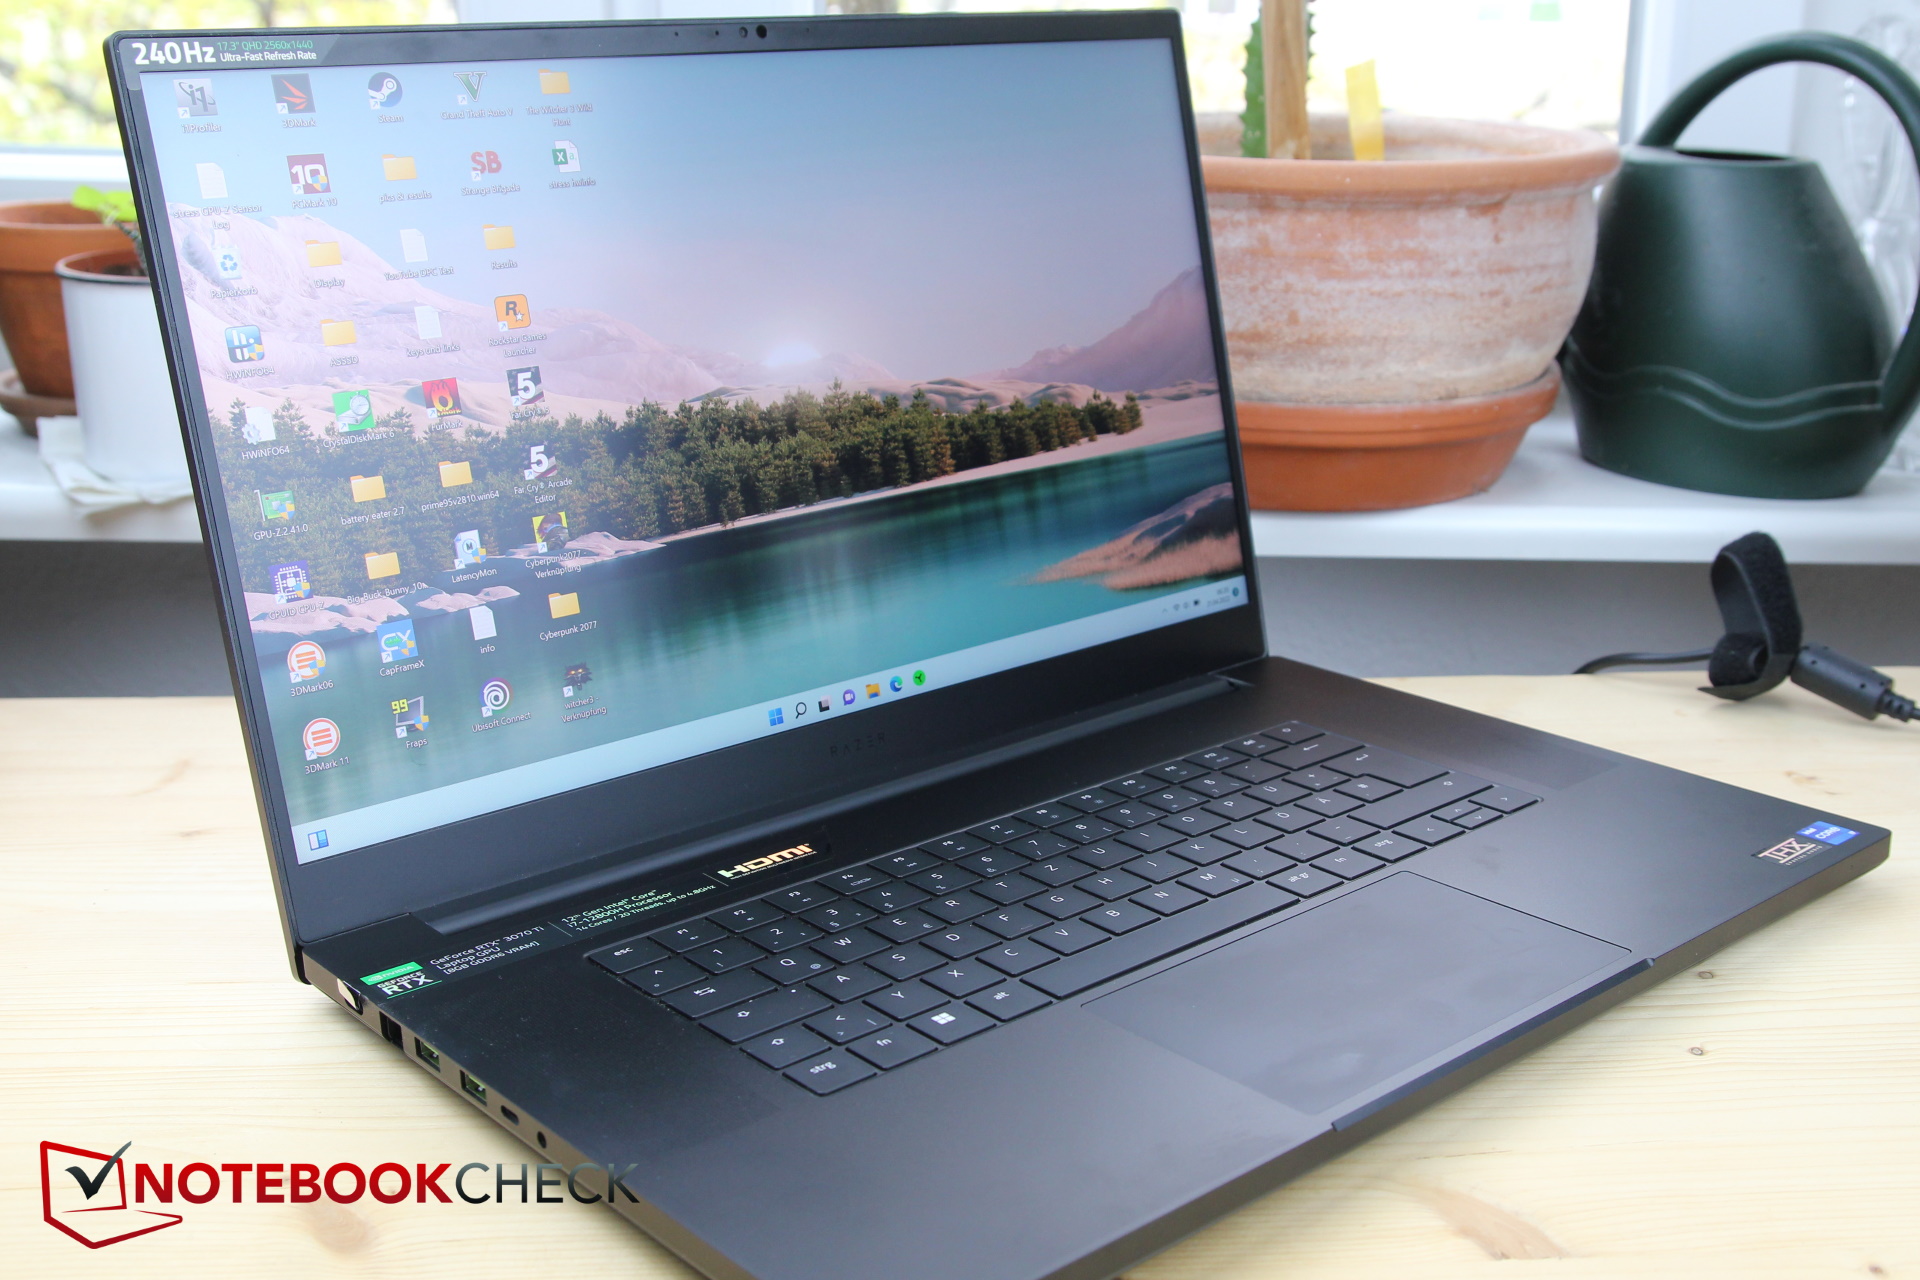
Análisis del portátil Razer Blade 17: RTX 3070 Ti o RTX 3080 Ti - ¿Cuál es el Blade superior?

Ya hemos analizado elRazer Blade 17 2022 con la RTX 3080 Ti a principios de abril, y el modelo con la RTX 3070 Ti, que cuesta 3,500 Euros, ha llegado hasta nosotros. Por tanto, compararemos el rendimiento de ambas y veremos si el precio más caro de 4.300 euros merece la pena para el modelo superior.
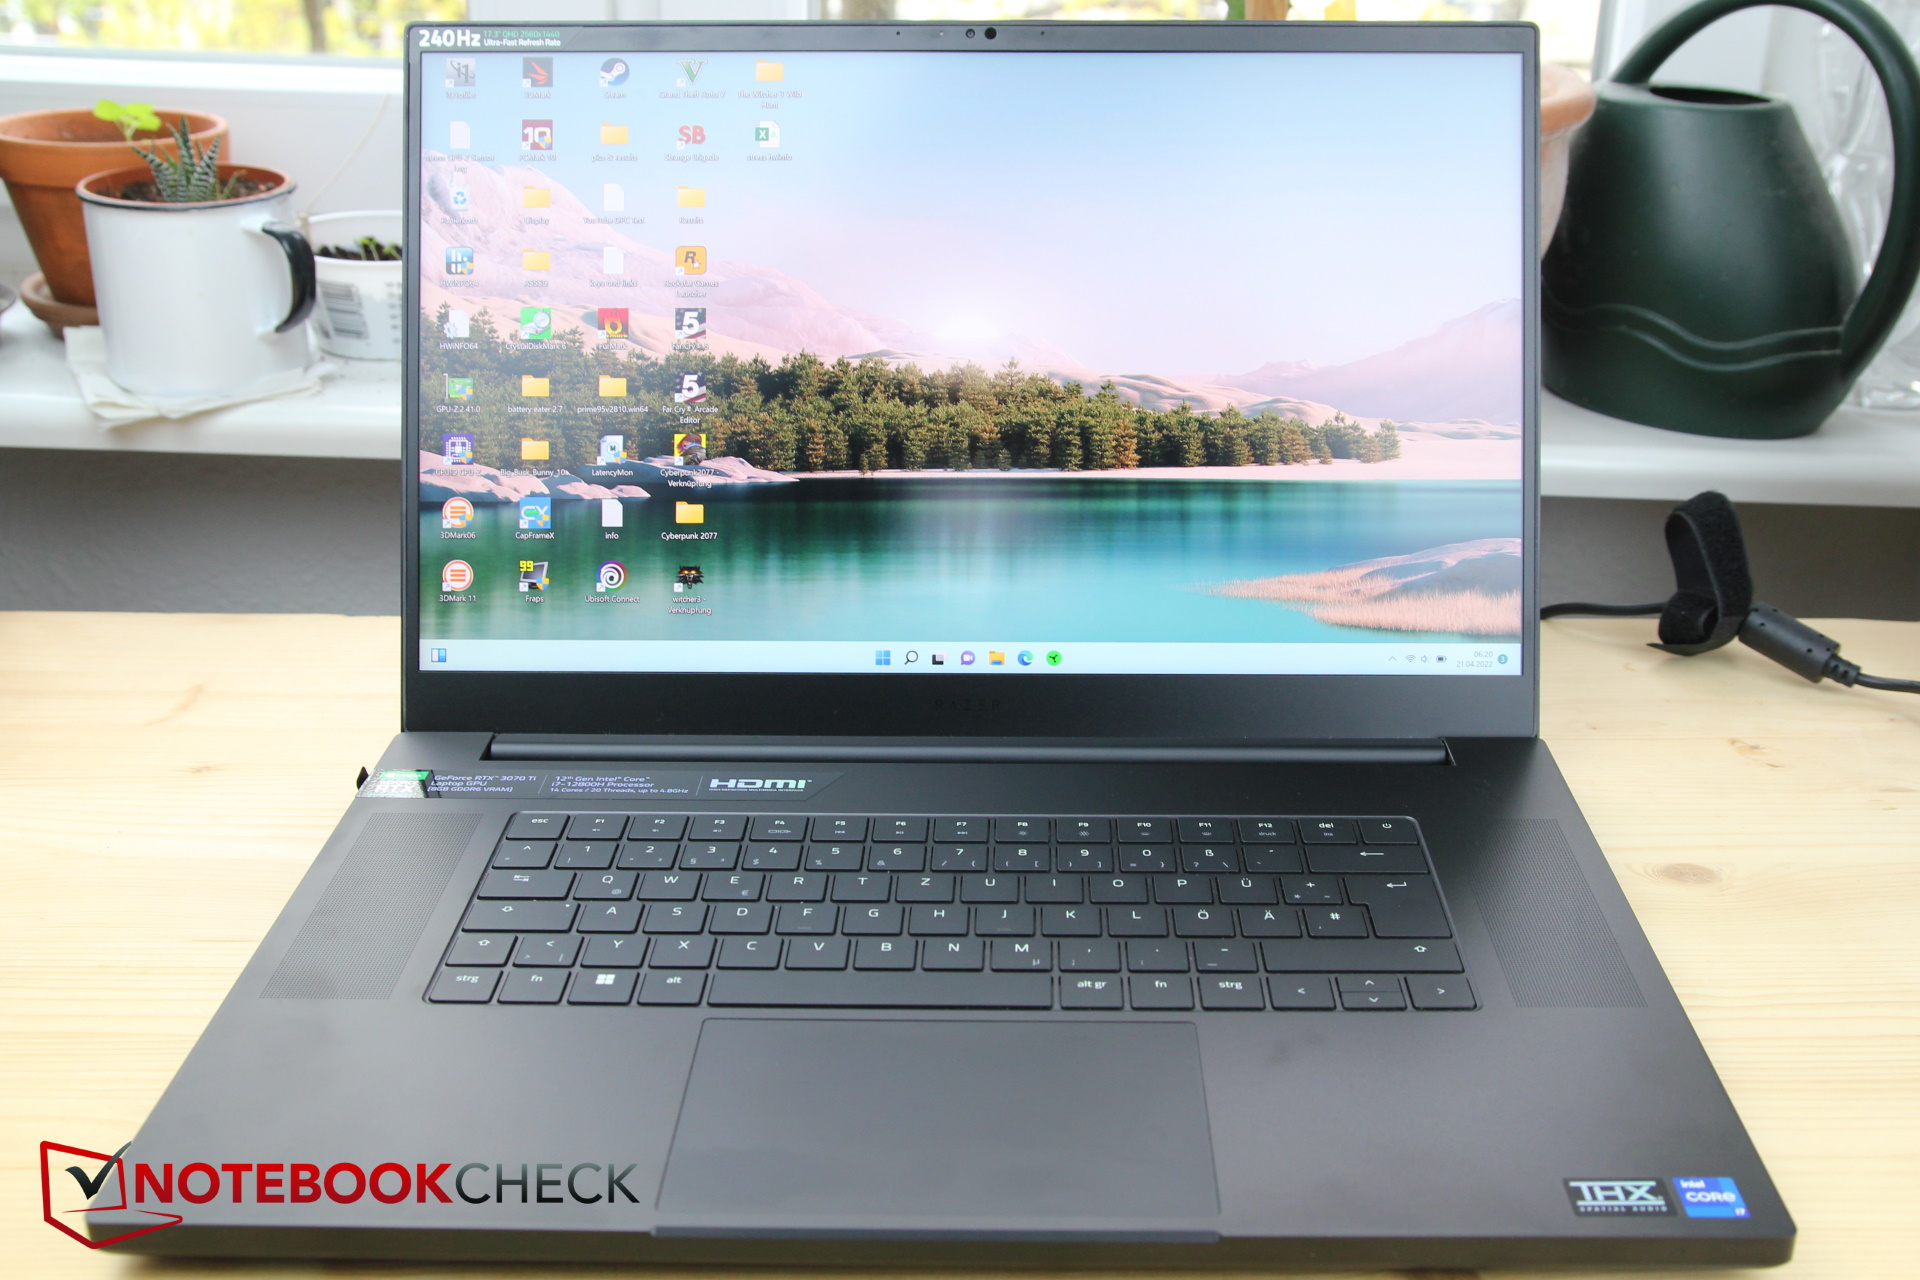
Como no ha cambiado prácticamente nada más en el portátil, nos remitiremos al análisis del modelo con la RTX 3080 Ti y omitiremos secciones como la relativa a la carcasa y todas las demás en las que no ha habido modificaciones.
Además del modelo superior, comparamos el rendimiento con otros portátiles de juego de 17 pulgadas equipados con la RTX 3070 Ti que encontramos en nuestro sistema. El único problema - aún no hay otros portátiles de 17 pulgadas con la RTX 3070 Ti en nuestro sistema. Por esta razón, incluiremos los siguientes modelos de comparación de 15 y 16 pulgadas: El Lenovo Legion 5 Pro 16 G7y elMSI Vector GP66 12UGSy elMSI Stealth GS66 12UGSasí como el predecesor, el Razer Blade 17 con una CPU Tiger Lake y la RTX 3070 no Ti.
Posibles contendientes en la comparación
Valoración | Fecha | Modelo | Peso | Altura | Tamaño | Resolución | Precio |
|---|---|---|---|---|---|---|---|
| 90.1 % v7 (old) | 05/2022 | Razer Blade 17 (i7-12800H, RTX 3070 Ti) i7-12800H, GeForce RTX 3070 Ti Laptop GPU | 2.8 kg | 19.9 mm | 17.30" | 2560x1440 | |
| 91.2 % v7 (old) | 03/2022 | Razer Blade 17 RTX 3080 Ti i7-12800H, GeForce RTX 3080 Ti Laptop GPU | 2.7 kg | 19.9 mm | 17.30" | 2560x1440 | |
| 89.4 % v7 (old) | 09/2021 | Razer Blade 17 RTX 3070 i7-11800H, GeForce RTX 3070 Laptop GPU | 2.8 kg | 19.9 mm | 17.30" | 1920x1080 | |
| 88 % v7 (old) | 03/2022 | Lenovo Legion 5 Pro 16 G7 i7 RTX 3070Ti i7-12700H, GeForce RTX 3070 Ti Laptop GPU | 2.6 kg | 26.6 mm | 16.00" | 2560x1600 | |
| 86.9 % v7 (old) | 03/2022 | MSI Vector GP66 12UGS i9-12900H, GeForce RTX 3070 Ti Laptop GPU | 2.3 kg | 23.4 mm | 15.60" | 1920x1080 | |
| 84.5 % v7 (old) | 02/2022 | MSI Stealth GS66 12UGS i7-12700H, GeForce RTX 3070 Ti Laptop GPU | 2.2 kg | 19.8 mm | 15.60" | 2560x1440 |
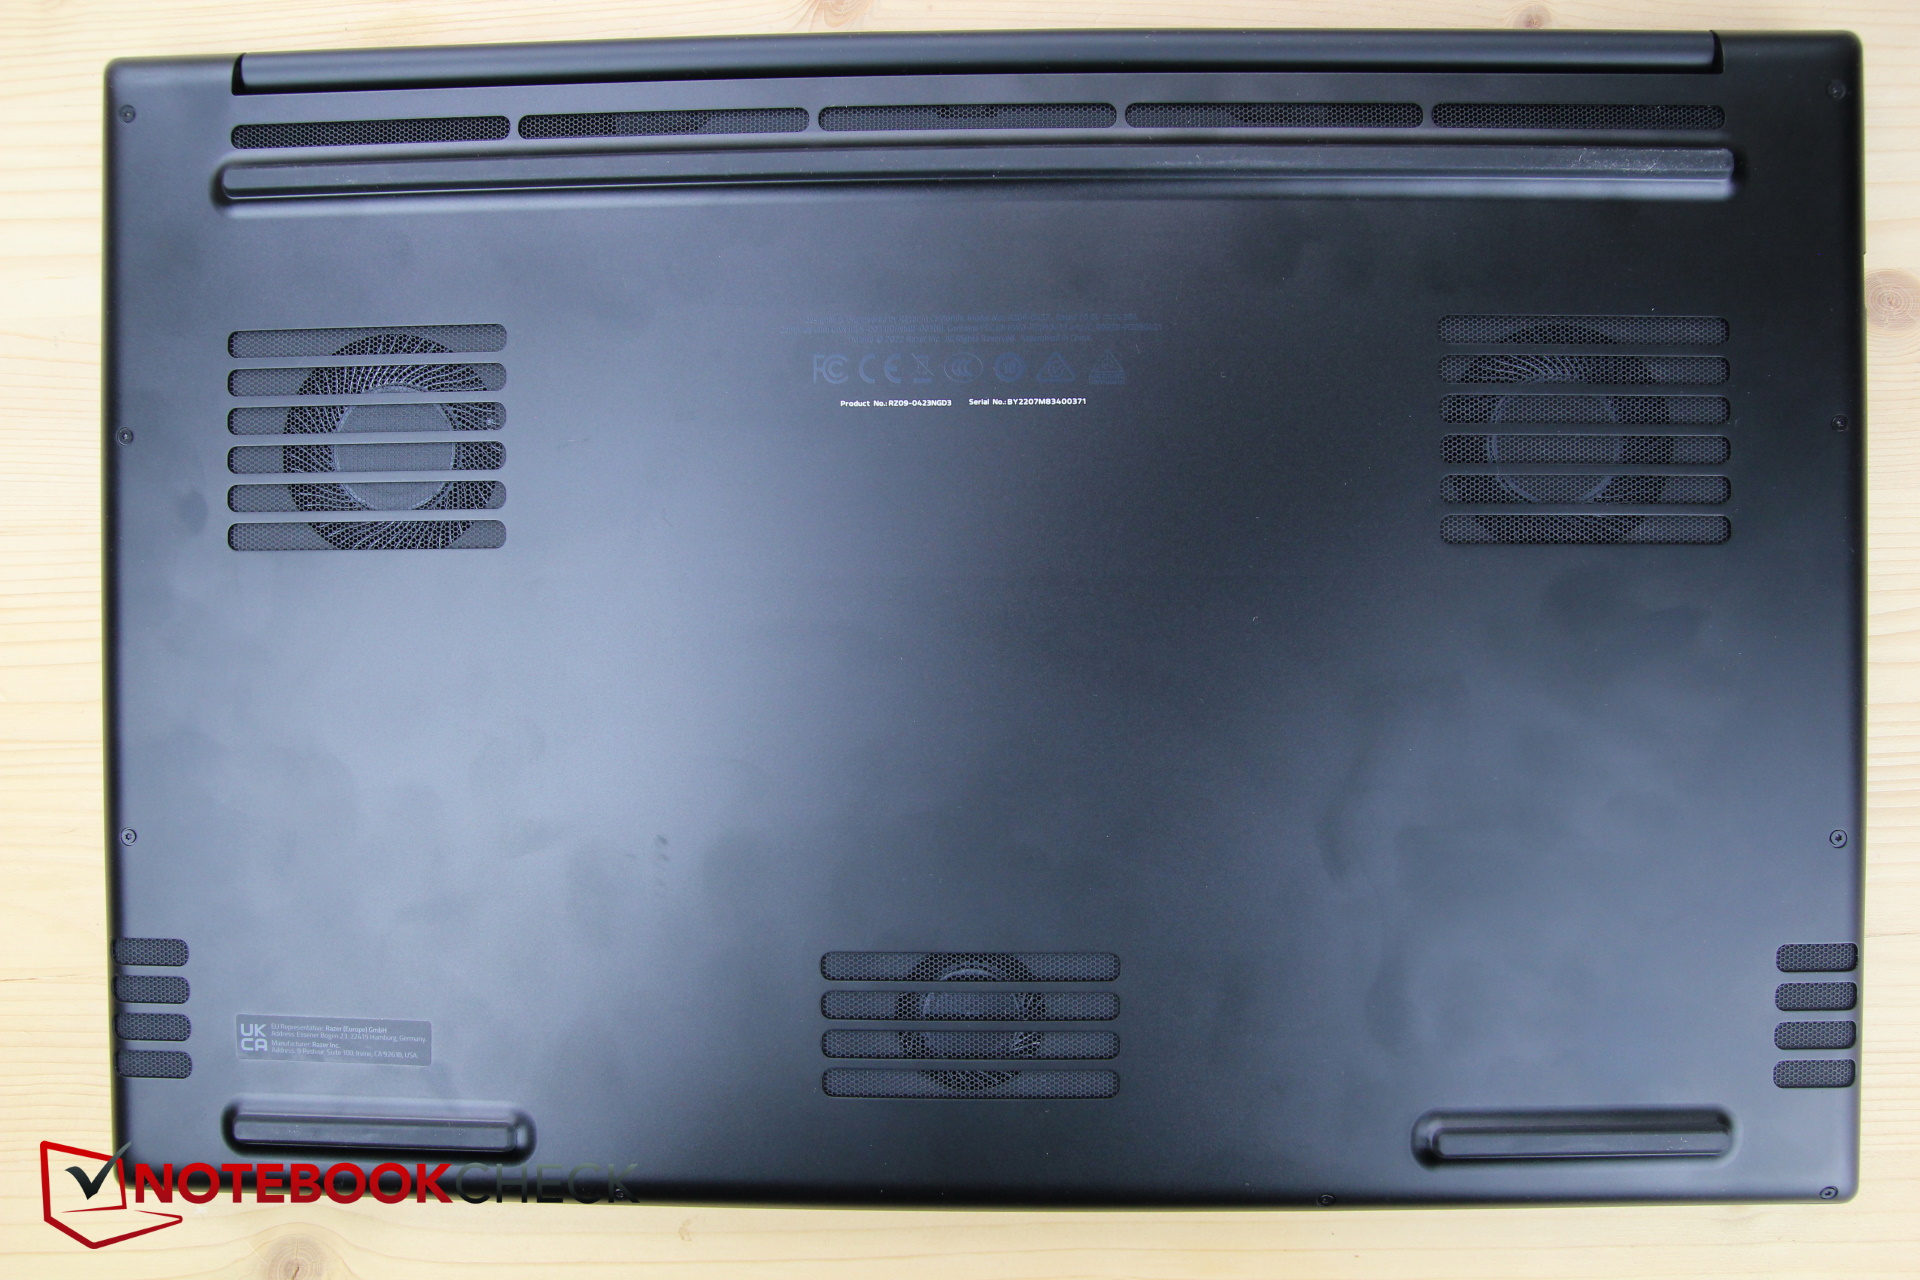
Carcasa - Delgada y totalmente metálica
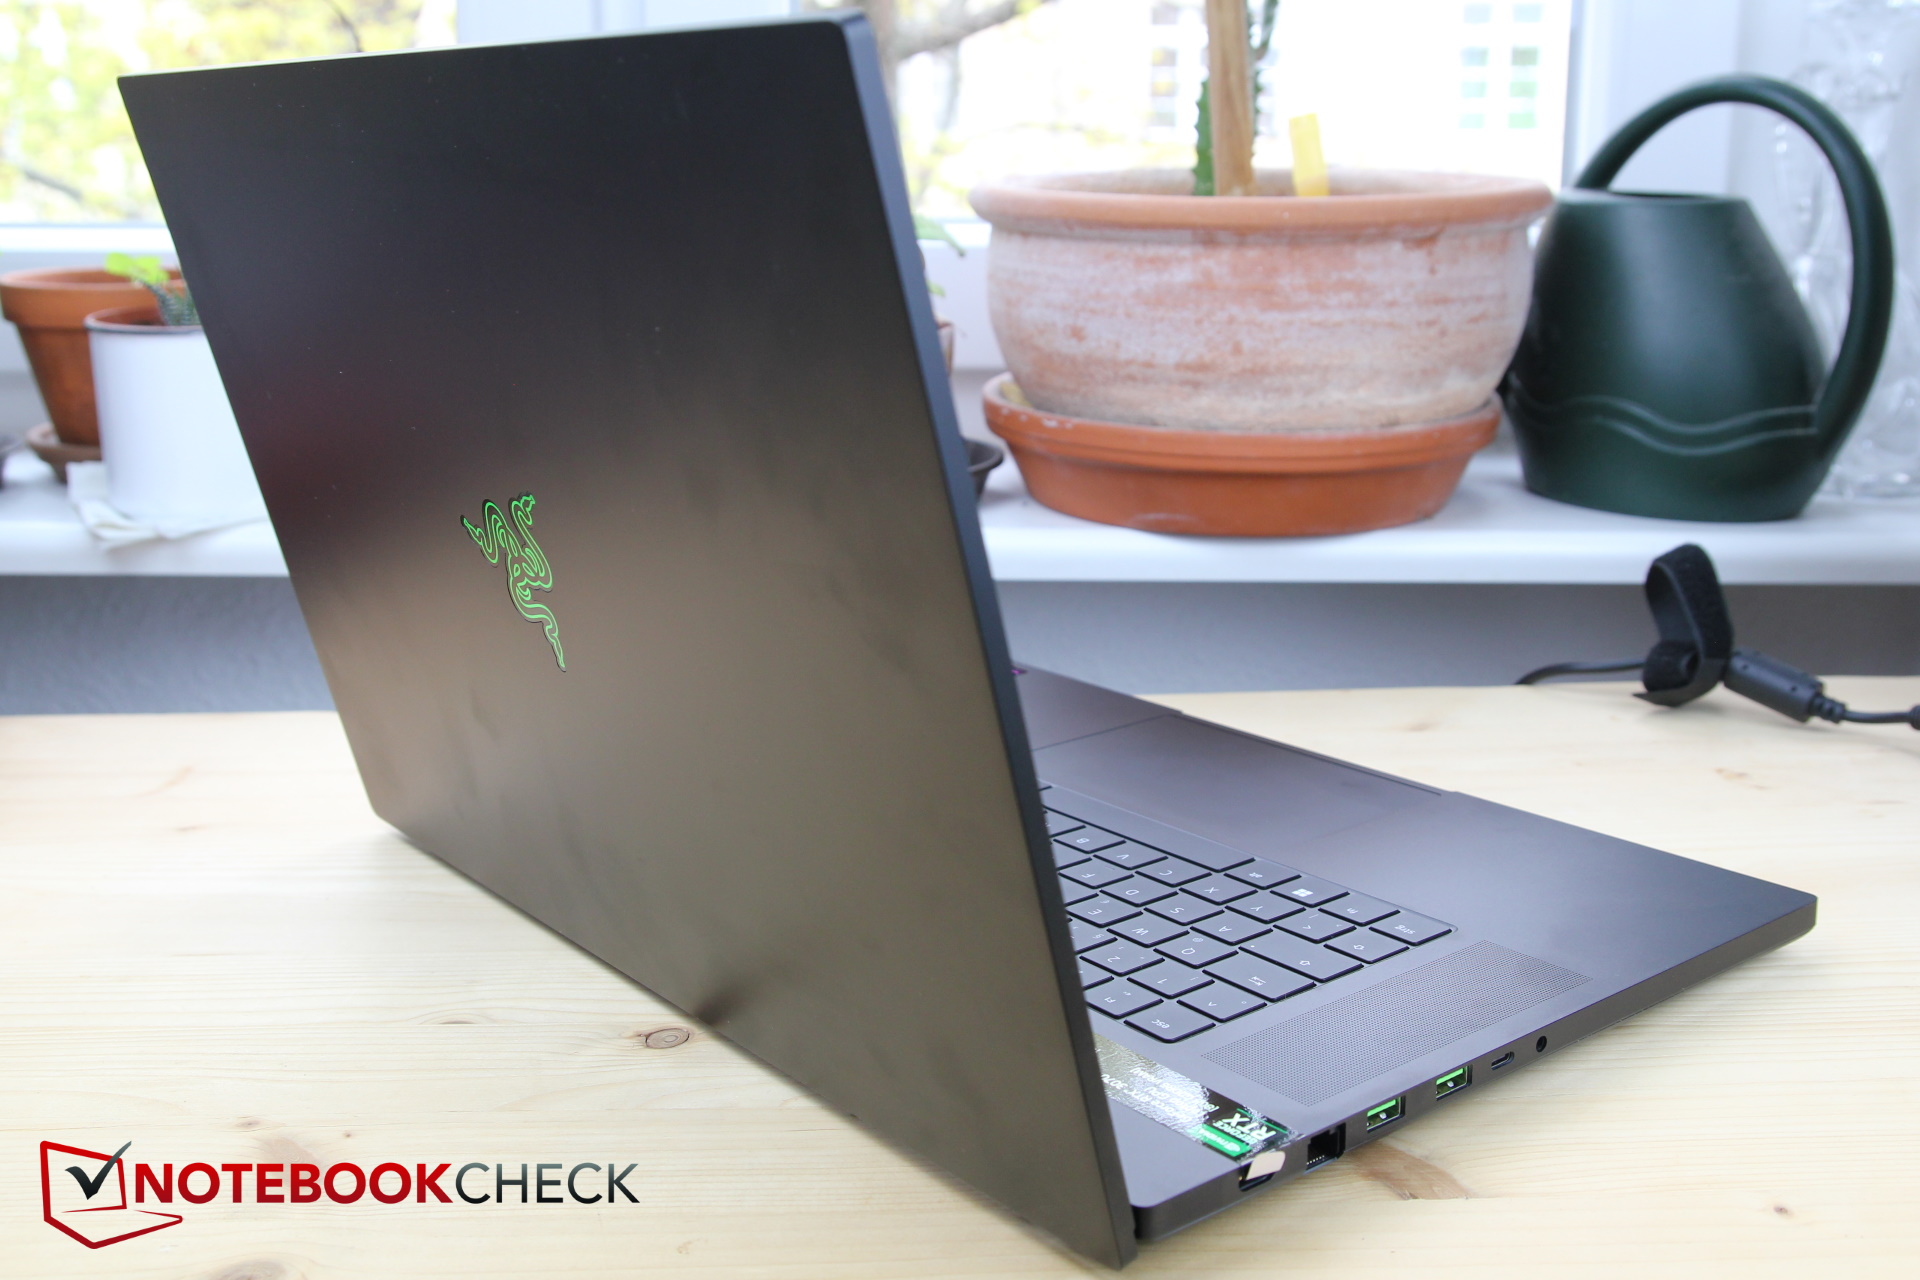
Conectividad - 2x Thunderbolt 4
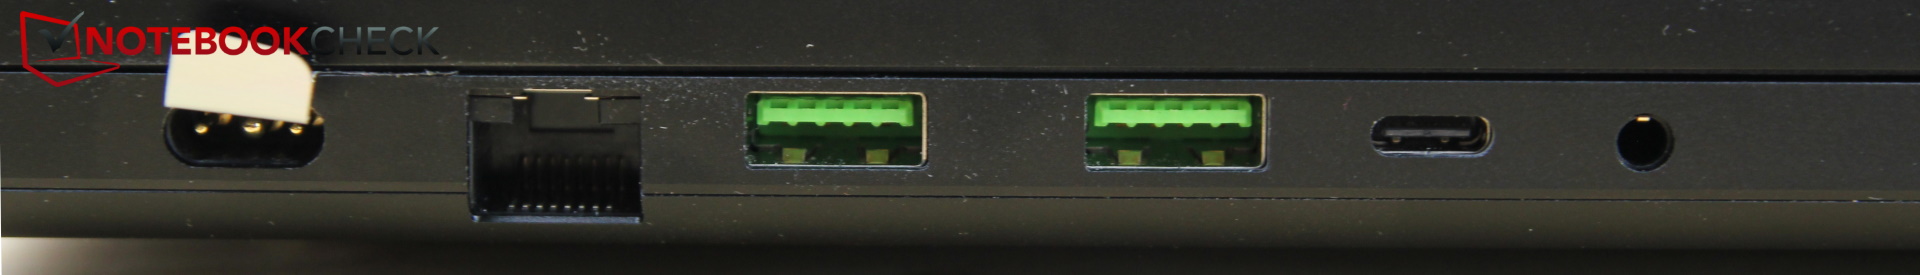
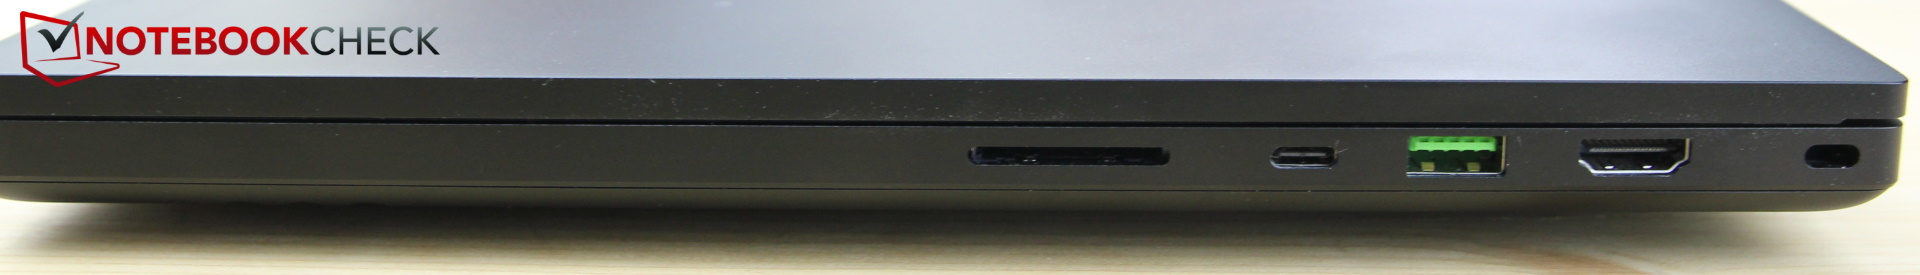
Lector de tarjetas SD
| SD Card Reader | |
| average JPG Copy Test (av. of 3 runs) | |
| Razer Blade 17 RTX 3070 (AV Pro V60) | |
| Razer Blade 17 (i7-12800H, RTX 3070 Ti) | |
| Razer Blade 17 RTX 3080 Ti (AV Pro V60) | |
| Media de la clase Gaming (20.9 - 210, n=54, últimos 2 años) | |
| maximum AS SSD Seq Read Test (1GB) | |
| Razer Blade 17 RTX 3070 (AV Pro V60) | |
| Razer Blade 17 (i7-12800H, RTX 3070 Ti) | |
| Razer Blade 17 RTX 3080 Ti (AV Pro V60) | |
| Media de la clase Gaming (25.5 - 261, n=51, últimos 2 años) | |
Comunicación
Cámara web

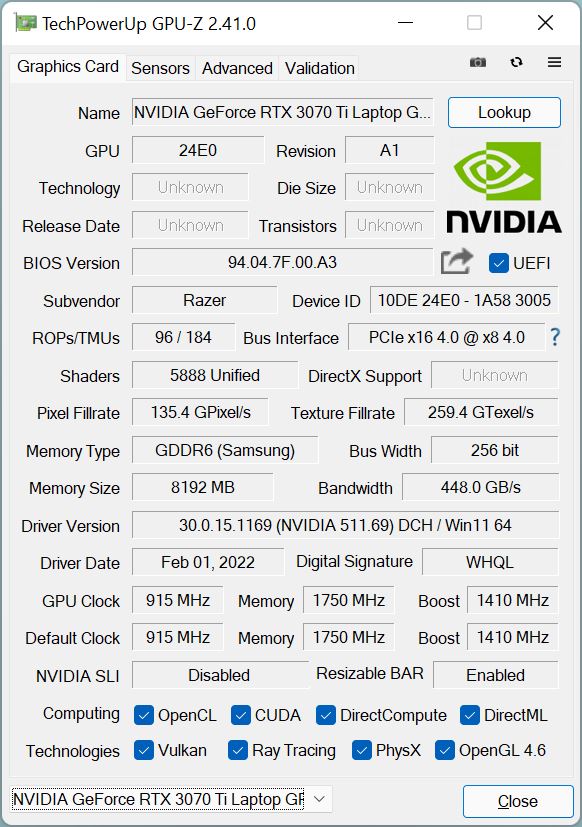
 GeForce RTX 3070 Ti Laptop GPU, i7-12800H, Samsung PM9A1 MZVL21T0HCLR")
 GeForce RTX 3070 Ti Laptop GPU, i7-12800H, Samsung PM9A1 MZVL21T0HCLR")
Dispositivos de entrada - Funciones especiales mal iluminadas
Teclado
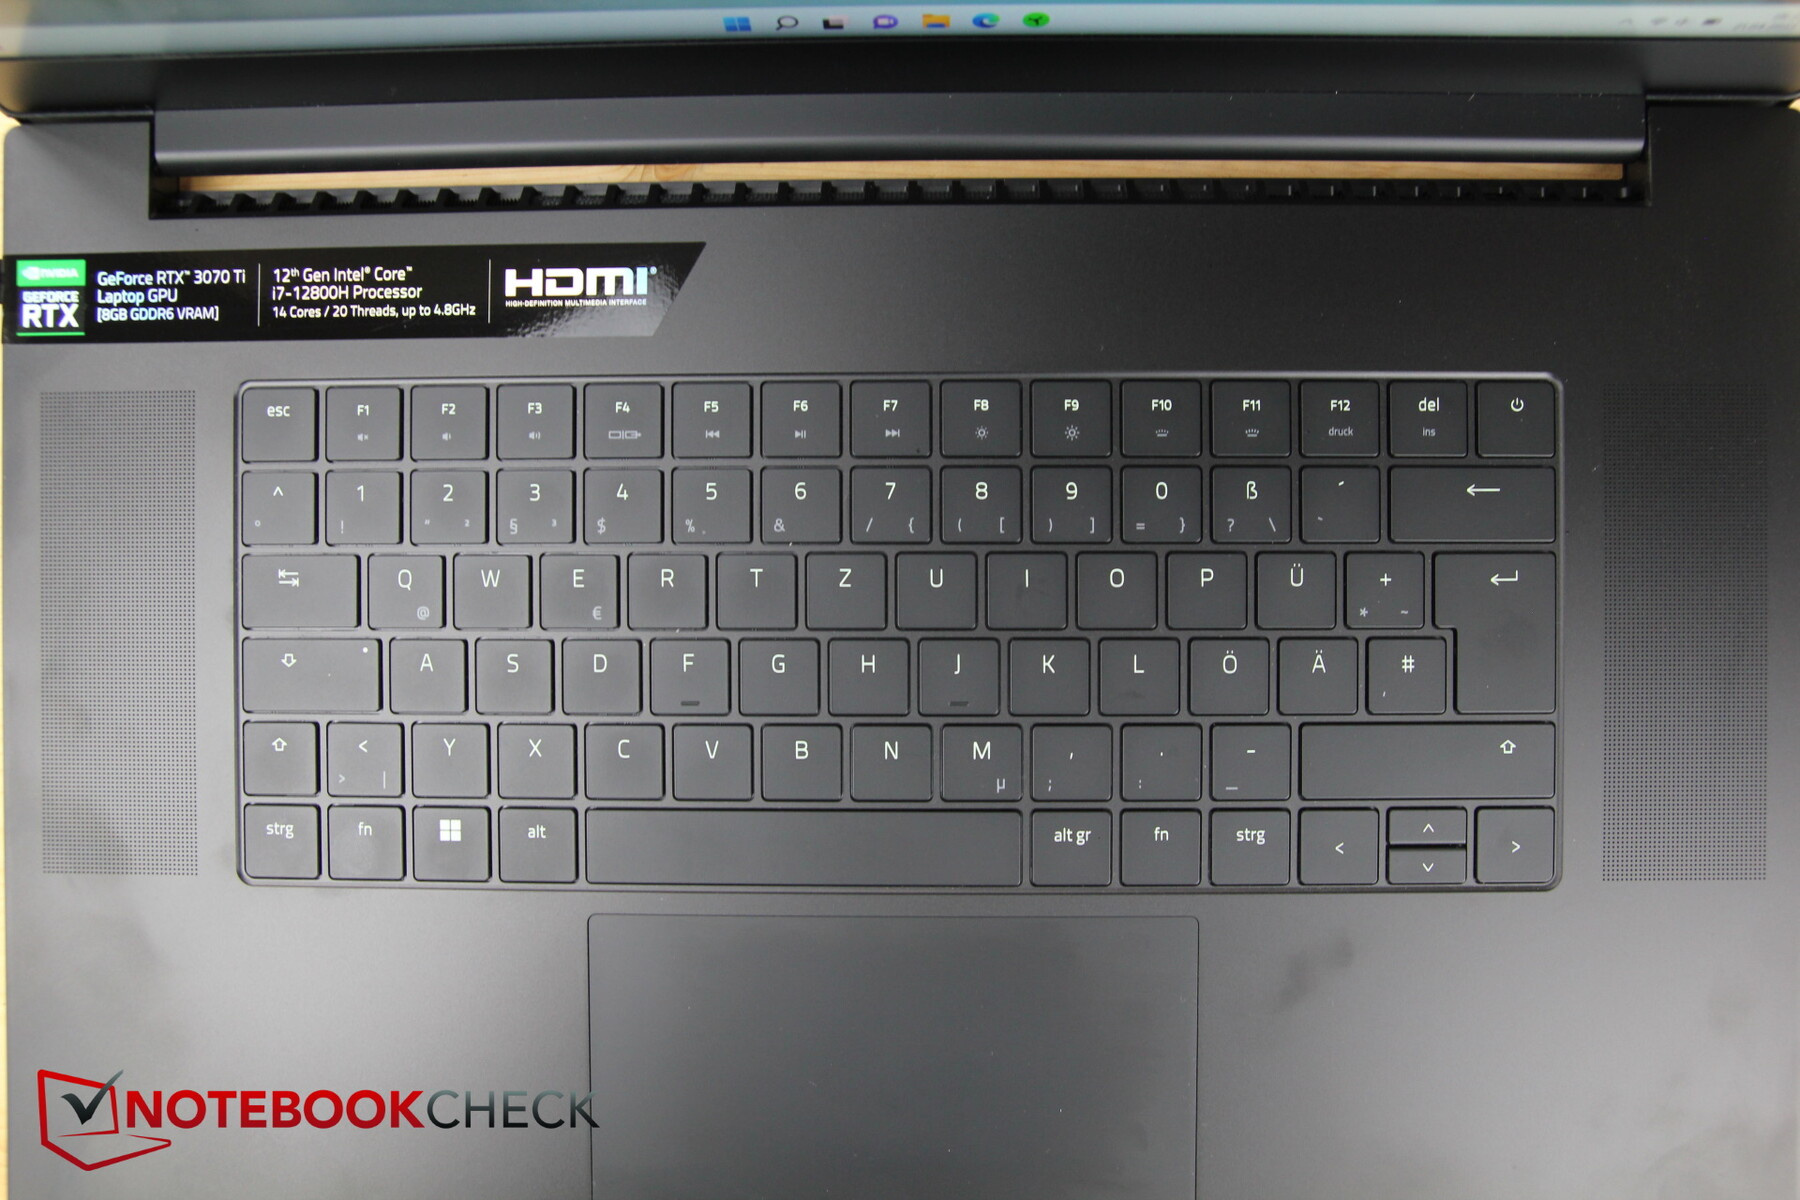
Unas palabras más sobre la retroiluminación del teclado: Sólo se iluminan las funciones principales de las teclas. Las funciones secundarias de las teclas F son muy pequeñas y están débilmente etiquetadas, y no están iluminadas, por lo que tendrás que buscar mucho las funciones especiales en entornos oscuros, incluso con la retroiluminación del teclado activada. Por ejemplo, queríamos atenuar el brillo de la pantalla en un entorno oscuro, pero la tecla correspondiente apenas se puede encontrar en un entorno oscuro.
Nos encantaría que Razer mejorara esto, ya que las teclas correspondientes a funciones como más fuerte/ más lento, imprimir, brillo de la pantalla, etc., apenas son visibles en la oscuridad, ya que no están iluminadas, y las etiquetas son muy pequeñas además de gris pálido.
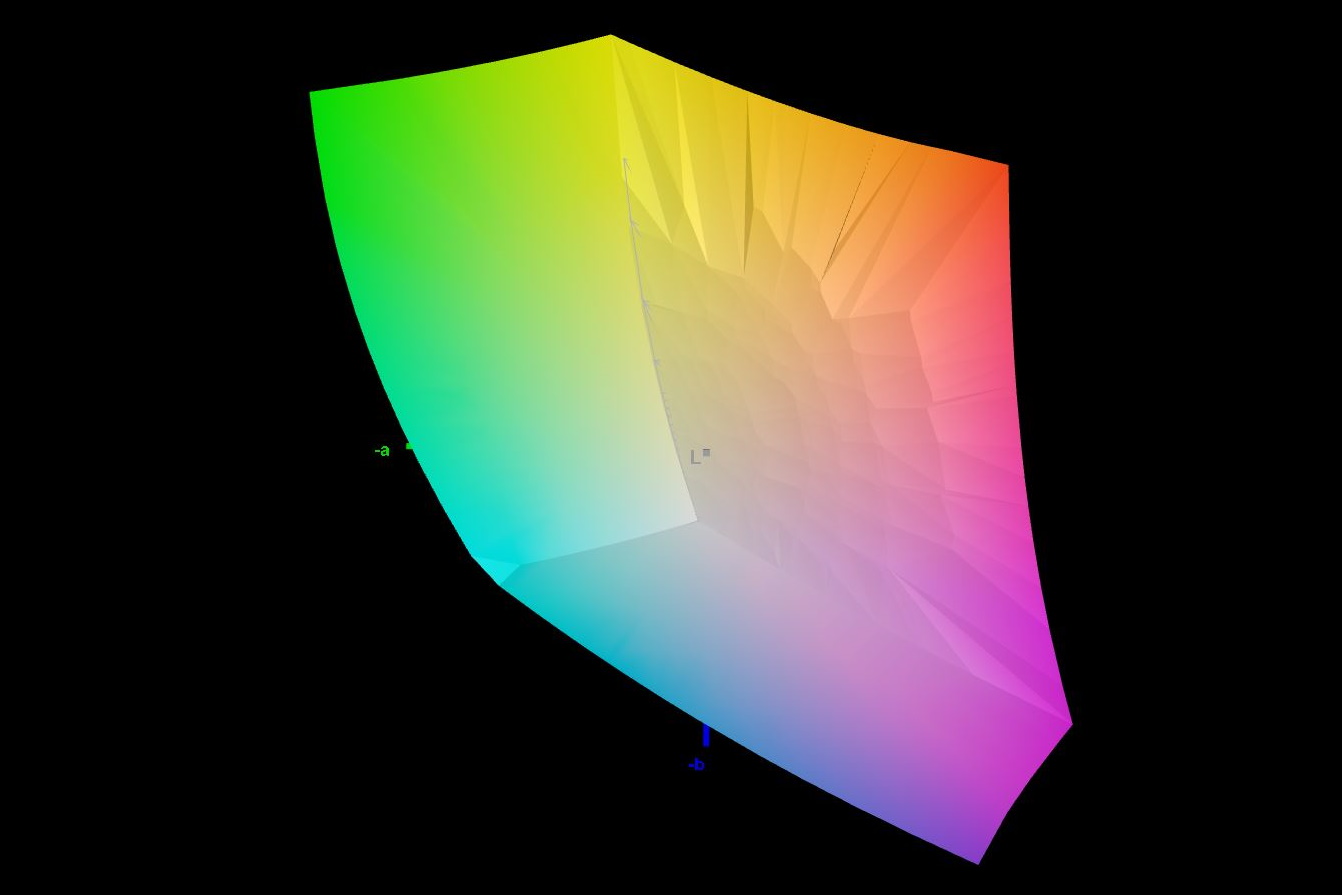
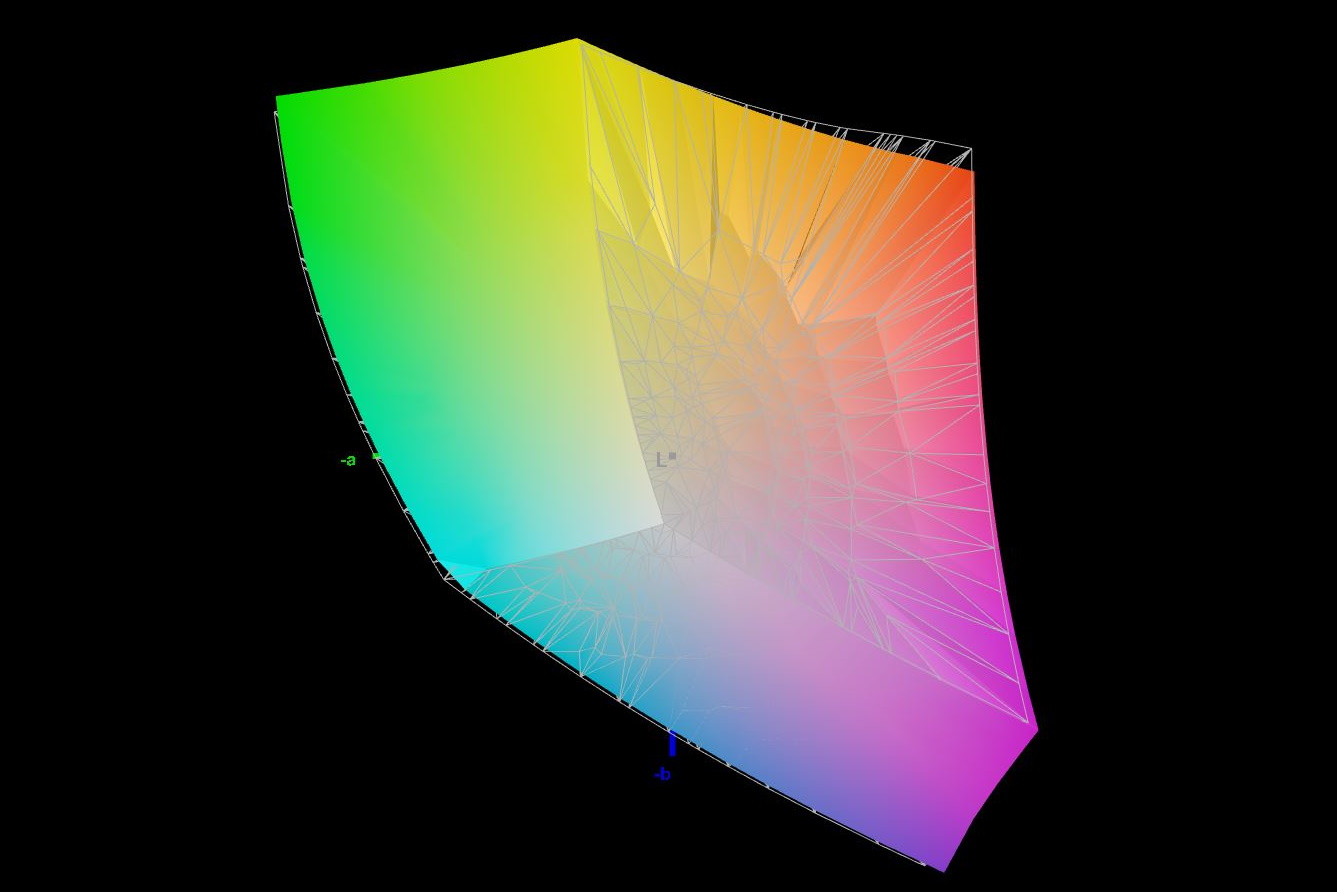
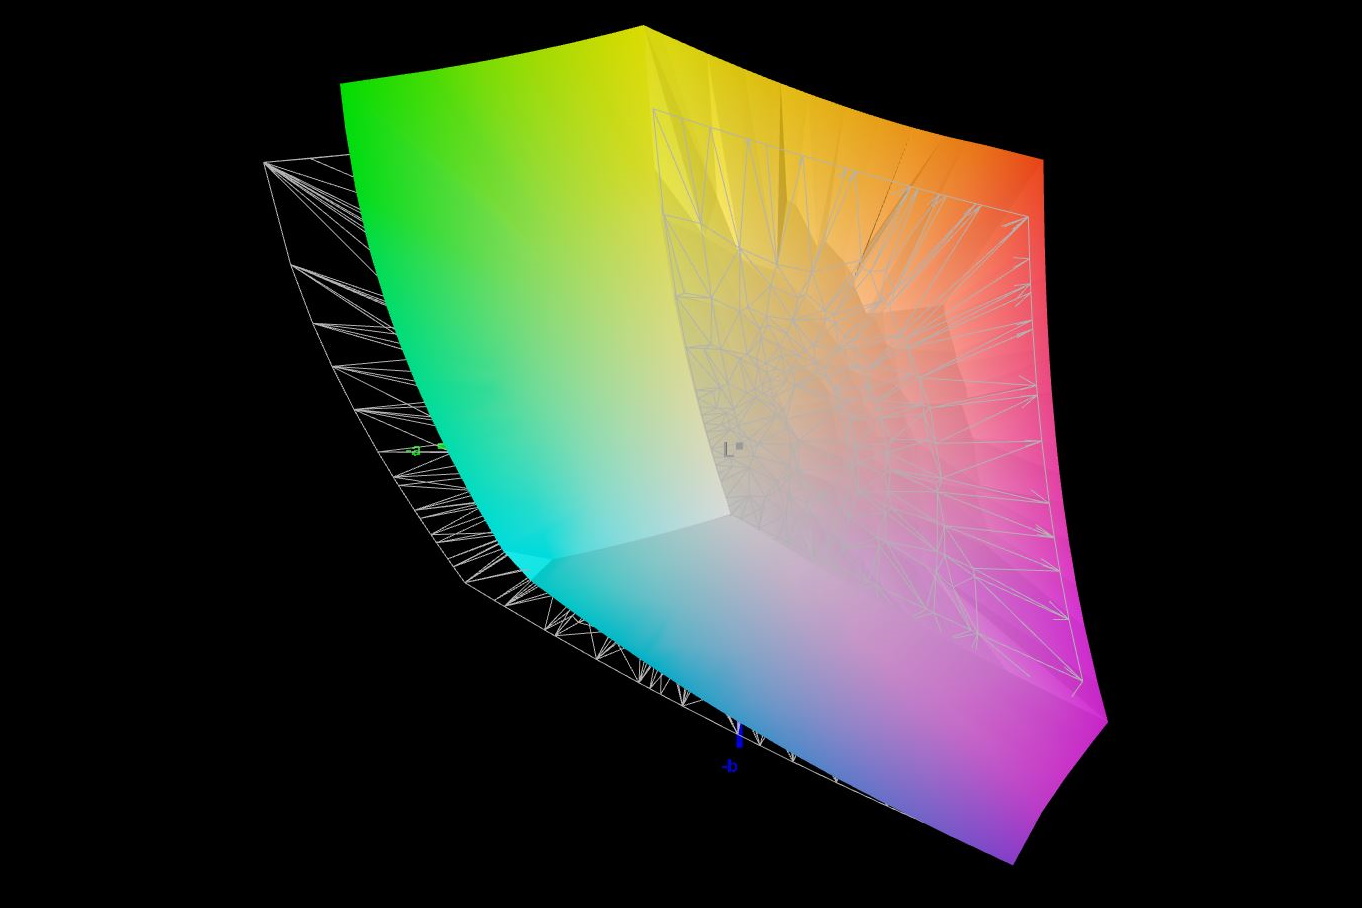
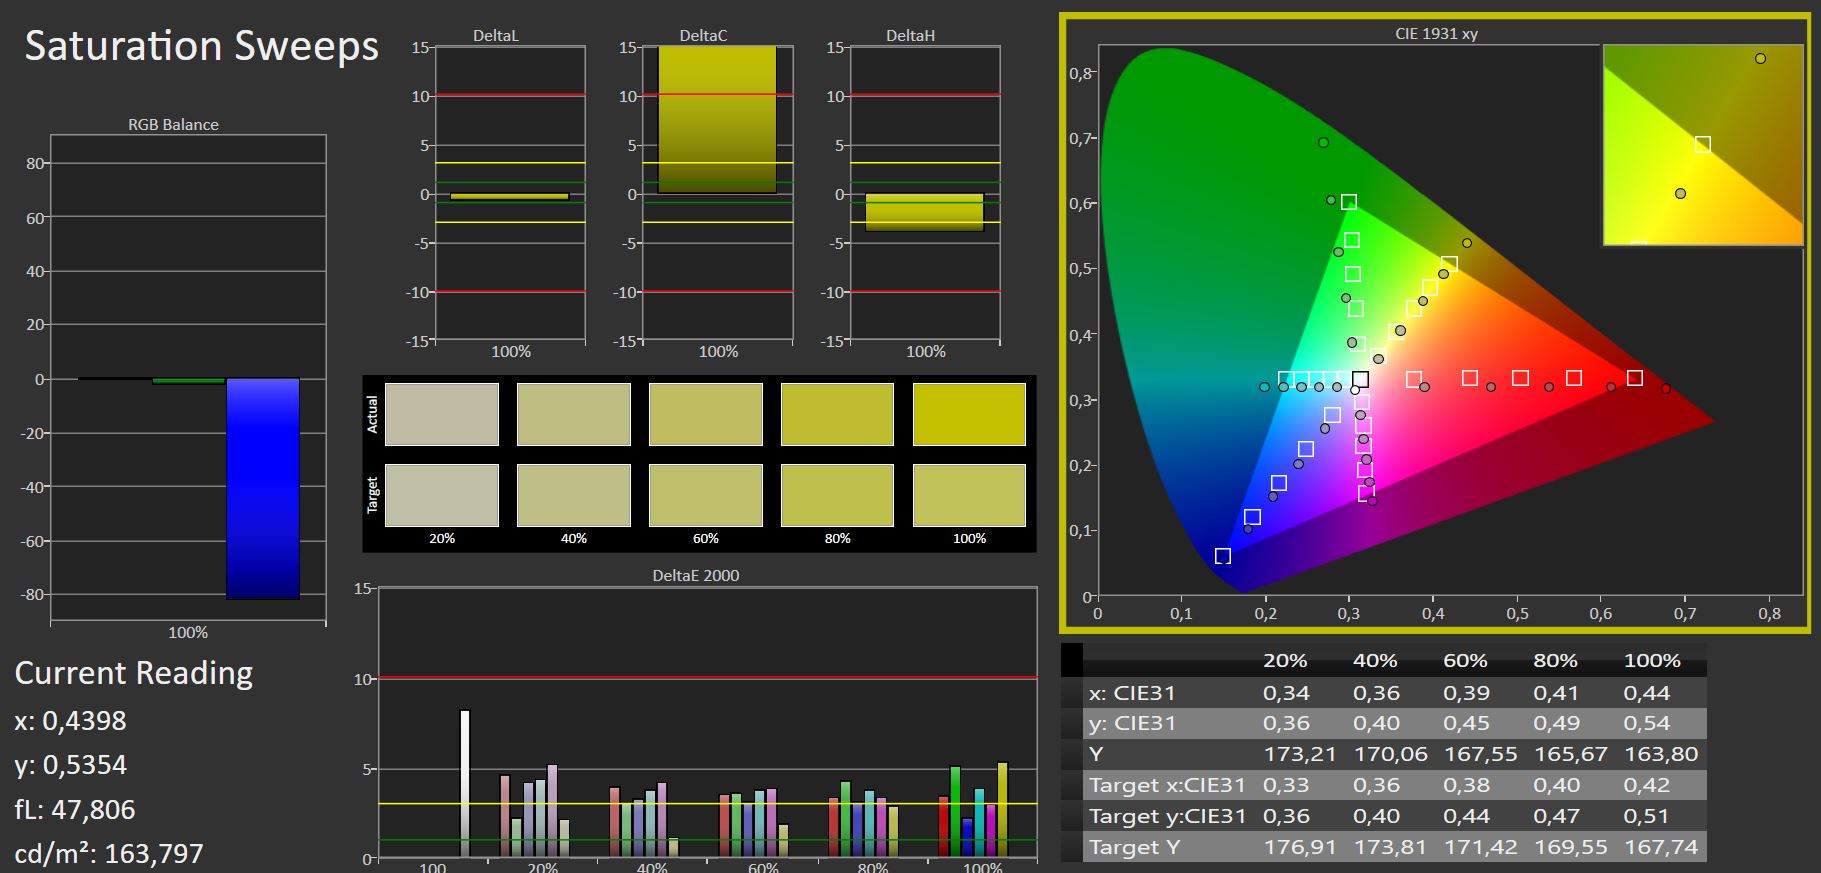
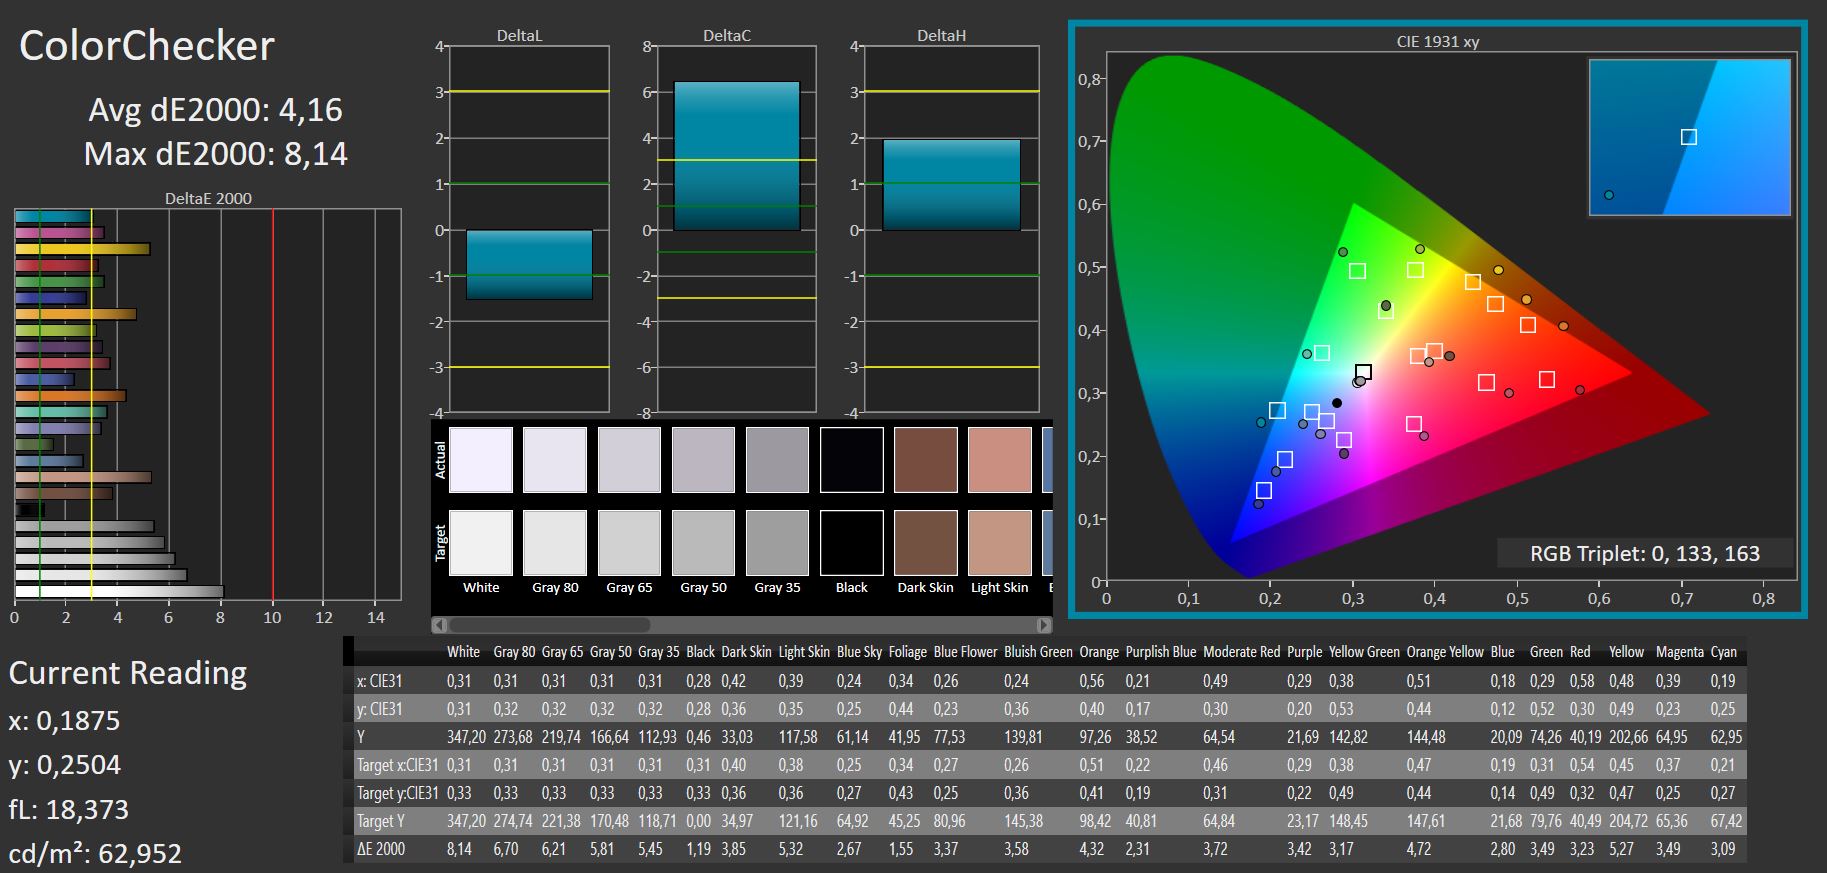
Pantalla - Buena cobertura del espacio de color

Nuestra configuración está equipada con la misma pantalla BOE IPS mate con 2560x1440 pixeles que se usa en la variante con RTX 3080 Ti.
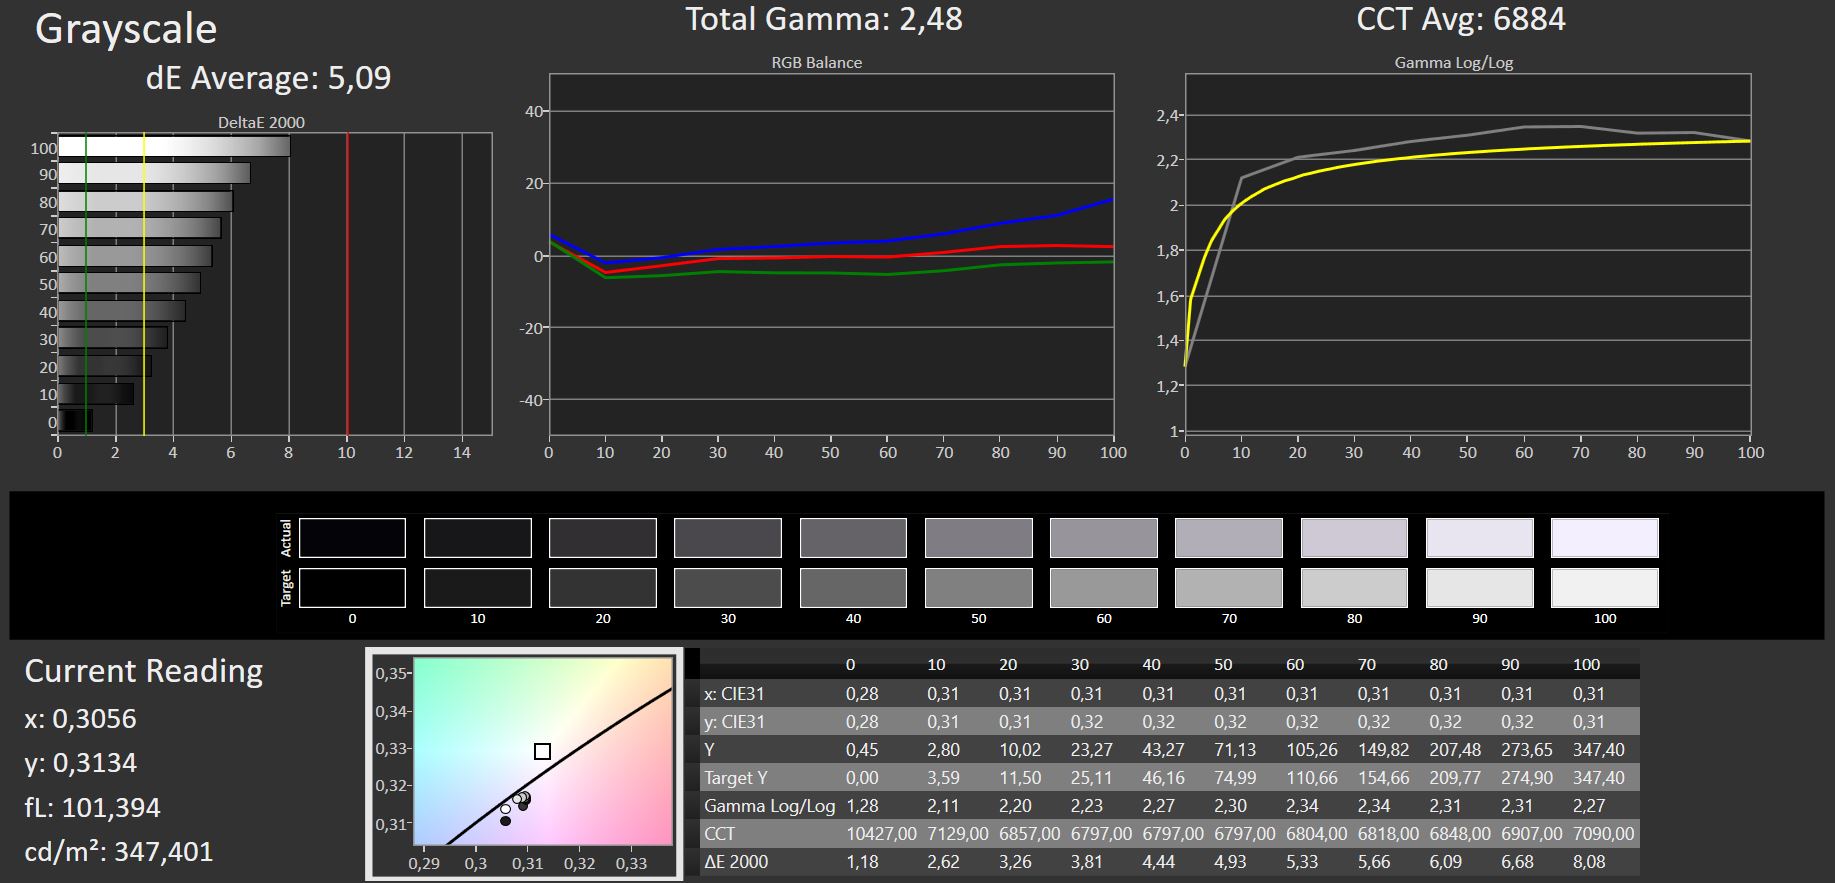
Sin embargo, nuestro modelo tiene una distribución de brillo ligeramente mejor del 82%. El brillo medio de algo más de 300 nits es decente.
Debido al valor de negro relativamente alto, el contraste no es sobresaliente, pero sigue estando dentro de los límites. Desde un punto de vista subjetivo también, la pantalla se ve muy nítida debido a la alta resolución, y ofrece colores atractivos.
Los tiempos de respuesta son adecuados para un portátil de juegos. El sangrado de pantalla es mínimo en el borde derecho, y no hay PWM.
| |||||||||||||||||||||||||
iluminación: 82 %
Brillo con batería: 338 cd/m²
Contraste: 758:1 (Negro: 0.45 cd/m²)
ΔE ColorChecker Calman: 4.16 | ∀{0.5-29.43 Ø4.72}
calibrated: 3
ΔE Greyscale Calman: 5.09 | ∀{0.09-98 Ø4.97}
85.5% AdobeRGB 1998 (Argyll 3D)
99.9% sRGB (Argyll 3D)
97.9% Display P3 (Argyll 3D)
Gamma: 2.48
CCT: 6884 K
| Razer Blade 17 (i7-12800H, RTX 3070 Ti) BOE CQ NE173QHM-NZ1 (BOE09F9), IPS, 2560x1440, 17.3" | Razer Blade 17 RTX 3080 Ti BOE NE173QHM-NZ1, IPS, 2560x1440, 17.3" | Razer Blade 17 RTX 3070 AU Optronics B173HAN05.4, IPS, 1920x1080, 17.3" | Lenovo Legion 5 Pro 16 G7 i7 RTX 3070Ti NE160QDM-NY1, IPS, 2560x1600, 16" | MSI Vector GP66 12UGS BOE NE156FHM-NZ3, IPS, 1920x1080, 15.6" | MSI Stealth GS66 12UGS Sharp LQ156T1JW04 (SHP153C), IPS-Level, 2560x1440, 15.6" | |
|---|---|---|---|---|---|---|
| Display | 1% | -14% | -16% | -15% | -1% | |
| Display P3 Coverage (%) | 97.9 | 98.7 1% | 71.7 -27% | 68.7 -30% | 70.1 -28% | 96.4 -2% |
| sRGB Coverage (%) | 99.9 | 99.9 0% | 98.8 -1% | 97.6 -2% | 99.5 0% | 99.7 0% |
| AdobeRGB 1998 Coverage (%) | 85.5 | 86.2 1% | 73.6 -14% | 70.9 -17% | 72.1 -16% | 85.6 0% |
| Response Times | -9% | 47% | 8% | 38% | 43% | |
| Response Time Grey 50% / Grey 80% * (ms) | 15.2 ? | 17.6 ? -16% | 4.2 ? 72% | 17.6 ? -16% | 5.8 ? 62% | 6 ? 61% |
| Response Time Black / White * (ms) | 11.2 ? | 11.4 ? -2% | 8.8 ? 21% | 7.6 ? 32% | 9.6 ? 14% | 8.4 ? 25% |
| PWM Frequency (Hz) | ||||||
| Screen | 19% | 2% | 44% | 25% | 10% | |
| Brightness middle (cd/m²) | 341 | 335.9 -1% | 323.3 -5% | 502 47% | 353.1 4% | 272 -20% |
| Brightness (cd/m²) | 308 | 294 -5% | 315 2% | 491 59% | 325 6% | 253 -18% |
| Brightness Distribution (%) | 82 | 75 -9% | 91 11% | 91 11% | 85 4% | 87 6% |
| Black Level * (cd/m²) | 0.45 | 0.38 16% | 0.33 27% | 0.37 18% | 0.38 16% | 0.25 44% |
| Contrast (:1) | 758 | 884 17% | 980 29% | 1357 79% | 929 23% | 1088 44% |
| Colorchecker dE 2000 * | 4.16 | 2.82 32% | 4.59 -10% | 2.7 35% | 2.24 46% | 3.73 10% |
| Colorchecker dE 2000 max. * | 8.14 | 5.04 38% | 10.82 -33% | 4.5 45% | 5 39% | 9.43 -16% |
| Colorchecker dE 2000 calibrated * | 3 | 1.4 53% | 1.4 53% | 1.02 66% | 0.98 67% | |
| Greyscale dE 2000 * | 5.09 | 1.7 67% | 7.9 -55% | 2.7 47% | 4 21% | 6.5 -28% |
| Gamma | 2.48 89% | 2.14 103% | 2.28 96% | 2.44 90% | 2.24 98% | 2.172 101% |
| CCT | 6884 94% | 6382 102% | 5941 109% | 6326 103% | 6864 95% | 6485 100% |
| Media total (Programa/Opciones) | 4% /
11% | 12% /
5% | 12% /
26% | 16% /
18% | 17% /
12% |
* ... más pequeño es mejor
Tanto sRGB como Display P3 están cubiertos casi en su totalidad. AdobeRGB también está cubierto en un 86% aproximadamente. Esto hace que la pantalla sea muy adecuada para los editores profesionales de imagen y vídeo
La pantalla ya está razonablemente bien calibrada al sacarla de la caja. Sin embargo, una nueva calibración reduce las desviaciones de color de forma aún más notable

Tiempos de respuesta del display
| ↔ Tiempo de respuesta de Negro a Blanco | ||
|---|---|---|
| 11.2 ms ... subida ↗ y bajada ↘ combinada | ↗ 5.8 ms subida | 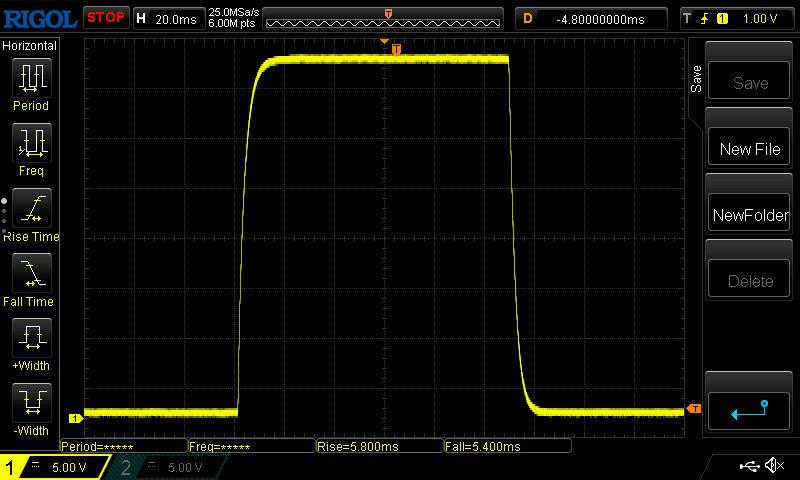 |
| ↘ 5.4 ms bajada | ||
| La pantalla mostró buenos tiempos de respuesta en nuestros tests pero podría ser demasiado lenta para los jugones competitivos. En comparación, todos los dispositivos de prueba van de ##min### (mínimo) a 240 (máximo) ms. » 30 % de todos los dispositivos son mejores. Esto quiere decir que el tiempo de respuesta medido es mejor que la media (19.8 ms) de todos los dispositivos testados. | ||
| ↔ Tiempo de respuesta 50% Gris a 80% Gris | ||
| 15.2 ms ... subida ↗ y bajada ↘ combinada | ↗ 7.4 ms subida | 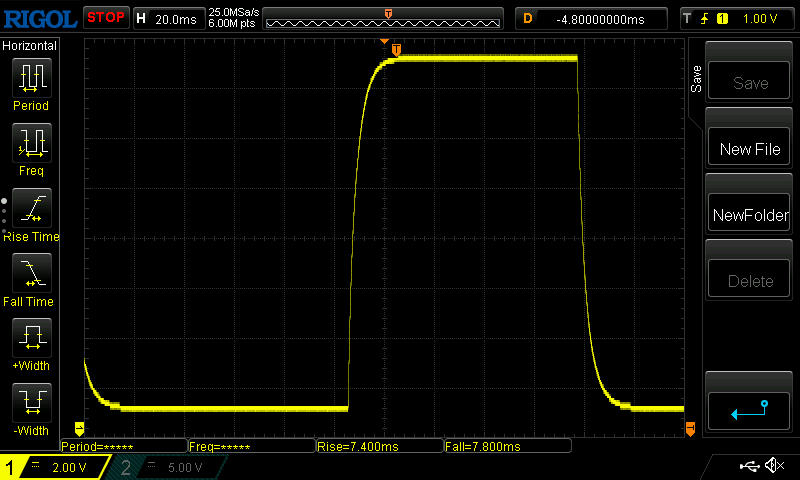 |
| ↘ 7.8 ms bajada | ||
| La pantalla mostró buenos tiempos de respuesta en nuestros tests pero podría ser demasiado lenta para los jugones competitivos. En comparación, todos los dispositivos de prueba van de ##min### (mínimo) a 636 (máximo) ms. » 29 % de todos los dispositivos son mejores. Esto quiere decir que el tiempo de respuesta medido es mejor que la media (31 ms) de todos los dispositivos testados. | ||
Parpadeo de Pantalla / PWM (Pulse-Width Modulation)
| Parpadeo de Pantalla / PWM no detectado | 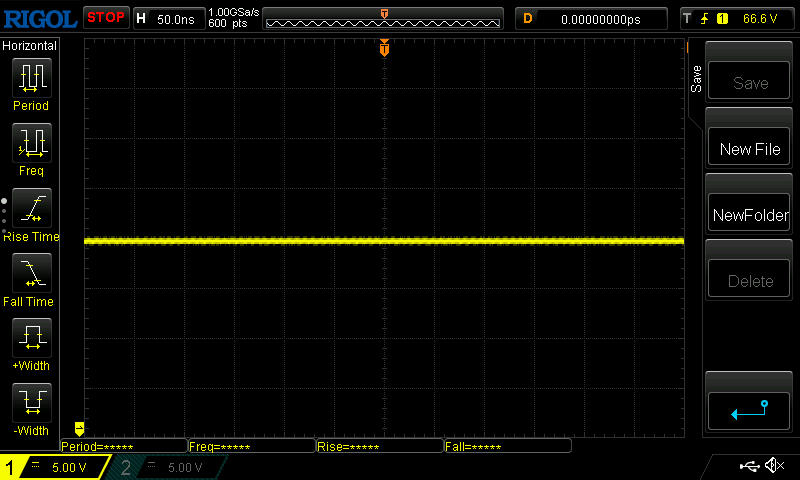 | ||
Comparación: 52 % de todos los dispositivos testados no usaron PWM para atenuar el display. Si se usó, medimos una media de 7775 (mínimo: 5 - máxmo: 343500) Hz. | |||
Con un brillo de unos 300 nits y la superficie mate, el uso en exteriores es posible siempre que estés a la sombra y veas la pantalla desde un ángulo favorable. Sin embargo, si inclinas el dispositivo o lo miras desde un ángulo oblicuo, pronto se acabará la diversión
Se pierde algo de brillo cuando se ve desde ángulos extremos, pero en general, la estabilidad del ángulo de visión es buena, como es típico de los paneles IPS

Rendimiento - Sigue siendo alto
Gracias a sus potentes componentes, el Razer Blade es principalmente adecuado para jugadores y creadores de contenido. Esperamos temperaturas y niveles de ruido ligeramente mejores de la RTX 3070 Ti que del modelo con la RTX 3080 Ti. A cambio, debería haber una ligera caída de rendimiento. Nuestro modelo de pruebas actual tampoco debería tener problemas con las pruebas

Condiciones de la prueba
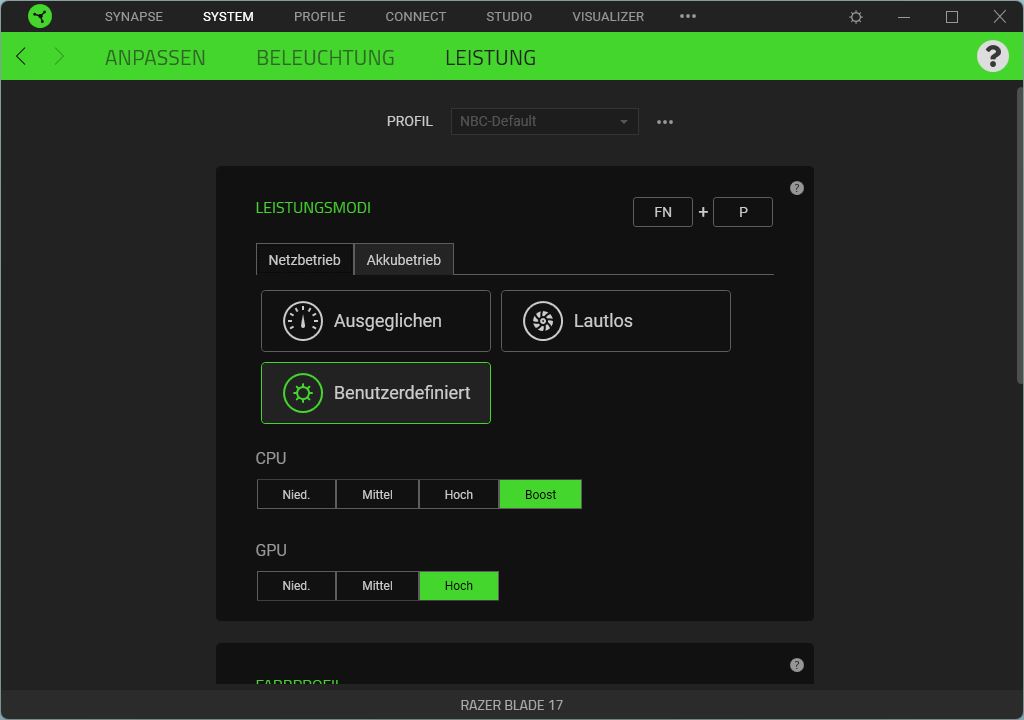
Para obtener los mejores resultados del benchmark, seleccionamos el modo personalizado en el software Razer Synapse y maximizamos los controles deslizantes de la CPU y la GPU.
El Razer admite Advanced Optimus, y también se puede activar manualmente la dGPU, pero no lo haremos.
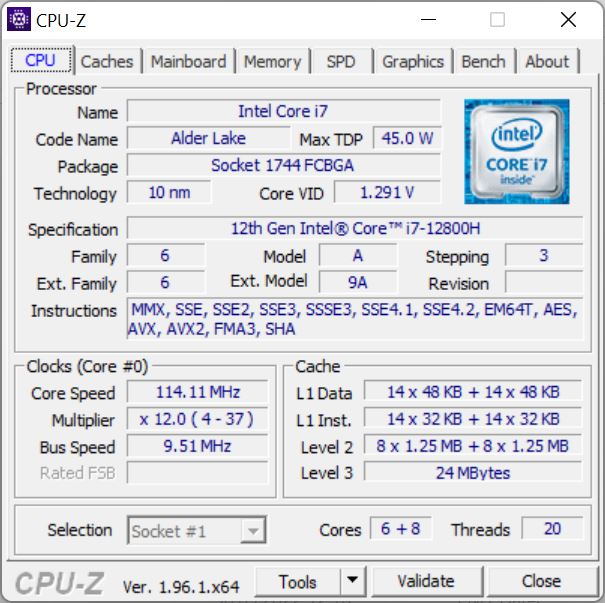
Procesador

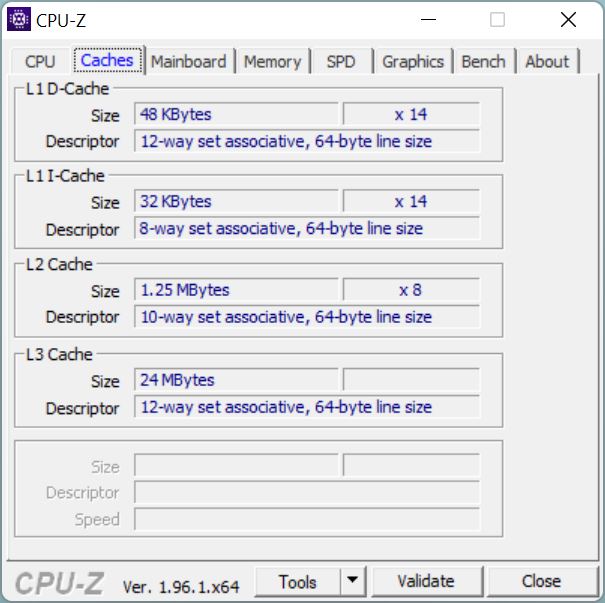
ElIntel Core i7-12800H tiene 14 núcleos y un total de 20 hilos. En este caso, un solo núcleo P puede alcanzar los 4,8 GHz, mientras que la velocidad de reloj base está entre 1,8 (núcleos E) y 2,4 GHz (núcleos P). Debería ser capaz de manejar cualquier tarea.
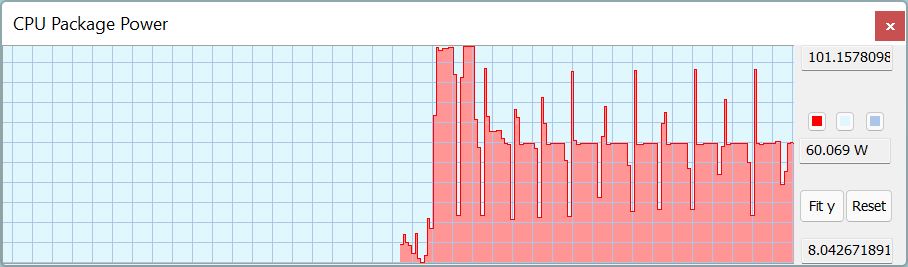
En el bucle de Cinebench, la CPU logra un TDP de unos 100 vatios en las dos primeras ejecuciones. En las siguientes ejecuciones, sólo alcanza los 85 vatios durante un tiempo muy corto en el mejor de los casos, tras lo cual el valor cae a unos 60 vatios en una sola ejecución. Tenga en cuenta que esto se aplica a la CPU en "Boost" dentro de Razer Synapse. En la configuración normal, la CPU debería alcanzar más bien unos 45 vatios.
En general, el Blade está ligeramente por encima del nivel esperado. El predecesor es superado por alrededor de un 20%. Pero el Legion 5 en particular muestra resultados aún mejores. Su potentei7-12700H incluso deja a los modelos con un i9 en el polvo.
La CPU sólo alcanza un TDP de 35 vatios en batería. En consecuencia, la puntuación de Cinebench R15 cae a 1.466 puntos, ¡un descenso de casi el 45%!
Cinebench R15 Multi endurance test
Cinebench R23: Multi Core | Single Core
Cinebench R20: CPU (Multi Core) | CPU (Single Core)
Cinebench R15: CPU Multi 64Bit | CPU Single 64Bit
Blender: v2.79 BMW27 CPU
7-Zip 18.03: 7z b 4 | 7z b 4 -mmt1
Geekbench 5.5: Multi-Core | Single-Core
HWBOT x265 Benchmark v2.2: 4k Preset
LibreOffice : 20 Documents To PDF
R Benchmark 2.5: Overall mean
| CPU Performance rating | |
| Media de la clase Gaming | |
| Lenovo Legion 5 Pro 16 G7 i7 RTX 3070Ti | |
| MSI Vector GP66 12UGS | |
| MSI Stealth GS66 12UGS | |
| Razer Blade 17 (i7-12800H, RTX 3070 Ti) | |
| Razer Blade 17 RTX 3080 Ti | |
| Medio Intel Core i7-12800H | |
| Razer Blade 17 RTX 3070 -2! | |
| Cinebench R23 / Multi Core | |
| Media de la clase Gaming (10488 - 40970, n=111, últimos 2 años) | |
| Lenovo Legion 5 Pro 16 G7 i7 RTX 3070Ti | |
| MSI Stealth GS66 12UGS | |
| MSI Vector GP66 12UGS | |
| Razer Blade 17 (i7-12800H, RTX 3070 Ti) | |
| Razer Blade 17 RTX 3080 Ti | |
| Medio Intel Core i7-12800H (9777 - 16597, n=5) | |
| Razer Blade 17 RTX 3070 | |
| Cinebench R23 / Single Core | |
| Media de la clase Gaming (1166 - 2356, n=111, últimos 2 años) | |
| MSI Vector GP66 12UGS | |
| Razer Blade 17 RTX 3080 Ti | |
| Razer Blade 17 (i7-12800H, RTX 3070 Ti) | |
| Medio Intel Core i7-12800H (1796 - 1859, n=5) | |
| Lenovo Legion 5 Pro 16 G7 i7 RTX 3070Ti | |
| MSI Stealth GS66 12UGS | |
| Razer Blade 17 RTX 3070 | |
| Cinebench R20 / CPU (Multi Core) | |
| Media de la clase Gaming (4029 - 16108, n=110, últimos 2 años) | |
| Lenovo Legion 5 Pro 16 G7 i7 RTX 3070Ti | |
| MSI Stealth GS66 12UGS | |
| MSI Vector GP66 12UGS | |
| Razer Blade 17 RTX 3080 Ti | |
| Medio Intel Core i7-12800H (3741 - 6433, n=5) | |
| Razer Blade 17 (i7-12800H, RTX 3070 Ti) | |
| Razer Blade 17 RTX 3070 | |
| Cinebench R20 / CPU (Single Core) | |
| Media de la clase Gaming (442 - 895, n=110, últimos 2 años) | |
| MSI Vector GP66 12UGS | |
| Razer Blade 17 RTX 3080 Ti | |
| Razer Blade 17 (i7-12800H, RTX 3070 Ti) | |
| Medio Intel Core i7-12800H (690 - 714, n=5) | |
| Lenovo Legion 5 Pro 16 G7 i7 RTX 3070Ti | |
| MSI Stealth GS66 12UGS | |
| Razer Blade 17 RTX 3070 | |
| Cinebench R15 / CPU Multi 64Bit | |
| Media de la clase Gaming (1578 - 6271, n=109, últimos 2 años) | |
| Lenovo Legion 5 Pro 16 G7 i7 RTX 3070Ti | |
| MSI Stealth GS66 12UGS | |
| Razer Blade 17 (i7-12800H, RTX 3070 Ti) | |
| MSI Vector GP66 12UGS | |
| Medio Intel Core i7-12800H (1566 - 2697, n=5) | |
| Razer Blade 17 RTX 3080 Ti | |
| Razer Blade 17 RTX 3070 | |
| Cinebench R15 / CPU Single 64Bit | |
| Media de la clase Gaming (188.8 - 343, n=110, últimos 2 años) | |
| MSI Vector GP66 12UGS | |
| Razer Blade 17 (i7-12800H, RTX 3070 Ti) | |
| Razer Blade 17 RTX 3080 Ti | |
| Lenovo Legion 5 Pro 16 G7 i7 RTX 3070Ti | |
| MSI Stealth GS66 12UGS | |
| Medio Intel Core i7-12800H (242 - 269, n=5) | |
| Razer Blade 17 RTX 3070 | |
| Blender / v2.79 BMW27 CPU | |
| Razer Blade 17 RTX 3070 | |
| Medio Intel Core i7-12800H (192 - 306, n=5) | |
| Razer Blade 17 RTX 3080 Ti | |
| Razer Blade 17 (i7-12800H, RTX 3070 Ti) | |
| MSI Vector GP66 12UGS | |
| MSI Stealth GS66 12UGS | |
| Lenovo Legion 5 Pro 16 G7 i7 RTX 3070Ti | |
| Media de la clase Gaming (80 - 330, n=108, últimos 2 años) | |
| 7-Zip 18.03 / 7z b 4 | |
| Media de la clase Gaming (33491 - 148086, n=109, últimos 2 años) | |
| Lenovo Legion 5 Pro 16 G7 i7 RTX 3070Ti | |
| MSI Stealth GS66 12UGS | |
| MSI Vector GP66 12UGS | |
| Razer Blade 17 (i7-12800H, RTX 3070 Ti) | |
| Razer Blade 17 RTX 3080 Ti | |
| Medio Intel Core i7-12800H (44553 - 68930, n=5) | |
| Razer Blade 17 RTX 3070 | |
| 7-Zip 18.03 / 7z b 4 -mmt1 | |
| Media de la clase Gaming (4199 - 7436, n=109, últimos 2 años) | |
| MSI Vector GP66 12UGS | |
| Lenovo Legion 5 Pro 16 G7 i7 RTX 3070Ti | |
| Medio Intel Core i7-12800H (5726 - 5976, n=5) | |
| Razer Blade 17 RTX 3080 Ti | |
| MSI Stealth GS66 12UGS | |
| Razer Blade 17 (i7-12800H, RTX 3070 Ti) | |
| Razer Blade 17 RTX 3070 | |
| Geekbench 5.5 / Multi-Core | |
| Media de la clase Gaming (6460 - 27010, n=109, últimos 2 años) | |
| MSI Stealth GS66 12UGS | |
| Lenovo Legion 5 Pro 16 G7 i7 RTX 3070Ti | |
| Razer Blade 17 RTX 3080 Ti | |
| MSI Vector GP66 12UGS | |
| Razer Blade 17 (i7-12800H, RTX 3070 Ti) | |
| Medio Intel Core i7-12800H (9607 - 12940, n=5) | |
| Geekbench 5.5 / Single-Core | |
| Media de la clase Gaming (986 - 2474, n=109, últimos 2 años) | |
| MSI Vector GP66 12UGS | |
| Medio Intel Core i7-12800H (1739 - 1842, n=5) | |
| Razer Blade 17 (i7-12800H, RTX 3070 Ti) | |
| Lenovo Legion 5 Pro 16 G7 i7 RTX 3070Ti | |
| Razer Blade 17 RTX 3080 Ti | |
| MSI Stealth GS66 12UGS | |
| HWBOT x265 Benchmark v2.2 / 4k Preset | |
| Media de la clase Gaming (11.5 - 44.3, n=109, últimos 2 años) | |
| Lenovo Legion 5 Pro 16 G7 i7 RTX 3070Ti | |
| MSI Vector GP66 12UGS | |
| MSI Stealth GS66 12UGS | |
| Razer Blade 17 RTX 3080 Ti | |
| Medio Intel Core i7-12800H (11.7 - 19.4, n=5) | |
| Razer Blade 17 (i7-12800H, RTX 3070 Ti) | |
| Razer Blade 17 RTX 3070 | |
| LibreOffice / 20 Documents To PDF | |
| Media de la clase Gaming (19 - 88.8, n=109, últimos 2 años) | |
| Razer Blade 17 RTX 3080 Ti | |
| Medio Intel Core i7-12800H (41.3 - 51.5, n=5) | |
| Razer Blade 17 RTX 3070 | |
| Lenovo Legion 5 Pro 16 G7 i7 RTX 3070Ti | |
| Razer Blade 17 (i7-12800H, RTX 3070 Ti) | |
| MSI Stealth GS66 12UGS | |
| MSI Vector GP66 12UGS | |
| R Benchmark 2.5 / Overall mean | |
| Razer Blade 17 RTX 3070 | |
| Razer Blade 17 RTX 3080 Ti | |
| Medio Intel Core i7-12800H (0.4442 - 0.4715, n=5) | |
| Razer Blade 17 (i7-12800H, RTX 3070 Ti) | |
| Lenovo Legion 5 Pro 16 G7 i7 RTX 3070Ti | |
| MSI Stealth GS66 12UGS | |
| Media de la clase Gaming (0.3439 - 0.759, n=110, últimos 2 años) | |
| MSI Vector GP66 12UGS | |
* ... más pequeño es mejor
AIDA64: FP32 Ray-Trace | FPU Julia | CPU SHA3 | CPU Queen | FPU SinJulia | FPU Mandel | CPU AES | CPU ZLib | FP64 Ray-Trace | CPU PhotoWorxx
| Performance rating | |
| Media de la clase Gaming | |
| Lenovo Legion 5 Pro 16 G7 i7 RTX 3070Ti | |
| MSI Stealth GS66 12UGS | |
| MSI Vector GP66 12UGS | |
| Medio Intel Core i7-12800H | |
| Razer Blade 17 RTX 3080 Ti | |
| Razer Blade 17 (i7-12800H, RTX 3070 Ti) | |
| Razer Blade 17 RTX 3070 -9! | |
| AIDA64 / FP32 Ray-Trace | |
| Media de la clase Gaming (10227 - 85542, n=108, últimos 2 años) | |
| Lenovo Legion 5 Pro 16 G7 i7 RTX 3070Ti | |
| MSI Stealth GS66 12UGS | |
| Medio Intel Core i7-12800H (5839 - 15206, n=5) | |
| MSI Vector GP66 12UGS | |
| Razer Blade 17 (i7-12800H, RTX 3070 Ti) | |
| Razer Blade 17 RTX 3080 Ti | |
| AIDA64 / FPU Julia | |
| Media de la clase Gaming (51376 - 238426, n=108, últimos 2 años) | |
| Medio Intel Core i7-12800H (27801 - 80002, n=5) | |
| Lenovo Legion 5 Pro 16 G7 i7 RTX 3070Ti | |
| MSI Stealth GS66 12UGS | |
| MSI Vector GP66 12UGS | |
| Razer Blade 17 (i7-12800H, RTX 3070 Ti) | |
| Razer Blade 17 RTX 3080 Ti | |
| AIDA64 / CPU SHA3 | |
| Media de la clase Gaming (2180 - 9817, n=108, últimos 2 años) | |
| Lenovo Legion 5 Pro 16 G7 i7 RTX 3070Ti | |
| MSI Stealth GS66 12UGS | |
| MSI Vector GP66 12UGS | |
| Medio Intel Core i7-12800H (2013 - 3684, n=5) | |
| Razer Blade 17 (i7-12800H, RTX 3070 Ti) | |
| Razer Blade 17 RTX 3080 Ti | |
| AIDA64 / CPU Queen | |
| Media de la clase Gaming (49785 - 173351, n=96, últimos 2 años) | |
| MSI Vector GP66 12UGS | |
| Razer Blade 17 RTX 3080 Ti | |
| Lenovo Legion 5 Pro 16 G7 i7 RTX 3070Ti | |
| MSI Stealth GS66 12UGS | |
| Medio Intel Core i7-12800H (85965 - 108084, n=5) | |
| Razer Blade 17 (i7-12800H, RTX 3070 Ti) | |
| AIDA64 / FPU SinJulia | |
| Media de la clase Gaming (4424 - 33636, n=108, últimos 2 años) | |
| Lenovo Legion 5 Pro 16 G7 i7 RTX 3070Ti | |
| MSI Stealth GS66 12UGS | |
| MSI Vector GP66 12UGS | |
| Razer Blade 17 (i7-12800H, RTX 3070 Ti) | |
| Razer Blade 17 RTX 3080 Ti | |
| Medio Intel Core i7-12800H (7027 - 9658, n=5) | |
| AIDA64 / FPU Mandel | |
| Media de la clase Gaming (25115 - 128721, n=108, últimos 2 años) | |
| Lenovo Legion 5 Pro 16 G7 i7 RTX 3070Ti | |
| MSI Stealth GS66 12UGS | |
| Medio Intel Core i7-12800H (15765 - 38179, n=5) | |
| MSI Vector GP66 12UGS | |
| Razer Blade 17 (i7-12800H, RTX 3070 Ti) | |
| Razer Blade 17 RTX 3080 Ti | |
| AIDA64 / CPU AES | |
| Media de la clase Gaming (39258 - 247074, n=108, últimos 2 años) | |
| Lenovo Legion 5 Pro 16 G7 i7 RTX 3070Ti | |
| MSI Stealth GS66 12UGS | |
| MSI Vector GP66 12UGS | |
| Medio Intel Core i7-12800H (55371 - 73928, n=5) | |
| Razer Blade 17 (i7-12800H, RTX 3070 Ti) | |
| Razer Blade 17 RTX 3080 Ti | |
| AIDA64 / CPU ZLib | |
| Media de la clase Gaming (574 - 2531, n=108, últimos 2 años) | |
| Lenovo Legion 5 Pro 16 G7 i7 RTX 3070Ti | |
| MSI Vector GP66 12UGS | |
| MSI Stealth GS66 12UGS | |
| Razer Blade 17 (i7-12800H, RTX 3070 Ti) | |
| Medio Intel Core i7-12800H (701 - 1047, n=5) | |
| Razer Blade 17 RTX 3080 Ti | |
| Razer Blade 17 RTX 3070 | |
| AIDA64 / FP64 Ray-Trace | |
| Media de la clase Gaming (5509 - 45446, n=108, últimos 2 años) | |
| Lenovo Legion 5 Pro 16 G7 i7 RTX 3070Ti | |
| MSI Stealth GS66 12UGS | |
| Medio Intel Core i7-12800H (3257 - 8559, n=5) | |
| MSI Vector GP66 12UGS | |
| Razer Blade 17 RTX 3080 Ti | |
| Razer Blade 17 (i7-12800H, RTX 3070 Ti) | |
| AIDA64 / CPU PhotoWorxx | |
| Media de la clase Gaming (12271 - 89891, n=108, últimos 2 años) | |
| Razer Blade 17 RTX 3080 Ti | |
| MSI Stealth GS66 12UGS | |
| Medio Intel Core i7-12800H (31329 - 40992, n=5) | |
| Lenovo Legion 5 Pro 16 G7 i7 RTX 3070Ti | |
| Razer Blade 17 (i7-12800H, RTX 3070 Ti) | |
| MSI Vector GP66 12UGS | |
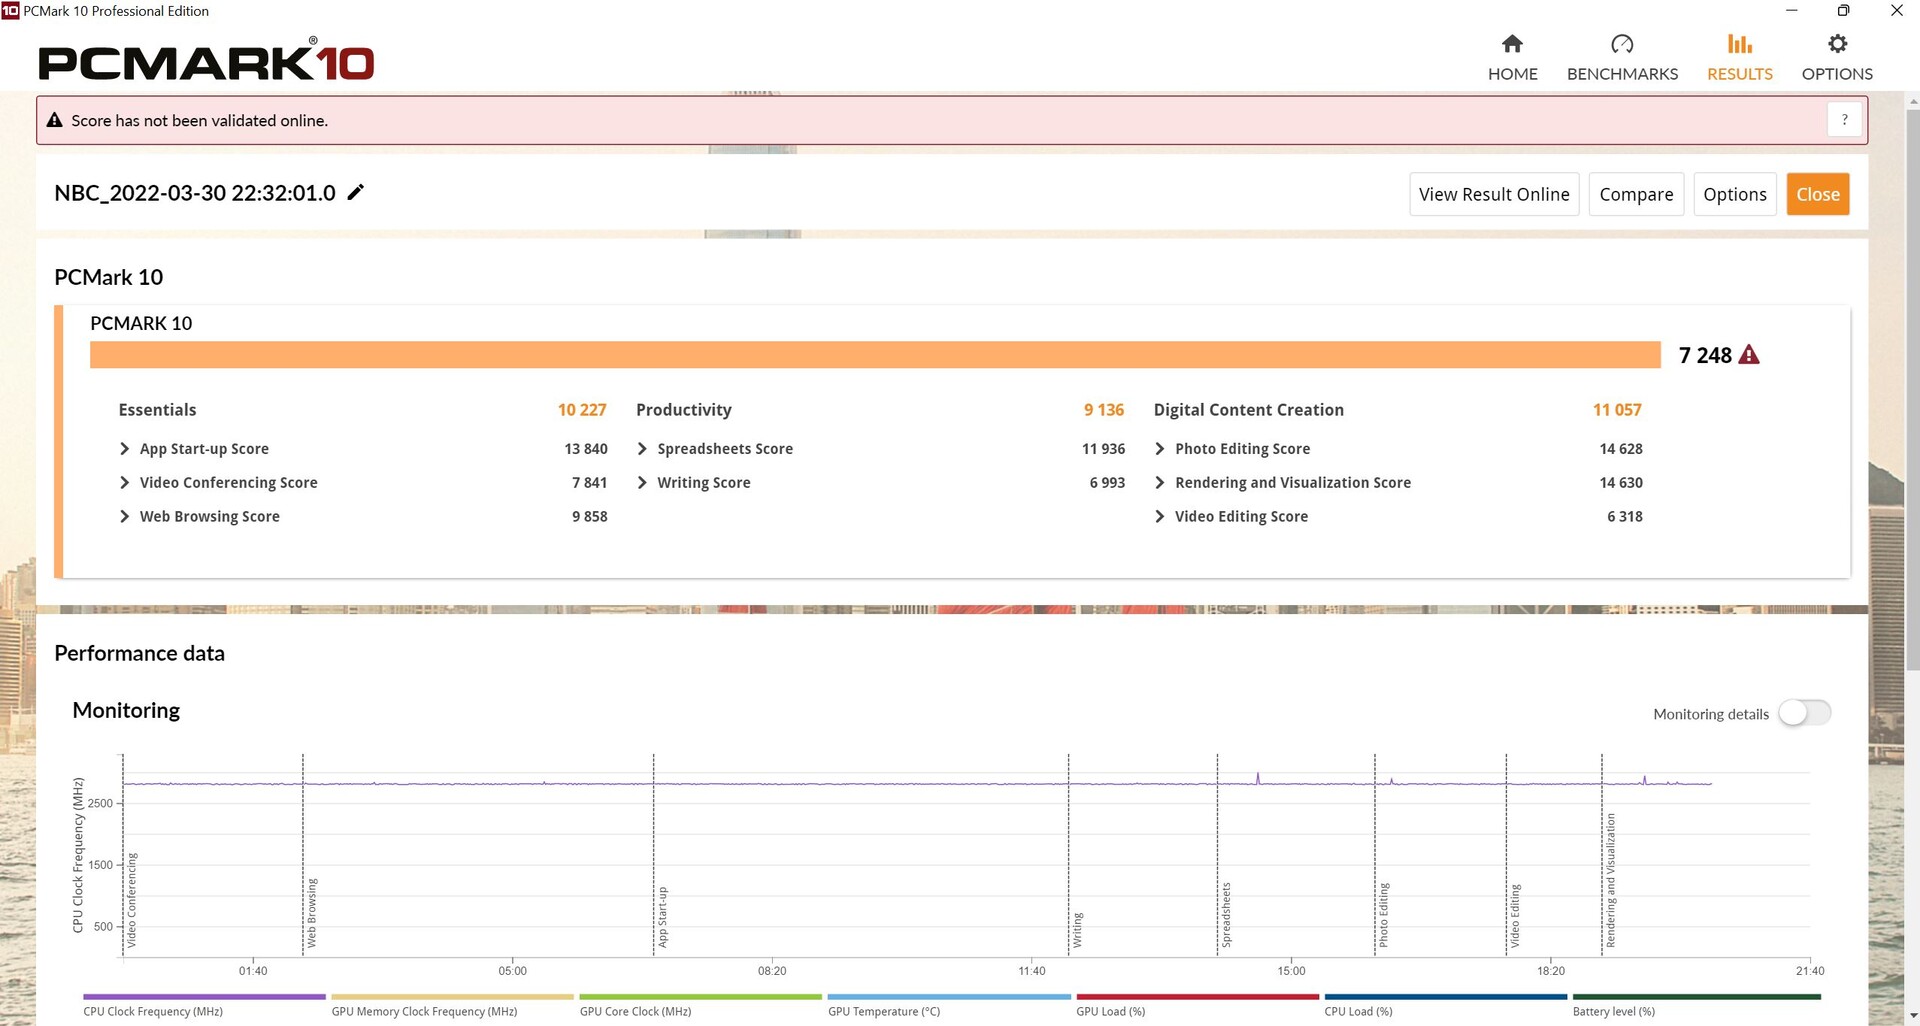
Rendimiento del sistema
El rendimiento del sistema es satisfactorio, pero no observamos un efecto positivo en comparación con el predecesor basado en Tiger Lake
CrossMark: Overall | Productivity | Creativity | Responsiveness
| PCMark 10 / Score | |
| Media de la clase Gaming (5828 - 11574, n=96, últimos 2 años) | |
| MSI Vector GP66 12UGS | |
| Razer Blade 17 RTX 3080 Ti | |
| MSI Stealth GS66 12UGS | |
| Lenovo Legion 5 Pro 16 G7 i7 RTX 3070Ti | |
| Razer Blade 17 RTX 3070 | |
| Razer Blade 17 (i7-12800H, RTX 3070 Ti) | |
| Medio Intel Core i7-12800H, NVIDIA GeForce RTX 3070 Ti Laptop GPU (n=1) | |
| PCMark 10 / Essentials | |
| MSI Vector GP66 12UGS | |
| MSI Stealth GS66 12UGS | |
| Razer Blade 17 RTX 3070 | |
| Razer Blade 17 RTX 3080 Ti | |
| Media de la clase Gaming (8810 - 12600, n=100, últimos 2 años) | |
| Razer Blade 17 (i7-12800H, RTX 3070 Ti) | |
| Medio Intel Core i7-12800H, NVIDIA GeForce RTX 3070 Ti Laptop GPU (n=1) | |
| Lenovo Legion 5 Pro 16 G7 i7 RTX 3070Ti | |
| PCMark 10 / Productivity | |
| Media de la clase Gaming (6845 - 21327, n=98, últimos 2 años) | |
| MSI Vector GP66 12UGS | |
| Lenovo Legion 5 Pro 16 G7 i7 RTX 3070Ti | |
| MSI Stealth GS66 12UGS | |
| Razer Blade 17 RTX 3080 Ti | |
| Razer Blade 17 RTX 3070 | |
| Razer Blade 17 (i7-12800H, RTX 3070 Ti) | |
| Medio Intel Core i7-12800H, NVIDIA GeForce RTX 3070 Ti Laptop GPU (n=1) | |
| PCMark 10 / Digital Content Creation | |
| Media de la clase Gaming (7602 - 19657, n=98, últimos 2 años) | |
| MSI Vector GP66 12UGS | |
| Razer Blade 17 RTX 3080 Ti | |
| Lenovo Legion 5 Pro 16 G7 i7 RTX 3070Ti | |
| MSI Stealth GS66 12UGS | |
| Razer Blade 17 (i7-12800H, RTX 3070 Ti) | |
| Medio Intel Core i7-12800H, NVIDIA GeForce RTX 3070 Ti Laptop GPU (n=1) | |
| Razer Blade 17 RTX 3070 | |
| CrossMark / Overall | |
| Media de la clase Gaming (1366 - 2409, n=96, últimos 2 años) | |
| Lenovo Legion 5 Pro 16 G7 i7 RTX 3070Ti | |
| Razer Blade 17 (i7-12800H, RTX 3070 Ti) | |
| Medio Intel Core i7-12800H, NVIDIA GeForce RTX 3070 Ti Laptop GPU (n=1) | |
| CrossMark / Productivity | |
| Lenovo Legion 5 Pro 16 G7 i7 RTX 3070Ti | |
| Media de la clase Gaming (1386 - 2254, n=96, últimos 2 años) | |
| Razer Blade 17 (i7-12800H, RTX 3070 Ti) | |
| Medio Intel Core i7-12800H, NVIDIA GeForce RTX 3070 Ti Laptop GPU (n=1) | |
| CrossMark / Creativity | |
| Media de la clase Gaming (1343 - 2729, n=96, últimos 2 años) | |
| Lenovo Legion 5 Pro 16 G7 i7 RTX 3070Ti | |
| Razer Blade 17 (i7-12800H, RTX 3070 Ti) | |
| Medio Intel Core i7-12800H, NVIDIA GeForce RTX 3070 Ti Laptop GPU (n=1) | |
| CrossMark / Responsiveness | |
| Lenovo Legion 5 Pro 16 G7 i7 RTX 3070Ti | |
| Media de la clase Gaming (1226 - 2334, n=96, últimos 2 años) | |
| Razer Blade 17 (i7-12800H, RTX 3070 Ti) | |
| Medio Intel Core i7-12800H, NVIDIA GeForce RTX 3070 Ti Laptop GPU (n=1) | |
| PCMark 10 Score | 7248 puntos | |
ayuda | ||
| AIDA64 / Memory Copy | |
| Media de la clase Gaming (21750 - 129946, n=108, últimos 2 años) | |
| Razer Blade 17 RTX 3080 Ti | |
| MSI Stealth GS66 12UGS | |
| Medio Intel Core i7-12800H (48643 - 62522, n=5) | |
| Lenovo Legion 5 Pro 16 G7 i7 RTX 3070Ti | |
| Razer Blade 17 (i7-12800H, RTX 3070 Ti) | |
| MSI Vector GP66 12UGS | |
| AIDA64 / Memory Read | |
| Media de la clase Gaming (22956 - 118858, n=108, últimos 2 años) | |
| Razer Blade 17 RTX 3080 Ti | |
| MSI Stealth GS66 12UGS | |
| Medio Intel Core i7-12800H (56629 - 66199, n=5) | |
| Lenovo Legion 5 Pro 16 G7 i7 RTX 3070Ti | |
| Razer Blade 17 (i7-12800H, RTX 3070 Ti) | |
| MSI Vector GP66 12UGS | |
| AIDA64 / Memory Write | |
| Media de la clase Gaming (22297 - 135096, n=108, últimos 2 años) | |
| MSI Stealth GS66 12UGS | |
| Razer Blade 17 RTX 3080 Ti | |
| Medio Intel Core i7-12800H (50923 - 66074, n=5) | |
| Lenovo Legion 5 Pro 16 G7 i7 RTX 3070Ti | |
| Razer Blade 17 (i7-12800H, RTX 3070 Ti) | |
| MSI Vector GP66 12UGS | |
| AIDA64 / Memory Latency | |
| Media de la clase Gaming (75.3 - 259, n=108, últimos 2 años) | |
| Lenovo Legion 5 Pro 16 G7 i7 RTX 3070Ti | |
| MSI Stealth GS66 12UGS | |
| MSI Vector GP66 12UGS | |
| Medio Intel Core i7-12800H (89.3 - 95.2, n=5) | |
| Razer Blade 17 RTX 3070 | |
| Razer Blade 17 RTX 3080 Ti | |
| Razer Blade 17 (i7-12800H, RTX 3070 Ti) | |
* ... más pequeño es mejor
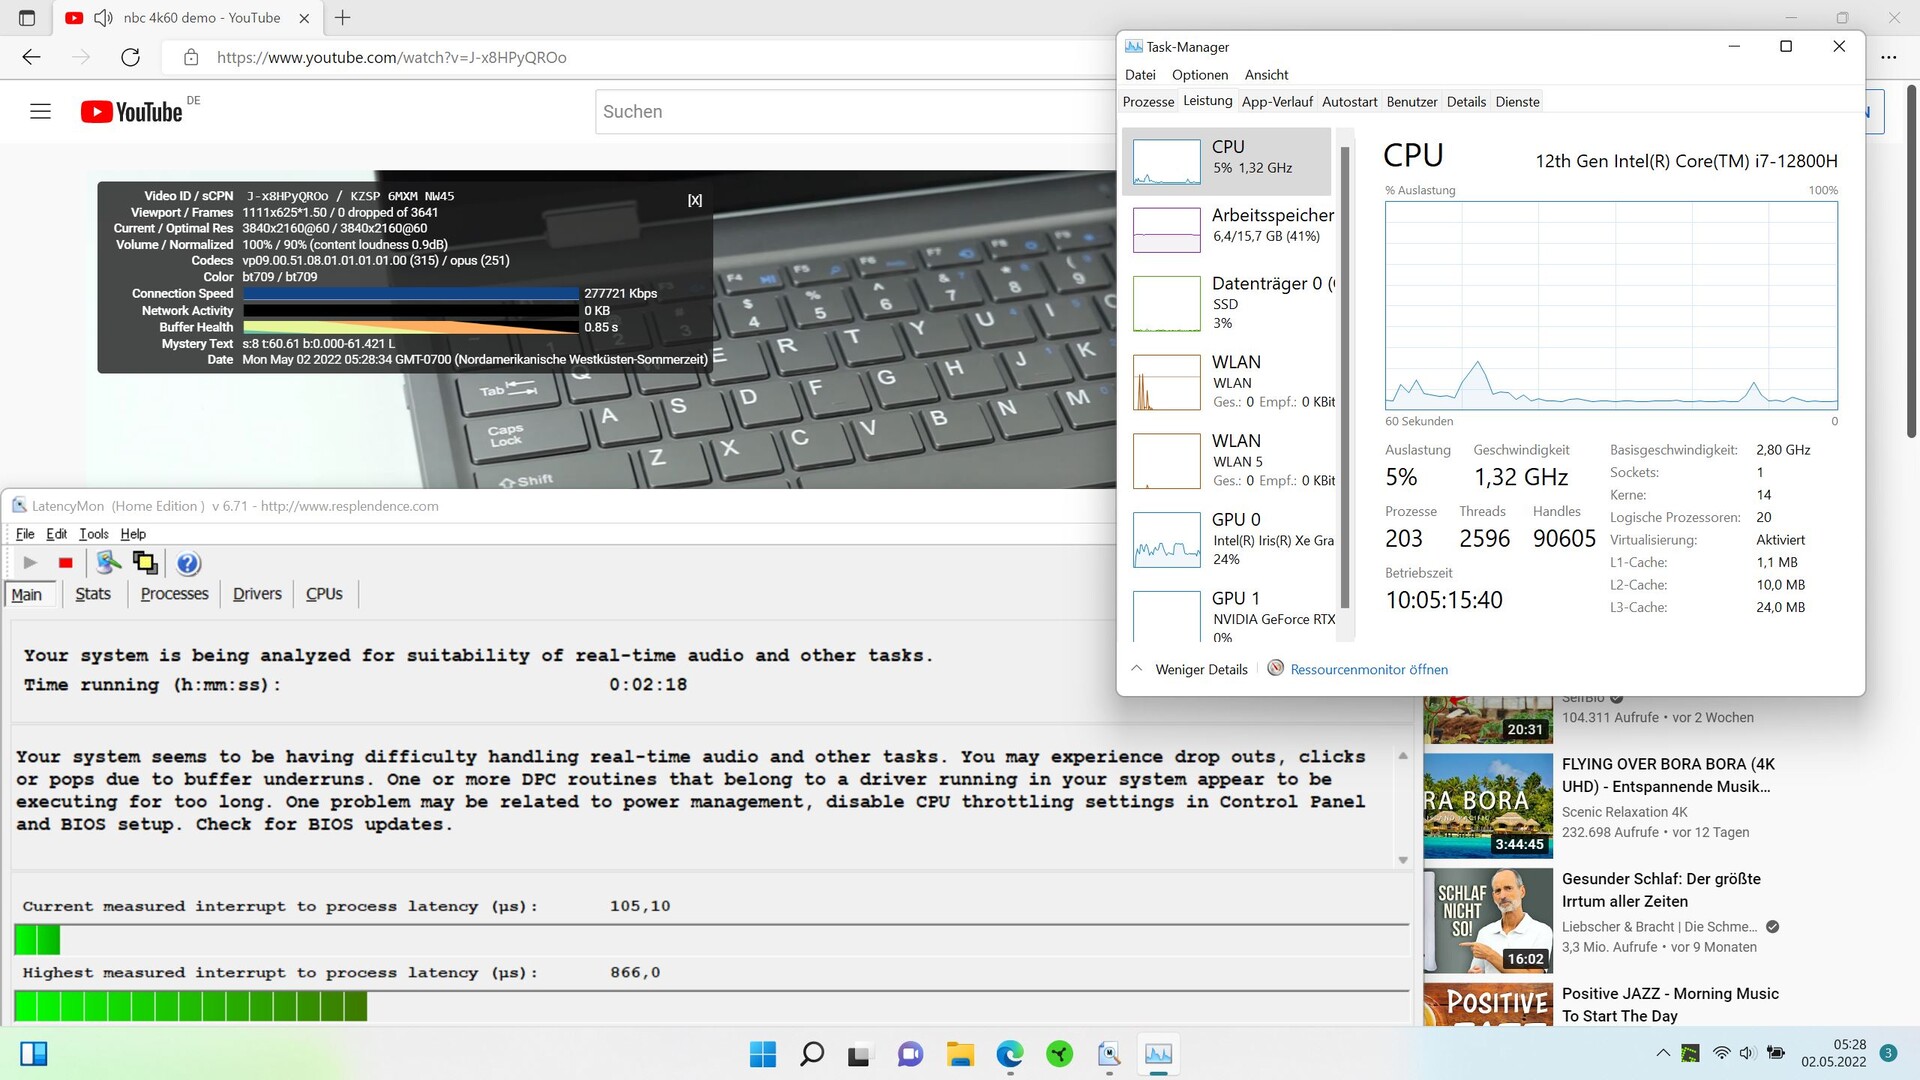
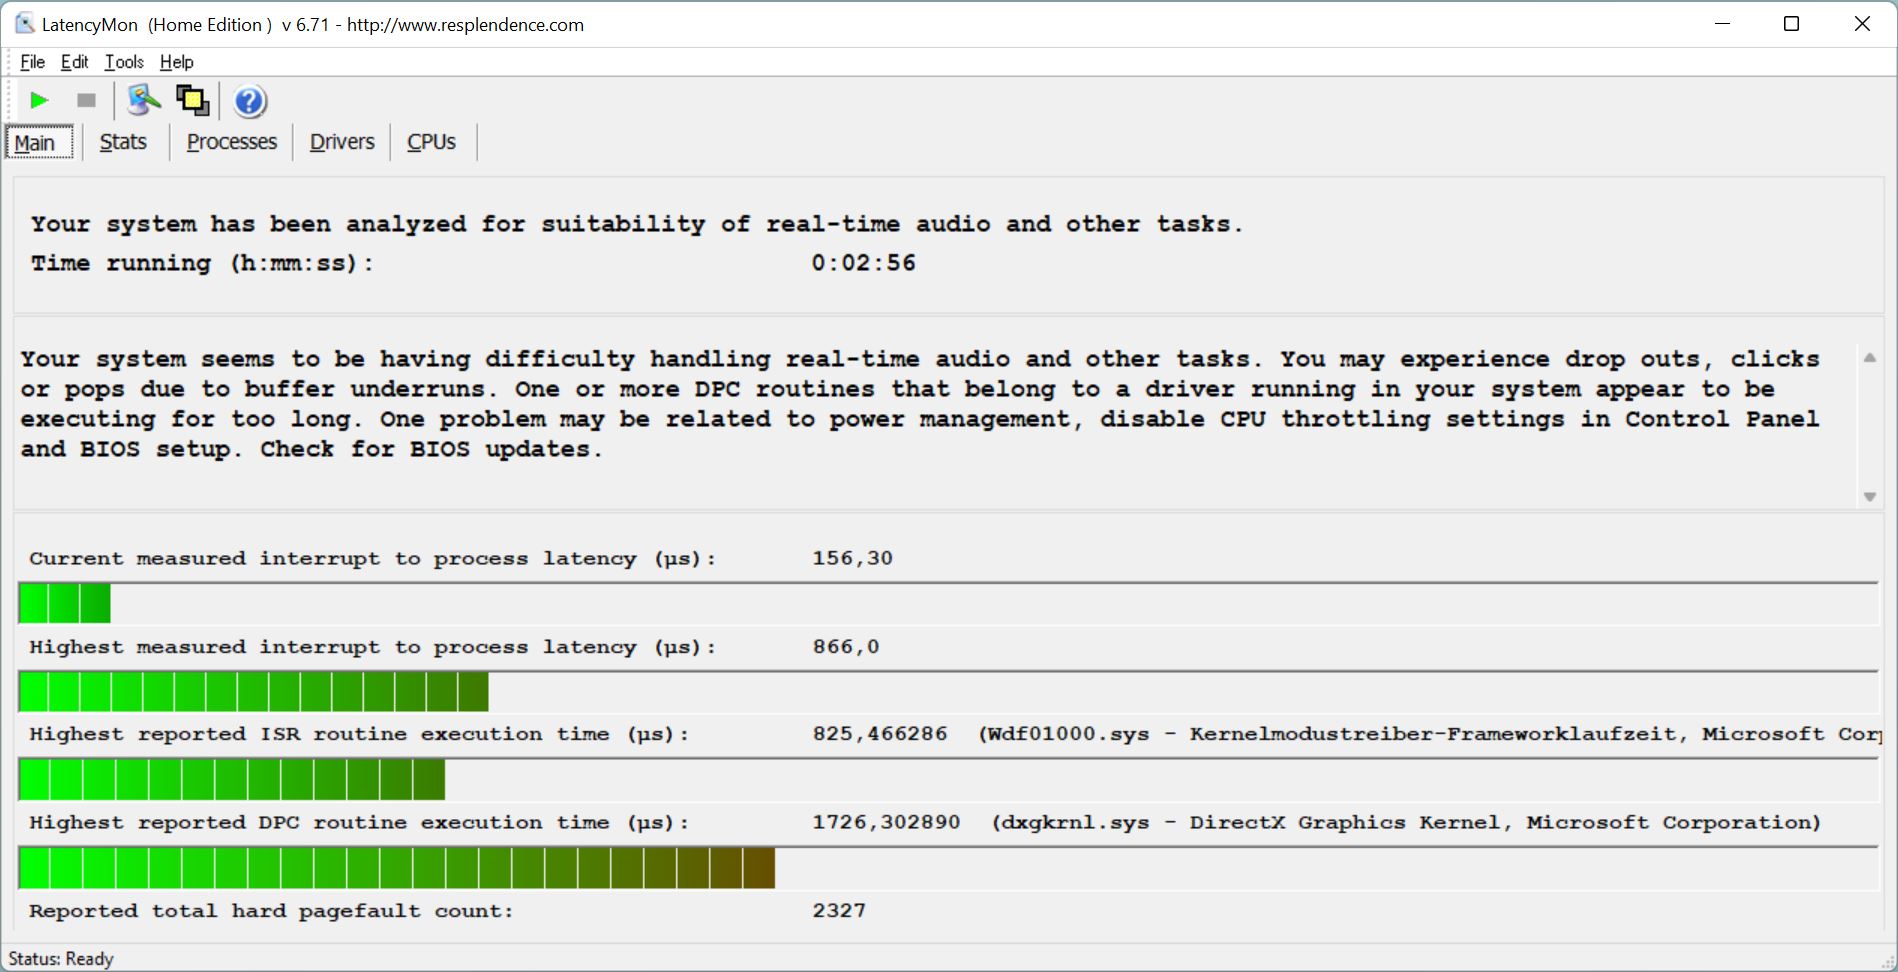
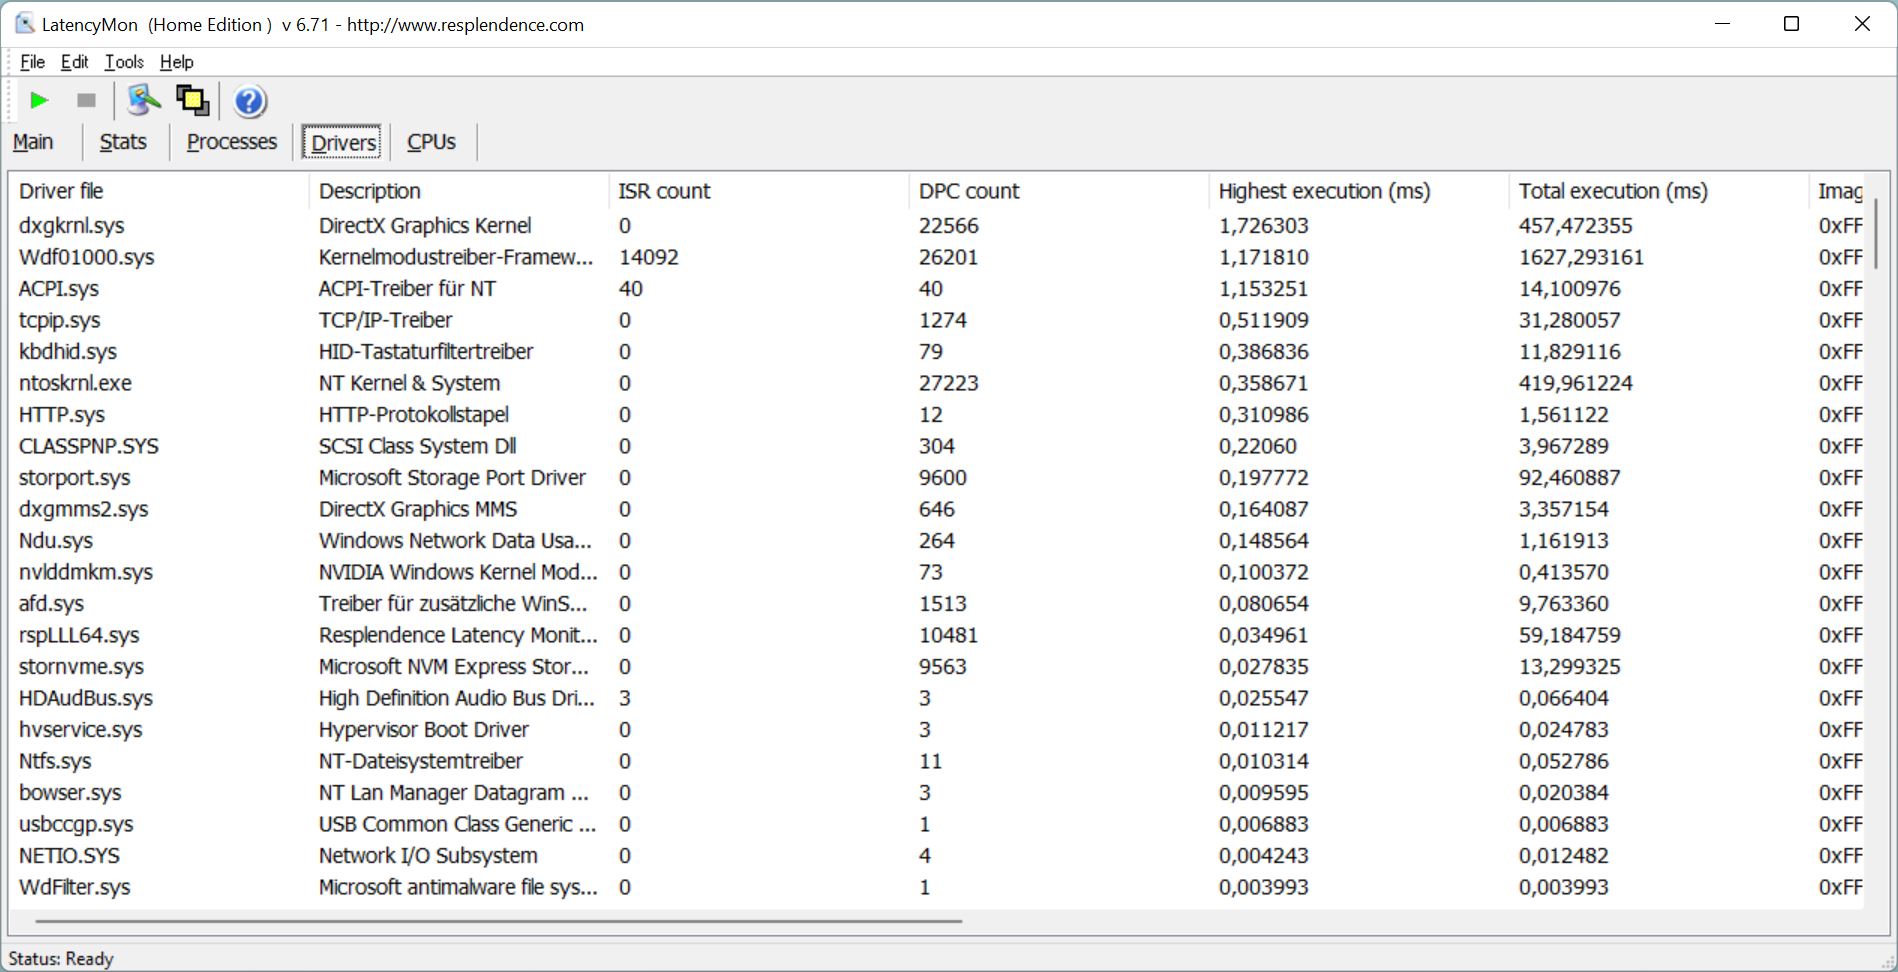
Latencias del CPD
LatencyMon ya registra ligeras latencias sólo con abrir el navegador Edge, que aumentan en nuestra página de inicio cuando abrimos varias pestañas.
La posterior reproducción de nuestro vídeo 4K/60 fps de YouTube aumenta aún más las latencias, pero el vídeo se renderiza al menos sin pérdida de fotogramas.
| DPC Latencies / LatencyMon - interrupt to process latency (max), Web, Youtube, Prime95 | |
| MSI Vector GP66 12UGS | |
| MSI Stealth GS66 12UGS | |
| Razer Blade 17 RTX 3080 Ti | |
| Razer Blade 17 (i7-12800H, RTX 3070 Ti) | |
| Lenovo Legion 5 Pro 16 G7 i7 RTX 3070Ti | |
| Razer Blade 17 RTX 3070 | |
* ... más pequeño es mejor
Almacenamiento
Razer ha instalado un SSD Samsung NVMe con 1 TB de espacio de almacenamiento en nuestra configuración de análisis. El SSD ocupa el 7º lugar en nuestro Artículo de pruebas de HDD/SSDlo que lo convierte en uno de los modelos más rápidos disponibles.
La solución de almacenamiento también logra unos índices muy buenos en comparación, pero el mismo modelo es incluso ligeramente más rápido en Legion. El rendimiento continuo también es irreprochable.

* ... más pequeño es mejor
Continuous load read: DiskSpd Read Loop, Queue Depth 8
Tarjeta gráfica
Ahora, vamos a echar un vistazo a si hay una brecha entre el built-inRTX 3070 Ti y laRTX 3080 Ti en la configuración superior, y si es así, descubriremos cuán grande es.
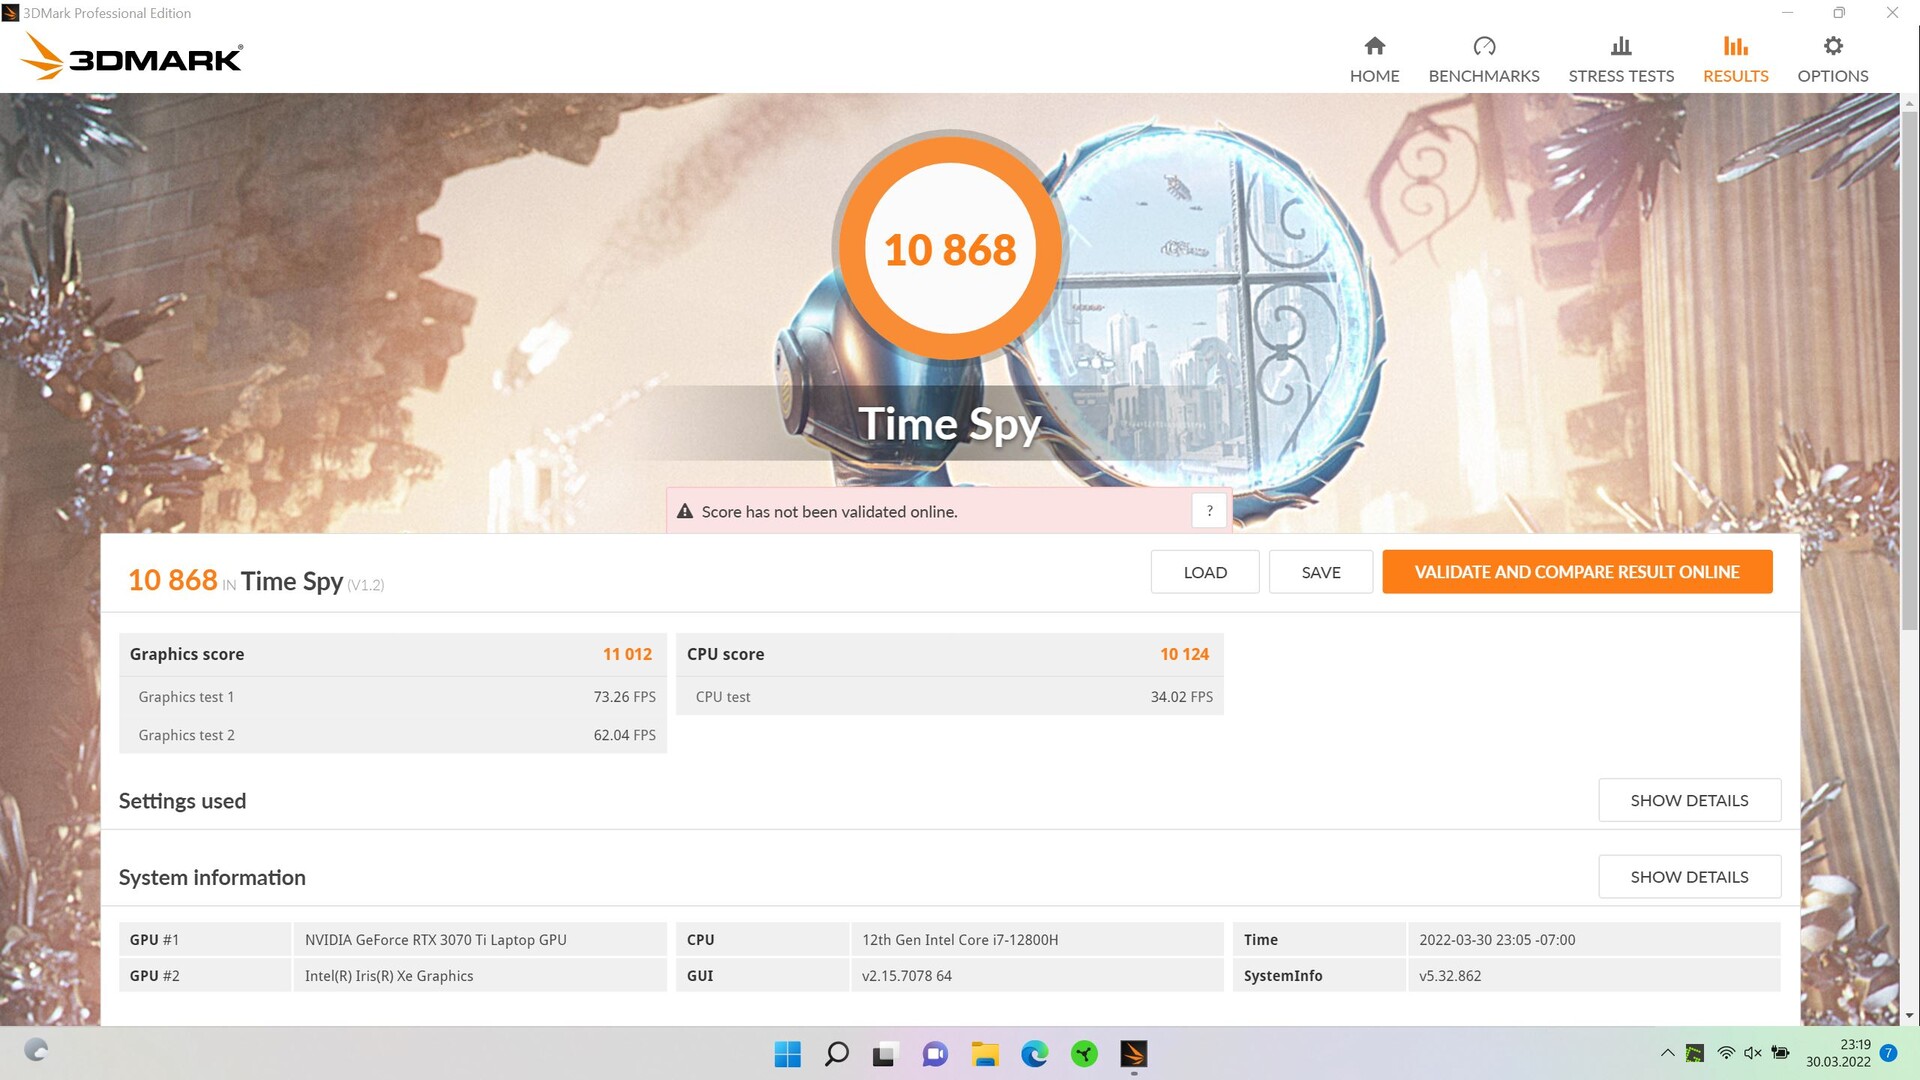
En las pruebas sintéticas de 3DMark, la RTX 3080 Ti rinde entre un 12% y un 20% más rápido que la Blade con RTX 3070 Ti, lo cual es una diferencia notable.
Un nuevo Fire Strike ejecutado en batería revela una pérdida de rendimiento del 77,5%, ¡y la puntuación es de sólo 4.427 en lugar de 24.111 puntos cuando está enchufado!
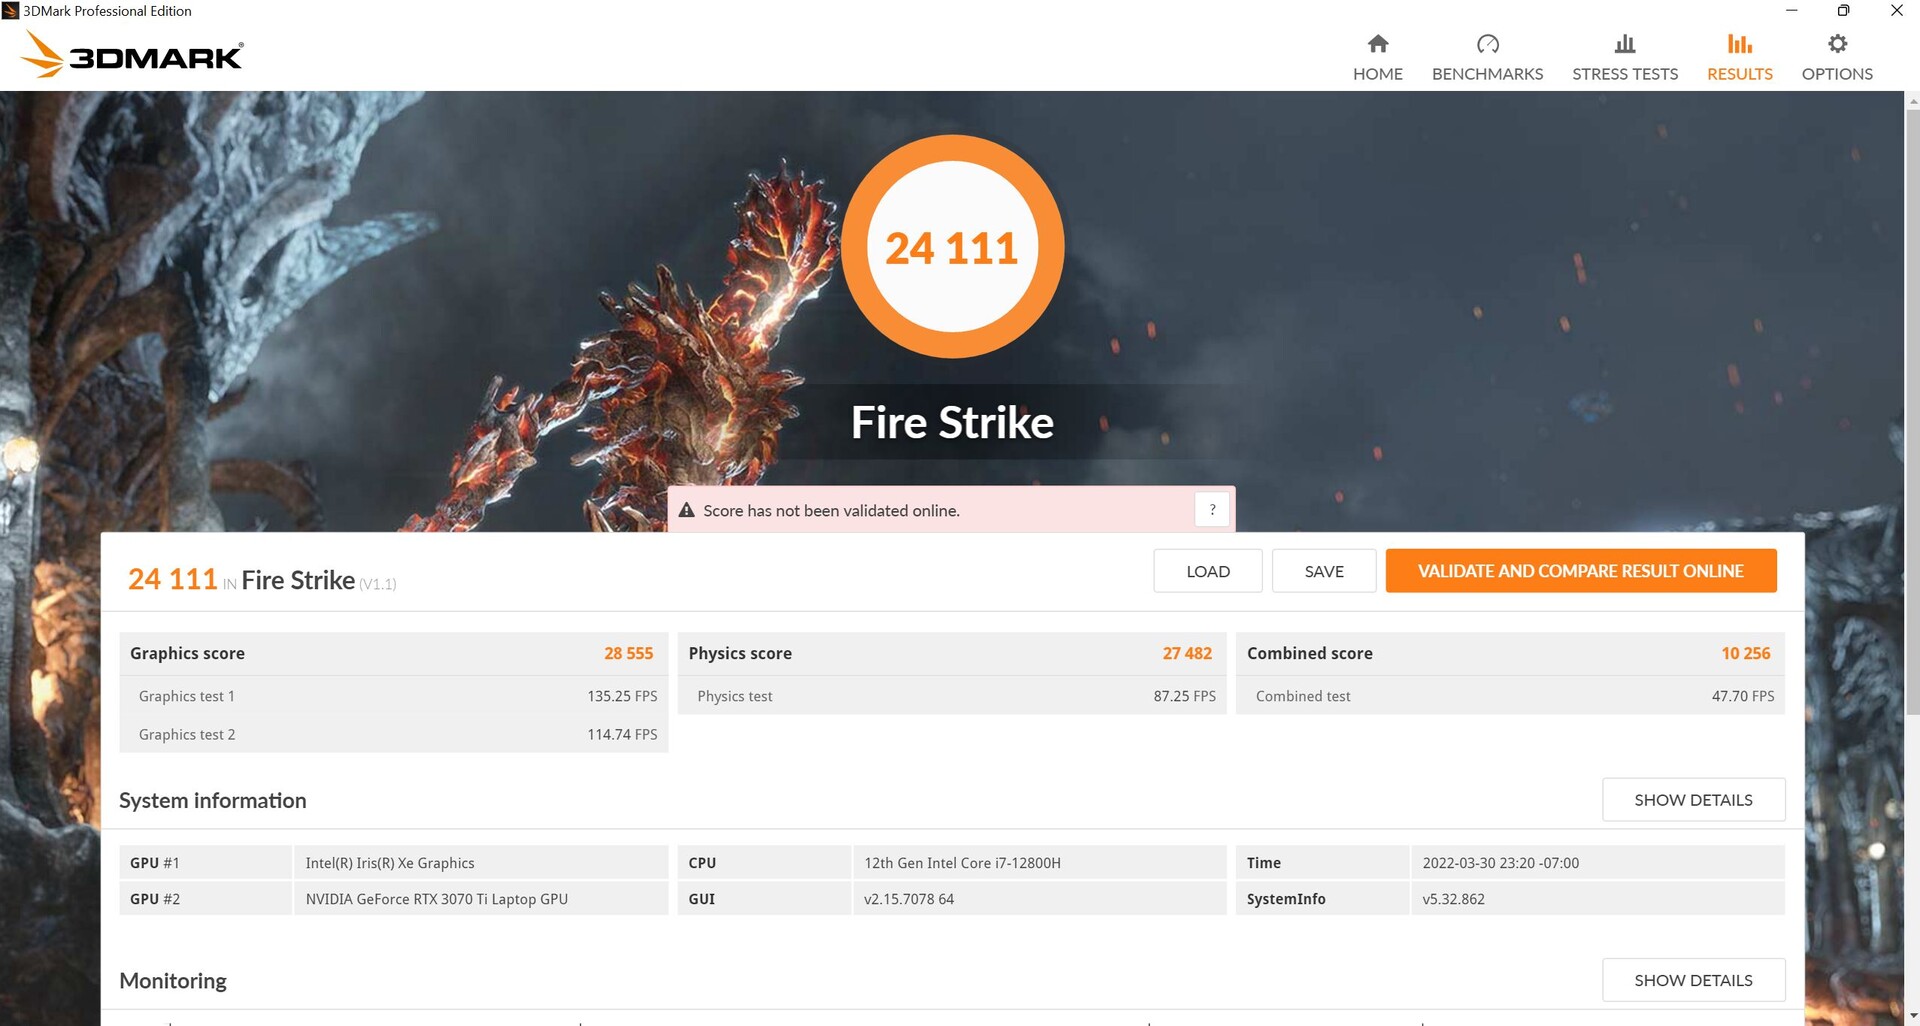

| 3DMark 11 Performance | 31308 puntos | |
| 3DMark Cloud Gate Standard Score | 52870 puntos | |
| 3DMark Fire Strike Score | 24111 puntos | |
| 3DMark Time Spy Score | 10868 puntos | |
ayuda | ||
Rendimiento de los juegos
No hace falta decir que la RTX 3070 Ti es capaz de ejecutar casi cualquier juego en la resolución nativa y con detalles altos sin problemas. Para los entusiastas del rendimiento, sin embargo, surge la cuestión de cuántos fotogramas más puedes sacar del sistema comprando la variante RTX 3080 Ti.
En The Witcher 3, la ventaja de la RTX 3080 Ti es del 12% en Full HD y con detalles máximos. En Far Cry 5, la diferencia se reduce al 8% con los mismos ajustes. En 2K, la ventaja es del 18%.
En Cyberpunk medimos diferencias muy variables. Mientras que ambas tarjetas están prácticamente a la par en Full HD, sólo medimos una diferencia mayor a partir de 2K, donde es un considerable 22%.
En general, el Blade 17 no extrae el máximo de su RTX 3070 Ti, pero las diferencias con el modelo RTX 3080 Ti siguen siendo bastante pequeñas hasta Full HD. Sin embargo, la RTX 3080 Ti logra una notable ventaja en la resolución nativa del Blade, aunque la mayoría de juegos también deberían funcionar sin problemas con la RTX 3070. Comprar la versión mejor probablemente sólo será relevante cuando planees jugar en una pantalla externa 4K.
La tasa de fotogramas de Witcher 3sólo desciende de forma insignificante de unos 110 a 107 fps en el transcurso de una hora
The Witcher 3 FPS diagram
| bajo | medio | alto | ultra | QHD | |
|---|---|---|---|---|---|
| GTA V (2015) | 182.6 | 176.8 | 164.2 | 103.8 | |
| The Witcher 3 (2015) | 339 | 296.4 | 173.4 | 111.6 | |
| Dota 2 Reborn (2015) | 173.6 | 159.3 | 150 | 141.6 | |
| Final Fantasy XV Benchmark (2018) | 158.4 | 134.3 | 103.2 | 78.5 | |
| X-Plane 11.11 (2018) | 138.6 | 117.7 | 95.8 | ||
| Far Cry 5 (2018) | 155 | 128 | 123 | 116 | 102 |
| Strange Brigade (2018) | 369 | 258 | 217 | 191.7 | |
| Cyberpunk 2077 1.6 (2022) | 117 | 113 | 105 | 104 | 49 |
Emisiones - Ligeramente más frías
Emisiones acústicas
El rendimiento ligeramente inferior nos hace esperar un sistema algo más silencioso y frío.
Los ventiladores suelen estar inactivos en uso inactivo, incluso cuando se usan los ajustes de máximo rendimiento. El Razer Blade es uno de los dispositivos más silenciosos bajo carga, pero no hay diferencias positivas respecto al modelo con la RTX 3080 Ti.
Ruido
| Ocioso |
| 23 / 23 / 23 dB(A) |
| Carga |
| 36.92 / 50 dB(A) |
 | ||
30 dB silencioso 40 dB(A) audible 50 dB(A) ruidosamente alto |
||
min: | ||
| Razer Blade 17 (i7-12800H, RTX 3070 Ti) GeForce RTX 3070 Ti Laptop GPU, i7-12800H, Samsung PM9A1 MZVL21T0HCLR | Razer Blade 17 RTX 3080 Ti GeForce RTX 3080 Ti Laptop GPU, i7-12800H, Samsung PM9A1 MZVL21T0HCLR | Razer Blade 17 RTX 3070 GeForce RTX 3070 Laptop GPU, i7-11800H, Samsung PM9A1 MZVL21T0HCLR | Lenovo Legion 5 Pro 16 G7 i7 RTX 3070Ti GeForce RTX 3070 Ti Laptop GPU, i7-12700H, Samsung PM9A1 MZVL21T0HCLR | MSI Vector GP66 12UGS GeForce RTX 3070 Ti Laptop GPU, i9-12900H | MSI Stealth GS66 12UGS GeForce RTX 3070 Ti Laptop GPU, i7-12700H, WDC PC SN810 1TB | |
|---|---|---|---|---|---|---|
| Noise | -3% | -8% | -17% | -8% | -20% | |
| apagado / medio ambiente * (dB) | 23 | 23.3 -1% | 24.2 -5% | 24.6 -7% | 22.9 -0% | 24 -4% |
| Idle Minimum * (dB) | 23 | 23.3 -1% | 24.7 -7% | 28.4 -23% | 23.4 -2% | 31 -35% |
| Idle Average * (dB) | 23 | 23.3 -1% | 24.7 -7% | 28.4 -23% | 23.4 -2% | 32 -39% |
| Idle Maximum * (dB) | 23 | 26.3 -14% | 24.7 -7% | 28.4 -23% | 27.4 -19% | 35 -52% |
| Load Average * (dB) | 36.92 | 38.2 -3% | 44.3 -20% | 49.4 -34% | 36 2% | 48 -30% |
| Witcher 3 ultra * (dB) | 50 | 50.9 -2% | 56.3 -13% | 49.4 1% | 58.2 -16% | 43 14% |
| Load Maximum * (dB) | 50 | 49.1 2% | 47.7 5% | 54.7 -9% | 58 -16% | 48 4% |
* ... más pequeño es mejor
Temperatura
El reposamanos, al menos, permanece siempre fresco, y la carcasa metálica conduce el calor residual particularmente bien hacia el exterior. Y, de hecho, la RTX 3070 Ti Blade se mantiene un poco más fresca que su homóloga reforzada, tanto en reposo como bajo carga. Los puntos calientes de 45 °C durante los juegos son muy moderados
(±) La temperatura máxima en la parte superior es de 43 °C / 109 F, frente a la media de 40.4 °C / 105 F, que oscila entre 21.2 y 68.8 °C para la clase Gaming.
(±) El fondo se calienta hasta un máximo de 44 °C / 111 F, frente a la media de 43.2 °C / 110 F
(+) En reposo, la temperatura media de la parte superior es de 29.8 °C / 86# F, frente a la media del dispositivo de 33.9 °C / 93 F.
(-) Jugando a The Witcher 3, la temperatura media de la parte superior es de 38.3 °C / 101 F, frente a la media del dispositivo de 33.9 °C / 93 F.
(+) Los reposamanos y el panel táctil alcanzan como máximo la temperatura de la piel (35 °C / 95 F) y, por tanto, no están calientes.
(-) La temperatura media de la zona del reposamanos de dispositivos similares fue de 28.8 °C / 83.8 F (-6.2 °C / -11.2 F).
| Razer Blade 17 (i7-12800H, RTX 3070 Ti) Intel Core i7-12800H, NVIDIA GeForce RTX 3070 Ti Laptop GPU | Razer Blade 17 RTX 3080 Ti Intel Core i7-12800H, NVIDIA GeForce RTX 3080 Ti Laptop GPU | Razer Blade 17 RTX 3070 Intel Core i7-11800H, NVIDIA GeForce RTX 3070 Laptop GPU | Lenovo Legion 5 Pro 16 G7 i7 RTX 3070Ti Intel Core i7-12700H, NVIDIA GeForce RTX 3070 Ti Laptop GPU | MSI Vector GP66 12UGS Intel Core i9-12900H, NVIDIA GeForce RTX 3070 Ti Laptop GPU | MSI Stealth GS66 12UGS Intel Core i7-12700H, NVIDIA GeForce RTX 3070 Ti Laptop GPU | |
|---|---|---|---|---|---|---|
| Heat | -10% | -5% | -6% | -3% | -5% | |
| Maximum Upper Side * (°C) | 43 | 46 -7% | 41 5% | 45.3 -5% | 40.2 7% | 54 -26% |
| Maximum Bottom * (°C) | 44 | 46.8 -6% | 47.2 -7% | 61.2 -39% | 43.8 -0% | 59 -34% |
| Idle Upper Side * (°C) | 32 | 36.2 -13% | 33.2 -4% | 28.6 11% | 34.8 -9% | 26 19% |
| Idle Bottom * (°C) | 34 | 38.6 -14% | 39 -15% | 31.4 8% | 37 -9% | 27 21% |
* ... más pequeño es mejor
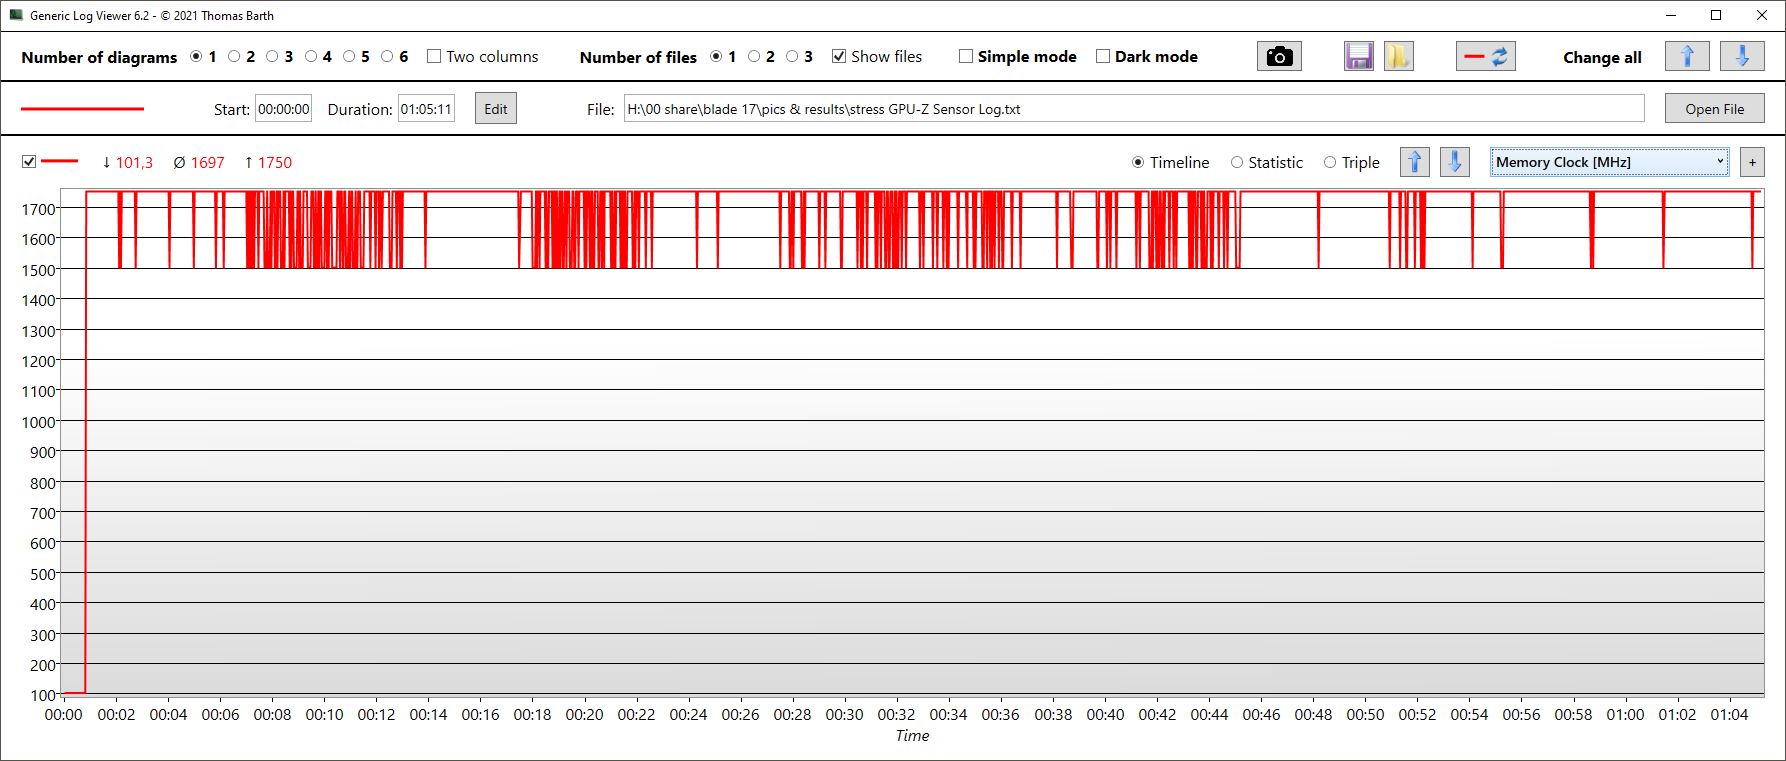
Prueba de esfuerzo
Los núcleos comienzan nuestra prueba de estrés a unos 3,2 GHz. La velocidad de reloj tarda poco en establecerse en torno a los 2.2 GHz, tras lo cual se mantiene bastante estable. Las temperaturas alcanzan unos moderados 75 °C, y el máximo de 86 °C sólo se alcanza durante un breve periodo de tiempo.
El reloj del núcleo de la GPU fluctúa bastante entre 1.1 y 1.8 GHz. Además, la velocidad de reloj de la memoria baja de 1.750 a 1.500 MHz de vez en cuando. La temperatura de la GPU está por debajo de los 70 °C.
Por tanto, aún hay margen para la CPU y la GPU, y las temperaturas se mantienen en un nivel muy moderado.
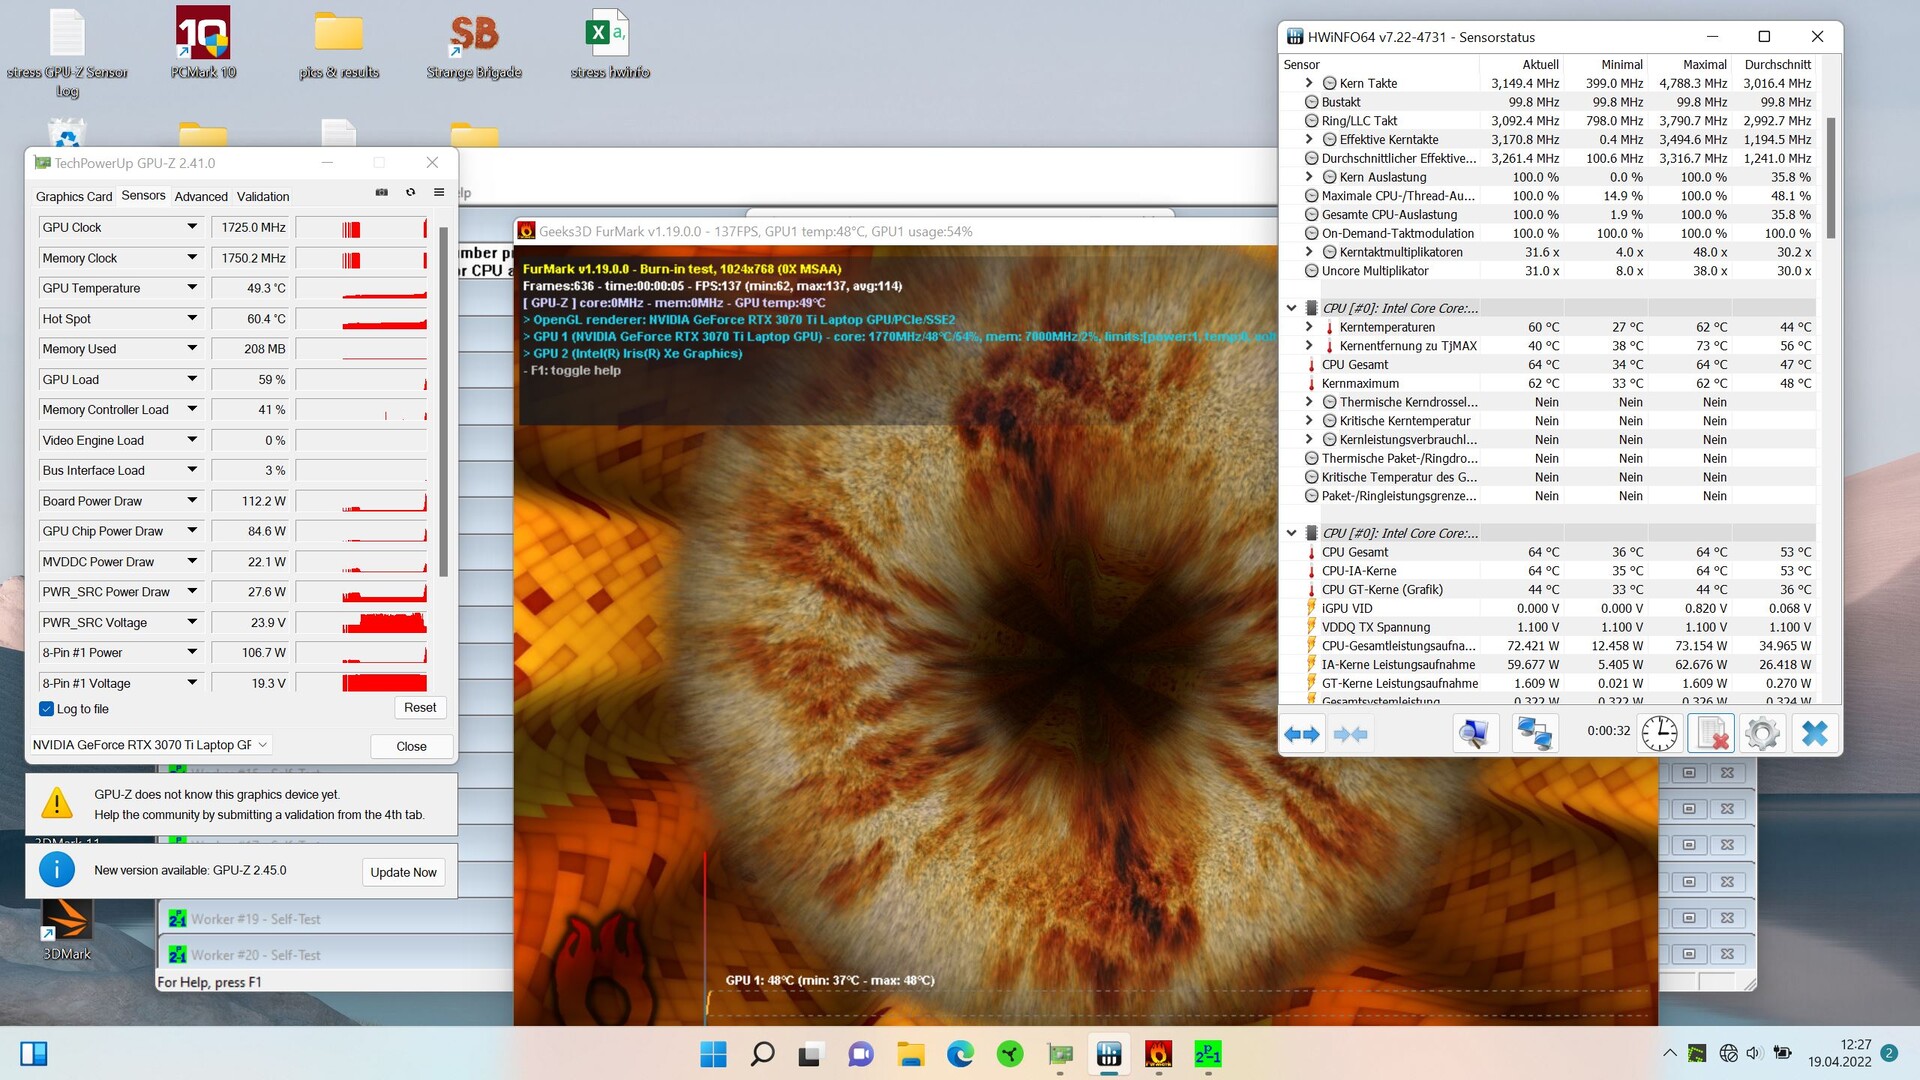
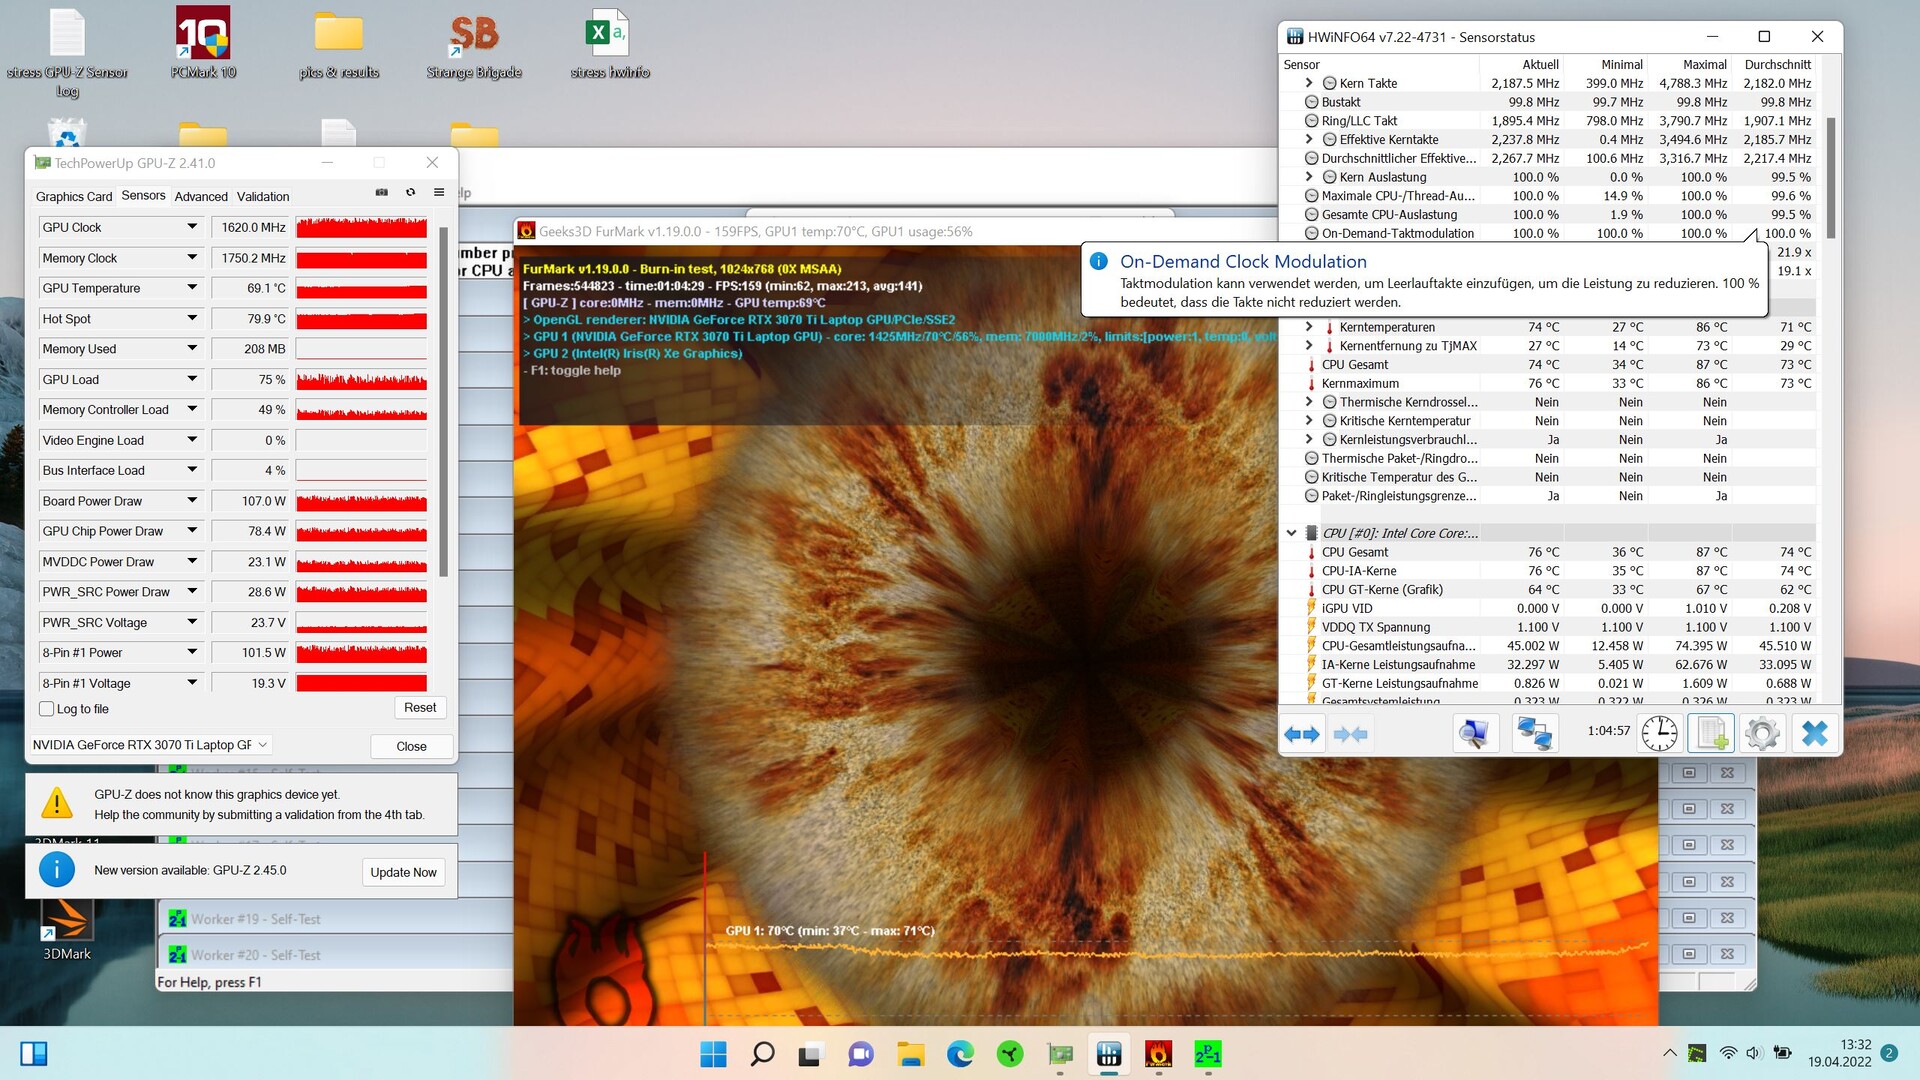
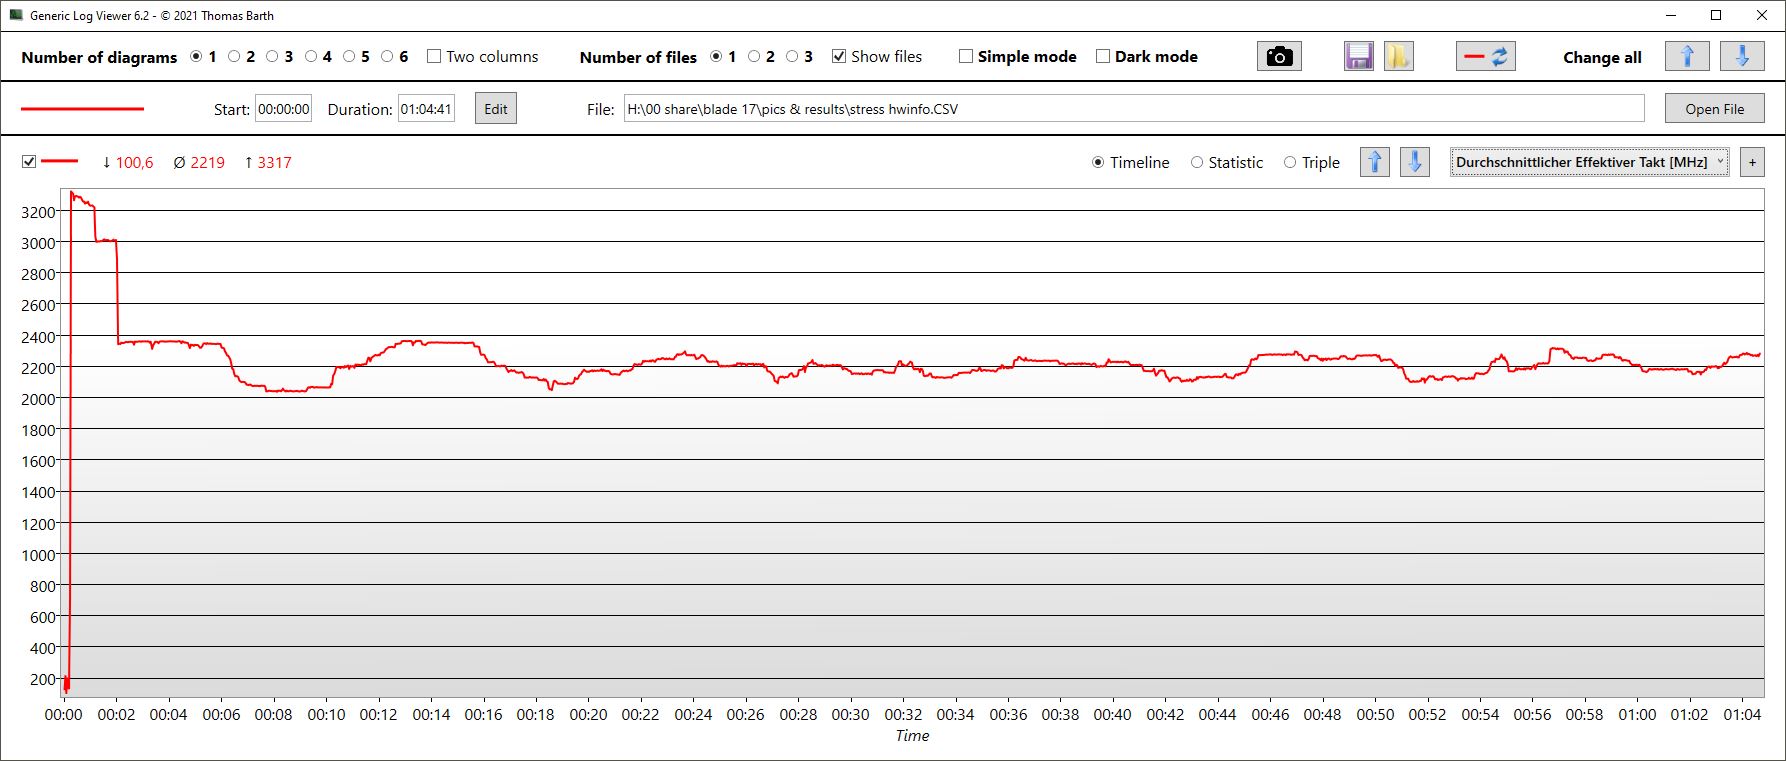
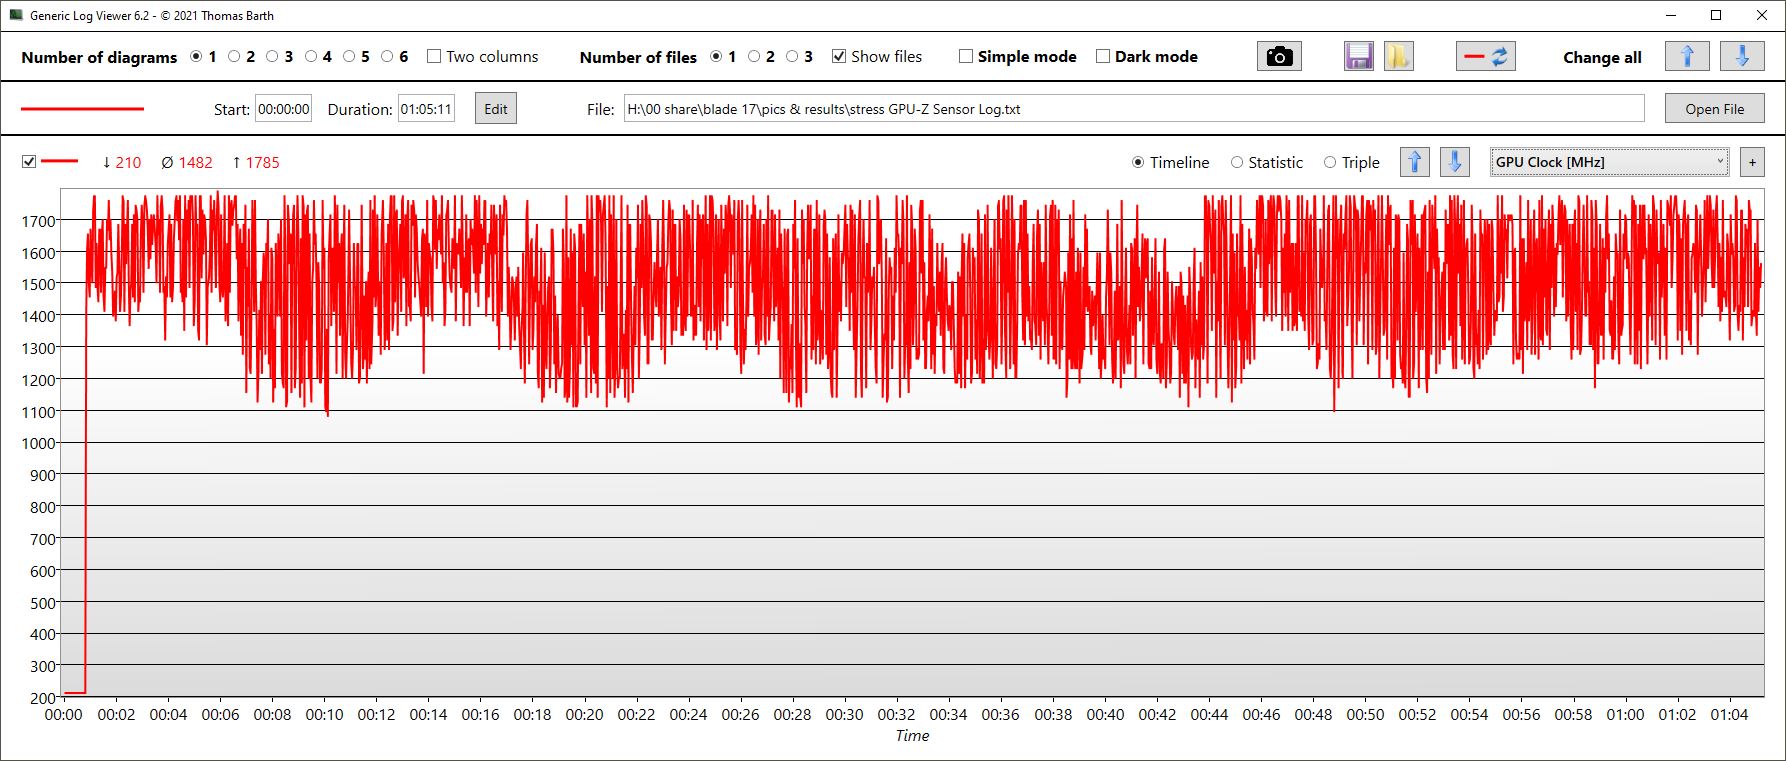
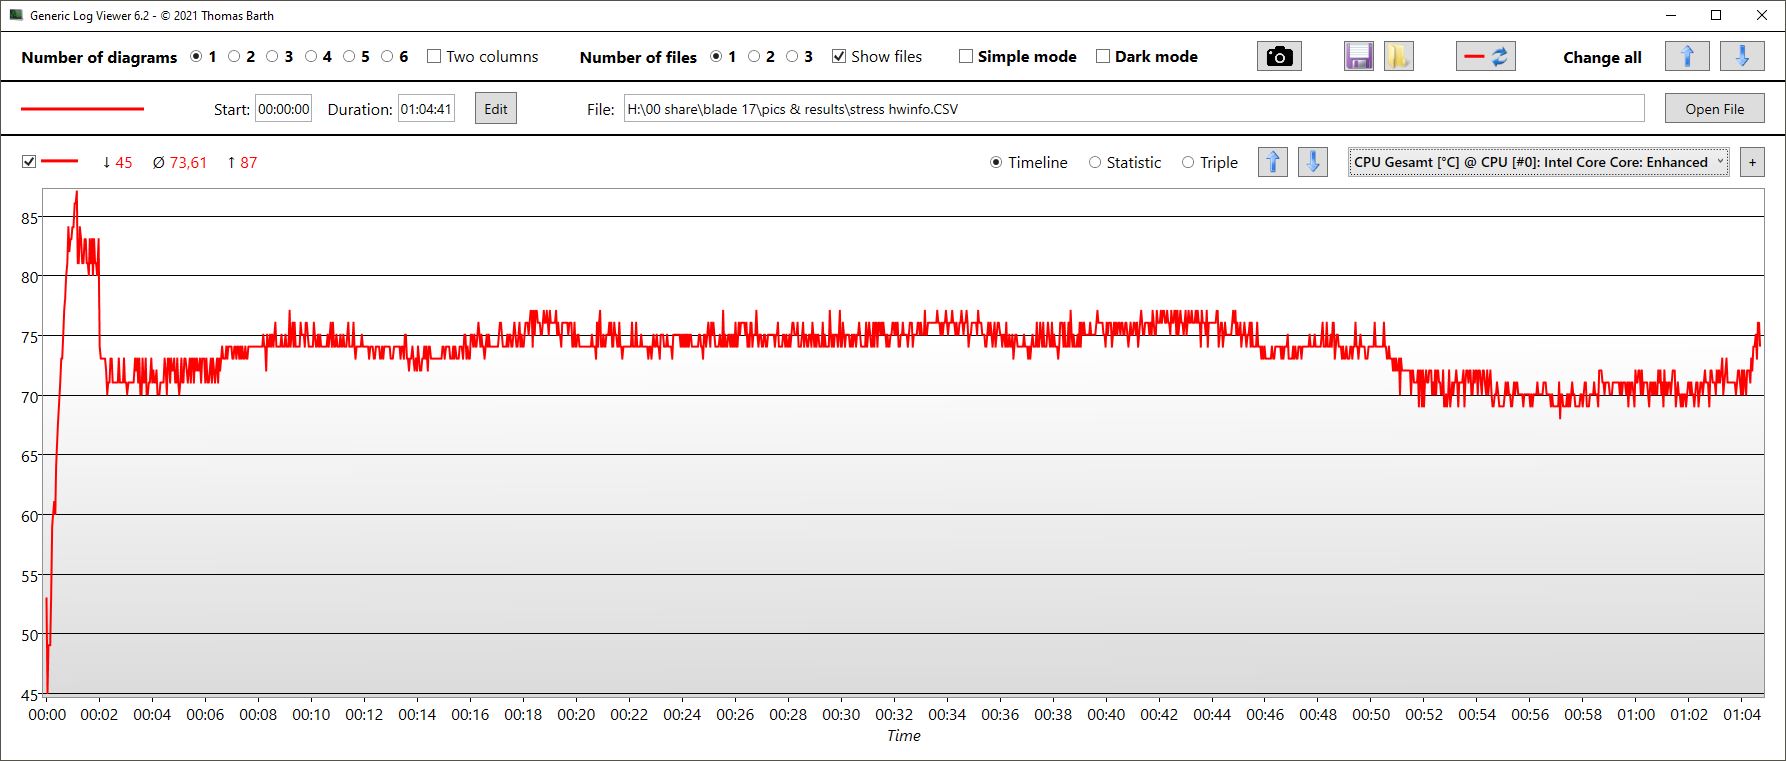
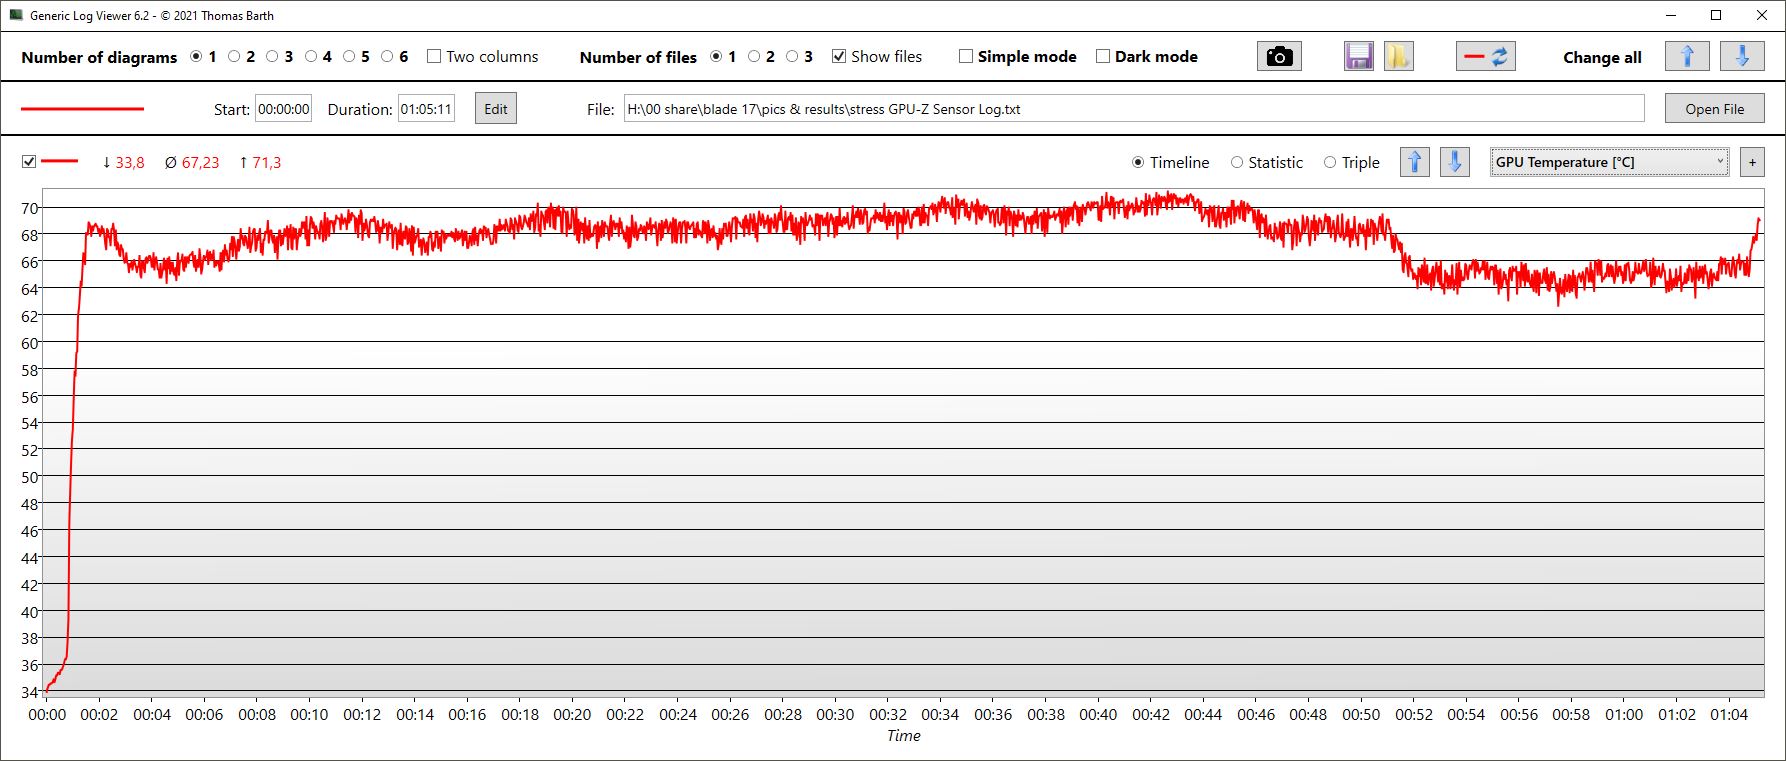
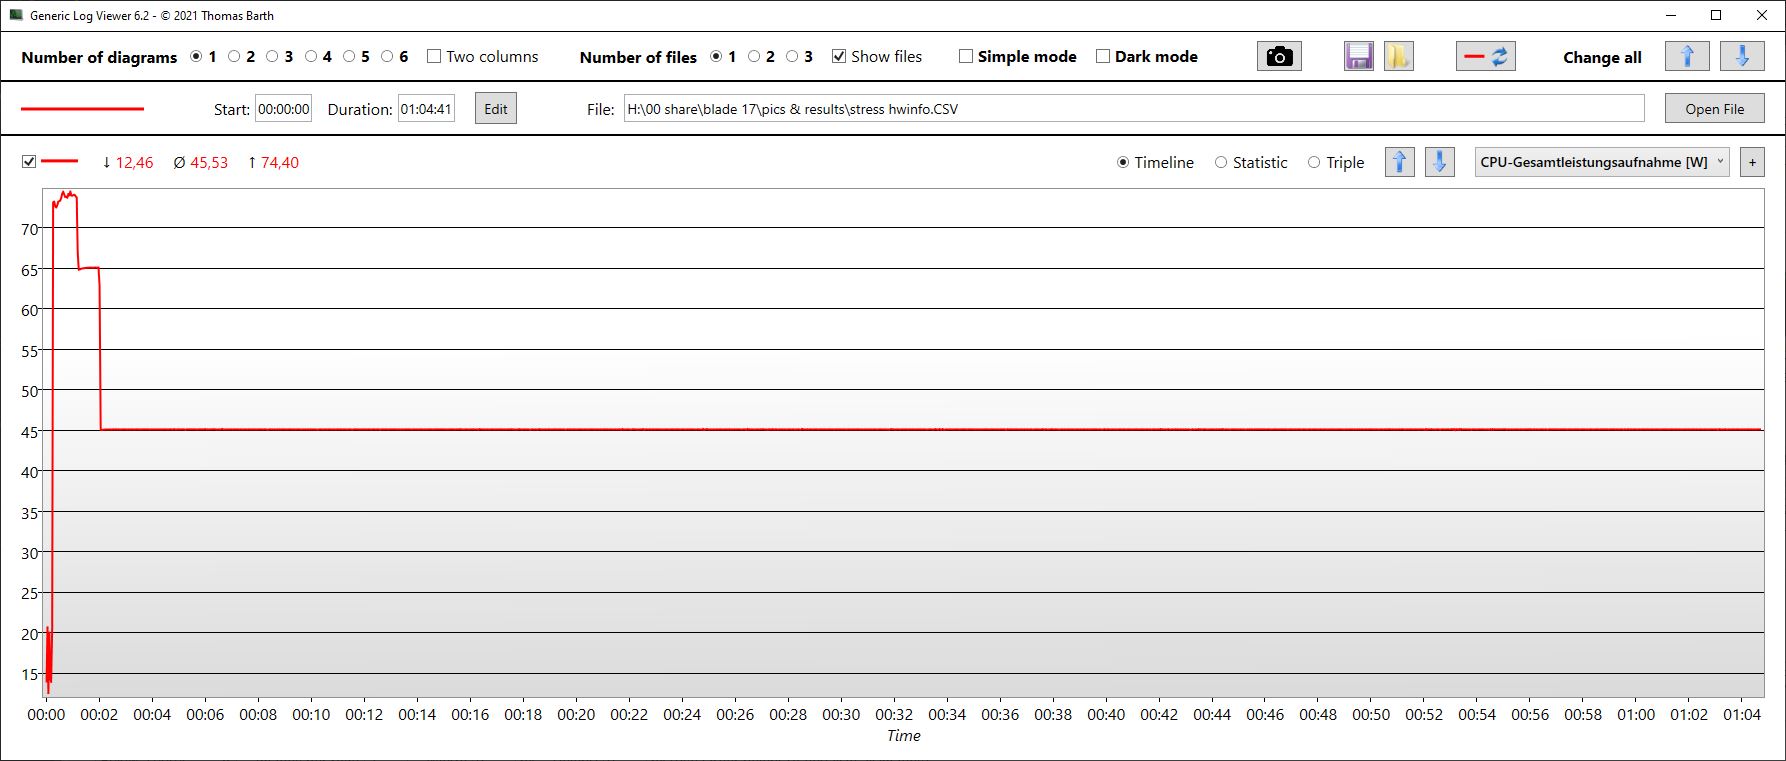
| Velocidad de reloj de la CPU (GHz) | Velocidad de reloj de la GPU (MHz) | Temperatura media dela CPU (°C) | Temperatura media de la GPU (°C) | |
| Sistema en reposo | 2.3 | 1.410 | 45 (~113 °F) | 50 (~122 °F) |
| Prime95 + FurMark stress | 2.2 | 1.482 | 74 (~165 °F) | 67 (~153 °F) |
Altavoces
Los altavoces del Razer Blade están entre los mejores de la comparación de clases. Aunque los graves tienen margen de mejora, no son tan finos y diminutos como en la mayoría de los portátiles. Los medios y los agudos están muy equilibrados, y los altavoces también pueden llegar a ser bastante fuertes.
Para la conexión analógica de dispositivos de audio externos sólo se dispone de un puerto de auriculares combinado en forma de clavija de audio.
Razer Blade 17 (i7-12800H, RTX 3070 Ti) análisis de audio
(+) | los altavoces pueden reproducir a un volumen relativamente alto (#82.67 dB)
Graves 100 - 315 Hz
(±) | lubina reducida - en promedio 6.7% inferior a la mediana
(±) | la linealidad de los graves es media (9.5% delta a frecuencia anterior)
Medios 400 - 2000 Hz
(+) | medios equilibrados - a sólo 4.6% de la mediana
(+) | los medios son lineales (4% delta a la frecuencia anterior)
Altos 2 - 16 kHz
(+) | máximos equilibrados - a sólo 3.1% de la mediana
(+) | los máximos son lineales (6.5% delta a la frecuencia anterior)
Total 100 - 16.000 Hz
(+) | el sonido global es lineal (9.9% de diferencia con la mediana)
En comparación con la misma clase
» 5% de todos los dispositivos probados de esta clase eran mejores, 2% similares, 94% peores
» El mejor tuvo un delta de 6%, la media fue 18%, el peor fue ###max##%
En comparación con todos los dispositivos probados
» 4% de todos los dispositivos probados eran mejores, 1% similares, 95% peores
» El mejor tuvo un delta de 4%, la media fue 24%, el peor fue ###max##%
Apple MacBook Pro 16 2021 M1 Pro análisis de audio
(+) | los altavoces pueden reproducir a un volumen relativamente alto (#84.7 dB)
Graves 100 - 315 Hz
(+) | buen bajo - sólo 3.8% lejos de la mediana
(+) | el bajo es lineal (5.2% delta a la frecuencia anterior)
Medios 400 - 2000 Hz
(+) | medios equilibrados - a sólo 1.3% de la mediana
(+) | los medios son lineales (2.1% delta a la frecuencia anterior)
Altos 2 - 16 kHz
(+) | máximos equilibrados - a sólo 1.9% de la mediana
(+) | los máximos son lineales (2.7% delta a la frecuencia anterior)
Total 100 - 16.000 Hz
(+) | el sonido global es lineal (4.6% de diferencia con la mediana)
En comparación con la misma clase
» 0% de todos los dispositivos probados de esta clase eran mejores, 0% similares, 100% peores
» El mejor tuvo un delta de 5%, la media fue 17%, el peor fue ###max##%
En comparación con todos los dispositivos probados
» 0% de todos los dispositivos probados eran mejores, 0% similares, 100% peores
» El mejor tuvo un delta de 4%, la media fue 24%, el peor fue ###max##%
Gestión de la energía - Más frugal que el modelo superior
Consumo de energía
La diferencia de la GPU se hace realmente notable cuando se trata del consumo de energía. En todos los escenarios, incluido el uso en reposo, la configuración RTX 3070 Ti consume significativamente menos que su homóloga RTX 3080 Ti.
Cuando jugamos a The Witcher 3, nuestro modelo de pruebas consume unos 25 vatios menos, y el consumo máximo absoluto a corto plazo también es aproximadamente inferior en la misma cantidad. El consumo se dispara brevemente a 248 vatios en nuestra prueba de estrés, pero es de 204 vatios de media.
El adaptador de corriente de 280 vatios, cuyo tamaño ha sido especialmente reducido por Razer, sigue estando disponible en nuestra configuración, lo que significa que siempre hay suficiente energía en reserva.
| Ocioso | |
| Carga |
|
Clave:
min: | |
| Razer Blade 17 (i7-12800H, RTX 3070 Ti) i7-12800H, GeForce RTX 3070 Ti Laptop GPU, Samsung PM9A1 MZVL21T0HCLR, IPS, 2560x1440, 17.3" | Razer Blade 17 RTX 3080 Ti i7-12800H, GeForce RTX 3080 Ti Laptop GPU, Samsung PM9A1 MZVL21T0HCLR, IPS, 2560x1440, 17.3" | Razer Blade 17 RTX 3070 i7-11800H, GeForce RTX 3070 Laptop GPU, Samsung PM9A1 MZVL21T0HCLR, IPS, 1920x1080, 17.3" | Lenovo Legion 5 Pro 16 G7 i7 RTX 3070Ti i7-12700H, GeForce RTX 3070 Ti Laptop GPU, Samsung PM9A1 MZVL21T0HCLR, IPS, 2560x1600, 16" | MSI Vector GP66 12UGS i9-12900H, GeForce RTX 3070 Ti Laptop GPU, , IPS, 1920x1080, 15.6" | MSI Stealth GS66 12UGS i7-12700H, GeForce RTX 3070 Ti Laptop GPU, WDC PC SN810 1TB, IPS-Level, 2560x1440, 15.6" | Medio NVIDIA GeForce RTX 3070 Ti Laptop GPU | Media de la clase Gaming | |
|---|---|---|---|---|---|---|---|---|
| Power Consumption | -69% | -25% | 9% | -25% | 14% | -5% | 2% | |
| Idle Minimum * (Watt) | 14.4 | 29.8 -107% | 20.9 -45% | 8.6 40% | 17.5 -22% | 11 24% | 14.2 ? 1% | 13.1 ? 9% |
| Idle Average * (Watt) | 20 | 37.1 -86% | 25.1 -26% | 17.6 12% | 20.1 -1% | 16 20% | 19.9 ? 1% | 18.8 ? 6% |
| Idle Maximum * (Watt) | 21.5 | 60.8 -183% | 45 -109% | 18.5 14% | 47.3 -120% | 23 -7% | 26.2 ? -22% | 24.4 ? -13% |
| Load Average * (Watt) | 119 | 135.3 -14% | 102 14% | 110 8% | 107.3 10% | 110 8% | 125.8 ? -6% | 108.5 ? 9% |
| Witcher 3 ultra * (Watt) | 218 | 243 -11% | 189 13% | 227 -4% | 225 -3% | 151 31% | ||
| Load Maximum * (Watt) | 248 | 273.1 -10% | 234.8 5% | 294.6 -19% | 277.7 -12% | 230 7% | 248 ? -0% | 254 ? -2% |
* ... más pequeño es mejor
Energy consumption during The Witcher 3 / stress test
Energy consumption with an external monitor
Duración de la batería
La batería no se ha reducido en nuestro modelo; Razer la ha equipado con 82 Wh. Sin embargo, sólo se nota un efecto positivo bajo carga. Cuando se navega por la web o se ve un vídeo, sólo la GPU interna está activa, por lo que la duración de la batería no difiere mucho aquí.
Dependiendo de la configuración del brillo, puedes navegar por la web entre 4 y casi 6 horas. Puedes planear una noche de cine durante aproximadamente el mismo tiempo. Es importante cambiar la tasa de refresco de 240 a 60 Hz en la batería para conseguir una mayor duración. Como referencia: La diferencia en tiempos de ejecución entre el uso de Wi-Fi con brillo reducido es de 274 minutos a 240 Hz frente a 353 minutos a 60 Hz. El valor de vídeo indicado se generó a 240 Hz.
| Razer Blade 17 (i7-12800H, RTX 3070 Ti) i7-12800H, GeForce RTX 3070 Ti Laptop GPU, 82 Wh | Razer Blade 17 RTX 3080 Ti i7-12800H, GeForce RTX 3080 Ti Laptop GPU, 82 Wh | Razer Blade 17 RTX 3070 i7-11800H, GeForce RTX 3070 Laptop GPU, 70 Wh | Lenovo Legion 5 Pro 16 G7 i7 RTX 3070Ti i7-12700H, GeForce RTX 3070 Ti Laptop GPU, 80 Wh | MSI Vector GP66 12UGS i9-12900H, GeForce RTX 3070 Ti Laptop GPU, 65 Wh | MSI Stealth GS66 12UGS i7-12700H, GeForce RTX 3070 Ti Laptop GPU, 99.9 Wh | Media de la clase Gaming | |
|---|---|---|---|---|---|---|---|
| Duración de Batería | -23% | -15% | -15% | -24% | -10% | 23% | |
| H.264 (h) | 4.9 | 6.3 29% | 8.26 ? 69% | ||||
| WiFi v1.3 (h) | 5.9 | 5.5 -7% | 5.2 -12% | 5.4 -8% | 5.7 -3% | 5.4 -8% | 6.98 ? 18% |
| Load (h) | 1.8 | 1.1 -39% | 1.5 -17% | 0.6 -67% | 1 -44% | 1.6 -11% | 1.47 ? -18% |
| Reader / Idle (h) | 8 | 6.7 | 7.9 | 7.8 | 8.71 ? |
Pro
Contra
Veredicto - Más fresco y más frugal
El Razer Blade es un portátil de juegos y productividad muy recomendable también con la RTX 3070 Ti. Quizá sea incluso más recomendable que la configuración superior con la RTX 3080 Ti, ya que nuestro modelo de pruebas sigue siendo más fresco y, sobre todo, es mucho más frugal a la vez que puede mostrar todos los juegos con fluidez hasta la resolución nativa.
Es difícil encontrar puntos de crítica para el Blade: Estaría bien una tapa para la webcam, y hay que buscar teclas especiales, como la que controla el brillo de la pantalla, usando una lupa cuando está oscuro. La RTX 3070 Ti no rinde al máximo de forma consistente en todos los juegos, y a veces se ve superada por portátiles con la misma GPU. La prueba de estrés revela que aún habría suficientes reservas disponibles para un rendimiento 3D aún mayor en términos de ralentización térmica.
El Razer Blade 17 con la RTX 3070 Ti es un portátil muy potente y totalmente recomendable, siempre que se tenga la capacidad de gasto necesaria.
Las alternativas al Blade de 17 pulgadas en términos de calidad siguen siendo escasas. Si puedes optar por algo más pequeño, deberías echar un vistazo alLenovo Legion 5 Pro 16 G7 con su pantalla QHD de 16 pulgadas y la misma GPU, ya que es muy bueno y tiene un rendimiento ligeramente superior. Sin embargo, también es considerablemente más grueso que el Blade. Pero también es notablemente más barato.
Precio y disponibilidad
En el momento de escribir este artículo, puede encontrar nuestra configuración de revisión en Amazon por 3.199 dólares.
Razer Blade 17 (i7-12800H, RTX 3070 Ti)
- 05/09/2022 v7 (old)
Christian Hintze
Price comparison

