Análisis del portátil Asus TUF Gaming F15 FX506HM: Sin extras, sólo rendimiento
Desvelado el pasado mes de mayo junto con la 11ª generación de la serie Intel Tiger Lake-H, el TUF Gaming F15 FX506 de 15,6 pulgadas y el TUF Gaming F17 FX706 de 17,3 pulgadas suceden directamente al FX505 y FX705 respectivamente, introduciendo una nueva estética y nuevos procesadores. Los F15 y F17 no deben confundirse con la serie TUF Dash, más rápida, ni con las series A15/A17, que utilizan procesadores AMD.
Nuestra unidad de análisis es una configuración de gama media-alta con la CPU Core i7-11800H, la GPU GeForce RTX 2060, y una pantalla de 144 Hz por unos 1500 dólares. Hay otras versiones disponibles con Core i5-11260H, i9-11900H, RTX 3050 o paneles de 60 Hz a 240 Hz. Todas las opciones por el momento se limitan a FHD y hasta la RTX 3060 para separar mejor el modelo TUF de un modelo ROG más caro.
Entre los competidores en este ámbito se encuentran otros portátiles para juegos de 15,6 pulgadas de gama media y económica, como el Lenovo Legion 5iy el MSI GF/GL de MSI, El modelo base del Razer Blade 15o el HP Pavilion 15 Gaming.
Más análisis de Asus:
potential competitors in comparison
Valoración | Fecha | Modelo | Peso | Altura | Tamaño | Resolución | Precio |
|---|---|---|---|---|---|---|---|
| 85.9 % v7 (old) | 06/2021 | Asus TUF Gaming F15 FX506HM i7-11800H, GeForce RTX 3060 Laptop GPU | 2.3 kg | 24.9 mm | 15.60" | 1920x1080 | |
| 82.4 % v7 (old) | 02/2021 | Asus TUF Dash F15 FX516PR i7-11370H, GeForce RTX 3070 Laptop GPU | 2 kg | 20 mm | 15.60" | 1920x1080 | |
| 80.4 % v6 (old) | 07/2019 | Asus TUF FX505DT-EB73 R7 3750H, GeForce GTX 1650 Mobile | 2.2 kg | 26.8 mm | 15.60" | 1920x1080 | |
| 85.5 % v7 (old) | 03/2021 | Razer Blade 15 Base Edition 2021, i7-10750H RTX 3060 i7-10750H, GeForce RTX 3060 Laptop GPU | 2.1 kg | 19.9 mm | 15.60" | 1920x1080 | |
| 80.4 % v7 (old) | 03/2021 | MSI GF65 Thin 10UE i7-10750H, GeForce RTX 3060 Laptop GPU | 1.9 kg | 21.7 mm | 15.60" | 1920x1080 | |
| 83.3 % v7 (old) | 07/2020 | Lenovo Legion 5 15IMH05H i5-10300H, GeForce RTX 2060 Mobile | 2.5 kg | 26.1 mm | 15.60" | 1920x1080 |
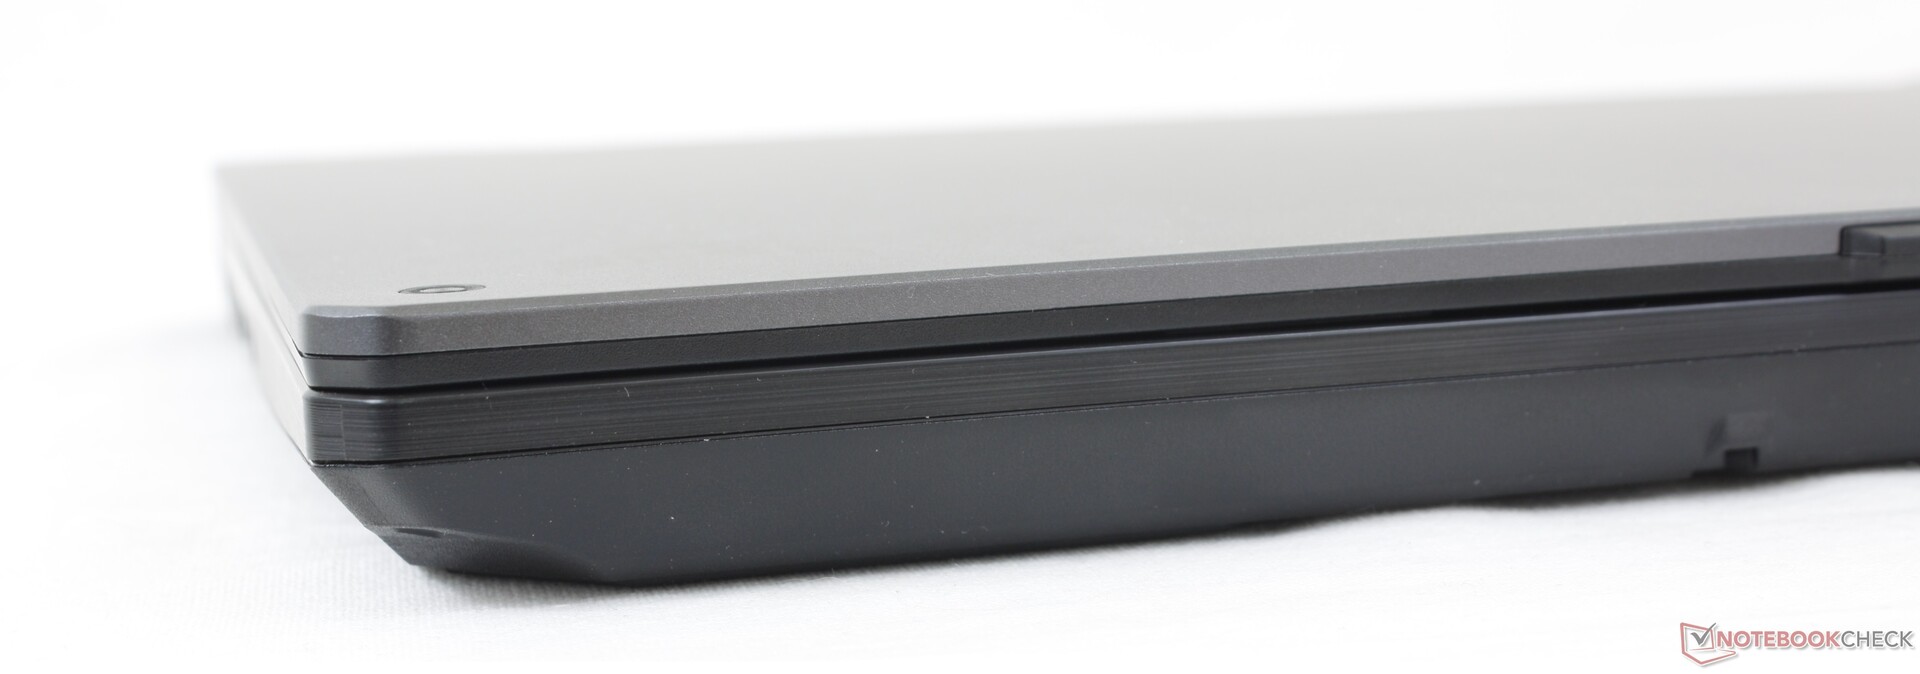
Caja - Muy diferente a la del FX516
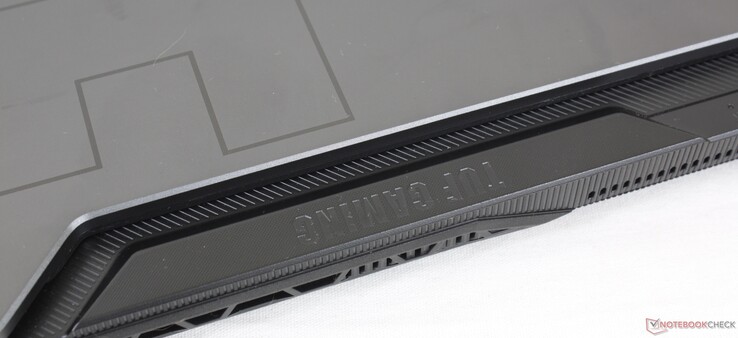
El chasis es una combinación del antiguo FX505 y del nuevo TUF Dash F15 FX516. Más concretamente, incorpora la tapa exterior con respaldo metálico del FX516 a las características de diseño base del FX505. También se han actualizado otros aspectos, como el panel táctil y algunos colores de la parte trasera. El resultado final es un portátil para juegos más "duro" y visualmente más atractivo, especialmente cuando la tapa está cerrada.
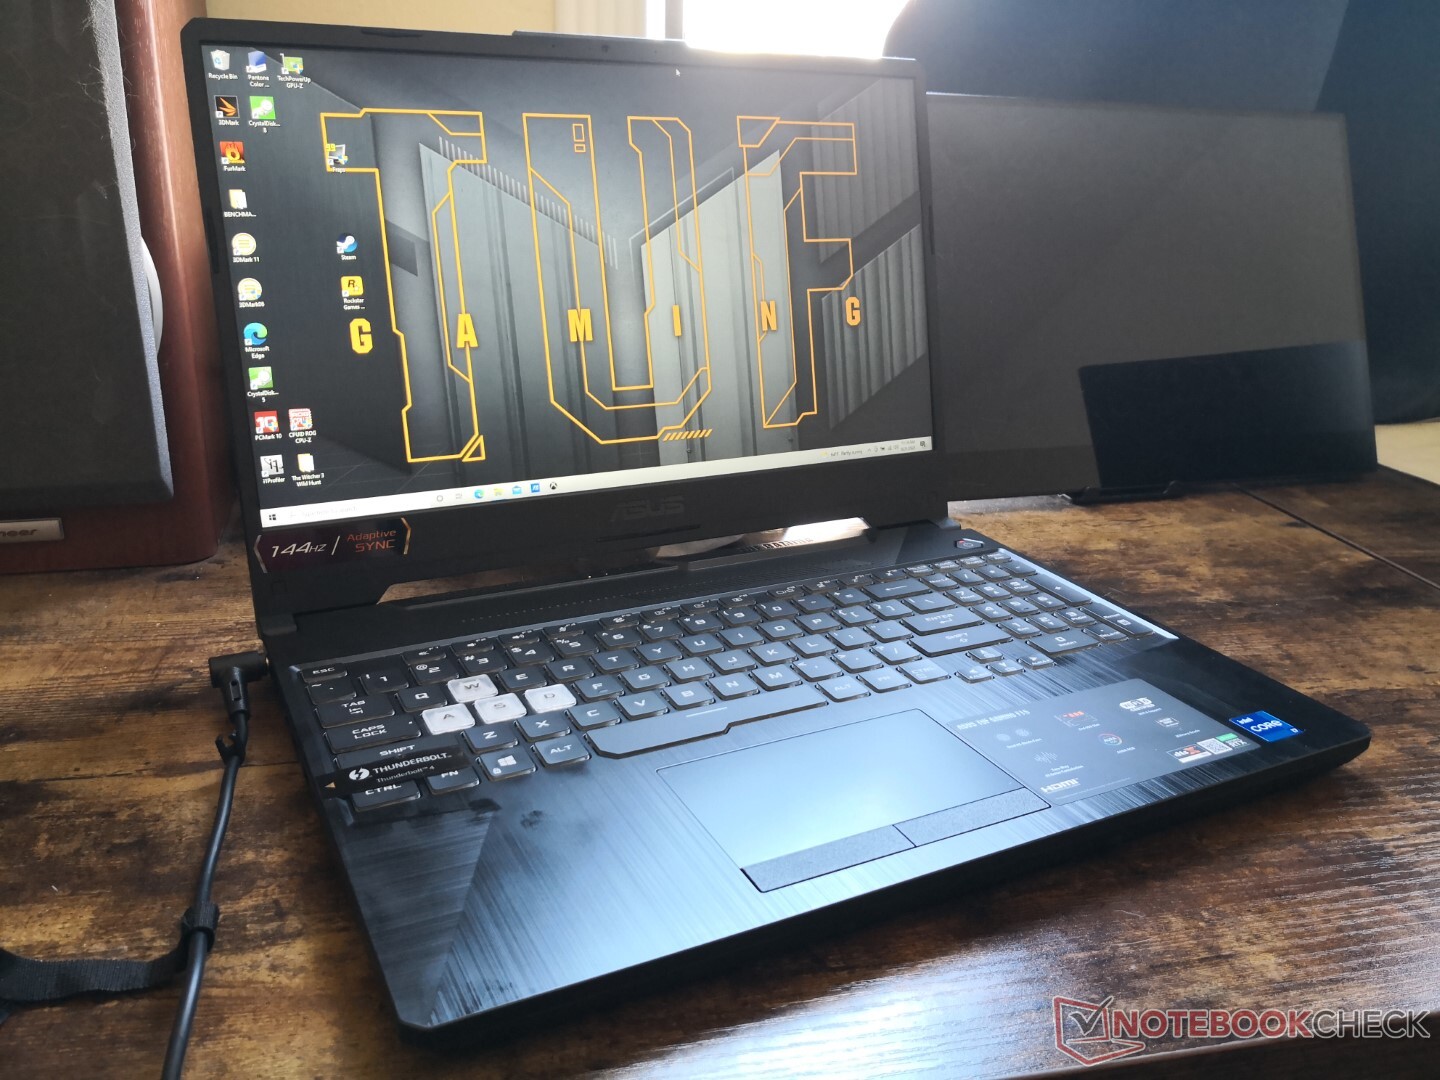
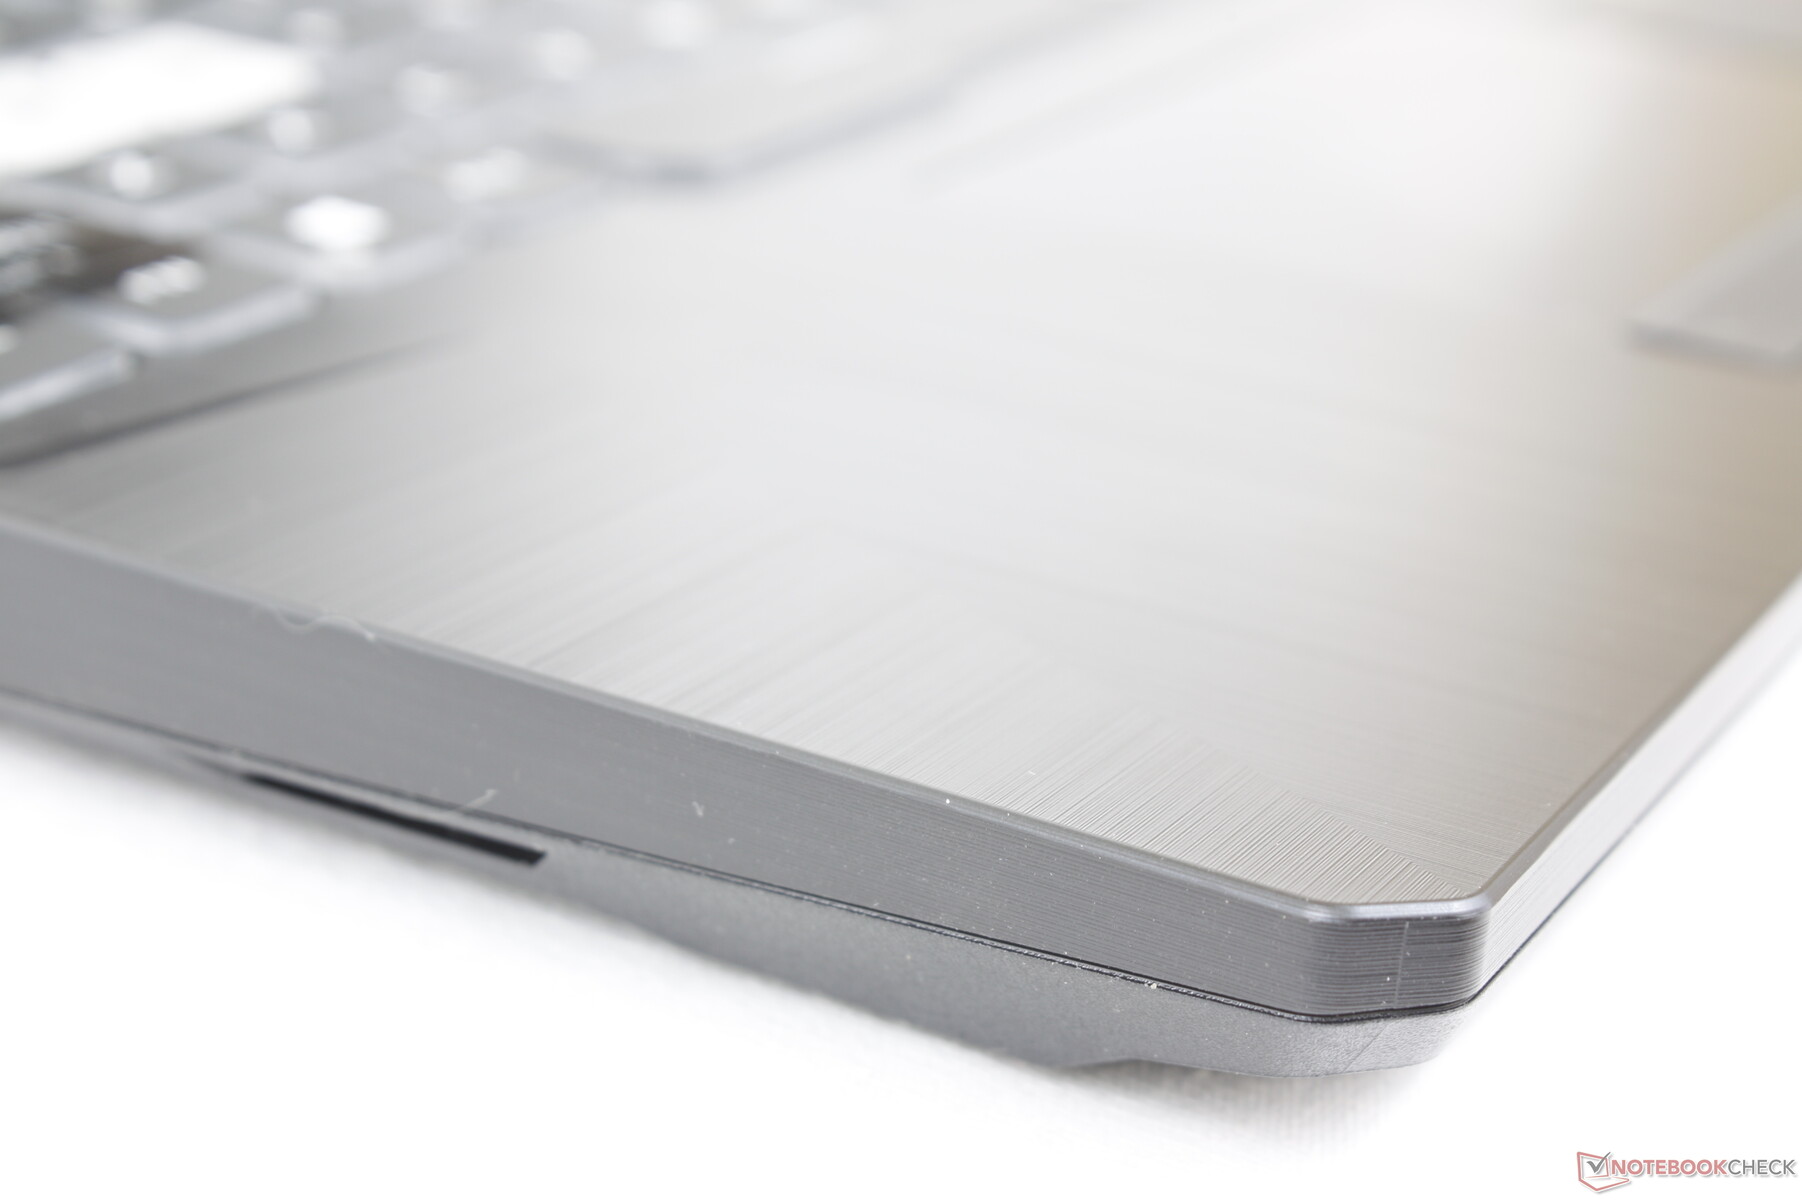
Sin embargo, el FX506 sigue siendo un portátil para juegos de nivel básico, y esto se hace evidente al abrir la tapa para exponer la base de plástico. Los reposamanos y la cubierta del teclado no son tan lujosos como los portátiles Zephyrus o ROG más potentes. Para ocultar este hecho, las superficies de plástico están adornadas con todo tipo de texturas y protuberancias superficiales que los usuarios amarán u odiarán. MSI adopta el enfoque contrario en su competidor GF65 con superficies de plástico más planas y suaves.
Una ventaja notable de los reposamanos texturizados es su capacidad para alejar la acumulación de huellas dactilares. Las teclas del teclado y el touchpad más lisos, sin embargo, no son tan afortunados.
La rigidez de la base se siente más fuerte que en el MSI GF65. Por otro lado, la tapa y sus dos pequeñas bisagras se tambalean un poco más de lo que nos gustaría, por lo que no inspiran mucha confianza a largo plazo.
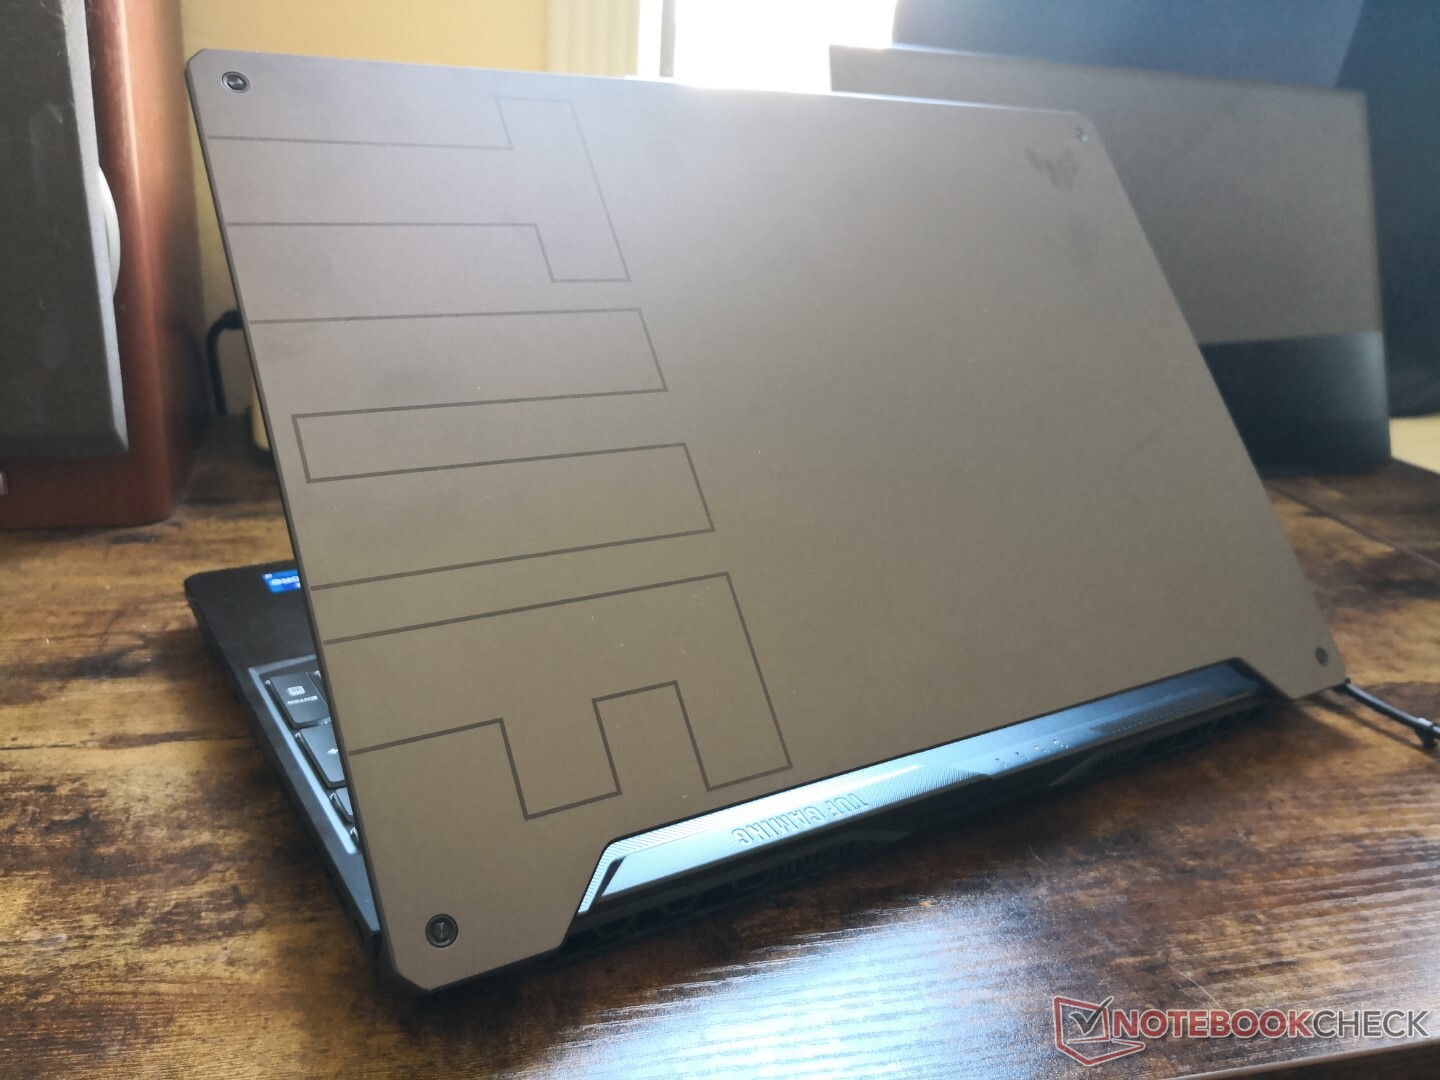
Las dimensiones están entre las del antiguo TUF FX505DT y las del más rápido TUF Dash F15 FX516. Es ligeramente más pesado que cualquiera de los dos por unos 100 g a 200 g cada uno para una primera impresión más densa. El competidor Blade 15 Modelo Base sigue siendo el más pequeño del grupo especialmente en longitud debido al bisel de la barbilla más grueso del diseño Asus TUF.

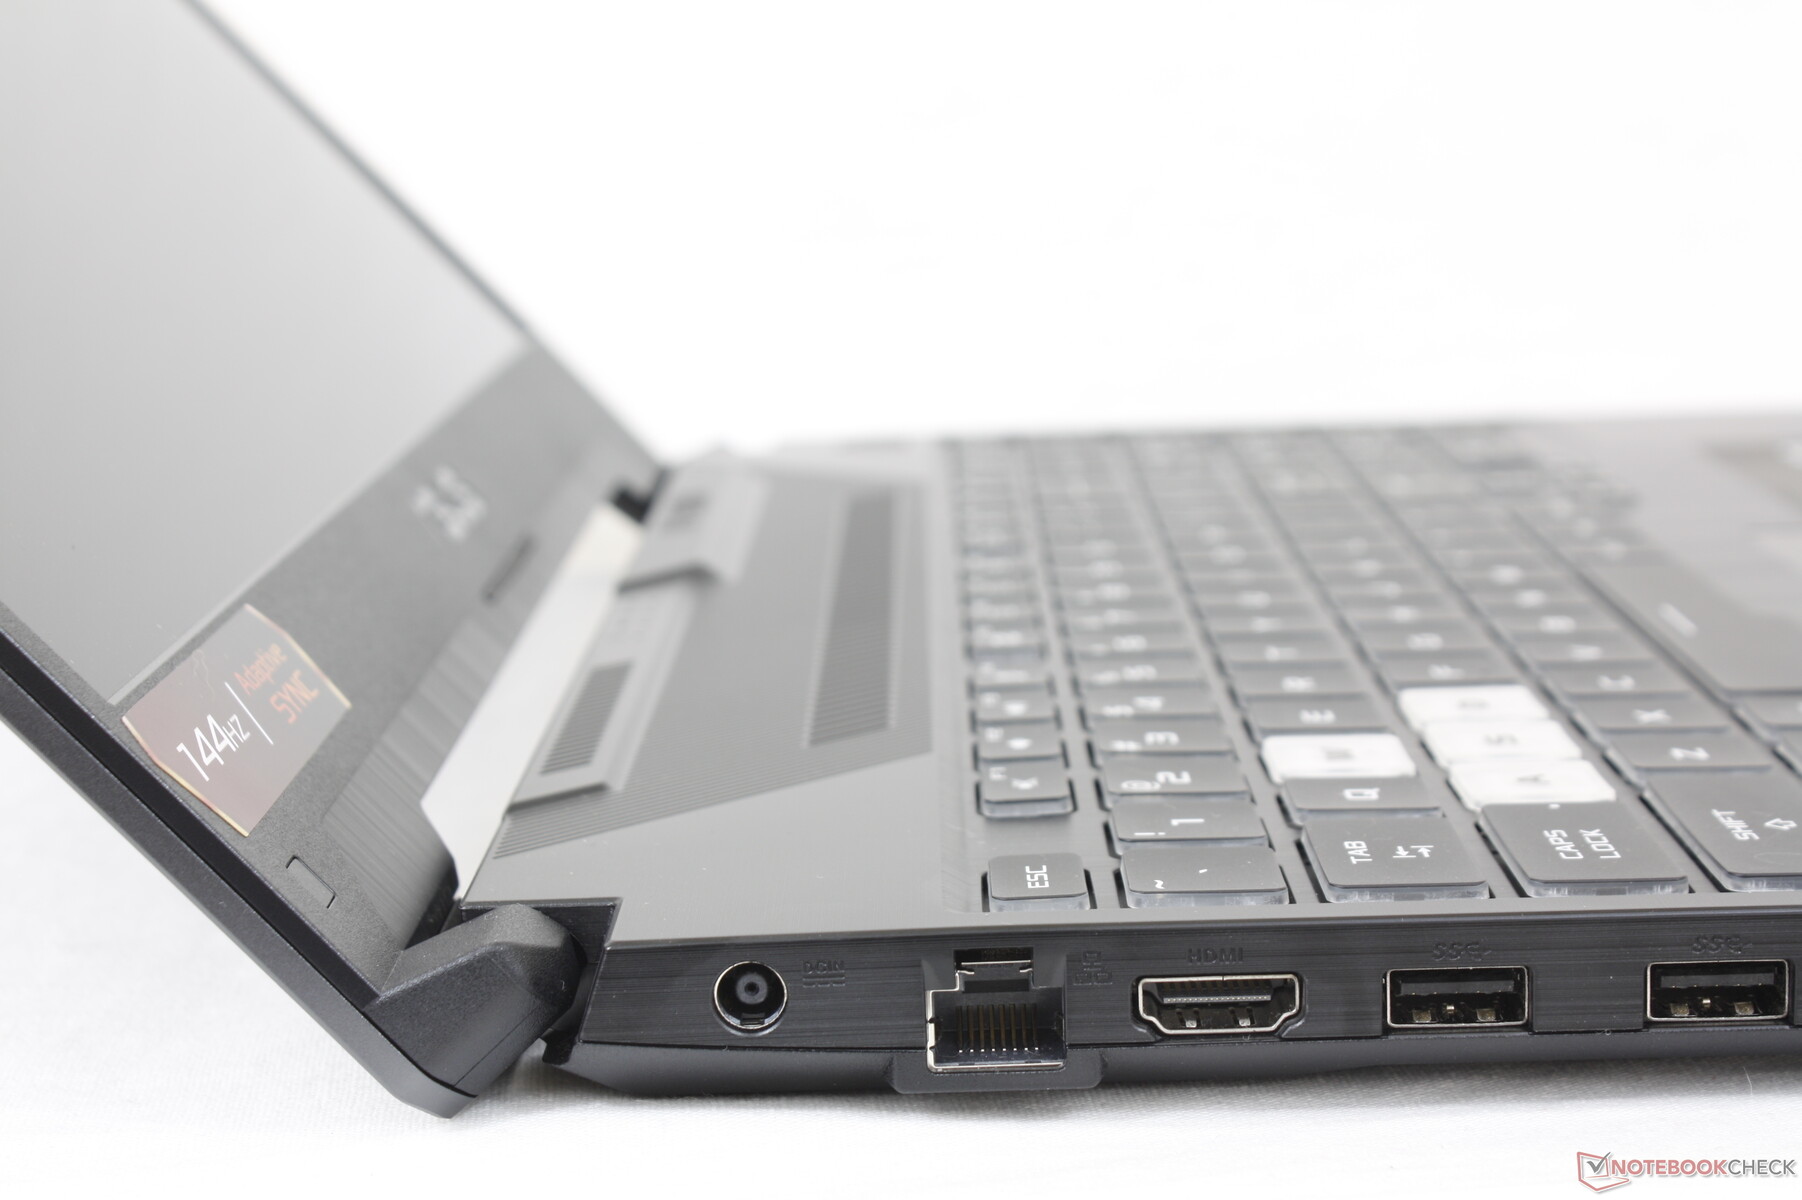
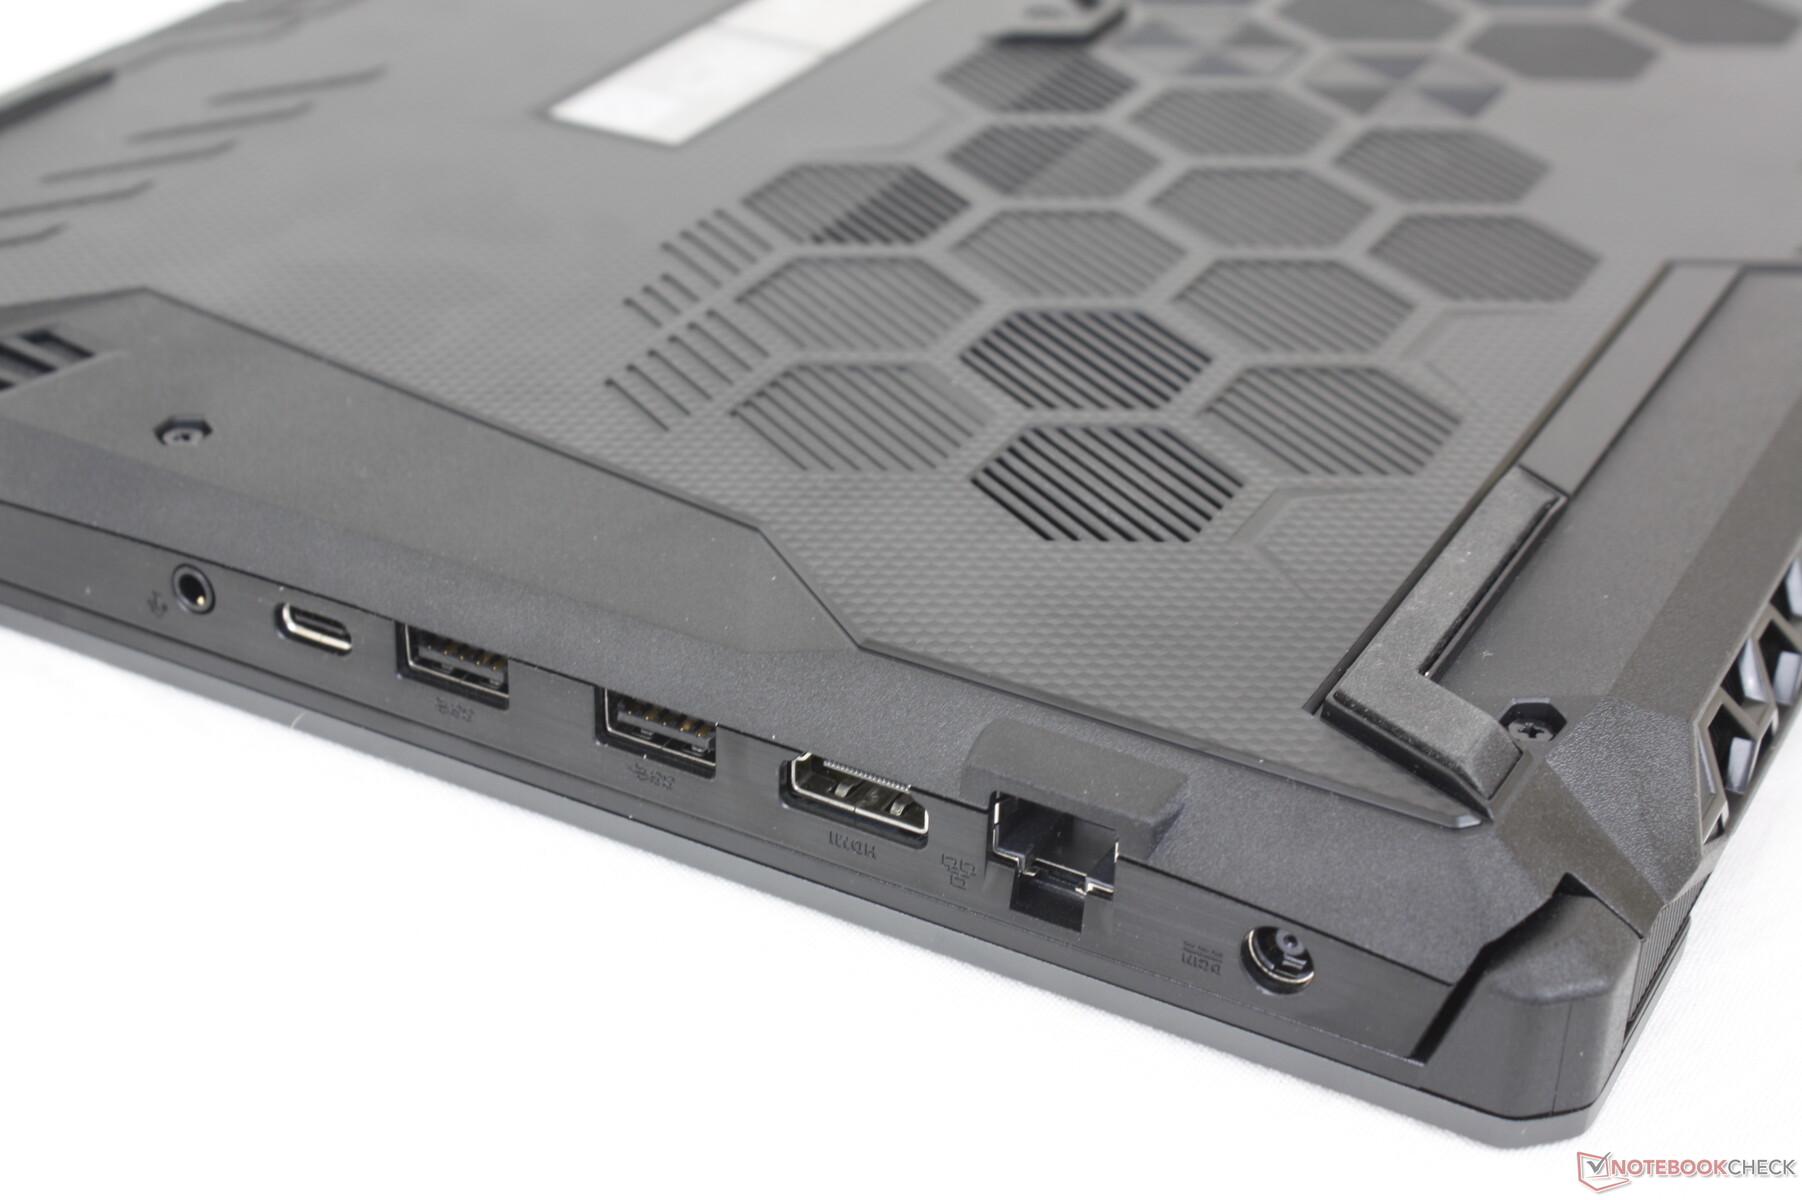
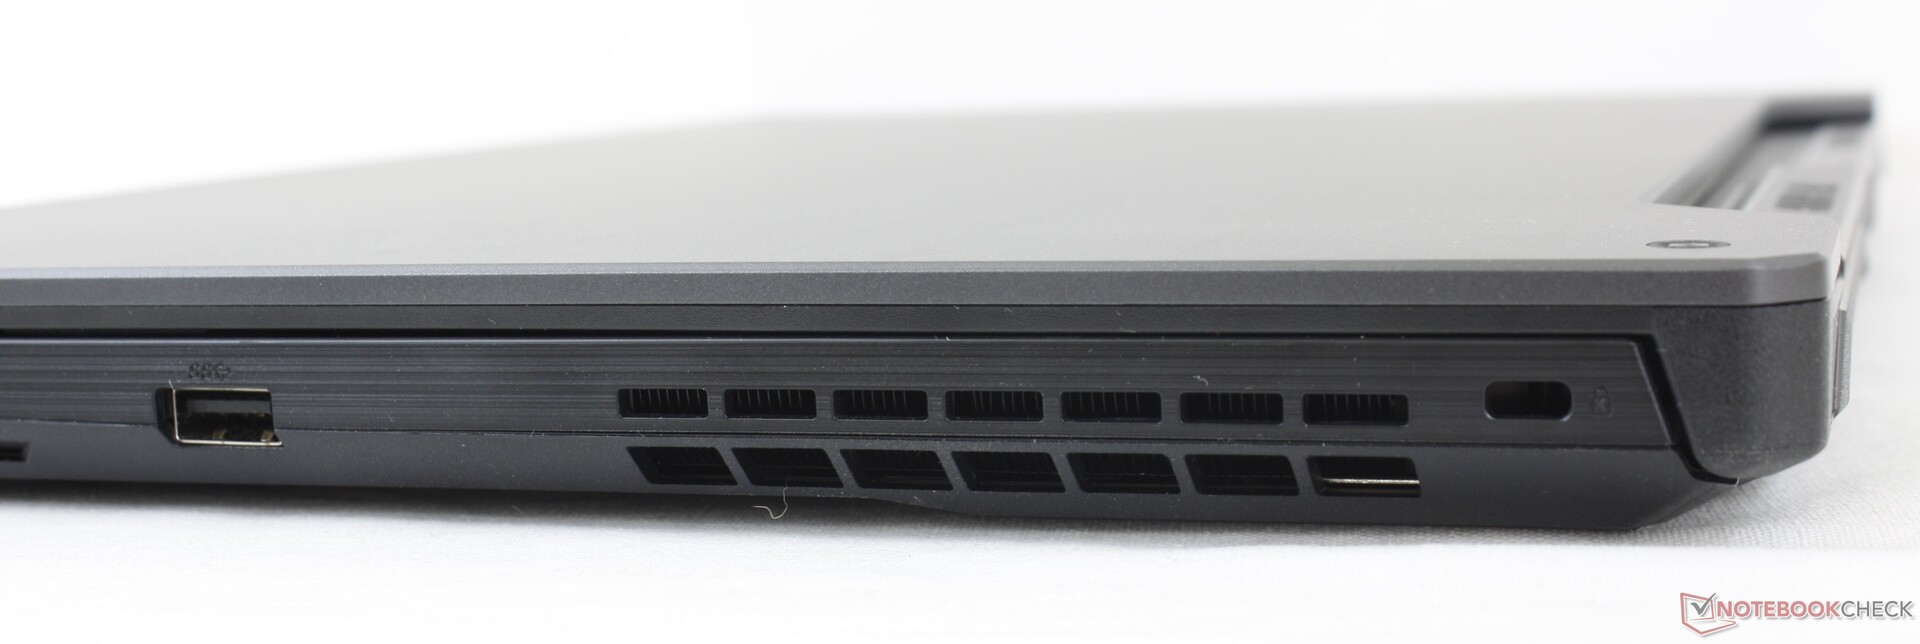
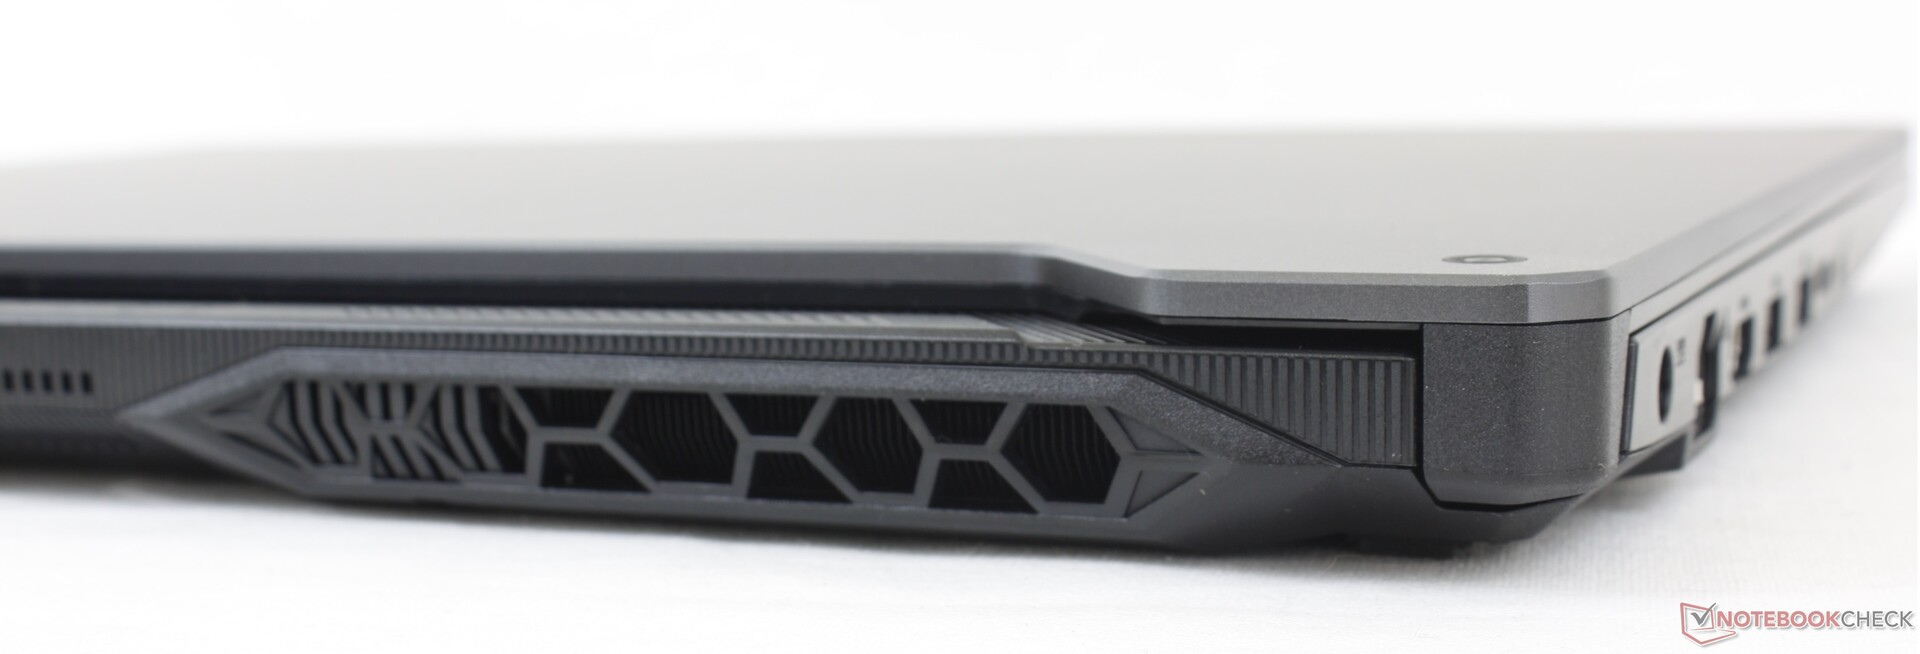
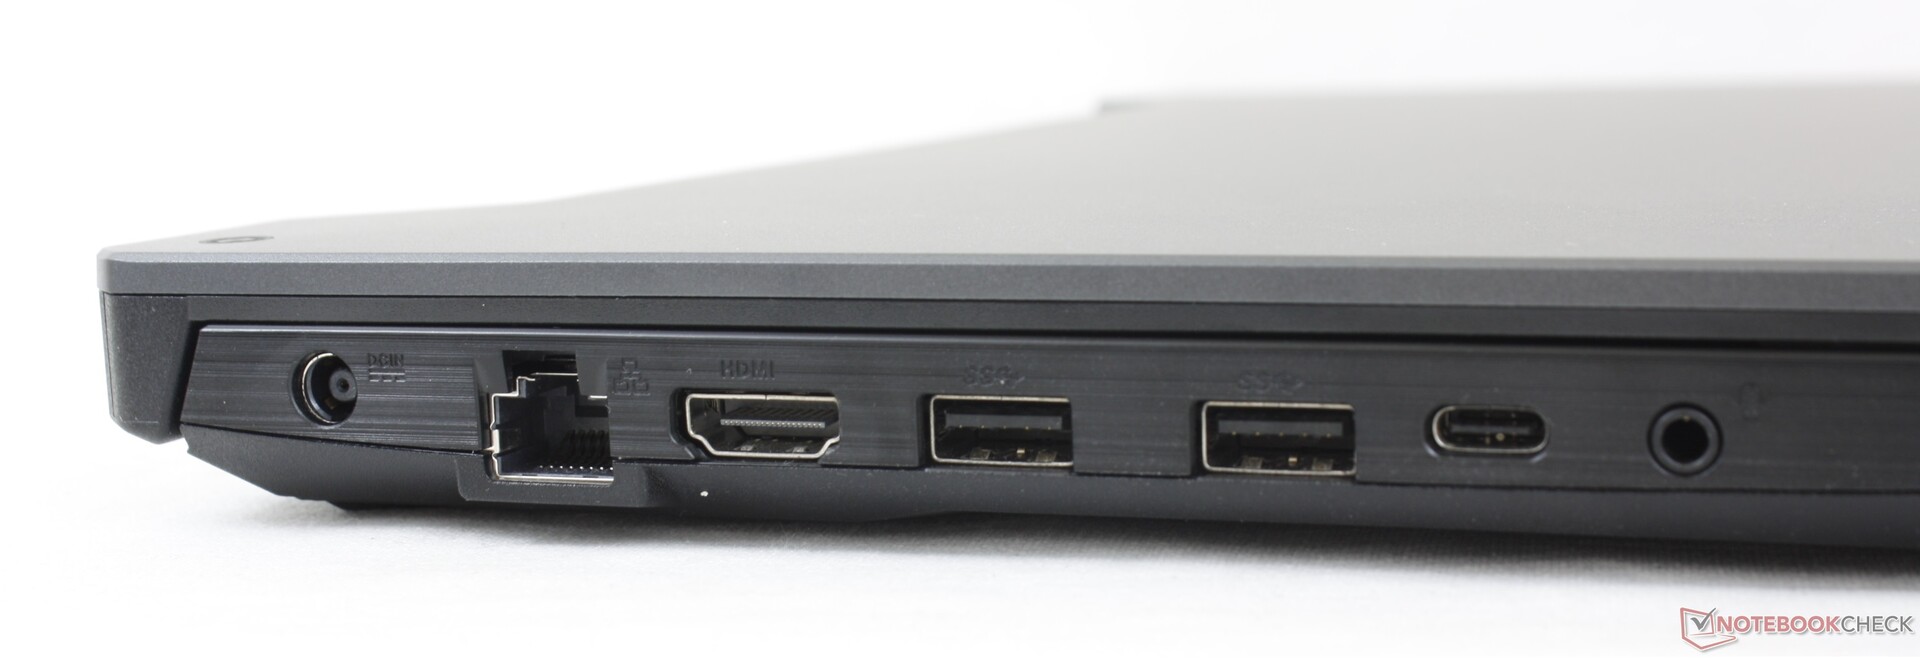
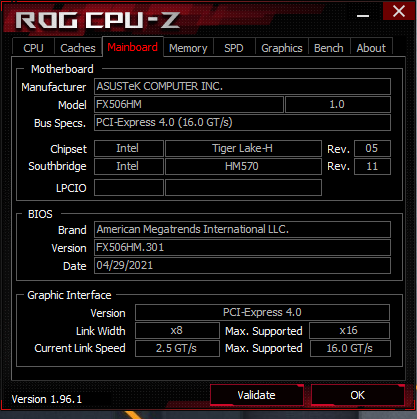
Conectividad - Thunderbolt 4 viene de serie
Las opciones de puerto son las mismas que en el TUF Dash F15, pero reorganizadas y con algunas mejoras notables. El borde derecho, por ejemplo, ahora alberga un solo puerto USB en vez de dos. Mientras tanto, el puerto USB-C a lo largo del borde izquierdo ahora es totalmente compatible con Thunderbolt 4, mientras que los anteriores portátiles TUF con CPUs AMD o Intel de 10ª generación o más antiguas no lo eran.
Comunicación
Wi-FI 6 y Bluetooth 5.1 son proporcionados por un MediaTek MT7921 que compite directamente con el común Intel AX200/201. Aunque las tasas de transferencia son constantes, no llegan a los mismos máximos de >1 Gbps que vemos en otros portátiles con el modelo inalámbrico de Intel.
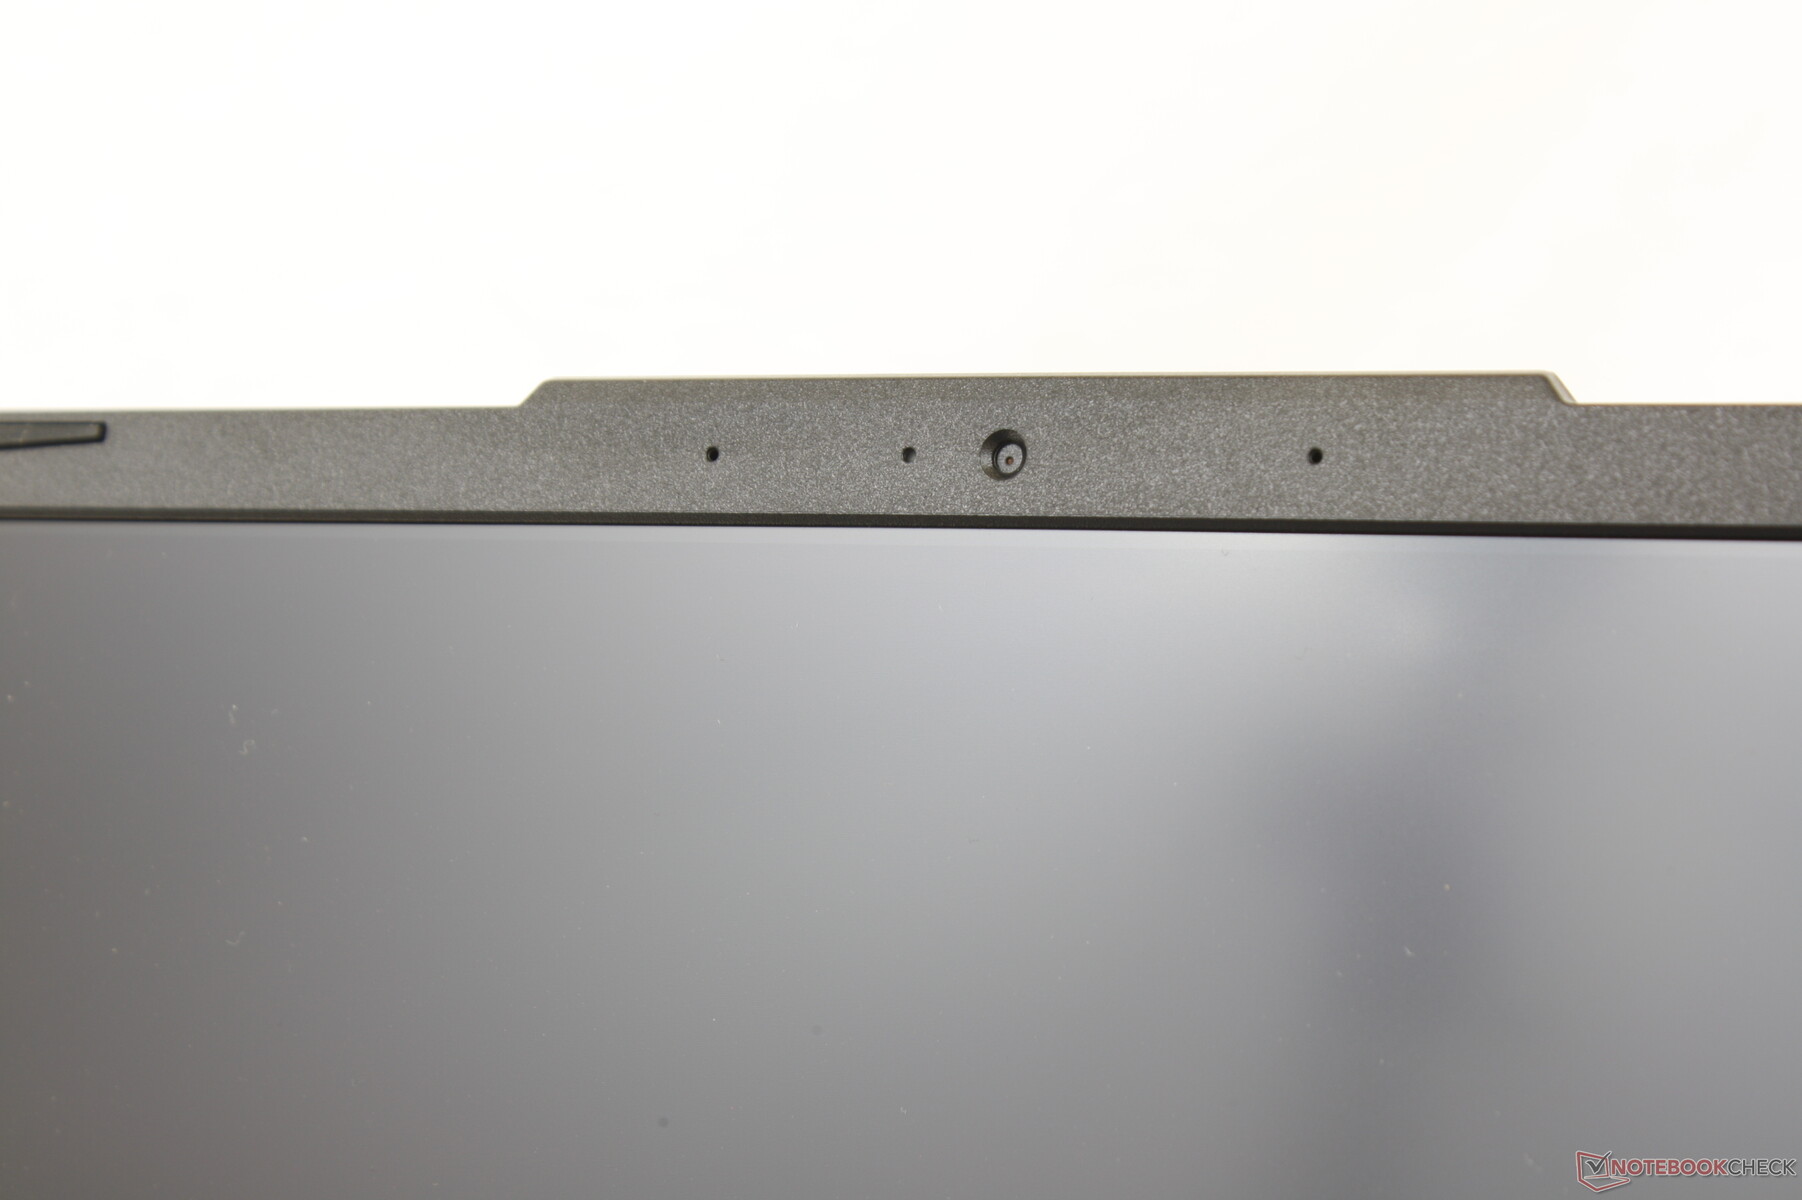
Cámara web


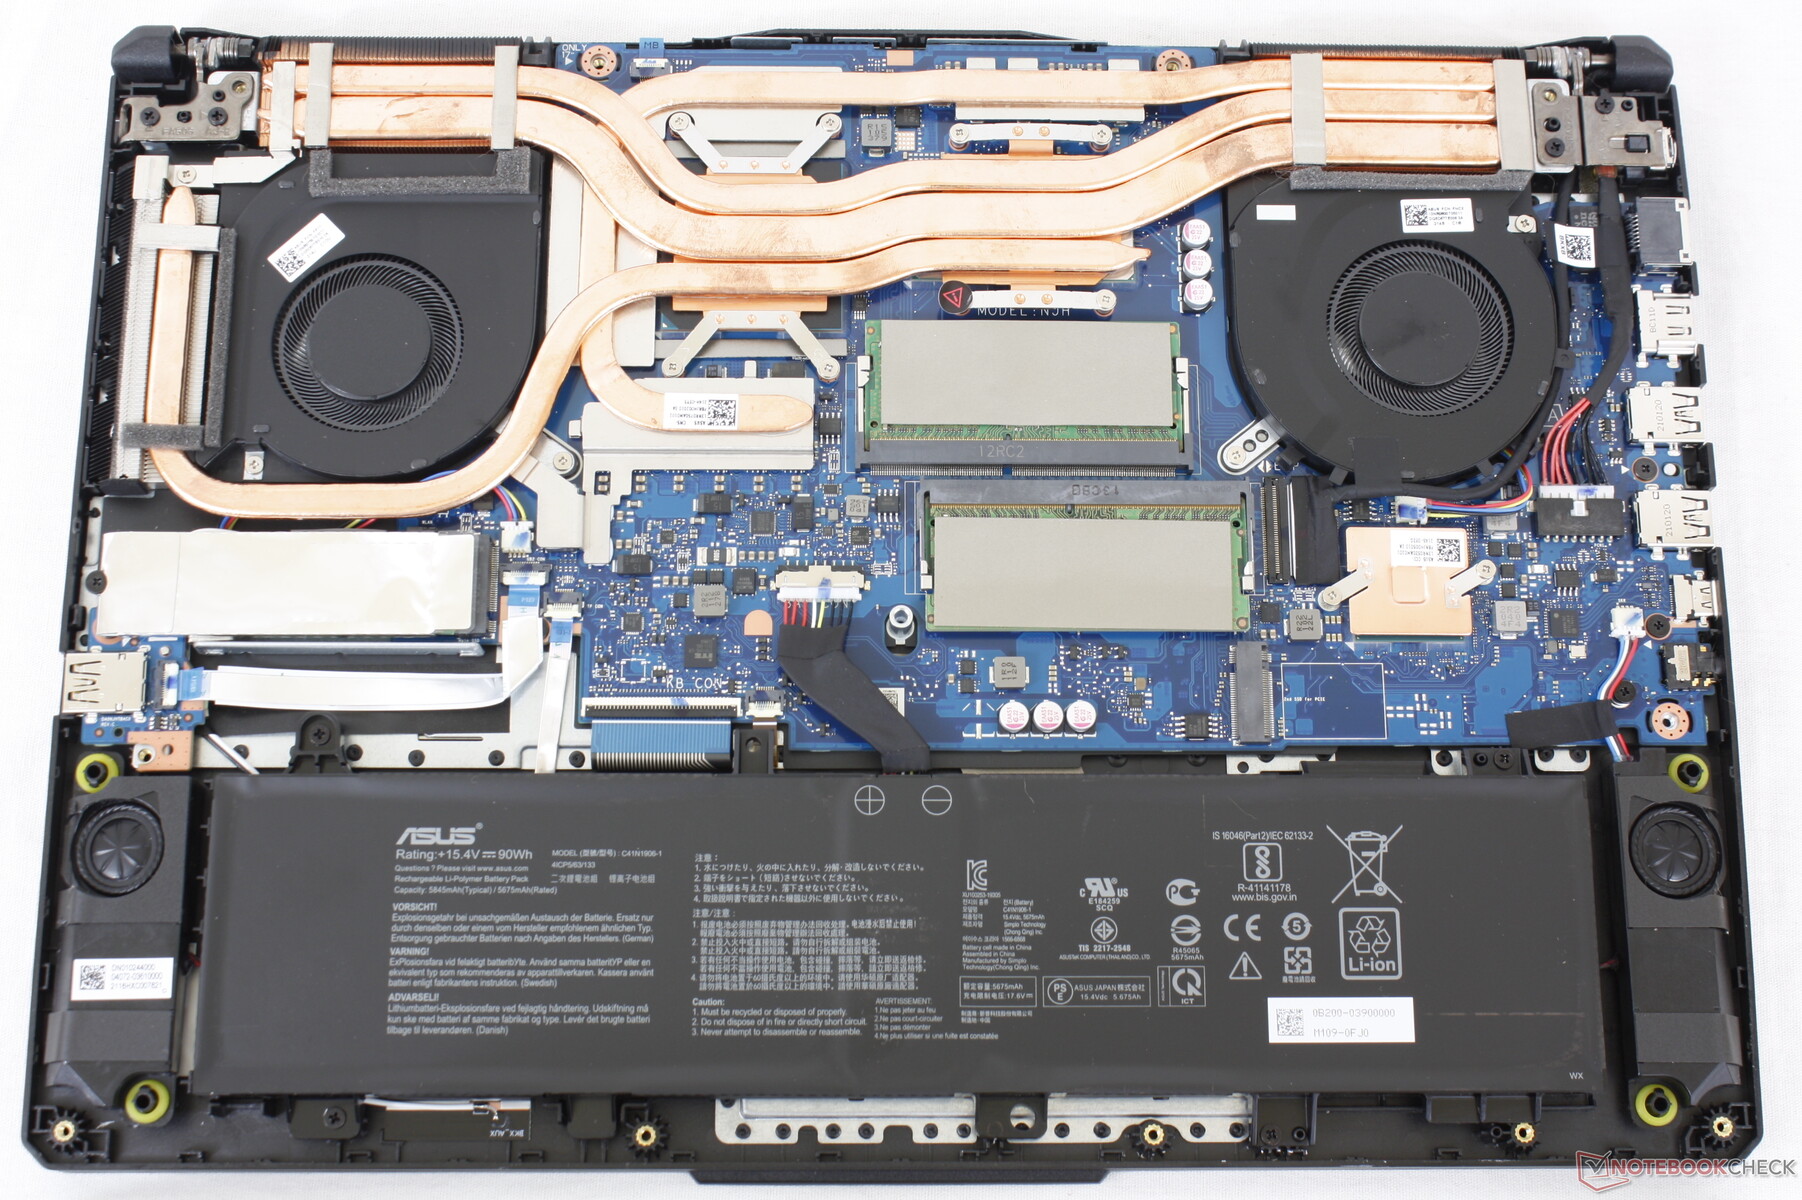
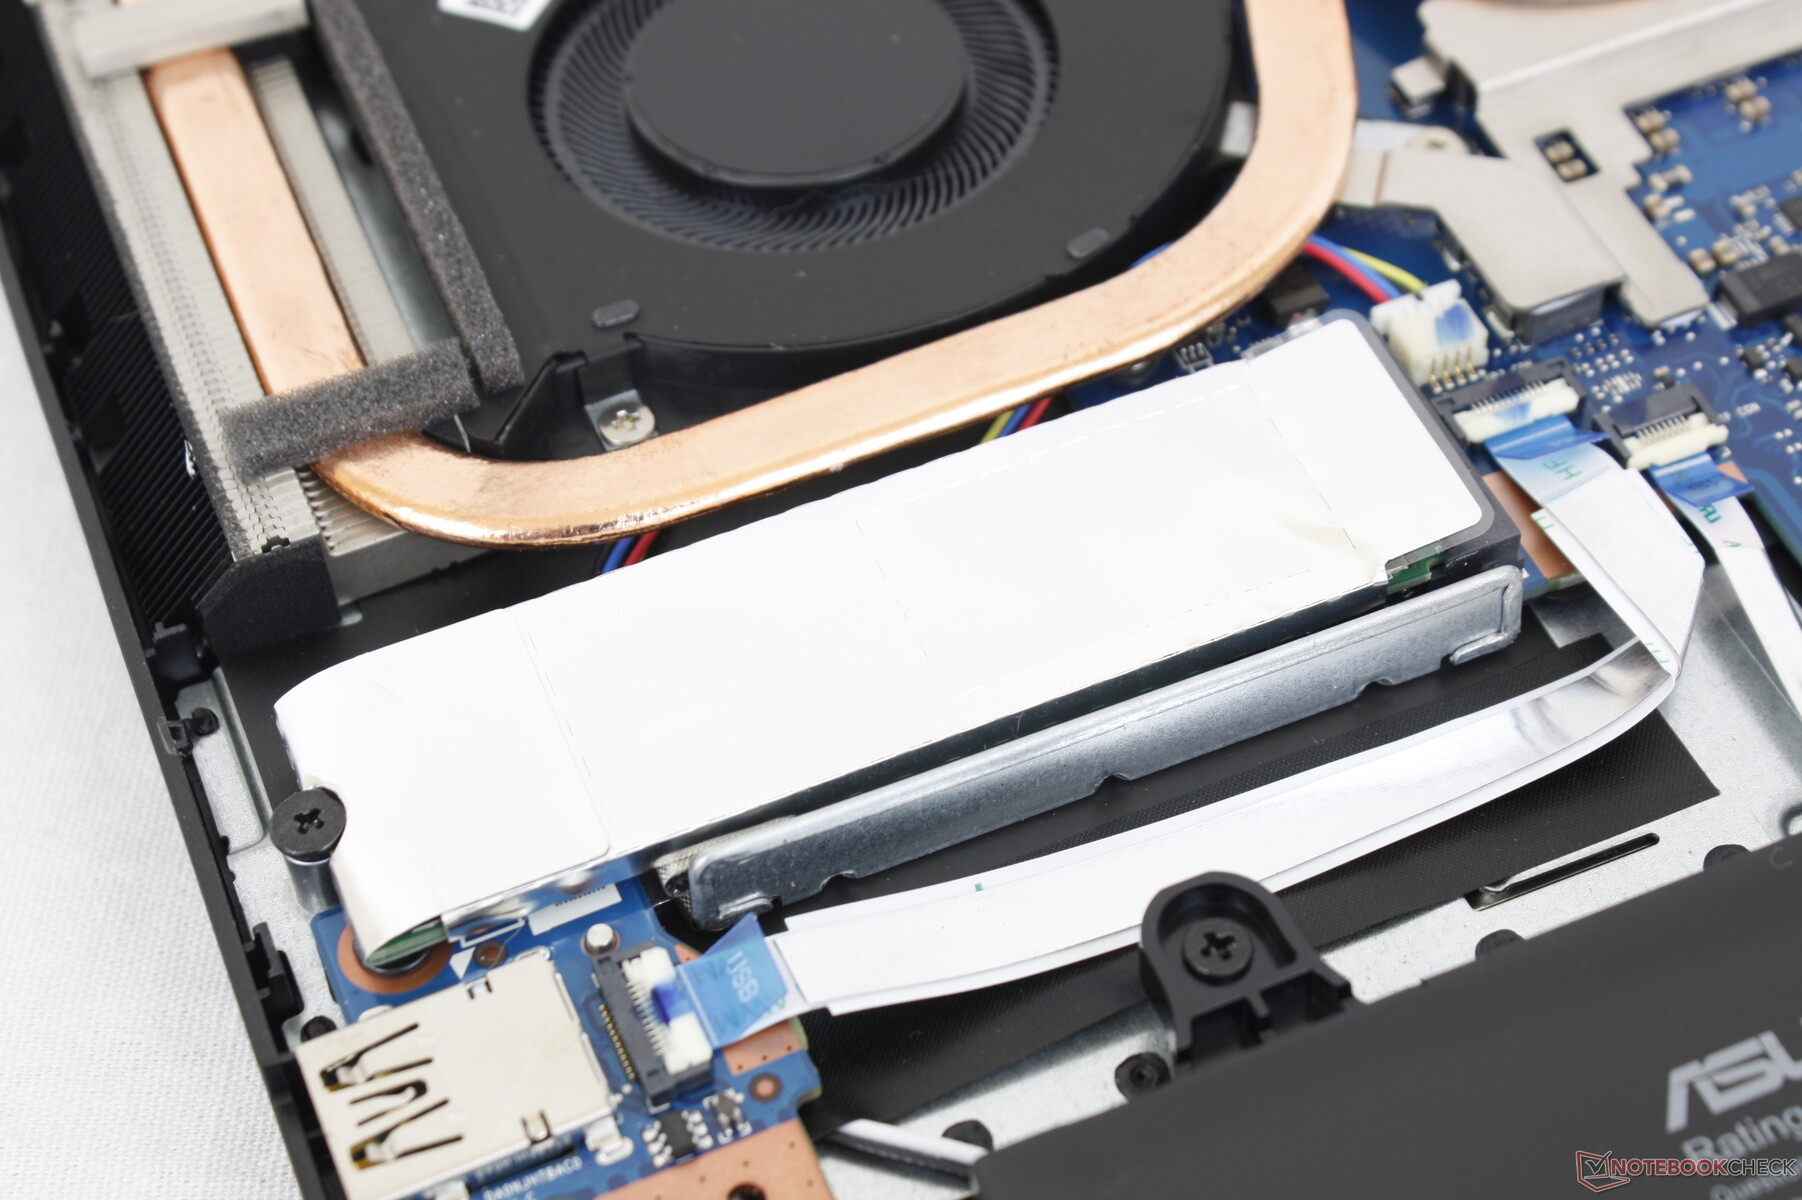
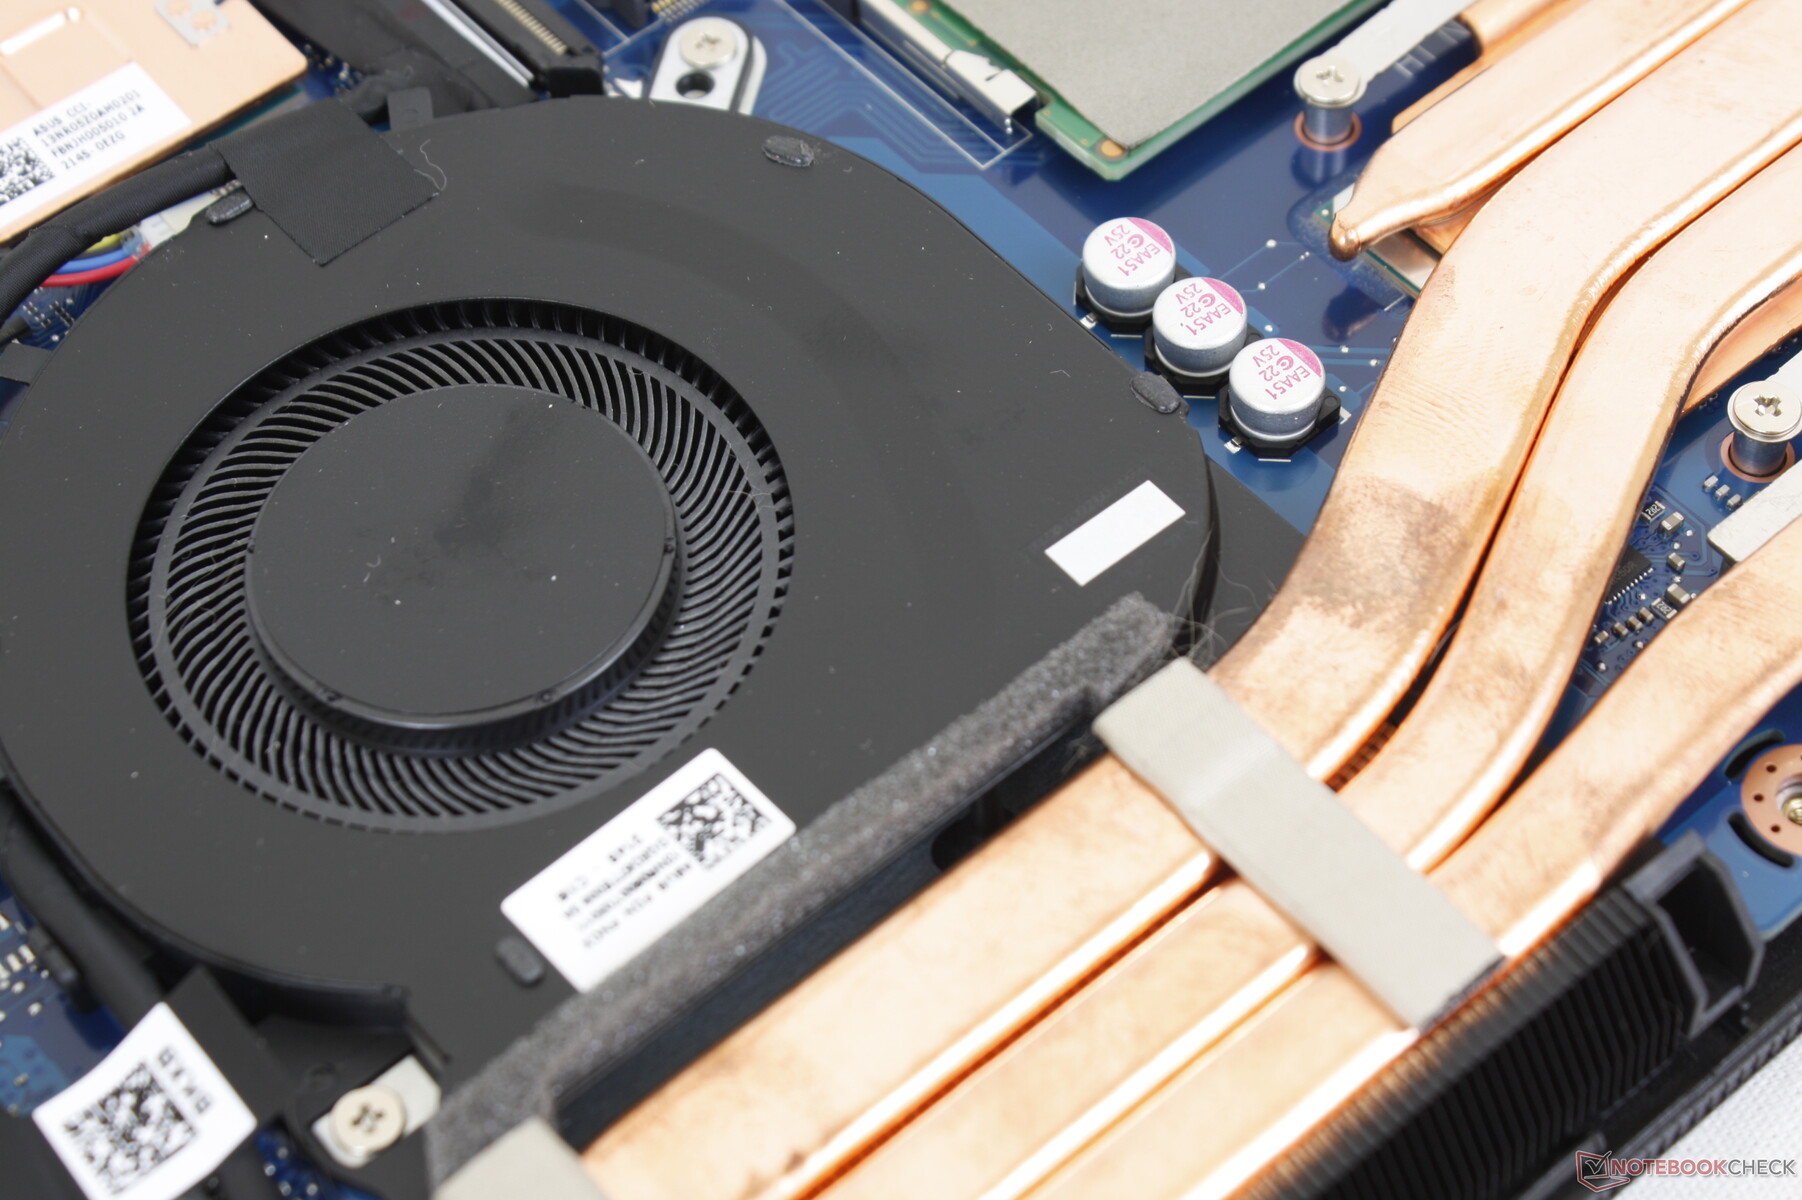
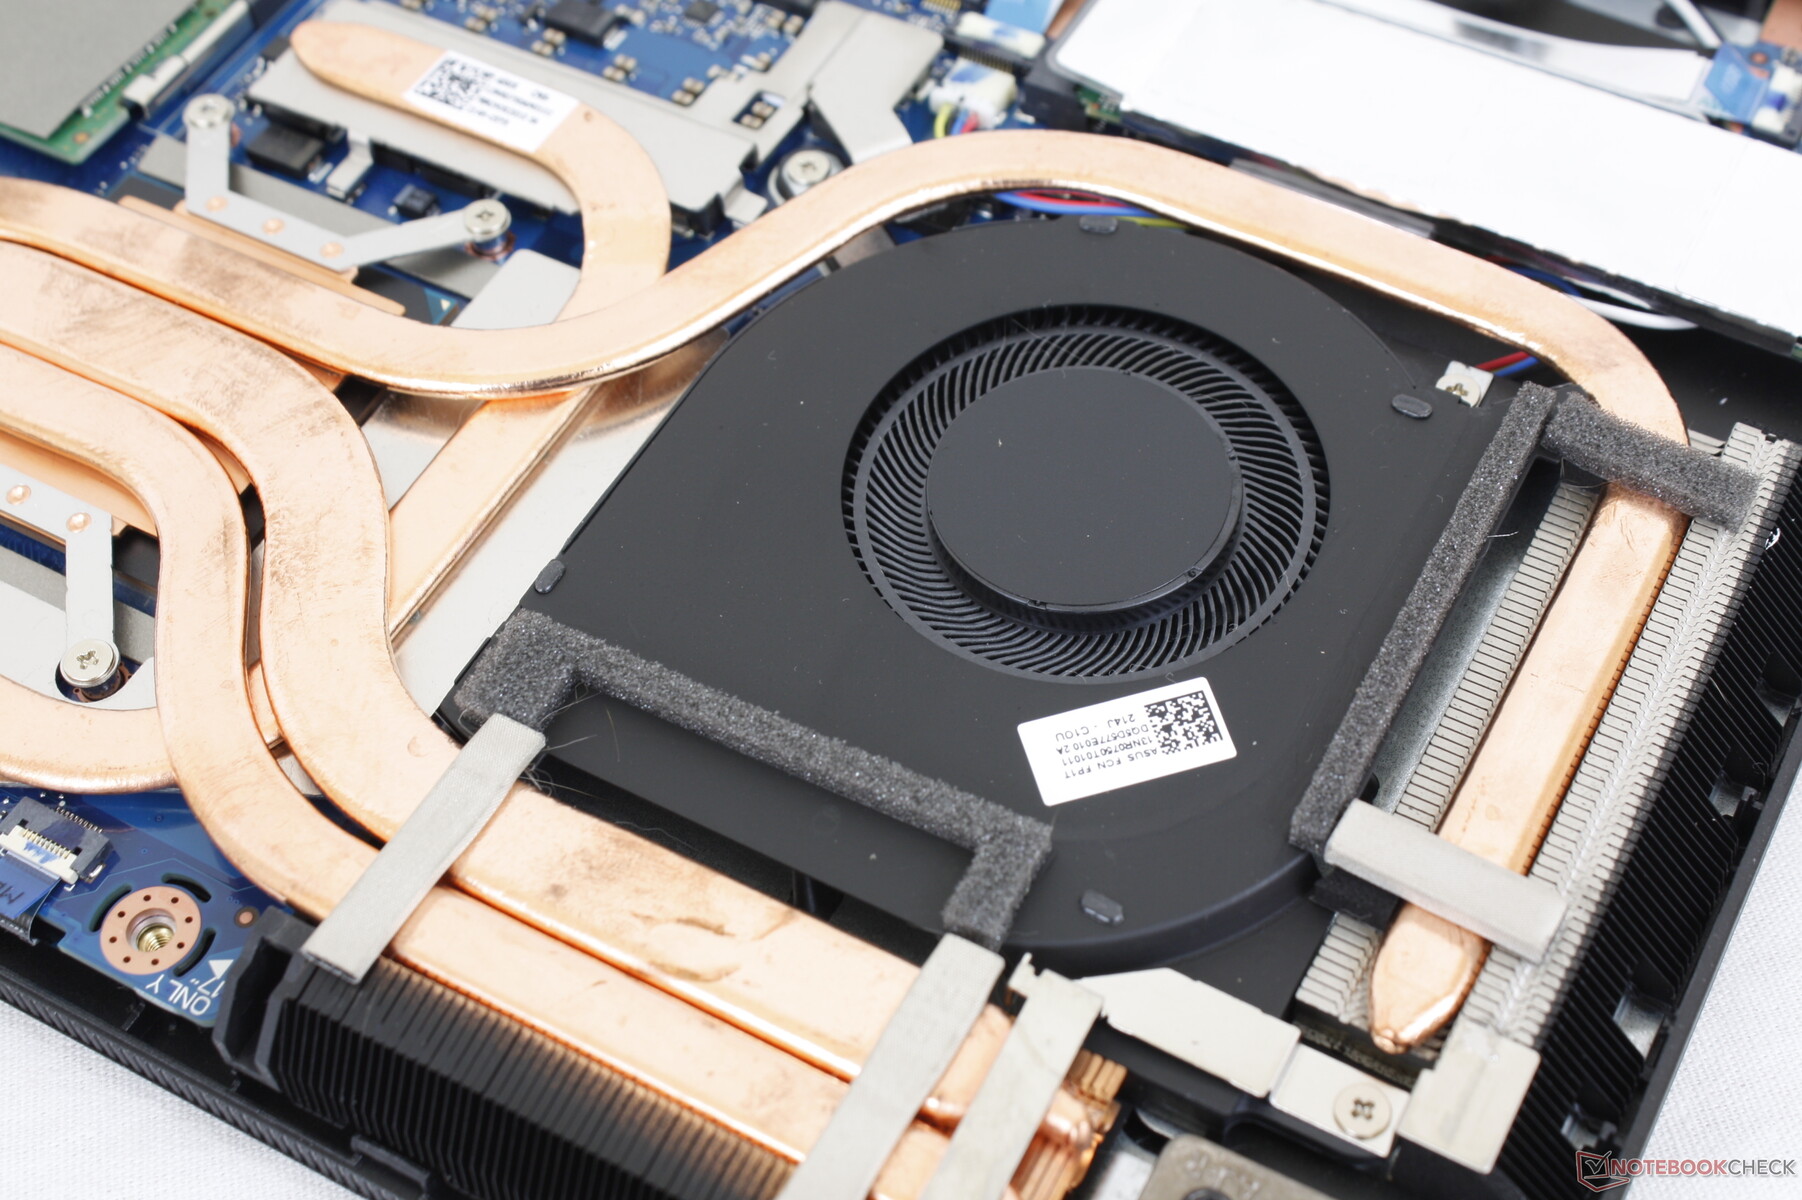
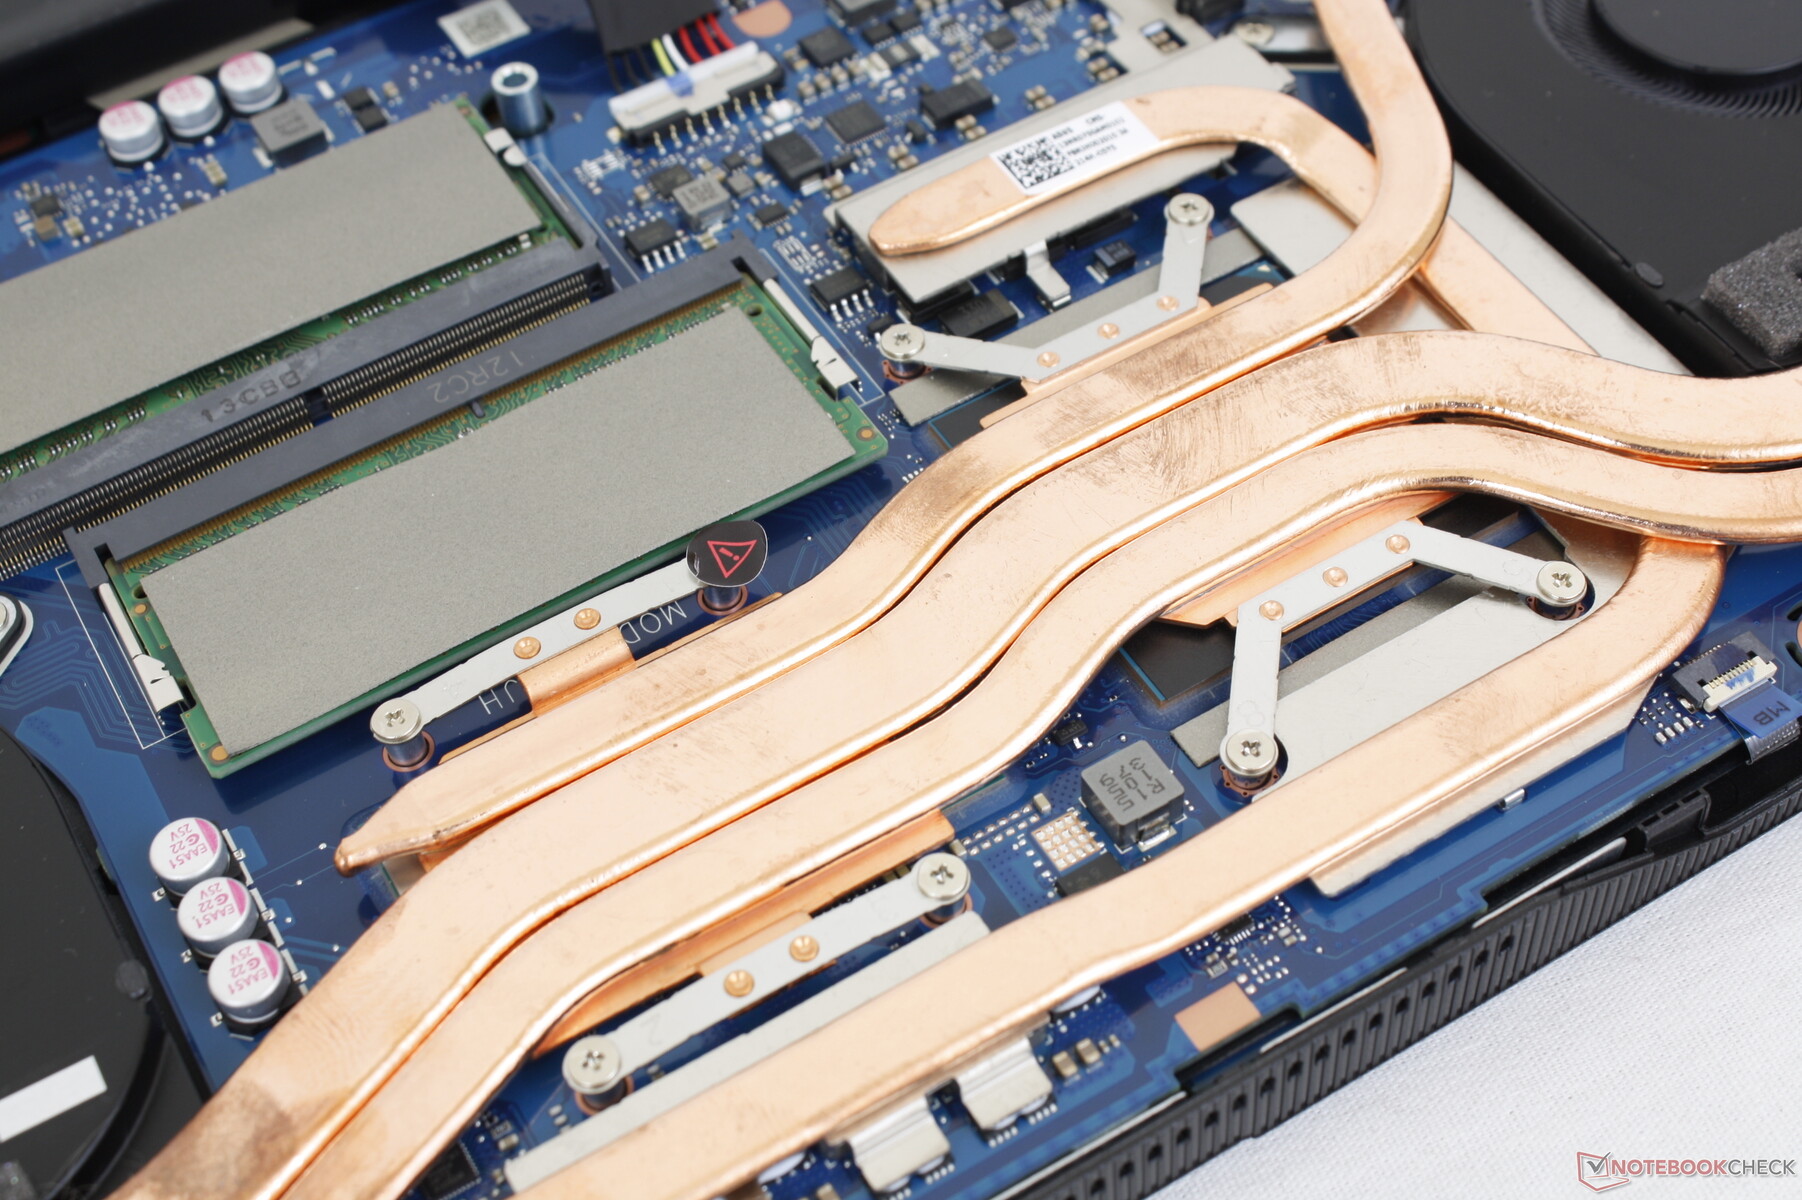
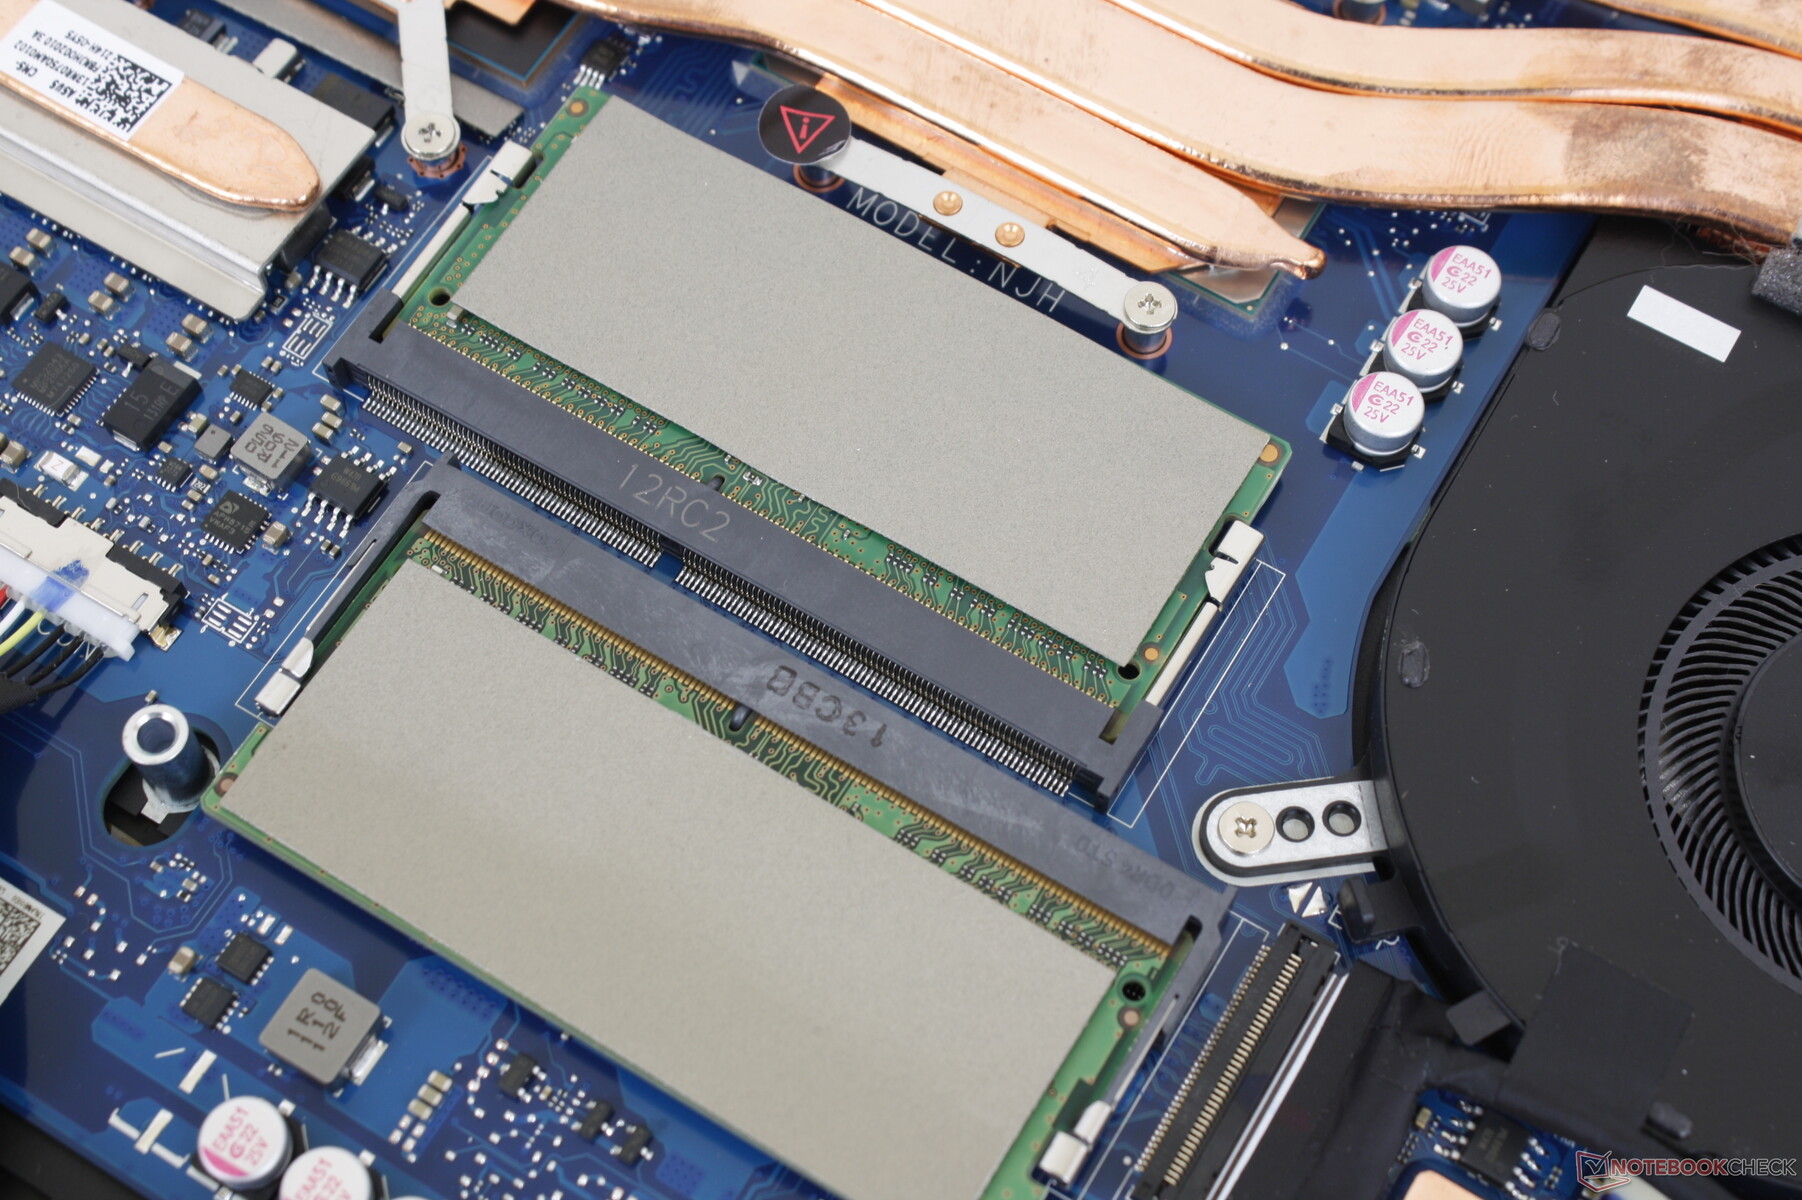
Mantenimiento - Facilidad de actualización
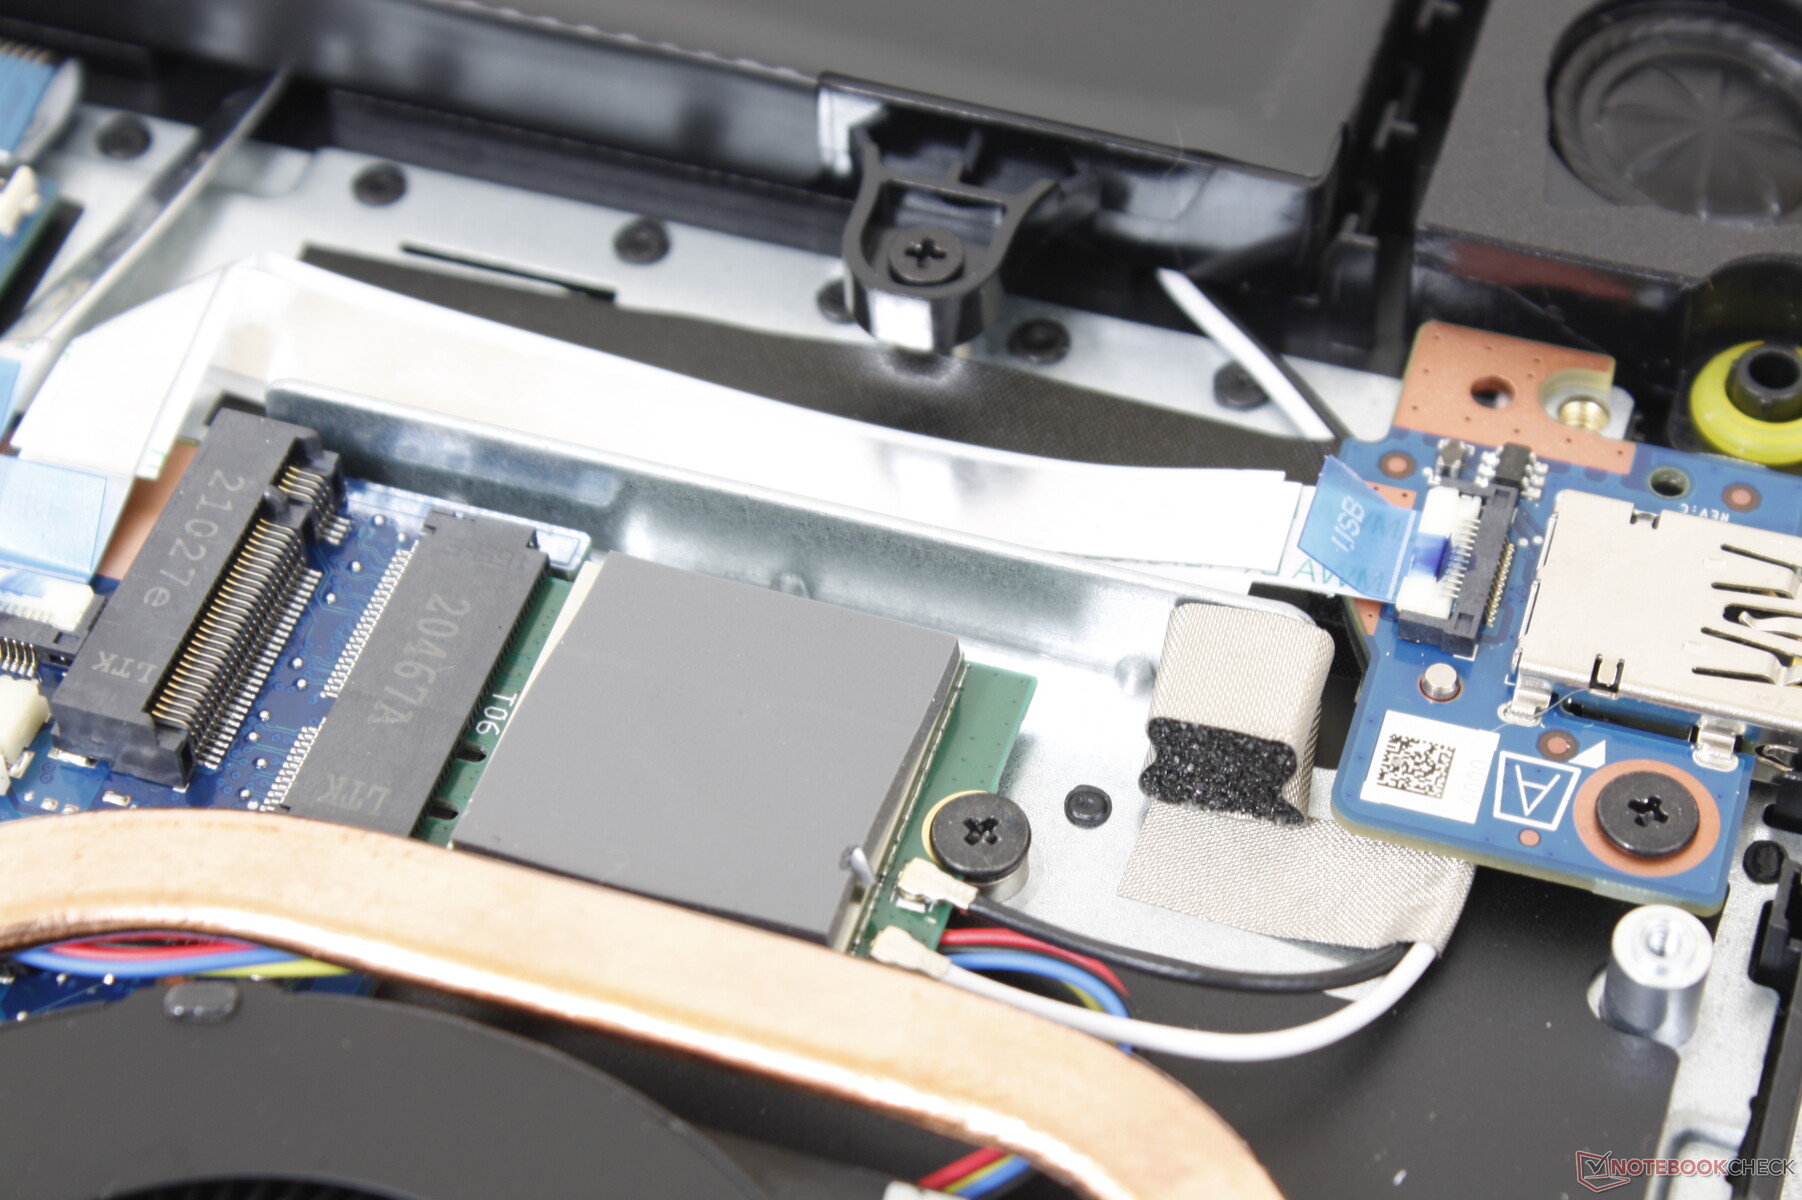
El panel inferior se desprende con bastante facilidad tras retirar sus 11 tornillos Philips. El diseño interno comparte muchas similitudes con el TUF Dash F15 a pesar de sus significativas diferencias de chasis.
Accesorios y garantía
La caja incluye una página de pegatinas de Asus junto con la documentación habitual. La garantía limitada de un año viene de serie.
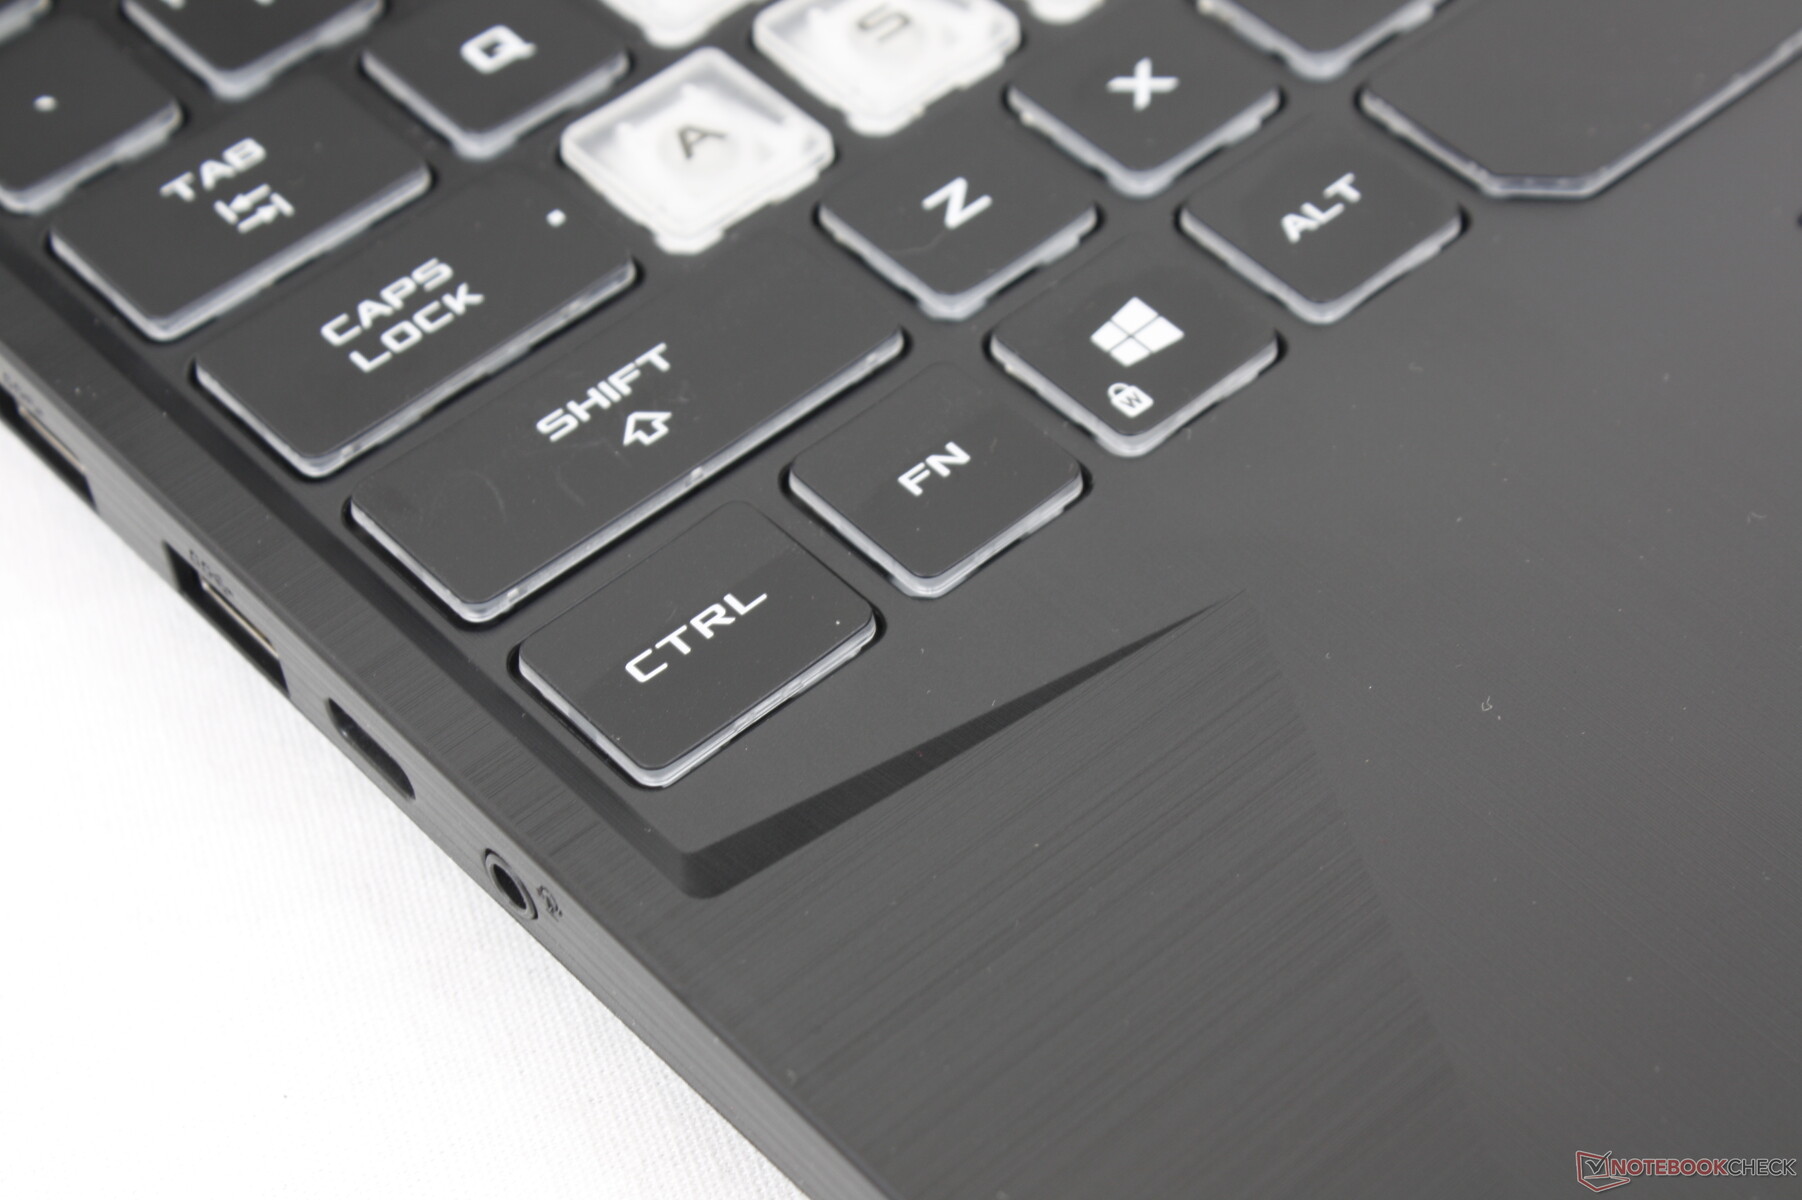
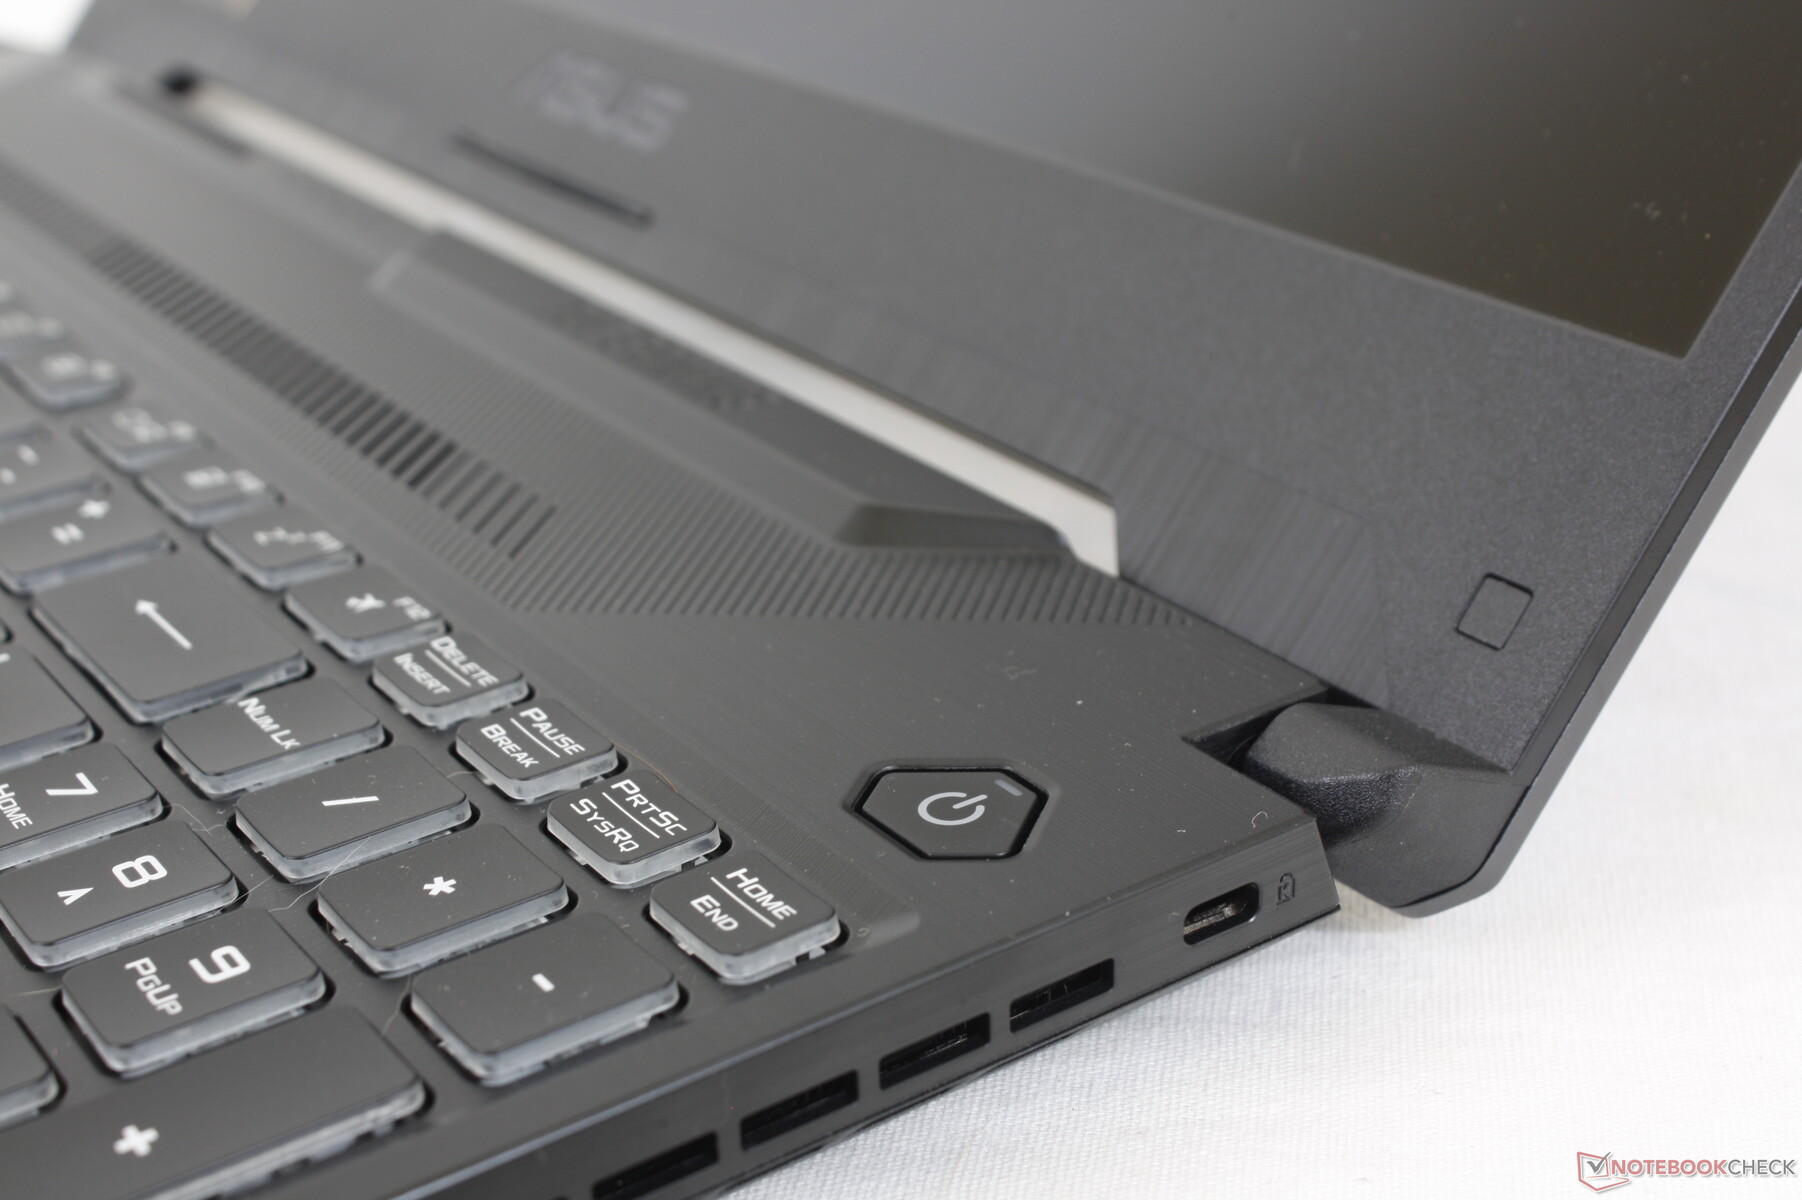
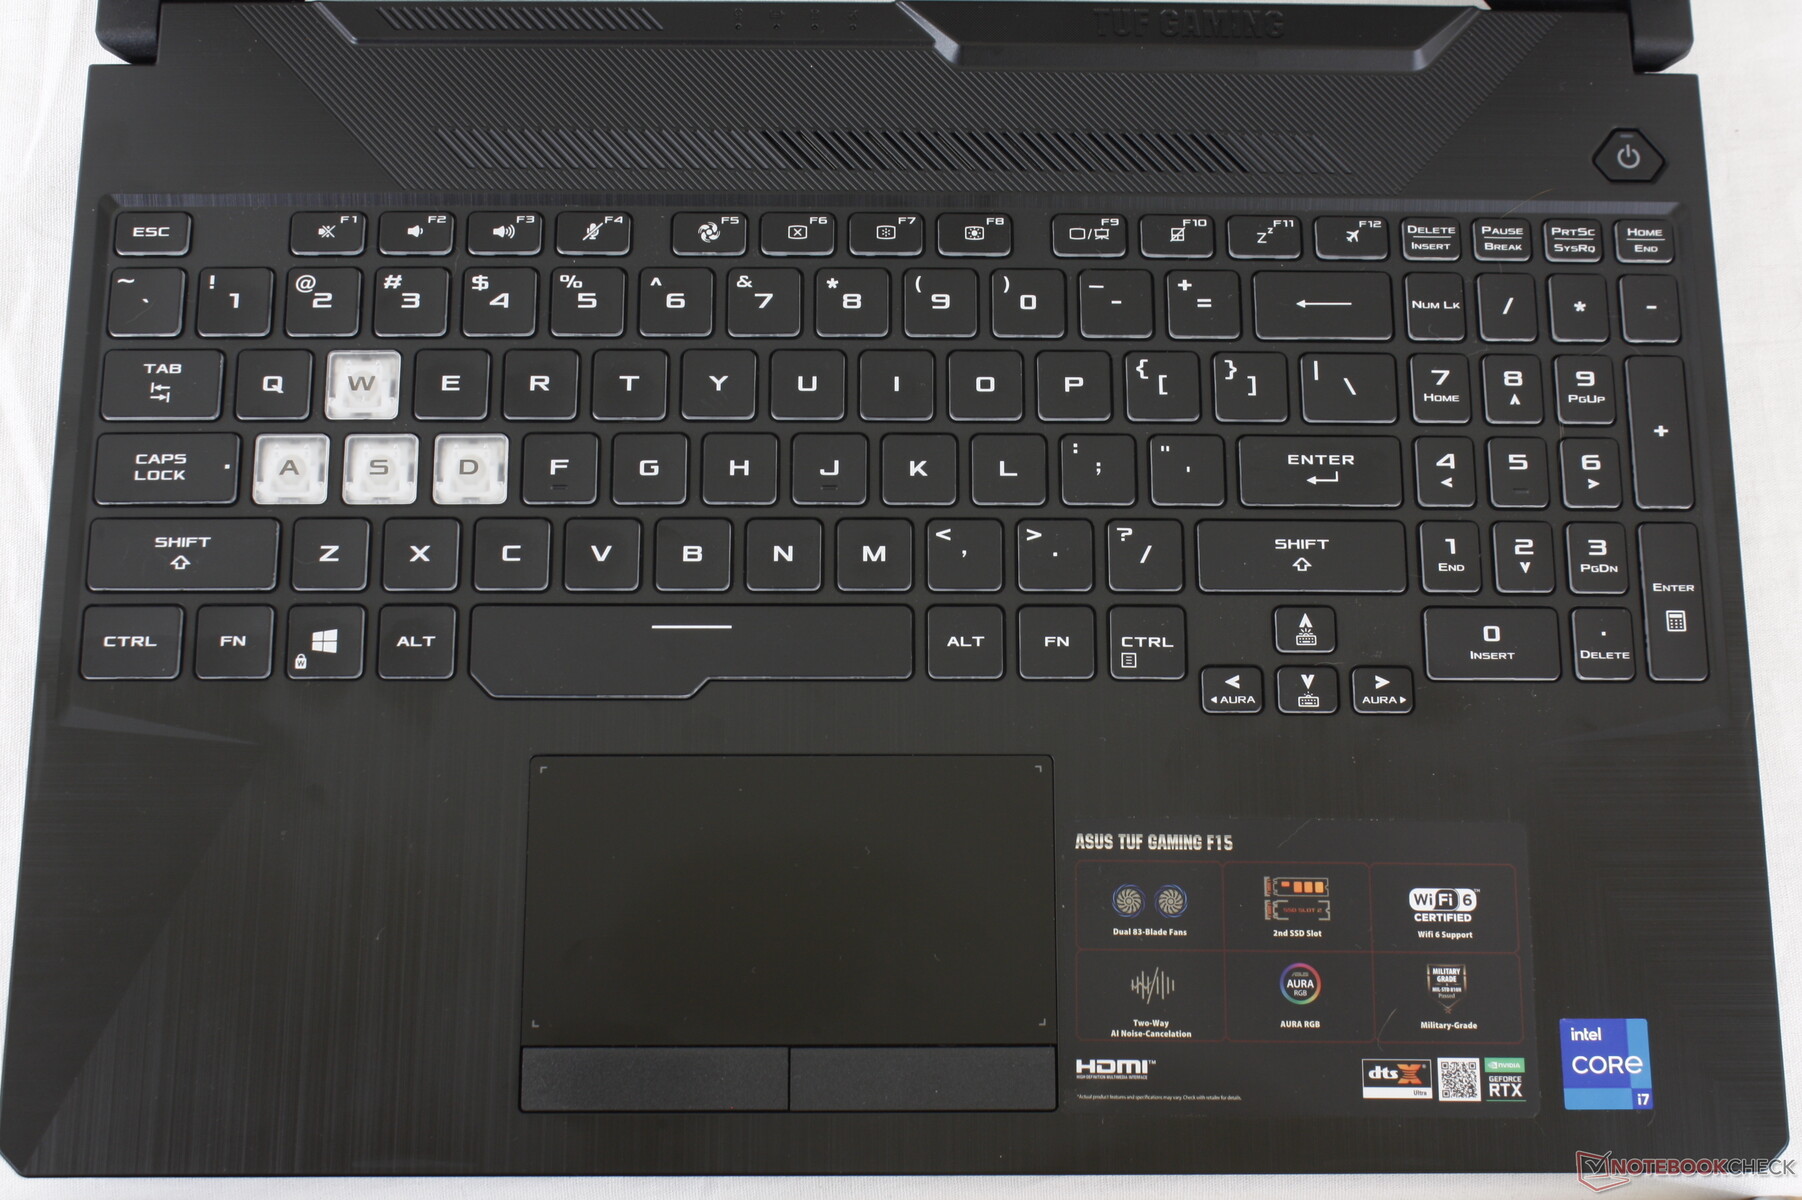
Dispositivos de entrada - Gran experiencia de escritura
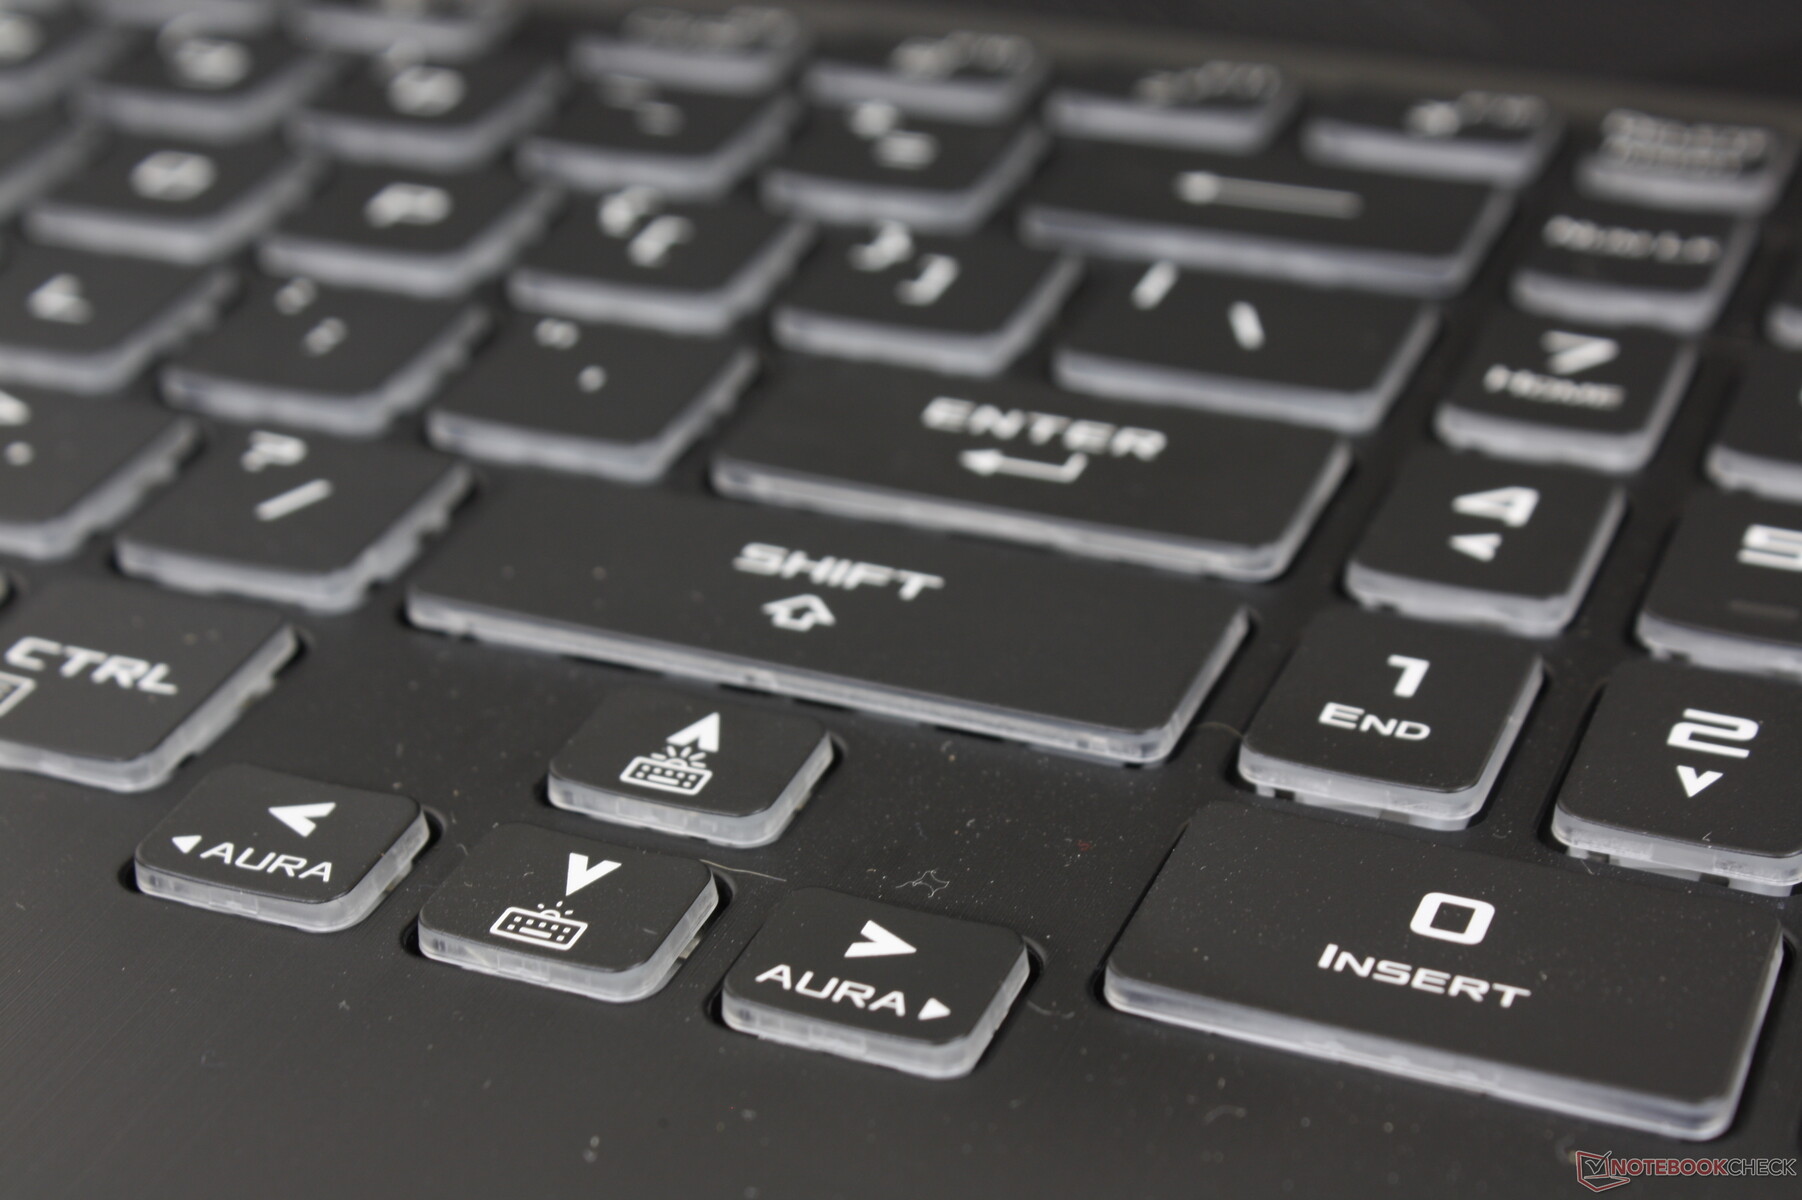
Teclado
Aunque la distribución del teclado ha cambiado con respecto al FX505la experiencia de tecleo sigue siendo la misma. La respuesta de las principales teclas QWERTY sigue siendo satisfactoria, con un repiqueteo moderadamente fuerte. Nuestro principal problema sigue siendo el de las teclas de dirección, que ahora son aún más pequeñas que las del modelo de última generación. No sólo están apretadas, sino que la respuesta es esponjosa e insatisfactoria. Vas a querer un teclado externo u otro portátil para juegos si planeas usar las teclas de dirección con frecuencia.
La iluminación RGB de una sola zona está disponible sin opciones por tecla. Los usuarios tendrán que cambiar a la serie ROG de Asus, más cara, para obtener estas características de lujo.
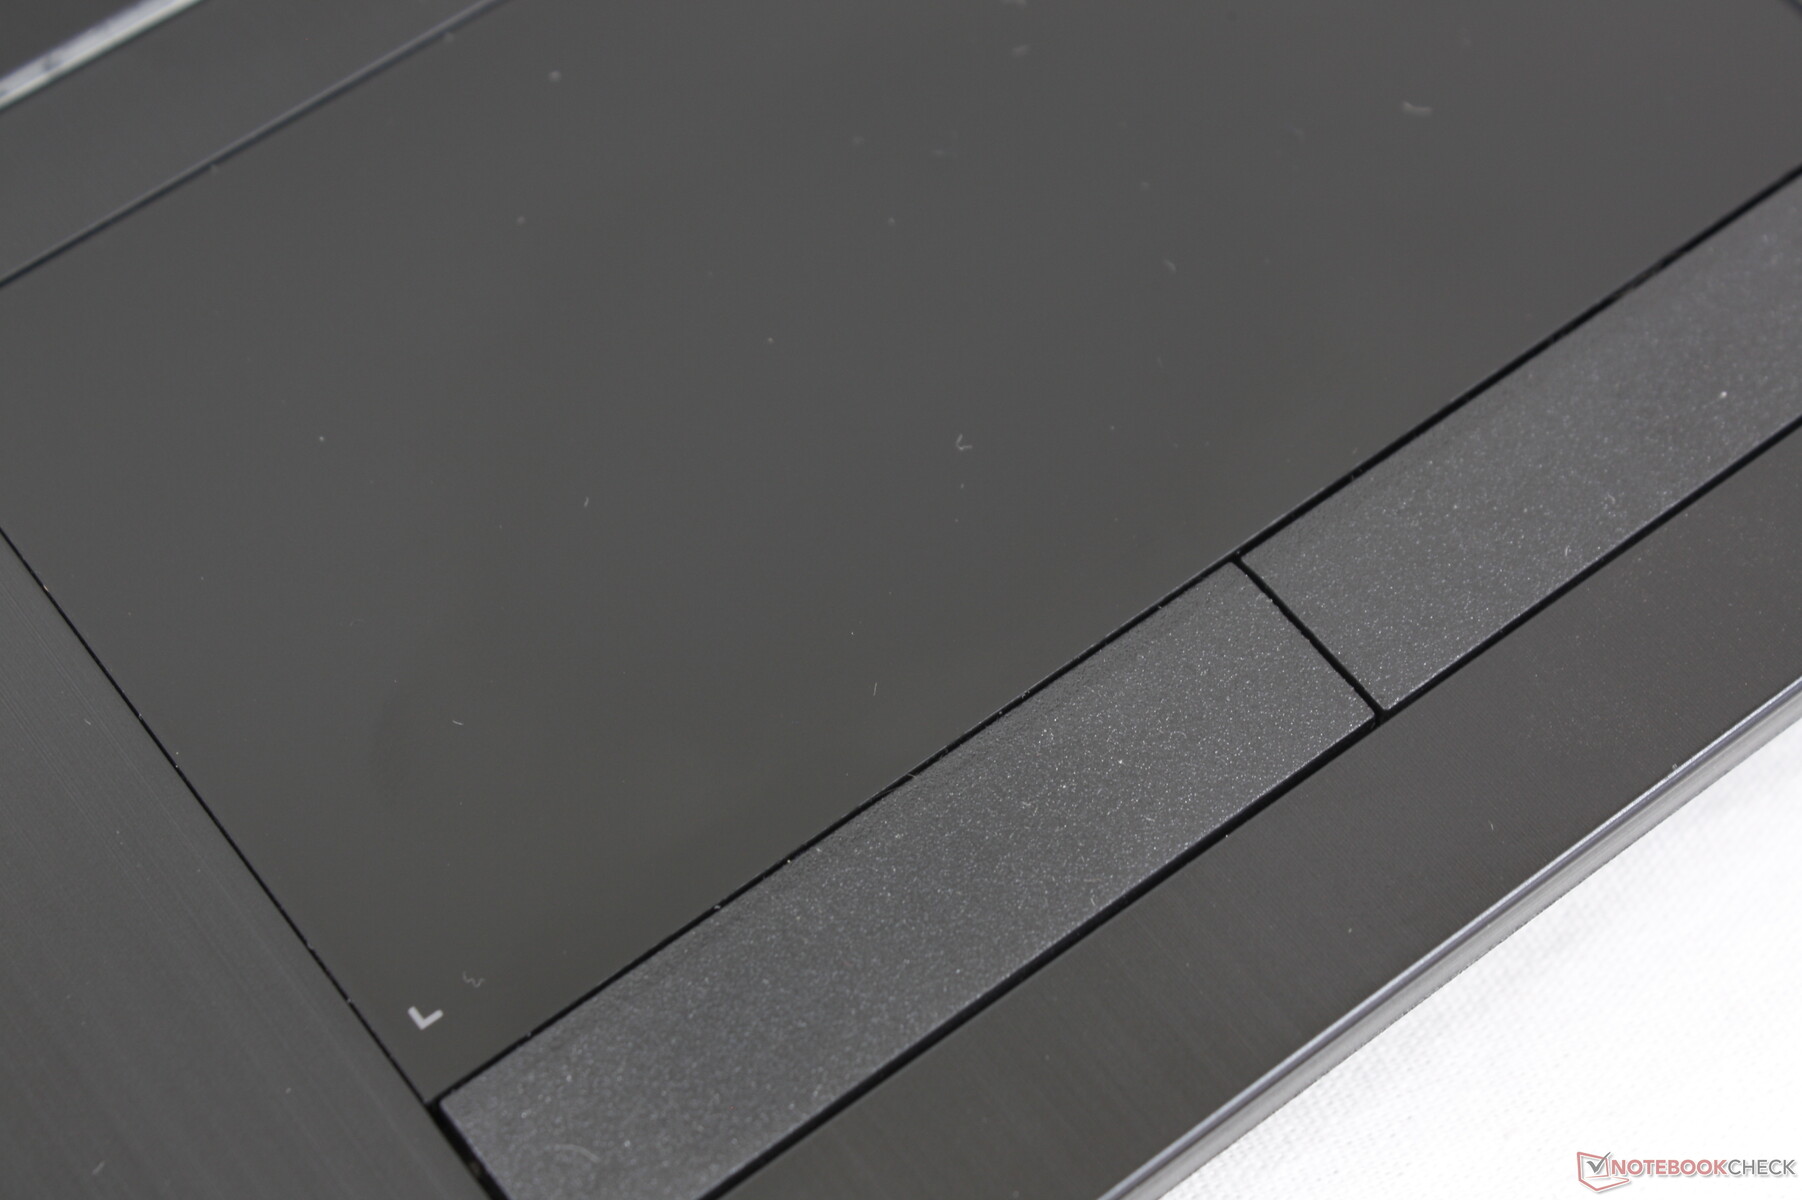
Panel táctil
El touchpad es relativamente pequeño (~10.6 x 8.0 cm), pero es uno de los pocos portátiles de juego con botones de ratón dedicados para un control y clics más precisos. Los botones son muy silenciosos cuando se pulsan con una respuesta moderada pero satisfactoria en contraste con los botones mucho más ruidosos de la serie MSI GT. Sin embargo, la superficie del touchpad sin textura es, por desgracia, susceptible de acumular antiestéticas huellas dactilares.

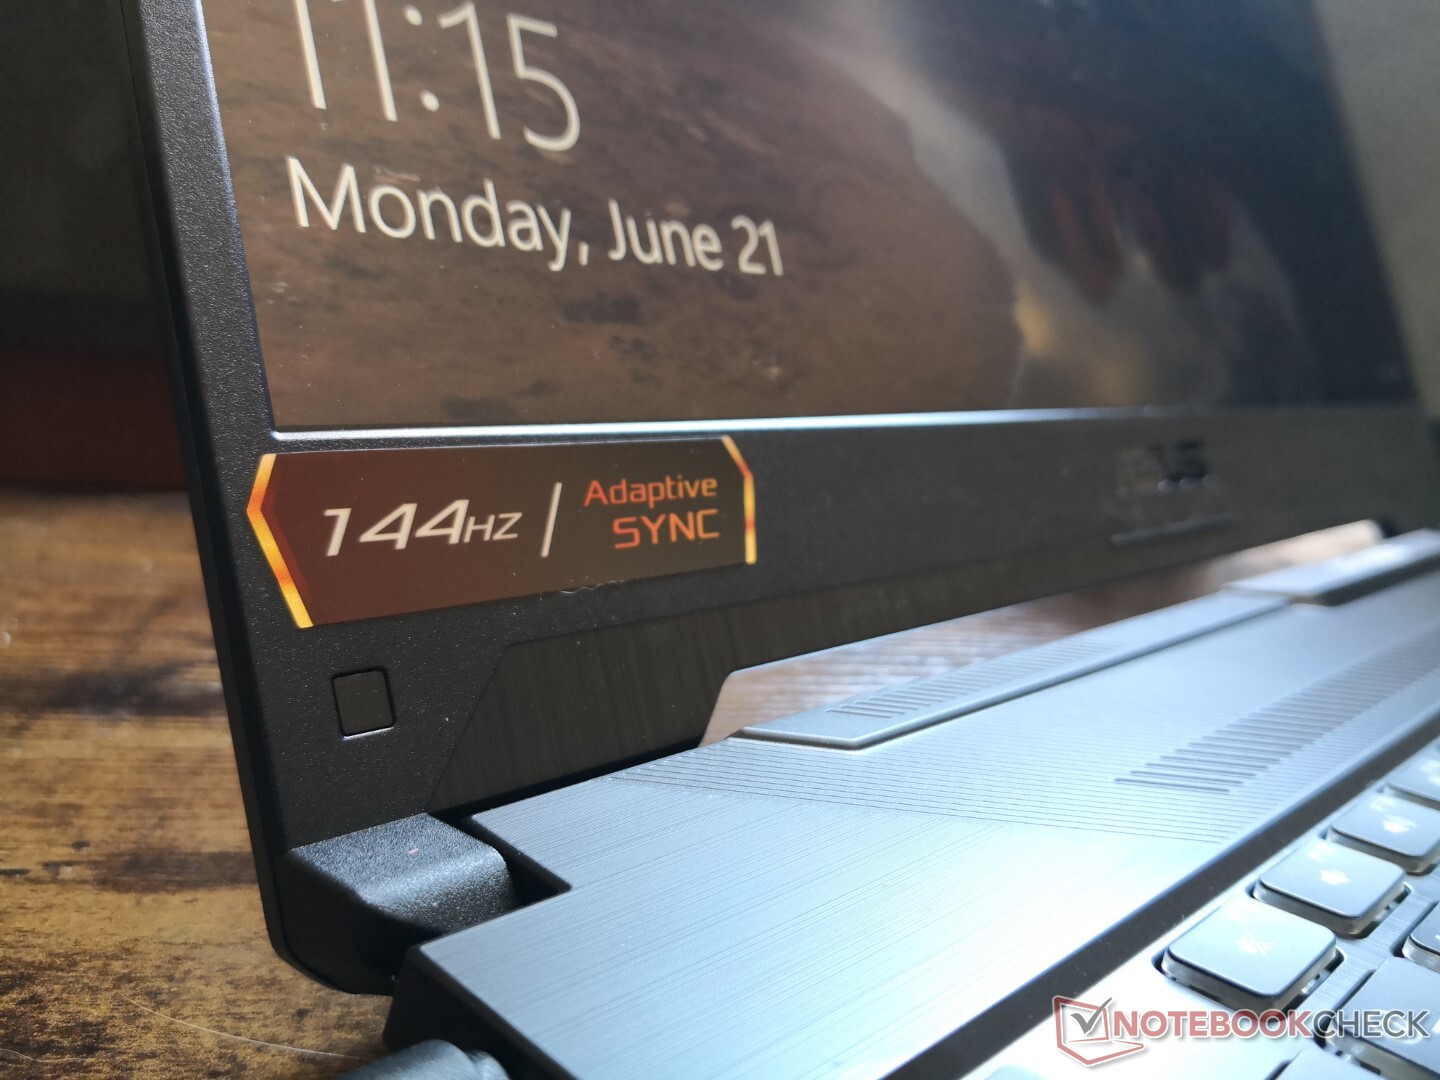
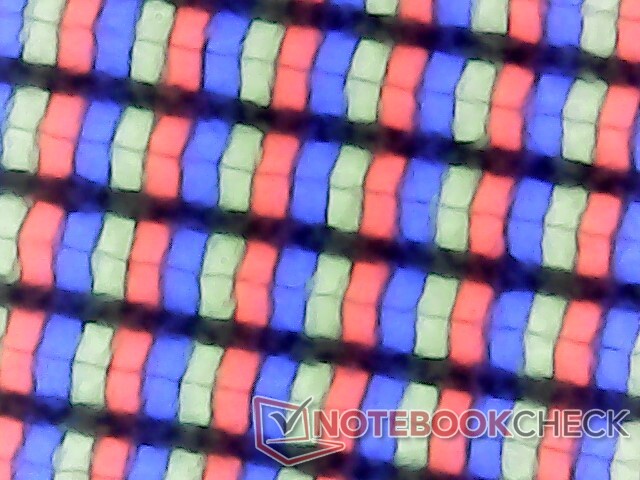
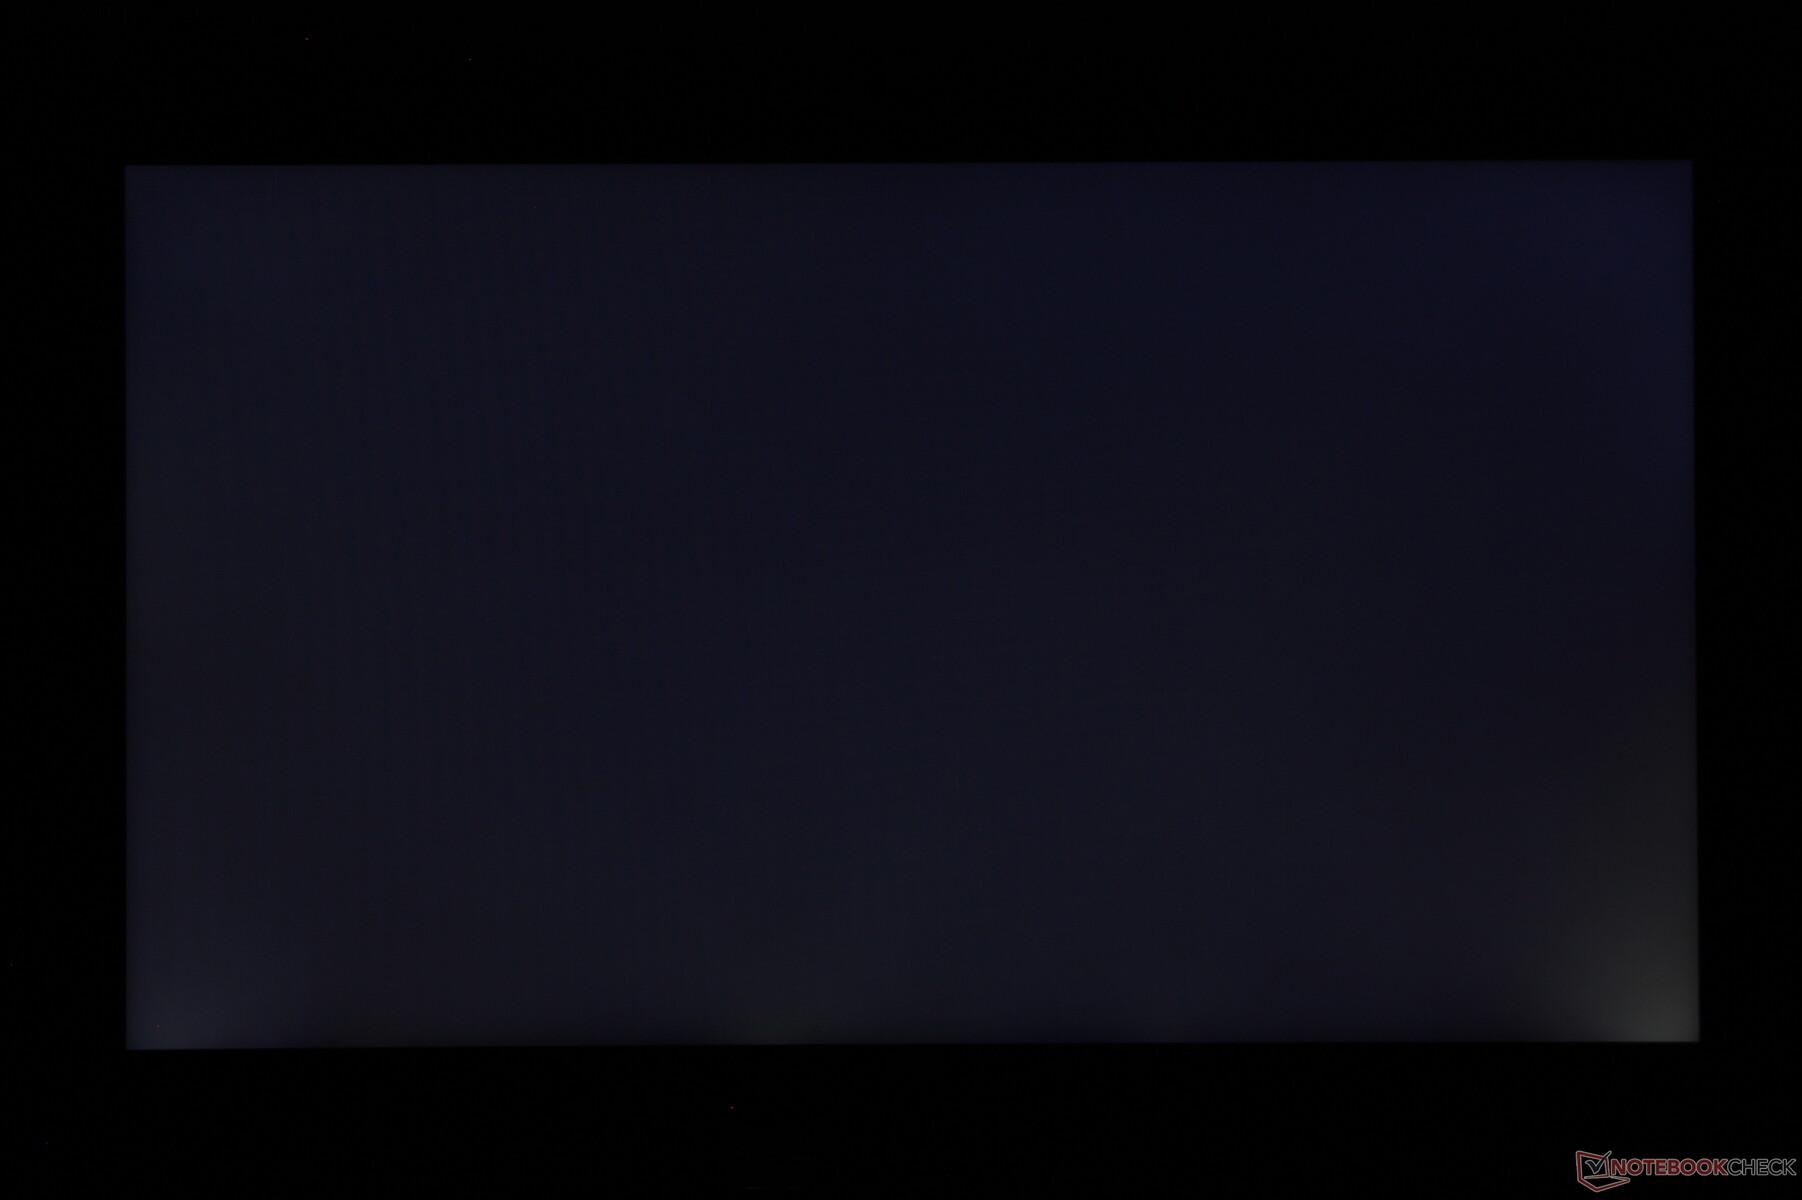
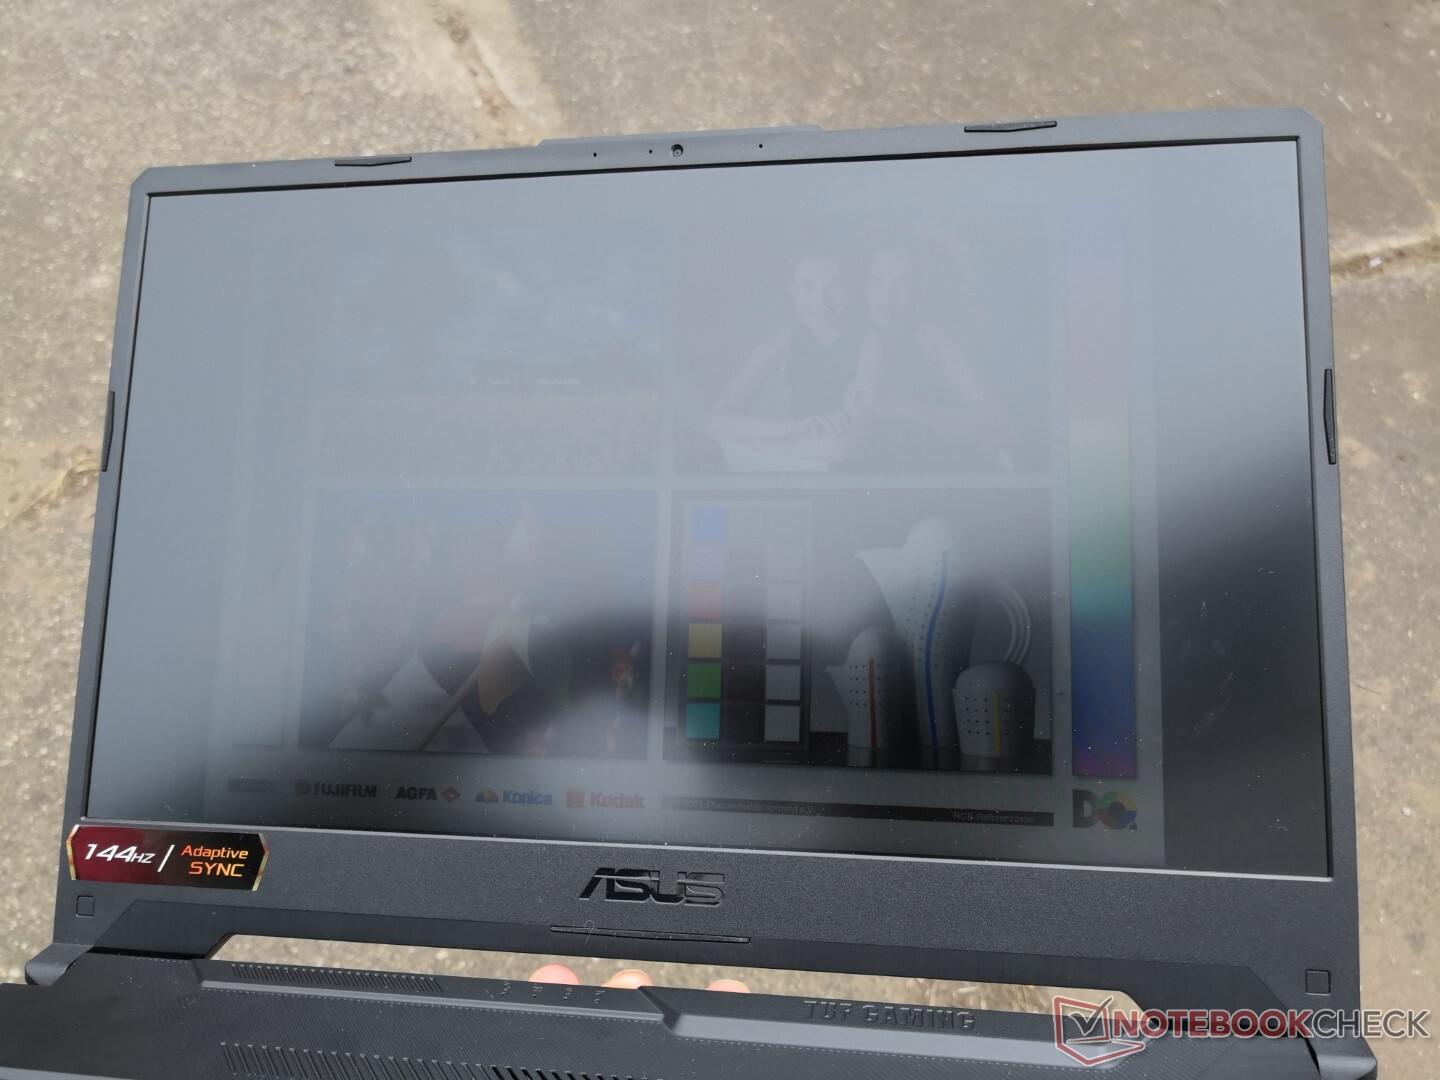
Pantalla - Alta en tasa de refresco, baja en colores
El panel IPS Chi Mei N156HRA-EA1 de 144 Hz también puede encontrarse en el reciente Nitro 5 AN515-55 que es un portátil de juegos económico de la competencia de Acer. Aparte de la rápida tasa de refresco nativa, todo lo demás del panel es bastante mediocre para reflejar la categoría de nivel básico. Los tiempos de respuesta, los colores y el contraste no son tan buenos como los paneles de los modelos Zephyrus o ROG, más caros. No obstante, el movimiento ultrasuave es una mejora notable con respecto a los paneles de 60 Hz más baratos que existen.

| |||||||||||||||||||||||||
iluminación: 84 %
Brillo con batería: 268.3 cd/m²
Contraste: 789:1 (Negro: 0.34 cd/m²)
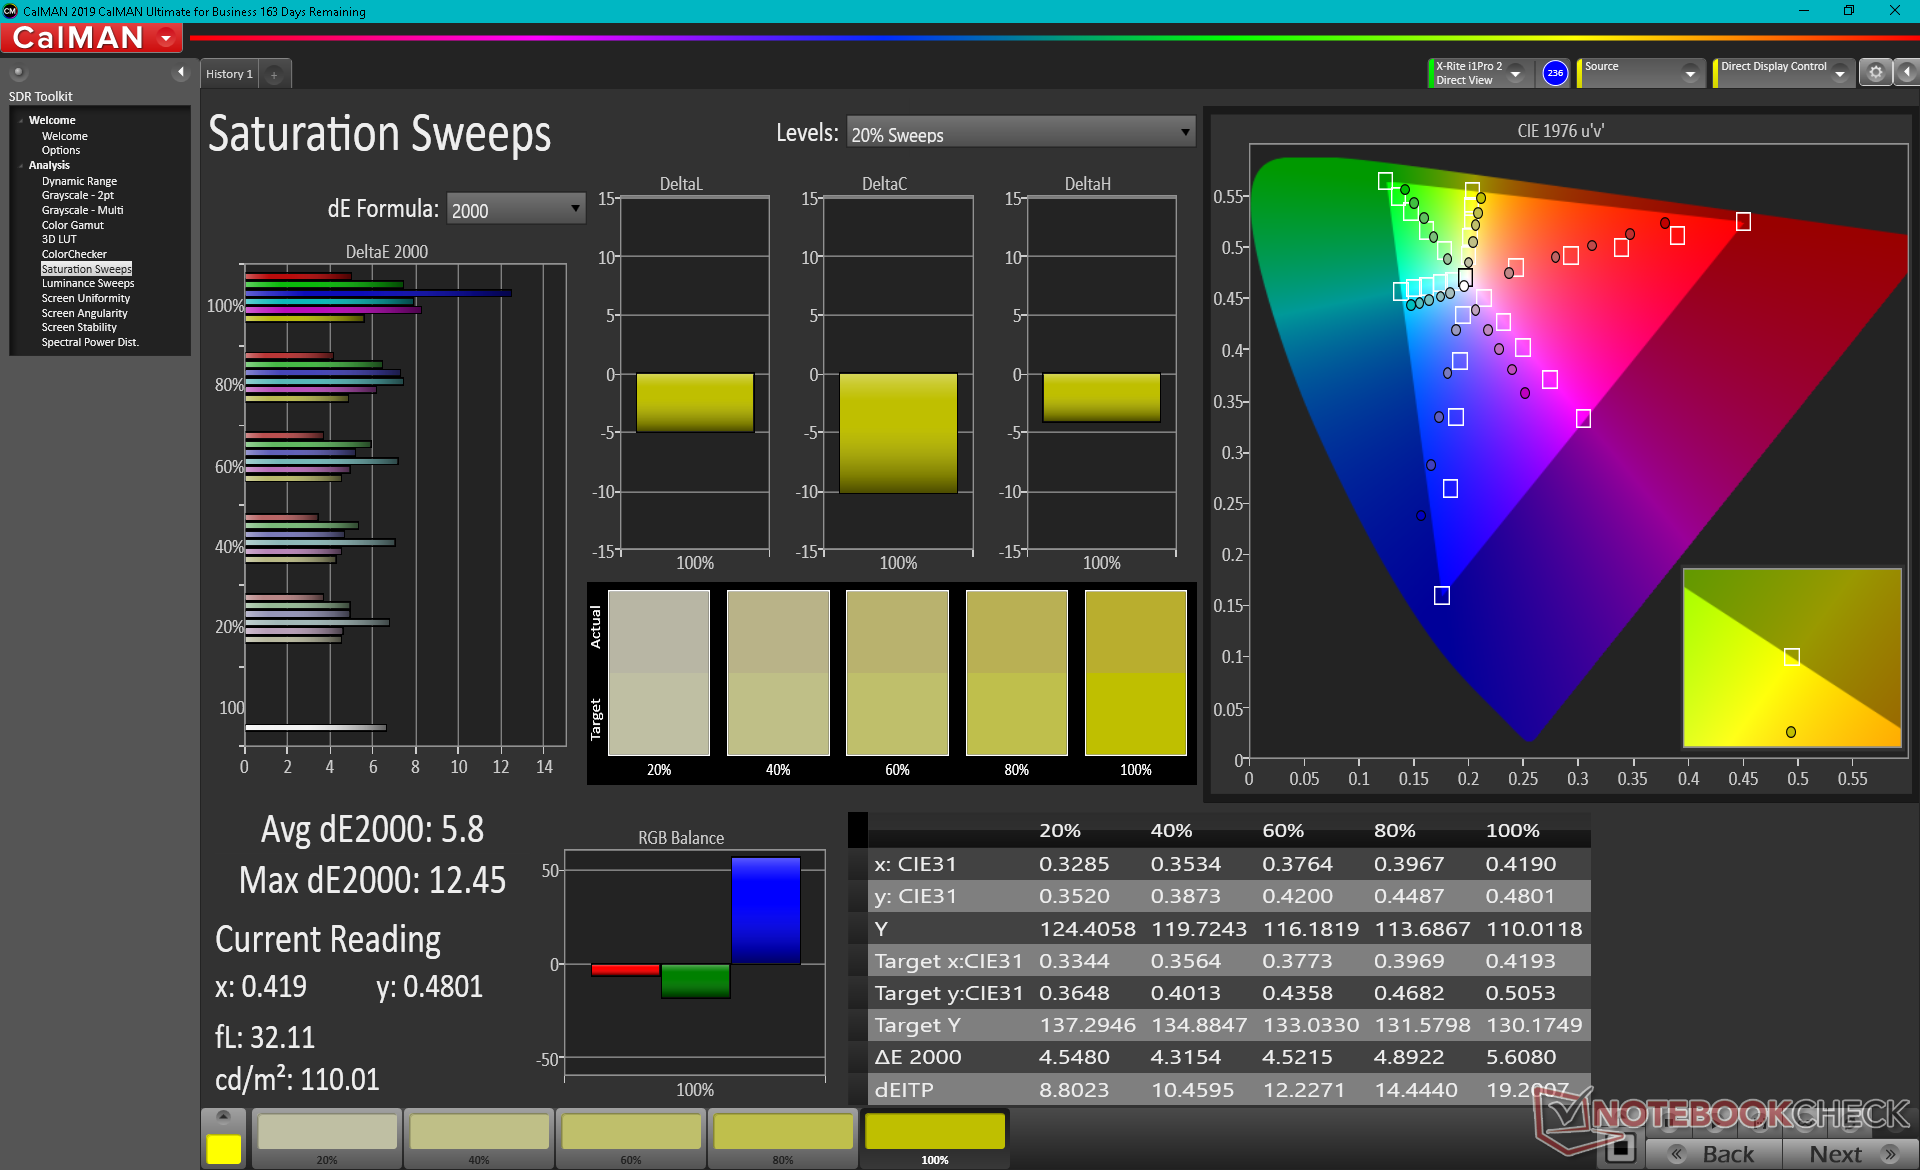
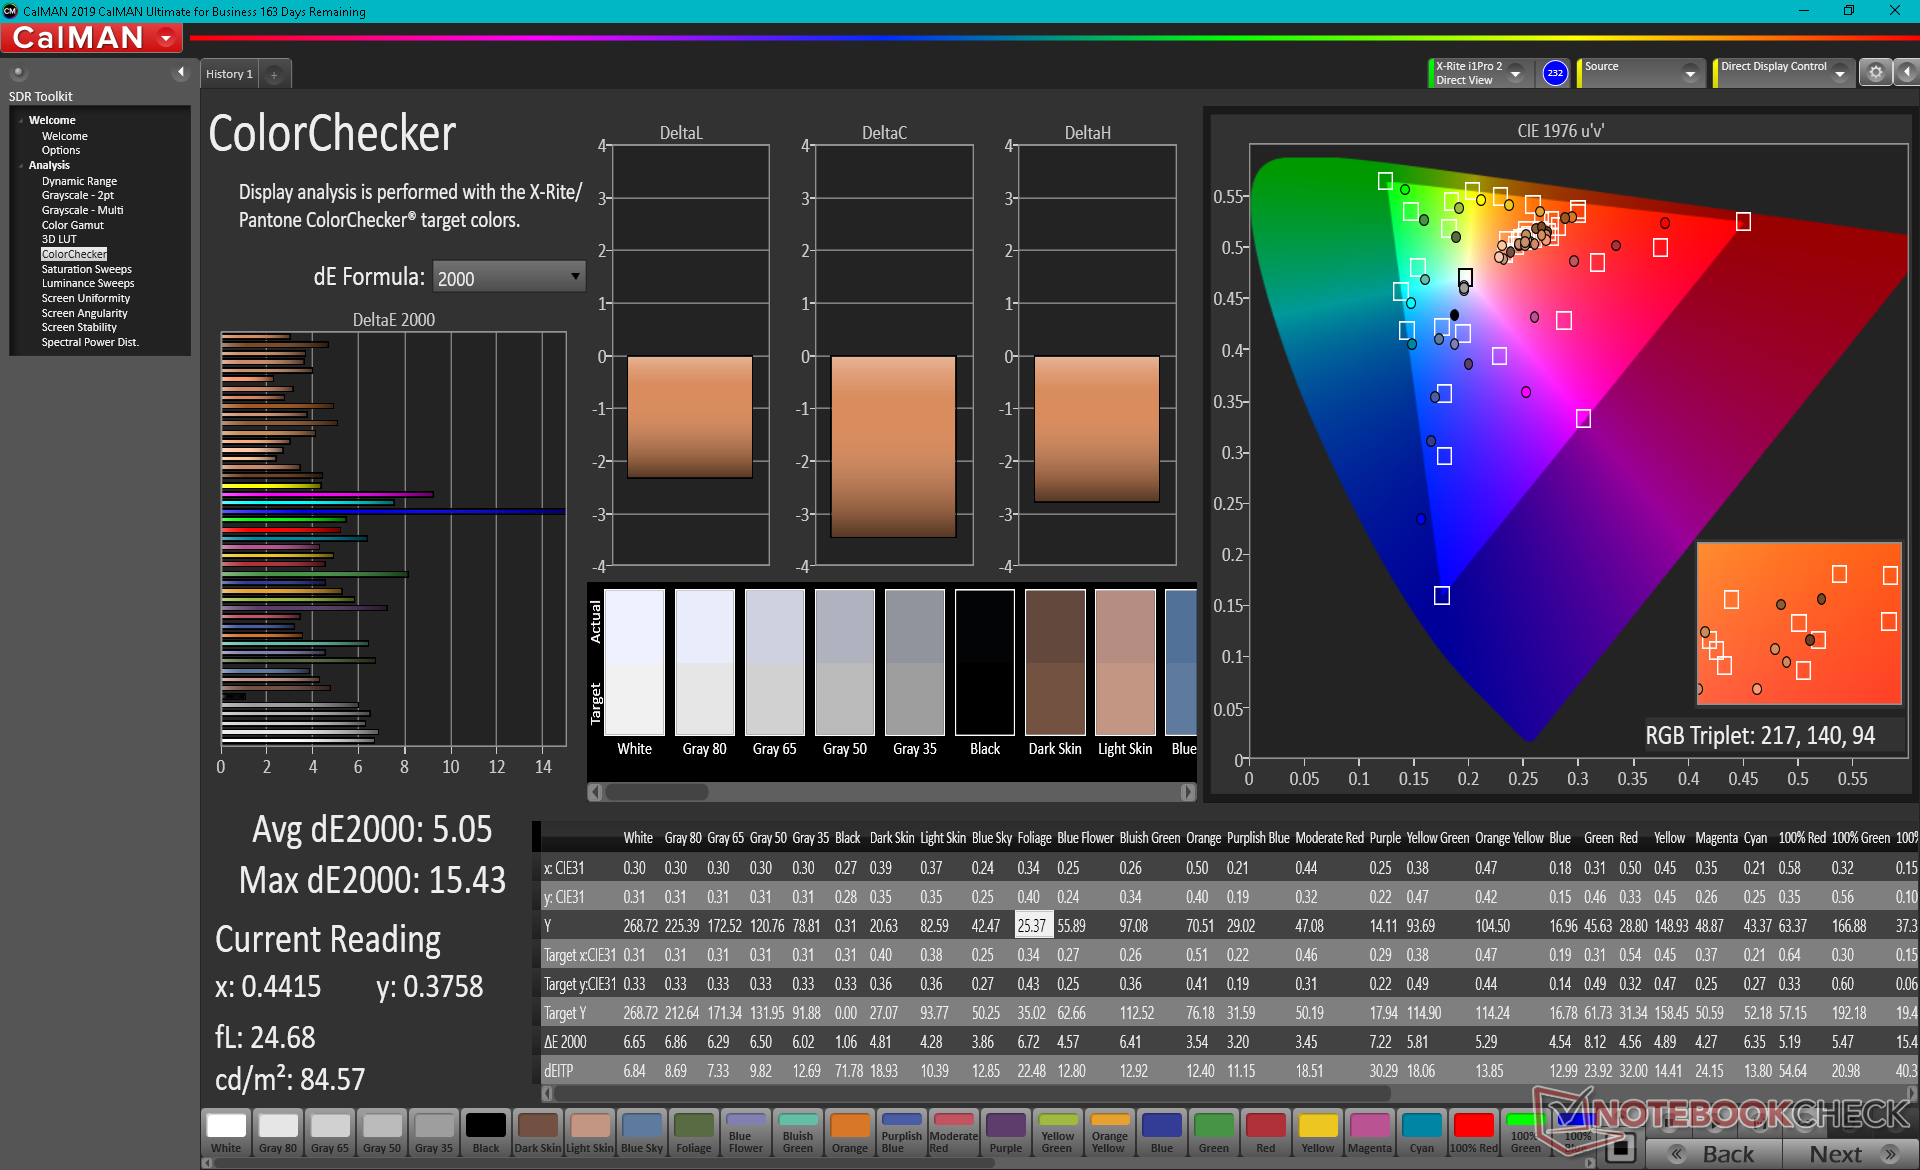
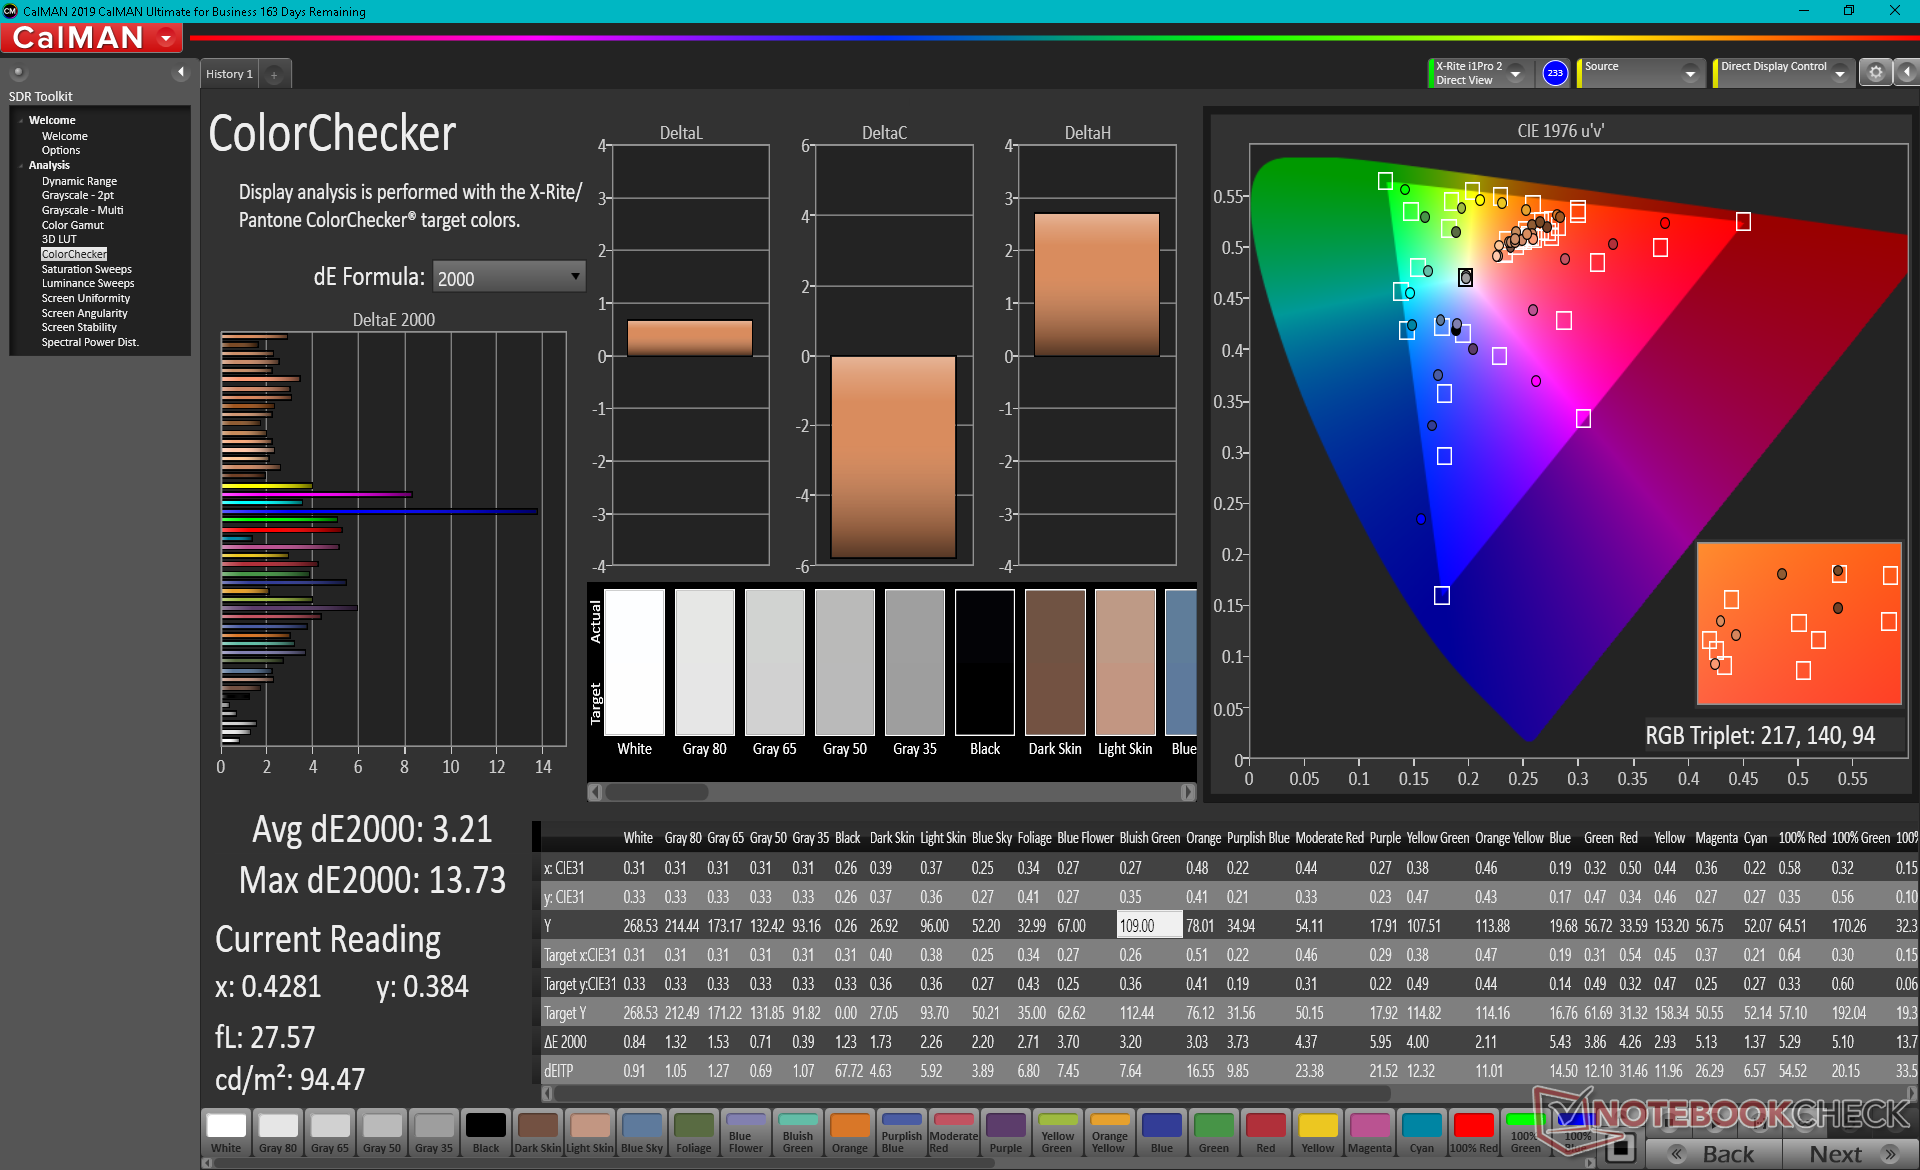
ΔE ColorChecker Calman: 5.05 | ∀{0.5-29.43 Ø4.73}
calibrated: 3.21
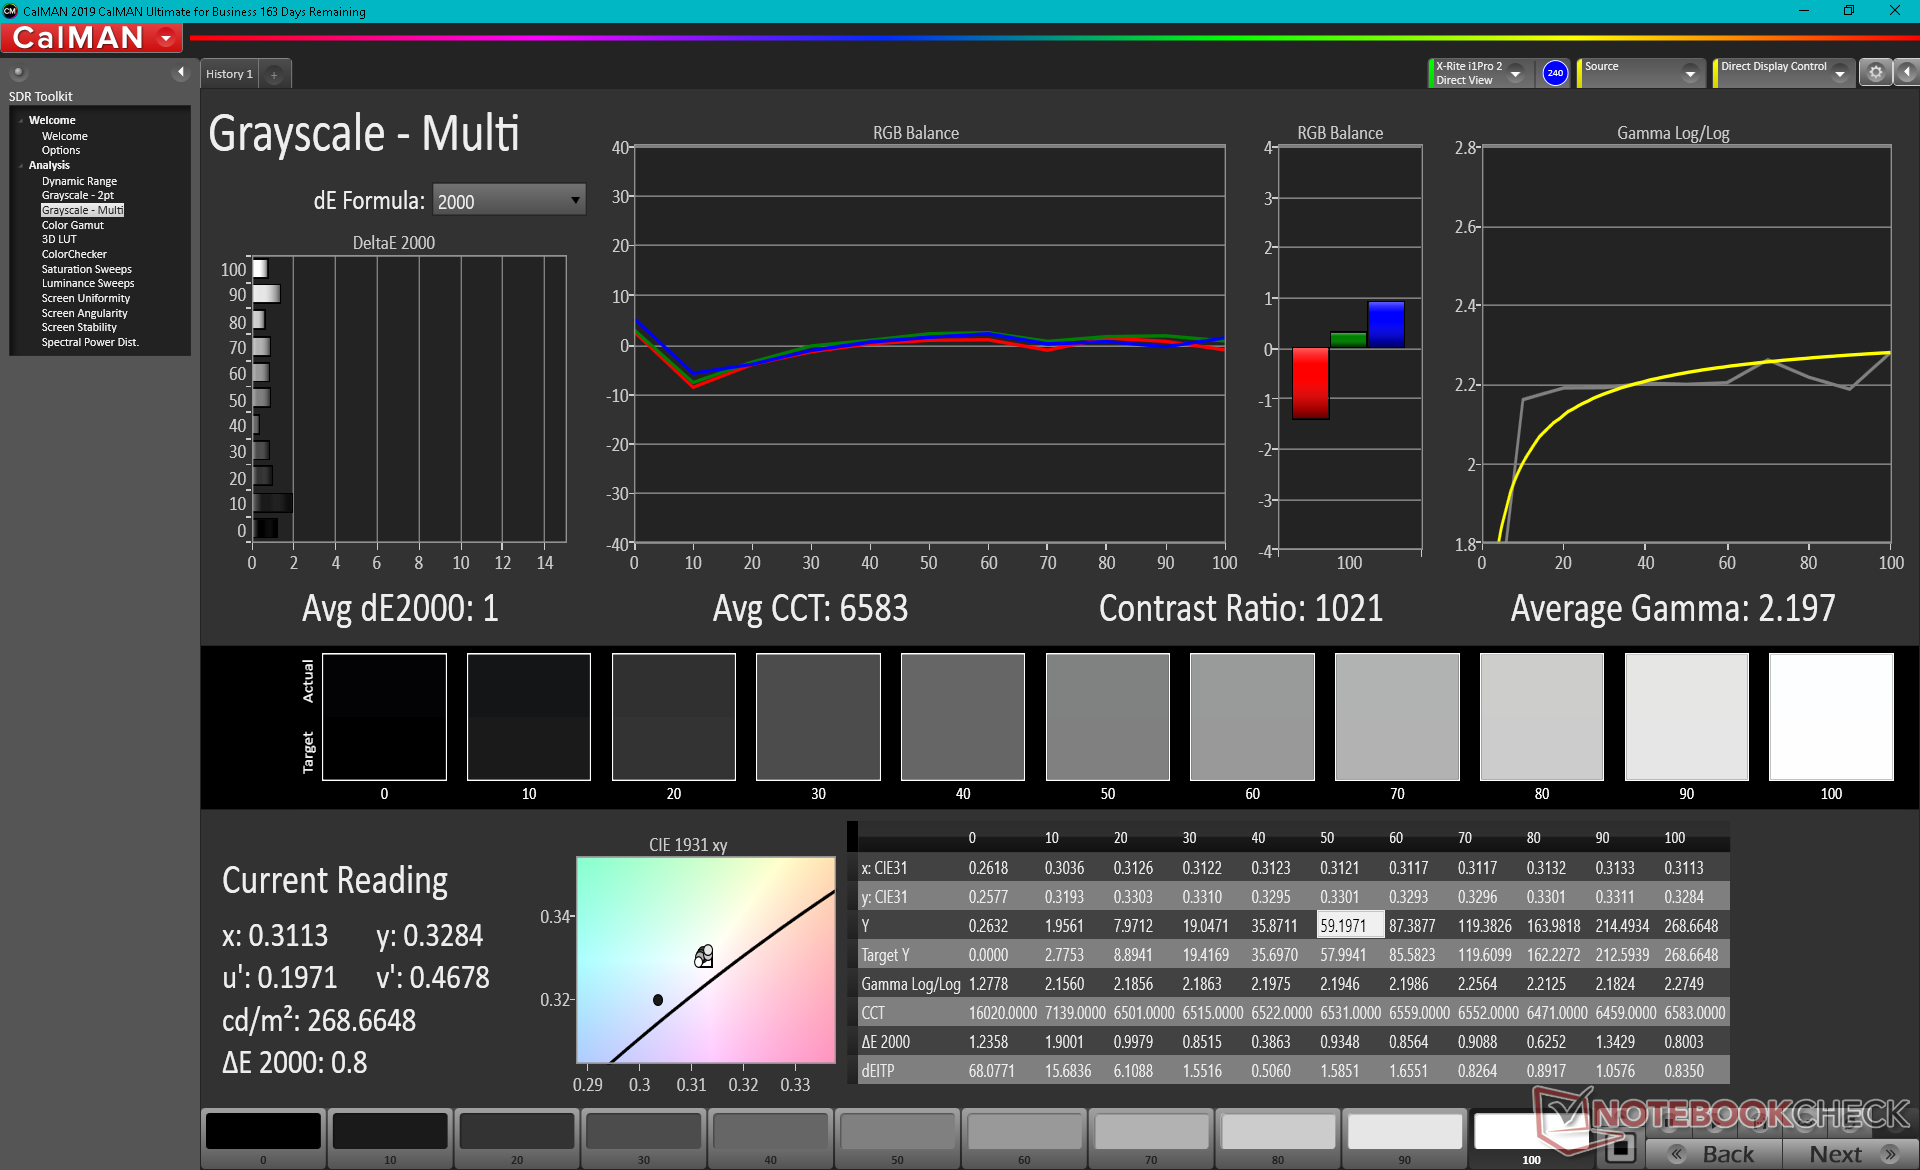
ΔE Greyscale Calman: 5.5 | ∀{0.09-98 Ø4.97}
43.3% AdobeRGB 1998 (Argyll 3D)
62.9% sRGB (Argyll 3D)
41.9% Display P3 (Argyll 3D)
Gamma: 2.35
CCT: 7392 K
| Asus TUF Gaming F15 FX506HM Chi Mei N156HRA-EA1, IPS, 15.6", 1920x1080 | Asus TUF Dash F15 FX516PR LQ156M1JW26 (SHP1532), IPS, 15.6", 1920x1080 | Asus TUF FX505DT-EB73 Panda LM156LF-GL, IPS, 15.6", 1920x1080 | Razer Blade 15 Base Edition 2021, i7-10750H RTX 3060 BOE NV156FHM-N4K, IPS, 15.6", 1920x1080 | MSI GF65 Thin 10UE AU Optronics B156HAN08.4, IPS, 15.6", 1920x1080 | Lenovo Legion 5 15IMH05H BOE CQ NV156FHM-NX1, IPS, 15.6", 1920x1080 | |
|---|---|---|---|---|---|---|
| Display | 58% | -6% | 50% | -10% | -7% | |
| Display P3 Coverage (%) | 41.9 | 66.9 60% | 39.56 -6% | 64.3 53% | 37.65 -10% | 38.8 -7% |
| sRGB Coverage (%) | 62.9 | 98.1 56% | 59.5 -5% | 91.8 46% | 56.3 -10% | 57.8 -8% |
| AdobeRGB 1998 Coverage (%) | 43.3 | 67.9 57% | 40.91 -6% | 65.5 51% | 38.9 -10% | 40.09 -7% |
| Response Times | 56% | -18% | 62% | -38% | 15% | |
| Response Time Grey 50% / Grey 80% * (ms) | 28.4 ? | 12 ? 58% | 30.4 ? -7% | 8.8 ? 69% | 36.8 ? -30% | 26 ? 8% |
| Response Time Black / White * (ms) | 21.6 ? | 10 ? 54% | 27.6 ? -28% | 10 ? 54% | 31.6 ? -46% | 17 ? 21% |
| PWM Frequency (Hz) | 23580 ? | 1000 ? | ||||
| Screen | 35% | -4% | 21% | 11% | 12% | |
| Brightness middle (cd/m²) | 268.3 | 286 7% | 286.2 7% | 317.2 18% | 266.5 -1% | 301 12% |
| Brightness (cd/m²) | 257 | 275 7% | 267 4% | 306 19% | 262 2% | 277 8% |
| Brightness Distribution (%) | 84 | 91 8% | 84 0% | 89 6% | 91 8% | 77 -8% |
| Black Level * (cd/m²) | 0.34 | 0.25 26% | 0.33 3% | 0.31 9% | 0.18 47% | 0.26 24% |
| Contrast (:1) | 789 | 1144 45% | 867 10% | 1023 30% | 1481 88% | 1158 47% |
| Colorchecker dE 2000 * | 5.05 | 2.43 52% | 5.45 -8% | 4.37 13% | 5.33 -6% | 5.12 -1% |
| Colorchecker dE 2000 max. * | 15.43 | 6.33 59% | 18.08 -17% | 6.62 57% | 18.28 -18% | 8.86 43% |
| Colorchecker dE 2000 calibrated * | 3.21 | 0.83 74% | 4.47 -39% | 2.67 17% | 4.36 -36% | 4.88 -52% |
| Greyscale dE 2000 * | 5.5 | 3.5 36% | 5.3 4% | 4.5 18% | 4.5 18% | 3.47 37% |
| Gamma | 2.35 94% | 2.32 95% | 2.1 105% | 2.4 92% | 2.35 94% | 2.37 93% |
| CCT | 7392 88% | 7145 91% | 7679 85% | 7418 88% | 6289 103% | 7062 92% |
| Color Space (Percent of AdobeRGB 1998) (%) | 68 | 37.6 | 59.2 | 35.6 | 37 | |
| Color Space (Percent of sRGB) (%) | 91 | 59.1 | 91.4 | 55.8 | 57 | |
| Media total (Programa/Opciones) | 50% /
43% | -9% /
-6% | 44% /
33% | -12% /
-0% | 7% /
8% |
* ... más pequeño es mejor
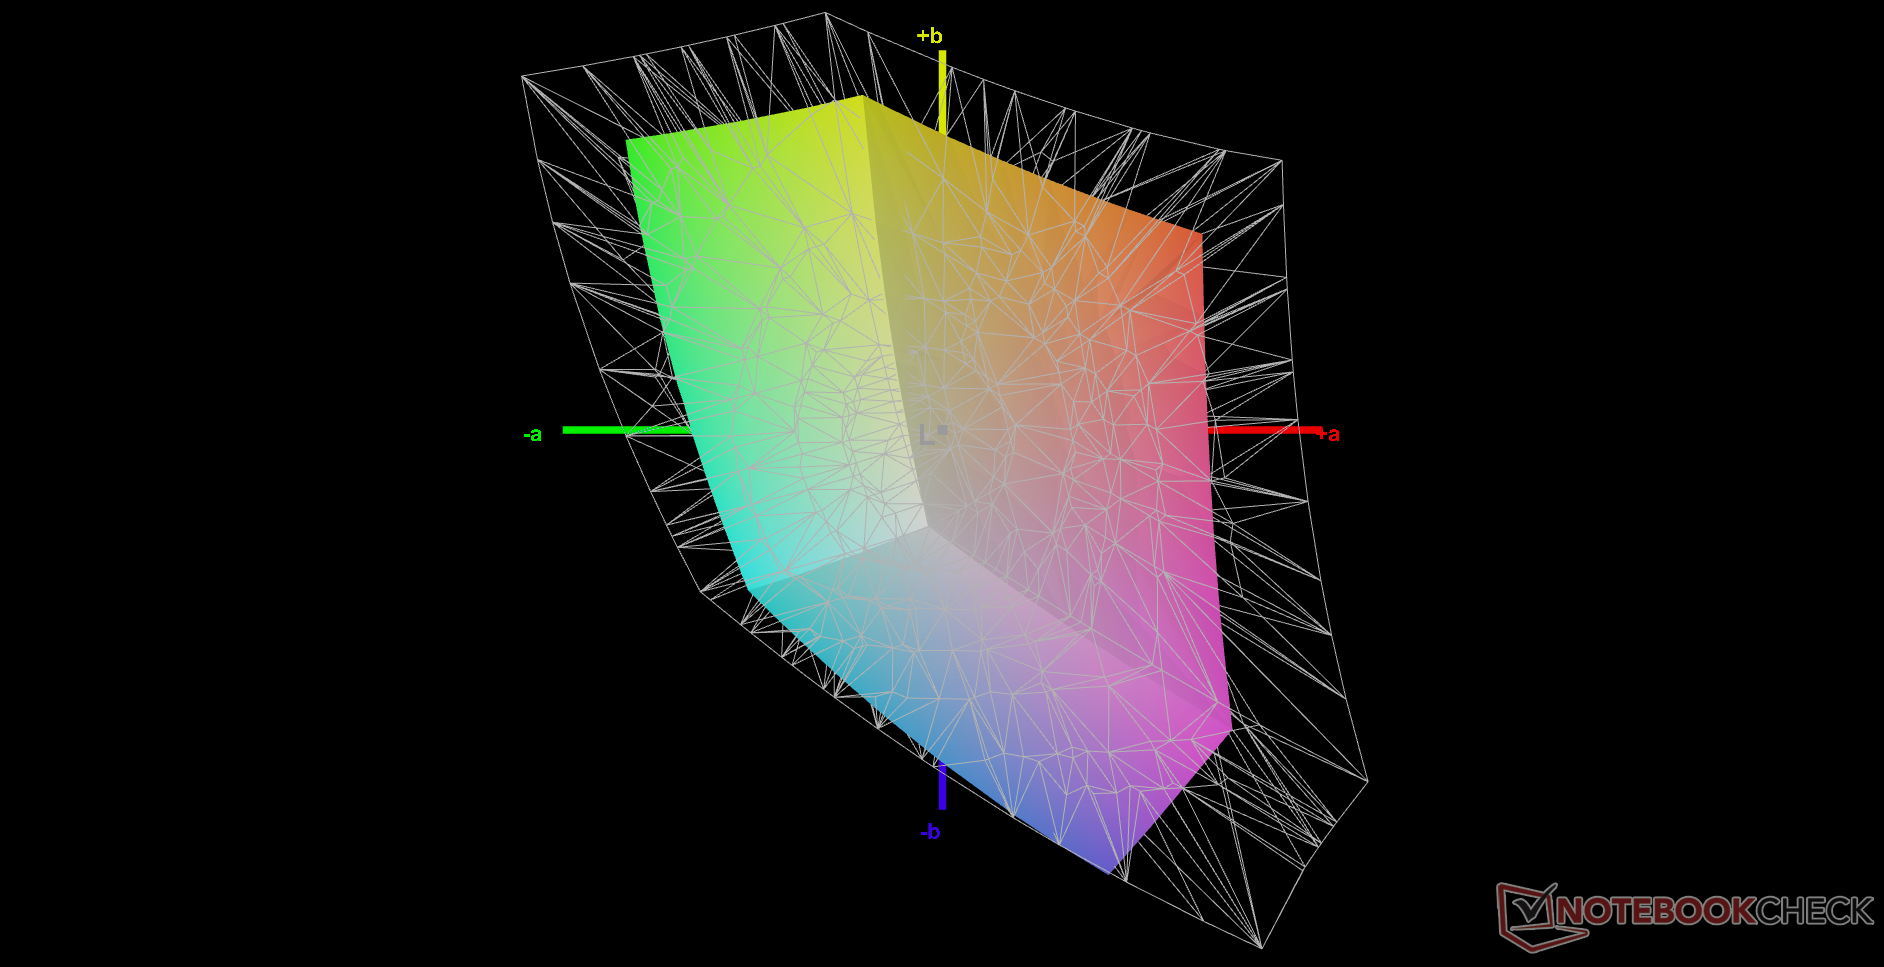
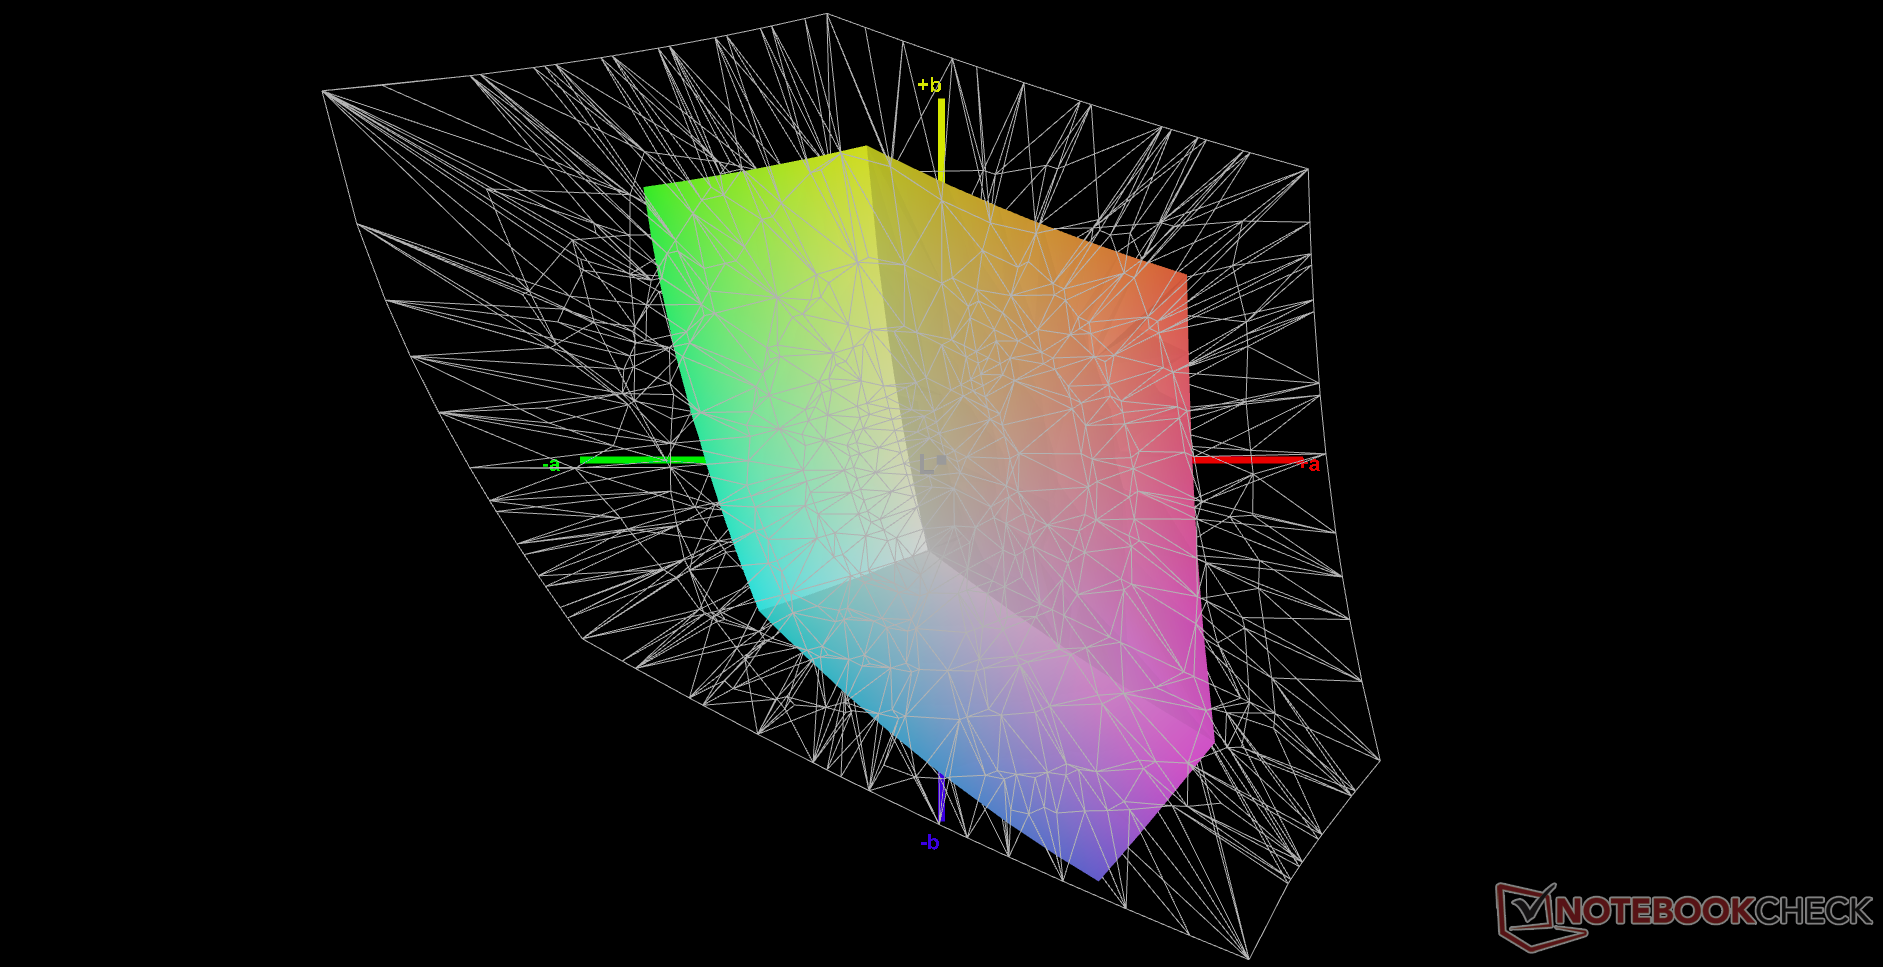
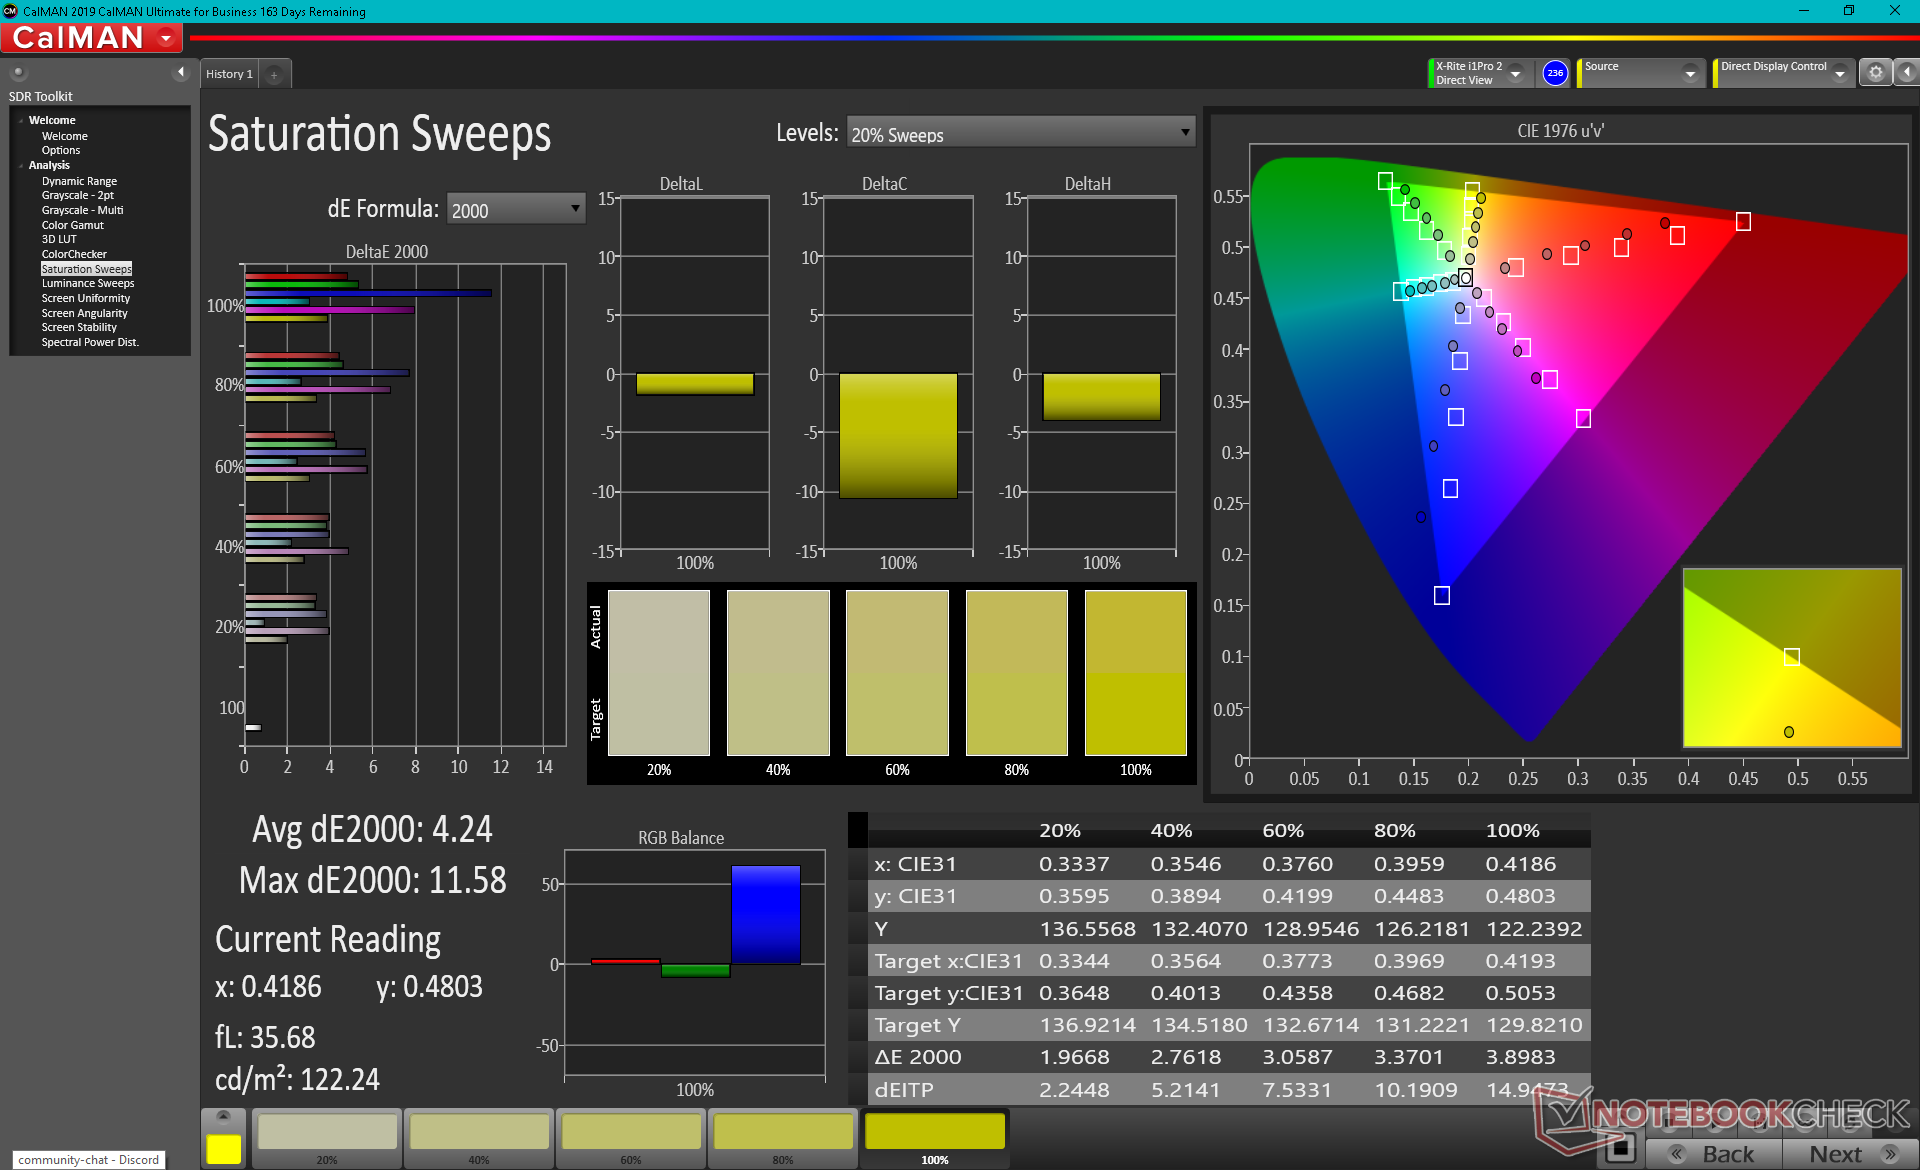
El espacio de color es estrecho, con sólo el 63% de sRGB, para ser indicativo de un panel económico a pesar de la tasa de refresco nativa de 144 Hz. La mayoría de portátiles de juego baratos como el Asus TUF tienden a sacrificar la precisión del color por tiempos de respuesta y frecuencias de refresco más rápidos. Es posible que quieras conectar un monitor externo con más precisión de color si eres un editor gráfico profesional.
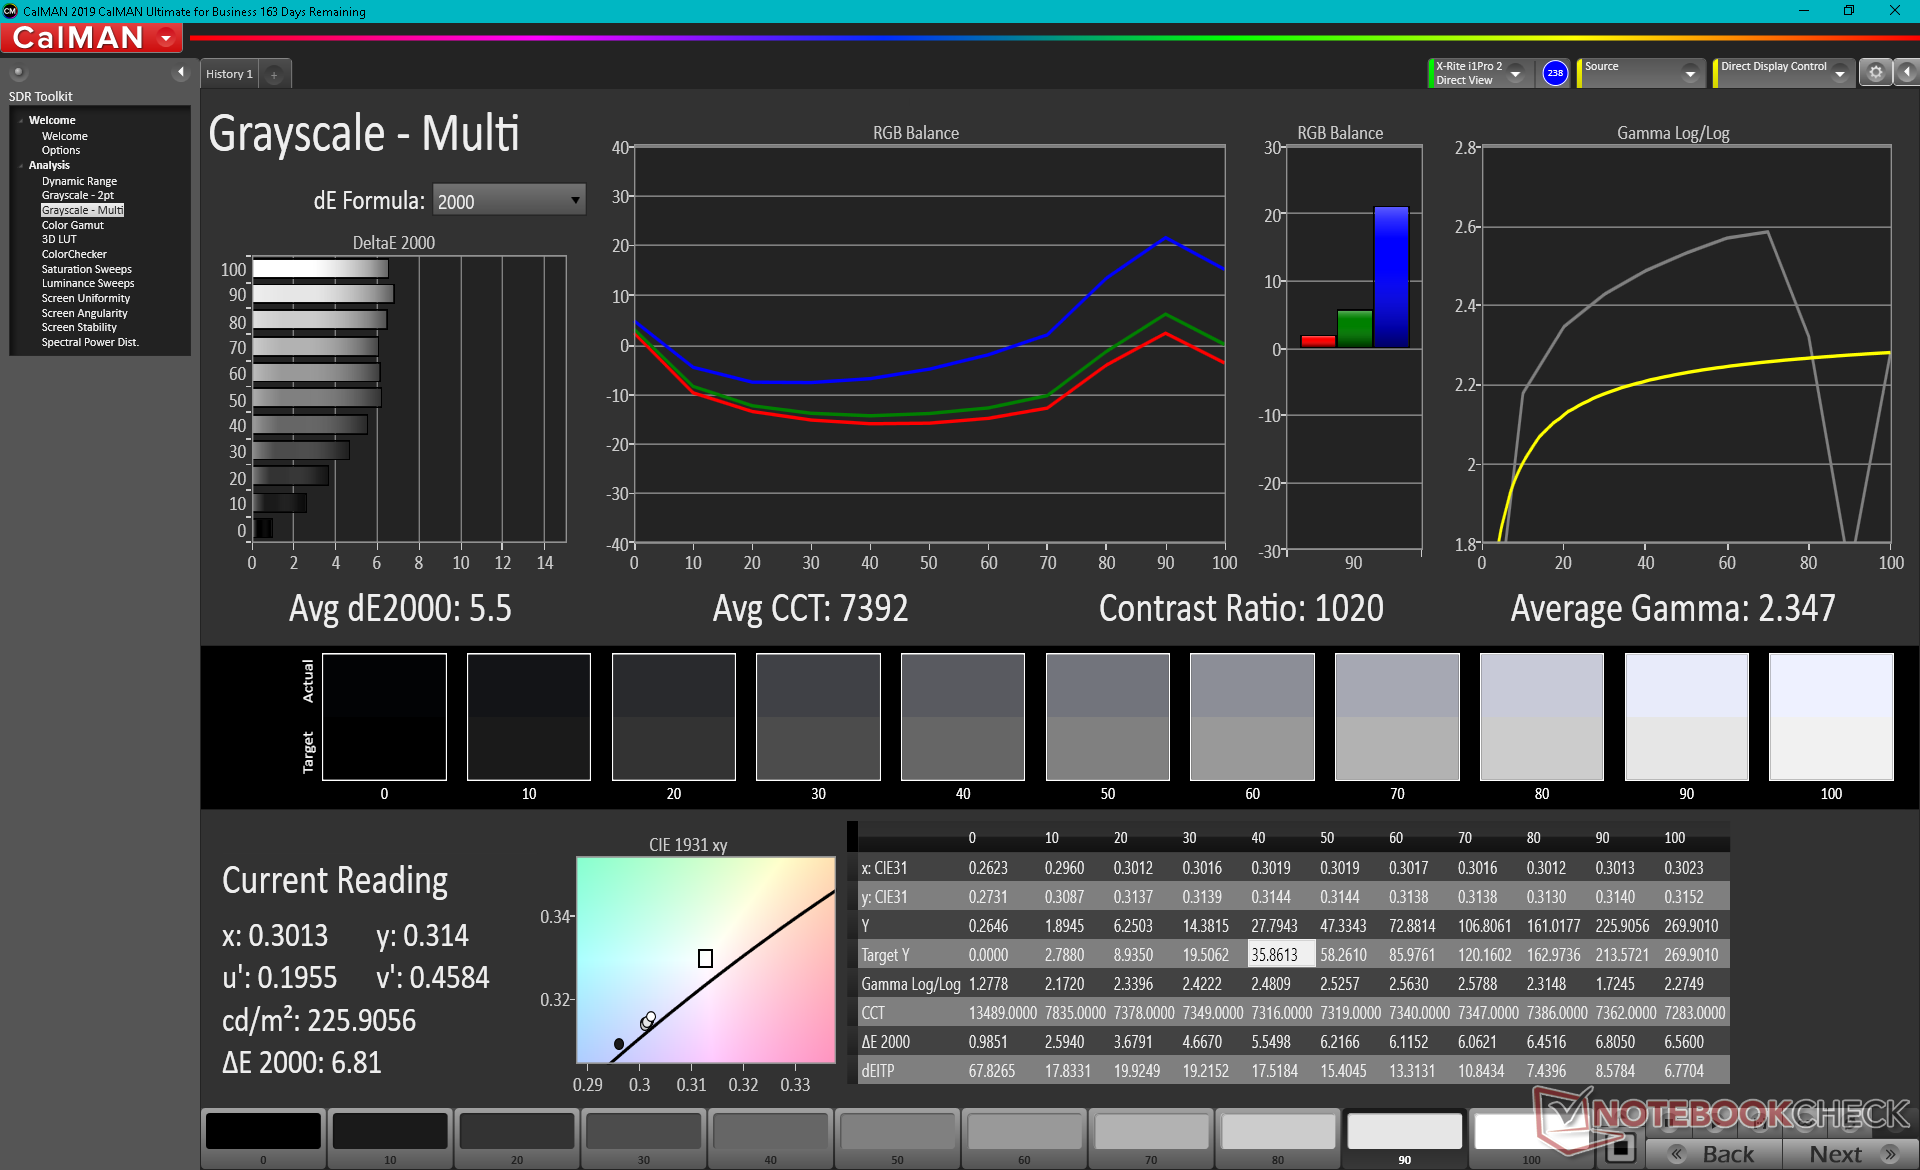
Las mediciones del colorímetro X-Rite muestran una pantalla que necesita ser calibrada, ya que los portátiles de la serie TUF no vienen precalibrados de fábrica. La temperatura del color en particular es demasiado fría, mientras que el azul se representa de forma mucho más inexacta que otros colores. Después de calibrar el panel nosotros mismos, la escala de grises y el equilibrio RGB mejoraron drásticamente, pasando de un DeltaE medio de 5,5 a sólo 1,0. Sin embargo, los colores siguen siendo relativamente imprecisos en los niveles de saturación más altos debido al limitado espacio de color mencionado anteriormente.
Tiempos de respuesta del display
| ↔ Tiempo de respuesta de Negro a Blanco | ||
|---|---|---|
| 21.6 ms ... subida ↗ y bajada ↘ combinada | ↗ 11.6 ms subida | 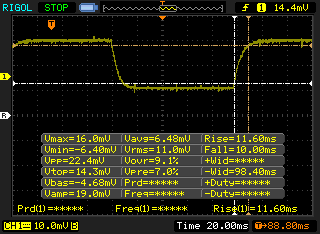 |
| ↘ 10 ms bajada | ||
| La pantalla mostró buenos tiempos de respuesta en nuestros tests pero podría ser demasiado lenta para los jugones competitivos. En comparación, todos los dispositivos de prueba van de ##min### (mínimo) a 240 (máximo) ms. » 48 % de todos los dispositivos son mejores. Eso quiere decir que el tiempo de respuesta es similar al dispositivo testado medio (19.9 ms). | ||
| ↔ Tiempo de respuesta 50% Gris a 80% Gris | ||
| 28.4 ms ... subida ↗ y bajada ↘ combinada | ↗ 15.6 ms subida | 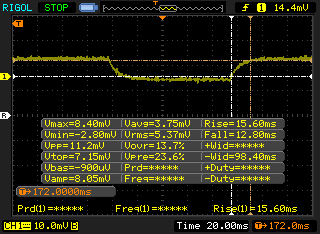 |
| ↘ 12.8 ms bajada | ||
| La pantalla mostró tiempos de respuesta relativamente lentos en nuestros tests pero podría ser demasiado lenta para los jugones. En comparación, todos los dispositivos de prueba van de ##min### (mínimo) a 636 (máximo) ms. » 38 % de todos los dispositivos son mejores. Eso quiere decir que el tiempo de respuesta es similar al dispositivo testado medio (31.1 ms). | ||
Parpadeo de Pantalla / PWM (Pulse-Width Modulation)
| Parpadeo de Pantalla / PWM no detectado | 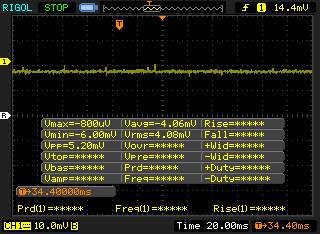 | ||
Comparación: 52 % de todos los dispositivos testados no usaron PWM para atenuar el display. Si se usó, medimos una media de 7798 (mínimo: 5 - máxmo: 343500) Hz. | |||
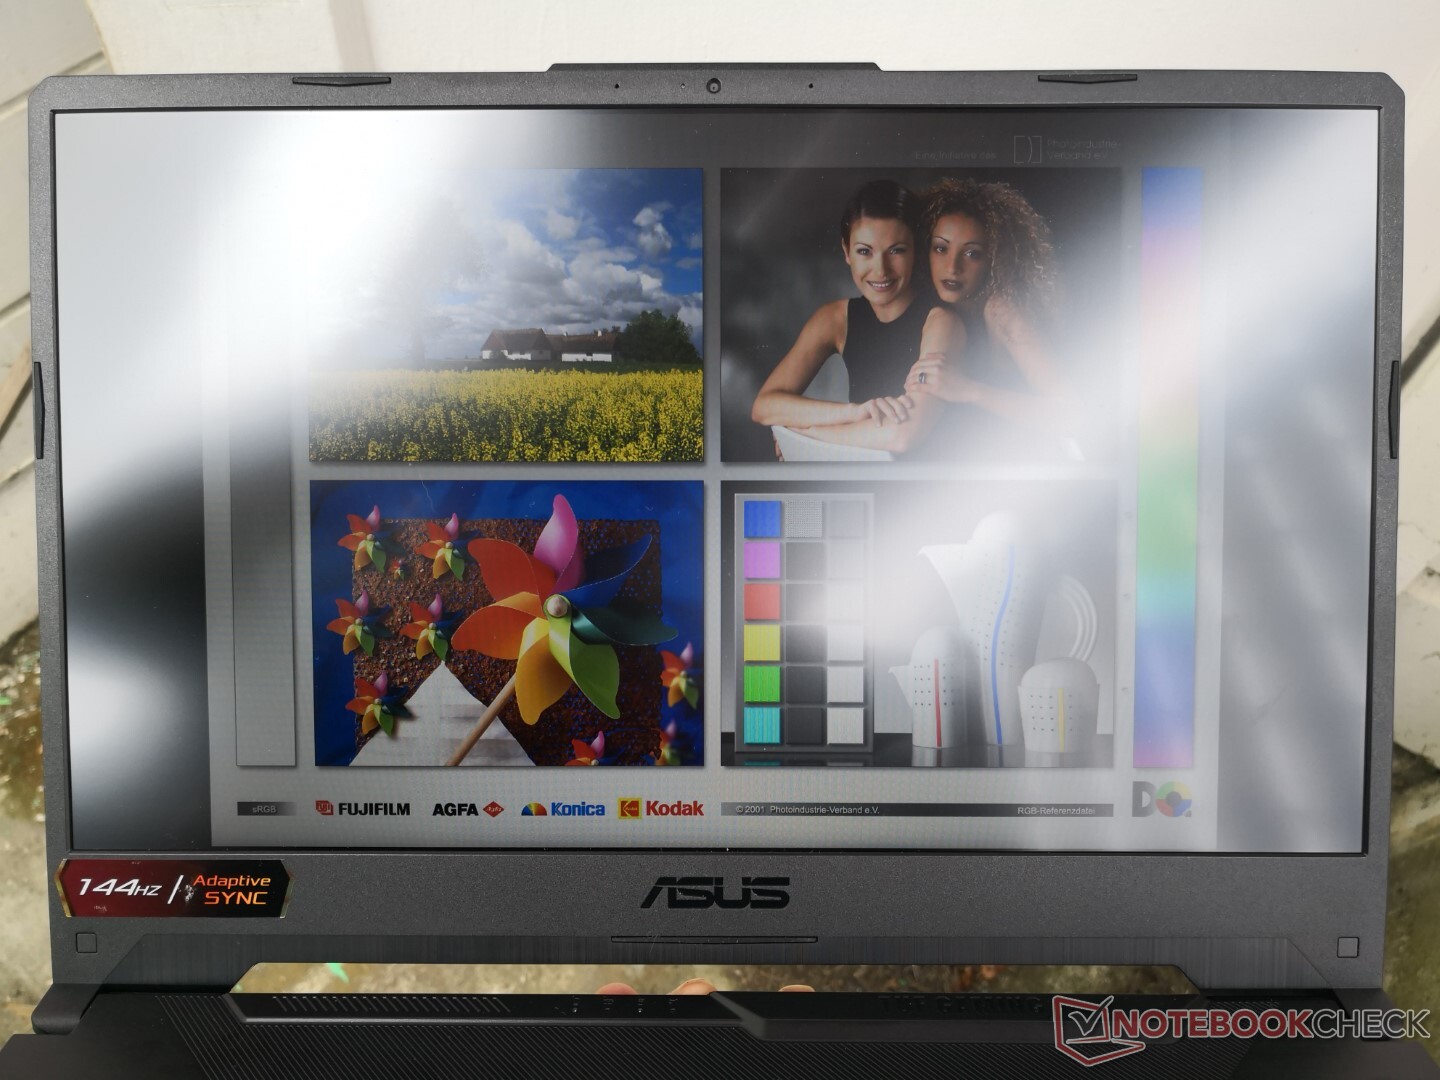
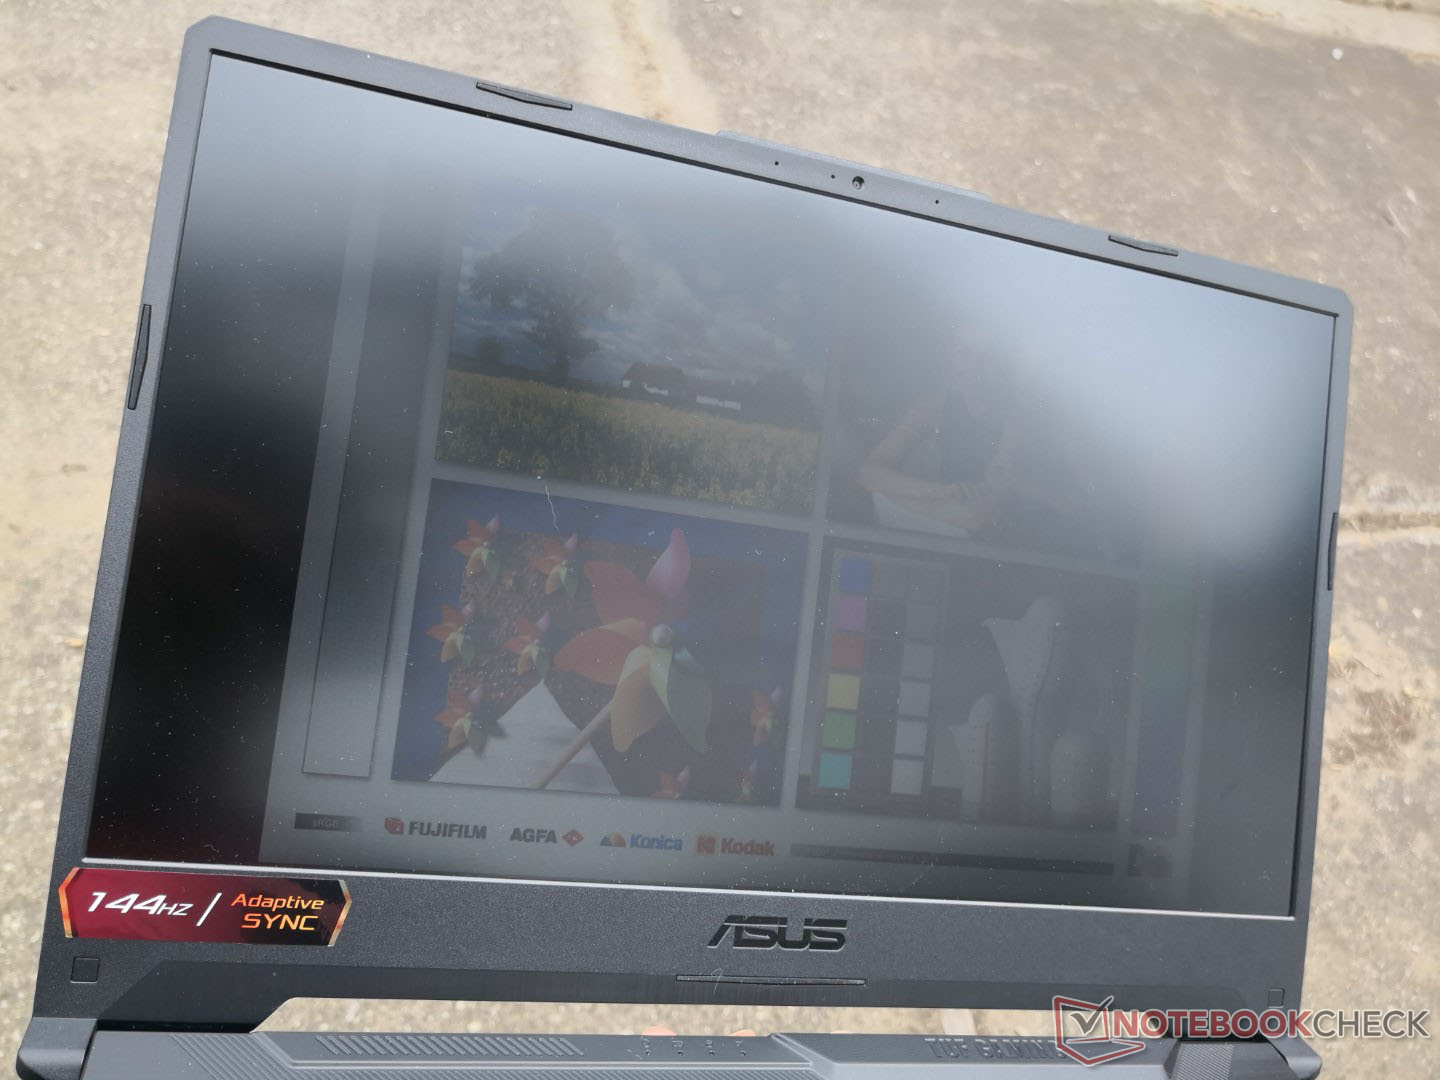
Ángulos de visión: describa los ángulos de visión en la práctica (importante para el uso móvil, uso en el regazo...)
Añade una composición fotográfica para comparar (imagen de referencia NBC, brillo máximo de la pantalla, habitación oscura, misma apertura y velocidad de obturación para todas las imágenes, pasos de 45° en todas las direcciones)
En su caso (ordenadores portátiles de empresa) comprueba la calidad de la imagen en pantallas externas a través de las interfaces disponibles en diferentes resoluciones.

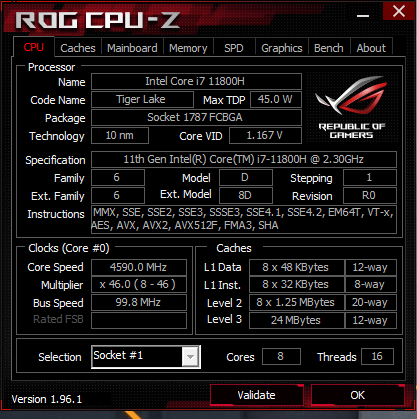
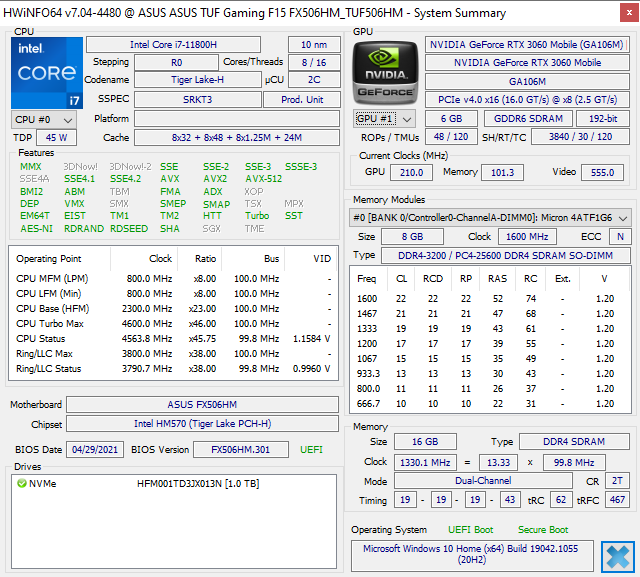
Rendimiento - Core i7 de 11ª generación Tiger Lake-H Debut
Asus ofrece una larga lista de opciones de procesadores de 11ª generación y gráficos Ampere para el TUF Gaming F15 incluyendo el Core i5-11260H, i5-11400Hi7-11800H, y el i9-11900H con la GeForce RTX 3050 (60 W + 15 W DB) o RTX 3060 (90 W + 5 W DB). Estas opciones sustituyen a las CPUs Comet Lake-H de 10ª generación del año pasado y a las opciones GTX 1650 a 1660 Ti. Son compatibles con la barra redimensionable, el Dynamic Boost 2.0 y el Whisper Mode 2.0, y el Optimus 1.0 estándar. Las opciones de AMD aún no están disponibles en esta serie.
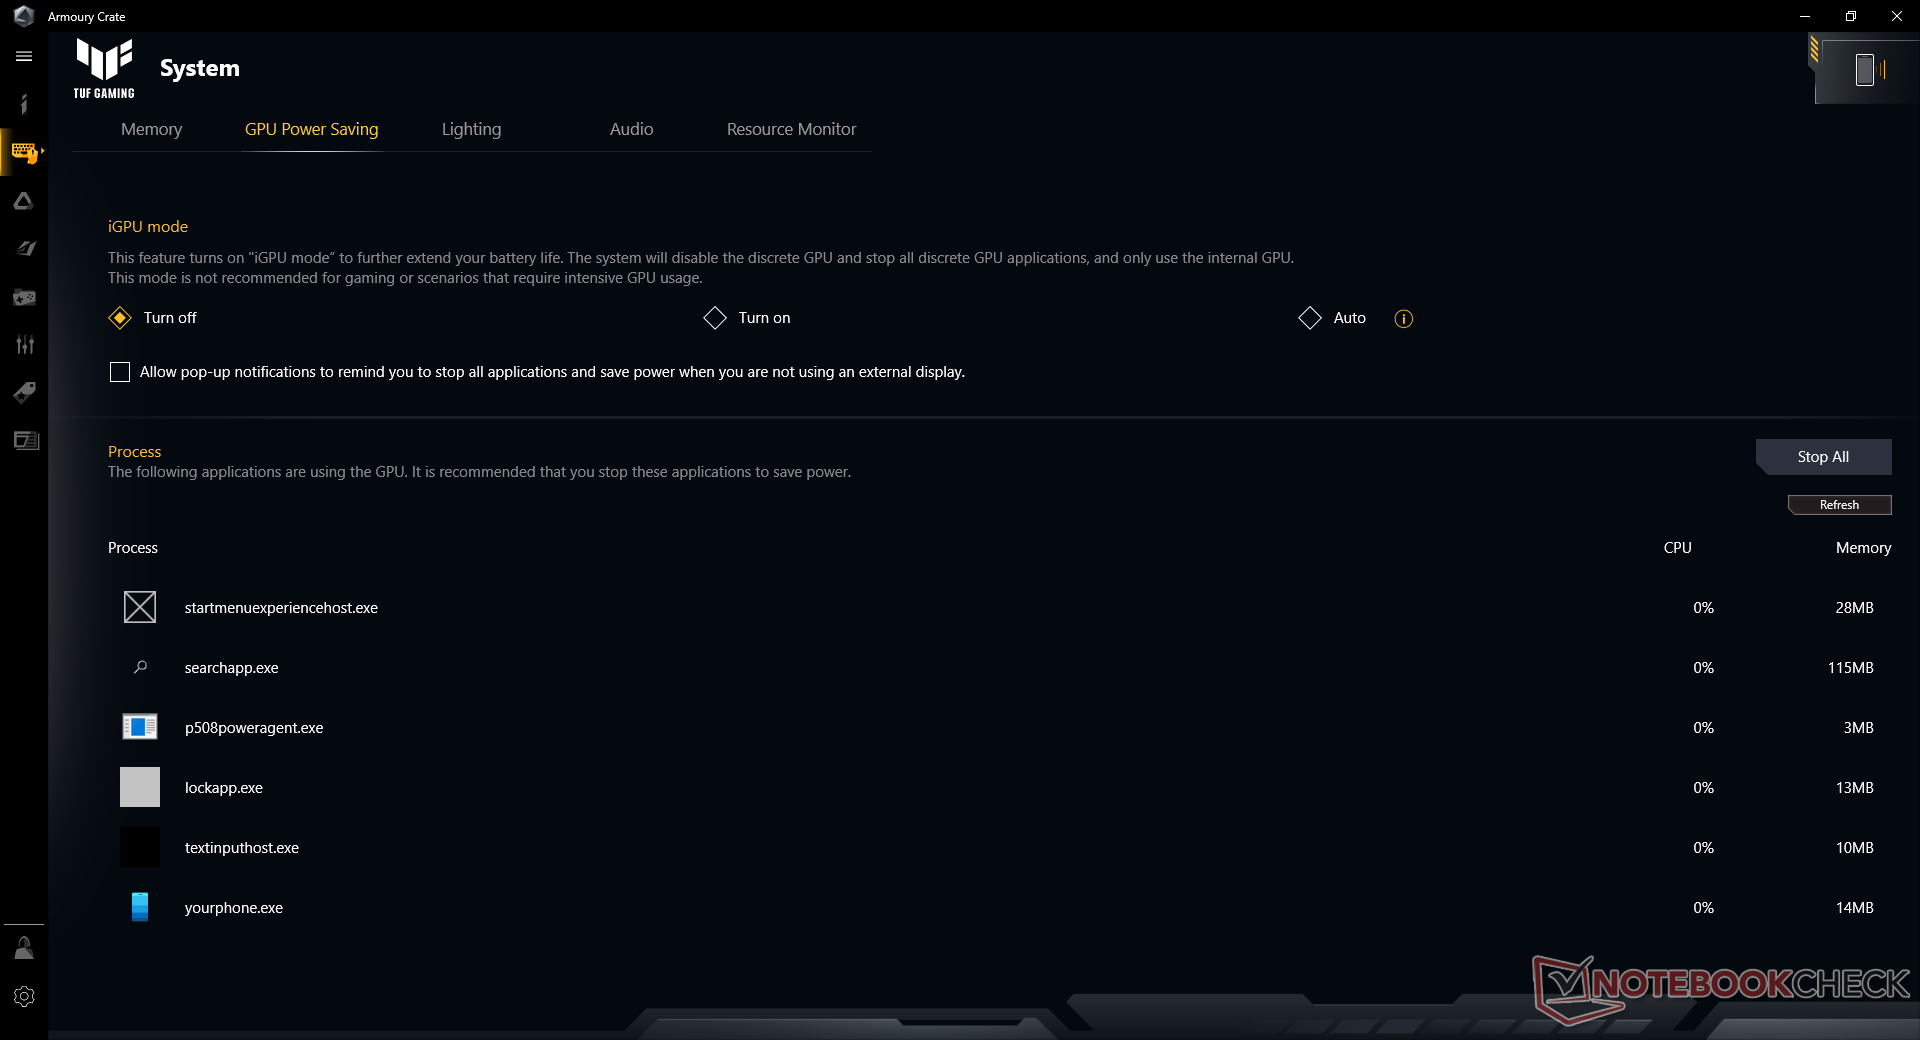
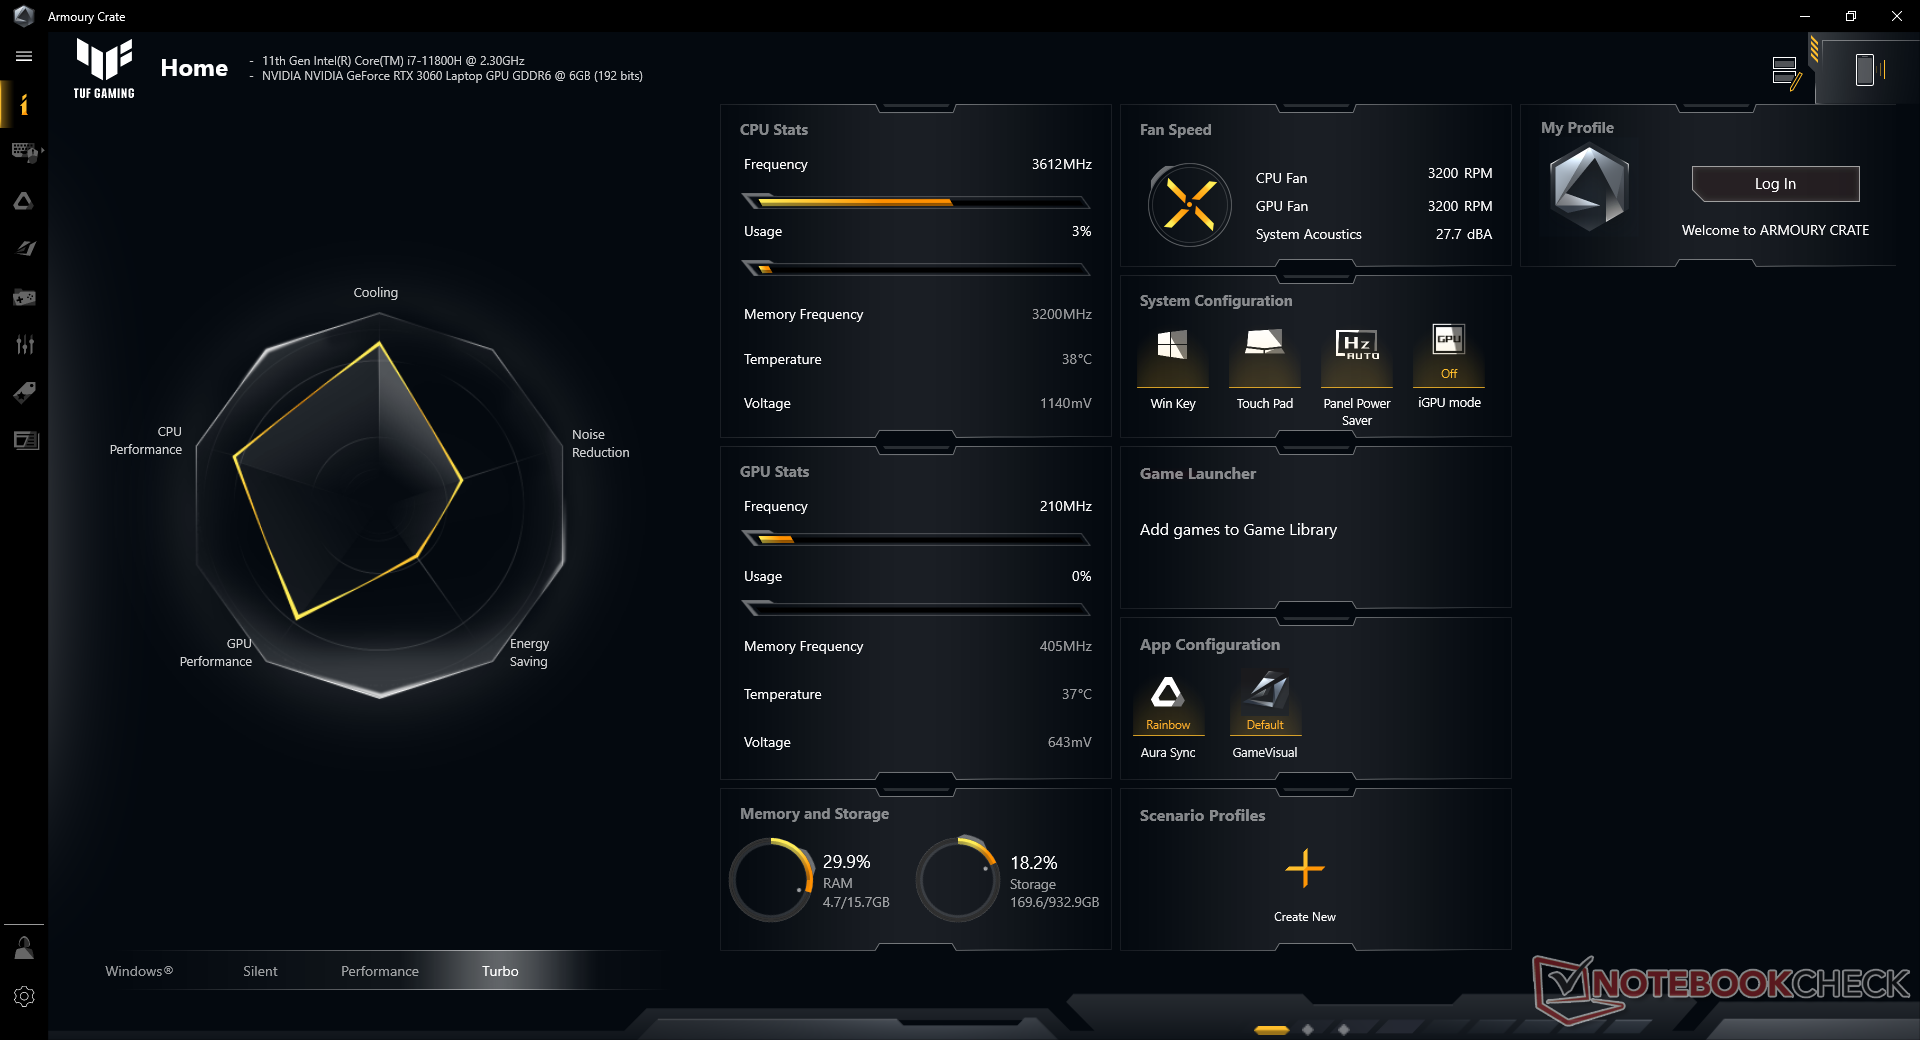
Nuestra unidad se puso en modo Turbo a través de Asus Armoury Crate antes de ejecutar cualquier prueba de rendimiento para obtener las puntuaciones más altas posibles. Los propietarios deberían familiarizarse con el software, ya que sirve como centro de mando para las configuraciones y características específicas de Asus.
Procesador
El rendimiento de la CPU es excelente y comparable al de la competencia Ryzen 9 5900HX o Ryzen 9 5980HS tanto en cargas de trabajo de un solo hilo como de varios hilos. La mejora del rendimiento de generación a generación con respecto al Core i7-10875H del año pasado es considerable, entre un 25 y un 35 por ciento. Si tienes la opción de elegir entre un Core i9-10980HK o el más reciente Core i7-11800Hentonces este último parece ser la mejor y más rápida opción.
Cinebench R23: Multi Core | Single Core
Cinebench R15: CPU Multi 64Bit | CPU Single 64Bit
Blender: v2.79 BMW27 CPU
7-Zip 18.03: 7z b 4 -mmt1 | 7z b 4
Geekbench 5.5: Single-Core | Multi-Core
HWBOT x265 Benchmark v2.2: 4k Preset
LibreOffice : 20 Documents To PDF
R Benchmark 2.5: Overall mean
| Cinebench R23 / Multi Core | |
| Asus TUF Gaming F15 FX506HM | |
| Asus ROG Strix G15 G513QR | |
| Asus ROG Flow X13 GV301QH | |
| Medio Intel Core i7-11800H (6508 - 14088, n=48) | |
| Aorus 15P XC | |
| Asus TUF Dash F15 FX516PR | |
| Cinebench R23 / Single Core | |
| Asus ROG Flow X13 GV301QH | |
| Asus TUF Gaming F15 FX506HM | |
| Asus TUF Dash F15 FX516PR | |
| Medio Intel Core i7-11800H (1386 - 1522, n=45) | |
| Asus ROG Strix G15 G513QR | |
| Aorus 15P XC | |
* ... más pequeño es mejor
Rendimiento del sistema
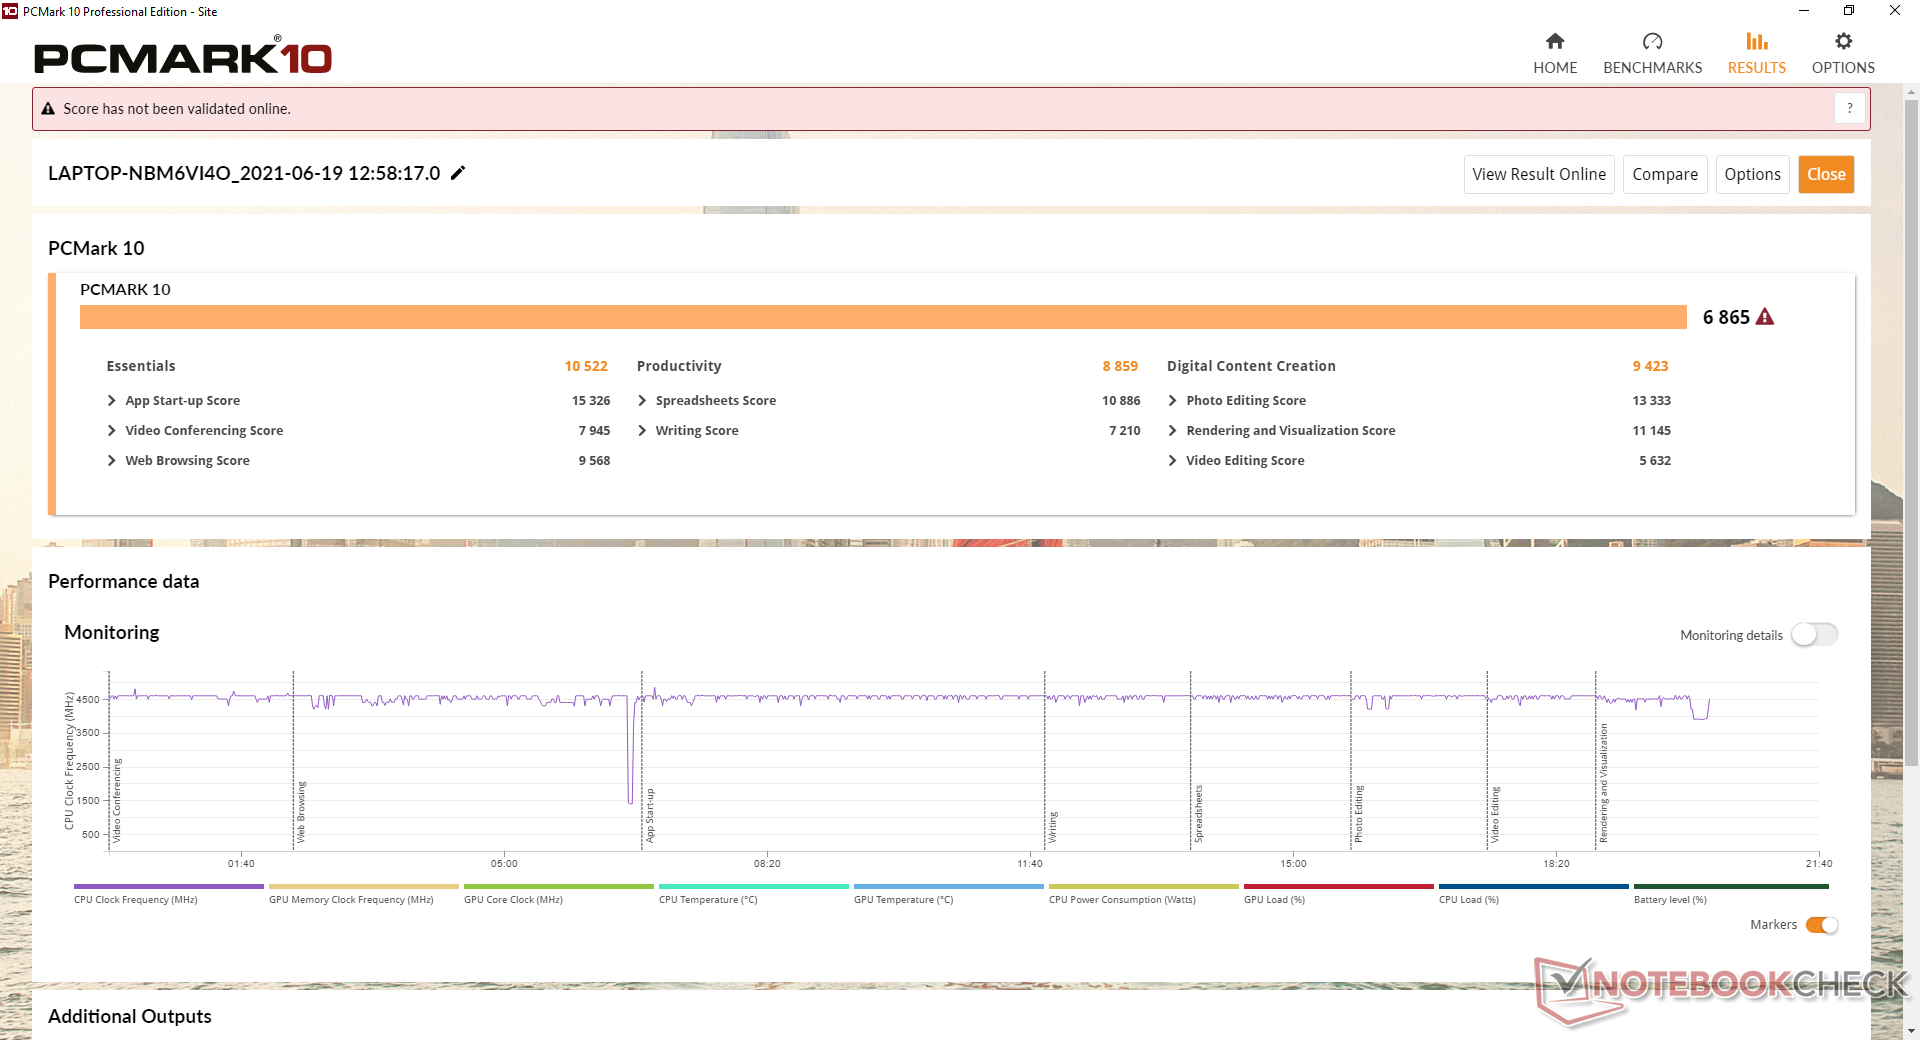
Las puntuaciones de PCMark 10 son sistemáticamente superiores a las del FX505 y también en otros portátiles con CPUs Core de 10ª generación y la misma GPU RTX 3060. De hecho, son algunas de las más altas de nuestra base de datos entre todos los portátiles con esta GPU en particular.
| PCMark 10 / Score | |
| Asus TUF Gaming F15 FX506HM | |
| Medio NVIDIA GeForce RTX 3060 Laptop GPU (5117 - 8156, n=43) | |
| Razer Blade 15 Base Edition 2021, i7-10750H RTX 3060 | |
| Asus TUF Dash F15 FX516PR | |
| MSI GF65 Thin 10UE | |
| Lenovo Legion 5 15IMH05H | |
| Asus TUF FX505DT-EB73 | |
| PCMark 10 / Essentials | |
| Asus TUF Gaming F15 FX506HM | |
| Medio NVIDIA GeForce RTX 3060 Laptop GPU (8945 - 12144, n=43) | |
| Razer Blade 15 Base Edition 2021, i7-10750H RTX 3060 | |
| Asus TUF Dash F15 FX516PR | |
| MSI GF65 Thin 10UE | |
| Lenovo Legion 5 15IMH05H | |
| Asus TUF FX505DT-EB73 | |
| PCMark 10 / Productivity | |
| Asus TUF Dash F15 FX516PR | |
| Medio NVIDIA GeForce RTX 3060 Laptop GPU (6161 - 10486, n=43) | |
| Asus TUF Gaming F15 FX506HM | |
| Razer Blade 15 Base Edition 2021, i7-10750H RTX 3060 | |
| Lenovo Legion 5 15IMH05H | |
| MSI GF65 Thin 10UE | |
| Asus TUF FX505DT-EB73 | |
| PCMark 10 / Digital Content Creation | |
| Asus TUF Gaming F15 FX506HM | |
| Medio NVIDIA GeForce RTX 3060 Laptop GPU (6003 - 12554, n=43) | |
| Razer Blade 15 Base Edition 2021, i7-10750H RTX 3060 | |
| Asus TUF Dash F15 FX516PR | |
| MSI GF65 Thin 10UE | |
| Asus TUF FX505DT-EB73 | |
| Lenovo Legion 5 15IMH05H | |
| PCMark 10 Score | 6865 puntos | |
ayuda | ||
Latencia del CPD
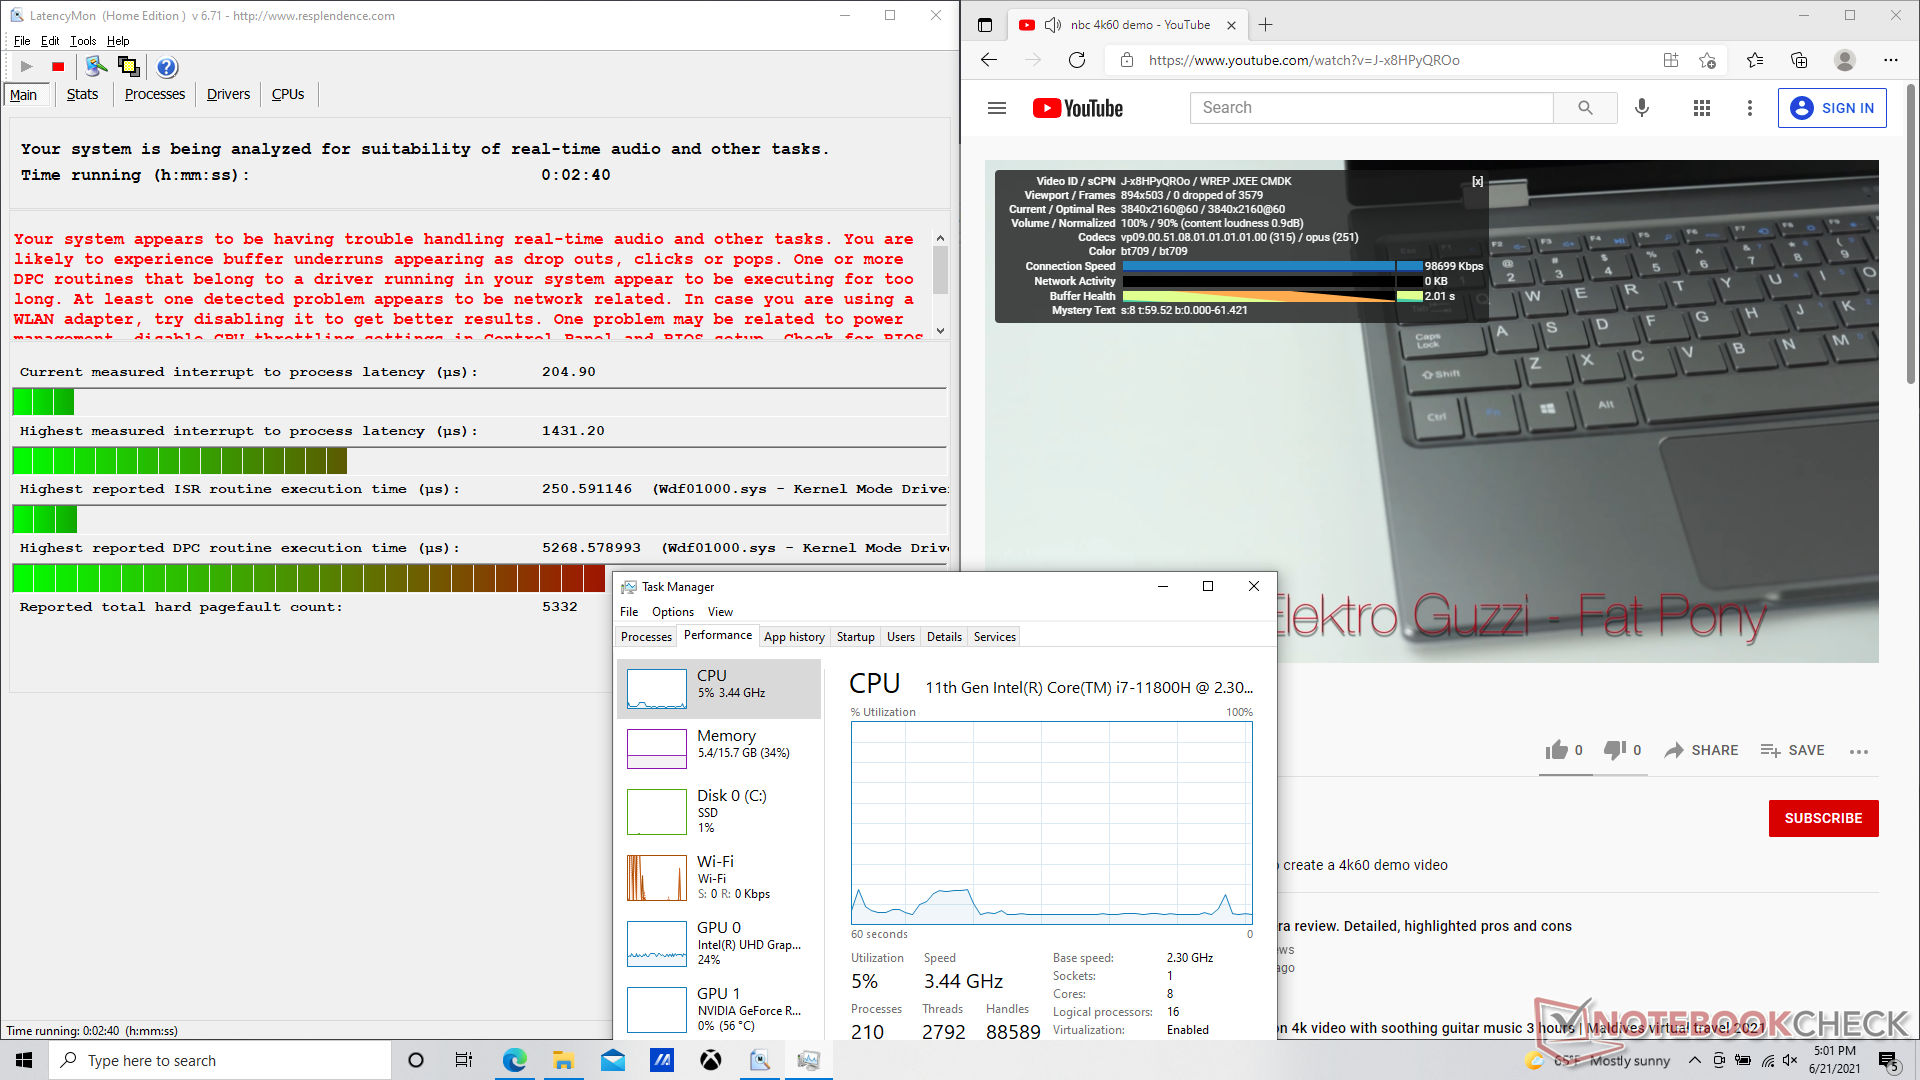
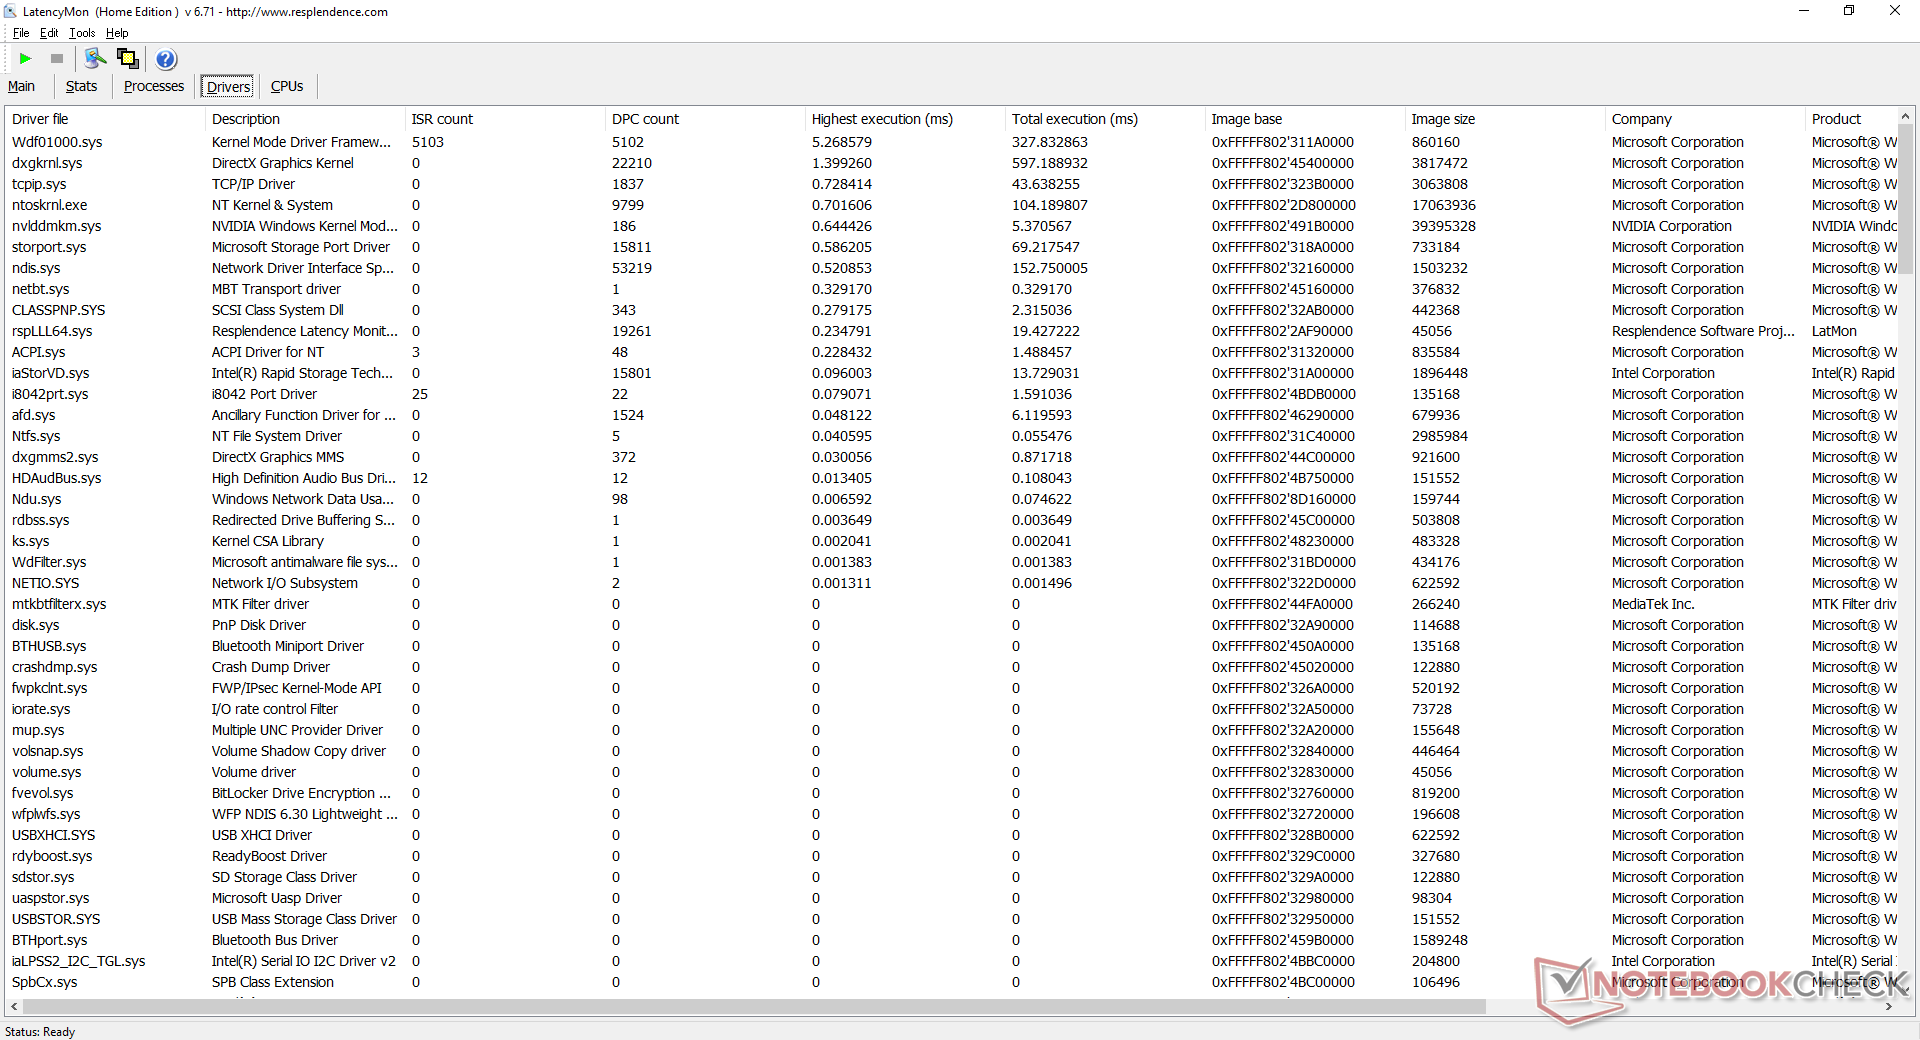
LatencyMon muestra problemas de latencia del CPD al abrir varias pestañas en nuestra página web. La reproducción de vídeo 4K a 60 FPS es por lo demás fluida y sin caídas de frames. La utilización de la CPU y la iGPU es muy baja, con apenas un 5% y un 24% respectivamente.
| DPC Latencies / LatencyMon - interrupt to process latency (max), Web, Youtube, Prime95 | |
| Asus TUF Gaming F15 FX506HM | |
| Asus TUF Dash F15 FX516PR | |
| MSI GF65 Thin 10UE | |
| Lenovo Legion 5 15IMH05H | |
| Razer Blade 15 Base Edition 2021, i7-10750H RTX 3060 | |
* ... más pequeño es mejor
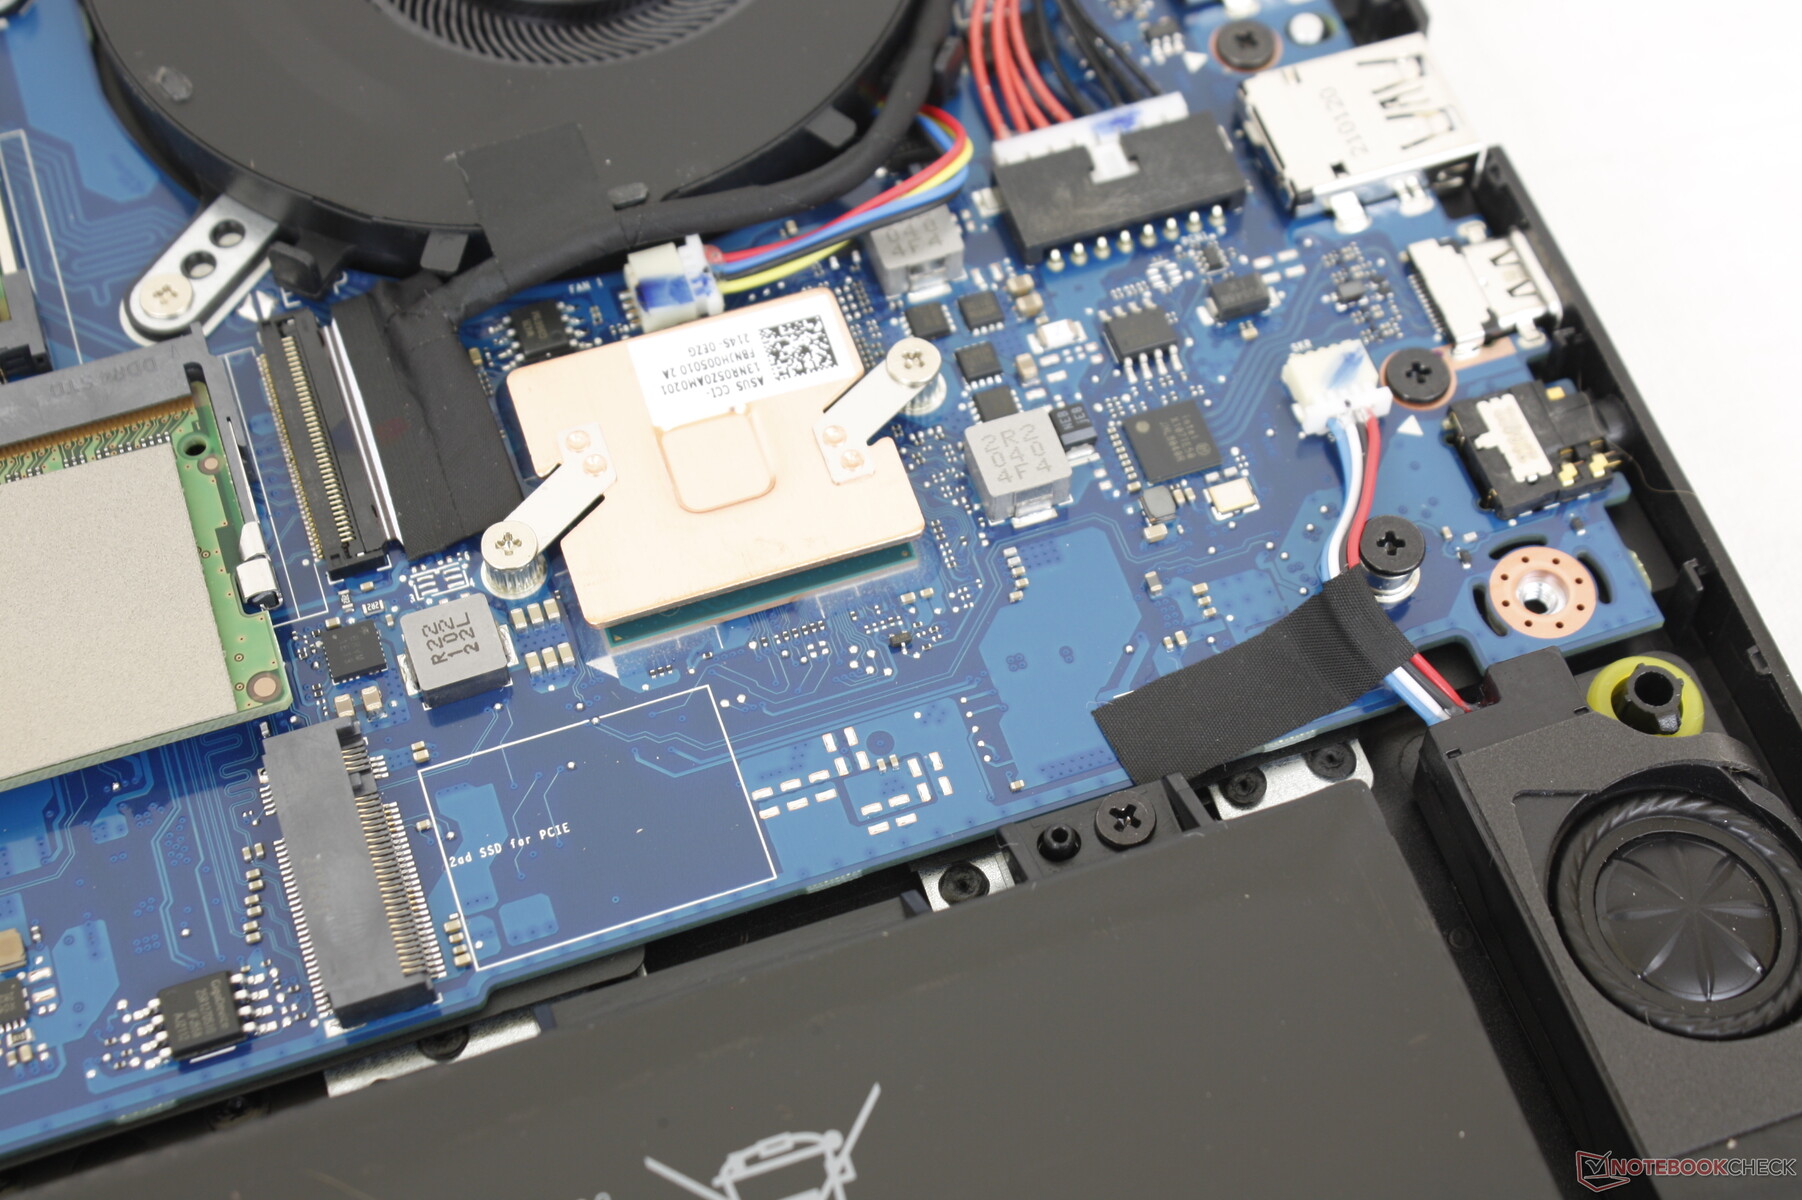
Dispositivos de almacenamiento: ahora con PCIe 4.0
Nuestra unidad de prueba viene con el mismo SSD NVMe SK Hynix HFM001TD3JX013N de 1 TB que se encuentra en el TUF Dash F15. Sin embargo, esto no garantiza que los usuarios obtengan la misma unidad, ya que Asus se abastece de unidades de múltiples proveedores, incluyendo Intel y Samsung. Las tasas de transferencia son excelentes en nuestra unidad con niveles de rendimiento similares al Samsung PM981 de 1 TB.
Asus también ofrece opciones de SSD PCIe 4.0 NVMe para los que quieran aprovechar el ancho de banda más rápido que antes no estaba disponible en los antiguos portátiles Intel 10th gen.
| Asus TUF Gaming F15 FX506HM SK Hynix HFM001TD3JX013N | Asus TUF Dash F15 FX516PR SK Hynix HFM001TD3JX013N | Asus TUF FX505DT-EB73 Intel SSD 660p SSDPEKNW512G8 | MSI GF65 Thin 10UE Samsung SSD PM981 MZVLB1T0HALR | Lenovo Legion 5 15IMH05H Samsung PM991 MZALQ512HALU | |
|---|---|---|---|---|---|
| AS SSD | -25% | -43% | 10% | -39% | |
| Seq Read (MB/s) | 2873 | 2671 -7% | 1019 -65% | 3002 4% | 2012 -30% |
| Seq Write (MB/s) | 1619 | 1501 -7% | 889 -45% | 2420 49% | 1261 -22% |
| 4K Read (MB/s) | 57.5 | 39.65 -31% | 48.22 -16% | 48.46 -16% | 43.66 -24% |
| 4K Write (MB/s) | 149.6 | 69 -54% | 115.5 -23% | 114.3 -24% | 109.3 -27% |
| 4K-64 Read (MB/s) | 1252 | 1209 -3% | 321.5 -74% | 1873 50% | 851 -32% |
| 4K-64 Write (MB/s) | 2196 | 1650 -25% | 787 -64% | 1882 -14% | 780 -64% |
| Access Time Read * (ms) | 0.04 | 0.093 -132% | 0.065 -63% | 0.045 -13% | 0.117 -193% |
| Access Time Write * (ms) | 0.082 | 0.055 33% | 0.047 43% | 0.101 -23% | 0.036 56% |
| Score Read (Points) | 1597 | 1516 -5% | 472 -70% | 2221 39% | 1096 -31% |
| Score Write (Points) | 2508 | 1869 -25% | 992 -60% | 2238 -11% | 1016 -59% |
| Score Total (Points) | 4869 | 4105 -16% | 1717 -65% | 5565 14% | 2643 -46% |
| Copy ISO MB/s (MB/s) | 1583 | 942 -40% | 2421 53% | 1481 -6% | |
| Copy Program MB/s (MB/s) | 964 | 444.5 -54% | 705 -27% | 467.5 -52% | |
| Copy Game MB/s (MB/s) | 943 | 867 -8% | 1490 58% | 734 -22% | |
| CrystalDiskMark 5.2 / 6 | -17% | -38% | -6% | -26% | |
| Write 4K (MB/s) | 168.1 | 129.6 -23% | 137.5 -18% | 157.3 -6% | 145.4 -14% |
| Read 4K (MB/s) | 65.1 | 44.71 -31% | 57 -12% | 46.69 -28% | 51.6 -21% |
| Write Seq (MB/s) | 2124 | 1929 -9% | 984 -54% | 2389 12% | 1007 -53% |
| Read Seq (MB/s) | 2204 | 2035 -8% | 1564 -29% | 2196 0% | 1145 -48% |
| Write 4K Q32T1 (MB/s) | 455.3 | 425.9 -6% | 237.4 -48% | 407.6 -10% | 468.4 3% |
| Read 4K Q32T1 (MB/s) | 465.6 | 433.4 -7% | 340.7 -27% | 519 11% | 528 13% |
| Write Seq Q32T1 (MB/s) | 2911 | 1390 -52% | 959 -67% | 2401 -18% | 1381 -53% |
| Read Seq Q32T1 (MB/s) | 3519 | 3505 0% | 1732 -51% | 3344 -5% | 2291 -35% |
| Media total (Programa/Opciones) | -21% /
-21% | -41% /
-41% | 2% /
4% | -33% /
-35% |
* ... más pequeño es mejor

Disk Throttling: DiskSpd Read Loop, Queue Depth 8
Rendimiento de la GPU - Gráficos TGP GeForce RTX 3060 de 90 W
El rendimiento gráfico está exactamente donde esperamos que esté en relación con otros portátiles con el mismo móvil GeForce RTX 3060 GPU. El cambio a la GTX 1660 Ti o GTX 1650 supondrá para los jugadores un descenso del 20% y el 50% del rendimiento, respectivamente.
El rendimiento en los juegos es excelente con resultados casi idénticos a los del portátil de juego RTX 2070 medio o RTX 2060 de sobremesa.
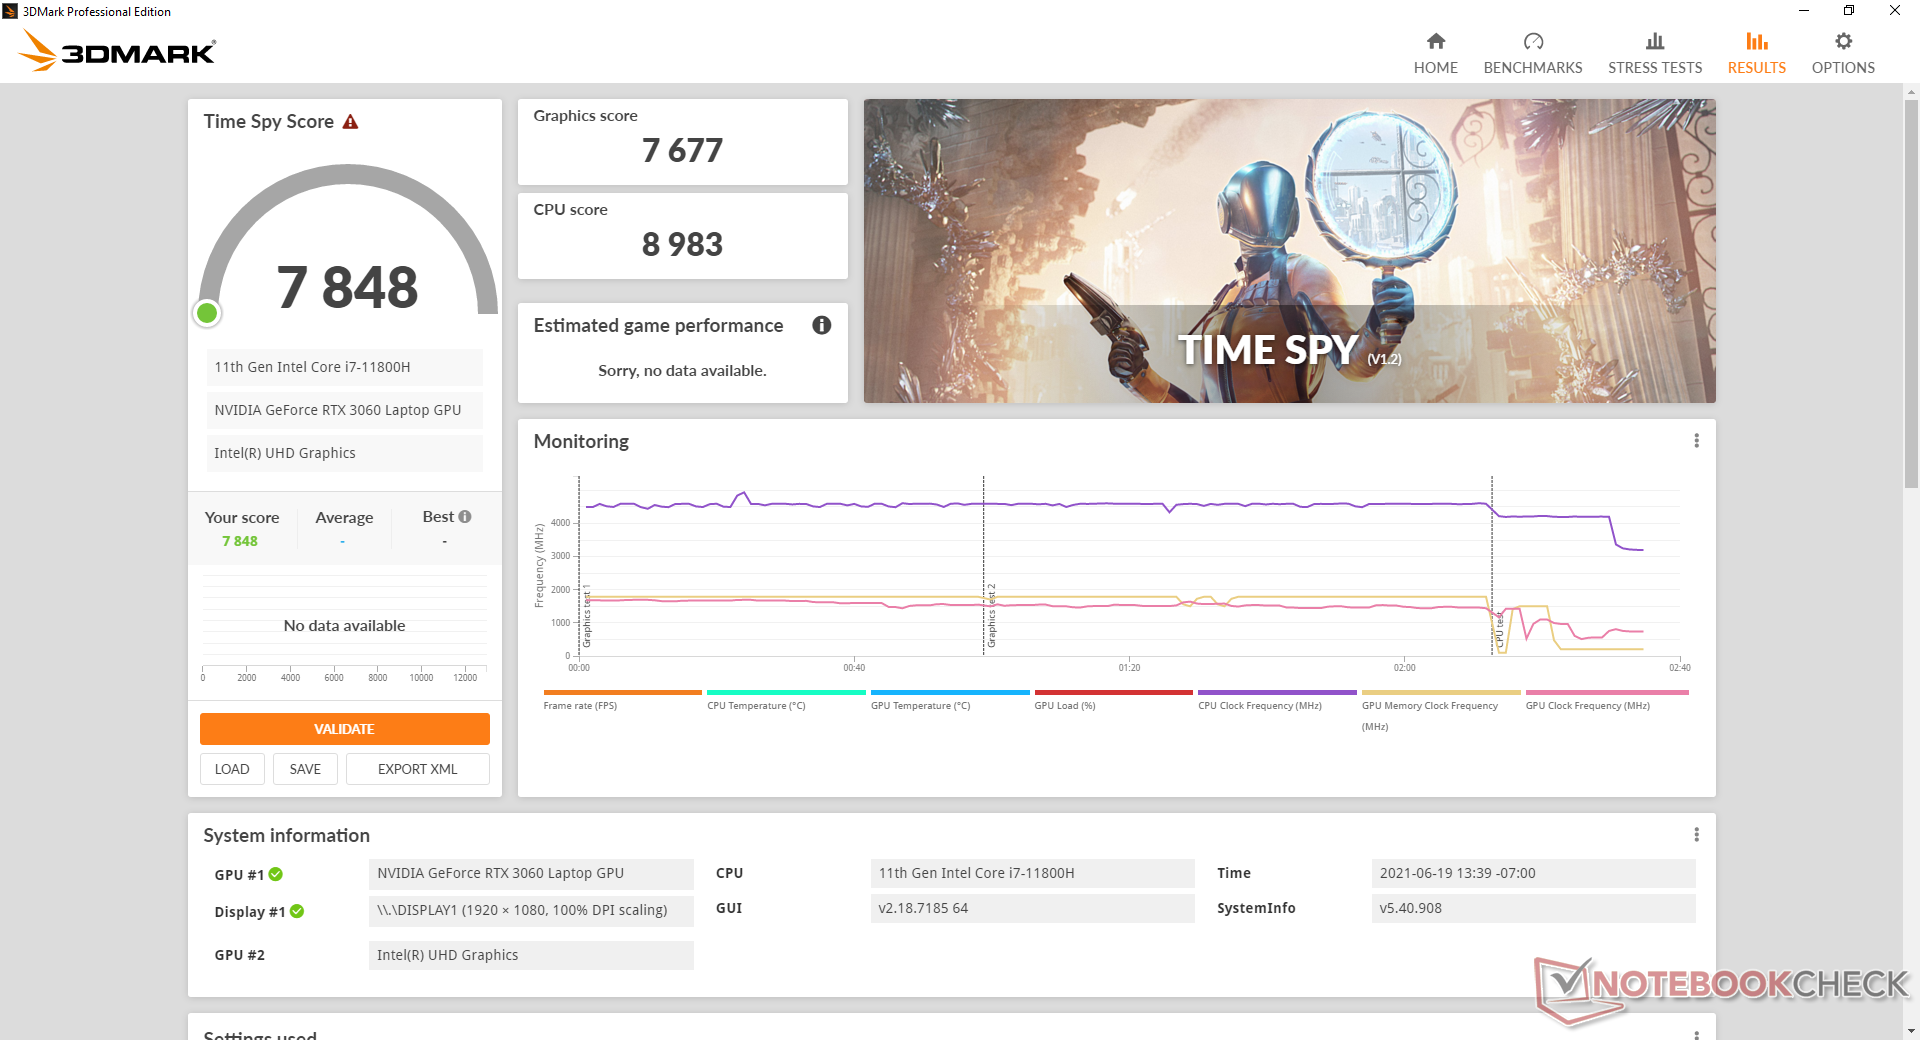
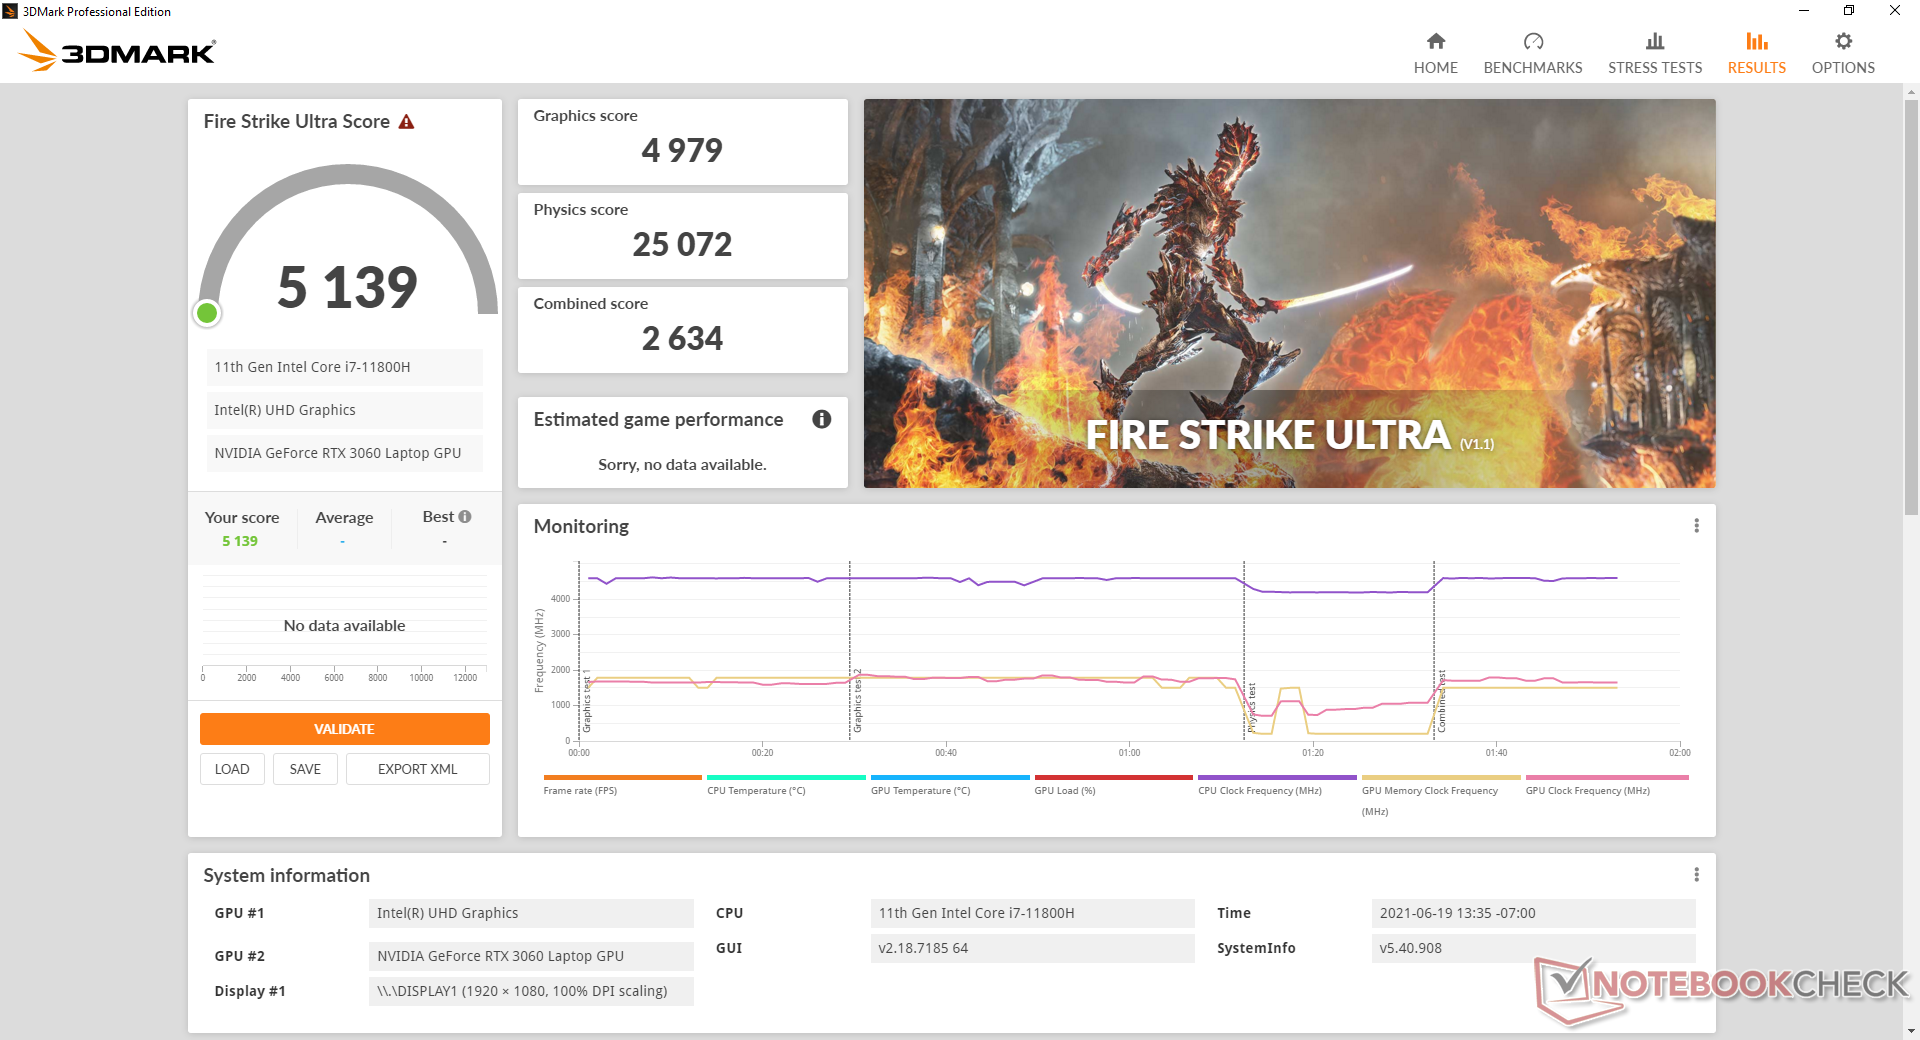
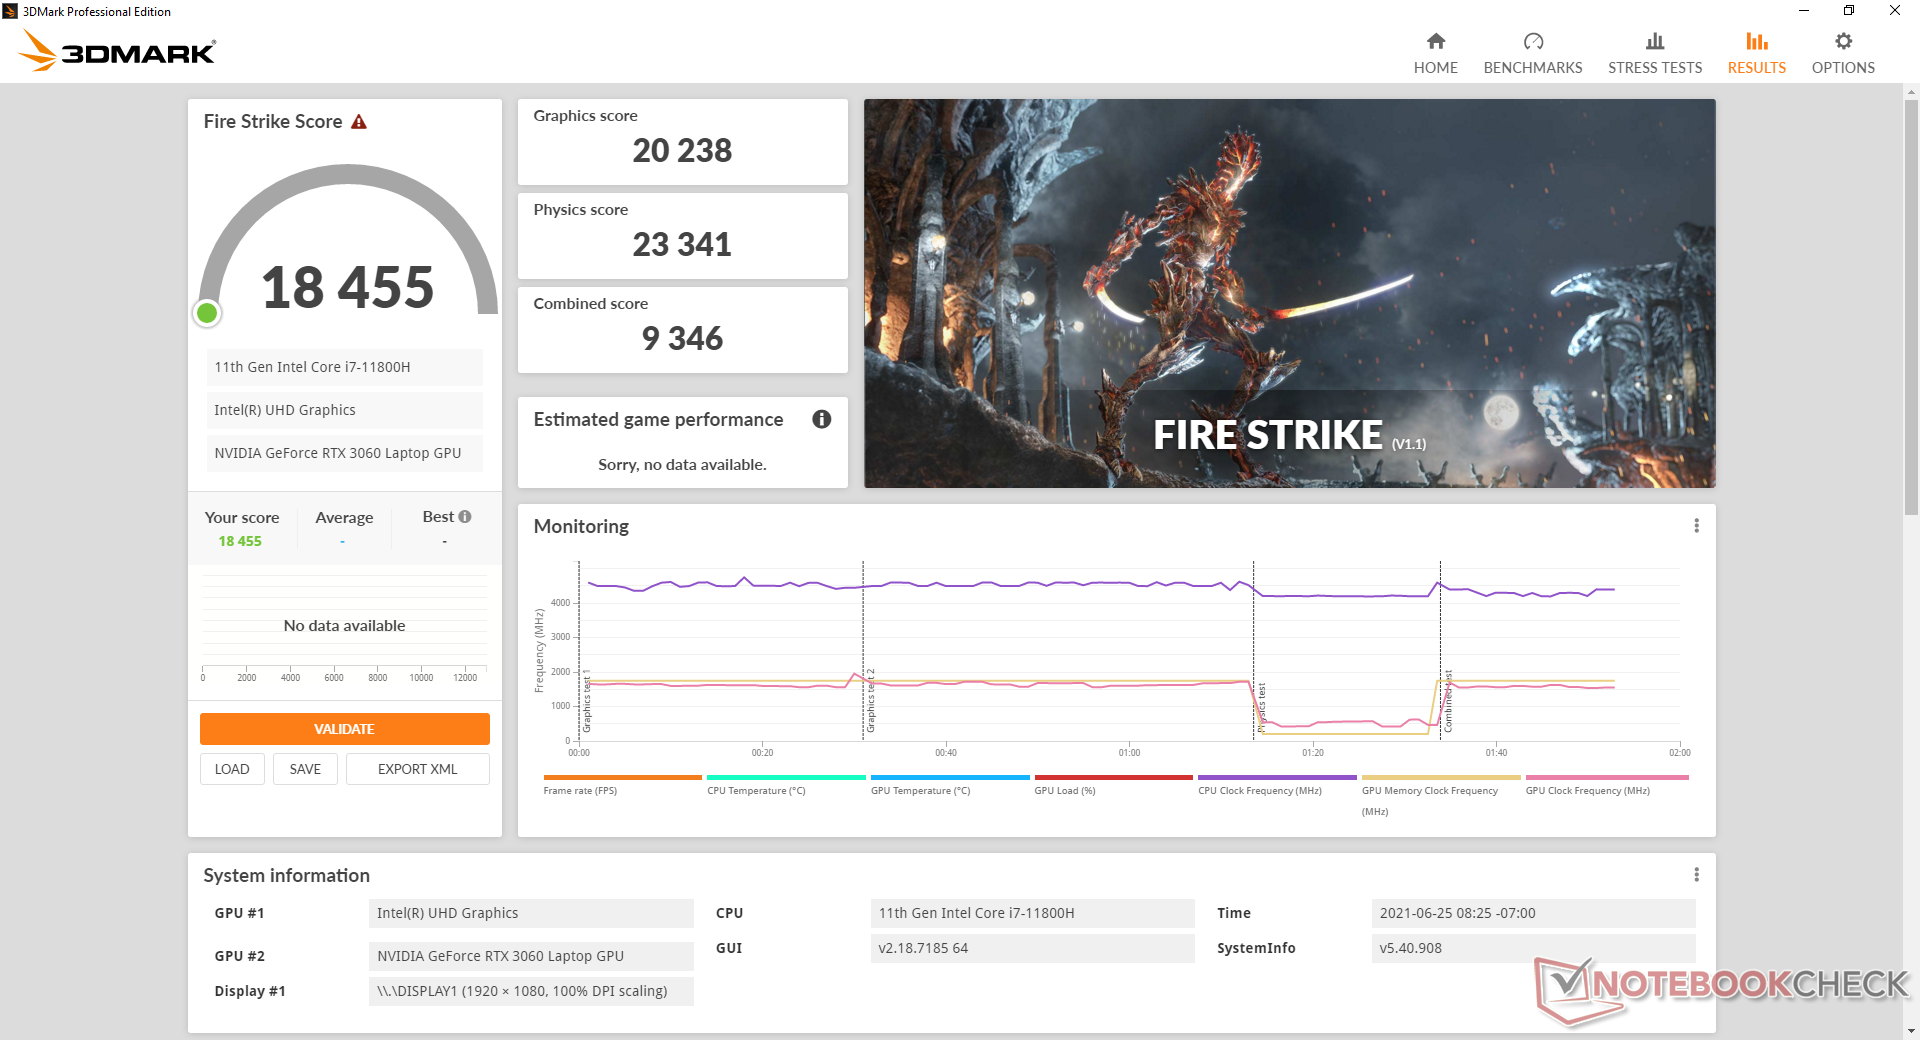
Hay una ligera diferencia de rendimiento entre el modo Performance y el modo Turbo. Si se ejecuta Fire Strike en modo Turbo, se obtienen puntuaciones más altas en Física y Gráficos, de un 2 y un 5 por ciento, respectivamente, a costa de un mayor ruido del ventilador.
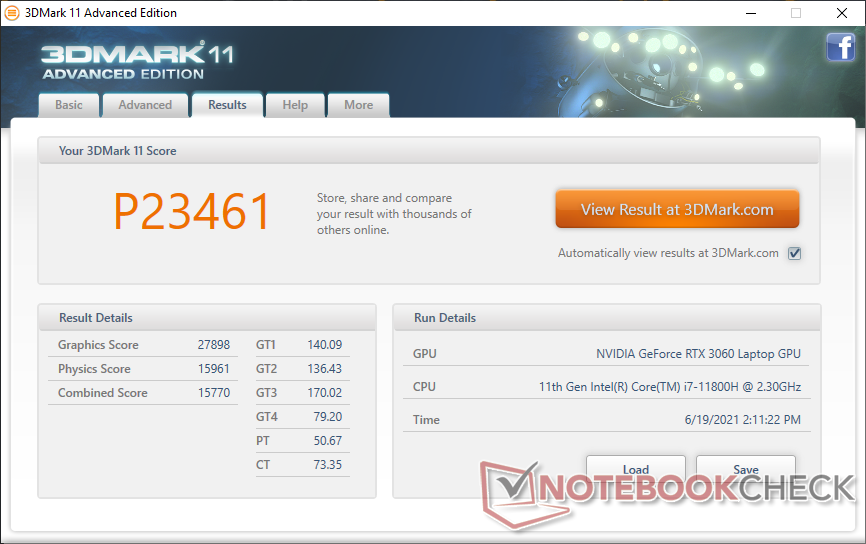

| 3DMark 11 Performance | 23461 puntos | |
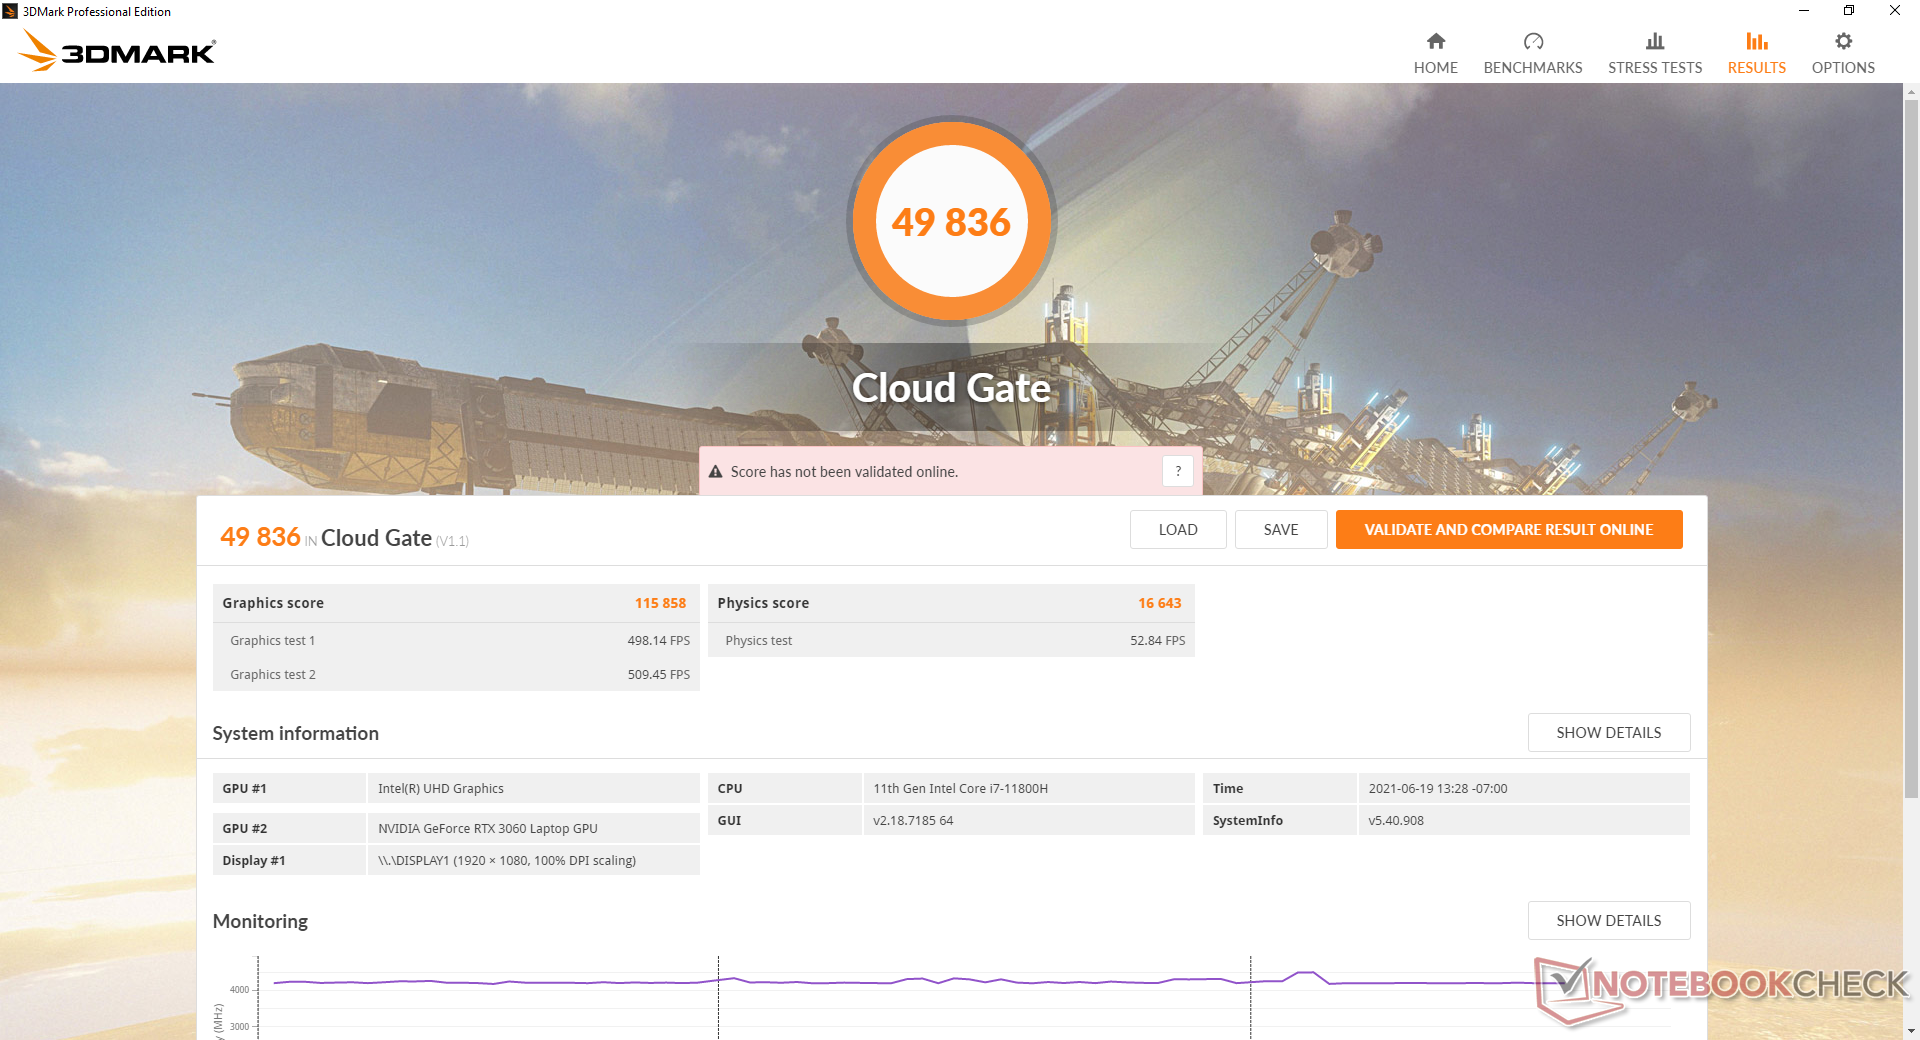
| 3DMark Cloud Gate Standard Score | 49836 puntos | |
| 3DMark Fire Strike Score | 19131 puntos | |
| 3DMark Time Spy Score | 7848 puntos | |
ayuda | ||
Las tasas de fotogramas en reposo en Witcher 3 son estables, sin caídas significativas en el tiempo. Hay fluctuaciones de algunos fotogramas de vez en cuando, probablemente debido al recurrente Dynamic Boost.
Witcher 3 FPS Chart
| bajo | medio | alto | ultra | |
|---|---|---|---|---|
| GTA V (2015) | 180 | 172 | 146 | 83.4 |
| The Witcher 3 (2015) | 362.3 | 246 | 143.9 | 75.3 |
| Dota 2 Reborn (2015) | 162 | 142 | 134 | 125 |
| Final Fantasy XV Benchmark (2018) | 153 | 104 | 78.1 | |
| X-Plane 11.11 (2018) | 122 | 102 | 83.3 | |
| Strange Brigade (2018) | 389 | 192 | 155 | 134 |
Emissions — Use Armoury Crate For Fan Control
Ruido del sistema
El ruido del ventilador puede ser muy silencioso o muy fuerte dependiendo del perfil de Armoury Crate. Si se ajusta al modo Silencioso, los ventiladores suelen permanecer a 26,7 dB(A) o menos contra un fondo de 24,8 dB(A) cuando se transmite o se navega por la web. Cuando se ajusta al modo Equilibrado o Rendimiento, el sistema es capaz de permanecer más silencioso durante más tiempo que la mayoría de los otros portátiles para juegos. Ejecutando la primera escena de benchmark de 3DMark 06, por ejemplo, induciría un ruido de ventilador de sólo 27 dB(A) en comparación con 53 dB(A) en el TUF Dash F15.
Si se ejecuta Witcher 3 en modo Rendimiento llevaría a un ruido de ventilador estable de 46,4 dB(A) mientras que el modo Turbo lo elevaría aún más a 49 dB(A). Como se mencionó anteriormente, los usuarios obtendrán un rendimiento ligeramente más rápido si juegan en el modo Turbo.
| Asus TUF Gaming F15 FX506HM GeForce RTX 3060 Laptop GPU, i7-11800H, SK Hynix HFM001TD3JX013N | Asus TUF Dash F15 FX516PR GeForce RTX 3070 Laptop GPU, i7-11370H, SK Hynix HFM001TD3JX013N | Asus TUF FX505DT-EB73 GeForce GTX 1650 Mobile, R7 3750H, Intel SSD 660p SSDPEKNW512G8 | Razer Blade 15 Base Edition 2021, i7-10750H RTX 3060 GeForce RTX 3060 Laptop GPU, i7-10750H, Samsung SSD PM981a MZVLB512HBJQ | MSI GF65 Thin 10UE GeForce RTX 3060 Laptop GPU, i7-10750H, Samsung SSD PM981 MZVLB1T0HALR | Lenovo Legion 5 15IMH05H GeForce RTX 2060 Mobile, i5-10300H, Samsung PM991 MZALQ512HALU | |
|---|---|---|---|---|---|---|
| Noise | -24% | -17% | -9% | -24% | -19% | |
| apagado / medio ambiente * (dB) | 24.8 | 24 3% | 28.2 -14% | 25.3 -2% | 24.7 -0% | 30.7 -24% |
| Idle Minimum * (dB) | 24.6 | 25 -2% | 28.2 -15% | 25.4 -3% | 33.1 -35% | 30.7 -25% |
| Idle Average * (dB) | 24.9 | 30 -20% | 28.2 -13% | 25.4 -2% | 33.1 -33% | 30.7 -23% |
| Idle Maximum * (dB) | 24.9 | 35 -41% | 31.4 -26% | 25.4 -2% | 33.1 -33% | 30.7 -23% |
| Load Average * (dB) | 27.1 | 53 -96% | 39.8 -47% | 42.5 -57% | 42.7 -58% | 36.6 -35% |
| Witcher 3 ultra * (dB) | 46.4 | 48 -3% | 47 -1% | 42 9% | 40.6 12% | 47 -1% |
| Load Maximum * (dB) | 49 | 54 -10% | 50.2 -2% | 52.2 -7% | 59.4 -21% | 50.9 -4% |
* ... más pequeño es mejor
Ruido
| Ocioso |
| 24.6 / 24.9 / 24.9 dB(A) |
| HDD |
| 26.7 dB(A) |
| Carga |
| 27.1 / 49 dB(A) |
 | ||
30 dB silencioso 40 dB(A) audible 50 dB(A) ruidosamente alto |
||
min: | ||
Temperatura
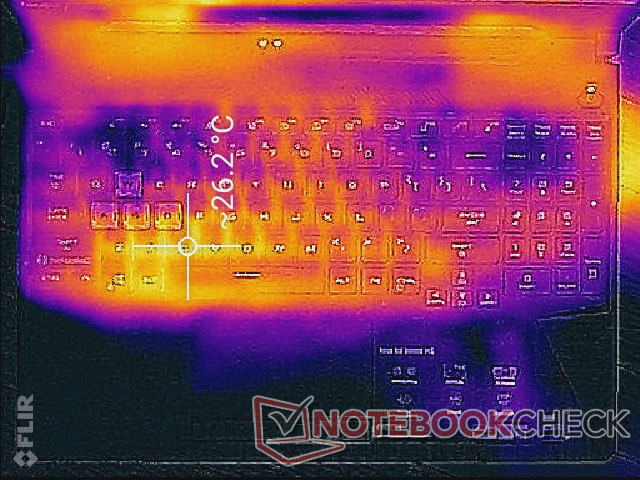
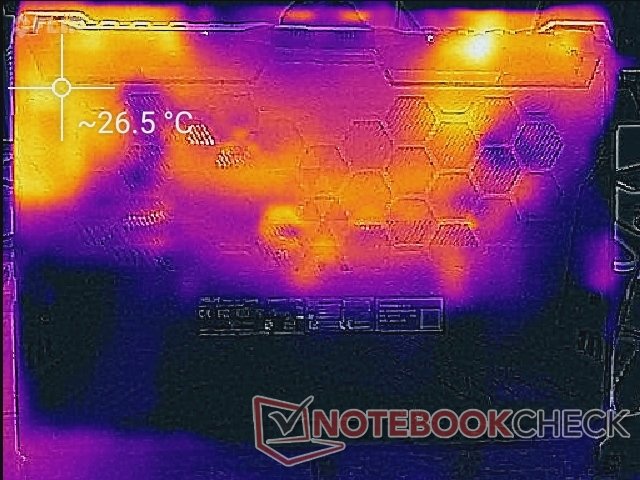
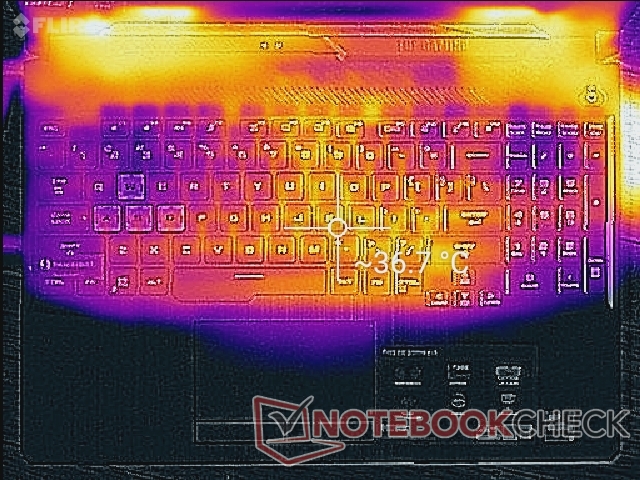
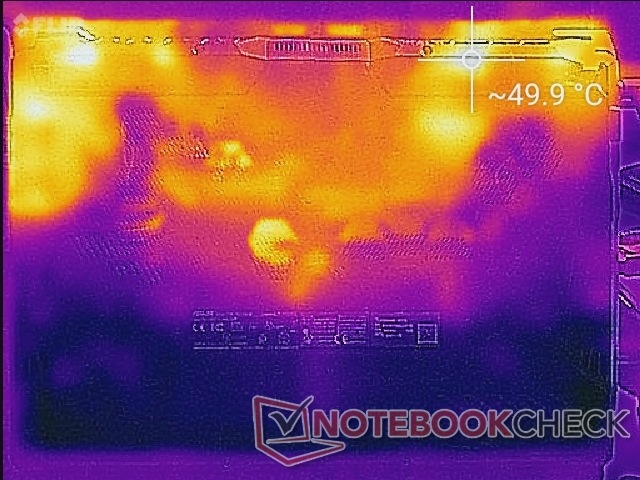
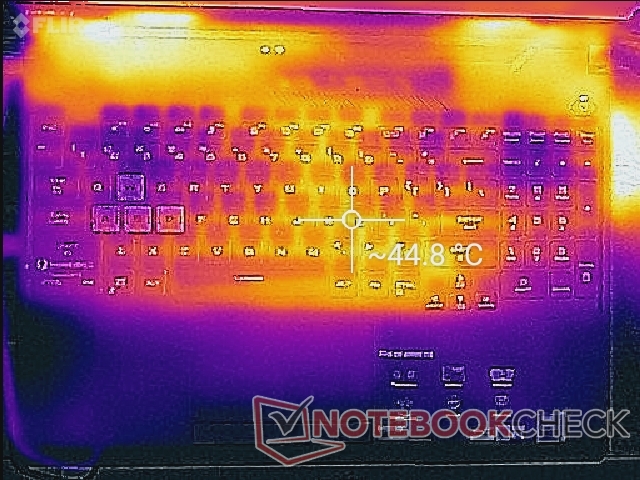
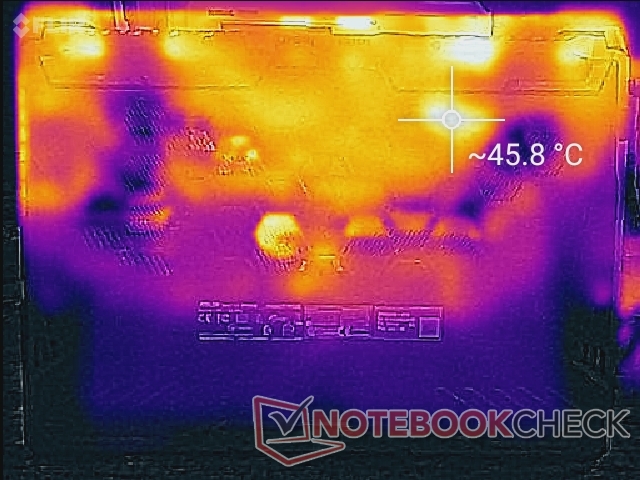
Las temperaturas de la superficie son más cálidas hacia el centro del teclado y las regiones traseras, donde pueden llegar a los 45 C cuando se ejecutan cargas extremas. Observamos rangos de temperatura similares en el MSI GF65 o en el modelo base del Razer Blade 15. Las teclas WASD y NumPad permanecen relativamente frescas cuando se juega, ya que los dos ventiladores internos introducen aire fresco a través de estas teclas. Cuando se compara con el TUF Dash F15 con la más potente RTX 3070, sin embargo, las temperaturas superficiales son más frías aquí por varios grados C.
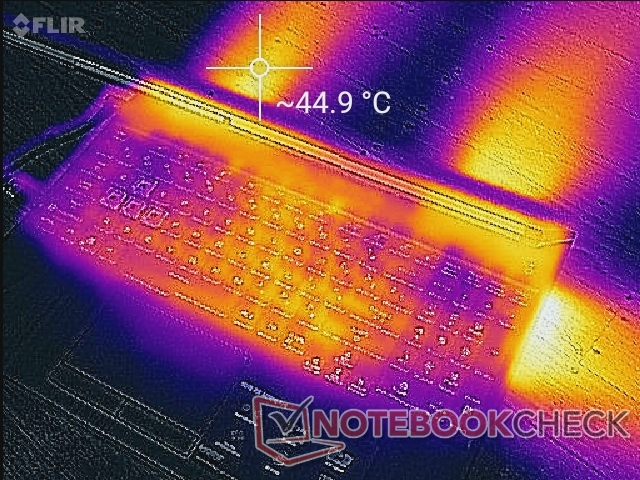
(-) La temperatura máxima en la parte superior es de 46.4 °C / 116 F, frente a la media de 40.4 °C / 105 F, que oscila entre 21.2 y 68.8 °C para la clase Gaming.
(-) El fondo se calienta hasta un máximo de 45.4 °C / 114 F, frente a la media de 43.2 °C / 110 F
(+) En reposo, la temperatura media de la parte superior es de 24.1 °C / 75# F, frente a la media del dispositivo de 33.9 °C / 93 F.
(±) Jugando a The Witcher 3, la temperatura media de la parte superior es de 32.2 °C / 90 F, frente a la media del dispositivo de 33.9 °C / 93 F.
(+) El reposamanos y el panel táctil están a una temperatura inferior a la de la piel, con un máximo de 26.4 °C / 79.5 F y, por tanto, son fríos al tacto.
(+) La temperatura media de la zona del reposamanos de dispositivos similares fue de 28.8 °C / 83.8 F (+2.4 °C / 4.3 F).
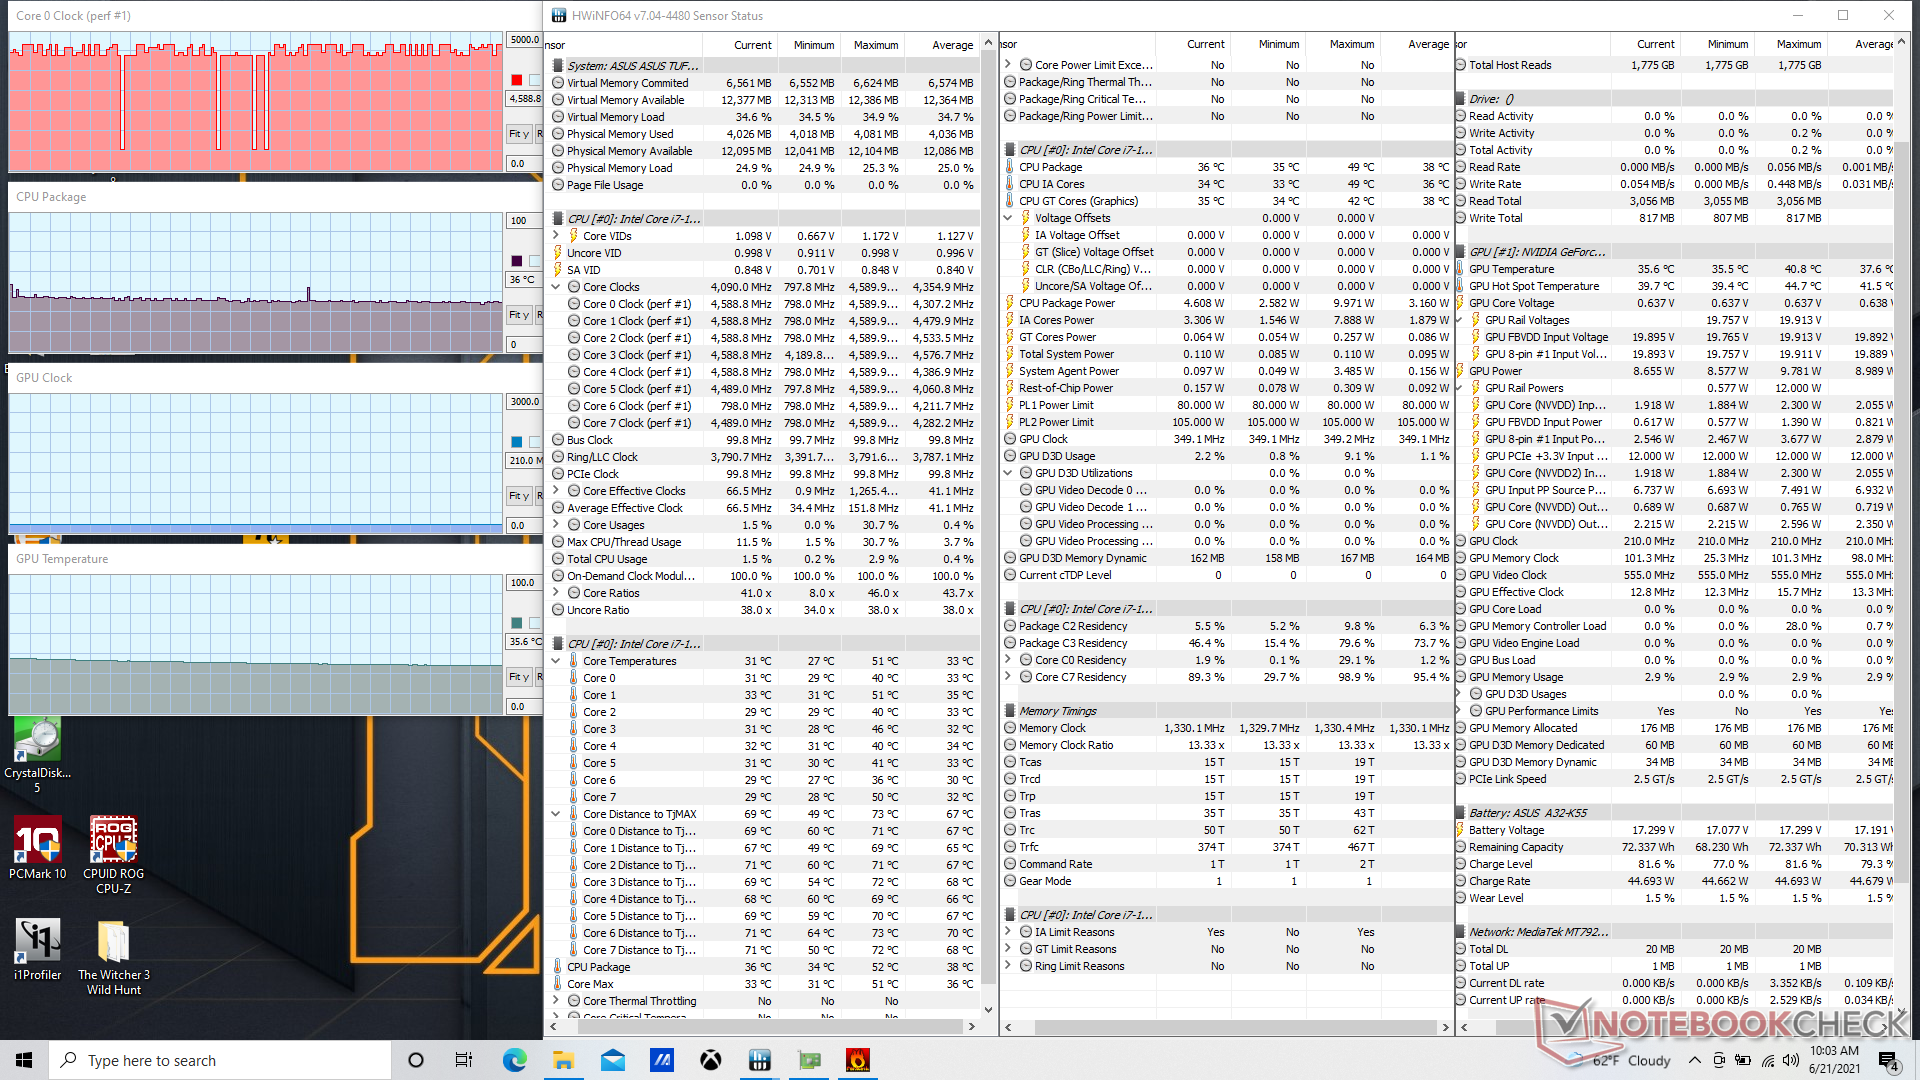
Prueba de esfuerzo
Cuando se ejecuta Prime95, la CPU sube a 4.2 GHz durante un par de segundos antes de caer y estabilizarse finalmente en 3.2 GHz y 90 C. La temperatura del núcleo puede ser alta, pero la preferimos a un rendimiento más lento. Ejecutando esta misma prueba en el Razer Blade 15 con un Core i7-10750H de 10ª generación más antiguo, por ejemplo, se obtendría una velocidad de reloj de la CPU estable y una temperatura de sólo 2,7 GHz y 66 C
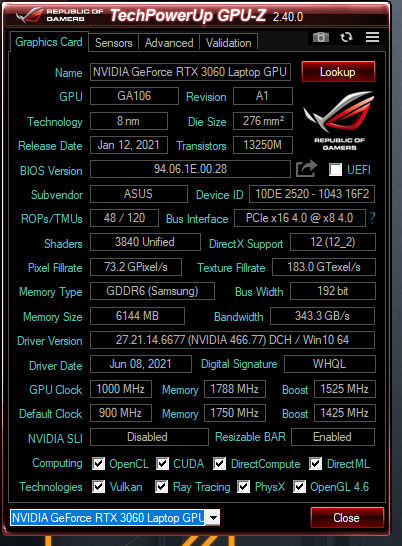
Cuando se ejecuta Witcher 3en modo Turbo para representar las cargas de juego del mundo real, la CPU se estabilizaría en 75 C mientras que la GPU oscilaría ligeramente entre 78 C y 81 C. Las velocidades de reloj de la GPU también oscilarían entre 1600 MHz y 1717 MHz, probablemente debido al pequeño Dynamic Boost en vigor. GPU-Z informa de un consumo de energía de la placa en tiempo real de hasta 90 W, lo que coincide con lo que Asus afirma en su lista de especificaciones.
Funcionar con batería limitará el rendimiento. Un test 3DMark 11 en batería arrojaría unas puntuaciones de Física y Gráficos de 10422 y 20531 puntos, respectivamente, frente a los 15961 y 27898 puntos de la red eléctrica.
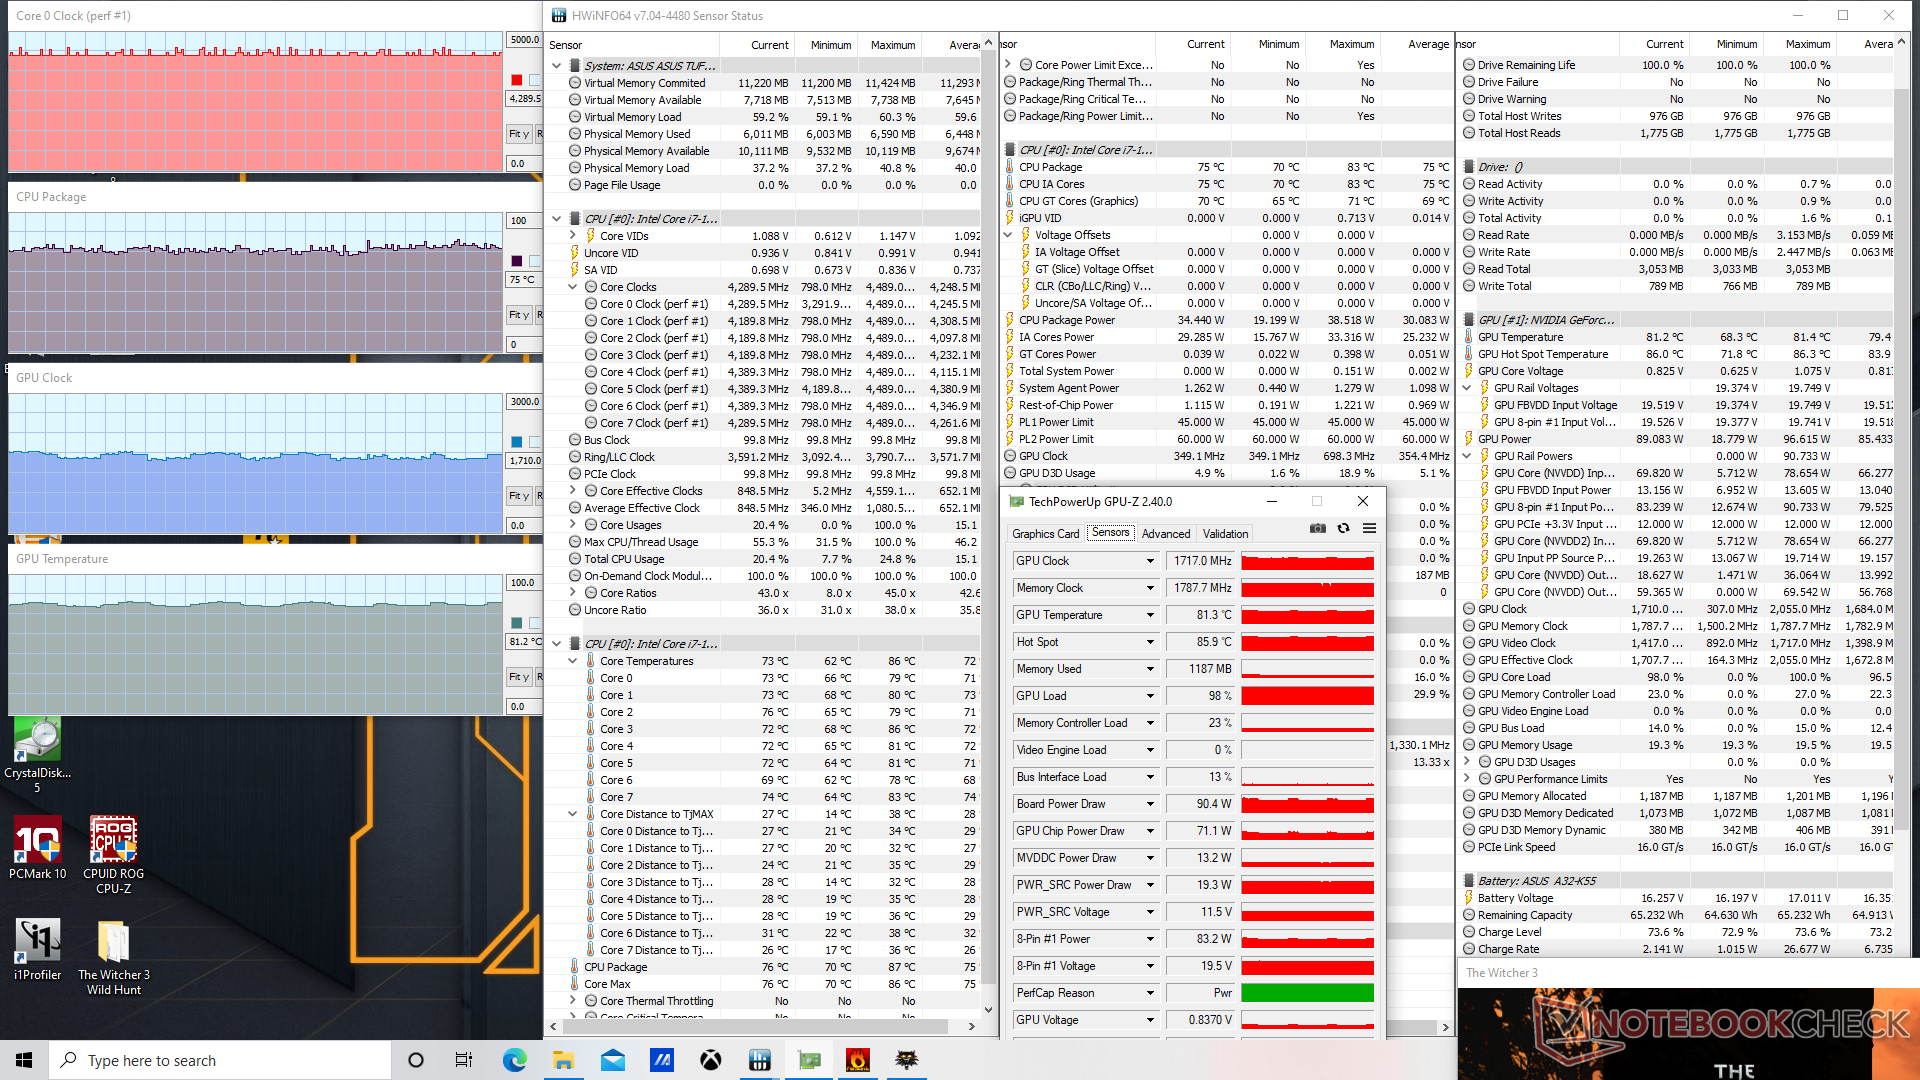
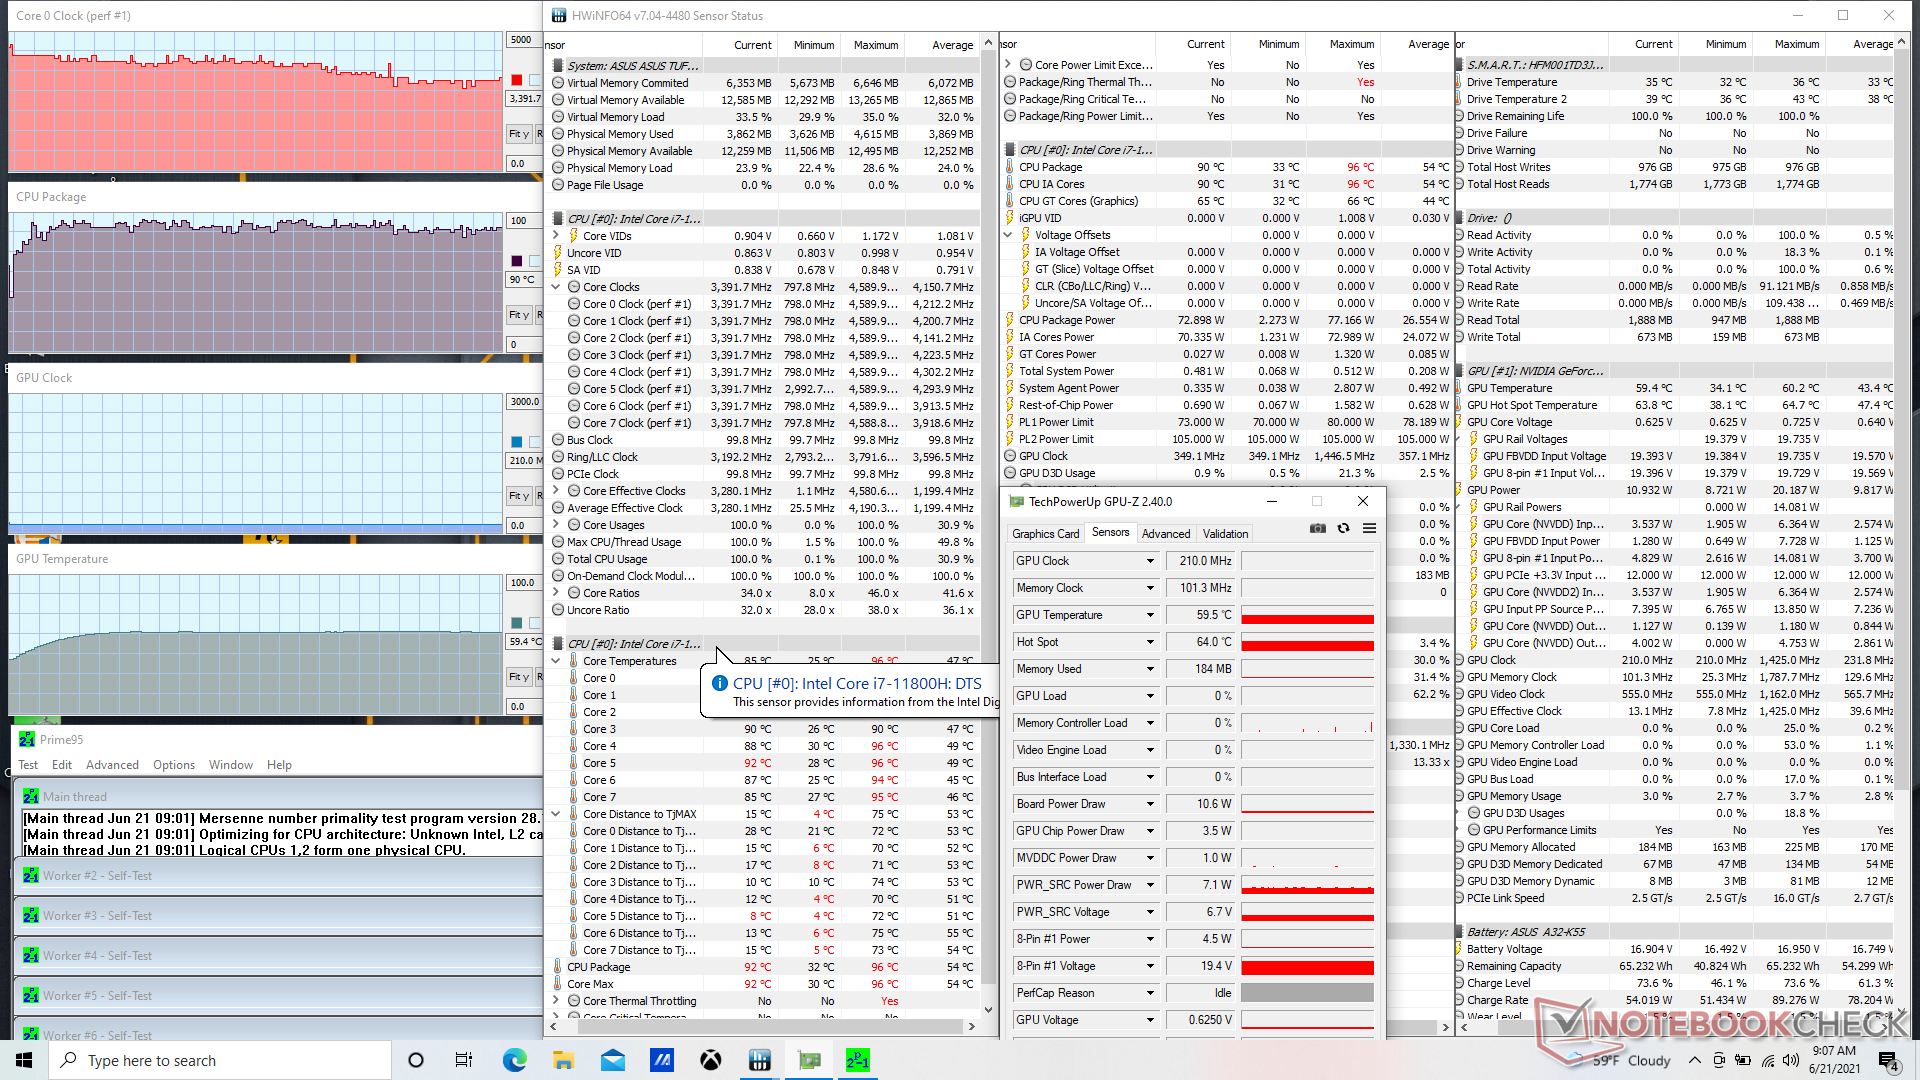
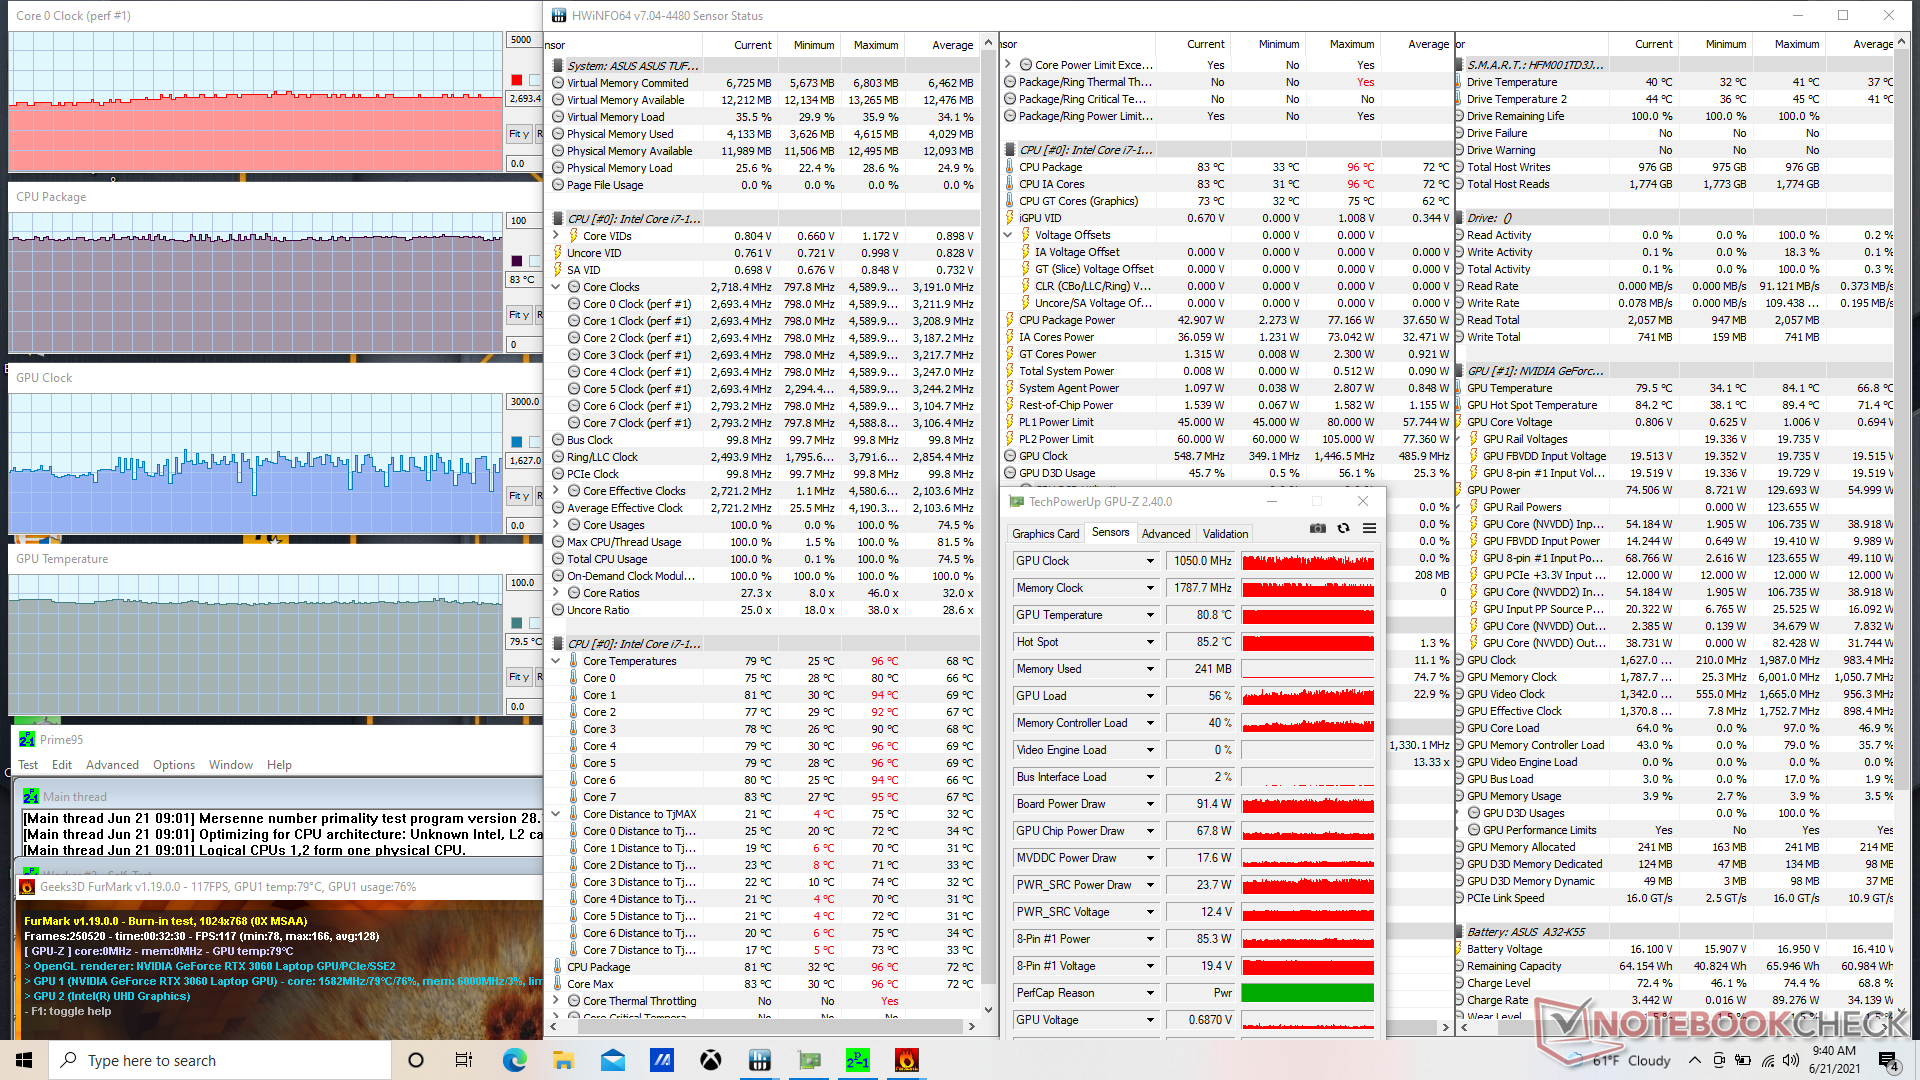
| Relojde la CPU(GHz) | Reloj dela GPU(MHz) | Temperatura media de la CPU (°C) | Temperaturamediade la GPU (°C) | |
| Sistema en reposo | 36 | 36 | ||
| Estrés de Prime95(modo Turbo) | 3.2 | -- | 90 | 60 |
| Estrés de Prime95+ FurMark (modo Turbo) | 2,7 - 2,8 | 930 - 2000 | 83 | 80 |
| Witcher 3 Estrés (modo Turbo) | 4,2 - 4,3 | 1600 - 1717 | 75 | 78 - 81 |
Altavoces

Los dos altavoces de 2 W tienen una reproducción de graves y un equilibrio decentes, como demuestra su gráfico de ruido rosa relativamente suave. Es molesto que los reposapalmas vibren al tacto cuando el volumen es alto, ya que los altavoces están situados directamente debajo.
Asus TUF Gaming F15 FX506HM análisis de audio
(±) | la sonoridad del altavoz es media pero buena (77.1 dB)
Graves 100 - 315 Hz
(±) | lubina reducida - en promedio 13.8% inferior a la mediana
(±) | la linealidad de los graves es media (7.9% delta a frecuencia anterior)
Medios 400 - 2000 Hz
(+) | medios equilibrados - a sólo 2.9% de la mediana
(+) | los medios son lineales (5.9% delta a la frecuencia anterior)
Altos 2 - 16 kHz
(+) | máximos equilibrados - a sólo 1.8% de la mediana
(+) | los máximos son lineales (2.7% delta a la frecuencia anterior)
Total 100 - 16.000 Hz
(+) | el sonido global es lineal (13.1% de diferencia con la mediana)
En comparación con la misma clase
» 18% de todos los dispositivos probados de esta clase eran mejores, 4% similares, 78% peores
» El mejor tuvo un delta de 6%, la media fue 18%, el peor fue ###max##%
En comparación con todos los dispositivos probados
» 13% de todos los dispositivos probados eran mejores, 3% similares, 84% peores
» El mejor tuvo un delta de 4%, la media fue 24%, el peor fue ###max##%
Apple MacBook 12 (Early 2016) 1.1 GHz análisis de audio
(+) | los altavoces pueden reproducir a un volumen relativamente alto (#83.6 dB)
Graves 100 - 315 Hz
(±) | lubina reducida - en promedio 11.3% inferior a la mediana
(±) | la linealidad de los graves es media (14.2% delta a frecuencia anterior)
Medios 400 - 2000 Hz
(+) | medios equilibrados - a sólo 2.4% de la mediana
(+) | los medios son lineales (5.5% delta a la frecuencia anterior)
Altos 2 - 16 kHz
(+) | máximos equilibrados - a sólo 2% de la mediana
(+) | los máximos son lineales (4.5% delta a la frecuencia anterior)
Total 100 - 16.000 Hz
(+) | el sonido global es lineal (10.2% de diferencia con la mediana)
En comparación con la misma clase
» 7% de todos los dispositivos probados de esta clase eran mejores, 2% similares, 91% peores
» El mejor tuvo un delta de 5%, la media fue 18%, el peor fue ###max##%
En comparación con todos los dispositivos probados
» 5% de todos los dispositivos probados eran mejores, 1% similares, 94% peores
» El mejor tuvo un delta de 4%, la media fue 24%, el peor fue ###max##%
Energy Management
Consumo de energía
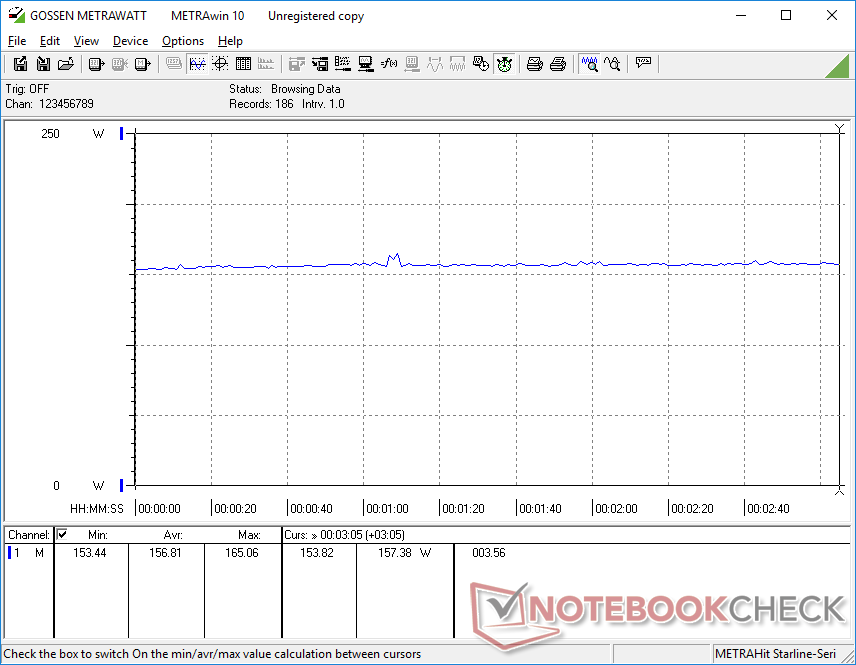
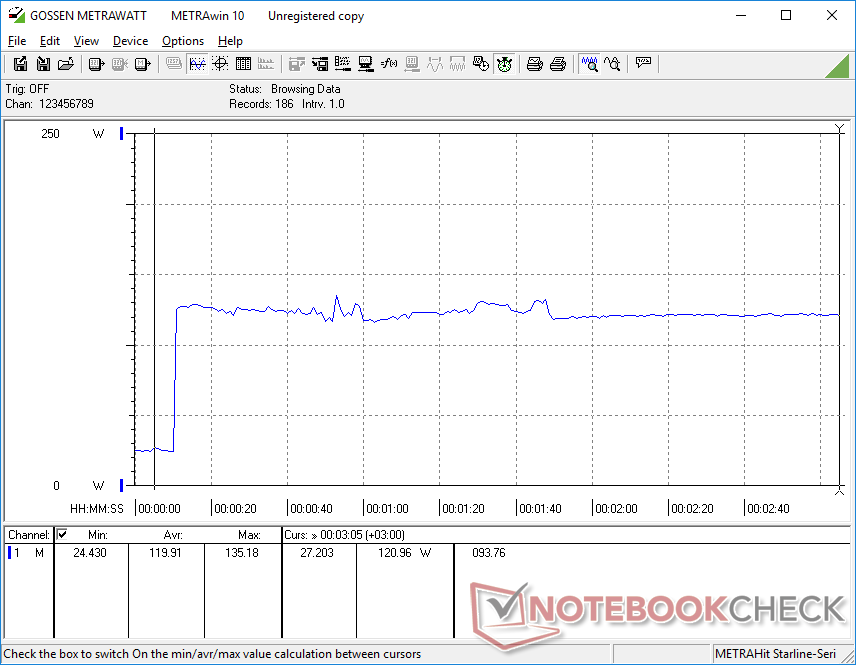
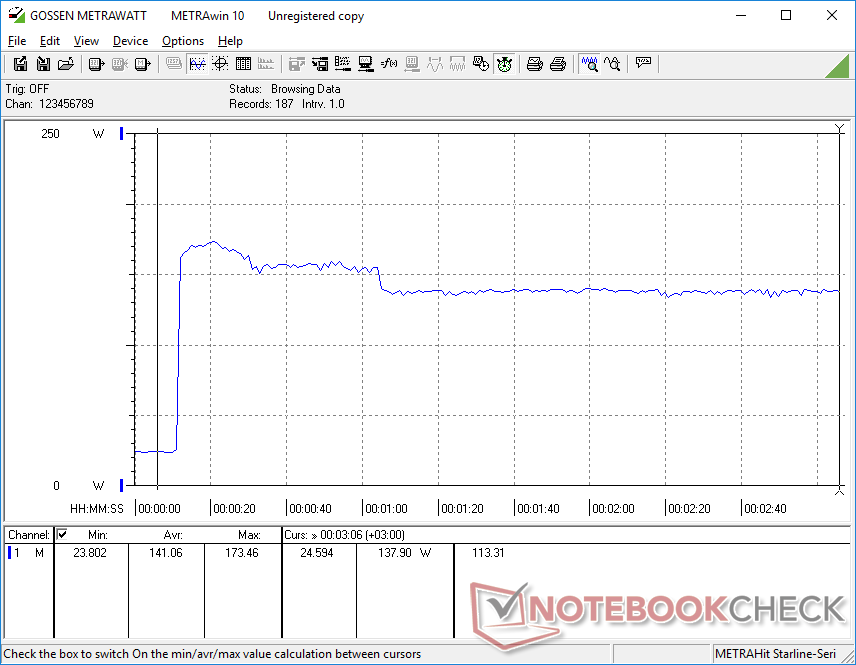
El consumo general de energía es mayor que el que registramos en el TUF Dash F15 FX516PR, lo que puede explicar la menor duración de la batería en la siguiente sección. Ejecutando Witcher 3 consumiría 157 W comparado con sólo 141 W y 116 W en el Blade 15 y el MSI GF65, respectivamente, cada uno con CPUs Core i7 de 10ª generación más antiguas pero con la misma GPU RTX 3060.
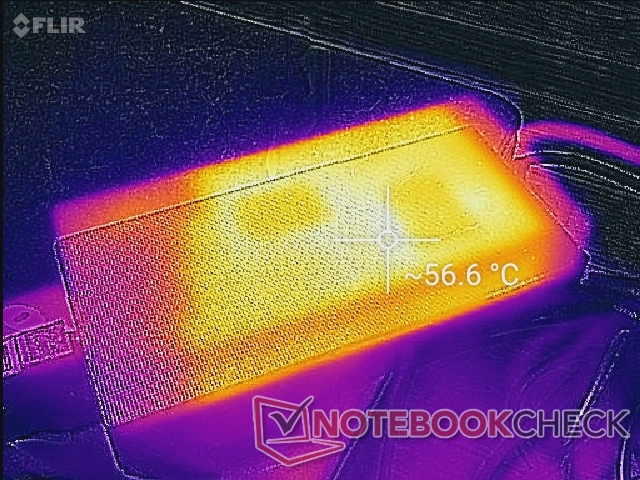
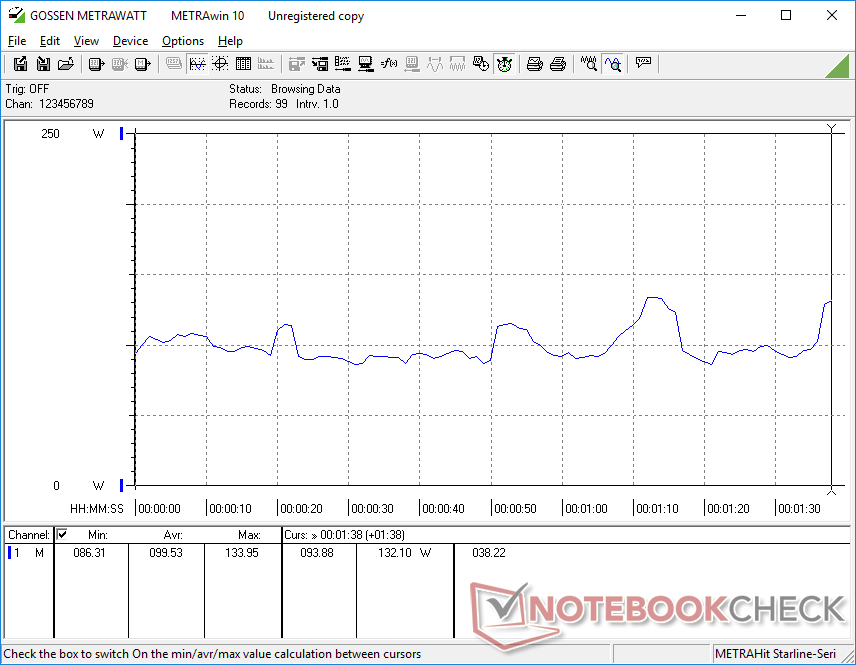
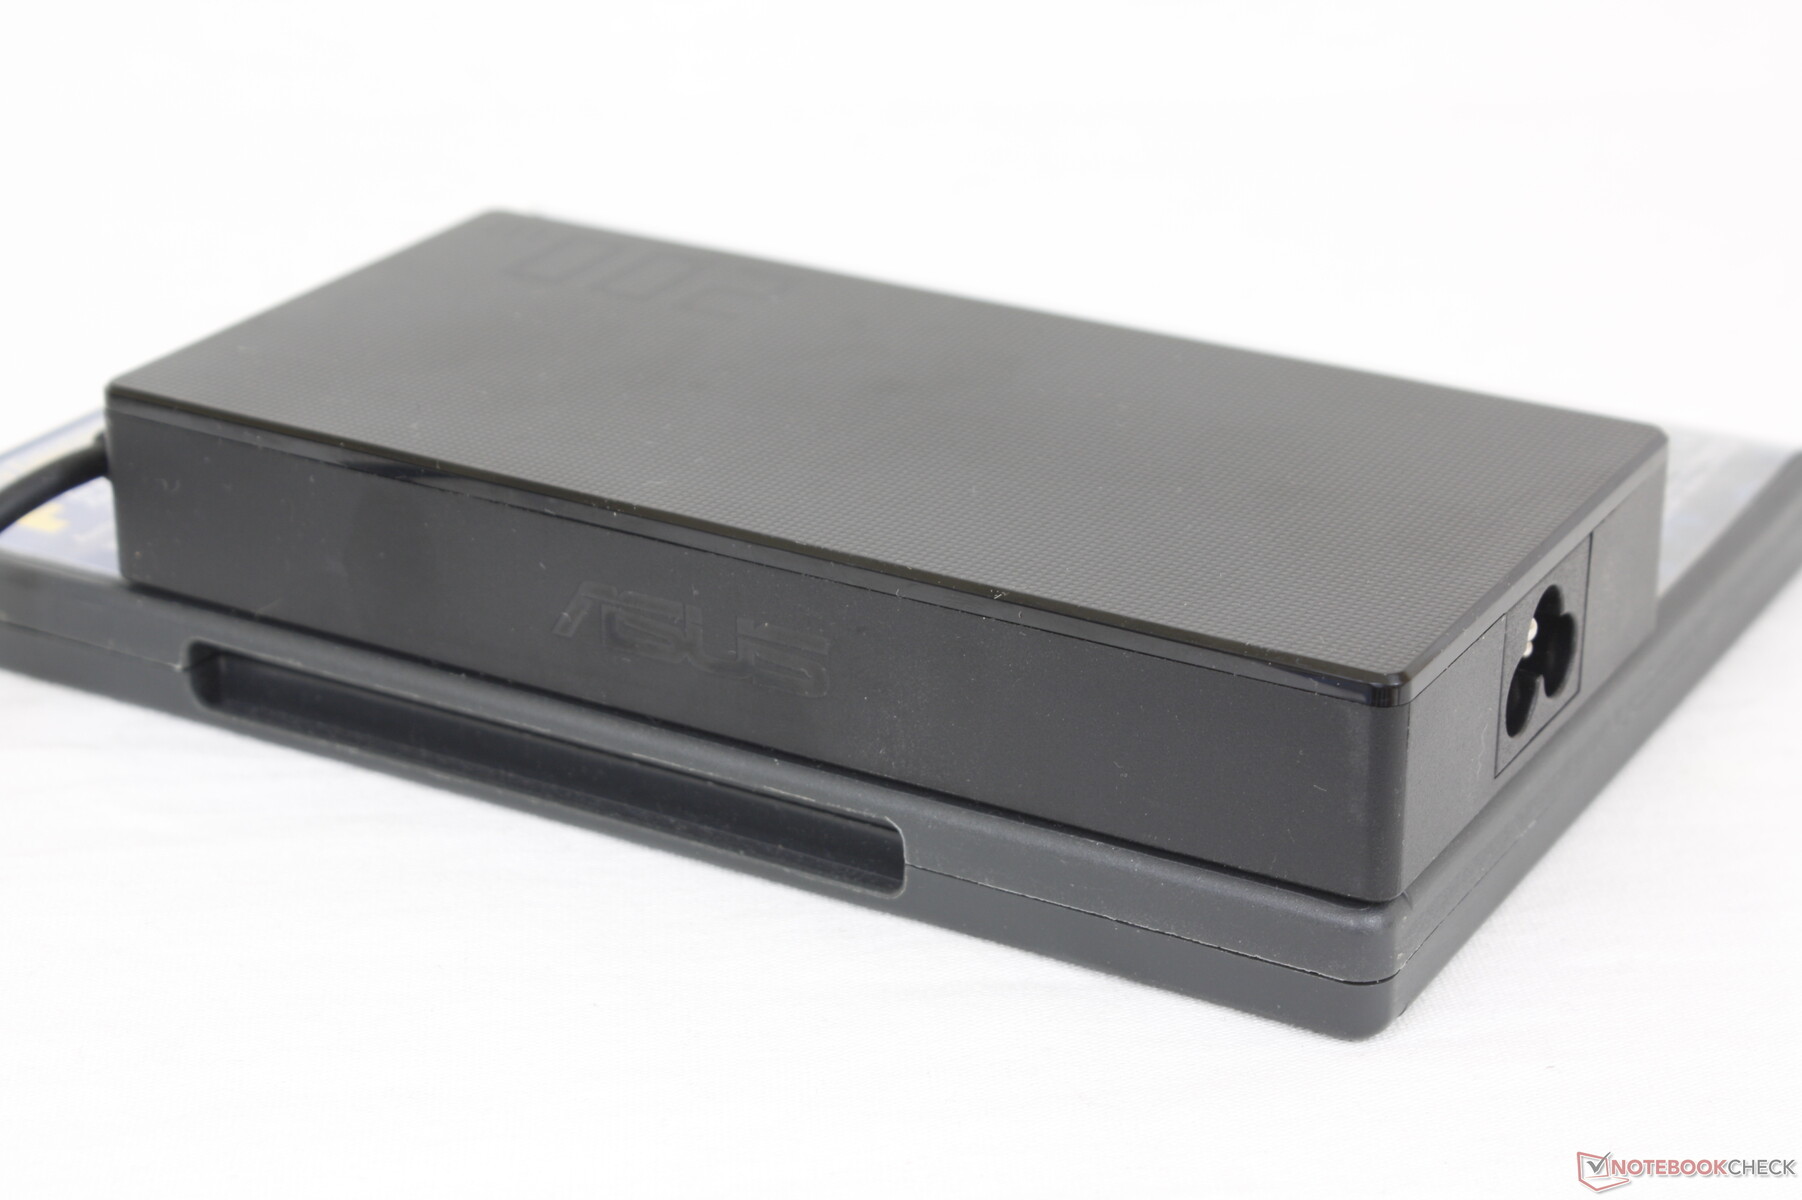
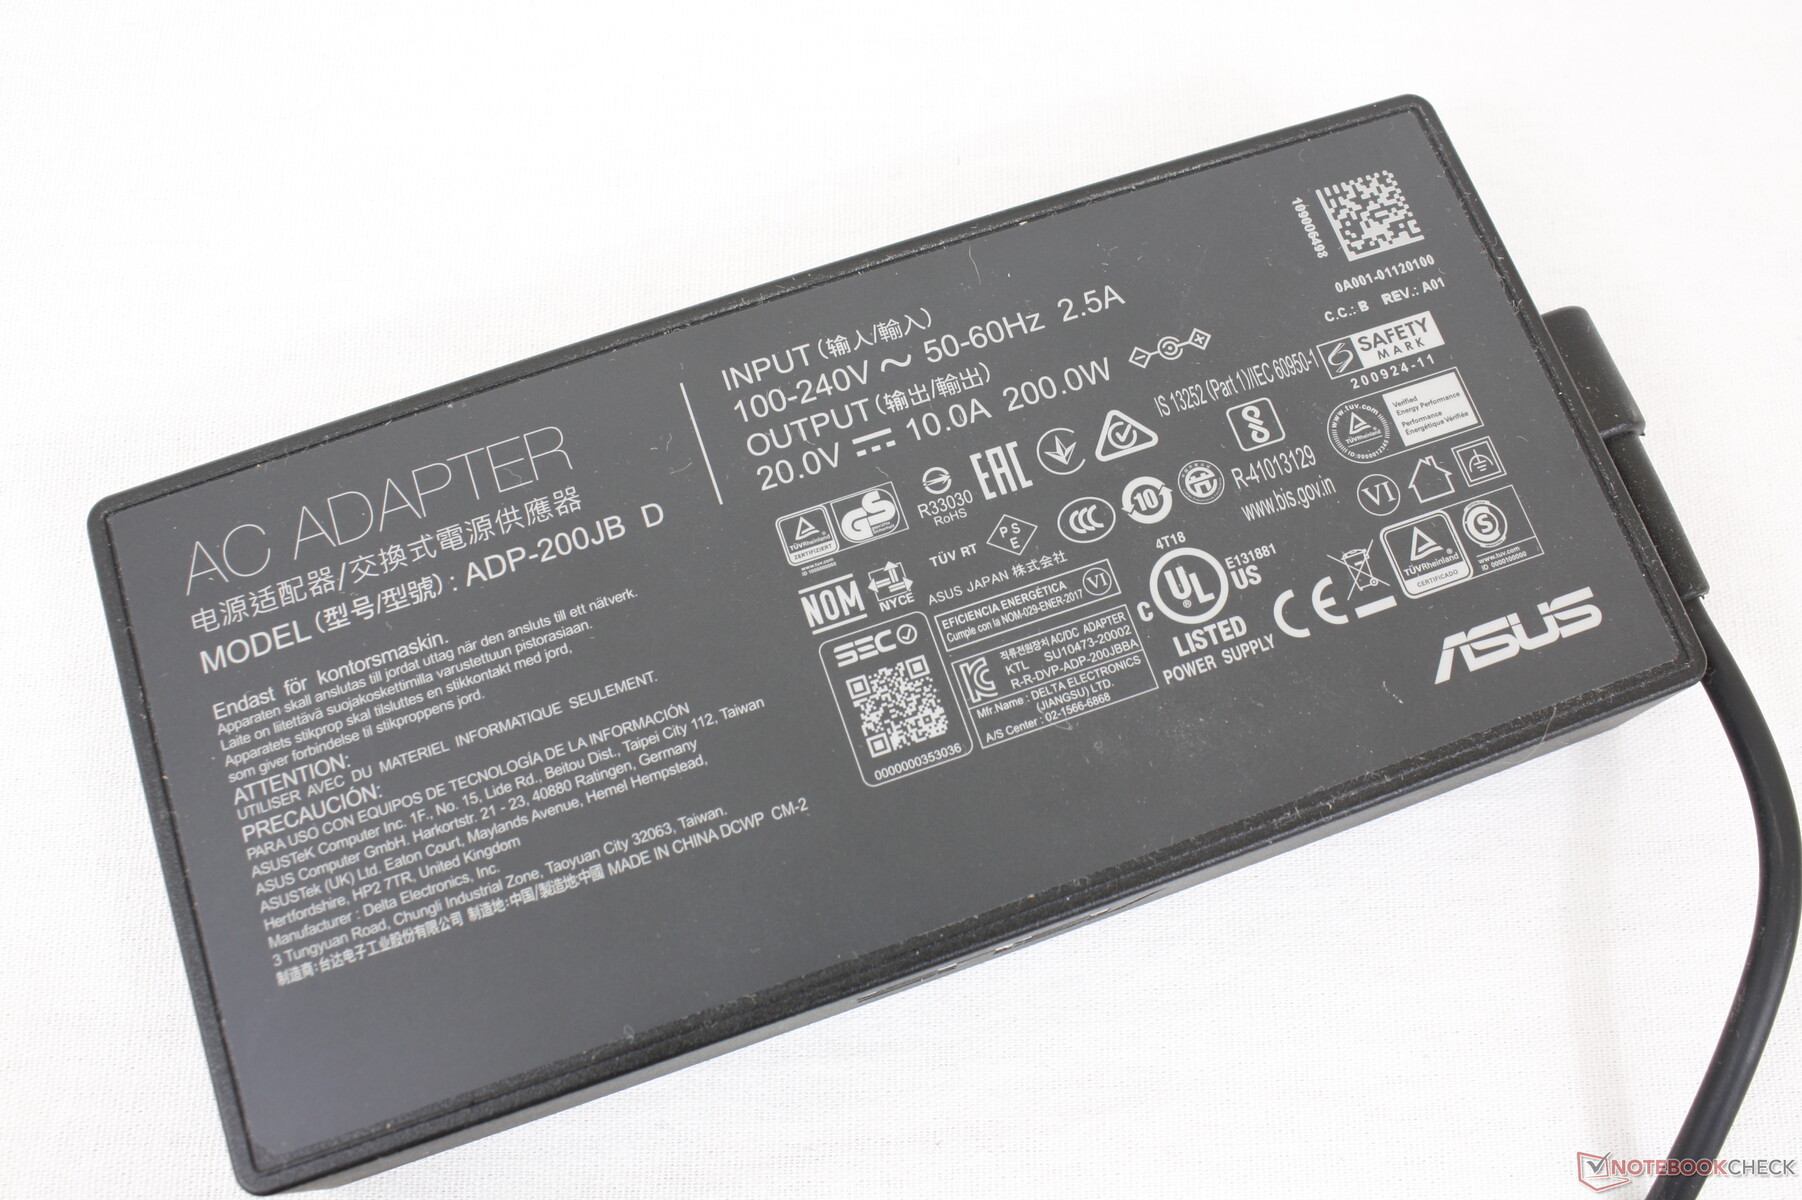
Pudimos registrar un consumo máximo de 173.5 W con el adaptador de CA de tamaño medio (~15.1 x 7.2 x 2.3 cm) de 180 W. Esta tasa es sólo temporal, ya que acaba cayendo a sólo 135 W tras un par de minutos, como muestra la siguiente captura de pantalla. La tasa de carga también se ralentiza bajo cargas tan altas, pero afortunadamente nunca se descarga como en los antiguos modelos XPS 17.
| Off / Standby | |
| Ocioso | |
| Carga |
|
Clave:
min: | |
| Asus TUF Gaming F15 FX506HM i7-11800H, GeForce RTX 3060 Laptop GPU, SK Hynix HFM001TD3JX013N, IPS, 1920x1080, 15.6" | Asus TUF Dash F15 FX516PR i7-11370H, GeForce RTX 3070 Laptop GPU, SK Hynix HFM001TD3JX013N, IPS, 1920x1080, 15.6" | Asus TUF FX505DT-EB73 R7 3750H, GeForce GTX 1650 Mobile, Intel SSD 660p SSDPEKNW512G8, IPS, 1920x1080, 15.6" | Razer Blade 15 Base Edition 2021, i7-10750H RTX 3060 i7-10750H, GeForce RTX 3060 Laptop GPU, Samsung SSD PM981a MZVLB512HBJQ, IPS, 1920x1080, 15.6" | MSI GF65 Thin 10UE i7-10750H, GeForce RTX 3060 Laptop GPU, Samsung SSD PM981 MZVLB1T0HALR, IPS, 1920x1080, 15.6" | Lenovo Legion 5 15IMH05H i5-10300H, GeForce RTX 2060 Mobile, Samsung PM991 MZALQ512HALU, IPS, 1920x1080, 15.6" | |
|---|---|---|---|---|---|---|
| Power Consumption | 11% | 31% | -14% | 15% | 28% | |
| Idle Minimum * (Watt) | 9.5 | 9 5% | 7 26% | 11.7 -23% | 5.4 43% | 3.2 66% |
| Idle Average * (Watt) | 12.1 | 11 9% | 9.9 18% | 16 -32% | 12.8 -6% | 8.3 31% |
| Idle Maximum * (Watt) | 22.5 | 16 29% | 12 47% | 29.3 -30% | 19.5 13% | 8.7 61% |
| Load Average * (Watt) | 99.5 | 107 -8% | 68.4 31% | 95.6 4% | 86.6 13% | 82 18% |
| Witcher 3 ultra * (Watt) | 157 | 121 23% | 94.9 40% | 141.3 10% | 115.7 26% | 151 4% |
| Load Maximum * (Watt) | 173.5 | 162 7% | 130.9 25% | 197 -14% | 175.2 -1% | 195 -12% |
* ... más pequeño es mejor
Duración de la batería: buena para un portátil de juegos
Hemos sido capaces de exprimir casi 8 horas completas de uso real de la WLAN de nuestra batería de 90 Wh cuando está configurada en modo equilibrado con la iGPU activa. Los usuarios que opten por la configuración de 48 Wh pueden esperar aproximadamente la mitad de esta duración. Inusualmente, los tiempos de ejecución serían consistentemente más cortos que lo que registramos en el TUF Dash F15 incluso cuando se encuentra en el escritorio en el modo de ahorro de energía con la pantalla ajustada al brillo mínimo.
La carga desde el vacío hasta la capacidad total es relativamente rápida, con algo menos de 1.5 horas. Los usuarios no pueden recargar el portátil por USB-C.
| Asus TUF Gaming F15 FX506HM i7-11800H, GeForce RTX 3060 Laptop GPU, 90 Wh | Asus TUF Dash F15 FX516PR i7-11370H, GeForce RTX 3070 Laptop GPU, 76 Wh | Asus TUF FX505DT-EB73 R7 3750H, GeForce GTX 1650 Mobile, 48 Wh | Razer Blade 15 Base Edition 2021, i7-10750H RTX 3060 i7-10750H, GeForce RTX 3060 Laptop GPU, 65 Wh | MSI GF65 Thin 10UE i7-10750H, GeForce RTX 3060 Laptop GPU, 51 Wh | Lenovo Legion 5 15IMH05H i5-10300H, GeForce RTX 2060 Mobile, 60 Wh | |
|---|---|---|---|---|---|---|
| Duración de Batería | 30% | -31% | -31% | -29% | -4% | |
| Reader / Idle (h) | 11 | 16 45% | 7.8 -29% | 7.8 -29% | 11.1 1% | 14.1 28% |
| WiFi v1.3 (h) | 7.9 | 9.1 15% | 4.8 -39% | 4.8 -39% | 4.6 -42% | 7.2 -9% |
| Load (h) | 2 | 1.5 -25% | 1.5 -25% | 1.1 -45% | 1.4 -30% |
Pro
Contra
Veredicto - Gran rendimiento, chasis mediocre
Para un portátil de juegos de nivel básico y medio, el TUF FX506HM ofrece un buen valor, especialmente si se compara con el competidor MSI GF65 o GF66. Lo más destacable es que lleva conectividad Thunderbolt, iluminación RGB en el teclado y un teclado numérico del que carecen los modelos MSI antes mencionados. También preferimos las teclas más firmes del teclado y el touchpad más fácil de usar del Asus para una experiencia de usuario más satisfactoria.
Las altas prestaciones de la CPU y la GPU permiten al FX506HM superar su categoría de gama media. La base de plástico y la limitada reproducción del color, sin embargo, lo devuelven a la tierra.
El rendimiento del procesador de la nueva plataforma Intel Core-H de 11ª generación también es excelente, con ganancias decentes respecto a la generación anterior. Aunque no supera a las últimas CPUs Zen 3 de AMD por un margen significativo, su compatibilidad con Thunderbolt y PCIe 4.0 le da una ventaja para los usuarios que se preocupan por estas características de gama alta.
Todo lo demás en el FX506 es simplemente normal para su categoría. La base de plástico, por ejemplo, está a la altura de un económico Lenovo IdeaPad Gaming 3i, HP Pavilion Gaming 15o el MSI GF65. La calidad del chasis no parece ni mejor ni peor que en la generación anterior FX505 como resultado.
Precio y disponibilidad
La serie Asus TUF FX506 con CPUs Intel de 11ª generación aún no está disponible en el momento de escribir este artículo
Asus TUF Gaming F15 FX506HM
- 06/25/2021 v7 (old)
Allen Ngo
Price comparison

