Análisis del portátil MSI GF65 Thin 10UE: GeForce RTX 3060 con un presupuesto
El MSI GF65 es uno de los portátiles para juegos de 15,6 pulgadas más baratos que puedes comprar con gráficos GeForce RTX 3060. Nuestra configuración de análisis viene con el Core i7-10750H de 10ª generación, la mencionada GPU RTX 30, 32 GB de RAM y 1 TB de SSD Samsung por unos 1650 dólares en CUKUSA. Sin embargo, hay opciones con menos RAM, almacenamiento y Core i5 por precios mucho más bajos, a partir de 999 dólares.
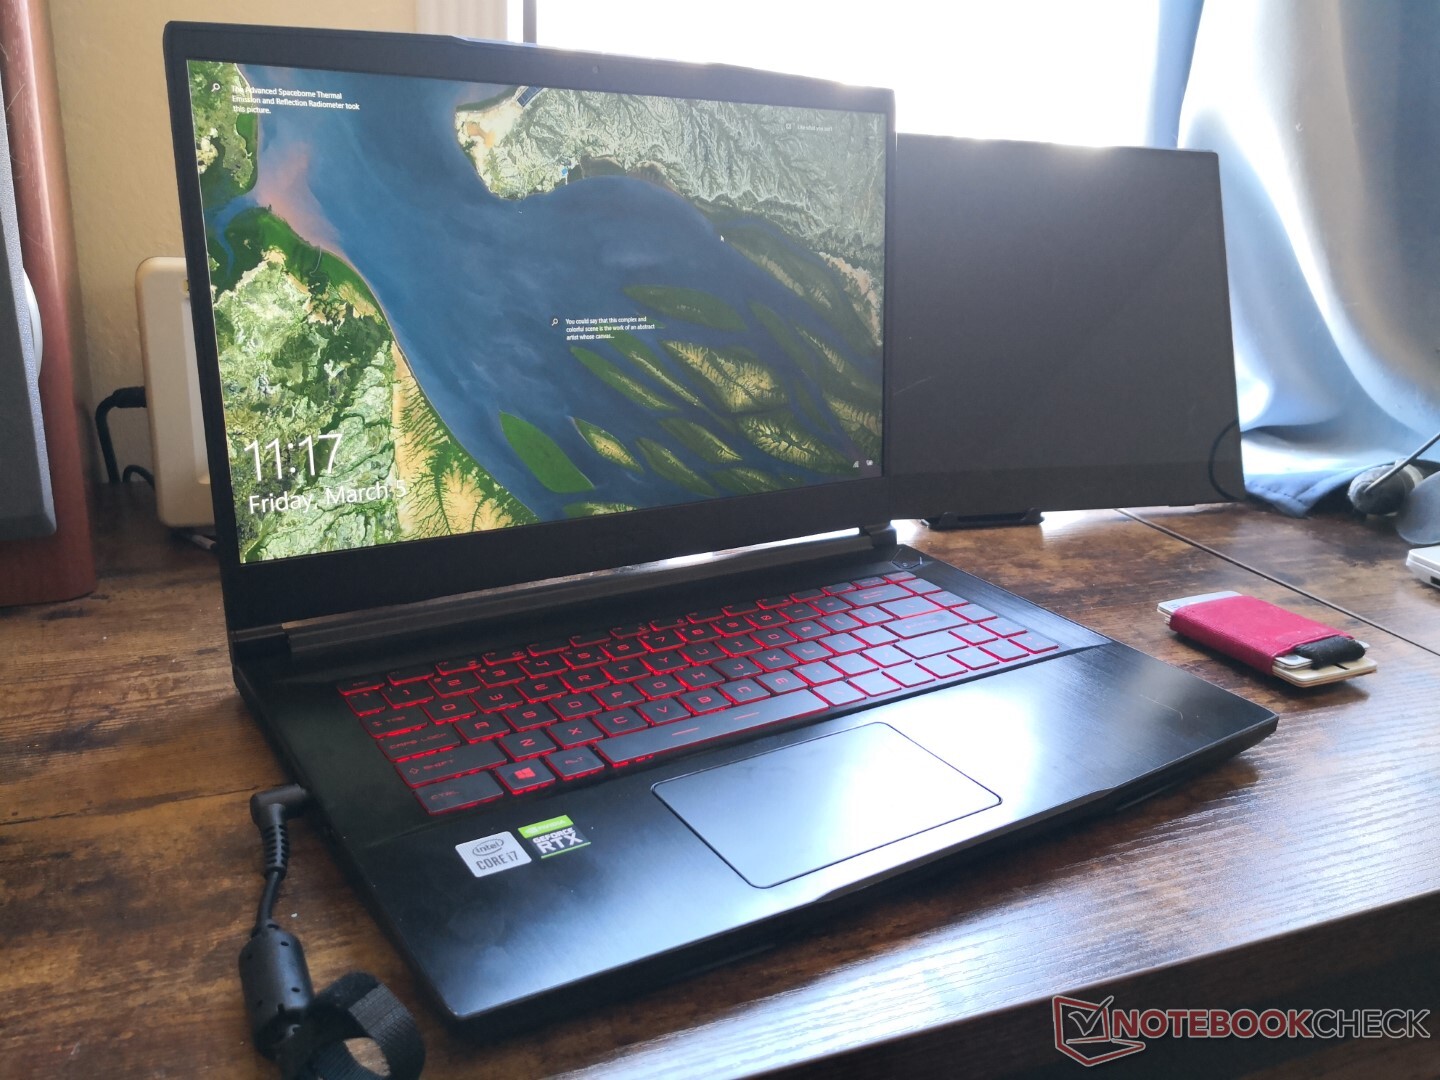
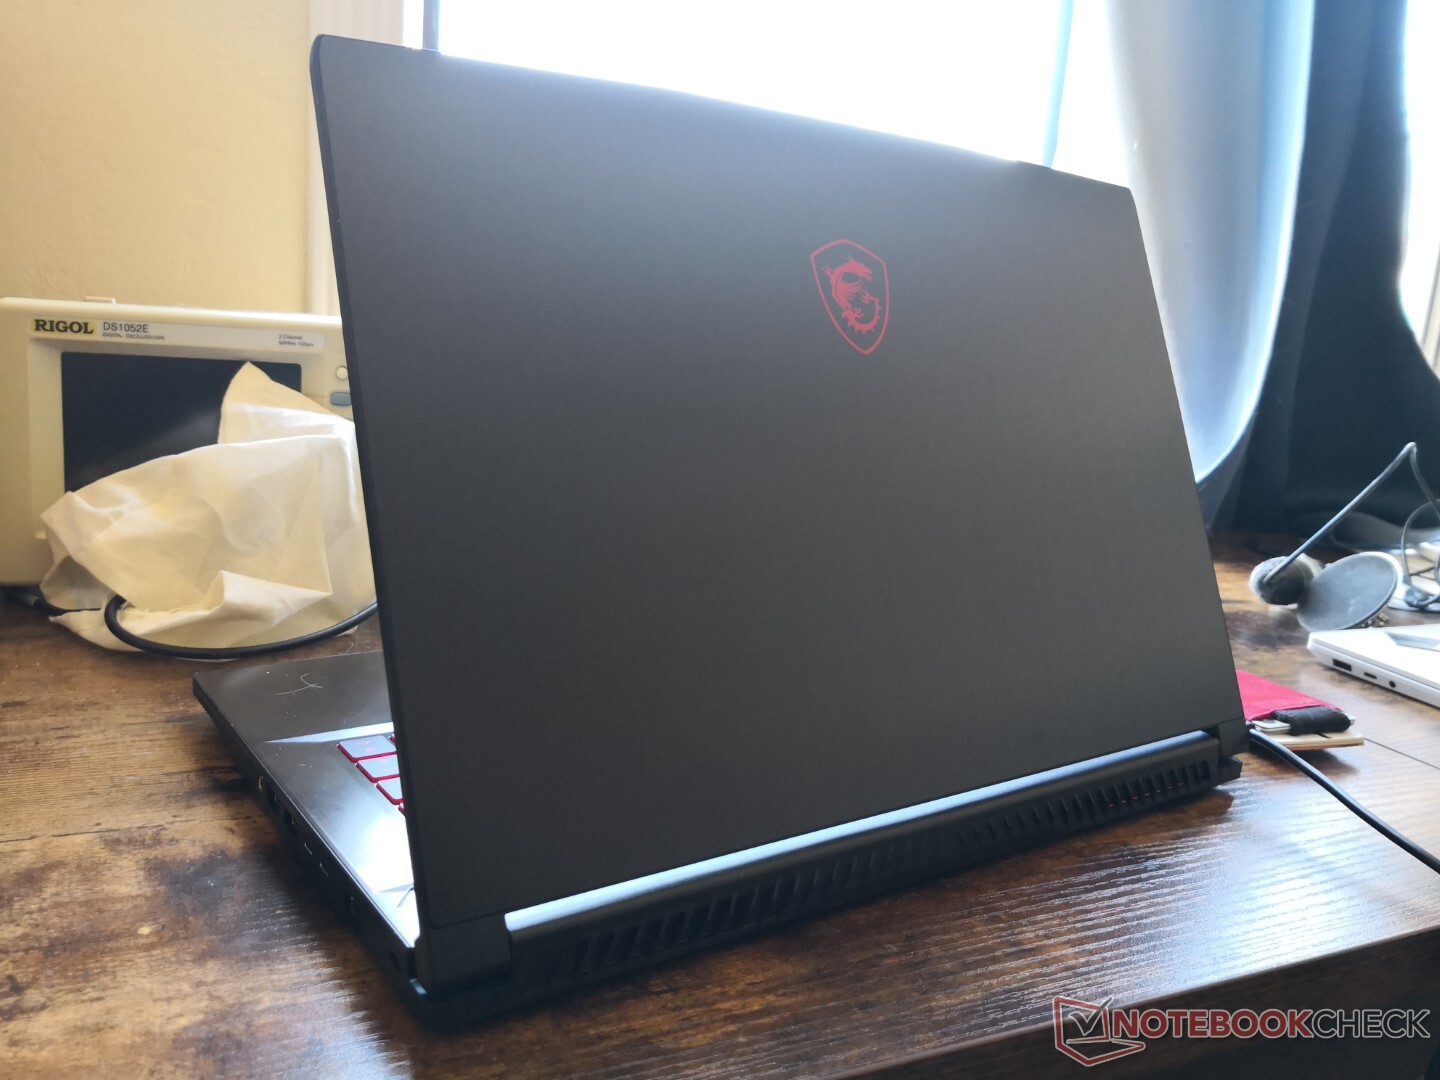
Externamente, el GF65 10UE lleva el mismo diseño de chasis que el GF65 9SD de 2020, por lo que muchos de nuestros comentarios existentes siguen siendo válidos. Recomendamos consultar nuestro análisis de la versión 2020 para saber más sobre las características físicas del portátil.
La serie GF de MSI compite con otros portátiles de juego económicos como el Lenovo Legion 5, el Dell G5, el Acer Nitro 5 o la serie TUF de Asus.
Más análisis de MSI:
potential competitors in comparison
Valoración | Fecha | Modelo | Peso | Altura | Tamaño | Resolución | Precio |
|---|---|---|---|---|---|---|---|
| 80.4 % v7 (old) | 03/2021 | MSI GF65 Thin 10UE i7-10750H, GeForce RTX 3060 Laptop GPU | 1.9 kg | 21.7 mm | 15.60" | 1920x1080 | |
| 85 % v7 (old) | 02/2021 | Asus ROG Strix G15 G513QR R9 5900HX, GeForce RTX 3070 Laptop GPU | 2.3 kg | 27.2 mm | 15.60" | 1920x1080 | |
| 84.9 % v7 (old) | 03/2021 | Schenker XMG Core 15 Ampere R7 4800H, GeForce RTX 3060 Laptop GPU | 2 kg | 22.9 mm | 15.60" | 2560x1440 | |
| 84 % v7 (old) | 02/2021 | MSI GS66 Stealth 10UG i7-10870H, GeForce RTX 3070 Laptop GPU | 2.1 kg | 19.8 mm | 15.60" | 1920x1080 | |
| 86.4 % v7 (old) | 02/2021 | Aorus 15G XC i7-10870H, GeForce RTX 3070 Laptop GPU | 2.1 kg | 23 mm | 15.60" | 1920x1080 | |
| 86.3 % v7 (old) | 12/2020 | Lenovo Legion 7 15IMH05-81YT001VGE i9-10980HK, GeForce RTX 2080 Super Max-Q | 2.4 kg | 19.9 mm | 15.60" | 1920x1080 |
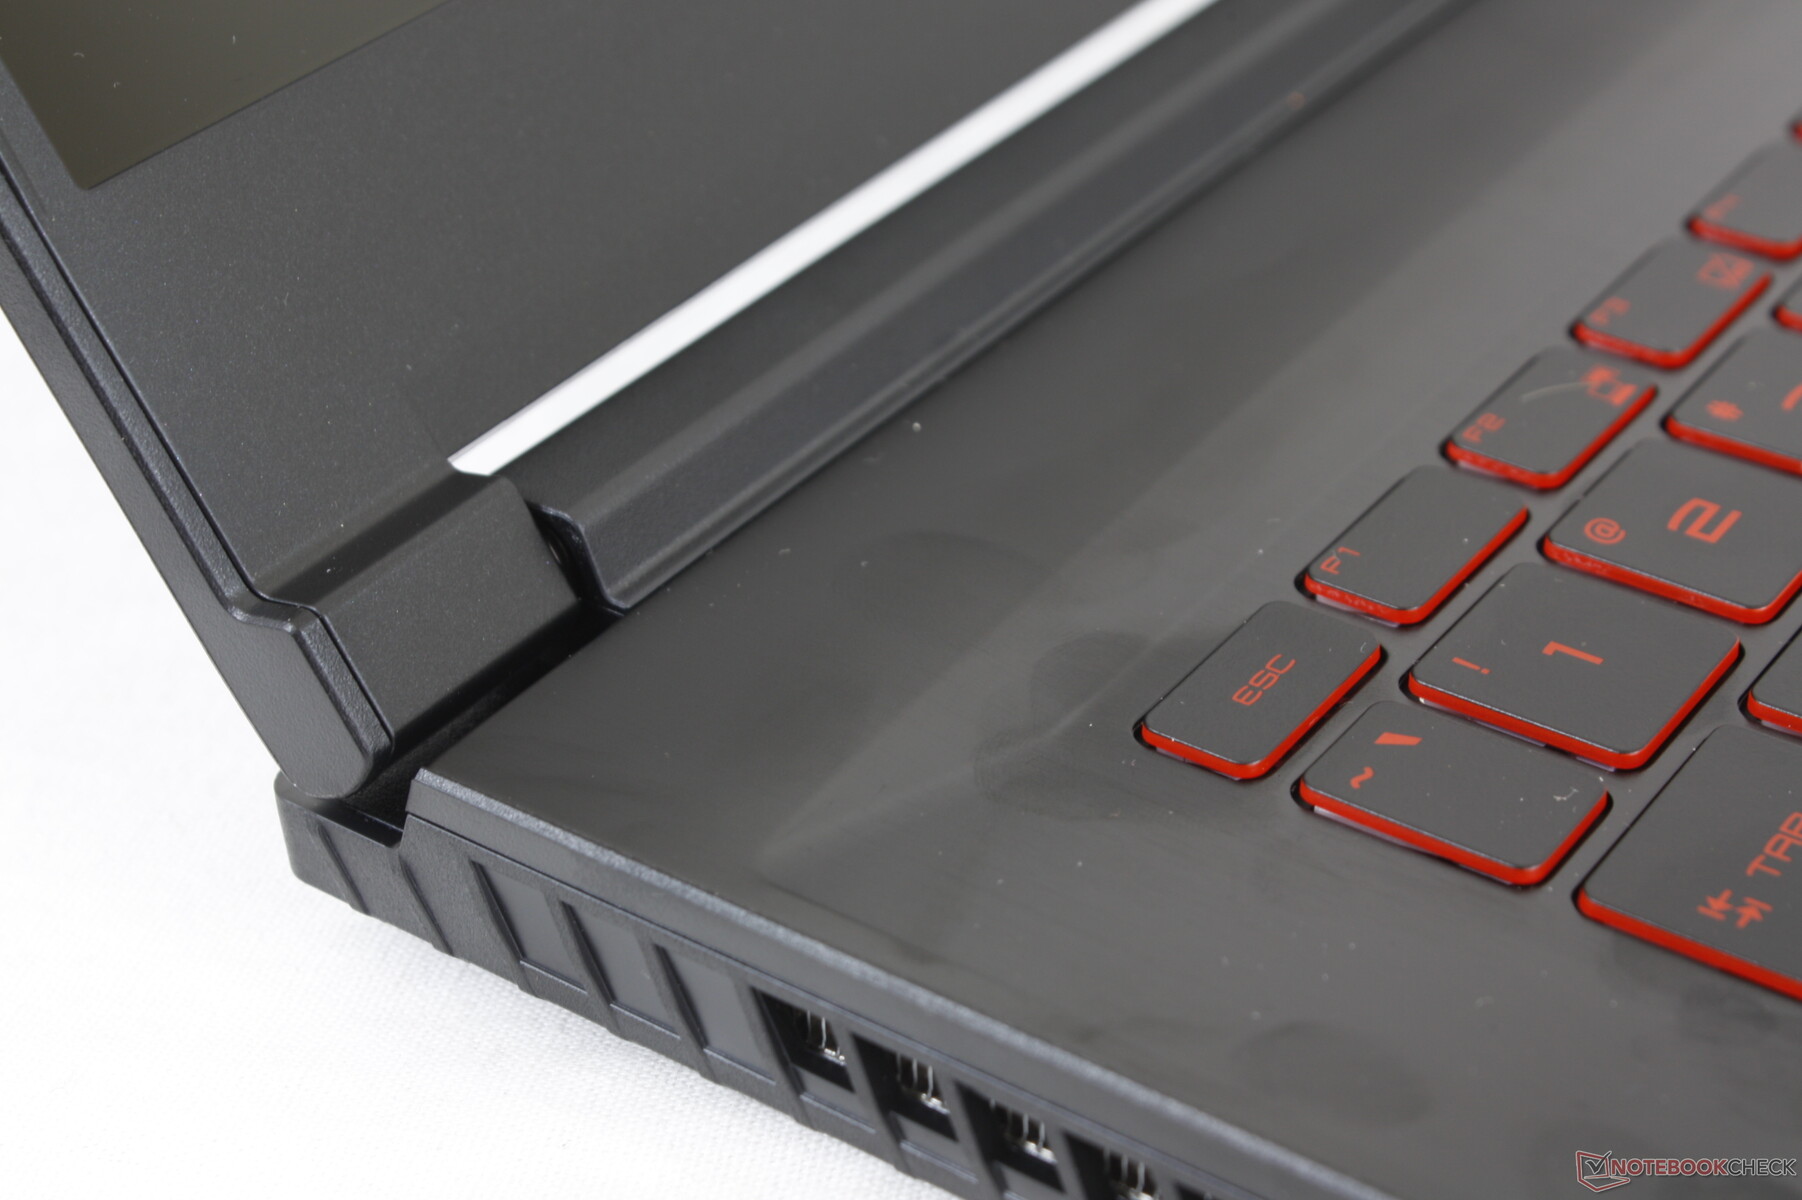
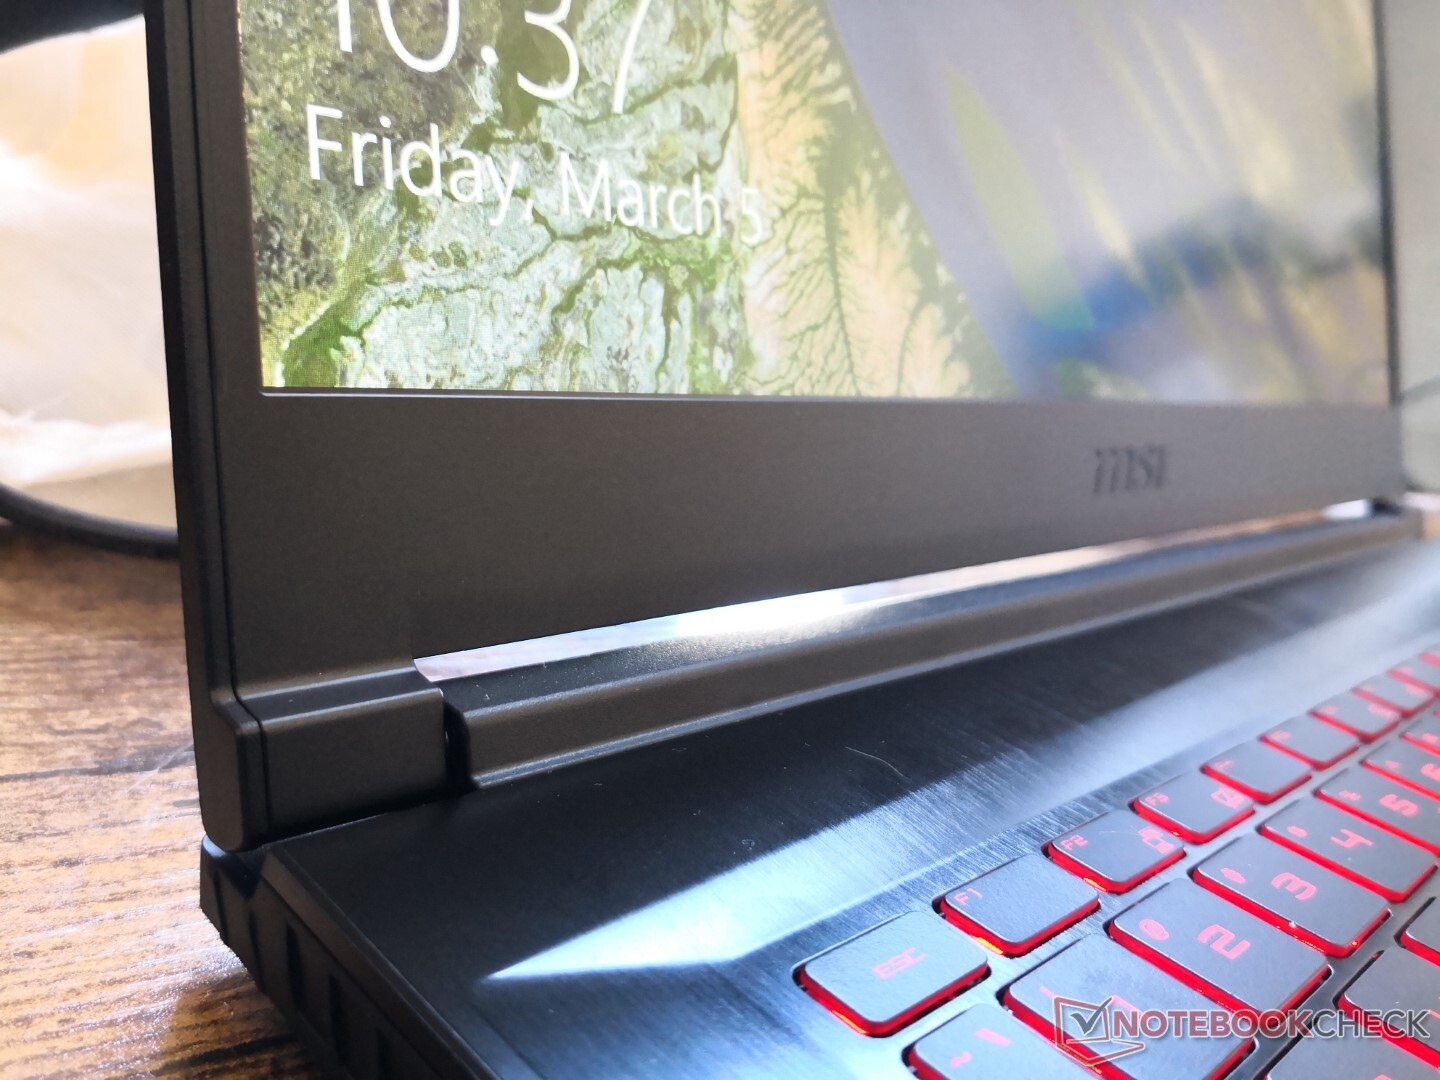
Caso
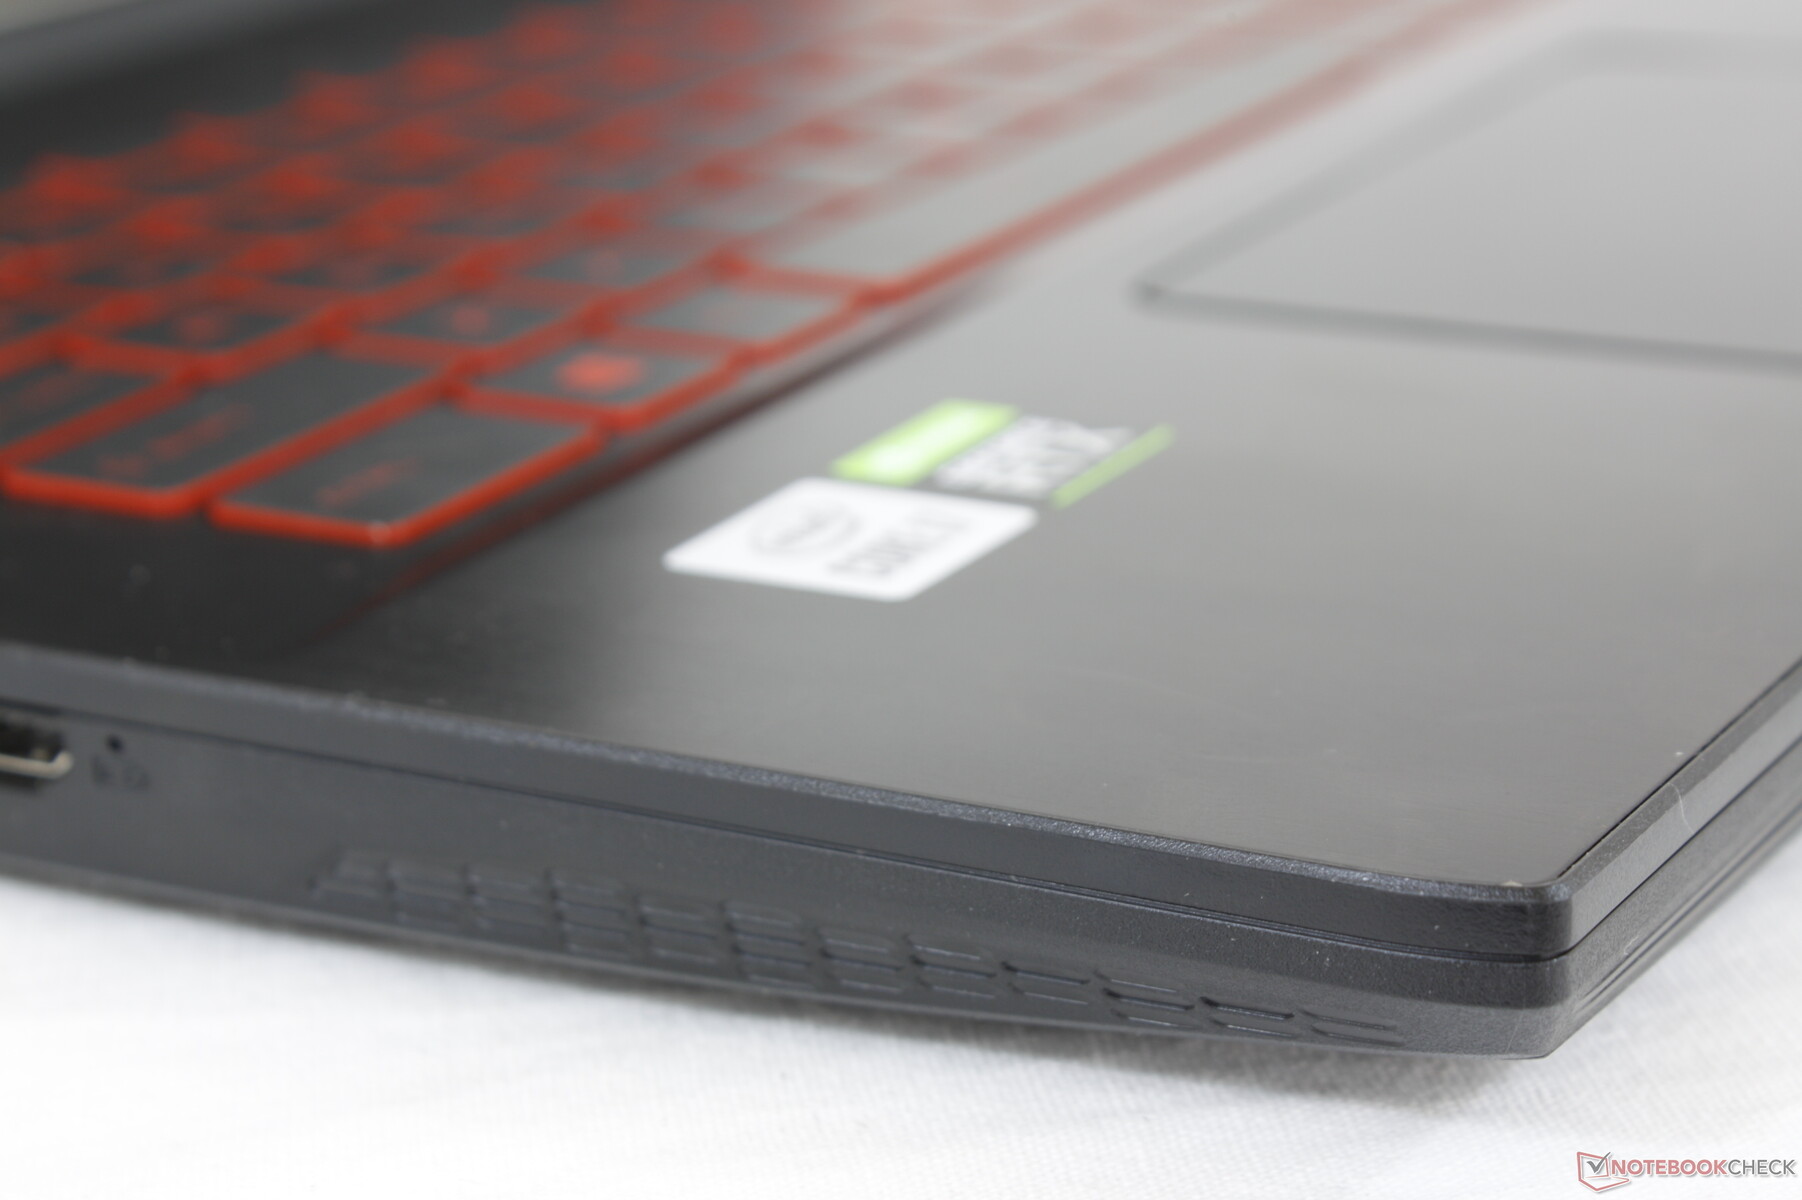
Las superficies se sienten delgadas y se deforman más fácilmente en comparación con los modelos de gama alta de MSI de las series GE o GT. El GF65 no parece tan lujoso como resultado, lo que es de esperar de un portátil de juegos de nivel básico. Los modelos TUF de la competencia, que son ligeramente más pesados, se sienten más robustos.

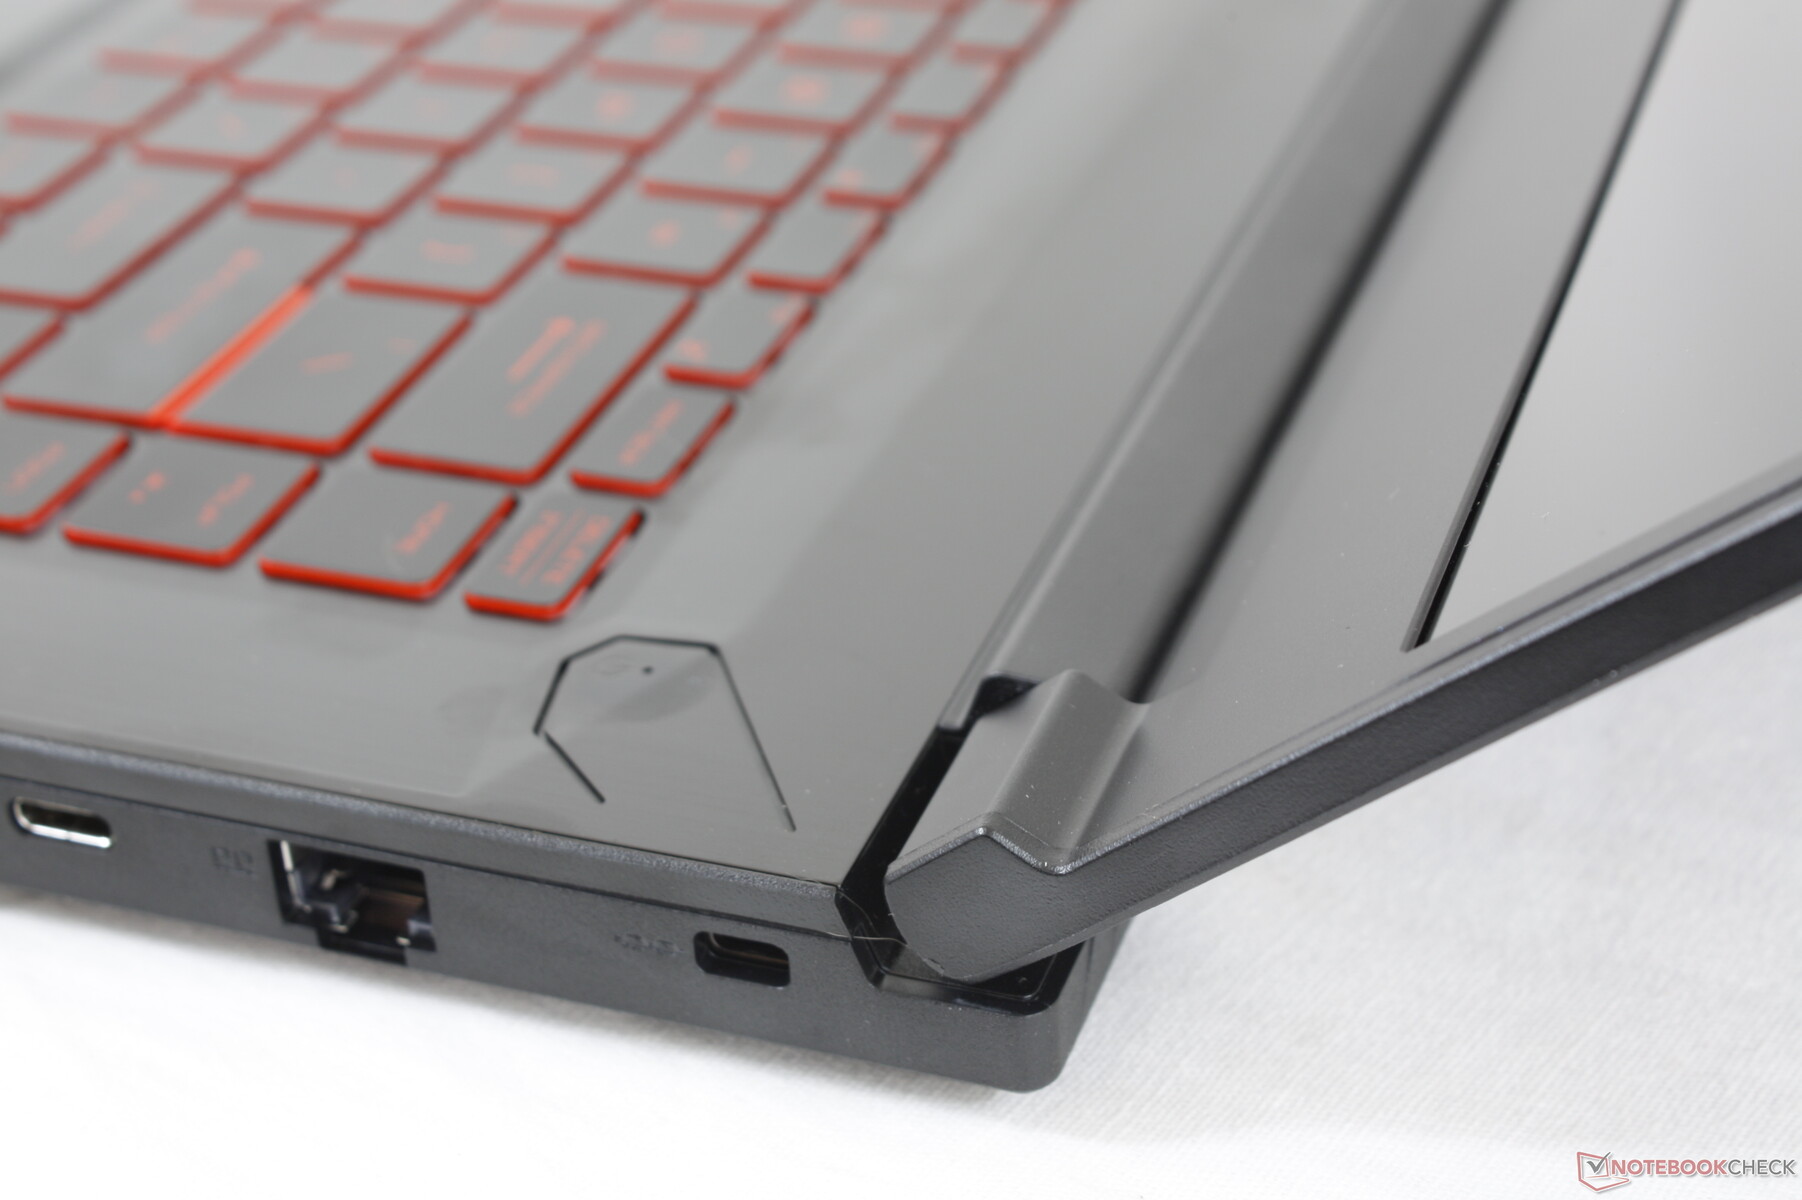
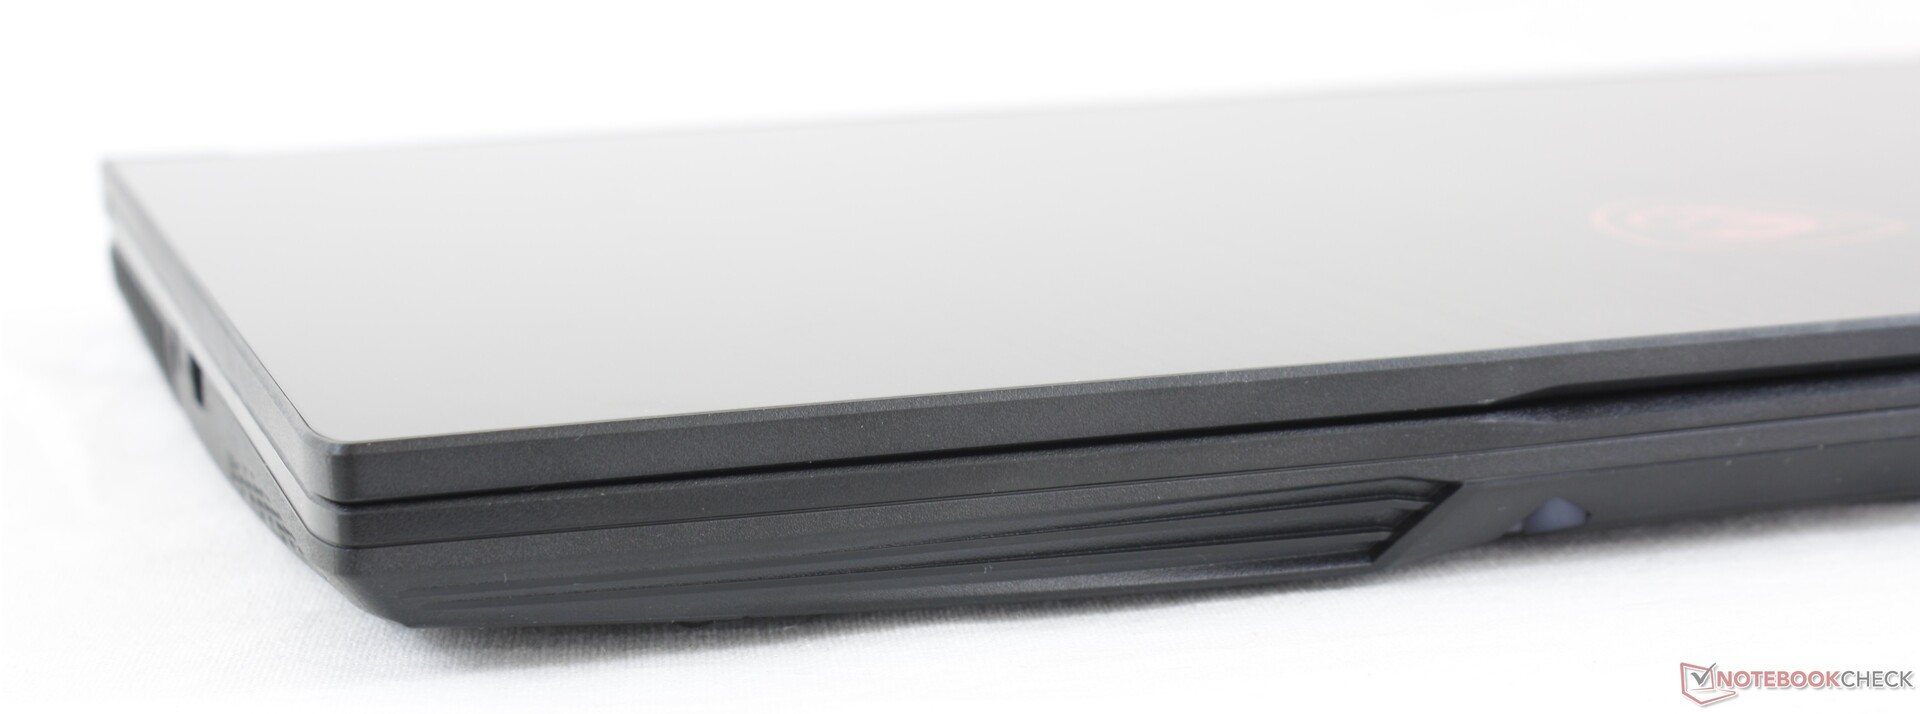
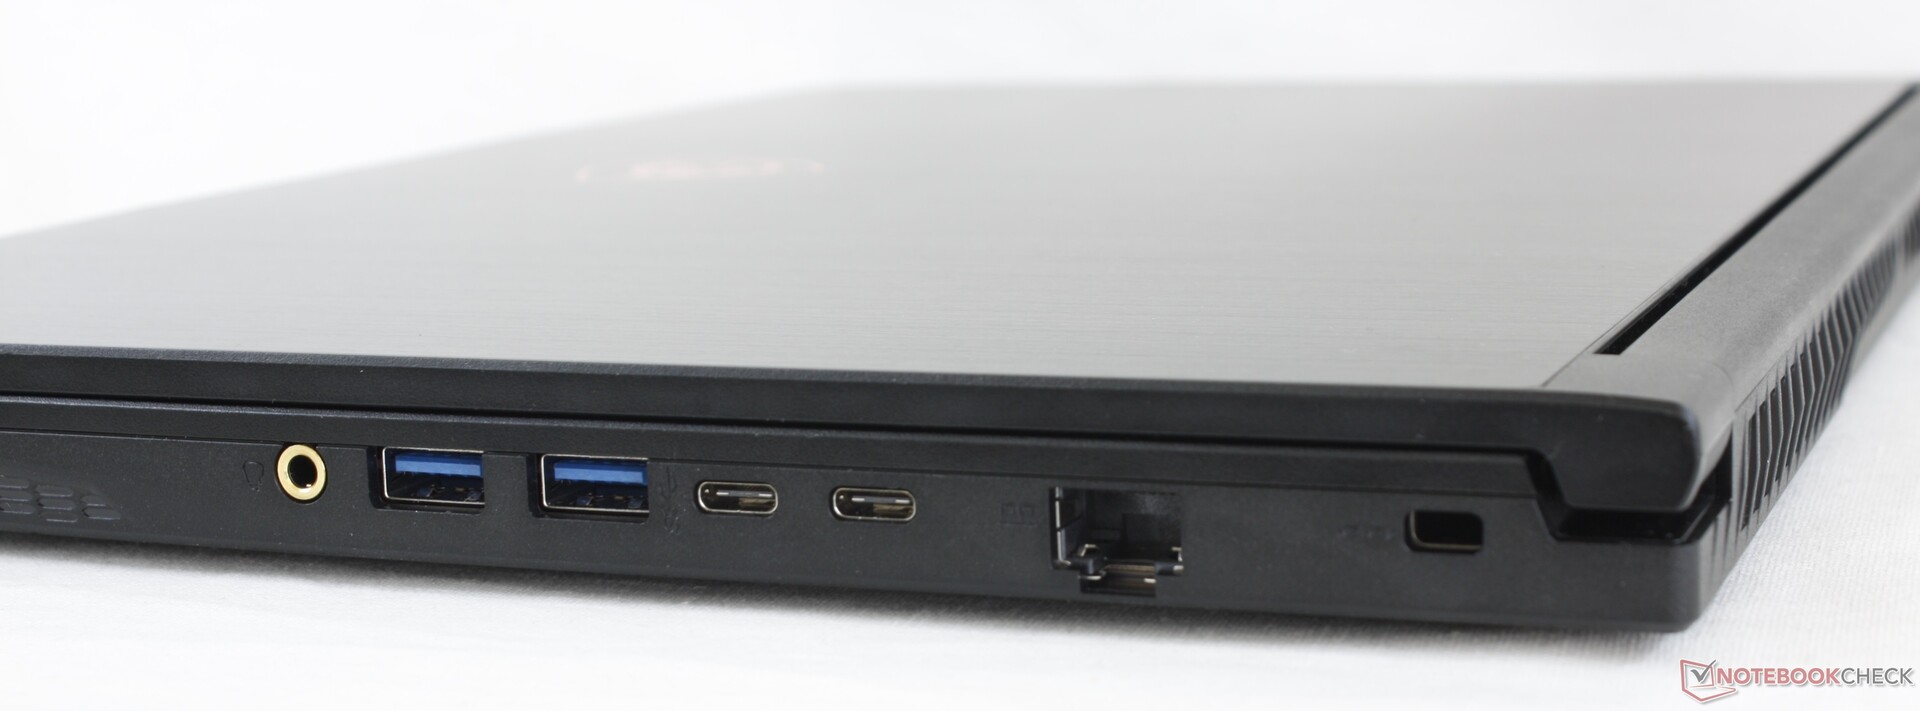
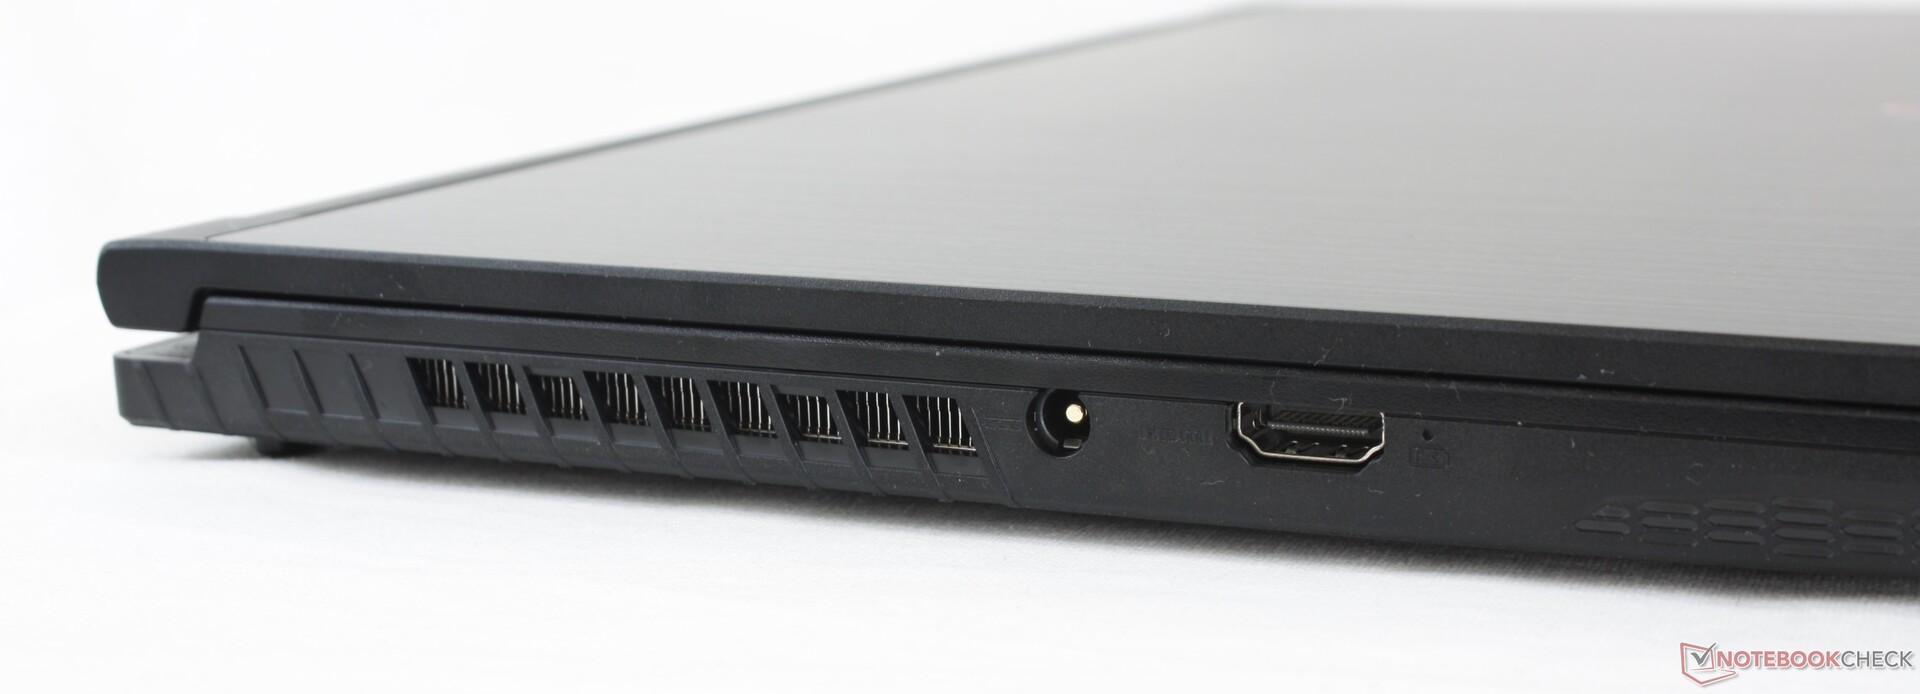
Conectividad
Las opciones de puerto siguen siendo idénticas salvo por un cambio notable: el puerto HDMI 1.4 del GF65 9SD del año pasado se ha actualizado a HDMI 2.0 para que sea totalmente compatible con monitores externos a 4K60 FPS. Sin embargo, los puertos USB-C siguen siendo incompatibles con los monitores externos.
Comunicación
Módulos de comunicación por cable e inalámbricos incorporados, soluciones alternativas disponibles (UMTS)..., Irregularidades (recepción de radio)..
Cámara web


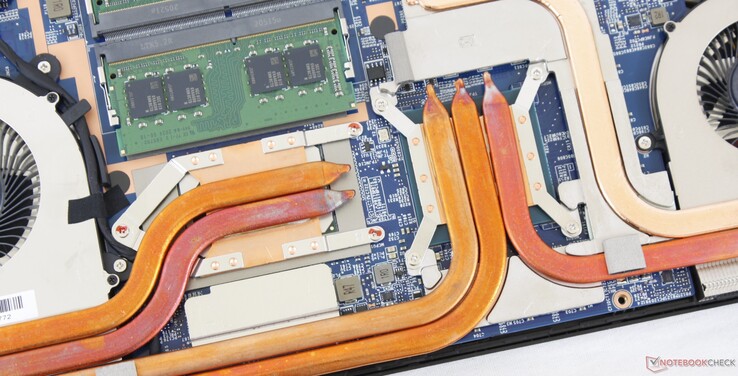
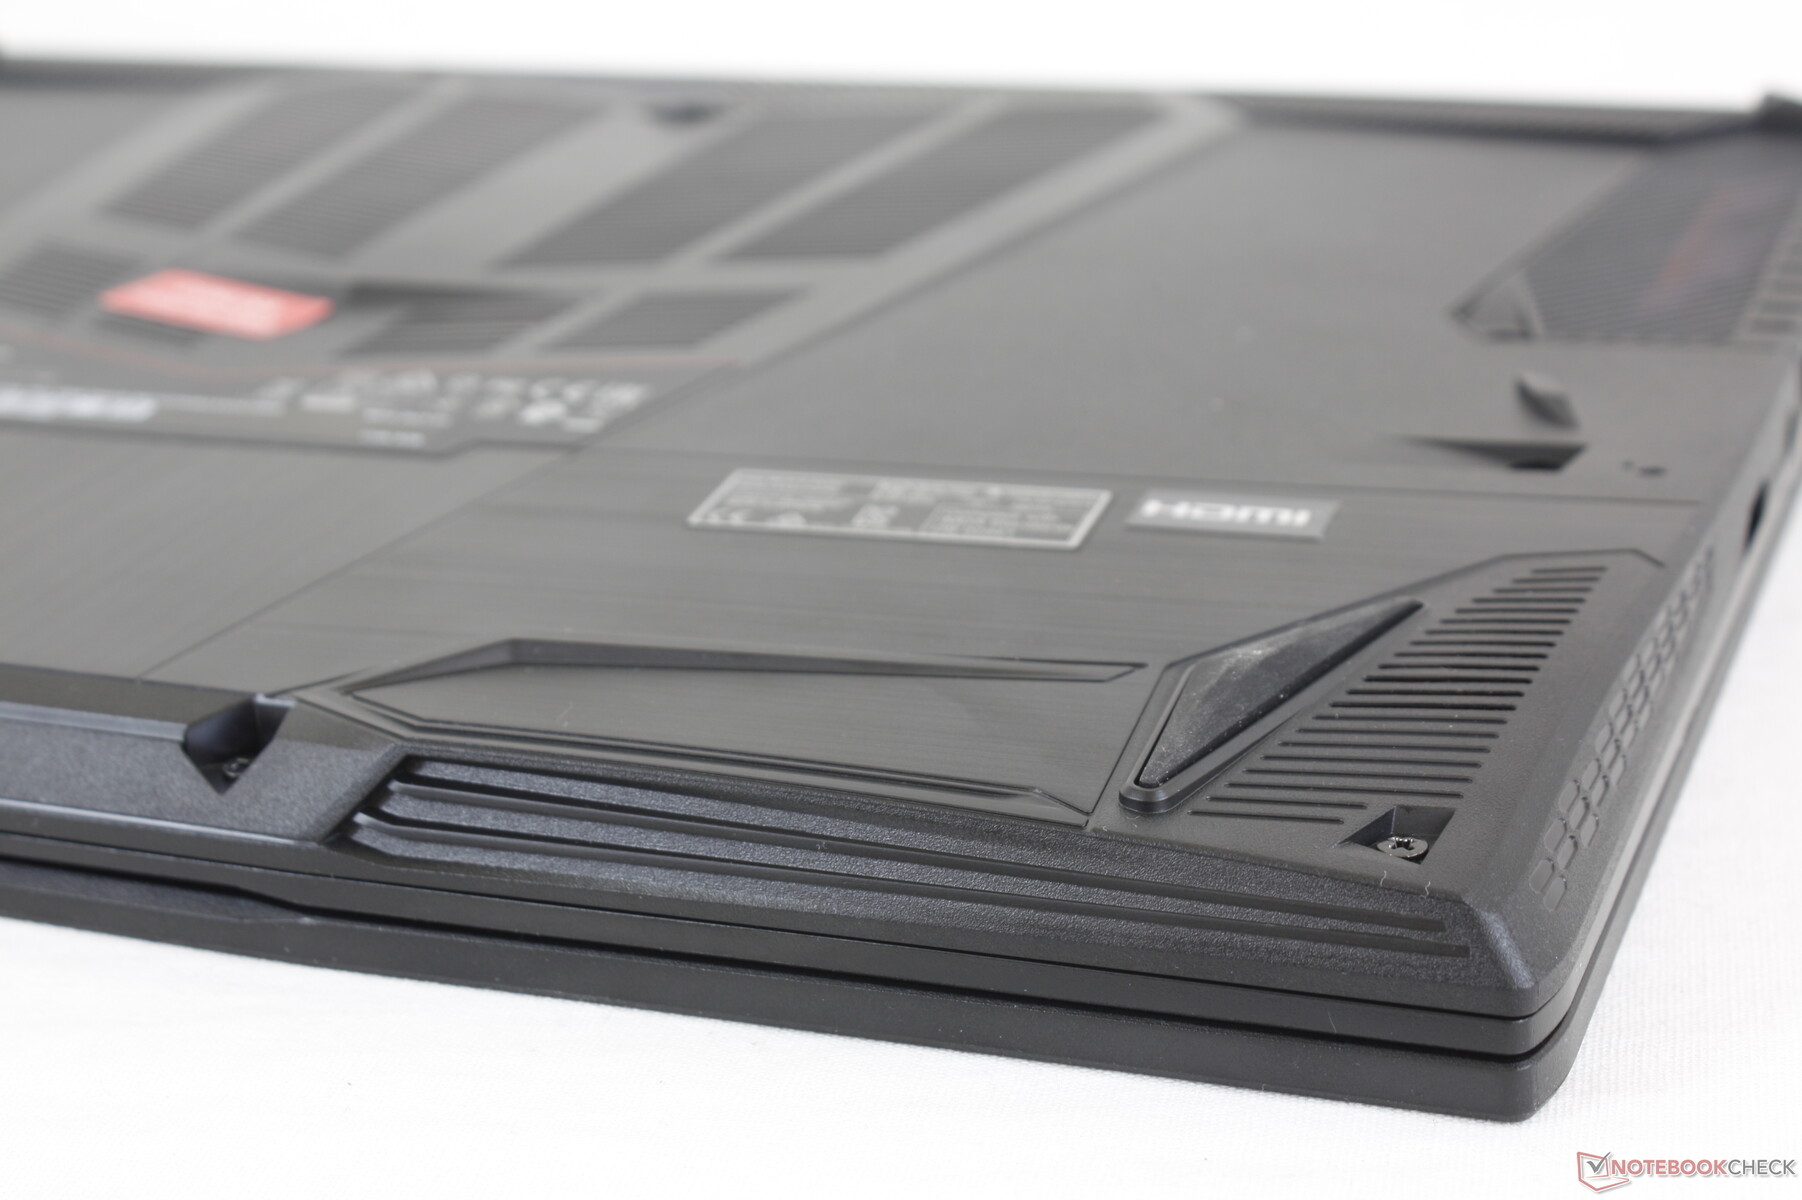
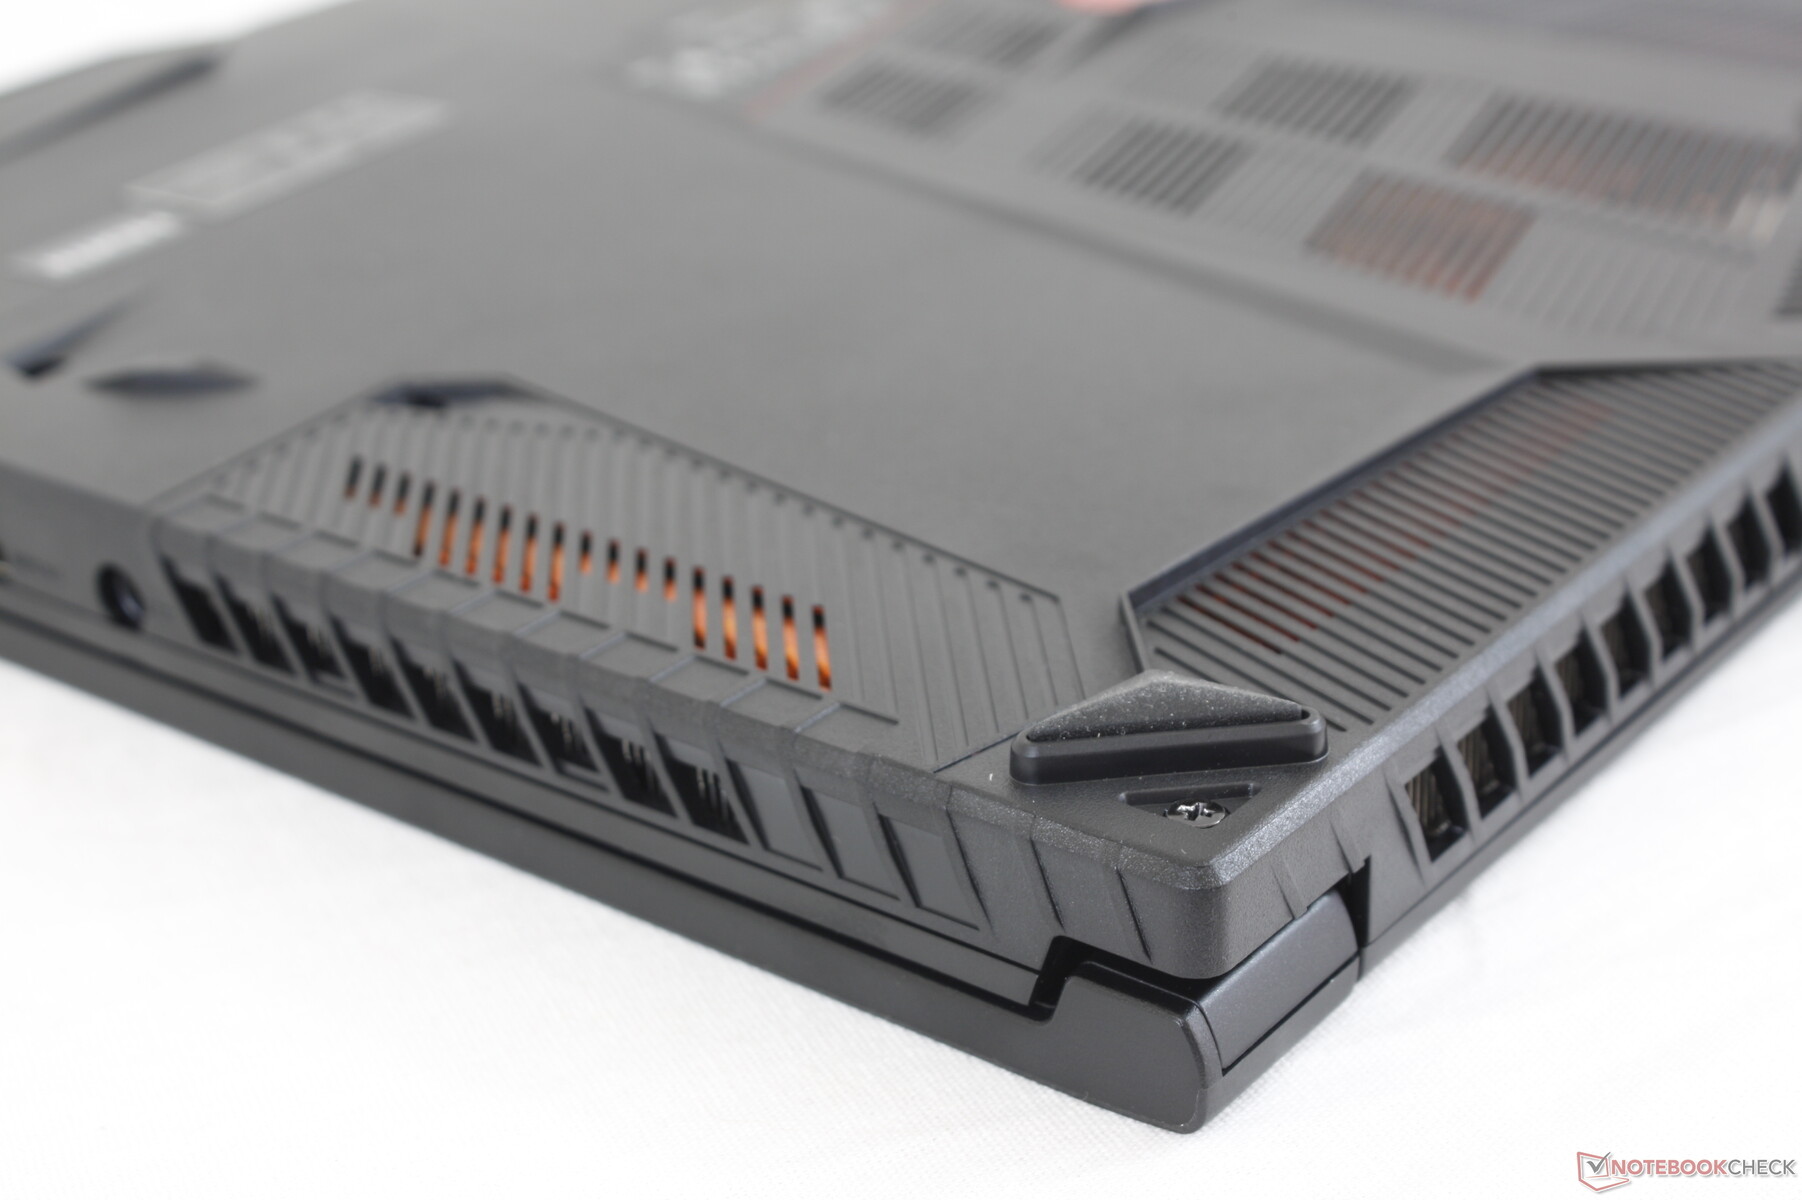
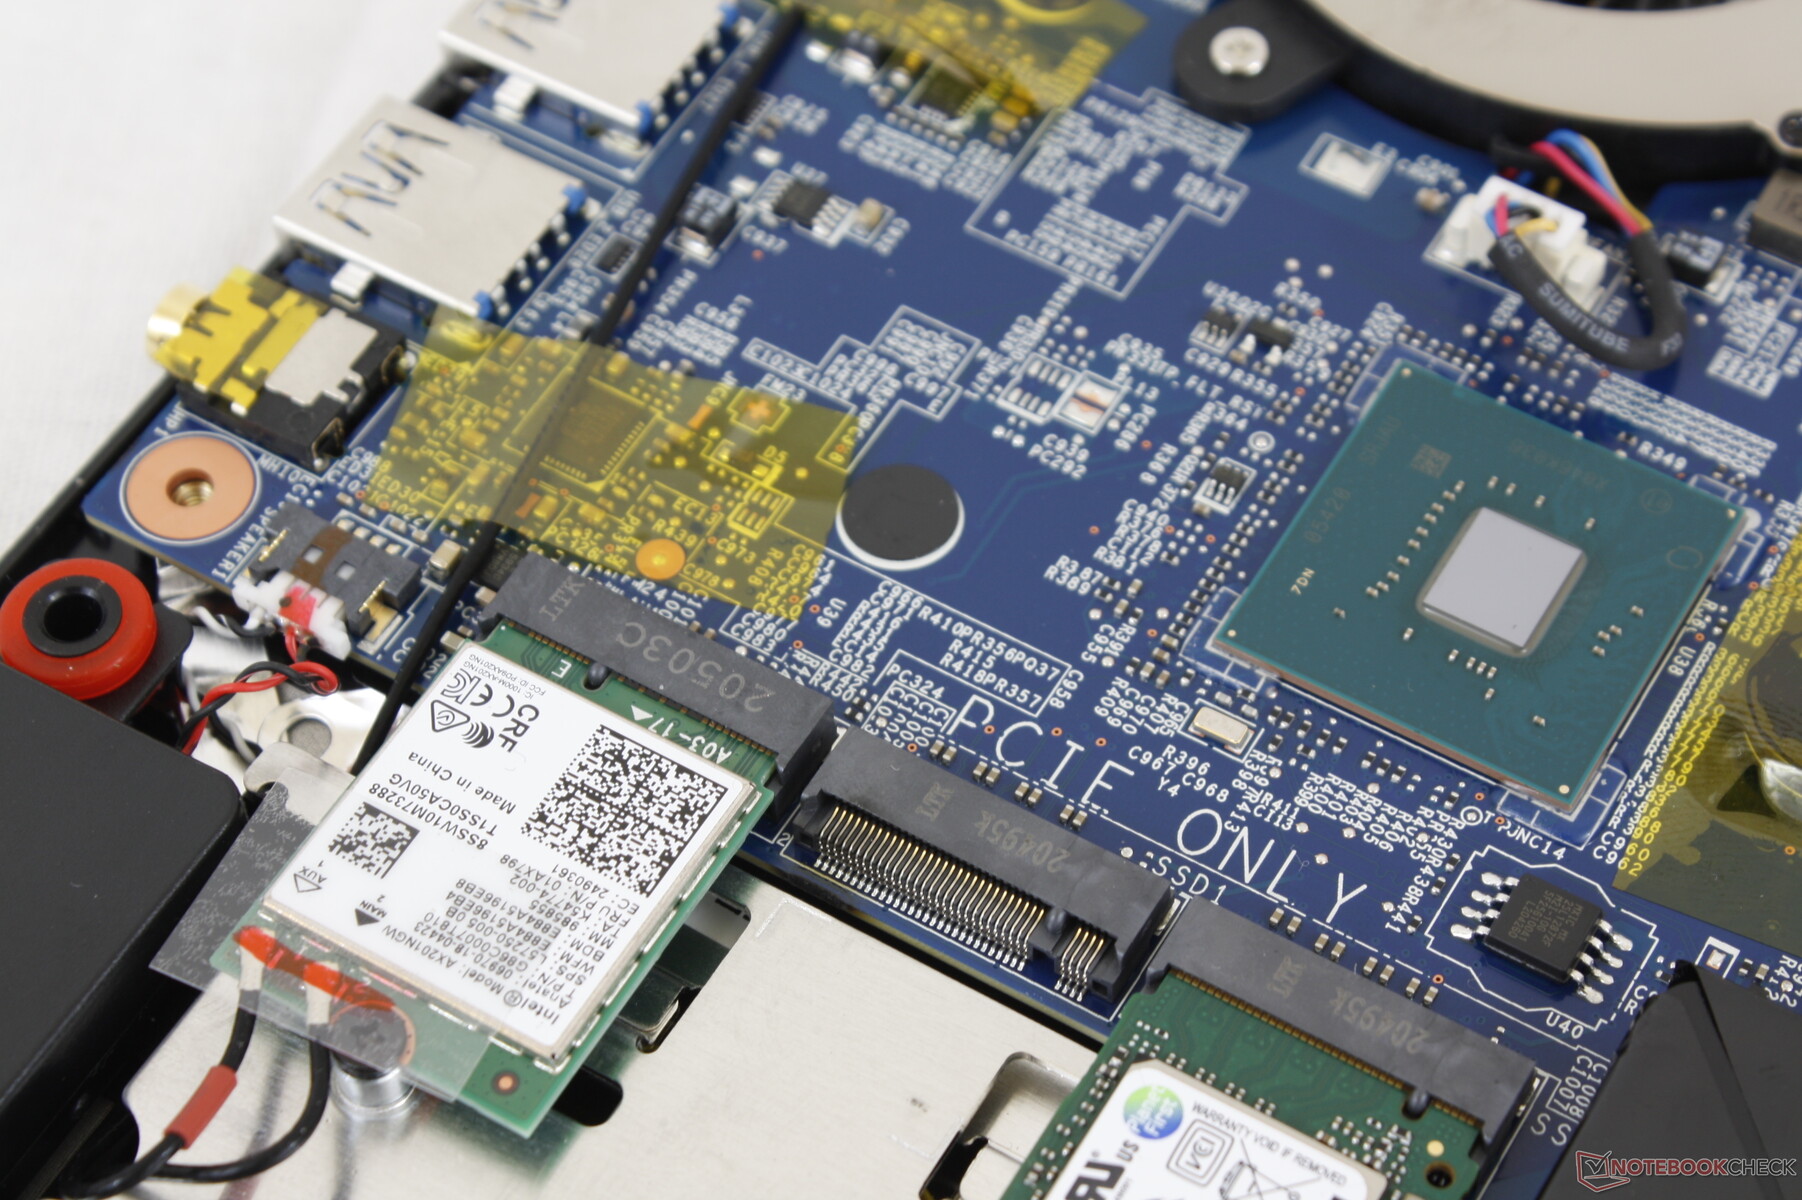
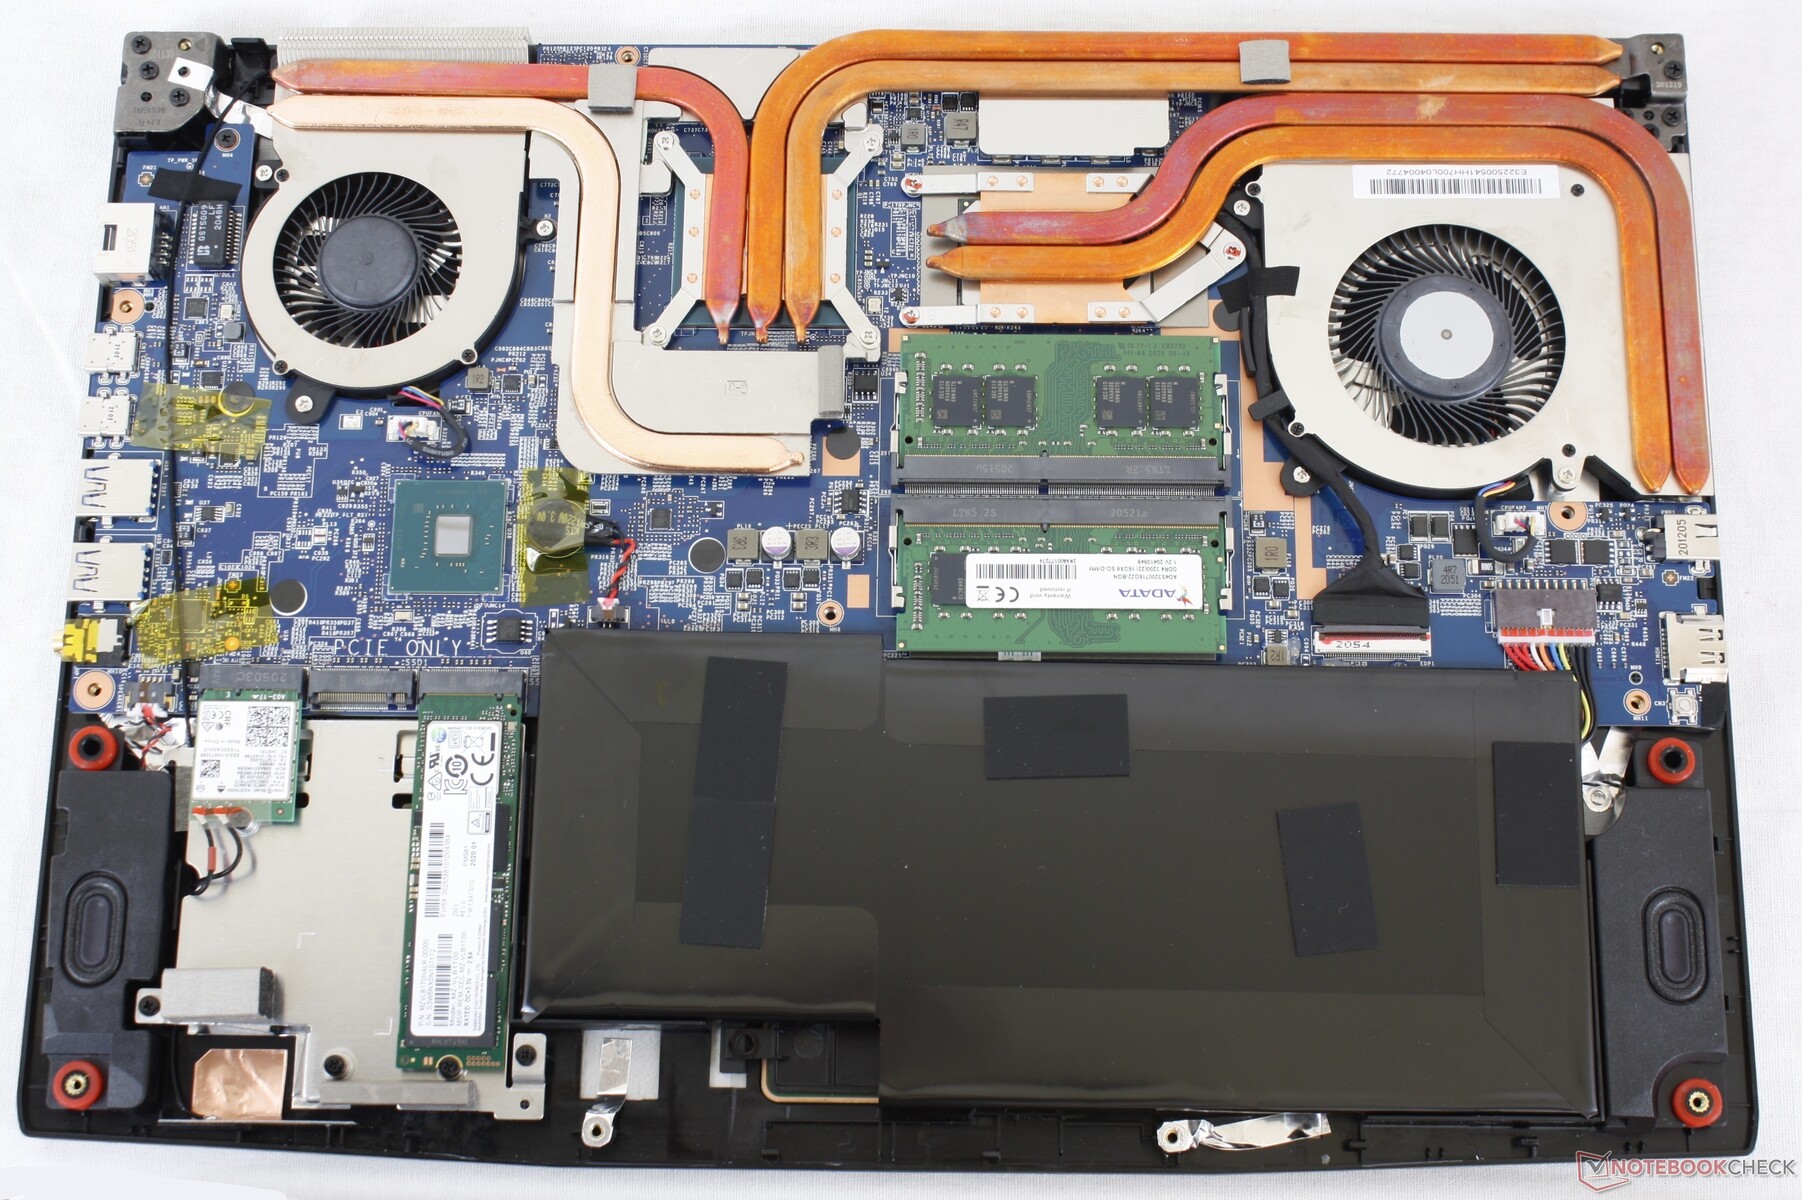
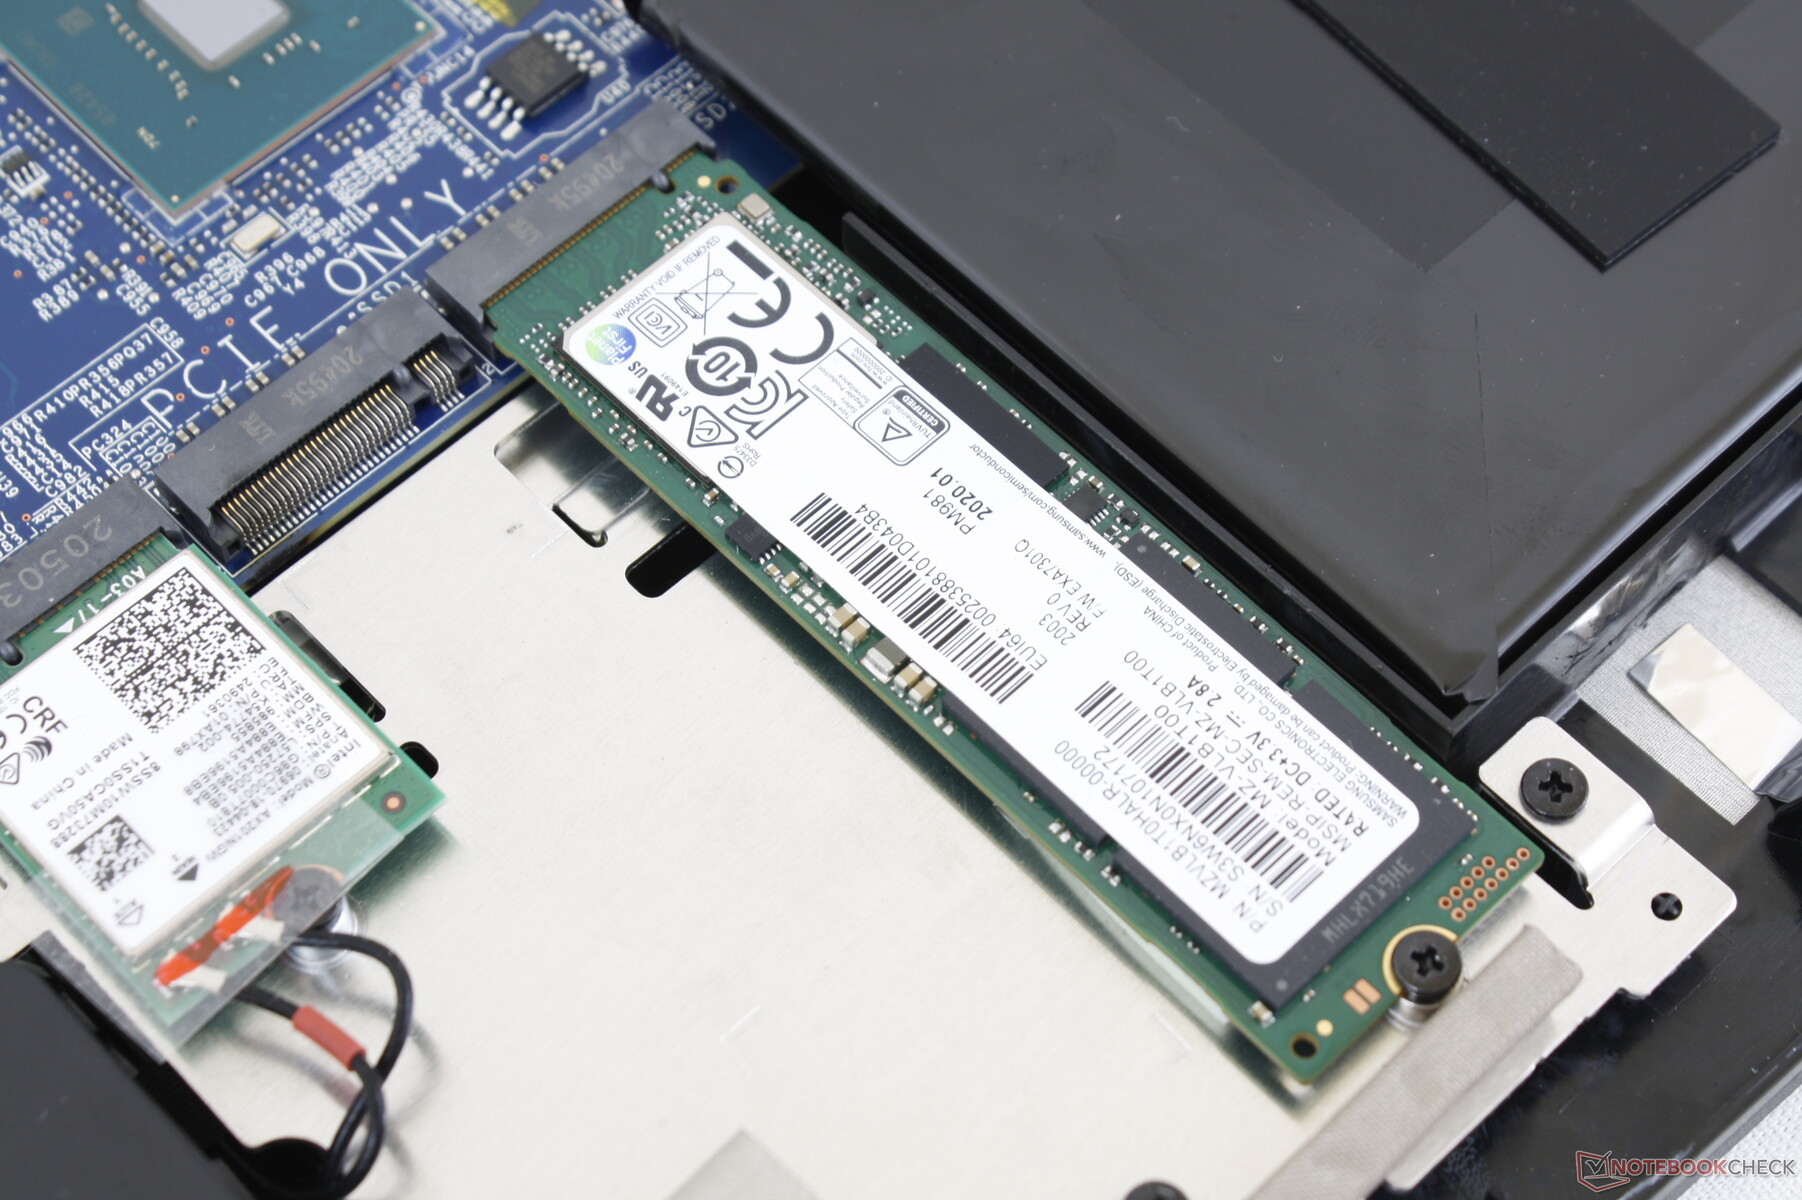
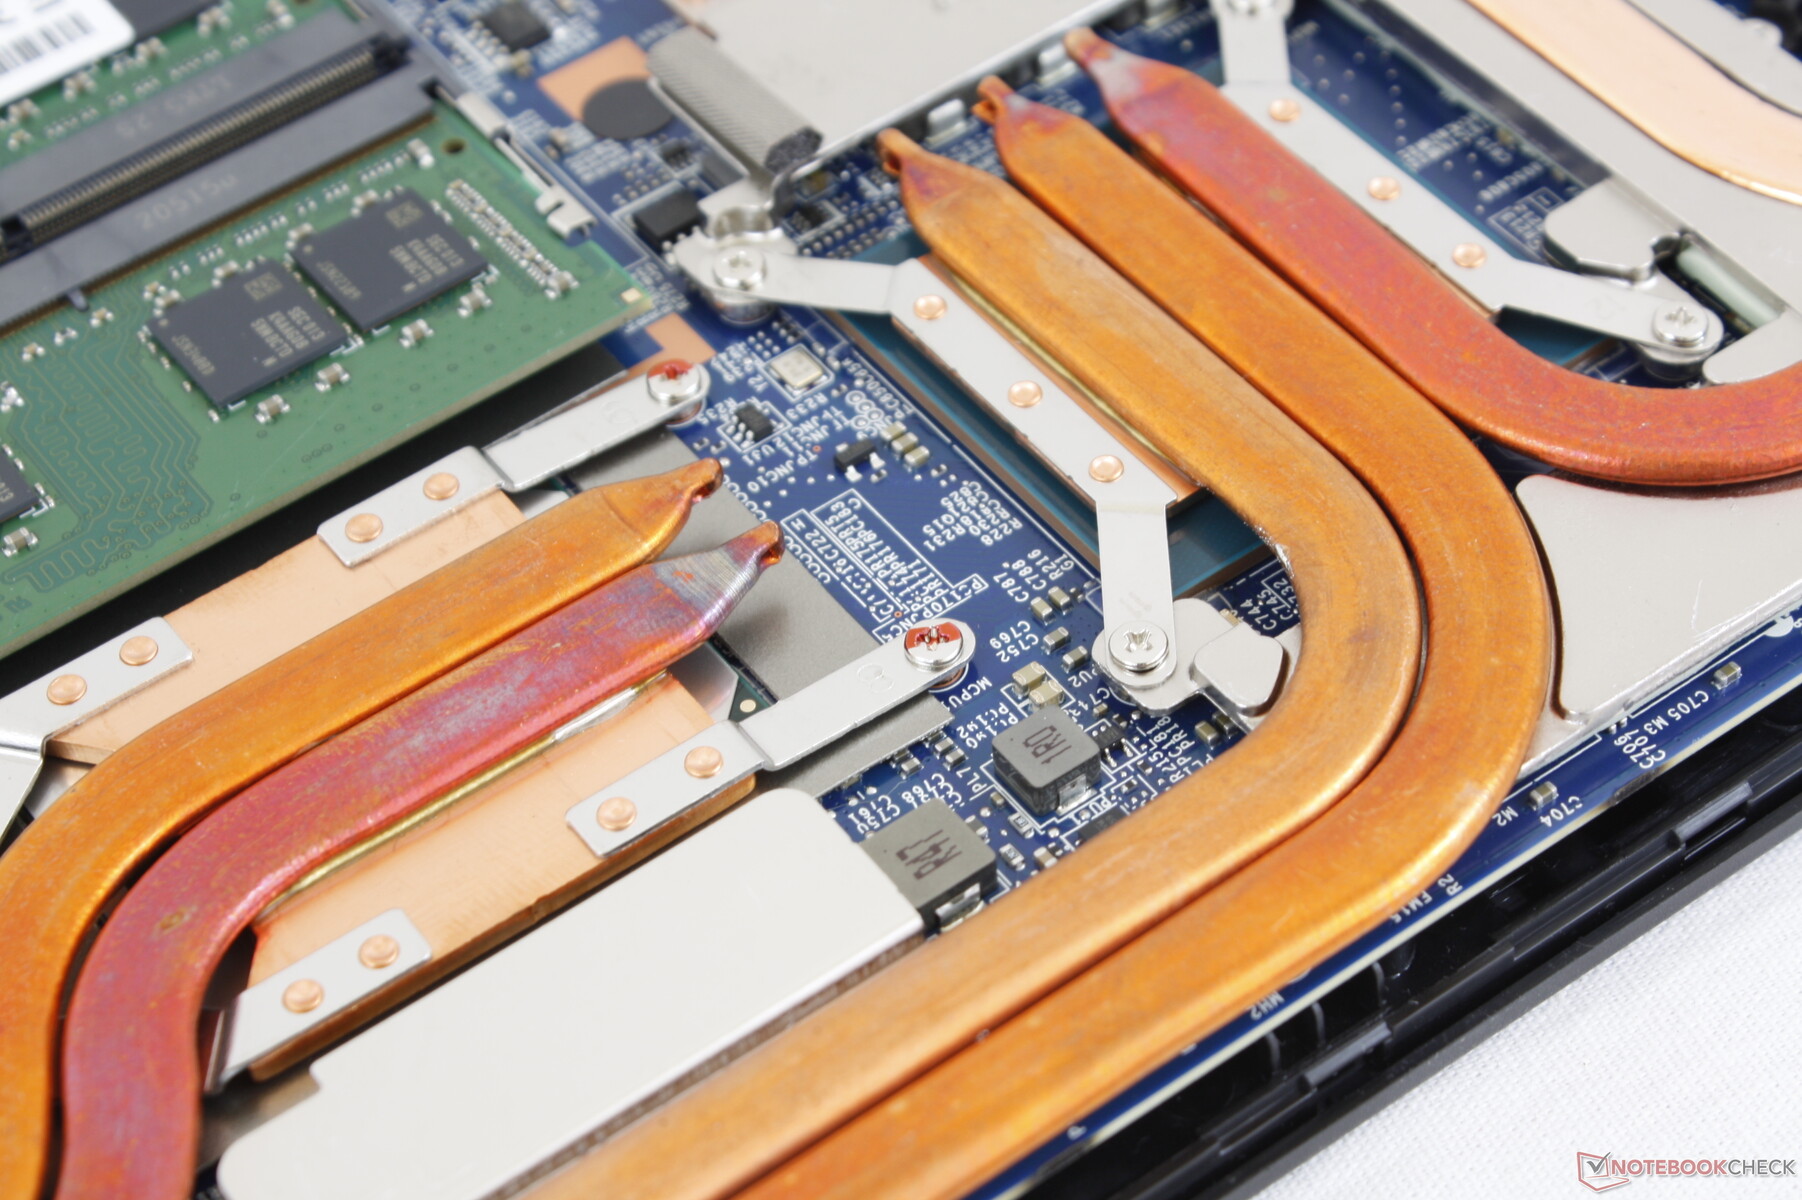
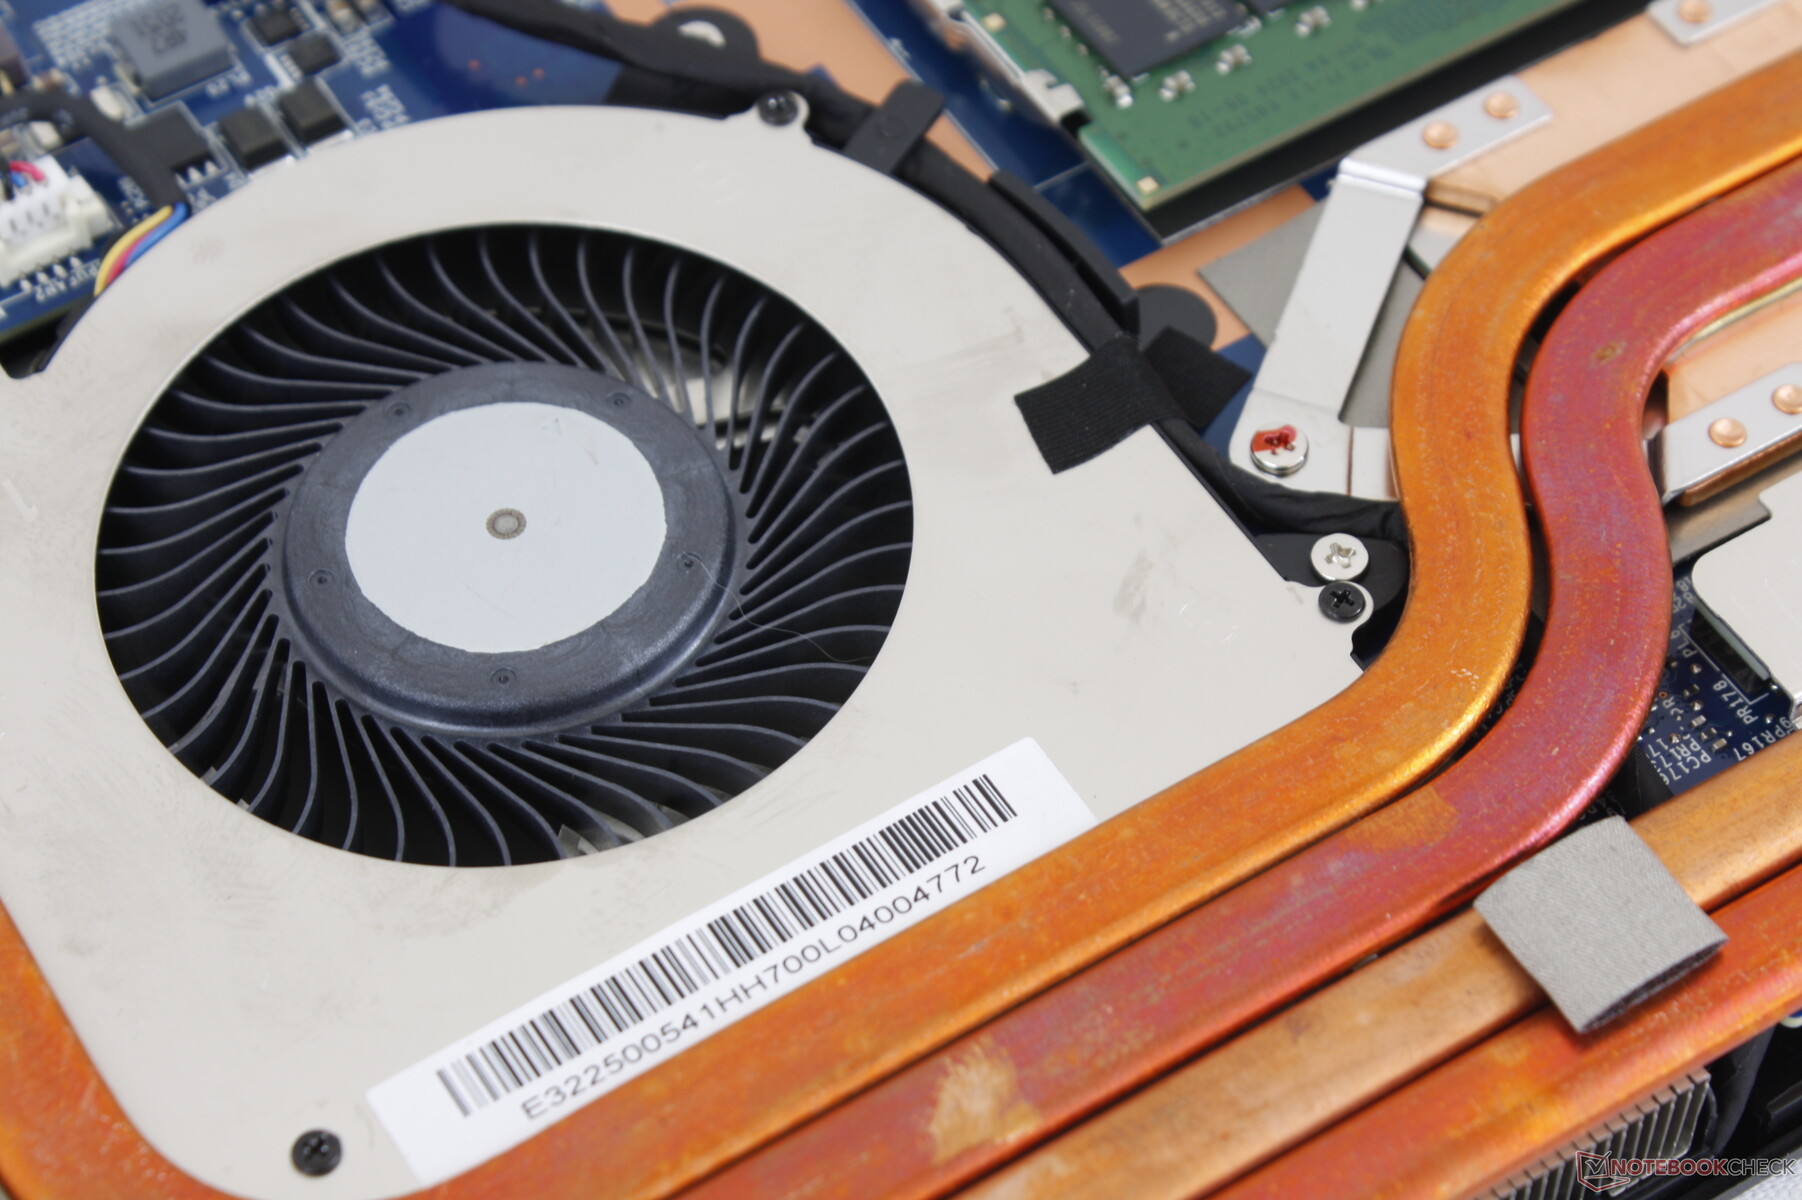
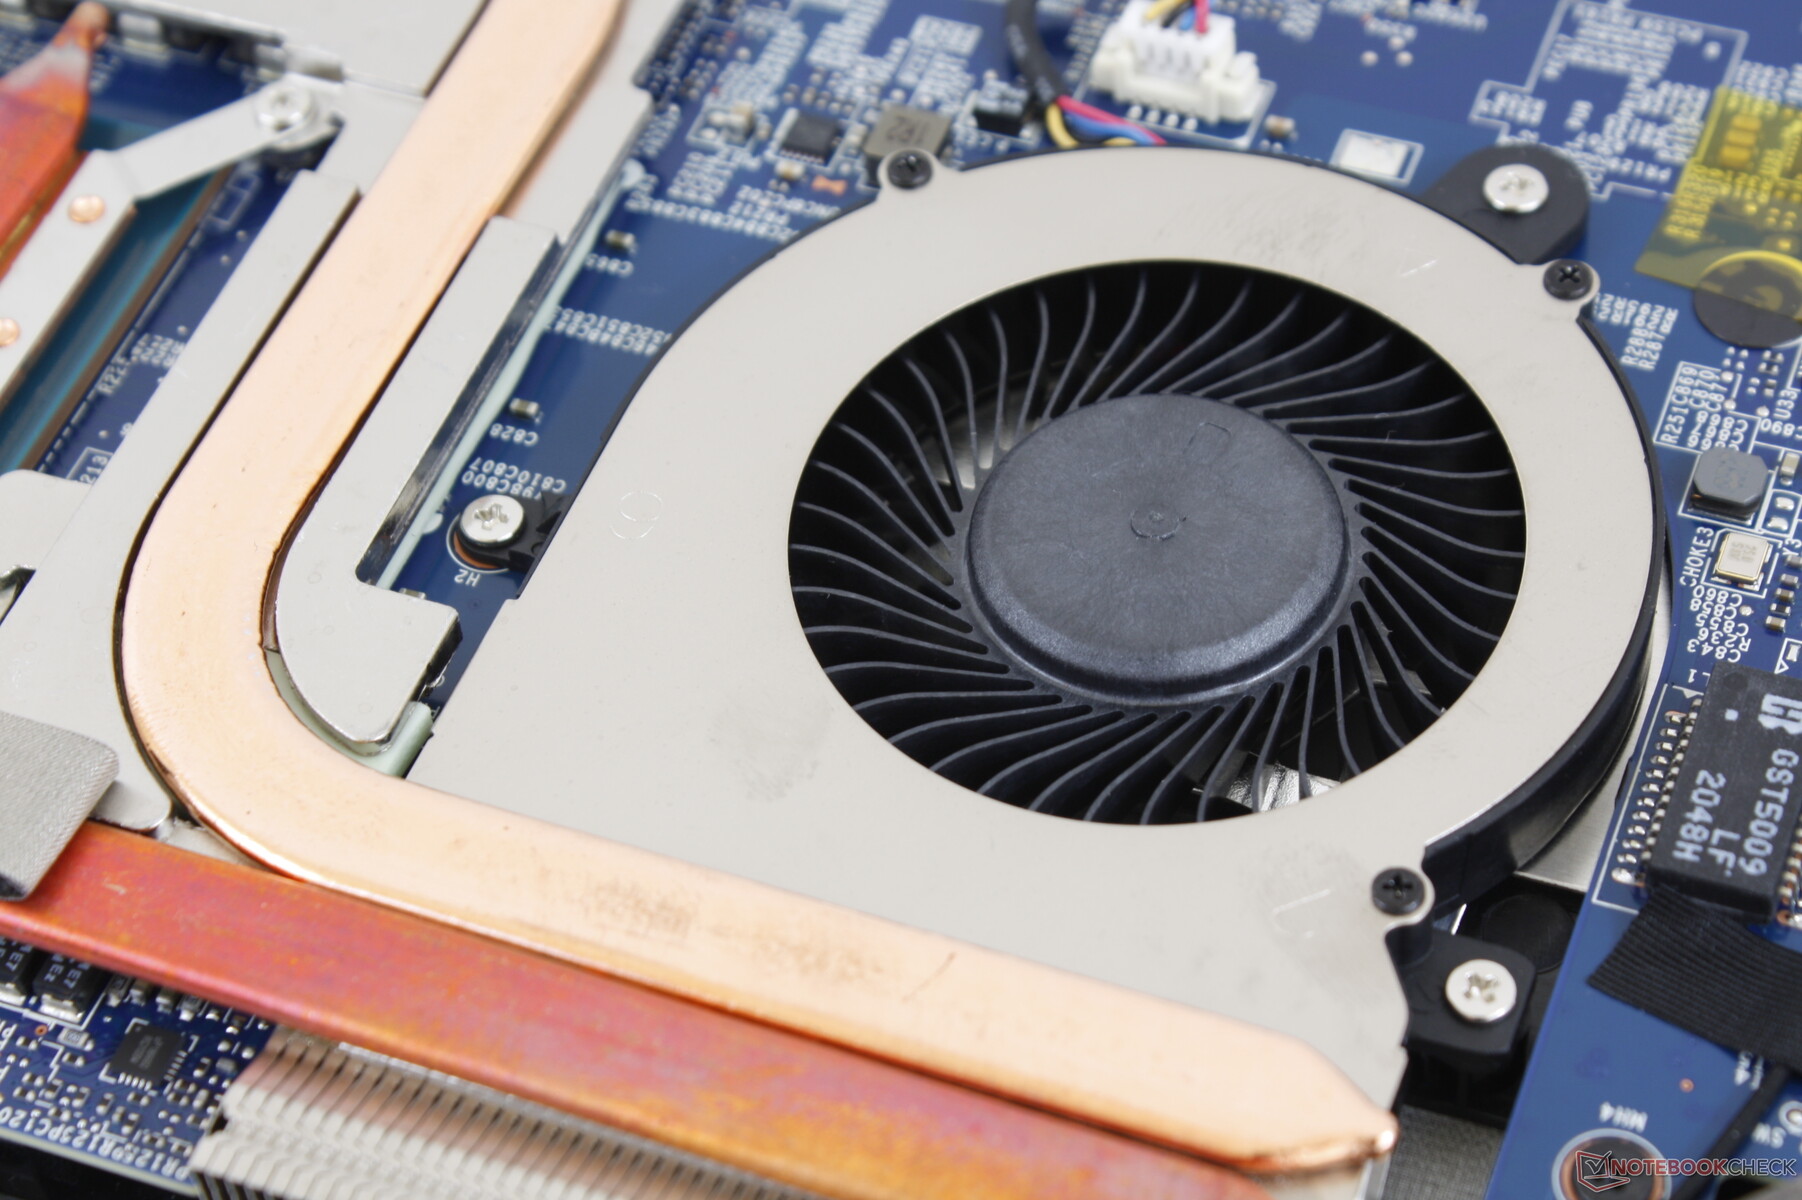
Mantenimiento
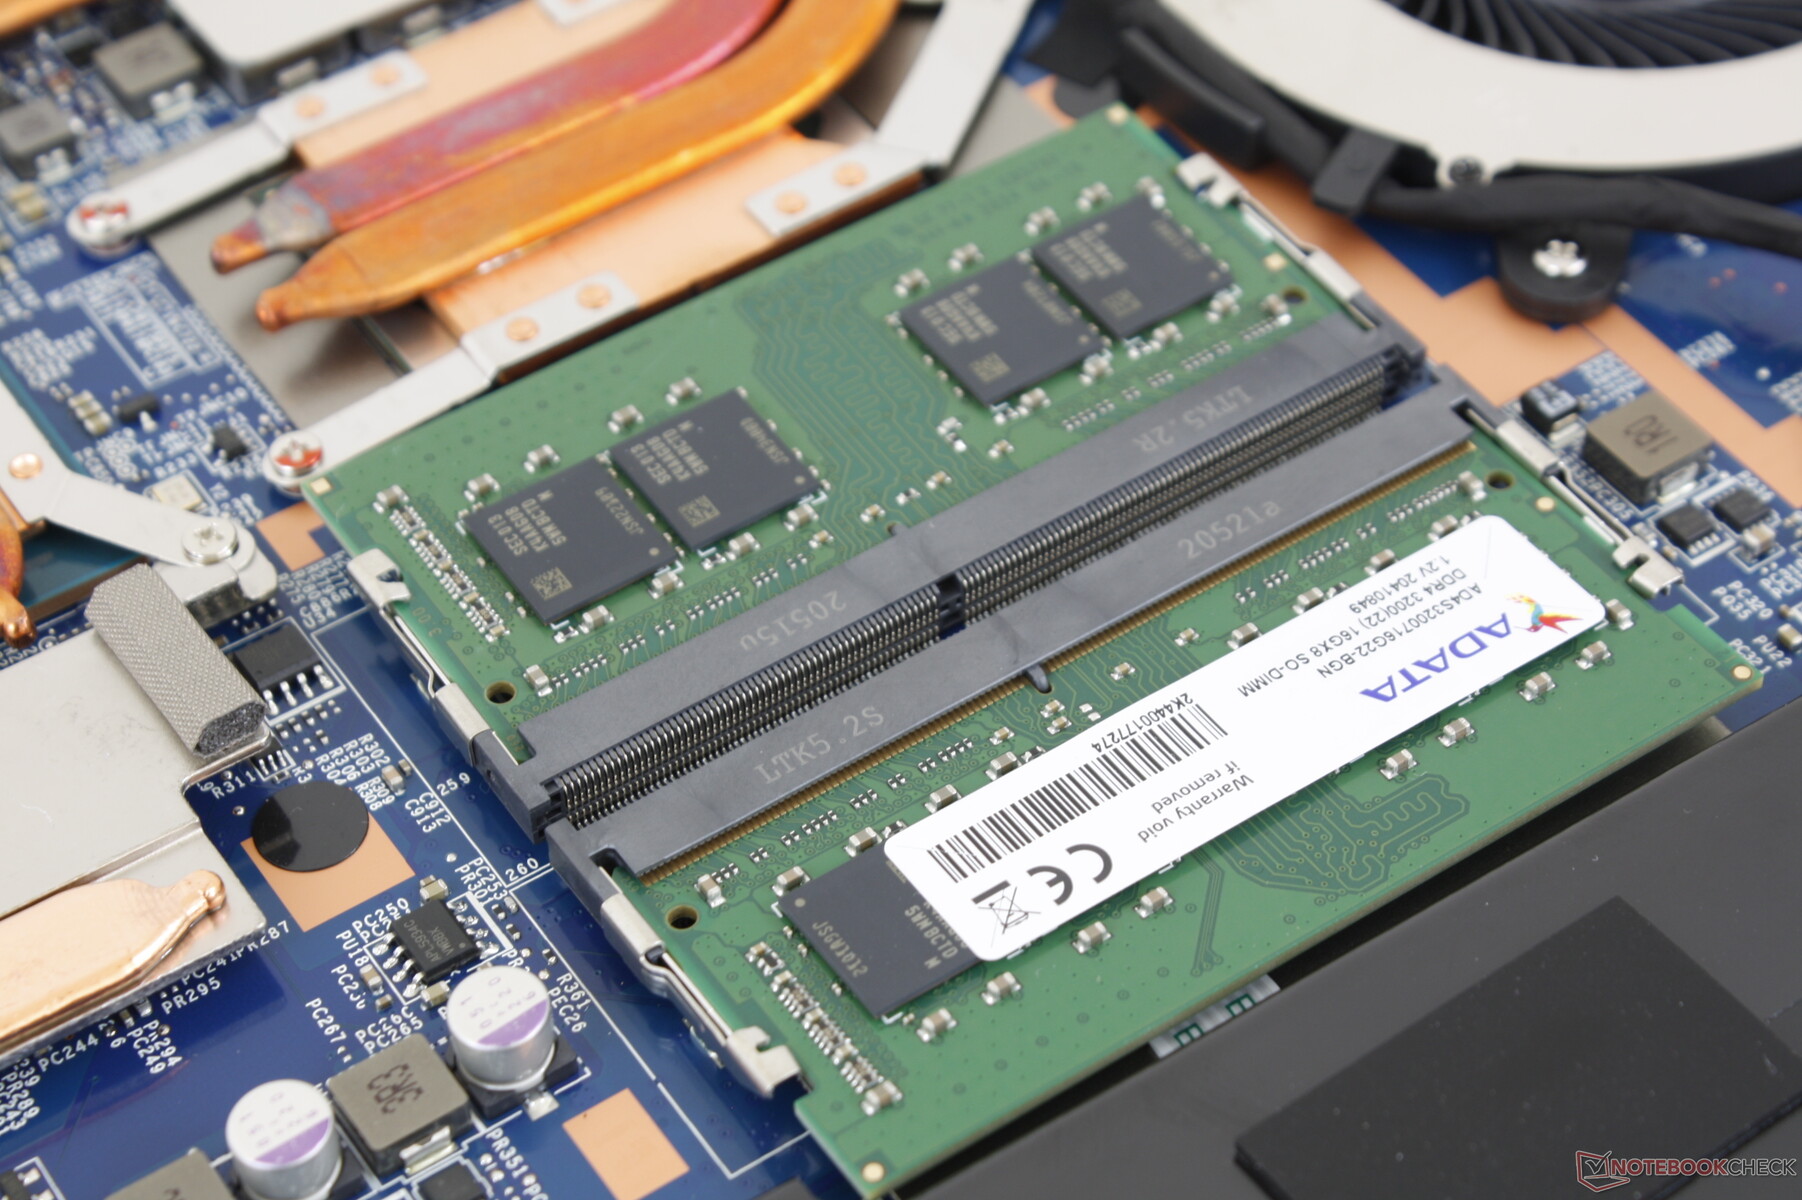
El mantenimiento sólo requiere un destornillador Philips para que las actualizaciones sean relativamente fáciles. Los propietarios deben tener cuidado al retirar el panel inferior, ya que el conector de audio puede atascarse a lo largo del borde.
Accesorios y garantía
No hay extras en la caja más allá del habitual adaptador de CA y la documentación. Se aplica la garantía limitada estándar de un año, mientras que cualquier componente instalado por CUKUSA, como la RAM o el almacenamiento, tendrá una cobertura de tres años en su lugar.
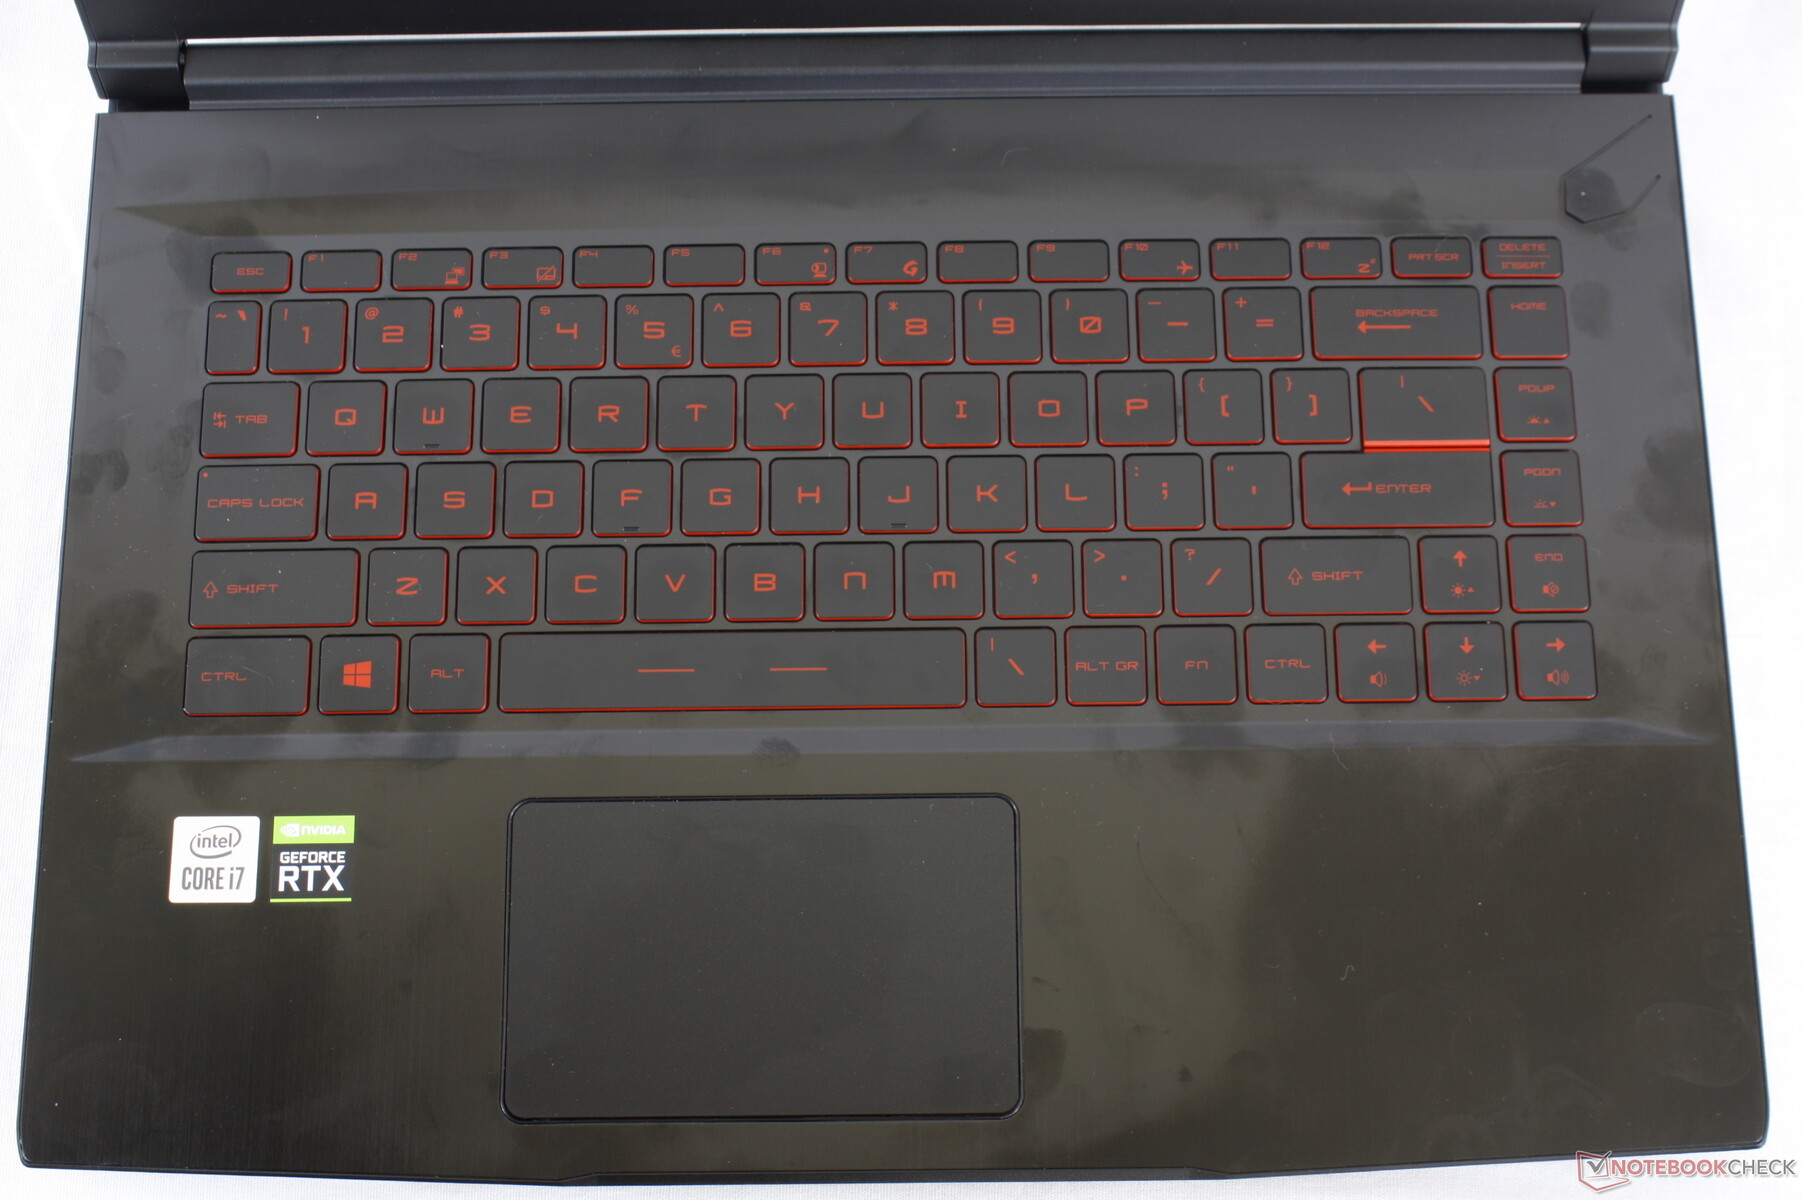
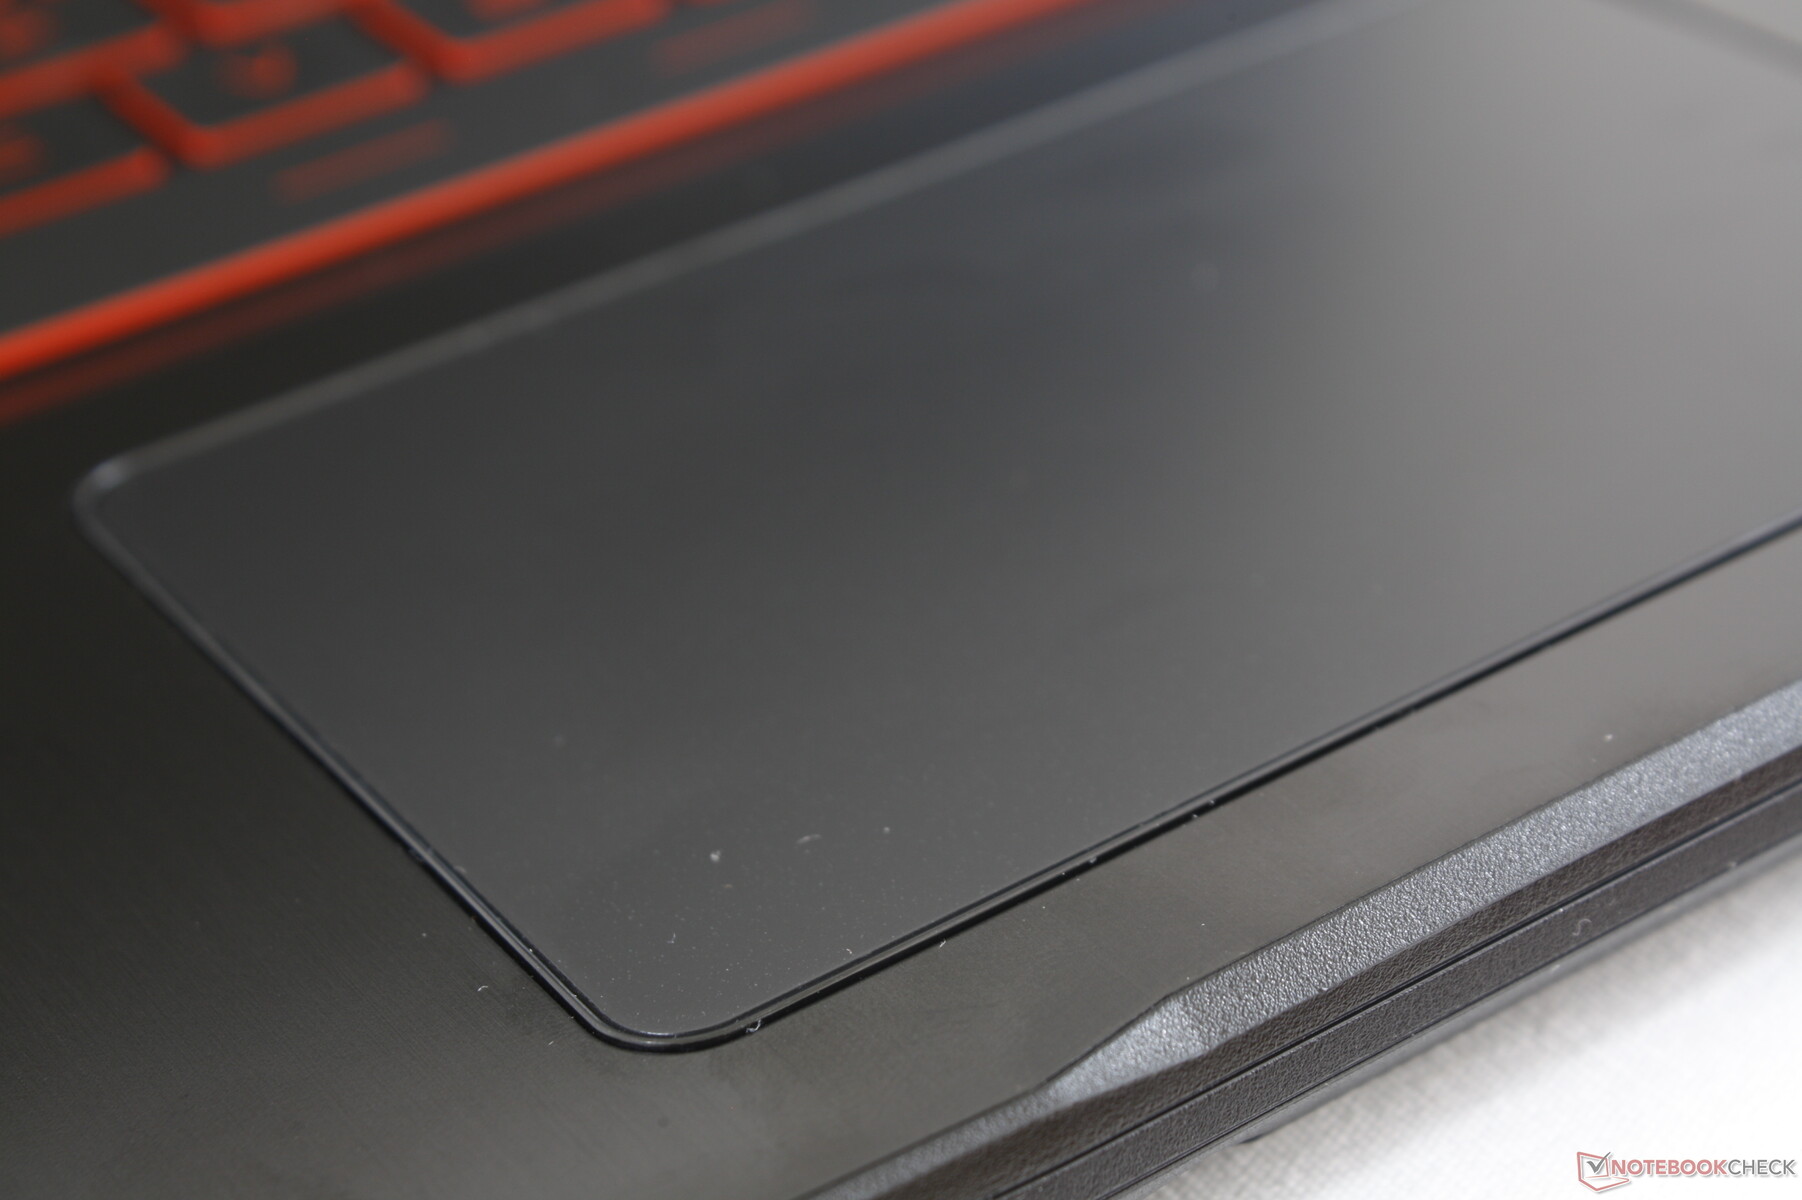
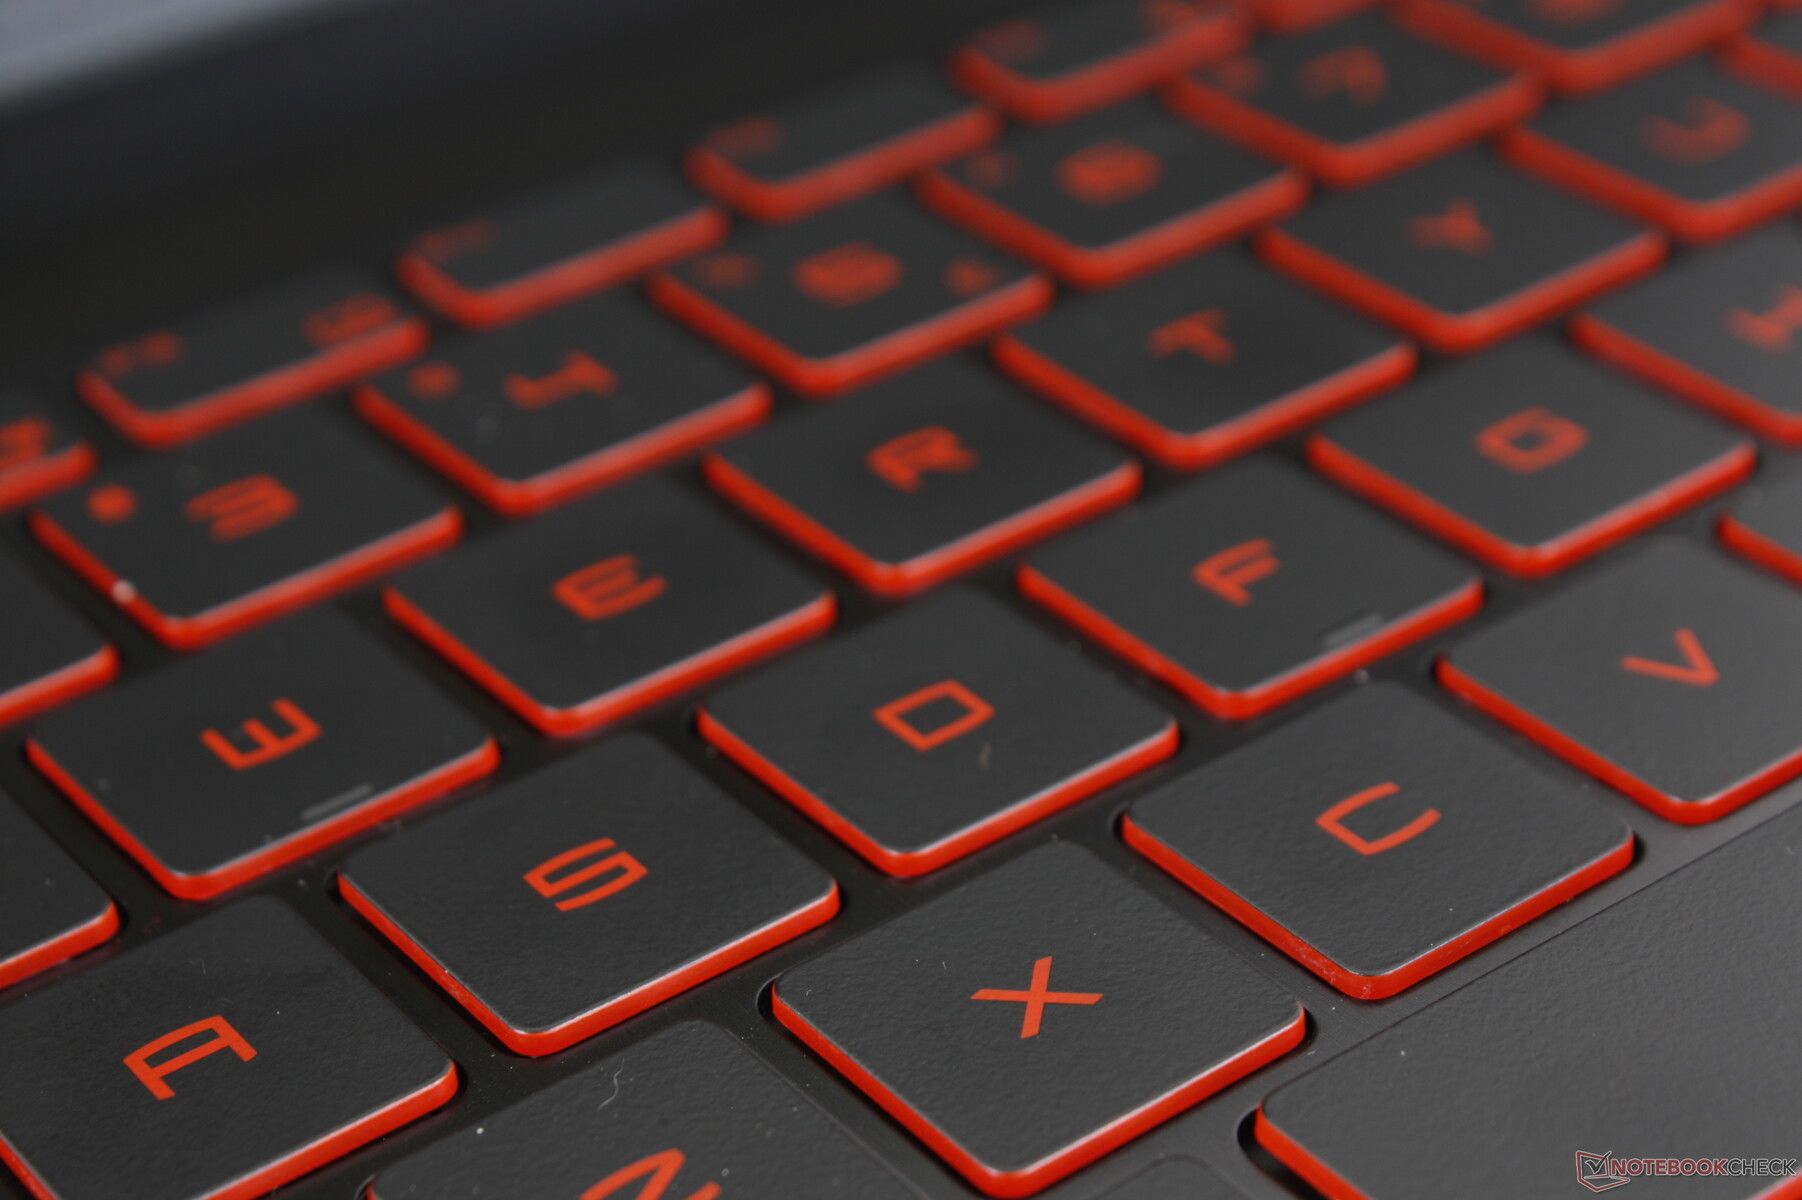
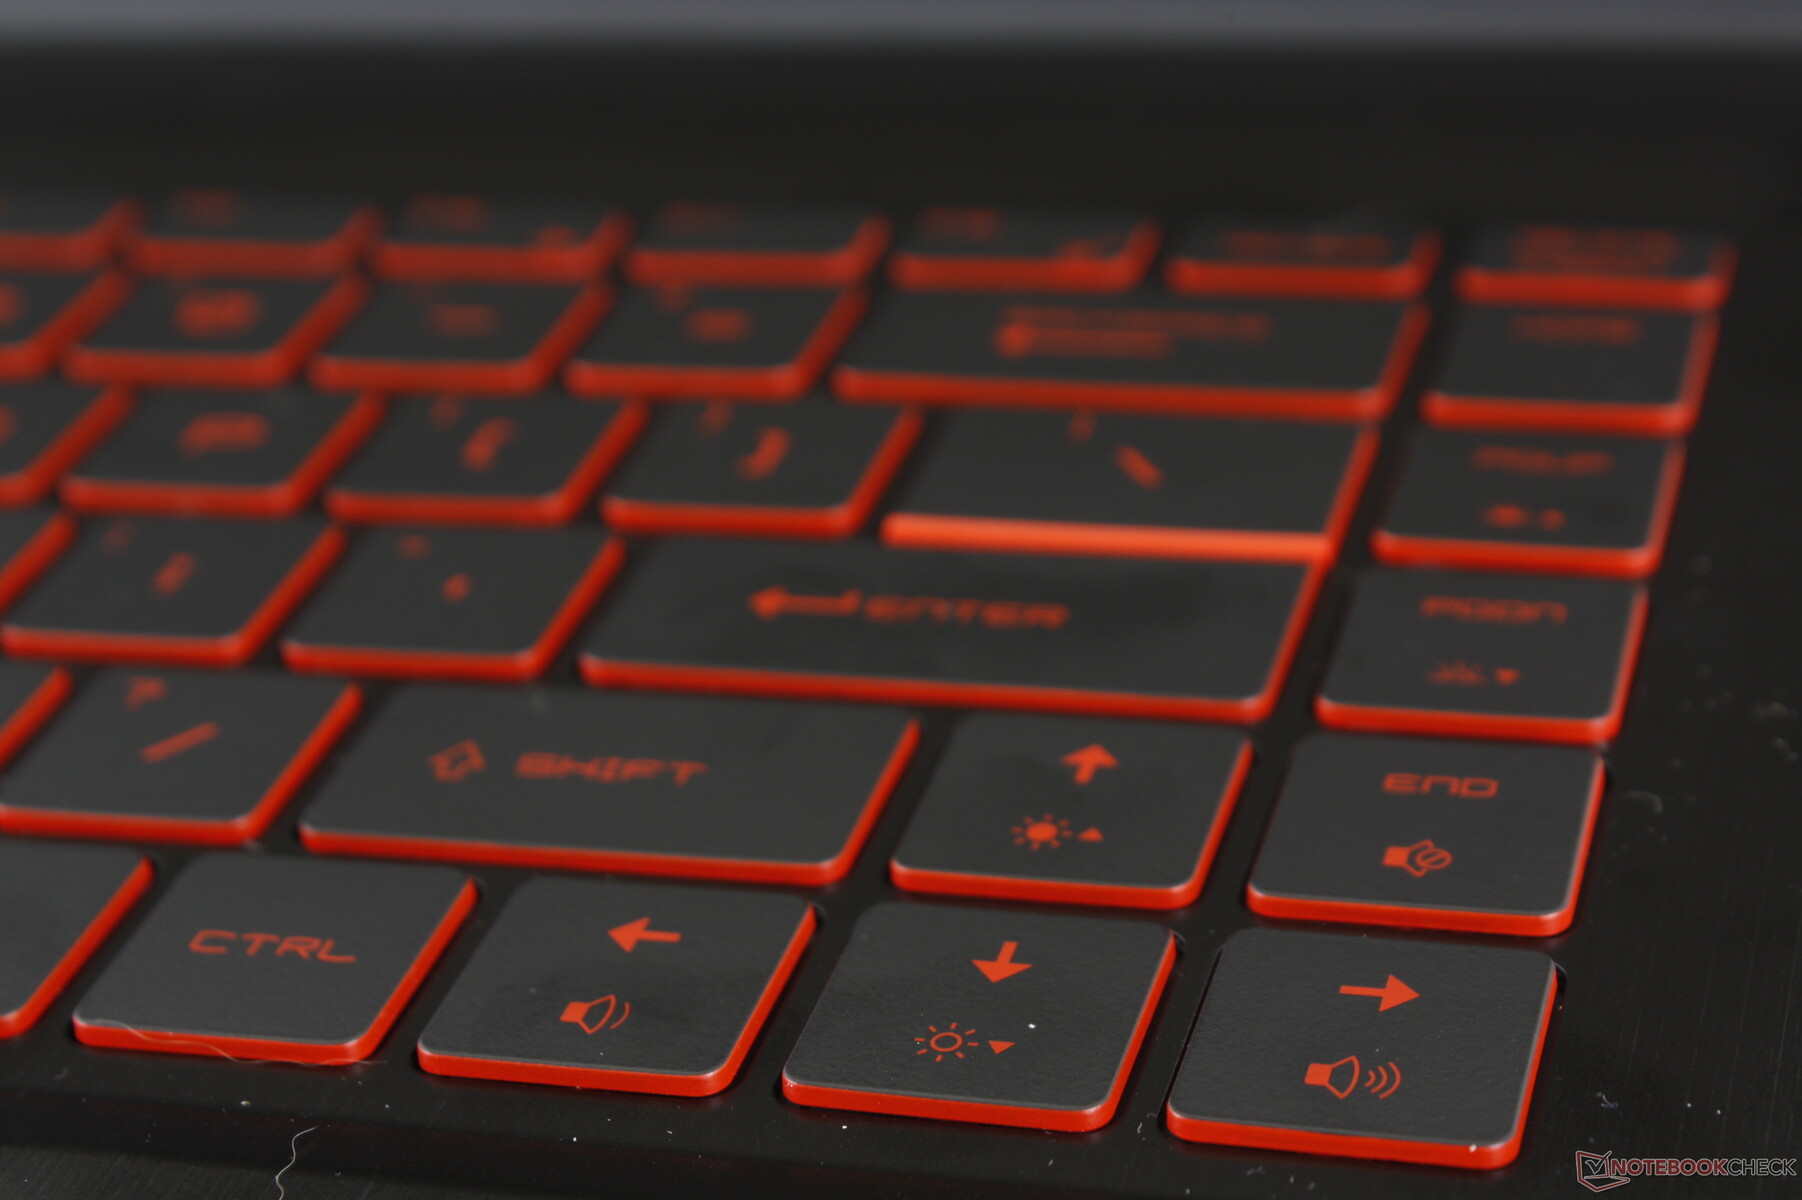
Dispositivos de entrada
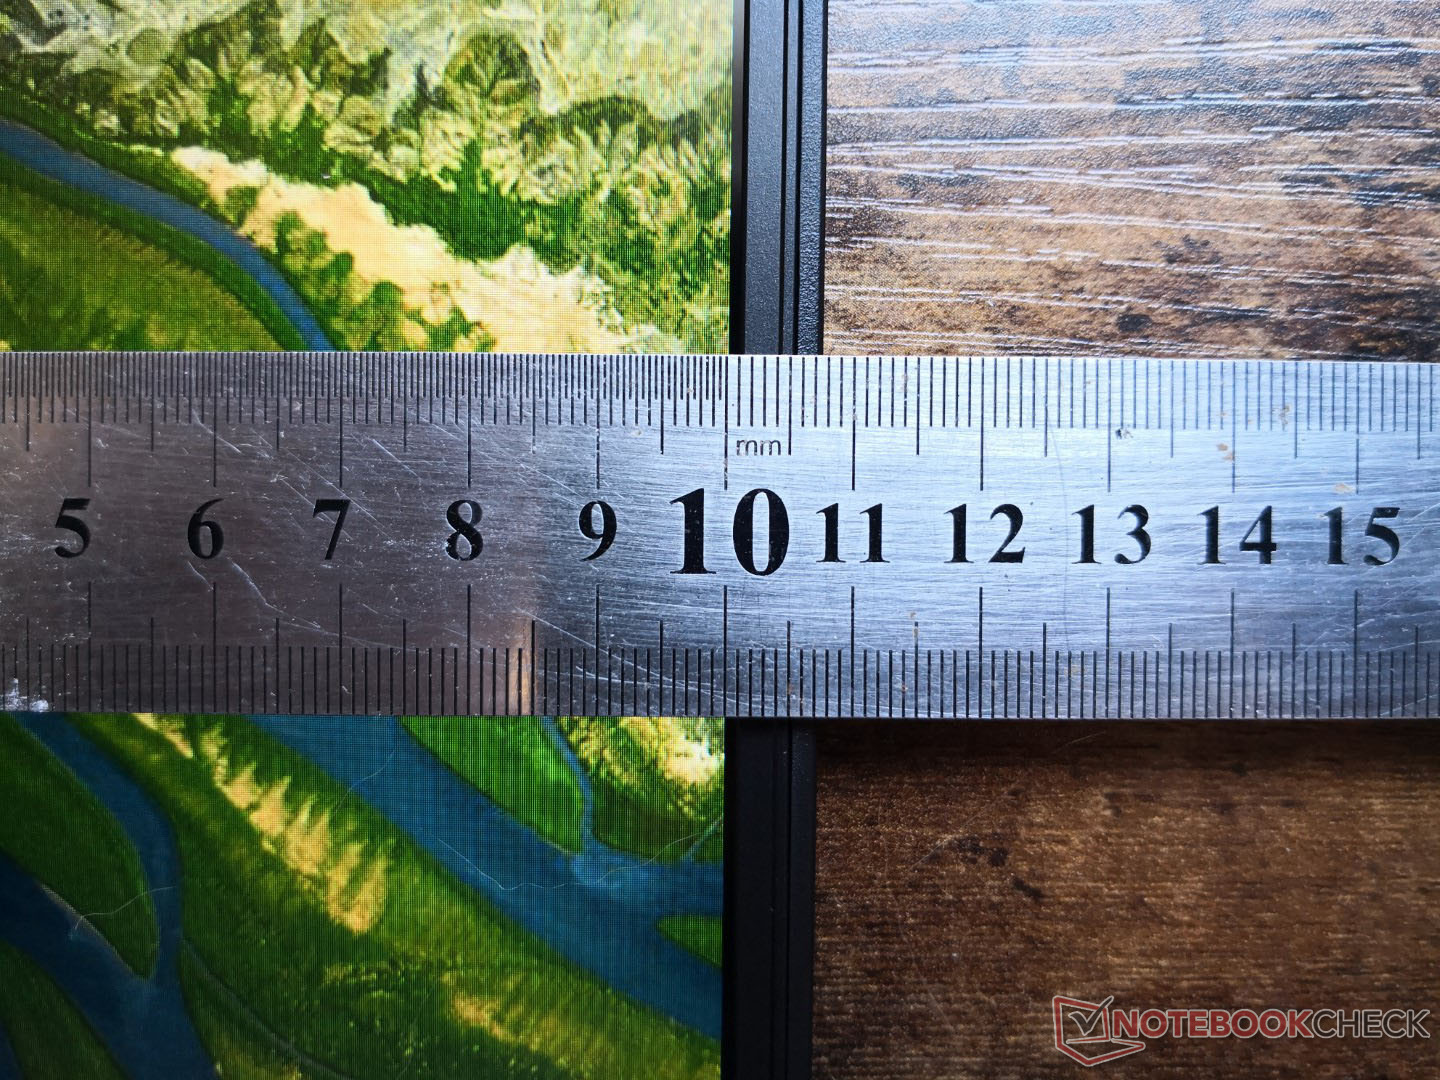
Mostrar
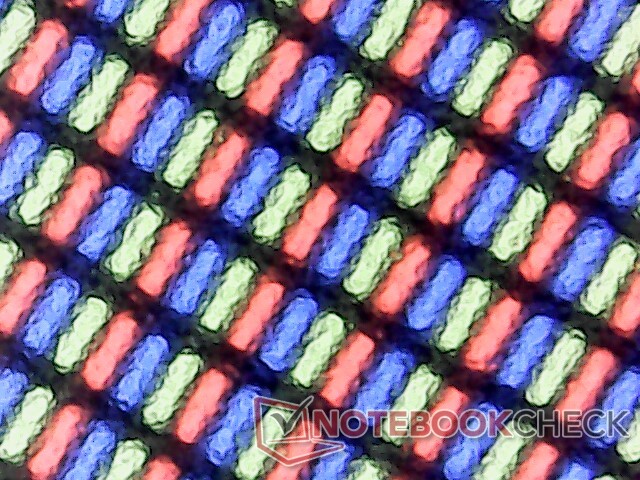
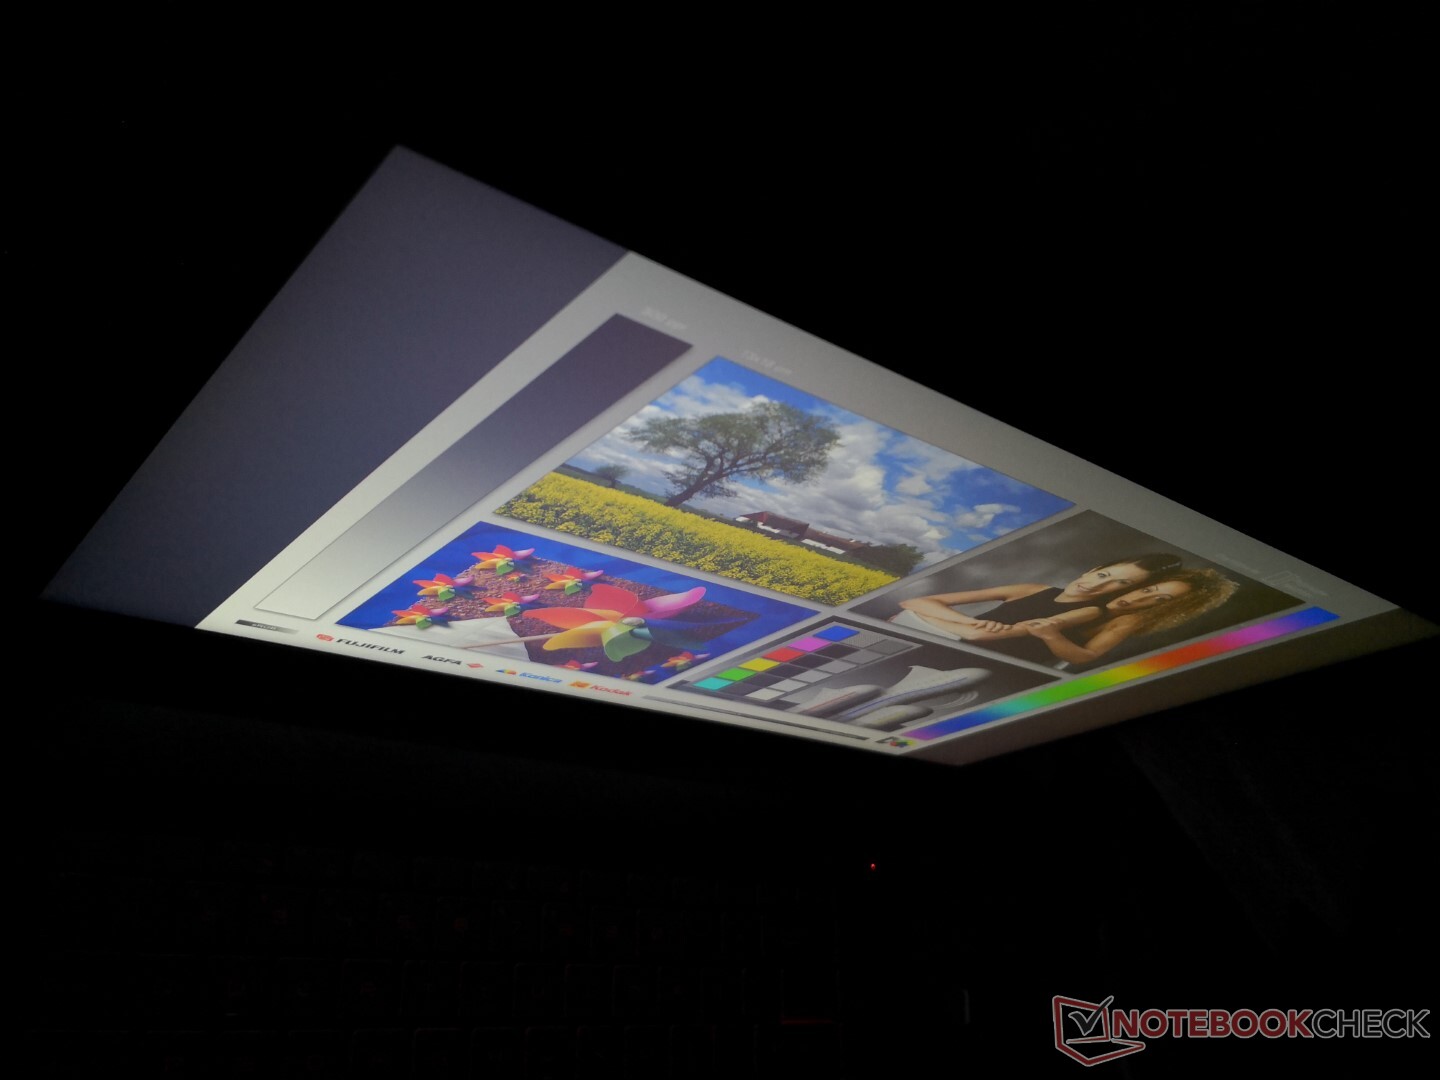
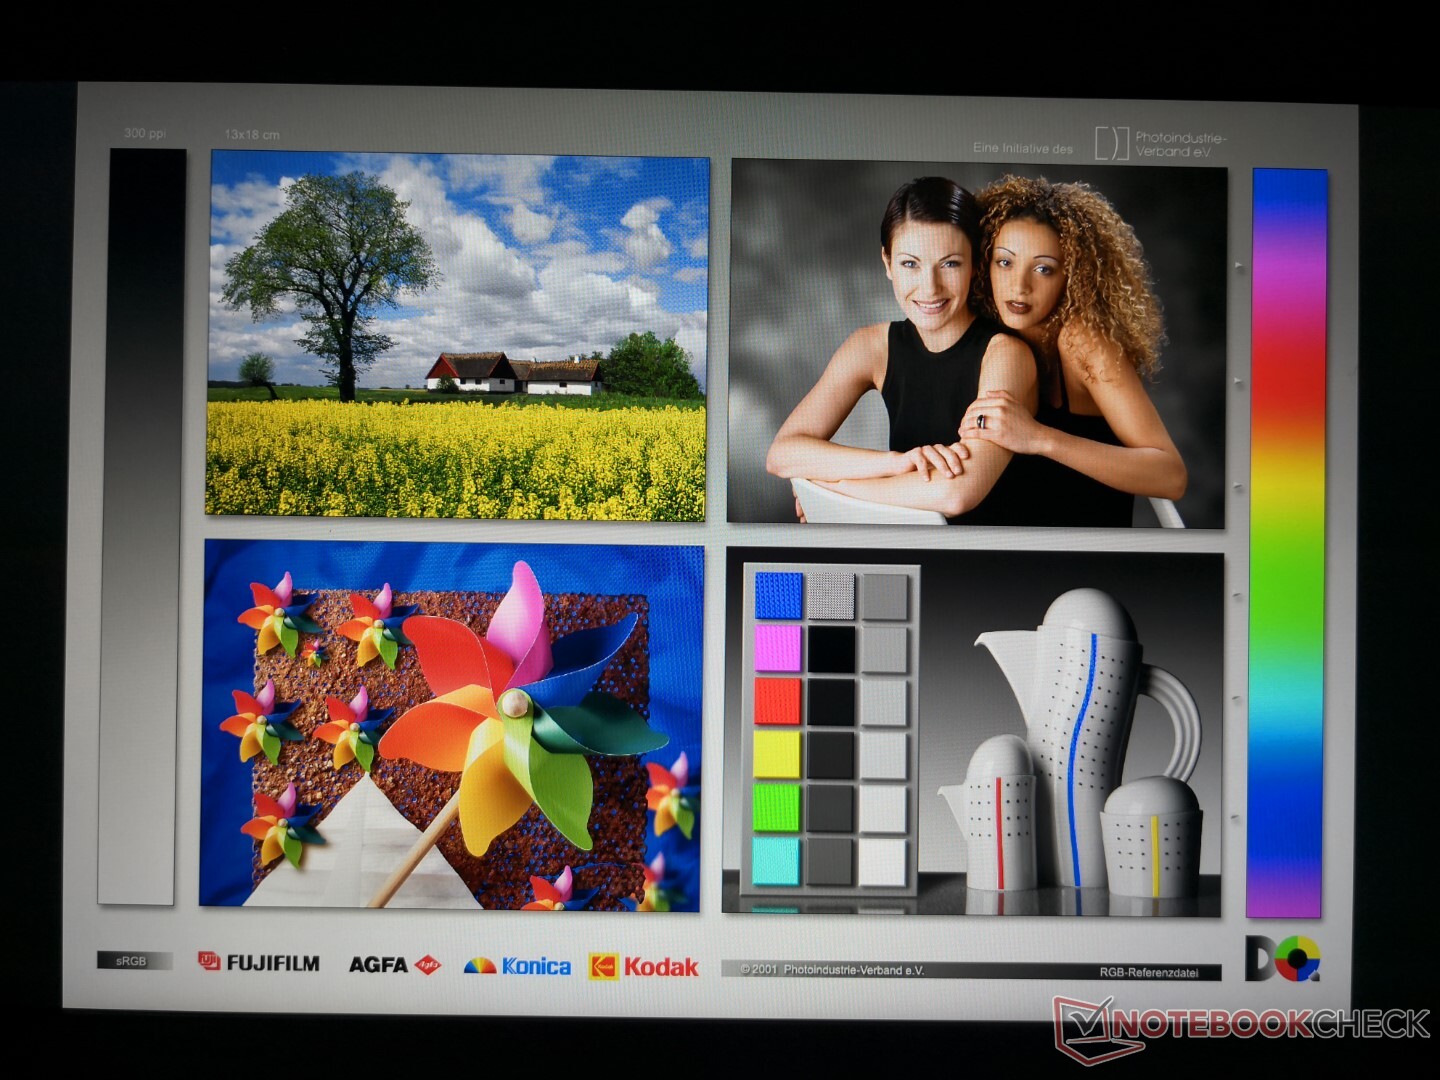
El GF65 10UE utiliza un panel de AU Optronics diferente del antiguo GF65 9SD (AUO B156HAN08.4 frente a AUO B156HAN13.0) y la principal diferencia entre ellos es la frecuencia de refresco (144 Hz frente a 120 Hz). Aparte de eso, los paneles son casi idénticos, incluyendo sus tiempos medios de respuesta en blanco y negro y una gama inferior a la media. El contraste es bastante alto, más de 1000:1, pero la limitada reproducción del color disminuye esta ventaja.
Subjetivamente, la pantalla es muy fluida para los juegos y el uso general, pero prepárate para un poco de ghosting y no esperes que los colores destaquen.
| |||||||||||||||||||||||||
iluminación: 91 %
Brillo con batería: 266.5 cd/m²
Contraste: 1481:1 (Negro: 0.18 cd/m²)
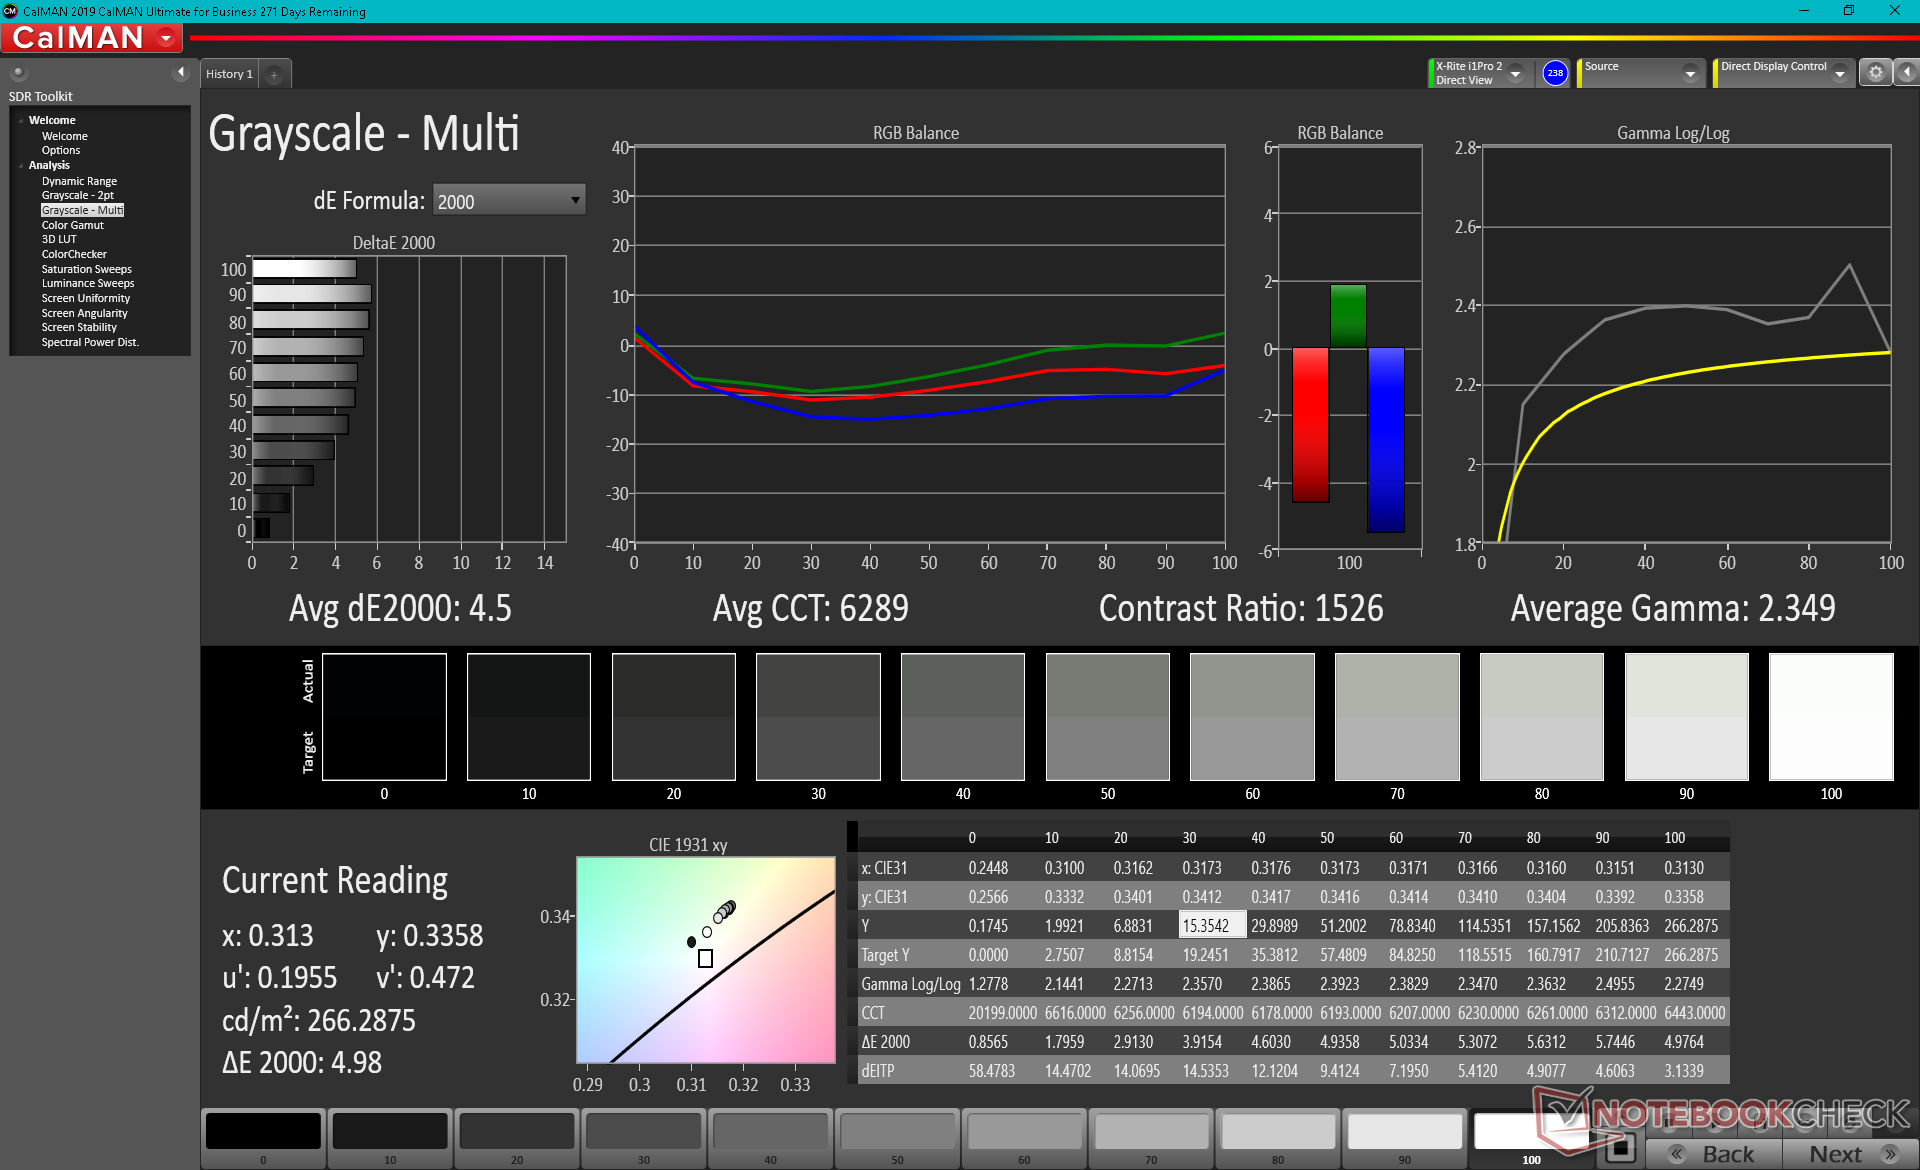
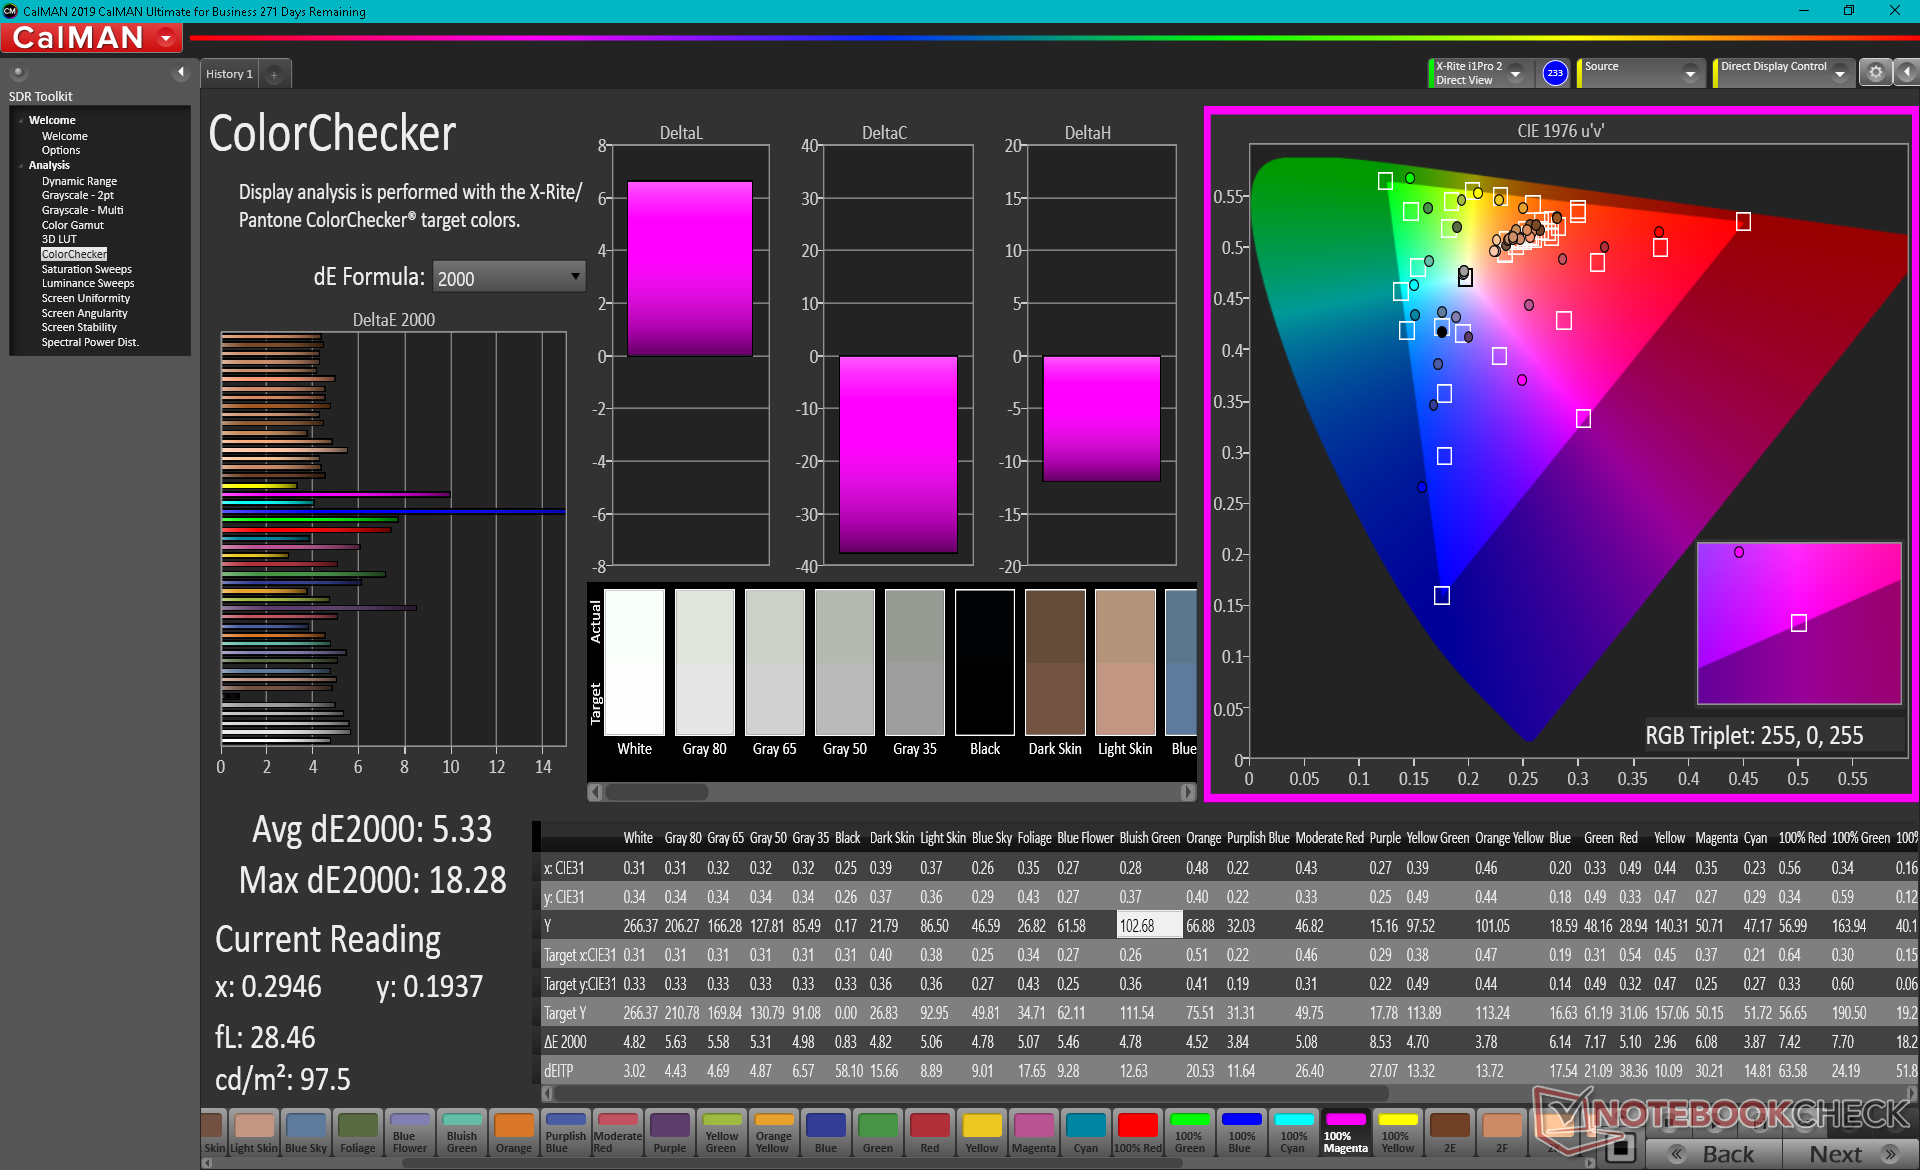
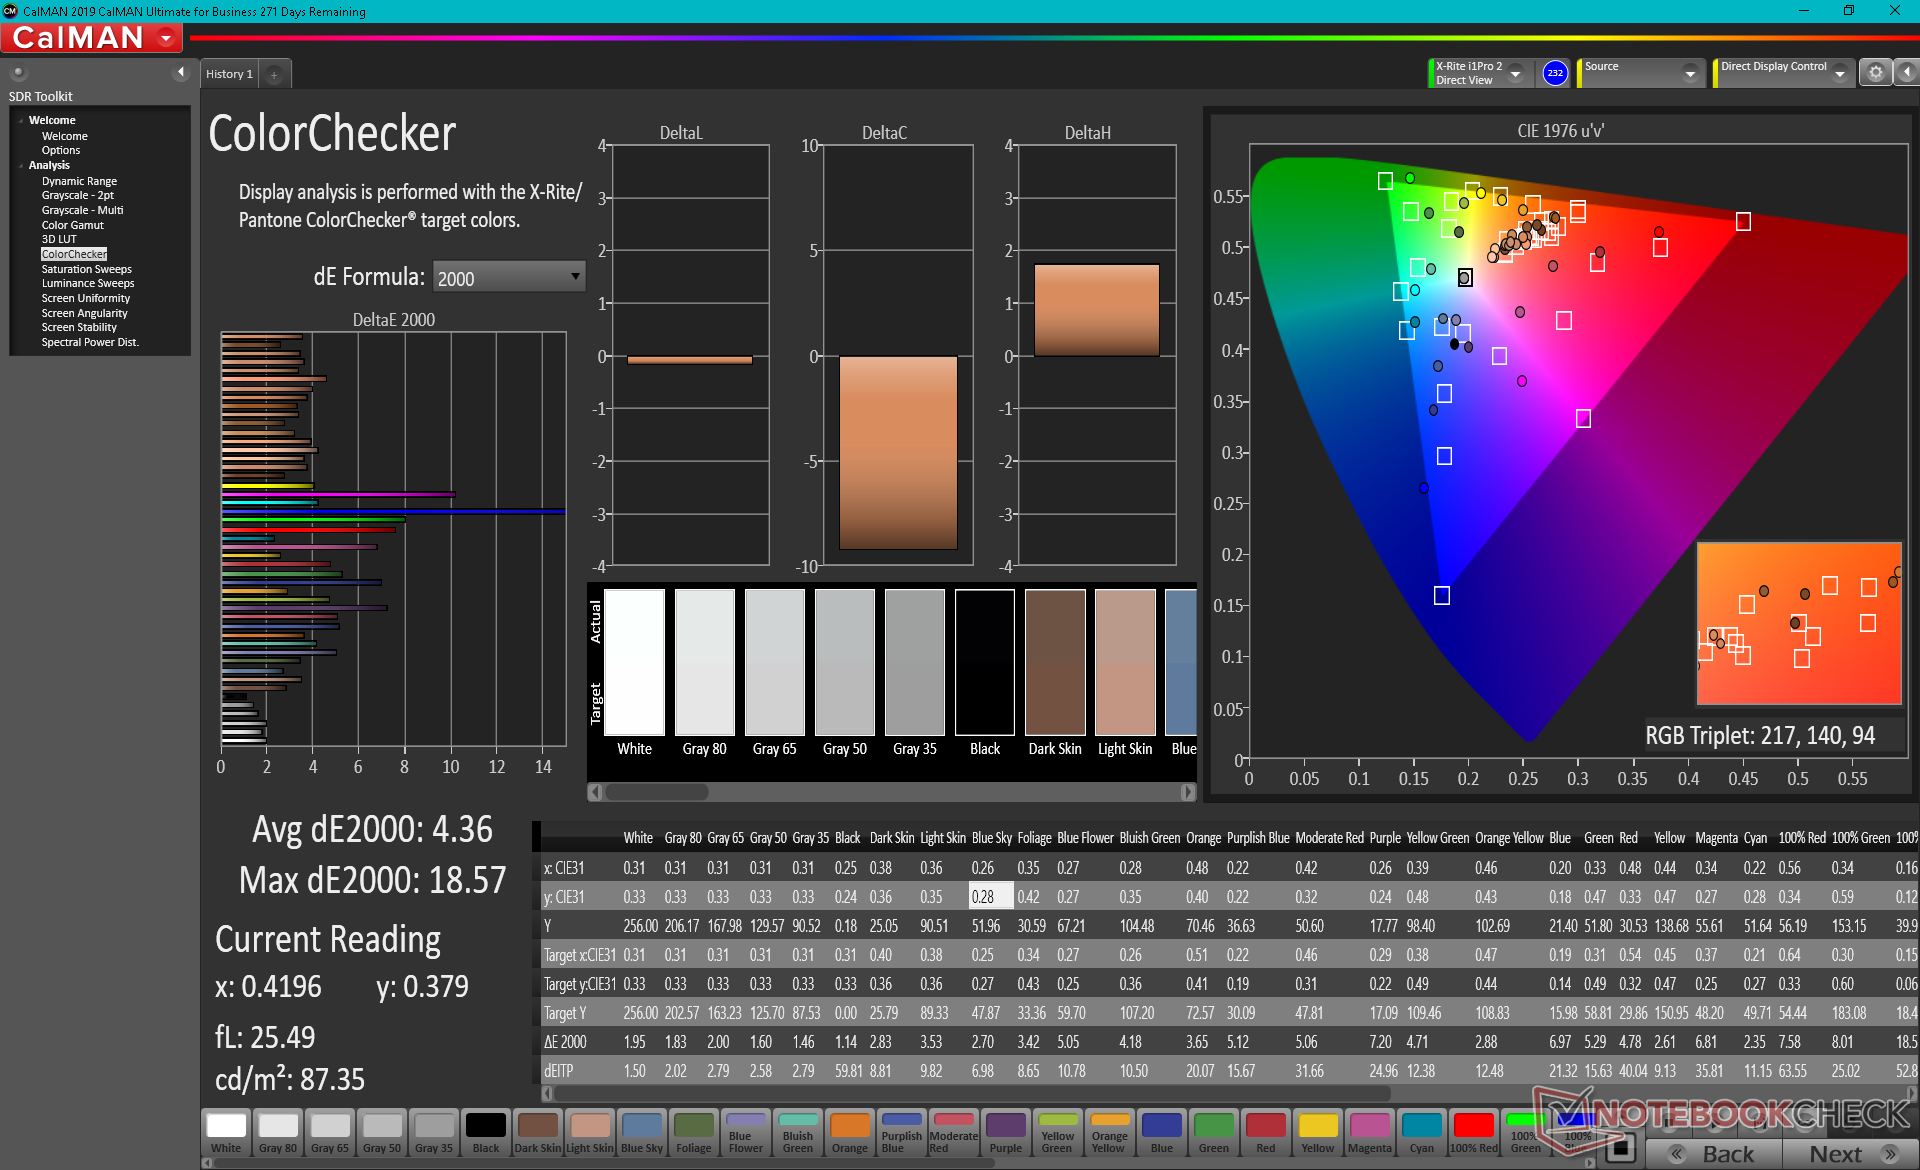
ΔE ColorChecker Calman: 5.33 | ∀{0.5-29.43 Ø4.73}
calibrated: 4.36
ΔE Greyscale Calman: 4.5 | ∀{0.09-98 Ø4.97}
55.8% sRGB (Argyll 1.6.3 3D)
35.6% AdobeRGB 1998 (Argyll 1.6.3 3D)
38.9% AdobeRGB 1998 (Argyll 3D)
56.3% sRGB (Argyll 3D)
37.65% Display P3 (Argyll 3D)
Gamma: 2.35
CCT: 6289 K
| MSI GF65 Thin 10UE AU Optronics B156HAN08.4, IPS, 15.6", 1920x1080 | Asus ROG Strix G15 G513QR LQ156M1JW25, IPS, 15.6", 1920x1080 | Schenker XMG Core 15 Ampere BOE CQ NE156QHM-NY2, IPS, 15.6", 2560x1440 | MSI GS66 Stealth 10UG AU Optronics B156HAN12.0, IPS, 15.6", 1920x1080 | Aorus 15G XC Sharp LQ156M1JW03, IPS, 15.6", 1920x1080 | Lenovo Legion 7 15IMH05-81YT001VGE AUO048E, IPS, 15.6", 1920x1080 | |
|---|---|---|---|---|---|---|
| Display | 74% | 81% | 78% | 73% | 82% | |
| Display P3 Coverage (%) | 37.65 | 67.7 80% | 69.8 85% | 67.7 80% | 65.6 74% | 70.3 87% |
| sRGB Coverage (%) | 56.3 | 94.3 67% | 98.8 75% | 98.4 75% | 97.5 73% | 99.4 77% |
| AdobeRGB 1998 Coverage (%) | 38.9 | 68.2 75% | 70.7 82% | 69.1 78% | 67.1 72% | 71.3 83% |
| Response Times | 75% | 64% | 62% | 72% | 77% | |
| Response Time Grey 50% / Grey 80% * (ms) | 36.8 ? | 8.2 ? 78% | 14.8 ? 60% | 14.4 ? 61% | 9.6 ? 74% | 8 ? 78% |
| Response Time Black / White * (ms) | 31.6 ? | 9.2 ? 71% | 10.4 ? 67% | 11.6 ? 63% | 9.6 ? 70% | 8 ? 75% |
| PWM Frequency (Hz) | 24040 ? | |||||
| Screen | 27% | 40% | 29% | 37% | 47% | |
| Brightness middle (cd/m²) | 266.5 | 308 16% | 347 30% | 259.5 -3% | 288 8% | 470 76% |
| Brightness (cd/m²) | 262 | 288 10% | 328 25% | 264 1% | 270 3% | 468 79% |
| Brightness Distribution (%) | 91 | 86 -5% | 89 -2% | 90 -1% | 89 -2% | 85 -7% |
| Black Level * (cd/m²) | 0.18 | 0.23 -28% | 0.27 -50% | 0.25 -39% | 0.25 -39% | 0.21 -17% |
| Contrast (:1) | 1481 | 1339 -10% | 1285 -13% | 1038 -30% | 1152 -22% | 2238 51% |
| Colorchecker dE 2000 * | 5.33 | 3.28 38% | 1.66 69% | 2.52 53% | 1.19 78% | 3.28 38% |
| Colorchecker dE 2000 max. * | 18.28 | 8.51 53% | 3.03 83% | 5.55 70% | 3.79 79% | 7.31 60% |
| Colorchecker dE 2000 calibrated * | 4.36 | 0.83 81% | 1.23 72% | 1.93 56% | 0.71 84% | 0.8 82% |
| Greyscale dE 2000 * | 4.5 | 5 -11% | 1.6 64% | 1.7 62% | 1.6 64% | 4.49 -0% |
| Gamma | 2.35 94% | 2.057 107% | 2.278 97% | 2.04 108% | 2.229 99% | 2.4 92% |
| CCT | 6289 103% | 7393 88% | 6430 101% | 6414 101% | 6539 99% | 7438 87% |
| Color Space (Percent of AdobeRGB 1998) (%) | 35.6 | 68 91% | 71 99% | 63.3 78% | 67 88% | 65 83% |
| Color Space (Percent of sRGB) (%) | 55.8 | 90 61% | 94 68% | 98.8 77% | 90 61% | 99 77% |
| Media total (Programa/Opciones) | 59% /
42% | 62% /
51% | 56% /
43% | 61% /
48% | 69% /
58% |
* ... más pequeño es mejor
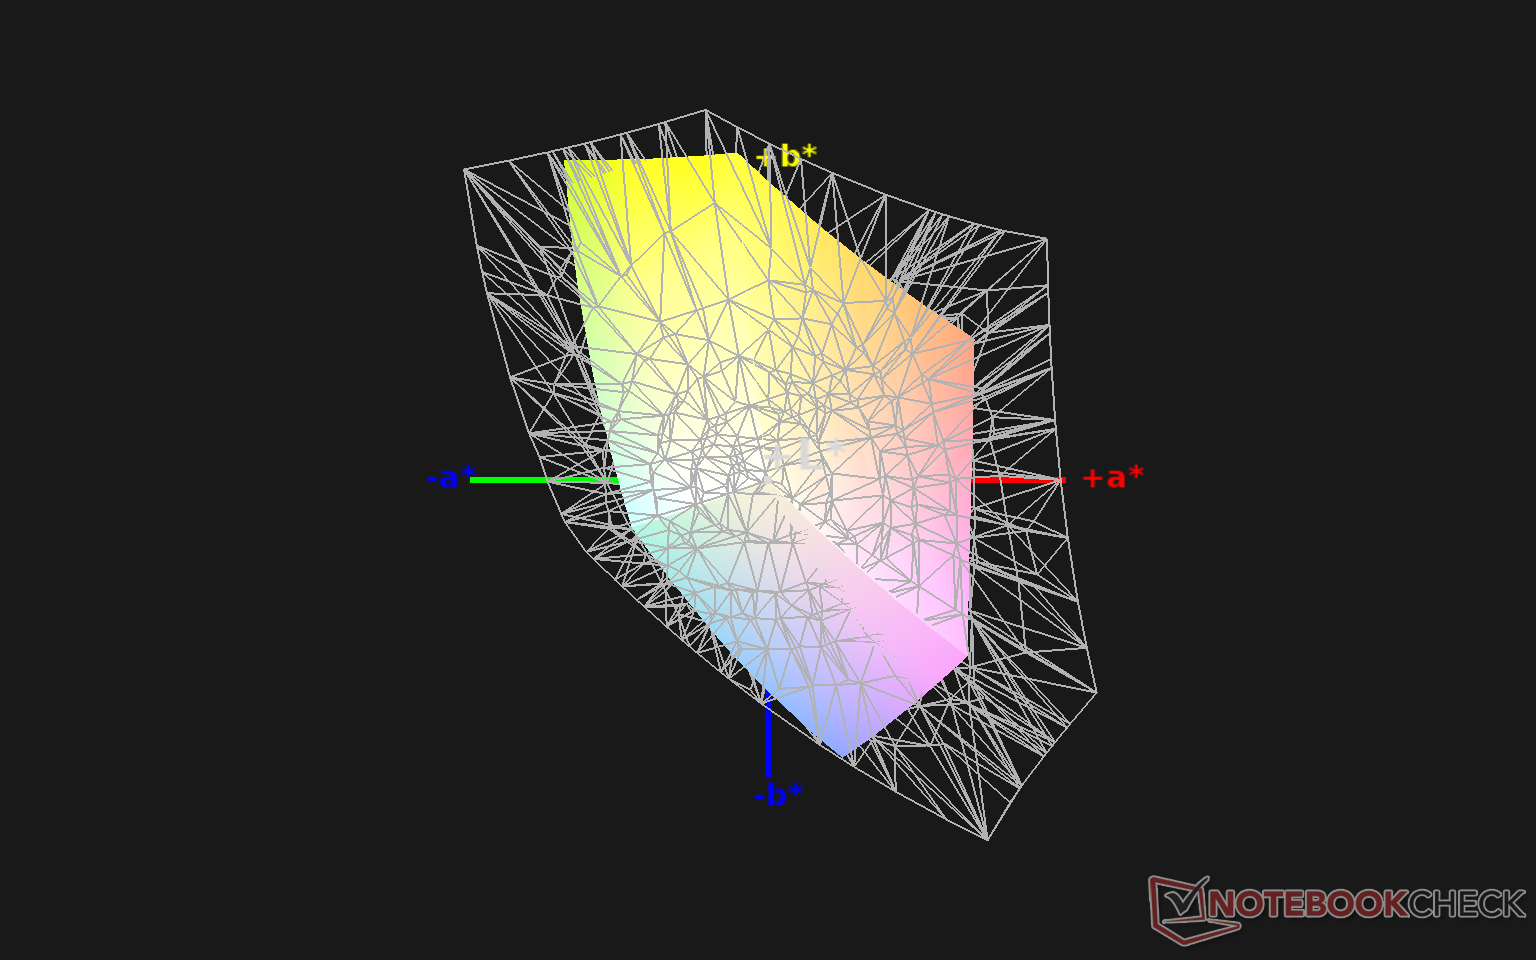
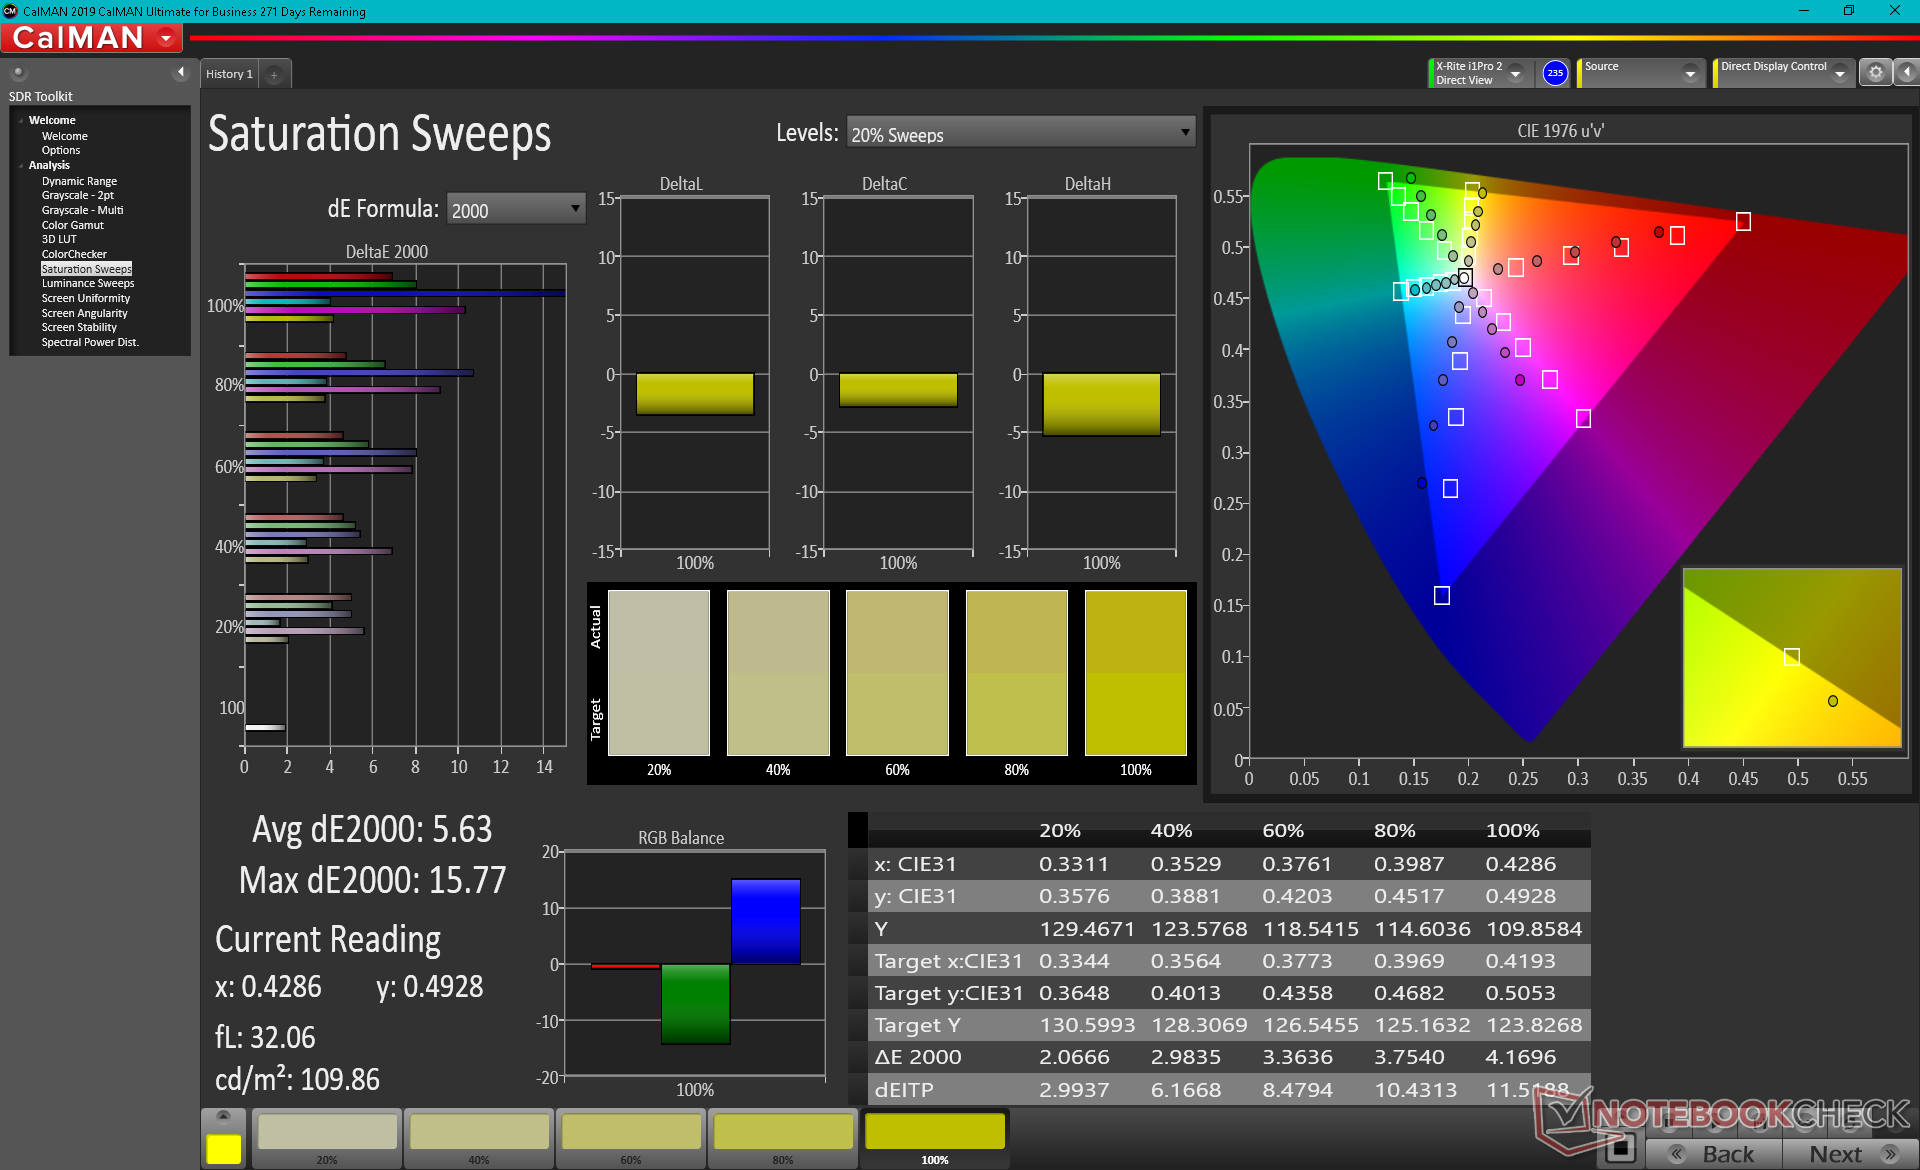
El espacio de color cubre sólo el 56 por ciento y el 36 por ciento de sRGB y AdobeRGB, respectivamente, para ser indicativo de un panel de presupuesto a pesar de la alta frecuencia de actualización nativa de 144 Hz. La mayoría de Ultrabooks o portátiles de juego de gama media o superior cubren al menos el 90% de sRGB para colores más profundos. Los colores limitados aquí no son un problema cuando se juega, pero los editores gráficos querrán evitar el uso de este panel.
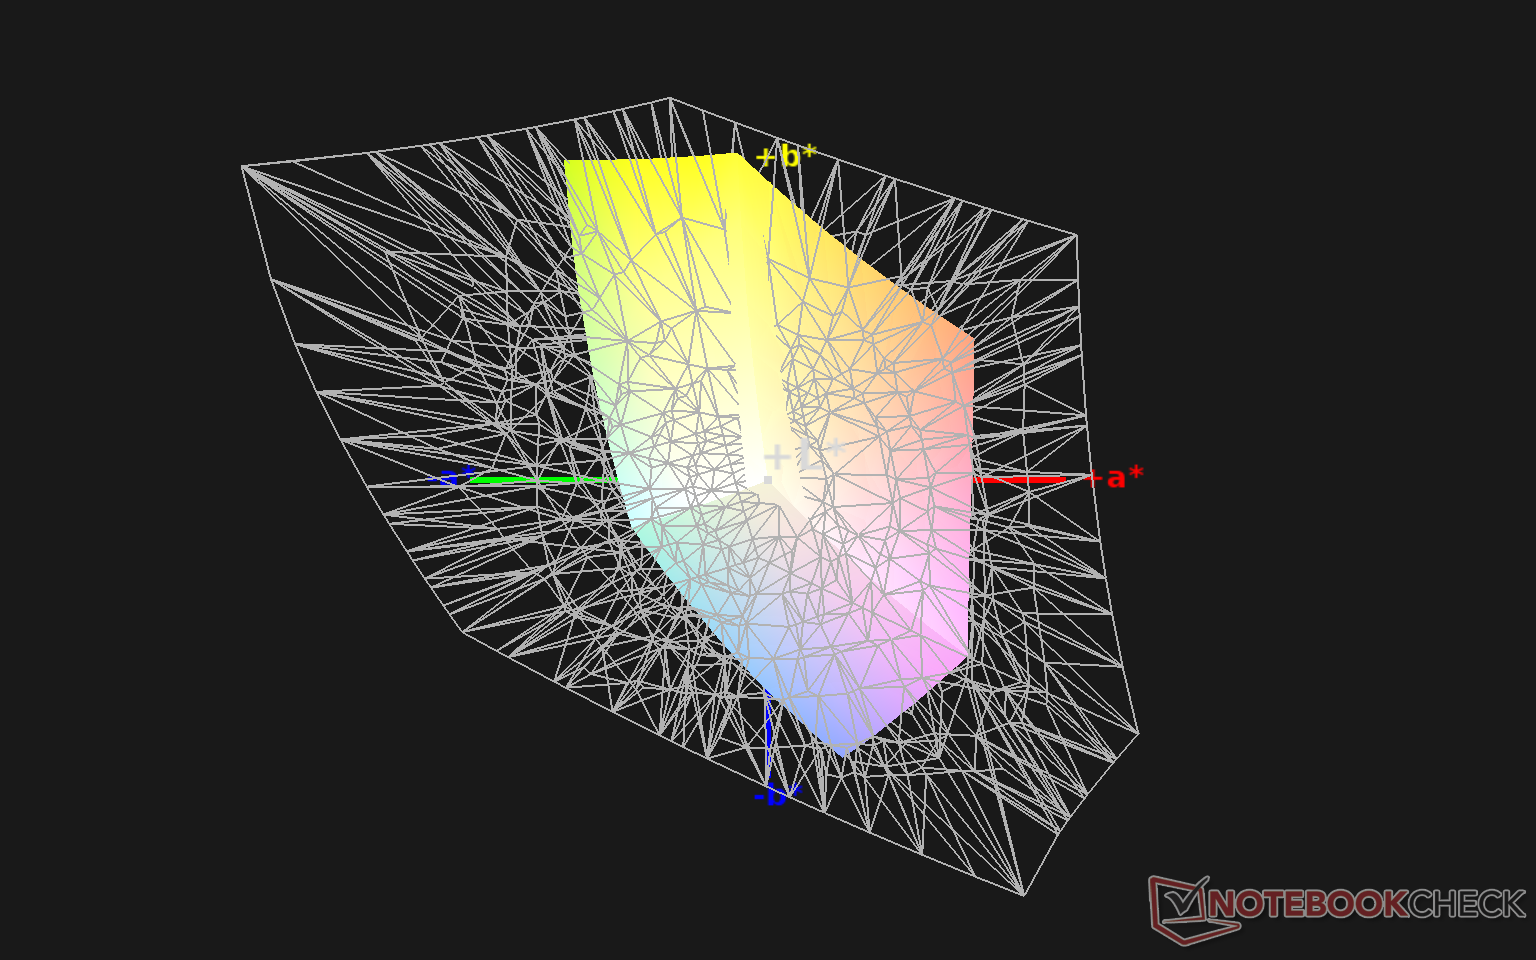
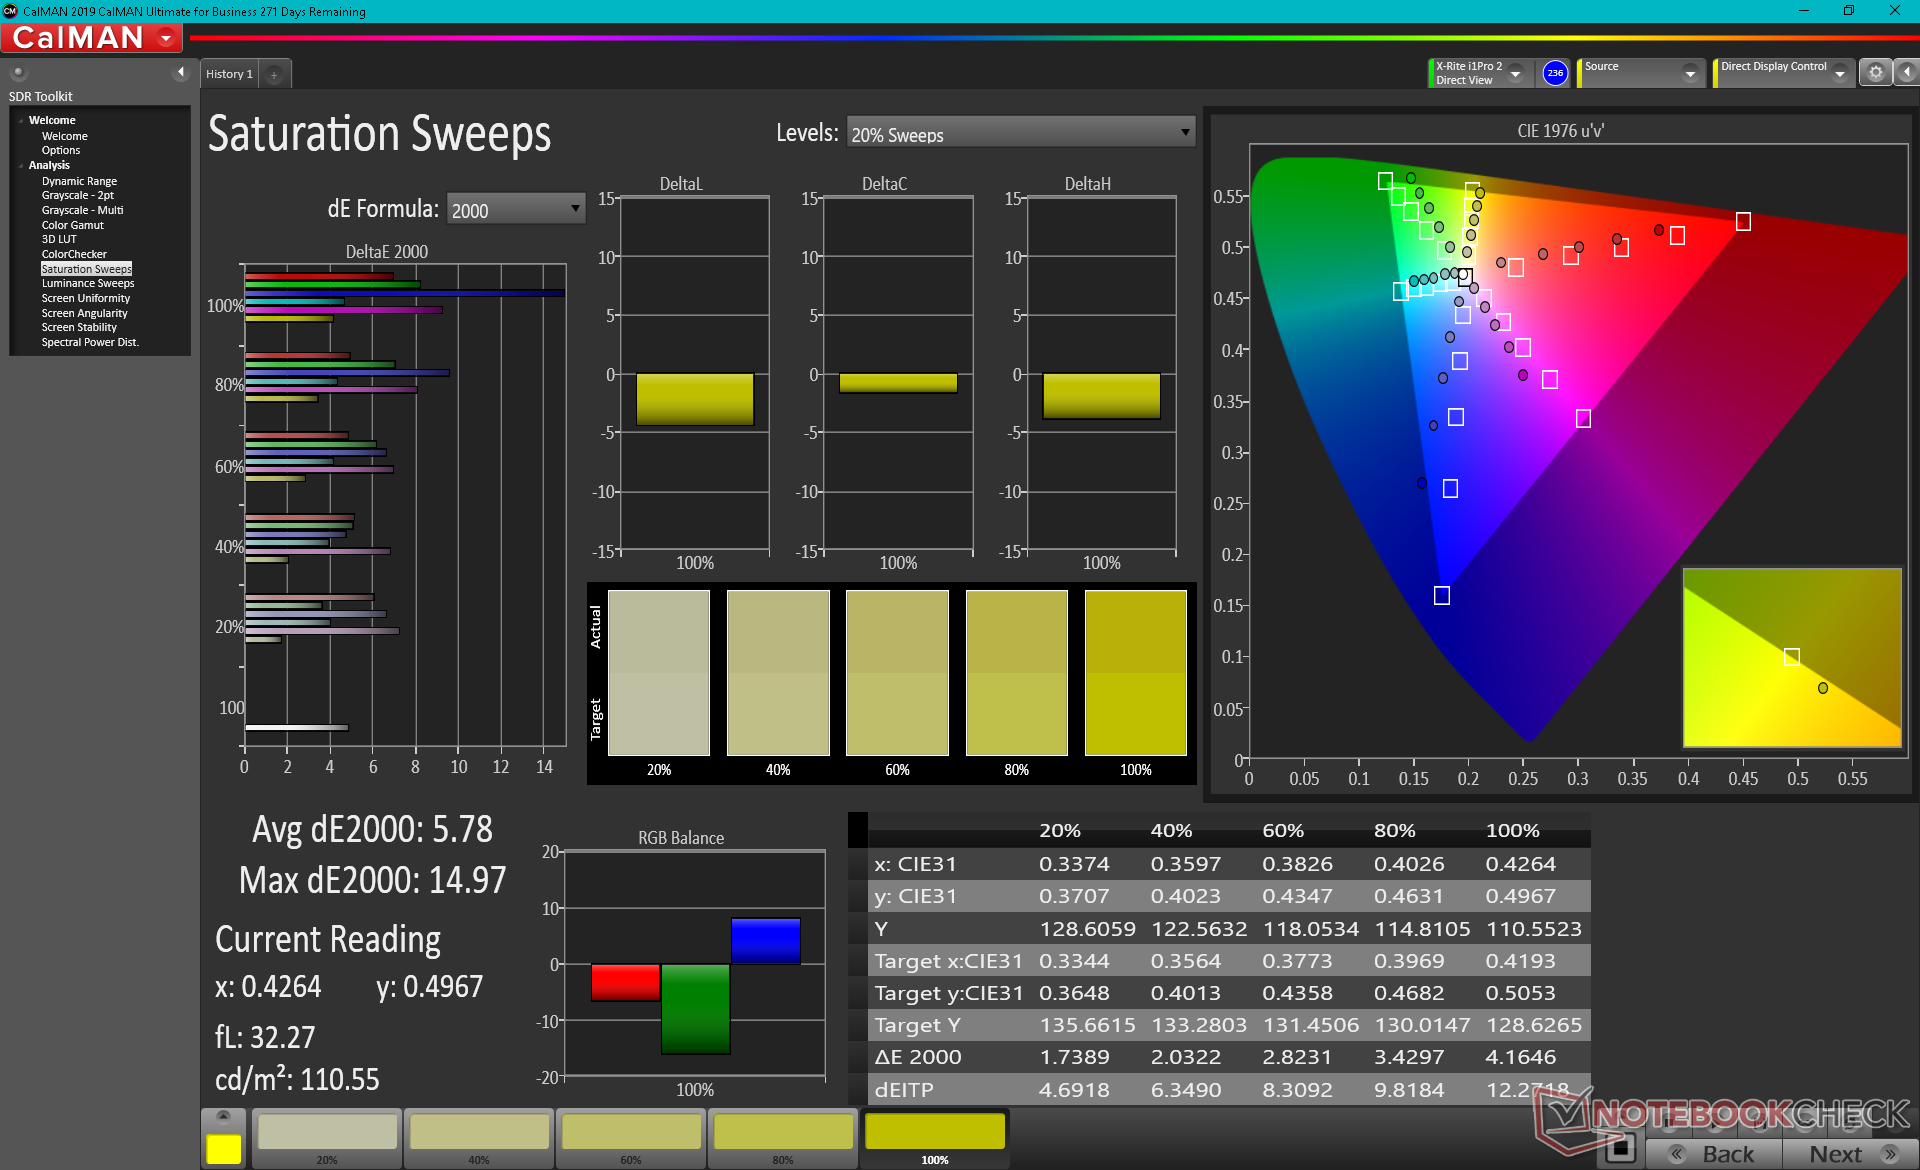
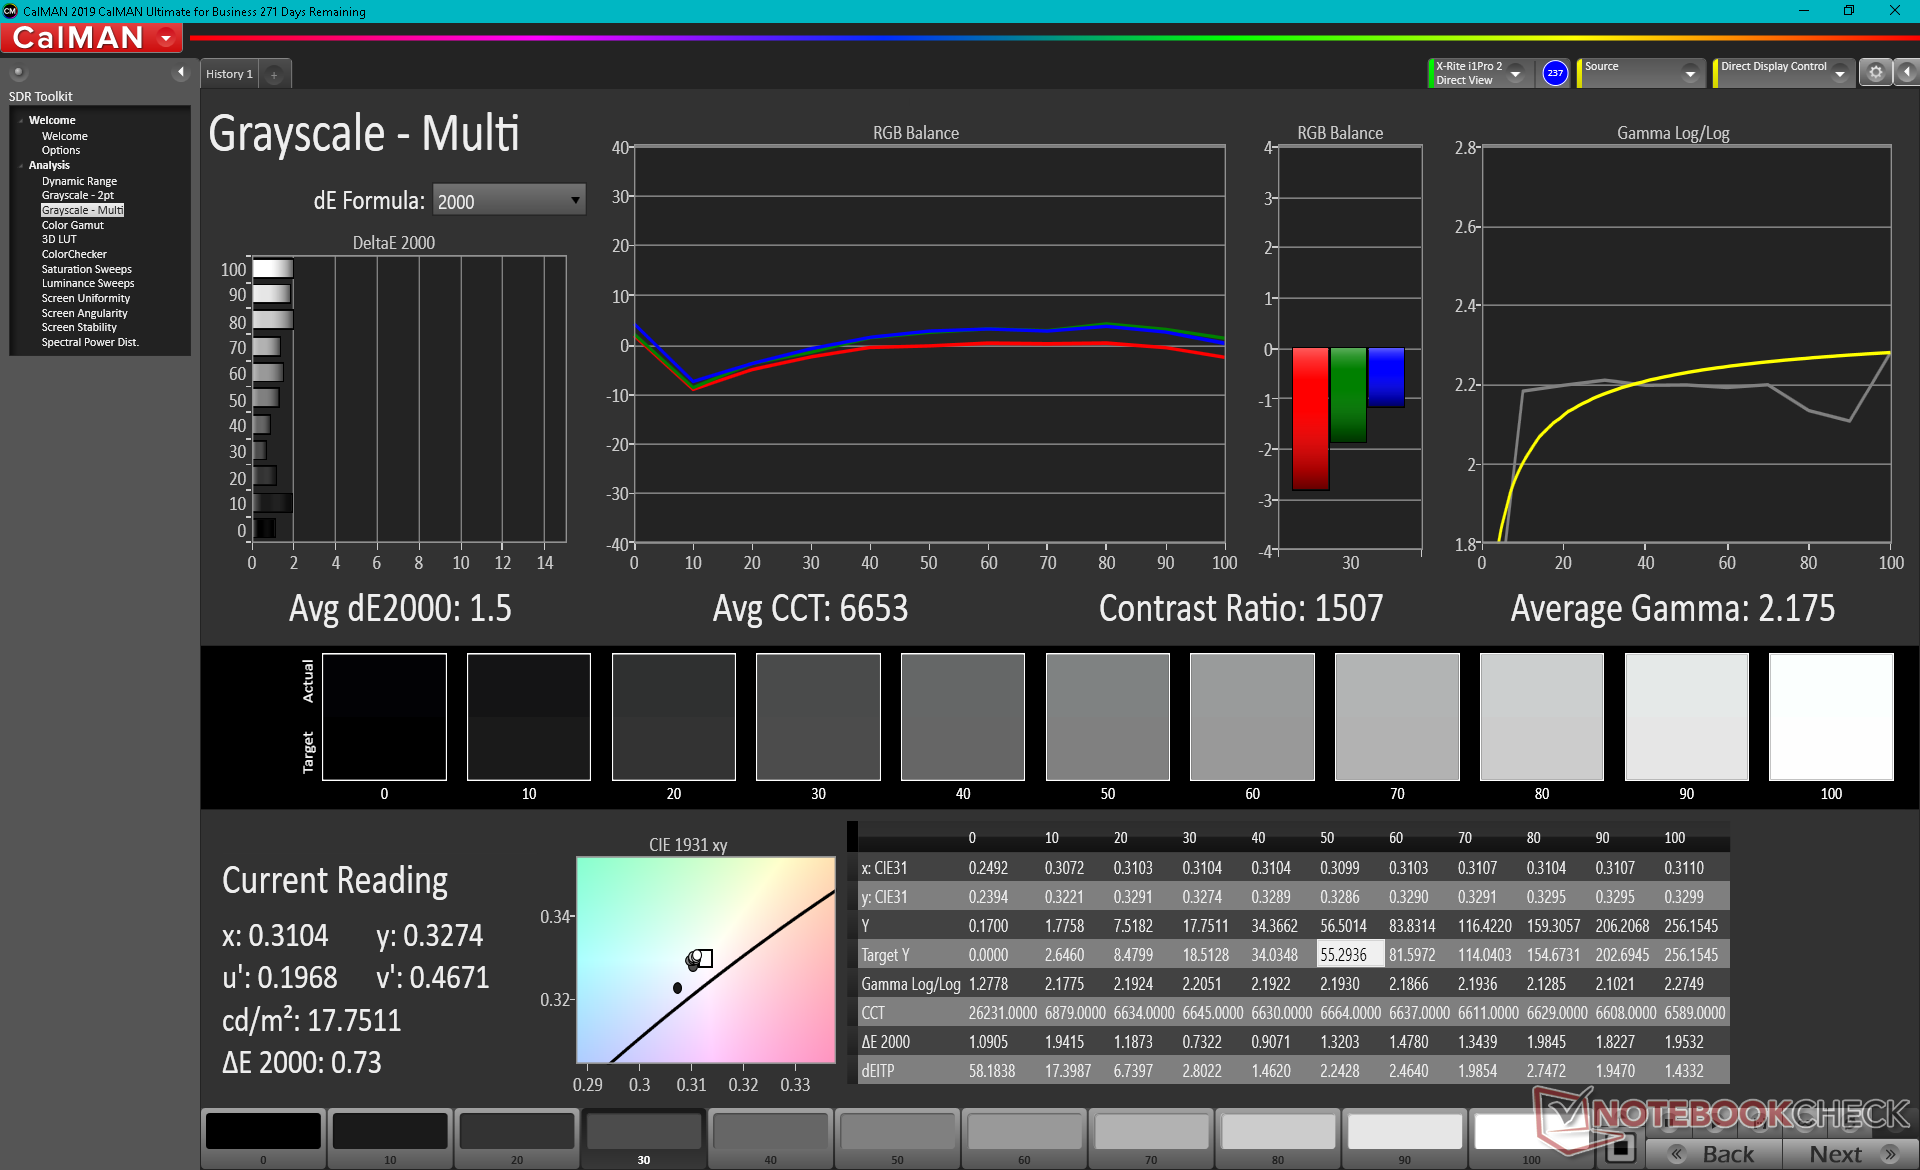
Las mediciones del colorímetro X-Rite muestran una temperatura de color demasiado cálida al sacarlo de la caja, que nuestra propia calibración es capaz de corregir para obtener niveles de escala de grises más precisos. La precisión del color, sin embargo, sigue estando por debajo de la media, especialmente en los niveles de saturación más altos, debido al estrecho espacio de color mencionado anteriormente. El azul, en particular, se representa de forma más imprecisa que cualquier otro color probado, con un amplio margen.
Tiempos de respuesta del display
| ↔ Tiempo de respuesta de Negro a Blanco | ||
|---|---|---|
| 31.6 ms ... subida ↗ y bajada ↘ combinada | ↗ 18.4 ms subida | 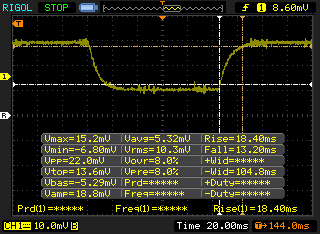 |
| ↘ 13.2 ms bajada | ||
| La pantalla mostró tiempos de respuesta lentos en nuestros tests y podría ser demasiado lenta para los jugones. En comparación, todos los dispositivos de prueba van de ##min### (mínimo) a 240 (máximo) ms. » 85 % de todos los dispositivos son mejores. Eso quiere decir que el tiempo de respuesta es peor que la media (19.9 ms) de todos los dispositivos testados. | ||
| ↔ Tiempo de respuesta 50% Gris a 80% Gris | ||
| 36.8 ms ... subida ↗ y bajada ↘ combinada | ↗ 19.2 ms subida | 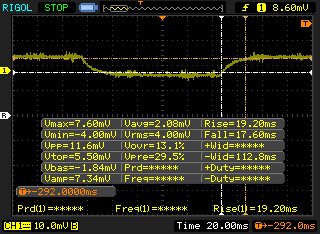 |
| ↘ 17.6 ms bajada | ||
| La pantalla mostró tiempos de respuesta lentos en nuestros tests y podría ser demasiado lenta para los jugones. En comparación, todos los dispositivos de prueba van de ##min### (mínimo) a 636 (máximo) ms. » 53 % de todos los dispositivos son mejores. Eso quiere decir que el tiempo de respuesta es peor que la media (31.1 ms) de todos los dispositivos testados. | ||
Parpadeo de Pantalla / PWM (Pulse-Width Modulation)
| Parpadeo de Pantalla / PWM no detectado | 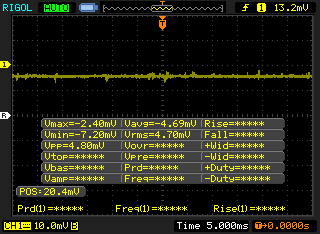 | ||
Comparación: 52 % de todos los dispositivos testados no usaron PWM para atenuar el display. Si se usó, medimos una media de 7798 (mínimo: 5 - máxmo: 343500) Hz. | |||
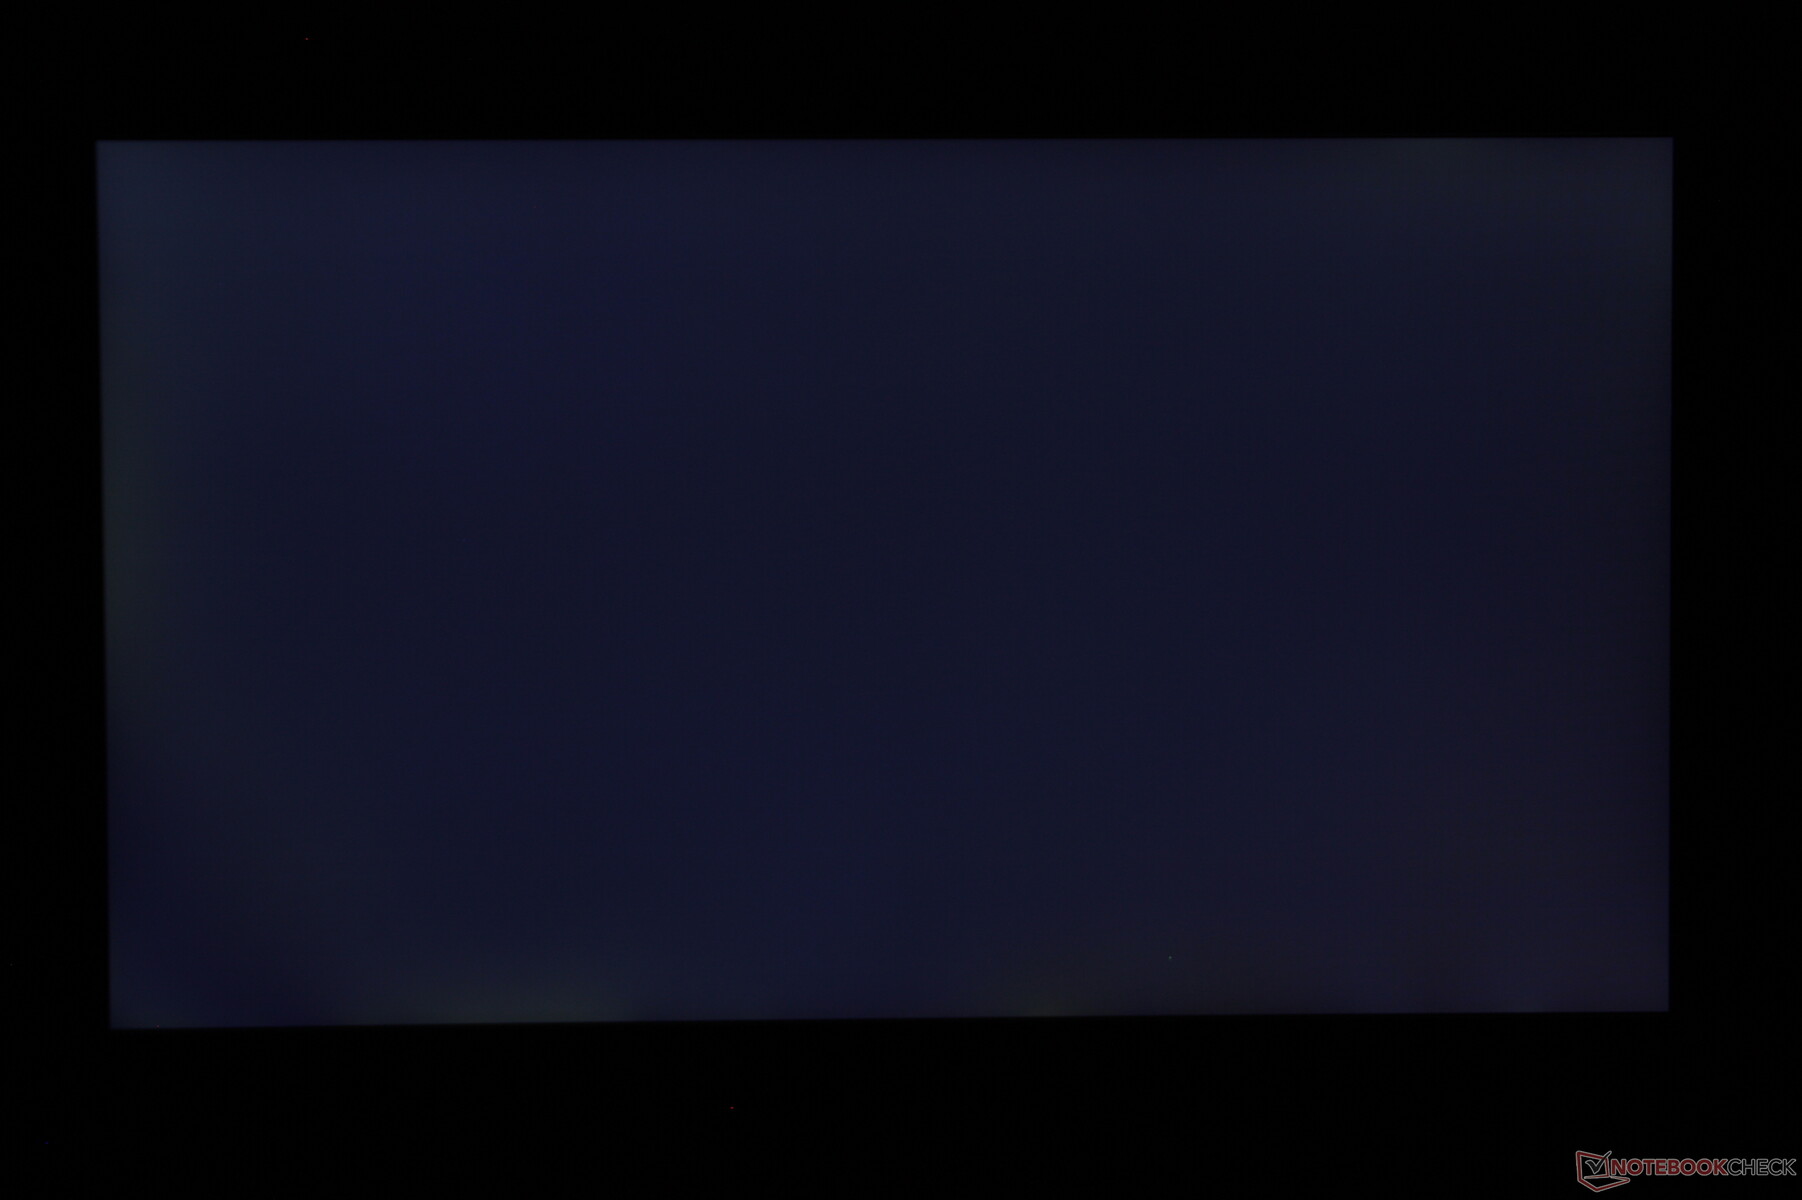
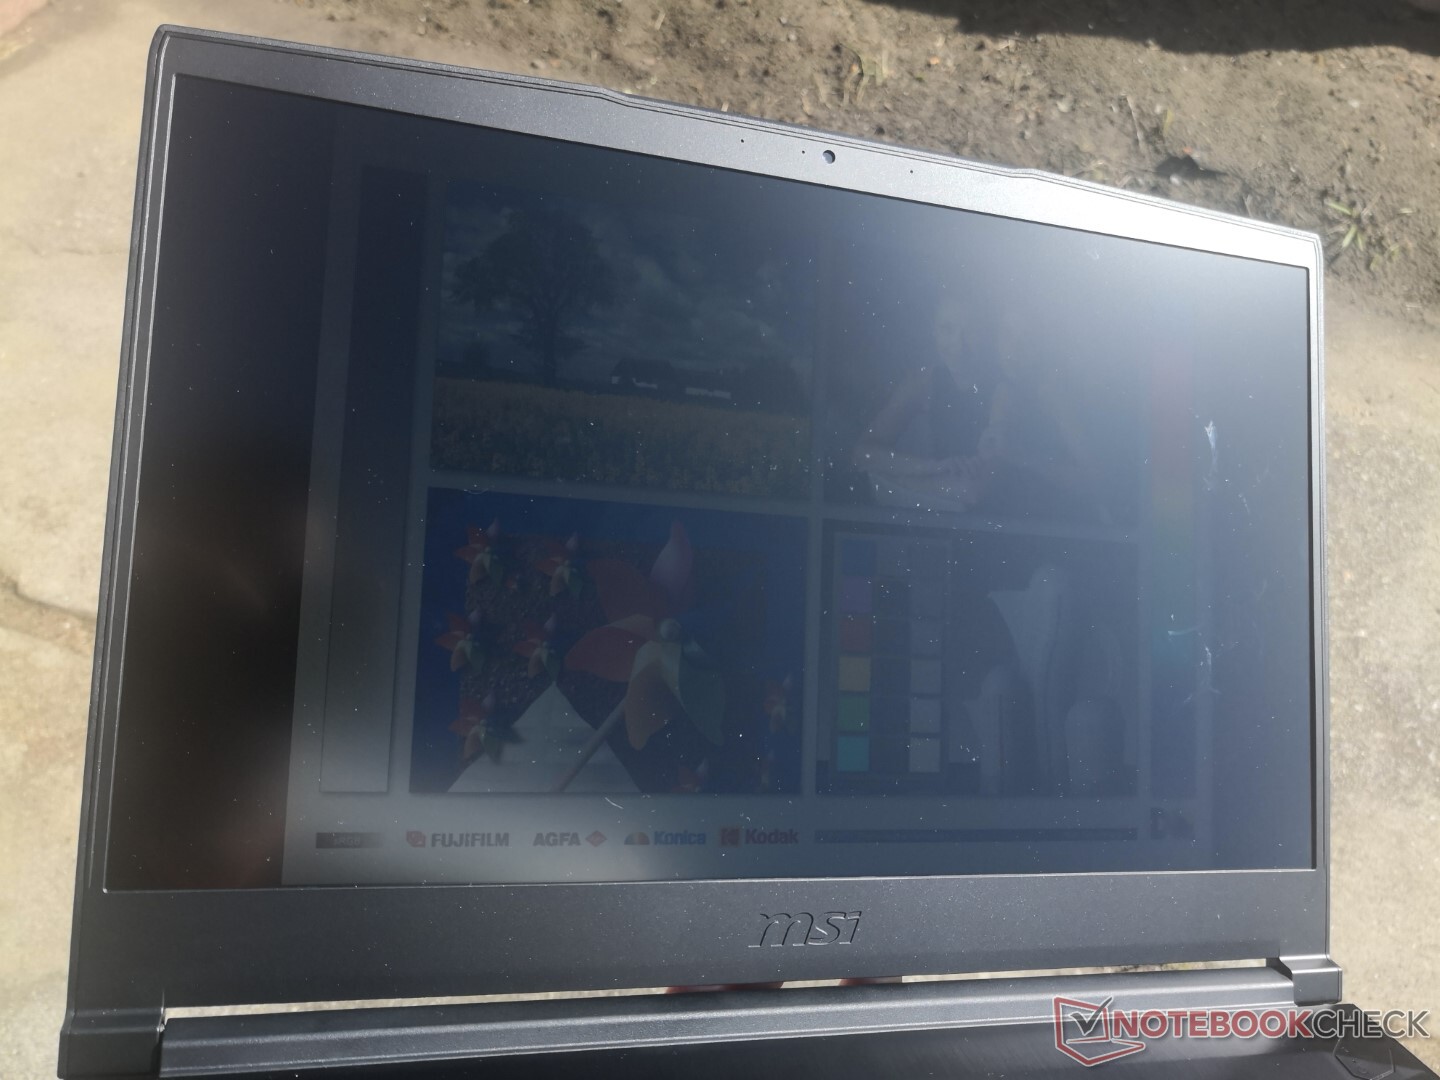
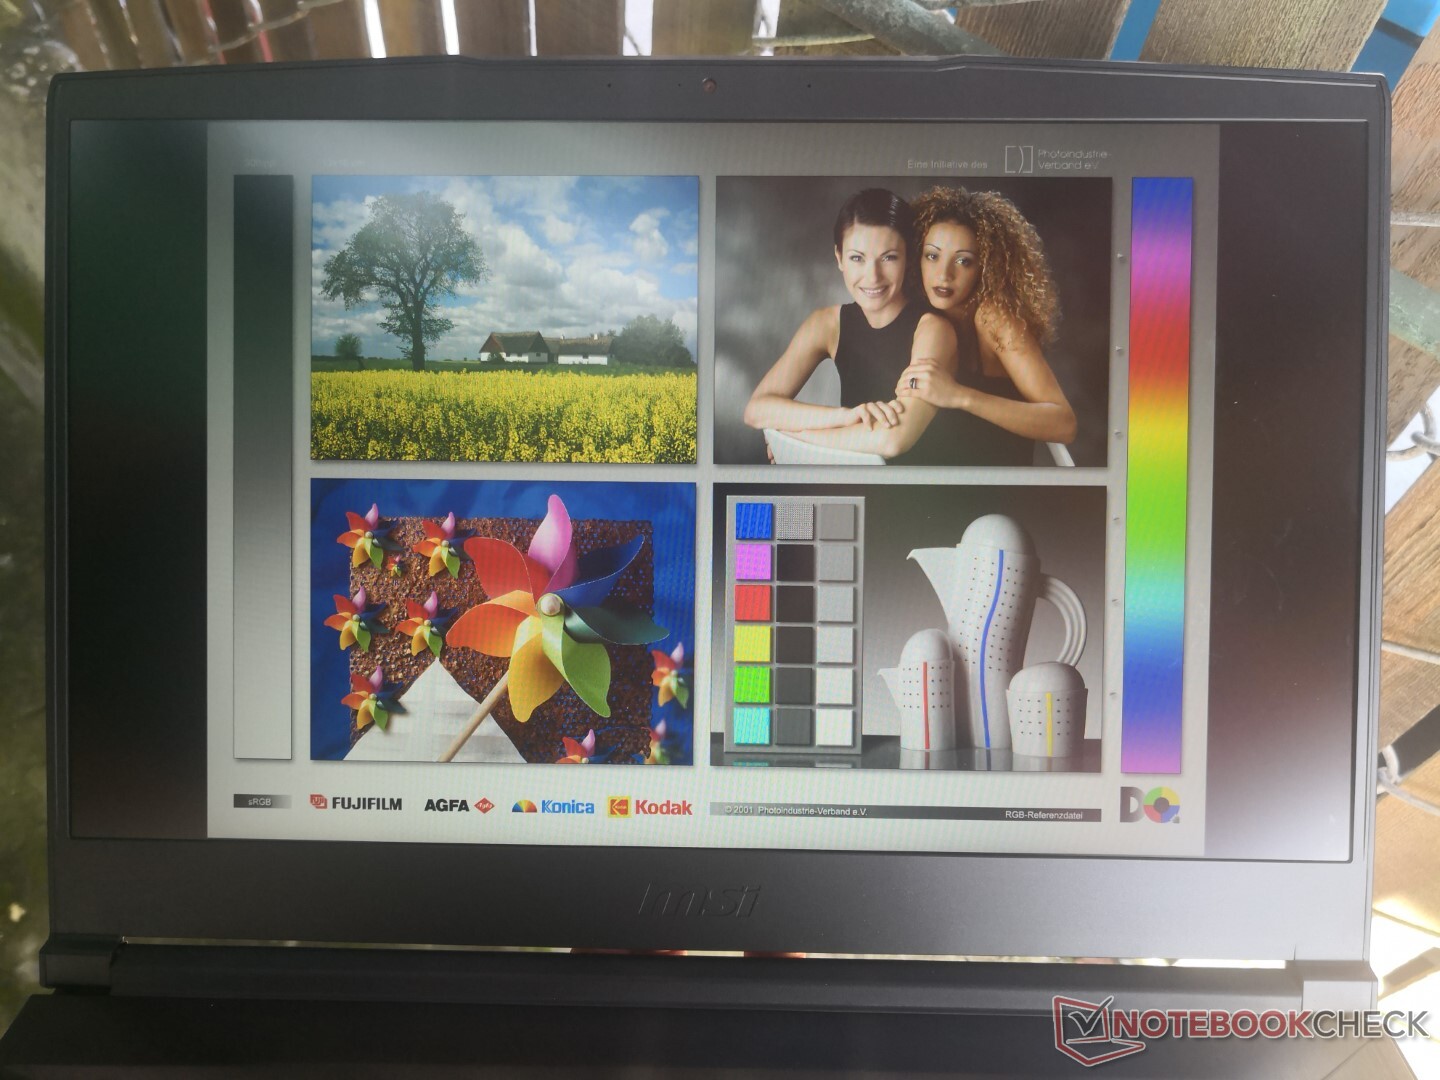
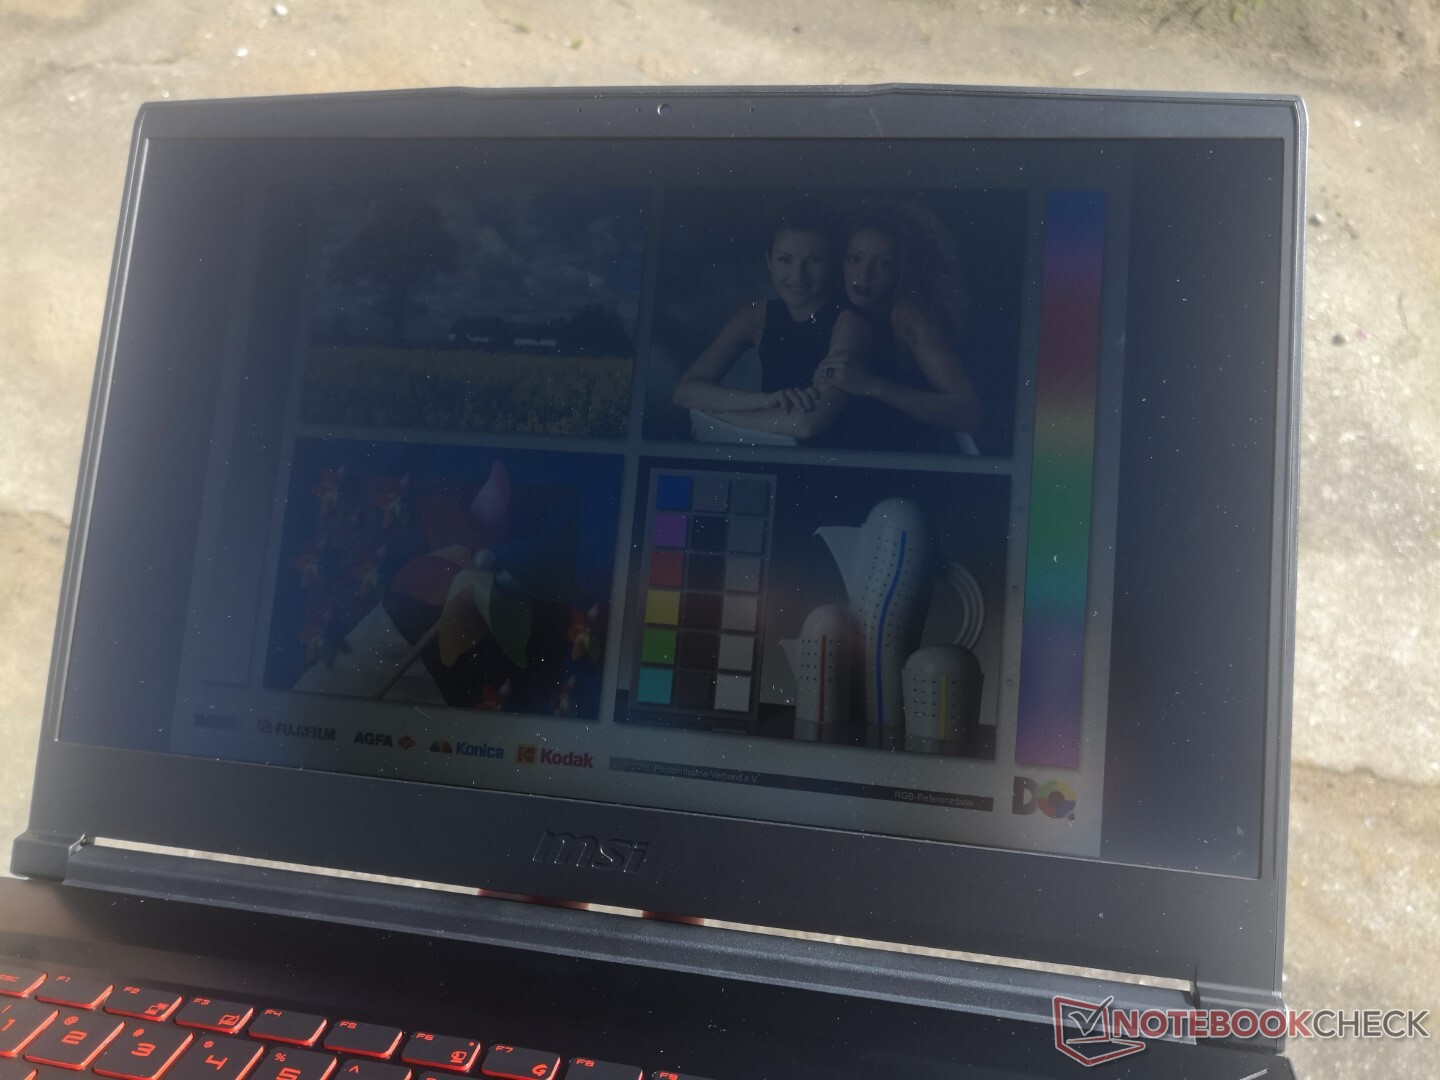
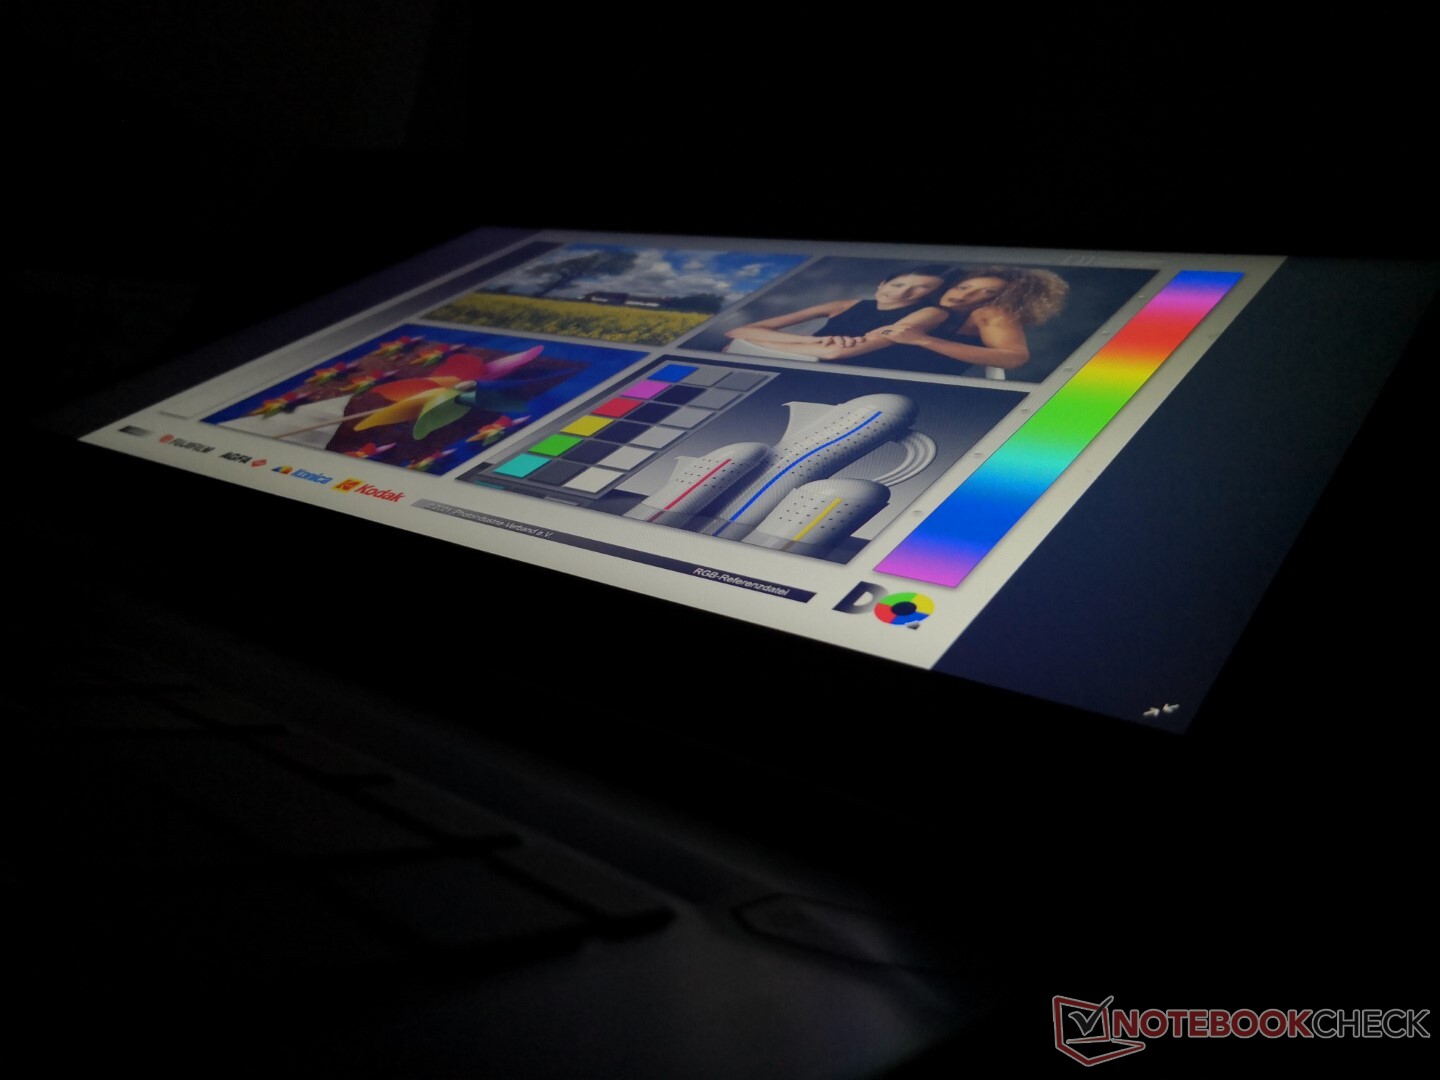
La visibilidad en exteriores está por debajo de la media, ya que la pantalla no es más brillante ni más tenue que la del GF65 9SD saliente. El brillo máximo es un poco menor que el de la mayoría de portátiles para juegos, en los que 300 nits o más son más comunes.
Rendimiento
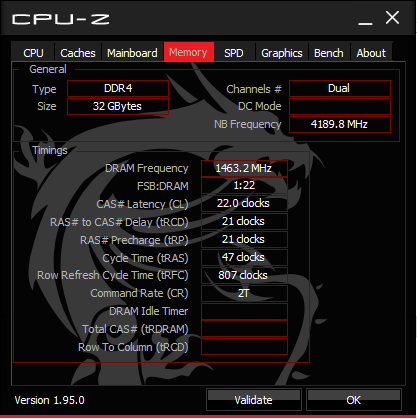
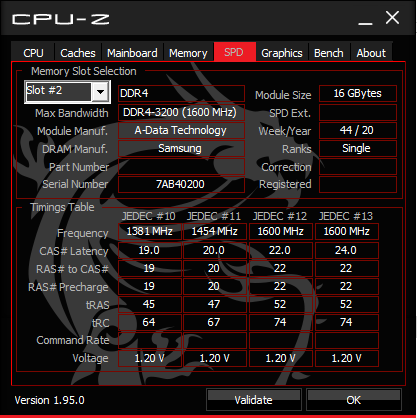
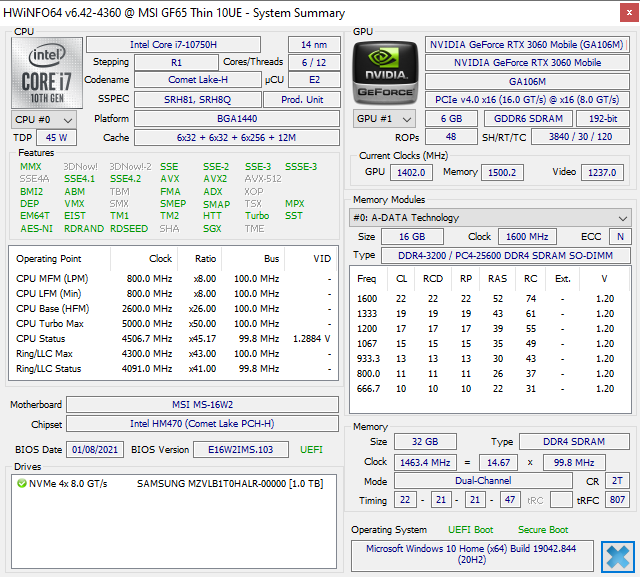
MSI ha actualizado la pantalla (120 Hz a 144 Hz) y la RAM (2666 MHz a 3200 MHz) del antiguo GF65 9SD. La CPU y la GPU se han actualizado de Coffee Lake-H a Comet Lake-H y Nvidia Turing a Ampere, respectivamente.
También hay disponibles SKUs Core i5-10200H e i5-10500H inferiores, pero la pantalla IPS de 144 Hz y la GeForce RTX 3060 siguen siendo fijas en todas las configuraciones en el momento de escribir este artículo.
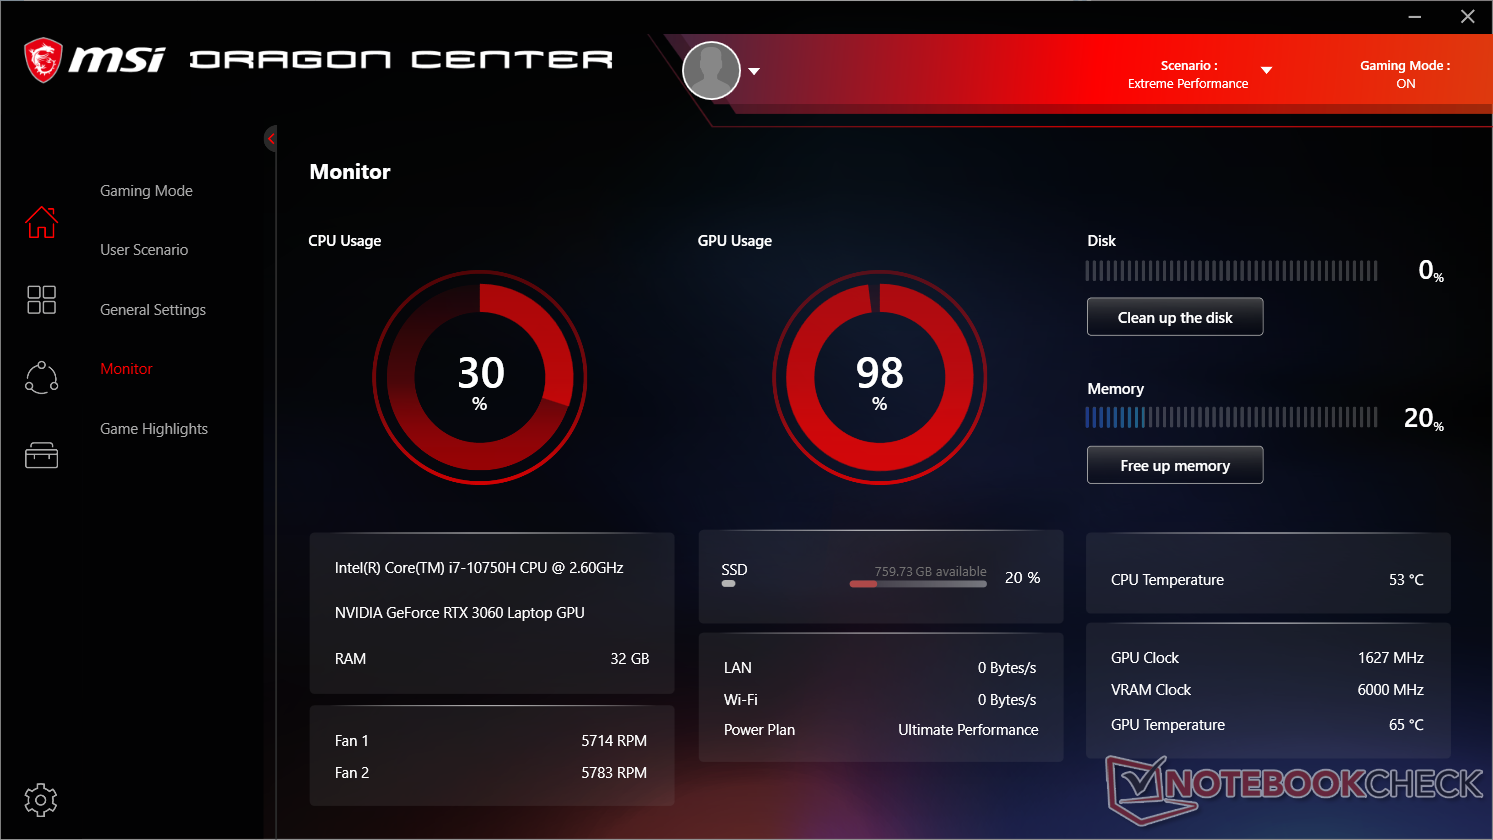
Hemos configurado nuestro sistema en el modo MSI Extreme Performance antes de ejecutar cualquier prueba de rendimiento.
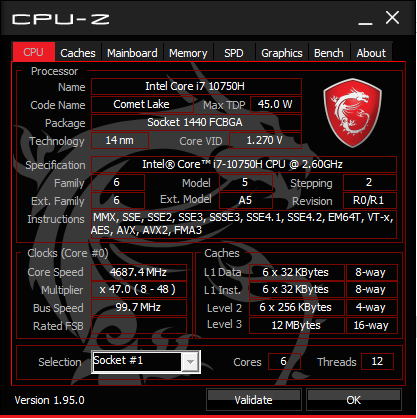
Procesador
El rendimiento multihilo de la CPU es más lento que el del Core i7-10750H medio de nuestra base de datos en un 10-15%. De hecho, el Core i7-9750H más antiguo del Maingear Vector 15 es capaz de superar sistemáticamente a nuestro MSI por unos pocos puntos porcentuales en cargas multihilo. Para un mayor rendimiento, los usuarios deberían activar el modo Cooler Boost (o modo de ventilador máximo) como se detalla en nuestra sección de pruebas de estrés más adelante.
Cinebench R15: CPU Multi 64Bit | CPU Single 64Bit
Blender: v2.79 BMW27 CPU
7-Zip 18.03: 7z b 4 -mmt1 | 7z b 4
Geekbench 5.5: Single-Core | Multi-Core
HWBOT x265 Benchmark v2.2: 4k Preset
LibreOffice : 20 Documents To PDF
R Benchmark 2.5: Overall mean
| Blender / v2.79 BMW27 CPU | |
| Gateway Creator Series 15.6 GWTN156-3BK | |
| MSI GF65 Thin 10UE | |
| Medio Intel Core i7-10750H (322 - 587, n=43) | |
| HP Pavilion Gaming 15-ec1206ng | |
| Asus Zephyrus G14 GA401IV | |
| Aorus 15P XC | |
| Asus ROG Strix Scar 15 G532LWS | |
| Schenker XMG Core 15 Ampere | |
| 7-Zip 18.03 / 7z b 4 -mmt1 | |
| Asus ROG Strix Scar 15 G532LWS | |
| Aorus 15P XC | |
| MSI GF65 Thin 10UE | |
| Medio Intel Core i7-10750H (4504 - 5470, n=43) | |
| Schenker XMG Core 15 Ampere | |
| Asus Zephyrus G14 GA401IV | |
| Gateway Creator Series 15.6 GWTN156-3BK | |
| HP Pavilion Gaming 15-ec1206ng | |
| 7-Zip 18.03 / 7z b 4 | |
| Schenker XMG Core 15 Ampere | |
| Asus Zephyrus G14 GA401IV | |
| Asus ROG Strix Scar 15 G532LWS | |
| Aorus 15P XC | |
| HP Pavilion Gaming 15-ec1206ng | |
| Medio Intel Core i7-10750H (26040 - 37345, n=43) | |
| MSI GF65 Thin 10UE | |
| Gateway Creator Series 15.6 GWTN156-3BK | |
| Geekbench 5.5 / Single-Core | |
| Asus ROG Strix Scar 15 G532LWS | |
| MSI GF65 Thin 10UE | |
| Aorus 15P XC | |
| Medio Intel Core i7-10750H (1114 - 1333, n=43) | |
| Asus Zephyrus G14 GA401IV | |
| Schenker XMG Core 15 Ampere | |
| HP Pavilion Gaming 15-ec1206ng | |
| Gateway Creator Series 15.6 GWTN156-3BK | |
| Geekbench 5.5 / Multi-Core | |
| Asus ROG Strix Scar 15 G532LWS | |
| Schenker XMG Core 15 Ampere | |
| Aorus 15P XC | |
| Asus Zephyrus G14 GA401IV | |
| MSI GF65 Thin 10UE | |
| Medio Intel Core i7-10750H (4443 - 6674, n=43) | |
| HP Pavilion Gaming 15-ec1206ng | |
| Gateway Creator Series 15.6 GWTN156-3BK | |
| HWBOT x265 Benchmark v2.2 / 4k Preset | |
| Schenker XMG Core 15 Ampere | |
| Asus ROG Strix Scar 15 G532LWS | |
| Aorus 15P XC | |
| Asus Zephyrus G14 GA401IV | |
| HP Pavilion Gaming 15-ec1206ng | |
| Medio Intel Core i7-10750H (5.54 - 11.6, n=43) | |
| MSI GF65 Thin 10UE | |
| Gateway Creator Series 15.6 GWTN156-3BK | |
| LibreOffice / 20 Documents To PDF | |
| HP Pavilion Gaming 15-ec1206ng | |
| Schenker XMG Core 15 Ampere | |
| Gateway Creator Series 15.6 GWTN156-3BK | |
| Aorus 15P XC | |
| Medio Intel Core i7-10750H (43.1 - 99.2, n=43) | |
| Asus ROG Strix Scar 15 G532LWS | |
| MSI GF65 Thin 10UE | |
| R Benchmark 2.5 / Overall mean | |
| Gateway Creator Series 15.6 GWTN156-3BK | |
| Medio Intel Core i7-10750H (0.578 - 0.708, n=42) | |
| HP Pavilion Gaming 15-ec1206ng | |
| MSI GF65 Thin 10UE | |
| Aorus 15P XC | |
| Schenker XMG Core 15 Ampere | |
| Asus ROG Strix Scar 15 G532LWS | |
* ... más pequeño es mejor
Rendimiento del sistema
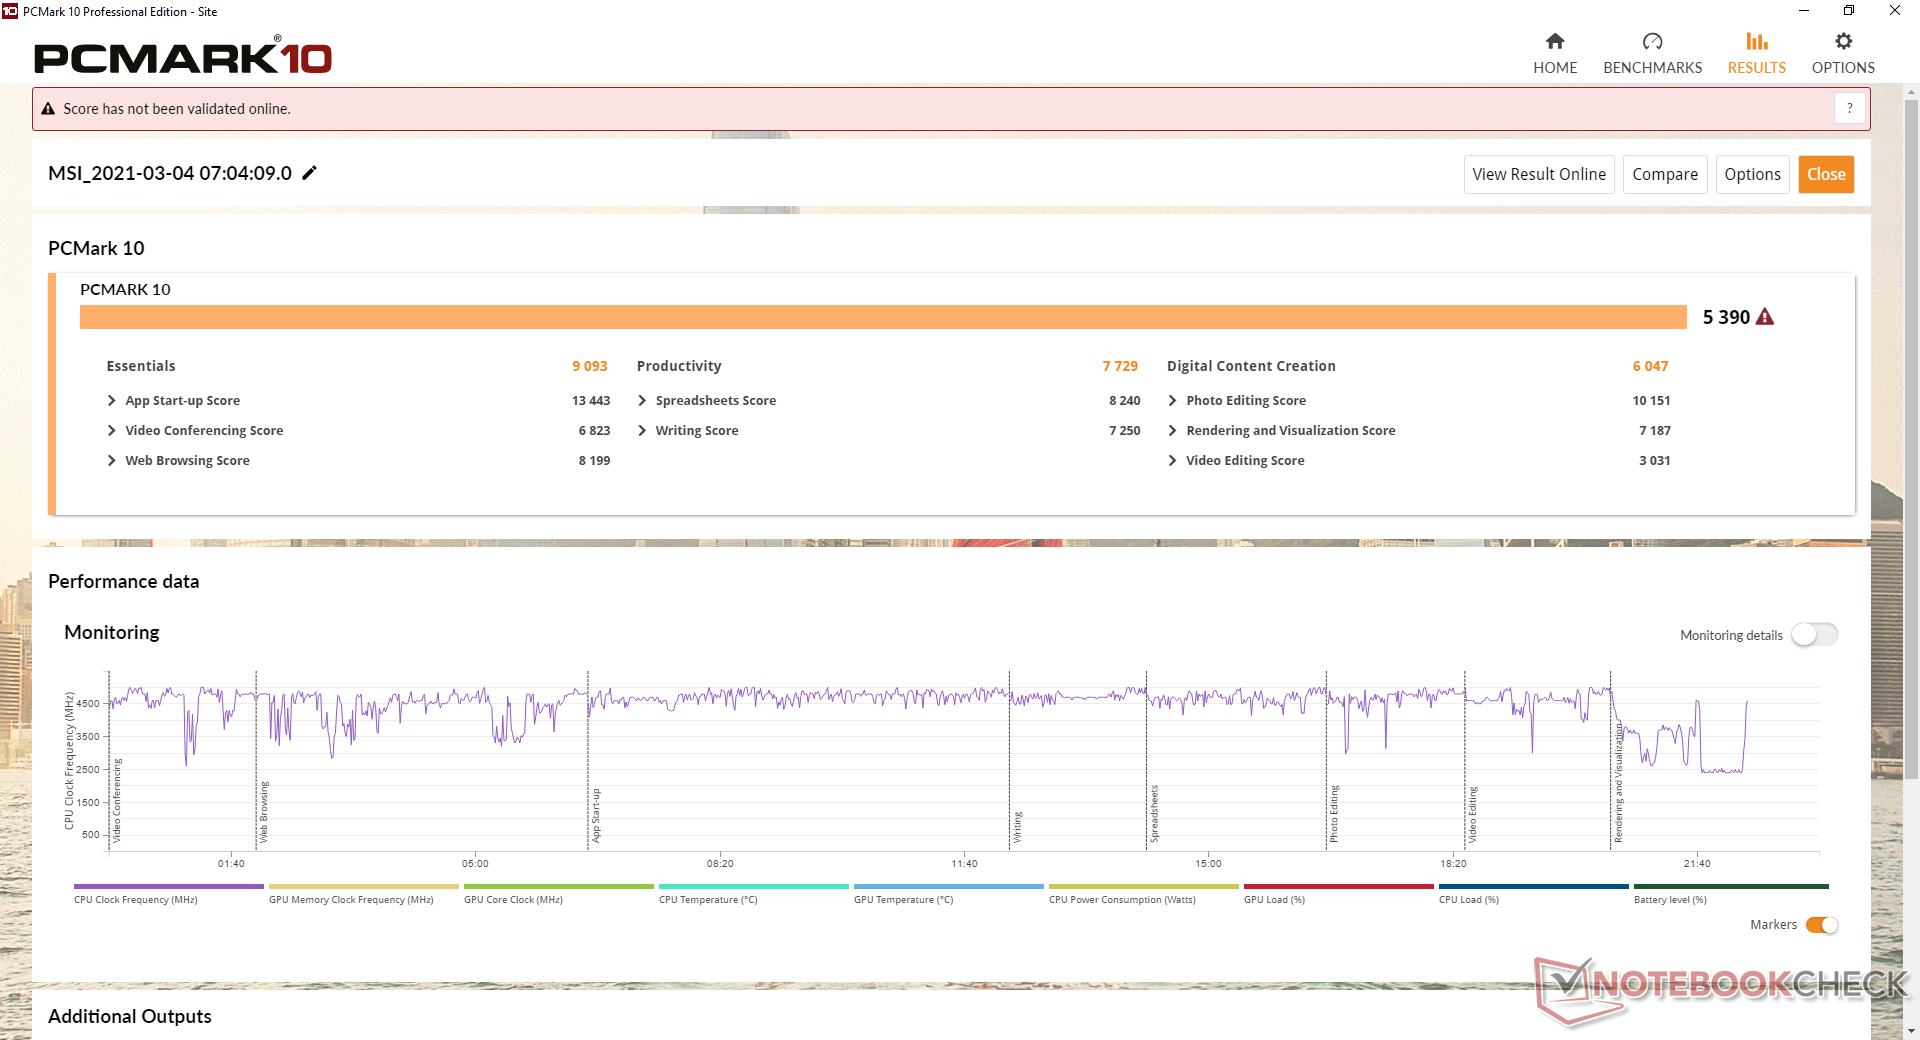
| PCMark 10 Score | 5390 puntos | |
ayuda | ||
Latencia del CPD
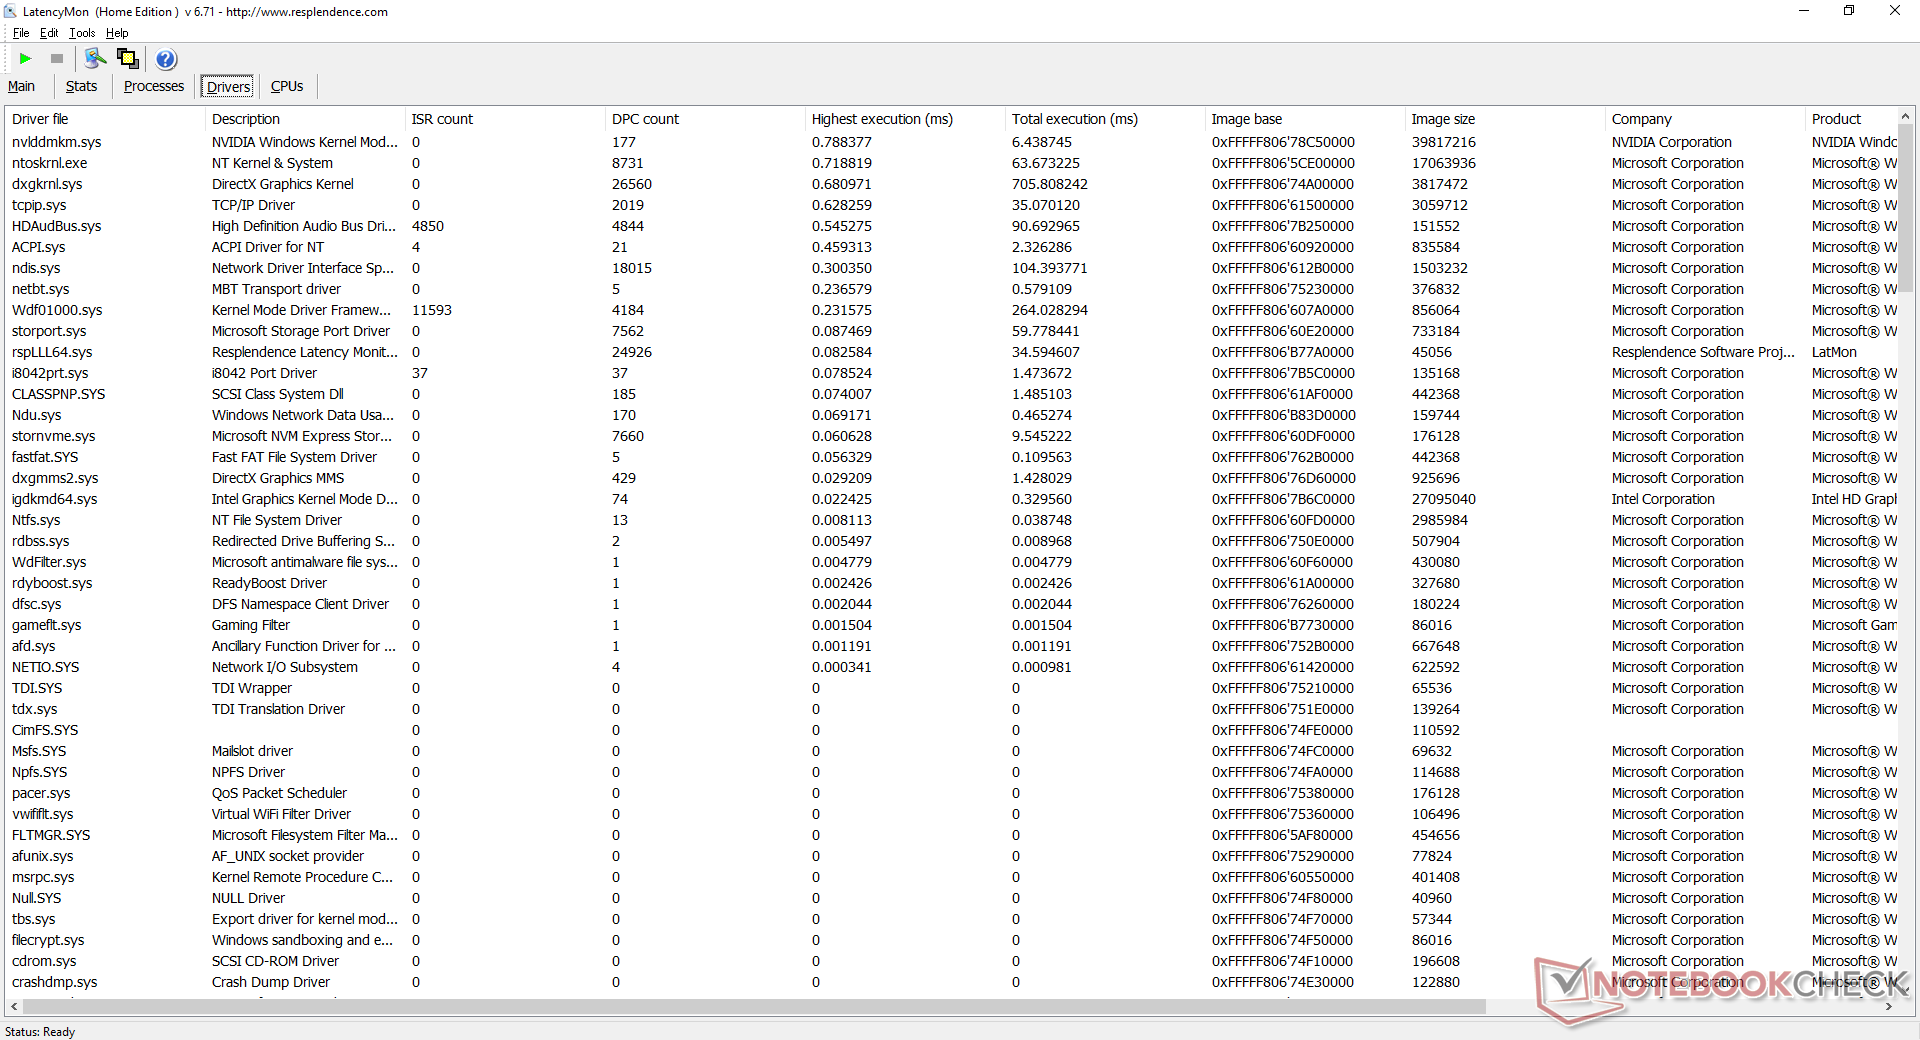
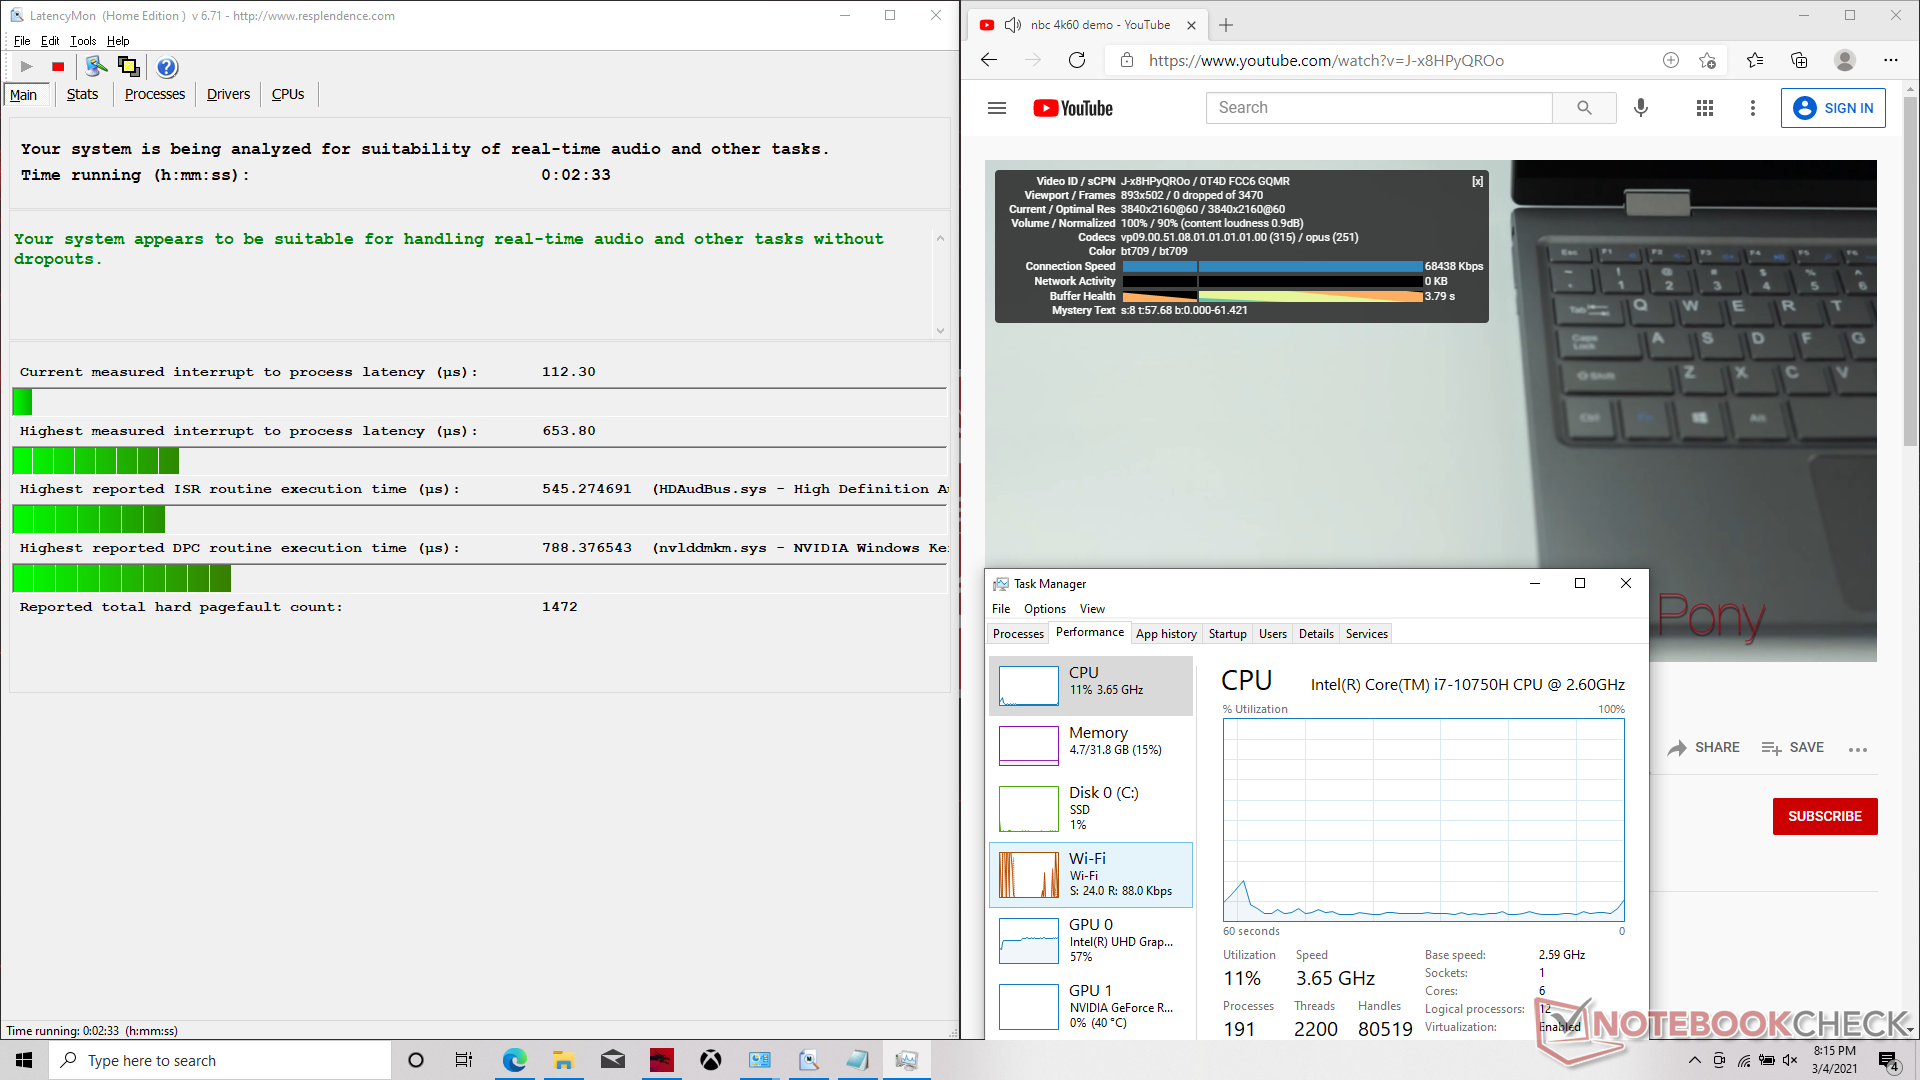
LatencyMon no muestra problemas de latencia DPC al abrir varias pestañas del navegador en nuestra página de inicio y tampoco se producen caídas de fotogramas al reproducir contenido 4K60 en YouTube.
| DPC Latencies / LatencyMon - interrupt to process latency (max), Web, Youtube, Prime95 | |
| Aorus 15G XC | |
| Lenovo Legion 7 15IMH05-81YT001VGE | |
| MSI GF65 Thin 10UE | |
| MSI GS66 Stealth 10UG | |
| Schenker XMG Core 15 Ampere | |
| Asus ROG Strix G15 G513QR | |
* ... más pequeño es mejor
Dispositivos de almacenamiento
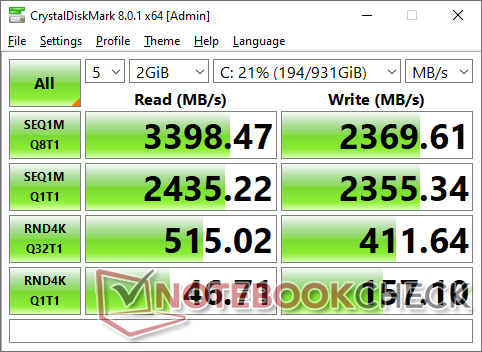
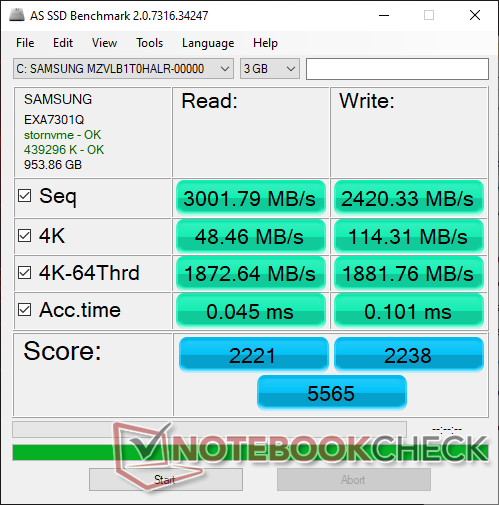
Nuestra unidad viene con un SSD Samsung PM981 NVMe de 1 TB, pero otros vendedores probablemente tendrán algo diferente dependiendo de la capacidad y el precio deseados. Pudimos alcanzar y mantener la velocidad de lectura secuencial teórica de 3200 MB/s de la unidad, como muestra nuestra prueba de bucle DiskSpd a continuación.
| MSI GF65 Thin 10UE Samsung SSD PM981 MZVLB1T0HALR | Asus ROG Strix G15 G513QR SK Hynix HFM001TD3JX013N | Schenker XMG Core 15 Ampere Samsung SSD 970 EVO Plus 1TB | MSI GS66 Stealth 10UG WDC PC SN730 SDBPNTY-1T00 | Lenovo Legion 7 15IMH05-81YT001VGE 2x Samsung PM981a MZVLB1T0HBLR (RAID 0) | |
|---|---|---|---|---|---|
| AS SSD | -7% | 10% | -4% | -7% | |
| Seq Read (MB/s) | 3002 | 2881 -4% | 2829 -6% | 2198 -27% | 3088 3% |
| Seq Write (MB/s) | 2420 | 1570 -35% | 2646 9% | 2596 7% | 2561 6% |
| 4K Read (MB/s) | 48.46 | 52.4 8% | 54.8 13% | 43.81 -10% | 43.01 -11% |
| 4K Write (MB/s) | 114.3 | 124 8% | 179.1 57% | 115.5 1% | 102 -11% |
| 4K-64 Read (MB/s) | 1873 | 1334 -29% | 1734 -7% | 1692 -10% | 1549 -17% |
| 4K-64 Write (MB/s) | 1882 | 2189 16% | 2396 27% | 2162 15% | 1378 -27% |
| Access Time Read * (ms) | 0.045 | 0.055 -22% | 0.033 27% | 0.056 -24% | 0.051 -13% |
| Access Time Write * (ms) | 0.101 | 0.03 70% | 0.021 79% | 0.098 3% | 0.037 63% |
| Score Read (Points) | 2221 | 1675 -25% | 2072 -7% | 1956 -12% | 1901 -14% |
| Score Write (Points) | 2238 | 2470 10% | 2839 27% | 2537 13% | 1737 -22% |
| Score Total (Points) | 5565 | 4943 -11% | 5965 7% | 5513 -1% | 4583 -18% |
| Copy ISO MB/s (MB/s) | 2421 | 1277 -47% | 2119 -12% | 2236 -8% | 2684 11% |
| Copy Program MB/s (MB/s) | 705 | 575 -18% | 406.1 -42% | 690 -2% | 544 -23% |
| Copy Game MB/s (MB/s) | 1490 | 1272 -15% | 1086 -27% | 1546 4% | 1116 -25% |
| CrystalDiskMark 5.2 / 6 | 14% | 4% | 8% | ||
| Write 4K (MB/s) | 157.3 | 139.1 -12% | 163.1 4% | 110.4 -30% | |
| Read 4K (MB/s) | 46.69 | 47.59 2% | 48.97 5% | 55.1 18% | |
| Write Seq (MB/s) | 2389 | 2917 22% | 2607 9% | ||
| Read Seq (MB/s) | 2196 | 2586 18% | 2316 5% | ||
| Write 4K Q32T1 (MB/s) | 407.6 | 511 25% | 338 -17% | 466.6 14% | |
| Read 4K Q32T1 (MB/s) | 519 | 571 10% | 475.6 -8% | 517 0% | |
| Write Seq Q32T1 (MB/s) | 2401 | 3263 36% | 3090 29% | 3424 43% | |
| Read Seq Q32T1 (MB/s) | 3344 | 3567 7% | 3421 2% | 3519 5% | |
| Write 4K Q8T8 (MB/s) | 1496 | ||||
| Read 4K Q8T8 (MB/s) | 1597 | ||||
| Media total (Programa/Opciones) | -7% /
-7% | 12% /
12% | 0% /
-1% | 1% /
-2% |
* ... más pequeño es mejor

Disk Throttling: DiskSpd Read Loop, Queue Depth 8
Rendimiento de la GPU
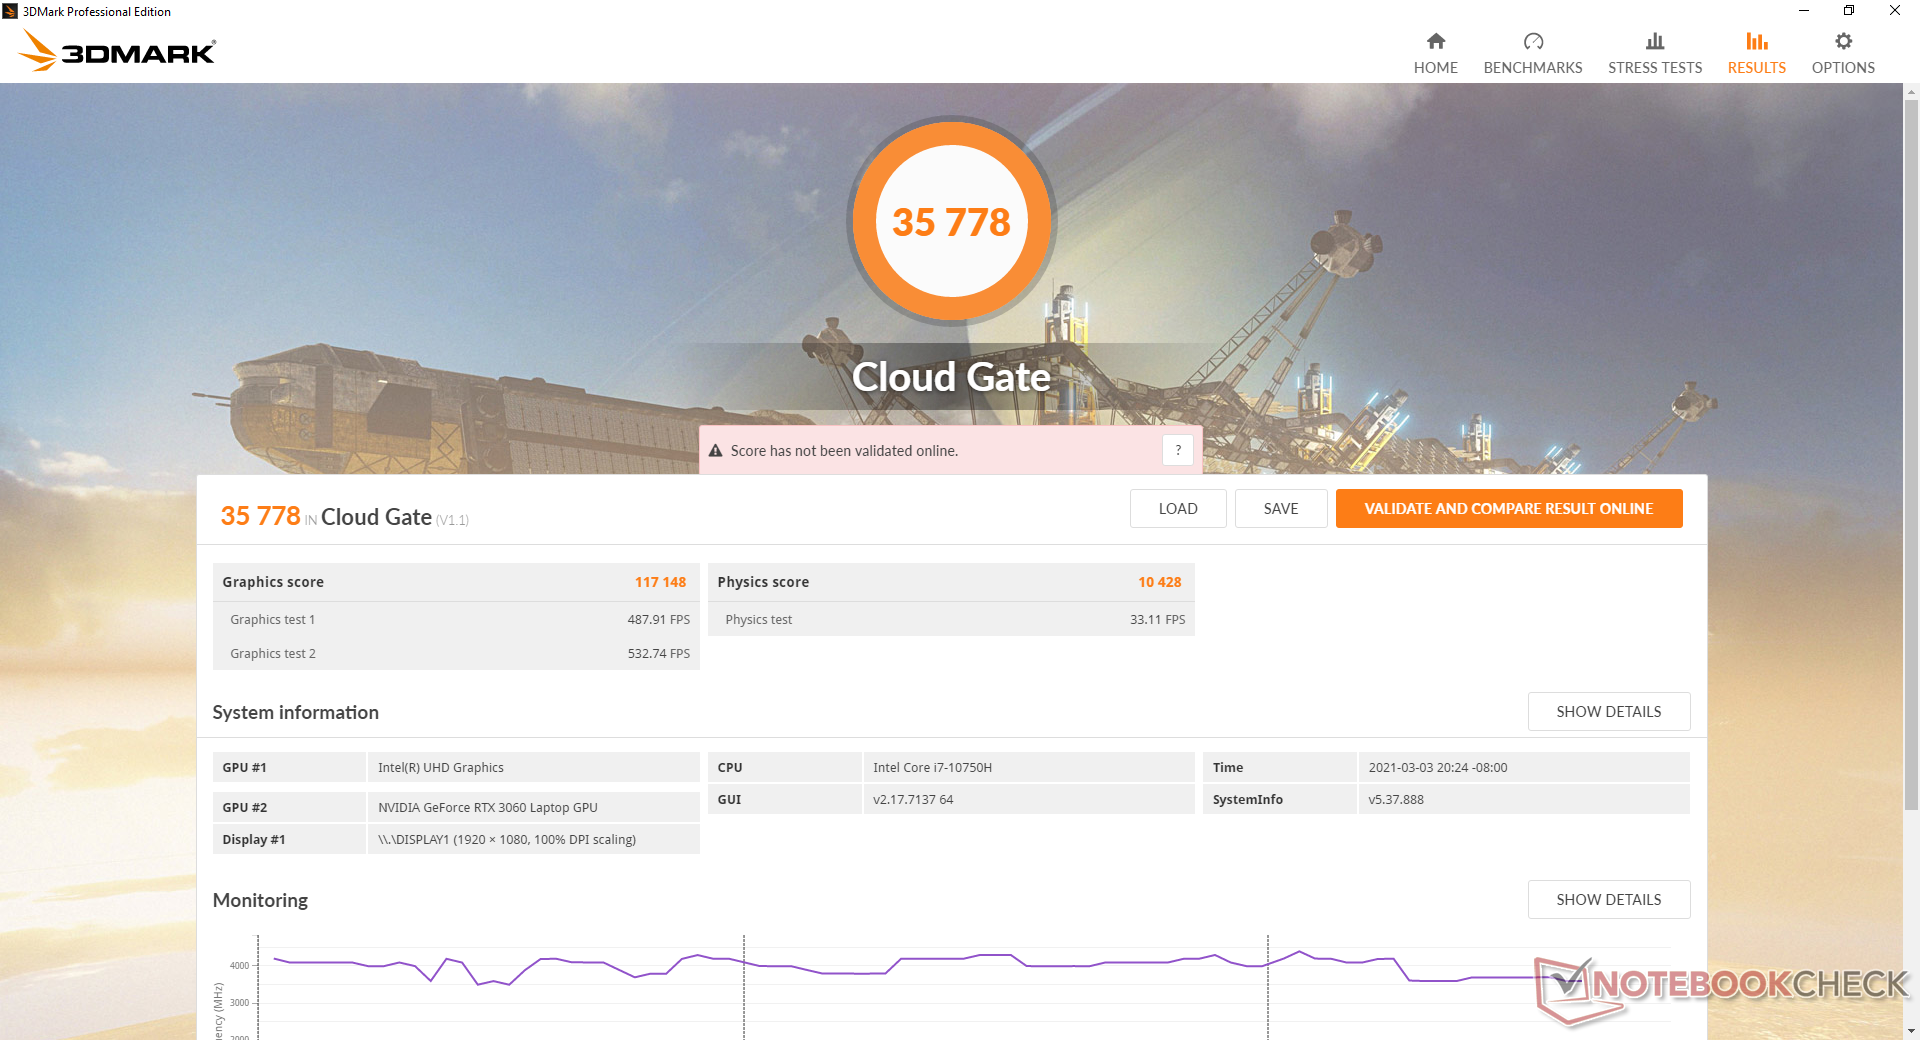
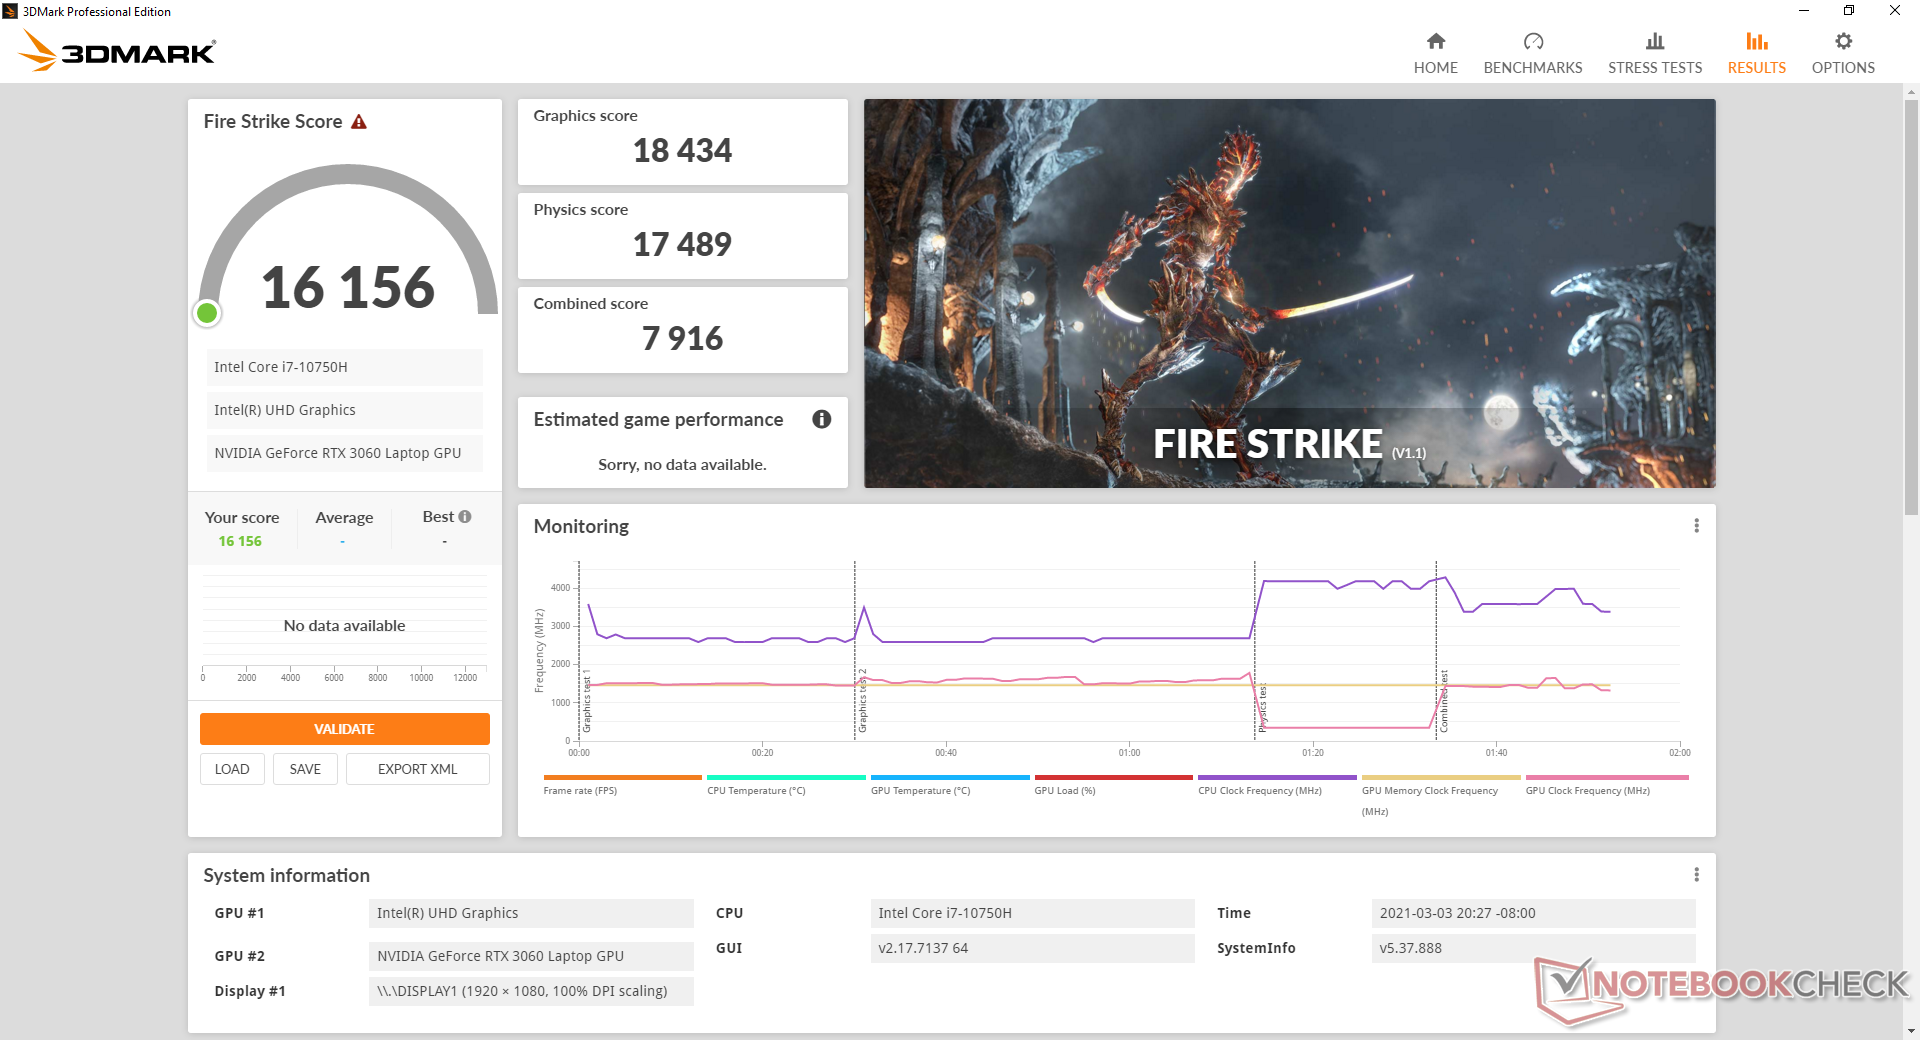
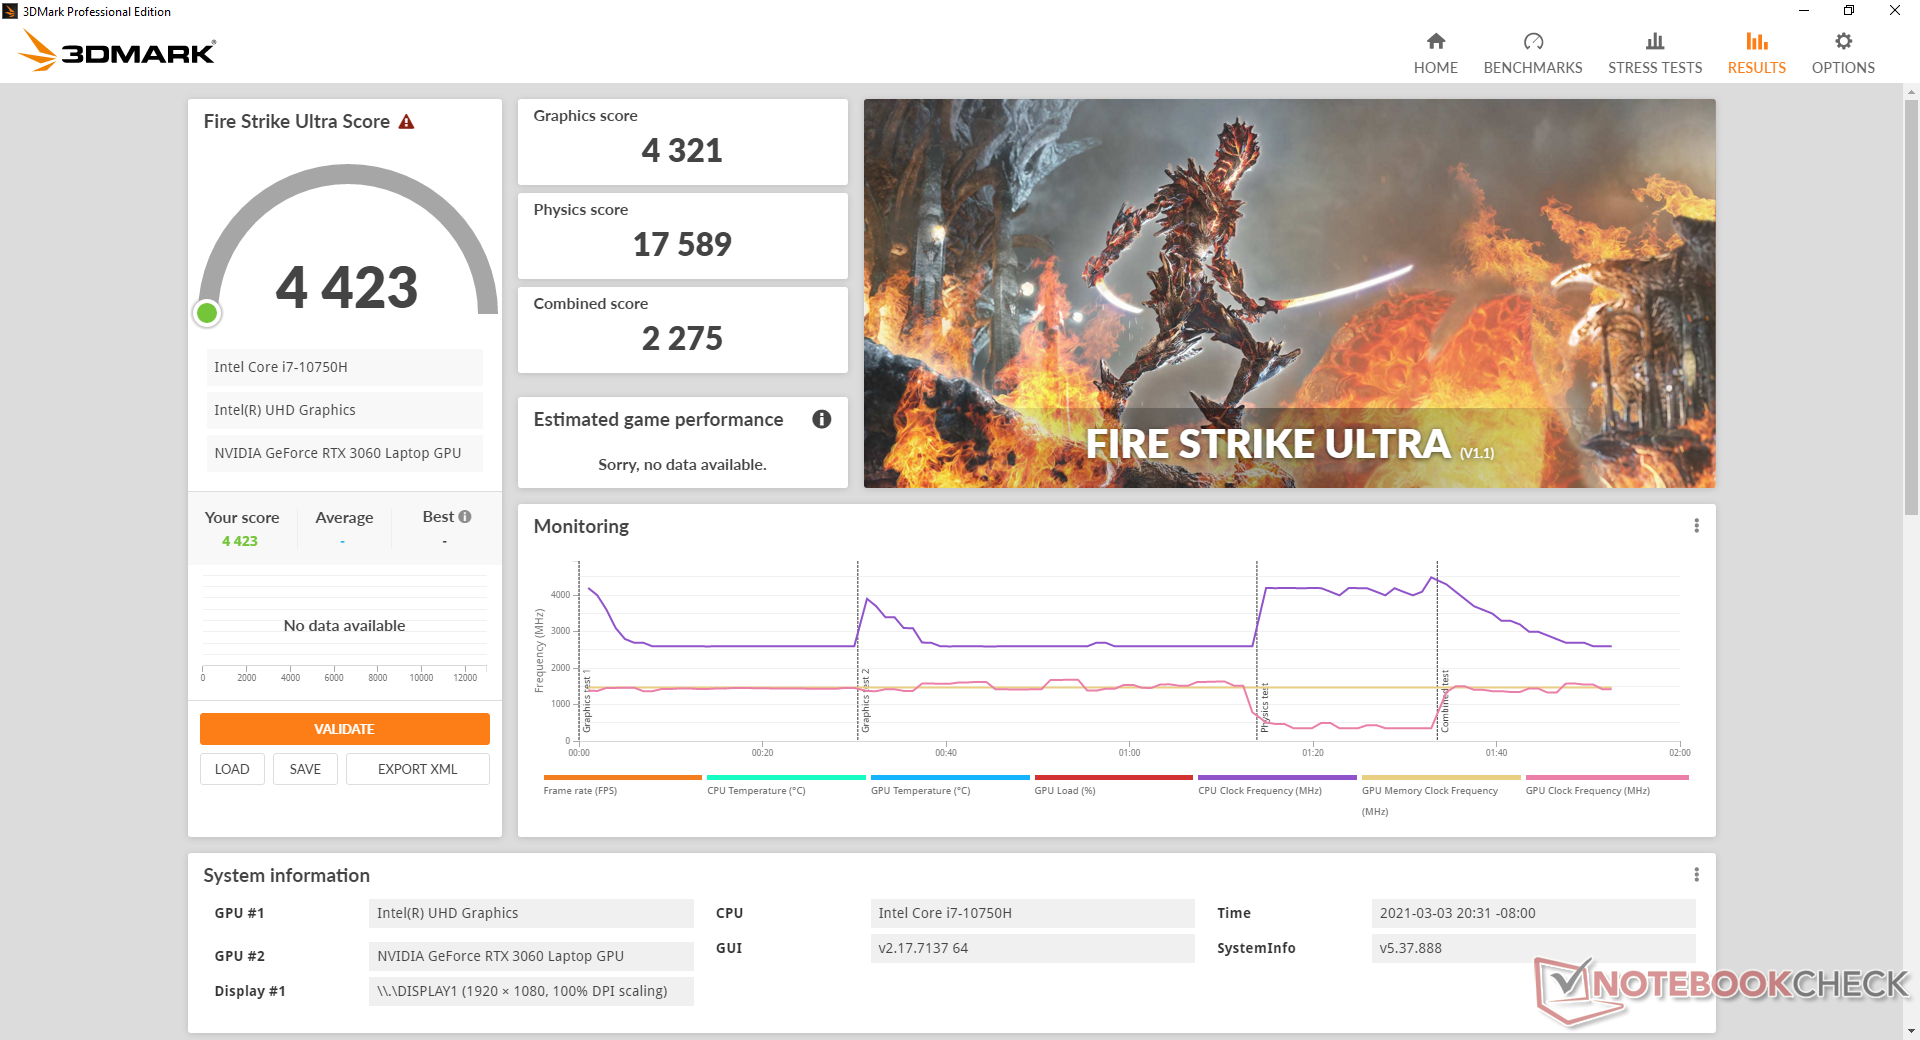
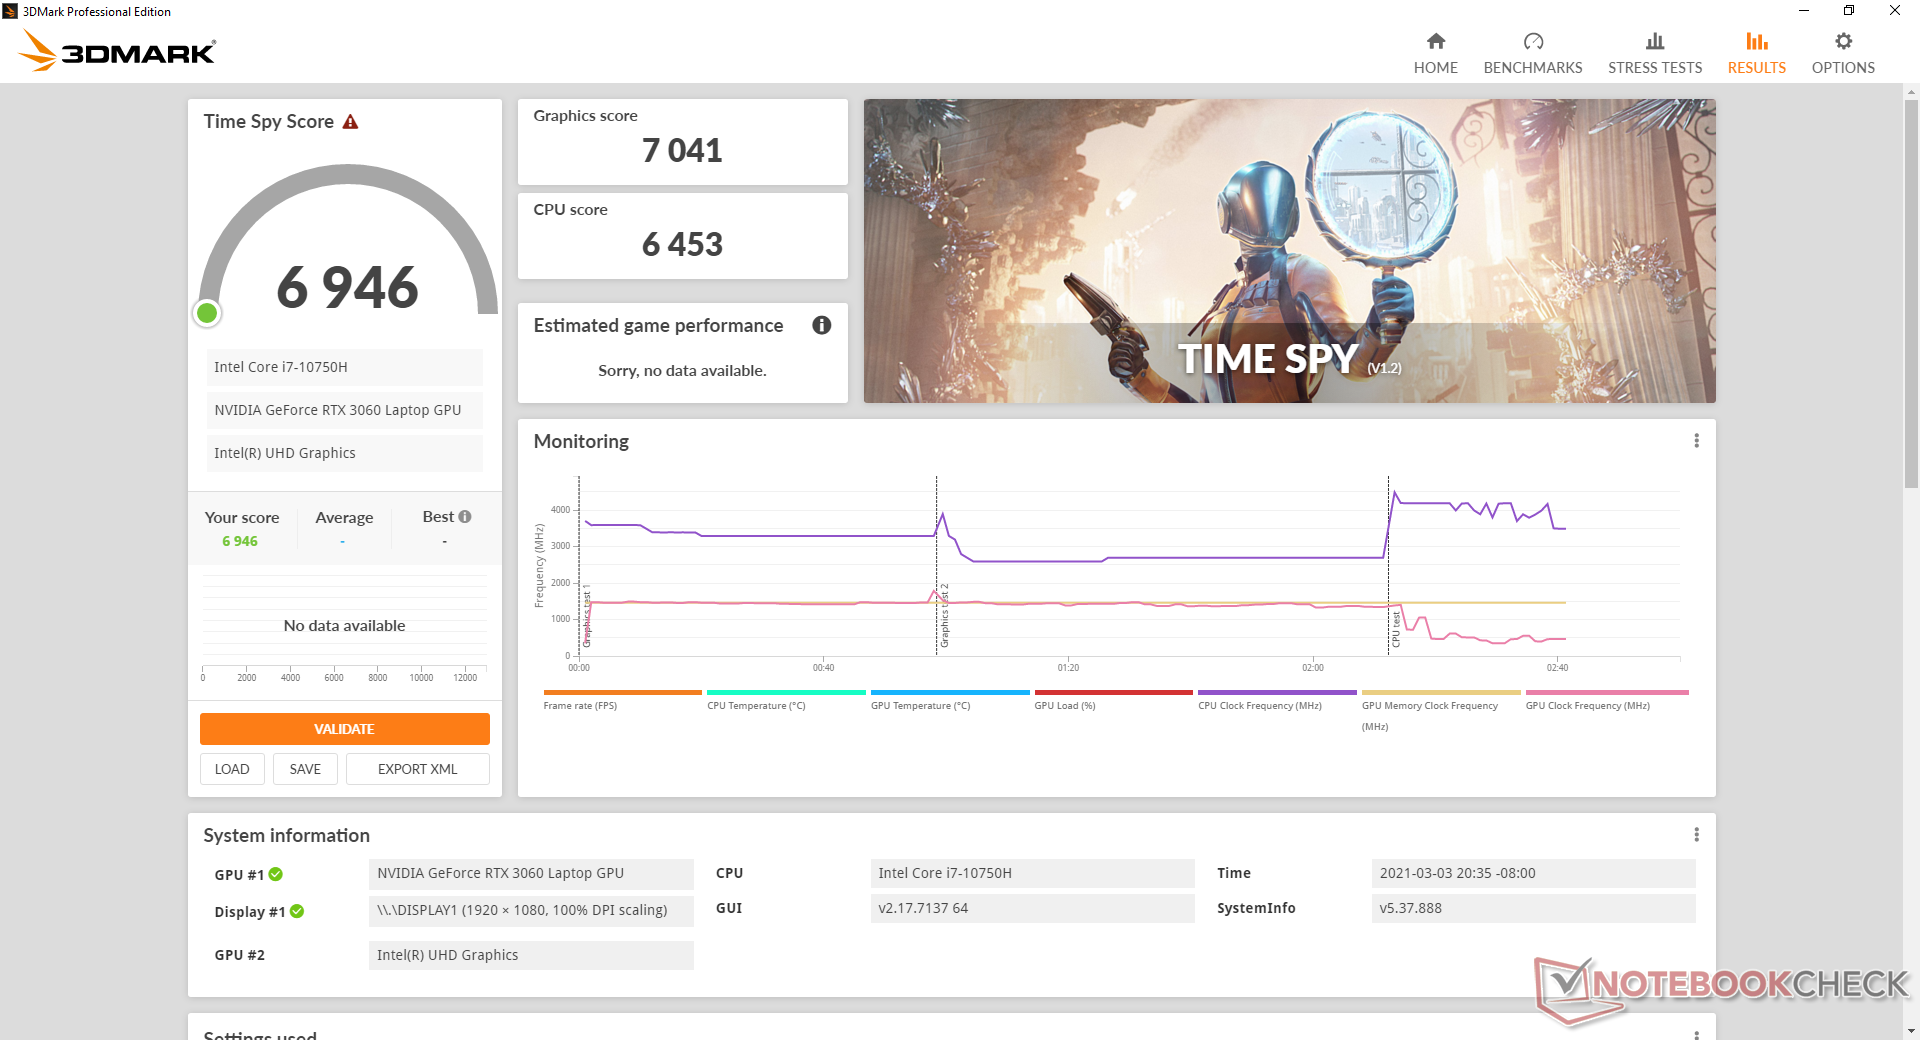
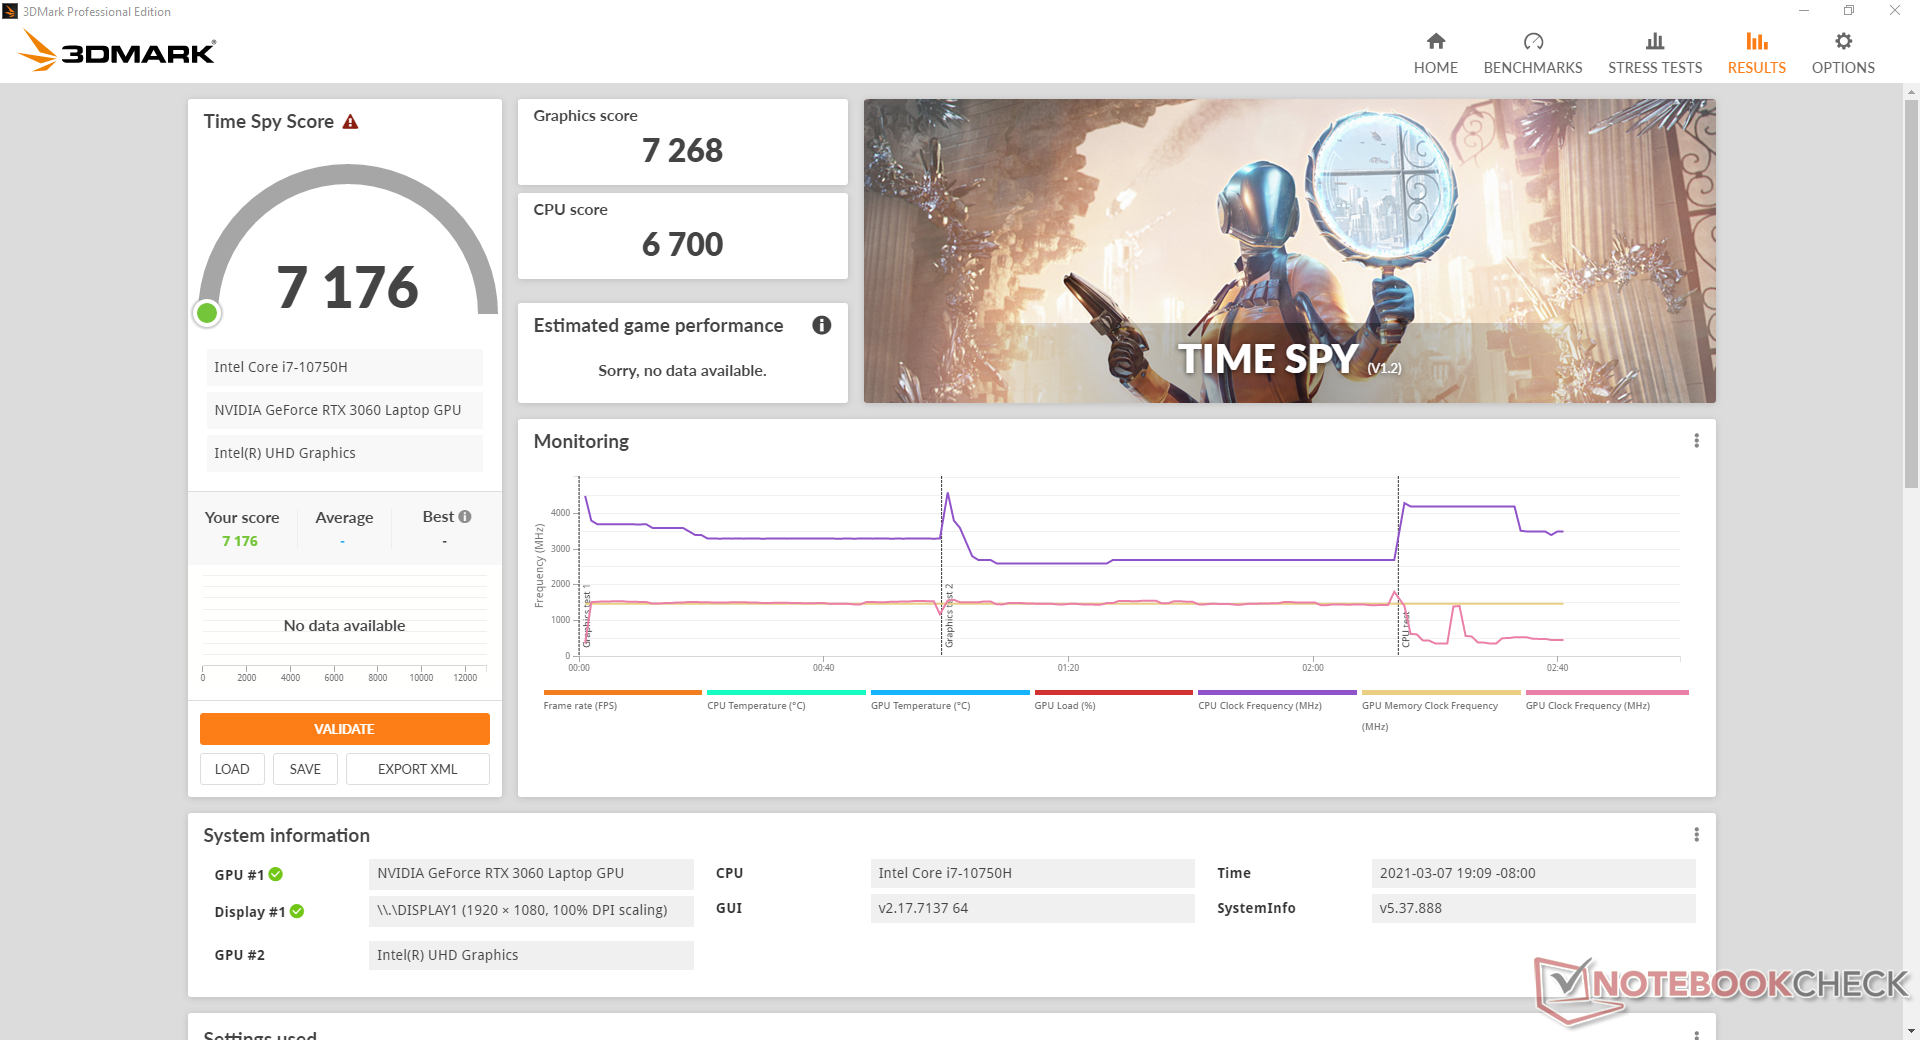
De los cuatro portátiles que hemos probado hasta ahora con la GeForce RTX 3060 móvil, nuestro MSI GF65 es el más lento del grupo por un 15 por ciento aproximadamente según las pruebas de 3DMark. El rendimiento en bruto sigue estando por encima de la RTX 2060 móvil, aunque sólo por un 15 por ciento. Los propietarios de los portátiles GeForce RTX 2070 seguirán disfrutando de un rendimiento gráfico ligeramente superior al de este portátil RTX 3060.
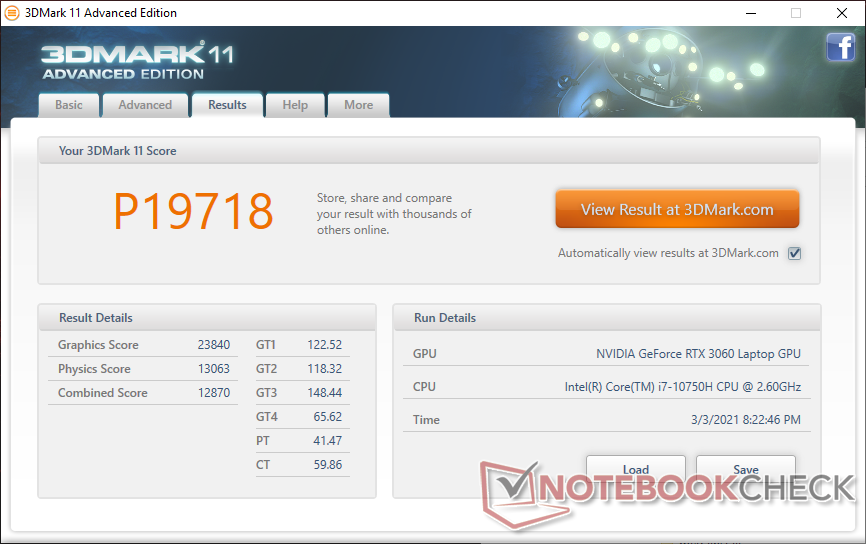
| 3DMark 11 Performance | 19718 puntos | |
| 3DMark Cloud Gate Standard Score | 35778 puntos | |
| 3DMark Fire Strike Score | 16156 puntos | |
| 3DMark Time Spy Score | 6946 puntos | |
ayuda | ||
| Dota 2 Reborn - 3840x2160 ultra (3/3) best looking | |
| MSI GF65 Thin 10UE | |
| Medio NVIDIA GeForce RTX 3060 Laptop GPU (46.9 - 107, n=11) | |
| bajo | medio | alto | ultra | QHD | 4K | |
|---|---|---|---|---|---|---|
| GTA V (2015) | 164 | 152 | 120 | 69.2 | ||
| The Witcher 3 (2015) | 294 | 223.2 | 134.2 | 68.7 | ||
| Dota 2 Reborn (2015) | 125 | 116 | 109 | 90.7 | 94.9 | |
| Final Fantasy XV Benchmark (2018) | 124 | 89.8 | 70.3 | 53.6 | 30.7 | |
| X-Plane 11.11 (2018) | 83.6 | 73 | 62.2 | 62.3 | ||
| Far Cry 5 (2018) | 131 | 108 | 103 | 97 | ||
| Strange Brigade (2018) | 269 | 172 | 138 | 121 |
Emissions
Ruido del sistema
Cuando se conecta a una toma de corriente, el ruido del ventilador siempre estará presente sin importar la configuración, incluso cuando se establece en el modo "silencioso" de MSI. Los ventiladores sólo serán realmente silenciosos si funcionan con la energía de la batería. De lo contrario, los ventiladores siempre serán audibles a 33 dB(A) durante actividades de baja potencia como la navegación web o el streaming de vídeo, lo que puede ser un poco molesto.
El ruido de los ventiladores cuando se juega en modo de rendimiento extremo rondará los 40 dB(A) para ser más silencioso que lo que observamos en el GF65 9SD. Sin embargo, puede aumentar durante el juego dependiendo de la carga de la CPU. Si se activa el modo Cooler Boost, el ruido del ventilador aumentará a unos chirriantes 59 dB(A).
| MSI GF65 Thin 10UE GeForce RTX 3060 Laptop GPU, i7-10750H, Samsung SSD PM981 MZVLB1T0HALR | Asus ROG Strix G15 G513QR GeForce RTX 3070 Laptop GPU, R9 5900HX, SK Hynix HFM001TD3JX013N | Schenker XMG Core 15 Ampere GeForce RTX 3060 Laptop GPU, R7 4800H, Samsung SSD 970 EVO Plus 1TB | MSI GS66 Stealth 10UG GeForce RTX 3070 Laptop GPU, i7-10870H, WDC PC SN730 SDBPNTY-1T00 | Aorus 15G XC GeForce RTX 3070 Laptop GPU, i7-10870H, ESR512GTLCG-EAC-4 | Lenovo Legion 7 15IMH05-81YT001VGE GeForce RTX 2080 Super Max-Q, i9-10980HK, 2x Samsung PM981a MZVLB1T0HBLR (RAID 0) | MSI GF65 9SD GeForce GTX 1660 Ti Mobile, i7-9750H, Kingston RBUSNS8154P3512GJ | |
|---|---|---|---|---|---|---|---|
| Noise | 4% | 6% | -5% | 4% | 8% | -6% | |
| apagado / medio ambiente * (dB) | 24.7 | 24 3% | 24 3% | 26.2 -6% | 25 -1% | 24.4 1% | 28.7 -16% |
| Idle Minimum * (dB) | 33.1 | 25 24% | 26 21% | 34 -3% | 29 12% | 24.4 26% | 33.3 -1% |
| Idle Average * (dB) | 33.1 | 31 6% | 28 15% | 34 -3% | 30 9% | 24.4 26% | 33.9 -2% |
| Idle Maximum * (dB) | 33.1 | 33 -0% | 30 9% | 34 -3% | 31 6% | 24.4 26% | 33.9 -2% |
| Load Average * (dB) | 42.7 | 45 -5% | 42 2% | 47.2 -11% | 41 4% | 49.3 -15% | 41 4% |
| Witcher 3 ultra * (dB) | 40.6 | 48 -18% | 50 -23% | 46.3 -14% | 47 -16% | 54 -33% | 49.5 -22% |
| Load Maximum * (dB) | 59.4 | 50 16% | 52 12% | 58.2 2% | 51 14% | 46.6 22% | 59.5 -0% |
* ... más pequeño es mejor
Ruido
| Ocioso |
| 33.1 / 33.1 / 33.1 dB(A) |
| Carga |
| 42.7 / 59.4 dB(A) |
 | ||
30 dB silencioso 40 dB(A) audible 50 dB(A) ruidosamente alto |
||
min: | ||
Temperatura
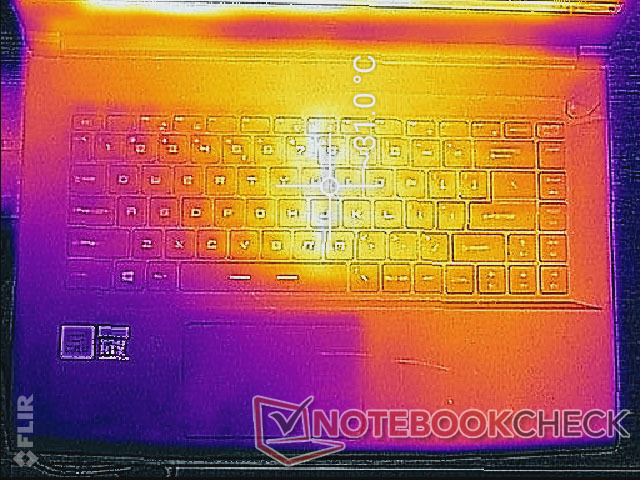
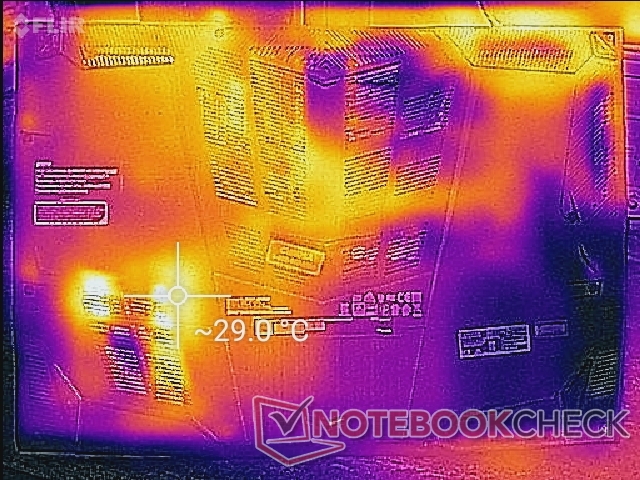
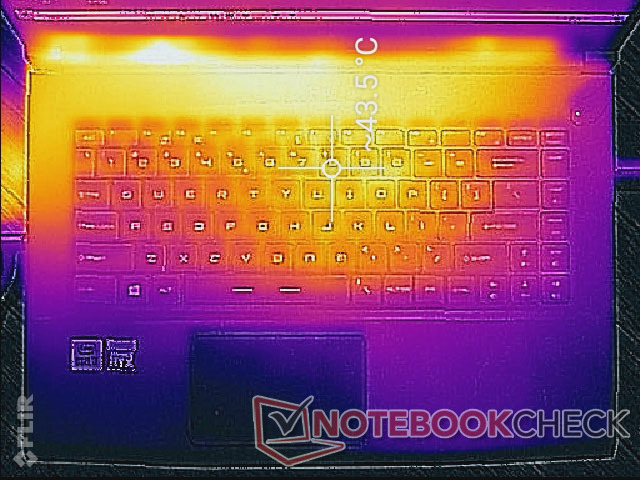
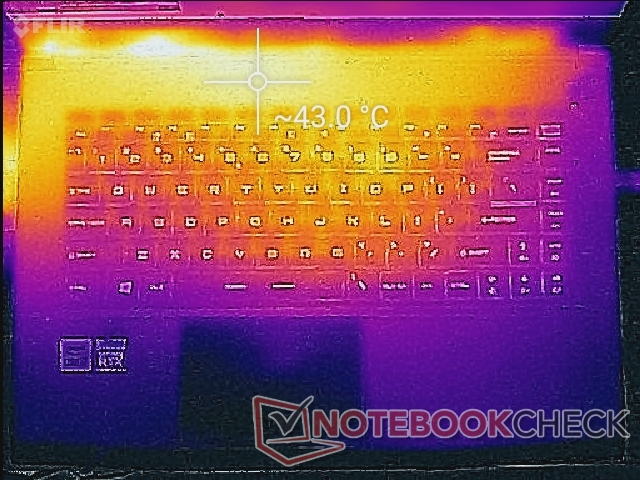
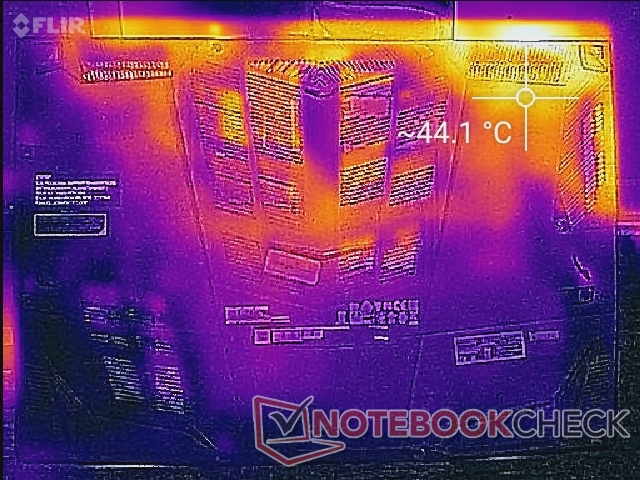
Las temperaturas de la superficie son más cálidas hacia los cuadrantes traseros, lejos de las teclas WASD y las teclas de flecha. Los puntos calientes pueden llegar a los 44 C cuando se juega, lo que es muy parecido a lo que registramos en el antiguo GF65 9SD. La mayor parte de la superficie inferior permanece relativamente fría cuando se juega.
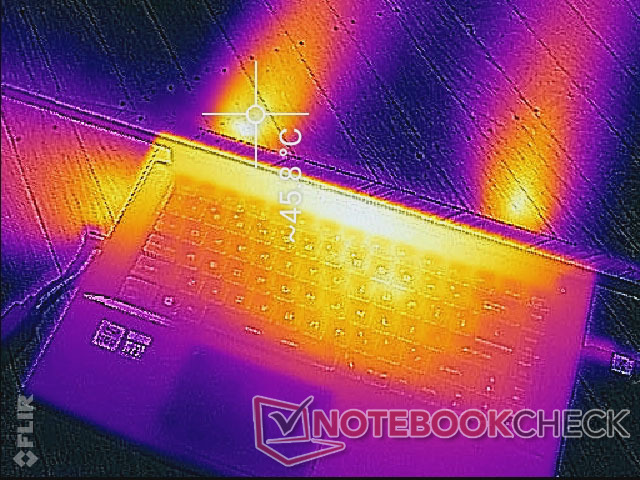
(±) La temperatura máxima en la parte superior es de 43.4 °C / 110 F, frente a la media de 40.4 °C / 105 F, que oscila entre 21.2 y 68.8 °C para la clase Gaming.
(±) El fondo se calienta hasta un máximo de 41.8 °C / 107 F, frente a la media de 43.2 °C / 110 F
(+) En reposo, la temperatura media de la parte superior es de 27.6 °C / 82# F, frente a la media del dispositivo de 33.9 °C / 93 F.
(±) Jugando a The Witcher 3, la temperatura media de la parte superior es de 33.9 °C / 93 F, frente a la media del dispositivo de 33.9 °C / 93 F.
(+) El reposamanos y el panel táctil están a una temperatura inferior a la de la piel, con un máximo de 27.4 °C / 81.3 F y, por tanto, son fríos al tacto.
(±) La temperatura media de la zona del reposamanos de dispositivos similares fue de 28.8 °C / 83.8 F (+1.4 °C / 2.5 F).

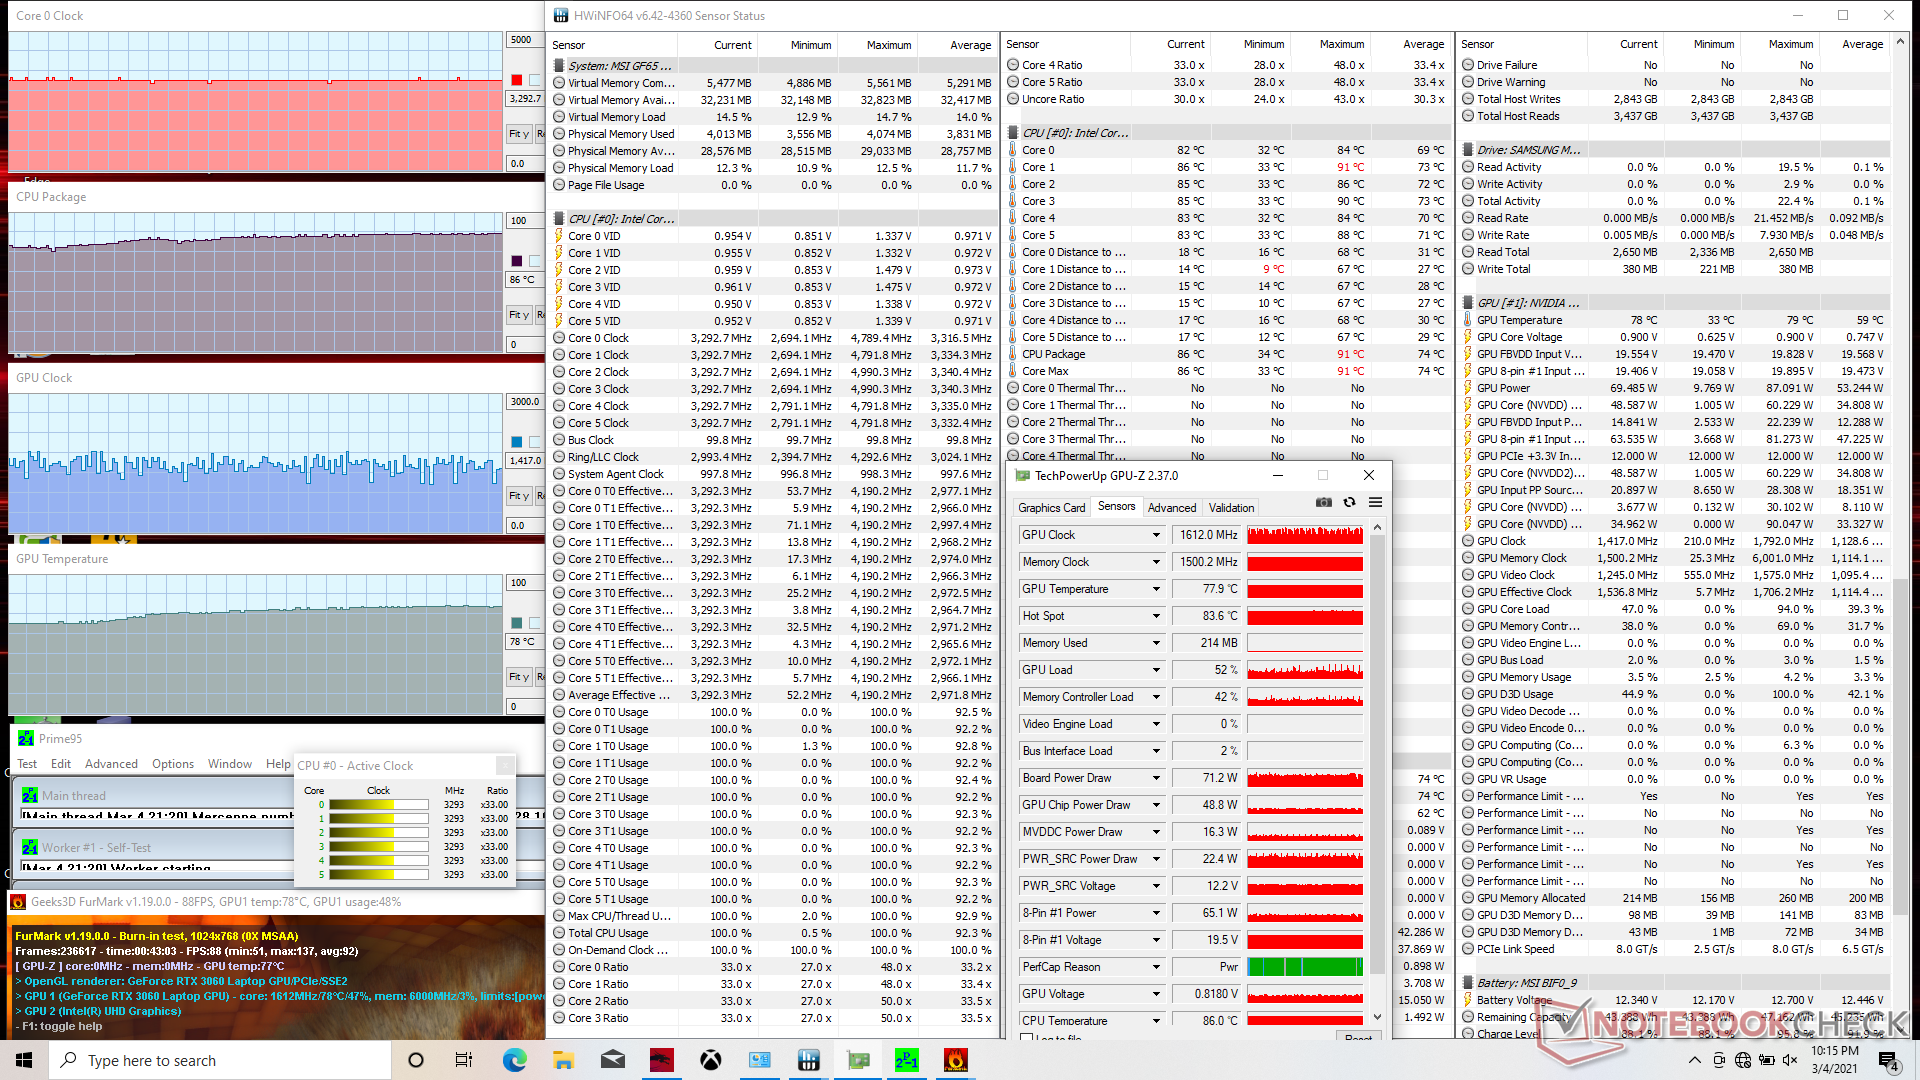
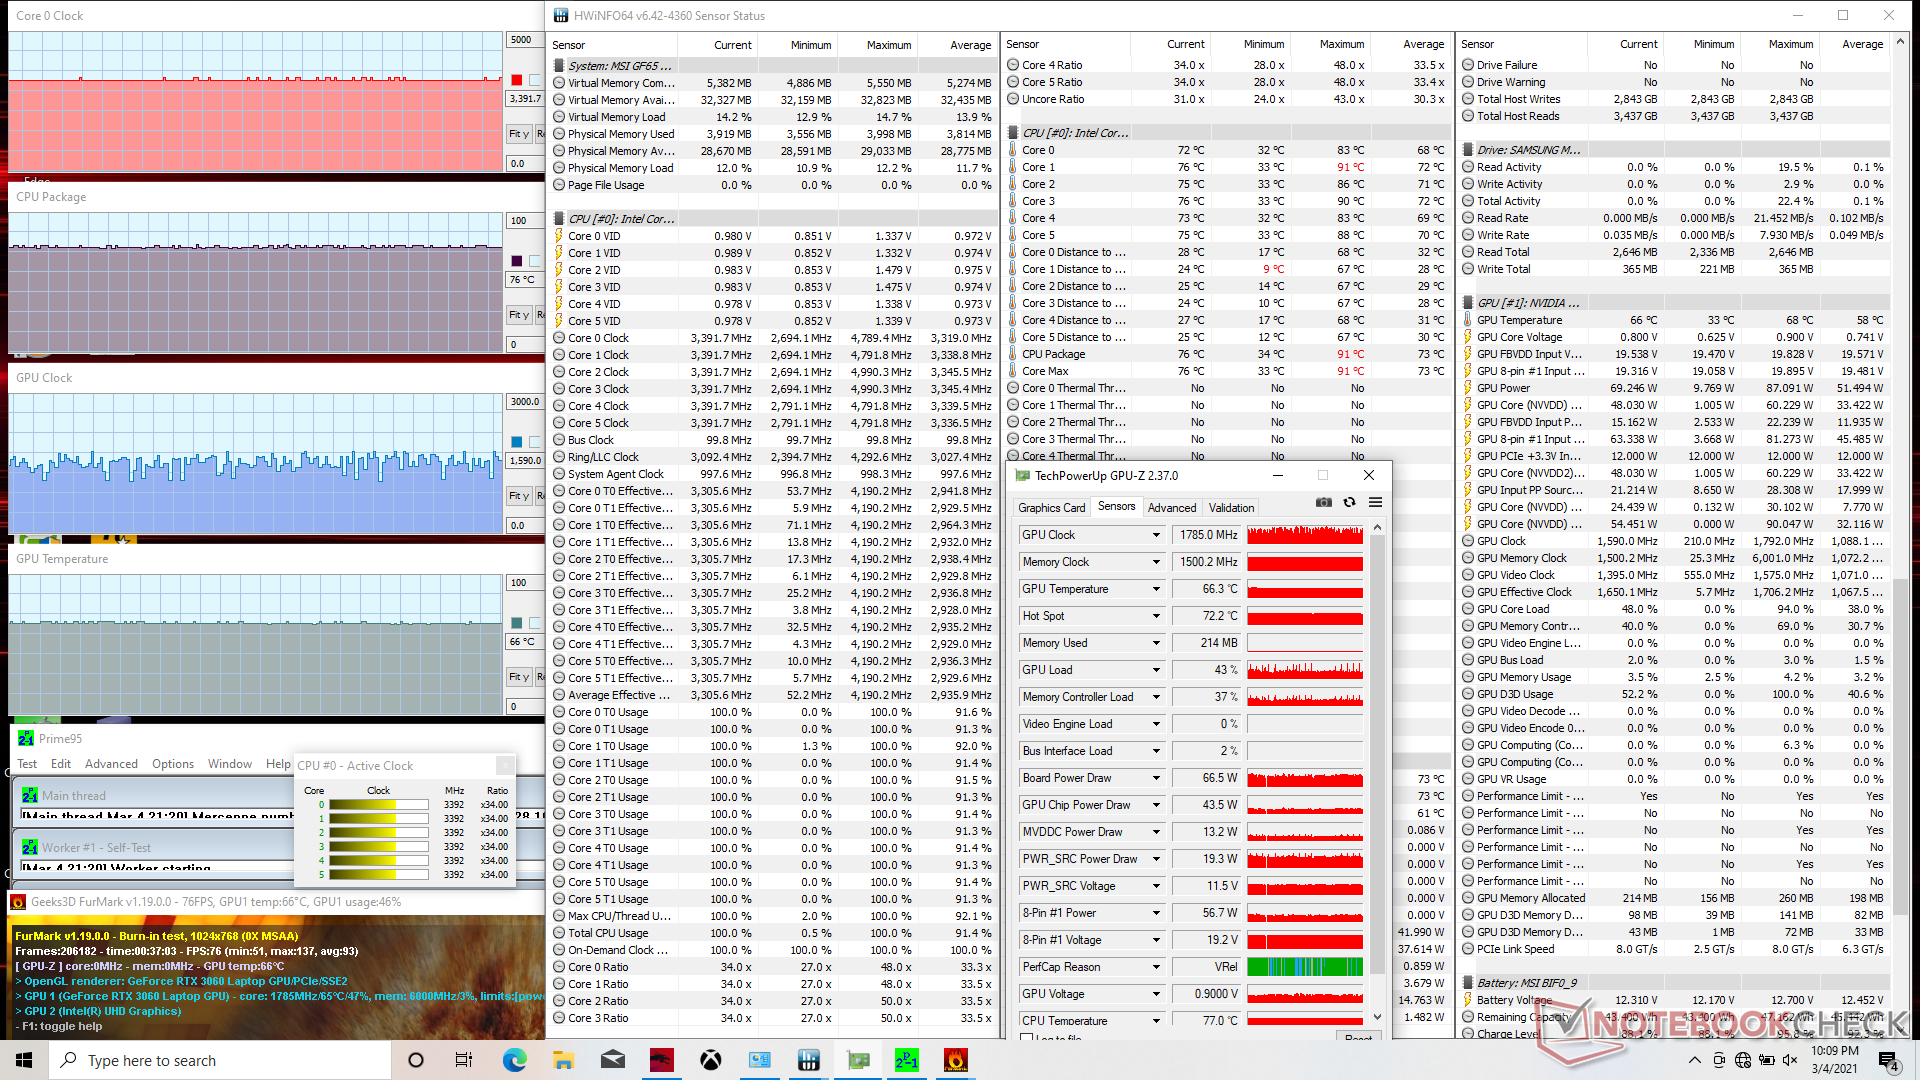
Prueba de esfuerzo
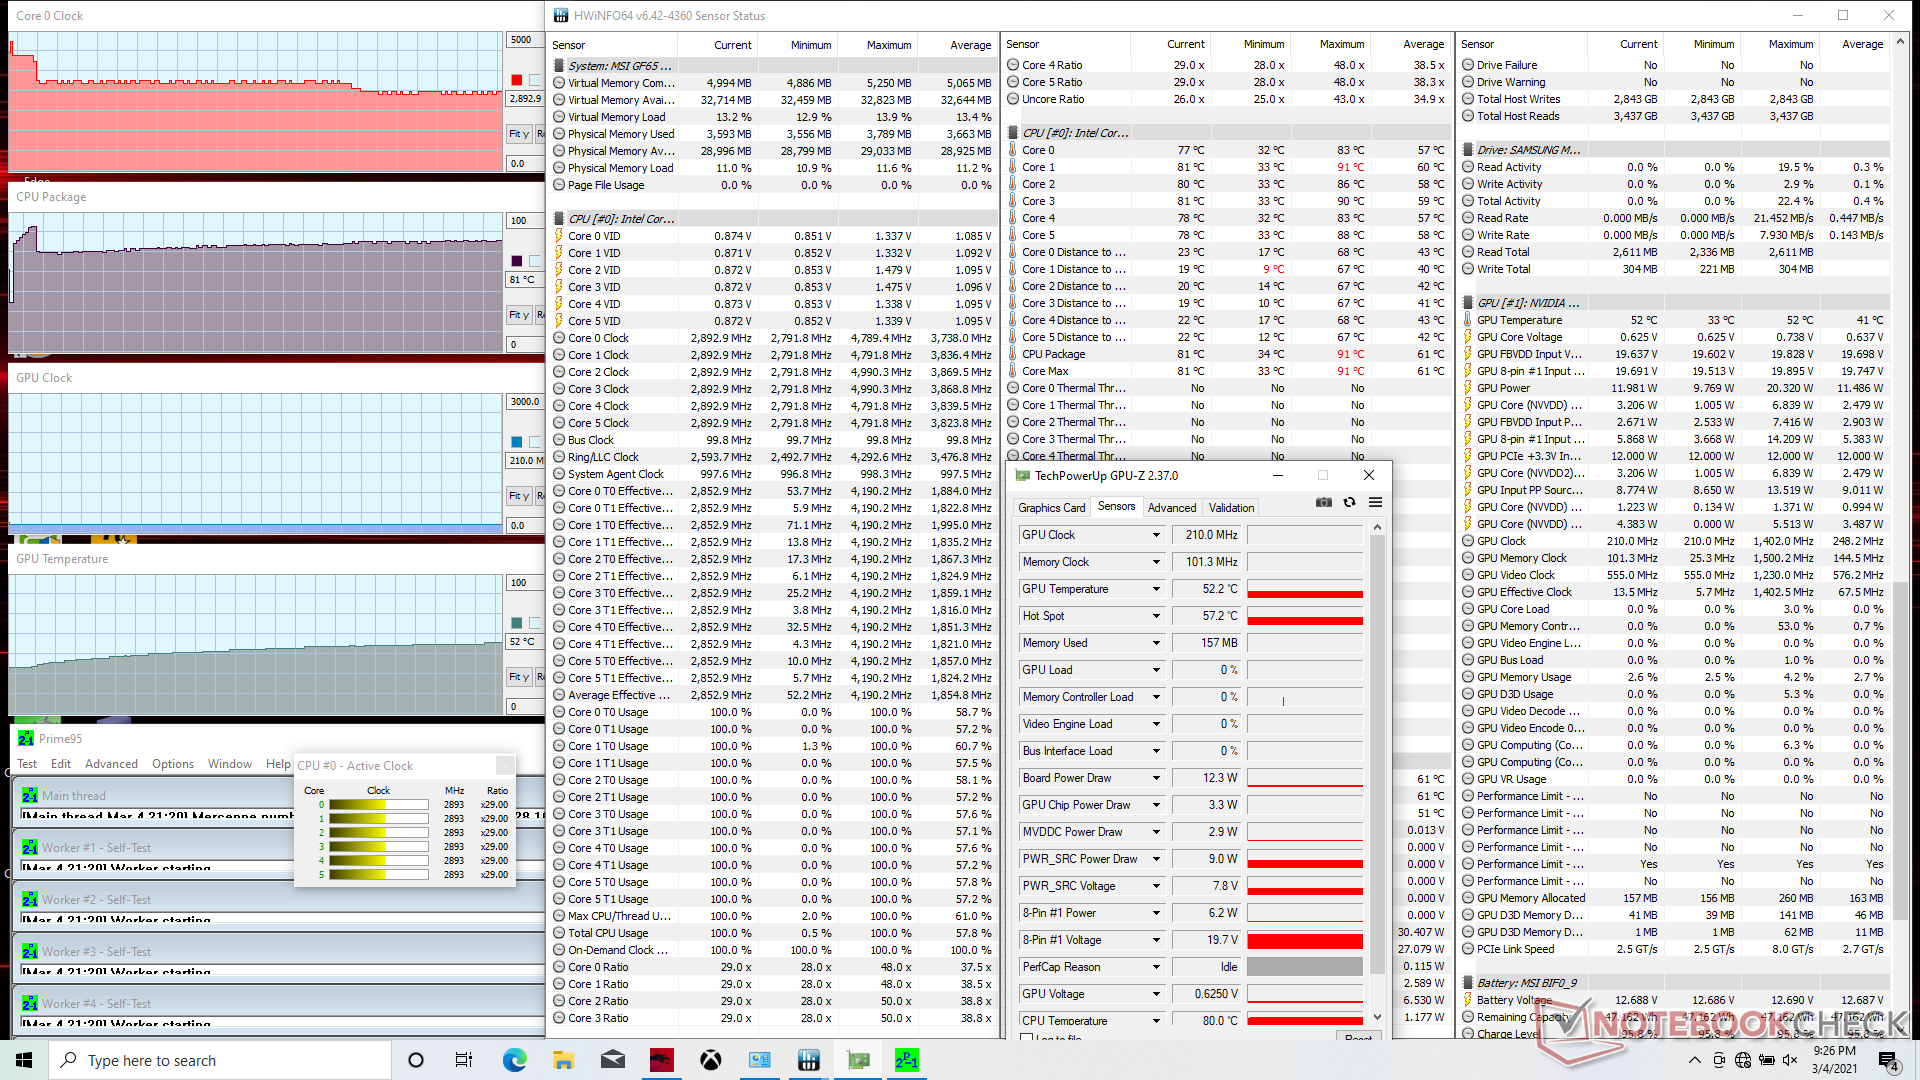
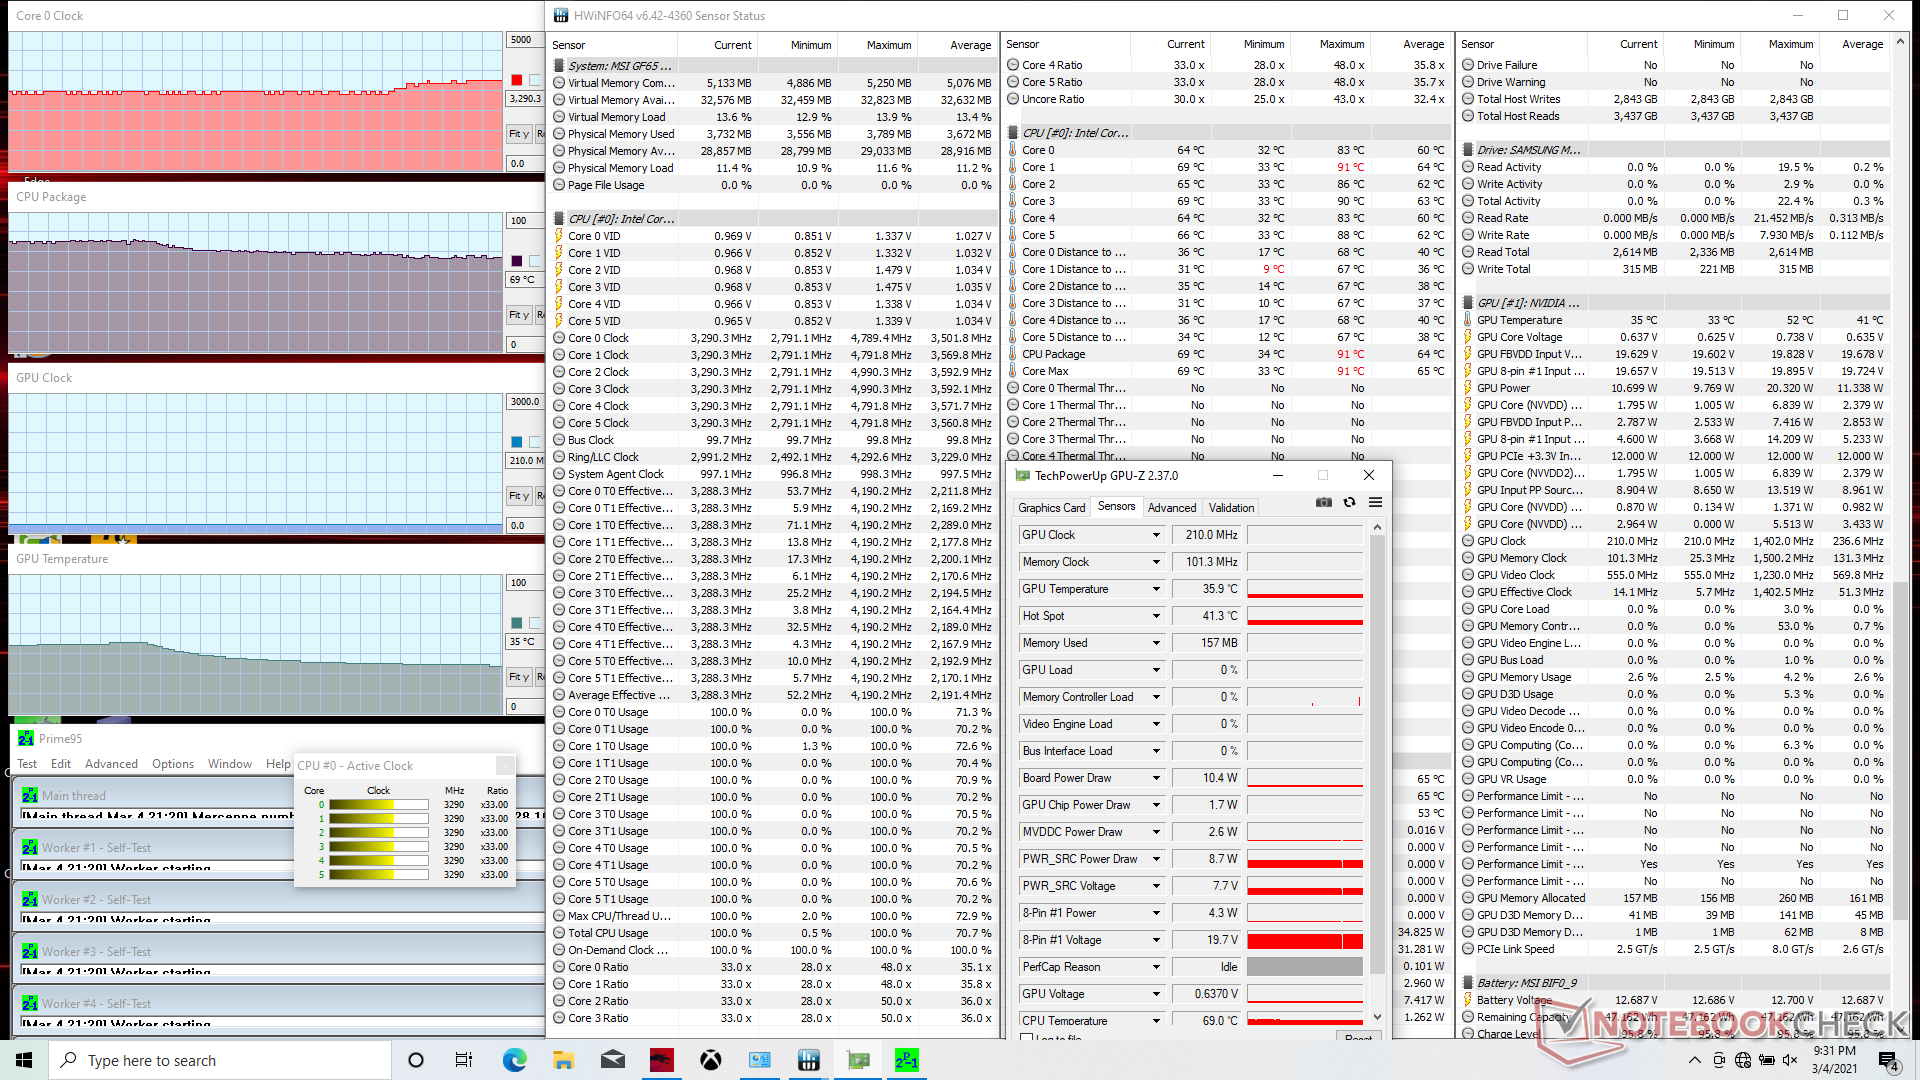
Cuando se ejecuta Prime95 en el modo de rendimiento extremo, la velocidad de reloj de la CPU alcanza los 4,2 GHz durante los primeros segundos hasta alcanzar una temperatura del núcleo de 91 C. A continuación, la velocidad de reloj y la temperatura descienden de forma constante y se estabilizan en 2,8 GHz y 72 C, respectivamente. Si se activa Cooler Boost, la velocidad de reloj y la temperatura aumentarán a 3,3 GHz y disminuirán a 69 C, respectivamente
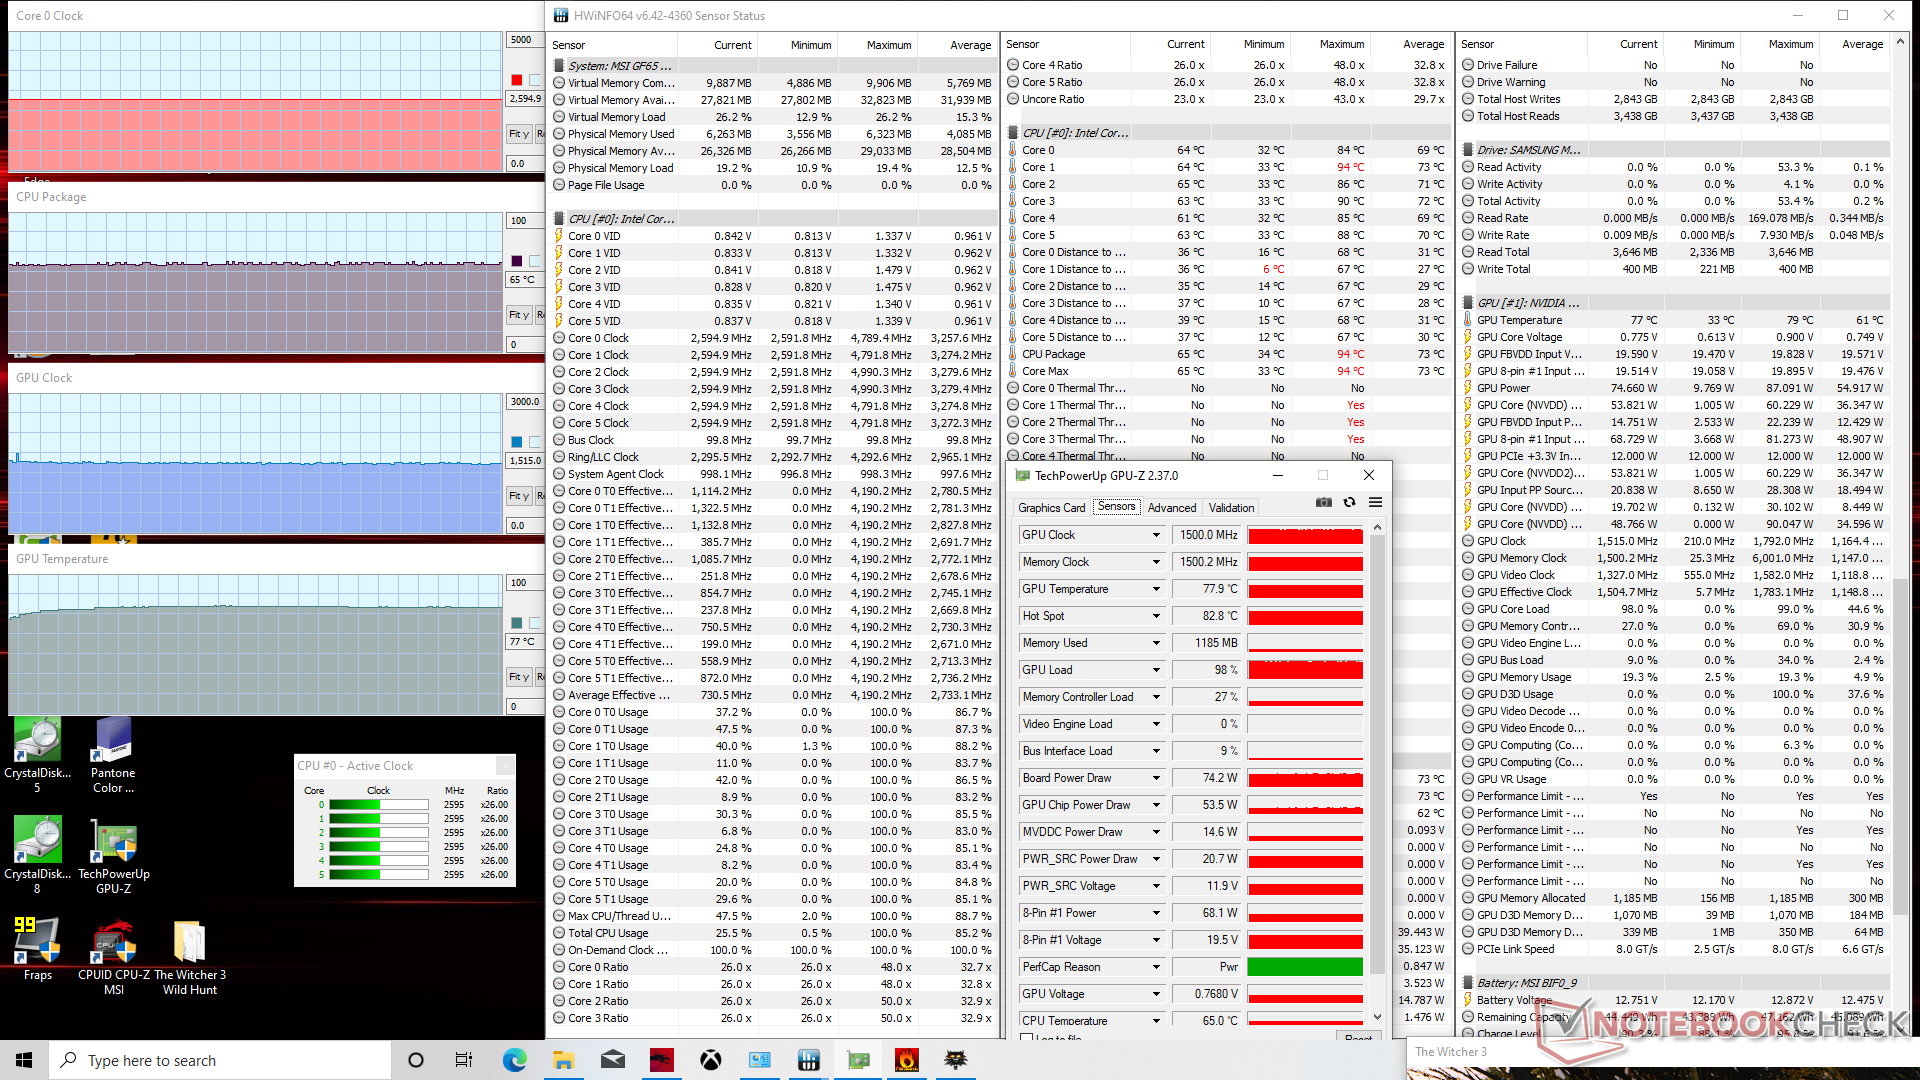
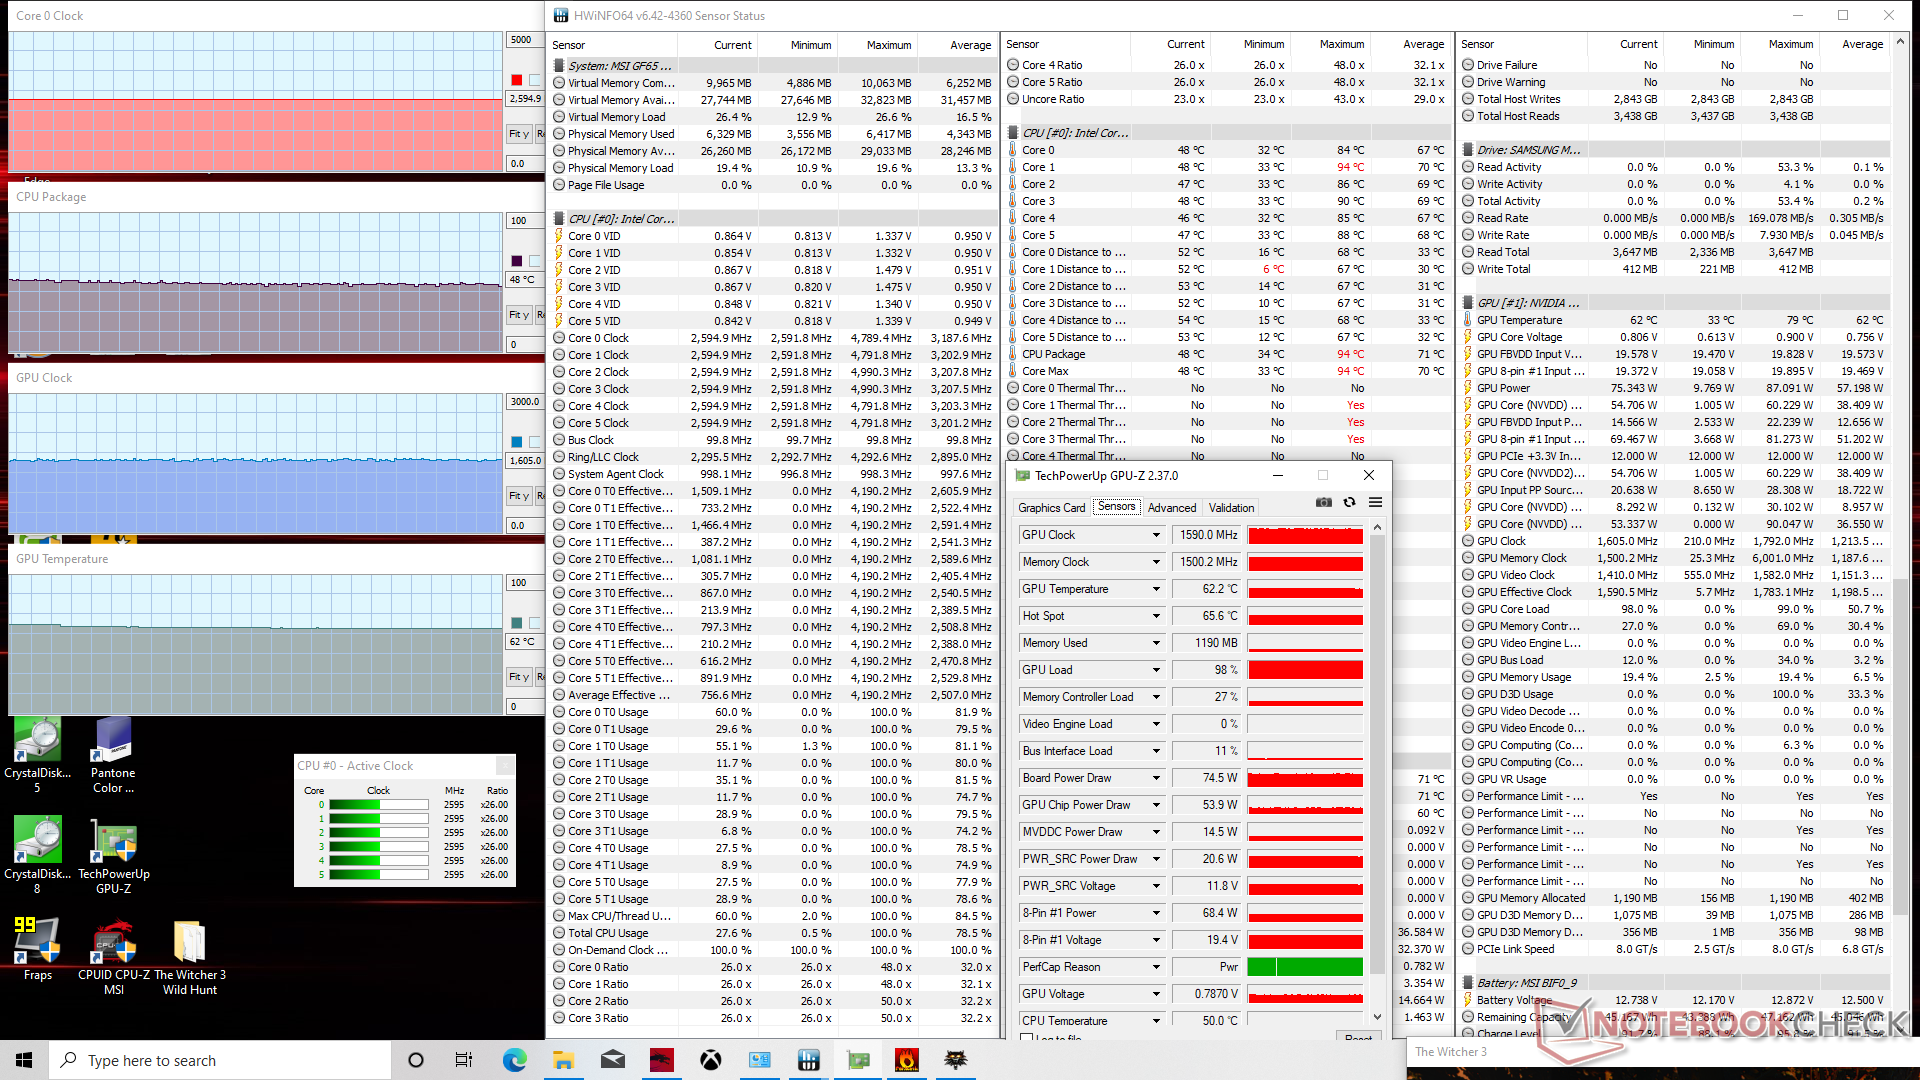
La ejecución de Witcher 3 hace que la CPU y la GPU se estabilicen a 65 C y 77 C, respectivamente, que son rangos relativamente frescos para un portátil de juegos. Activar Cooler Boost reduciría aún más las temperaturas de la CPU y la GPU a sólo 48 C y 62 C, respectivamente, al tiempo que aumentaría ligeramente la velocidad media de la GPU de 1515 MHz a 1590 MHz. Por lo tanto, la función Cooler Boost no es vital para los juegos, pero puede ser útil para aquellos que quieran obtener el máximo rendimiento del Turbo Boost de la CPU en sus sistemas GF65
El uso de la batería limita el rendimiento. Un Fire Strike ejecutado con baterías arrojaría unas puntuaciones de Física y Gráficos de 10559 y 12438 puntos, respectivamente, en comparación con los 17489 y 18434 puntos de la red eléctrica.

| Relojde la CPU(GHz) | Reloj dela GPU(MHz) | Temperatura media de la CPU (°C) | Temperaturamediade la GPU (°C) | |
| Sistema en reposo | 34 | 33 | ||
| Estrés Prime95 (Cooler Boostoff) | 2,8 - 2,9 | -- | 81 | 52 |
| Estrés Prime95 (Cooler Boostactivado) | 3,3 | -- | 69 | 35 |
| Witcher 3 Tensión (Cooler Boost desactivado) | 2,6 | 1515 | 65 | 77 |
| Witcher 3 Estrés (Cooler Boost activado) | 2,6 | 1590 | 48 | 62 |
| Prime95 + FurMark Stress (Cooler Boost off) | 3.3 | 1612 | 86 | 78 |
| Prime95 + FurMark Stress (Cooler Boost on) | 3.3 | 1785 | 76 | 66 |
Altavoces


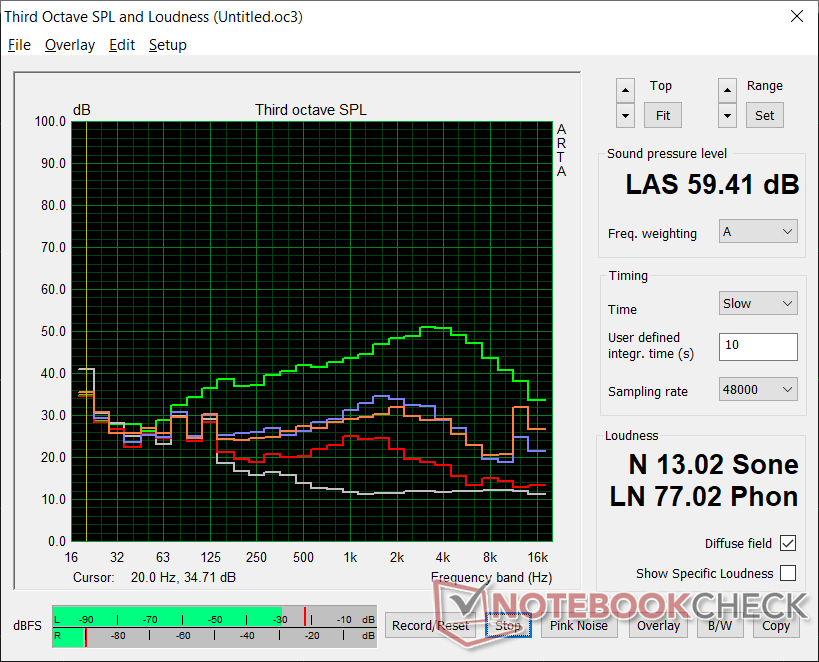
MSI GF65 Thin 10UE análisis de audio
(±) | la sonoridad del altavoz es media pero buena (80.7 dB)
Graves 100 - 315 Hz
(-) | casi sin bajos - de media 19.6% inferior a la mediana
(-) | los graves no son lineales (16.1% delta a la frecuencia anterior)
Medios 400 - 2000 Hz
(+) | medios equilibrados - a sólo 3.2% de la mediana
(±) | la linealidad de los medios es media (7.6% delta respecto a la frecuencia anterior)
Altos 2 - 16 kHz
(+) | máximos equilibrados - a sólo 3.6% de la mediana
(±) | la linealidad de los máximos es media (8.6% delta a frecuencia anterior)
Total 100 - 16.000 Hz
(±) | la linealidad del sonido global es media (17.9% de diferencia con la mediana)
En comparación con la misma clase
» 54% de todos los dispositivos probados de esta clase eran mejores, 9% similares, 37% peores
» El mejor tuvo un delta de 6%, la media fue 18%, el peor fue ###max##%
En comparación con todos los dispositivos probados
» 37% de todos los dispositivos probados eran mejores, 8% similares, 55% peores
» El mejor tuvo un delta de 4%, la media fue 24%, el peor fue ###max##%
Apple MacBook 12 (Early 2016) 1.1 GHz análisis de audio
(+) | los altavoces pueden reproducir a un volumen relativamente alto (#83.6 dB)
Graves 100 - 315 Hz
(±) | lubina reducida - en promedio 11.3% inferior a la mediana
(±) | la linealidad de los graves es media (14.2% delta a frecuencia anterior)
Medios 400 - 2000 Hz
(+) | medios equilibrados - a sólo 2.4% de la mediana
(+) | los medios son lineales (5.5% delta a la frecuencia anterior)
Altos 2 - 16 kHz
(+) | máximos equilibrados - a sólo 2% de la mediana
(+) | los máximos son lineales (4.5% delta a la frecuencia anterior)
Total 100 - 16.000 Hz
(+) | el sonido global es lineal (10.2% de diferencia con la mediana)
En comparación con la misma clase
» 7% de todos los dispositivos probados de esta clase eran mejores, 2% similares, 91% peores
» El mejor tuvo un delta de 5%, la media fue 18%, el peor fue ###max##%
En comparación con todos los dispositivos probados
» 5% de todos los dispositivos probados eran mejores, 1% similares, 94% peores
» El mejor tuvo un delta de 4%, la media fue 24%, el peor fue ###max##%
Energy Management
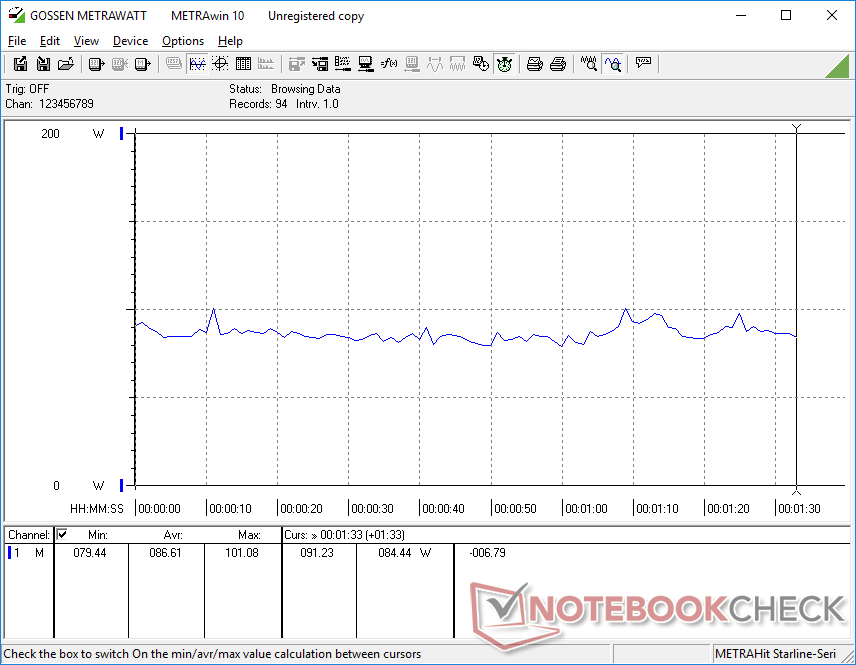
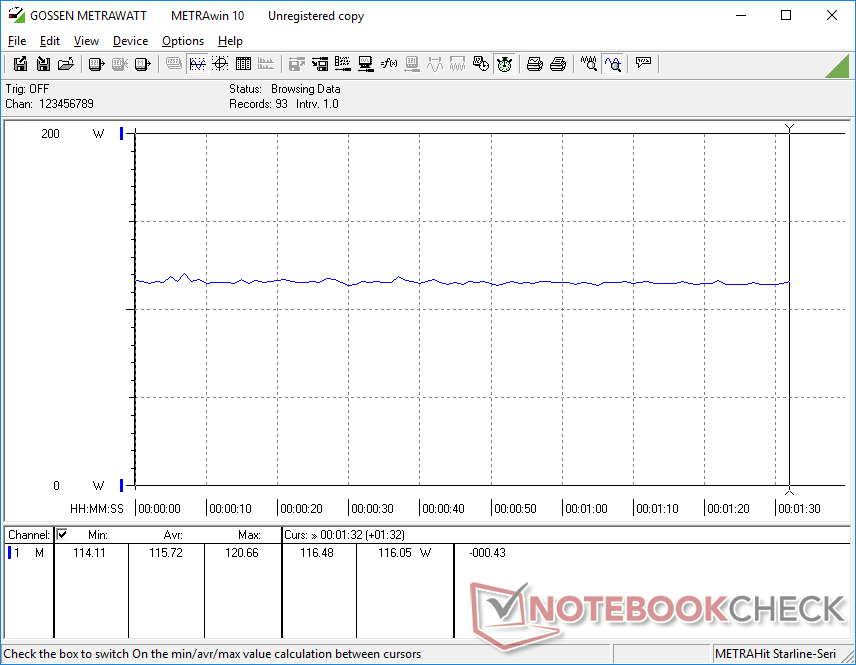
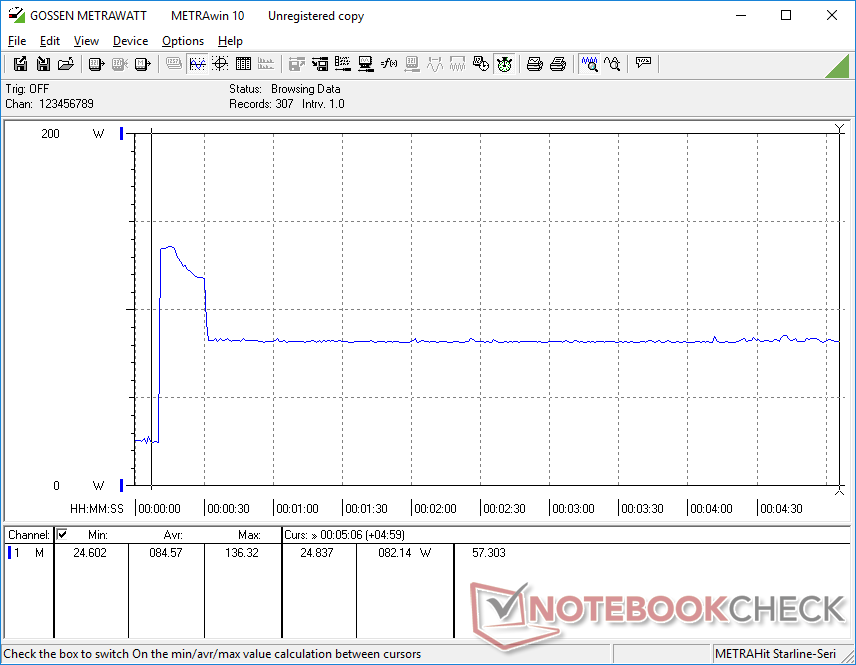
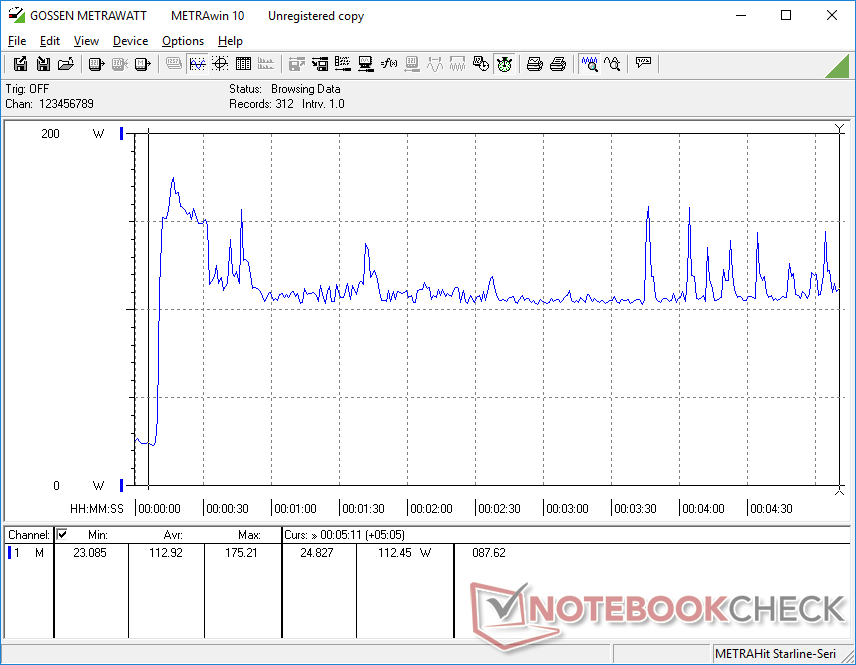
Consumo de energía
El sistema consume algo menos de energía que el antiguo GF65 9SD. La ejecución de Witcher 3 demanda unos 116 W frente a los 134 W del modelo anterior, aunque nuestra RTX 3060 es capaz de proporcionar un 15 por ciento más de potencia gráfica bruta que la GTX 1660 Ti. El Schenker XMG Core 15 con la misma GPU RTX 3060 consume bastante más energía que nuestro MSI probablemente porque apunta a valores TGP más altos y otras diferencias de procesador.
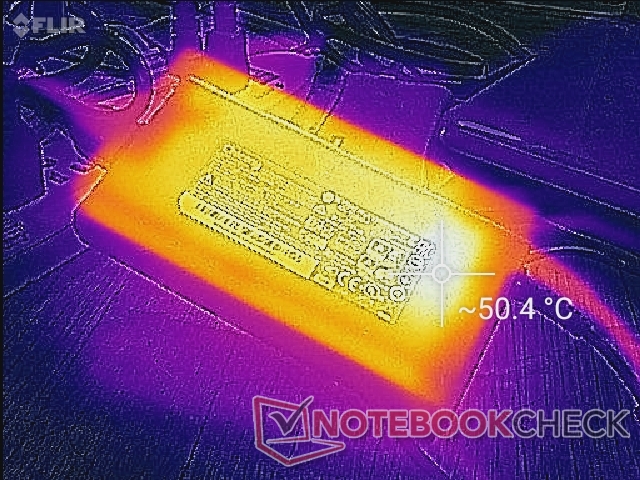
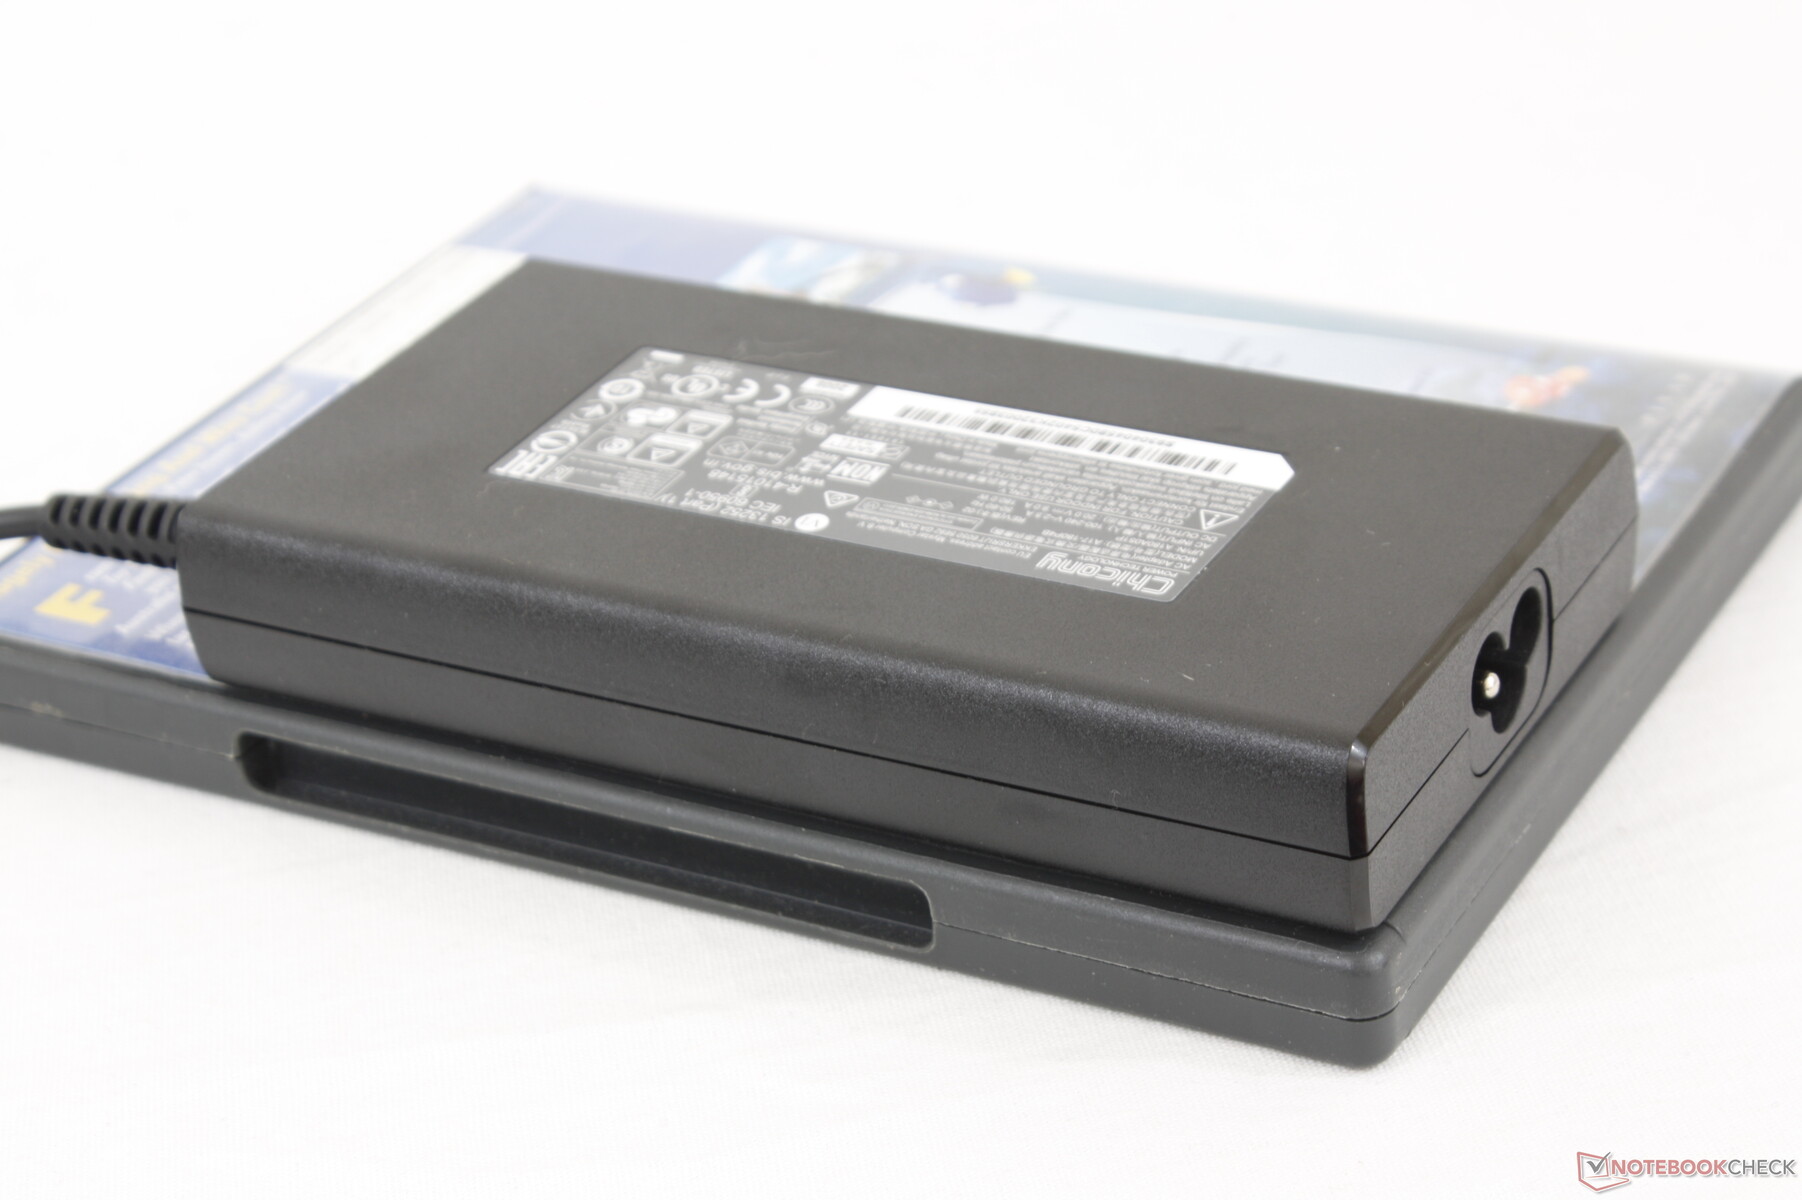
Pudimos medir un consumo máximo de 175.2 W desde el pequeño (~14.4 x 7.5 x 2.3 cm) adaptador de CA de 180 W al ejecutar Prime95 y FurMark simultáneamente. La carga de la batería se ralentiza significativamente cuando se ejecutan cargas extremas e incluso puede calarse, que es lo que observamos durante nuestra prueba de estrés anterior.
| Off / Standby | |
| Ocioso | |
| Carga |
|
Clave:
min: | |
| MSI GF65 Thin 10UE i7-10750H, GeForce RTX 3060 Laptop GPU, Samsung SSD PM981 MZVLB1T0HALR, IPS, 1920x1080, 15.6" | Asus ROG Strix G15 G513QR R9 5900HX, GeForce RTX 3070 Laptop GPU, SK Hynix HFM001TD3JX013N, IPS, 1920x1080, 15.6" | Schenker XMG Core 15 Ampere R7 4800H, GeForce RTX 3060 Laptop GPU, Samsung SSD 970 EVO Plus 1TB, IPS, 2560x1440, 15.6" | Aorus 15G XC i7-10870H, GeForce RTX 3070 Laptop GPU, ESR512GTLCG-EAC-4, IPS, 1920x1080, 15.6" | Lenovo Legion 7 15IMH05-81YT001VGE i9-10980HK, GeForce RTX 2080 Super Max-Q, 2x Samsung PM981a MZVLB1T0HBLR (RAID 0), IPS, 1920x1080, 15.6" | MSI GF65 9SD i7-9750H, GeForce GTX 1660 Ti Mobile, Kingston RBUSNS8154P3512GJ, IPS, 1920x1080, 15.6" | |
|---|---|---|---|---|---|---|
| Power Consumption | -27% | -35% | -48% | -24% | -17% | |
| Idle Minimum * (Watt) | 5.4 | 4 26% | 11 -104% | 13 -141% | 9 -67% | 9.5 -76% |
| Idle Average * (Watt) | 12.8 | 9 30% | 14 -9% | 16 -25% | 12.6 2% | 12.4 3% |
| Idle Maximum * (Watt) | 19.5 | 36 -85% | 20 -3% | 30 -54% | 17 13% | 22 -13% |
| Load Average * (Watt) | 86.6 | 130 -50% | 94 -9% | 92 -6% | 115 -33% | 80.8 7% |
| Witcher 3 ultra * (Watt) | 115.7 | 174 -50% | 167 -44% | 154 -33% | 159 -37% | 133.9 -16% |
| Load Maximum * (Watt) | 175.2 | 227 -30% | 251 -43% | 223 -27% | 216 -23% | 187.1 -7% |
* ... más pequeño es mejor
Duración de la batería
La duración media es de unas 4,5 horas de uso real de la WLAN con el perfil de energía equilibrado. Los resultados no son muy diferentes de los del GF65 del año pasado, ya que la capacidad de la batería no ha cambiado.
La carga desde el vacío hasta la capacidad total tarda algo más de dos horas. El sistema no puede recargarse por USB-C.
| MSI GF65 Thin 10UE i7-10750H, GeForce RTX 3060 Laptop GPU, 51 Wh | Asus ROG Strix G15 G513QR R9 5900HX, GeForce RTX 3070 Laptop GPU, 90 Wh | Schenker XMG Core 15 Ampere R7 4800H, GeForce RTX 3060 Laptop GPU, 62 Wh | MSI GS66 Stealth 10UG i7-10870H, GeForce RTX 3070 Laptop GPU, 99.9 Wh | Aorus 15G XC i7-10870H, GeForce RTX 3070 Laptop GPU, 99 Wh | Lenovo Legion 7 15IMH05-81YT001VGE i9-10980HK, GeForce RTX 2080 Super Max-Q, 80 Wh | MSI GF65 9SD i7-9750H, GeForce GTX 1660 Ti Mobile, 51 Wh | |
|---|---|---|---|---|---|---|---|
| Duración de Batería | 58% | 2% | 50% | 44% | 1% | 11% | |
| Reader / Idle (h) | 11.1 | 7.8 -30% | 10.8 -3% | 9.6 -14% | |||
| WiFi v1.3 (h) | 4.6 | 7.4 61% | 5.8 26% | 7.1 54% | 6.3 37% | 3.4 -26% | 5.1 11% |
| Load (h) | 1.1 | 1.7 55% | 1.2 9% | 2.2 100% | 2.3 109% | 1.4 27% |
Pro
Contra
Veredicto

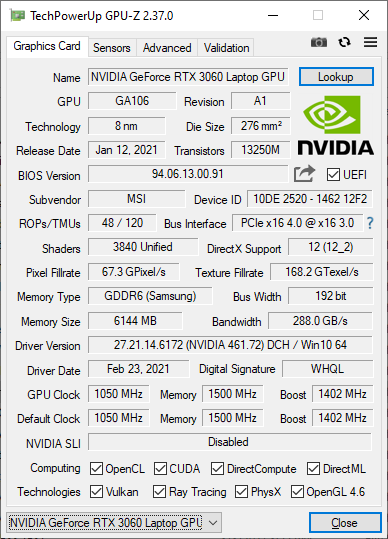
La GeForce RTX 3060 móvil funciona en un amplio rango de TGP entre 60 W y 115 W. Los fabricantes de portátiles son libres de apuntar a los valores de TGP que deseen dentro de ese rango, lo que significa que los objetivos de TGP más altos darán un mayor rendimiento. Esto también significa que algunos portátiles con la pueden preferir marginalmente más lentos que otros aunque vengan equipados con la misma GPU
El MSI GF65 10UE es un portátil RTX 3060 relativamente barato y, quizás no por casualidad, también viene con una GPU RTX 3060 más lenta que la media. Otros portátiles que hemos probado hasta ahora con la misma GPU son entre un 10 y un 15 por ciento más rápidos. El rendimiento de la CPU también es ligeramente más lento que la media, a menos que los usuarios decidan activar el modo Cooler Boost. Los colores, los tiempos de respuesta en blanco y negro, Thunderbolt y DisplayPort están en la media o se omiten por completo.
Los jugadores que quieran maximizar el rendimiento por dólar sin sacrificar la RAM o la capacidad de actualización del SSD encontrarán atractivo el ligero MSI GF65. Para un mayor rendimiento bruto, la mayoría de los otros portátiles para juegos con la misma GeForce RTX 3060 pueden correr más rápido.
La facilidad de mantenimiento, la alta tasa de refresco de la pantalla y las temperaturas relativamente frescas del núcleo al jugar siguen siendo algunos de nuestros aspectos favoritos del GF65. Aun así, los compradores potenciales deberían ser conscientes de las características que se perderán.
Precio y disponibilidad
Nuestra configuración exacta está actualmente disponible en Amazon por $1649 USD. Una configuración con solo 8 GB de RAM y 512 GB de almacenamiento también está disponible por $1299 USD.
MSI GF65 Thin 10UE
- 03/08/2021 v7 (old)
Allen Ngo
Price comparison

