Análisis para el Intel Core i9-13900HX procesador
La GPU Nvidia RTX 5070 Ti más barata para portátiles - Análisis del portátil para juegos XMG Focus 17 M25
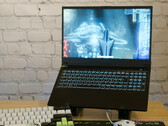
El nuevo XMG Focus 17 M25 es la forma más asequible de conseguir la nueva GPU Nvidia GeForce RTX 5070 Ti para portátiles. El portátil para juegos de 17 pulgadas ya está a la venta a partir de 1.849 euros (al cambio actual, unos 2.100 dólares), pero ¿con qué compromisos tendrá que vivir por ese precio?
Intel Core i9-13900HX, NVIDIA GeForce RTX 5070 Ti Laptop, 17.3", 2.8 kgAnálisis del portátil Acer Predator Helios 18: RTX 4080 gamer con pantalla MiniLED a más de 1.000 nits
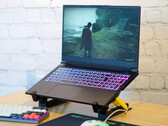
El Predator Helios 18 de 18 pulgadas es un auténtico sustituto del sobremesa, especialmente para jugadores y creativos. De ello se encargan la pantalla MiniLED muy brillante, además de la RTX 4080 y el potente i9-13900HX. Siga leyendo para averiguar si el portátil también es apto para jugadores y creativos en cuanto a sus otras características.
Intel Core i9-13900HX, NVIDIA GeForce RTX 4080 Laptop GPU, 18", 3.2 kgAnálisis del portátil HP Omen Transcend 16: Más que una pequeña diferencia de nombre
No debe confundirse con el Omen 16 normal, el Omen Transcend 16 es el siguiente paso de la serie, con nuevas características y opciones de las que probablemente se inspirarán los futuros modelos Omen. Conozca todas las diferencias y cambios antes de apretar el gatillo.
Intel Core i9-13900HX, NVIDIA GeForce RTX 4070 Laptop GPU, 16", 2.3 kgAnálisis del portátil de juegos económico Schenker XMG Focus 15 (E23): Mucho rendimiento a un precio menor que el Pro 15
Si puedes prescindir de una carcasa metálica y de un teclado RGB completo, no tienes por qué decantarte necesariamente por el caro XMG Pro 15. En nuestra prueba, el XMG Focus 15 tiene el mismo rendimiento y sólo tiene que quedarse atrás en algunos aspectos. A cambio, el precio base del Focus 15 es unos 400 euros inferior al del Pro 15 para un rendimiento prácticamente similar.
Intel Core i9-13900HX, NVIDIA GeForce RTX 4050 Laptop GPU, 15.6", 2.4 kgAnálisis del portátil para juegos Schenker XMG Pro 15 E23 (PD50SND-G): Por el equilibrio entre trabajo y ocio
Un diseño sólido y discreto combinado con potencia de cálculo. Así es el XMG Pro 15 E23 en nuestro análisis. Ya sea como portátil para creadores de contenido o jugadores, el XMG Pro 15 impresiona con potentes gráficos Nvidia y un maravilloso display QHD que cubre el espacio de color P3.
Intel Core i9-13900HX, NVIDIA GeForce RTX 4060 Laptop GPU, 15.6", 2.4 kgLenovo Legion Pro 7 RTX4090: NVIDIA GeForce RTX 4090 Laptop GPU, 16.00", 2.7 kg
análise » Análisis del portátil Lenovo Legion Pro 7 16: Potencia de juego total gracias a RTX 4090
Schenker XMG Focus 17 (E23): NVIDIA GeForce RTX 4070 Laptop GPU, 17.30", 2.9 kg
análise » Análisis del Schenker XMG Focus 17 (E23): El portátil gaming con RTX 4070 no escatima en rendimiento
Schenker Key 17 Pro (Early 23): NVIDIA GeForce RTX 4090 Laptop GPU, 17.30", 3.4 kg
análise » Análisis del Schenker Key 17 Pro (Early 23): portátil para juegos 4k con Core i9 y RTX 4090
Eurocom Raptor X17: NVIDIA GeForce RTX 4090 Laptop GPU, 17.30", 3.5 kg
análise » Análisis del portátil Eurocom Raptor X17: La alternativa a los ROG de MSI y Asus
Medion Erazer Major X20: NVIDIA GeForce RTX 4070 Laptop GPU, 16.00", 2.4 kg
análise » Análisis del Medion Erazer Major X20: Portátil gaming con RTX 4070 y hardware sólido
Aorus 17X AZF: NVIDIA GeForce RTX 4090 Laptop GPU, 17.30", 2.9 kg
análise » Análisis del Aorus 17X AZF: Portátil gaming de gama alta con i9-13900HX y RTX 4090 en una carcasa delgada
Eluktronics Mech-17 GP2 Liquid Propulsion Package G2: NVIDIA GeForce RTX 4090 Laptop GPU
análise » Refrigeración por agua de un portátil GeForce RTX 4090: Análisis de Eluktronics Liquid Propulsion Package G2
HP Omen 17-ck2097ng: NVIDIA GeForce RTX 4080 Laptop GPU, 17.30", 2.8 kg
análise » Análisis del HP Omen 17 (2023): Portátil para juegos con RTX 4080
Medion Erazer Beast X40: NVIDIA GeForce RTX 4090 Laptop GPU, 17.00", 2.9 kg
análise » Análisis del Medion Erazer Beast X40: Portátil para juegos con RTX 4090
Eluktronics Mech-17 GP2: NVIDIA GeForce RTX 4090 Laptop GPU, 17.00", 2.9 kg
análise » Análisis del portátil Eluktronics Mech-17 GP2: MSI GT77 Titan: rendimiento sin tamaño
Lenovo Legion Pro 7 16IRX8H: NVIDIA GeForce RTX 4080 Laptop GPU, 16.00", 2.7 kg
análise » Análisis de Lenovo Legion Pro 7 16IRX8H: Rendimiento RTX 4080 de gama alta
Schenker XMG Neo 17 2023 Engineering Sample: NVIDIA GeForce RTX 4070 Laptop GPU
análise » GeForce Análisis de las RTX 4070, 4060 y 4050 para portátiles: las nuevas GPU de Nvidia para portátiles de gama alta, a examen
Schenker XMG Neo 16 Raptor Lake: NVIDIA GeForce RTX 4090 Laptop GPU, 16.00"
análise » Análisis de la GPU Nvidia Ada RTX 40 para portátiles: la GPU RTX 4090 de 175 W para portátiles supera a una RTX 3090 de 350 W en rendimiento y eficiencia energética
Acer Predator Helios 18 PH18-71: NVIDIA GeForce RTX 4060 Laptop GPU, 18.00", 3.3 kg
análise externo » Acer Predator Helios 18 PH18-71
Dell G16 7630, i9-13900HX RTX 4070: NVIDIA GeForce RTX 4070 Laptop GPU, 16.00", 2.9 kg
análise externo » Dell G16 7630, i9-13900HX RTX 4070
Acer Predator Helios 3D 15 SpatialLabs Edition: NVIDIA GeForce RTX 4080 Laptop GPU, 15.60", 3 kg
análise externo » Acer Predator Helios 3D 15 SpatialLabs Edition
Alienware m18 R1, RTX 4090: NVIDIA GeForce RTX 4090 Laptop GPU, 18.00", 4.2 kg
análise externo » Alienware m18 R1, RTX 4090
Acer Predator Helios 16 PH16-71-97H2: NVIDIA GeForce RTX 4070 Laptop GPU, 16.00", 2.7 kg
análise externo » Acer Predator Helios 16 PH16-71-97H2
Schenker XMG Neo 17 E23: NVIDIA GeForce RTX 4090 Laptop GPU, 17.30", 2.8 kg
análise externo » SCHENKER XMG Neo 17 E23
HP Omen Transcend 16-u0000: NVIDIA GeForce RTX 4070 Laptop GPU, 16.00", 2.2 kg
análise externo » HP Omen Transcend 16-u0000
Origin PC EON17-X 2023: NVIDIA GeForce RTX 4090 Laptop GPU, 17.30", 3.3 kg
análise externo » Origin PC EON17-X 2023
HP Omen Transcend 16: NVIDIA GeForce RTX 4070 Laptop GPU, 16.00", 2.3 kg
análise externo » HP Omen Transcend 16
HP Omen Transcend 16-u0095ng: NVIDIA GeForce RTX 4070 Laptop GPU, 16.00", 2.2 kg
análise externo » HP Omen Transcend 16-u0095ng
HP Omen 17-ck2940nz: NVIDIA GeForce RTX 4080 Laptop GPU, 17.30", 2.8 kg
análise externo » HP Omen 17-ck2940nz
Lenovo Legion Pro 7 16IRX8H, i9-13900HX RTX 4090: NVIDIA GeForce RTX 4090 Laptop GPU, 16.00", 2.8 kg
análise externo » Lenovo Legion Pro 7 16IRX8H, i9-13900HX RTX 4090
HP Omen 17-ck2004TX: NVIDIA GeForce RTX 4080 Laptop GPU, 17.30", 2.8 kg
análise externo » HP Omen 17-ck2004TX
Lenovo Legion Pro 5 16IRX8, i9-13900HX RTX 4070: NVIDIA GeForce RTX 4070 Laptop GPU, 16.00", 2.6 kg
análise externo » Lenovo Legion Pro 5 16IRX8, i9-13900HX RTX 4070
Acer Predator Triton 17X PTX17-71-99W5: NVIDIA GeForce RTX 4090 Laptop GPU, 17.00", 3 kg
análise externo » Acer Predator Triton 17X PTX17-71-99W5
Lenovo Legion Pro 7 16IRX8H, i9-13900HX RTX 4070: NVIDIA GeForce RTX 4070 Laptop GPU, 16.00", 2.5 kg
análise externo » Lenovo Legion Pro 7 16IRX8H, i9-13900HX RTX 4070
Acer Predator Helios 16 PH16-71: NVIDIA GeForce RTX 4070 Laptop GPU, 16.00", 2.7 kg
análise externo » Acer Predator Helios 16 PH16-71
Schenker XMG Focus 15 (E23): NVIDIA GeForce RTX 4050 Laptop GPU, 15.60", 2.4 kg
análise externo » Schenker XMG Focus 15 (E23)
HP Omen 17-ck2097ng: NVIDIA GeForce RTX 4080 Laptop GPU, 17.30", 2.8 kg
análise externo » HP Omen 17-ck2097ng
Medion Erazer Major X20: NVIDIA GeForce RTX 4070 Laptop GPU, 16.00", 2.4 kg
análise externo » Medion Erazer Major X20
Alienware m16 R1: NVIDIA GeForce RTX 4080 Laptop GPU, 16.00", 3.3 kg
análise externo » Alienware m16 R1
Aorus 17X AZF: NVIDIA GeForce RTX 4090 Laptop GPU, 17.30", 2.9 kg
análise externo » Aorus 17X AZF
Lenovo Legion Pro 7 16IRX8H: NVIDIA GeForce RTX 4080 Laptop GPU, 16.00", 2.7 kg
análise externo » Lenovo Legion Pro 7 16IRX8H
Acer Predator Helios 16 2023 PH16-71-9705: NVIDIA GeForce RTX 4080 Laptop GPU, 16.00", 2.7 kg
análise externo » Acer Predator Helios 16 2023 PH16-71-9705
Acer Predator Helios 18 2023 PH18-71-91U5: NVIDIA GeForce RTX 4080 Laptop GPU, 18.00", 3.3 kg
análise externo » Acer Predator Helios 18 2023 PH18-71-91U5
Schenker XMG Neo 16 E23: NVIDIA GeForce RTX 4090 Laptop GPU, 16.00", 2.5 kg
análise externo » Schenker XMG Neo 16 E23
Medion Erazer Beast X40: NVIDIA GeForce RTX 4090 Laptop GPU, 17.00", 2.9 kg
análise externo » Medion Erazer Beast X40
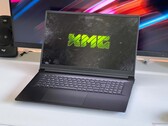
Schenker XMG Focus 17 M25: NVIDIA GeForce RTX 5070 Ti Laptop, 17.30", 2.8 kg
» El Focus 17 M25 de XMG con la RTX 5070 Ti es actualmente el portátil para juegos con mejor relación calidad-precio
HP Omen Transcend 16: NVIDIA GeForce RTX 4070 Laptop GPU, 16.00", 2.3 kg
» HP Omen Transcend 16 es tres pasos adelante y uno atrás para la serie