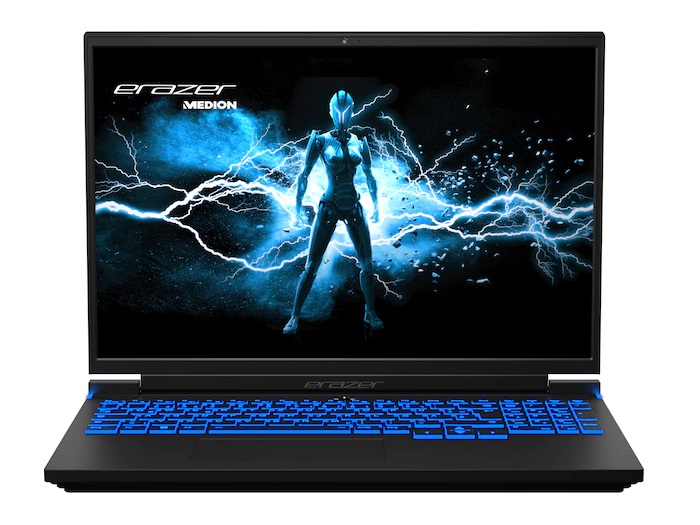
Análisis del portátil Medion Erazer Major X10: Debut del Intel Arc A730M
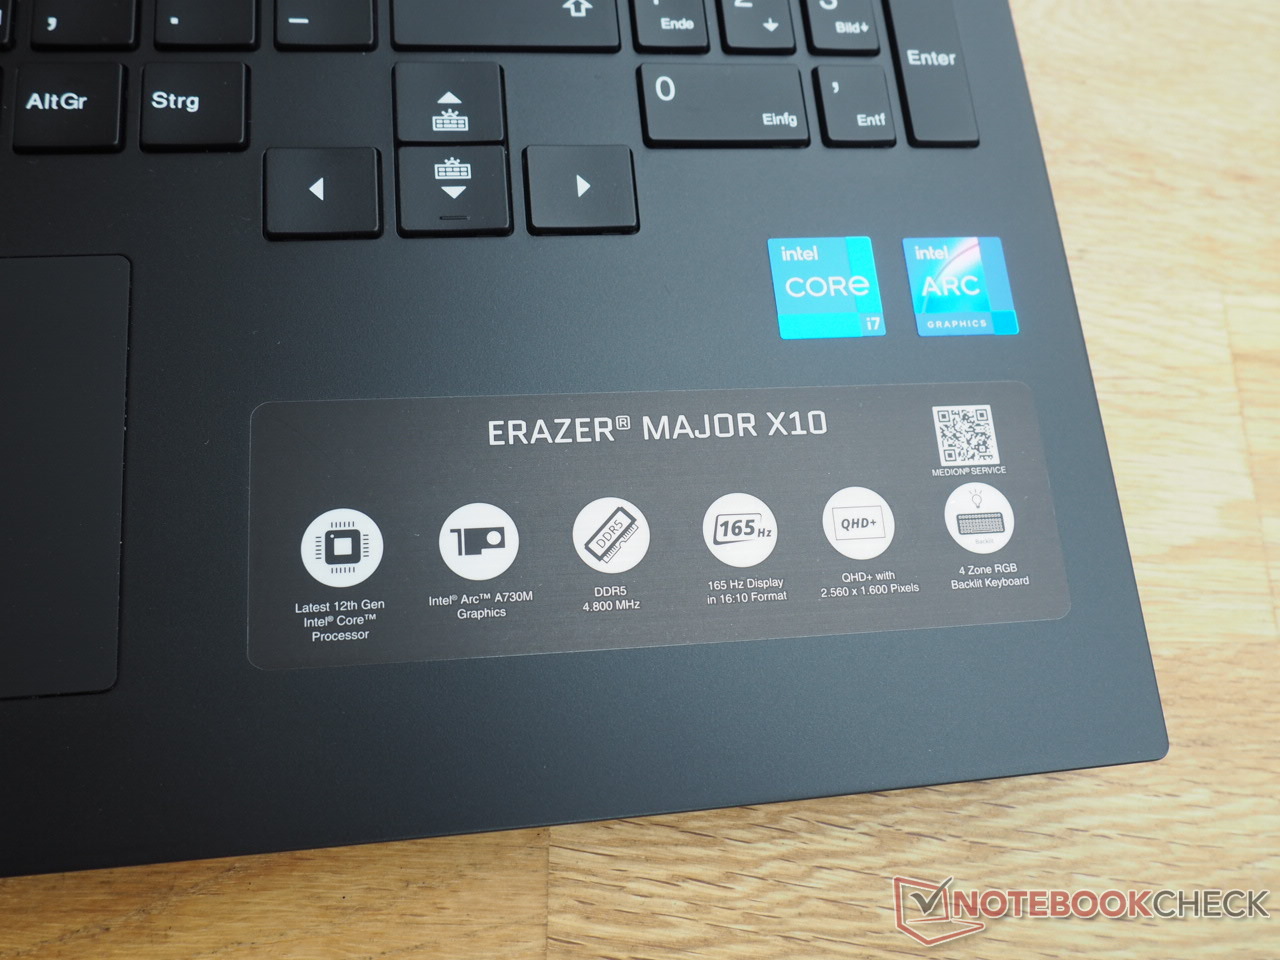
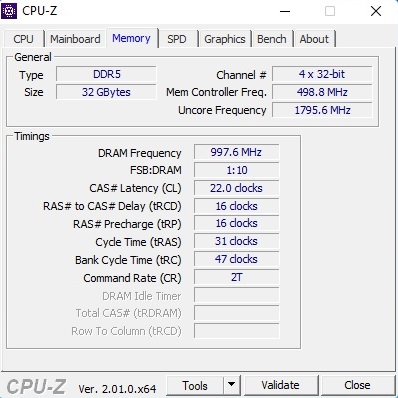
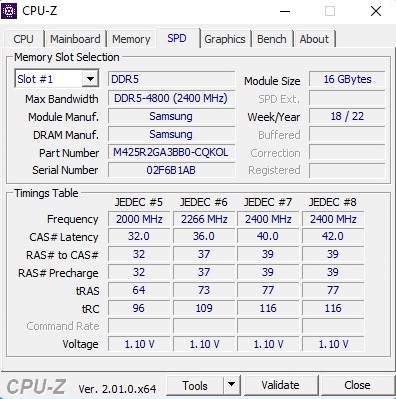
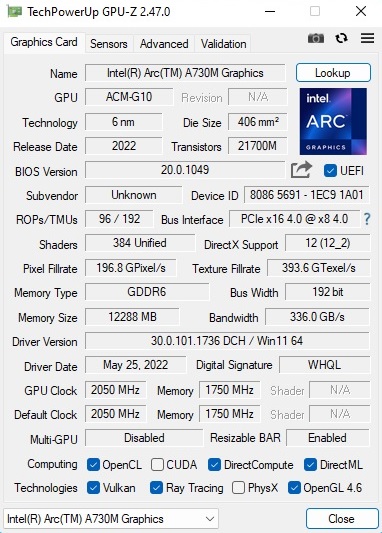
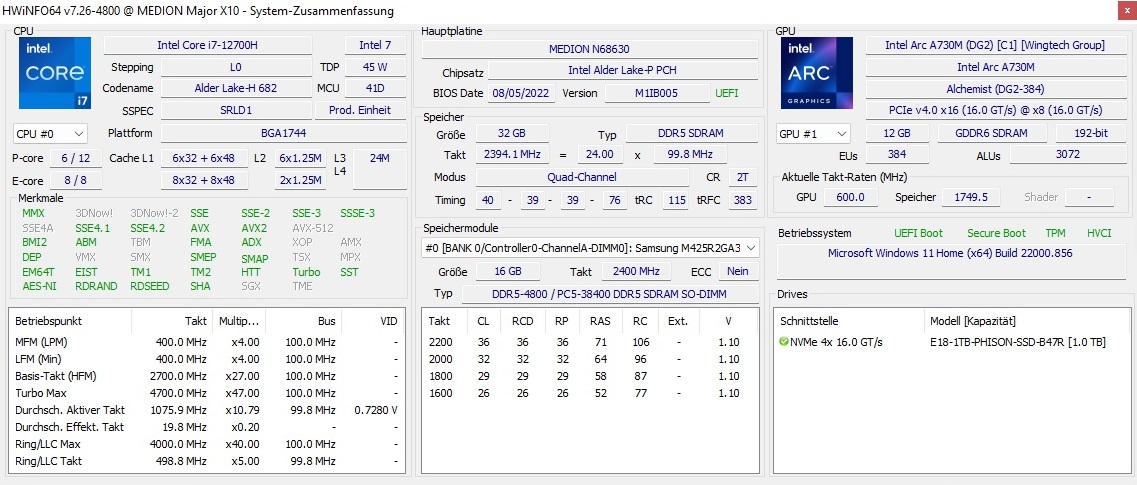
El Erazer Major X10 cuesta unos 1.700 euros (1.728 dólares) y está disponible en la tienda online de Medion https://www.medion.com/de/shop/p/core-gaming-notebooks-medion-erazer-major-x10-intel-core-i7-12700h-windows-11-home-40-6-cm-16-0--qhd-display-100-srgb-mit-165-hz-intel-arc-a730m-1-tb-pcie-ssd-32-gb-ram-high-end-gaming-notebook-30034414A1. Por ese precio, no solo se obtienen 32 GB de RAM de doble canal (2 x 16 GB DDR5-4800), sino también 1 TB de almacenamiento NVMe. El portátil cuenta con el Core i7-12700H, un procesador de 14 núcleos muy popular en los portátiles para juegos. Como se ha mencionado al principio, del procesamiento gráfico exigente se encarga el Arc A730M de Intel, una GPU de gama media que está diseñada principalmente para competir con la GeForce RTX 3060 y la Radeon RX 6600M. El portátil también cuenta con una pantalla mate de 165 Hz con una relación de aspecto 16:10 y una resolución de 2.560 x 1.600. Windows 11 Home completa el conjunto.
El Major X10 compite con otros portátiles para juegos de gama media, como el Asus TUF F17 FX707Z-HX011W, el Acer Nitro 5 AN517-55-738R (ambos con RTX 3060; uno con un TGP superior y el otro con uno medio) y el HP Omen 16-c0077ng (RX 6600M). El supuestamente más lento Dell Inspiron 16 Plus 7620 con GeForce RTX 3050 Ti está igualmente incluido en las tablas de comparación. Explicaremos el porqué más adelante en el análisis.
Posibles contendientes en la comparación
Valoración | Fecha | Modelo | Peso | Altura | Tamaño | Resolución | Precio |
|---|---|---|---|---|---|---|---|
| 85 % v7 (old) | 09/2022 | Medion Erazer Major X10 i7-12700H, A730M | 2.5 kg | 31 mm | 16.00" | 2560x1600 | |
| 84.1 % v7 (old) | 04/2022 | Asus TUF Gaming F17 FX707Z-HX011W i7-12700H, GeForce RTX 3060 Laptop GPU | 2.5 kg | 25 mm | 17.30" | 1920x1080 | |
| 83.9 % v7 (old) | 08/2022 | Acer Nitro 5 AN517-55-738R i7-12700H, GeForce RTX 3060 Laptop GPU | 3.1 kg | 28.6 mm | 17.30" | 1920x1080 | |
| 87.4 % v7 (old) | 08/2022 | Dell Inspiron 16 Plus 7620 i7-12700H, GeForce RTX 3050 Ti Laptop GPU | 2.1 kg | 18.99 mm | 16.00" | 3072x1920 | |
| 86 % v7 (old) | 04/2022 | HP Omen 16-c0077ng R7 5800H, Radeon RX 6600M | 2.3 kg | 26 mm | 16.10" | 2560x1440 |
Chasis
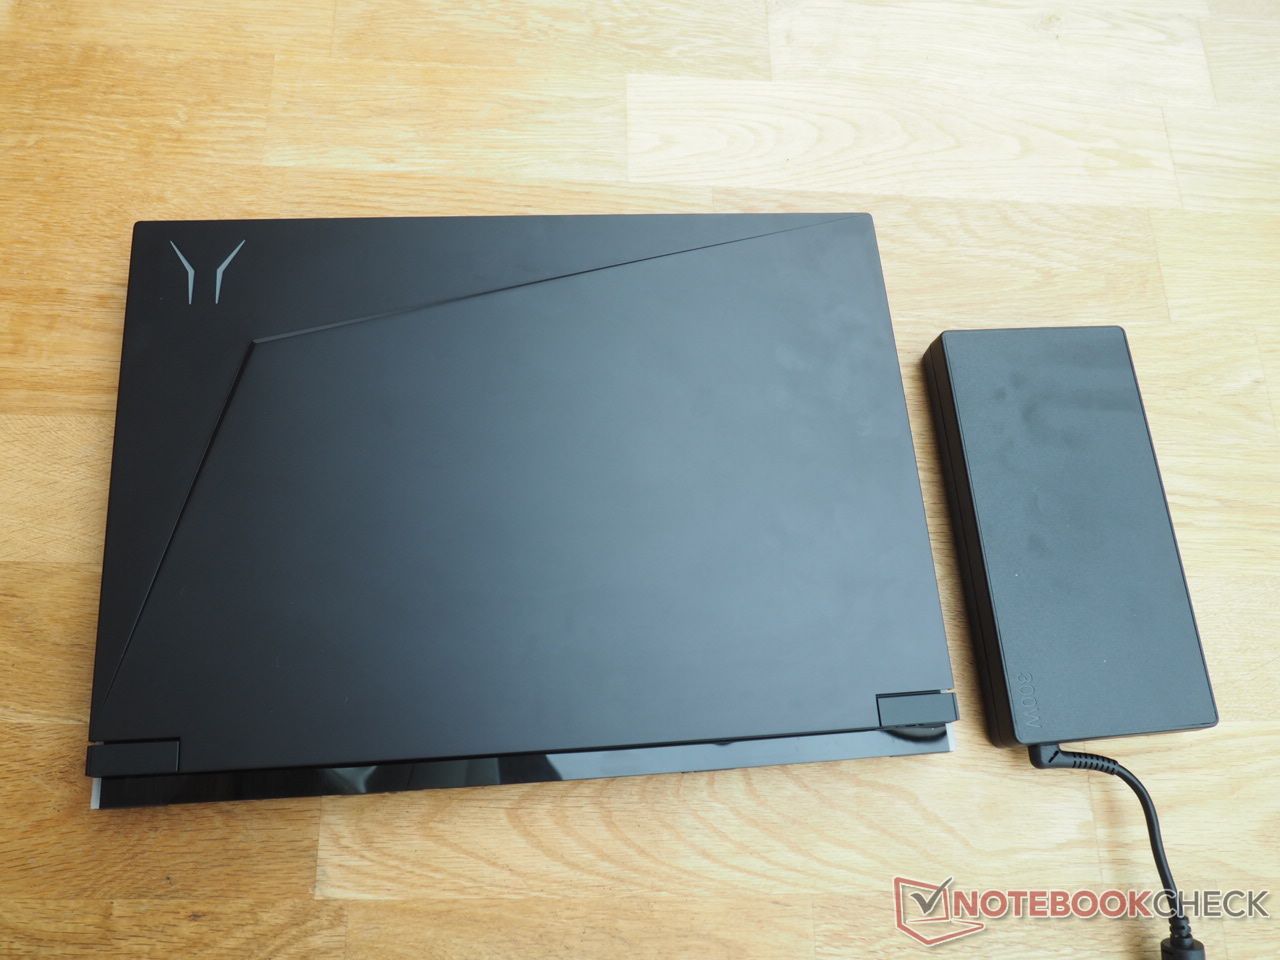
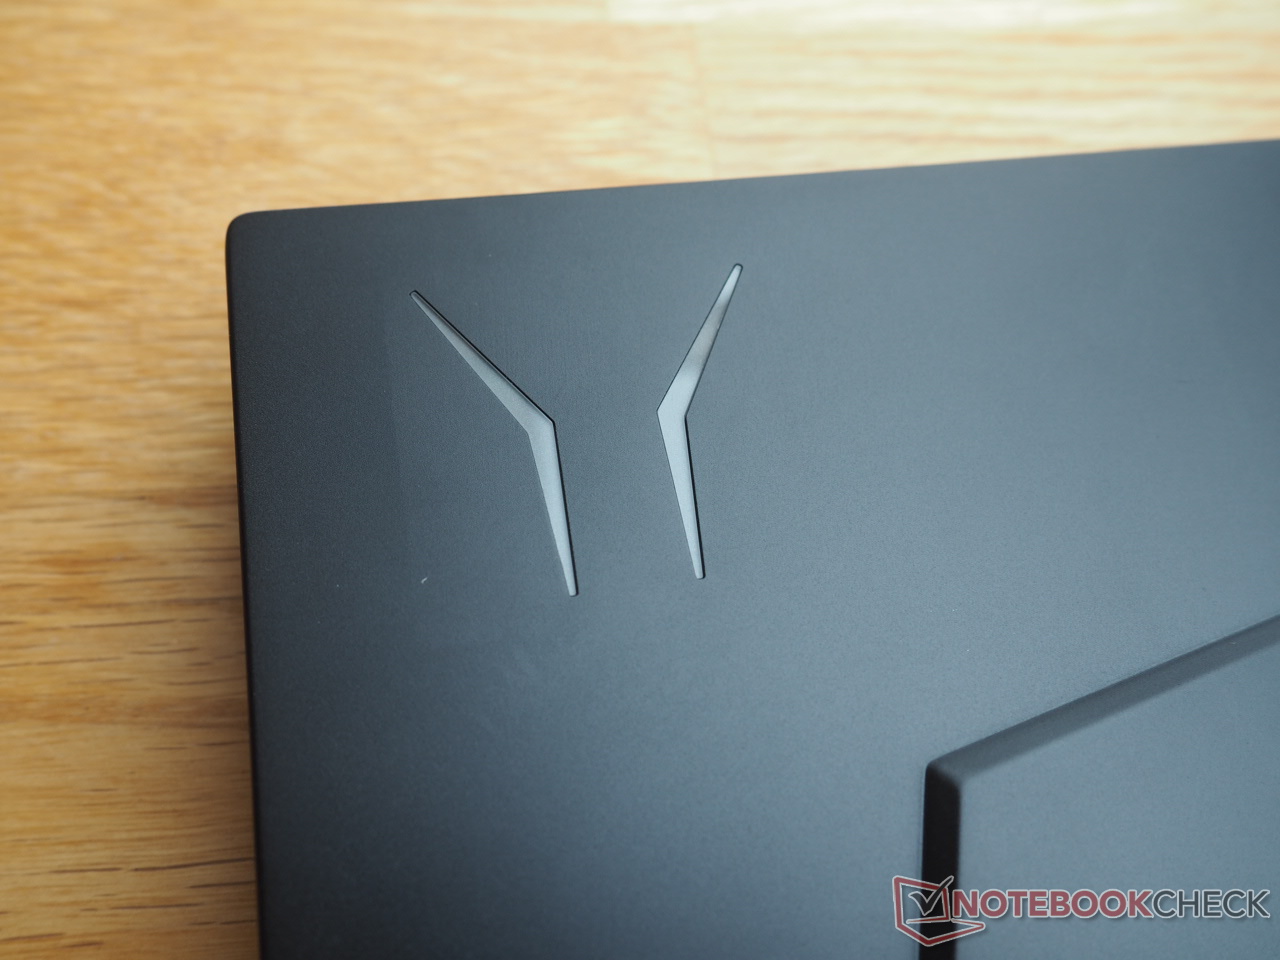
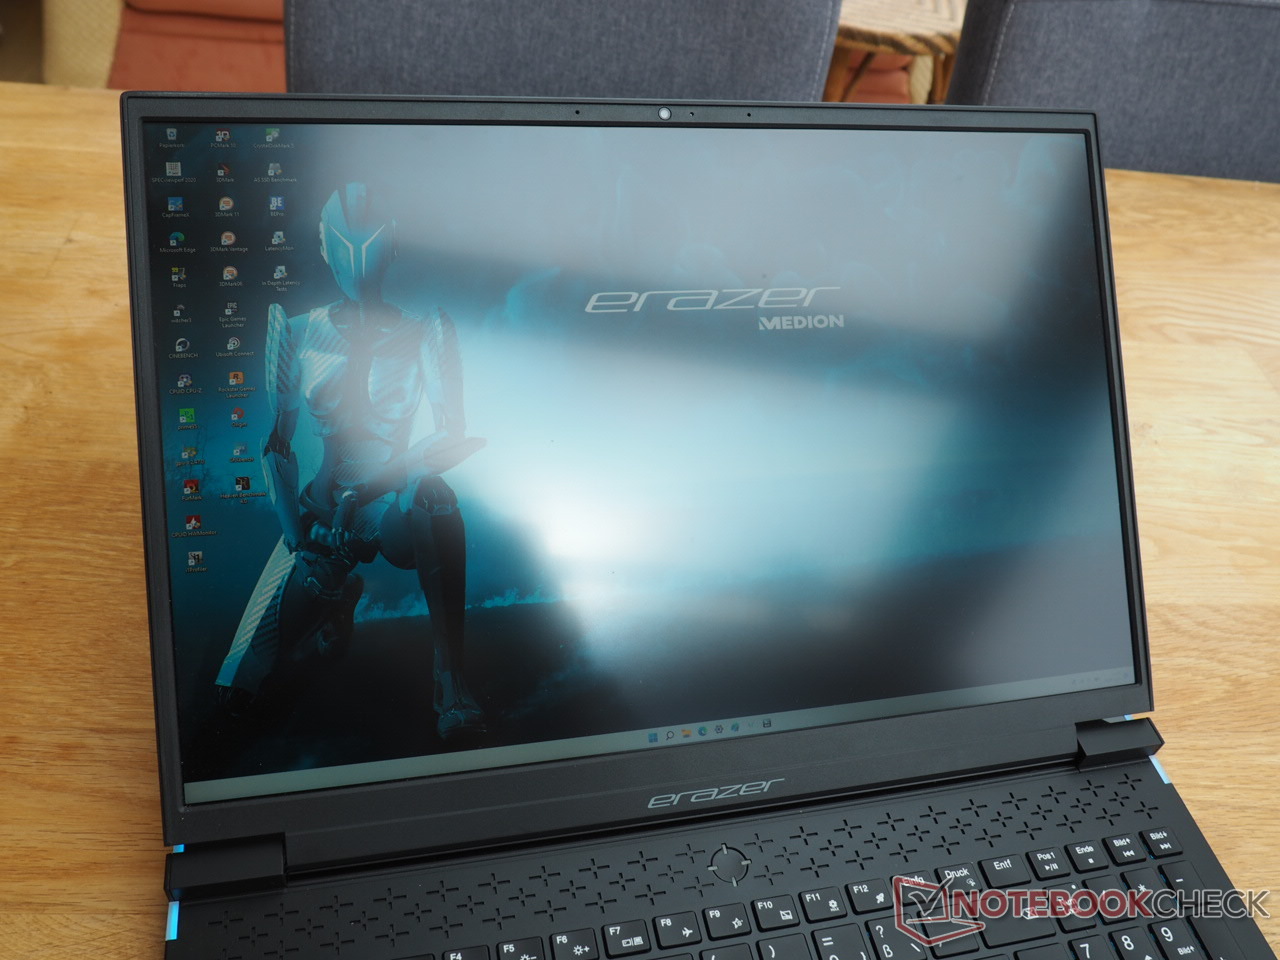
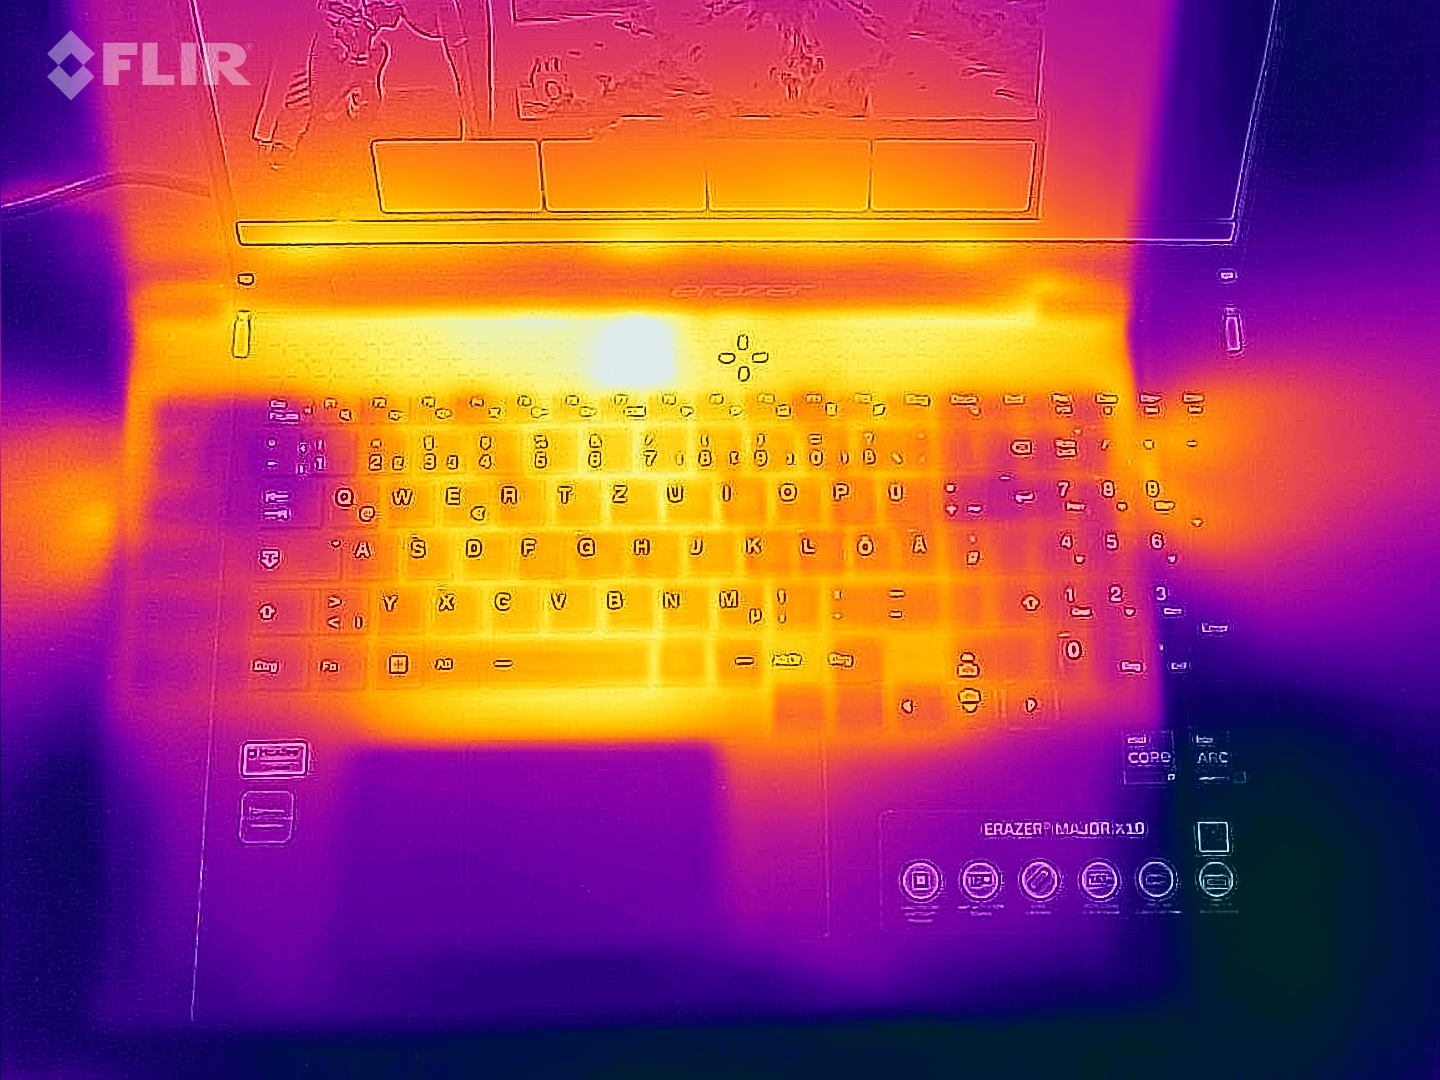
En cuanto al aspecto, el Major X10 nos recuerda a la serie Legion de Lenovo. Medion ha optado por utilizar un chasis negro mate con una tapa de aluminio. El chasis se siente sólido en nuestra opinión, aunque la sección de la base puede flexionar en algunos puntos cuando se aplica más fuerza y la tapa podría ser algo más firme (como es el caso de la mayoría de los portátiles). La pantalla puede abrirse hasta 180º, lo que es bastante inusual para un portátil. Y las bisagras hacen su trabajo sin problemas. Por ejemplo, el dispositivo se puede abrir fácilmente con una mano. Medion ha equipado el portátil con numerosos elementos de iluminación para hacerlo atractivo a los jugadores. Aparte del teclado, el logotipo en la tapa y las cruces en la parte trasera de los laterales también destacan visualmente. Las rejillas de ventilación situadas sobre el teclado presentan un diseño de retícula que complementa la estética general.
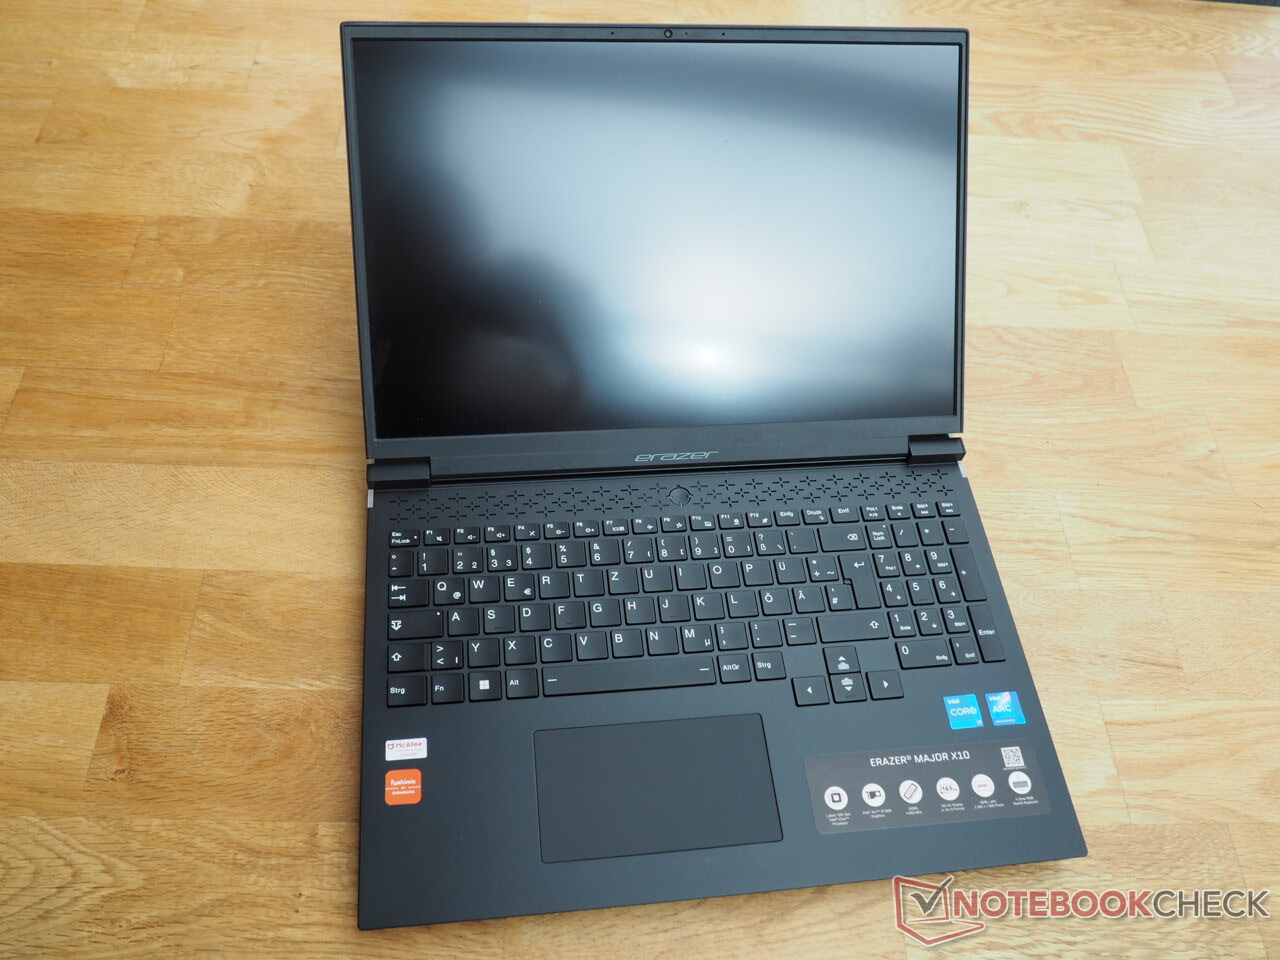
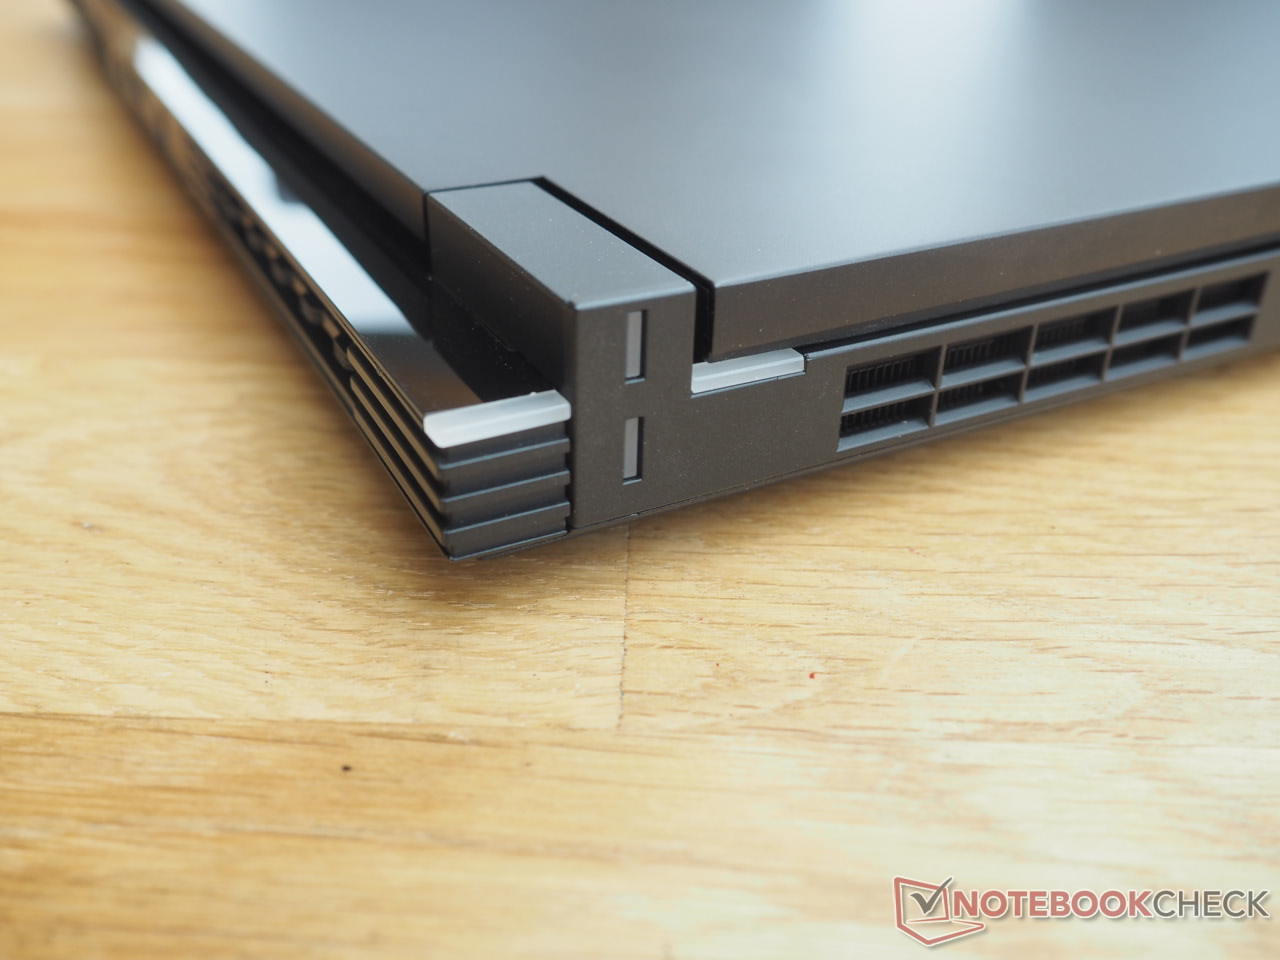
El Major X10 tiene un muy buen ajuste y acabado. En nuestra unidad de pruebas, todas las superficies están bien unidas. Con 2,5 kg, el dispositivo de 16 pulgadas no es ni ligero ni especialmente pesado para un portátil de juegos. A modo de comparación, el Asus TUF F17, ligeramente más grande, y el Acer Nitro 5 AN517 pesan 2,5 kg y 3,1 kg respectivamente, mientras que los competidores de 16 pulgadas Omen 16 e Inspiron 16 Plus son ligeramente más ligeros, con 2,3 kg y 2,1 kg respectivamente. Según el fabricante, el Major X10 tiene un grosor de 2,7 cm (1,06") sin las patas y de 3,1 cm (1,22") con ellas.
Características
Interfaces
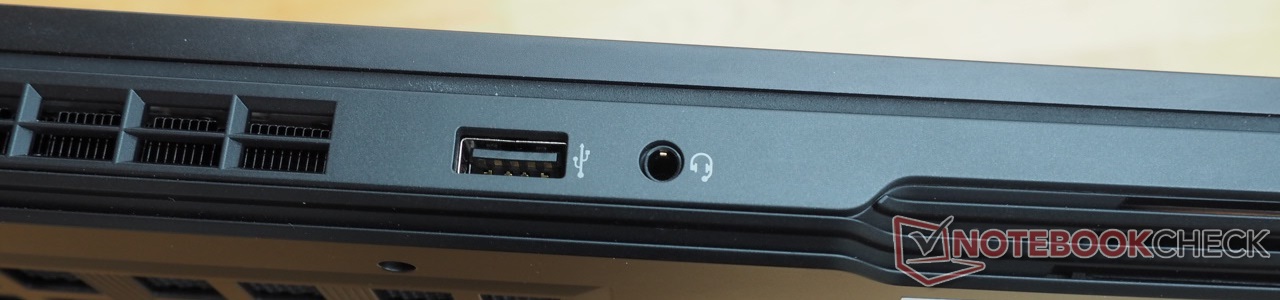
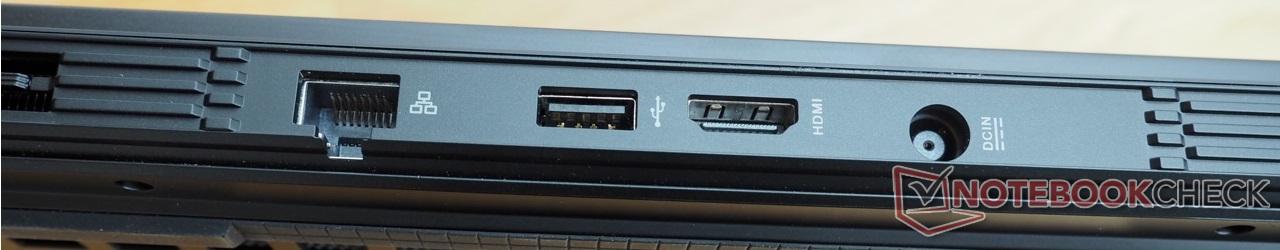
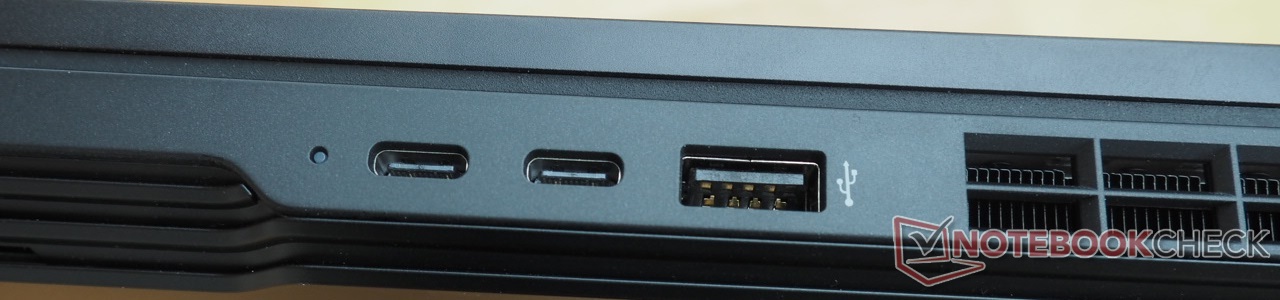
Si no te importa no tener un puerto Thunderbolt y un lector de tarjetas, estarás satisfecho con la selección de puertos del portátil. Hay tres puertos USB de tipo A y dos de tipo C (compatibles con DisplayPort), y todos, excepto uno, son compatibles con el estándar 3.2 Gen 2. El portátil también está equipado con un conector de audio combinado (auriculares y micrófono), un puerto Ethernet RJ45 y una salida HDMI 2.0. Como los puertos más importantes están situados en la parte trasera del portátil, no tendrás que preocuparte de que tus movimientos estén muy restringidos mientras juegas con un ratón externo.
Conectividad
No hubo sorpresas durante nuestra prueba Wi-Fi (portátil a 1 m de nuestro router de referencia Asus AXE11000). El módulo Intel Wi-Fi 6 AX201 del interior del dispositivo ofrece altas velocidades de transferencia, en línea con las expectativas.
| Networking | |
| iperf3 receive AXE11000 | |
| Medion Erazer Major X10 | |
| Media de la clase Gaming (680 - 1745, n=88, últimos 2 años) | |
| Medio Intel Wi-Fi 6 AX201 (390 - 1734, n=79) | |
| iperf3 transmit AXE11000 | |
| Medion Erazer Major X10 | |
| Medio Intel Wi-Fi 6 AX201 (438 - 1715, n=74) | |
| Media de la clase Gaming (560 - 1862, n=88, últimos 2 años) | |
Cámara web
A Medion le vendría bien una cámara web mejor. Aunque la webcam es ligeramente más nítida y rápida que la de muchos de sus competidores, le falta precisión en el color, como a muchas webcams integradas en los portátiles.


Accesorios
Nuestra unidad de revisión sólo venía con una fuente de alimentación de 300 vatios que mide aproximadamente 20 x 9 x 2 cm (7,9 x 3,5 x 0,8").
Mantenimiento
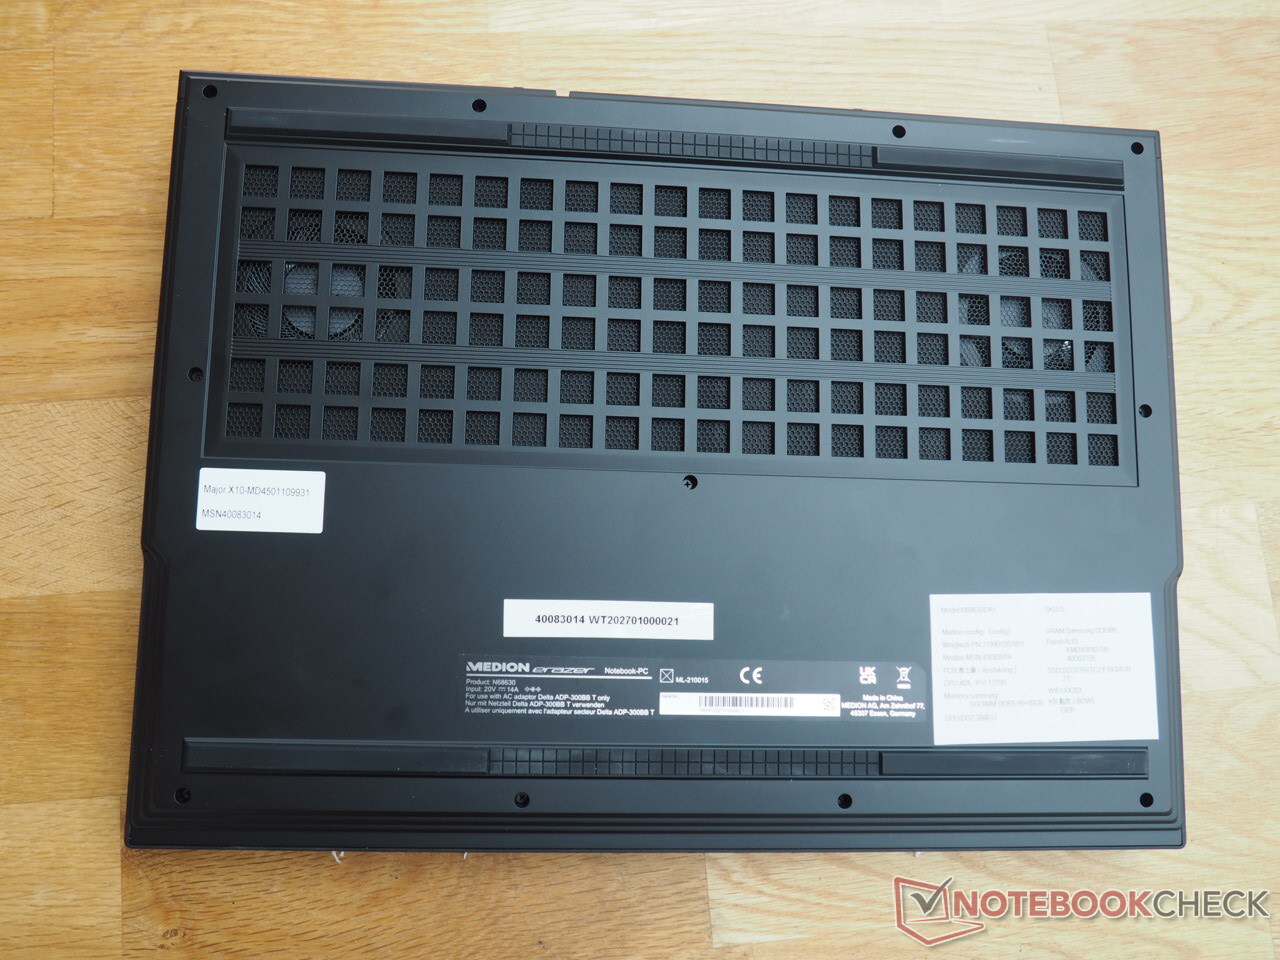
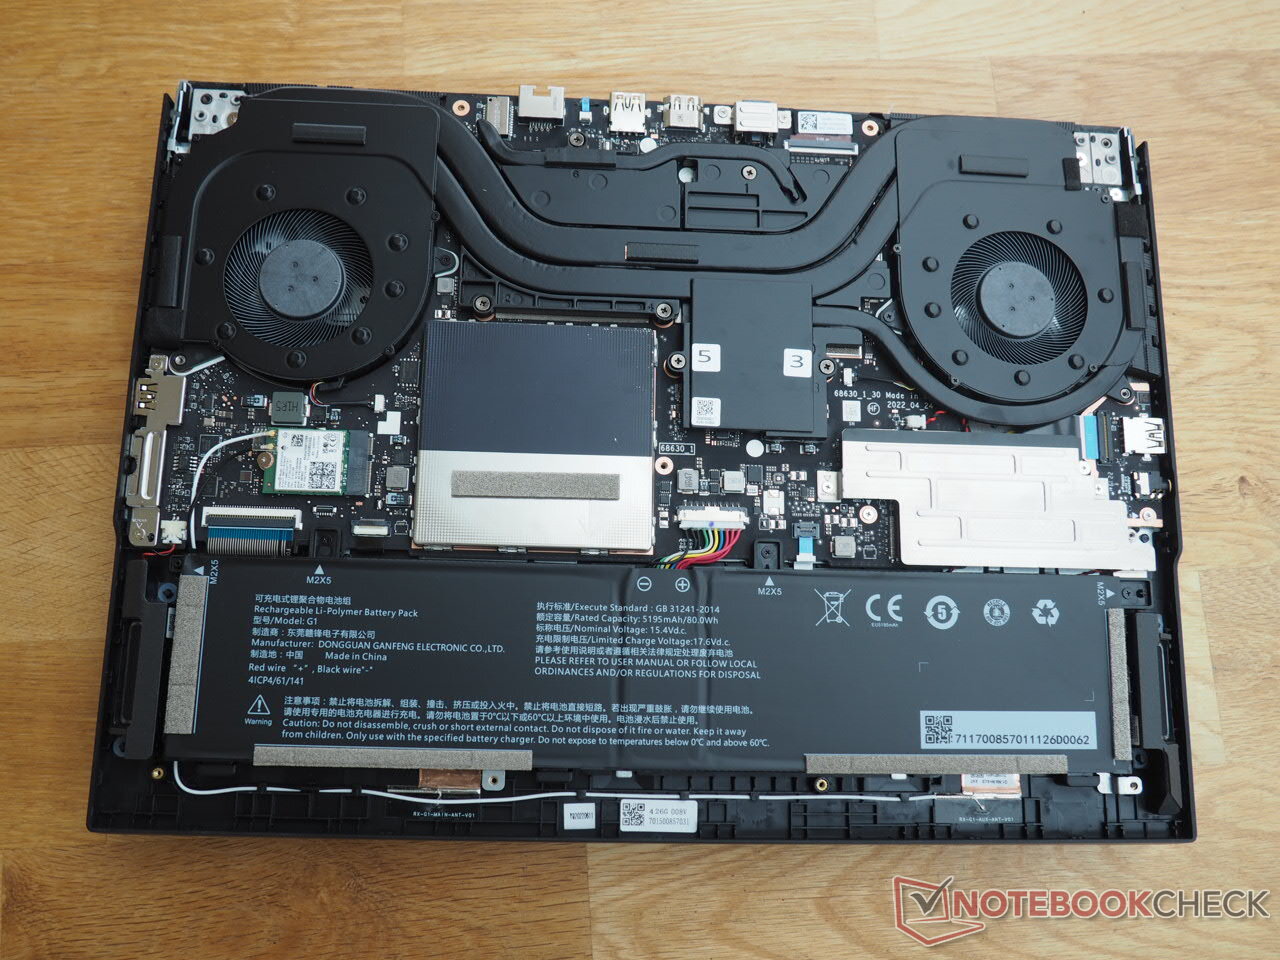
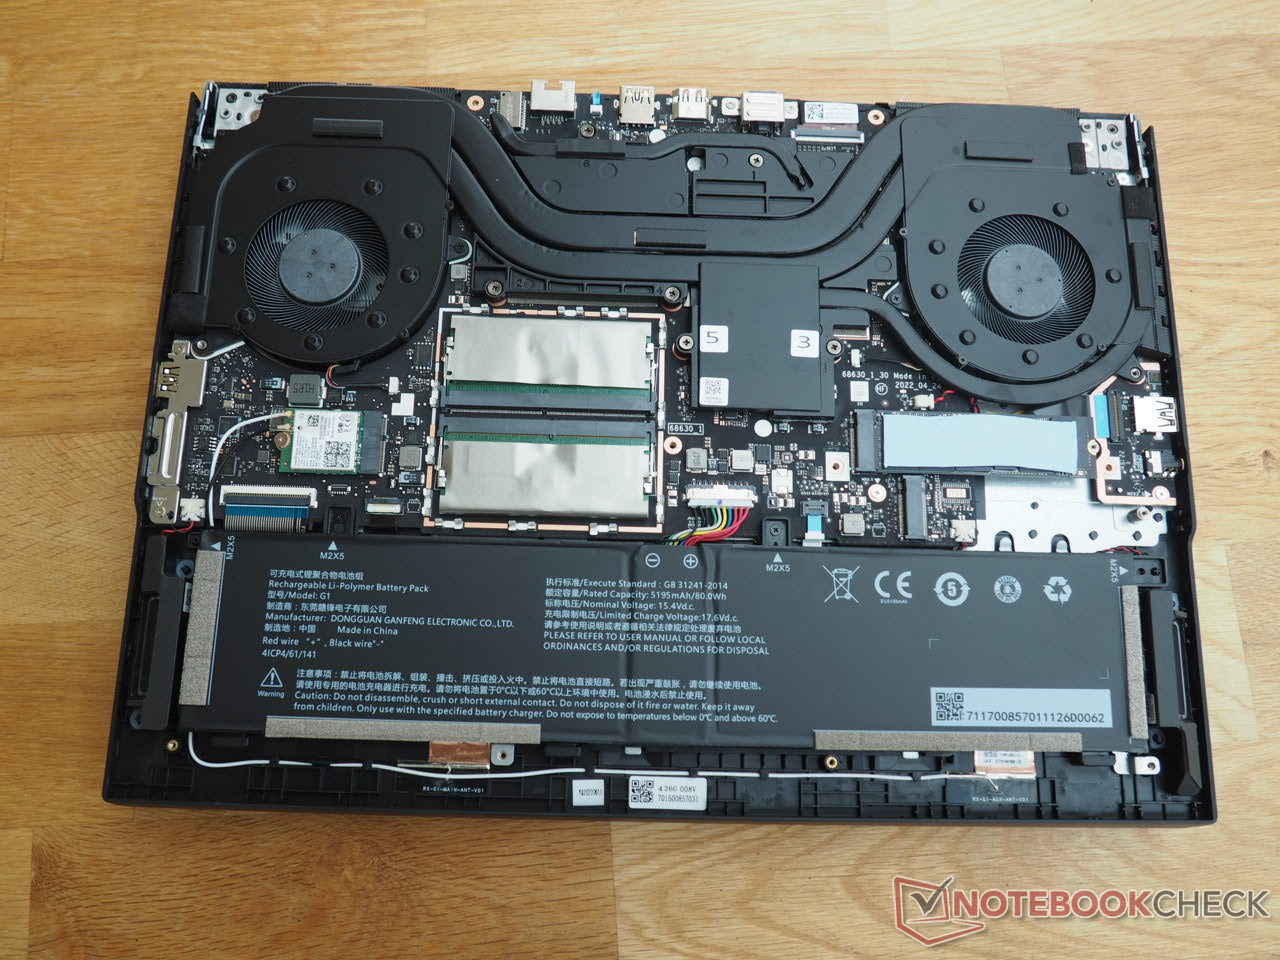
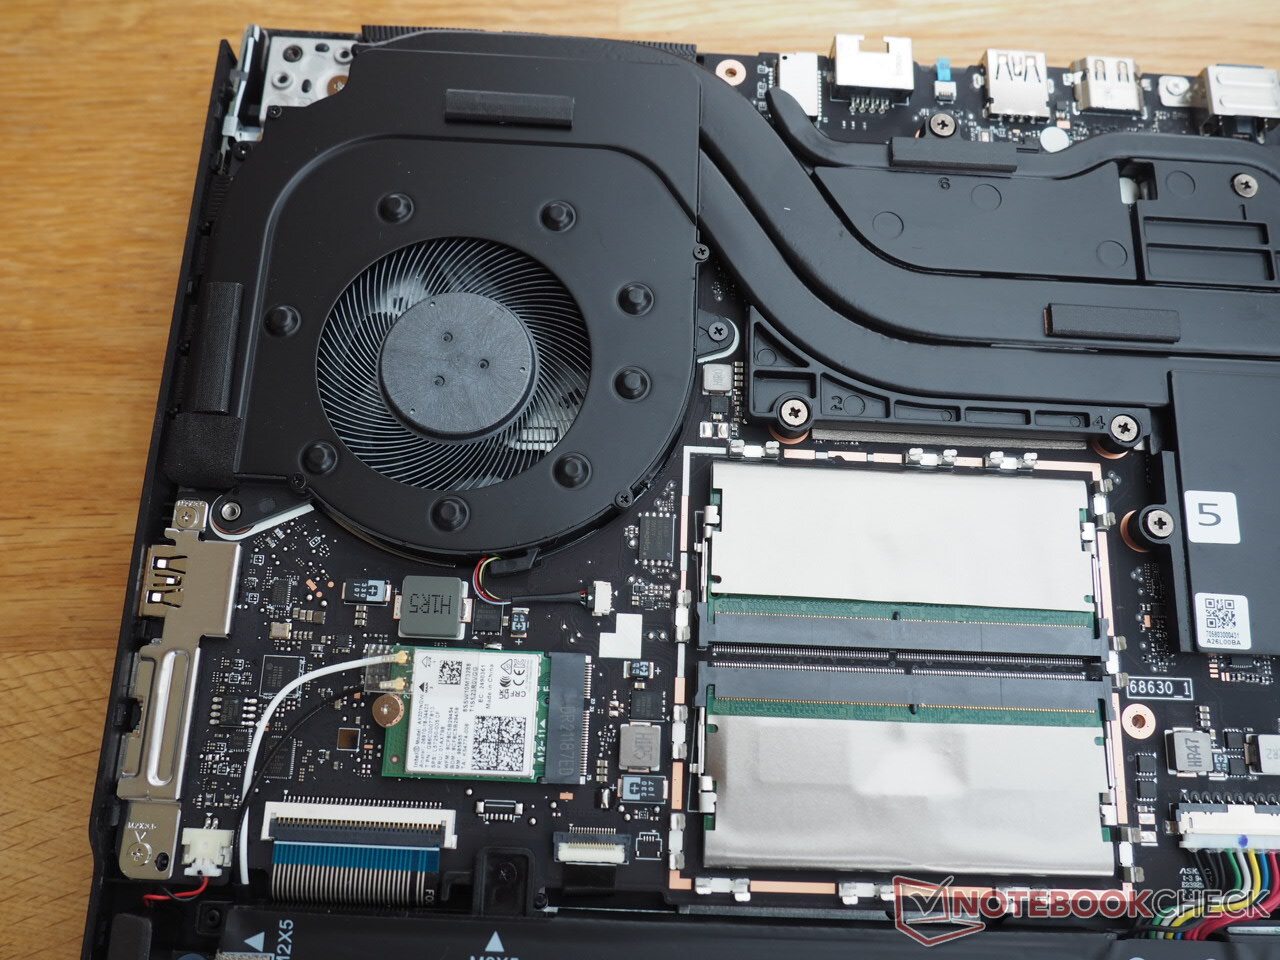
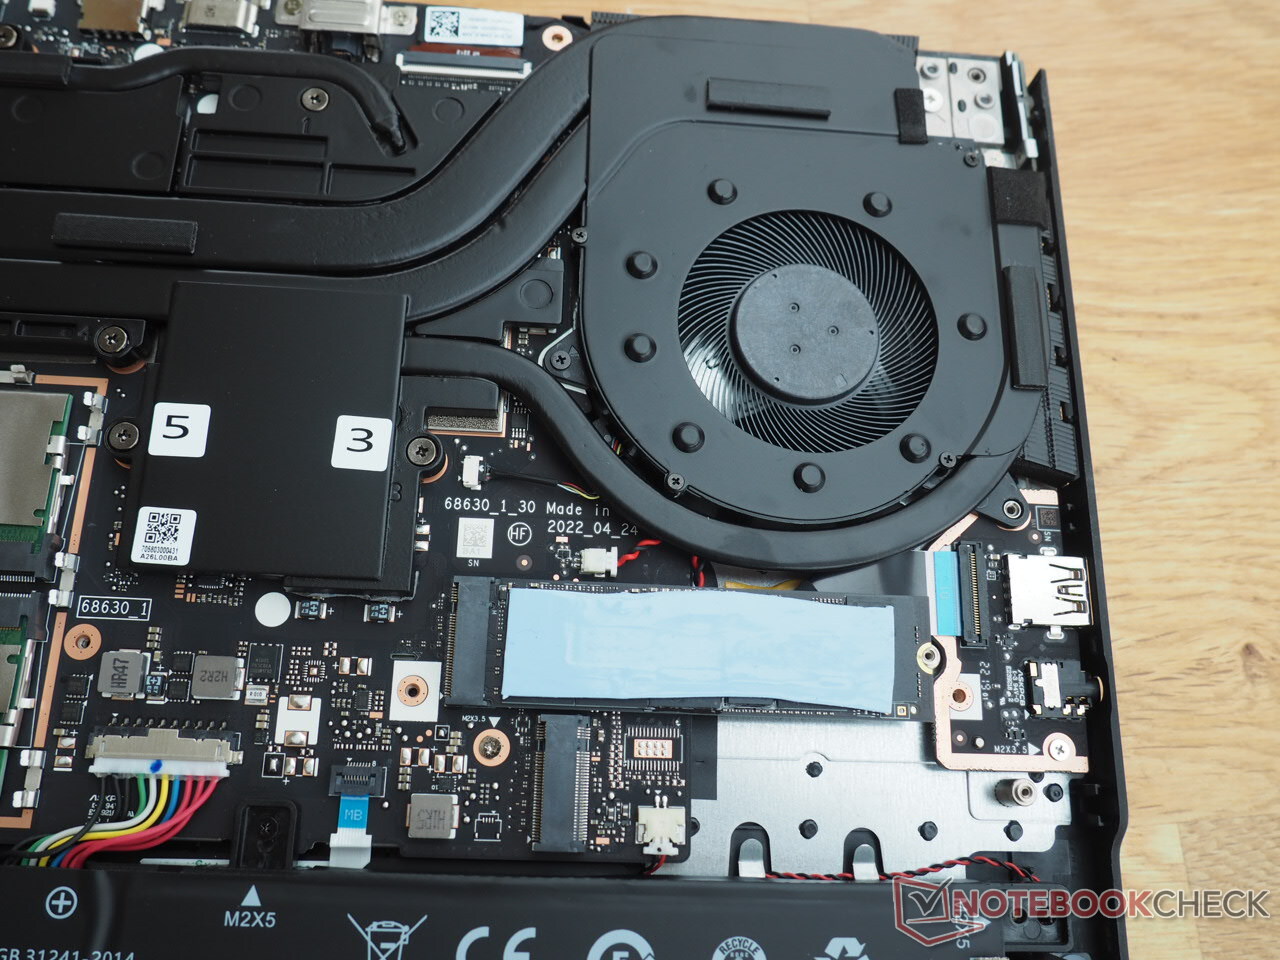
Se puede acceder al interior del dispositivo para su mantenimiento de la misma manera que en la mayoría de los portátiles para juegos. Después de quitar 11 tornillos Phillips de la parte inferior, puede levantar la cubierta inferior del portátil. Debido a que hay clips que mantienen la cubierta en su lugar, tendrá que aplicar una buena cantidad de fuerza utilizando una herramienta plana para hacerlo. Dentro del chasis, encontrarás dos ranuras SODIMM, dos ranuras M.2 (ambas situadas debajo de una tapa), el módulo inalámbrico y la batería. El sistema de refrigeración consiste en dos ventiladores que comparten varios tubos de calor.
Garantía
El Erazer Major X10 tiene una garantía de 24 meses.
Dispositivos de entrada
Teclado
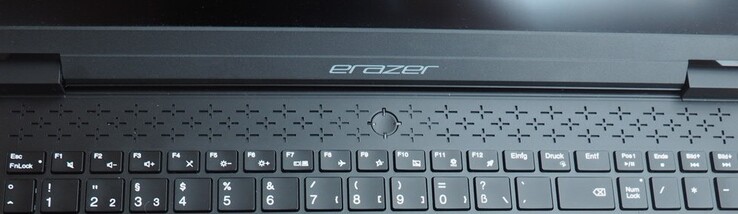
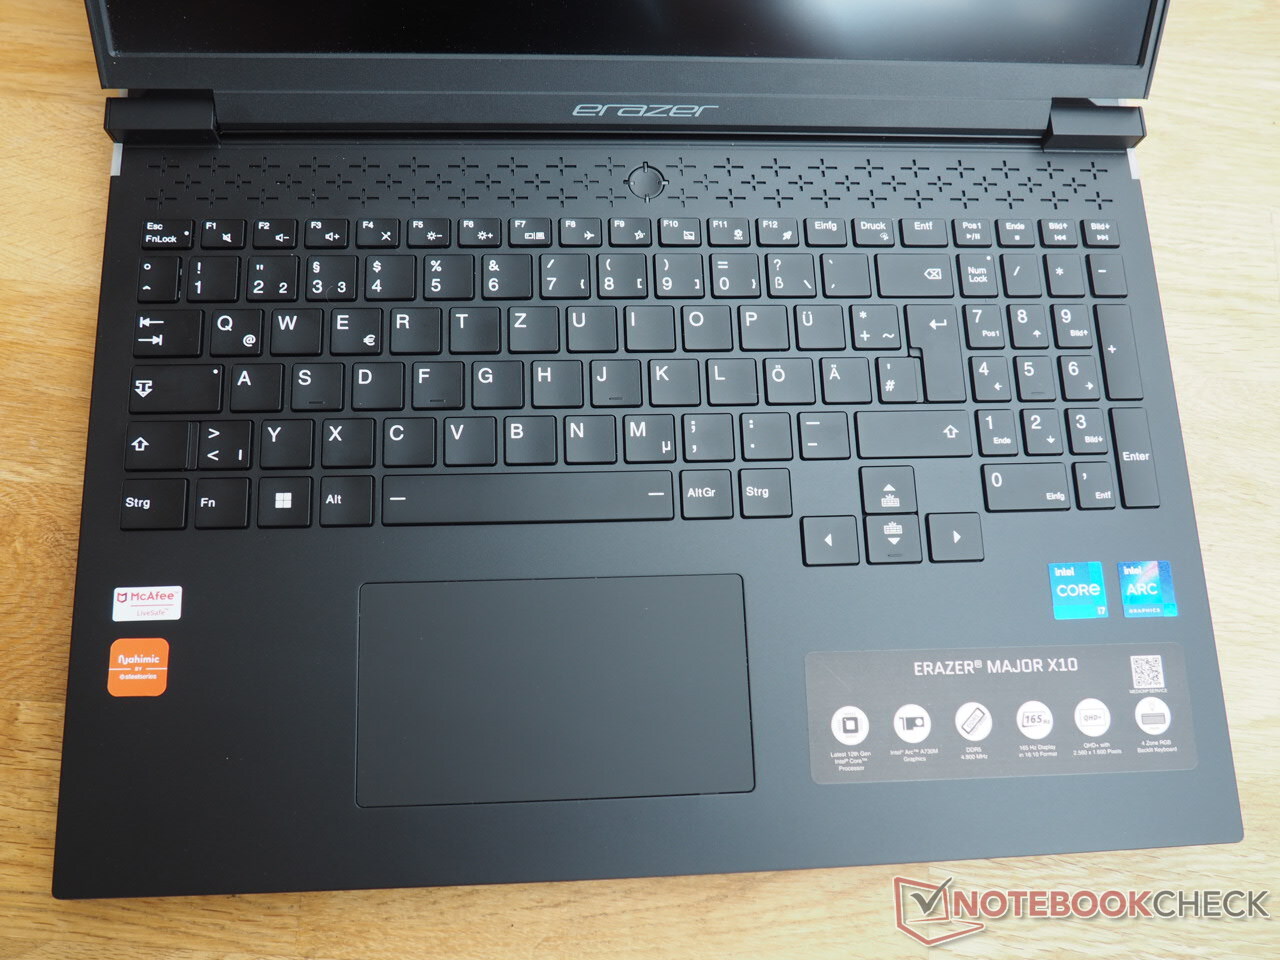
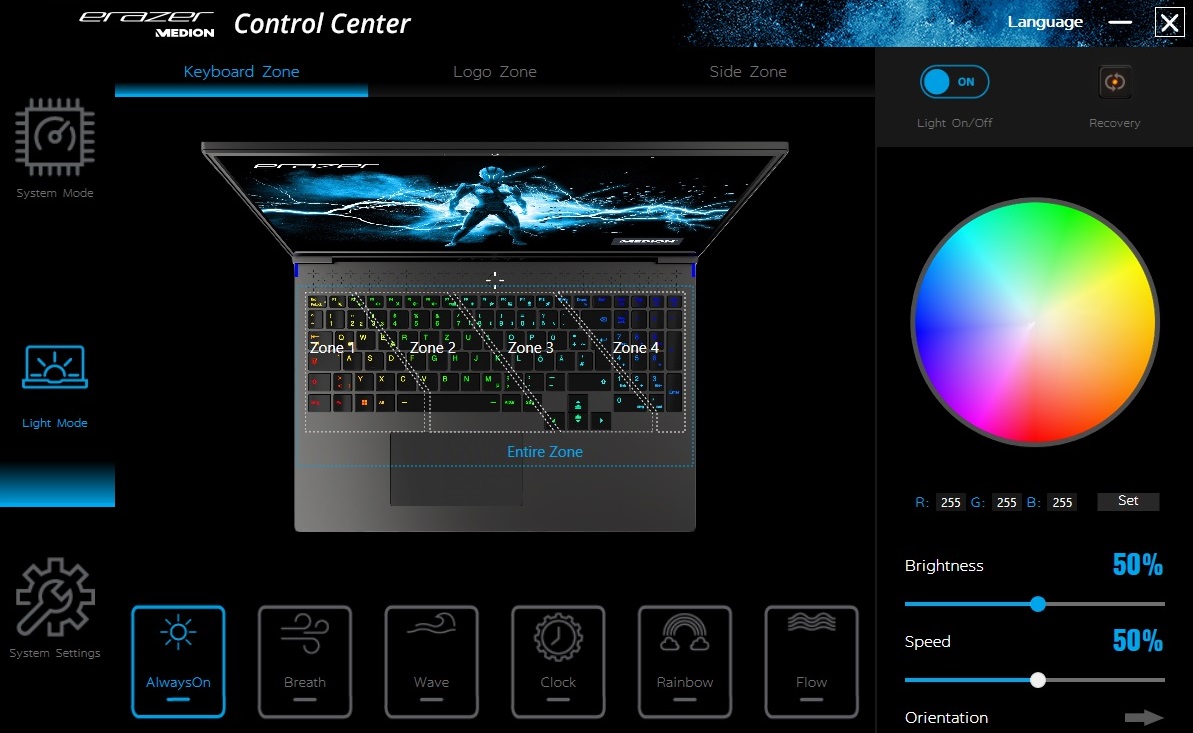
El portátil de 16 pulgadas cuenta con un teclado chiclet con un teclado numérico completo cuyas teclas son ligeramente más estrechas que el resto. A diferencia de muchos otros fabricantes, Medion ha decidido utilizar teclas de dirección de tamaño decente en lugar de esas diminutas; algunos jugadores se alegrarán de ello. También nos gusta la distribución del teclado, que se ajusta en gran medida al diseño estándar de QWERTZ. Uno de los aspectos más destacados es la iluminación RGB de cuatro zonas con niveles de brillo ajustables. Hay varios modos disponibles para personalizar la iluminación. La sensación de escribir en el teclado es decente para un portátil de juegos, es decir, ofrece una respuesta suficiente.
Teclado táctil
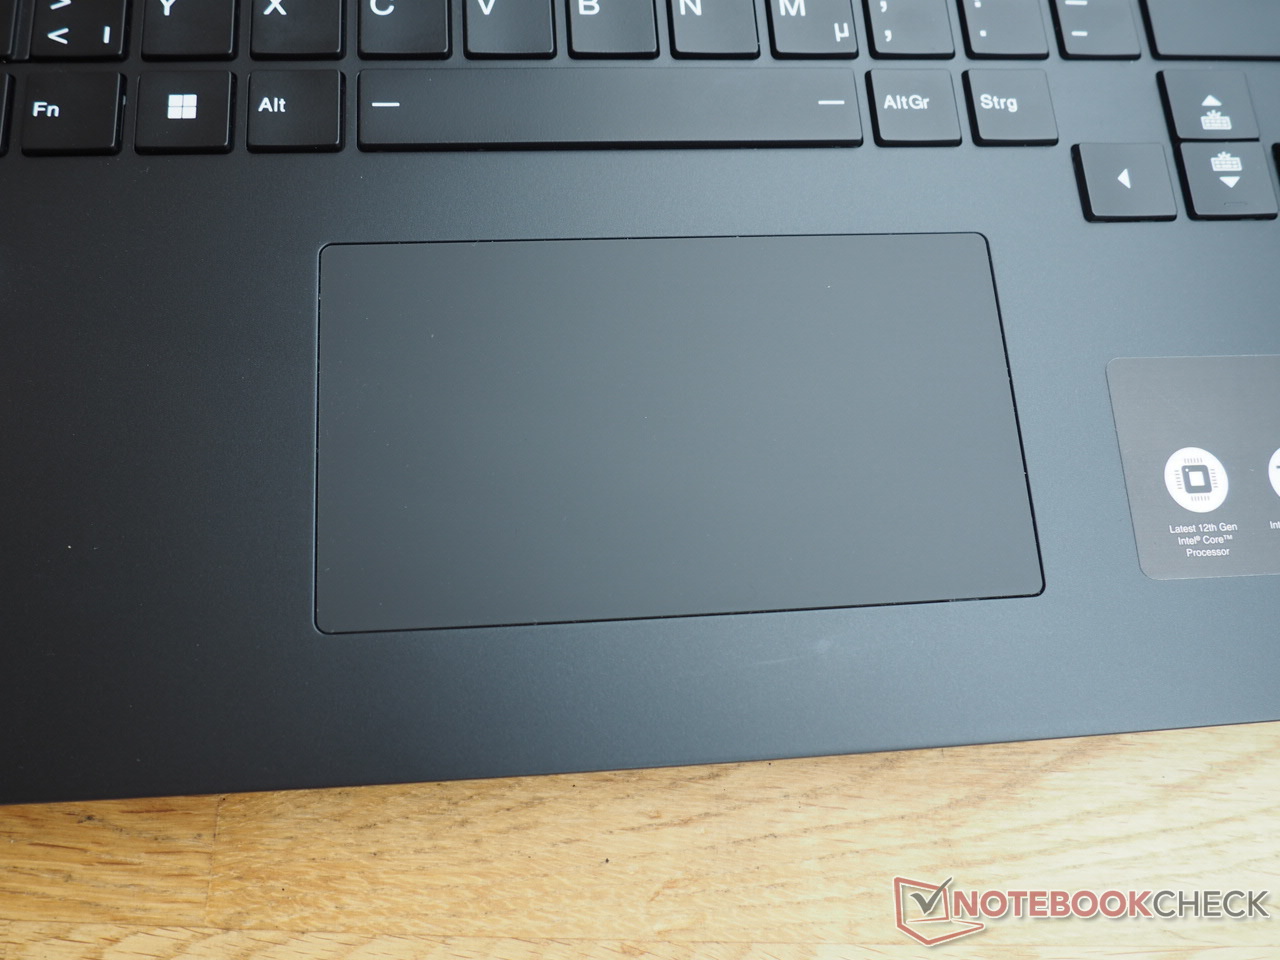
Tampoco hay mucho que objetar al touchpad. Con unas dimensiones de 12 x 6,5 cm, permite que los dedos se deslicen sobre él sin esfuerzo gracias a su superficie bastante lisa y tampoco muestra ningún problema (por ejemplo, con la precisión, los gestos). Sólo las zonas para hacer clic en la parte inferior eran un poco demasiado endebles para nuestro gusto, a pesar de ser suficientemente resistentes.
Mostrar
La pantalla de primera categoría es una característica destacada del dispositivo. Ahora mismo, los paneles 16:10 son cada vez más populares también en los portátiles para juegos. Y Medion sigue esta tendencia.
| |||||||||||||||||||||||||
iluminación: 82 %
Brillo con batería: 489 cd/m²
Contraste: 1223:1 (Negro: 0.4 cd/m²)
ΔE ColorChecker Calman: 2.08 | ∀{0.5-29.43 Ø4.71}
calibrated: 1.27
ΔE Greyscale Calman: 2.6 | ∀{0.09-98 Ø4.96}
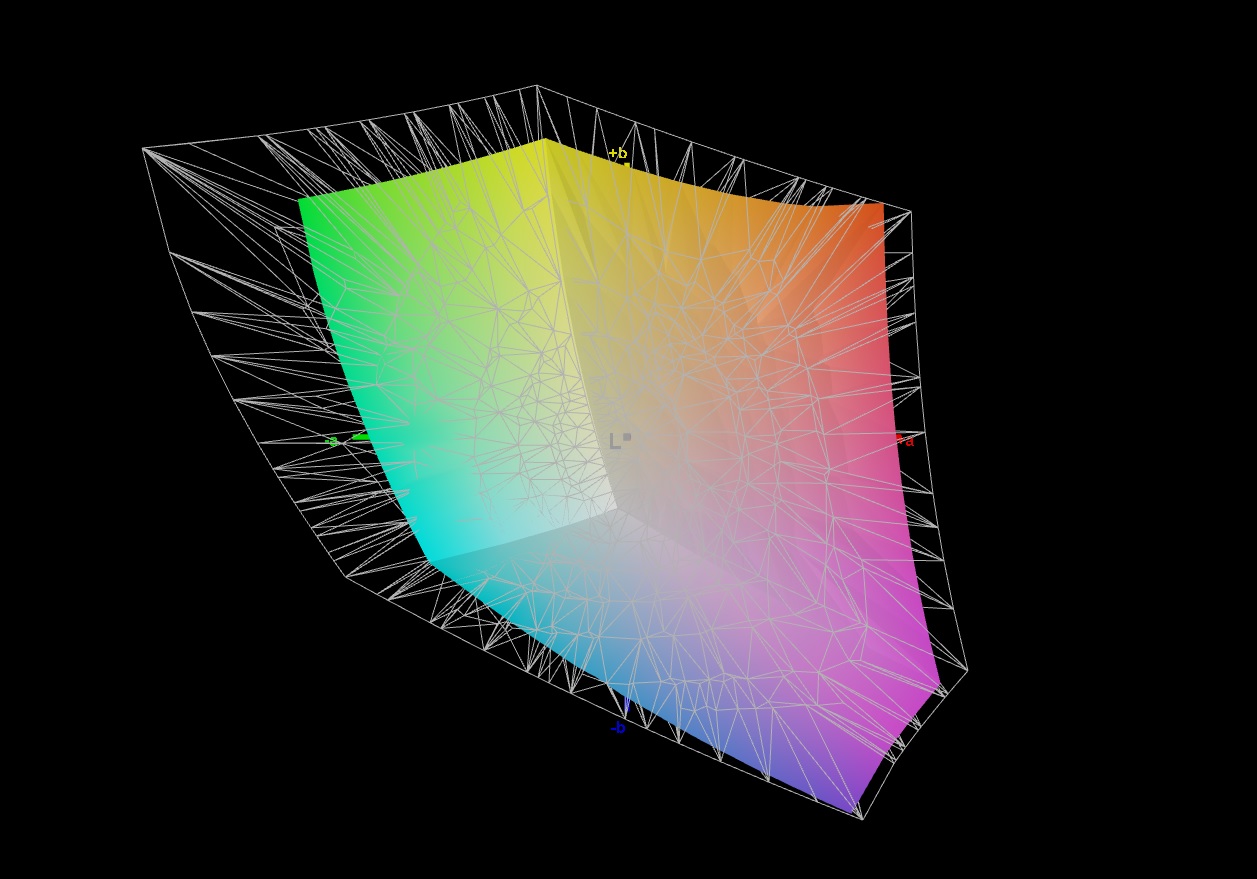
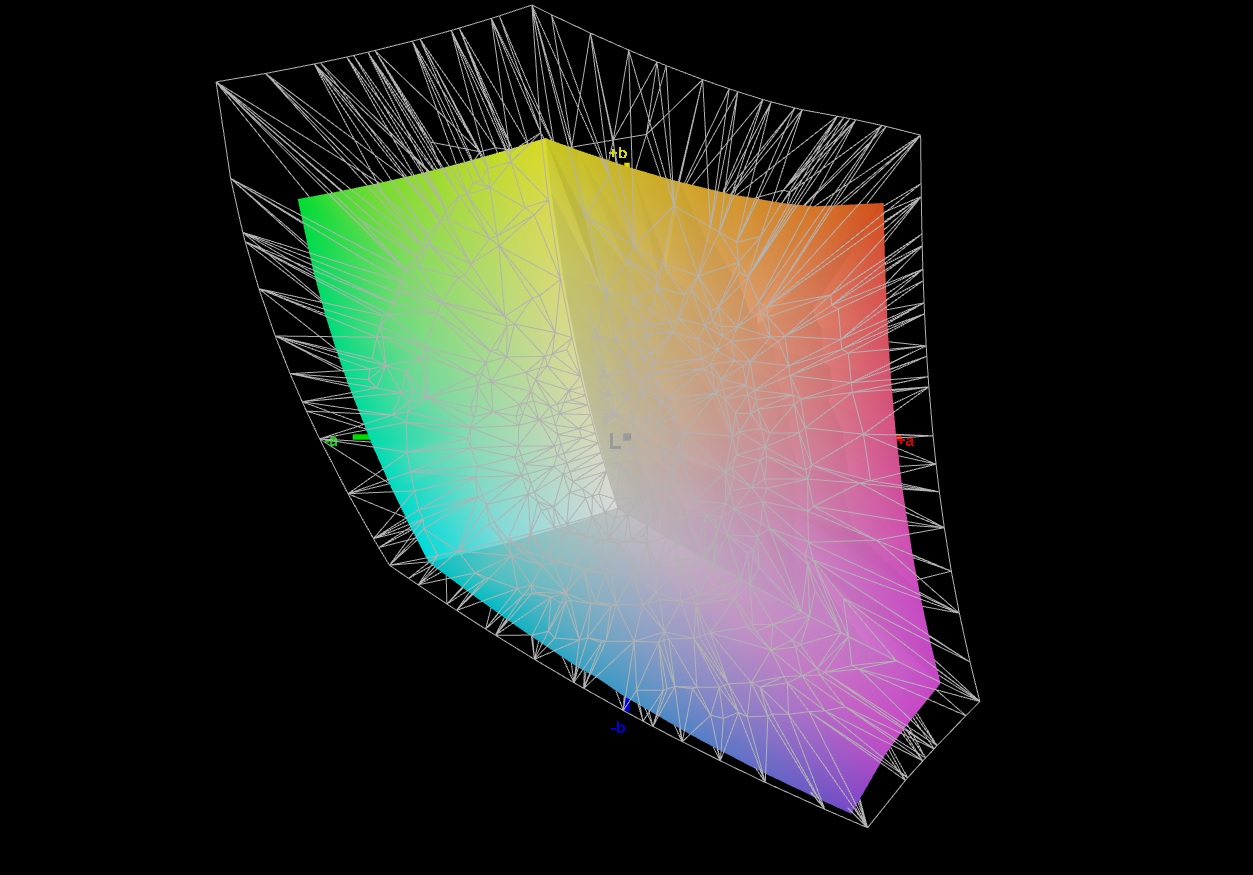
72.5% AdobeRGB 1998 (Argyll 3D)
98% sRGB (Argyll 3D)
70.4% Display P3 (Argyll 3D)
Gamma: 2.205
CCT: 6797 K
| Medion Erazer Major X10 AUO B160QAN03.H, IPS, 2560x1600, 16" | Asus TUF Gaming F17 FX707Z-HX011W AU Optronics B173HAN04.9 (AUO4B9D), IPS, 1920x1080, 17.3" | Acer Nitro 5 AN517-55-738R B173HAN04.0, IPS, 1920x1080, 17.3" | Dell Inspiron 16 Plus 7620 BOE NE16N41, IPS, 3072x1920, 16" | HP Omen 16-c0077ng BOE09E5, IPS, 2560x1440, 16.1" | |
|---|---|---|---|---|---|
| Display | -42% | -15% | 1% | -2% | |
| Display P3 Coverage (%) | 70.4 | 40.2 -43% | 58.9 -16% | 70.8 1% | 68.8 -2% |
| sRGB Coverage (%) | 98 | 59.7 -39% | 86.4 -12% | 99.5 2% | 96.9 -1% |
| AdobeRGB 1998 Coverage (%) | 72.5 | 41.5 -43% | 60.5 -17% | 73.2 1% | 71.1 -2% |
| Response Times | -273% | 16% | -256% | -25% | |
| Response Time Grey 50% / Grey 80% * (ms) | 13.9 ? | 39.2 ? -182% | 6 ? 57% | 38 ? -173% | 13 ? 6% |
| Response Time Black / White * (ms) | 6.4 ? | 29.6 ? -363% | 8 ? -25% | 28 ? -338% | 10 ? -56% |
| PWM Frequency (Hz) | |||||
| Screen | -66% | -36% | 9% | -30% | |
| Brightness middle (cd/m²) | 489 | 287 -41% | 286 -42% | 288.9 -41% | 297 -39% |
| Brightness (cd/m²) | 436 | 268 -39% | 278 -36% | 276 -37% | 283 -35% |
| Brightness Distribution (%) | 82 | 89 9% | 89 9% | 92 12% | 91 11% |
| Black Level * (cd/m²) | 0.4 | 0.17 57% | 0.32 20% | 0.26 35% | 0.22 45% |
| Contrast (:1) | 1223 | 1688 38% | 894 -27% | 1111 -9% | 1350 10% |
| Colorchecker dE 2000 * | 2.08 | 5.1 -145% | 3.05 -47% | 1.88 10% | 3.25 -56% |
| Colorchecker dE 2000 max. * | 4.27 | 8.72 -104% | 5.83 -37% | 4.37 -2% | 6.33 -48% |
| Colorchecker dE 2000 calibrated * | 1.27 | 5.1 -302% | 3.13 -146% | 0.42 67% | 1.11 13% |
| Greyscale dE 2000 * | 2.6 | 4.24 -63% | 3.17 -22% | 1.4 46% | 6.97 -168% |
| Gamma | 2.205 100% | 2.44 90% | 2.29 96% | 2.3 96% | 2.3 96% |
| CCT | 6797 96% | 6008 108% | 6916 94% | 6634 98% | 6050 107% |
| Media total (Programa/Opciones) | -127% /
-90% | -12% /
-24% | -82% /
-30% | -19% /
-23% |
* ... más pequeño es mejor
La pantalla de 165 Hz fabricada por AUO (modelo B160QAN03.H) es excepcional en casi todos los aspectos. En primer lugar, supera a la competencia en cuanto a brillo máximo. El panel tiene un buen promedio de brillo máximo de 436 cd/m², lo que hace que el Major X10 sea muy adecuado para el uso en exteriores. En comparación, los competidores no llegan ni a 300 cd/m².
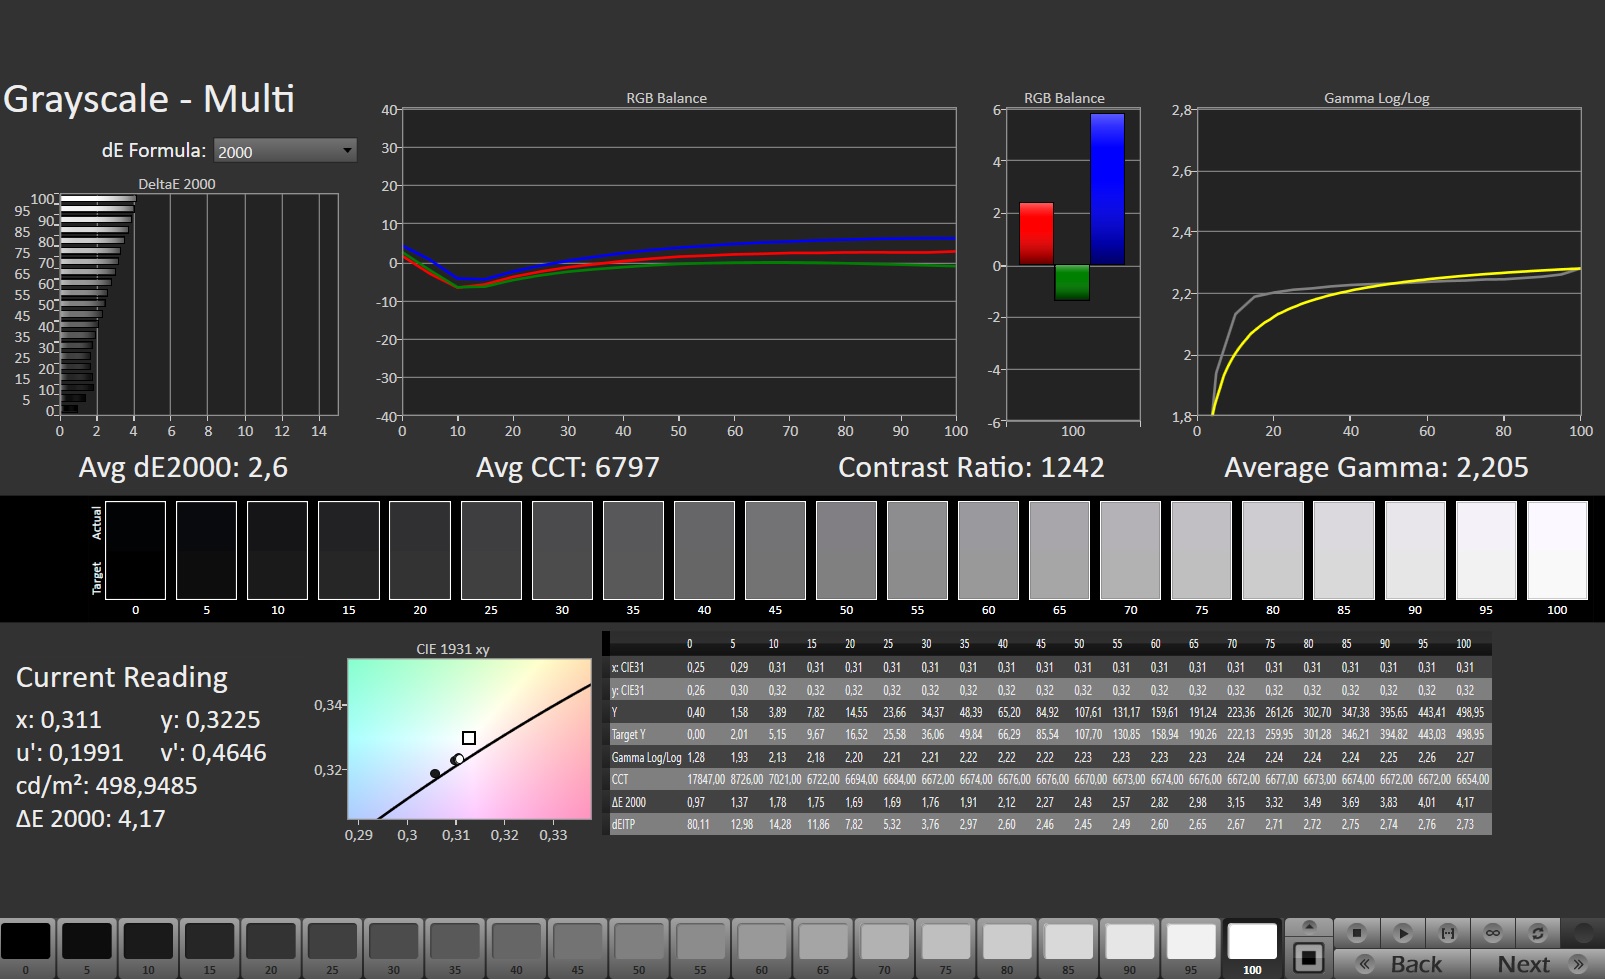
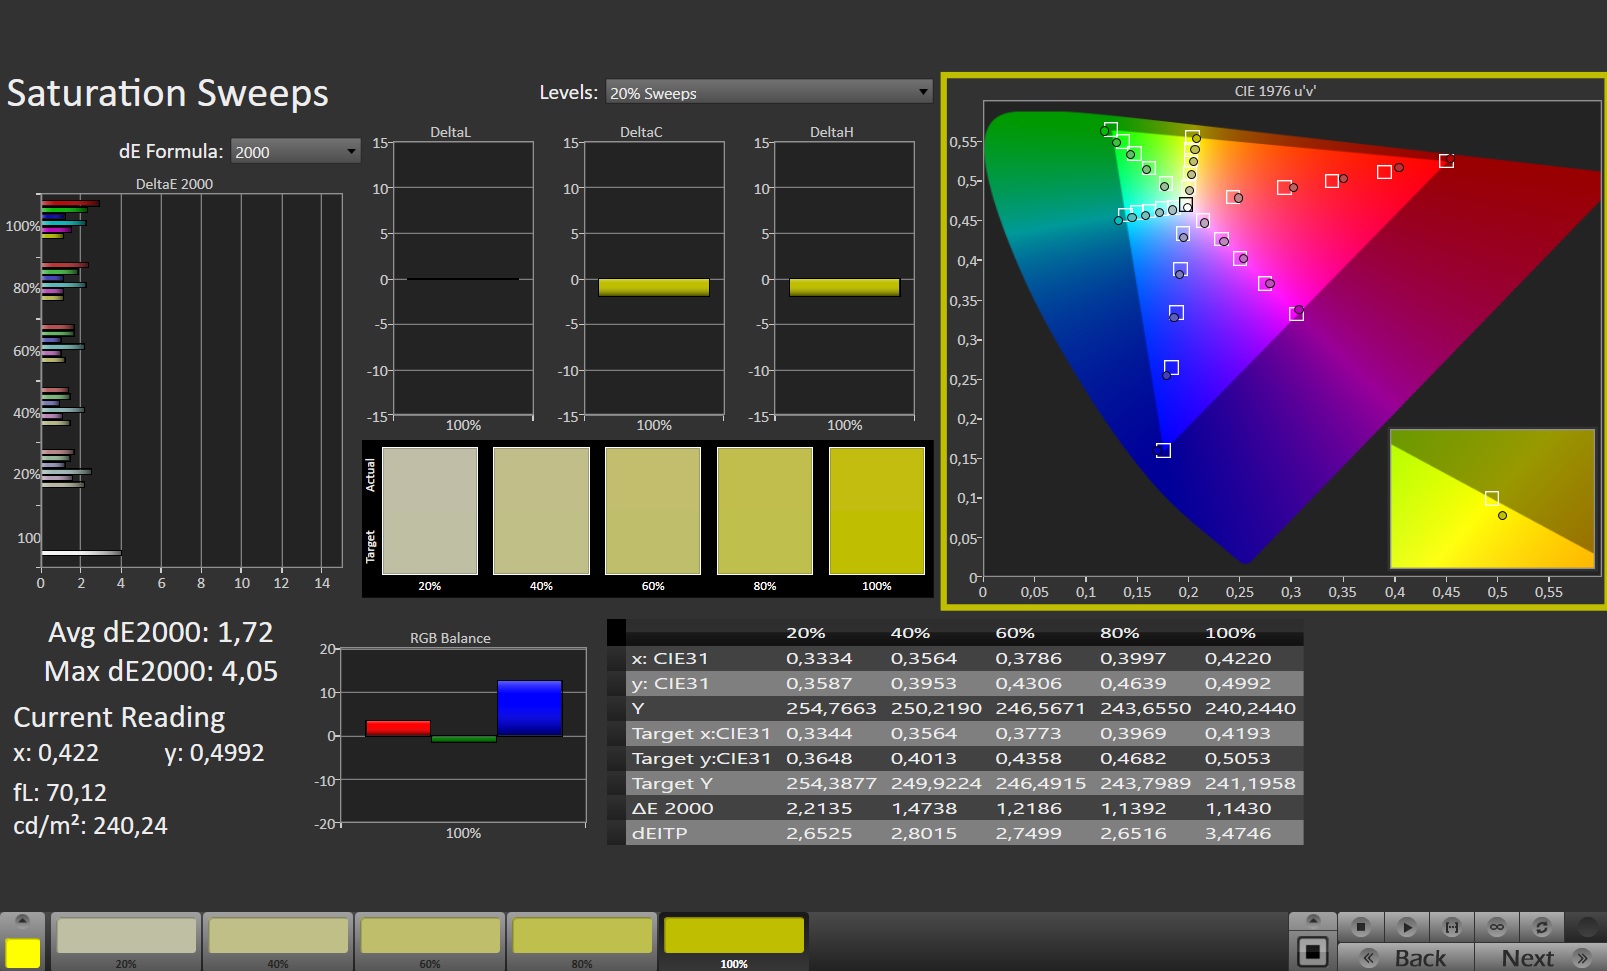
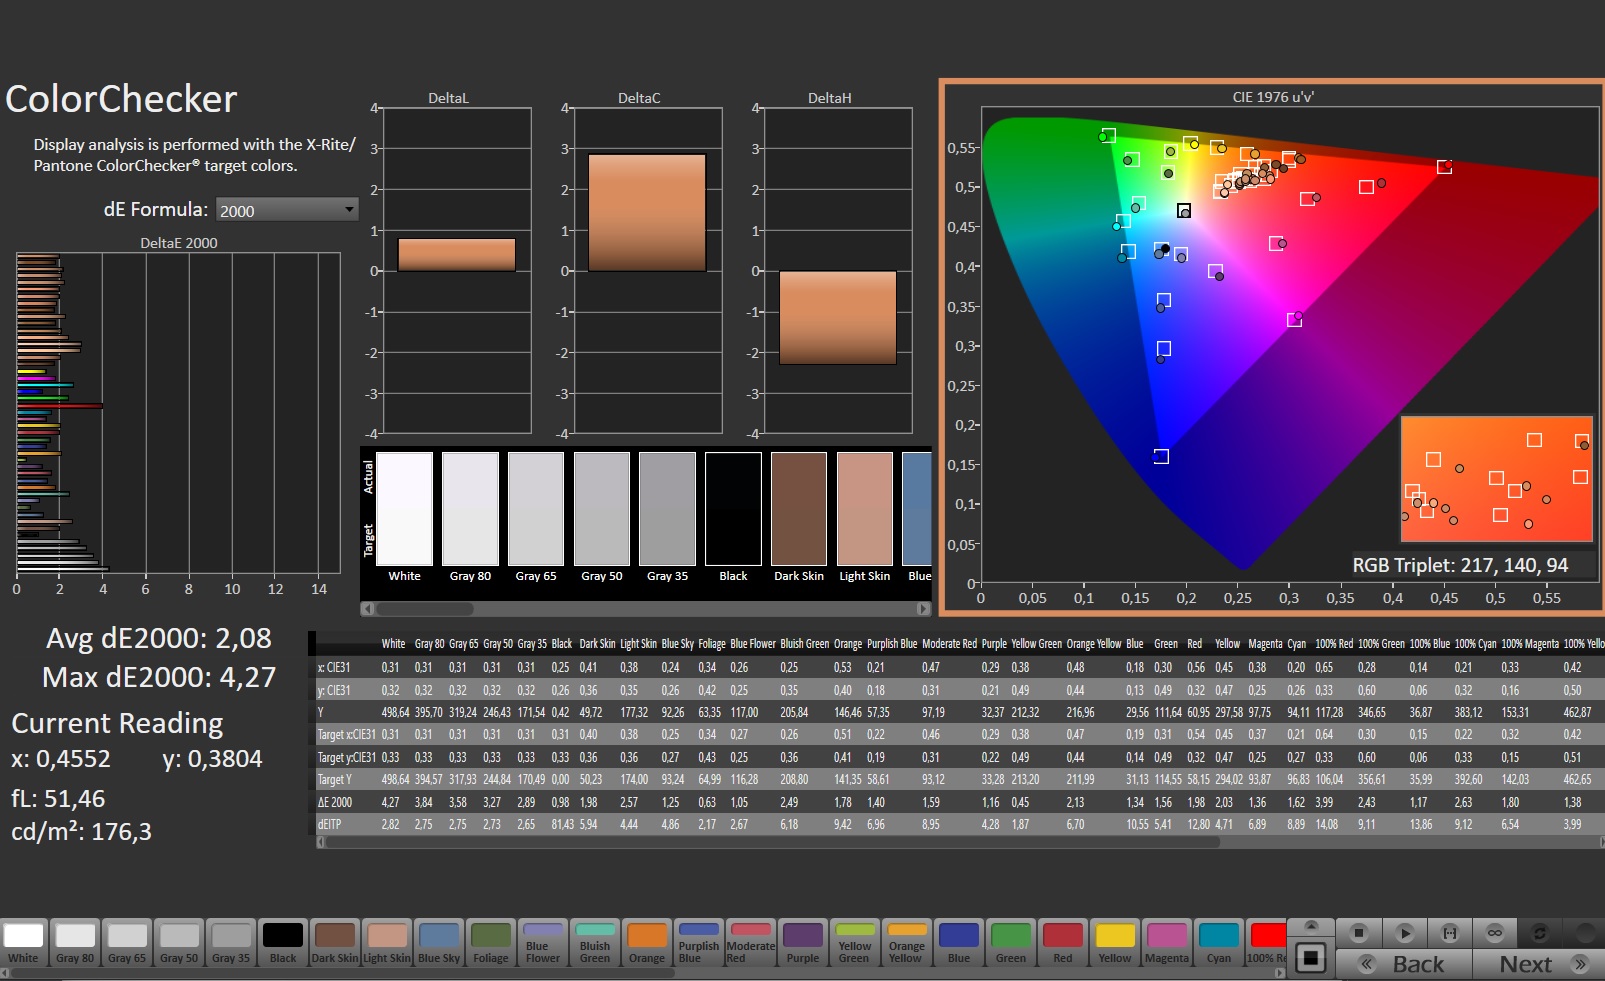
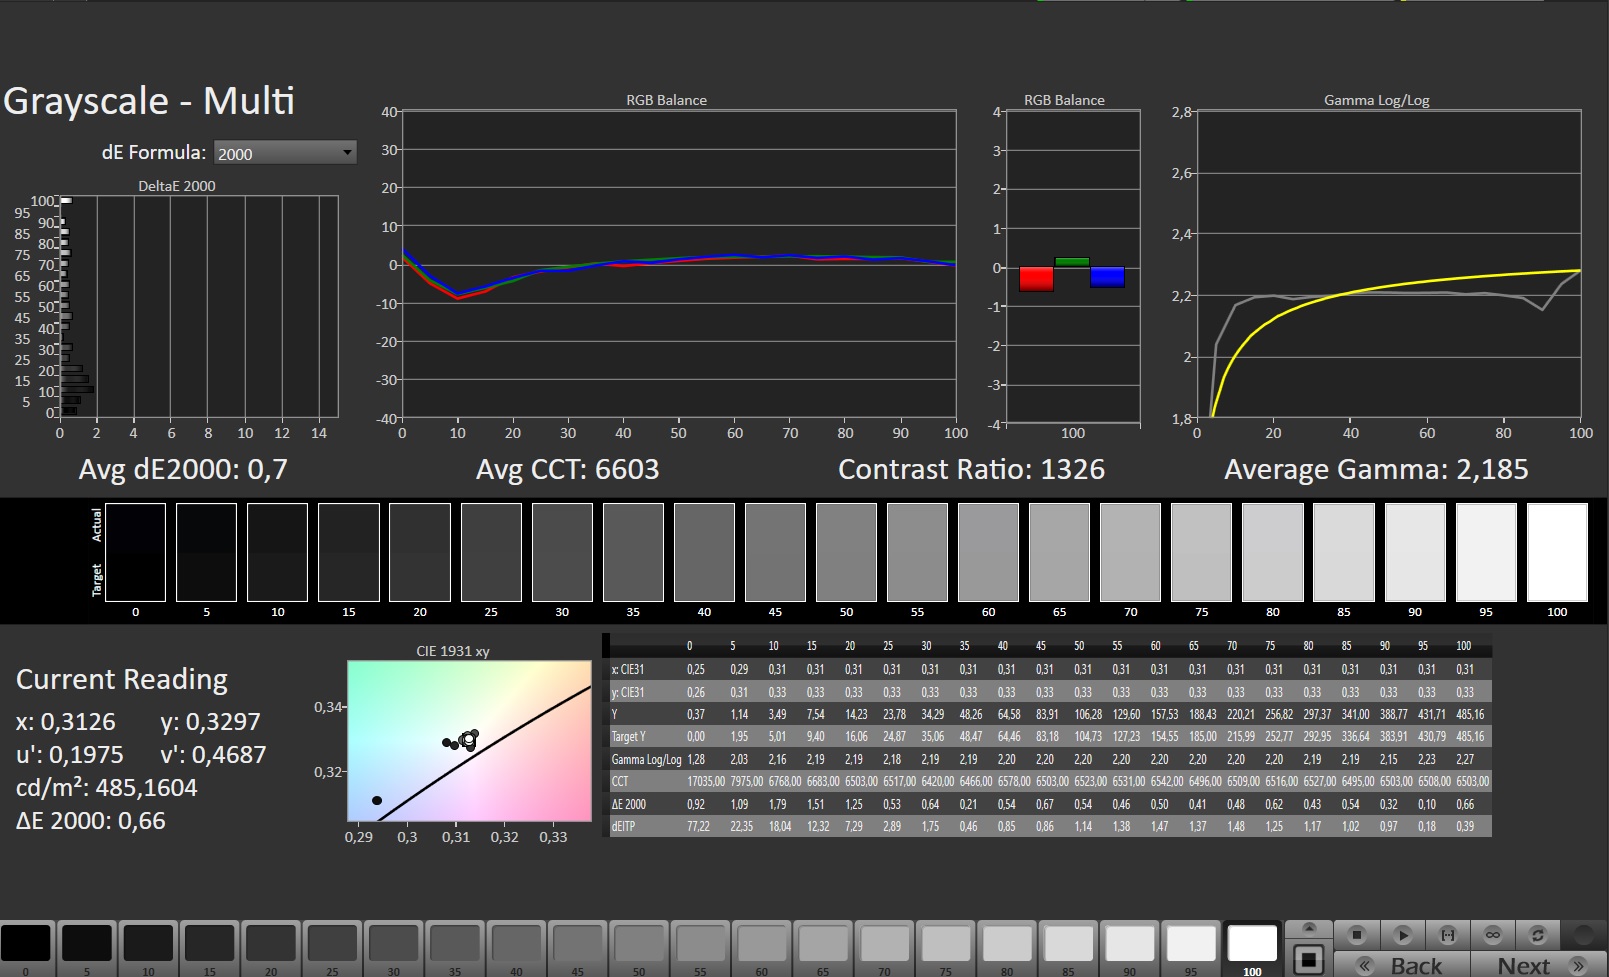
En segundo lugar, el ratio de contraste de 1.233:1 es excelente para un panel IPS. Sin embargo, esto sólo es suficiente para situar al portátil en la mitad de nuestro grupo de comparación. Dicho esto, la pantalla ya es bastante precisa en cuanto al color nada más sacarla de la caja, como muestran las mediciones que hicimos con CalMan (ver capturas). Su cobertura de color debería satisfacer a la mayoría de los consumidores: la cobertura sRGB del 98% es más que suficiente para un portátil de juegos. Y la pantalla es capaz de cubrir hasta el 73% del espacio de color AdobeRGB y el 70% del P3.
El ángulo de visión es el típico de un panel IPS. Nuestro dispositivo de medición informó de tiempos de respuesta de 6 ms (negro a blanco) y 14 ms (gris a gris), lo que tampoco está mal en relación con los otros portátiles de nuestra comparación. Sin embargo, es un poco desafortunado que haya un notable brillo IPS en los bordes. Nuestra unidad de pruebas tenía una distribución de brillo de sólo el 82%.

Tiempos de respuesta del display
| ↔ Tiempo de respuesta de Negro a Blanco | ||
|---|---|---|
| 6.4 ms ... subida ↗ y bajada ↘ combinada | ↗ 2 ms subida | 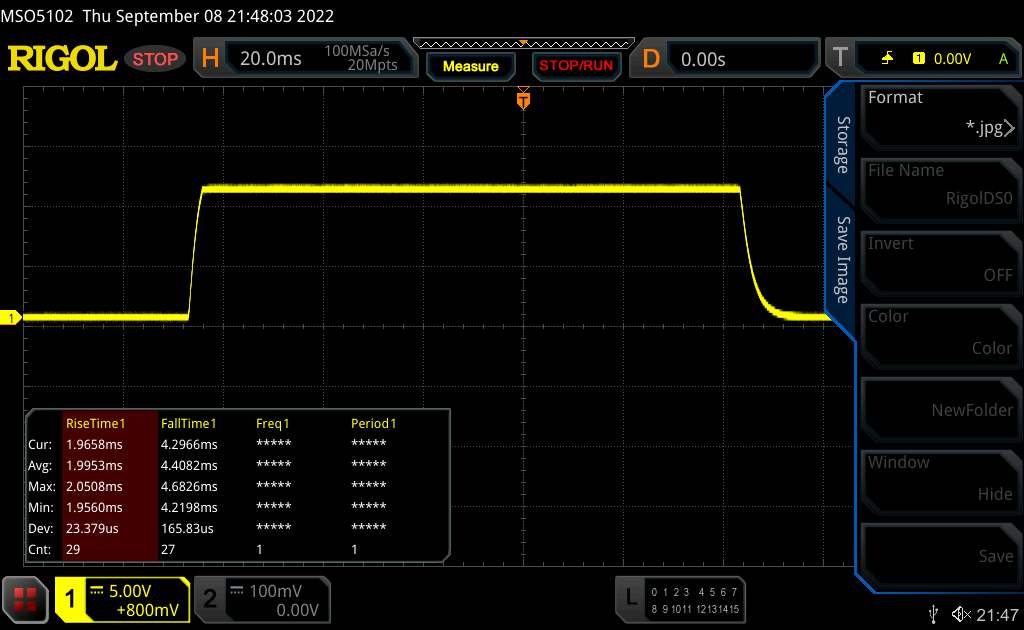 |
| ↘ 4.4 ms bajada | ||
| La pantalla mostró tiempos de respuesta muy rápidos en nuestros tests y debería ser adecuada para juegos frenéticos. En comparación, todos los dispositivos de prueba van de ##min### (mínimo) a 240 (máximo) ms. » 20 % de todos los dispositivos son mejores. Esto quiere decir que el tiempo de respuesta medido es mejor que la media (19.8 ms) de todos los dispositivos testados. | ||
| ↔ Tiempo de respuesta 50% Gris a 80% Gris | ||
| 13.9 ms ... subida ↗ y bajada ↘ combinada | ↗ 6.5 ms subida | 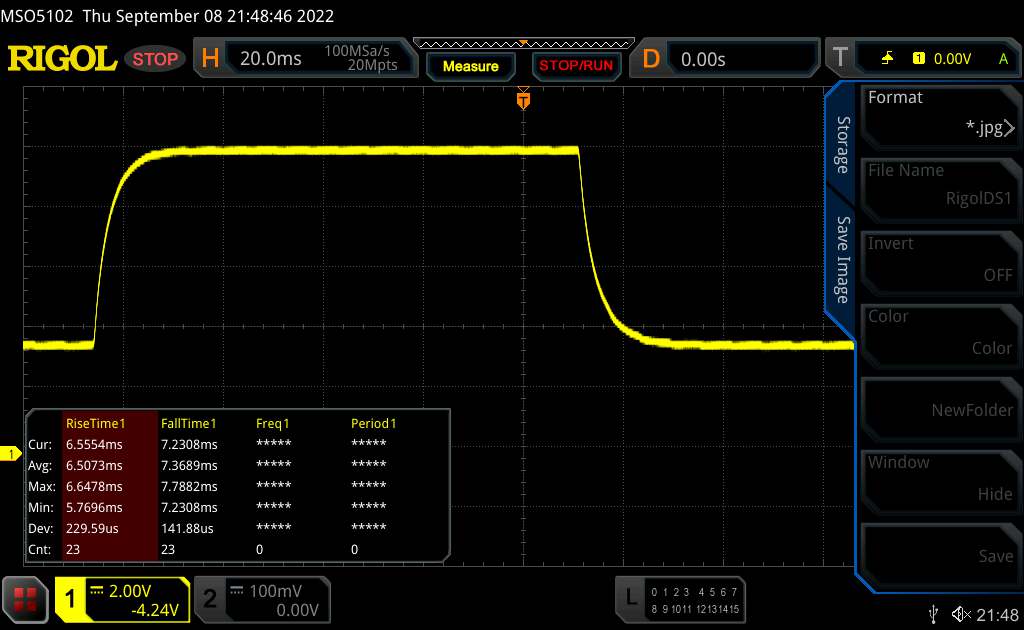 |
| ↘ 7.4 ms bajada | ||
| La pantalla mostró buenos tiempos de respuesta en nuestros tests pero podría ser demasiado lenta para los jugones competitivos. En comparación, todos los dispositivos de prueba van de ##min### (mínimo) a 636 (máximo) ms. » 28 % de todos los dispositivos son mejores. Esto quiere decir que el tiempo de respuesta medido es mejor que la media (31 ms) de todos los dispositivos testados. | ||
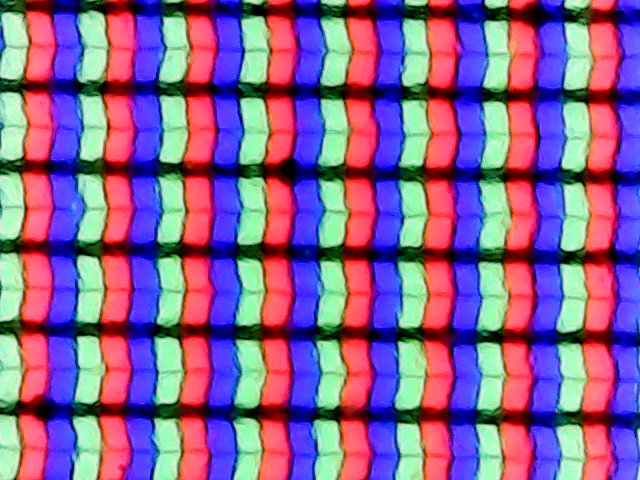
Parpadeo de Pantalla / PWM (Pulse-Width Modulation)
| Parpadeo de Pantalla / PWM no detectado |  | ||
Comparación: 52 % de todos los dispositivos testados no usaron PWM para atenuar el display. Si se usó, medimos una media de 7754 (mínimo: 5 - máxmo: 343500) Hz. | |||
Rendimiento
Aunque tener 32 GB de RAM y 12 GB de VRAM grita gama alta, sólo clasificaríamos el Major X10 como una máquina de gama media debido a su rendimiento gráfico menos que estelar (más adelante, un análisis en profundidad). Con un precio de 1.700 euros (1.728 dólares), el conjunto no puede considerarse una gran oferta.
Condiciones de la prueba
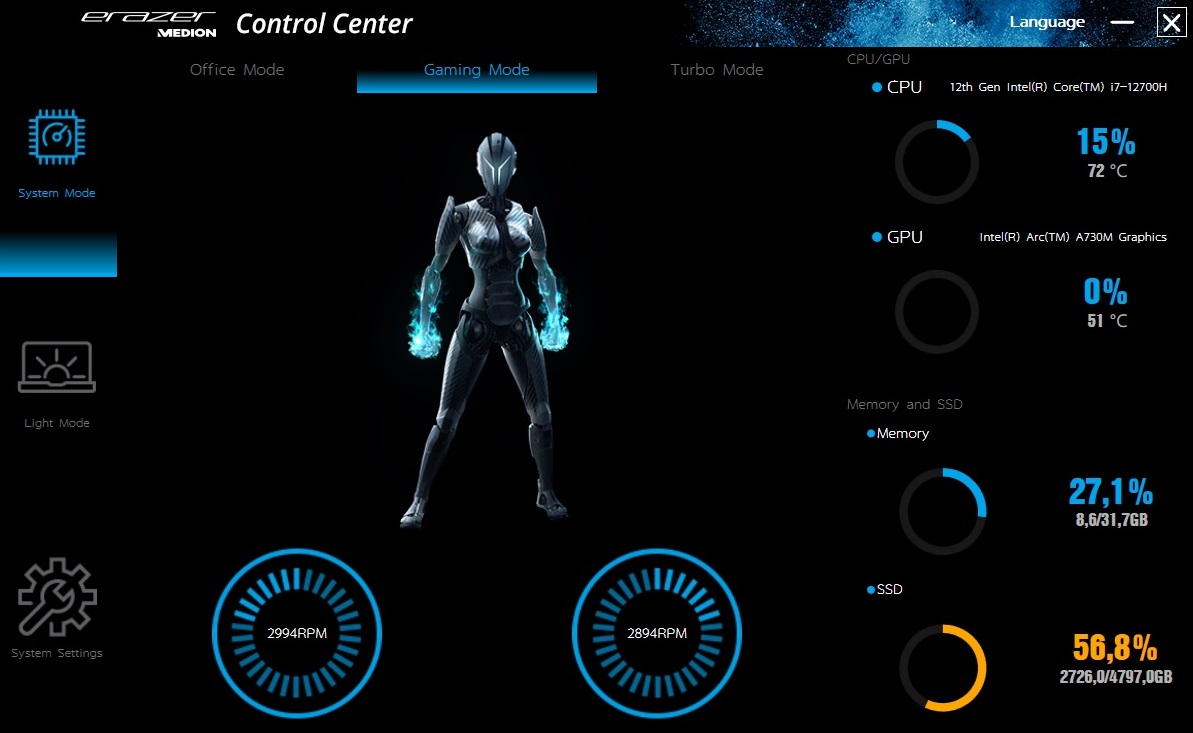
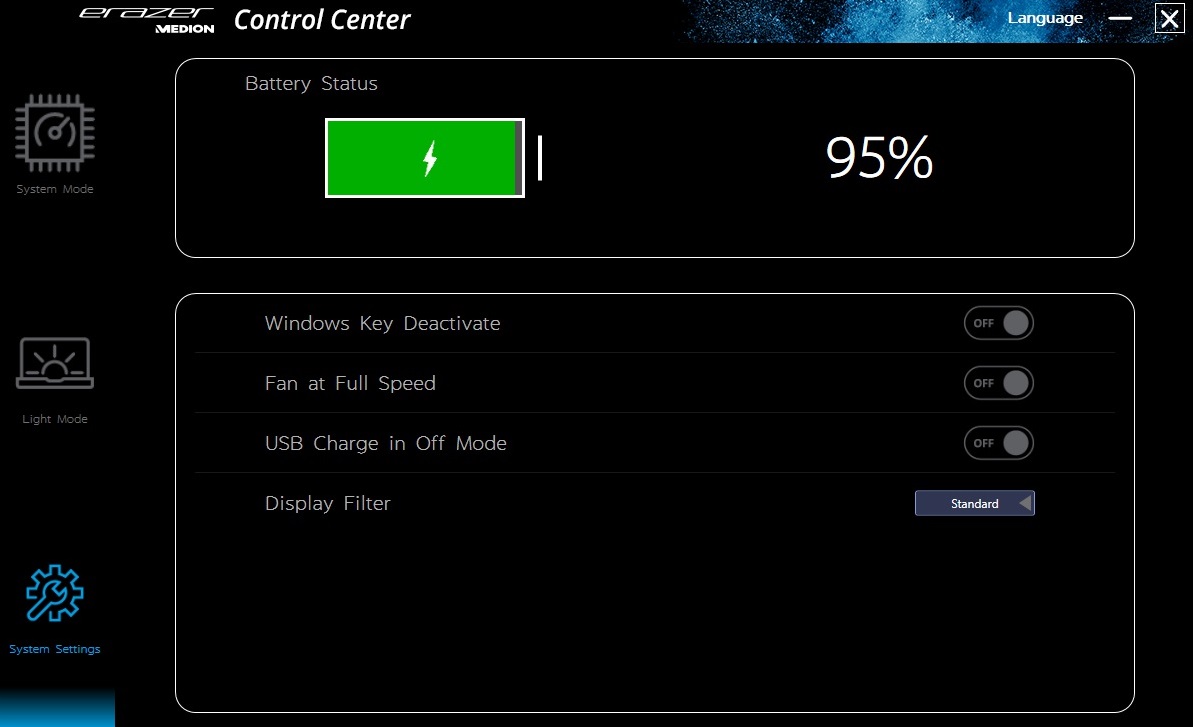
Puedes elegir entre tres perfiles en el software preinstalado del Centro de Control. A menos que se indique lo contrario, las mediciones se tomaron con el Major X10 en modo Gaming, que debería ser similar al modo de rendimiento de otros portátiles. Puedes encontrar los ajustes PL1 y PL2 de los distintos perfiles en la siguiente tabla.
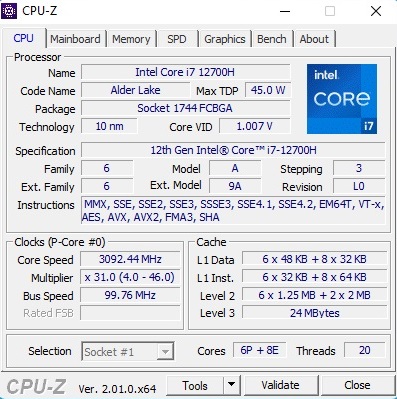
Procesador
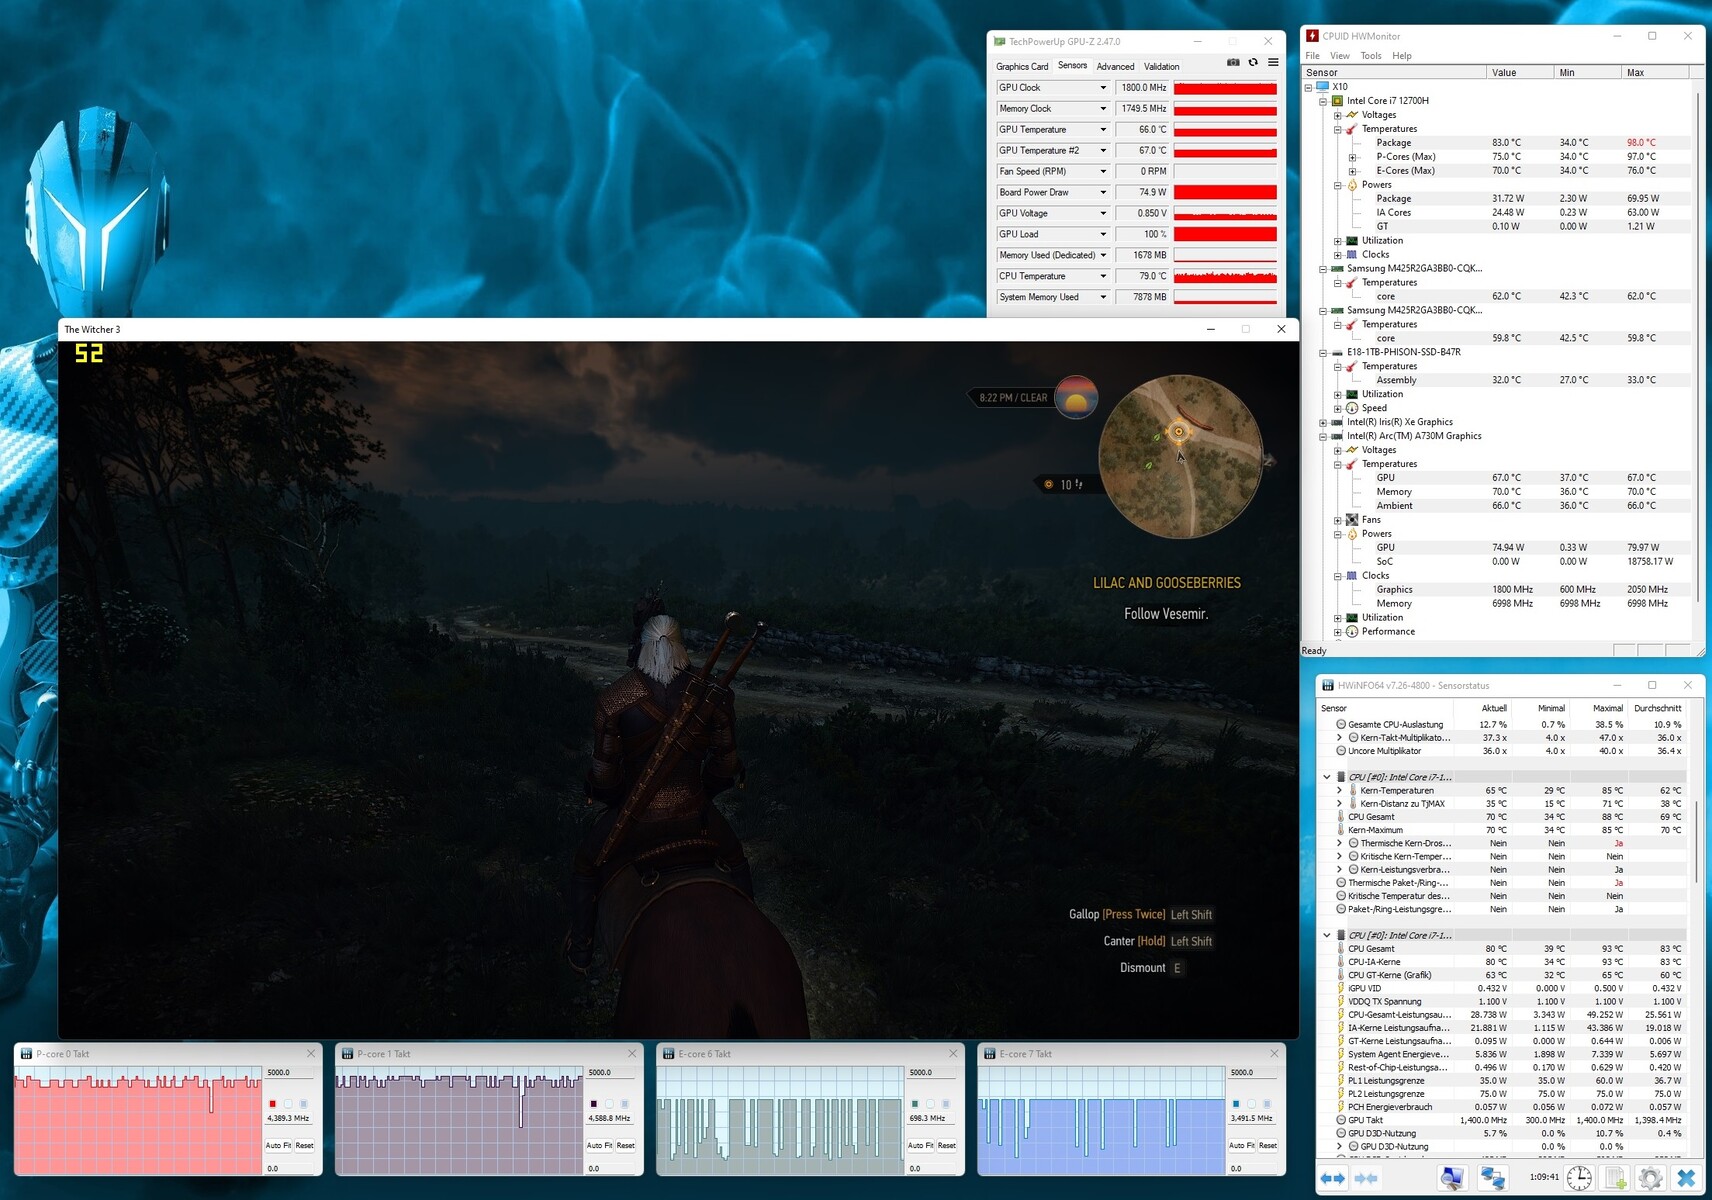
El Core i7-12700H de este portátil Medion es un procesador de 10 nm de última generación de la gama Alder Lake de Intel. La opción de gama alta ofrece 6 núcleos de rendimiento y 8 de eficiencia y puede manejar hasta 20 hilos en paralelo usando Hyper-Threading. En nuestra serie de pruebas de CPU, el Major X10 rindió bien incluso sin el modo Turbo activado. Durante el bucle de Cinebench R15, su rendimiento se estableció en un nivel bastante consistente que es ligeramente superior a lo que son capaces de hacer los rivales del 12700H. Incluso el Ryzen 7 5800H en el HP Omen 16 no puede igualar este nivel de rendimiento.
Cinebench R15 Multi Sustained Load
* ... más pequeño es mejor
AIDA64: FP32 Ray-Trace | FPU Julia | CPU SHA3 | CPU Queen | FPU SinJulia | FPU Mandel | CPU AES | CPU ZLib | FP64 Ray-Trace | CPU PhotoWorxx
| Performance rating | |
| Media de la clase Gaming | |
| HP Omen 16-c0077ng | |
| Dell Inspiron 16 Plus 7620 | |
| Medio Intel Core i7-12700H | |
| Medion Erazer Major X10 | |
| Acer Nitro 5 AN517-55-738R | |
| Asus TUF Gaming F17 FX707Z-HX011W | |
| AIDA64 / FP32 Ray-Trace | |
| Media de la clase Gaming (10227 - 85542, n=105, últimos 2 años) | |
| HP Omen 16-c0077ng | |
| Dell Inspiron 16 Plus 7620 | |
| Medio Intel Core i7-12700H (2585 - 17957, n=64) | |
| Acer Nitro 5 AN517-55-738R | |
| Medion Erazer Major X10 | |
| Asus TUF Gaming F17 FX707Z-HX011W | |
| AIDA64 / FPU Julia | |
| Media de la clase Gaming (51376 - 238426, n=105, últimos 2 años) | |
| HP Omen 16-c0077ng | |
| Dell Inspiron 16 Plus 7620 | |
| Medio Intel Core i7-12700H (12439 - 90760, n=64) | |
| Acer Nitro 5 AN517-55-738R | |
| Medion Erazer Major X10 | |
| Asus TUF Gaming F17 FX707Z-HX011W | |
| AIDA64 / CPU SHA3 | |
| Media de la clase Gaming (2180 - 10115, n=105, últimos 2 años) | |
| HP Omen 16-c0077ng | |
| Medio Intel Core i7-12700H (833 - 4242, n=64) | |
| Dell Inspiron 16 Plus 7620 | |
| Acer Nitro 5 AN517-55-738R | |
| Medion Erazer Major X10 | |
| Asus TUF Gaming F17 FX707Z-HX011W | |
| AIDA64 / CPU Queen | |
| Media de la clase Gaming (49785 - 173351, n=90, últimos 2 años) | |
| Asus TUF Gaming F17 FX707Z-HX011W | |
| HP Omen 16-c0077ng | |
| Acer Nitro 5 AN517-55-738R | |
| Medion Erazer Major X10 | |
| Medio Intel Core i7-12700H (57923 - 103202, n=63) | |
| Dell Inspiron 16 Plus 7620 | |
| AIDA64 / FPU SinJulia | |
| Media de la clase Gaming (4424 - 33636, n=105, últimos 2 años) | |
| HP Omen 16-c0077ng | |
| Medion Erazer Major X10 | |
| Acer Nitro 5 AN517-55-738R | |
| Medio Intel Core i7-12700H (3249 - 9939, n=64) | |
| Dell Inspiron 16 Plus 7620 | |
| Asus TUF Gaming F17 FX707Z-HX011W | |
| AIDA64 / FPU Mandel | |
| Media de la clase Gaming (25115 - 128721, n=105, últimos 2 años) | |
| HP Omen 16-c0077ng | |
| Dell Inspiron 16 Plus 7620 | |
| Medio Intel Core i7-12700H (7135 - 44760, n=64) | |
| Acer Nitro 5 AN517-55-738R | |
| Medion Erazer Major X10 | |
| Asus TUF Gaming F17 FX707Z-HX011W | |
| AIDA64 / CPU AES | |
| HP Omen 16-c0077ng | |
| Media de la clase Gaming (39258 - 247074, n=105, últimos 2 años) | |
| Medio Intel Core i7-12700H (31839 - 144360, n=64) | |
| Dell Inspiron 16 Plus 7620 | |
| Acer Nitro 5 AN517-55-738R | |
| Medion Erazer Major X10 | |
| Asus TUF Gaming F17 FX707Z-HX011W | |
| AIDA64 / CPU ZLib | |
| Media de la clase Gaming (574 - 2531, n=105, últimos 2 años) | |
| Dell Inspiron 16 Plus 7620 | |
| Medio Intel Core i7-12700H (305 - 1171, n=64) | |
| Medion Erazer Major X10 | |
| Acer Nitro 5 AN517-55-738R | |
| HP Omen 16-c0077ng | |
| Asus TUF Gaming F17 FX707Z-HX011W | |
| AIDA64 / FP64 Ray-Trace | |
| Media de la clase Gaming (5509 - 45446, n=105, últimos 2 años) | |
| HP Omen 16-c0077ng | |
| Dell Inspiron 16 Plus 7620 | |
| Medio Intel Core i7-12700H (1437 - 9692, n=64) | |
| Acer Nitro 5 AN517-55-738R | |
| Medion Erazer Major X10 | |
| Asus TUF Gaming F17 FX707Z-HX011W | |
| AIDA64 / CPU PhotoWorxx | |
| Media de la clase Gaming (12271 - 89891, n=105, últimos 2 años) | |
| Medion Erazer Major X10 | |
| Dell Inspiron 16 Plus 7620 | |
| Medio Intel Core i7-12700H (12863 - 52207, n=64) | |
| Asus TUF Gaming F17 FX707Z-HX011W | |
| HP Omen 16-c0077ng | |
| Acer Nitro 5 AN517-55-738R | |
Rendimiento del sistema
En cuanto al rendimiento del sistema, el portátil de 16 pulgadas ocupó el tercer lugar en nuestra comparación con una excelente puntuación de 6.830 en PCMark. Basándonos en nuestra impresión subjetiva, el sistema operativo es sensible y fluido.
CrossMark: Overall | Productivity | Creativity | Responsiveness
| PCMark 10 / Score | |
| Media de la clase Gaming (5828 - 12414, n=93, últimos 2 años) | |
| HP Omen 16-c0077ng | |
| Dell Inspiron 16 Plus 7620 | |
| Medio Intel Core i7-12700H, Intel Arc A730M (6830 - 6845, n=2) | |
| Medion Erazer Major X10 | |
| Acer Nitro 5 AN517-55-738R | |
| Asus TUF Gaming F17 FX707Z-HX011W | |
| PCMark 10 / Essentials | |
| Medion Erazer Major X10 | |
| Medio Intel Core i7-12700H, Intel Arc A730M (10529 - 11116, n=2) | |
| Media de la clase Gaming (8810 - 11935, n=97, últimos 2 años) | |
| HP Omen 16-c0077ng | |
| Dell Inspiron 16 Plus 7620 | |
| Acer Nitro 5 AN517-55-738R | |
| Asus TUF Gaming F17 FX707Z-HX011W | |
| PCMark 10 / Productivity | |
| Media de la clase Gaming (6845 - 25323, n=95, últimos 2 años) | |
| HP Omen 16-c0077ng | |
| Acer Nitro 5 AN517-55-738R | |
| Dell Inspiron 16 Plus 7620 | |
| Medion Erazer Major X10 | |
| Medio Intel Core i7-12700H, Intel Arc A730M (7070 - 7260, n=2) | |
| Asus TUF Gaming F17 FX707Z-HX011W | |
| PCMark 10 / Digital Content Creation | |
| Media de la clase Gaming (7602 - 19954, n=95, últimos 2 años) | |
| Medio Intel Core i7-12700H, Intel Arc A730M (10714 - 11691, n=2) | |
| Medion Erazer Major X10 | |
| HP Omen 16-c0077ng | |
| Asus TUF Gaming F17 FX707Z-HX011W | |
| Dell Inspiron 16 Plus 7620 | |
| Acer Nitro 5 AN517-55-738R | |
| CrossMark / Overall | |
| Media de la clase Gaming (1366 - 2409, n=94, últimos 2 años) | |
| Medio Intel Core i7-12700H, Intel Arc A730M (n=1) | |
| Acer Nitro 5 AN517-55-738R | |
| Dell Inspiron 16 Plus 7620 | |
| Asus TUF Gaming F17 FX707Z-HX011W | |
| CrossMark / Productivity | |
| Media de la clase Gaming (1386 - 2254, n=94, últimos 2 años) | |
| Medio Intel Core i7-12700H, Intel Arc A730M (n=1) | |
| Acer Nitro 5 AN517-55-738R | |
| Dell Inspiron 16 Plus 7620 | |
| Asus TUF Gaming F17 FX707Z-HX011W | |
| CrossMark / Creativity | |
| Media de la clase Gaming (1343 - 2786, n=94, últimos 2 años) | |
| Asus TUF Gaming F17 FX707Z-HX011W | |
| Medio Intel Core i7-12700H, Intel Arc A730M (n=1) | |
| Dell Inspiron 16 Plus 7620 | |
| Acer Nitro 5 AN517-55-738R | |
| CrossMark / Responsiveness | |
| Medio Intel Core i7-12700H, Intel Arc A730M (n=1) | |
| Acer Nitro 5 AN517-55-738R | |
| Media de la clase Gaming (1226 - 2334, n=94, últimos 2 años) | |
| Dell Inspiron 16 Plus 7620 | |
| Asus TUF Gaming F17 FX707Z-HX011W | |
| PCMark 10 Score | 6830 puntos | |
ayuda | ||
| AIDA64 / Memory Copy | |
| Media de la clase Gaming (21750 - 129946, n=105, últimos 2 años) | |
| Medion Erazer Major X10 | |
| Dell Inspiron 16 Plus 7620 | |
| Medio Intel Core i7-12700H (25615 - 80511, n=64) | |
| Asus TUF Gaming F17 FX707Z-HX011W | |
| Acer Nitro 5 AN517-55-738R | |
| HP Omen 16-c0077ng | |
| AIDA64 / Memory Read | |
| Media de la clase Gaming (22956 - 118858, n=105, últimos 2 años) | |
| Medion Erazer Major X10 | |
| Asus TUF Gaming F17 FX707Z-HX011W | |
| Dell Inspiron 16 Plus 7620 | |
| Medio Intel Core i7-12700H (25586 - 79442, n=64) | |
| HP Omen 16-c0077ng | |
| Acer Nitro 5 AN517-55-738R | |
| AIDA64 / Memory Write | |
| Media de la clase Gaming (22297 - 135096, n=105, últimos 2 años) | |
| Medion Erazer Major X10 | |
| Asus TUF Gaming F17 FX707Z-HX011W | |
| Dell Inspiron 16 Plus 7620 | |
| Medio Intel Core i7-12700H (23679 - 88660, n=64) | |
| Acer Nitro 5 AN517-55-738R | |
| HP Omen 16-c0077ng | |
| AIDA64 / Memory Latency | |
| Media de la clase Gaming (75.3 - 259, n=105, últimos 2 años) | |
| Dell Inspiron 16 Plus 7620 | |
| HP Omen 16-c0077ng | |
| Medio Intel Core i7-12700H (76.2 - 133.9, n=62) | |
| Asus TUF Gaming F17 FX707Z-HX011W | |
| Acer Nitro 5 AN517-55-738R | |
* ... más pequeño es mejor
Latencia del CPD
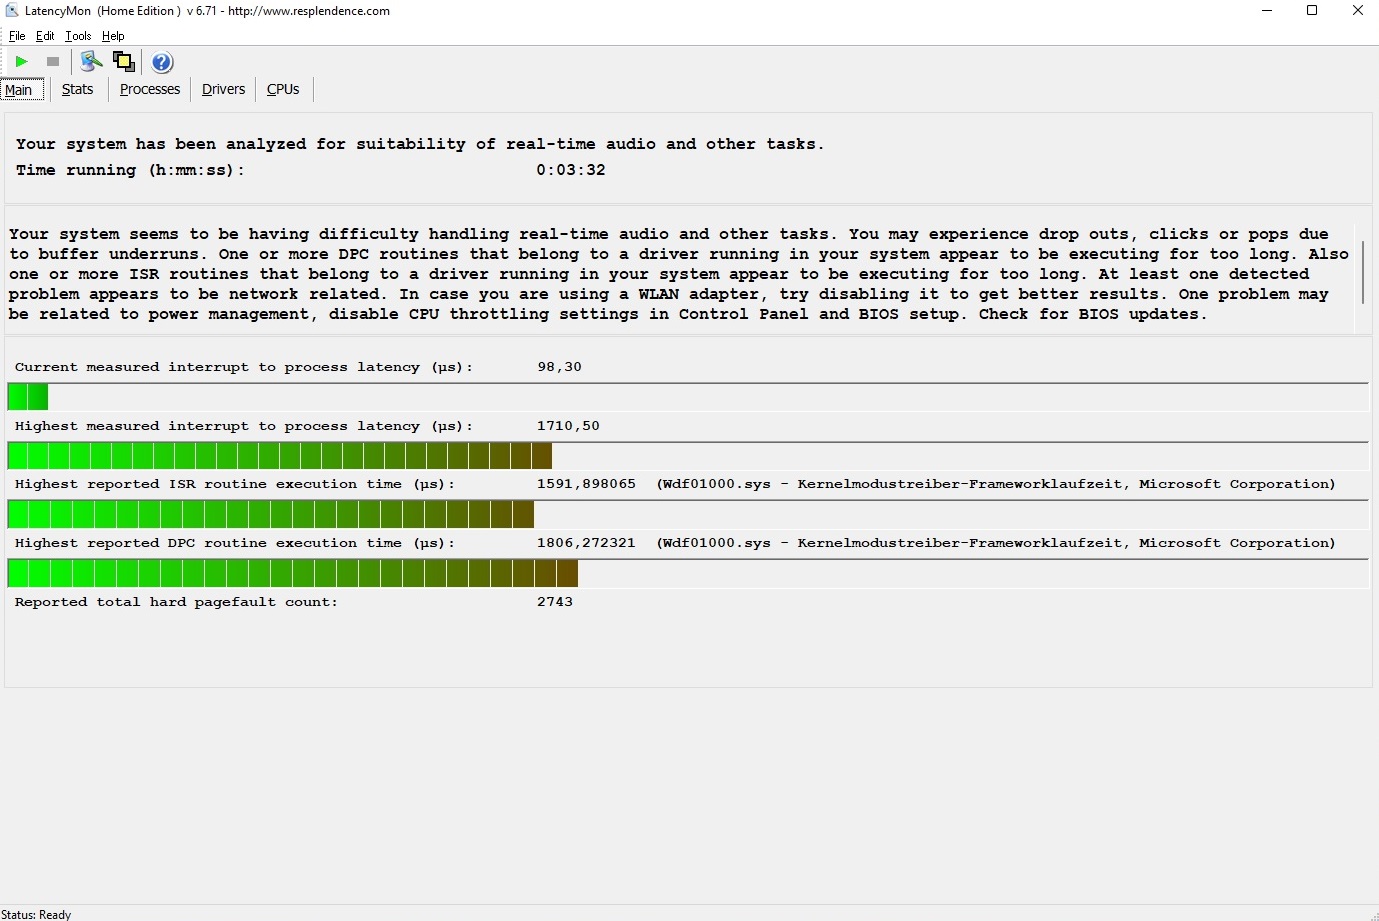
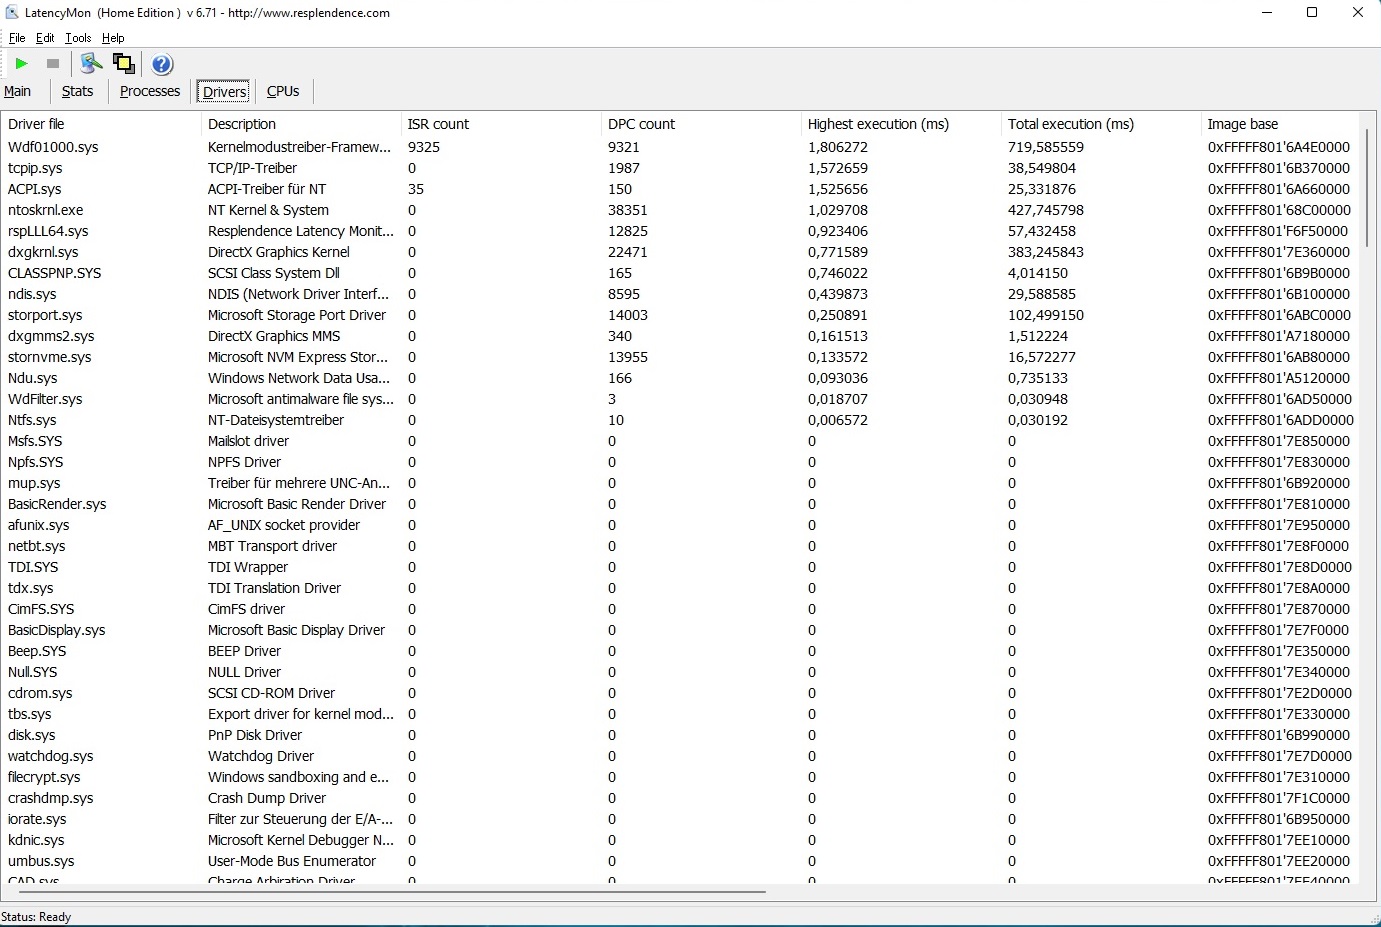
Como suele ocurrir con los portátiles, el Major X10 tiene algunos problemas de latencia. Según LatencyMon, el portátil sólo es adecuado para el procesamiento de audio y vídeo en tiempo real de forma limitada.
| DPC Latencies / LatencyMon - interrupt to process latency (max), Web, Youtube, Prime95 | |
| Asus TUF Gaming F17 FX707Z-HX011W | |
| HP Omen 16-c0077ng | |
| Medion Erazer Major X10 | |
| Acer Nitro 5 AN517-55-738R | |
| Dell Inspiron 16 Plus 7620 | |
* ... más pequeño es mejor
Almacenamiento masivo
El Major X10 alberga un SSD NVMe con una velocidad superior a la media que pondrá nerviosos a los competidores. Tiene una excelente velocidad de lectura y escritura secuencial de más de 5.000 MB/s y 4.000 MB/s respectivamente (obtenida utilizando AS SSD Benchmark). También hay una segunda ranura PCIe M.2 para que puedas ampliar cómodamente el almacenamiento si lo necesitas en el futuro.

| Drive Performance rating - Percent | |
| Medion Erazer Major X10 | |
| Media de la clase Gaming | |
| Acer Nitro 5 AN517-55-738R | |
| HP Omen 16-c0077ng | |
| Asus TUF Gaming F17 FX707Z-HX011W | |
| Dell Inspiron 16 Plus 7620 | |
* ... más pequeño es mejor
Sustained Performance Read: DiskSpd Read Loop, Queue Depth 8
Tarjeta gráfica
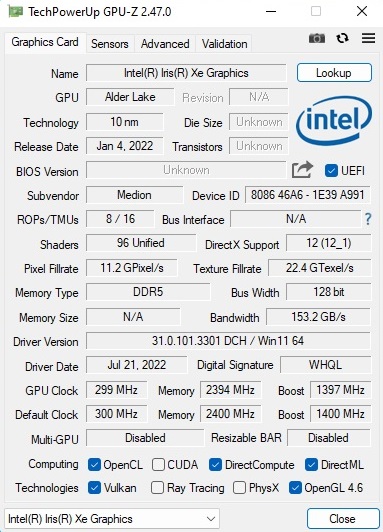
Hemos llegado a la parte más interesante del Major X10: su tarjeta gráfica. Es la primera vez que una Intel Arc A730M (24 núcleos Xe y 24 unidades Ray Tracing) aterriza en nuestro banco de pruebas. La GPU Intel tiene un gran rendimiento cuando se trata de pruebas de gráficos sintéticos. En las pruebas de 3DMark, supera significativamente a la GeForce RTX 3050 Ti y está al mismo nivel que la GeForce RTX 3060 y la Radeon RX 6600M. Con el modo Turbo activado, el portátil Medion fue capaz de obtener casi un 20% más de rendimiento de la GPU y superar a los demás dispositivos de nuestra comparación. Se pueden encontrar más resultados de los benchmarks en nuestra página sobre el Arc A730M.
| 3DMark Performance rating - Percent | |
| Media de la clase Gaming | |
| Medion Erazer Major X10 Turbo Mode | |
| HP Omen 16-c0077ng -1! | |
| Asus TUF Gaming F17 FX707Z-HX011W -1! | |
| Medio Intel Arc A730M | |
| Acer Nitro 5 AN517-55-738R | |
| Medion Erazer Major X10 | |
| Dell Inspiron 16 Plus 7620 -1! | |
| 3DMark 11 - 1280x720 Performance GPU | |
| Media de la clase Gaming (21841 - 80022, n=104, últimos 2 años) | |
| HP Omen 16-c0077ng | |
| Medion Erazer Major X10 Turbo Mode | |
| Asus TUF Gaming F17 FX707Z-HX011W | |
| Medio Intel Arc A730M (24928 - 31551, n=4) | |
| Acer Nitro 5 AN517-55-738R | |
| Medion Erazer Major X10 | |
| Dell Inspiron 16 Plus 7620 | |
| 3DMark | |
| 1920x1080 Fire Strike Graphics | |
| Media de la clase Gaming (12242 - 62849, n=115, últimos 2 años) | |
| HP Omen 16-c0077ng | |
| Asus TUF Gaming F17 FX707Z-HX011W | |
| Medion Erazer Major X10 Turbo Mode | |
| Acer Nitro 5 AN517-55-738R | |
| Medio Intel Arc A730M (19850 - 22620, n=4) | |
| Medion Erazer Major X10 | |
| Dell Inspiron 16 Plus 7620 | |
| 2560x1440 Time Spy Graphics | |
| Media de la clase Gaming (5012 - 26212, n=115, últimos 2 años) | |
| Medion Erazer Major X10 Turbo Mode | |
| Asus TUF Gaming F17 FX707Z-HX011W | |
| Medio Intel Arc A730M (7212 - 10352, n=4) | |
| Medion Erazer Major X10 | |
| Acer Nitro 5 AN517-55-738R | |
| HP Omen 16-c0077ng | |
| Dell Inspiron 16 Plus 7620 | |
| 2560x1440 Port Royal Graphics | |
| Media de la clase Gaming (4395 - 17286, n=71, últimos 2 años) | |
| Medion Erazer Major X10 Turbo Mode | |
| Acer Nitro 5 AN517-55-738R | |
| Medio Intel Arc A730M (3758 - 5678, n=3) | |
| Medion Erazer Major X10 | |
| 3DMark 06 Standard Score | 46579 puntos | |
| 3DMark Vantage P Result | 63844 puntos | |
| 3DMark 11 Performance | 24223 puntos | |
| 3DMark Ice Storm Standard Score | 119799 puntos | |
| 3DMark Cloud Gate Standard Score | 44757 puntos | |
| 3DMark Fire Strike Score | 18543 puntos | |
| 3DMark Time Spy Score | 9041 puntos | |
ayuda | ||
Rendimiento de los juegos
Por el contrario, la GPU presenta una imagen muy variada en las pruebas de juego. Aunque el Arc A730M es capaz de desafiar a veces a la RTX 3060 y la RX 6600M, con frecuencia sólo ronda el nivel de rendimiento de la GeForce RTX 3050 Ti, que suele encontrarse en portátiles de juego mucho más baratos. En el peor de los casos, el Arc A730M es incluso más lento que la RTX 3050 Ti. Esto es bastante decepcionante teniendo en cuenta el precio y las especificaciones de la GPU (12 GB frente a 4 GB de VRAM). Intel debería seguir mejorando el soporte de los drivers. Al igual que hemos visto en las iGPUs, algunos juegos se ejecutaron con artefactos visuales u otros problemas varios. También hemos tenido que lidiar con fallos ocasionales. Dicho esto, el cambio de gráficos parece funcionar bien. Todos los juegos utilizados en nuestras pruebas se asignaron directamente a la dGPU. Fundamentalmente, el Arc A730M está más o menos diseñado para pantallas Full HD. Con una resolución de 1.920 x 1.080, casi todos los juegos se ejecutaron sin problemas con los detalles configurados en alto o muy alto. Mientras tanto, las resoluciones más altas (como la nativa de 2.560 x 1.600) llevan a la GPU Intel a sus límites. Para más comparaciones de GPU, puedes consultar nuestra lista de juegos en https://www.notebookcheck.net/Computer-Games-on-Laptop-Graphics-Cards.13849.0.html.
| The Witcher 3 | |
| 1920x1080 High Graphics & Postprocessing (Nvidia HairWorks Off) | |
| Media de la clase Gaming (341 - 404, n=2, últimos 2 años) | |
| Asus TUF Gaming F17 FX707Z-HX011W | |
| Acer Nitro 5 AN517-55-738R | |
| HP Omen 16-c0077ng | |
| Medion Erazer Major X10 | |
| Dell Inspiron 16 Plus 7620 | |
| 1920x1080 Ultra Graphics & Postprocessing (HBAO+) | |
| Media de la clase Gaming (104.7 - 240, n=7, últimos 2 años) | |
| Asus TUF Gaming F17 FX707Z-HX011W | |
| HP Omen 16-c0077ng | |
| Acer Nitro 5 AN517-55-738R | |
| Dell Inspiron 16 Plus 7620 | |
| Medion Erazer Major X10 | |
Corrimos El Witcher 3en el portátil durante una hora para comprobar si el rendimiento 3D se mantiene durante un período más largo. El resultado: no hubo caídas de rendimiento ni problemas similares.
Witcher 3 FPS graph
| bajo | medio | alto | ultra | QHD | |
|---|---|---|---|---|---|
| GTA V (2015) | 165.9 | 100.3 | 42.8 | ||
| The Witcher 3 (2015) | 212 | 114 | 49.4 | ||
| Dota 2 Reborn (2015) | 109.3 | 94.2 | 90.4 | 80.4 | |
| Final Fantasy XV Benchmark (2018) | 71 | 49.7 | |||
| X-Plane 11.11 (2018) | 57.3 | 47.1 | 38.6 | ||
| Far Cry 5 (2018) | 92 | 83 | 78 | ||
| Strange Brigade (2018) | 178.2 | 148.8 | 124.1 | ||
| Hunt Showdown (2020) | 88.2 | 72.3 | 50.1 | ||
| Doom Eternal (2020) | 112.4 | 104.2 | 101.7 | 70.9 | |
| Gears Tactics (2020) | 147 | 99.2 | 79.7 | 52 | |
| Death Stranding (2020) | 89.8 | 82.9 | 81.9 | 60 | |
| Crysis Remastered (2020) | 125.4 | 60.7 | 50.1 | 34.8 | |
| Serious Sam 4 (2020) | 72.7 | 54.8 | 42.5 | 34.7 | |
| Mafia Definitive Edition (2020) | 55.4 | 52.7 | 36.9 | ||
| Star Wars Squadrons (2020) | 167.1 | 149.4 | 140.6 | 97.4 | |
| Watch Dogs Legion (2020) | 85 | 75 | 48 | 35 | |
| Dirt 5 (2020) | 80.6 | 64.5 | 54 | 44.2 | |
| Assassin´s Creed Valhalla (2020) | 64 | 54 | 48 | 37 | |
| Yakuza Like a Dragon (2020) | 51.3 | 47.3 | 46.1 | 39.4 | |
| Hitman 3 (2021) | 123 | 109 | 102 | 65 | |
| Outriders (2021) | 90 | 76.1 | 69 | 43.9 | |
| Resident Evil Village (2021) | 119.9 | 107.8 | 93.3 | 61.1 | |
| Mass Effect Legendary Edition (2021) | 88.5 | 81.9 | |||
| Days Gone (2021) | 80.2 | 76 | 58.2 | 42 | |
| Deathloop (2021) | 76.2 | 65.5 | 54.6 | 37 | |
| Alan Wake Remastered (2021) | 116.7 | 98.6 | 67.5 | ||
| Far Cry 6 (2021) | 87 | 75 | 65 | 47 | |
| Back 4 Blood (2021) | 132.9 | 115.4 | 105.9 | 68.3 | |
| Guardians of the Galaxy (2021) | 81 | 76 | 73 | 52 | |
| Riders Republic (2021) | 60 | 51 | 47 | 34 | |
| Forza Horizon 5 (2021) | 86 | 80 | 50 | 41 | |
| Farming Simulator 22 (2021) | 136.6 | 110.8 | 107.2 | 80.5 | |
| Halo Infinite (2021) | 67.2 | 59.8 | 56.2 | 42.3 | |
| God of War (2022) | 53.1 | 44.9 | 36.9 | 30.7 | |
| Rainbow Six Extraction (2022) | 103 | 99 | 83 | 55 | |
| Dying Light 2 (2022) | 60.9 | 51.2 | 35.6 | ||
| GRID Legends (2022) | 109 | 91 | 71 | 56.9 | |
| Elden Ring (2022) | 59.9 | 59.7 | 56.9 | 46.2 | |
| Cyberpunk 2077 1.6 (2022) | 71 | 57.5 | 57.4 | 30.9 | |
| Elex 2 (2022) | 49.7 | 48.8 | 43.3 | 36.5 | |
| Ghostwire Tokyo (2022) | 85.4 | 83.6 | 83.3 | 52.3 | |
| Tiny Tina's Wonderlands (2022) | 86.6 | 64.6 | 52 | 35.5 | |
| Vampire Bloodhunt (2022) | 135.8 | 121.5 | 111.9 | 71.4 | |
| F1 22 (2022) | 124 | 104 | 35 | 23.4 | |
| The Quarry (2022) | 58.9 | 47.5 | 38.1 | 24.8 |
Emisiones
Emisiones acústicas
El Major X10 es claramente audible cuando funciona en modo Gaming. Los niveles de ruido pueden alcanzar de 49 a 51 dB(A) bajo carga, lo que muchos usuarios probablemente considerarán molesto. Dicho esto, otros portátiles para juegos pueden ser tan ruidosos o incluso más que el Major X10. Recomendamos usar auriculares. En reposo, puedes esperar que el dispositivo produzca entre 30 y 31 dB(A) de ruido, lo que es bastante perceptible pero no especialmente silencioso. El portátil de 16 pulgadas rara vez es completamente silencioso ya que los ventiladores suelen estar en funcionamiento.
Ruido
| Ocioso |
| 25 / 30 / 31 dB(A) |
| Carga |
| 49 / 51 dB(A) |
 | ||
30 dB silencioso 40 dB(A) audible 50 dB(A) ruidosamente alto |
||
min: | ||
| Medion Erazer Major X10 i7-12700H, A730M | Asus TUF Gaming F17 FX707Z-HX011W i7-12700H, GeForce RTX 3060 Laptop GPU | Acer Nitro 5 AN517-55-738R i7-12700H, GeForce RTX 3060 Laptop GPU | Dell Inspiron 16 Plus 7620 i7-12700H, GeForce RTX 3050 Ti Laptop GPU | HP Omen 16-c0077ng R7 5800H, Radeon RX 6600M | |
|---|---|---|---|---|---|
| Noise | 11% | -3% | 4% | -6% | |
| apagado / medio ambiente * (dB) | 25 | 24 4% | 25.5 -2% | 23.3 7% | 25 -0% |
| Idle Minimum * (dB) | 25 | 24 4% | 25.5 -2% | 25.7 -3% | 25 -0% |
| Idle Average * (dB) | 30 | 24 20% | 25.5 15% | 26.1 13% | 31.2 -4% |
| Idle Maximum * (dB) | 31 | 24 23% | 27 13% | 30.6 1% | 33.8 -9% |
| Load Average * (dB) | 49 | 42.6 13% | 52.6 -7% | 46.2 6% | 55.4 -13% |
| Witcher 3 ultra * (dB) | 50 | 46.84 6% | 49.2 2% | ||
| Load Maximum * (dB) | 51 | 46.84 8% | 68.2 -34% | 49.4 3% | 56 -10% |
* ... más pequeño es mejor
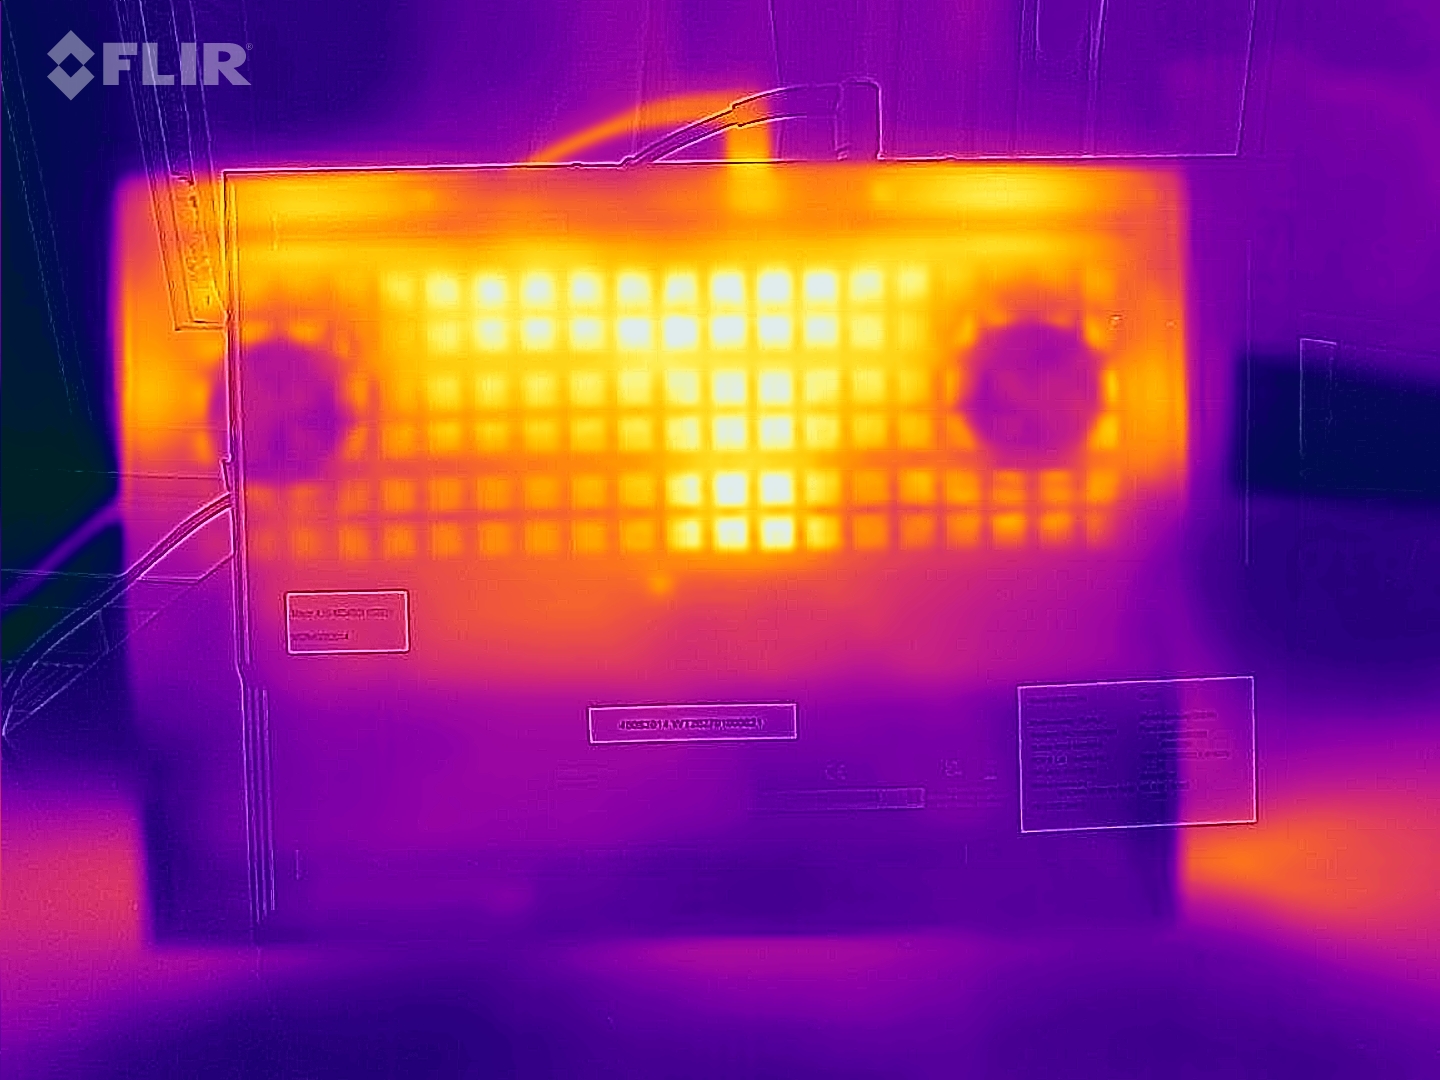
Temperatura
La temperatura del chasis nos dejó sentimientos encontrados. Por un lado, el chasis se calienta más que sus competidores en reposo, alcanzando hasta 45°C en la parte superior y 48°C en la inferior. Por otro lado, no se calienta demasiado cuando el dispositivo funciona a plena carga. No obstante, probablemente no deberías colocar el dispositivo sobre tu regazo durante las sesiones de juego.
(±) La temperatura máxima en la parte superior es de 45 °C / 113 F, frente a la media de 40.4 °C / 105 F, que oscila entre 21.2 y 68.8 °C para la clase Gaming.
(-) El fondo se calienta hasta un máximo de 48 °C / 118 F, frente a la media de 43.2 °C / 110 F
(±) En reposo, la temperatura media de la parte superior es de 32.7 °C / 91# F, frente a la media del dispositivo de 33.9 °C / 93 F.
(-) Jugando a The Witcher 3, la temperatura media de la parte superior es de 40.9 °C / 106 F, frente a la media del dispositivo de 33.9 °C / 93 F.
(±) El reposamanos y el touchpad pueden calentarse mucho al tacto con un máximo de 38 °C / 100.4 F.
(-) La temperatura media de la zona del reposamanos de dispositivos similares fue de 28.8 °C / 83.8 F (-9.2 °C / -16.6 F).
| Medion Erazer Major X10 i7-12700H, A730M | Asus TUF Gaming F17 FX707Z-HX011W i7-12700H, GeForce RTX 3060 Laptop GPU | Acer Nitro 5 AN517-55-738R i7-12700H, GeForce RTX 3060 Laptop GPU | Dell Inspiron 16 Plus 7620 i7-12700H, GeForce RTX 3050 Ti Laptop GPU | HP Omen 16-c0077ng R7 5800H, Radeon RX 6600M | |
|---|---|---|---|---|---|
| Heat | 6% | 1% | 12% | 15% | |
| Maximum Upper Side * (°C) | 45 | 52 -16% | 48.3 -7% | 46 -2% | 40.6 10% |
| Maximum Bottom * (°C) | 48 | 47 2% | 52 -8% | 45.8 5% | 36 25% |
| Idle Upper Side * (°C) | 38 | 31 18% | 34.5 9% | 29.2 23% | 31.3 18% |
| Idle Bottom * (°C) | 39 | 31 21% | 35.8 8% | 31 21% | 36 8% |
* ... más pequeño es mejor
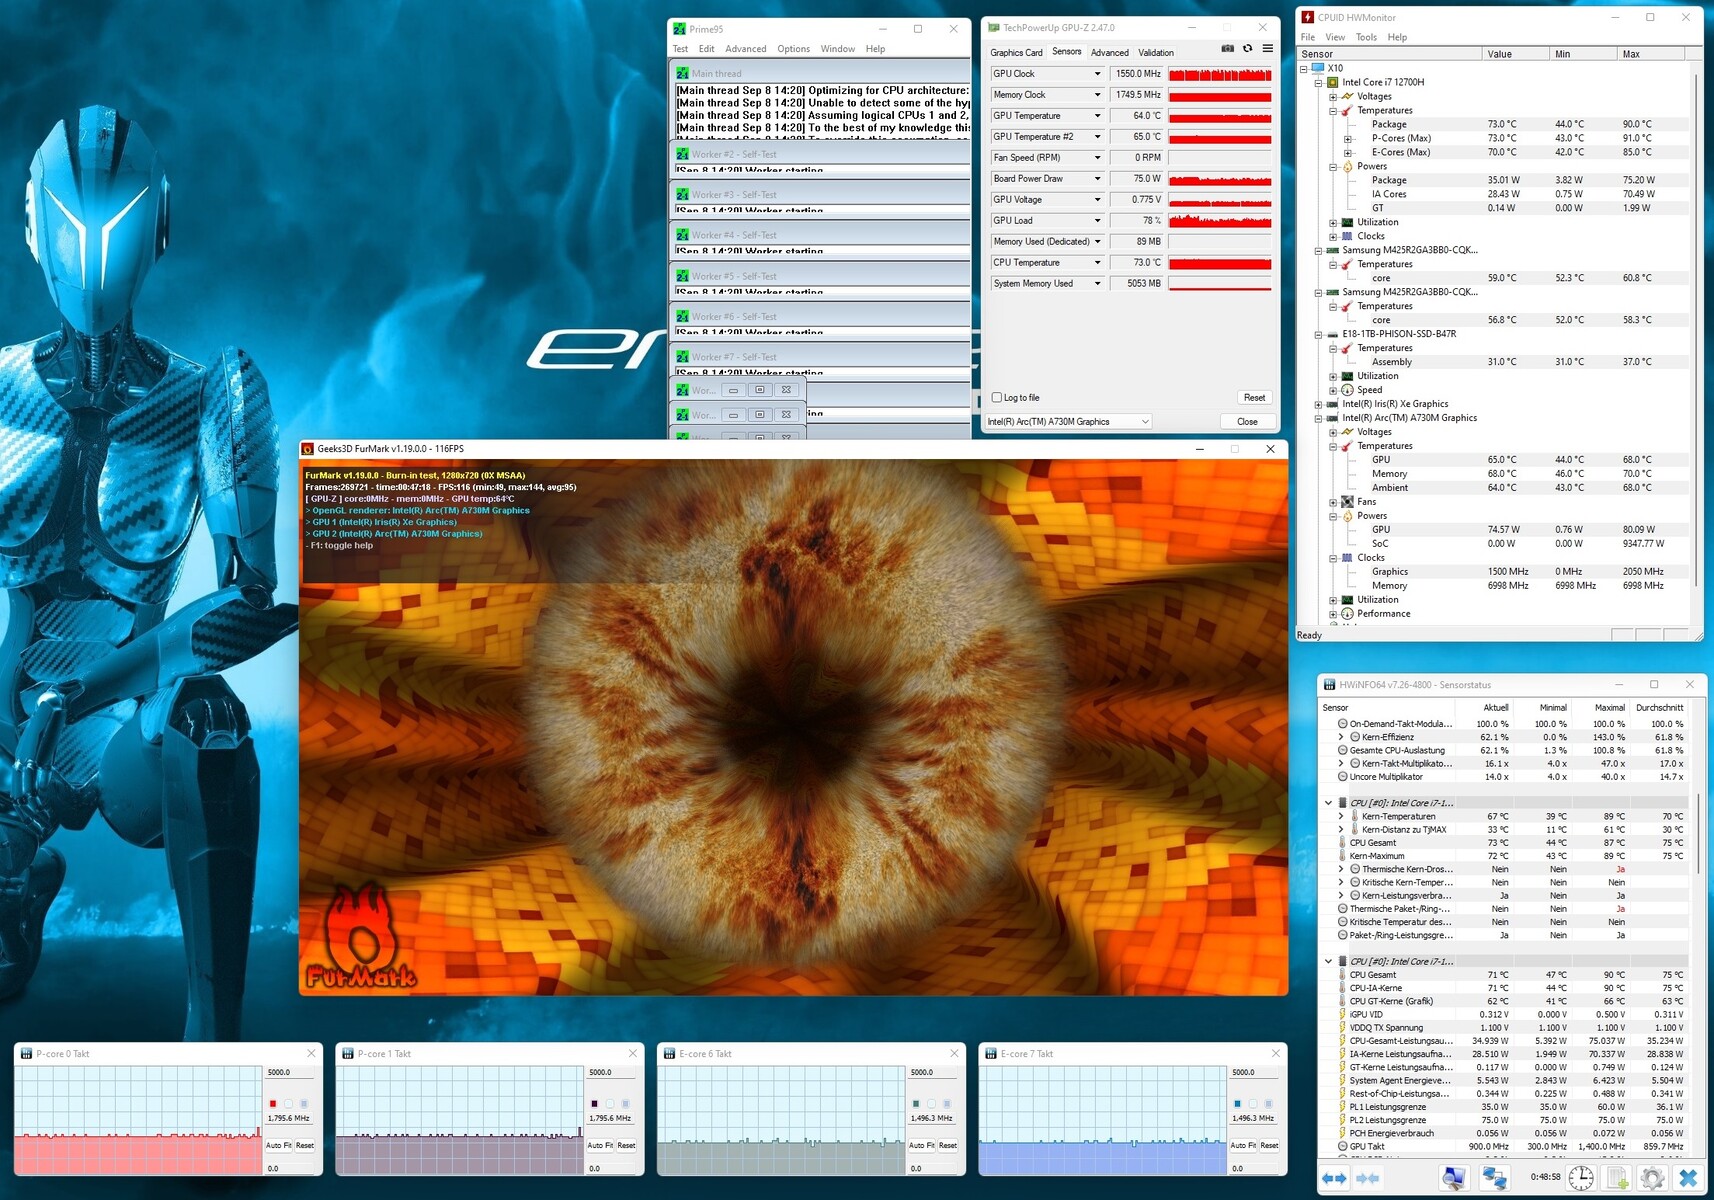
Prueba de esfuerzo
Como en el test Witcher 3, el Arc A730M completó el test de estrés de una hora (ejecutando FurMark y Prime95) con una temperatura media de unos 65°C. Mientras tanto, el Core i7-12700H superó la prueba sin problemas y funcionó a algo más de 70°C, lo que también es absolutamente seguro para la CPU.

Medion Erazer Major X10 análisis de audio
(+) | los altavoces pueden reproducir a un volumen relativamente alto (#82 dB)
Graves 100 - 315 Hz
(-) | casi sin bajos - de media 16.1% inferior a la mediana
(±) | la linealidad de los graves es media (12.9% delta a frecuencia anterior)
Medios 400 - 2000 Hz
(±) | medias más altas - de media 6.9% más altas que la mediana
(+) | los medios son lineales (4.3% delta a la frecuencia anterior)
Altos 2 - 16 kHz
(+) | máximos equilibrados - a sólo 3.2% de la mediana
(+) | los máximos son lineales (6.7% delta a la frecuencia anterior)
Total 100 - 16.000 Hz
(±) | la linealidad del sonido global es media (17.5% de diferencia con la mediana)
En comparación con la misma clase
» 49% de todos los dispositivos probados de esta clase eran mejores, 12% similares, 39% peores
» El mejor tuvo un delta de 6%, la media fue 18%, el peor fue ###max##%
En comparación con todos los dispositivos probados
» 34% de todos los dispositivos probados eran mejores, 8% similares, 58% peores
» El mejor tuvo un delta de 4%, la media fue 23%, el peor fue ###max##%
Asus TUF Gaming F17 FX707Z-HX011W análisis de audio
(±) | la sonoridad del altavoz es media pero buena (79.5 dB)
Graves 100 - 315 Hz
(±) | lubina reducida - en promedio 13.1% inferior a la mediana
(±) | la linealidad de los graves es media (9% delta a frecuencia anterior)
Medios 400 - 2000 Hz
(±) | medias más altas - de media 9.1% más altas que la mediana
(±) | la linealidad de los medios es media (7.8% delta respecto a la frecuencia anterior)
Altos 2 - 16 kHz
(+) | máximos equilibrados - a sólo 3.9% de la mediana
(±) | la linealidad de los máximos es media (9.1% delta a frecuencia anterior)
Total 100 - 16.000 Hz
(±) | la linealidad del sonido global es media (20.4% de diferencia con la mediana)
En comparación con la misma clase
» 72% de todos los dispositivos probados de esta clase eran mejores, 6% similares, 22% peores
» El mejor tuvo un delta de 6%, la media fue 18%, el peor fue ###max##%
En comparación con todos los dispositivos probados
» 54% de todos los dispositivos probados eran mejores, 8% similares, 38% peores
» El mejor tuvo un delta de 4%, la media fue 23%, el peor fue ###max##%
Altavoces
La calidad de sonido del Major X10 está en la media de los portátiles para juegos. Como suele ocurrir, los altavoces carecen principalmente de graves. Por lo tanto, deberías coger un par de auriculares cuando sea posible si quieres disfrutar de verdad de la música y los vídeos en el portátil.
Gestión de la energía
Consumo de energía
Es difícil entender por qué Medion incluyó una voluminosa fuente de alimentación de 300 vatios con el portátil. El Major X10 no usó más de 220 vatios durante nuestra prueba de estrés, lo que sugiere que un cargador más compacto de 230 vatios habría tenido más sentido. Bajo carga, el dispositivo consume entre 122 y 220 vatios de energía, lo que es similar a los portátiles equipados con una RTX 3060. Sin embargo, su elevado consumo de energía en reposo, de 24 a 36 vatios, lo sitúa firmemente en la parte baja del grupo de comparación.
| Off / Standby | |
| Ocioso | |
| Carga |
|
Clave:
min: | |
| Medion Erazer Major X10 i7-12700H, A730M | Asus TUF Gaming F17 FX707Z-HX011W i7-12700H, GeForce RTX 3060 Laptop GPU | Acer Nitro 5 AN517-55-738R i7-12700H, GeForce RTX 3060 Laptop GPU | Dell Inspiron 16 Plus 7620 i7-12700H, GeForce RTX 3050 Ti Laptop GPU | HP Omen 16-c0077ng R7 5800H, Radeon RX 6600M | Media de la clase Gaming | |
|---|---|---|---|---|---|---|
| Power Consumption | 33% | 23% | 43% | 13% | 19% | |
| Idle Minimum * (Watt) | 24 | 6.6 73% | 9.7 60% | 6.8 72% | 12 50% | 13 ? 46% |
| Idle Average * (Watt) | 26 | 8.3 68% | 14.6 44% | 9.6 63% | 12.8 51% | 19 ? 27% |
| Idle Maximum * (Watt) | 36 | 11.8 67% | 16.7 54% | 17 53% | 18.5 49% | 24.6 ? 32% |
| Load Average * (Watt) | 122 | 119 2% | 166 -36% | 117.5 4% | 190 -56% | 110.7 ? 9% |
| Witcher 3 ultra * (Watt) | 155.6 | 169 -9% | 113.1 27% | 194 -25% | ||
| Load Maximum * (Watt) | 220 | 222 -1% | 235 -7% | 137.4 38% | 200 9% | 259 ? -18% |
* ... más pequeño es mejor
Power consumption Witcher 3 / Stress test
Power consumption with external monitor
Duración de la batería
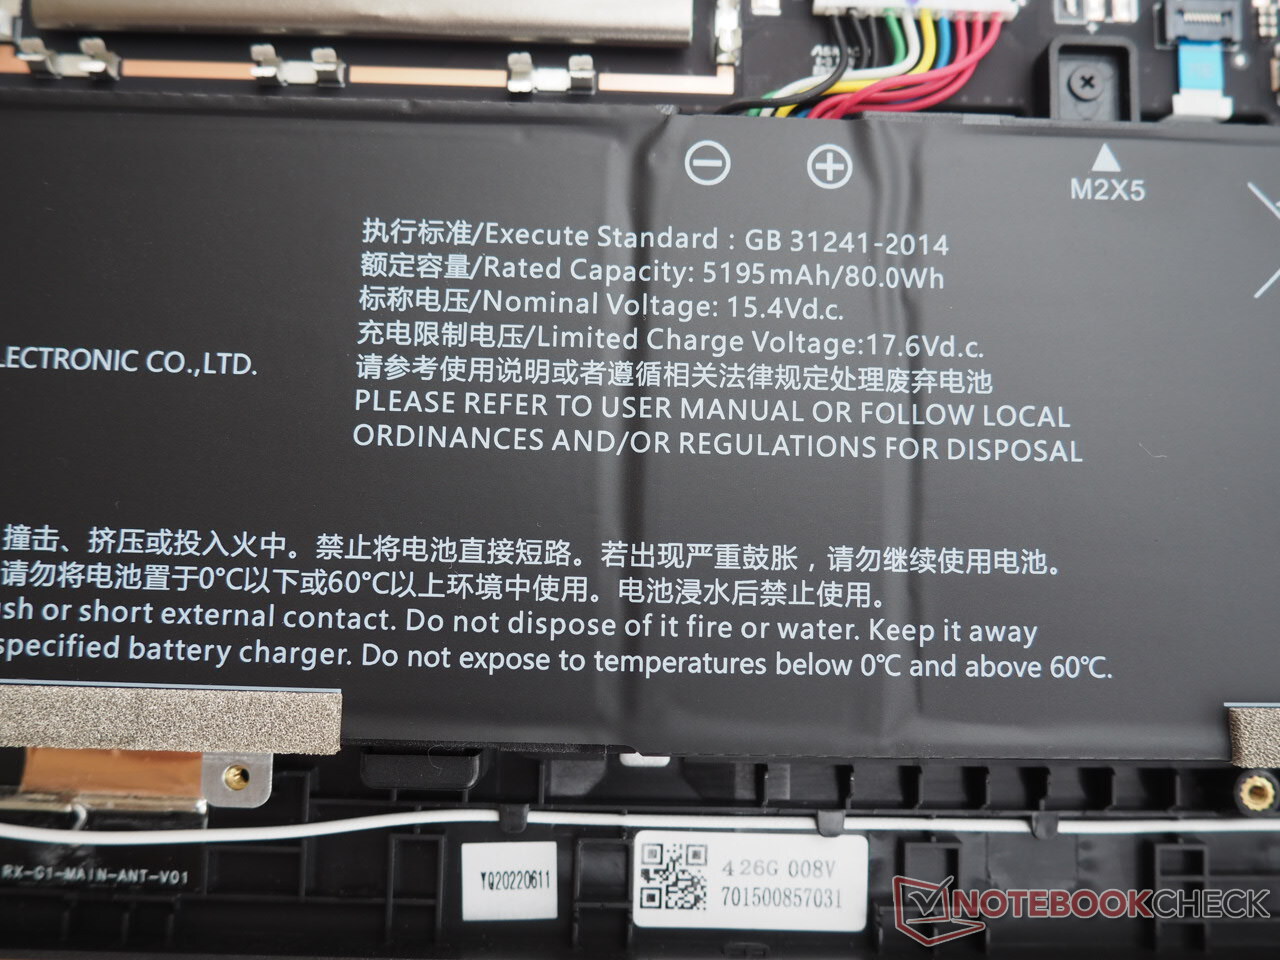
A pesar de su decente capacidad de batería (80 Wh), el Major X10 no tiene precisamente un gran aguante y a menudo queda por detrás de la competencia en este aspecto. Sin embargo, duró unas respetables 6,5 horas cuando lo utilizamos para navegar por Internet a través de Wi-Fi con un brillo de pantalla medio.
| Medion Erazer Major X10 i7-12700H, A730M, 80 Wh | Asus TUF Gaming F17 FX707Z-HX011W i7-12700H, GeForce RTX 3060 Laptop GPU, 90 Wh | Acer Nitro 5 AN517-55-738R i7-12700H, GeForce RTX 3060 Laptop GPU, 90.61 Wh | Dell Inspiron 16 Plus 7620 i7-12700H, GeForce RTX 3050 Ti Laptop GPU, 86 Wh | HP Omen 16-c0077ng R7 5800H, Radeon RX 6600M, 70 Wh | Media de la clase Gaming | |
|---|---|---|---|---|---|---|
| Duración de Batería | 109% | 59% | 73% | -9% | 32% | |
| Reader / Idle (h) | 8.2 | 11.7 43% | 18.6 127% | 8.27 ? 1% | ||
| WiFi v1.3 (h) | 6.7 | 8.7 30% | 6.5 -3% | 9.6 43% | 6.1 -9% | 7.11 ? 6% |
| Load (h) | 0.8 | 2.3 187% | 1.9 137% | 1.2 50% | 1.502 ? 88% | |
| H.264 (h) | 7.7 | 5.3 | 7 | 8.32 ? | ||
| Witcher 3 ultra (h) | 1.4 |
Pro
Contra
Veredicto
Demasiado caro para el rendimiento en juegos que ofrece: así es como se podría resumir el Medion Erazer Major X10 en pocas palabras
Mientras que el Intel Arc A730M se comporta relativamente bien en los benchmarks sintéticos y se enfrenta bien a la GeForce RTX 3060 y a la Radeon RX 6600M, sus diversas debilidades y los valores atípicos de rendimiento se hacen evidentes en el juego real, con niveles de rendimiento a la par o incluso peores que una
GeForce RTX 3050 Ti. Por lo tanto, es difícil recomendar el Arc A730M en términos de relación calidad-precio, sobre todo teniendo en cuenta que su eficiencia energética todavía deja que desear
Por lo demás, el Major X10 es bastante impresionante en su mayor parte. En particular, la pantalla de 16 pulgadas ofrece una razón convincente para comprar el portátil debido a su relación de aspecto 16:10, su alta resolución (2.560 x 1.600), su alto brillo máximo y su gran reproducción del color.
En general, sólo recomendaríamos el Major X10 a los fans acérrimos de Intel o a aquellos que sean extremadamente exigentes con las pantallas. El resto de jugadores que necesiten o quieran cuidar su presupuesto probablemente deberían echar un vistazo a un portátil con una RTX 3060 o una GPU que tenga un rendimiento similar. Medion ofrece actualmente unos cuantos dispositivos con esas especificaciones (por no mencionar que suelen ser más baratos).
Precio y disponibilidad
El Erazer Major X10 con un Core i7-12700H, Arc A730M, 32 GB de RAM y 1 TB de almacenamiento SSD cuesta unos 1.700 euros (1.728 dólares) y puede adquirirse en la tienda online alemana de Medion. El portátil aún no está disponible en otras regiones en el momento de realizar este análisis.
Medion Erazer Major X10
- 09/12/2022 v7 (old)
Florian Glaser
Price comparison

