Análisis del portátil Lenovo Legion Slim 7i 16 Gen 8: Más delgado que el Razer Blade 16

El Lenovo Legion Slim 7i Gen 8 sustituye al del año pasado Legion Slim 7i Gen 7 con nuevas CPU Raptor Lake-H de 13ª generación, GPU Nvidia Ada Lovelace y un diseño de chasis revisado. Complementa a la serie Legion Serie Pro 7.
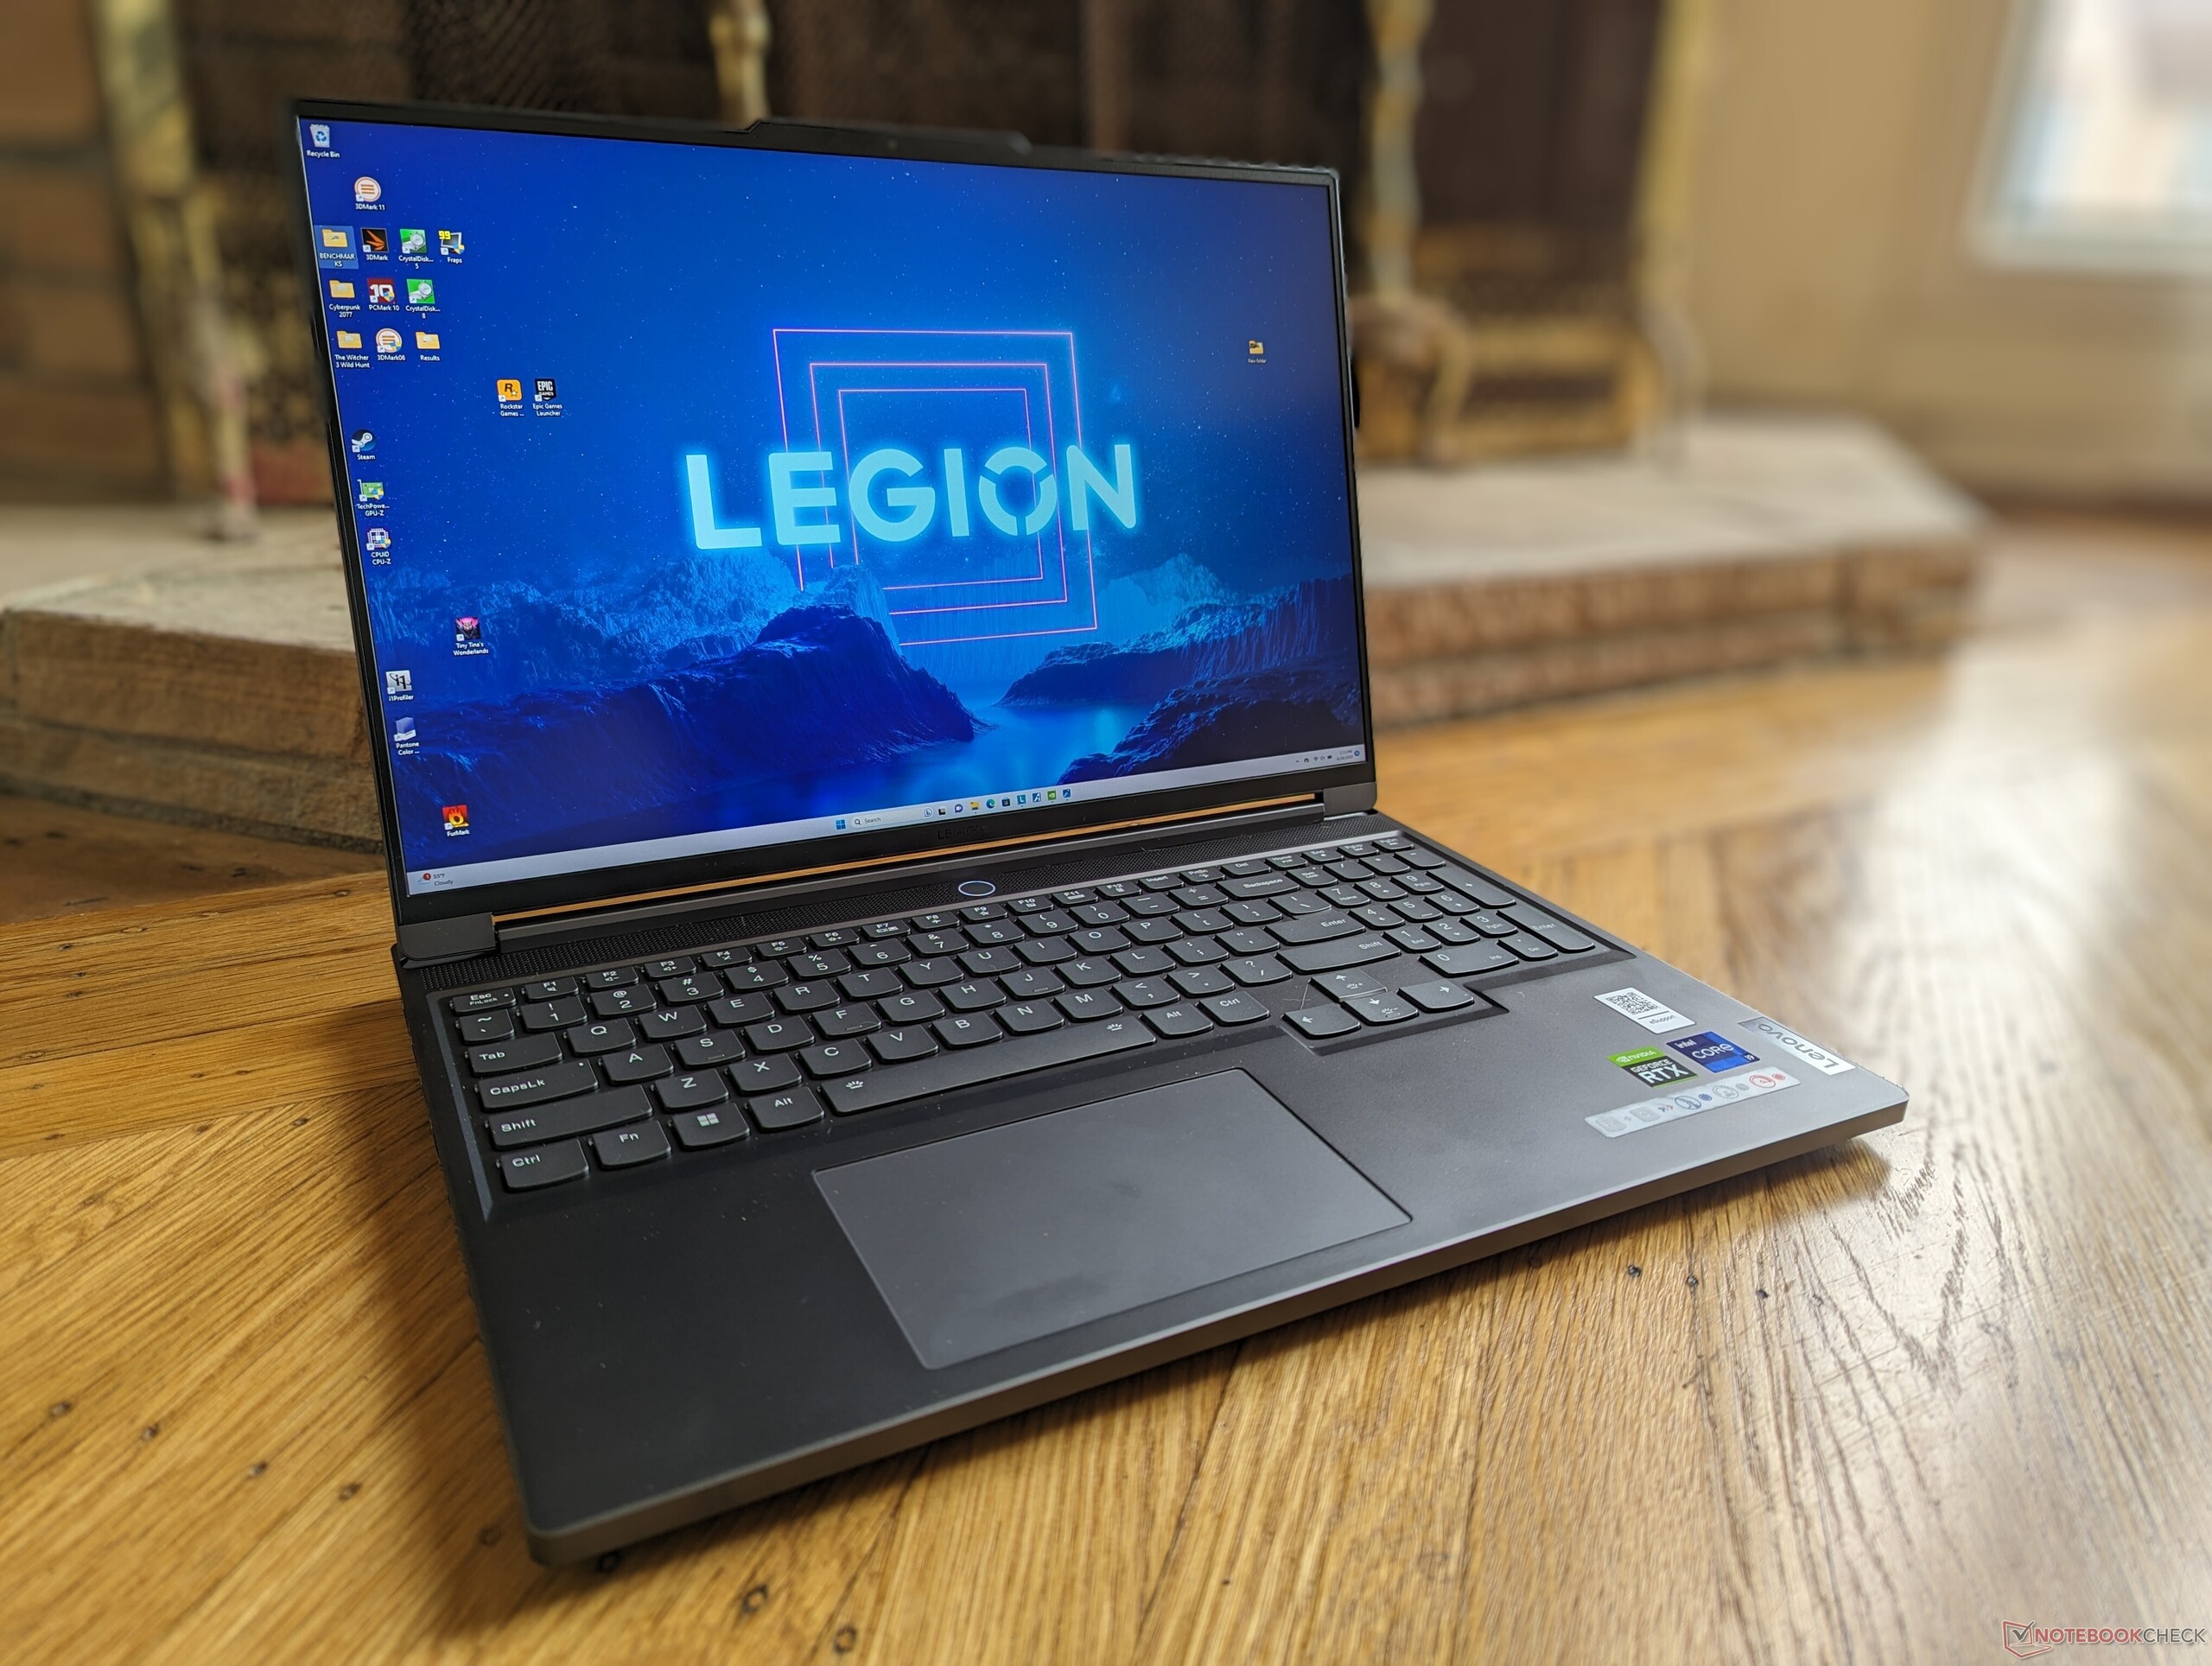
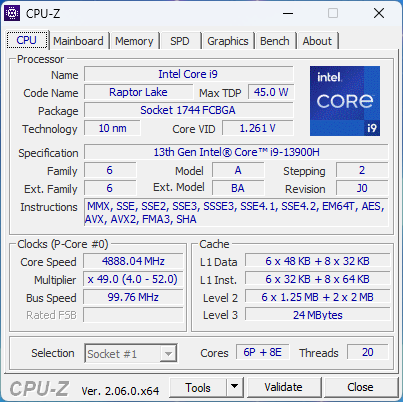
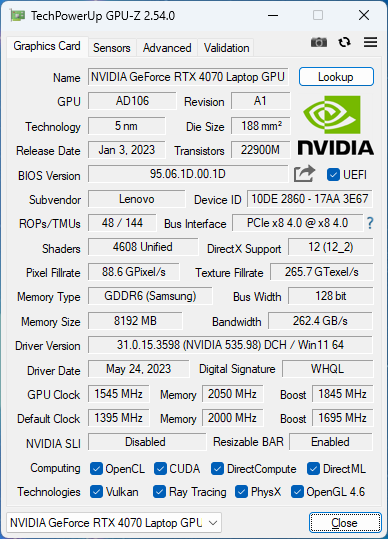
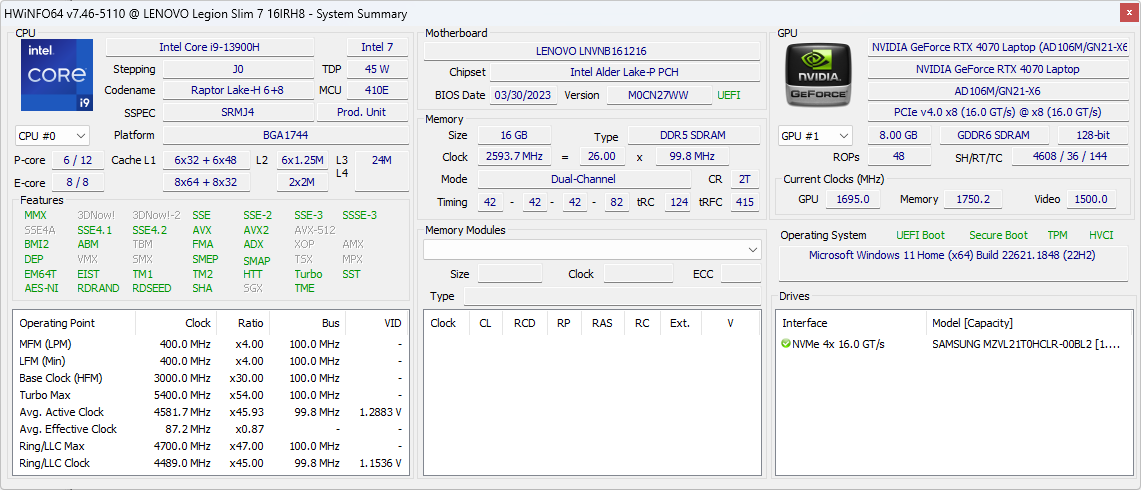
Nuestra unidad de análisis es una configuración de gama alta con Core i9-13900H, GPU GeForce RTX 4070 de 140 W y pantalla IPS de 2560 x 1600 240 Hz por unos 1600 dólares al por menor. Hay otras versiones disponibles con el Core i7-13700H, RTX 4060 o pantalla de mayor resolución 3200 x 2000 165 Hz a partir de unos 1500 $.
Entre los competidores del Legion Slim 7i G8 se incluyen otros portátiles para juegos de 16 pulgadas delgados y ligeros como el Razer Blade 16, HP Omen 16, Asus ROG Zephyrus M16o el Alienware x16 R1.
Más opiniones sobre Lenovo:
Posibles contendientes en la comparación
Valoración | Fecha | Modelo | Peso | Altura | Tamaño | Resolución | Precio |
|---|---|---|---|---|---|---|---|
| 90 % v7 (old) | 07/2023 | Lenovo Legion Slim 7i 16 Gen 8 i9-13900H, GeForce RTX 4070 Laptop GPU | 2.1 kg | 19.9 mm | 16.00" | 2560x1600 | |
| 87.4 % v7 (old) | 07/2023 | HP Omen 16-wf000 i7-13700HX, GeForce RTX 4080 Laptop GPU | 2.4 kg | 23.6 mm | 16.10" | 2560x1440 | |
| 88.4 % v7 (old) | 06/2023 | Alienware x16 R1 i9-13900HK, GeForce RTX 4080 Laptop GPU | 2.6 kg | 18.57 mm | 16.00" | 2560x1600 | |
| 88.8 % v7 (old) | 06/2023 | Lenovo Legion Pro 7 RTX4090 i9-13900HX, GeForce RTX 4090 Laptop GPU | 2.7 kg | 26 mm | 16.00" | 2560x1600 | |
| 88.4 % v7 (old) | 03/2023 | Asus ROG Strix G16 G614JZ i9-13980HX, GeForce RTX 4080 Laptop GPU | 2.4 kg | 30.4 mm | 16.00" | 2560x1600 | |
| 91.2 % v7 (old) | 02/2023 | Razer Blade 16 Early 2023 i9-13950HX, GeForce RTX 4080 Laptop GPU | 2.4 kg | 21.99 mm | 16.00" | 2560x1600 |
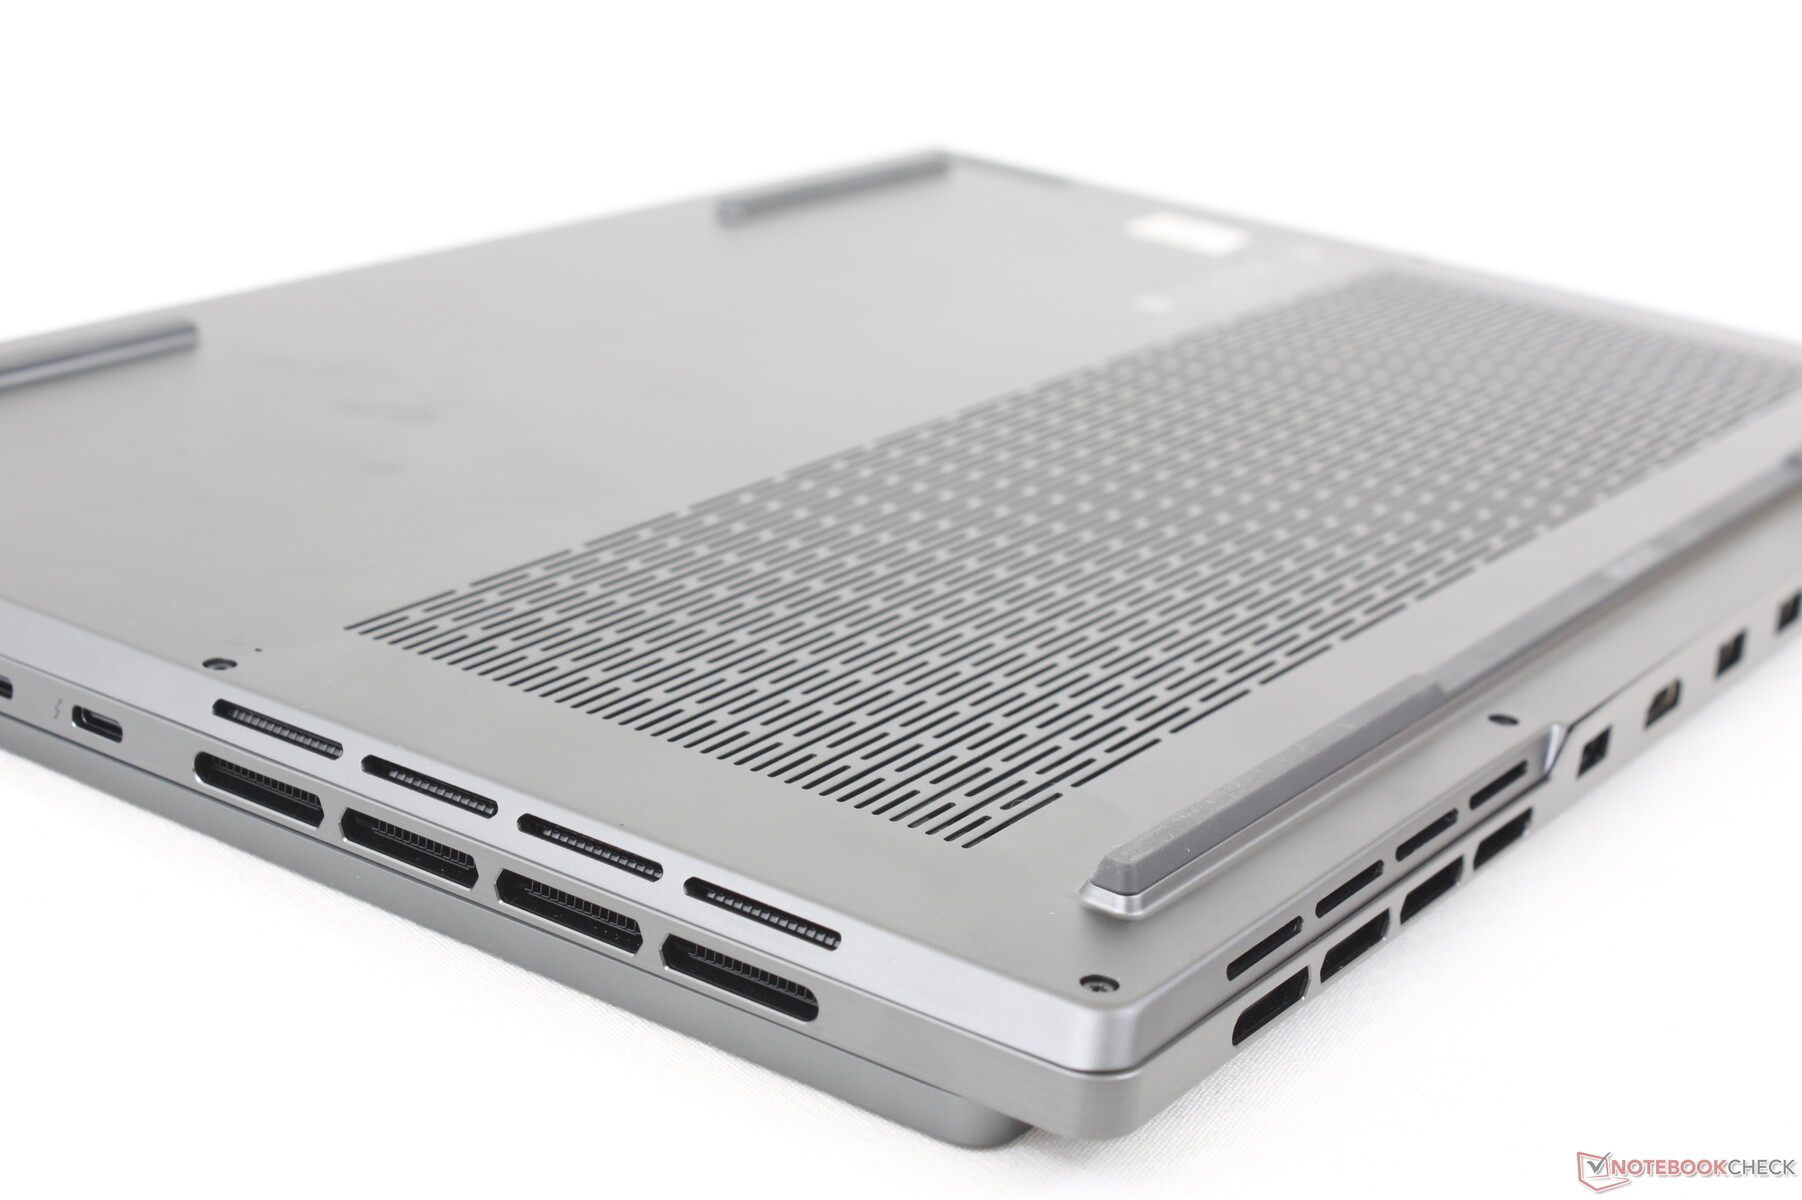
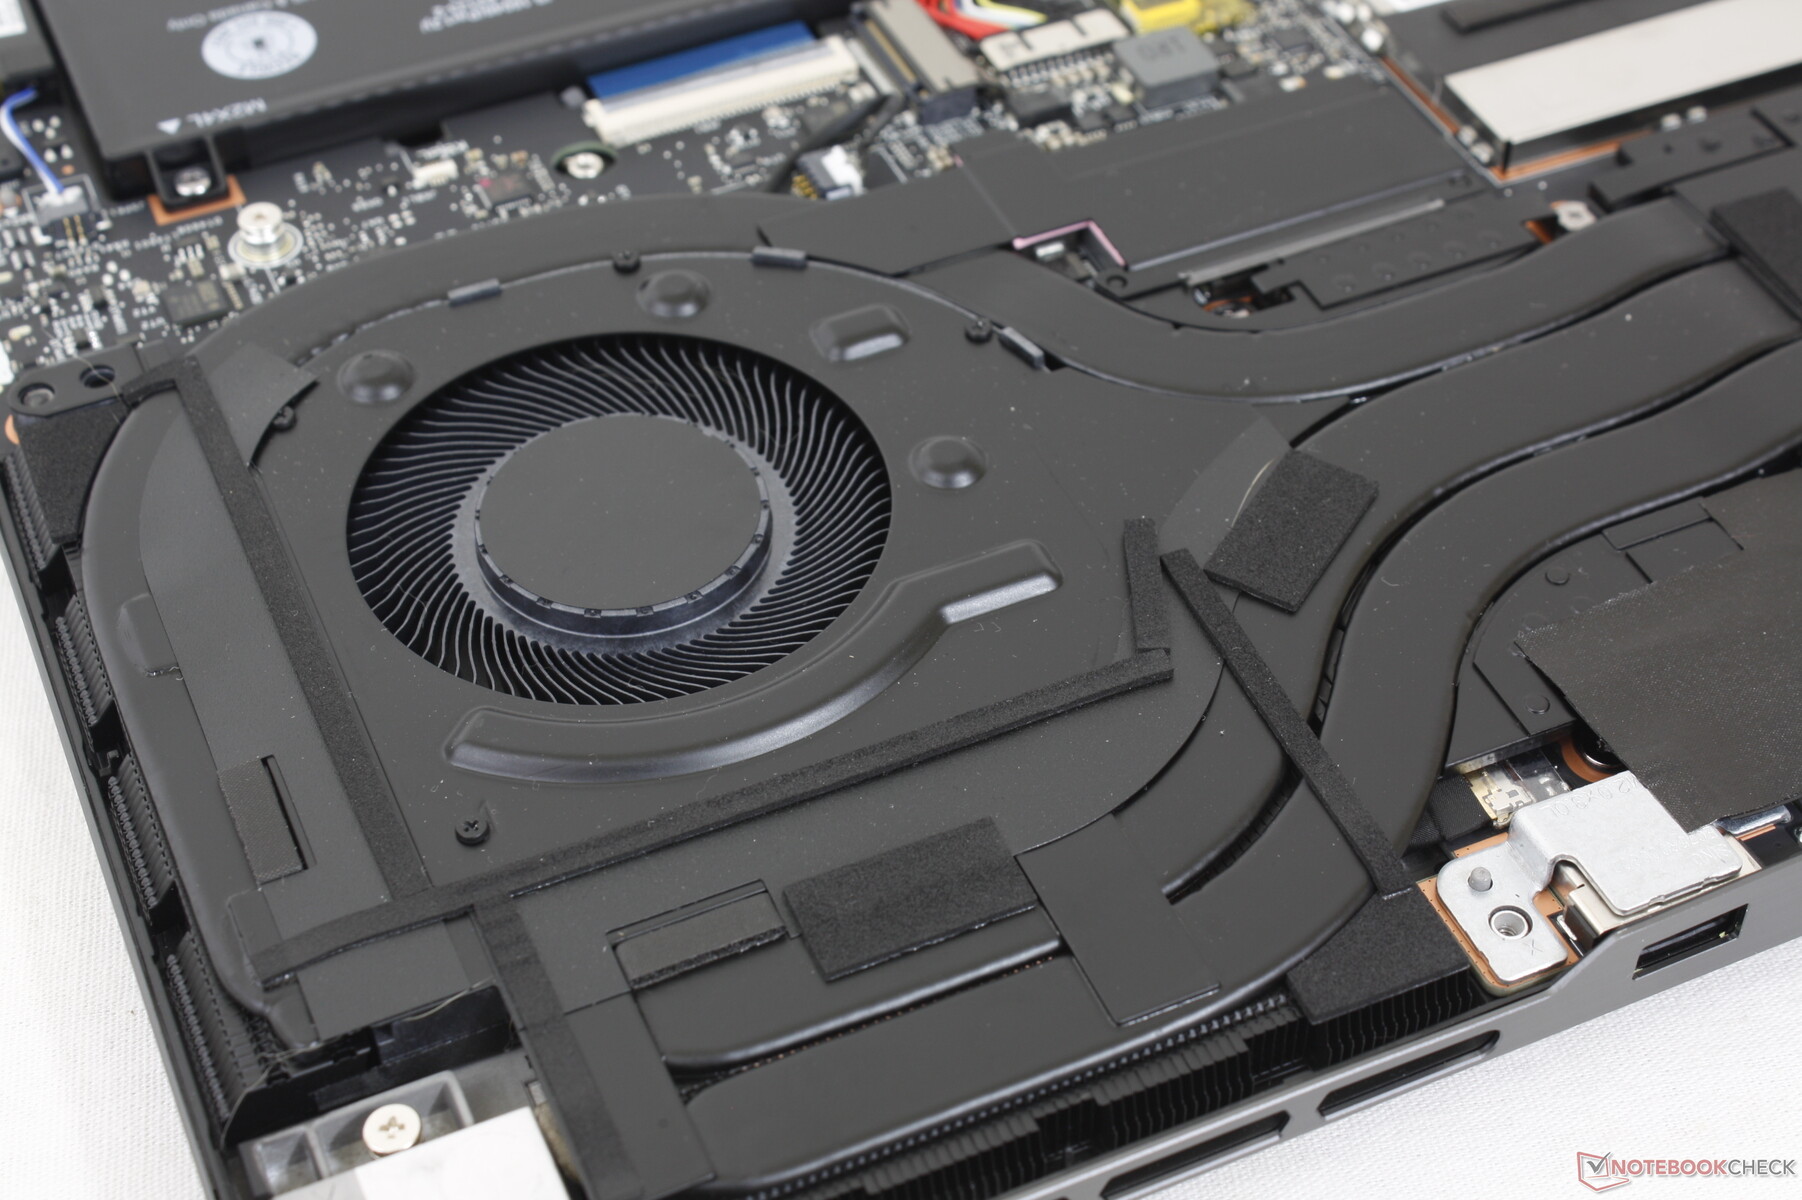
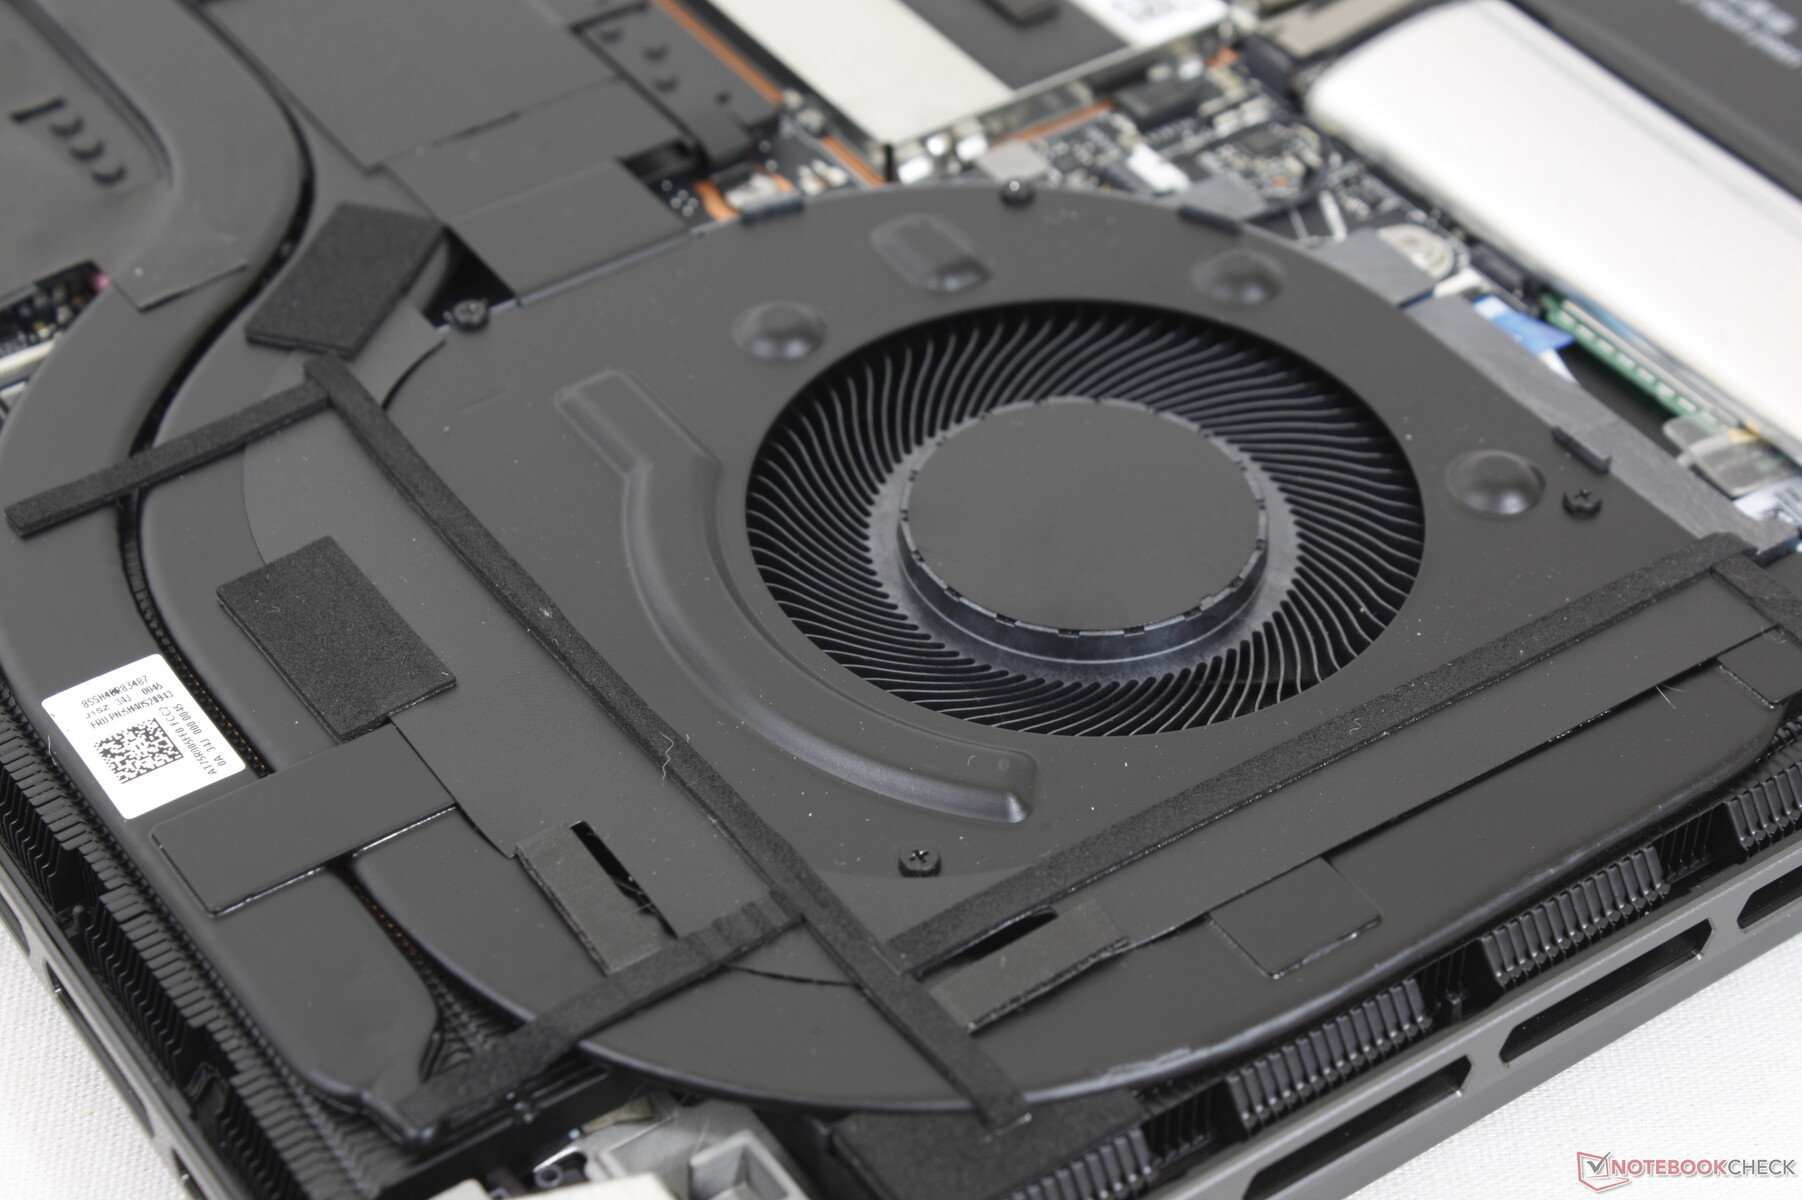
Maletín - Ahora con más rejillas de ventilación
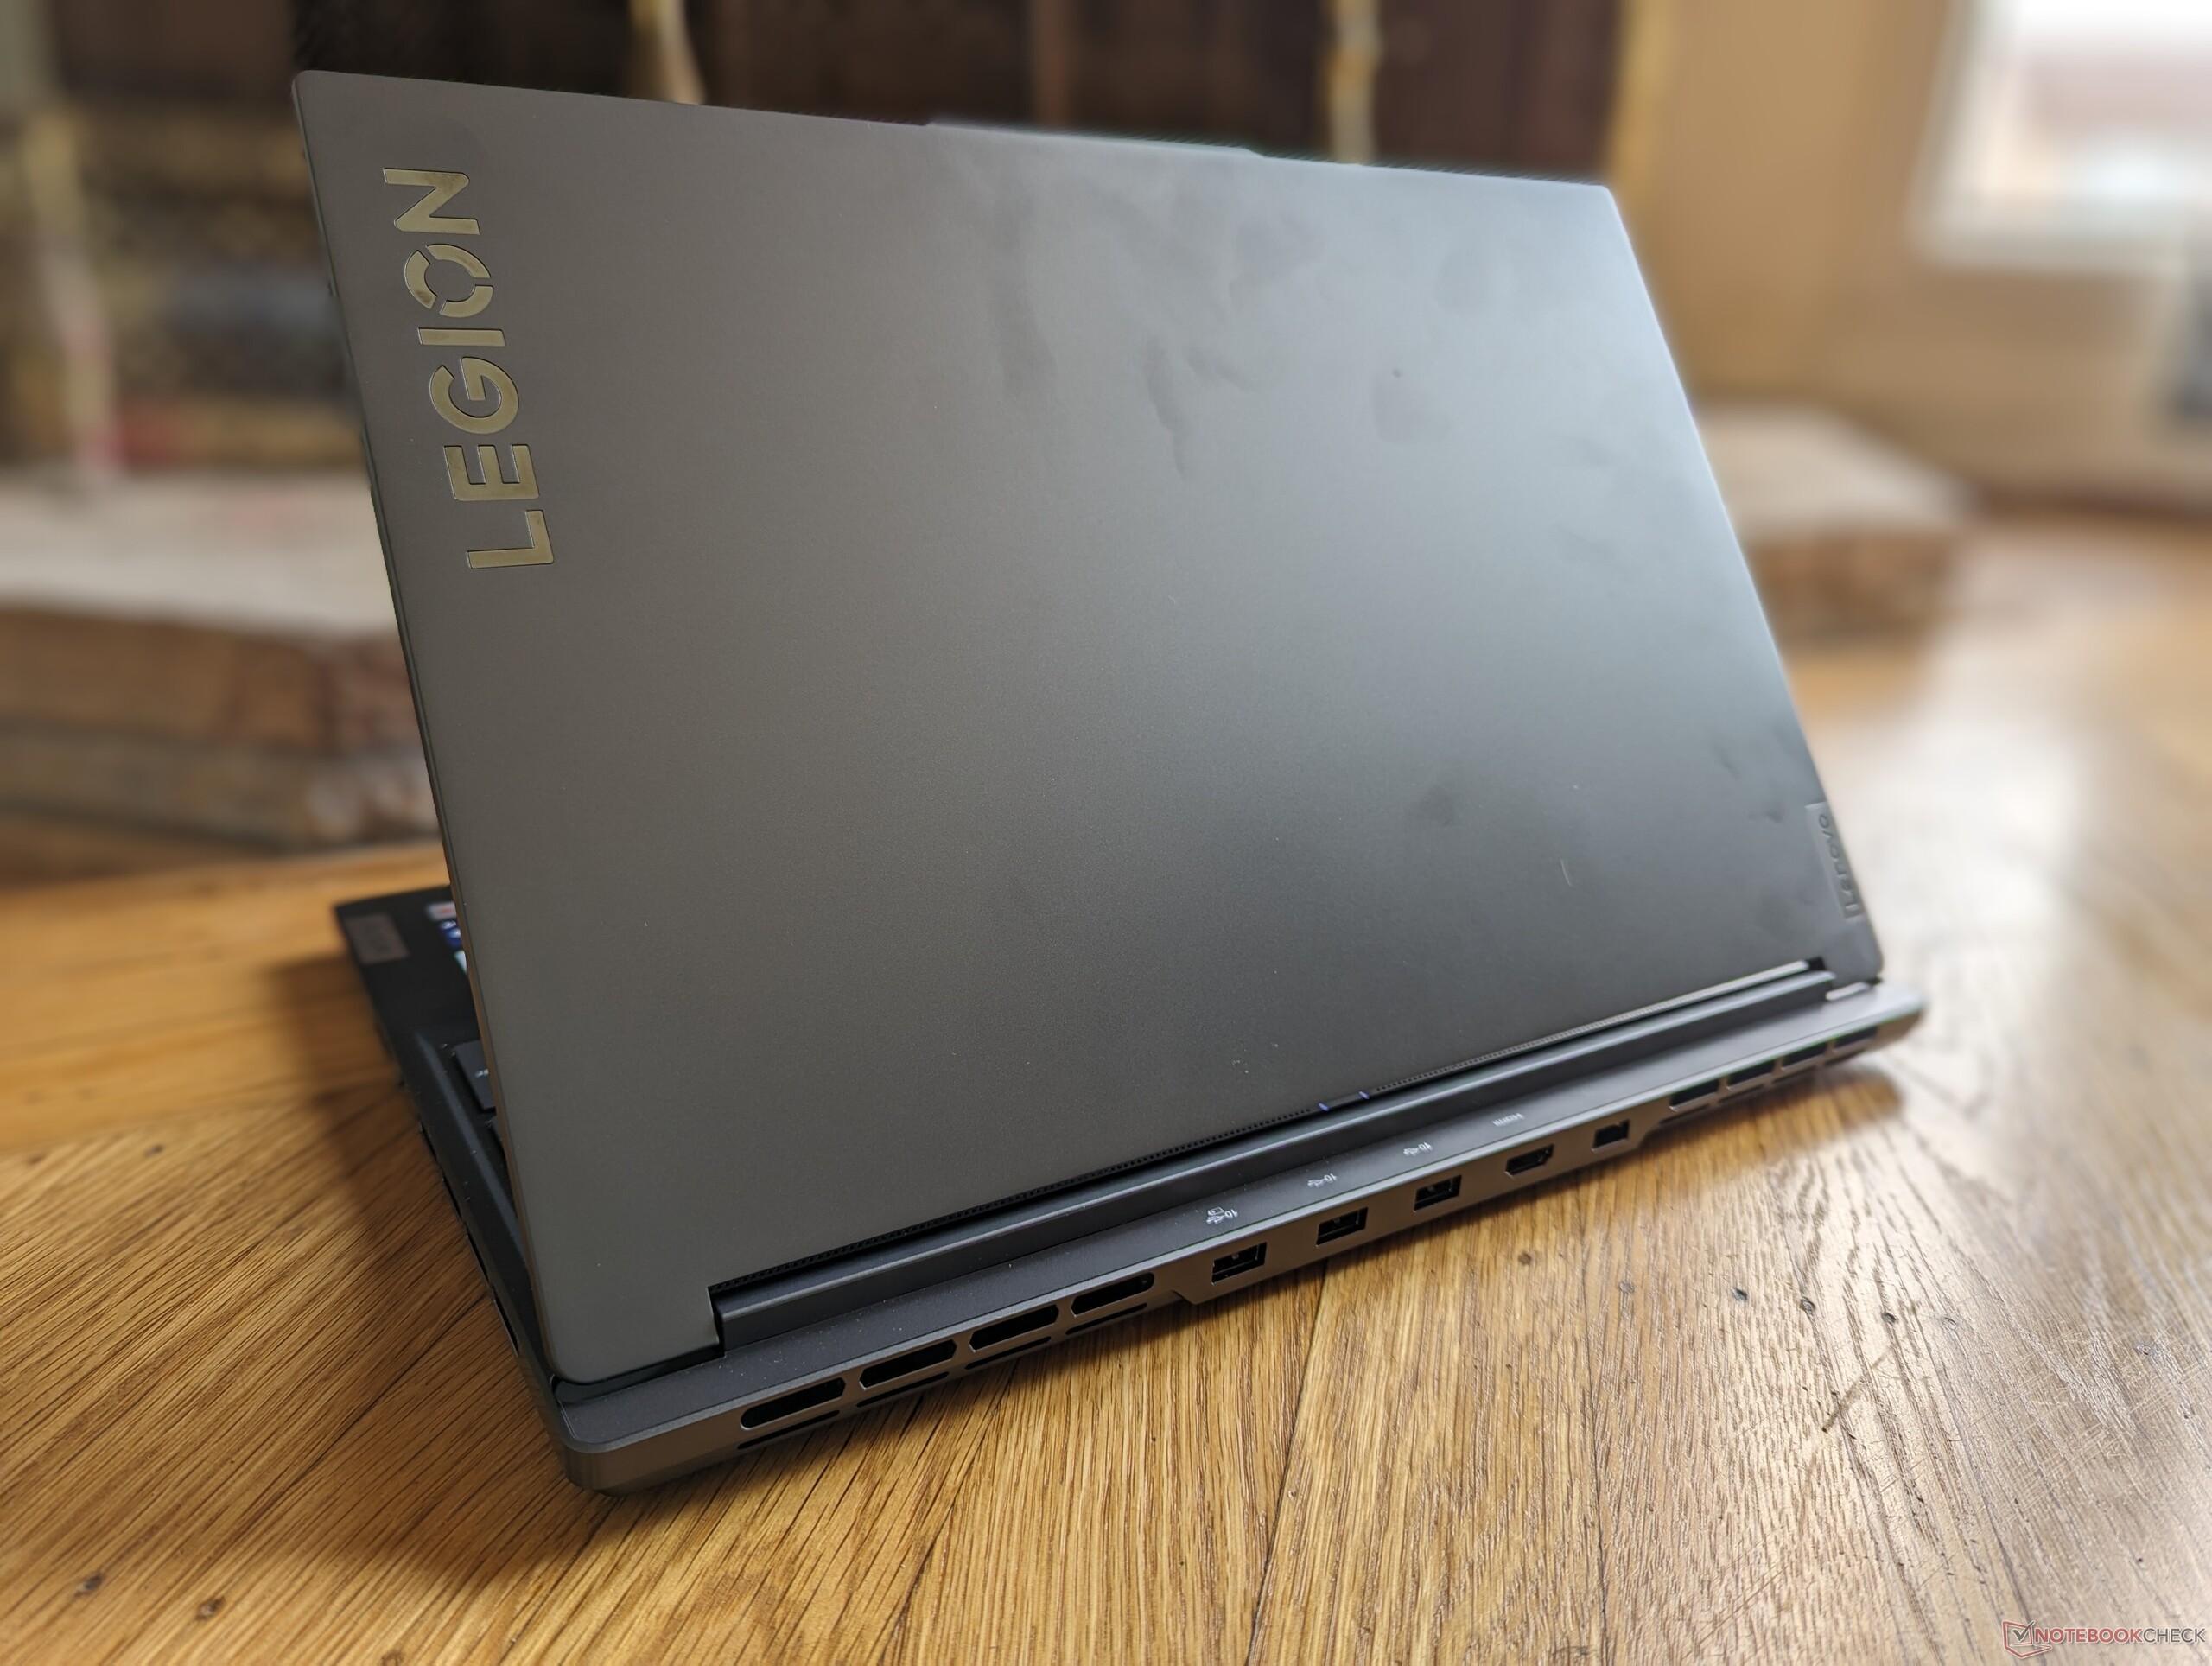
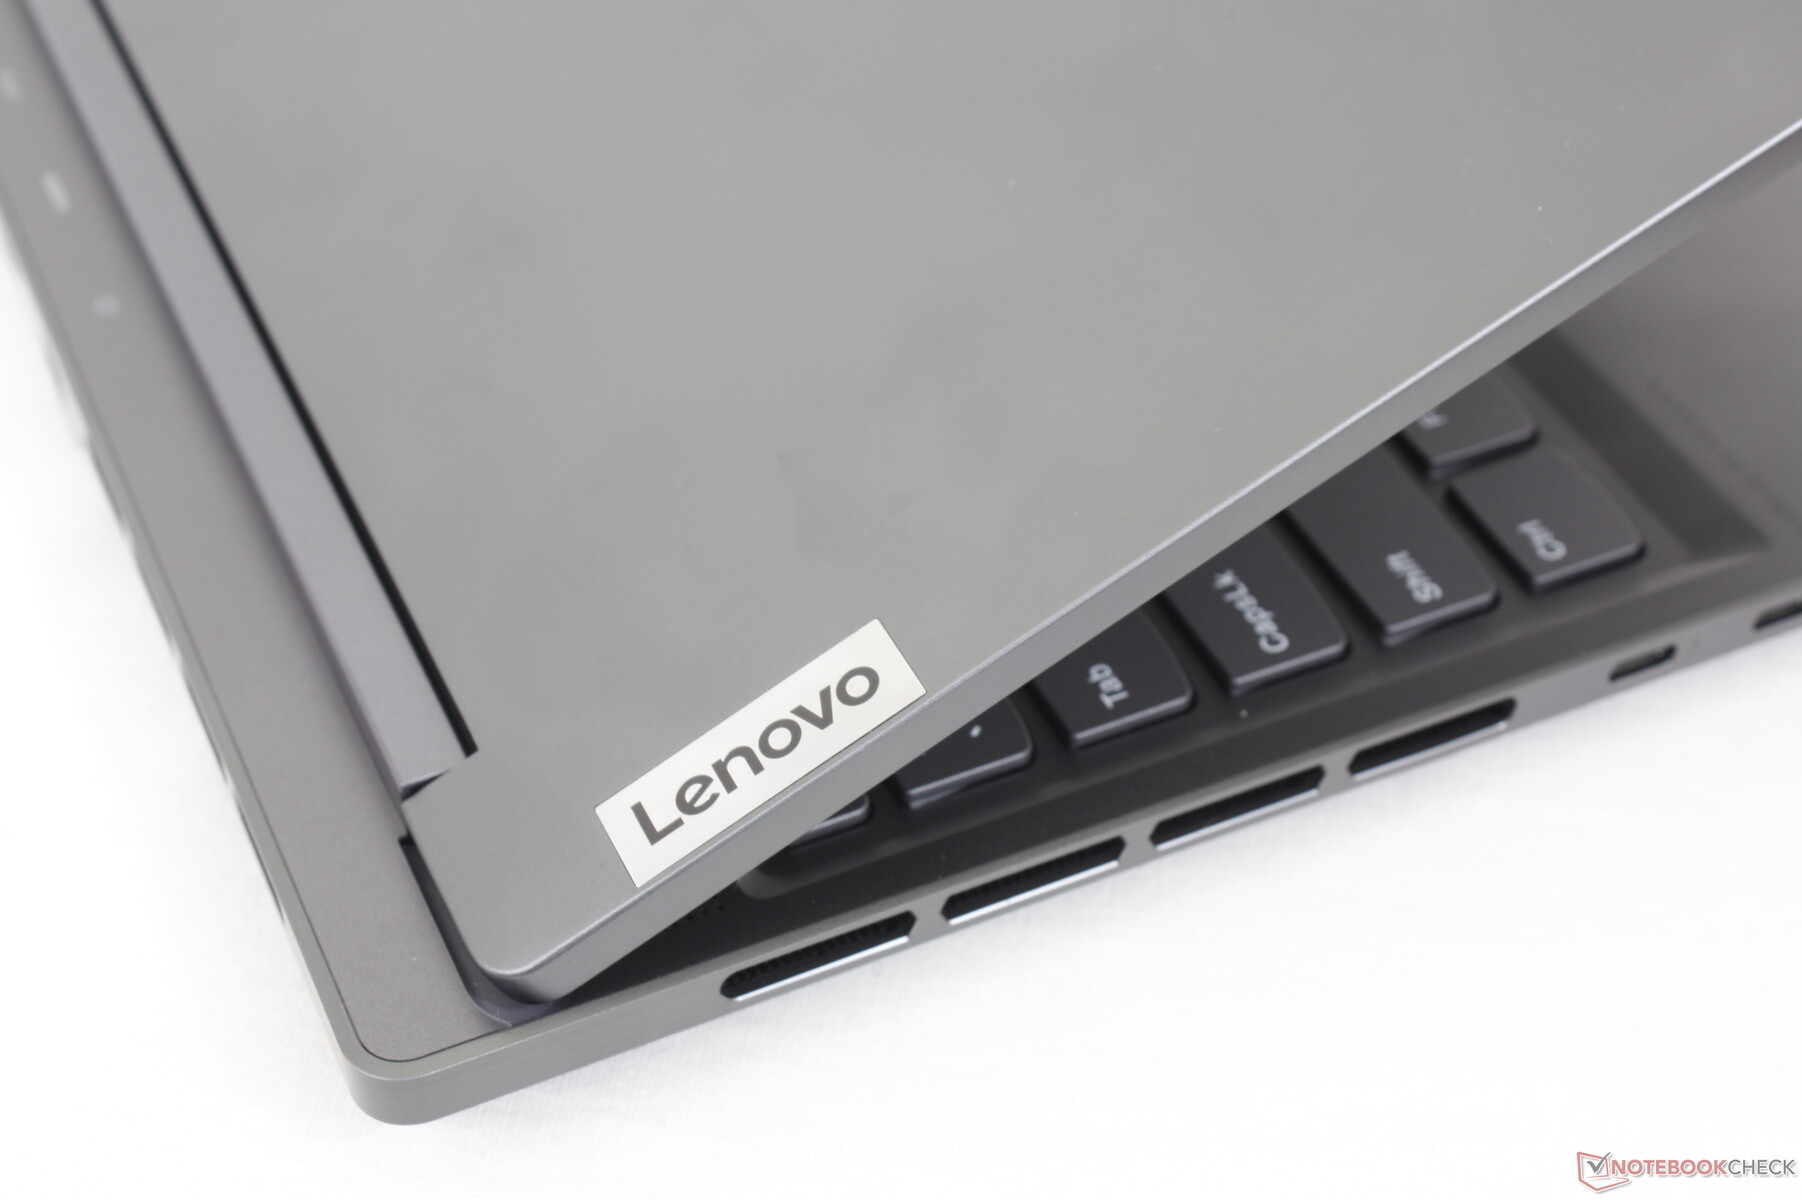
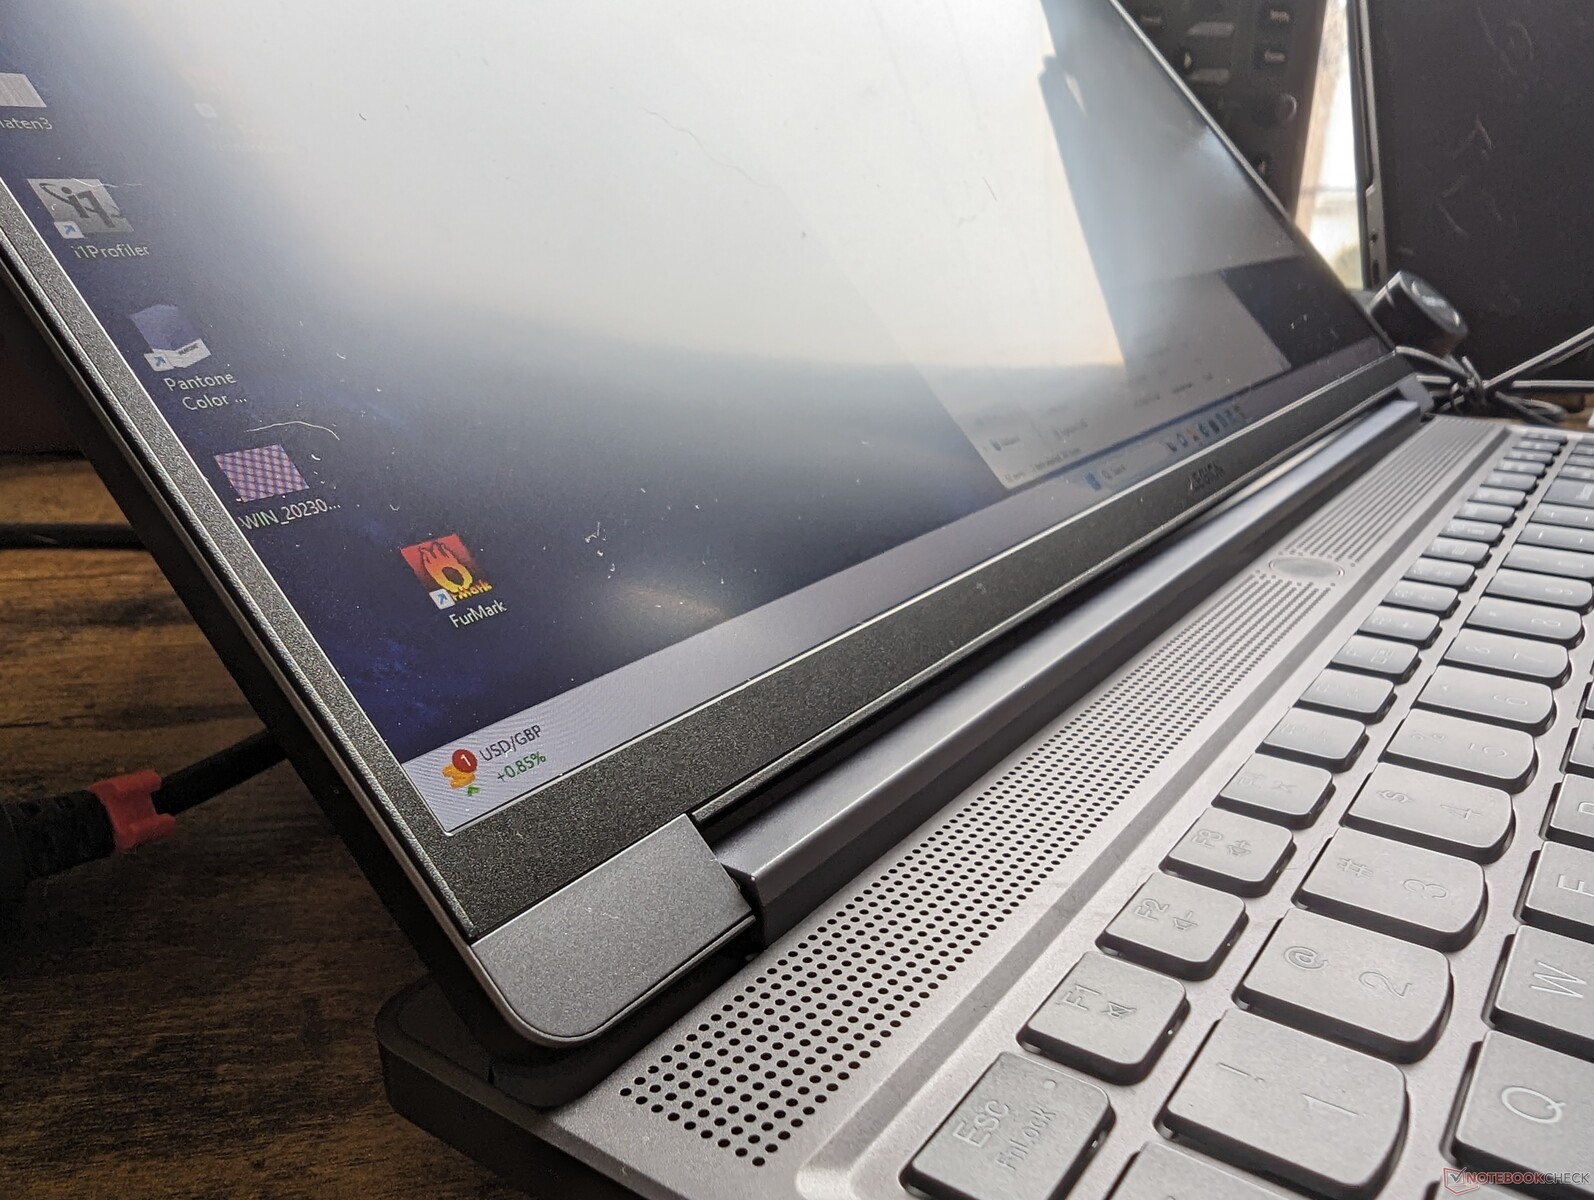
El chasis puede parecer similar al Legion Slim 7i 16 G7 del año pasado desde la parte frontal, pero la mayoría de los cambios externos se encuentran en la parte trasera e inferior. El borde trasero, por ejemplo, es ahora plano para darle un aspecto más limpio, mientras que las rejillas de ventilación son notablemente más grandes esta vez para mejorar la refrigeración.
Por lo demás, los materiales del chasis tienen el mismo acabado en aluminio gris y el mismo tacto que en otros modelos Legion 7. La base se mantiene rígida a pesar de su delgado perfil y la tapa también es relativamente firme. Las pequeñas bisagras no son tan sólidas como las más grandes del Asus ROG Strix G16pero permiten una apertura completa de 180 grados, algo poco común en portátiles para juegos.
Lenovo no lo llama Legion Slim 7 por nada. En comparación con el Legion Pro 7, nuestra versión Slim es significativamente más ligera (600 g) y notablemente más delgada (más de 6 mm). De hecho, el Legion Slim 7 es uno de los portátiles para juegos de 16 pulgadas más finos y ligeros del mercado, solo superado por el ligeramente más fino y ligero MSI GS66.
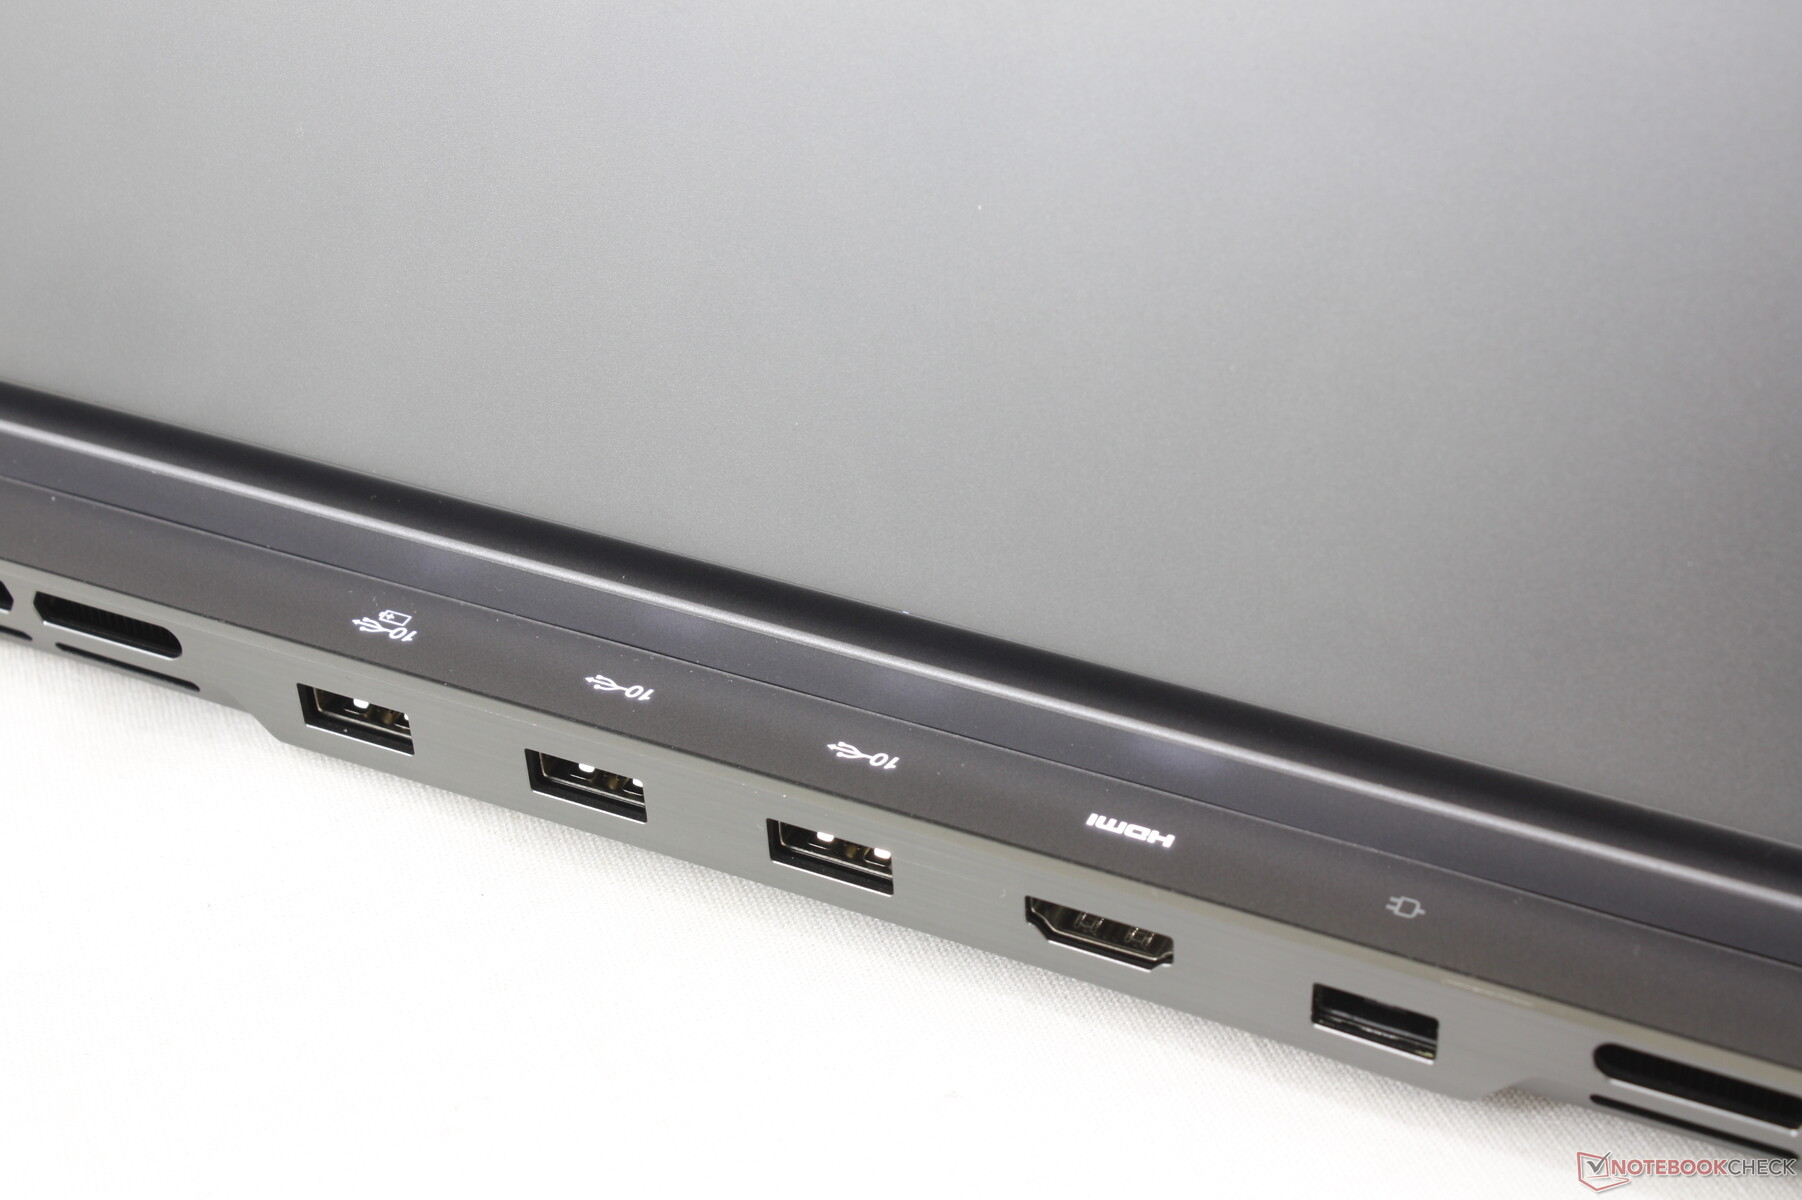
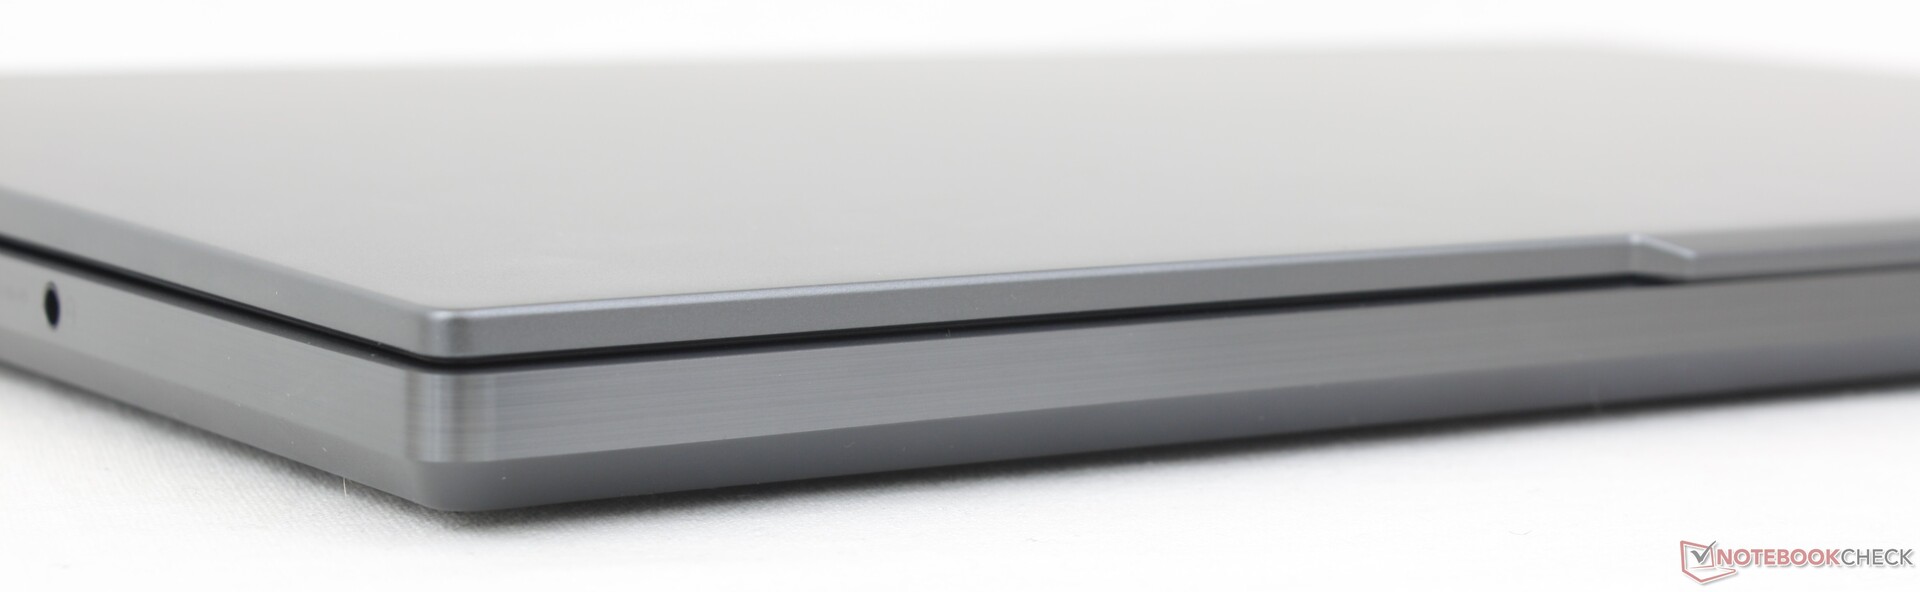
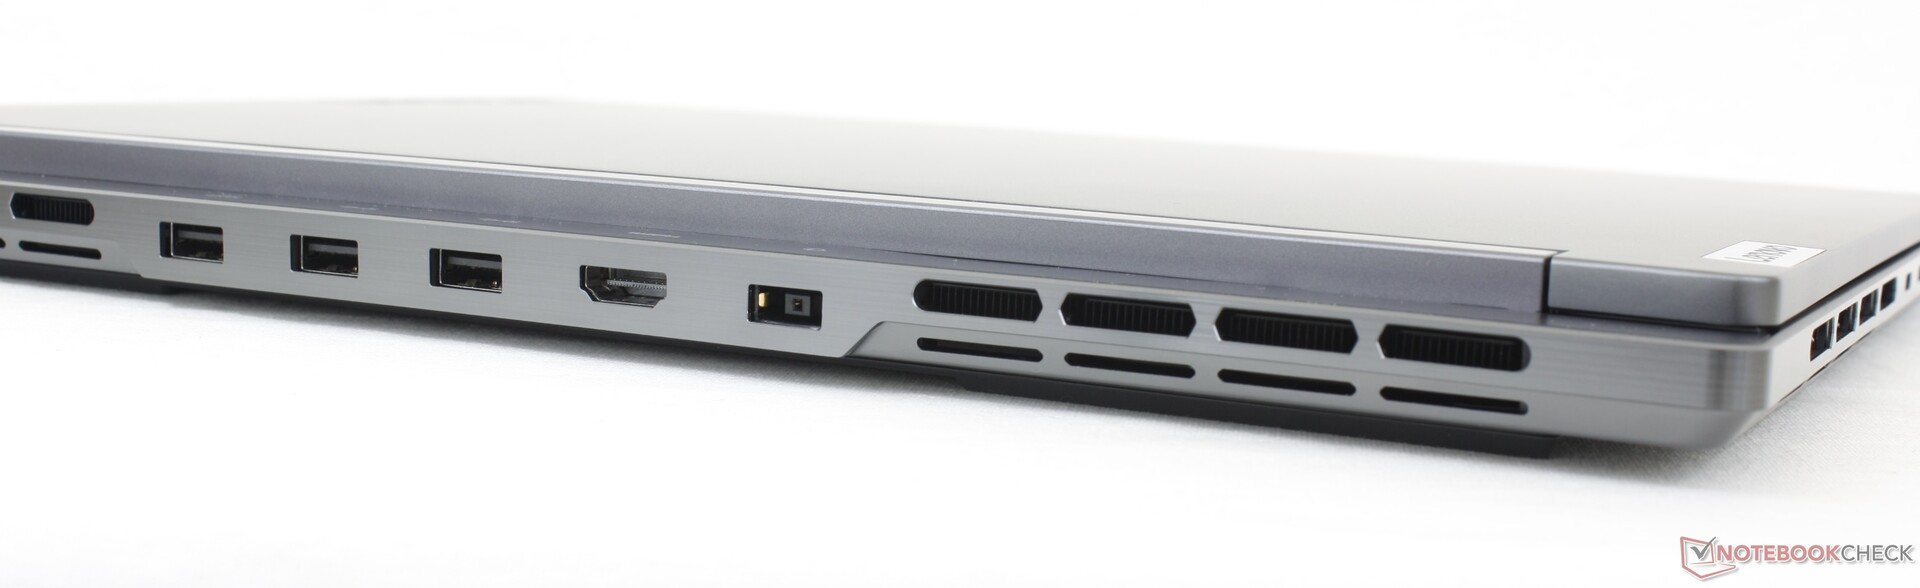
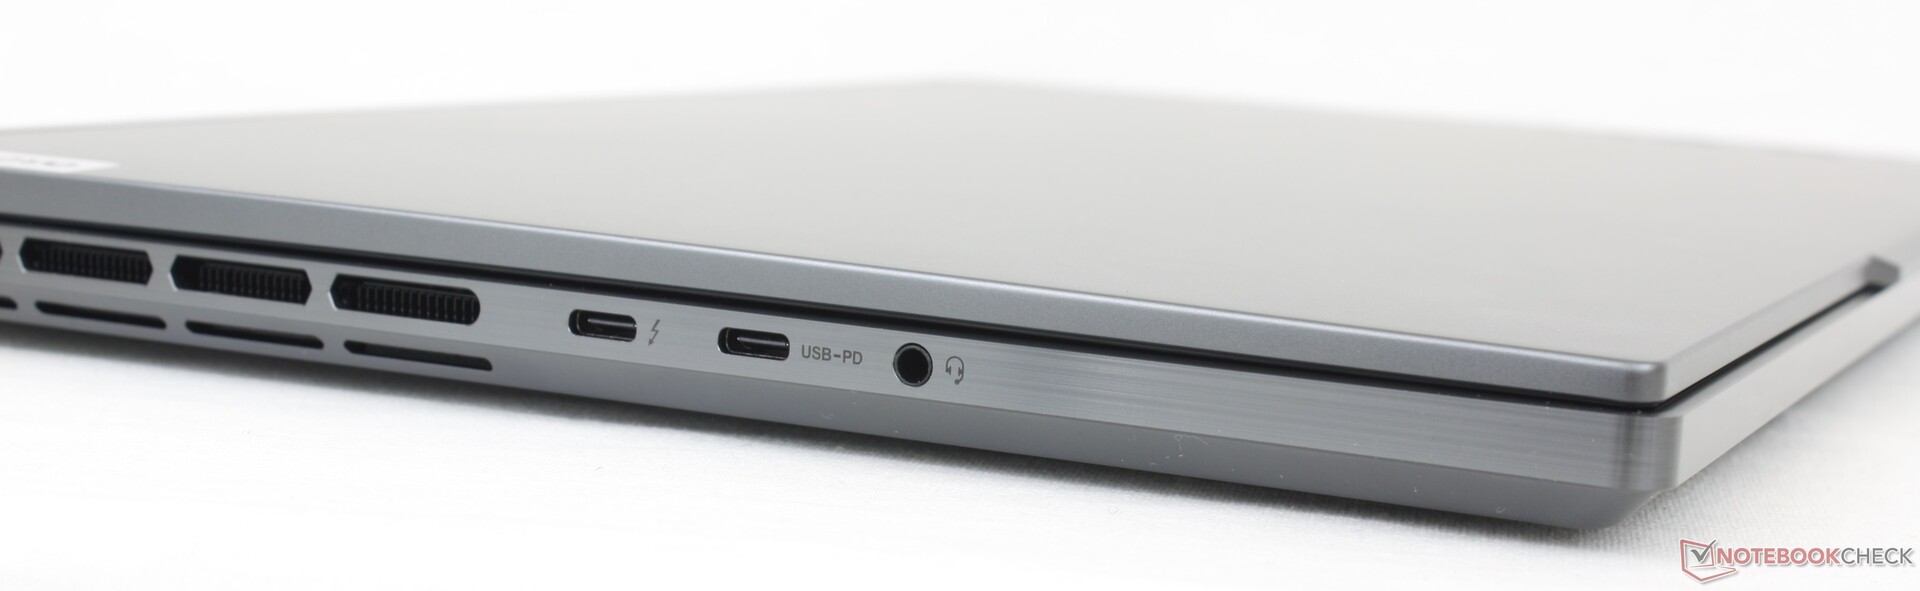
Conectividad: compatibilidad con Thunderbolt 4
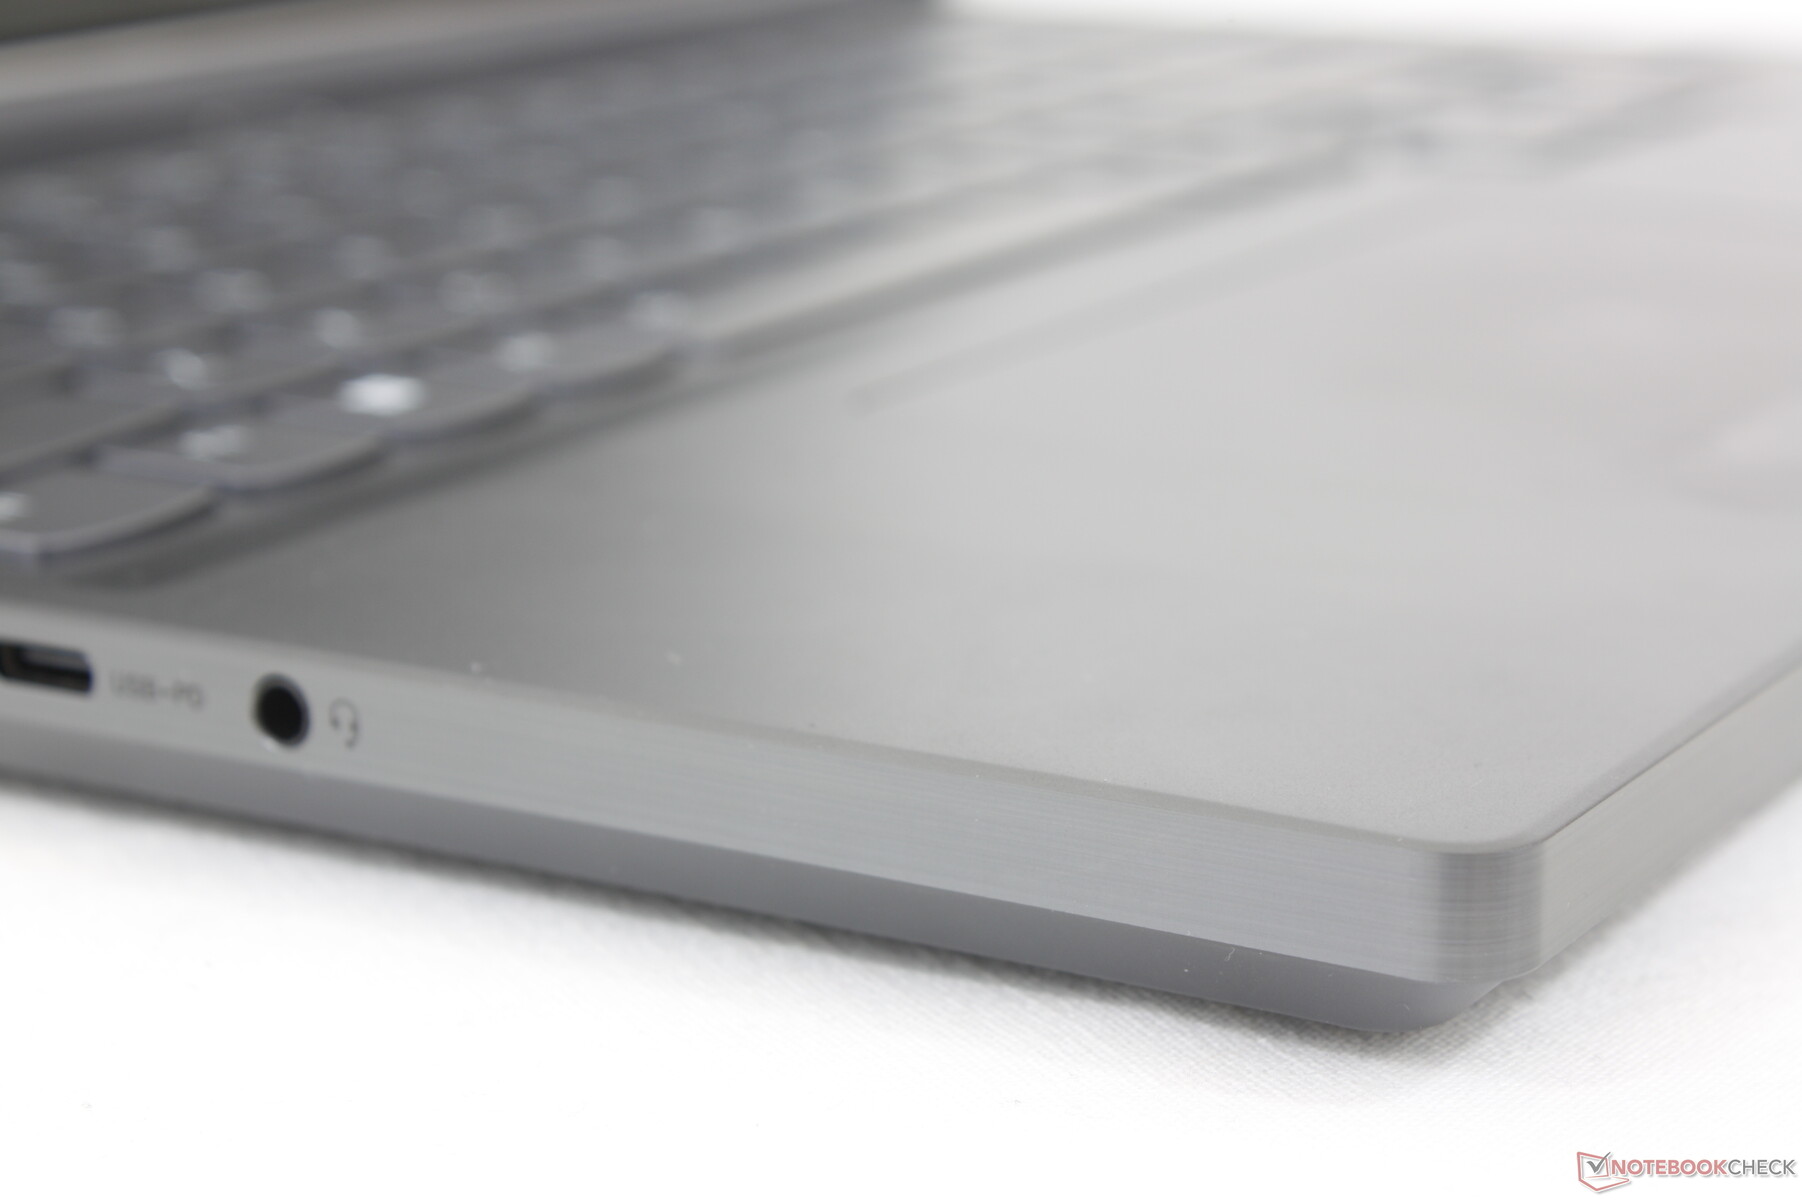
Las opciones de puertos son variadas, la mayoría en el borde trasero como en la serie Alienware. A diferencia del Alienware, empero, los dos puertos USB-C de nuestro Lenovo están en el borde izquierdo para un acceso más fácil.
Nótese que sólo uno de los dos puertos USB-C soporta Thunderbolt 4. Si ciertos accesorios no funcionan en un puerto, entonces asegúrate de probar el otro. Nuestro monitor externo Lepow, por ejemplo, funcionaría en el puerto USB-C 3.2 pero no en el puerto USB-C Thunderbolt.
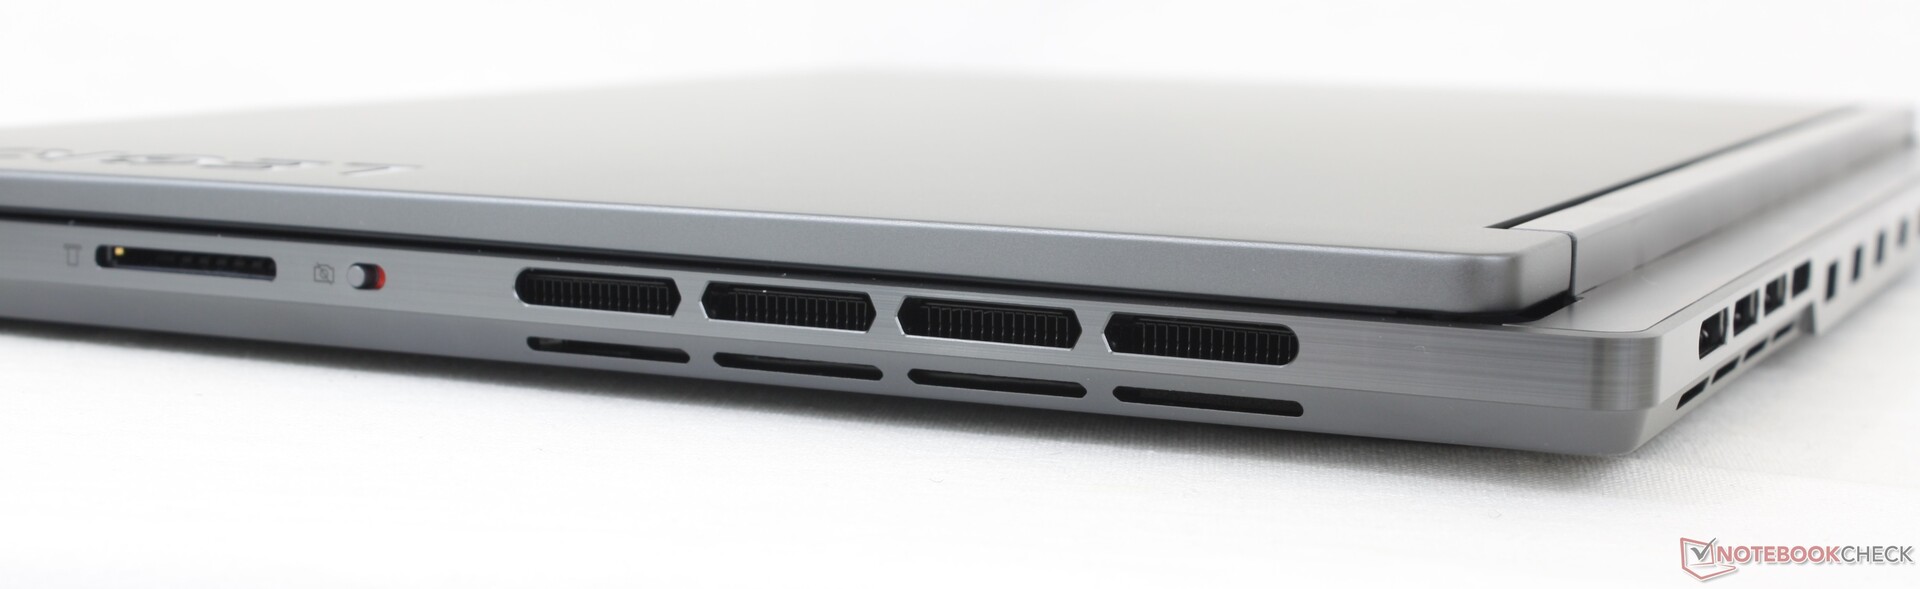
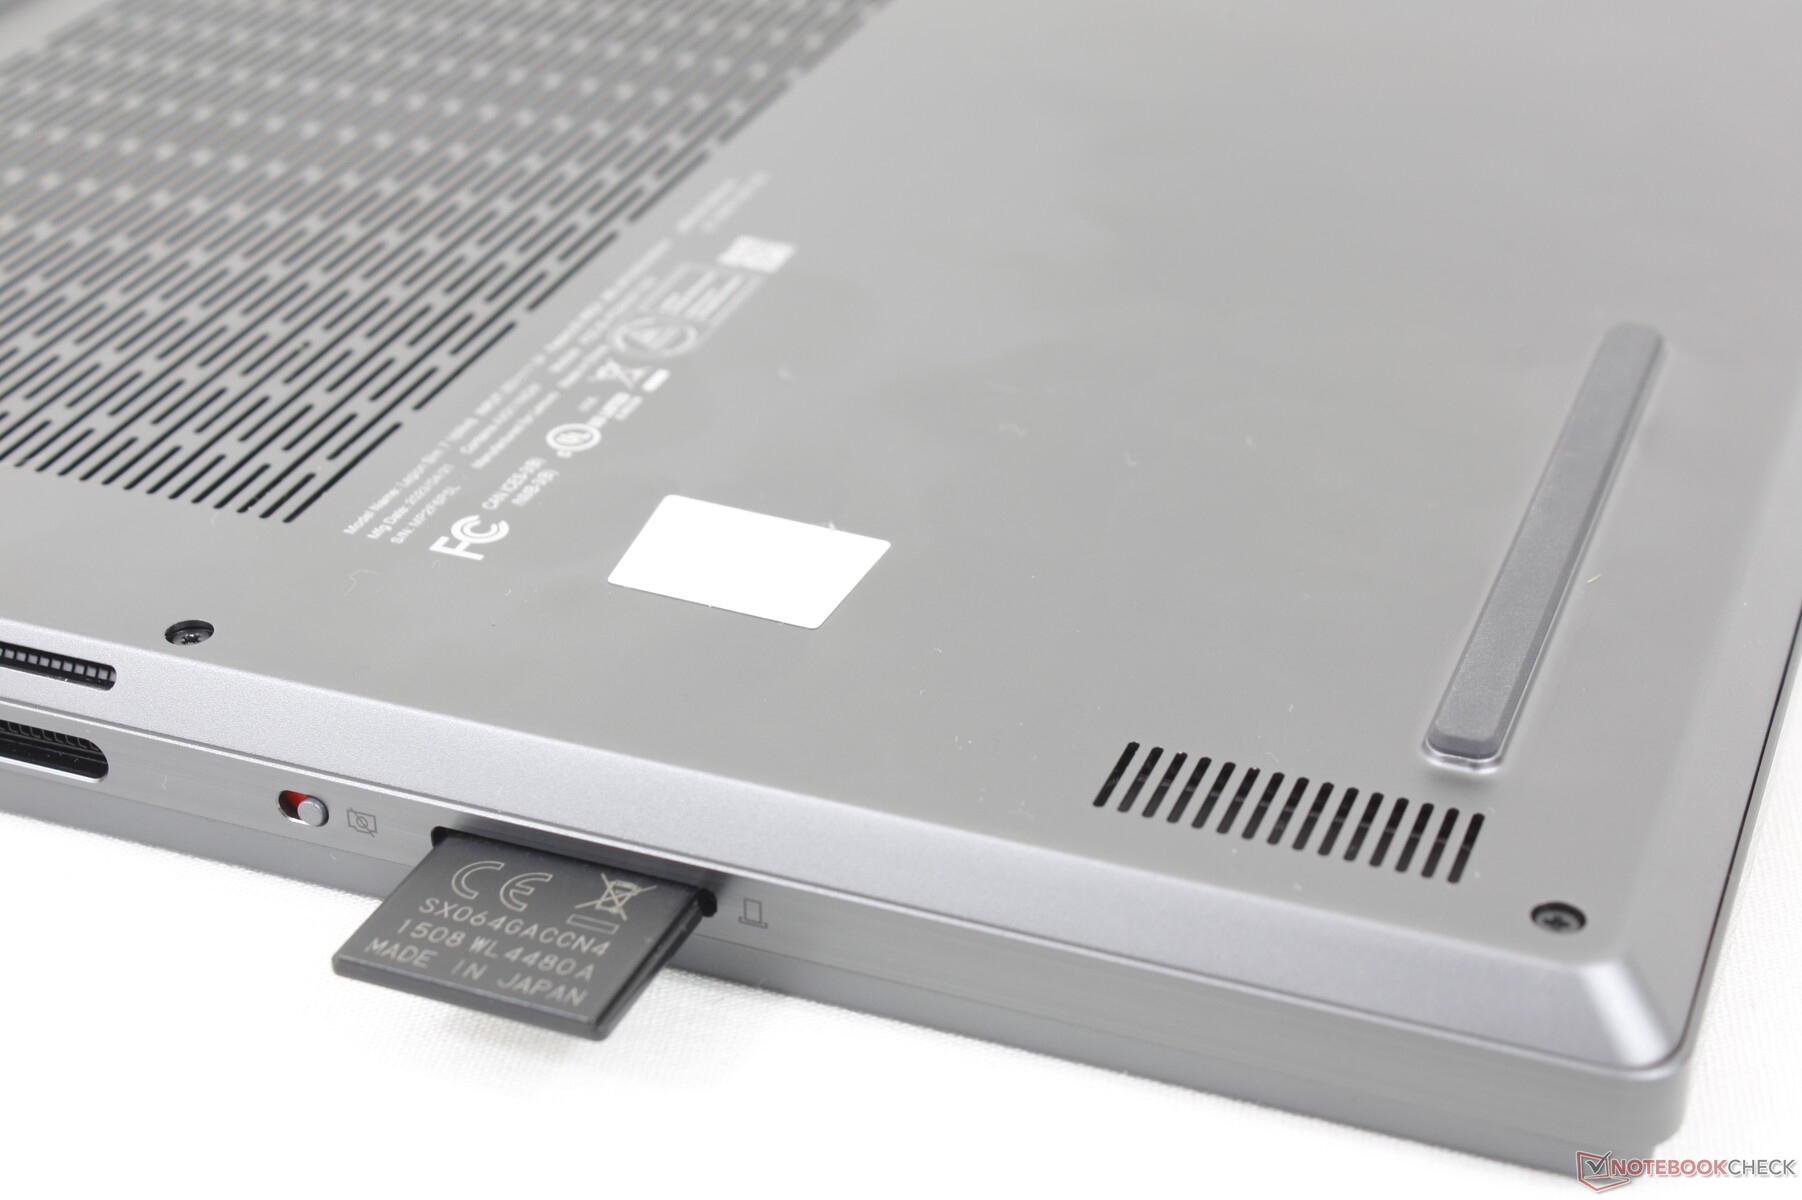
Lector de tarjetas SD
La velocidad media de transferencia a través del lector de tarjetas SD es de unos 80 MB/s con nuestra tarjeta de prueba UHS-II, que es aproximadamente la mitad de la velocidad del lector de tarjetas del Blade 16.
| SD Card Reader | |
| average JPG Copy Test (av. of 3 runs) | |
| Razer Blade 16 Early 2023 (AV PRO microSD 128 GB V60) | |
| Lenovo Legion Slim 7i 16 Gen 8 (Toshiba Exceria Pro SDXC 64 GB UHS-II) | |
| Alienware x16 R1 (AV PRO microSD 128 GB V60) | |
| maximum AS SSD Seq Read Test (1GB) | |
| Alienware x16 R1 (AV PRO microSD 128 GB V60) | |
| Razer Blade 16 Early 2023 (AV PRO microSD 128 GB V60) | |
| Lenovo Legion Slim 7i 16 Gen 8 (Toshiba Exceria Pro SDXC 64 GB UHS-II) | |
Comunicación
Un Intel AX211 viene de serie para la conectividad Wi-Fi 6E y Bluetooth 5.3. El rendimiento es constante y fiable cuando se conecta a nuestra red Asus AXE11000 de 6 GHz.
| Networking | |
| iperf3 transmit AXE11000 | |
| Lenovo Legion Pro 7 RTX4090 | |
| Asus ROG Strix G16 G614JZ | |
| Razer Blade 16 Early 2023 | |
| Lenovo Legion Slim 7i 16 Gen 8 | |
| HP Omen 16-wf000 | |
| Alienware x16 R1 | |
| iperf3 receive AXE11000 | |
| Lenovo Legion Pro 7 RTX4090 | |
| Asus ROG Strix G16 G614JZ | |
| Razer Blade 16 Early 2023 | |
| Alienware x16 R1 | |
| HP Omen 16-wf000 | |
| Lenovo Legion Slim 7i 16 Gen 8 | |
| iperf3 transmit AXE11000 6GHz | |
| Lenovo Legion Slim 7i 16 Gen 8 | |
| Razer Blade 16 Early 2023 | |
| HP Omen 16-wf000 | |
| Alienware x16 R1 | |
| iperf3 receive AXE11000 6GHz | |
| Lenovo Legion Slim 7i 16 Gen 8 | |
| Razer Blade 16 Early 2023 | |
| HP Omen 16-wf000 | |
| Alienware x16 R1 | |
Cámara web
La webcam de 2 MP sigue siendo la misma que en el modelo del año pasado. No es compatible con infrarrojos, pero incluye un interruptor para apagar la webcam.


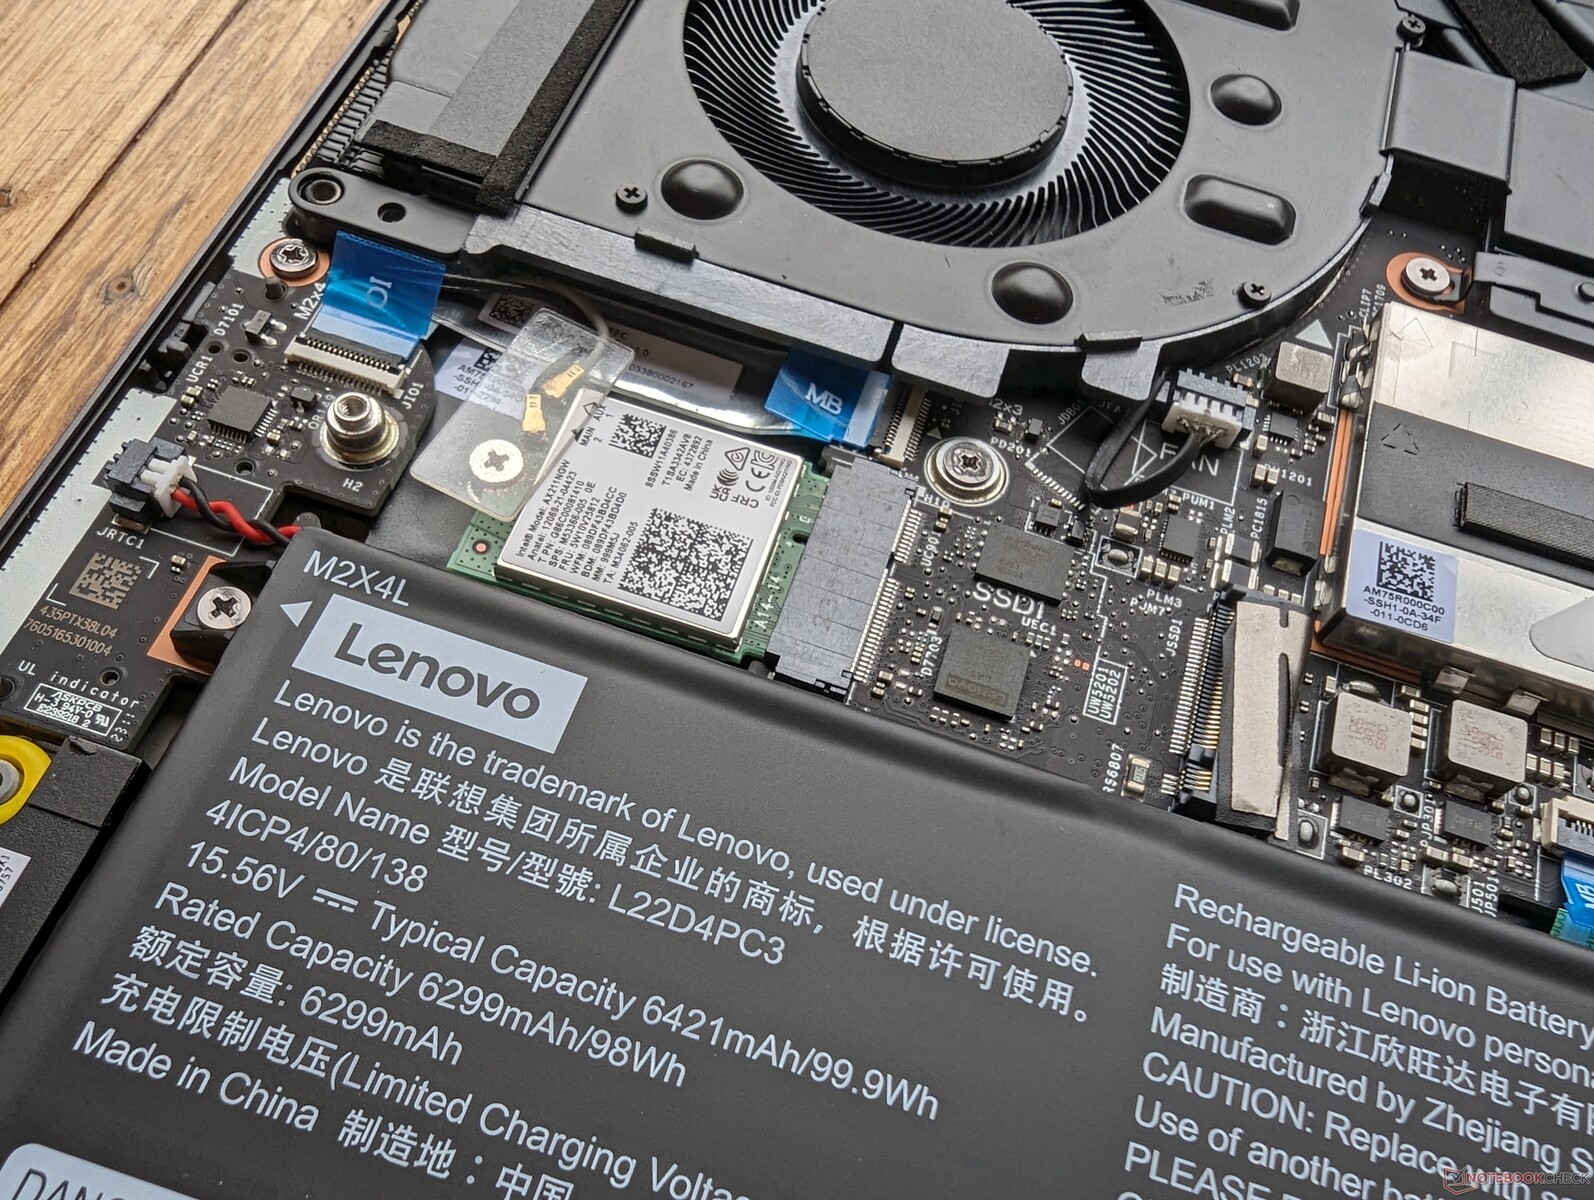
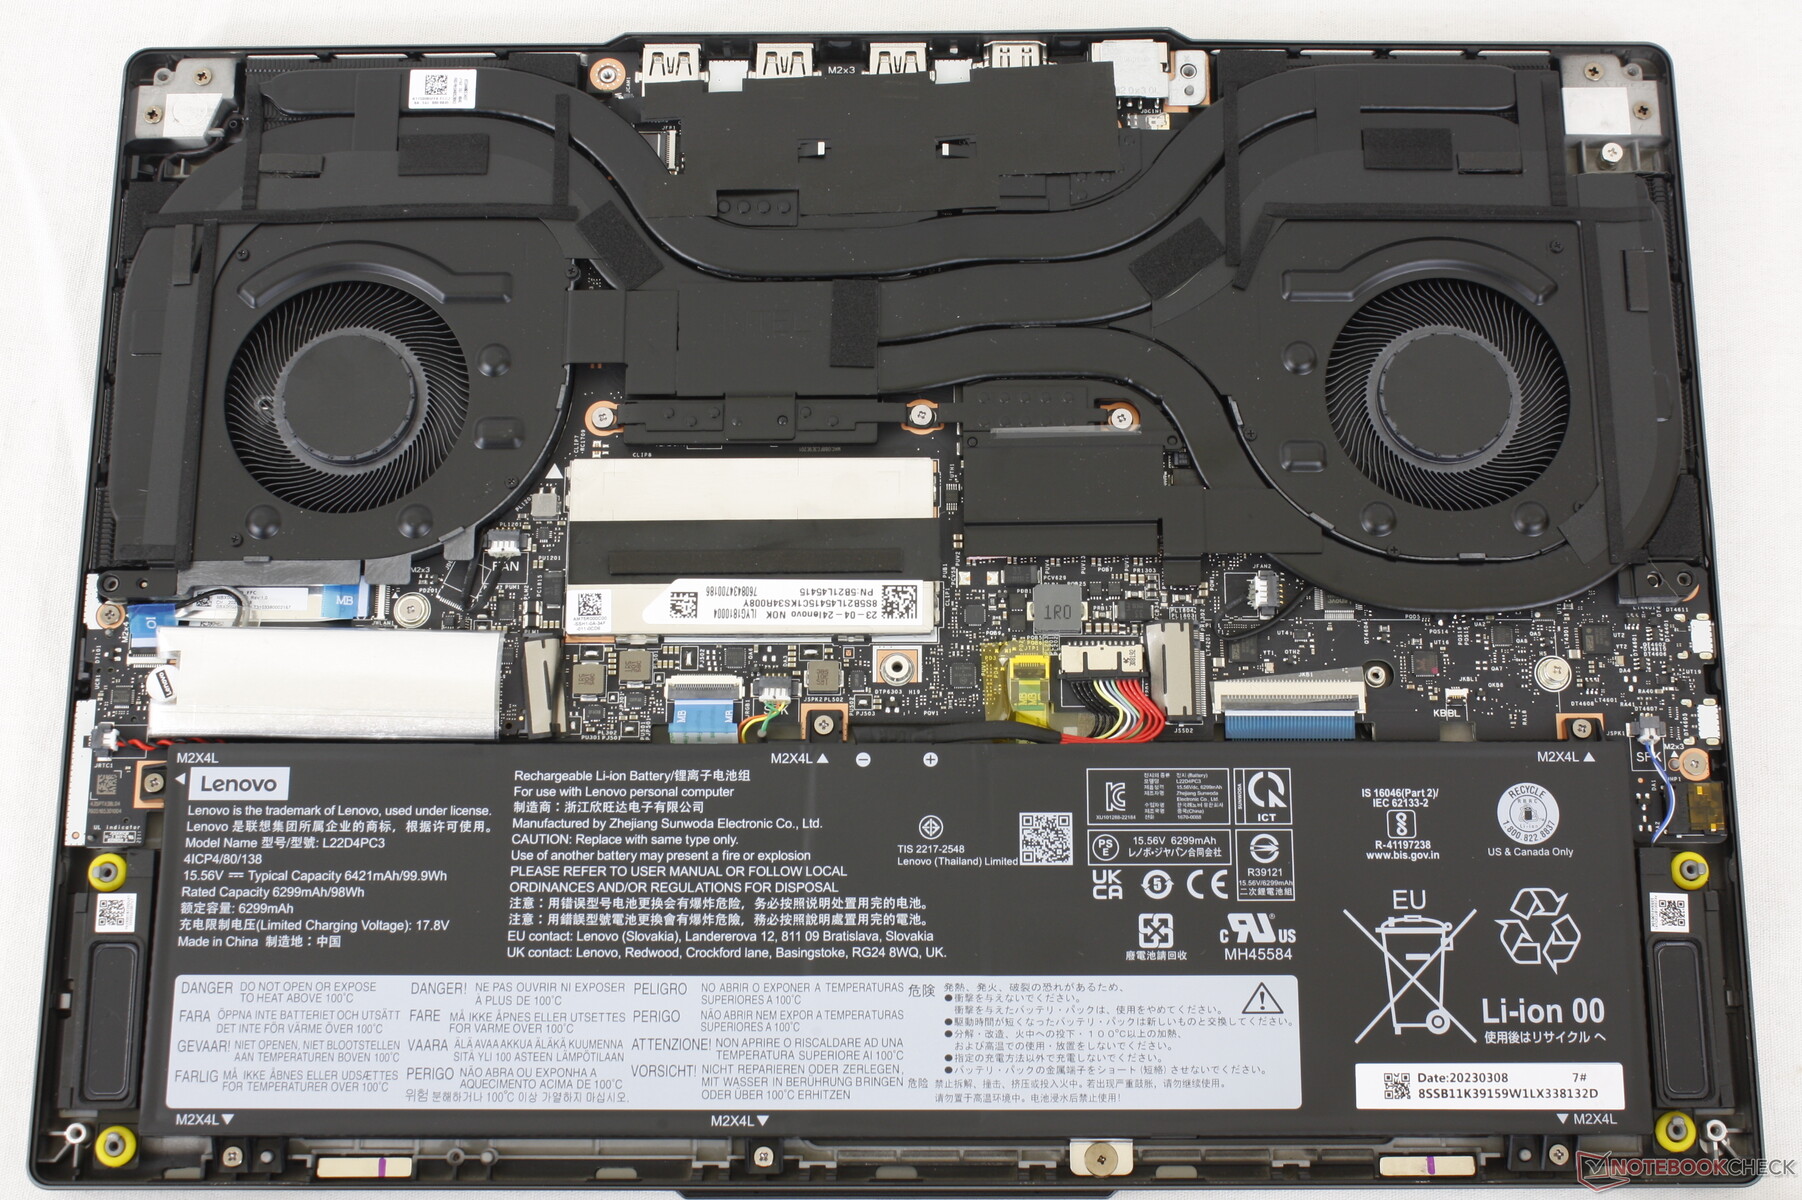
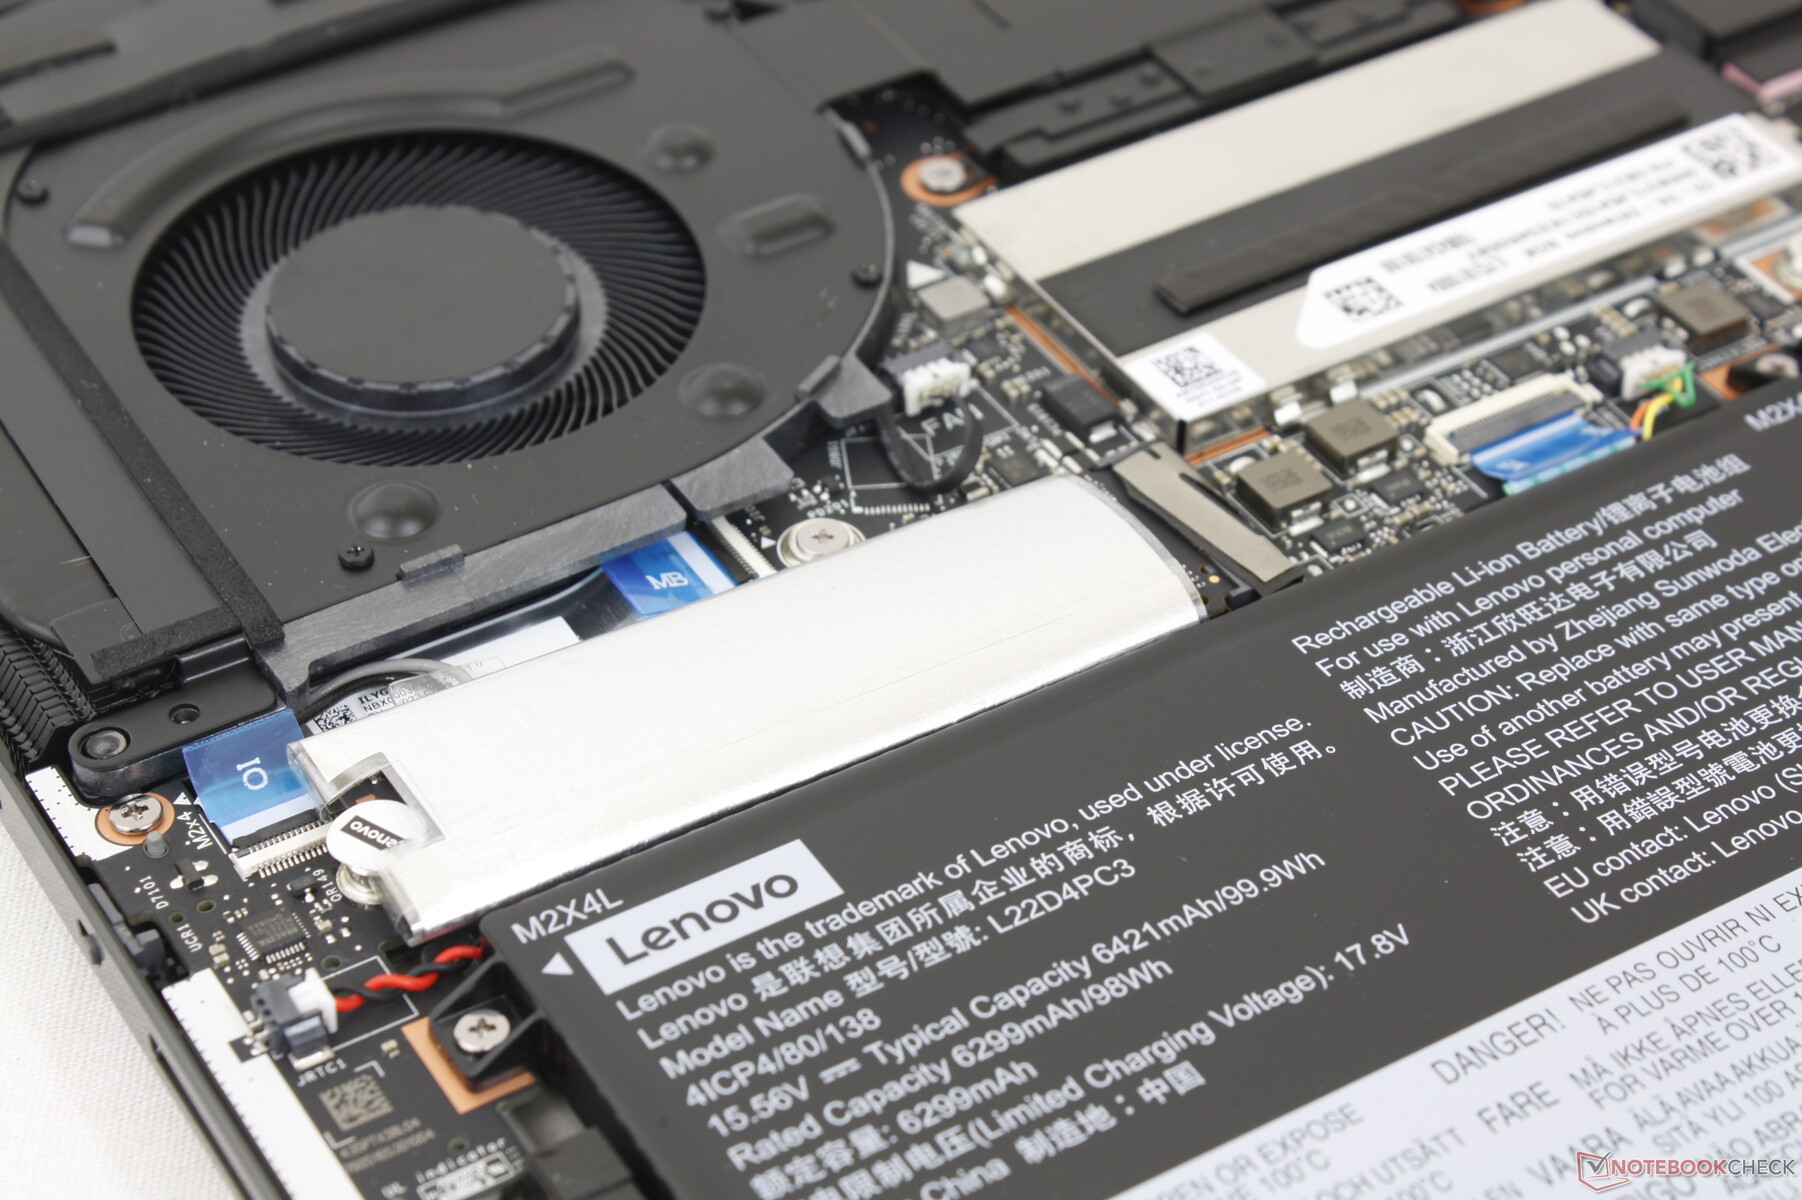
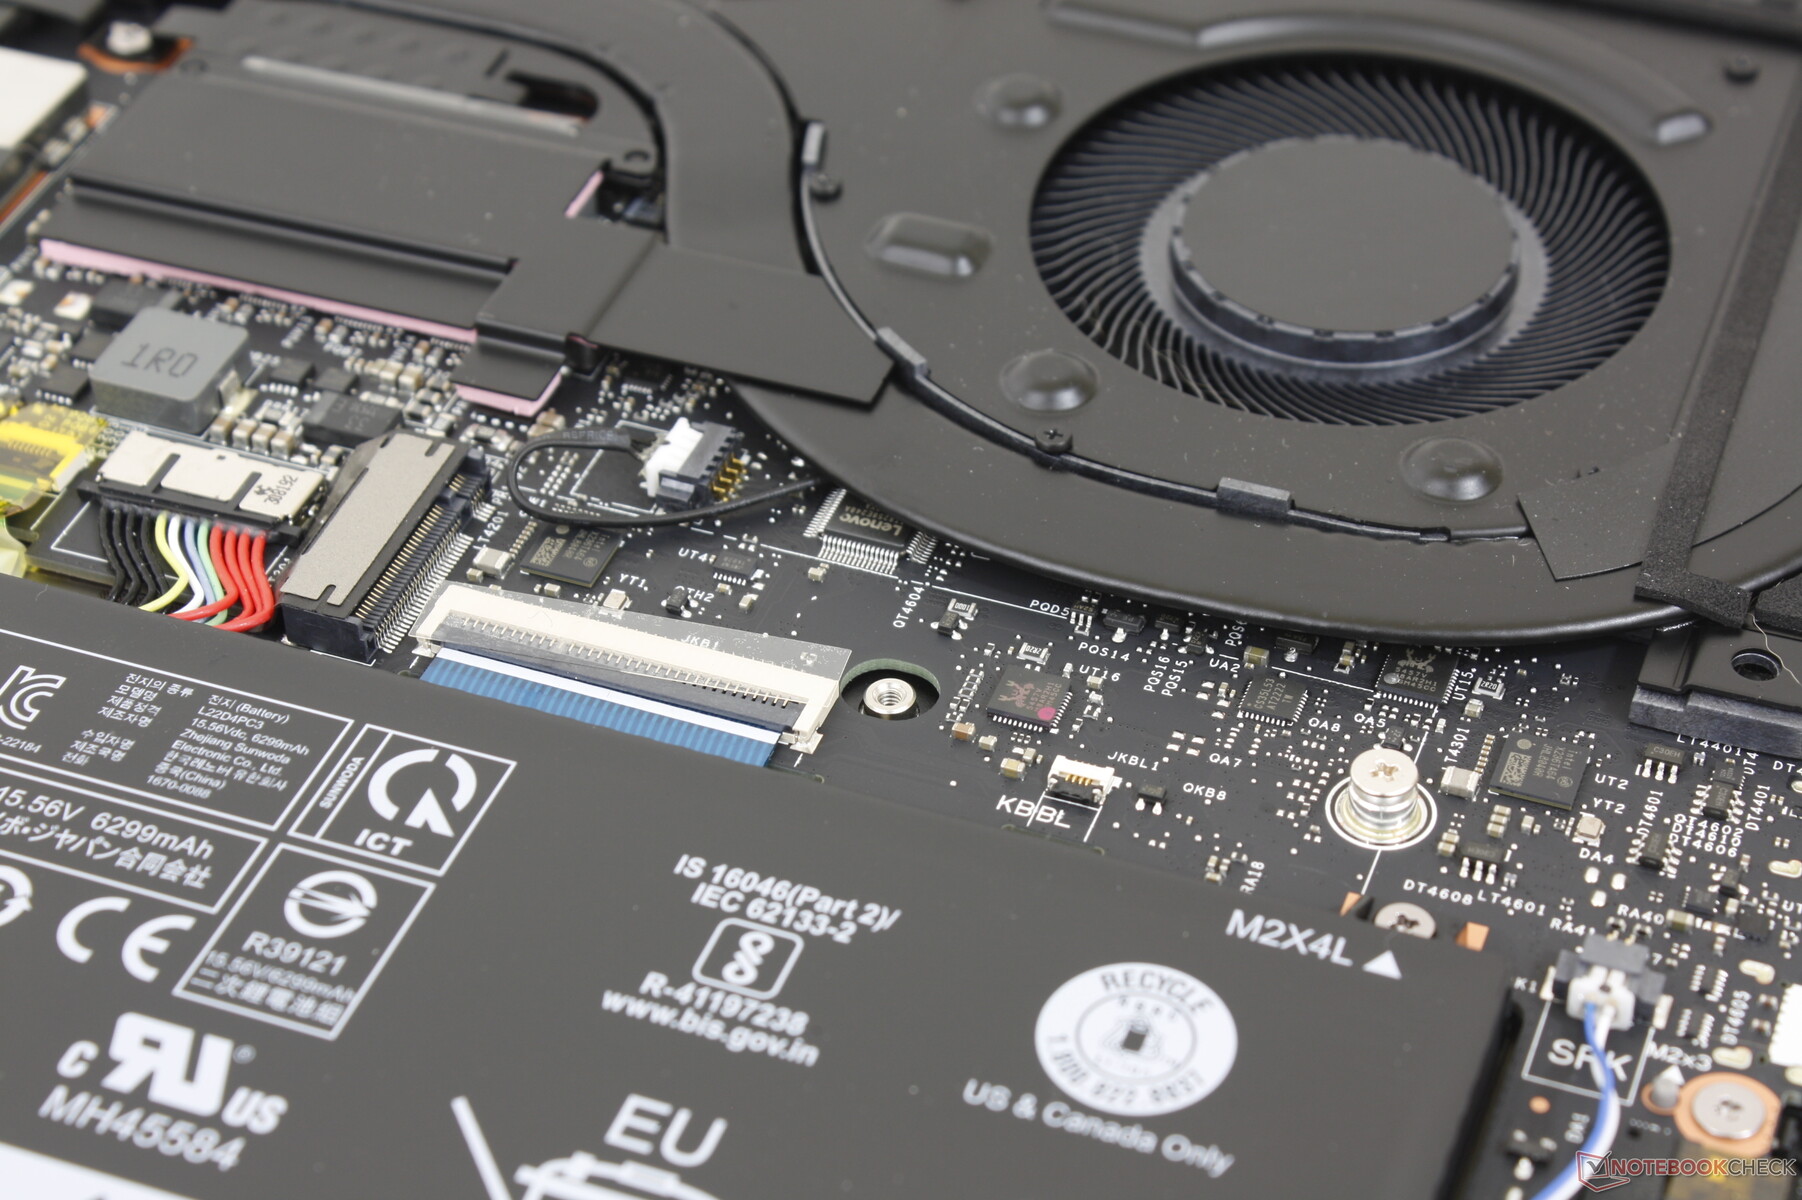
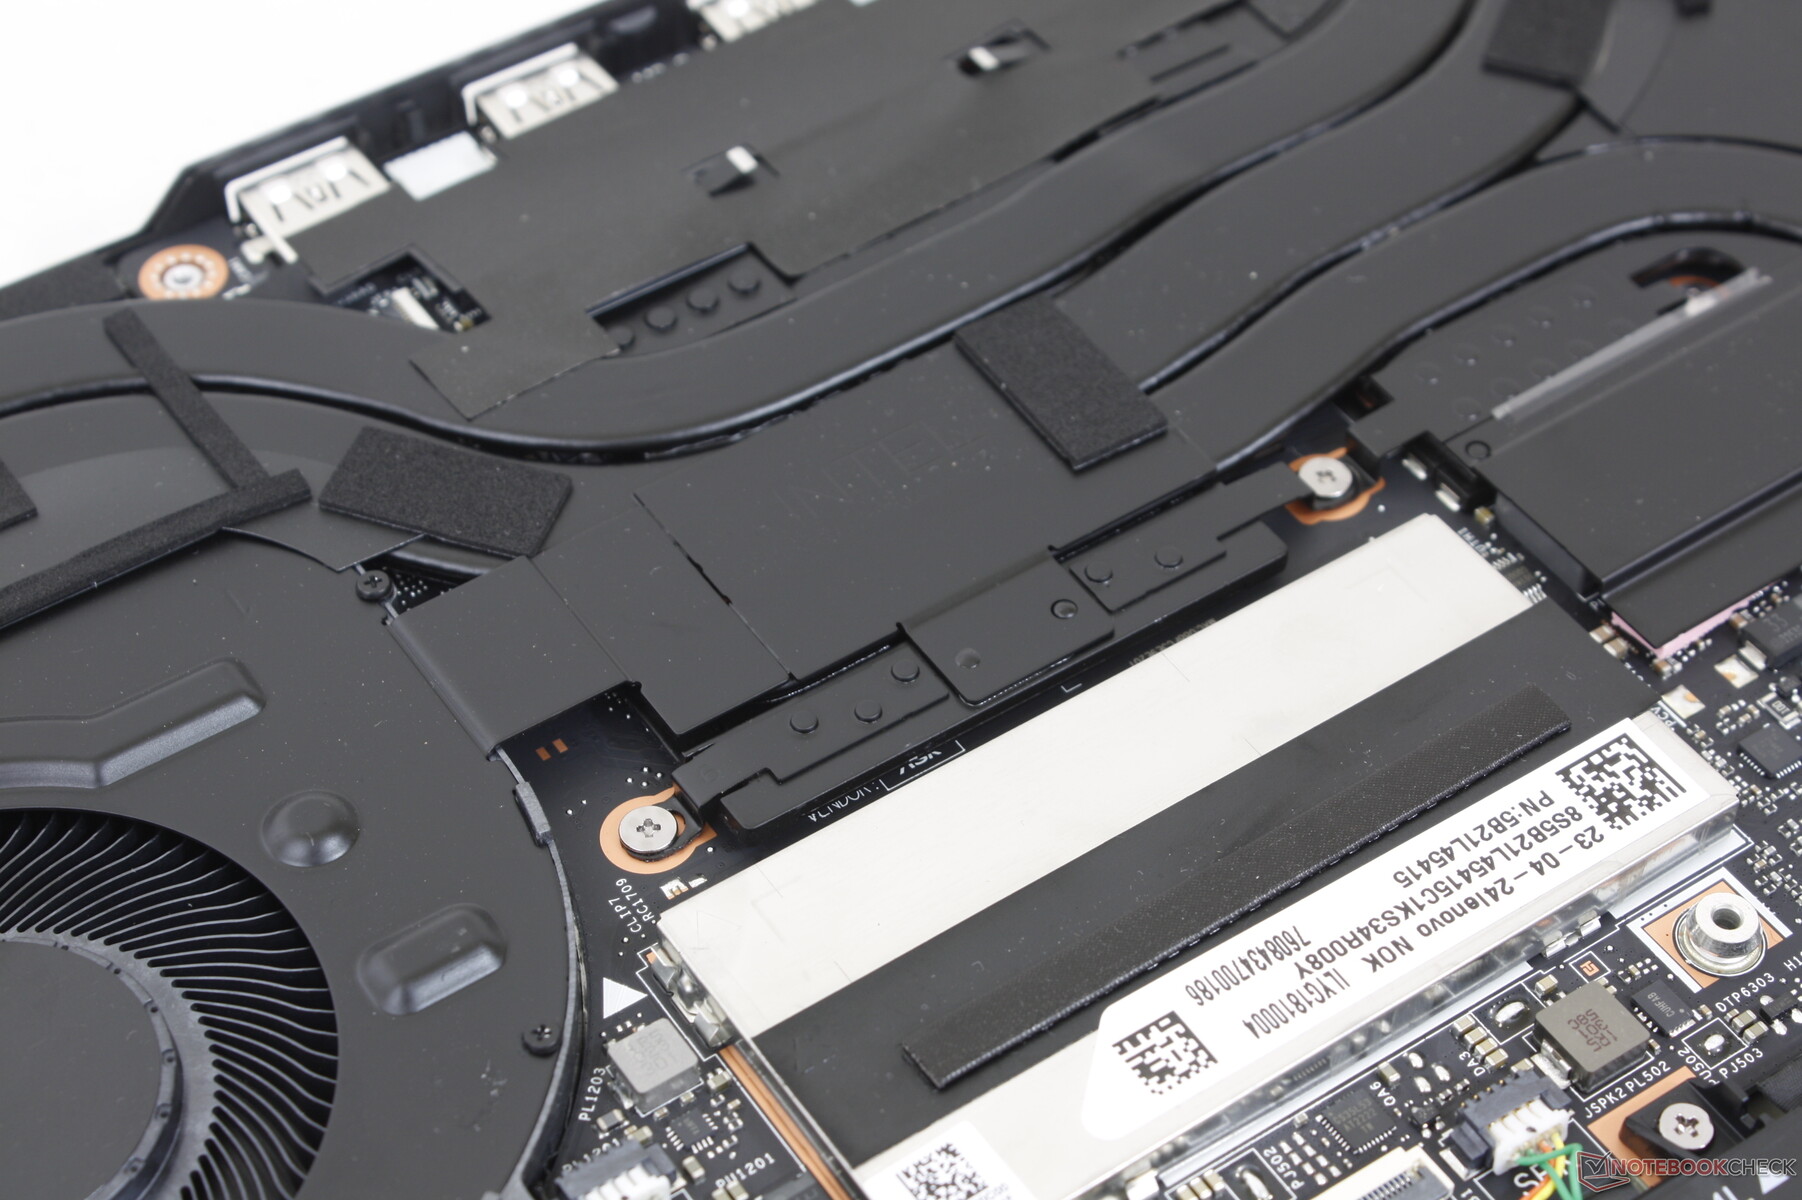
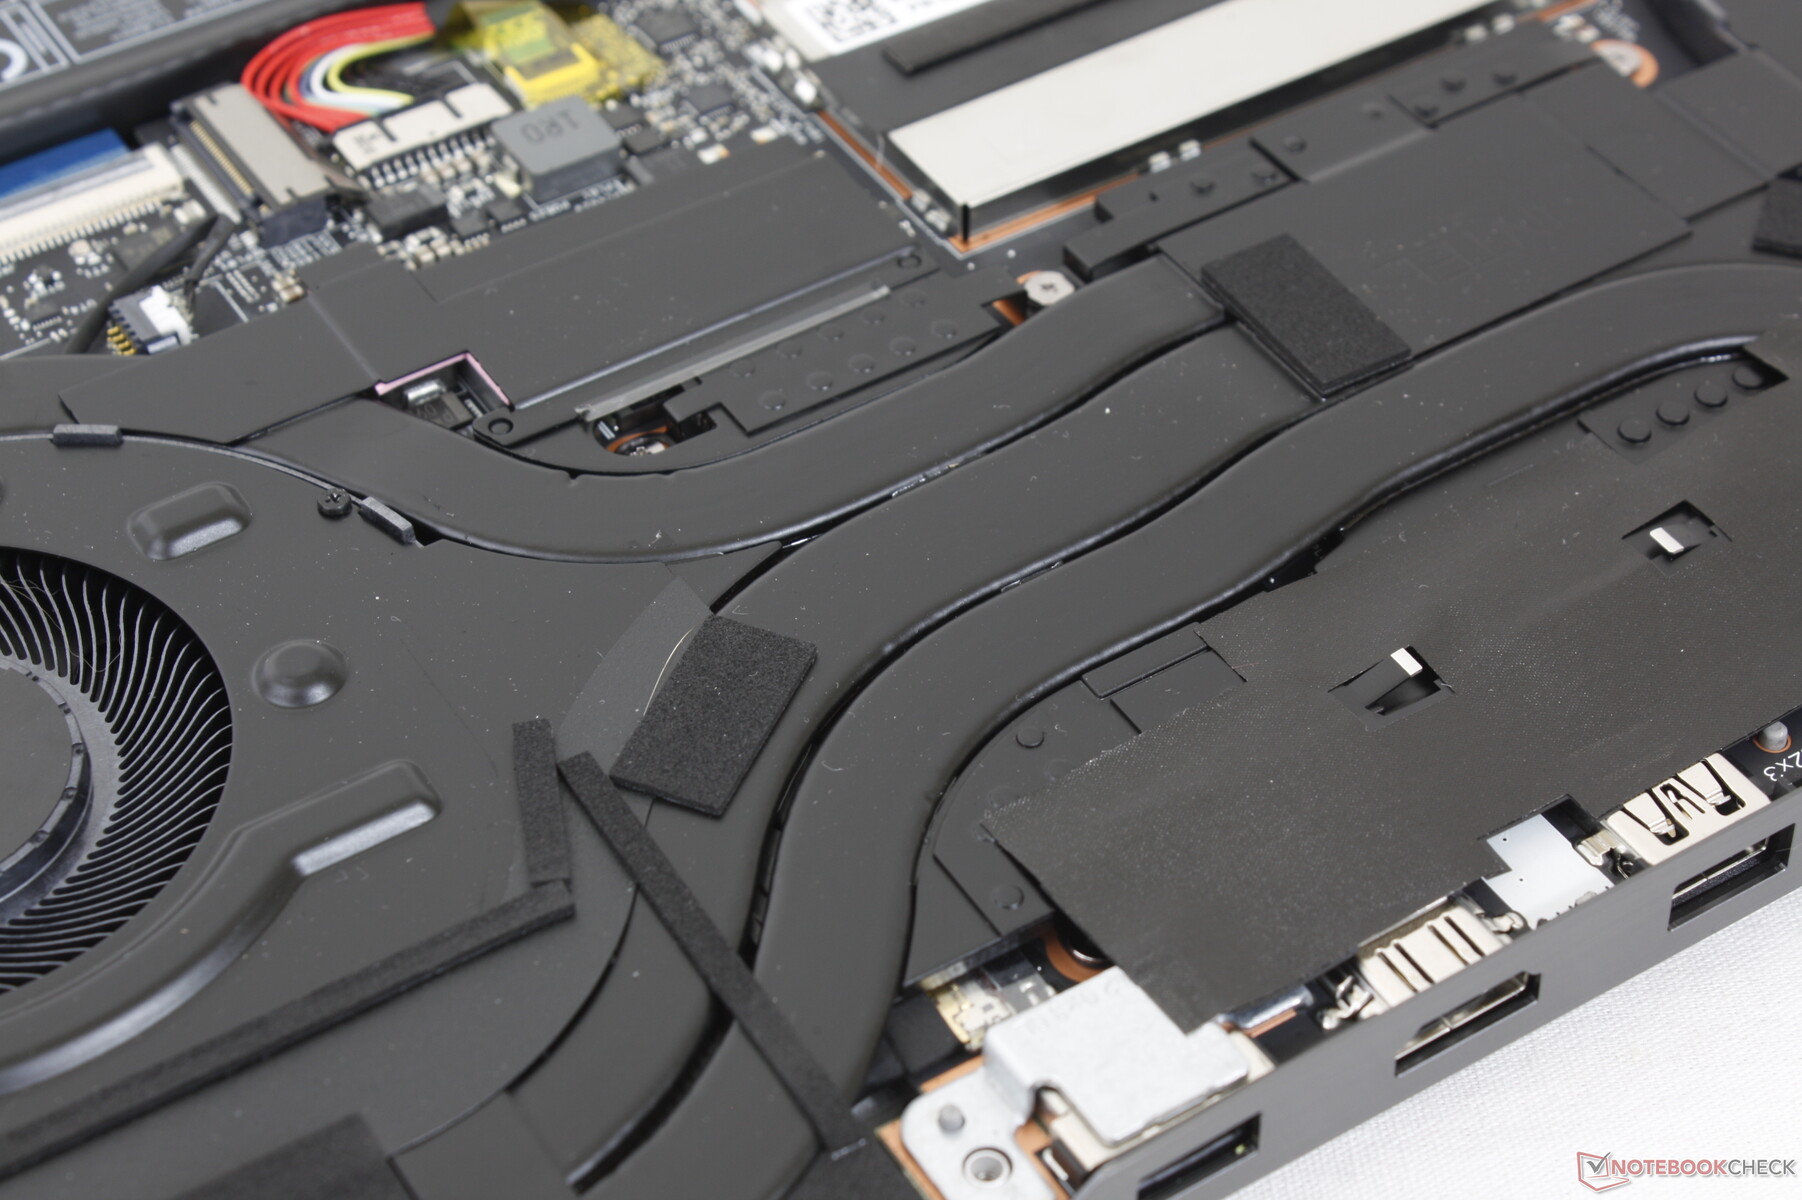
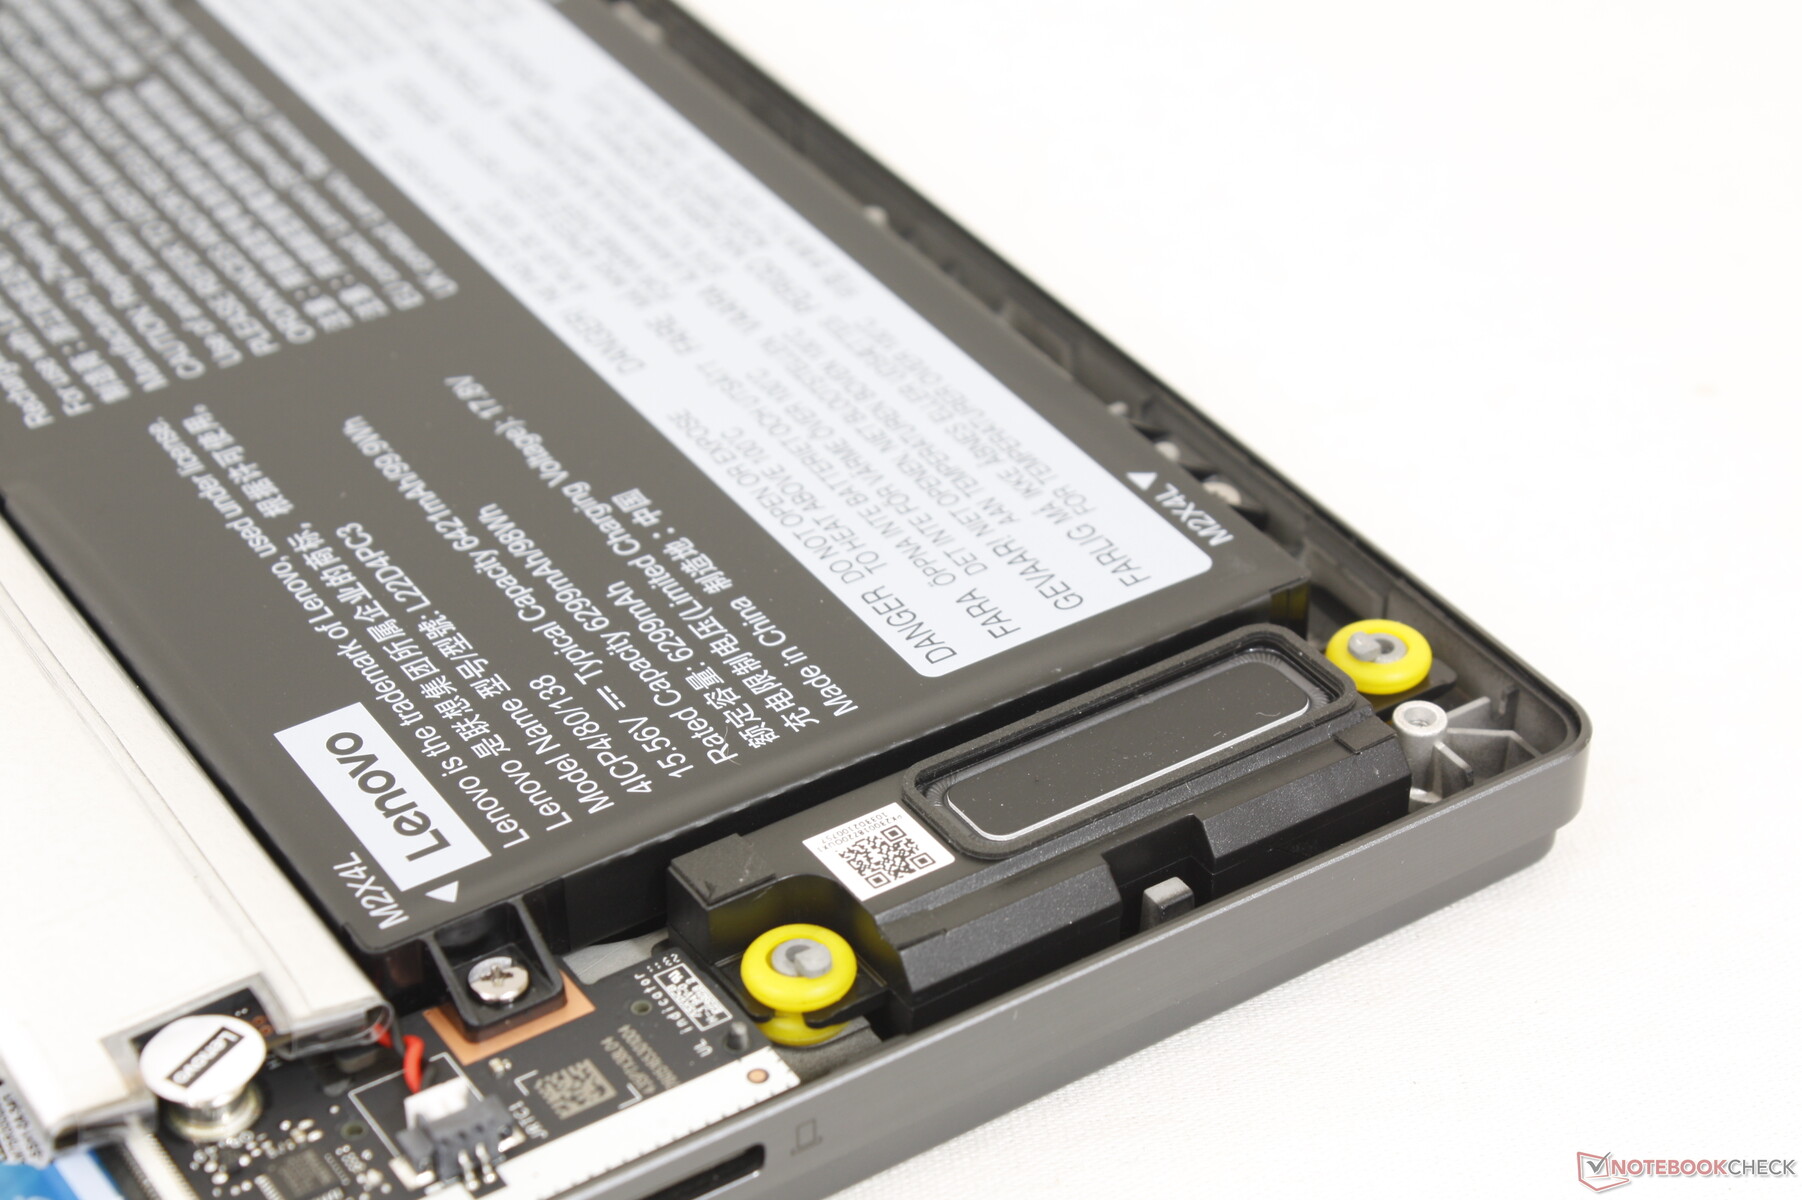
Mantenimiento
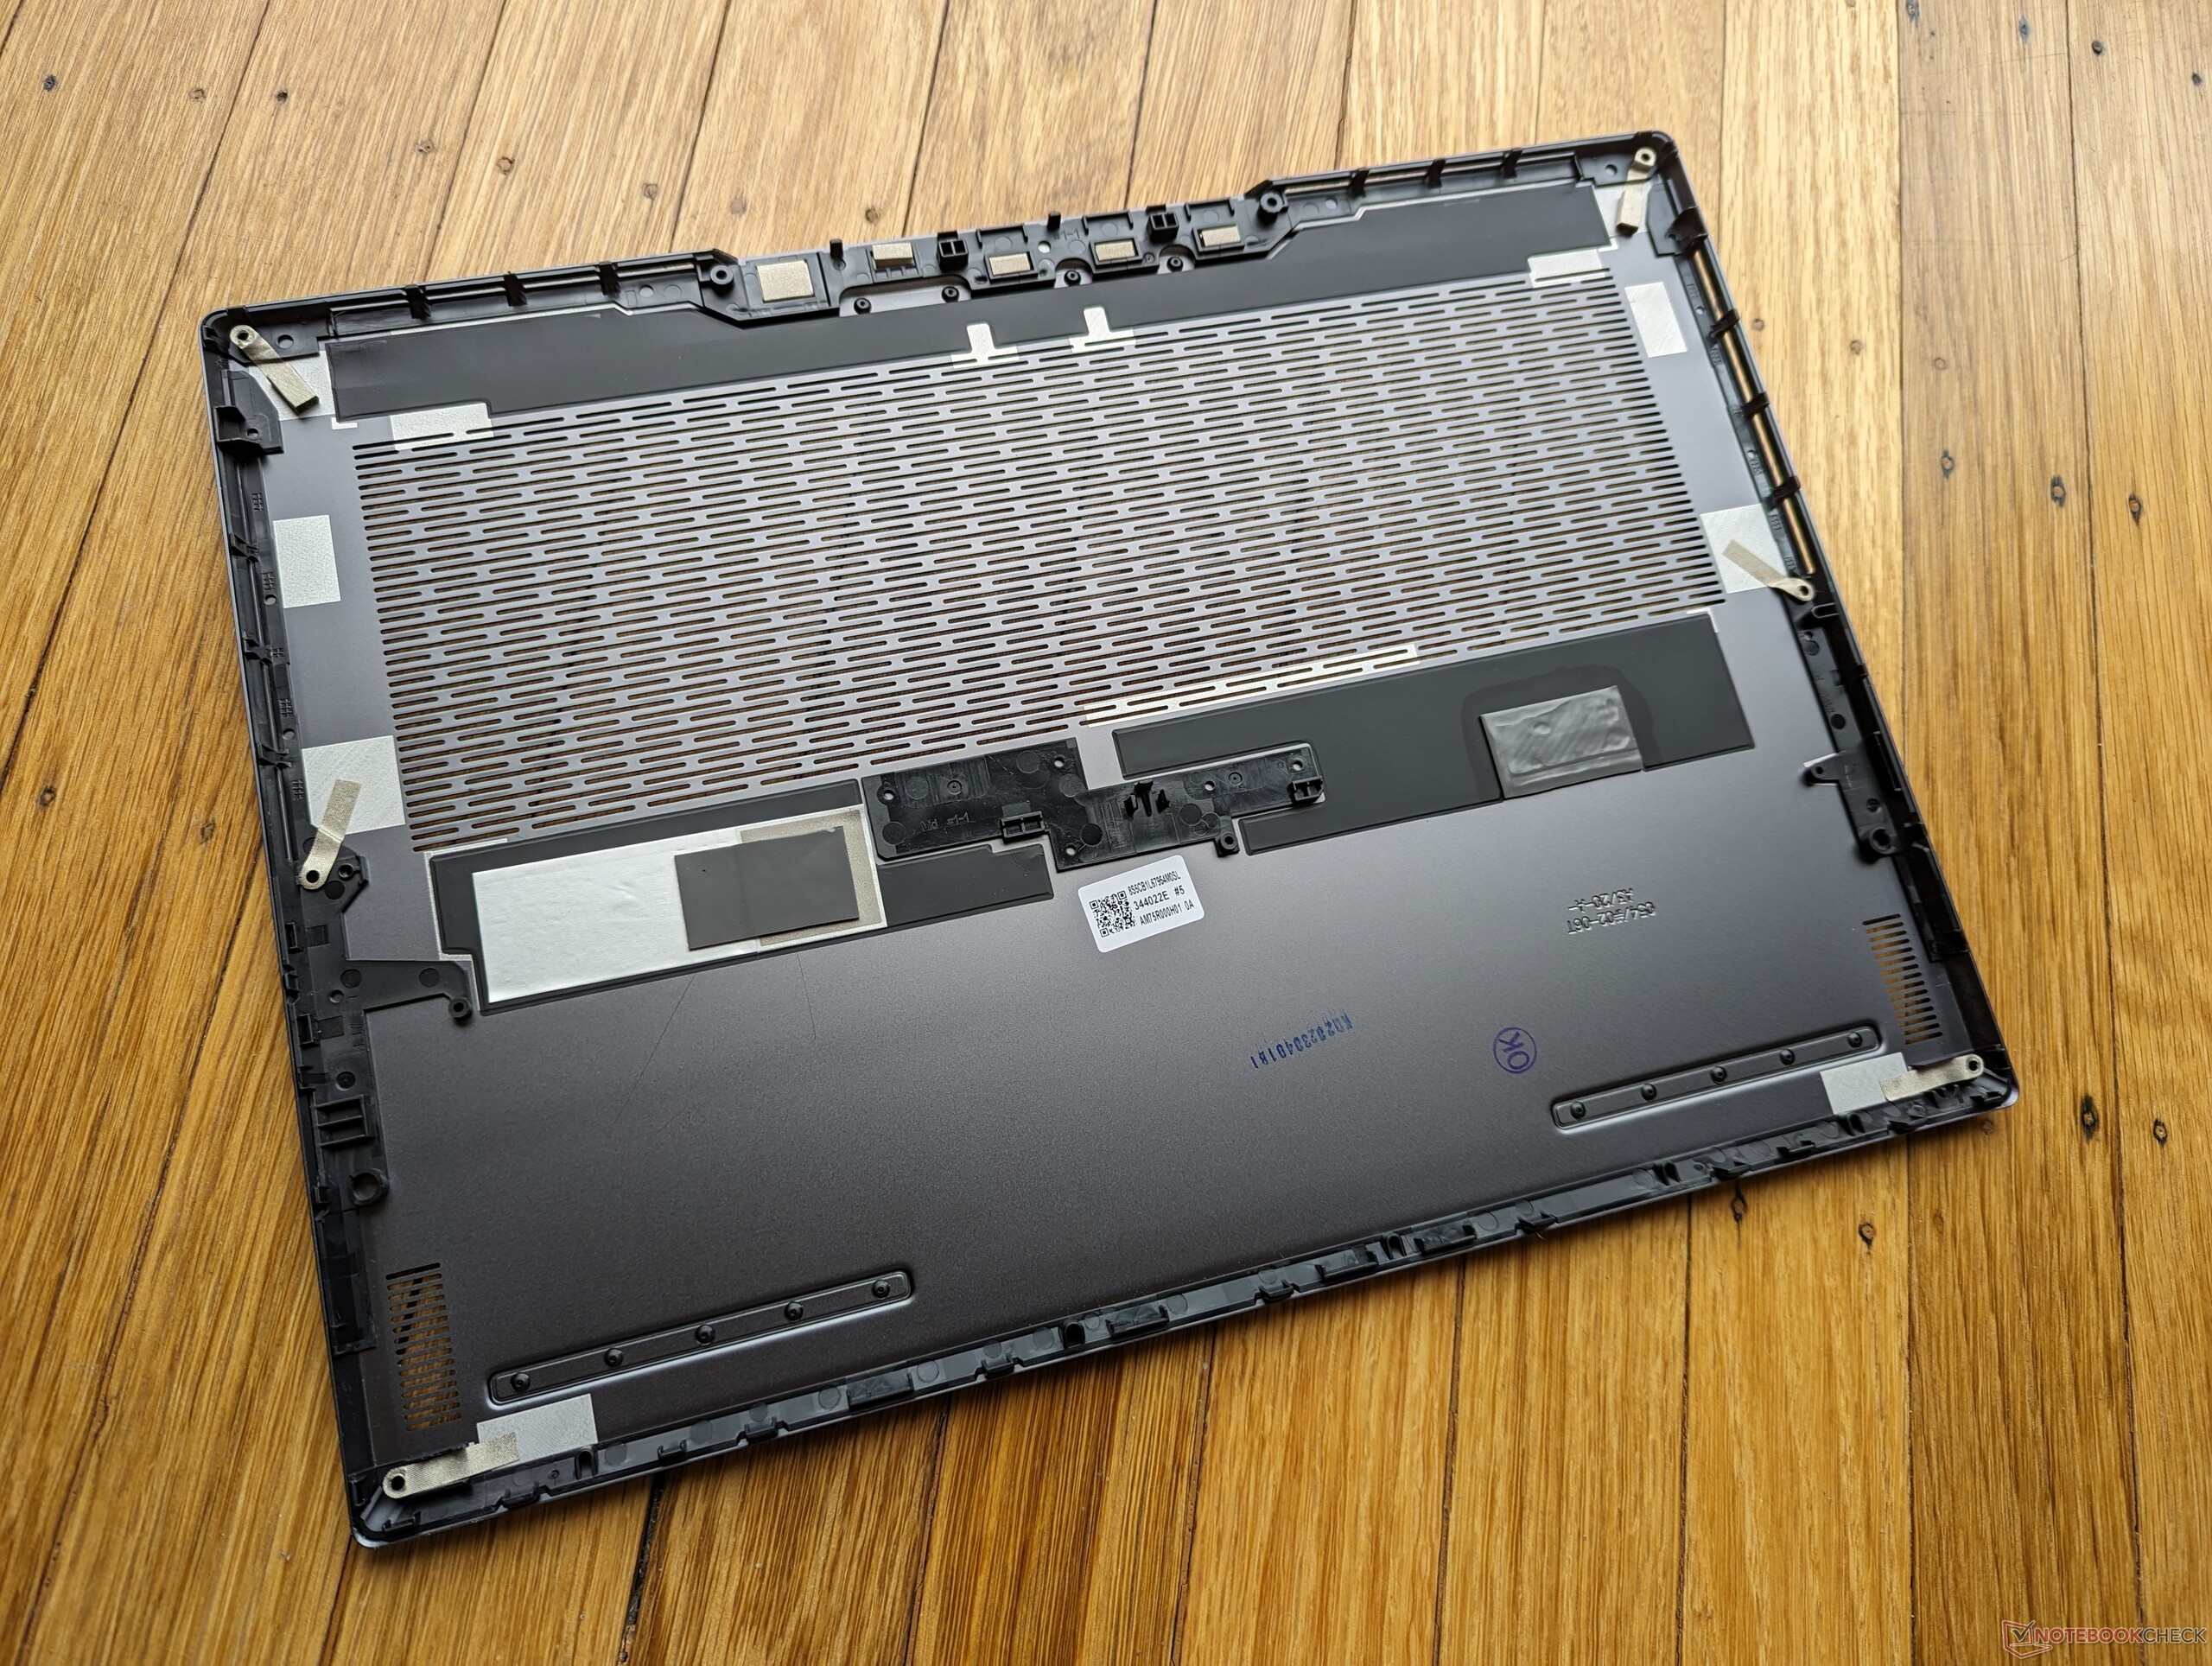
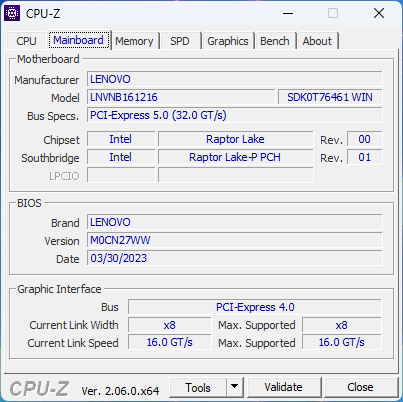
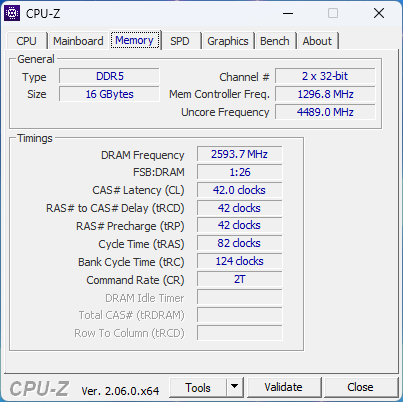
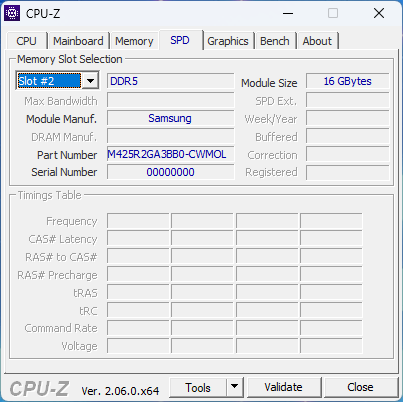
El panel inferior se fija con ocho tornillos Phillips para facilitar su extracción. Los propietarios tienen acceso directo a dos ranuras M.2 2280 PCIe4, el módulo WLAN y la batería. La RAM consiste en 16 GB de DDR5-5200 soldada más una ranura SODIMM ampliable bajo el blindaje de aluminio cerca del centro.
Accesorios y garantía
No hay más extras en la caja que el adaptador de CA y la documentación. Se aplica la garantía estándar limitada de un año del fabricante si se compra en EE.UU.
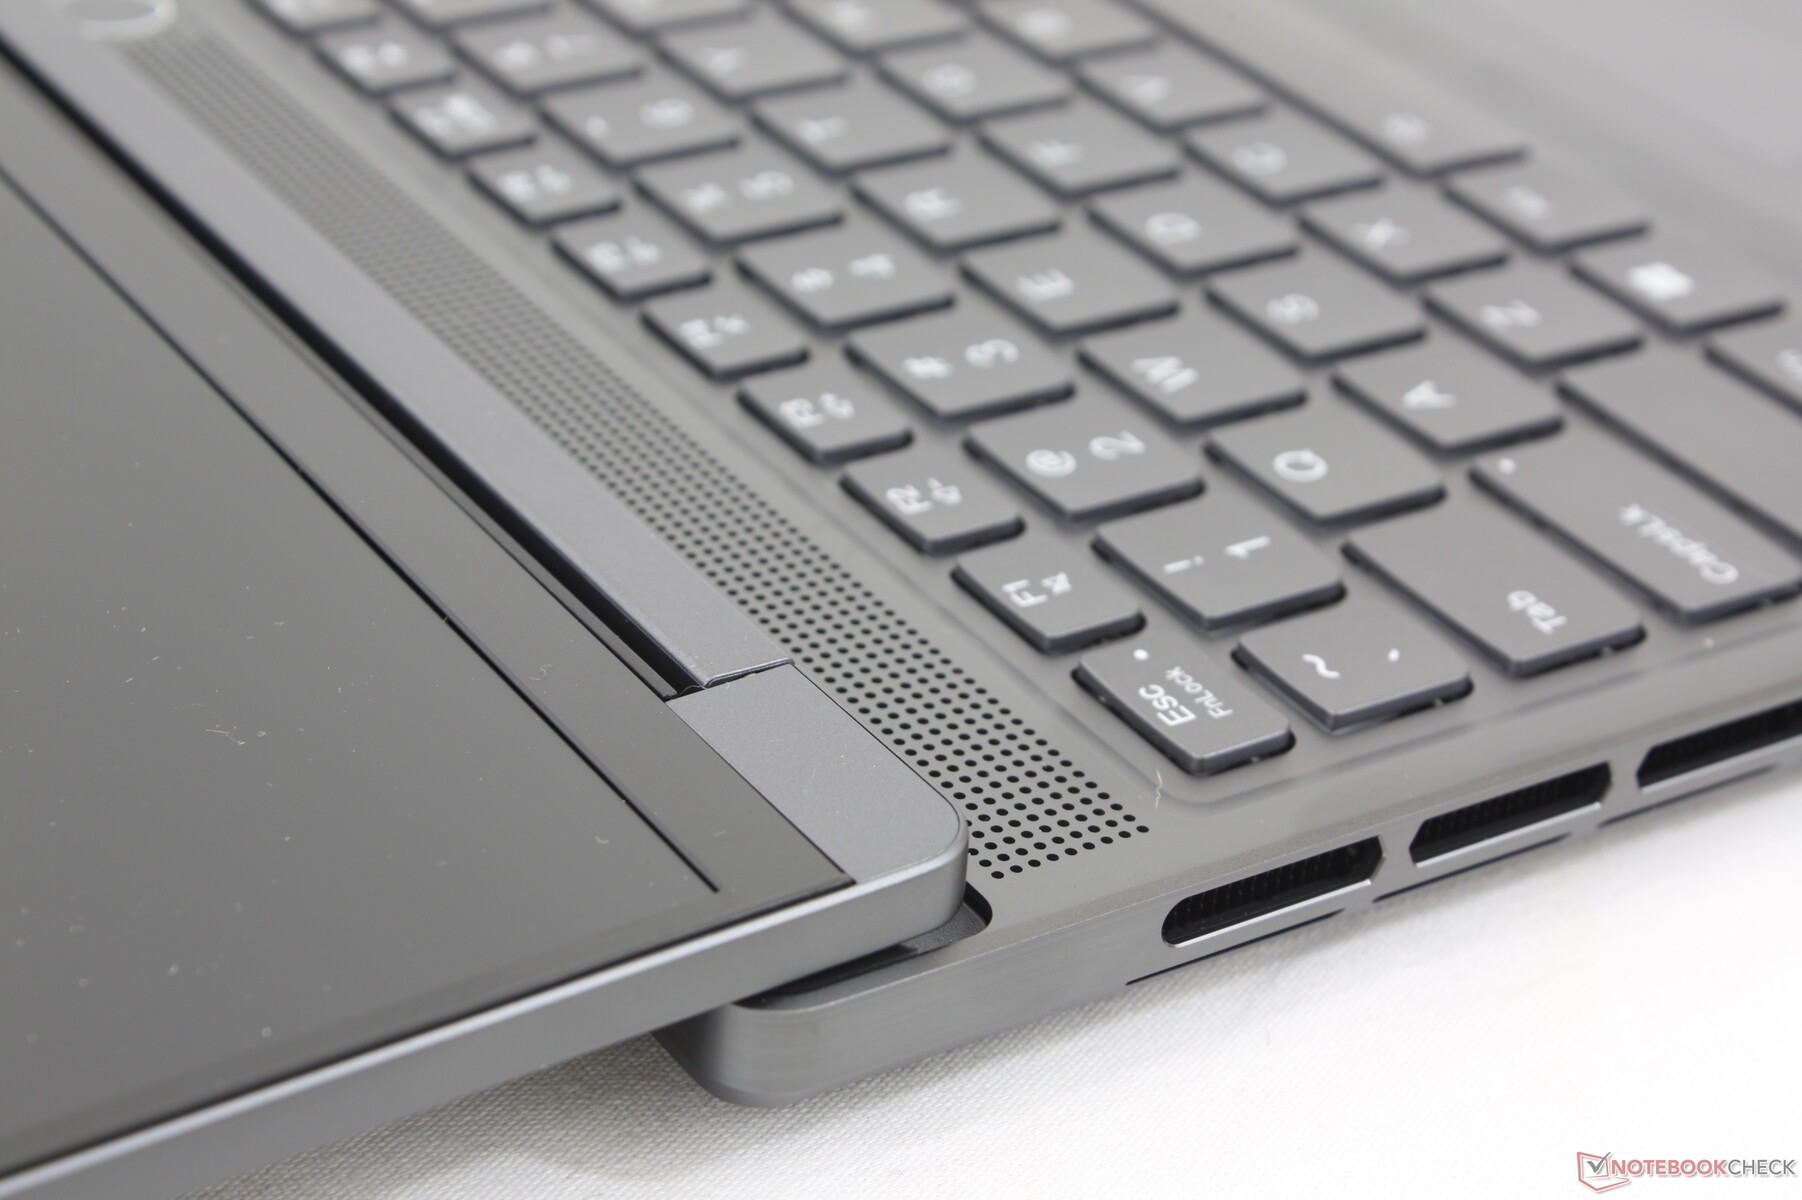
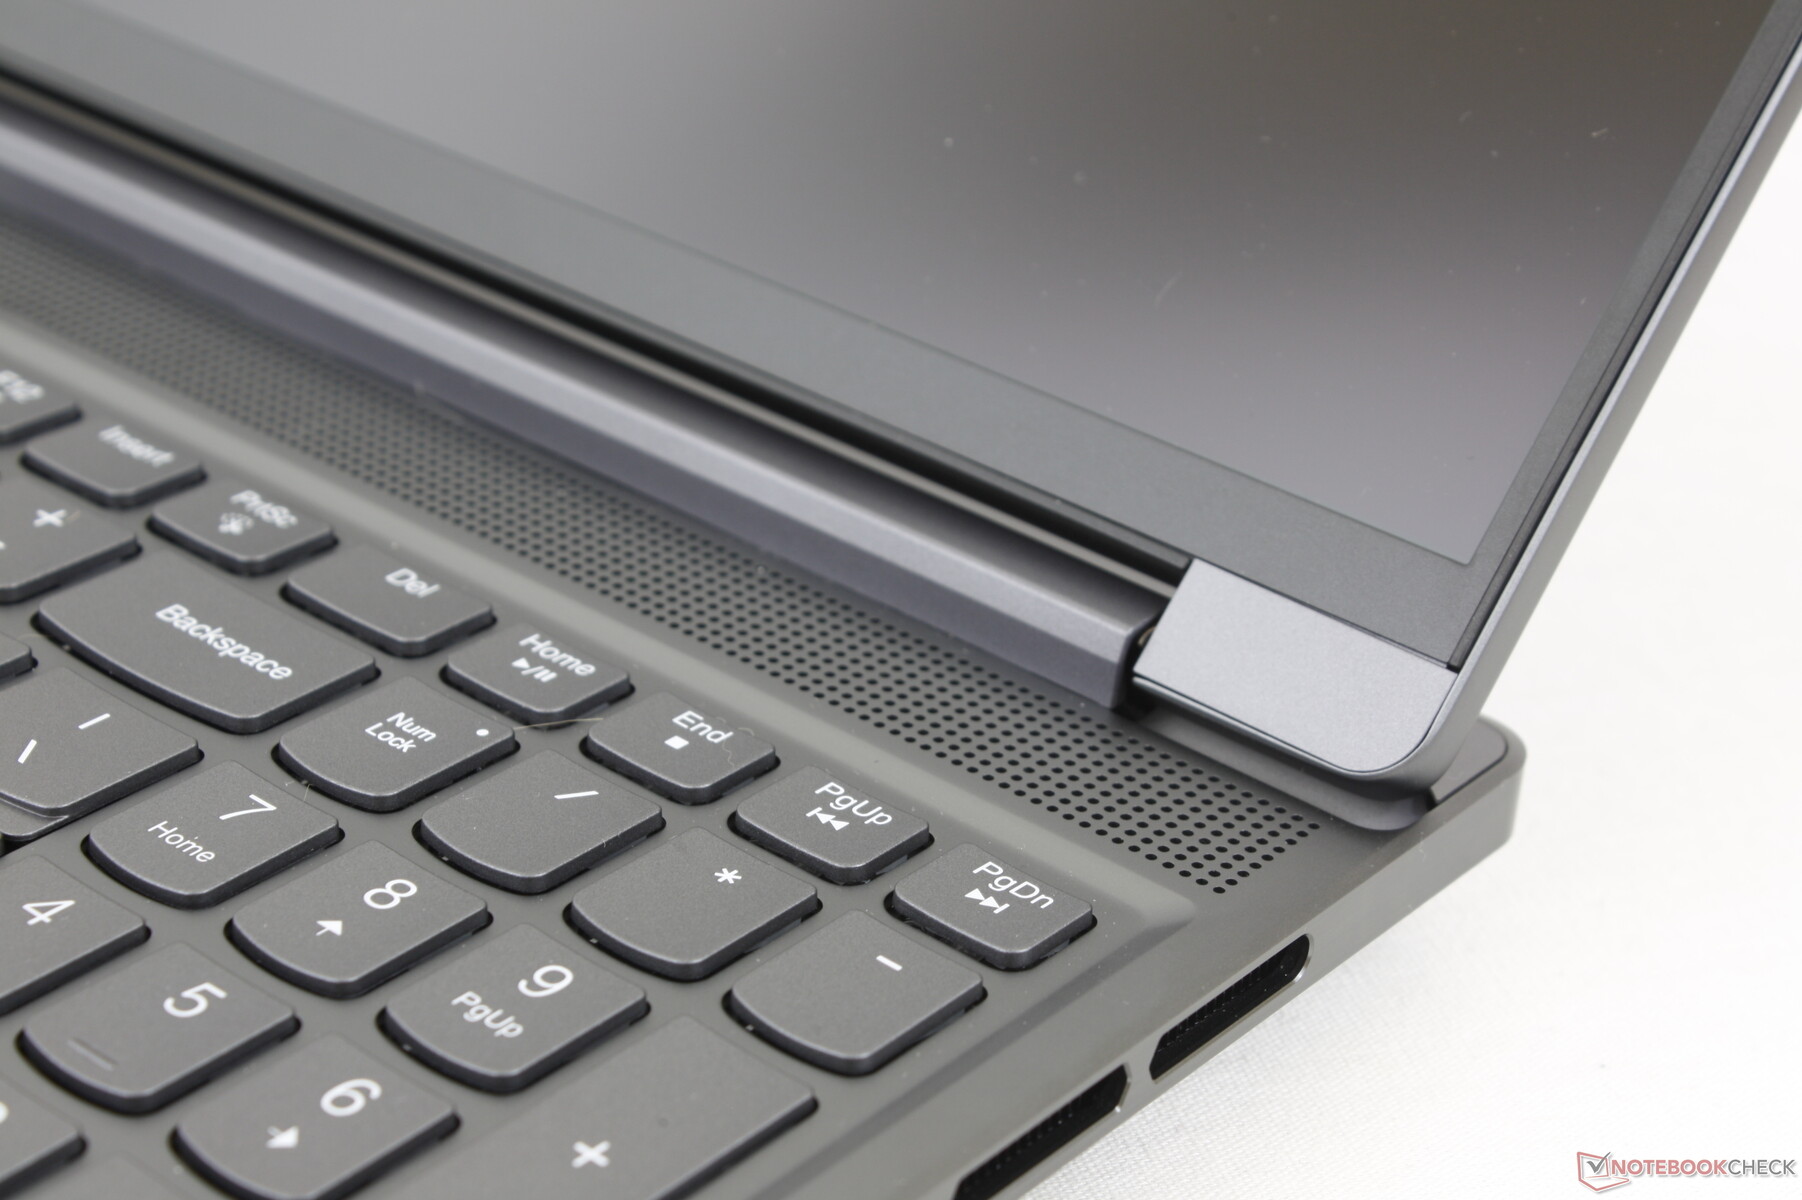
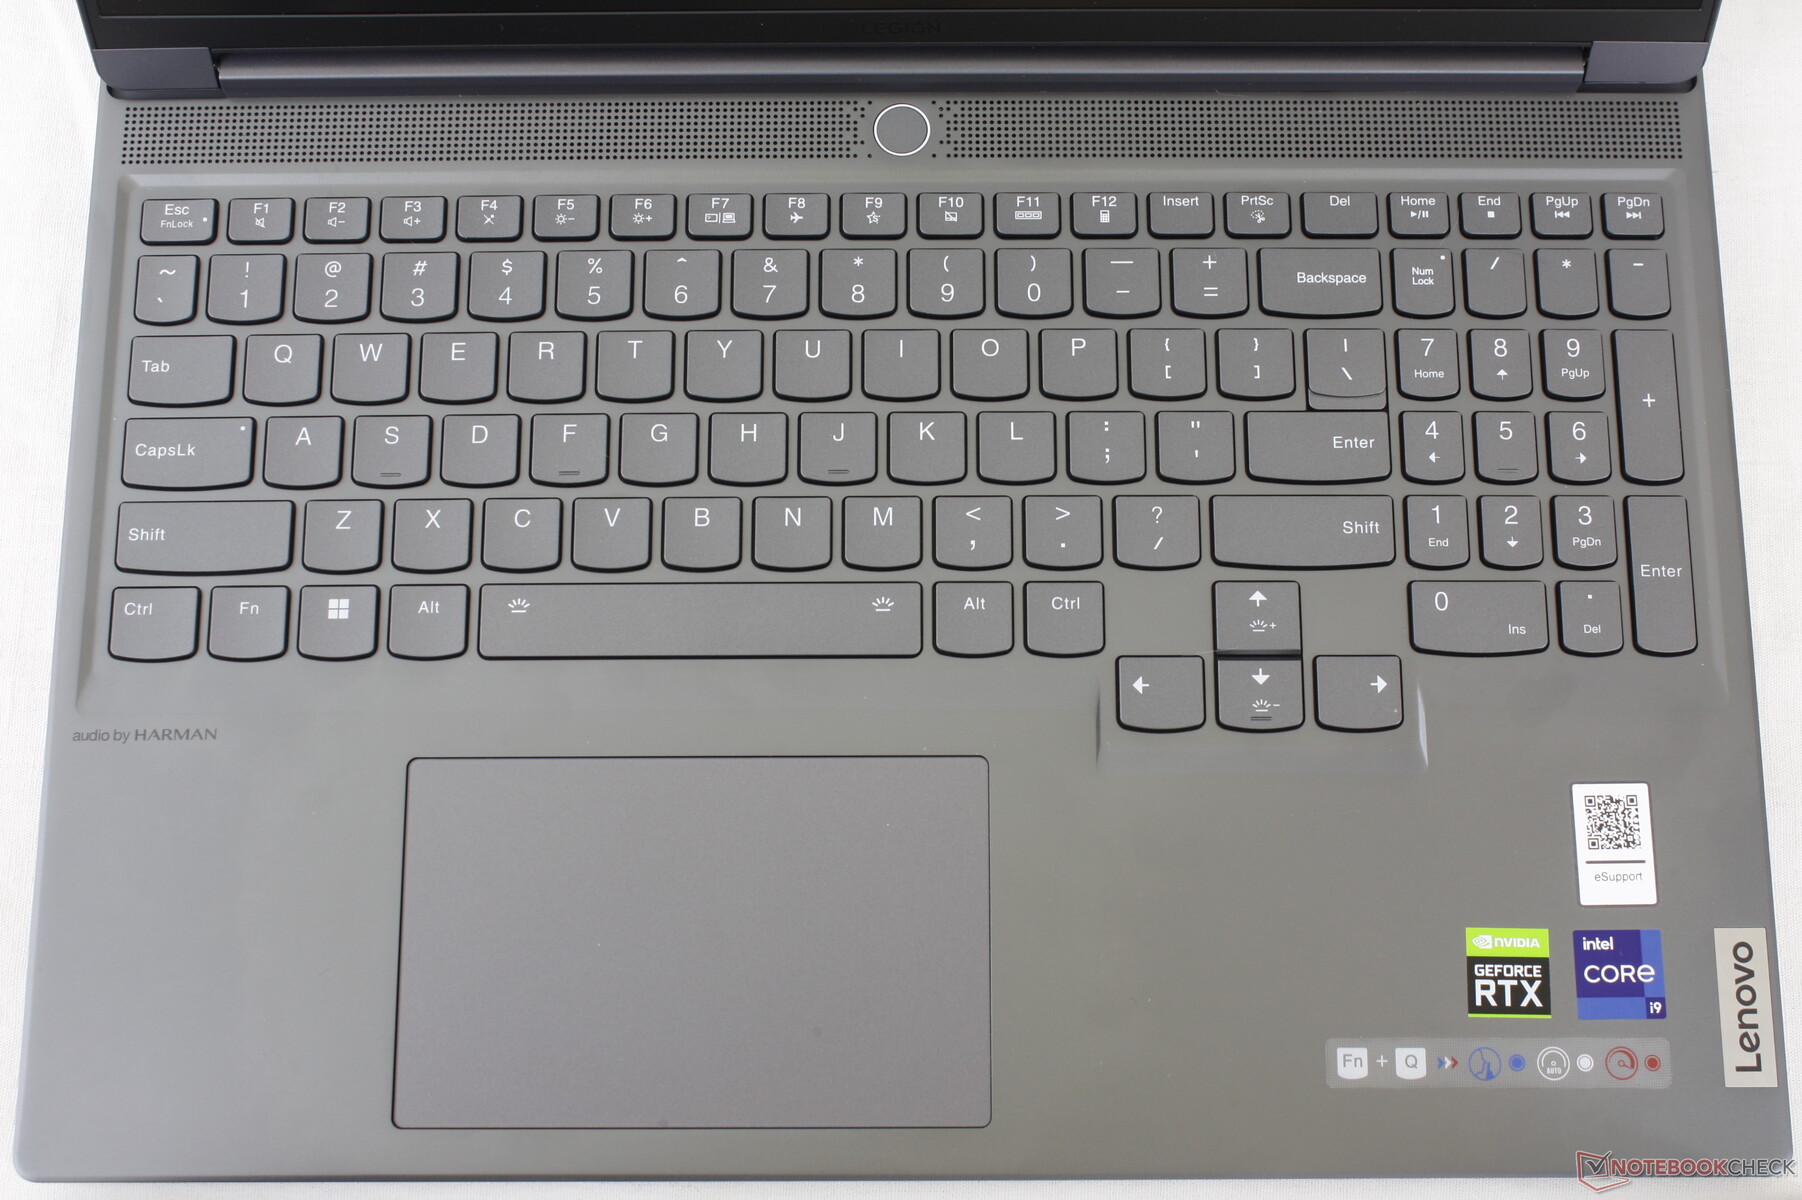
Dispositivos de entrada - Amplio con iluminación RGB por tecla
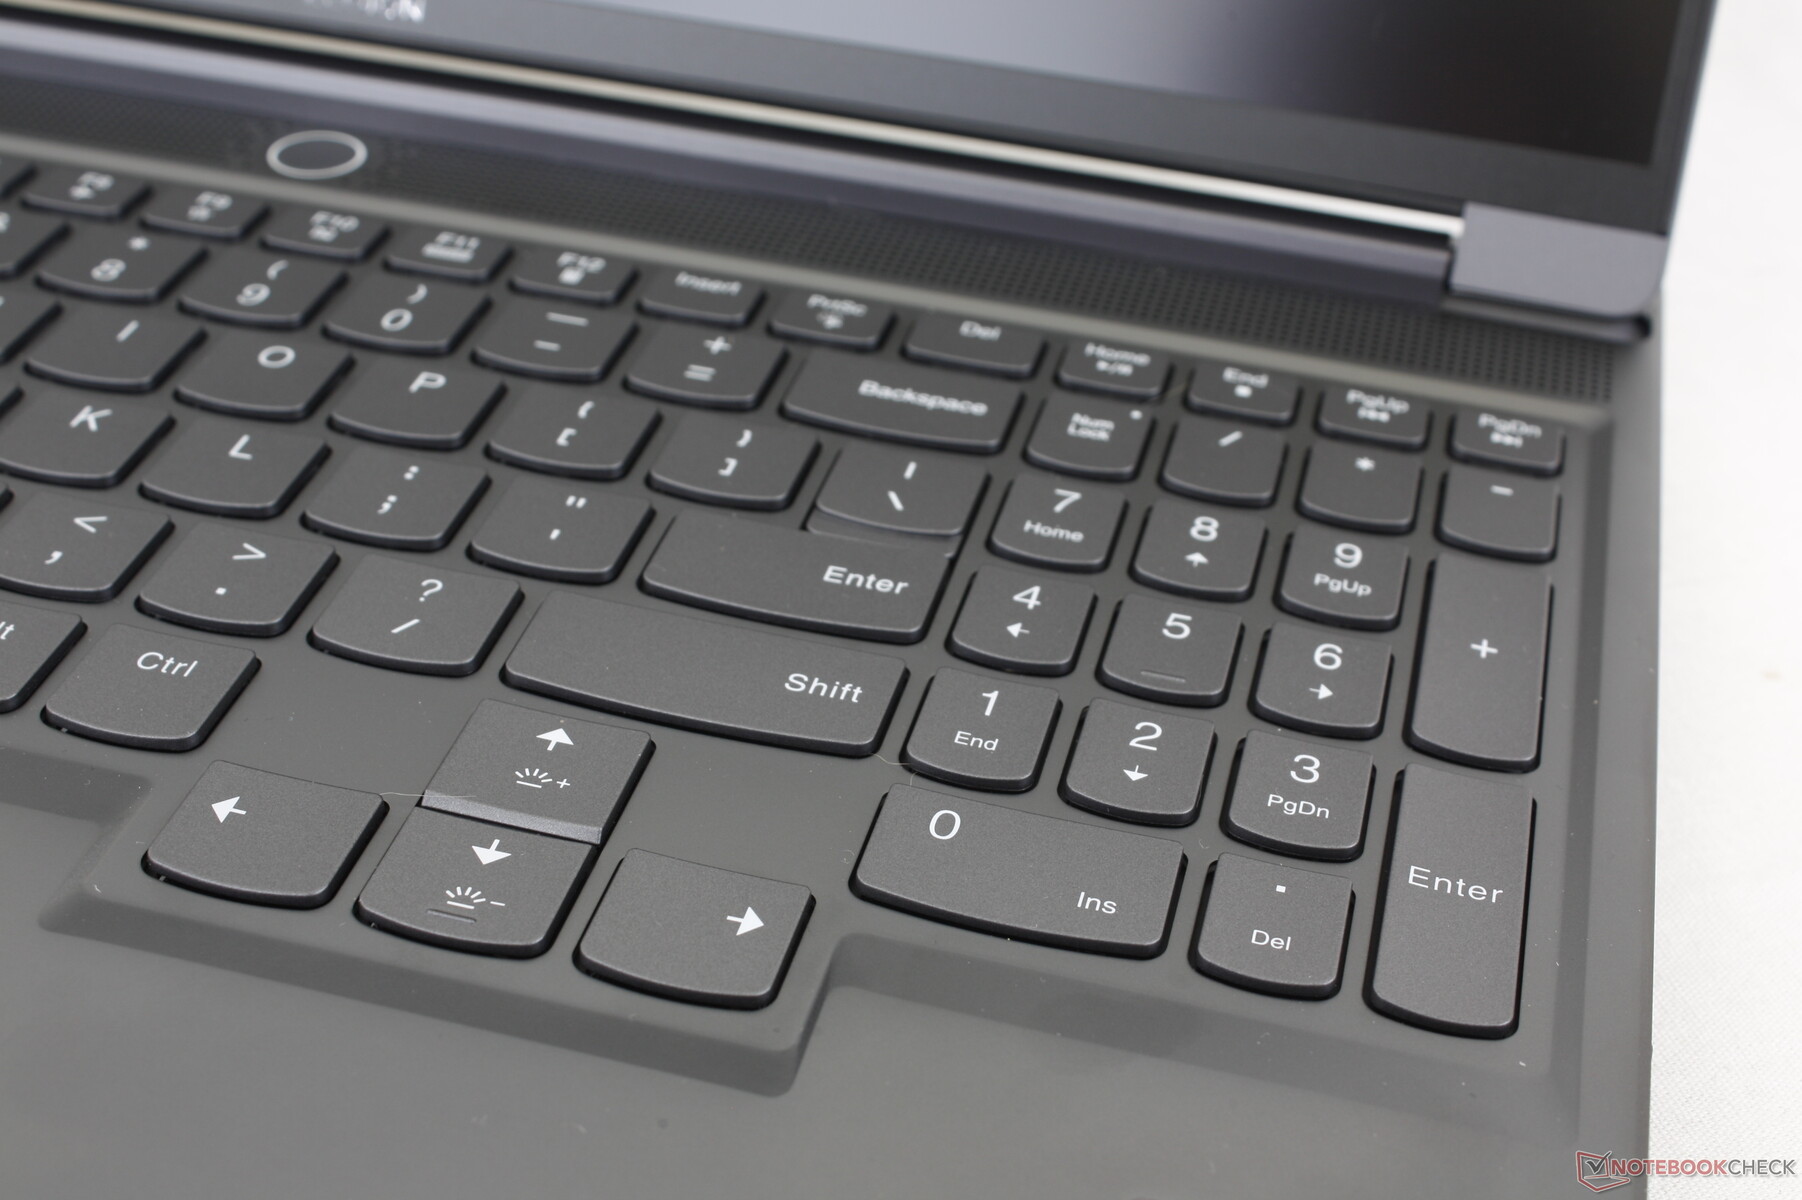
El teclado y el clickpad no han cambiado en comparación con el del año pasado Legion Slim 7i G7 por lo que la experiencia de usuario sigue siendo la misma. Esto no es necesariamente malo, ya que el recorrido de las teclas de 1,5 mm y la firme respuesta siguen siendo más cómodos para escribir en comparación con las teclas menos profundas del Blade 16. También apreciamos las teclas de flecha grandes, ya que estas mismas teclas suelen ser frustrantemente pequeñas en otros portátiles para juegos. También apreciamos las grandes teclas de flecha ya que estas mismas teclas a menudo son frustrantemente pequeñas en otros portátiles de juego como la Asus ROG Strix o la serie MSI Pulse.
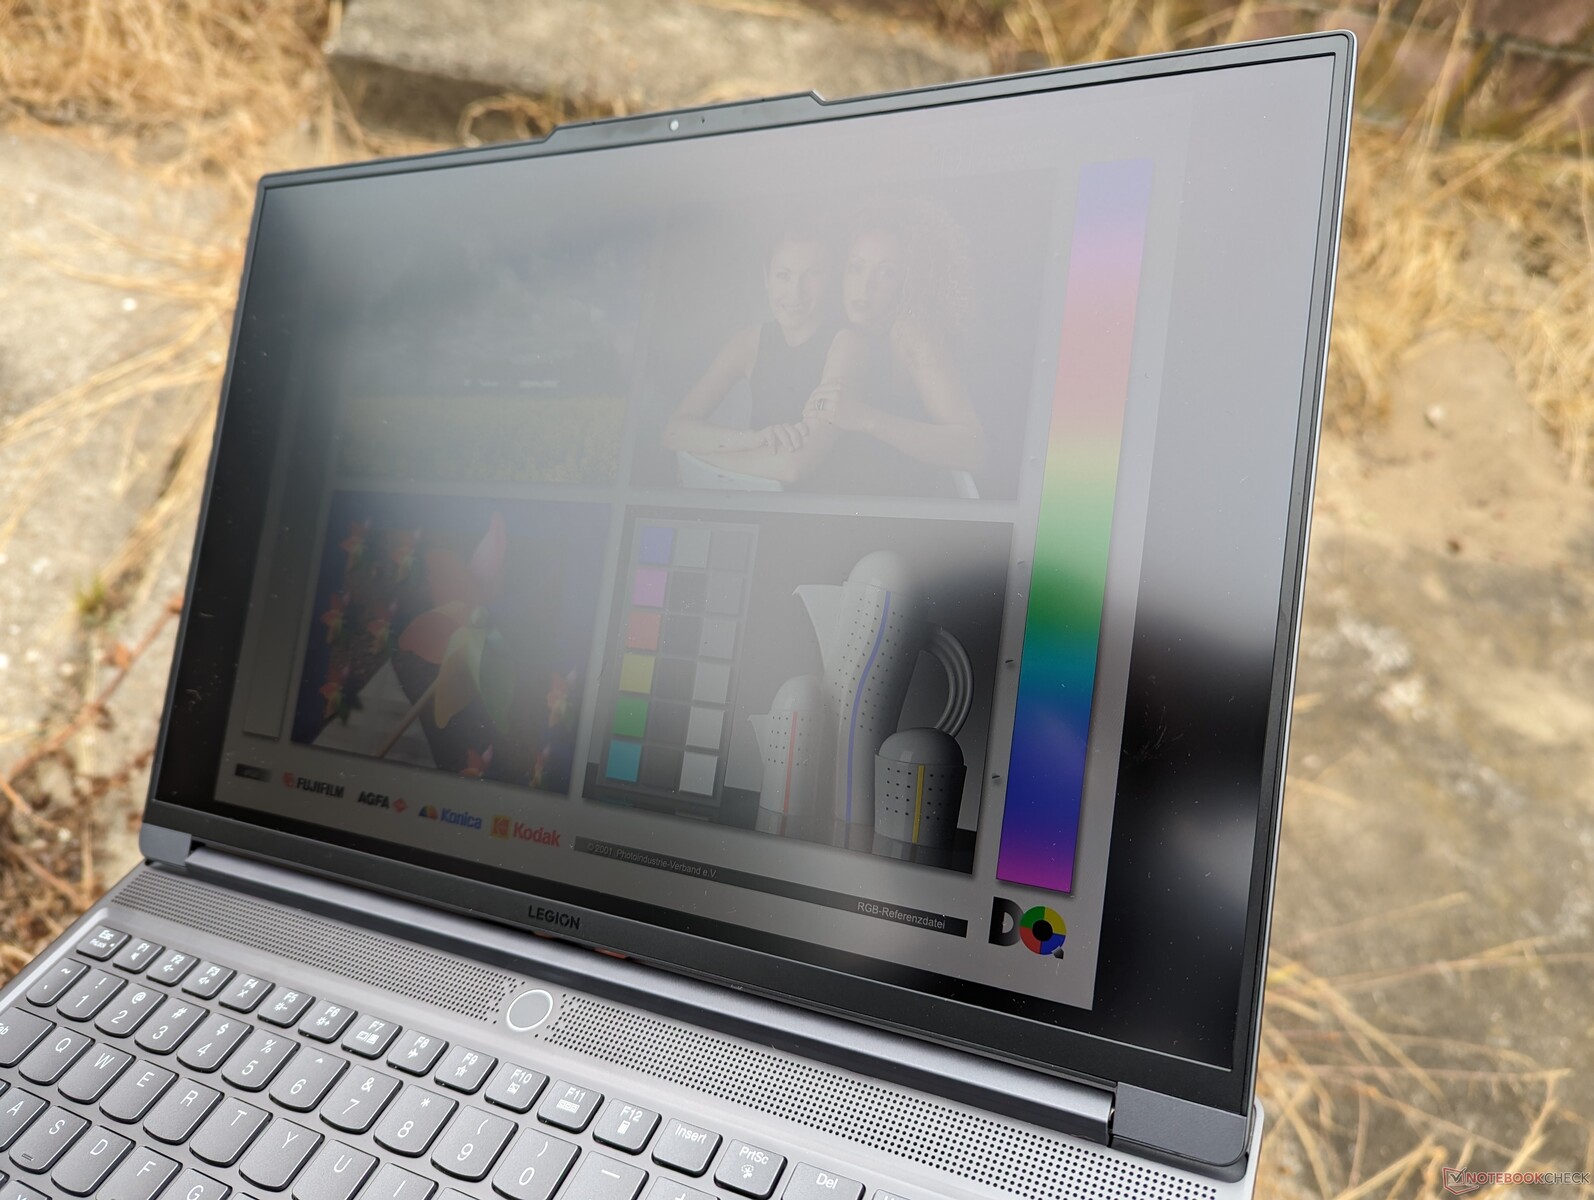
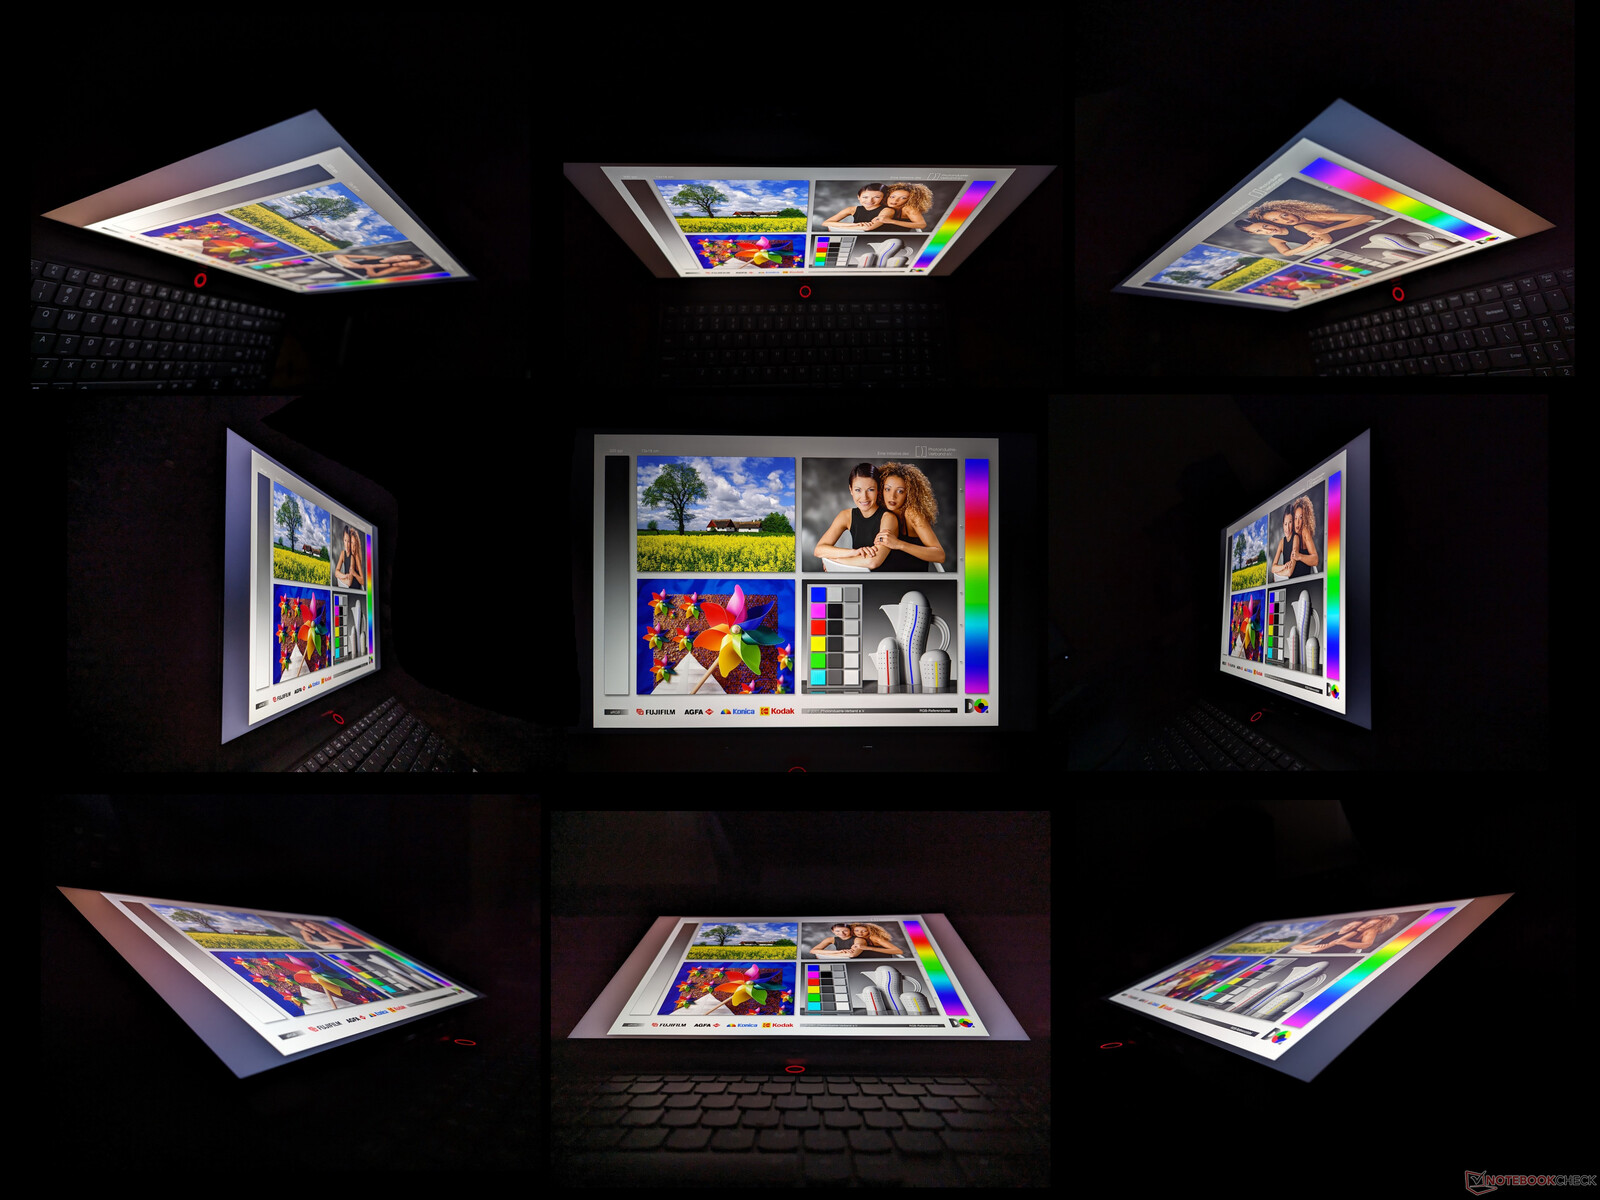
Pantalla - Idéntica a la de Legion Pro 7
Existen dos opciones de panel, ambas compatibles con G-Sync:
- 2560 x 1600, 240 Hz, tiempos de respuesta de 5 ms, 100% sRGB, 500 nits, certificado Pantone
- 3000 x 2000, 165 Hz, tiempos de respuesta de 3 ms, 100% DCI-P3, 430 nits, certificado Pantone
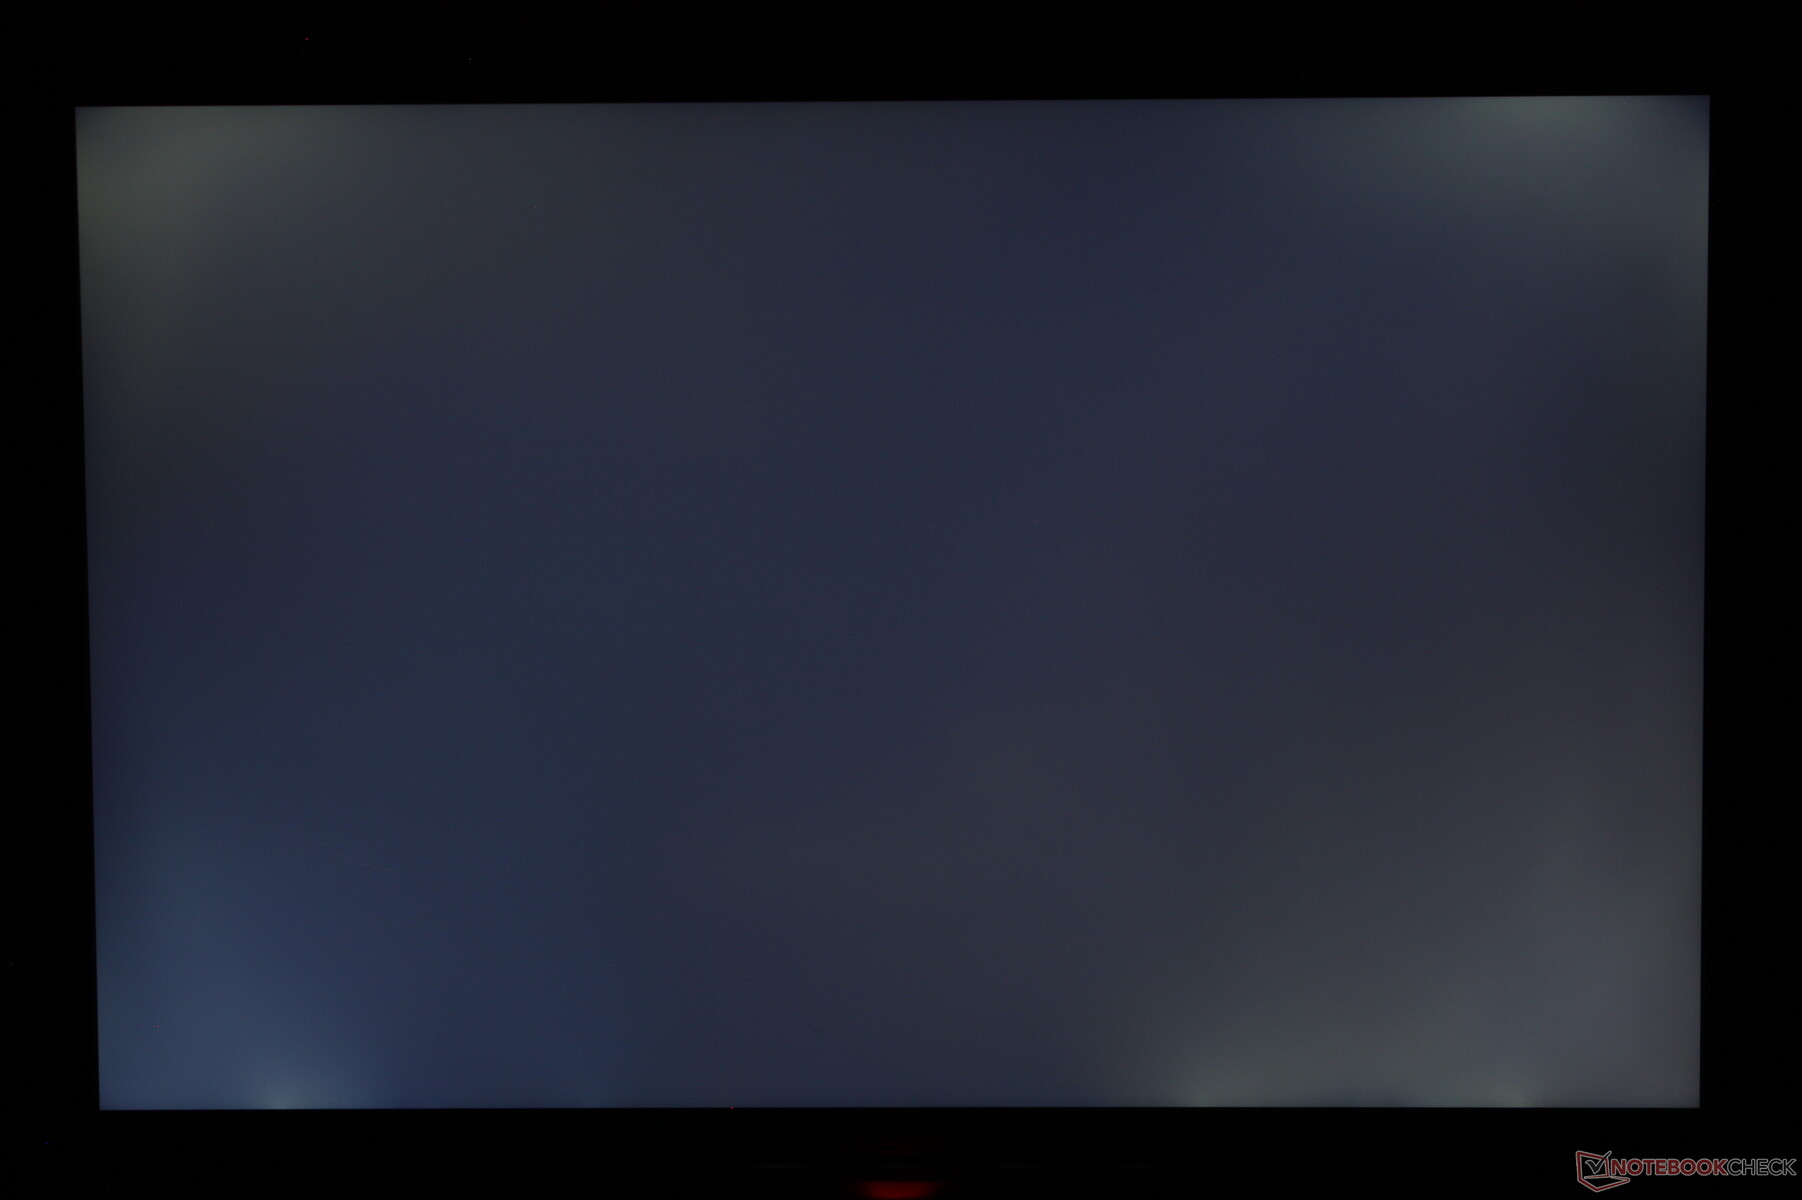
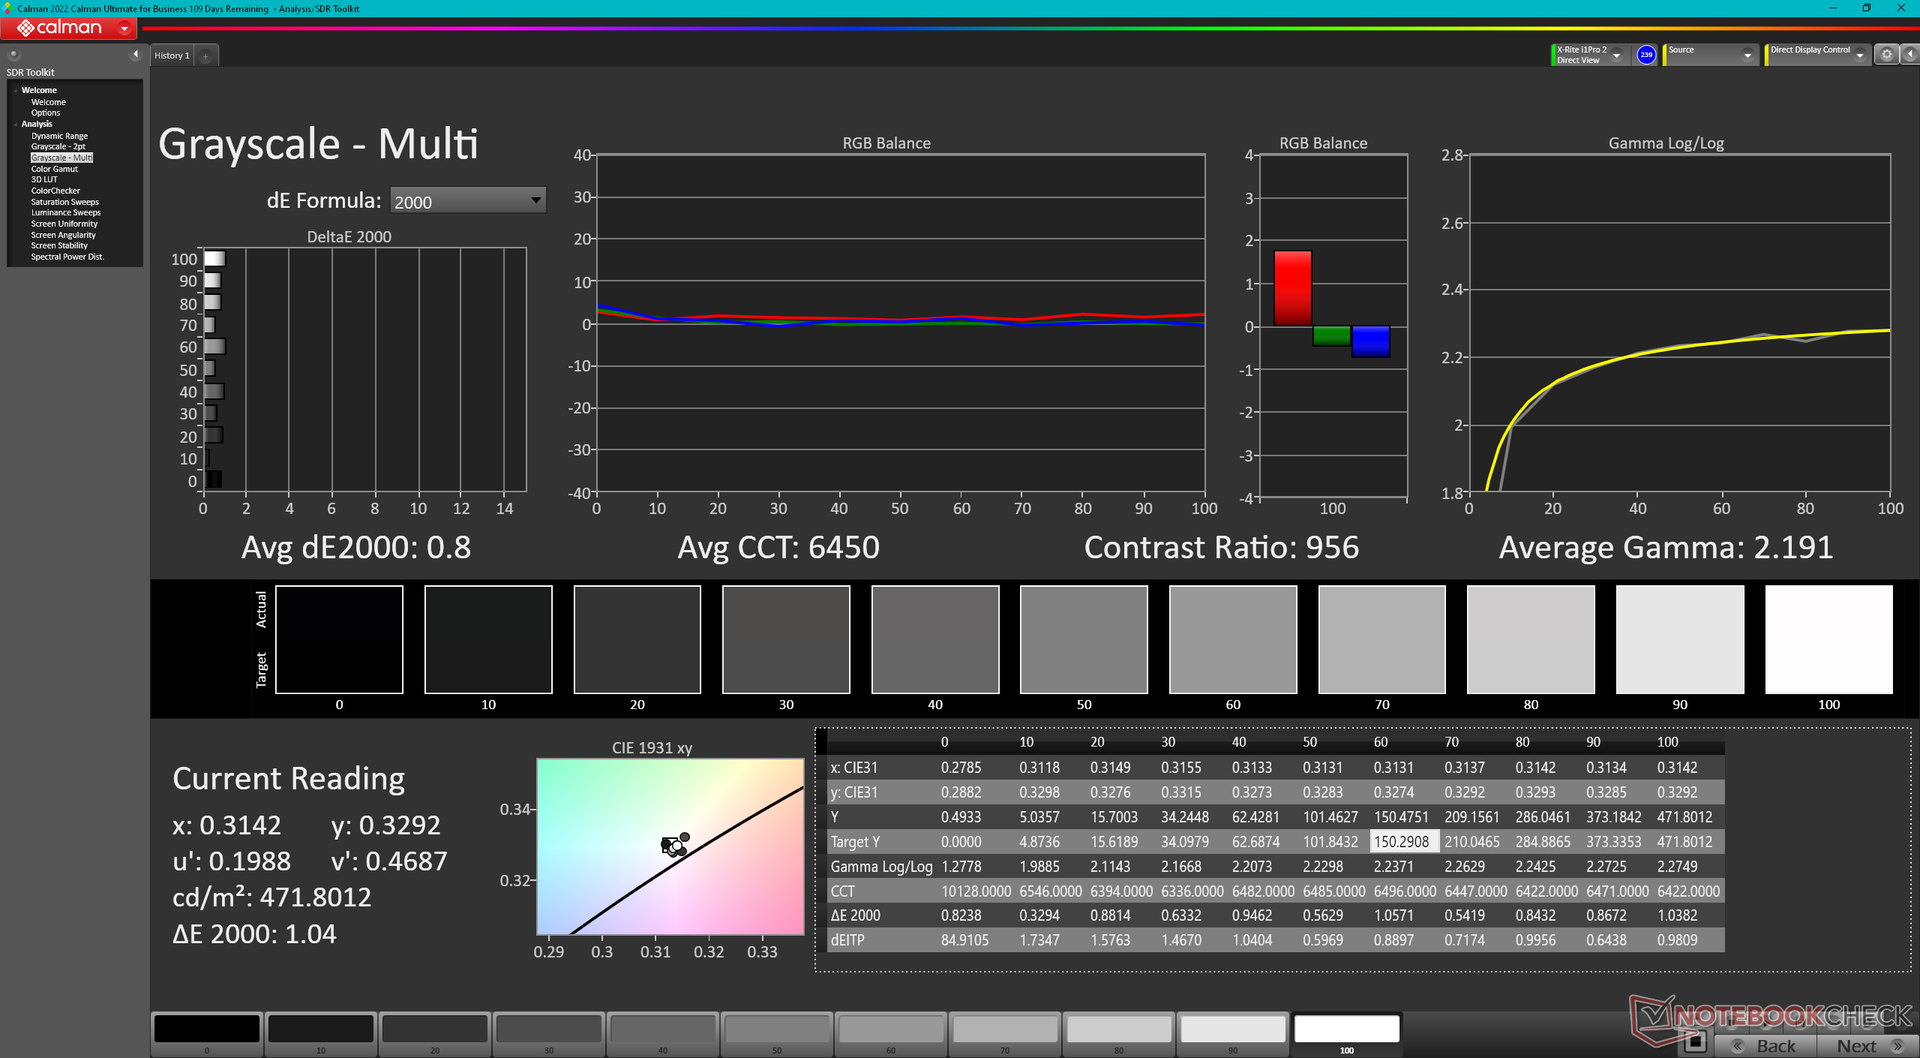
Nuestra configuración 1600p incluye exactamente el mismo panel IPS MNG007DA2-3 que se encuentra en el modelo más grande y caro Legion Pro 7 para una experiencia de visualización idéntica entre los dos modelos. Se trata de un panel de gama alta apto tanto para juegos como para edición gráfica amateur a pesar de ser la opción básica. El sangrado de retroiluminación, sin embargo, es más notable de lo que nos gustaría, como se muestra en la siguiente captura de pantalla.

| |||||||||||||||||||||||||
iluminación: 86 %
Brillo con batería: 474.6 cd/m²
Contraste: 1217:1 (Negro: 0.39 cd/m²)
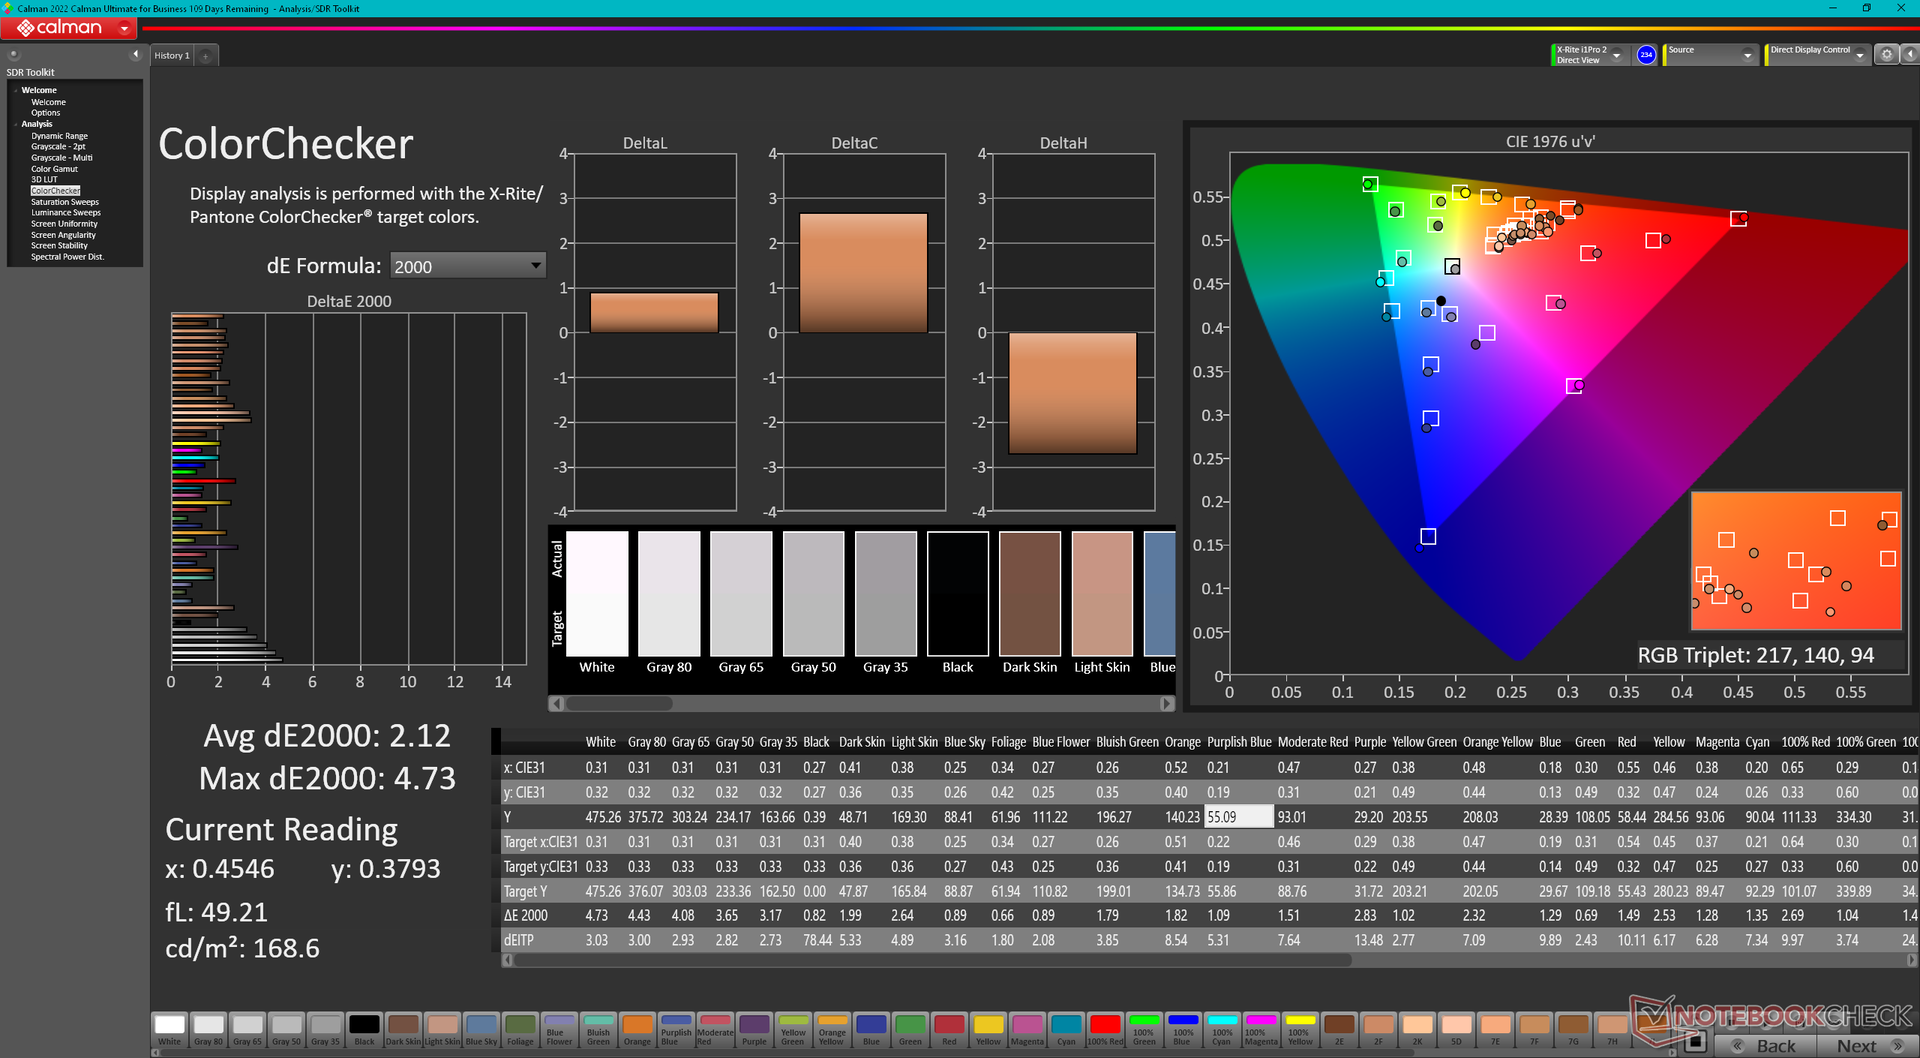
ΔE ColorChecker Calman: 2.12 | ∀{0.5-29.43 Ø4.71}
calibrated: 0.57
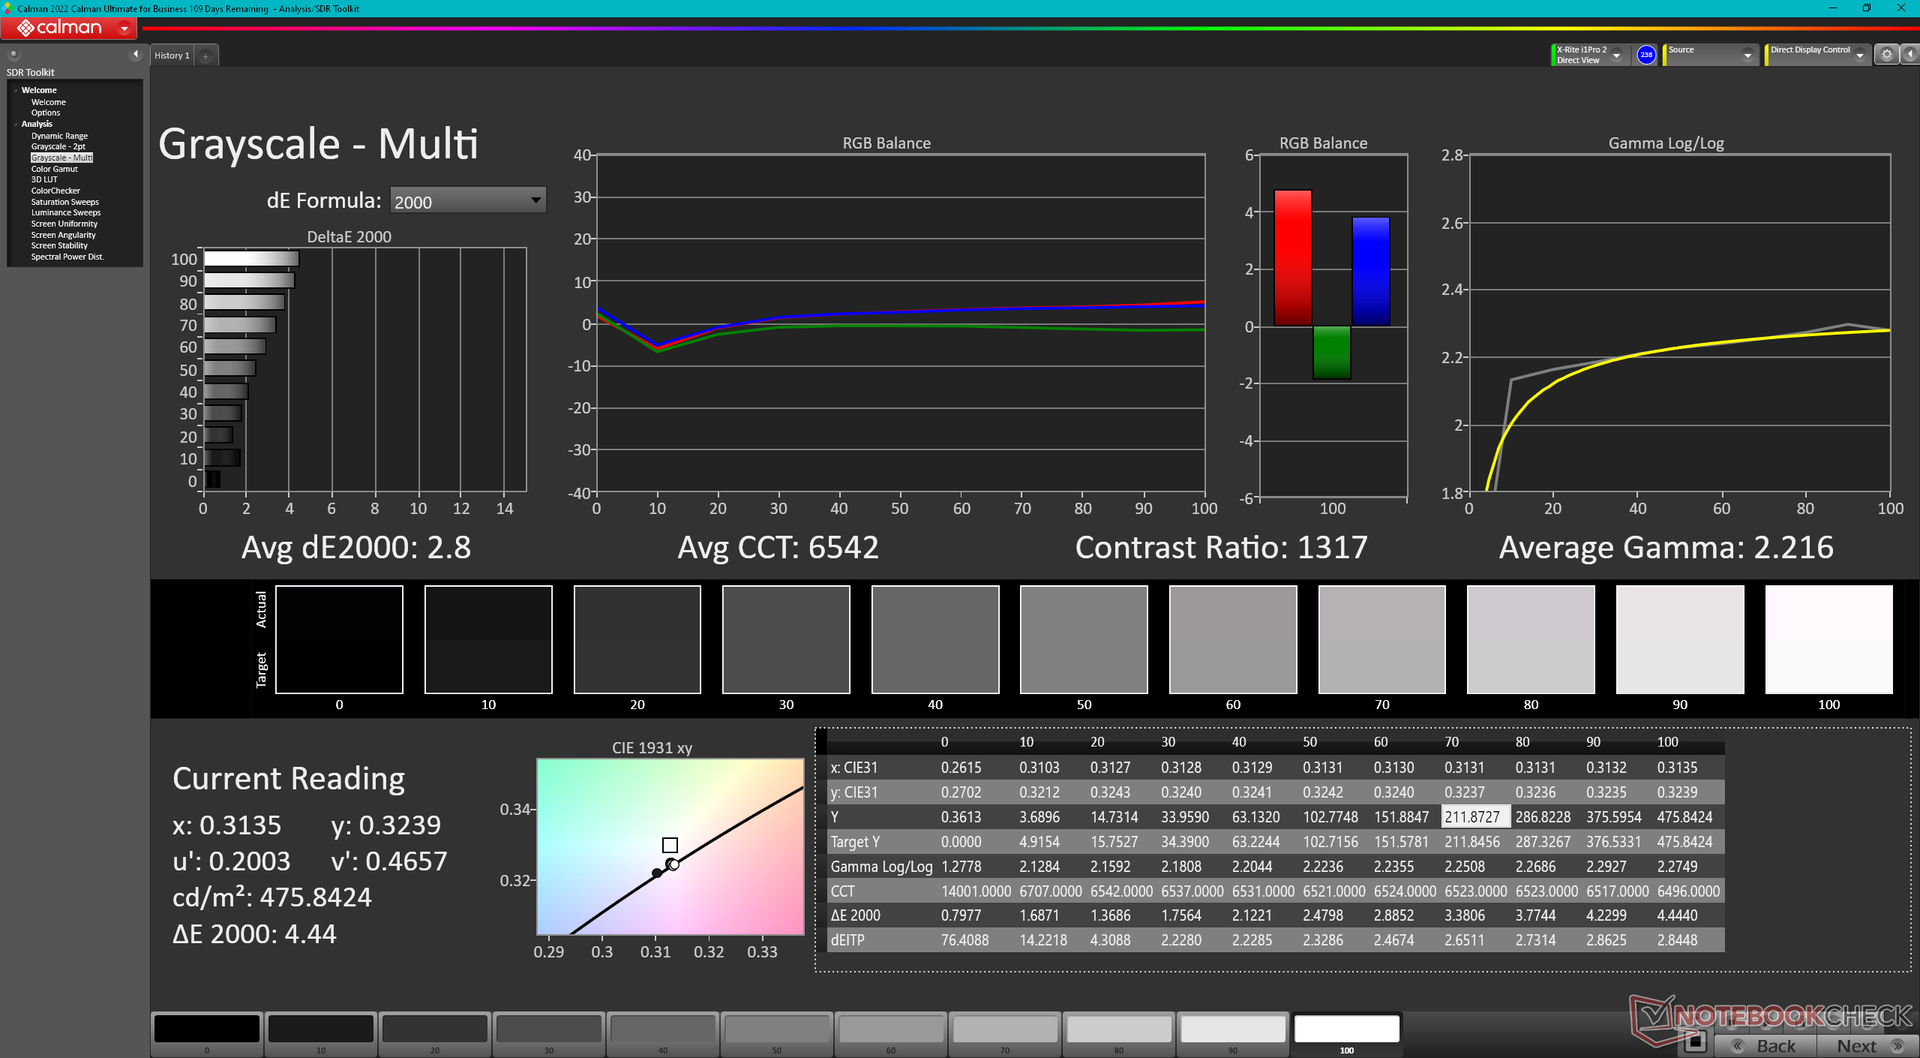
ΔE Greyscale Calman: 2.8 | ∀{0.09-98 Ø4.96}
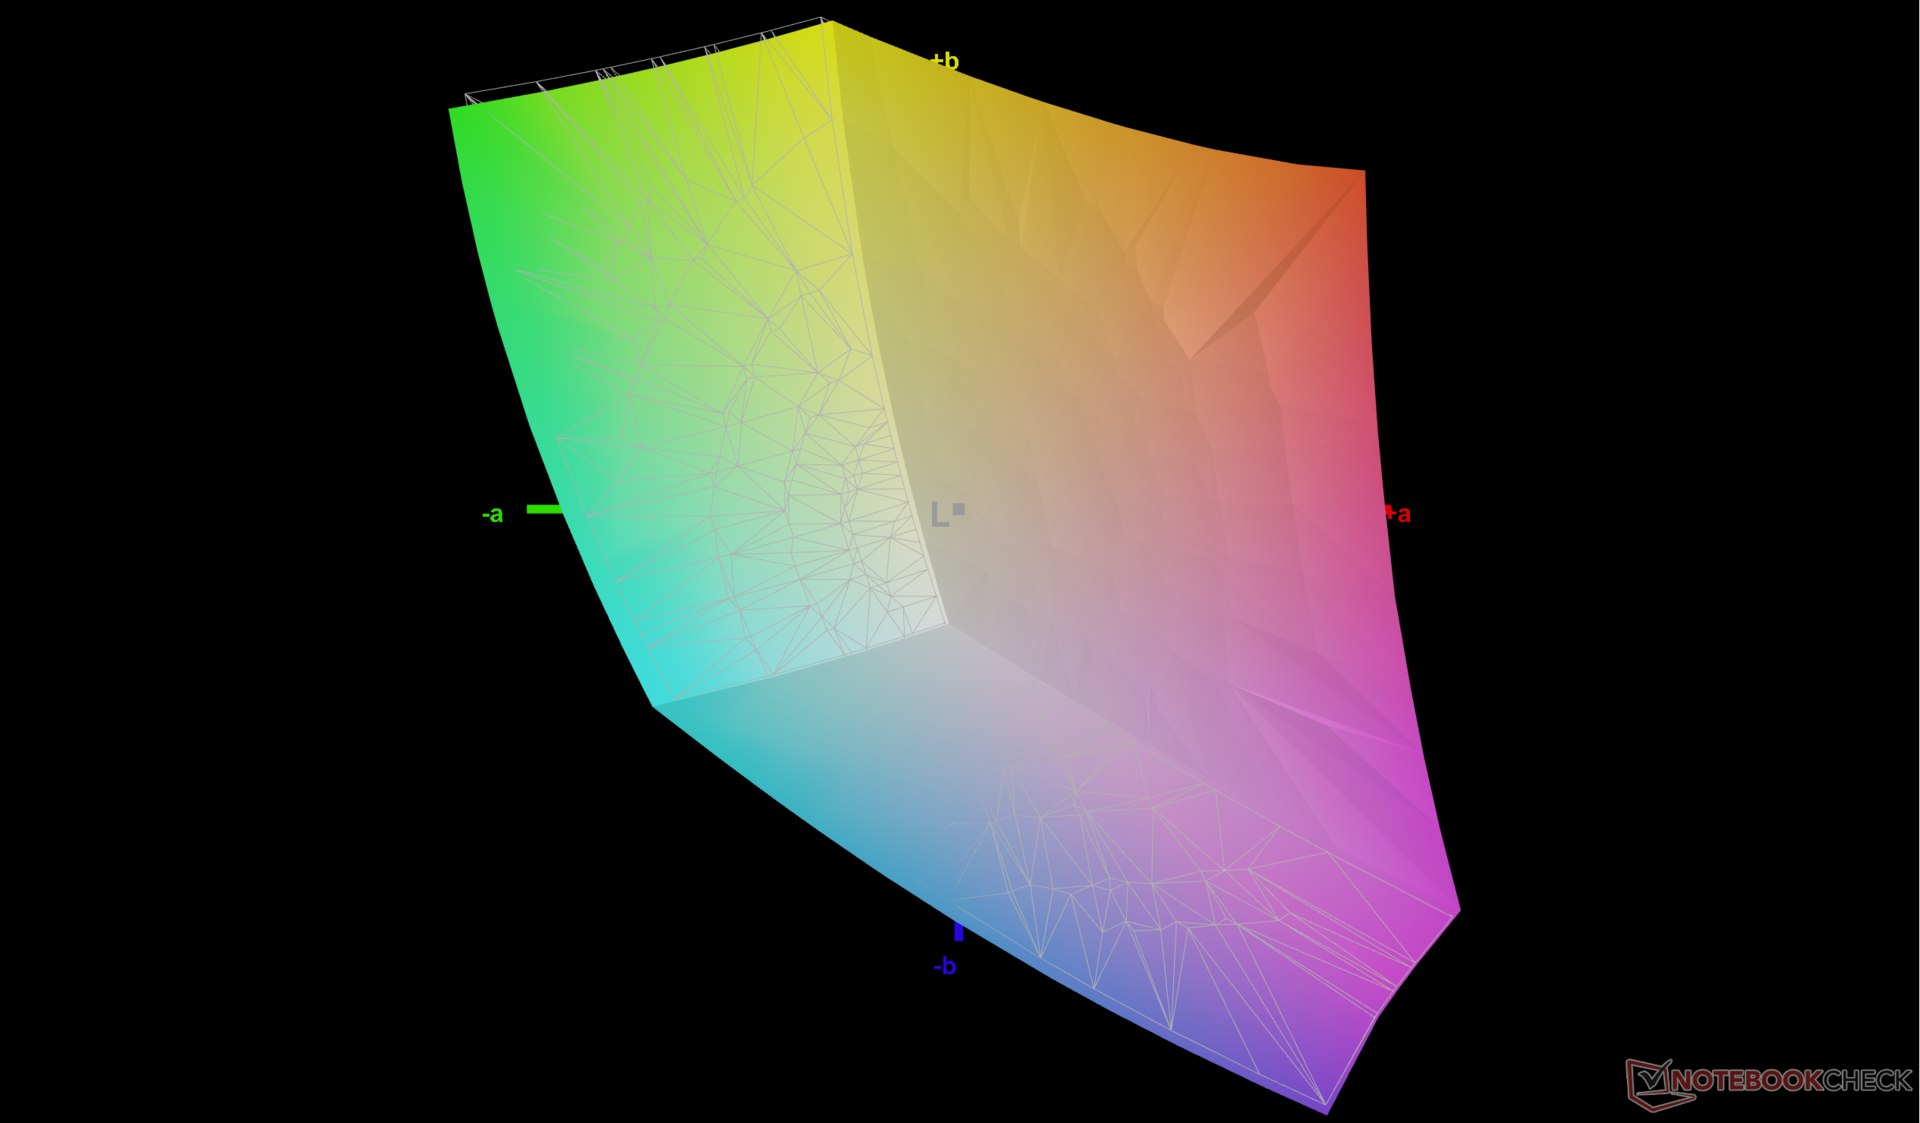
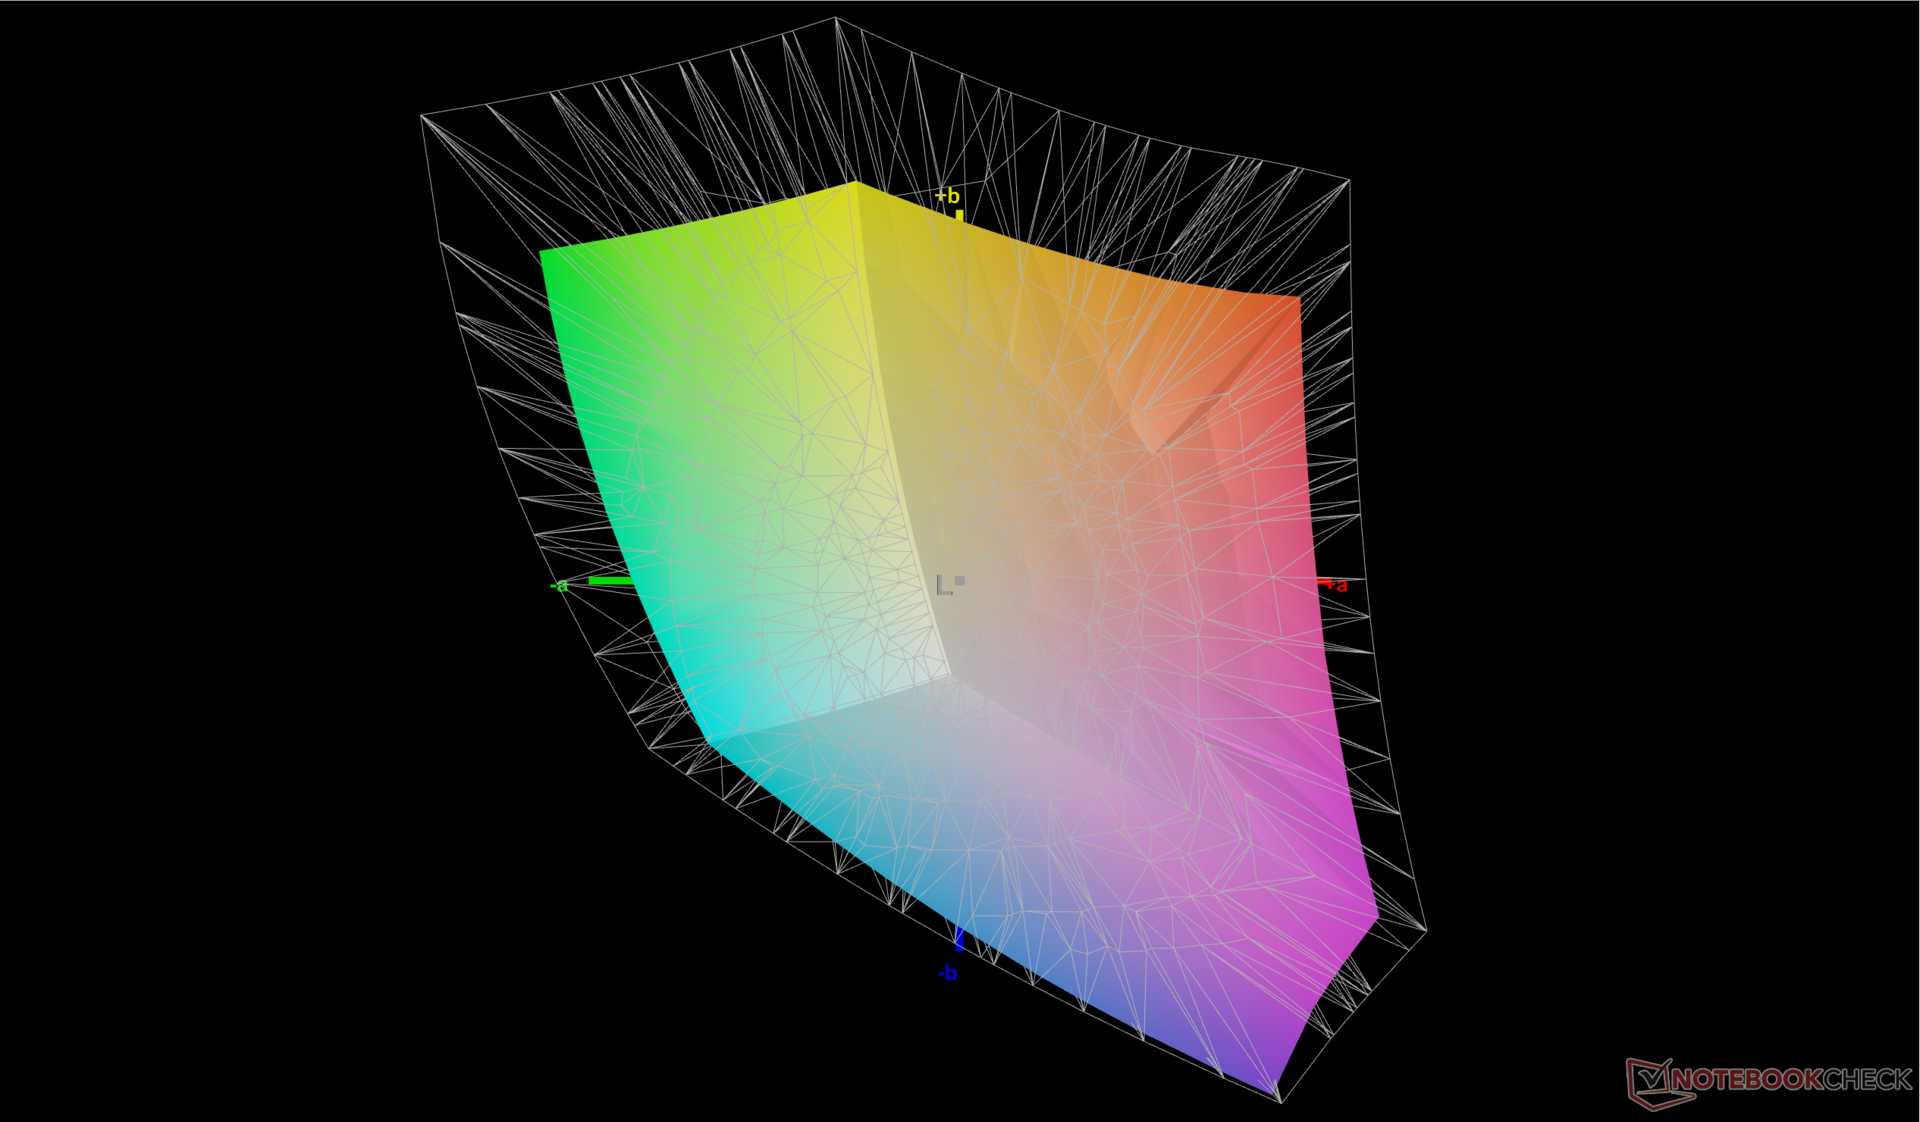
72.5% AdobeRGB 1998 (Argyll 3D)
99.4% sRGB (Argyll 3D)
70.4% Display P3 (Argyll 3D)
Gamma: 2.22
CCT: 6542 K
| Lenovo Legion Slim 7i 16 Gen 8 CSOT T3 MNG007DA2-3, IPS, 2560x1600, 16" | HP Omen 16-wf000 BOE0B7D, IPS, 2560x1440, 16.1" | Alienware x16 R1 BOE NE16NZ4, IPS, 2560x1600, 16" | Lenovo Legion Pro 7 RTX4090 MNG007DA2-3 (CSO1628), IPS, 2560x1600, 16" | Asus ROG Strix G16 G614JZ TL160ADMP03-0, IPS, 2560x1600, 16" | Razer Blade 16 Early 2023 CSOT T3 MNG007DA4-1, IPS, 2560x1600, 16" | |
|---|---|---|---|---|---|---|
| Display | -1% | 21% | -1% | 19% | 22% | |
| Display P3 Coverage (%) | 70.4 | 69 -2% | 99.2 41% | 69.5 -1% | 97 38% | 98.5 40% |
| sRGB Coverage (%) | 99.4 | 99.2 0% | 100 1% | 99.8 0% | 99.9 1% | 100 1% |
| AdobeRGB 1998 Coverage (%) | 72.5 | 71.2 -2% | 88.6 22% | 71.6 -1% | 84.9 17% | 89.7 24% |
| Response Times | 27% | 21% | 29% | 42% | 5% | |
| Response Time Grey 50% / Grey 80% * (ms) | 12 ? | 4.6 ? 62% | 5.1 ? 57% | 10.9 ? 9% | 5.1 ? 57% | 6.6 ? 45% |
| Response Time Black / White * (ms) | 8.9 ? | 9.7 ? -9% | 10.3 ? -16% | 4.6 ? 48% | 6.6 ? 26% | 12 ? -35% |
| PWM Frequency (Hz) | ||||||
| Screen | -5% | -11% | -5% | -4% | -12% | |
| Brightness middle (cd/m²) | 474.6 | 310.9 -34% | 302.2 -36% | 491 3% | 470 -1% | 456.8 -4% |
| Brightness (cd/m²) | 445 | 296 -33% | 285 -36% | 472 6% | 459 3% | 437 -2% |
| Brightness Distribution (%) | 86 | 91 6% | 89 3% | 91 6% | 93 8% | 83 -3% |
| Black Level * (cd/m²) | 0.39 | 0.35 10% | 0.26 33% | 0.4 -3% | 0.42 -8% | 0.35 10% |
| Contrast (:1) | 1217 | 888 -27% | 1162 -5% | 1228 1% | 1119 -8% | 1305 7% |
| Colorchecker dE 2000 * | 2.12 | 2.18 -3% | 1.63 23% | 1.6 25% | 1.86 12% | 3.7 -75% |
| Colorchecker dE 2000 max. * | 4.73 | 3.58 24% | 4.13 13% | 5.15 -9% | 3.87 18% | 6.42 -36% |
| Colorchecker dE 2000 calibrated * | 0.57 | 0.52 9% | 1.17 -105% | 0.97 -70% | 0.93 -63% | 0.66 -16% |
| Greyscale dE 2000 * | 2.8 | 2.8 -0% | 2.5 11% | 3 -7% | 2.7 4% | 2.6 7% |
| Gamma | 2.22 99% | 2.18 101% | 2.23 99% | 2.211 100% | 2.246 98% | 2.3 96% |
| CCT | 6542 99% | 6002 108% | 6590 99% | 6979 93% | 6711 97% | 6108 106% |
| Media total (Programa/Opciones) | 7% /
0% | 10% /
0% | 8% /
1% | 19% /
7% | 5% /
-3% |
* ... más pequeño es mejor
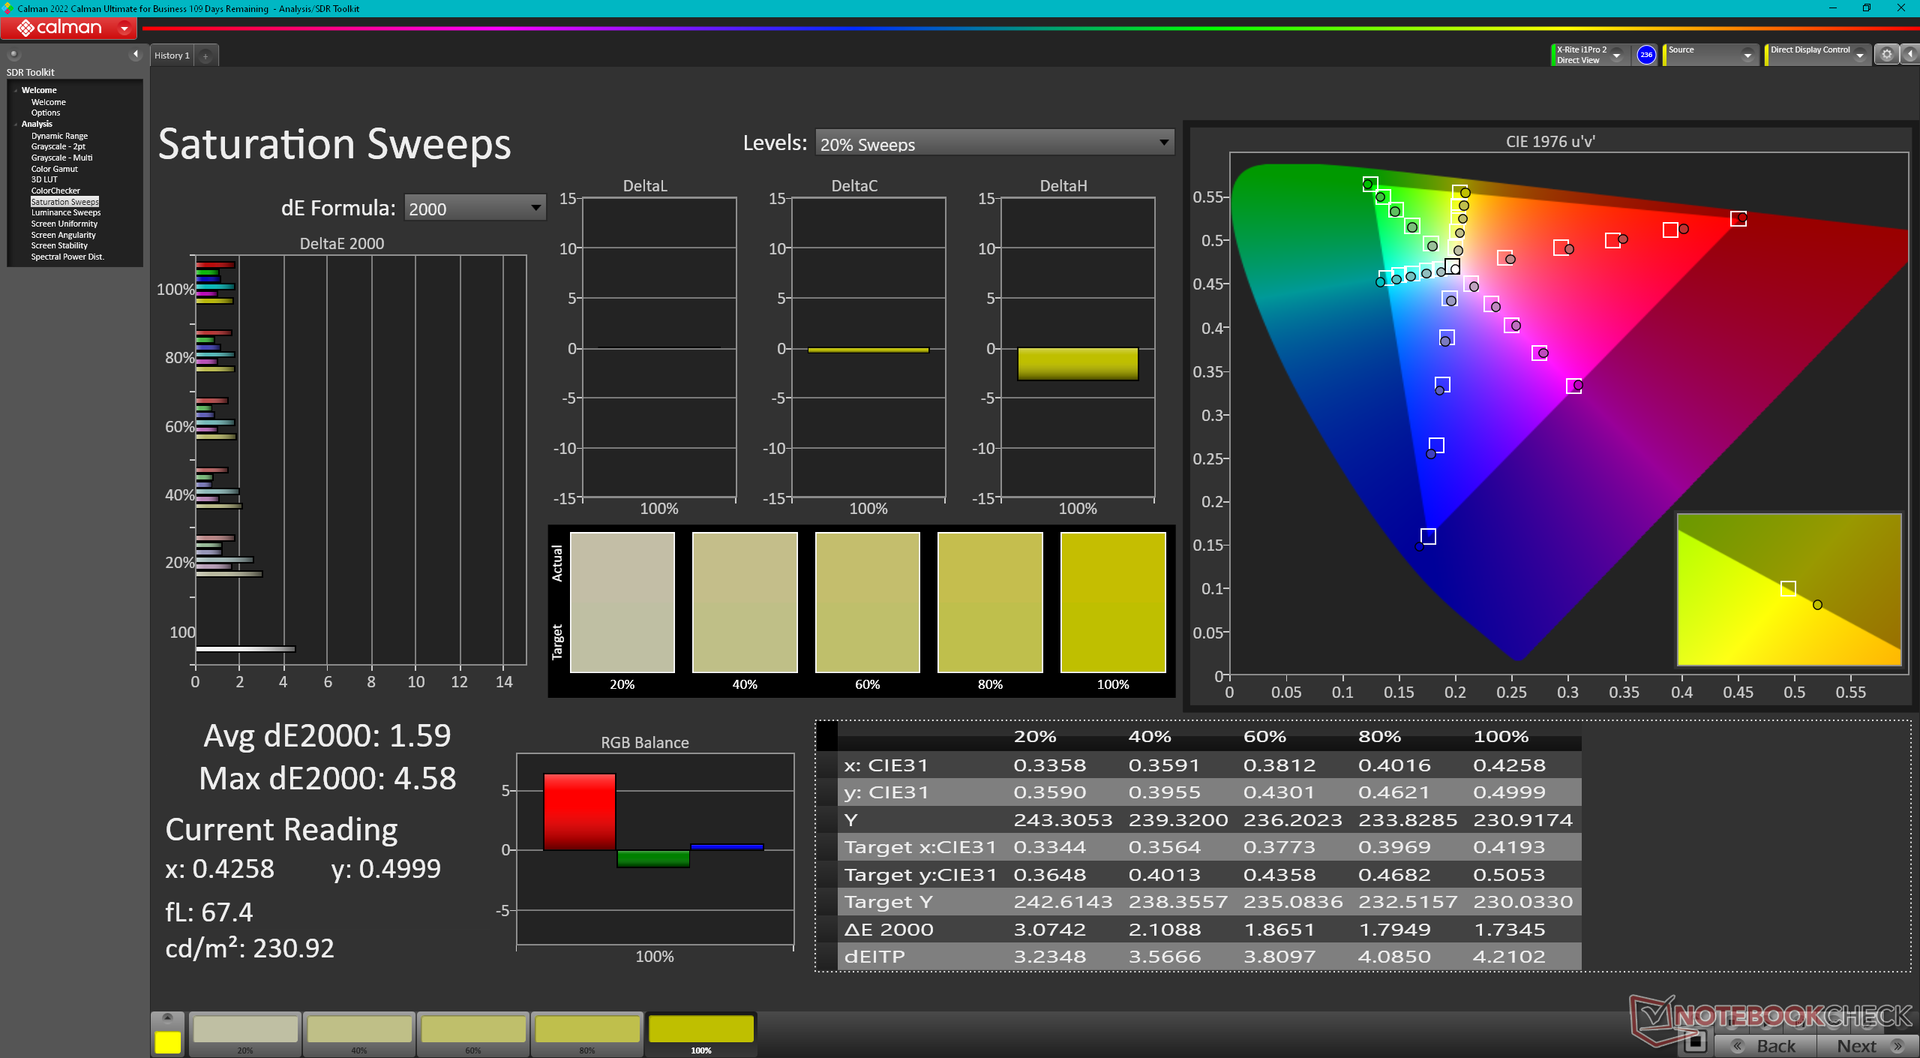
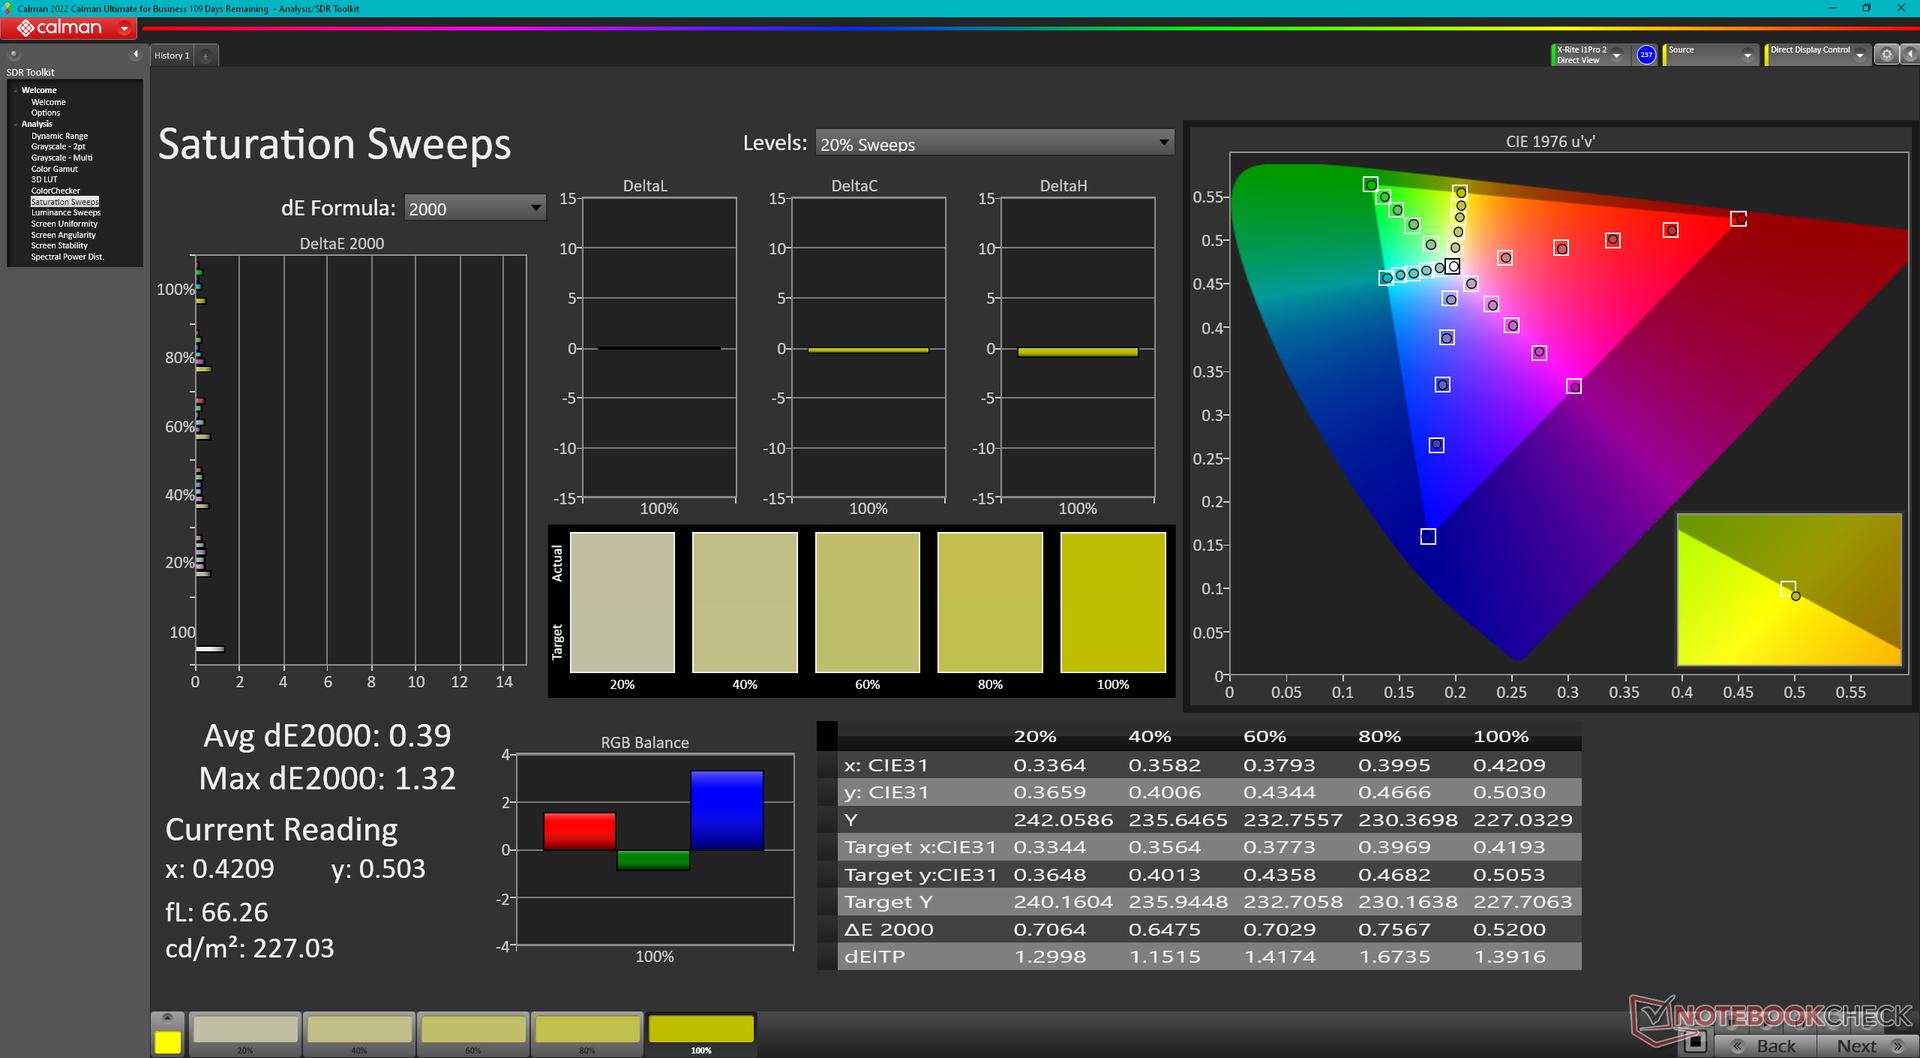
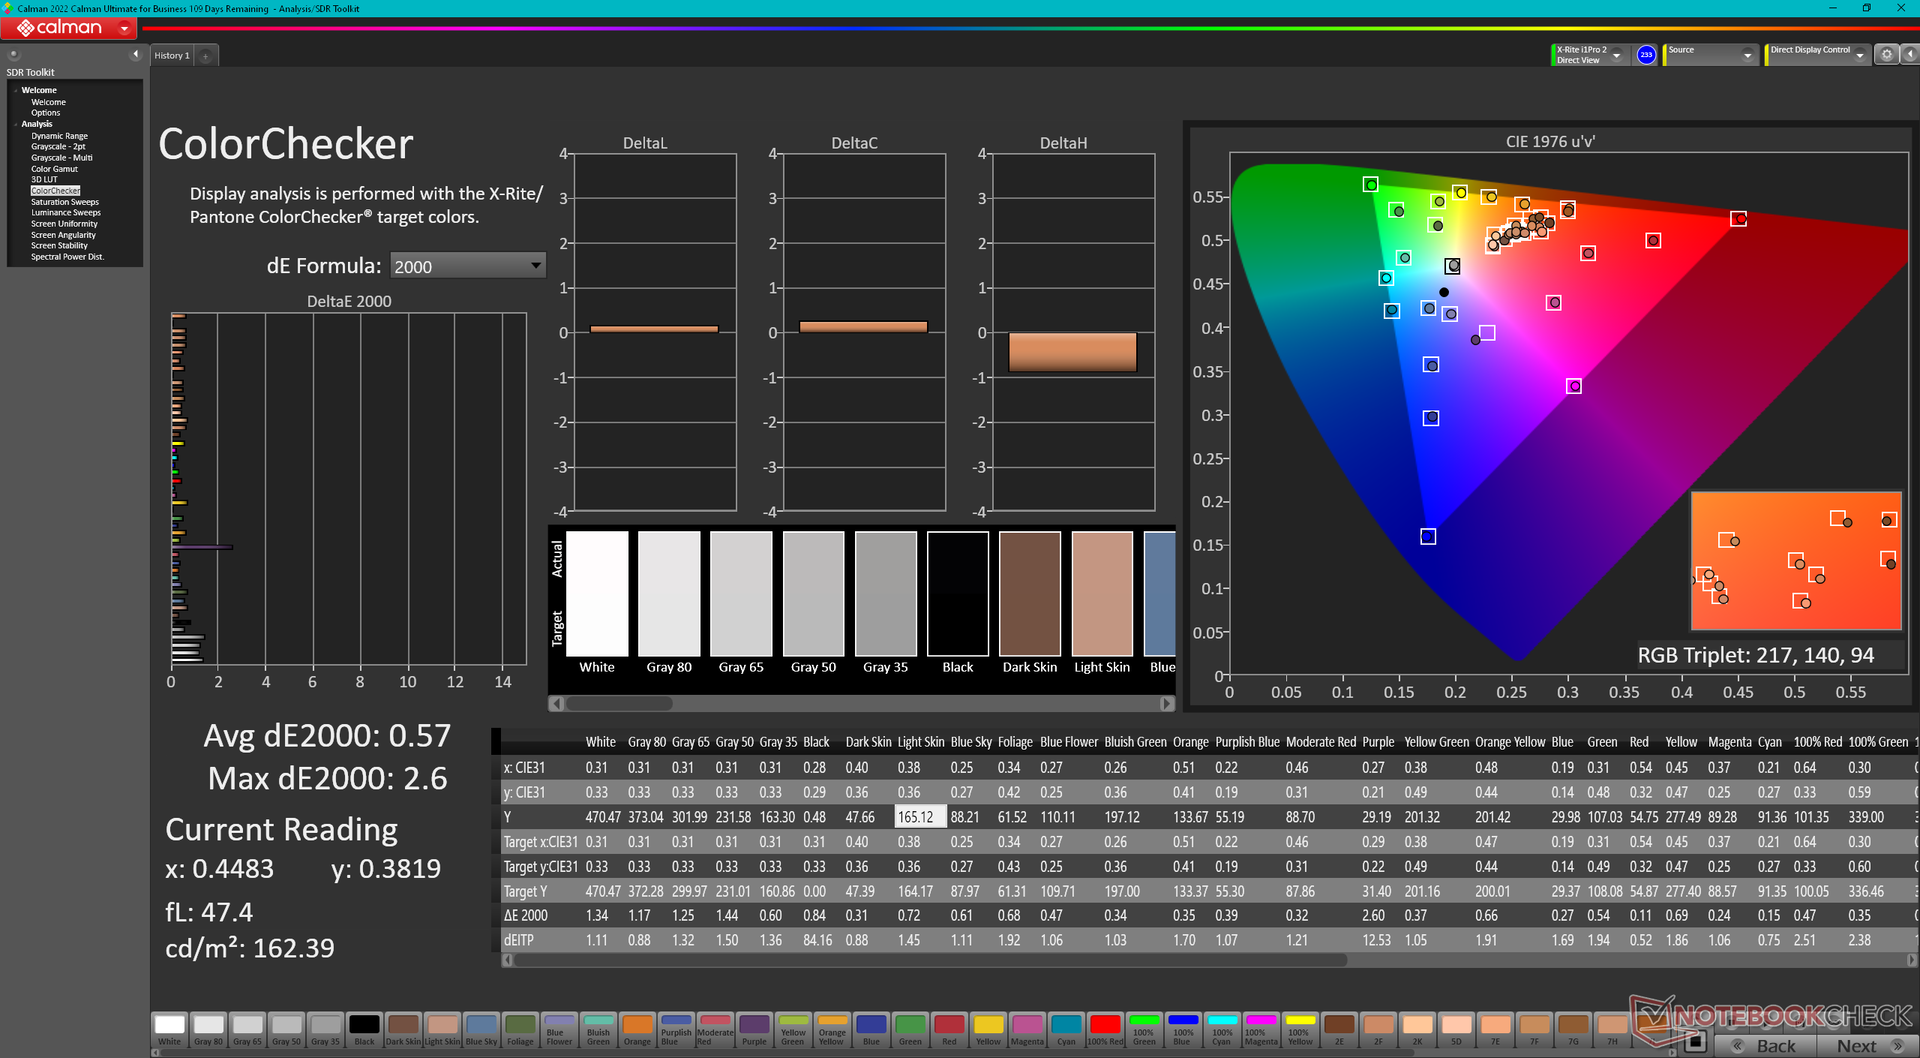
La pantalla viene precalibrada con unos valores medios deltaE en escala de grises y color de sólo 2,8 y 2,12, respectivamente. Calibrarla nosotros mismos con un colorímetro X-Rite mejoraría aún más estos promedios hasta sólo 0,8 y 0,57, respectivamente. Por tanto, una calibración por parte del usuario final no es del todo necesaria, pero nuestro perfil ICM calibrado está disponible arriba de forma gratuita para los usuarios interesados.
Tiempos de respuesta del display
| ↔ Tiempo de respuesta de Negro a Blanco | ||
|---|---|---|
| 8.9 ms ... subida ↗ y bajada ↘ combinada | ↗ 5.1 ms subida | 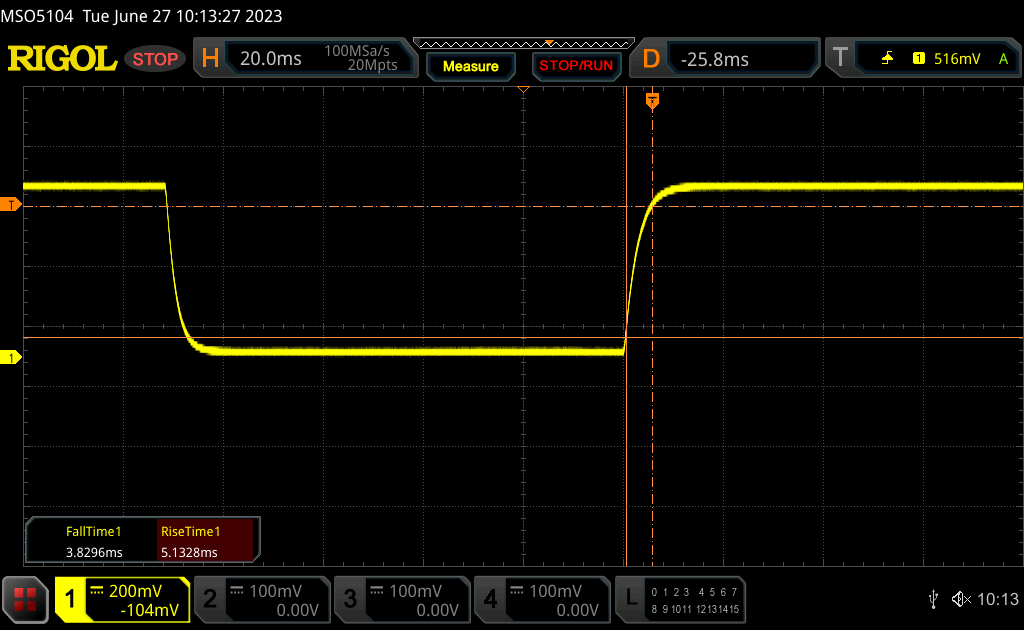 |
| ↘ 3.8 ms bajada | ||
| La pantalla mostró tiempos de respuesta rápidos en nuestros tests y debería ser adecuada para juegos. En comparación, todos los dispositivos de prueba van de ##min### (mínimo) a 240 (máximo) ms. » 25 % de todos los dispositivos son mejores. Esto quiere decir que el tiempo de respuesta medido es mejor que la media (19.8 ms) de todos los dispositivos testados. | ||
| ↔ Tiempo de respuesta 50% Gris a 80% Gris | ||
| 12 ms ... subida ↗ y bajada ↘ combinada | ↗ 6 ms subida | 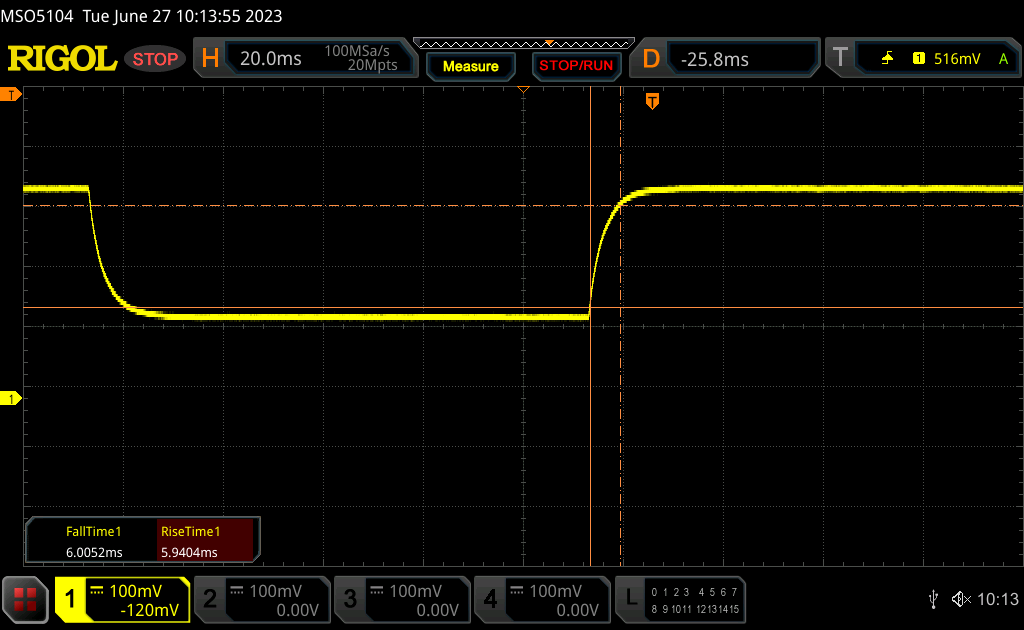 |
| ↘ 6 ms bajada | ||
| La pantalla mostró buenos tiempos de respuesta en nuestros tests pero podría ser demasiado lenta para los jugones competitivos. En comparación, todos los dispositivos de prueba van de ##min### (mínimo) a 636 (máximo) ms. » 25 % de todos los dispositivos son mejores. Esto quiere decir que el tiempo de respuesta medido es mejor que la media (31 ms) de todos los dispositivos testados. | ||
Parpadeo de Pantalla / PWM (Pulse-Width Modulation)
| Parpadeo de Pantalla / PWM no detectado | 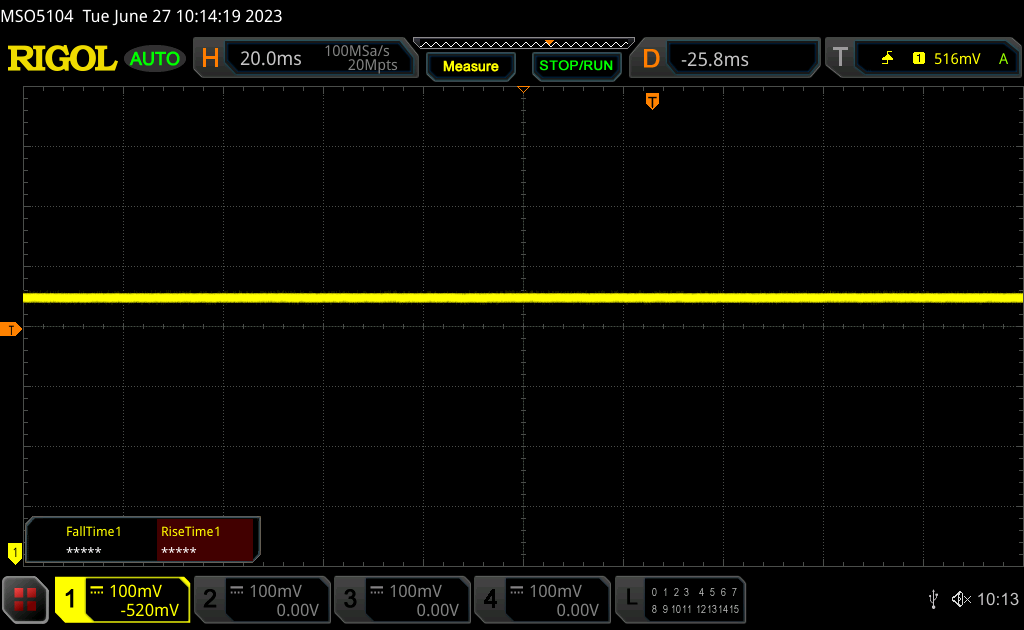 | ||
Comparación: 52 % de todos los dispositivos testados no usaron PWM para atenuar el display. Si se usó, medimos una media de 7757 (mínimo: 5 - máxmo: 343500) Hz. | |||
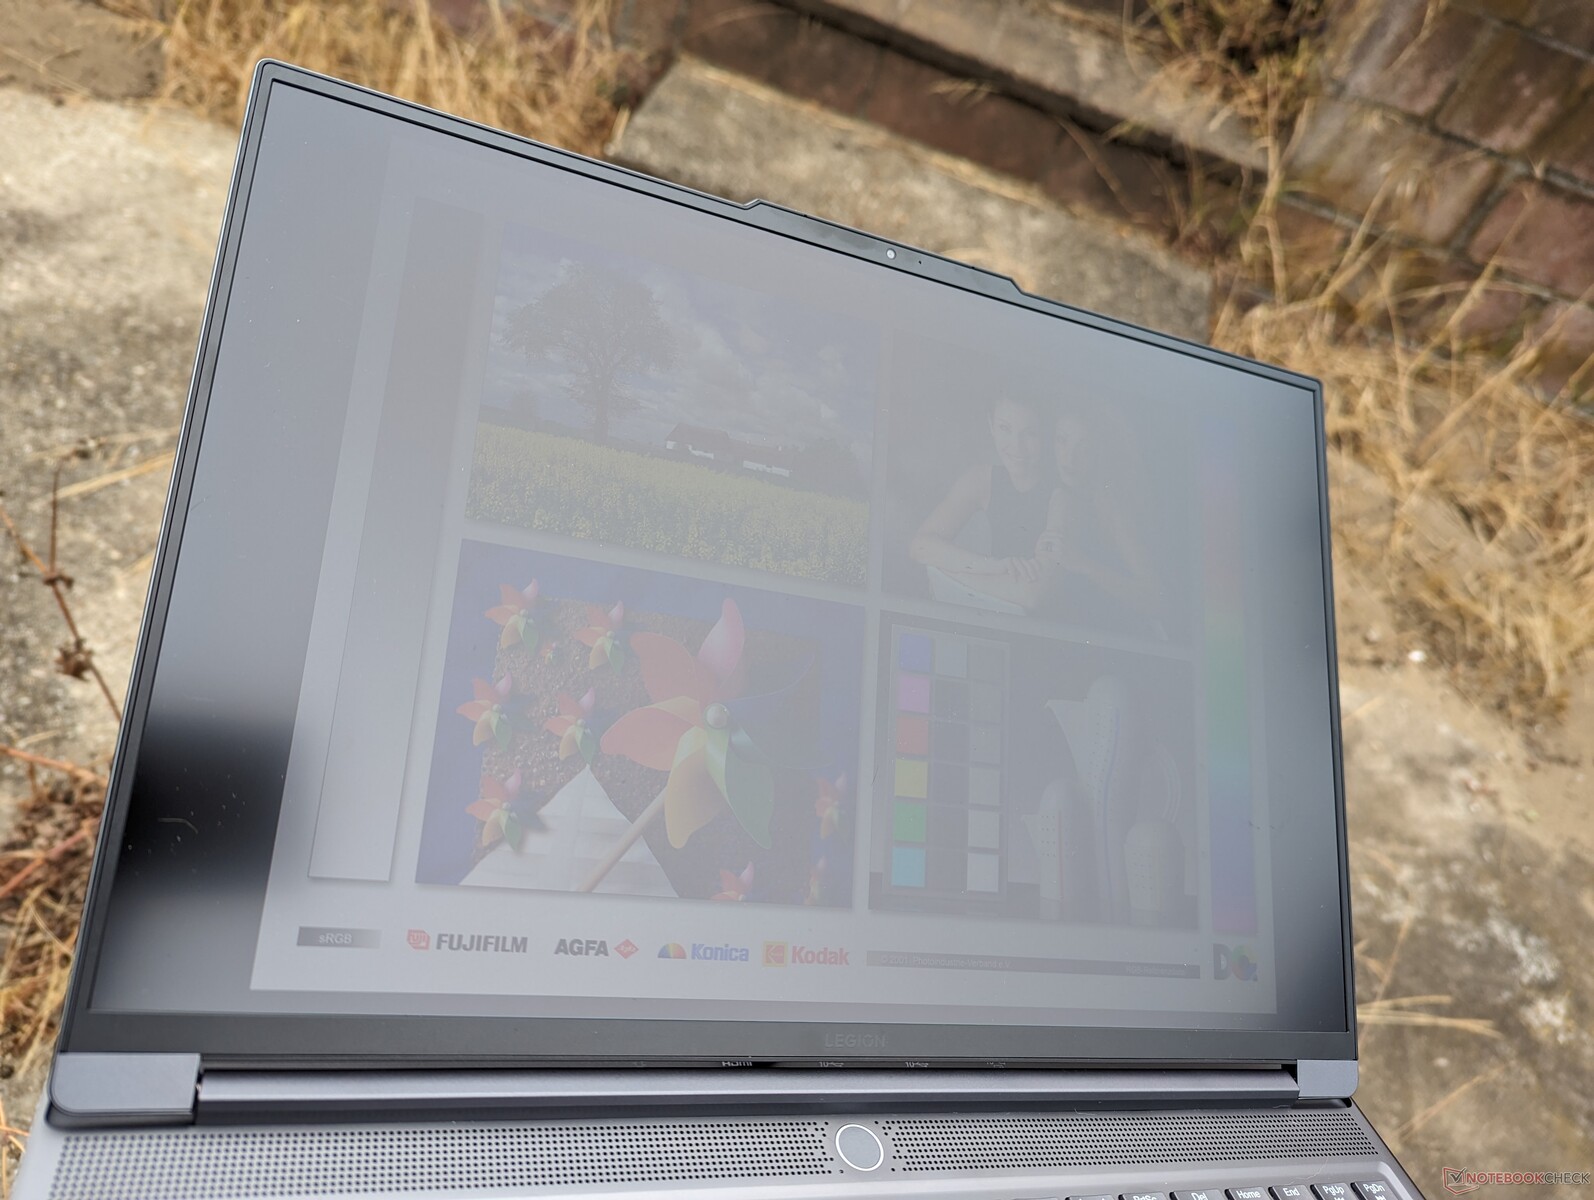
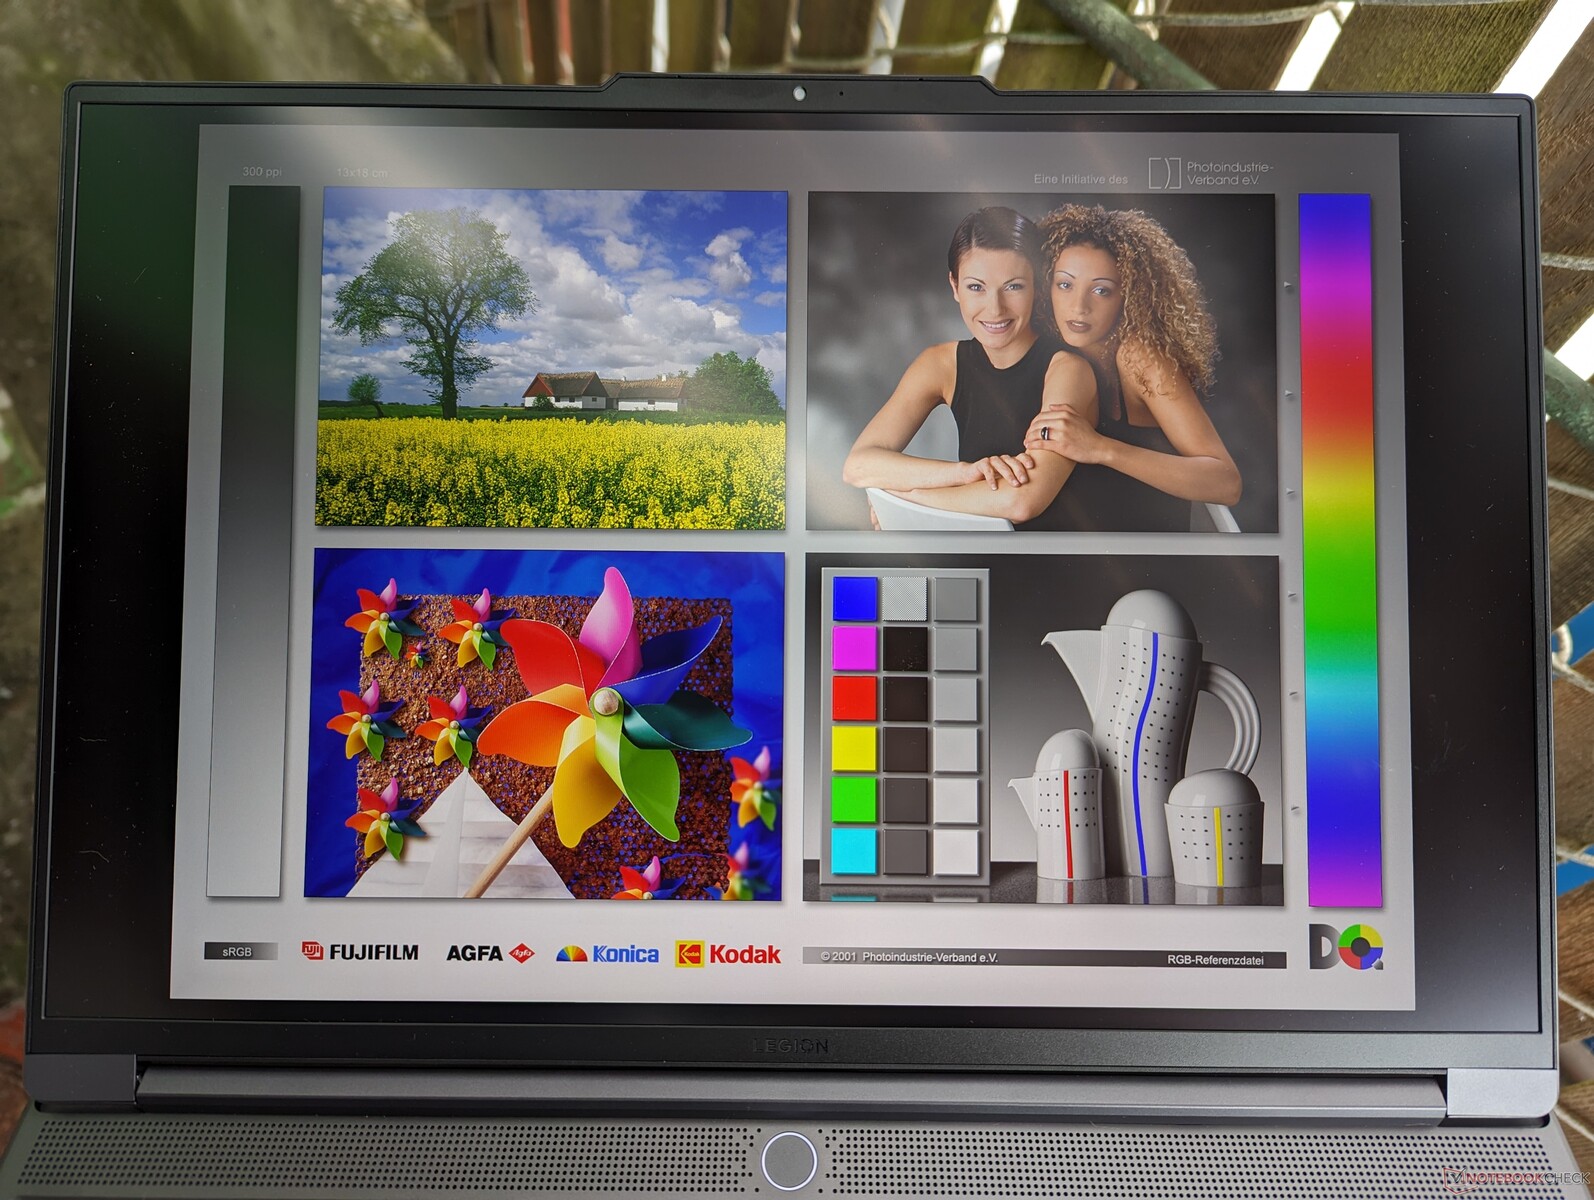
La pantalla es notablemente más brillante que en elOmen 16 o en el Alienware x16 R1 para facilitar la lectura en exteriores. De hecho, su ajuste de brillo máximo es sólo un 10 por ciento más tenue que en el MacBook Pro 16.
Rendimiento - Core i9 de 13ª generación
Condiciones de ensayo
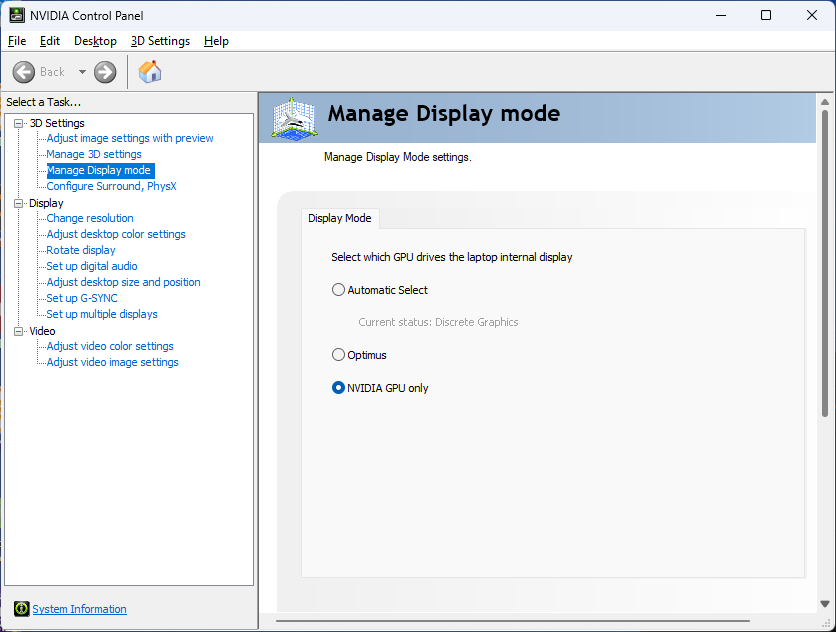
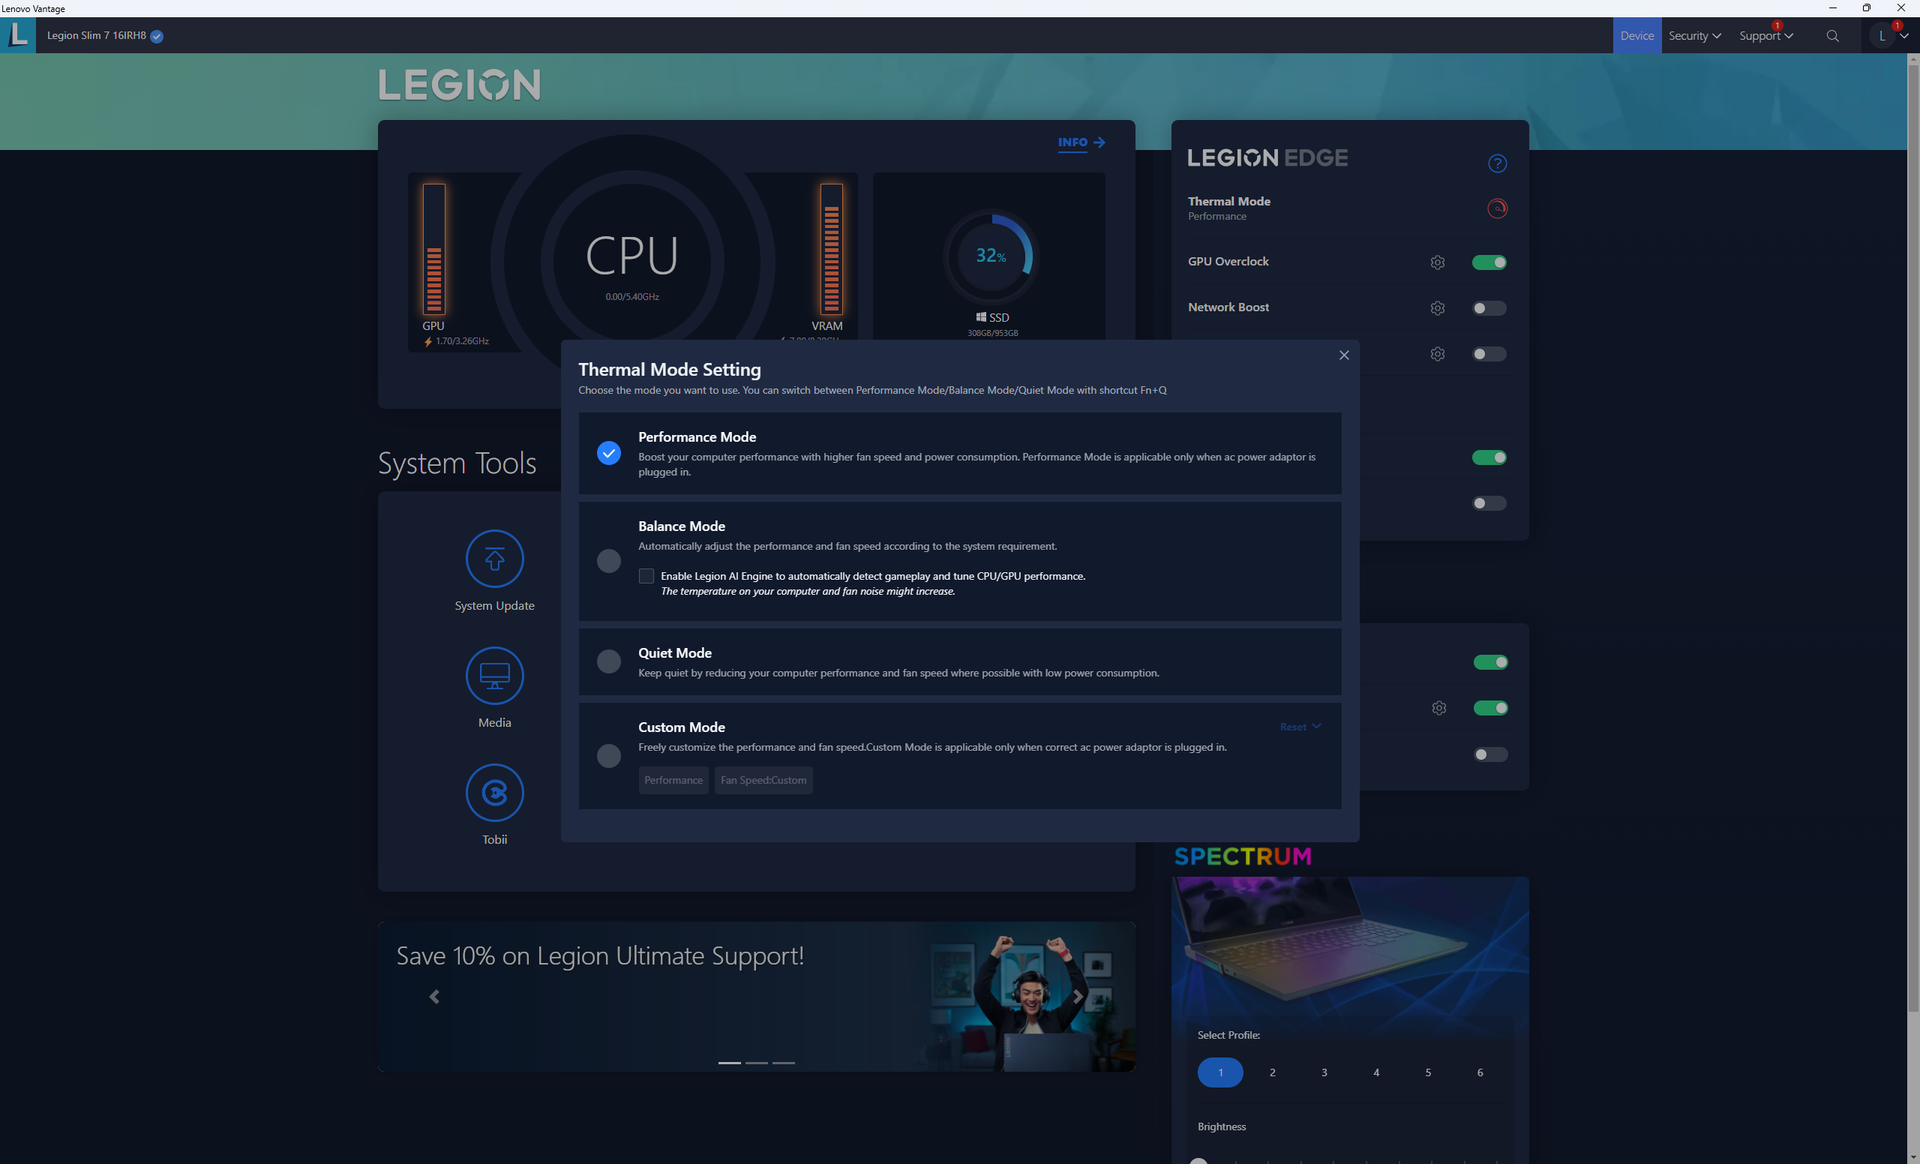
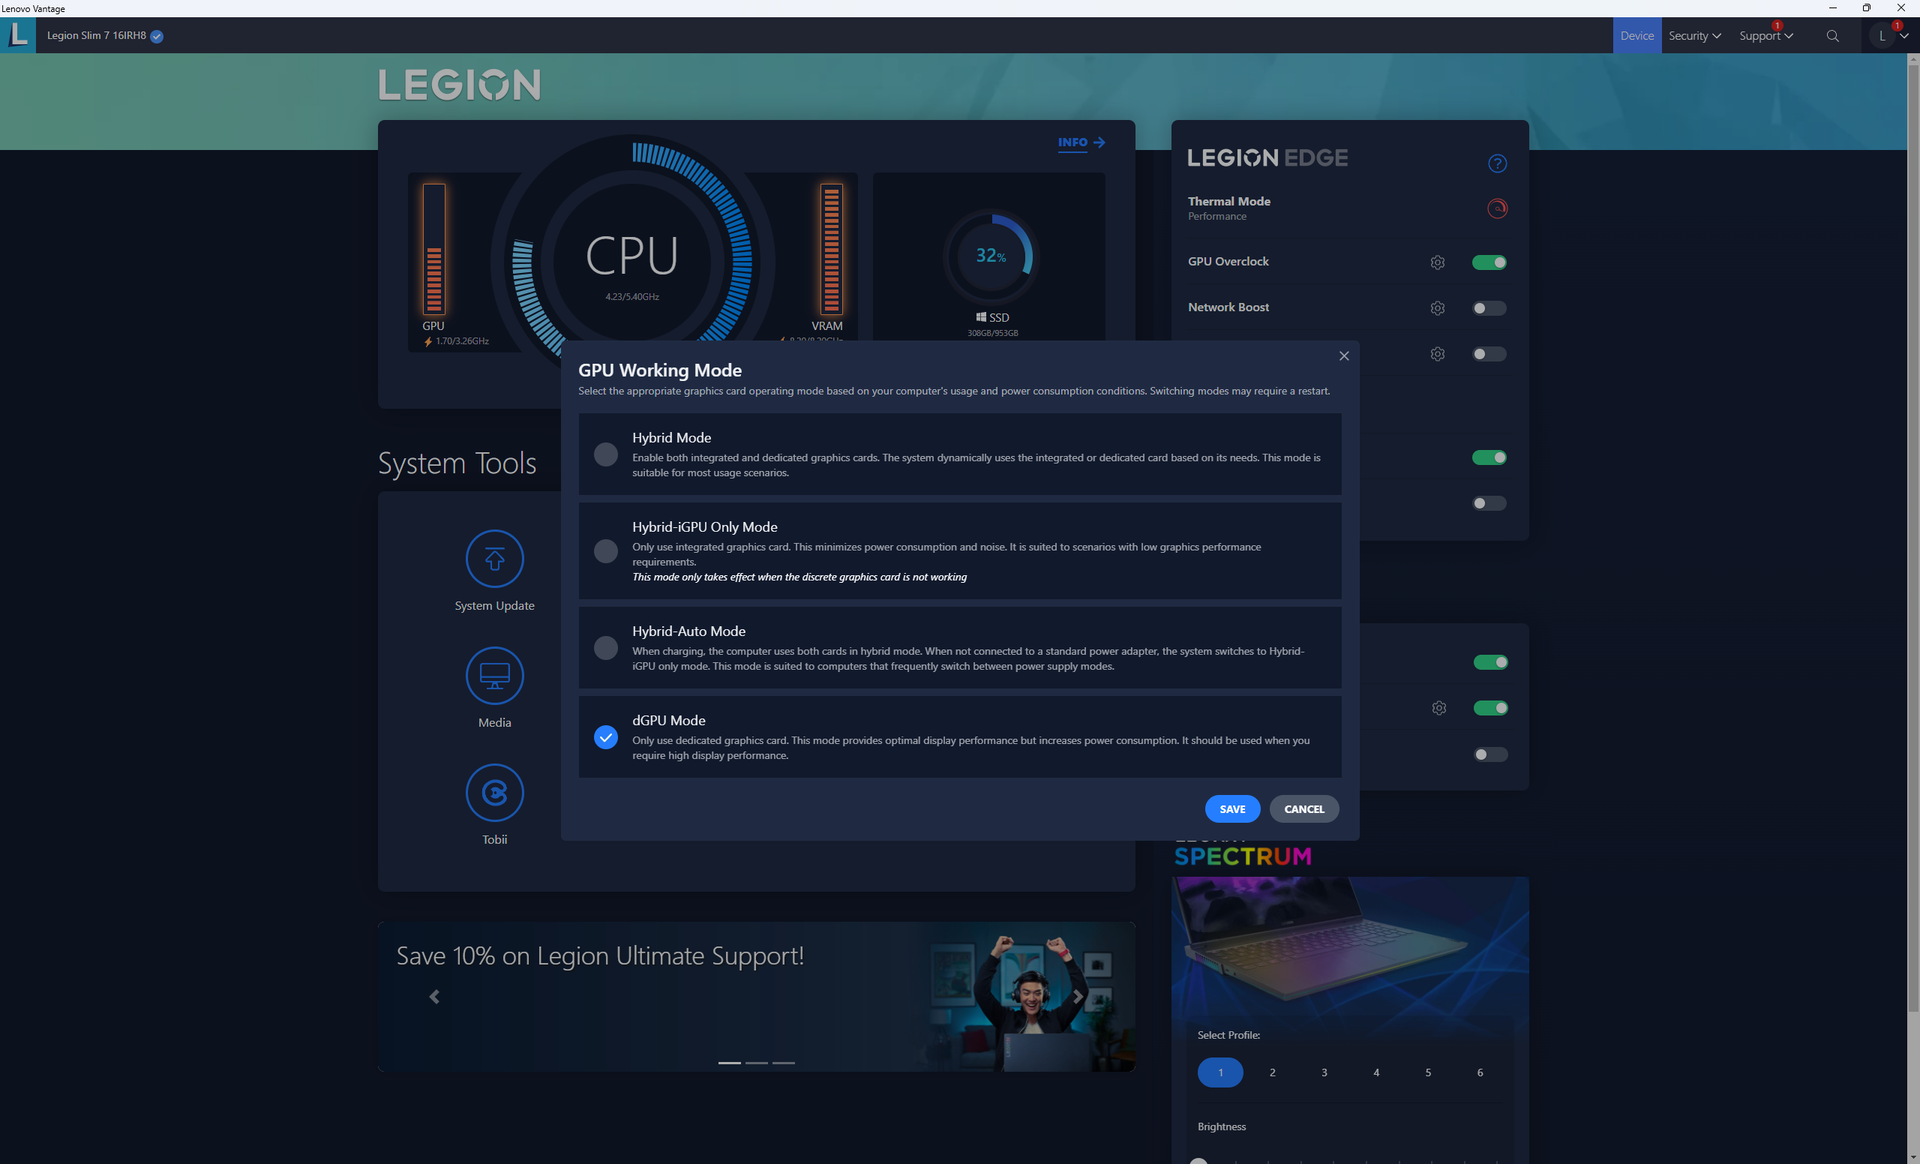
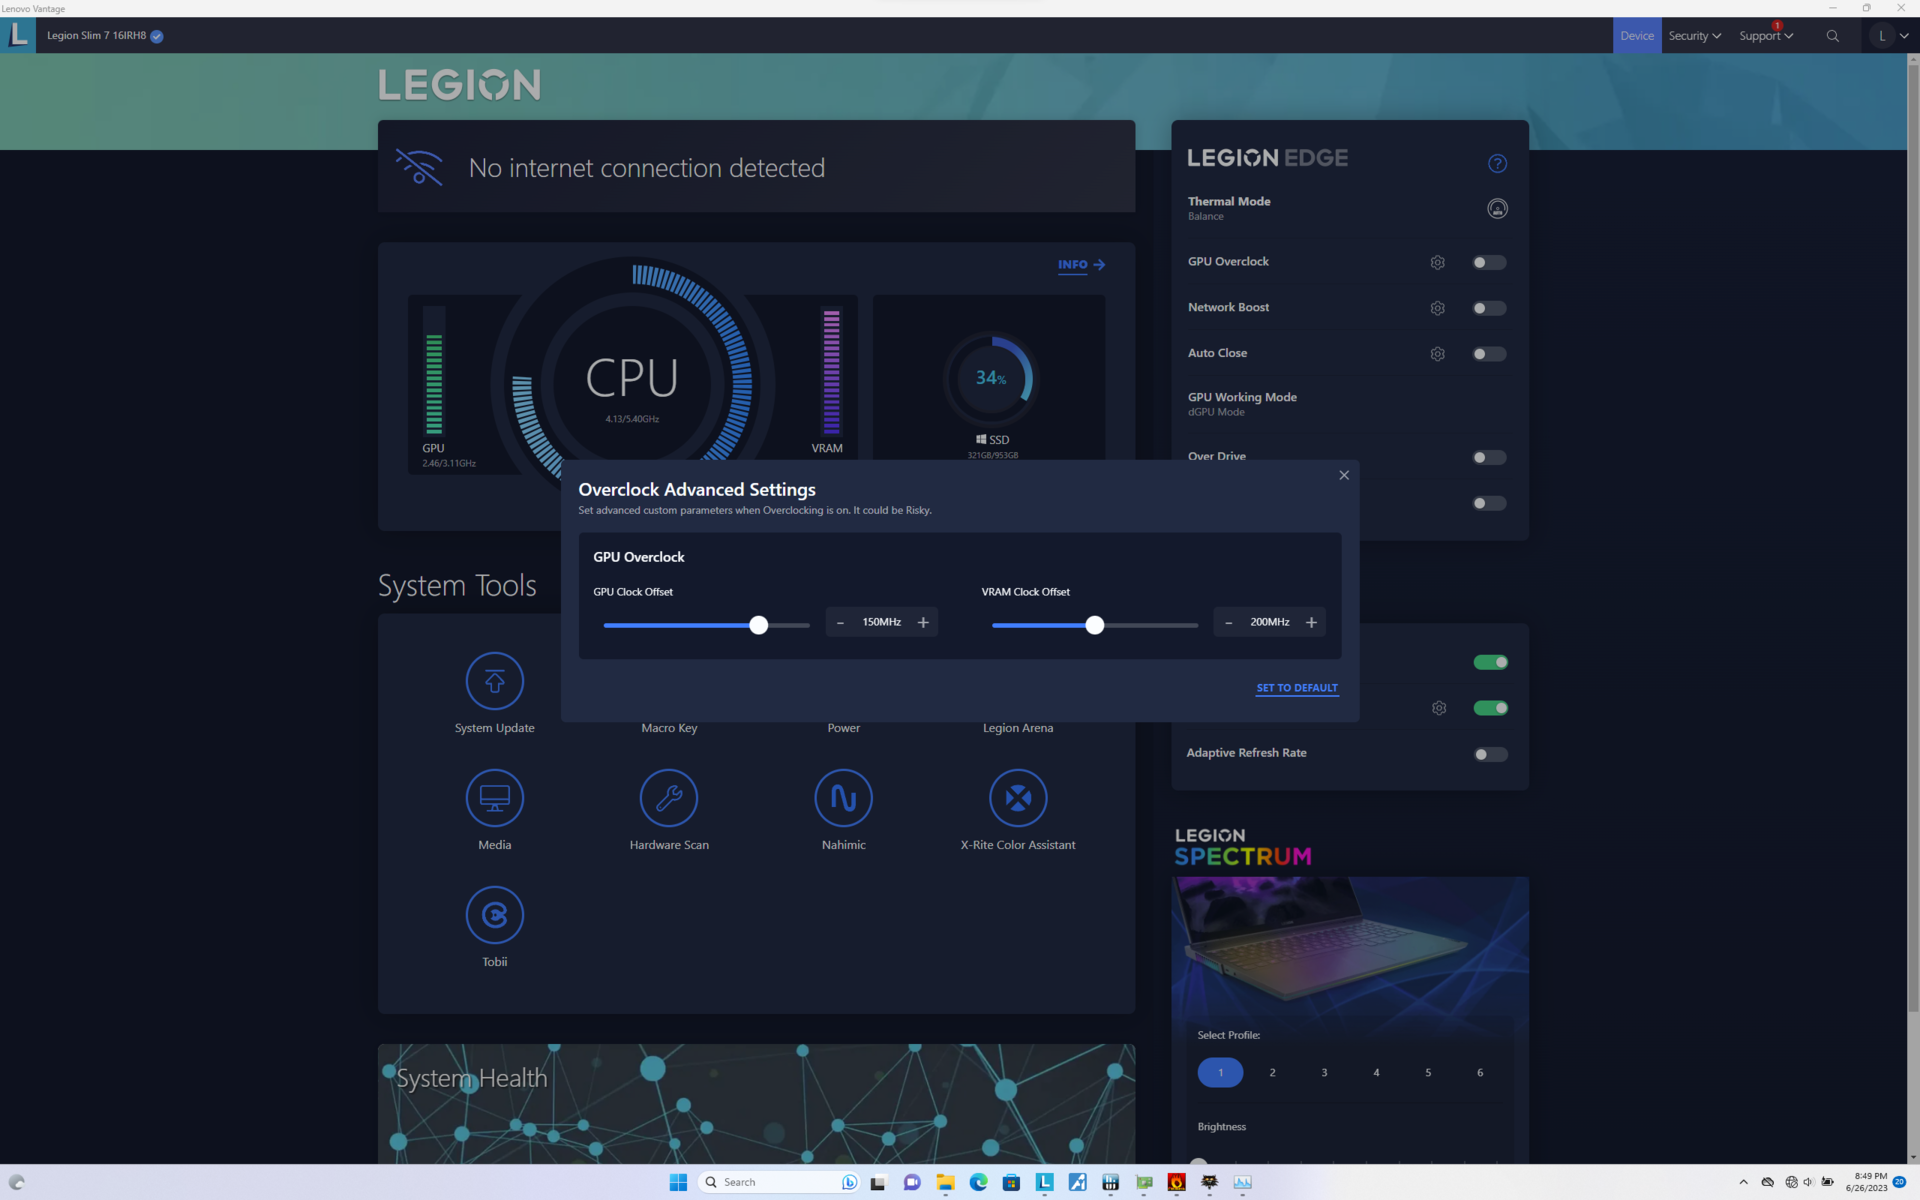
Configuramos nuestra unidad en modo dGPU y modo Rendimiento con GPU Overclock y Overdrive activos antes de ejecutar los benchmarks que se muestran a continuación. Lenovo Vantage es el centro de control para ajustar el rendimiento, las actualizaciones, la garantía, el RGB y otras funciones.
Soporta Advanced Optimus o MUX.
Es importante tener en cuenta que nuestra unidad tiene una ranura SODIMM desocupada, por lo que sólo funciona con 16 GB de RAM soldada de un solo canal. Los resultados del benchmark de memoria AIDA64 son, por tanto, muy inferiores a los de la mayoría de portátiles para juegos.
Procesador
El Raptor Lake-H Core i9-13900H ofrece un respetable 25% más de rendimiento multihilo que el Alder Lake-H Core i9-12900H. En particular, su rendimiento es idéntico al del más caroCore i7-13700HX y Core i9-13900HK. Si alguna vez te encuentras decidiendo entre cualquiera de estas tres CPUs de 13ª generación, entonces la opción Core i9-13900H sería la mejor relación calidad-precio.
Si se pasa al modelo básico Core i7-13700H se espera que el rendimiento del procesador disminuya entre un 20 y un 25 por ciento.
Cinebench R15 Multi Loop
Cinebench R20: CPU (Multi Core) | CPU (Single Core)
Cinebench R23: Multi Core | Single Core
Cinebench R15: CPU Multi 64Bit | CPU Single 64Bit
Blender: v2.79 BMW27 CPU
7-Zip 18.03: 7z b 4 | 7z b 4 -mmt1
Geekbench 5.5: Multi-Core | Single-Core
HWBOT x265 Benchmark v2.2: 4k Preset
LibreOffice : 20 Documents To PDF
R Benchmark 2.5: Overall mean
* ... más pequeño es mejor
AIDA64: FP32 Ray-Trace | FPU Julia | CPU SHA3 | CPU Queen | FPU SinJulia | FPU Mandel | CPU AES | CPU ZLib | FP64 Ray-Trace | CPU PhotoWorxx
| Performance rating | |
| Lenovo Legion Pro 7 RTX4090 | |
| Asus ROG Strix G16 G614JZ | |
| Razer Blade 16 Early 2023 | |
| Alienware x16 R1 | |
| HP Omen 16-wf000 | |
| Lenovo Legion Slim 7i 16 Gen 8 | |
| Medio Intel Core i9-13900H | |
| AIDA64 / FP32 Ray-Trace | |
| Asus ROG Strix G16 G614JZ | |
| Lenovo Legion Pro 7 RTX4090 | |
| Razer Blade 16 Early 2023 | |
| Razer Blade 16 Early 2023 | |
| Razer Blade 16 Early 2023 | |
| HP Omen 16-wf000 | |
| Alienware x16 R1 | |
| Lenovo Legion Slim 7i 16 Gen 8 | |
| Medio Intel Core i9-13900H (6788 - 19557, n=25) | |
| AIDA64 / CPU Queen | |
| Asus ROG Strix G16 G614JZ | |
| Lenovo Legion Pro 7 RTX4090 | |
| Razer Blade 16 Early 2023 | |
| Razer Blade 16 Early 2023 | |
| Lenovo Legion Slim 7i 16 Gen 8 | |
| Alienware x16 R1 | |
| Medio Intel Core i9-13900H (65121 - 120936, n=25) | |
| HP Omen 16-wf000 | |
| AIDA64 / FP64 Ray-Trace | |
| Asus ROG Strix G16 G614JZ | |
| Lenovo Legion Pro 7 RTX4090 | |
| Razer Blade 16 Early 2023 | |
| Razer Blade 16 Early 2023 | |
| Razer Blade 16 Early 2023 | |
| HP Omen 16-wf000 | |
| Alienware x16 R1 | |
| Lenovo Legion Slim 7i 16 Gen 8 | |
| Medio Intel Core i9-13900H (3655 - 10716, n=25) | |
| AIDA64 / CPU PhotoWorxx | |
| Razer Blade 16 Early 2023 | |
| Razer Blade 16 Early 2023 | |
| Razer Blade 16 Early 2023 | |
| Lenovo Legion Pro 7 RTX4090 | |
| Alienware x16 R1 | |
| HP Omen 16-wf000 | |
| Medio Intel Core i9-13900H (10871 - 50488, n=25) | |
| Asus ROG Strix G16 G614JZ | |
| Lenovo Legion Slim 7i 16 Gen 8 | |
Rendimiento del sistema
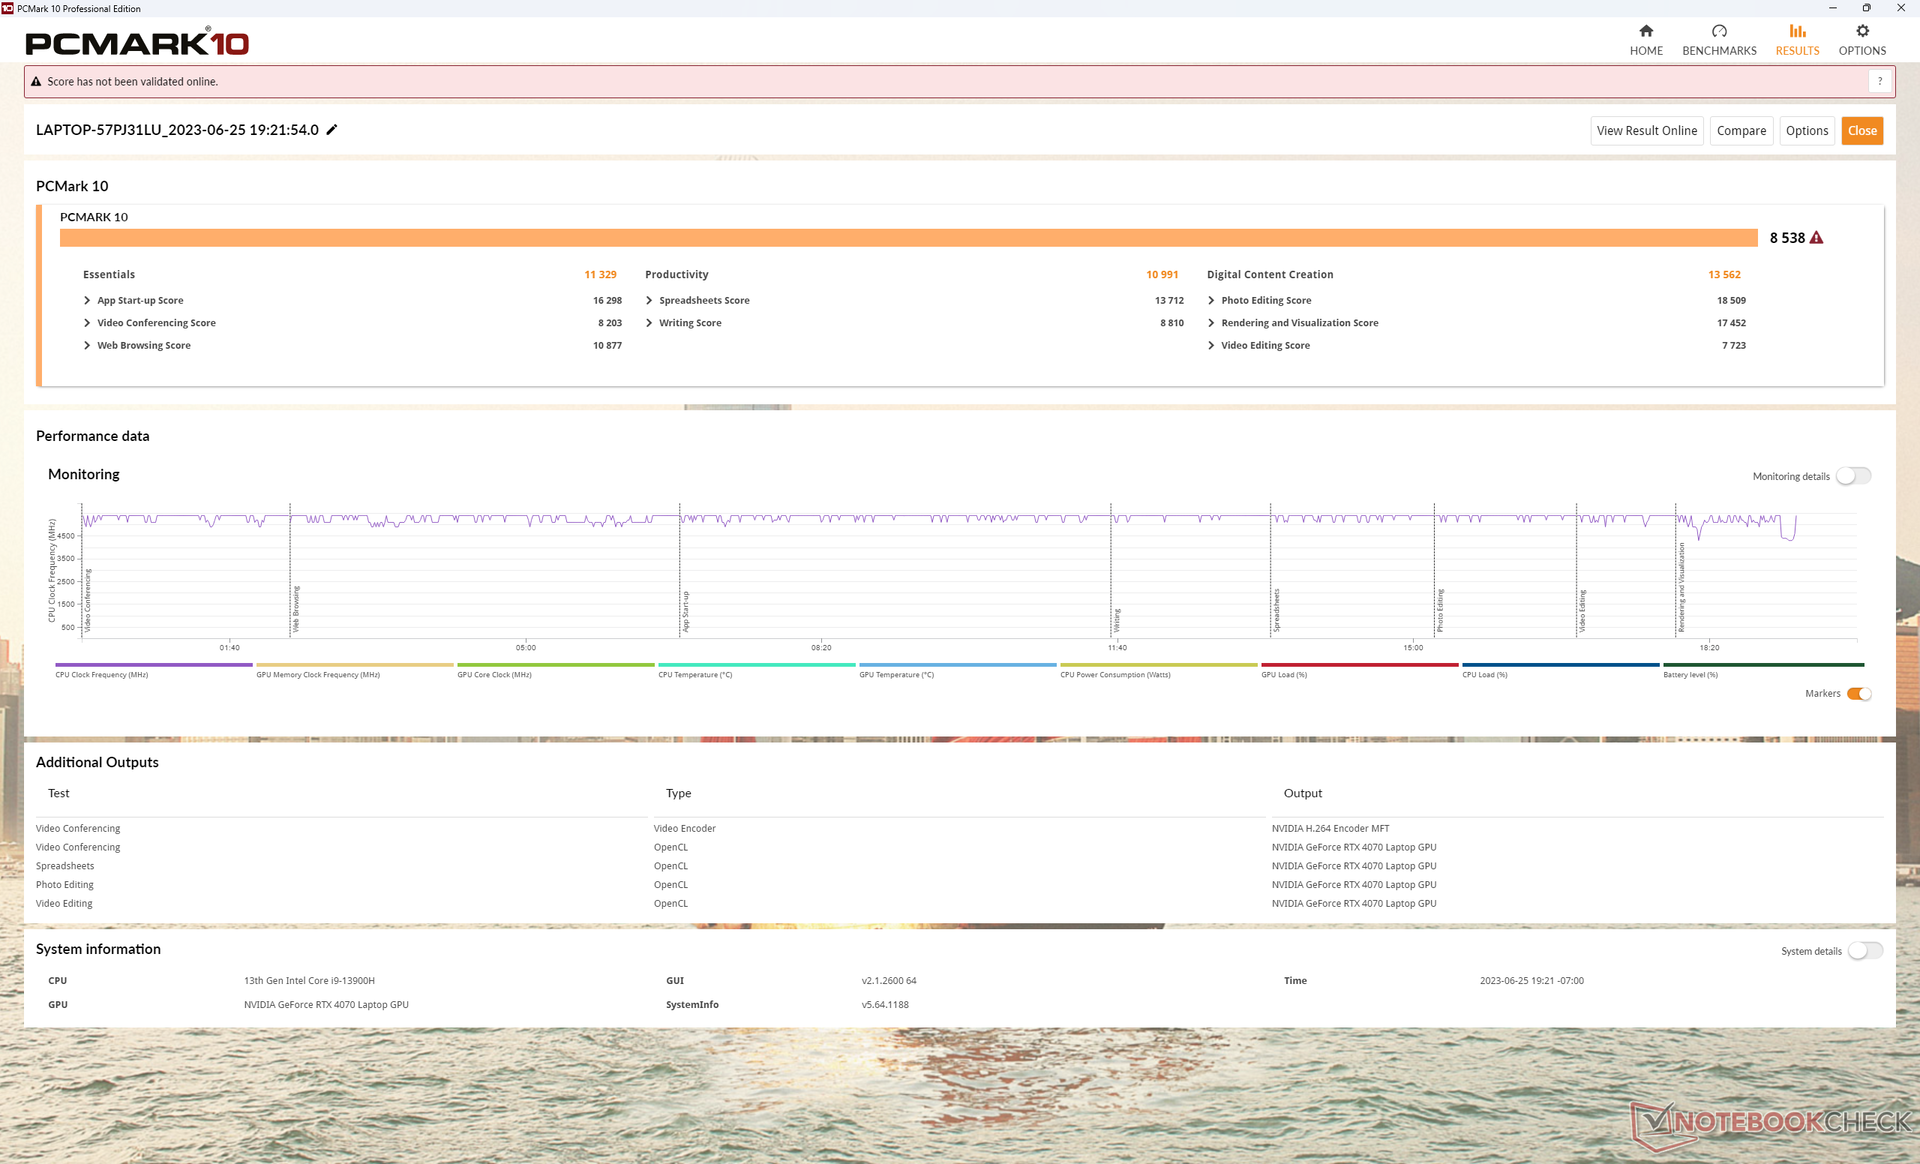
Los resultados de PCMark son excelentes, comparables a los de otros portátiles para juegos de gama alta. Sin embargo, experimentamos problemas al despertar del reposo en los que el portátil tardaba con frecuencia hasta 10 segundos antes de que la pantalla se encendiera correctamente en comparación con sólo un par de segundos como máximo en otros portátiles.
CrossMark: Overall | Productivity | Creativity | Responsiveness
| PCMark 10 / Score | |
| Lenovo Legion Slim 7i 16 Gen 8 | |
| Alienware x16 R1 | |
| Lenovo Legion Pro 7 RTX4090 | |
| Razer Blade 16 Early 2023 | |
| HP Omen 16-wf000 | |
| Medio Intel Core i9-13900H, NVIDIA GeForce RTX 4070 Laptop GPU (5855 - 8538, n=8) | |
| Asus ROG Strix G16 G614JZ | |
| PCMark 10 / Essentials | |
| Asus ROG Strix G16 G614JZ | |
| Lenovo Legion Slim 7i 16 Gen 8 | |
| Alienware x16 R1 | |
| Lenovo Legion Pro 7 RTX4090 | |
| Razer Blade 16 Early 2023 | |
| Medio Intel Core i9-13900H, NVIDIA GeForce RTX 4070 Laptop GPU (8835 - 11940, n=8) | |
| HP Omen 16-wf000 | |
| PCMark 10 / Productivity | |
| Lenovo Legion Slim 7i 16 Gen 8 | |
| Alienware x16 R1 | |
| Medio Intel Core i9-13900H, NVIDIA GeForce RTX 4070 Laptop GPU (7967 - 10991, n=8) | |
| HP Omen 16-wf000 | |
| Lenovo Legion Pro 7 RTX4090 | |
| Razer Blade 16 Early 2023 | |
| Asus ROG Strix G16 G614JZ | |
| PCMark 10 / Digital Content Creation | |
| Lenovo Legion Pro 7 RTX4090 | |
| Razer Blade 16 Early 2023 | |
| Alienware x16 R1 | |
| Lenovo Legion Slim 7i 16 Gen 8 | |
| HP Omen 16-wf000 | |
| Medio Intel Core i9-13900H, NVIDIA GeForce RTX 4070 Laptop GPU (7738 - 13575, n=8) | |
| Asus ROG Strix G16 G614JZ | |
| CrossMark / Overall | |
| Asus ROG Strix G16 G614JZ | |
| Lenovo Legion Slim 7i 16 Gen 8 | |
| Alienware x16 R1 | |
| Medio Intel Core i9-13900H, NVIDIA GeForce RTX 4070 Laptop GPU (1104 - 1974, n=7) | |
| HP Omen 16-wf000 | |
| Razer Blade 16 Early 2023 | |
| CrossMark / Productivity | |
| Asus ROG Strix G16 G614JZ | |
| Lenovo Legion Slim 7i 16 Gen 8 | |
| Alienware x16 R1 | |
| Medio Intel Core i9-13900H, NVIDIA GeForce RTX 4070 Laptop GPU (1058 - 1914, n=7) | |
| HP Omen 16-wf000 | |
| Razer Blade 16 Early 2023 | |
| CrossMark / Creativity | |
| Asus ROG Strix G16 G614JZ | |
| Lenovo Legion Slim 7i 16 Gen 8 | |
| Alienware x16 R1 | |
| Medio Intel Core i9-13900H, NVIDIA GeForce RTX 4070 Laptop GPU (1178 - 2254, n=7) | |
| HP Omen 16-wf000 | |
| Razer Blade 16 Early 2023 | |
| CrossMark / Responsiveness | |
| Asus ROG Strix G16 G614JZ | |
| Alienware x16 R1 | |
| Lenovo Legion Slim 7i 16 Gen 8 | |
| Medio Intel Core i9-13900H, NVIDIA GeForce RTX 4070 Laptop GPU (1037 - 1952, n=7) | |
| HP Omen 16-wf000 | |
| Razer Blade 16 Early 2023 | |
| PCMark 10 Score | 8538 puntos | |
ayuda | ||
| AIDA64 / Memory Latency | |
| Alienware x16 R1 | |
| Razer Blade 16 Early 2023 | |
| Razer Blade 16 Early 2023 | |
| Razer Blade 16 Early 2023 | |
| Medio Intel Core i9-13900H (75.8 - 102.3, n=25) | |
| Asus ROG Strix G16 G614JZ | |
| HP Omen 16-wf000 | |
| Lenovo Legion Pro 7 RTX4090 | |
| Lenovo Legion Slim 7i 16 Gen 8 | |
* ... más pequeño es mejor
Latencia del CPD
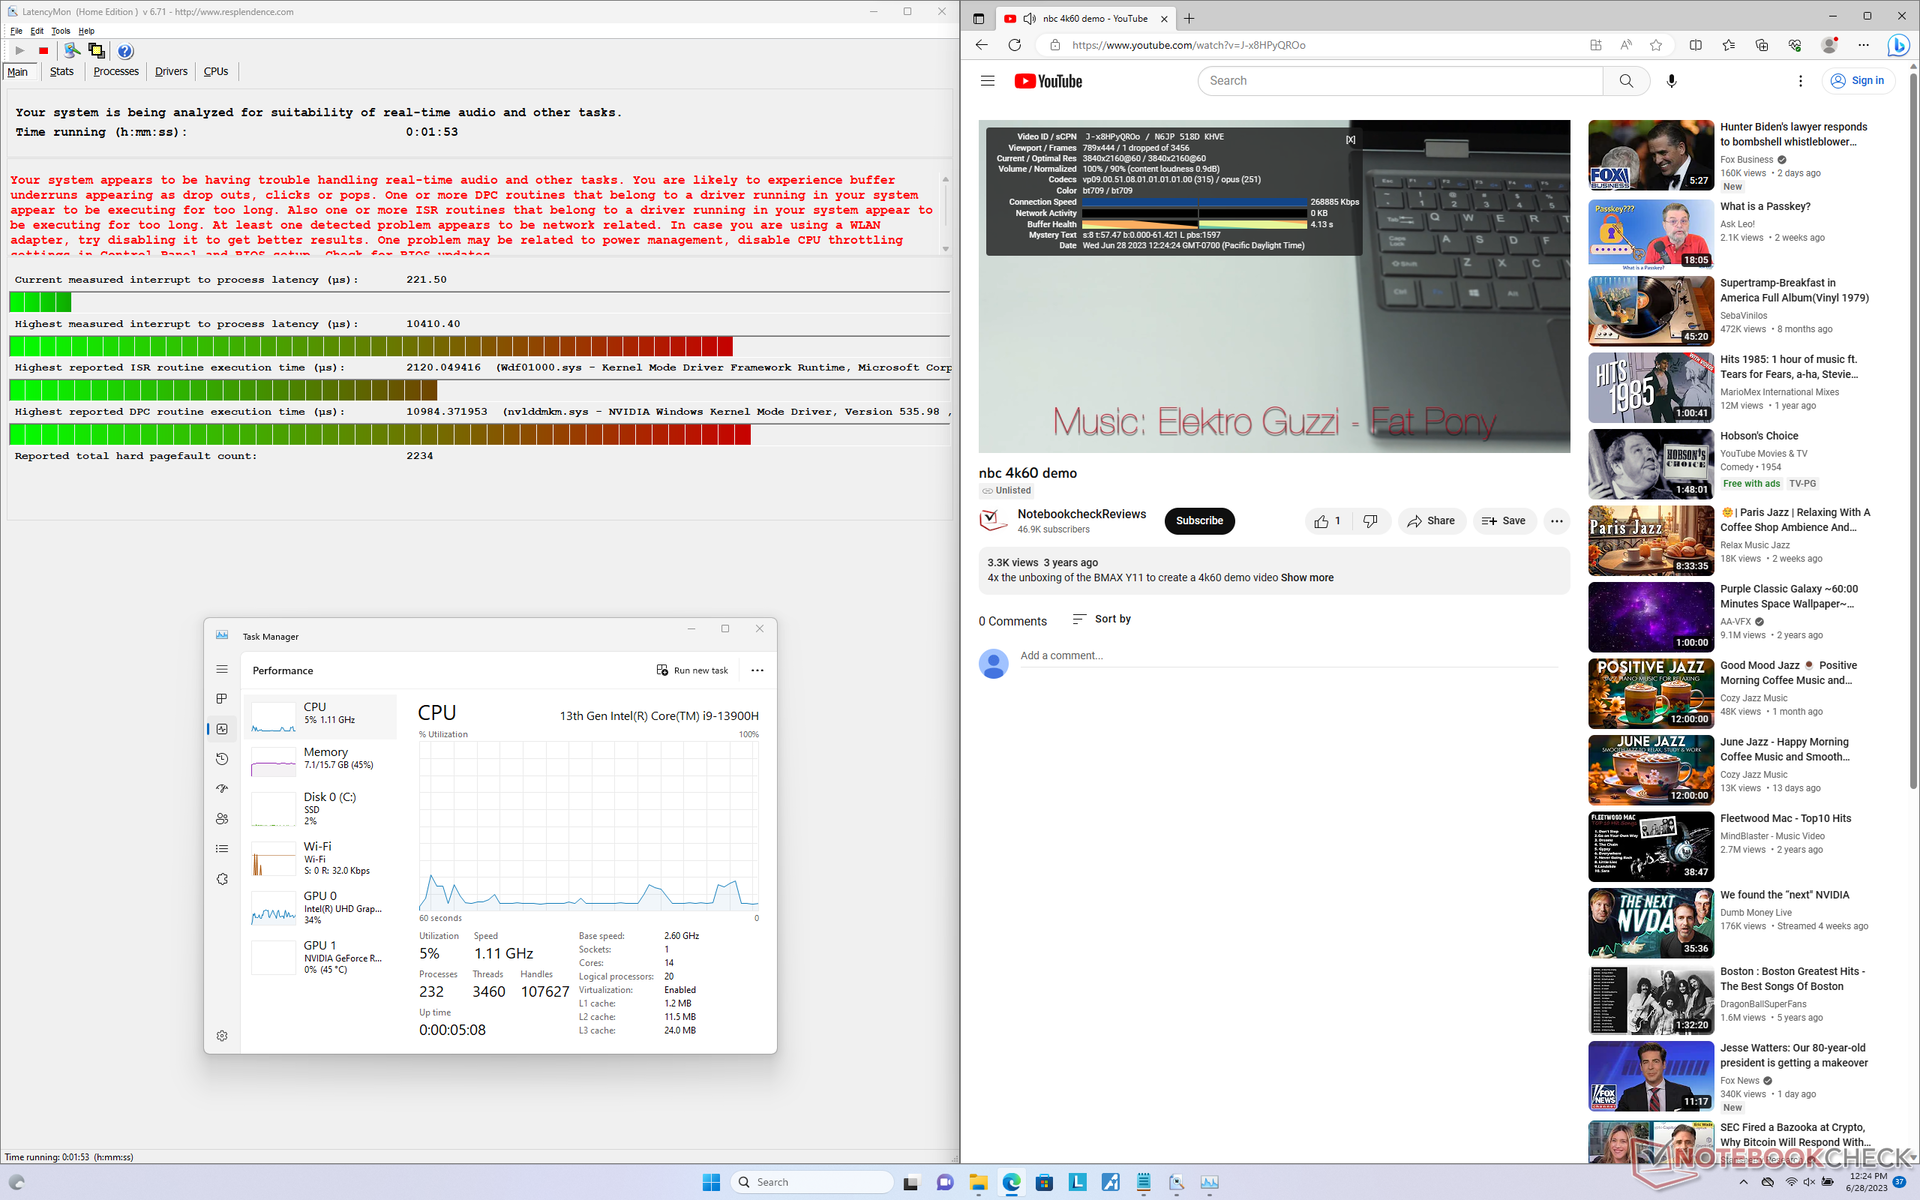
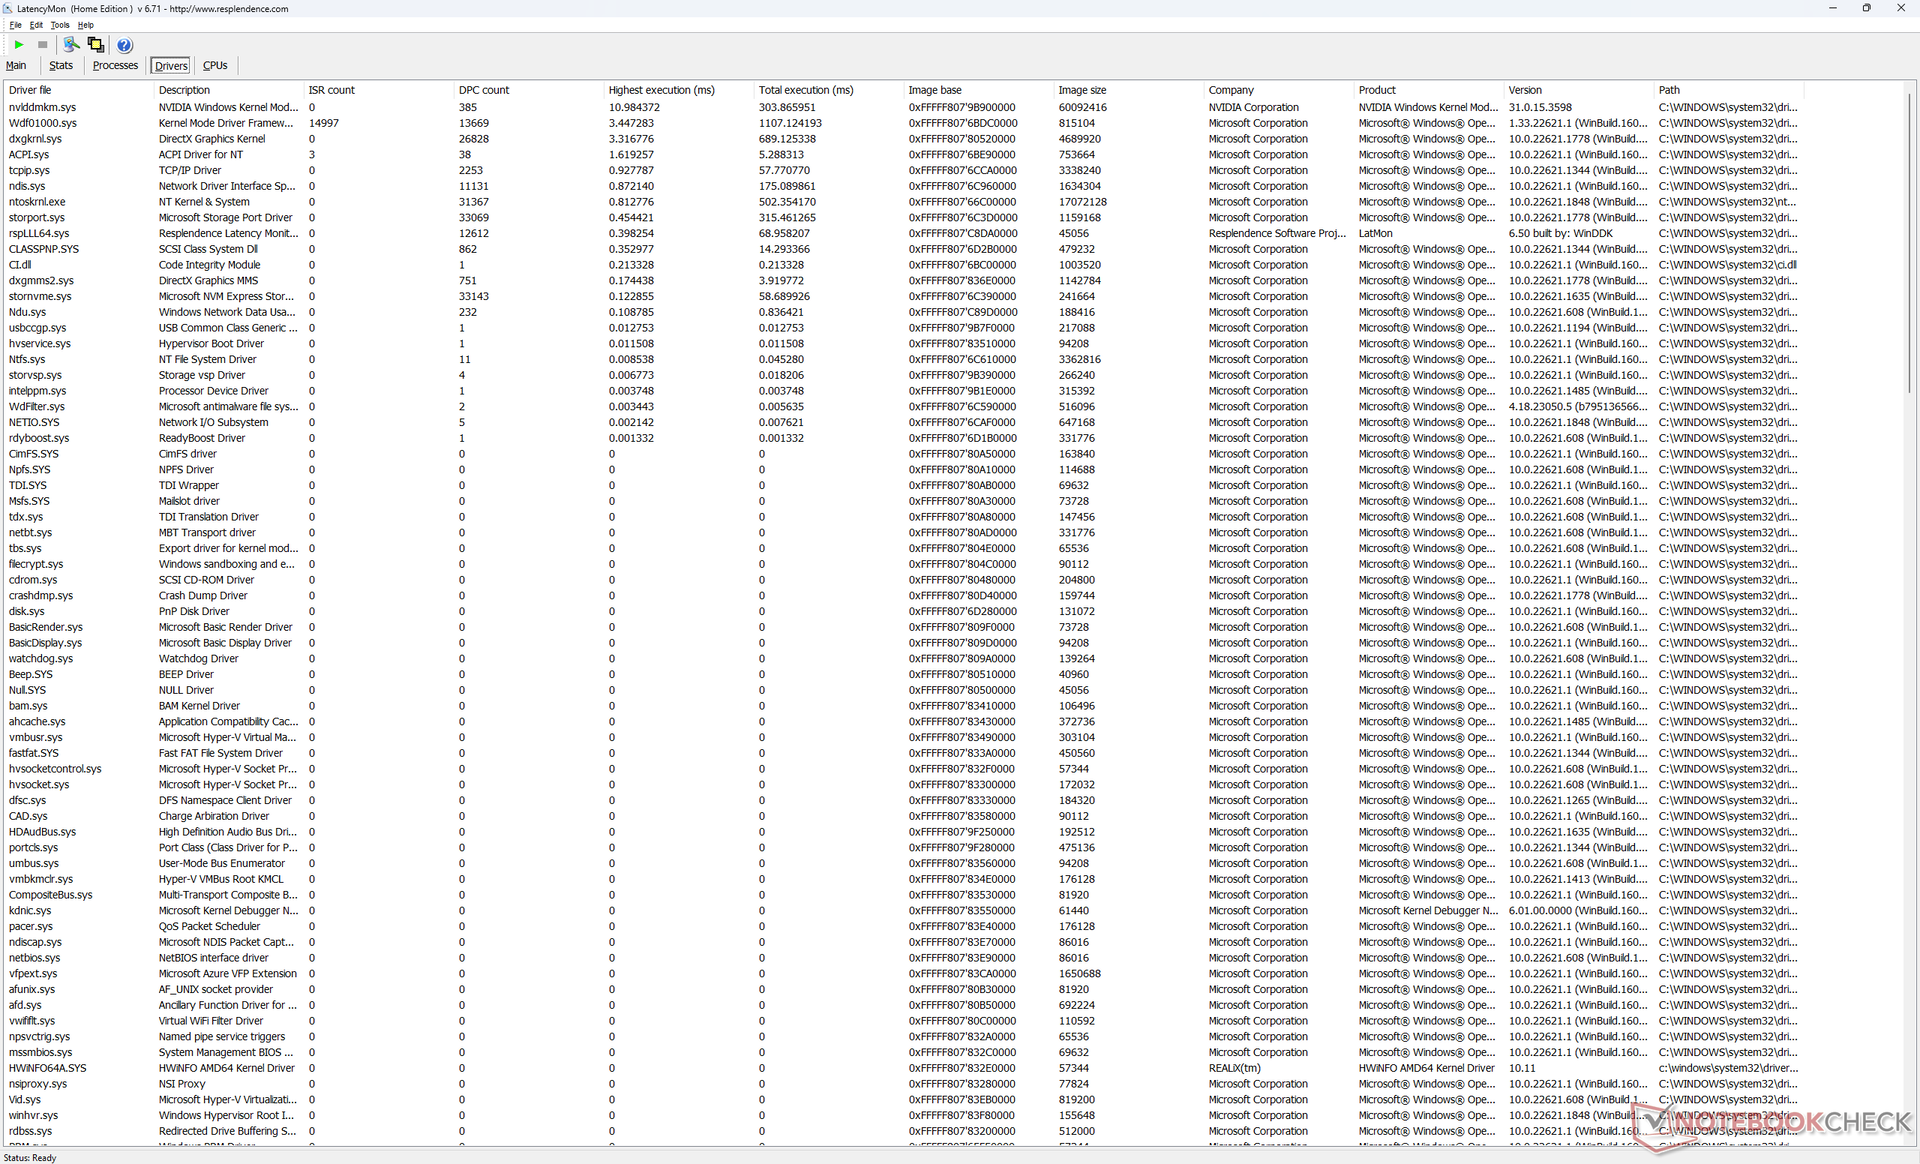
LatencyMon revela problemas de DPC relacionados con el controlador Nvidia NVLDDMKM muy parecido a lo que observamos en el Legion Pro 7 incluso tras varios reintentos. la reproducción de vídeo 4K a 60 FPS es casi perfecta, con un solo fotograma perdido durante nuestro vídeo de prueba.
| DPC Latencies / LatencyMon - interrupt to process latency (max), Web, Youtube, Prime95 | |
| Lenovo Legion Pro 7 RTX4090 | |
| Lenovo Legion Slim 7i 16 Gen 8 | |
| HP Omen 16-wf000 | |
| Asus ROG Strix G16 G614JZ | |
| Razer Blade 16 Early 2023 | |
| Alienware x16 R1 | |
* ... más pequeño es mejor
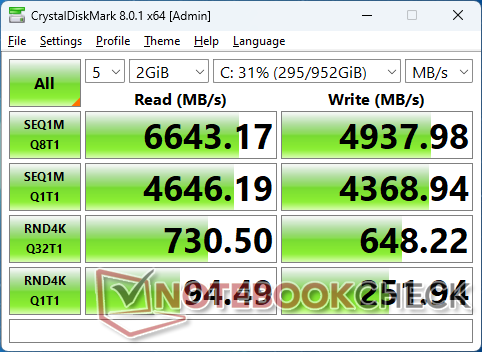
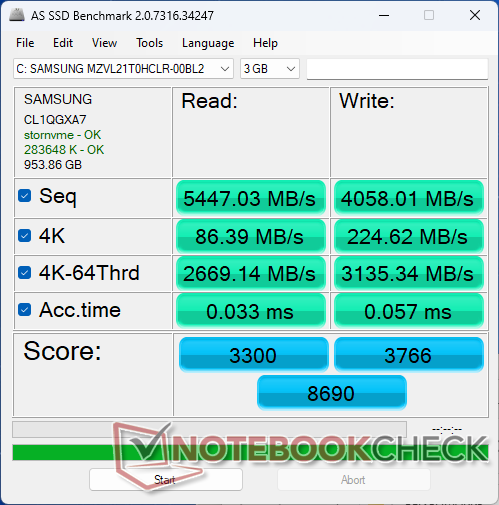
Dispositivos de almacenamiento: hasta dos SSD M.2
Nuestra unidad se entrega con unSamsung PM9A1 que es una de las unidades PCIe4 x4 de consumo más rápidas disponibles. Por desgracia, las tasas de transferencia se estrangulan de 6700 MB/s a tan bajo como 3300 MB/s cuando se estresa como se muestra en nuestra tabla a continuación para sugerir una mala disipación de calor. EnRazer Blade 14 viene con exactamente el mismo SSD Samsung y no presenta estos problemas.

| Drive Performance rating - Percent | |
| Alienware x16 R1 | |
| Lenovo Legion Slim 7i 16 Gen 8 | |
| Lenovo Legion Pro 7 RTX4090 | |
| HP Omen 16-wf000 | |
| Razer Blade 16 Early 2023 | |
| Asus ROG Strix G16 G614JZ | |
* ... más pequeño es mejor
Disk Throttling: DiskSpd Read Loop, Queue Depth 8
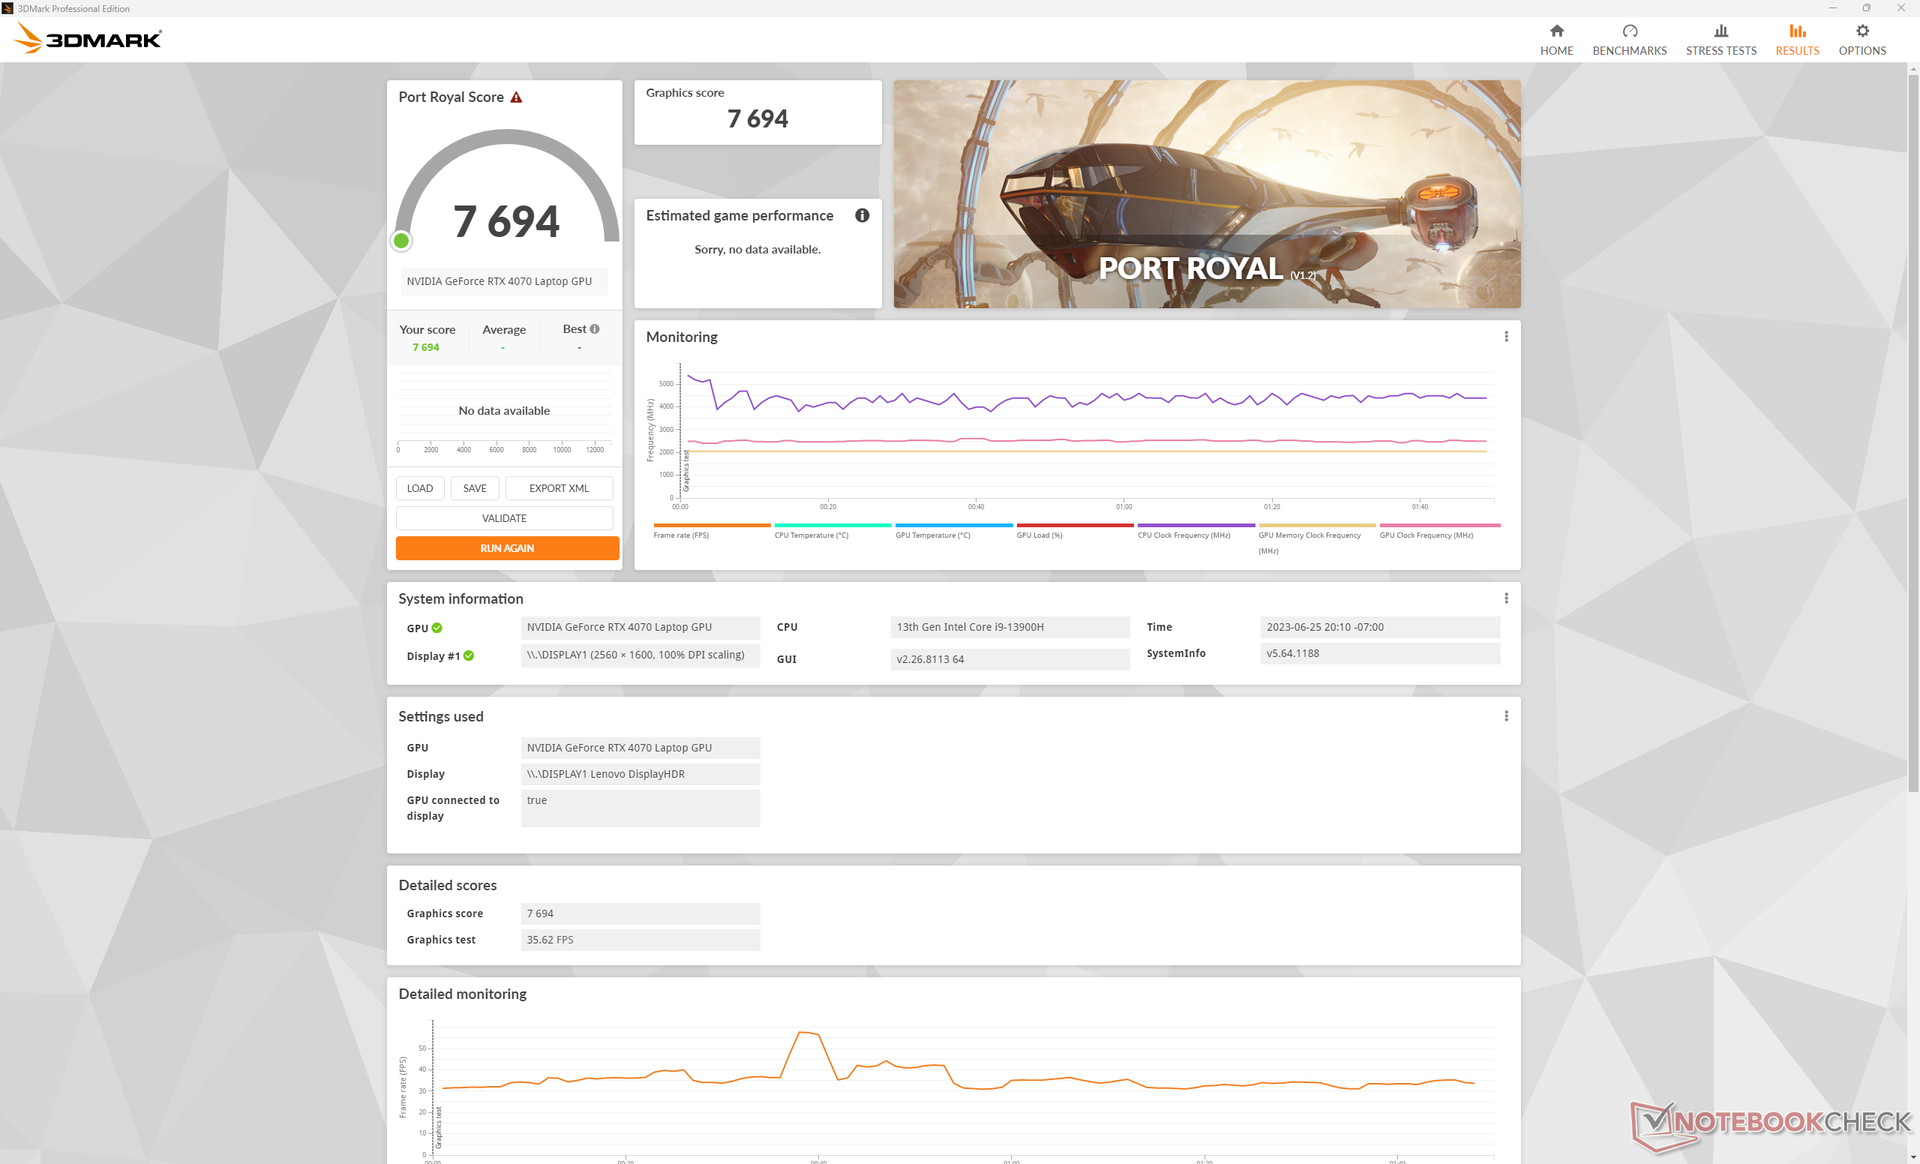
Rendimiento de la GPU - Gráficos RTX de 140 W
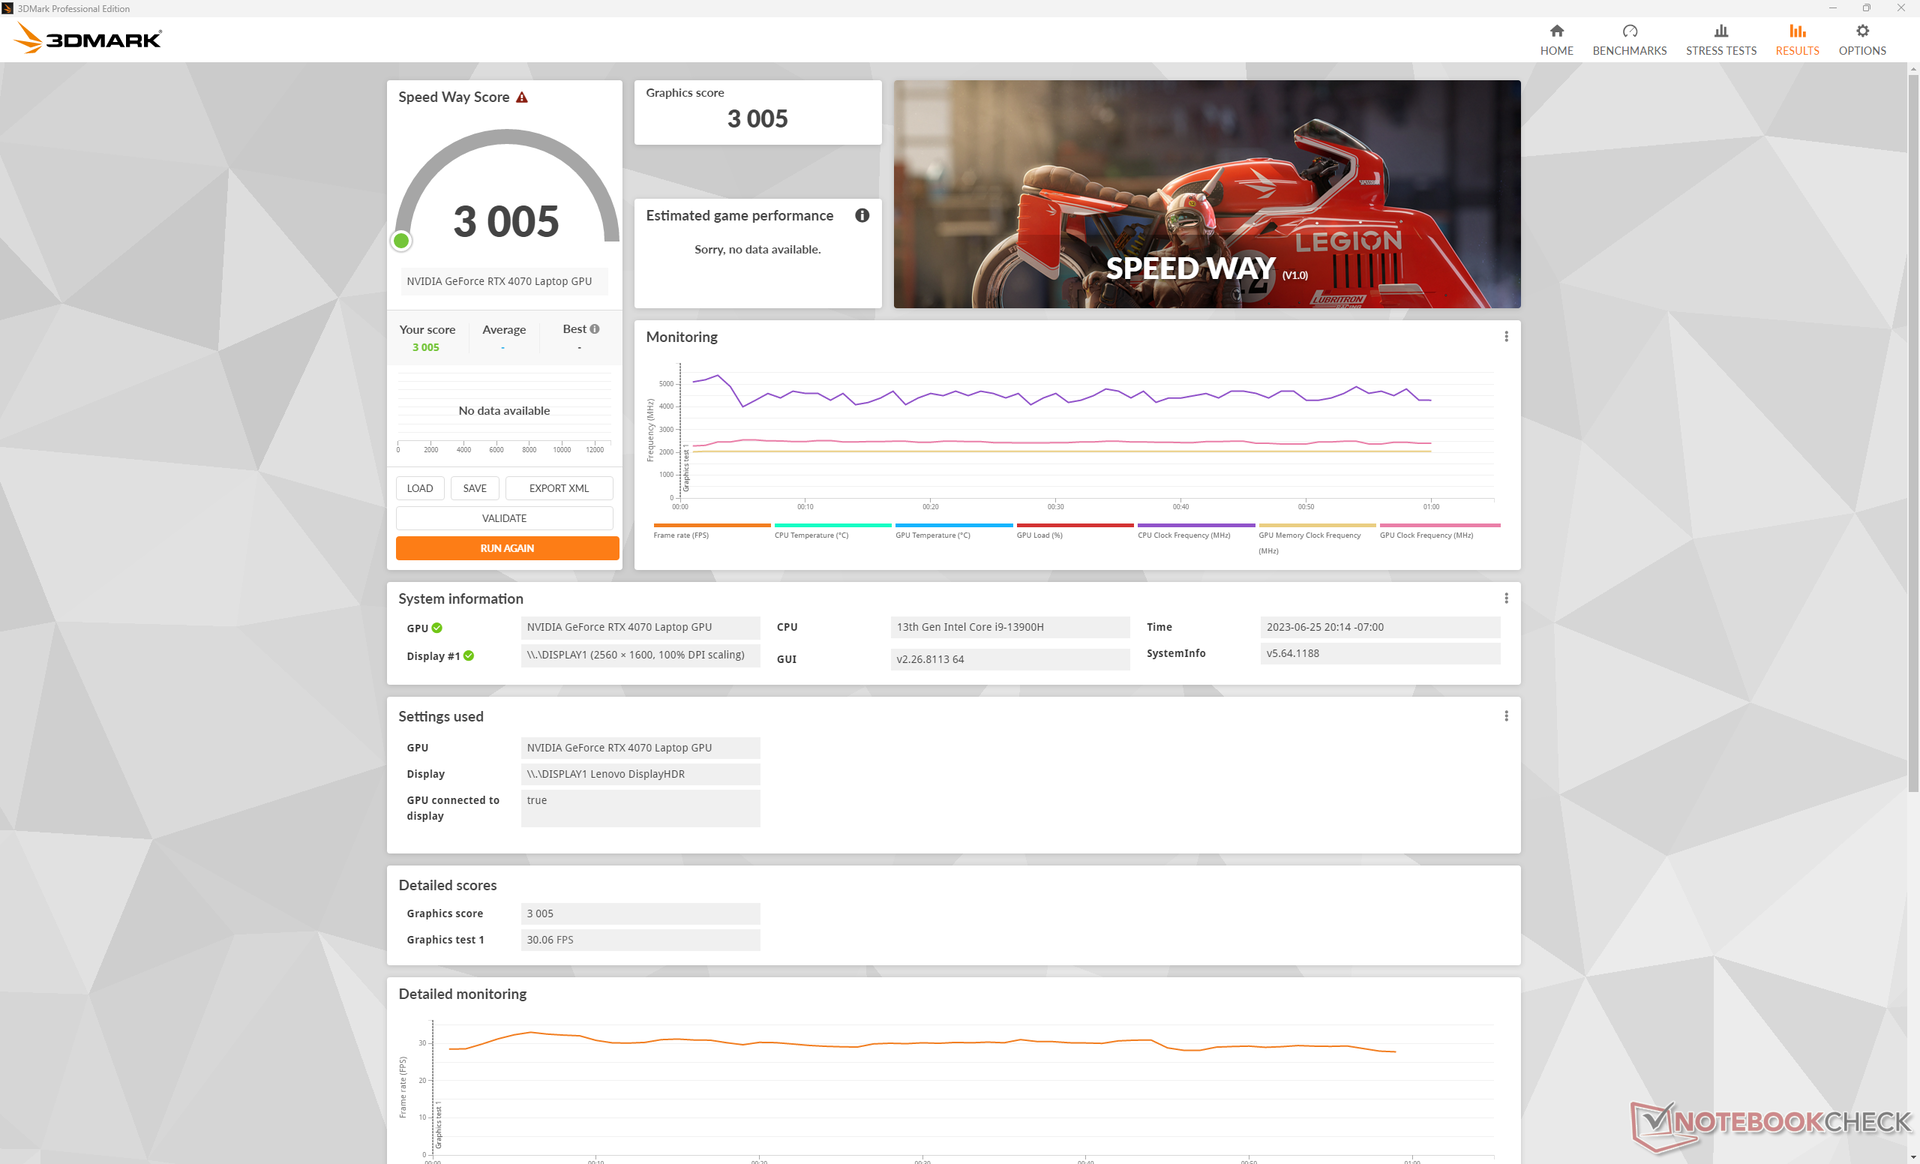
El rendimiento gráfico bruto es entre un 5 y un 10 por ciento más rápido que el del portátil medio de nuestra base de datos con la misma gPU RTX 4070 MÓVIL. Por tanto, el rendimiento general está más o menos a la par con el del año pasado rTX 3080 Ti para portátiles.
El rendimiento de la GPU cae un 5% si se desactiva la función Overclock. Si se activa el modo Equilibrado, el rendimiento de la CPU y la GPU caen un 10% y un 15%, respectivamente, como muestra la siguiente tabla. Algunos usuarios pueden preferir los ventiladores más silenciosos del modo Equilibrado, incluso si esto significa un rendimiento más lento.
Cambiar a la RTX 4060 desde nuestra configuración RTX 4070 se espera que afecte al rendimiento de la GPU en aproximadamente un 10 a 15 por ciento basado en nuestra experiencia con el Legion Pro 5 16.
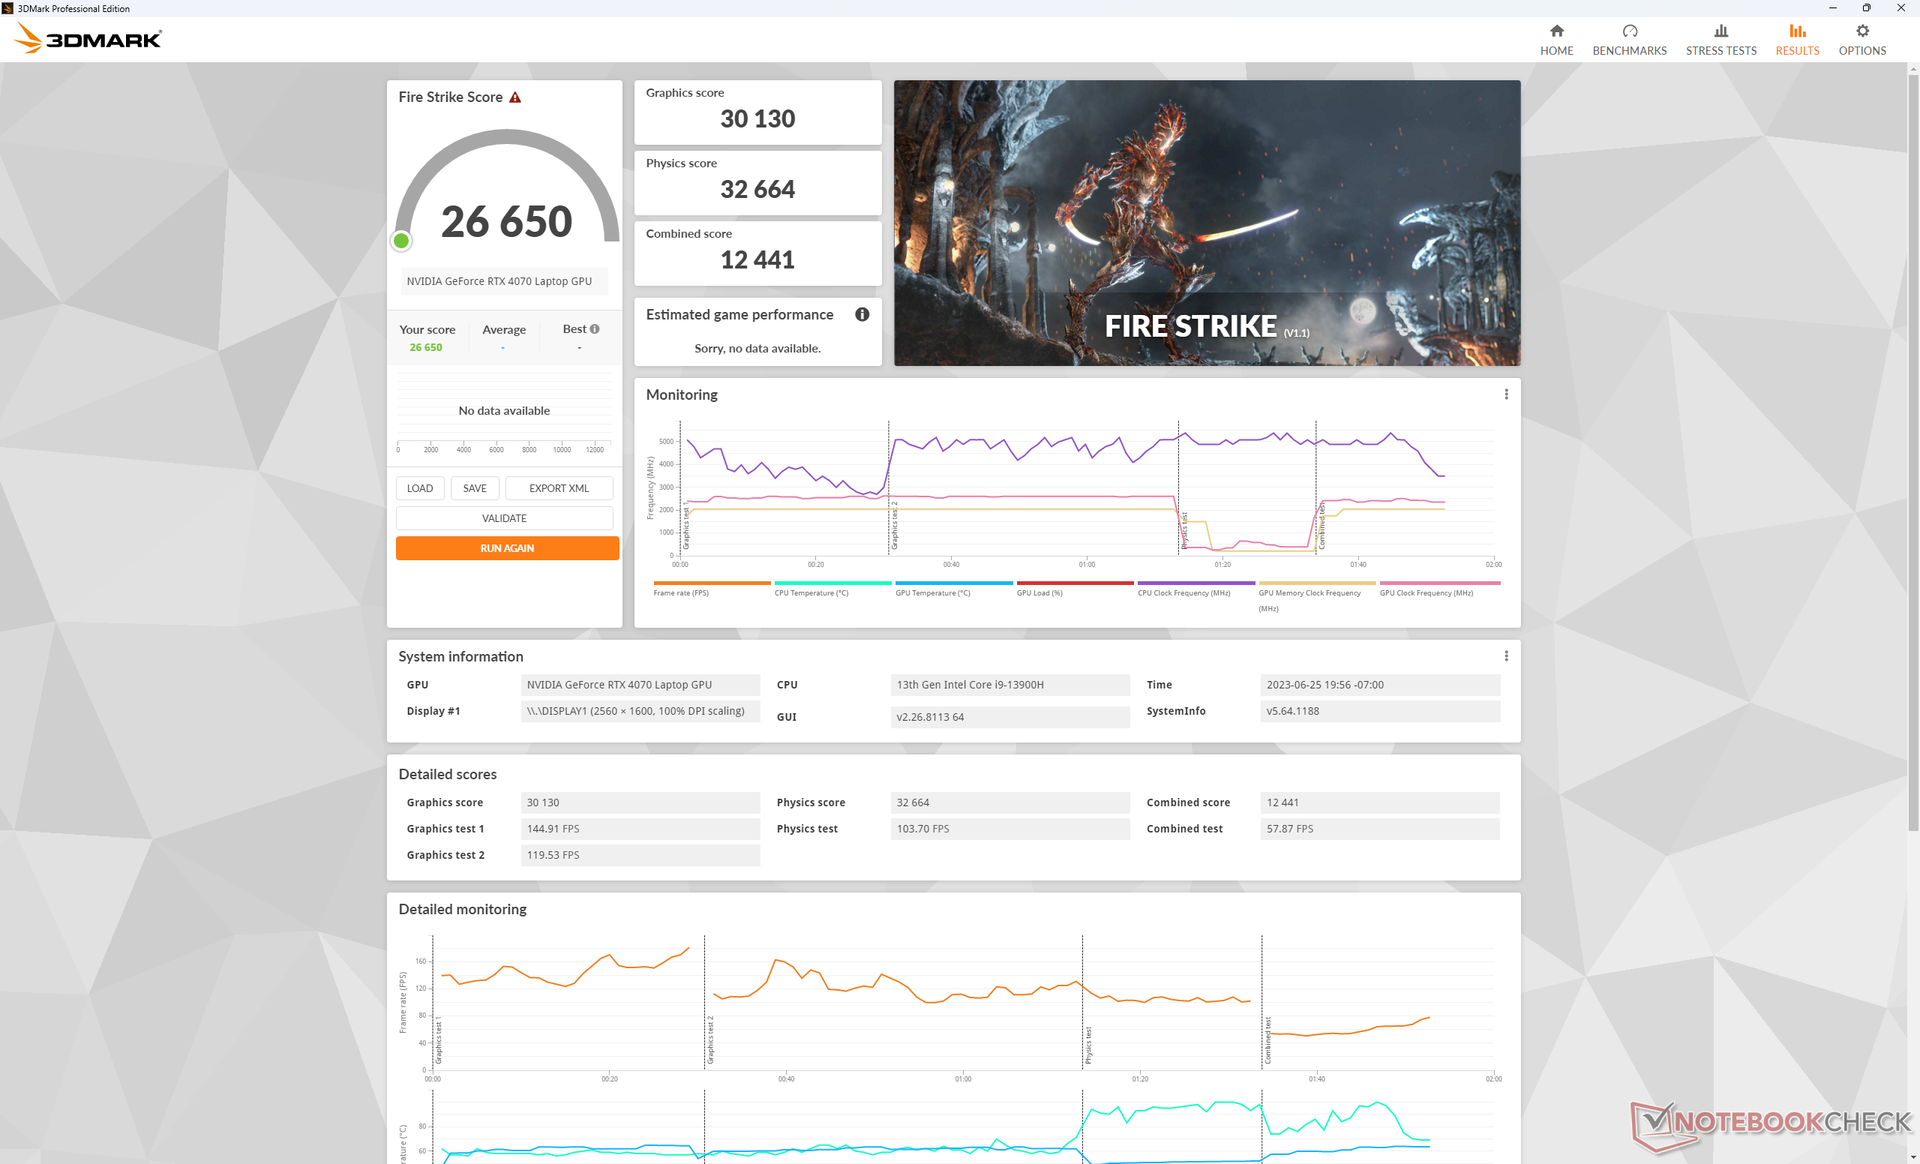
| Configuración del perfil de energía | Fire Strike Puntuación física | Fire Strike Puntuación GPU | Fire Strike Puntuación combinada |
| Rendimiento + GPU Overclock Activado + Overdrive Activado | 32664 | 30130 | 12441 |
| Rendimiento + GPU Overclock Activado + Overdrive Desactivado | 32439 | 30153 | 13360 |
| Rendimiento + GPU Overclock Off + Overdrive Off | 32550 | 28629 (-5%) | 12319 |
| Equilibrado | 27499 (-16%) | 27708 (-8%) | 11295 (-9%) |
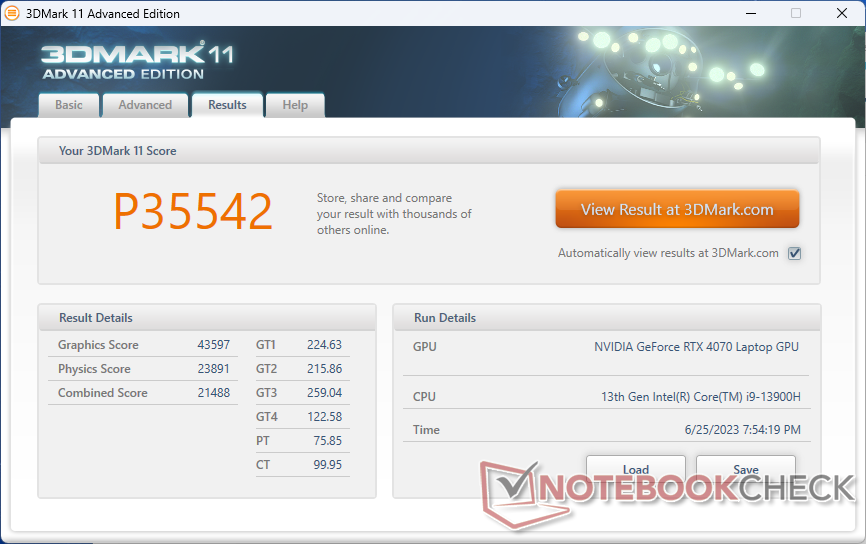
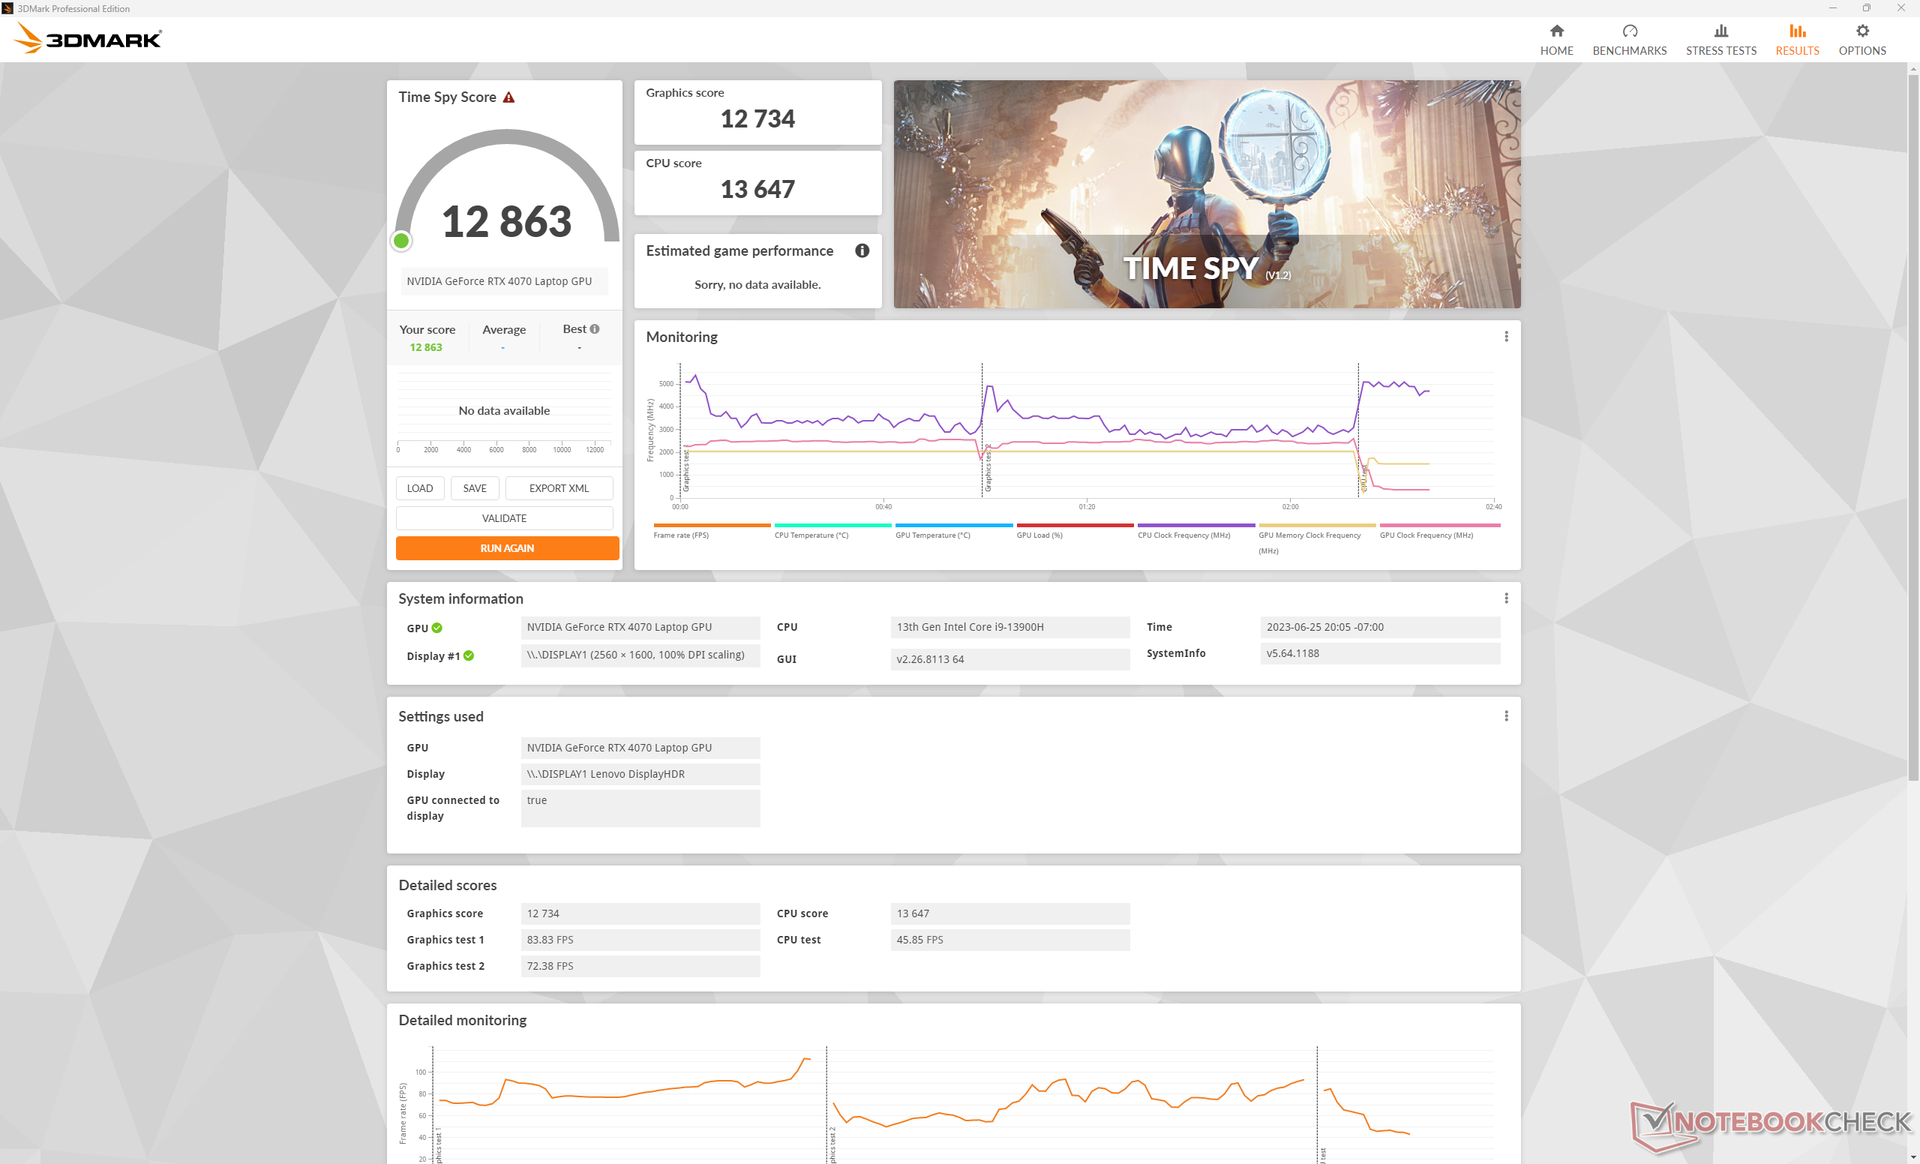
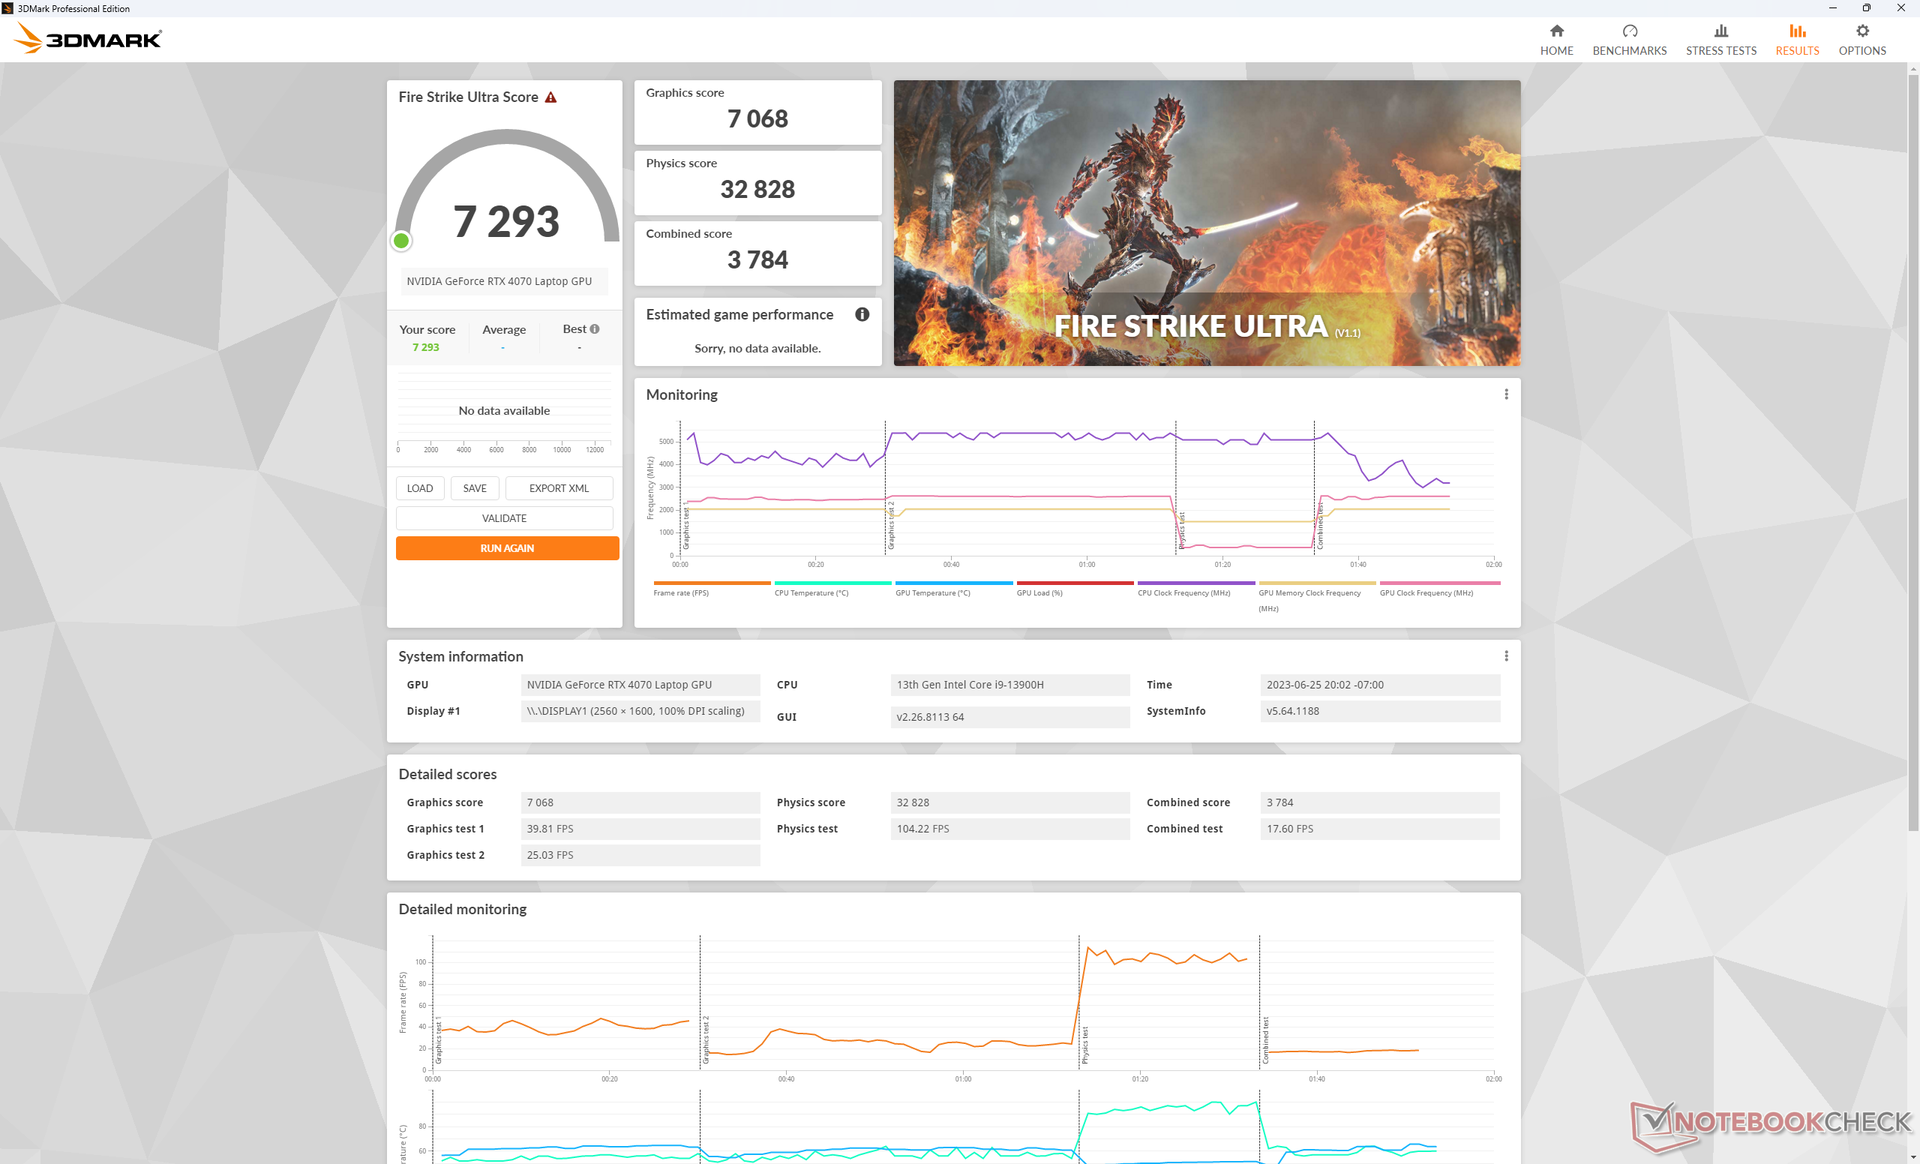
| 3DMark 11 Performance | 35542 puntos | |
| 3DMark Fire Strike Score | 26650 puntos | |
| 3DMark Time Spy Score | 12863 puntos | |
ayuda | ||
* ... más pequeño es mejor
Rendimiento en juegos
La RTX 4070 móvil funciona bien para apuntar a 1440p/1600p y 60 FPS en ajustes altos, mientras que la mucho más rápida rTX 4070 Ti de sobremesa puede alcanzar valores Ultra o máximos. Por ejemplo, si ejecutamos Returnal a 1440p con nuestro Lenovo, apenas llegaremos a los 50 FPS.
El DLSS se vuelve mucho más importante cuando la RTX 4070 empieza a parecer poco potente. Por ejemplo, Cyberpunk 2077 a 4K Ultra ofrece una media de 23 FPS sin DLSS y 38 FPS con DLSS2 activado.
Witcher 3 FPS Chart
| bajo | medio | alto | ultra | QHD | 4K | |
|---|---|---|---|---|---|---|
| GTA V (2015) | 184 | 180.3 | 175 | 115.2 | 94.3 | 98.7 |
| The Witcher 3 (2015) | 459.3 | 356.8 | 225.9 | 117.9 | 70 | |
| Dota 2 Reborn (2015) | 203 | 183.2 | 175.8 | 165.3 | 141.3 | |
| Final Fantasy XV Benchmark (2018) | 213 | 168.8 | 122.7 | 91.4 | 51.5 | |
| X-Plane 11.11 (2018) | 182.9 | 158.7 | 122.4 | 105.7 | ||
| Strange Brigade (2018) | 483 | 316 | 259 | 228 | 149.2 | 75.7 |
| Cyberpunk 2077 1.6 (2022) | 138.3 | 141.9 | 106.1 | 91 | 54.4 | 23.1 |
| Tiny Tina's Wonderlands (2022) | 244.3 | 204.8 | 143.7 | 113.9 | 78.1 | 37 |
| F1 22 (2022) | 258 | 261 | 219 | 81.5 | 46.2 | 25.9 |
| Returnal (2023) | 83 | 81 | 76 | 61 | 52 | 27 |
Emisiones
Ruido del sistema
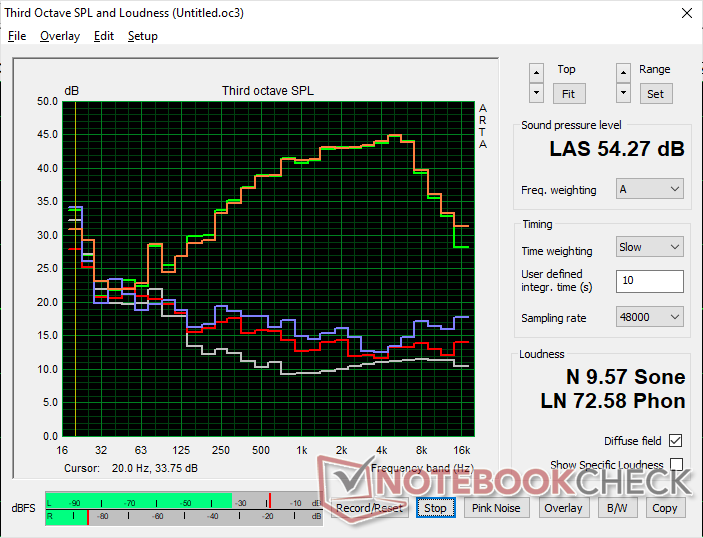
Los ventiladores internos están siempre activos a algo menos de 26 dB(A) contra un fondo silencioso de 23 dB(A). No es lo bastante ruidoso como para distraer en la mayoría de entornos de oficina o conferencia y hacen un excelente trabajo permaneciendo silenciosos durante periodos largos incluso cuando se introducen cargas más altas como 3DMark 06.
Jugar en modo Rendimiento induciría un ruido de ventilador constante de 54.4 dB(A) que es similar al del Alienware x16 R1 pero más fuerte que en el Blade 16. Pasando al modo Equilibrado se pierde algo de rendimiento como se mencionó anteriormente por un ruido de ventilador notablemente más silencioso de 48.9 dB(A).
Ruido
| Ocioso |
| 23.6 / 23.6 / 25.7 dB(A) |
| Carga |
| 27.6 / 54.4 dB(A) |
 | ||
30 dB silencioso 40 dB(A) audible 50 dB(A) ruidosamente alto |
||
min: | ||
| Lenovo Legion Slim 7i 16 Gen 8 GeForce RTX 4070 Laptop GPU, i9-13900H, Samsung PM9A1 MZVL21T0HCLR | HP Omen 16-wf000 GeForce RTX 4080 Laptop GPU, i7-13700HX, SK hynix PC801 HFS002TEJ9X101N | Alienware x16 R1 GeForce RTX 4080 Laptop GPU, i9-13900HK, SK hynix PC801 HFS001TEJ9X101N | Lenovo Legion Pro 7 RTX4090 GeForce RTX 4090 Laptop GPU, i9-13900HX, Samsung PM9A1 MZVL21T0HCLR | Asus ROG Strix G16 G614JZ GeForce RTX 4080 Laptop GPU, i9-13980HX, WD PC SN560 SDDPNQE-1T00 | Razer Blade 16 Early 2023 GeForce RTX 4080 Laptop GPU, i9-13950HX, SSSTC CA6-8D1024 | |
|---|---|---|---|---|---|---|
| Noise | -15% | -6% | -25% | -17% | -2% | |
| apagado / medio ambiente * (dB) | 22.8 | 23 -1% | 22.7 -0% | 25 -10% | 25 -10% | 23 -1% |
| Idle Minimum * (dB) | 23.6 | 29.6 -25% | 23.1 2% | 28 -19% | 26 -10% | 23 3% |
| Idle Average * (dB) | 23.6 | 29.8 -26% | 25.8 -9% | 30 -27% | 28 -19% | 23 3% |
| Idle Maximum * (dB) | 25.7 | 30.4 -18% | 25.8 -0% | 38 -48% | 30 -17% | 23.6 8% |
| Load Average * (dB) | 27.6 | 33.8 -22% | 39.3 -42% | 48 -74% | 48 -74% | 39 -41% |
| Witcher 3 ultra * (dB) | 54.4 | 57 -5% | 49.9 8% | 53 3% | 49 10% | 51.6 5% |
| Load Maximum * (dB) | 54.4 | 58.3 -7% | 54.8 -1% | 55 -1% | 52 4% | 51.3 6% |
* ... más pequeño es mejor
Temperatura
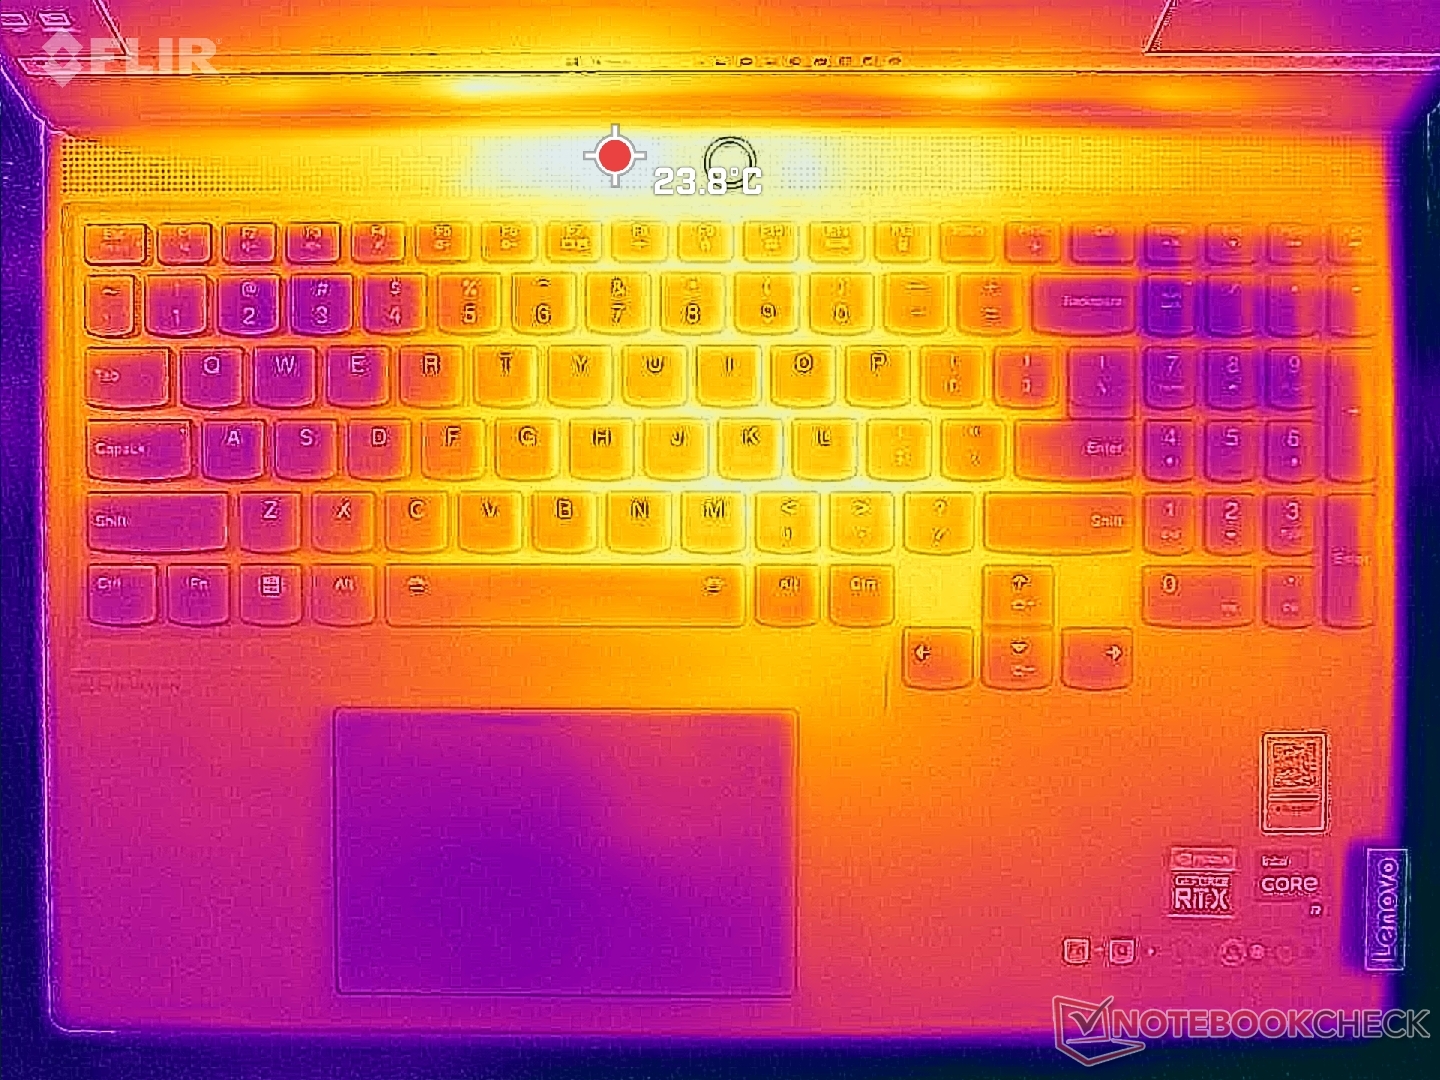
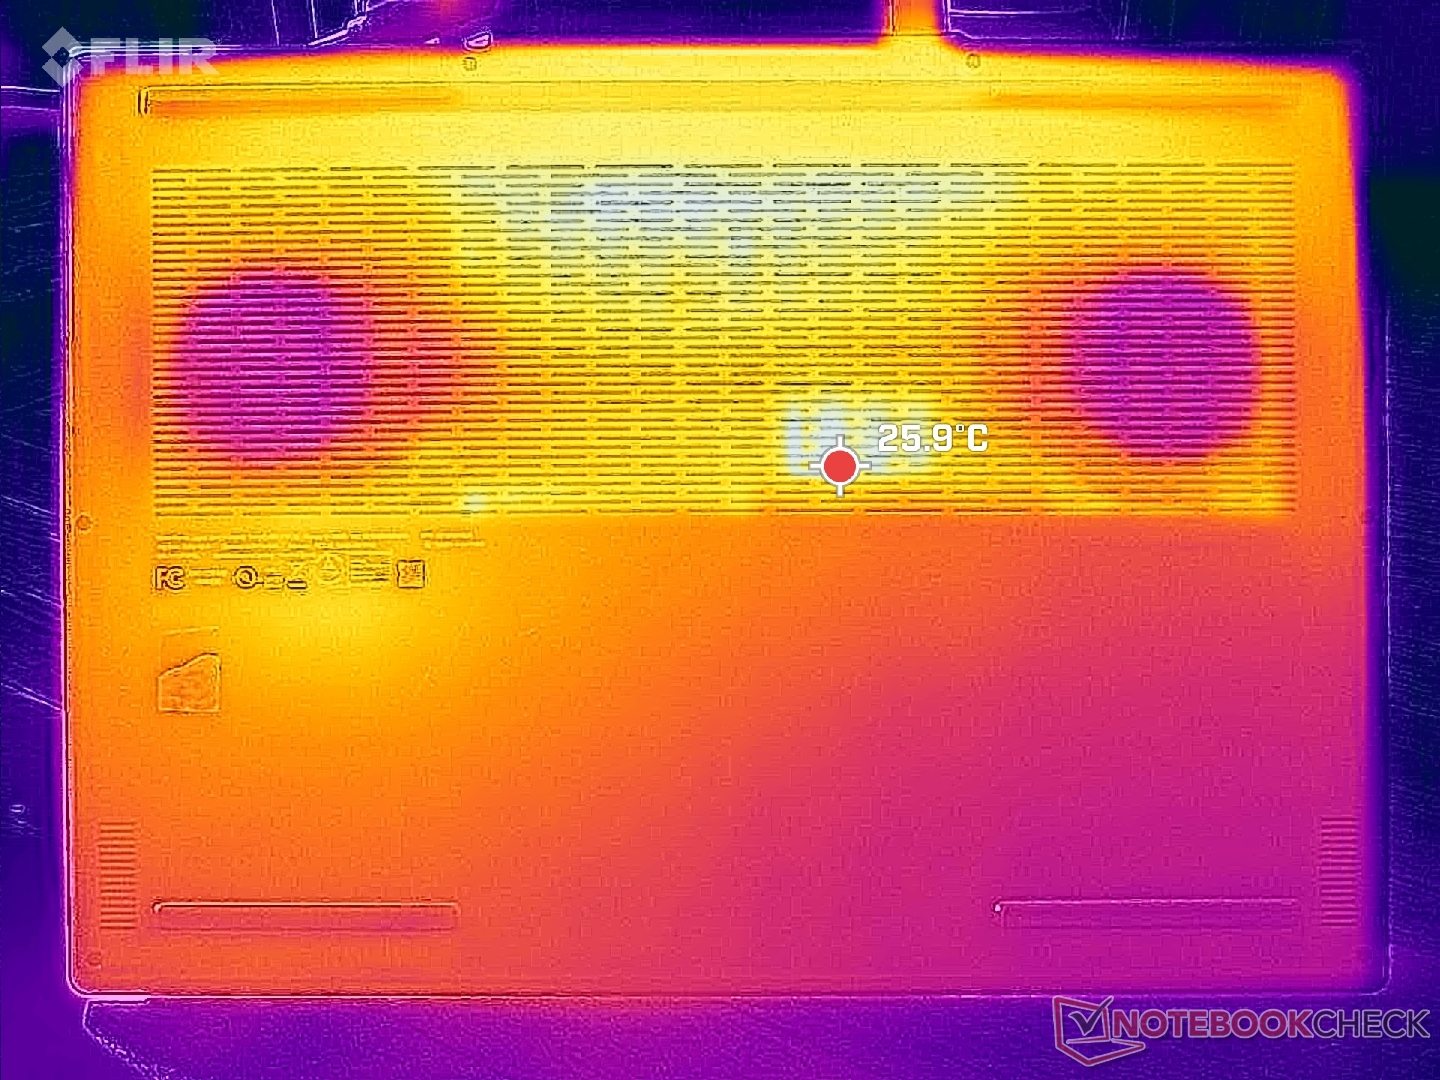
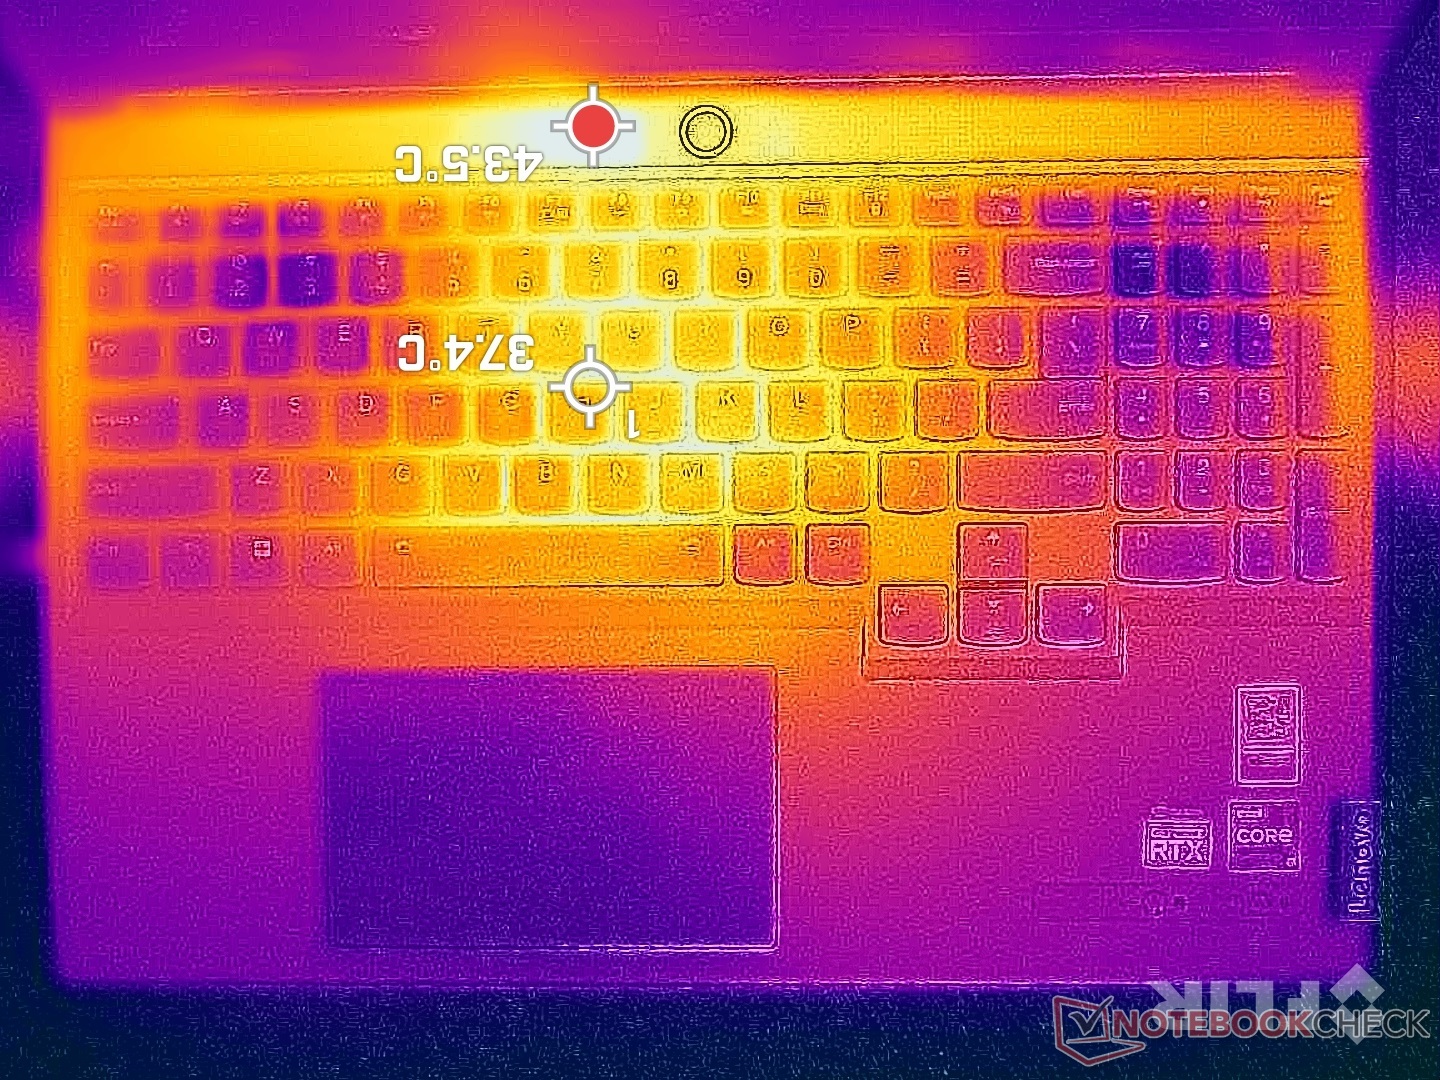
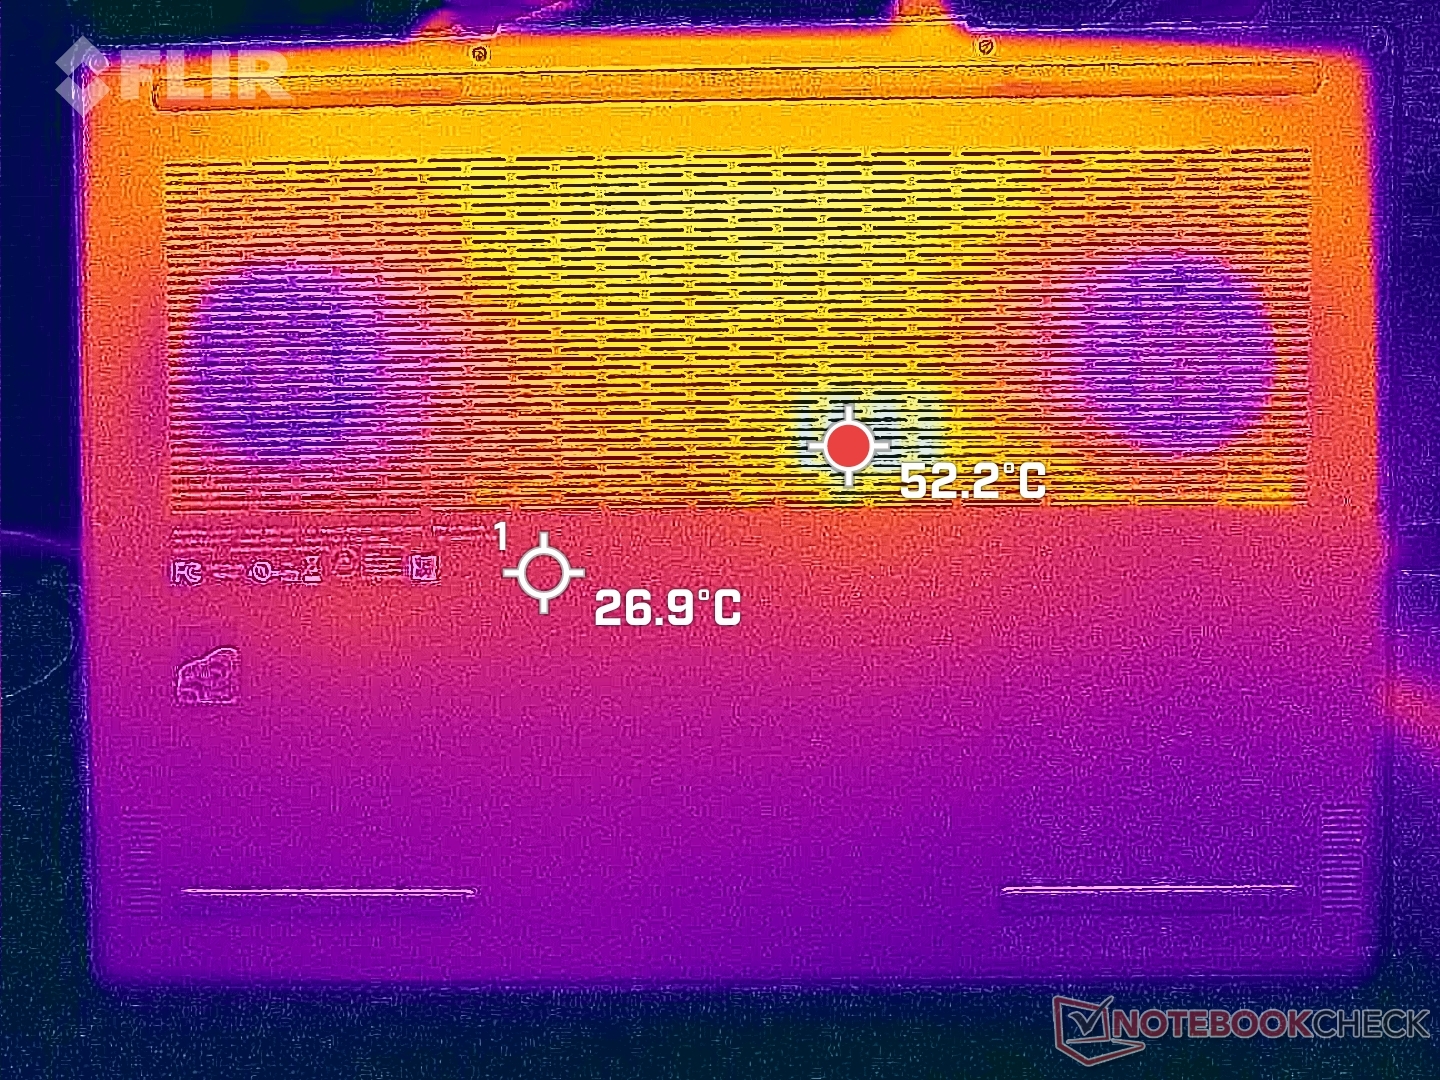
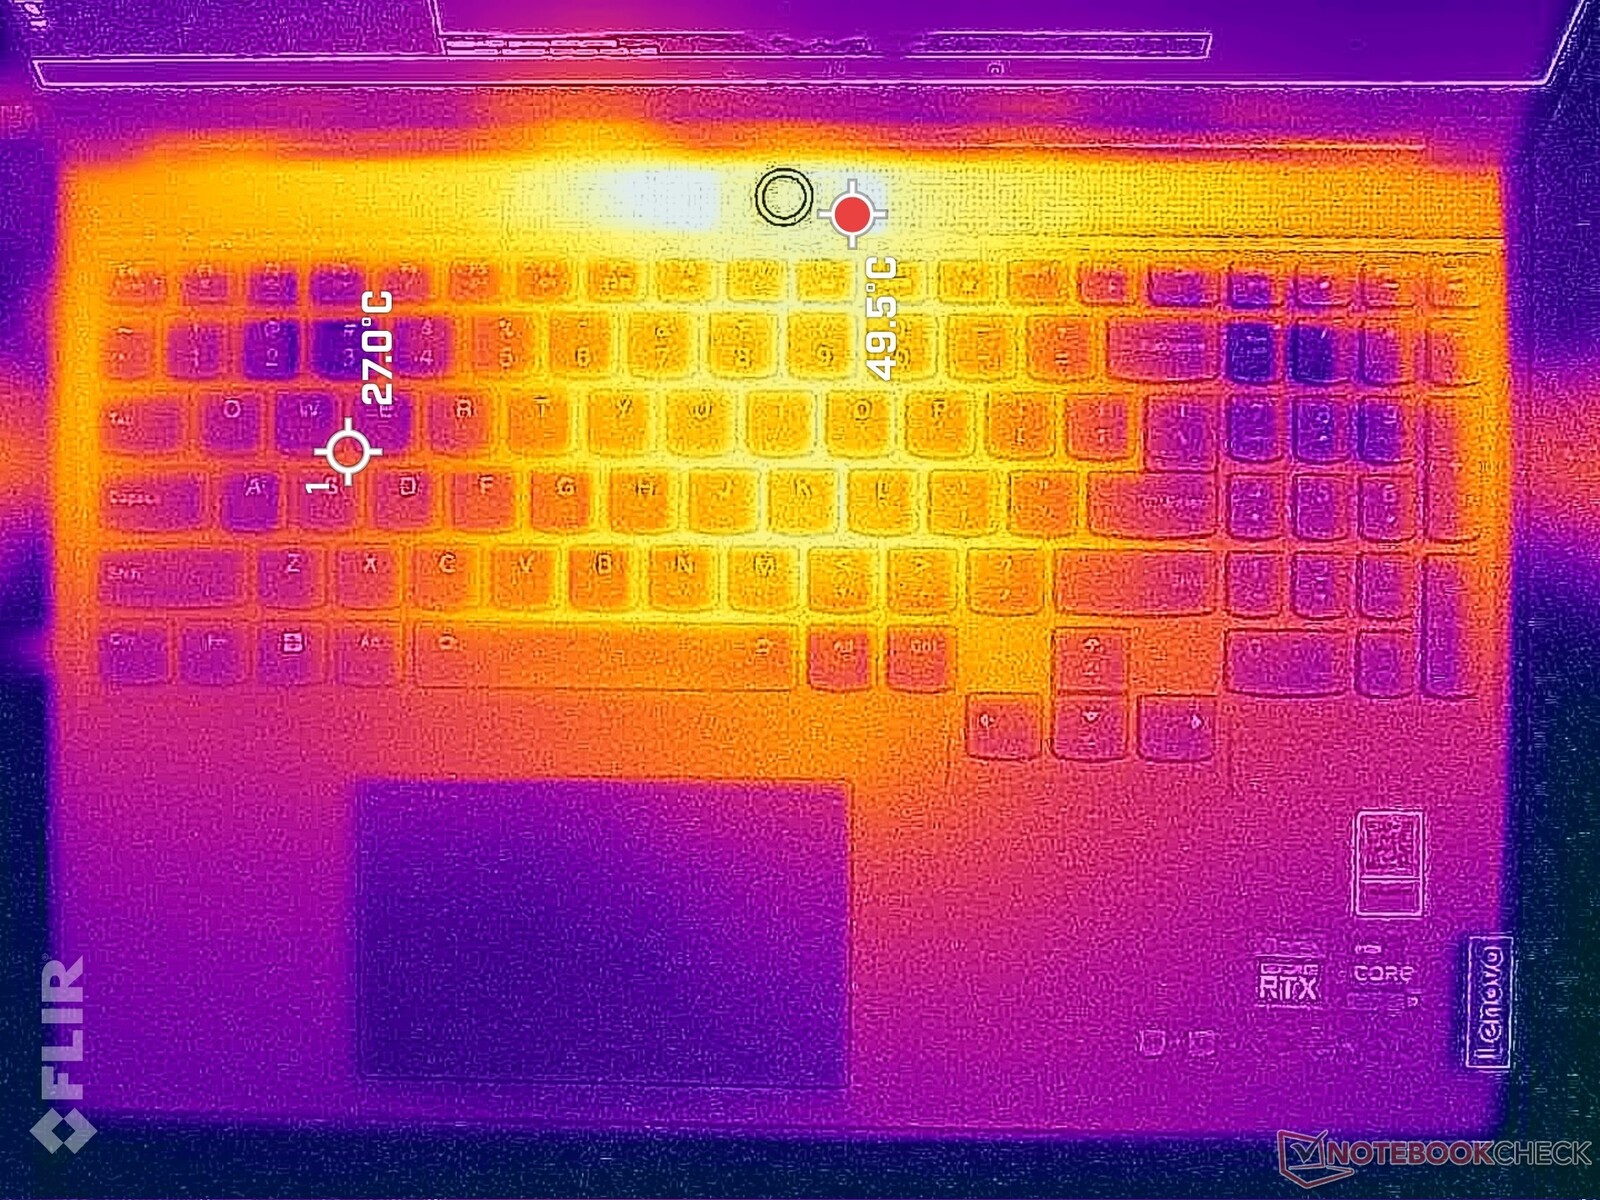
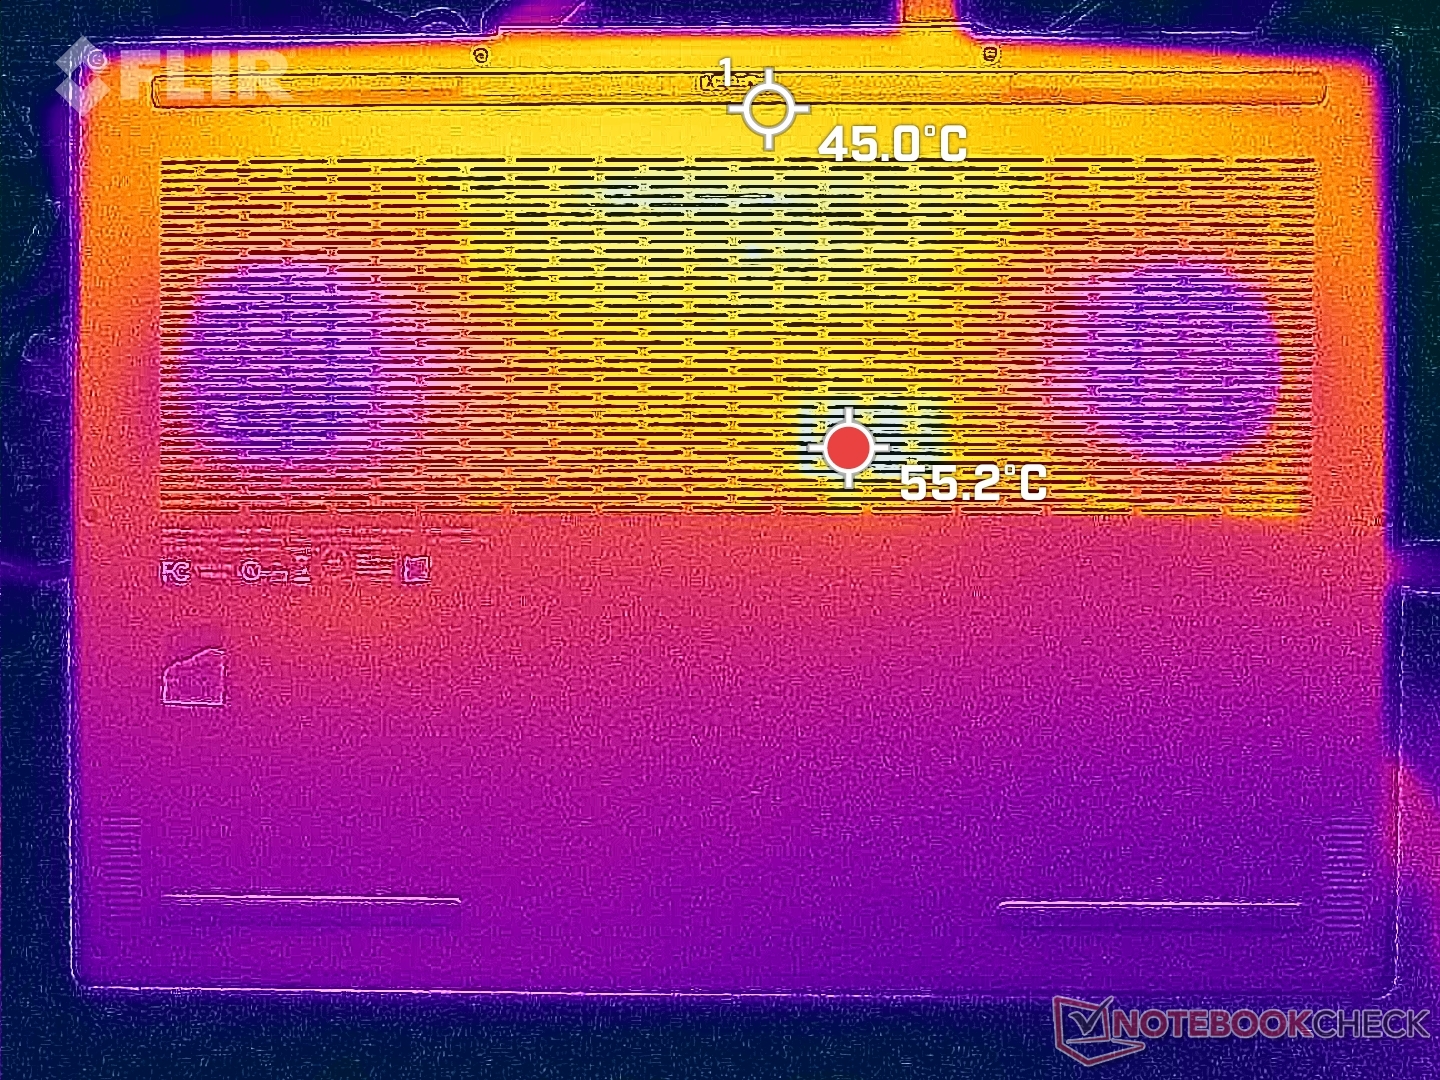
Los puntos calientes de temperatura de la superficie pueden alcanzar hasta 43 C a 50 C similar al Alienware x16 R1 cuando se ejecutan cargas exigentes como juegos. Afortunadamente, el punto caliente está más cerca del borde trasero y justo encima de la primera fila de teclas del teclado como muestran los mapas de temperatura de abajo donde es improbable que los dedos y la piel se toquen. Los reposamanos y las teclas WASD permanecen más frías en comparación.
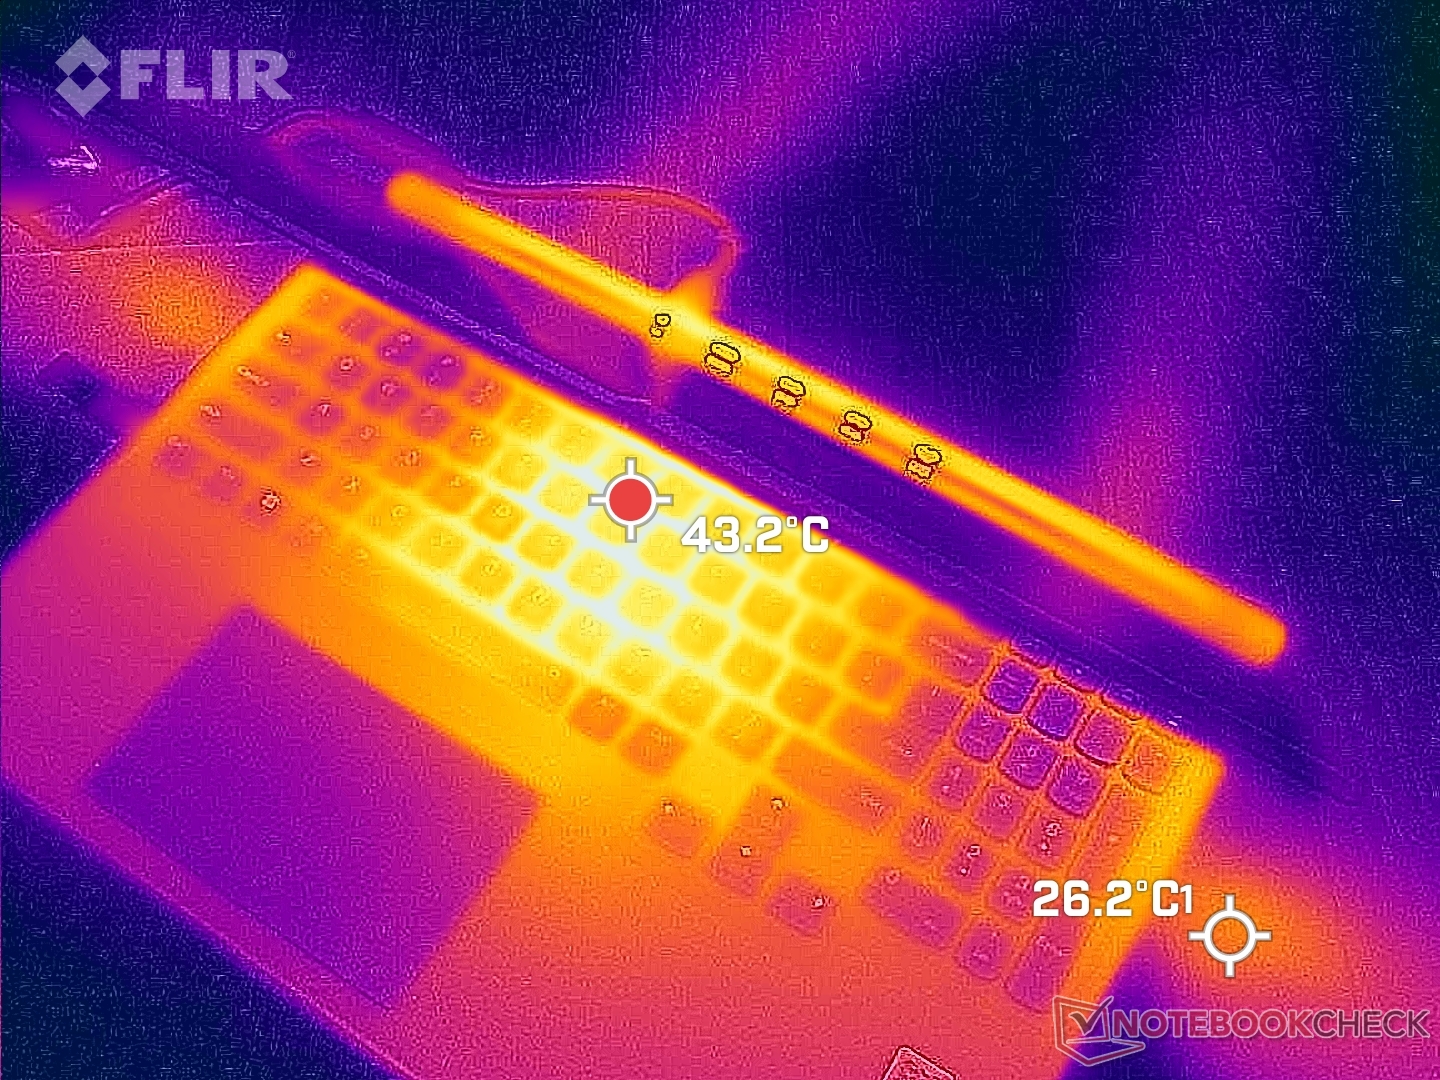
(-) La temperatura máxima en la parte superior es de 49.8 °C / 122 F, frente a la media de 40.4 °C / 105 F, que oscila entre 21.2 y 68.8 °C para la clase Gaming.
(-) El fondo se calienta hasta un máximo de 48.8 °C / 120 F, frente a la media de 43.2 °C / 110 F
(+) En reposo, la temperatura media de la parte superior es de 26 °C / 79# F, frente a la media del dispositivo de 33.9 °C / 93 F.
(±) Jugando a The Witcher 3, la temperatura media de la parte superior es de 35.1 °C / 95 F, frente a la media del dispositivo de 33.9 °C / 93 F.
(+) El reposamanos y el panel táctil están a una temperatura inferior a la de la piel, con un máximo de 29.4 °C / 84.9 F y, por tanto, son fríos al tacto.
(±) La temperatura media de la zona del reposamanos de dispositivos similares fue de 28.8 °C / 83.8 F (-0.6 °C / -1.1 F).
| Lenovo Legion Slim 7i 16 Gen 8 Intel Core i9-13900H, NVIDIA GeForce RTX 4070 Laptop GPU | HP Omen 16-wf000 Intel Core i7-13700HX, NVIDIA GeForce RTX 4080 Laptop GPU | Alienware x16 R1 Intel Core i9-13900HK, NVIDIA GeForce RTX 4080 Laptop GPU | Lenovo Legion Pro 7 RTX4090 Intel Core i9-13900HX, NVIDIA GeForce RTX 4090 Laptop GPU | Asus ROG Strix G16 G614JZ Intel Core i9-13980HX, NVIDIA GeForce RTX 4080 Laptop GPU | Razer Blade 16 Early 2023 Intel Core i9-13950HX, NVIDIA GeForce RTX 4080 Laptop GPU | |
|---|---|---|---|---|---|---|
| Heat | 4% | -9% | -13% | -8% | 7% | |
| Maximum Upper Side * (°C) | 49.8 | 45 10% | 47.2 5% | 53 -6% | 54 -8% | 40 20% |
| Maximum Bottom * (°C) | 48.8 | 48.8 -0% | 47.8 2% | 59 -21% | 55 -13% | 37.6 23% |
| Idle Upper Side * (°C) | 29.4 | 29.2 1% | 36.8 -25% | 34 -16% | 29 1% | 32.4 -10% |
| Idle Bottom * (°C) | 30 | 28.8 4% | 35.8 -19% | 32 -7% | 33 -10% | 31.4 -5% |
* ... más pequeño es mejor
Prueba de resistencia
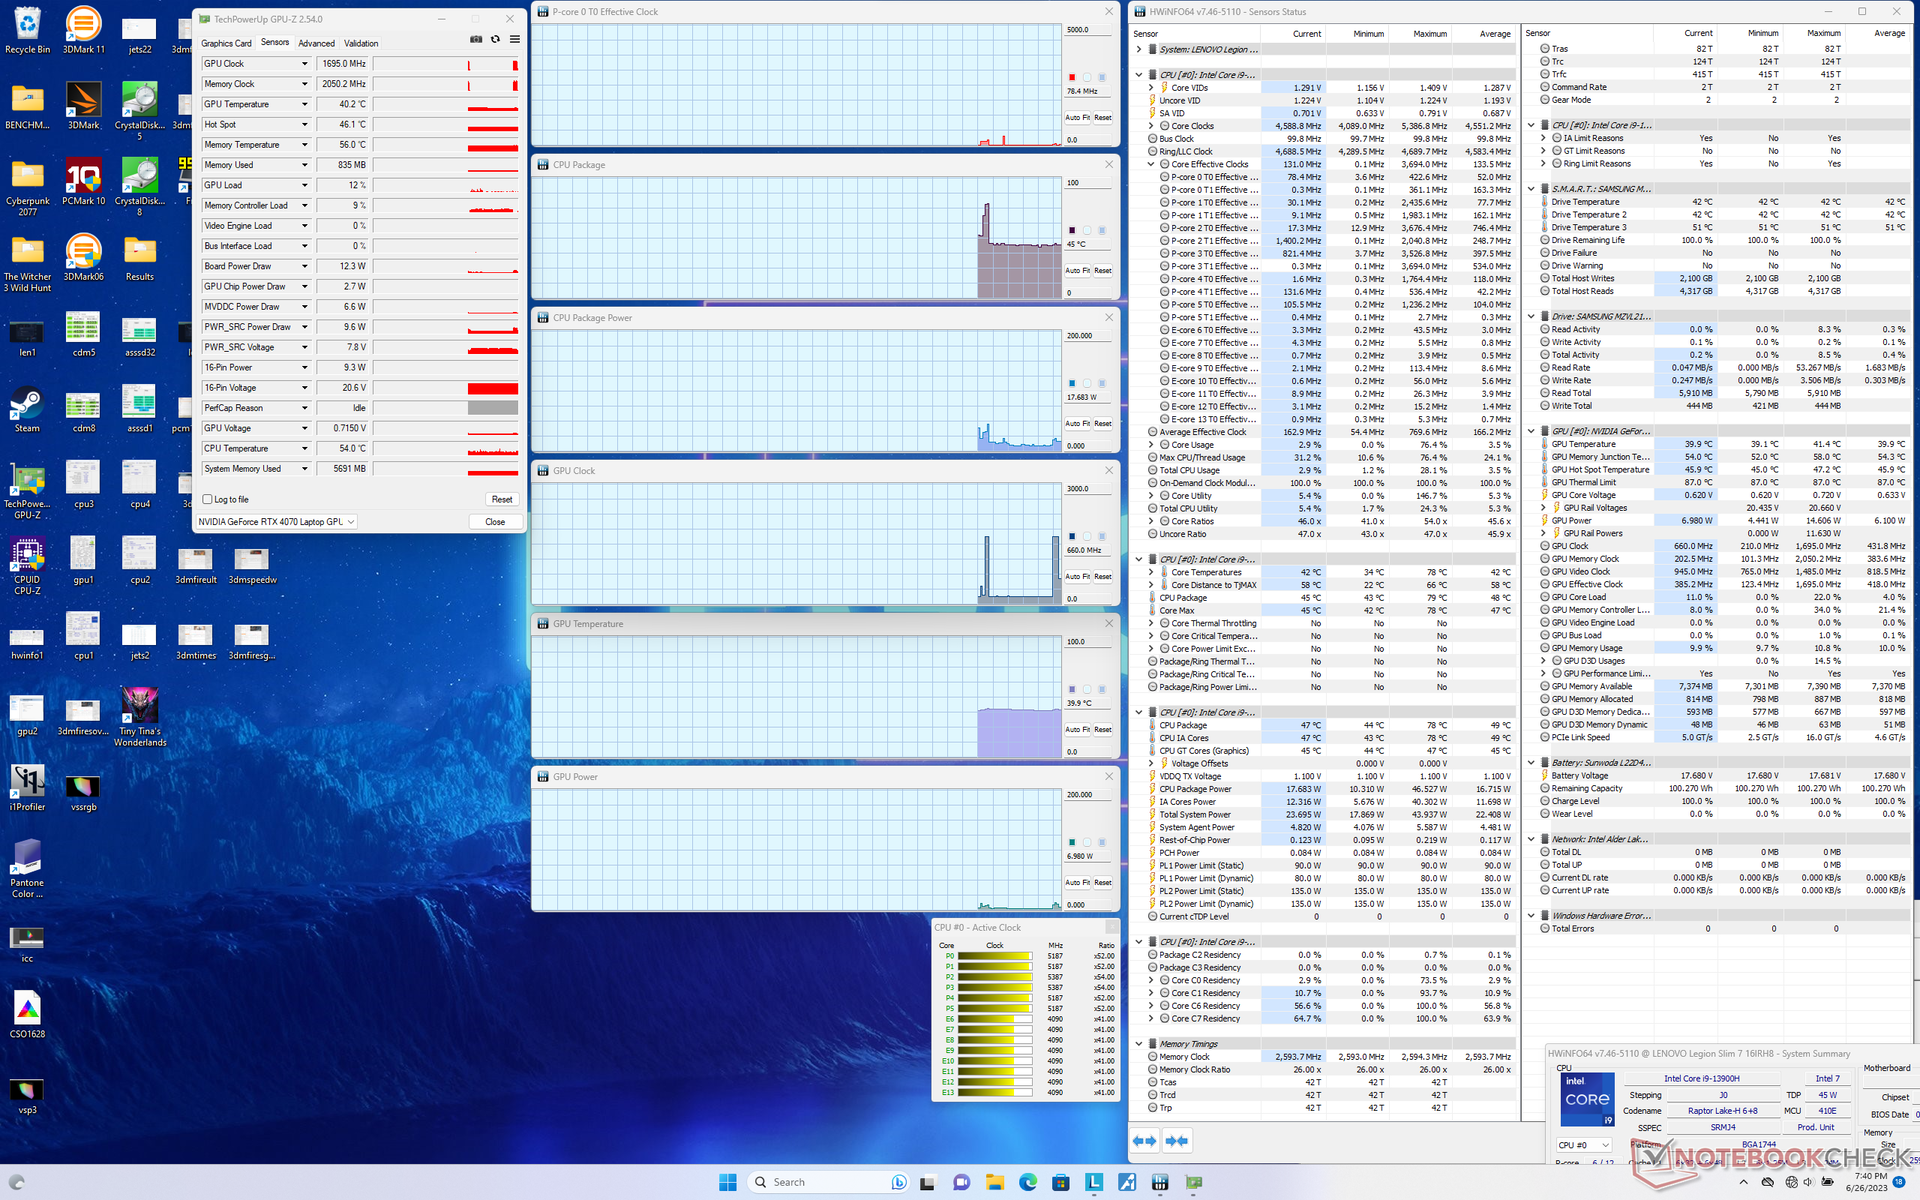
Las frecuencias de reloj de la CPU, la temperatura y el consumo de energía de la placa al ejecutar Prime95 alcanzaban los 4,5 GHz, 87 C y 100 W, respectivamente, durante aproximadamente un minuto. La CPU se estabilizaría finalmente a 3,5 GHz y 80 W para mantener una temperatura razonable del núcleo de 76 C. Repitiendo esta misma prueba en el blade 16 con el el Core i9-13950HX más rápido resultaría en una temperatura del núcleo más cálida de 82 C.
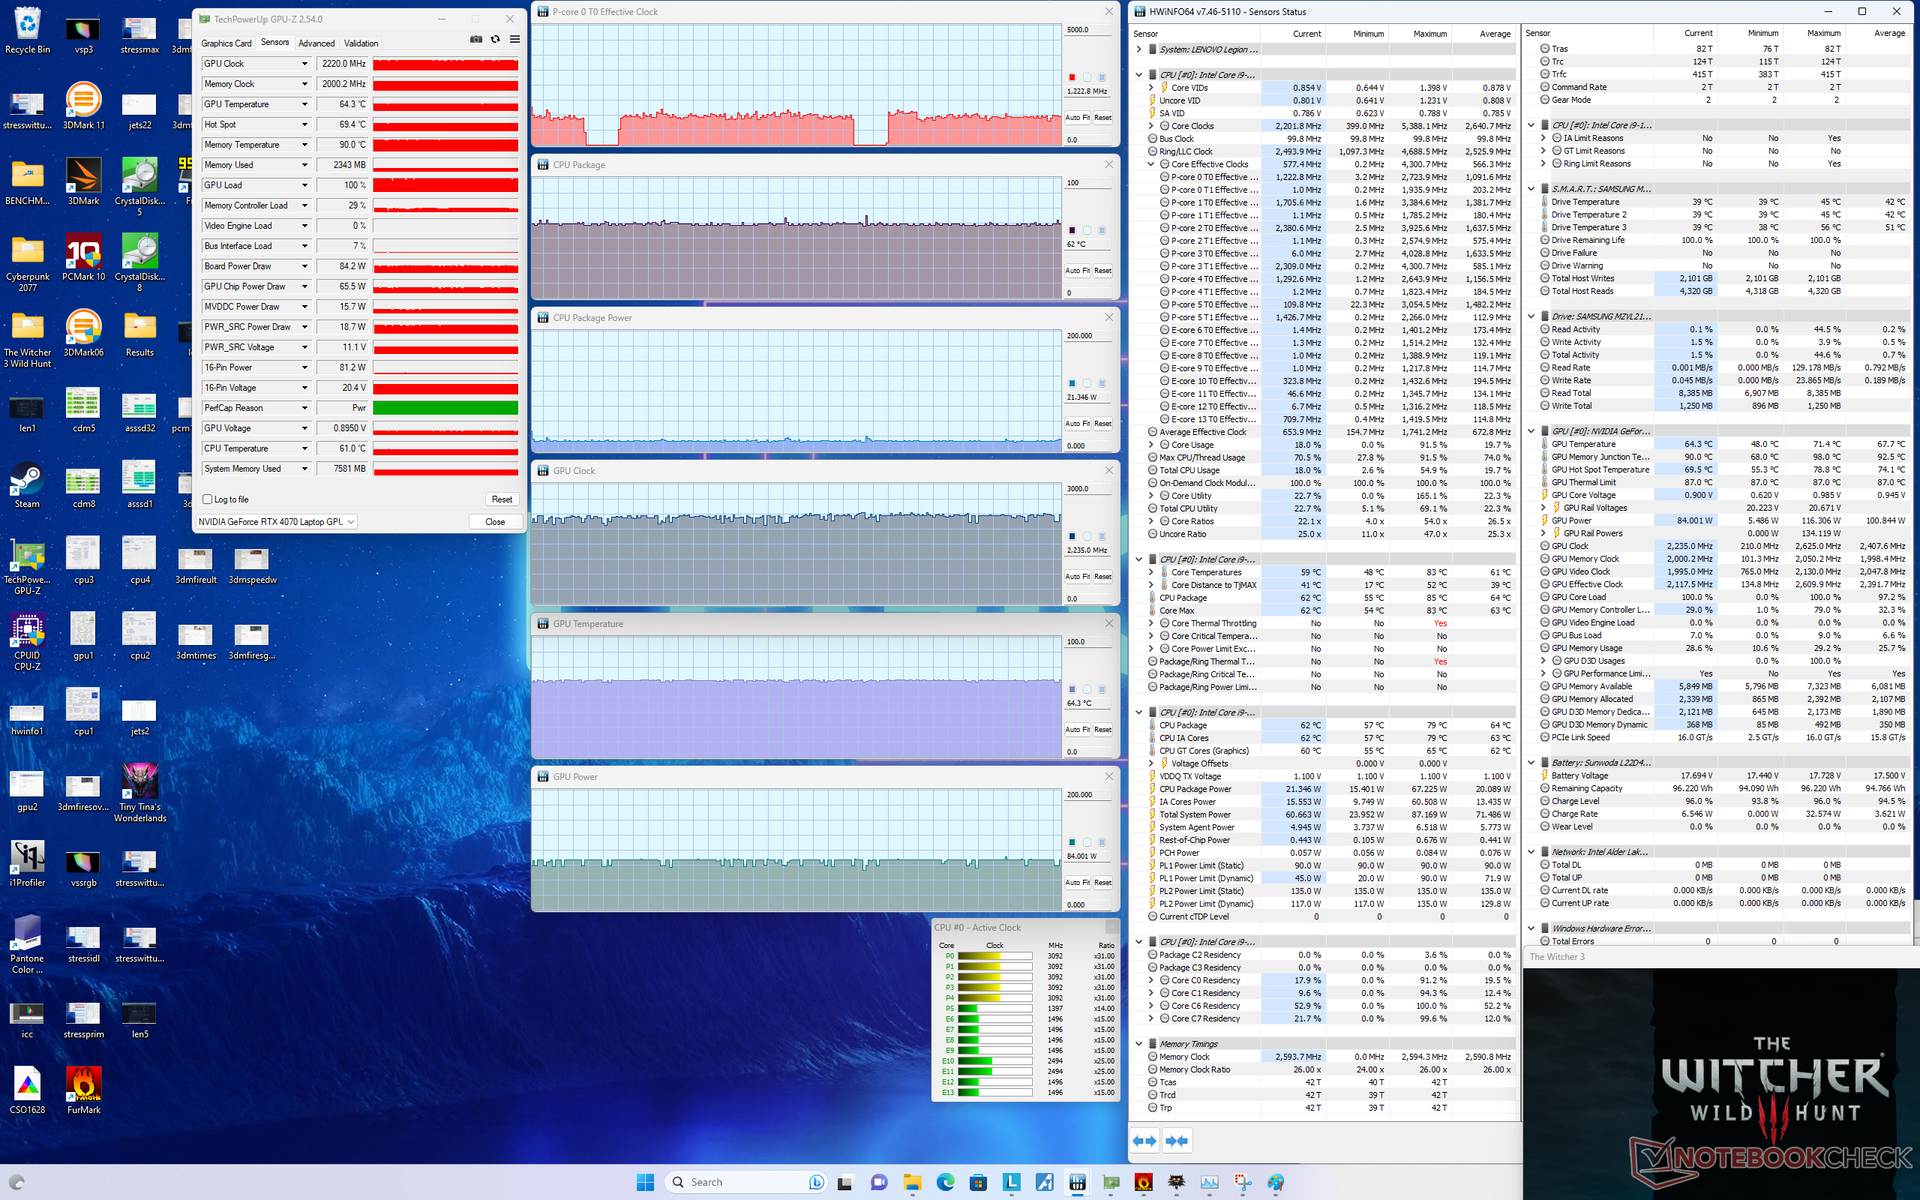
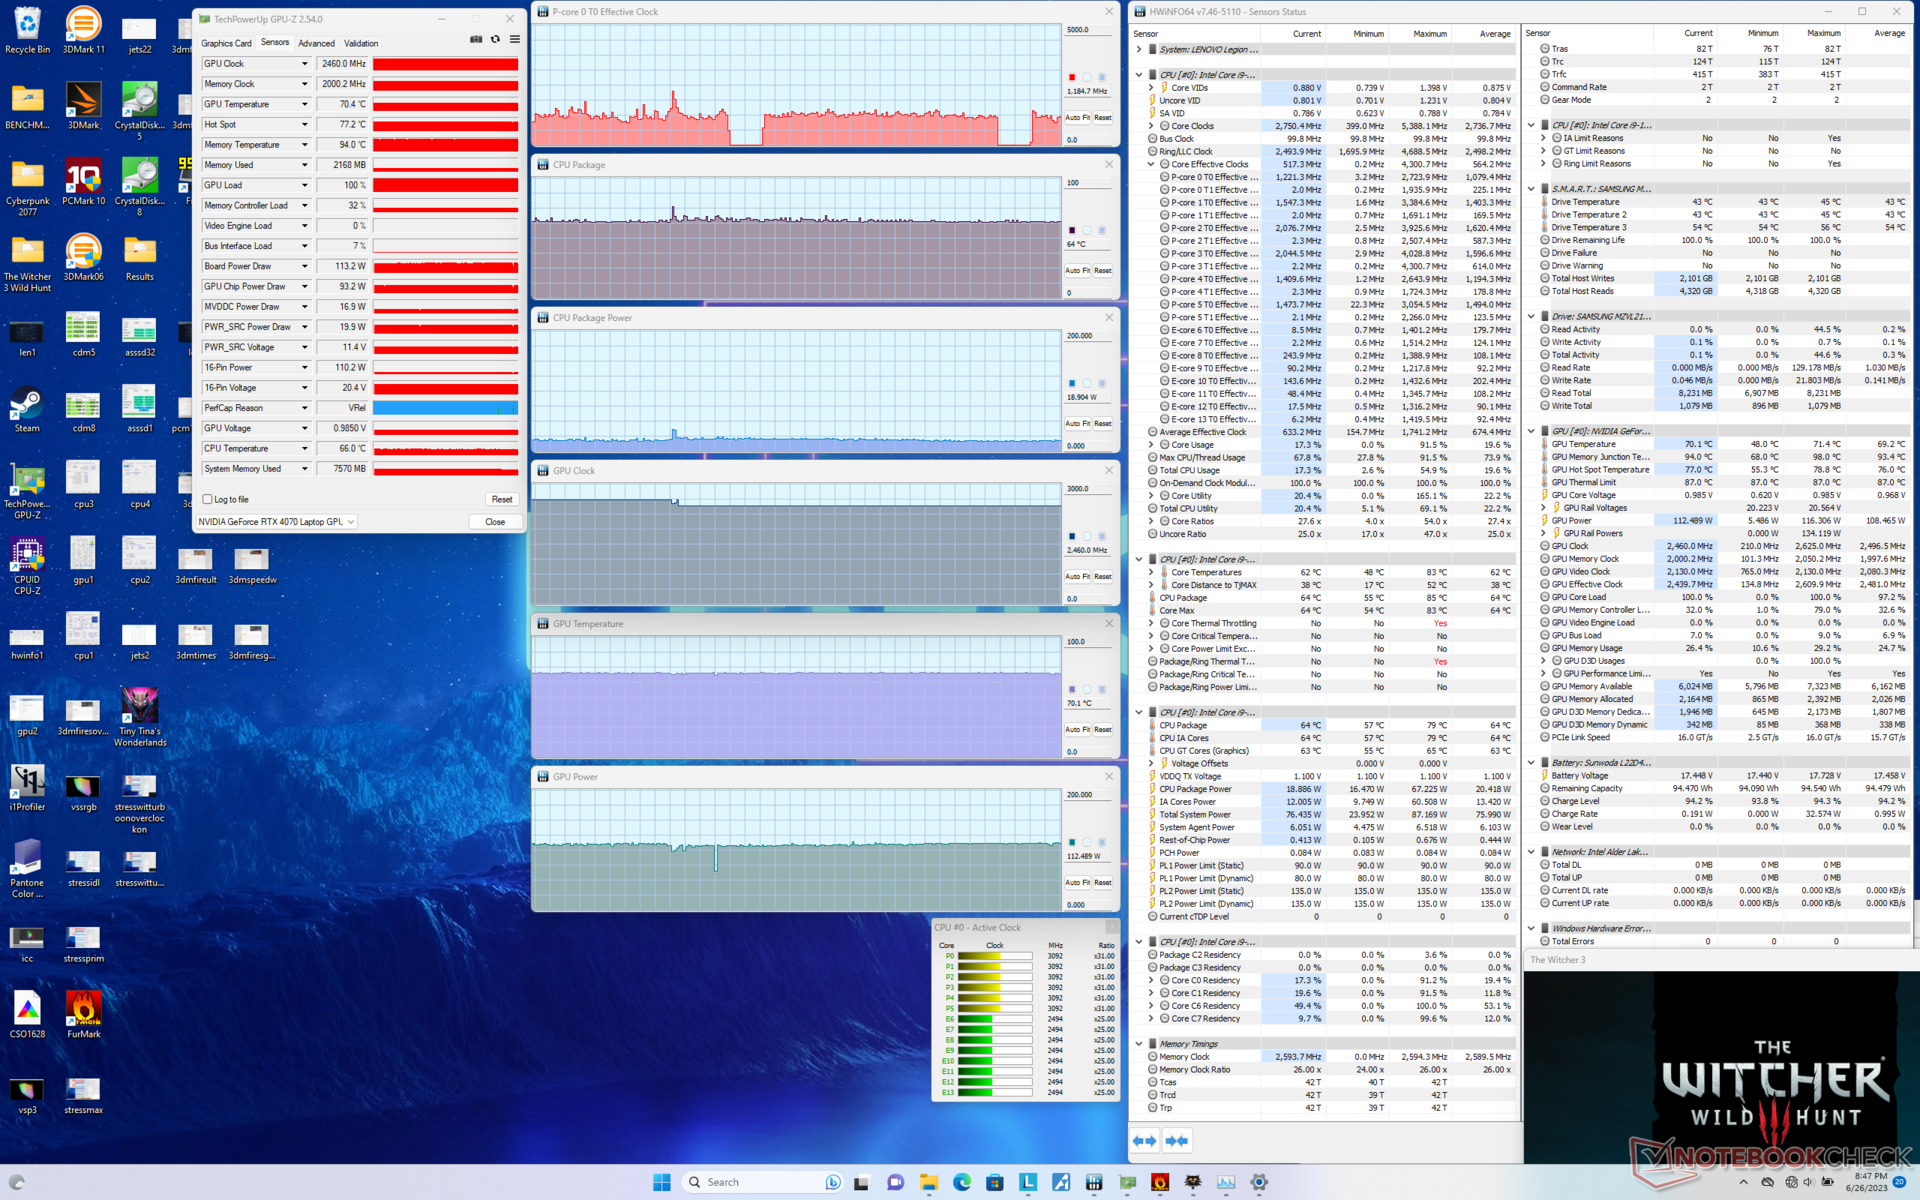
La GPU Nvidia se estabilizaría a 2580 MHz, 114 W, y 71 C, respectivamente, cuando se pone en modo Rendimiento con Overdrive y GPU Overclock activos. La GPU apunta a 140 W sobre el papel, pero sólo logramos 123 W incluso ejecutando Cyberpunk 2077. El consumo de la placa y la temperatura del núcleo caen a sólo 84 W y 64 C, respectivamente, si se juega en modo equilibrado. Las temperaturas del núcleo están en el lado fresco para un portátil de juegos delgado y ligero; las temperaturas de la CPU y la GPU en el Alienware x16 R1, por ejemplo, serían tan cálidas como 80 a 95 C al ejecutar los mismos juegos.
El uso de la batería limita el rendimiento, ya que el perfil de energía Rendimiento aparece en gris. Fire Strike a pilas ofrece unas puntuaciones de Física y Gráficos de sólo 25602 y 21049 puntos, respectivamente, frente a los 32664 y 30130 puntos de la red eléctrica.
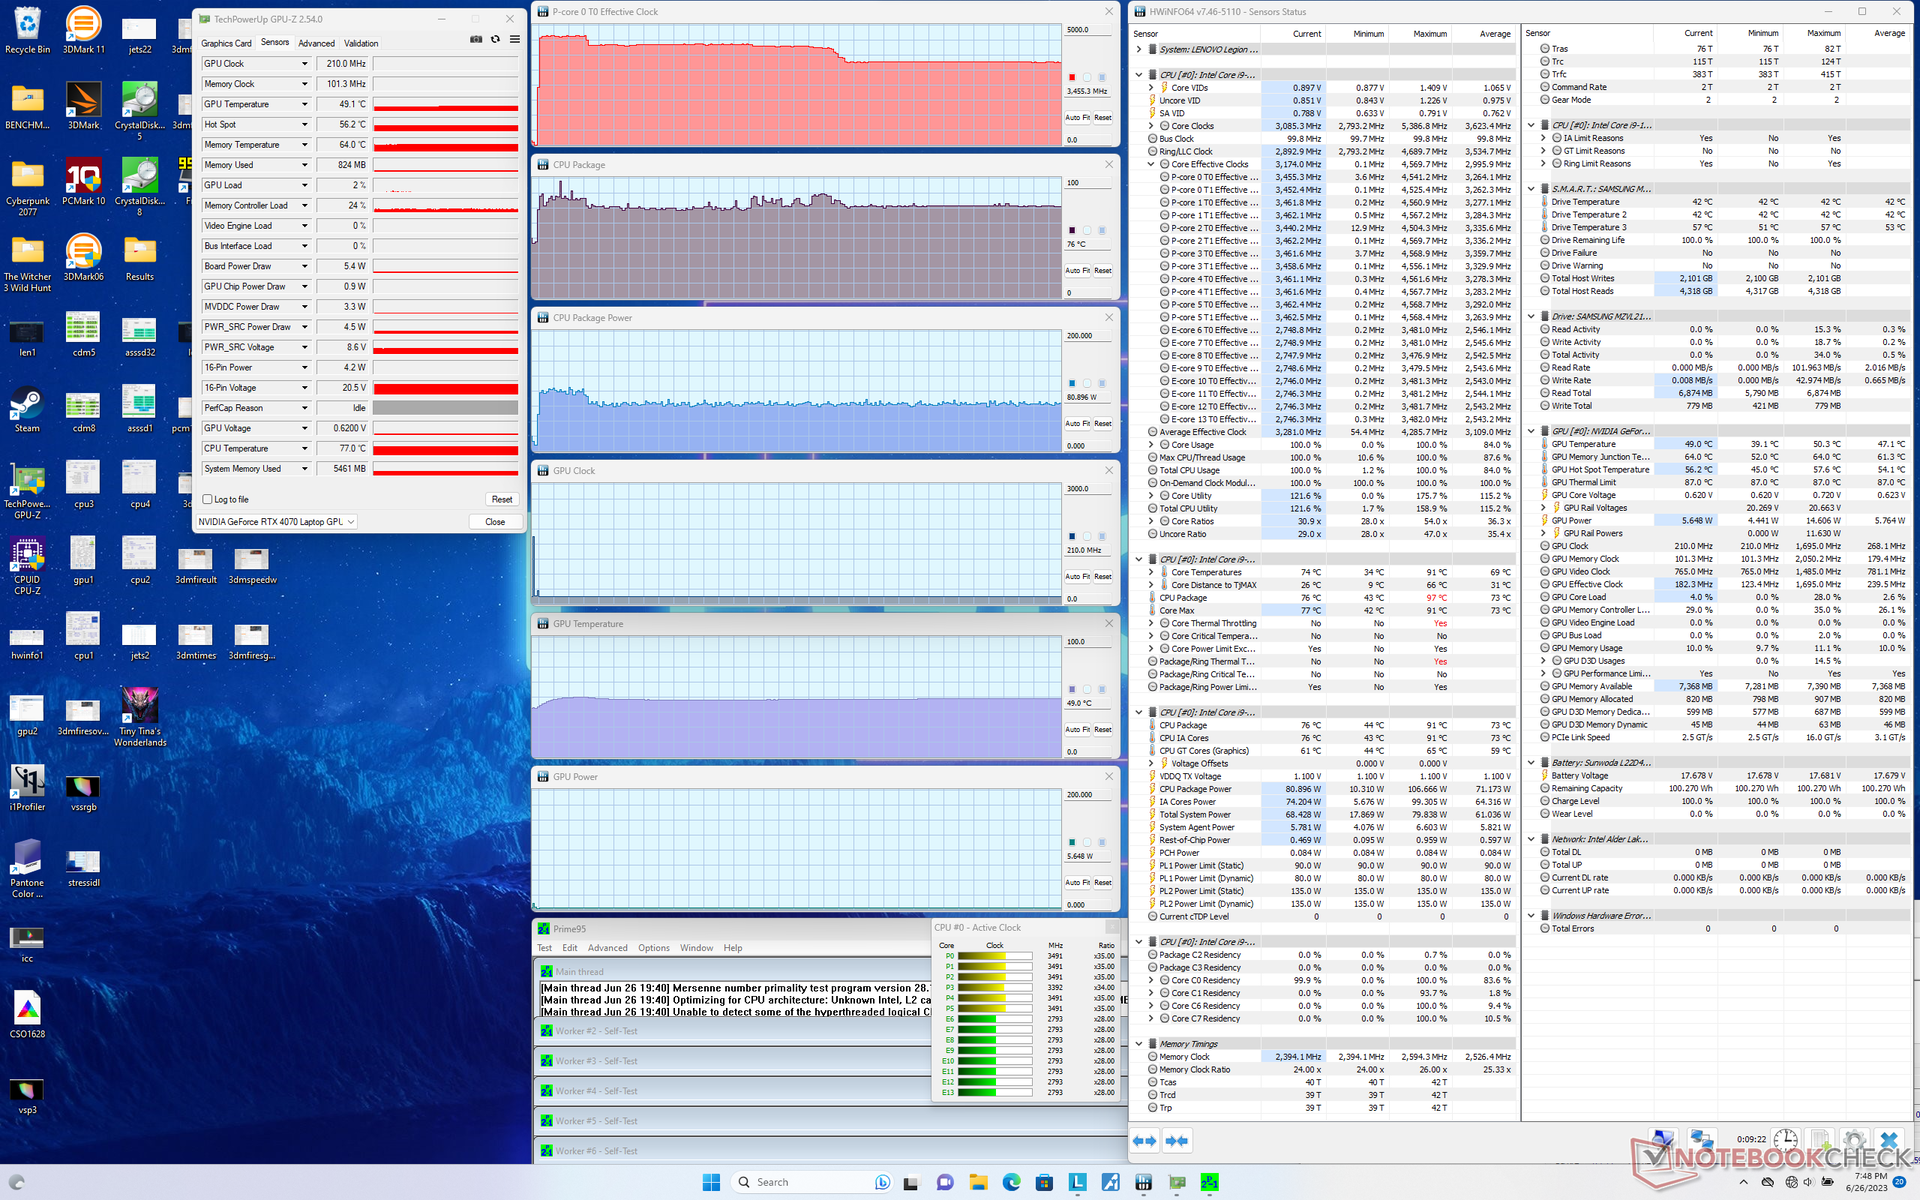
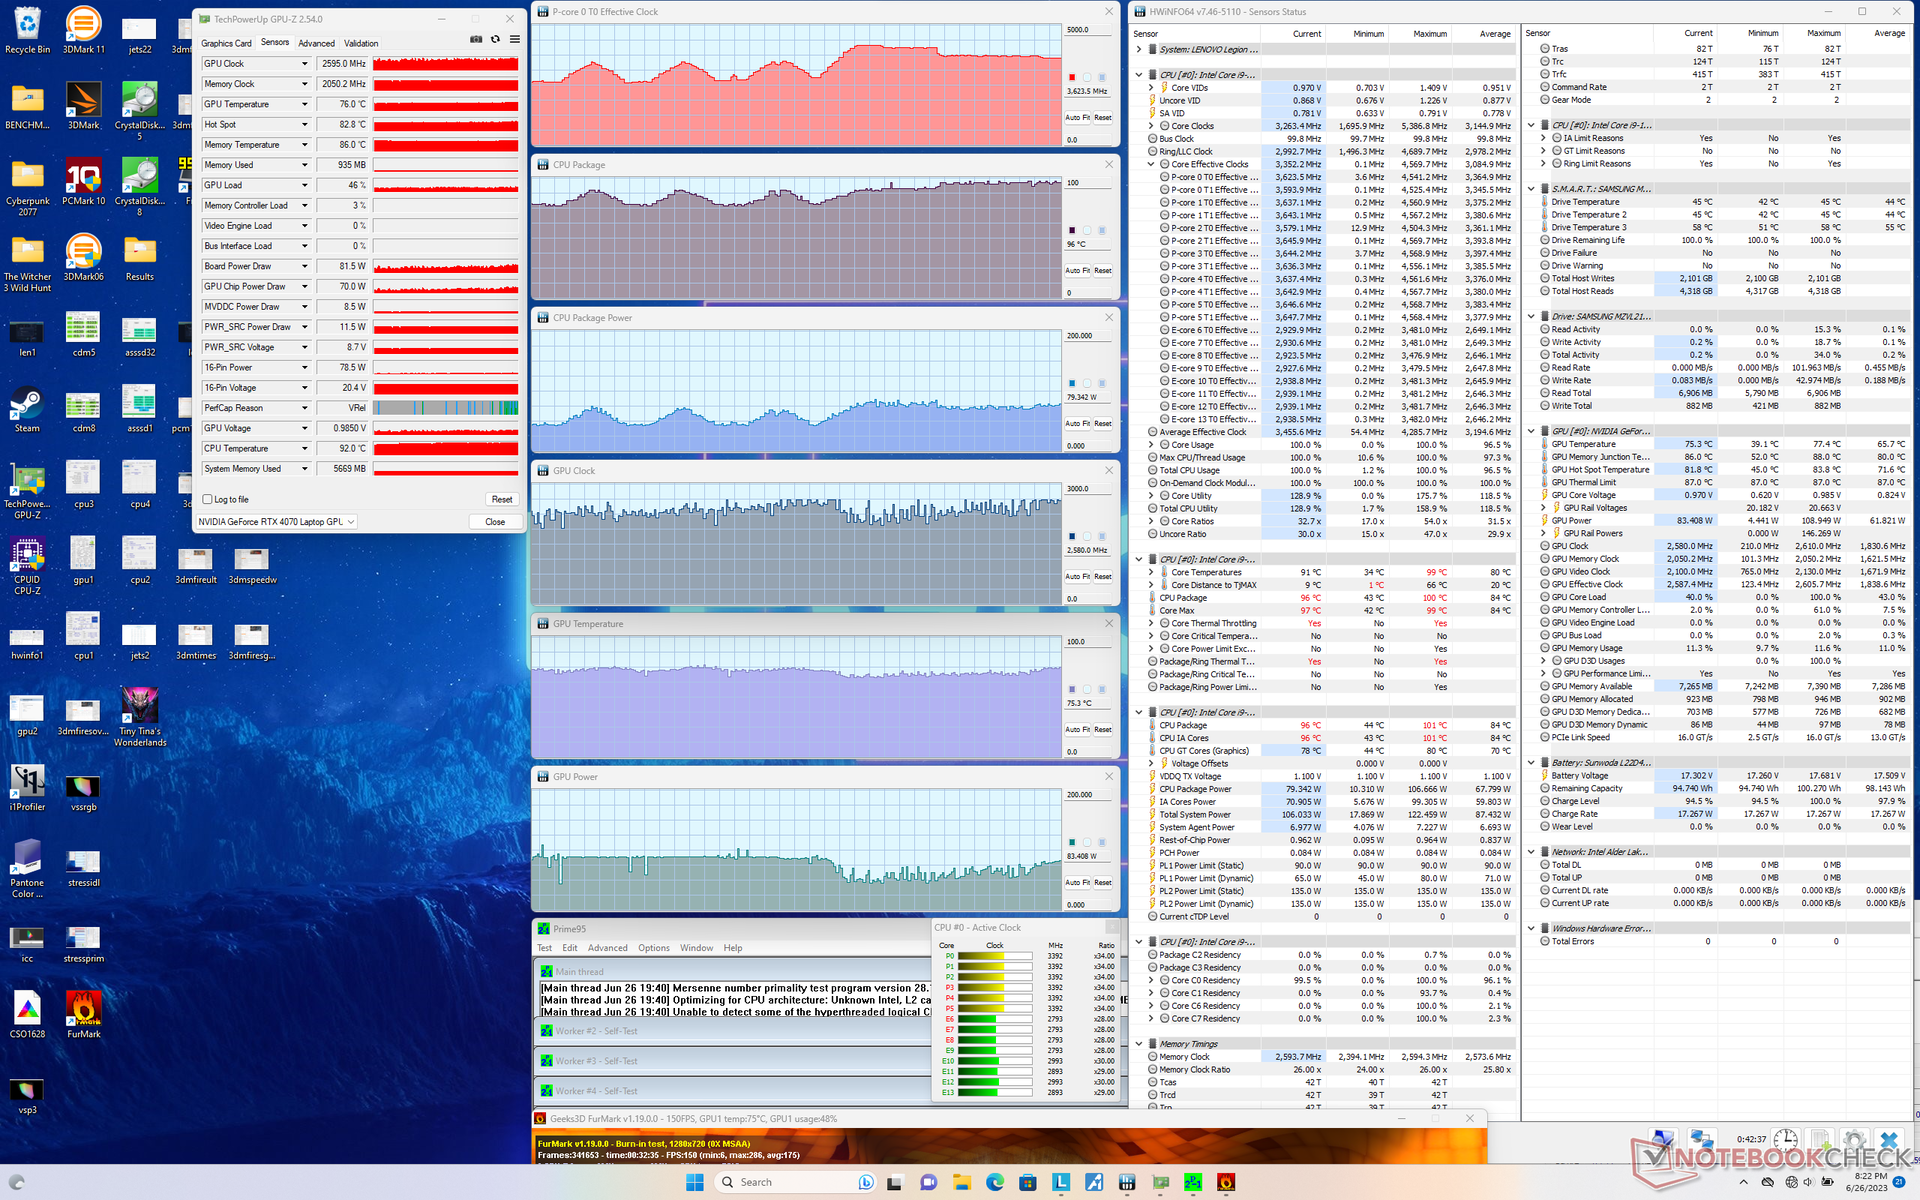
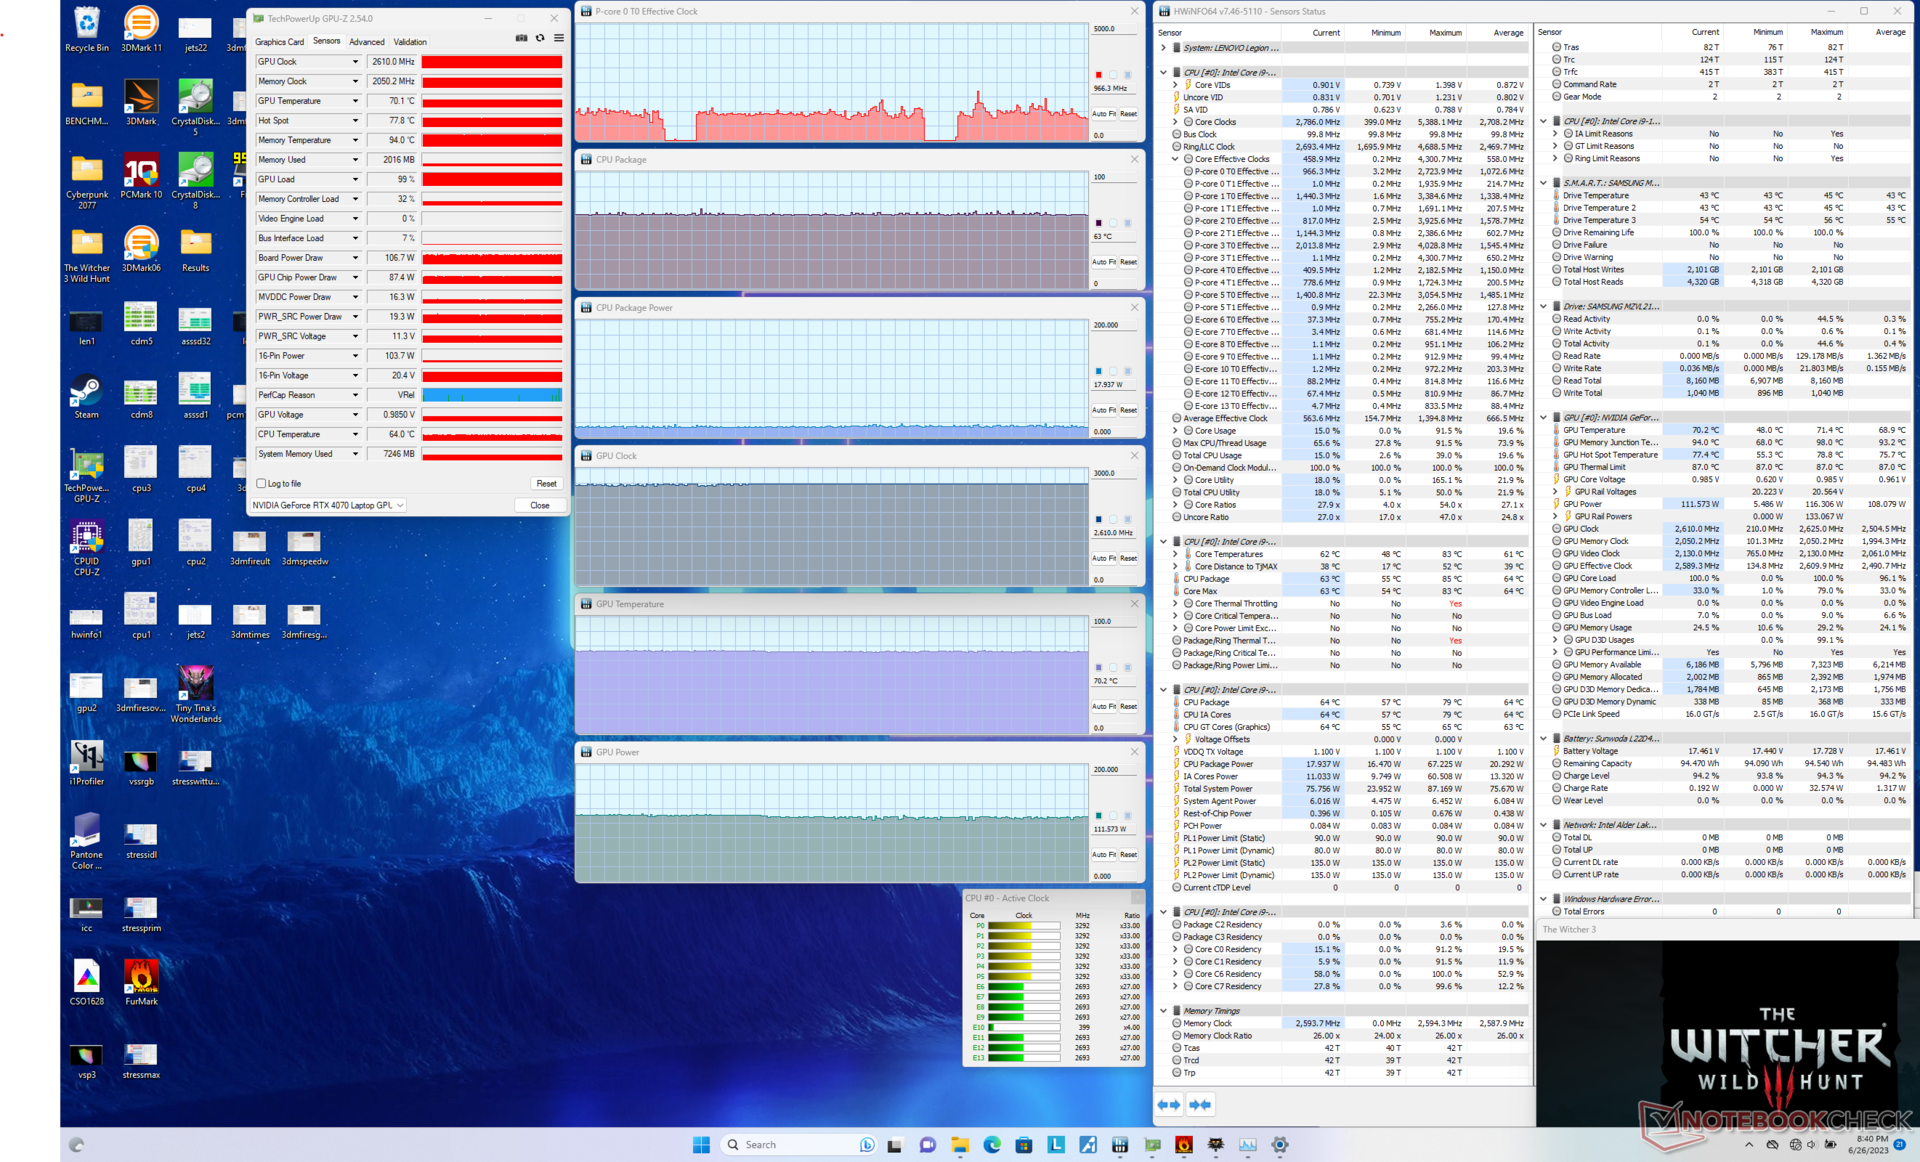
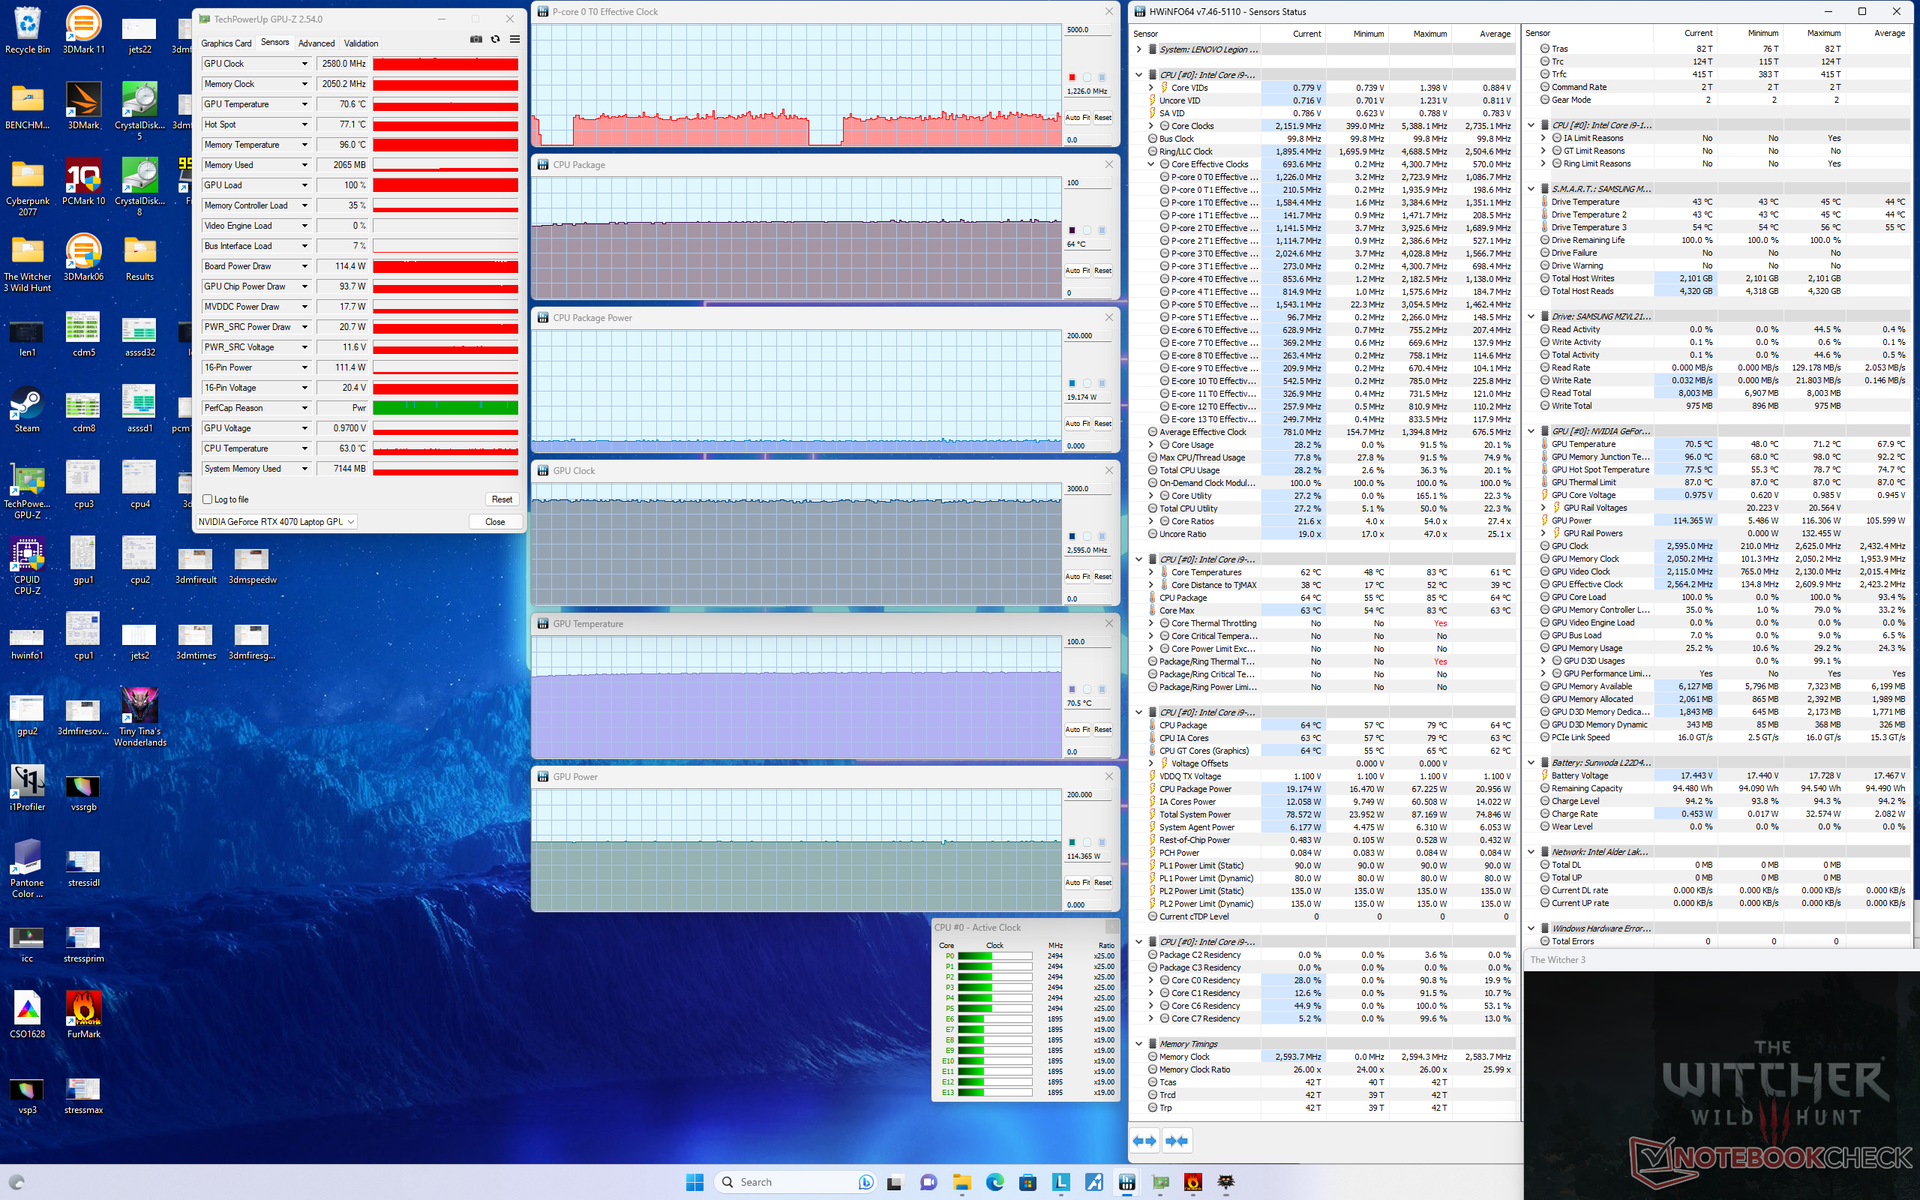
| RelojCPU(GHz) | Reloj GPU (MHz) | TemperaturamediaCPU(°C) | Temperatura media GPU (°C) | |
| Sistema en reposo | -- | -- | 45 | 40 |
| Prime95Stress | 3,5 | -- | 76 | 49 |
| Prime95+ FurMark Tensión | 2,6 - 3,5 | 1920 - 2610 | 77 - 90 | 75 |
| Witcher 3 Tensión(modo equilibrado) | ~1,2 | 2220 | 62 | 64 |
| Witcher 3 Estrés (Rendimiento conGPUOverclock Off + Overdrive Off) | ~1,2 | 2460 | 64 | 70 |
| Witcher 3 Tensión (Rendimiento con GPU Overclockactivada + Overdrivedesactivada) | ~1,2 | 2610 | 63 | 70 |
| Witcher 3 Estrés (Rendimiento con GPU Overclockactivada +Overdrive activado) | ~1,2 | 2580 | 64 | 71 |
Altavoces
Con unos 85 dB(A) como máximo, los altavoces tienen un volumen similar al de la mayoría de portátiles para juegos. Tampoco hay nada especial en la calidad de audio o la reproducción de graves. Los altavoces rinden mejor cuando se juega en modo equilibrado ya que los ventiladores no son tan ruidosos.
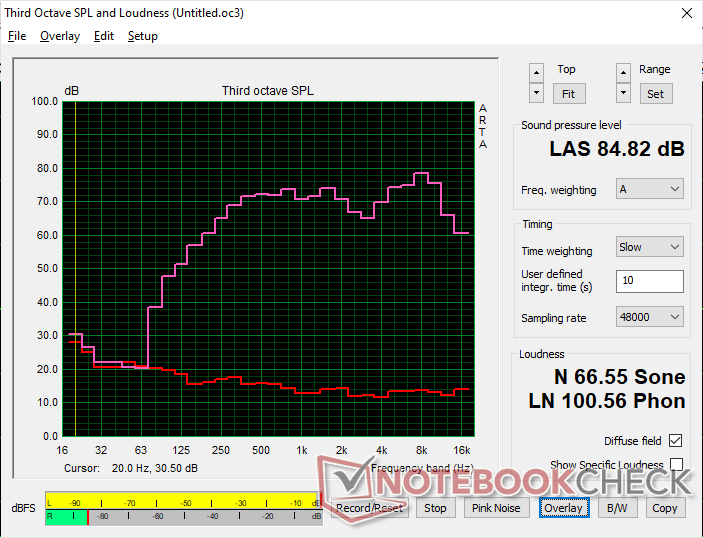
Lenovo Legion Slim 7i 16 Gen 8 análisis de audio
(+) | los altavoces pueden reproducir a un volumen relativamente alto (#84.8 dB)
Graves 100 - 315 Hz
(±) | lubina reducida - en promedio 12.1% inferior a la mediana
(±) | la linealidad de los graves es media (9% delta a frecuencia anterior)
Medios 400 - 2000 Hz
(+) | medios equilibrados - a sólo 1.4% de la mediana
(+) | los medios son lineales (3.3% delta a la frecuencia anterior)
Altos 2 - 16 kHz
(+) | máximos equilibrados - a sólo 4.4% de la mediana
(+) | los máximos son lineales (5.6% delta a la frecuencia anterior)
Total 100 - 16.000 Hz
(+) | el sonido global es lineal (10.5% de diferencia con la mediana)
En comparación con la misma clase
» 6% de todos los dispositivos probados de esta clase eran mejores, 2% similares, 92% peores
» El mejor tuvo un delta de 6%, la media fue 18%, el peor fue ###max##%
En comparación con todos los dispositivos probados
» 5% de todos los dispositivos probados eran mejores, 1% similares, 93% peores
» El mejor tuvo un delta de 4%, la media fue 23%, el peor fue ###max##%
Apple MacBook Pro 16 2021 M1 Pro análisis de audio
(+) | los altavoces pueden reproducir a un volumen relativamente alto (#84.7 dB)
Graves 100 - 315 Hz
(+) | buen bajo - sólo 3.8% lejos de la mediana
(+) | el bajo es lineal (5.2% delta a la frecuencia anterior)
Medios 400 - 2000 Hz
(+) | medios equilibrados - a sólo 1.3% de la mediana
(+) | los medios son lineales (2.1% delta a la frecuencia anterior)
Altos 2 - 16 kHz
(+) | máximos equilibrados - a sólo 1.9% de la mediana
(+) | los máximos son lineales (2.7% delta a la frecuencia anterior)
Total 100 - 16.000 Hz
(+) | el sonido global es lineal (4.6% de diferencia con la mediana)
En comparación con la misma clase
» 0% de todos los dispositivos probados de esta clase eran mejores, 0% similares, 100% peores
» El mejor tuvo un delta de 5%, la media fue 17%, el peor fue ###max##%
En comparación con todos los dispositivos probados
» 0% de todos los dispositivos probados eran mejores, 0% similares, 100% peores
» El mejor tuvo un delta de 4%, la media fue 23%, el peor fue ###max##%
Gestión de la energía
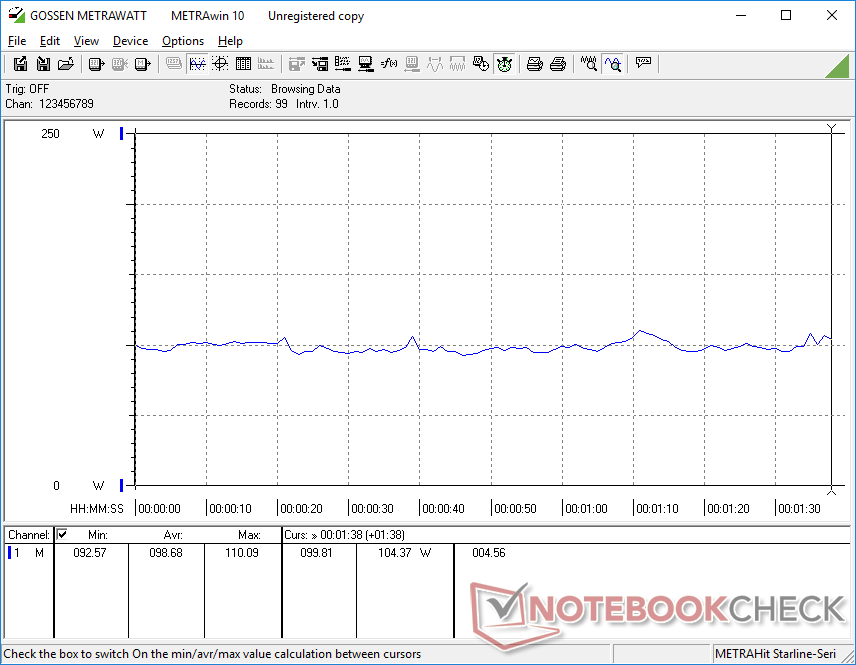
Consumo de energía - Altas tasas de ralentí
El consumo de energía en inactivo en el escritorio es relativamente alto con 22 W incluso con el Economizador y el brillo al mínimo. Esto parece ser un rasgo común entre los portátiles de juego equipados con CPUs Core-H de 13ª generación como muestra la siguiente tabla, lo que probablemente contribuya a la mediocre duración de la batería. En comparación, el AMD Zen 4-powered Legion Pro 5 16 puede bajar hasta los 8 W en condiciones similares.
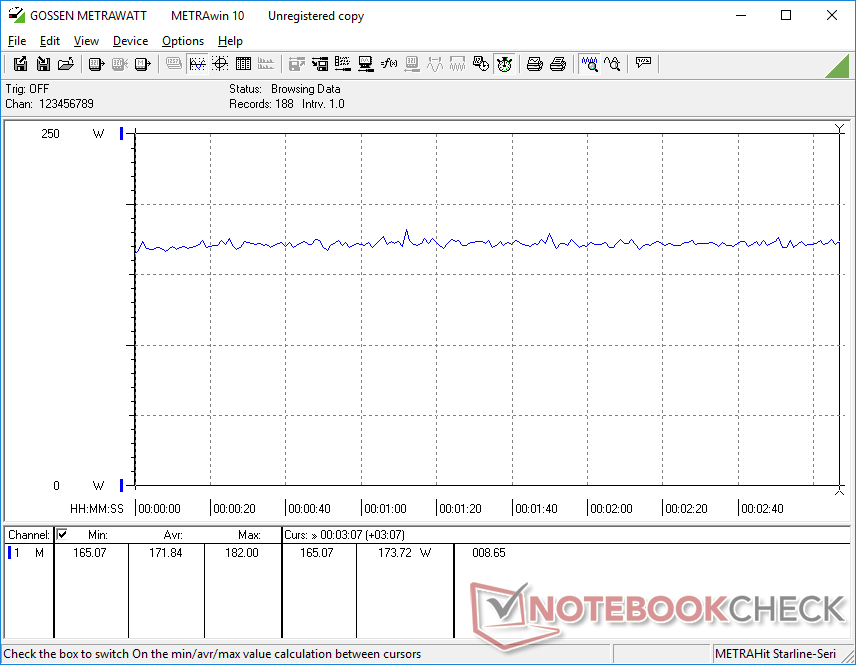
Los juegos consumen alrededor de 172 W, lo que es muy similar al antiguo Zephyrus M16 con Core i9-12900H y RTX 3070 Ti. Por tanto, nuestro Legion Slim 7 es capaz de ofrecer un rendimiento gráfico un 15 por ciento más rápido sin necesidad de consumir más energía, lo que se traduce en un mayor rendimiento por vatio en comparación con los antiguos portátiles para juegos alimentados por Ampere.
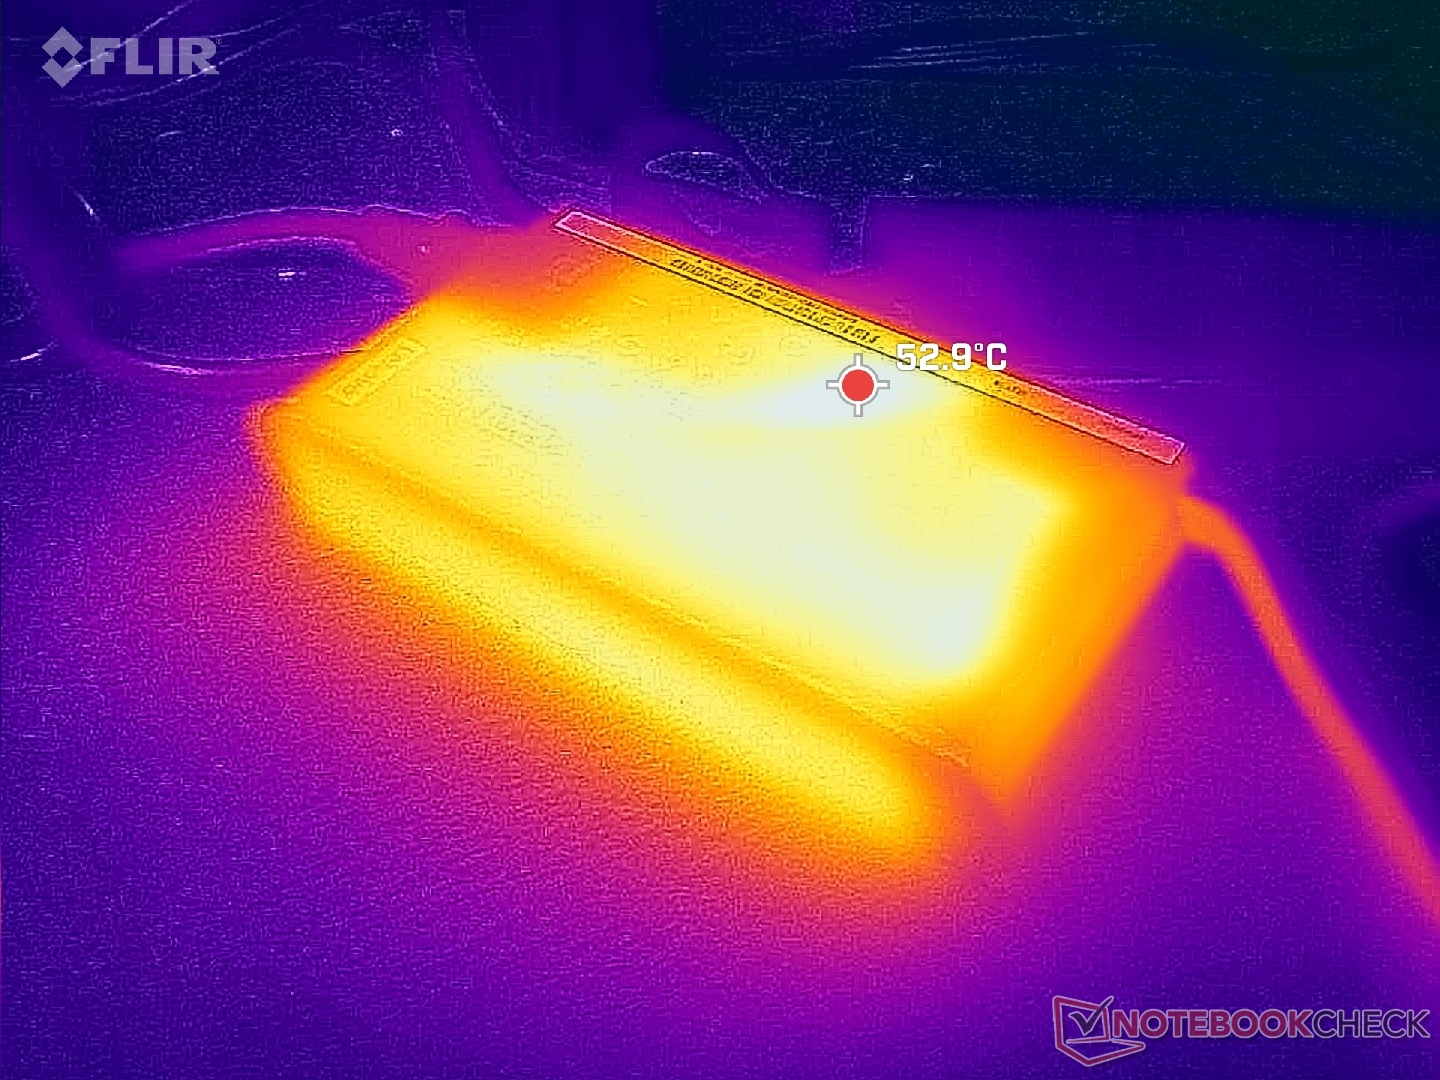
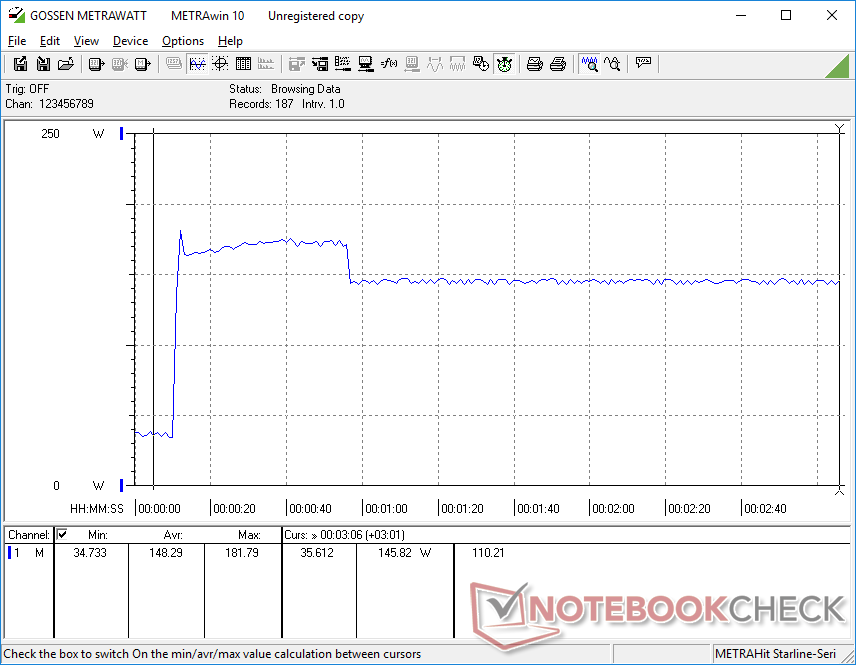
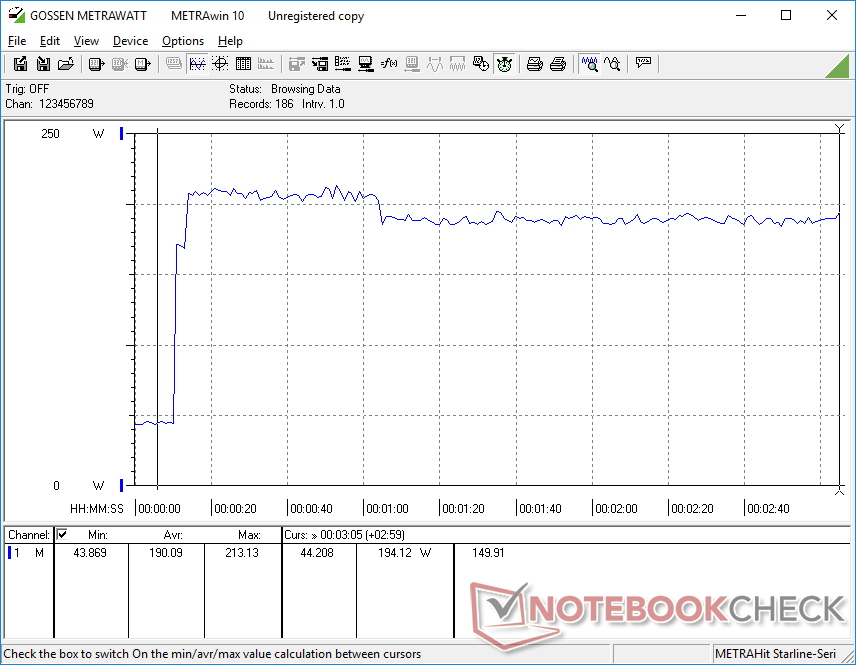
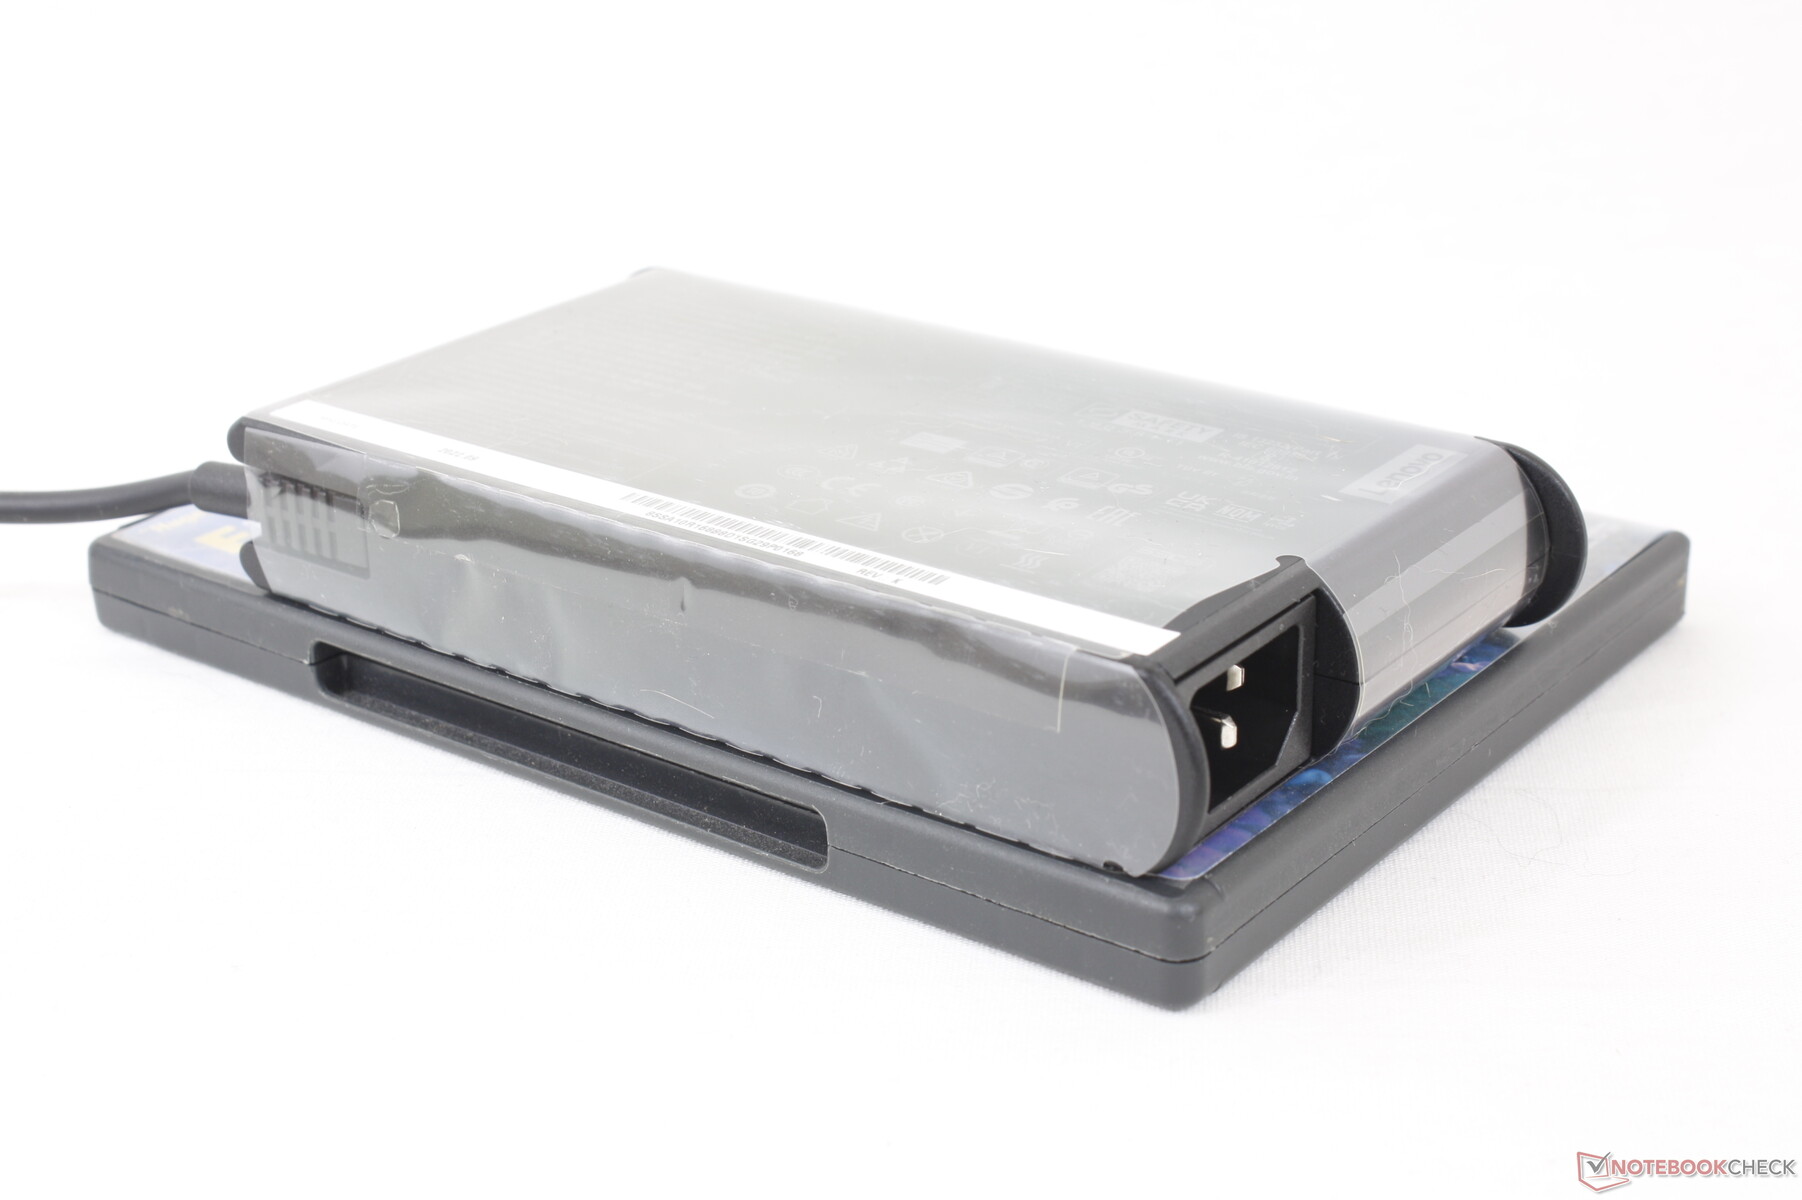
Hemos podido medir un consumo máximo de 213 W con el adaptador de CA de 230 W de tamaño medio (~16,9 x 8,8 x 2,6 cm). Se incluye un adaptador superior de 330 W con el Legion Pro 7 más grande, que viene con el Core i9-13900HX y la RTX 4080 mucho más potentes.
| Off / Standby | |
| Ocioso | |
| Carga |
|
Clave:
min: | |
| Lenovo Legion Slim 7i 16 Gen 8 i9-13900H, GeForce RTX 4070 Laptop GPU, Samsung PM9A1 MZVL21T0HCLR, IPS, 2560x1600, 16" | Acer Predator Helios 16 PH16-71-731Q i7-13700HX, GeForce RTX 4060 Laptop GPU, Micron 3400 1TB MTFDKBA1T0TFH, IPS-LED, 2560x1600, 16" | HP Omen 16-wf000 i7-13700HX, GeForce RTX 4080 Laptop GPU, SK hynix PC801 HFS002TEJ9X101N, IPS, 2560x1440, 16.1" | Lenovo Legion Pro 7 RTX4090 i9-13900HX, GeForce RTX 4090 Laptop GPU, Samsung PM9A1 MZVL21T0HCLR, IPS, 2560x1600, 16" | Alienware x16 R1 i9-13900HK, GeForce RTX 4080 Laptop GPU, SK hynix PC801 HFS001TEJ9X101N, IPS, 2560x1600, 16" | Lenovo Legion Pro 5 16ARX8 R7 7745HX, GeForce RTX 4070 Laptop GPU, Samsung PM9A1 MZVL21T0HCLR, IPS, 2560x1600, 16" | |
|---|---|---|---|---|---|---|
| Power Consumption | 11% | -8% | -20% | -25% | 15% | |
| Idle Minimum * (Watt) | 22 | 15.9 28% | 21.8 1% | 20 9% | 25.2 -15% | 8.1 63% |
| Idle Average * (Watt) | 29 | 20.5 29% | 26 10% | 25 14% | 29.9 -3% | 15.9 45% |
| Idle Maximum * (Watt) | 39.5 | 20.9 47% | 36 9% | 35 11% | 49.8 -26% | 37.2 6% |
| Load Average * (Watt) | 98.7 | 106 -7% | 115.5 -17% | 136 -38% | 105.4 -7% | 90.9 8% |
| Witcher 3 ultra * (Watt) | 171.8 | 175 -2% | 214 -25% | 282 -64% | 263 -53% | 189.6 -10% |
| Load Maximum * (Watt) | 213.2 | 276 -29% | 269.7 -27% | 320 -50% | 313.8 -47% | 263.5 -24% |
* ... más pequeño es mejor
Power Consumption Witcher 3 / Stresstest
Power Consumption external Monitor
Duración de la batería
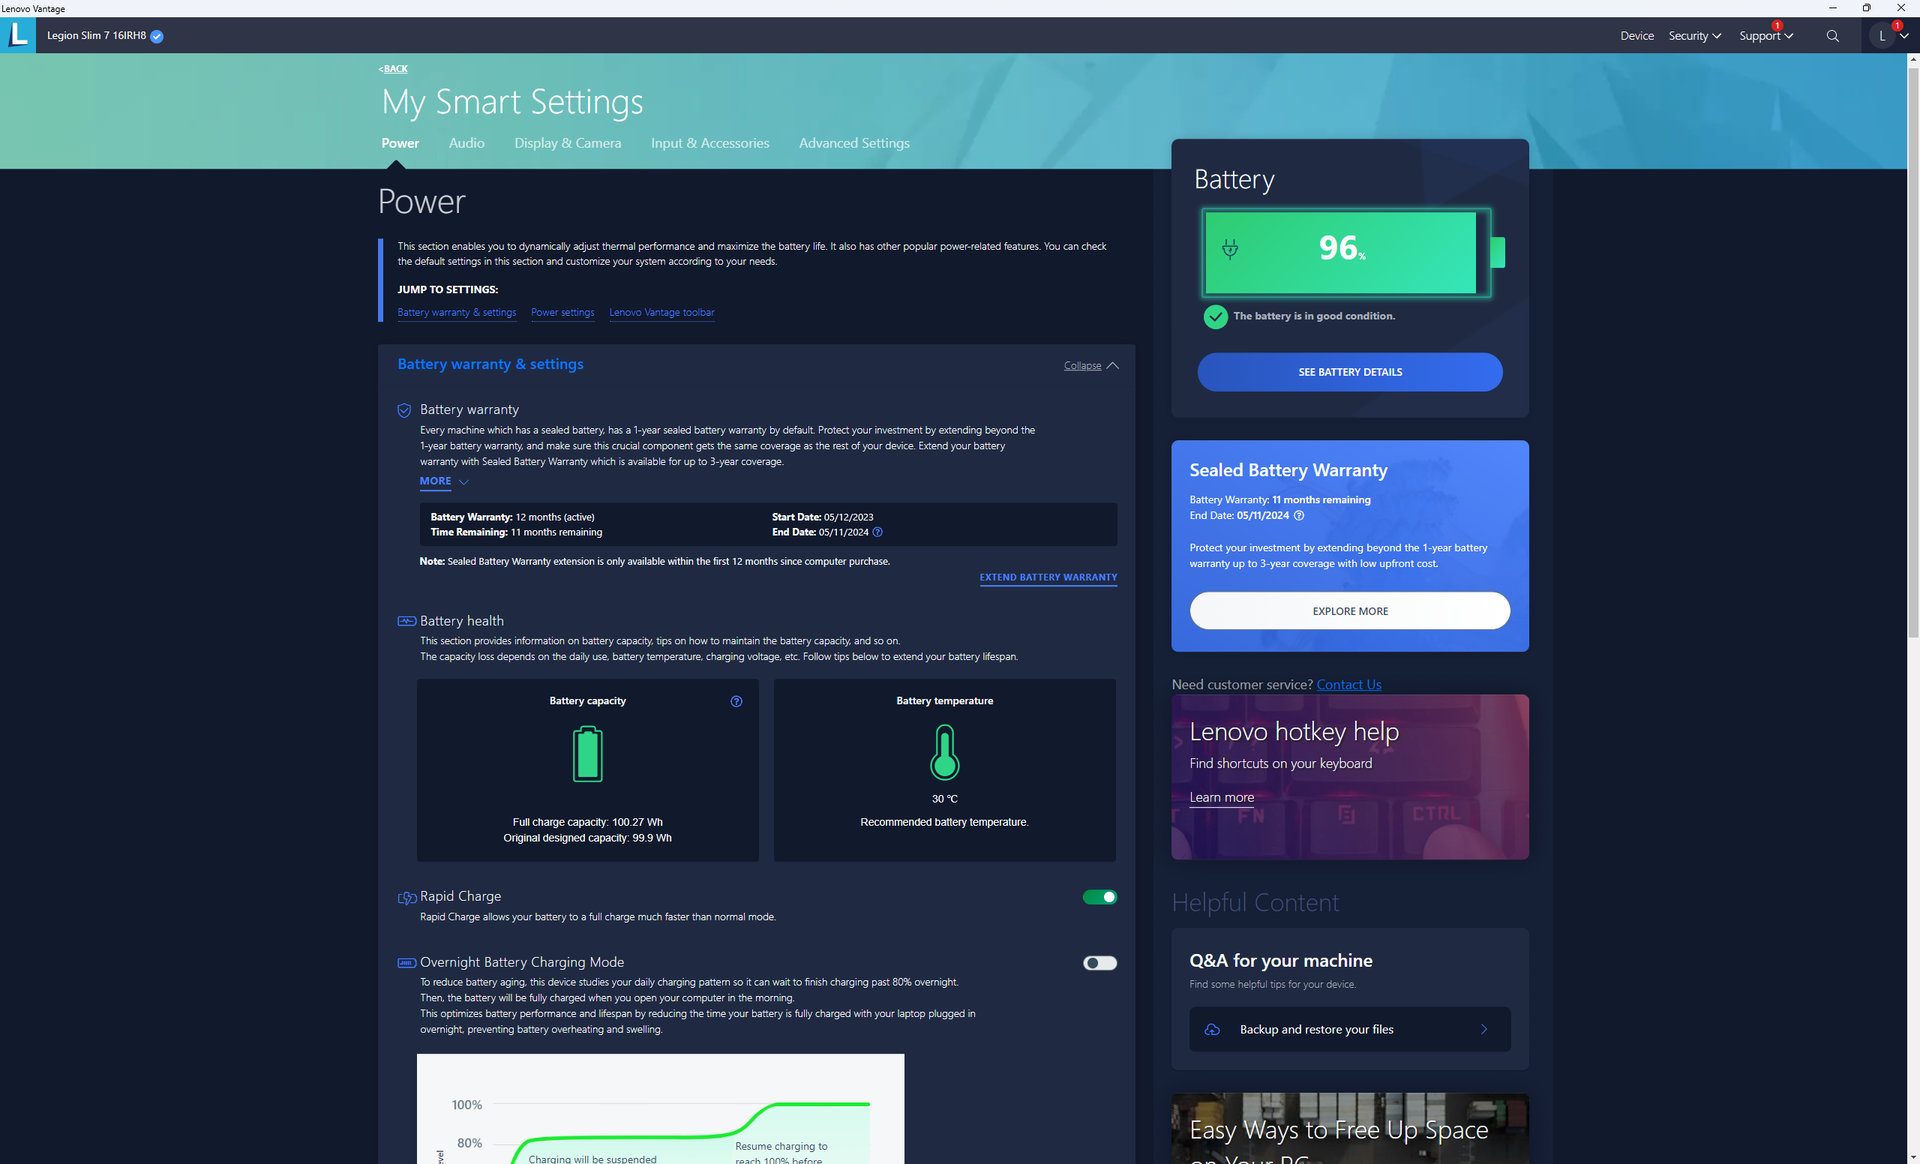
La capacidad de la batería es sorprendentemente igual de grande que en el Legion Pro 7 17 a pesar del perfil más delgado de nuestro diseño Slim 7i. No obstante, la duración de la batería sigue siendo media en el mejor de los casos, con algo menos de 4,5 horas de navegación real. La mayoría de los portátiles para juegos con CPU Intel de 13ª generación ofrecen duraciones similares o inferiores, incluido el Omen 16 o el Alienware x16 R1.
La carga de vacío a lleno tarda sólo 70 minutos con la carga rápida activada en comparación con 90 minutos o más en la mayoría de los otros portátiles de juego. El sistema también se puede recargar por USB-C hasta 140 W.
| Lenovo Legion Slim 7i 16 Gen 8 i9-13900H, GeForce RTX 4070 Laptop GPU, 99.9 Wh | HP Omen 16-wf000 i7-13700HX, GeForce RTX 4080 Laptop GPU, 83 Wh | Alienware x16 R1 i9-13900HK, GeForce RTX 4080 Laptop GPU, 90 Wh | Lenovo Legion Pro 7 RTX4090 i9-13900HX, GeForce RTX 4090 Laptop GPU, 99.9 Wh | Asus ROG Strix G16 G614JZ i9-13980HX, GeForce RTX 4080 Laptop GPU, 90 Wh | Razer Blade 16 Early 2023 i9-13950HX, GeForce RTX 4080 Laptop GPU, 95.2 Wh | |
|---|---|---|---|---|---|---|
| Duración de Batería | 15% | -7% | 16% | 71% | 57% | |
| Reader / Idle (h) | 5.1 | 5.5 8% | 7.3 43% | 8.9 75% | ||
| WiFi v1.3 (h) | 4.4 | 5.1 16% | 2.5 -43% | 5.1 16% | 9.7 120% | 6.1 39% |
| Load (h) | 0.9 | 1.1 22% | 0.7 -22% | 1.1 22% | 1.4 56% |
Pro
Contra
Veredicto: convincente en casi todos los aspectos
El Legion Slim 7i 16 Gen 8 es uno de los portátiles para juegos más equilibrados de la familia Legion. No sólo es más delgado y ligero que la mayoría de los de la categoría de 16 pulgadas, sino que tampoco escatima en opciones de puertos, el espacioso teclado RGB por tecla, las respetables opciones de pantalla tanto para jugadores como para creadores de contenidos, e incluso la capacidad de la batería y un lector SD. El modelo cumple muchos requisitos teniendo en cuenta su delgado perfil.
El Lenovo Legion Slim 7i 16 G8 sacrifica algunas opciones de rendimiento por su menor grosor y peso, pero el modelo está tan bien equilibrado en términos de rendimiento y portabilidad que a la mayoría de los jugadores no les importará.
Algunas grietas empiezan a aparecer cuando se profundiza en la máquina. La configuración de RAM soldada y ampliable, por ejemplo, es poco común en los portátiles para juegos, mientras que el SSD tiende a ralentizarse bajo estrés. Las opciones de CPU y GPU omiten el Core i9-13900HX de gama alta y la RTX 4080, respectivamente, que sólo están disponibles en el Legion Pro 7 16, más grueso y pesado. Los entusiastas que quieran todo y la cocina tendrían por tanto que conformarse con alternativas más grandes y pesadas como el Legion Pro 7alienware m16 o el Razer Blade 16 cada uno de los cuales ofrece opciones de procesador más rápidas.
Precio y disponibilidad
Lenovo ya está distribuyendo su Legion Slim 7i 16 Gen 8 a partir de $1500 USD para la configuración básica Core i7-13700H y RTX 4060 hasta $1800 USD con nuestra configuración Core i9-13900H y RTX 4070. La configuración de gama alta también está disponible en Best Buy.
Lenovo Legion Slim 7i 16 Gen 8
- 07/03/2023 v7 (old)
Allen Ngo
Transparencia
La selección de los dispositivos que se van a reseñar corre a cargo de nuestro equipo editorial. La muestra de prueba fue proporcionada al autor en calidad de préstamo por el fabricante o el minorista a los efectos de esta reseña. El prestamista no tuvo ninguna influencia en esta reseña, ni el fabricante recibió una copia de la misma antes de su publicación. No había ninguna obligación de publicar esta reseña. Como empresa de medios independiente, Notebookcheck no está sujeta a la autoridad de fabricantes, minoristas o editores.
Así es como prueba Notebookcheck
Cada año, Notebookcheck revisa de forma independiente cientos de portátiles y smartphones utilizando procedimientos estandarizados para asegurar que todos los resultados son comparables. Hemos desarrollado continuamente nuestros métodos de prueba durante unos 20 años y hemos establecido los estándares de la industria en el proceso. En nuestros laboratorios de pruebas, técnicos y editores experimentados utilizan equipos de medición de alta calidad. Estas pruebas implican un proceso de validación en varias fases. Nuestro complejo sistema de clasificación se basa en cientos de mediciones y puntos de referencia bien fundamentados, lo que mantiene la objetividad.Price comparison

