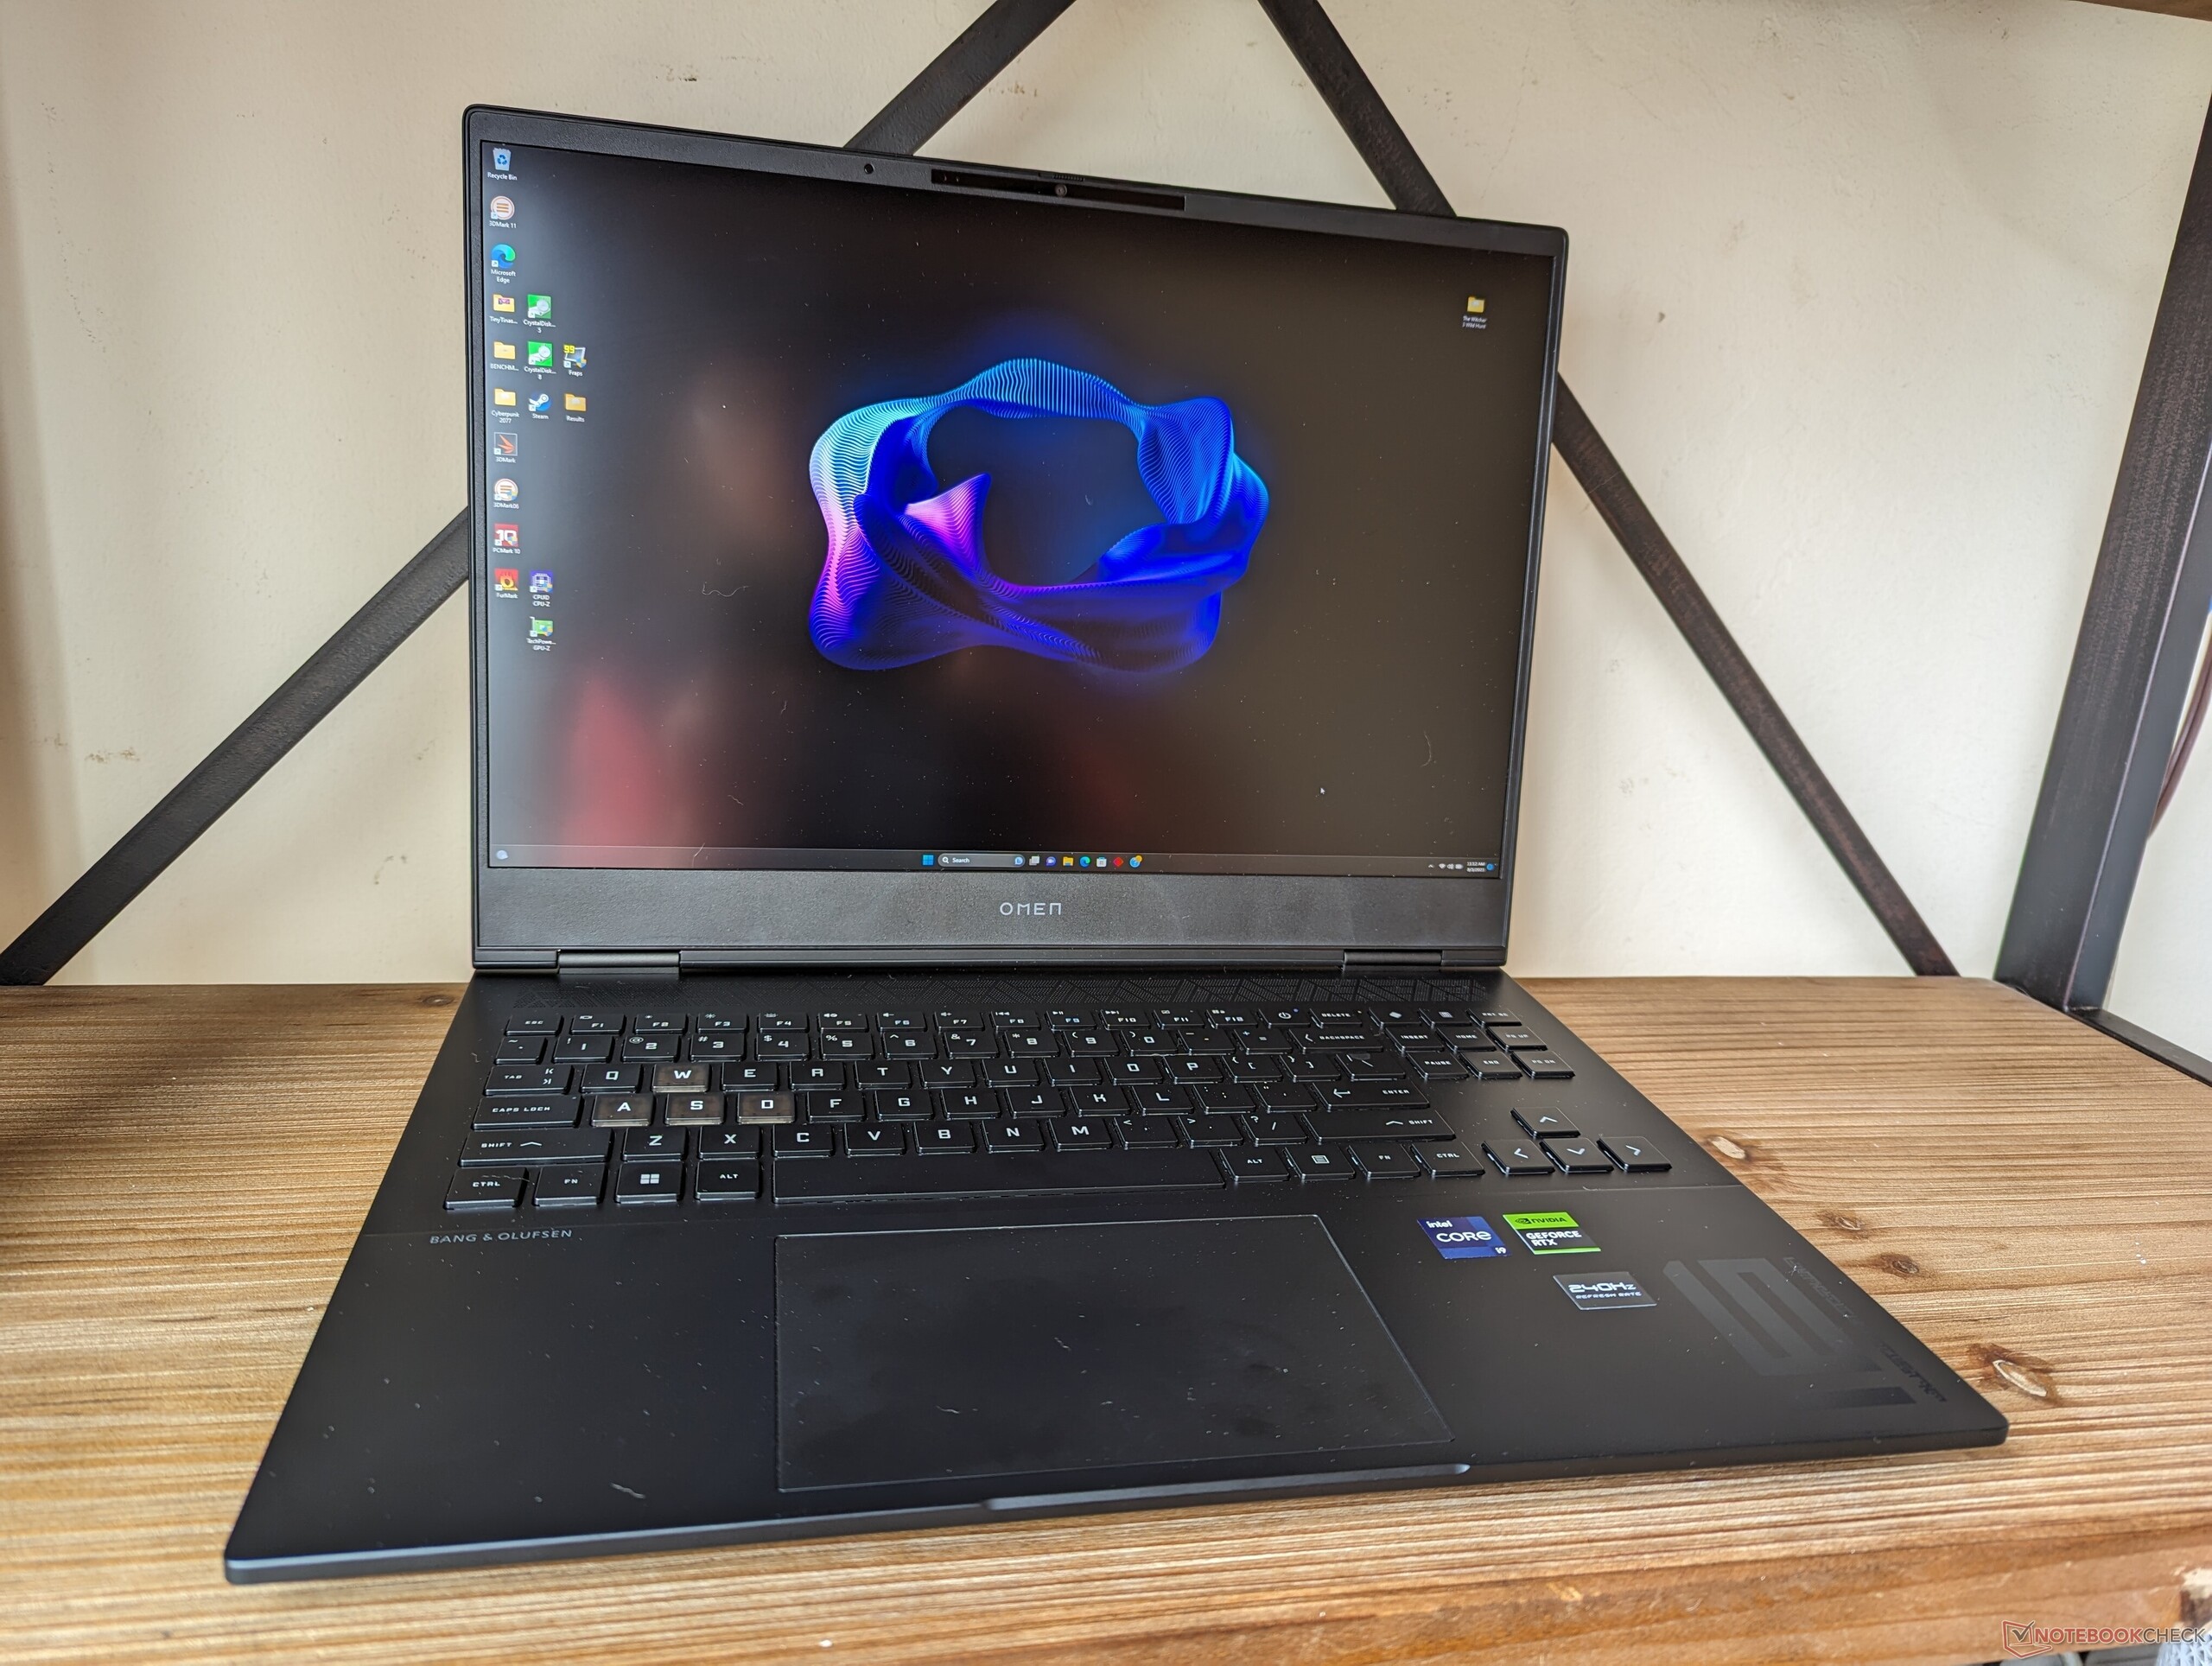
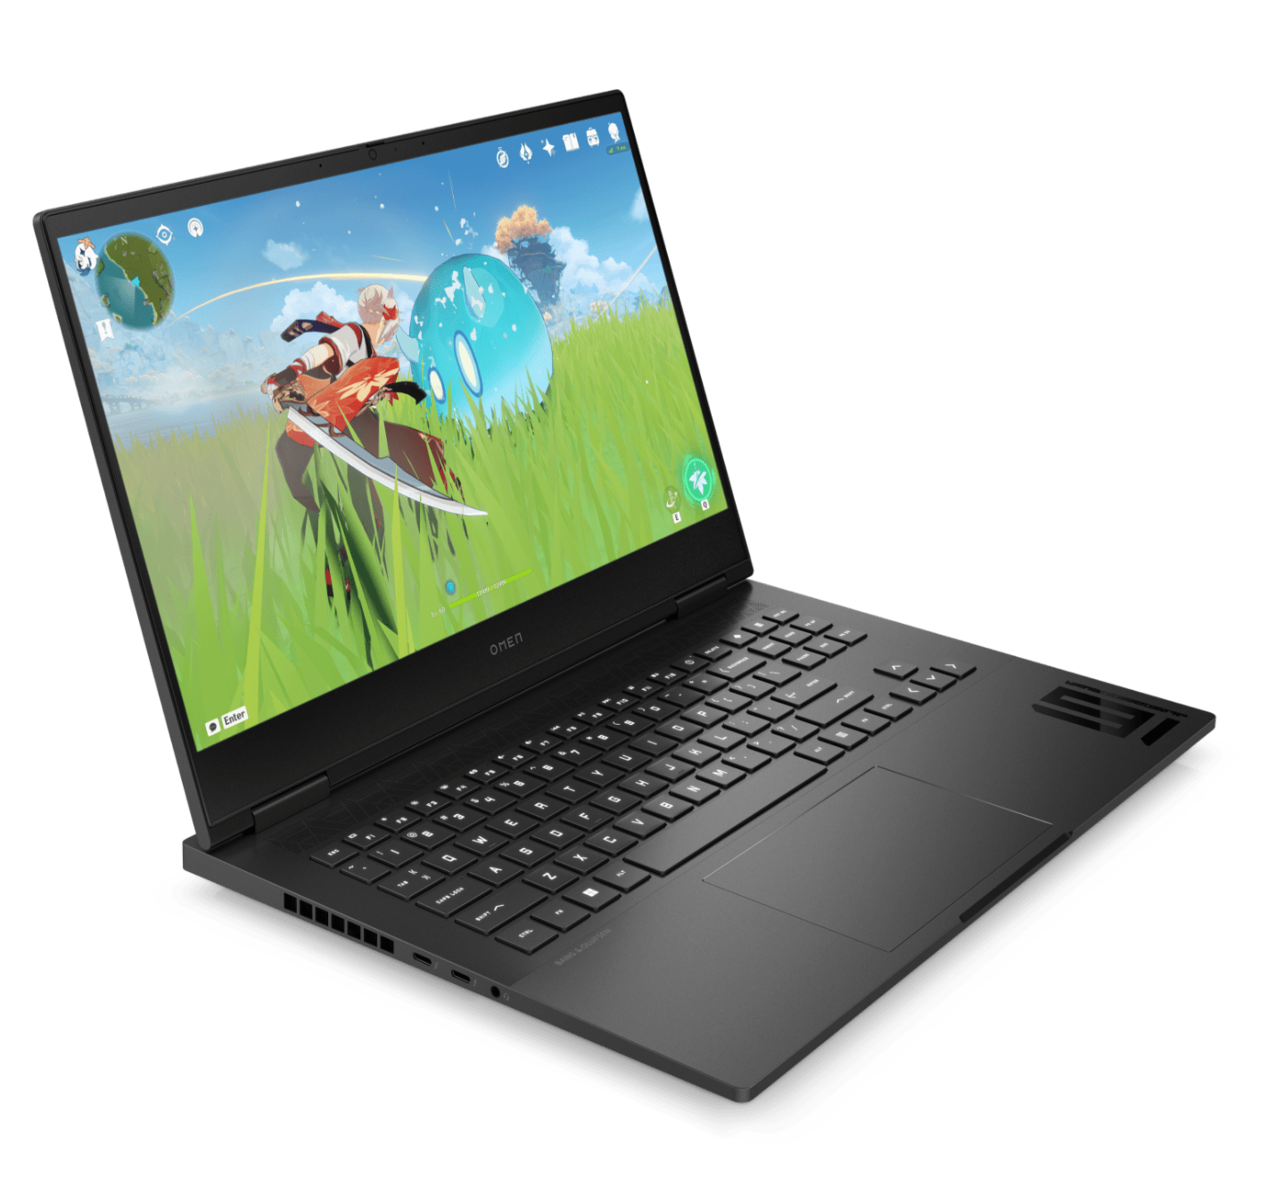
Análisis del portátil HP Omen Transcend 16: Más que una pequeña diferencia de nombre

El Omen Transcend 16 es una variante del estándar Omen 16. Aunque usan diseños de chasis y materiales similares, el Omen Transcend 16 tiene varias diferencias importantes que los compradores potenciales deberían conocer.
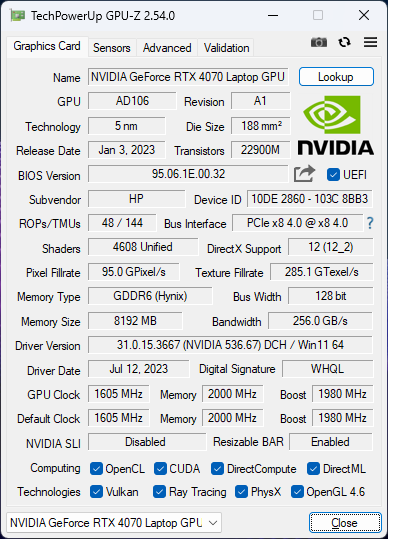
Nuestra unidad de análisis específica es la configuración más alta disponible con la CPU Raptor Lake Core i9-13900HX de 13ª generación, la GPU GeForce RTX 4070 de 130 W y una pantalla mini-LED QHD+ (2560 x 1600) de 240 Hz con todos los colores DCI-P3 por aproximadamente 2500 USD al por menor. Hay modelos inferiores con Core i7-13700HX, GPU RTX 4050 y pantalla IPS 1200p de 165 Hz por unos 1250 $.
La competencia en este segmento incluye otros portátiles de juego de 16 pulgadas de gama alta como el Lenovo Legion Slim 7i 16 G8, Acer Nitro 16, Alienware x16 R1, o el Asus ROG Zephyrus M16.
Más opiniones sobre HP:
Posibles contendientes en la comparación
Valoración | Fecha | Modelo | Peso | Altura | Tamaño | Resolución | Precio |
|---|---|---|---|---|---|---|---|
| 87.9 % v7 (old) | 08/2023 | HP Omen Transcend 16 i9-13900HX, GeForce RTX 4070 Laptop GPU | 2.3 kg | 19.8 mm | 16.00" | 2560x1600 | |
| 90 % v7 (old) | 07/2023 | Lenovo Legion Slim 7i 16 Gen 8 i9-13900H, GeForce RTX 4070 Laptop GPU | 2.1 kg | 19.9 mm | 16.00" | 2560x1600 | |
| 87.4 % v7 (old) | 07/2023 | HP Omen 16-wf000 i7-13700HX, GeForce RTX 4080 Laptop GPU | 2.4 kg | 23.6 mm | 16.10" | 2560x1440 | |
| 88.4 % v7 (old) | 06/2023 | Alienware x16 R1 i9-13900HK, GeForce RTX 4080 Laptop GPU | 2.6 kg | 18.57 mm | 16.00" | 2560x1600 | |
| 88.1 % v7 (old) | 06/2023 | Acer Nitro 16 AN16-41 R7 7735HS, GeForce RTX 4070 Laptop GPU | 2.7 kg | 27.9 mm | 16.00" | 2560x1600 | |
| 87.8 % v7 (old) | 02/2023 | Asus ROG Zephyrus M16 GU603Z i9-12900H, GeForce RTX 3070 Ti Laptop GPU | 2.1 kg | 19.9 mm | 16.00" | 2560x1600 |
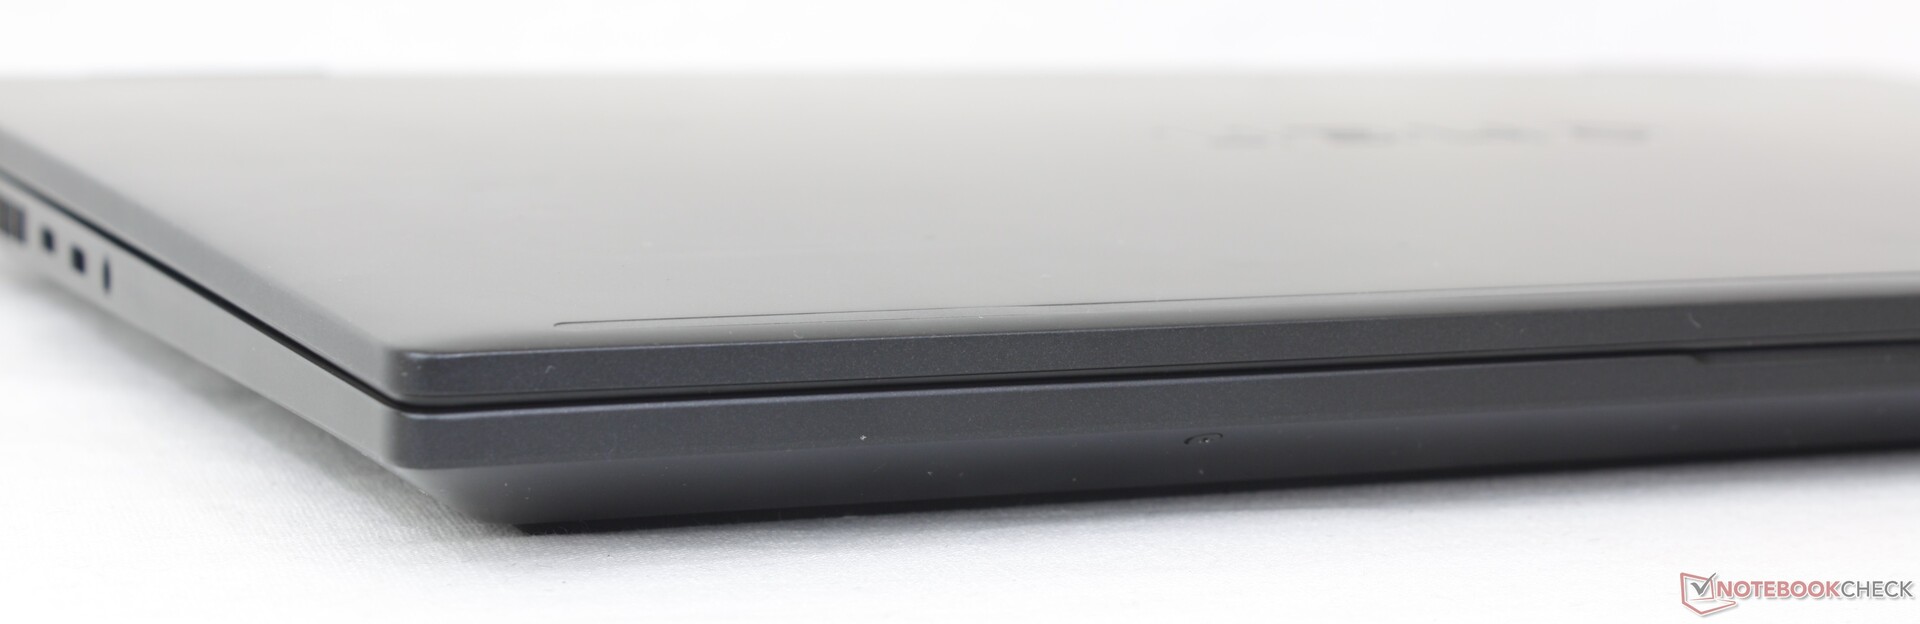
Maletín - Mismos materiales, distintas dimensiones
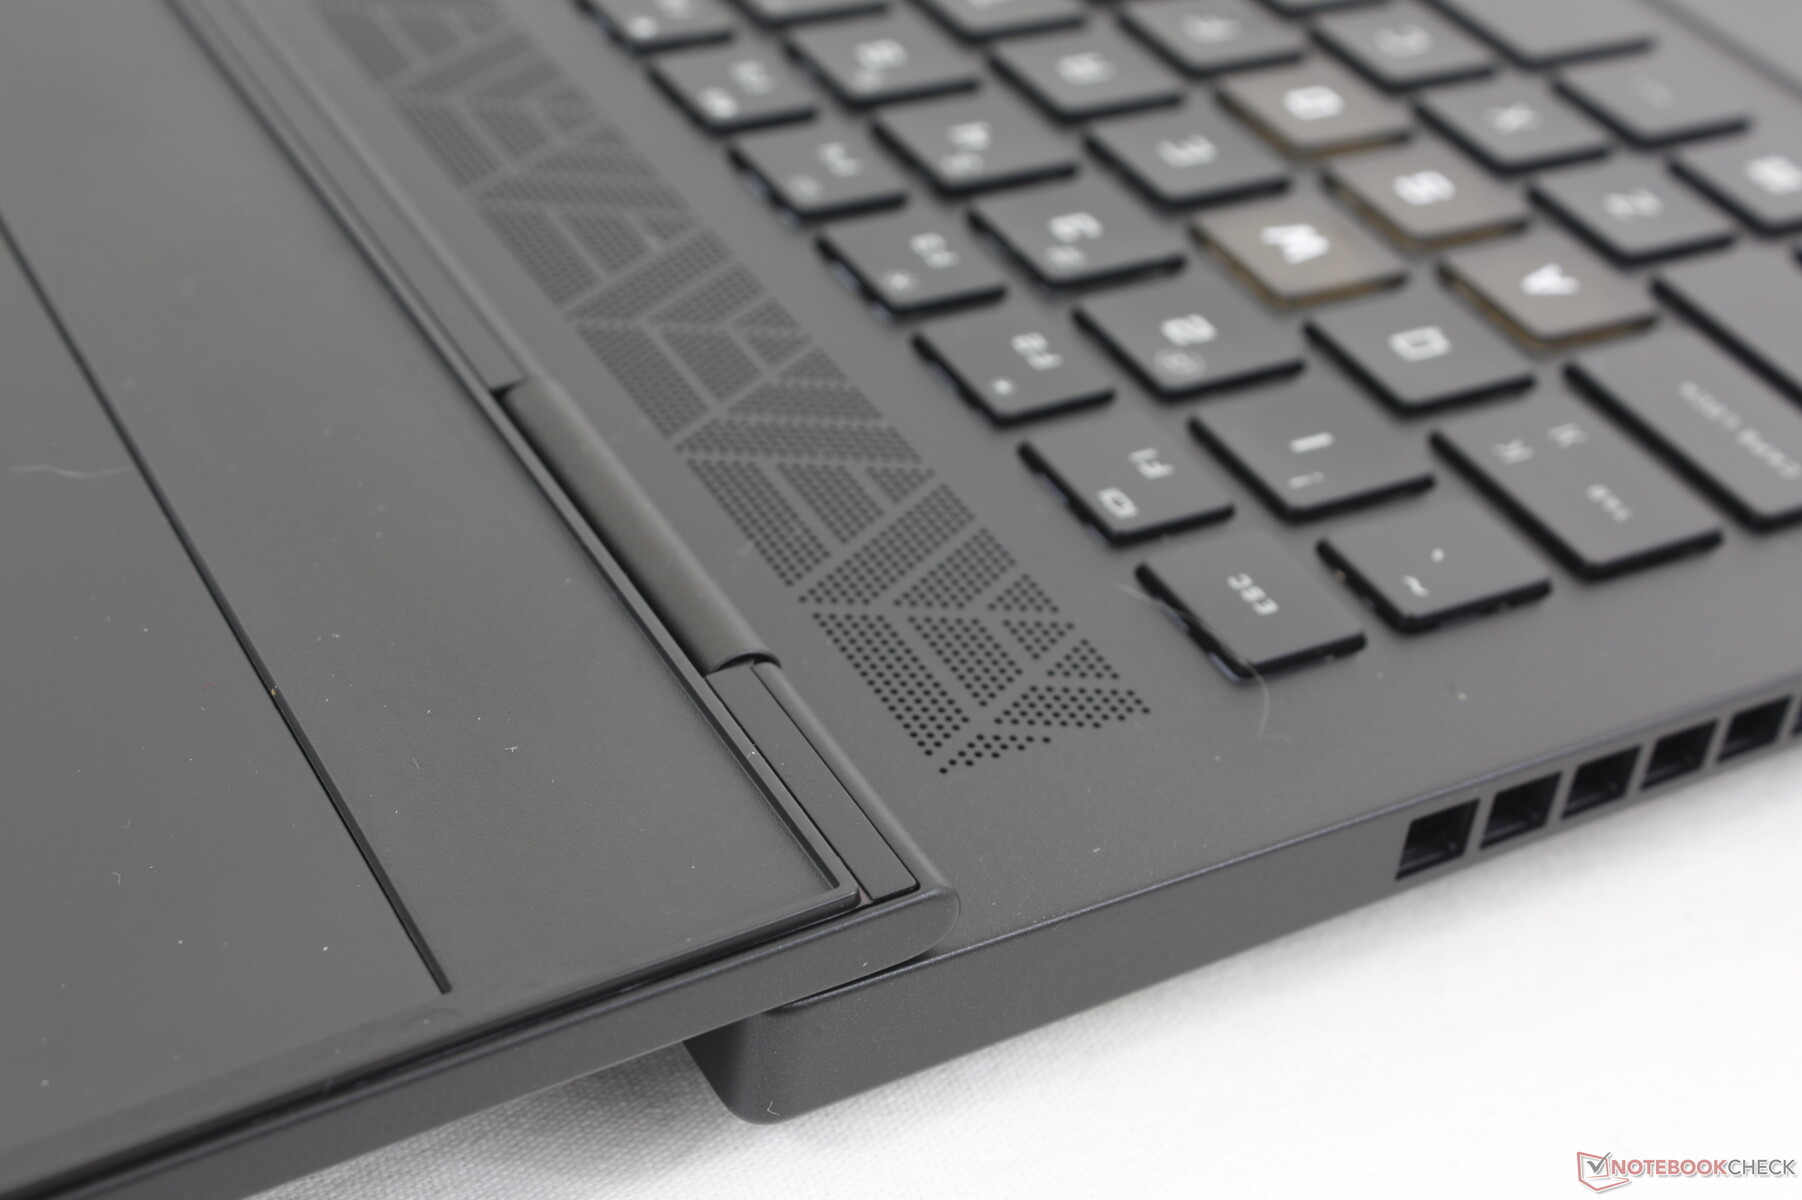
Una de las mayores diferencias externas entre el Omen 16 y el Omen Transcend 16 es el paso de 16:9 a 16:10, por lo que sus huellas son ligeramente diferentes. Por lo demás, ambos modelos comparten materiales metálicos y textura similares. Cabe destacar que el bisel a lo largo del borde inferior de la pantalla no es más estrecho que el del Omen 16 normal a pesar del cambio en la relación de aspecto.
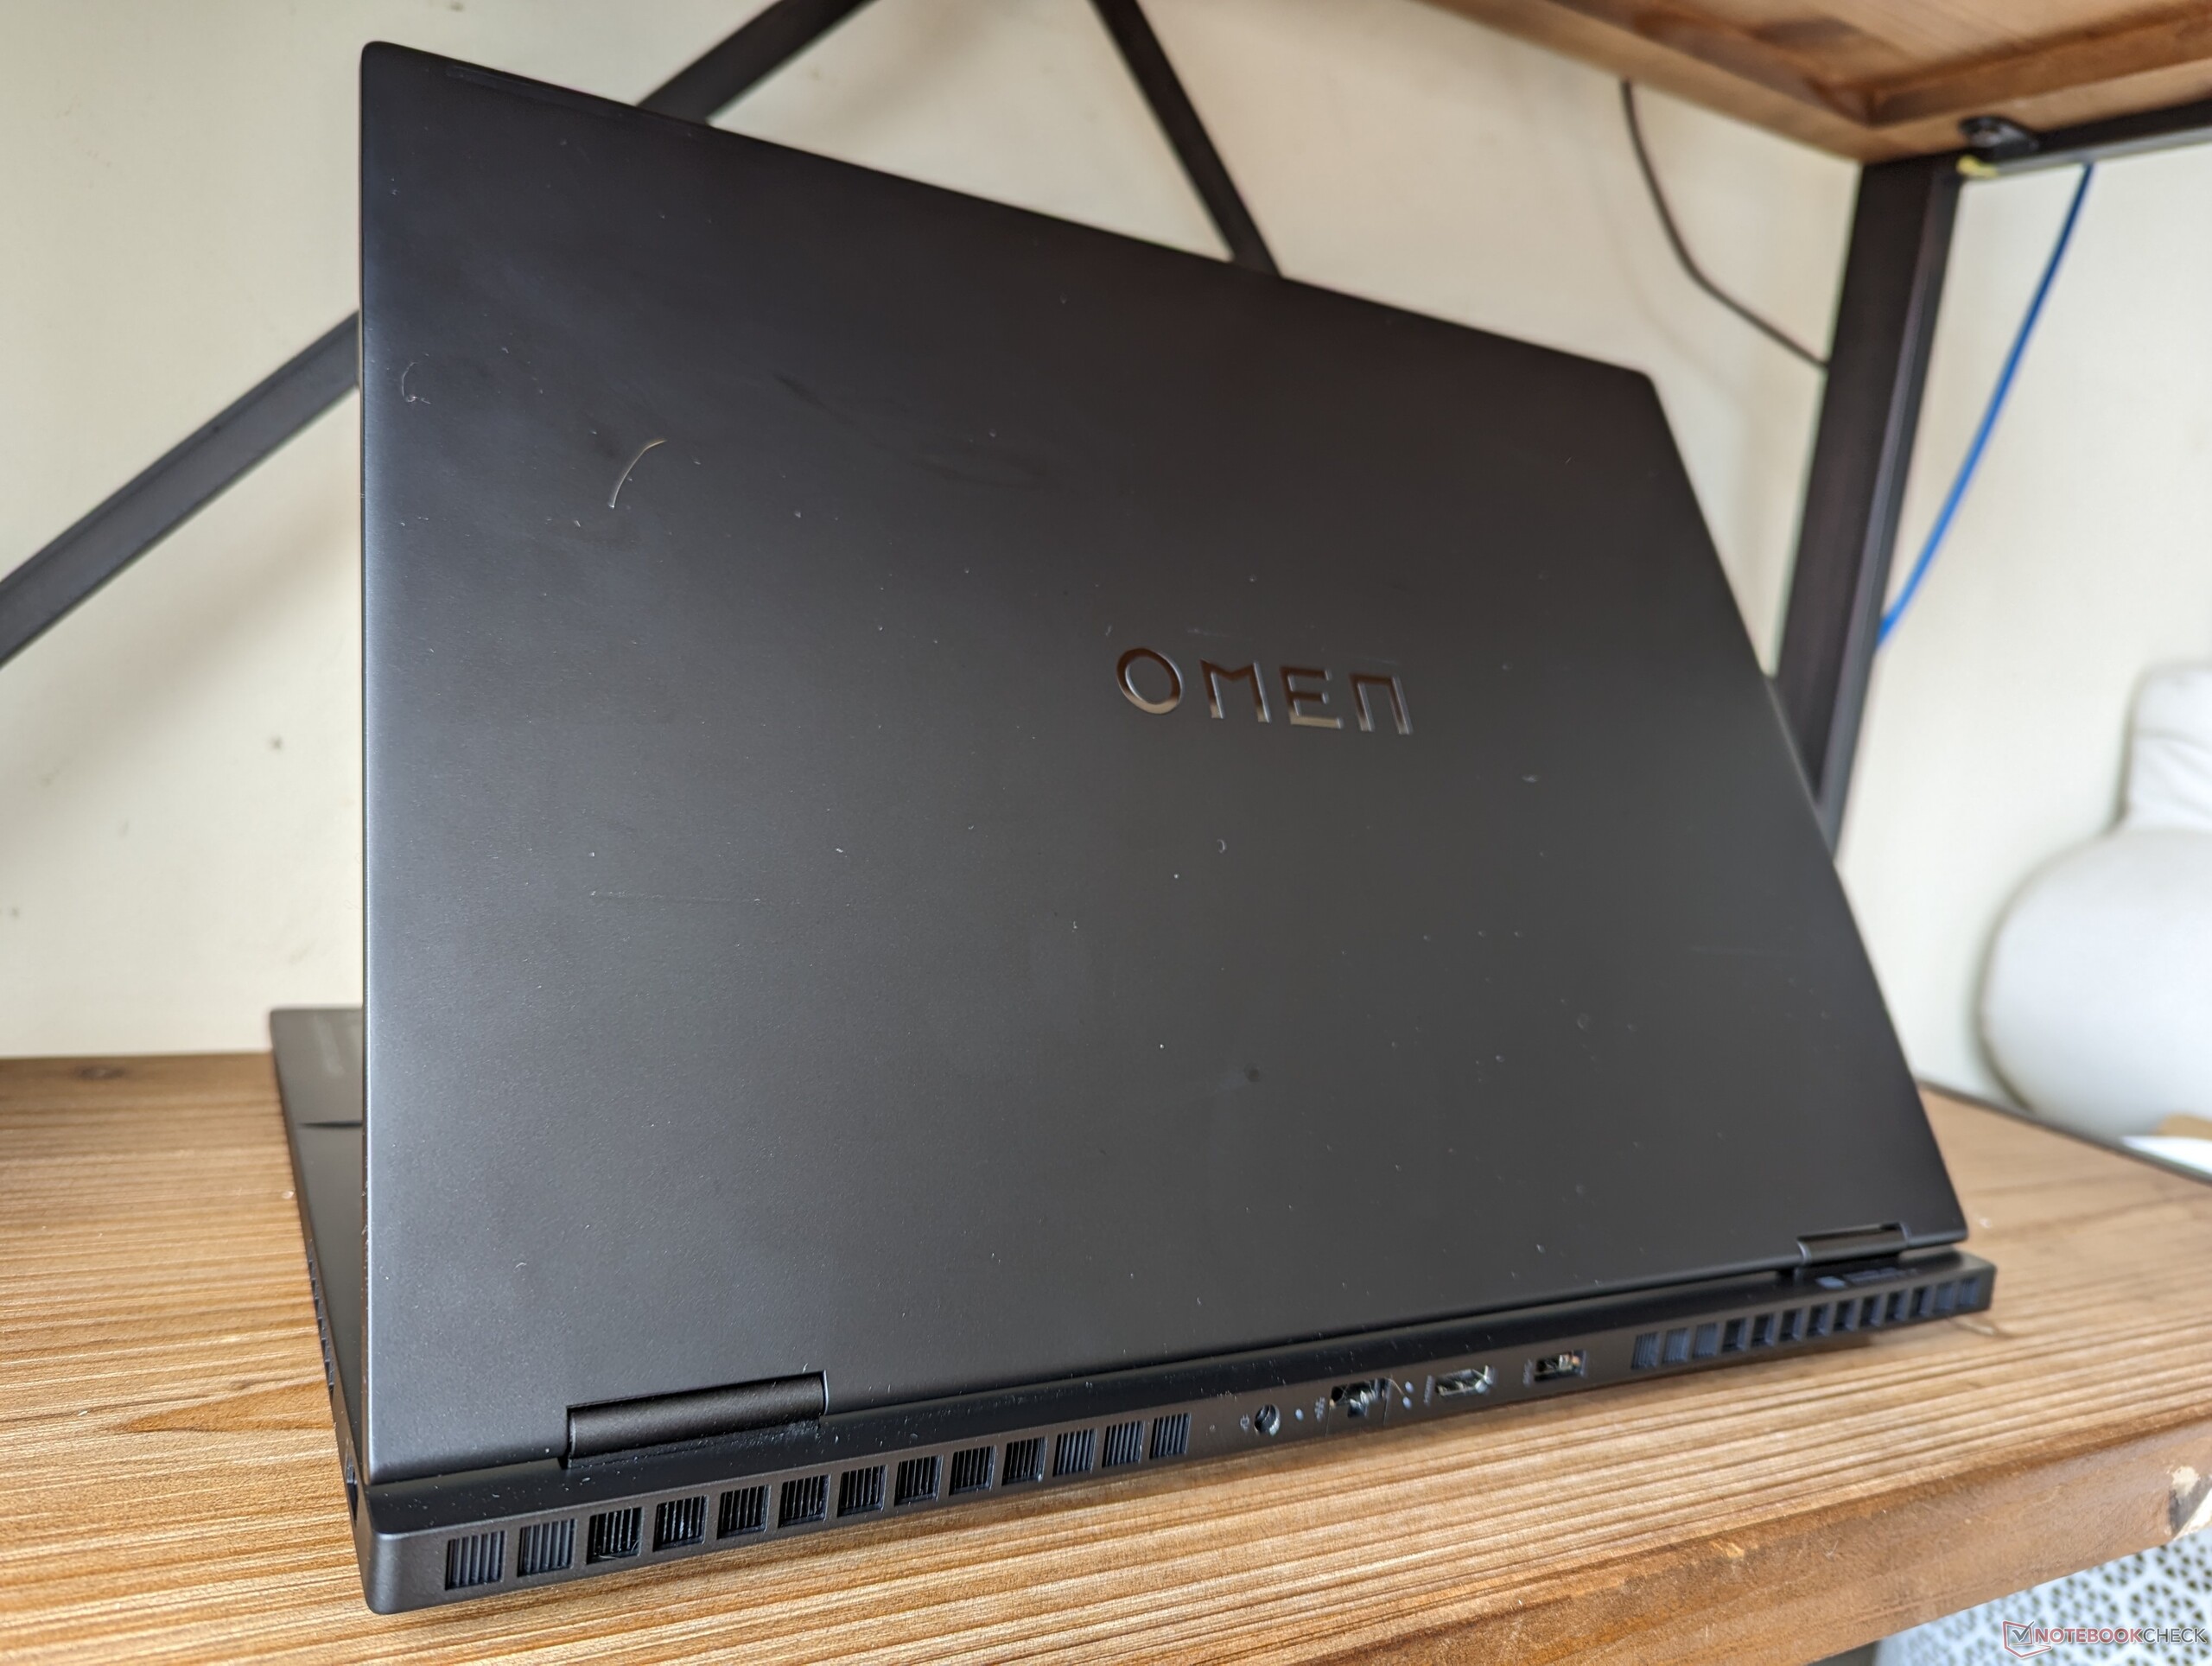
El nuevo formato 16:10 hace que el Omen Transcend 16 sea más cuadrado que el Omen 16 normal, pero con un perfil más fino en casi 4 mm. Es un poco más ligero como resultado, pero todavía no es tan ligero como el Asus ROG Zephyrus M16 oLenovo Legion Slim 7i 16 G8.
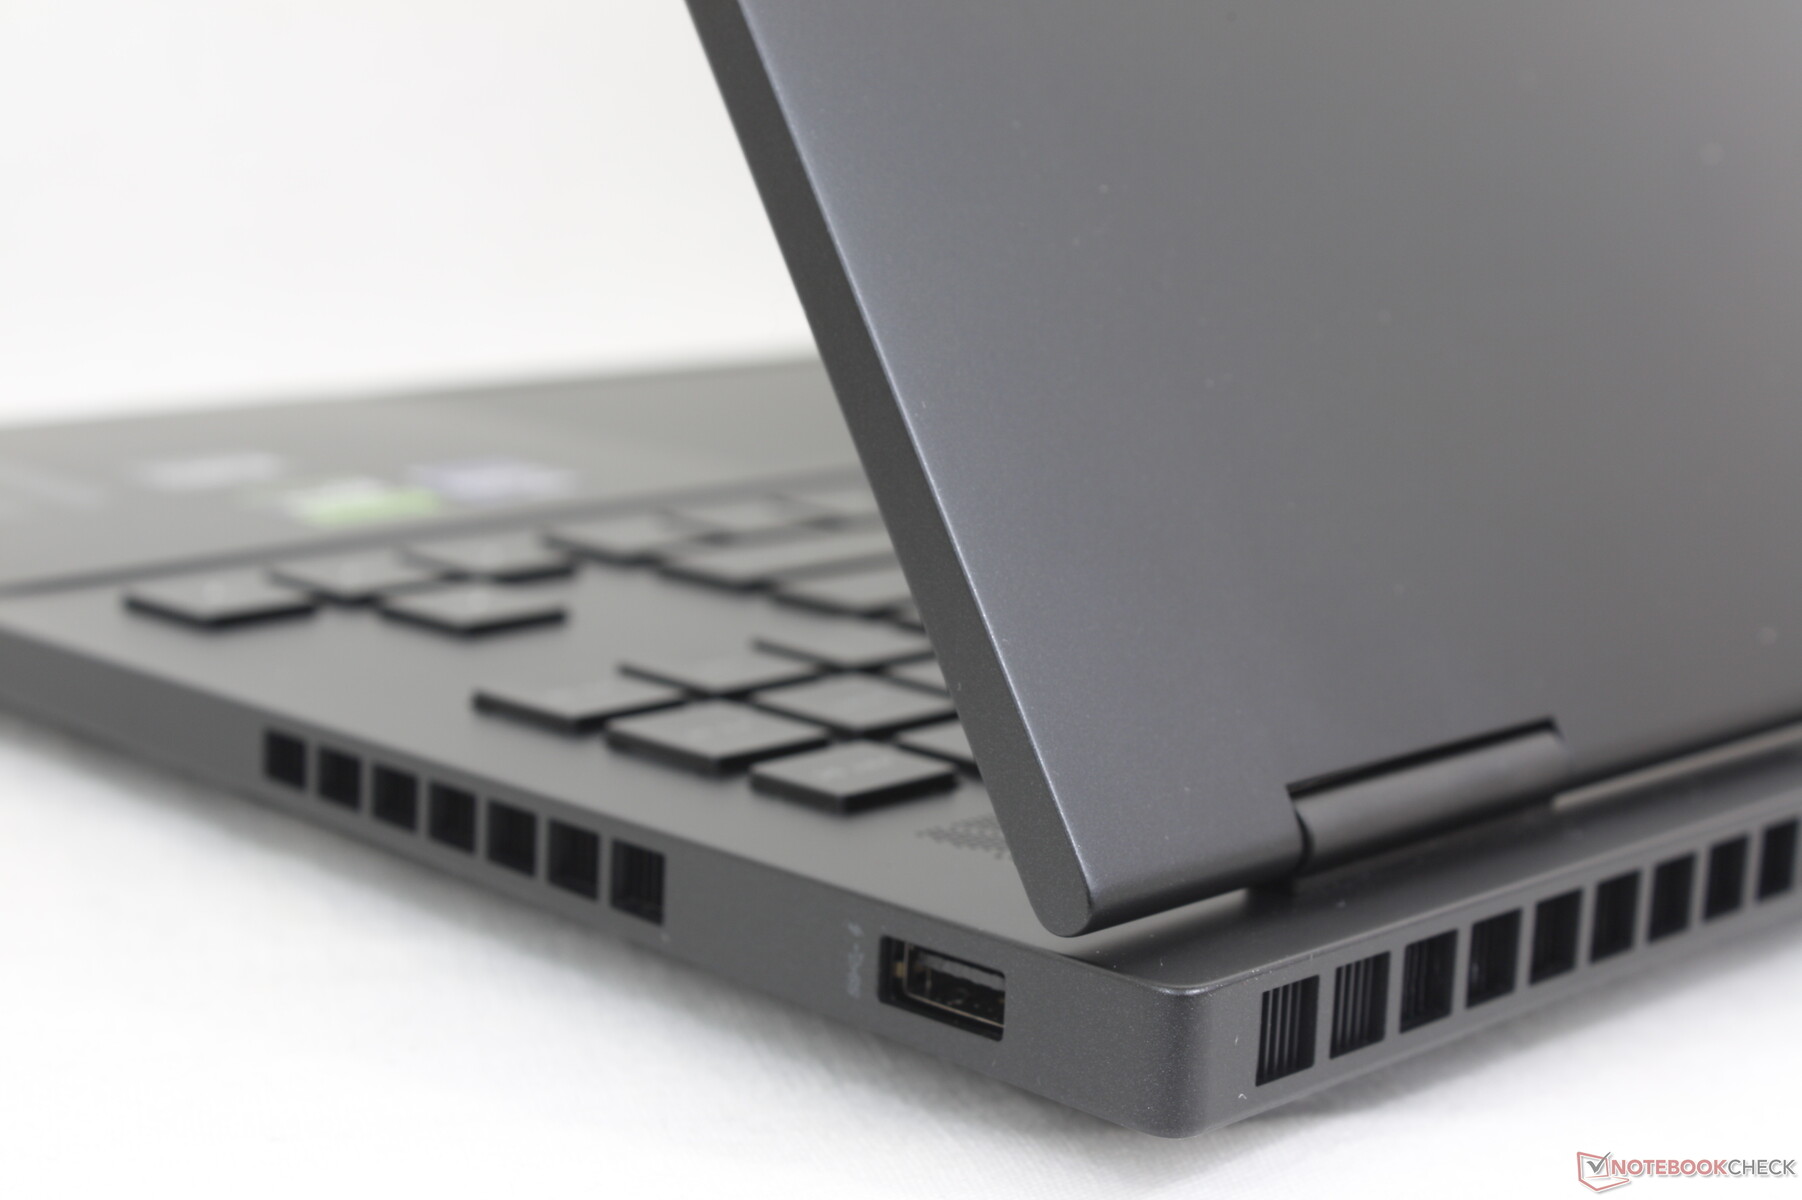
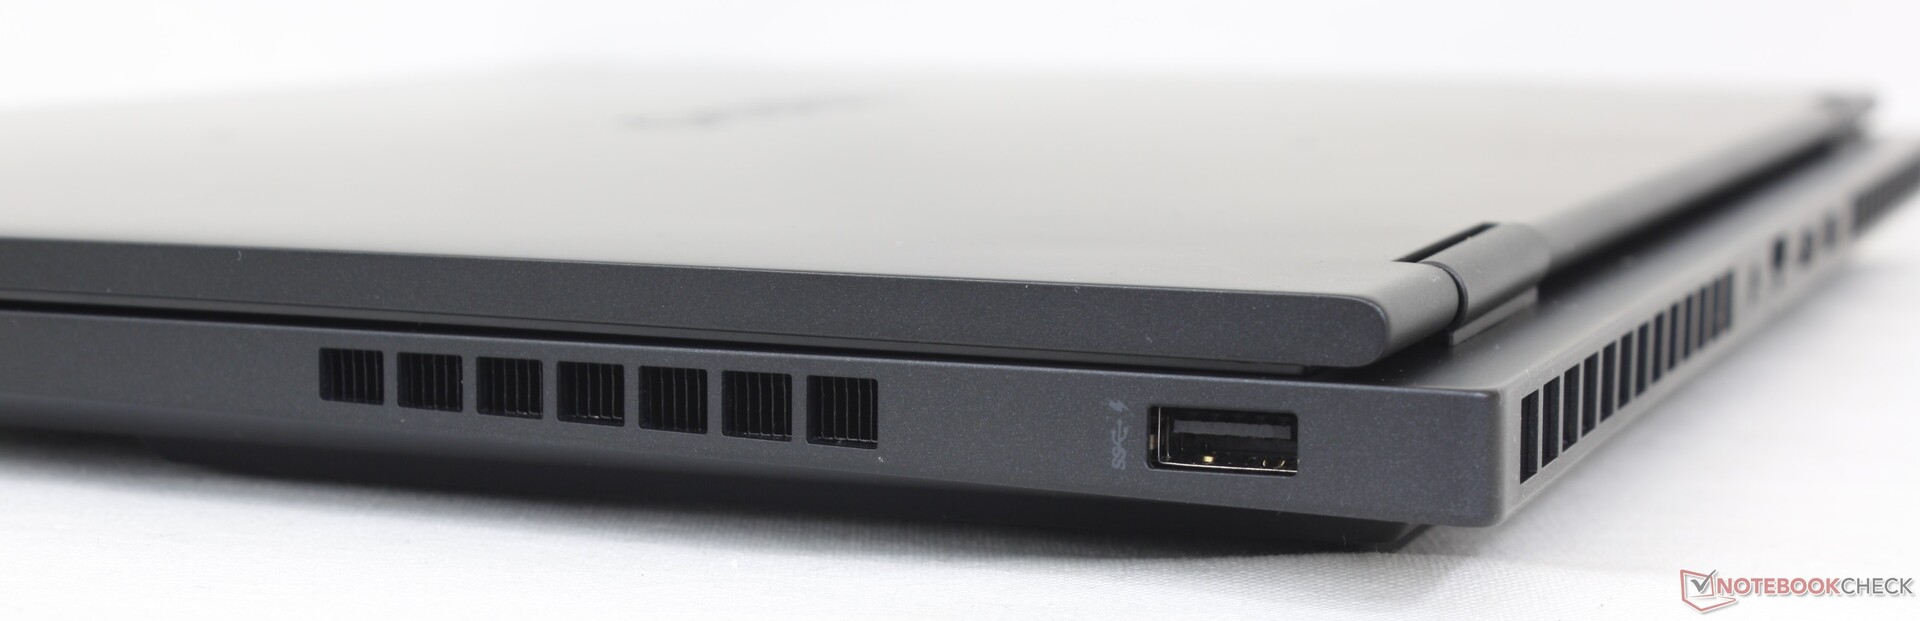
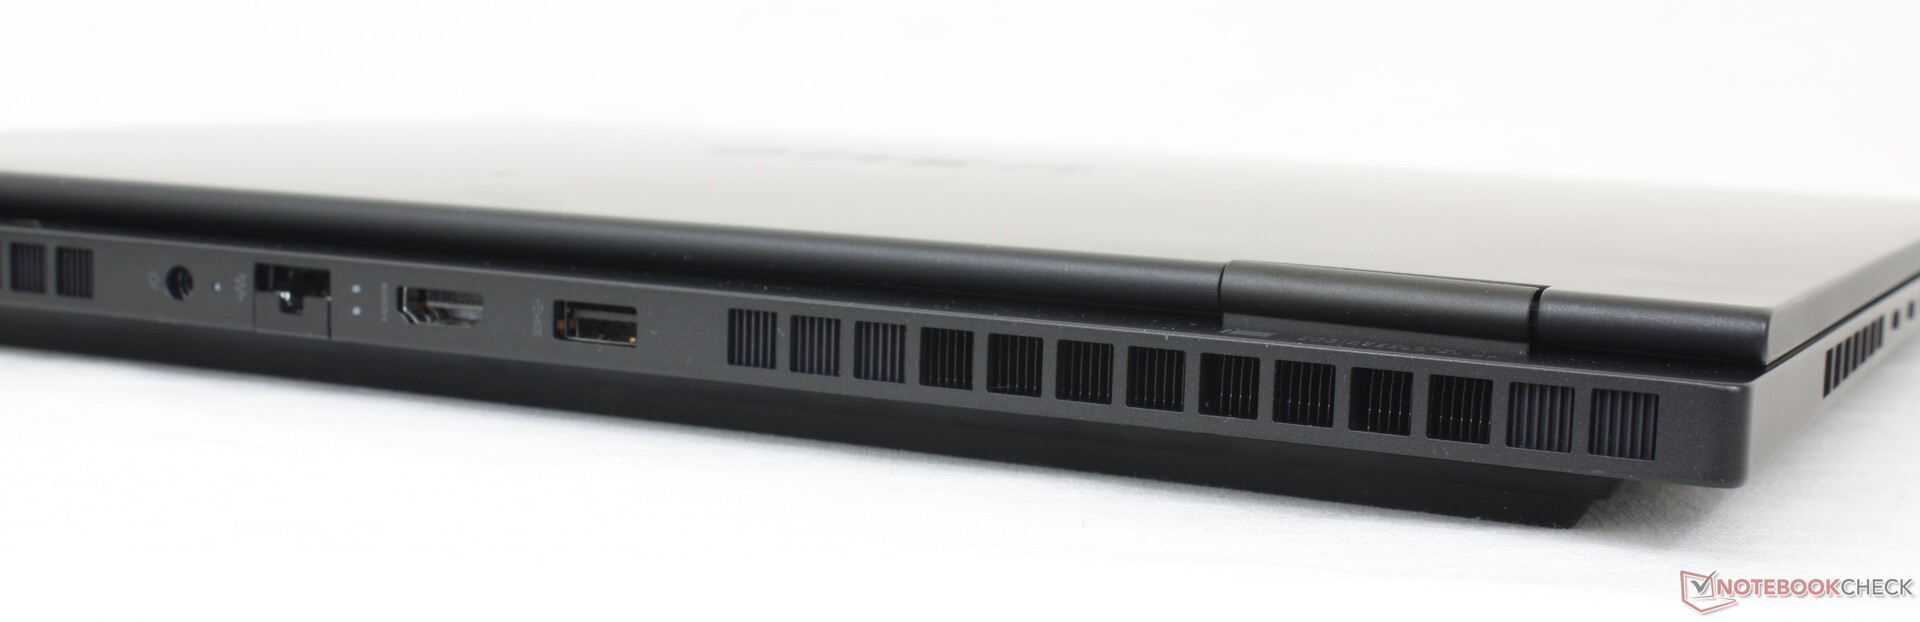
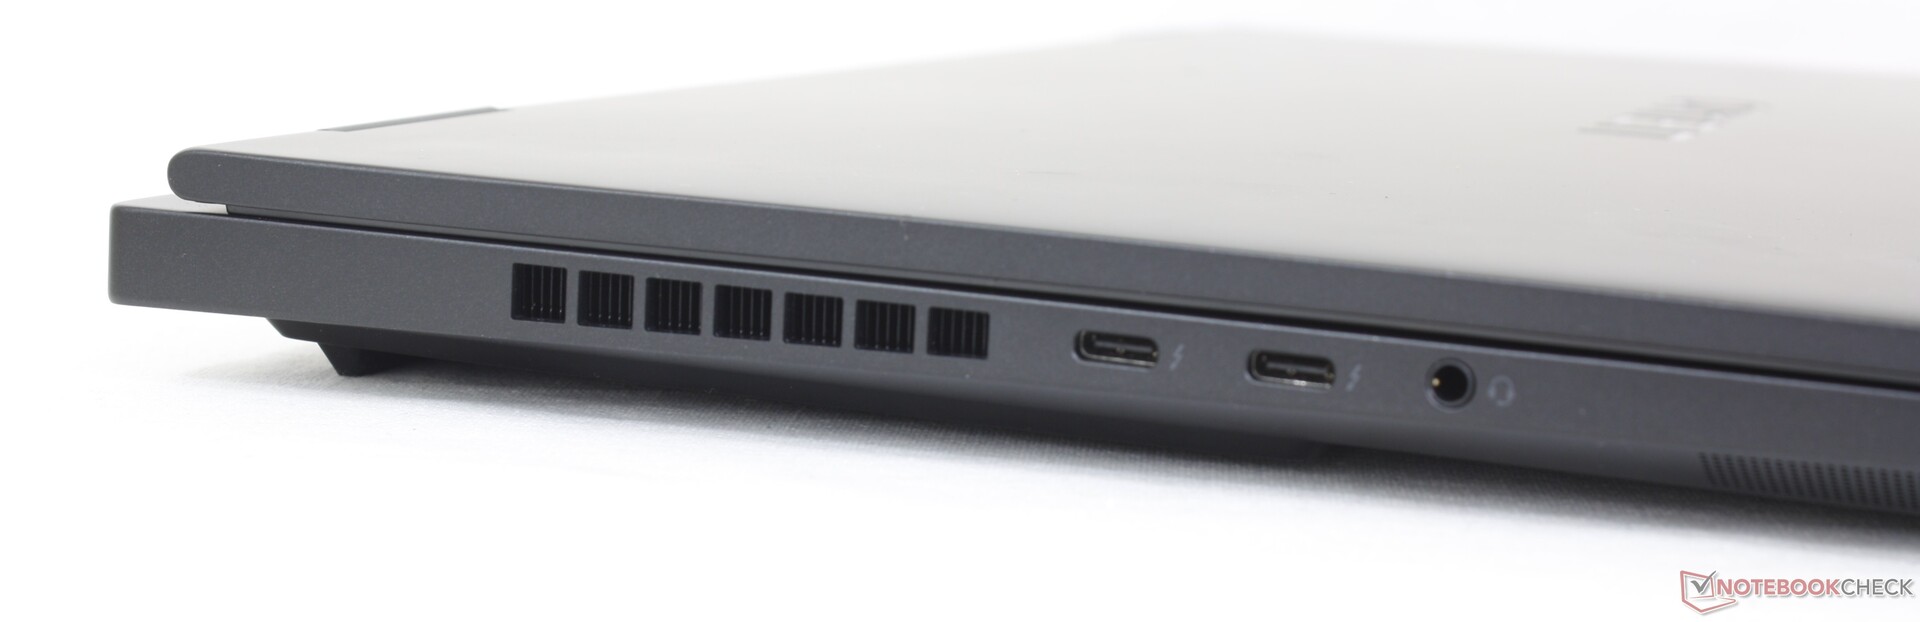
Conectividad
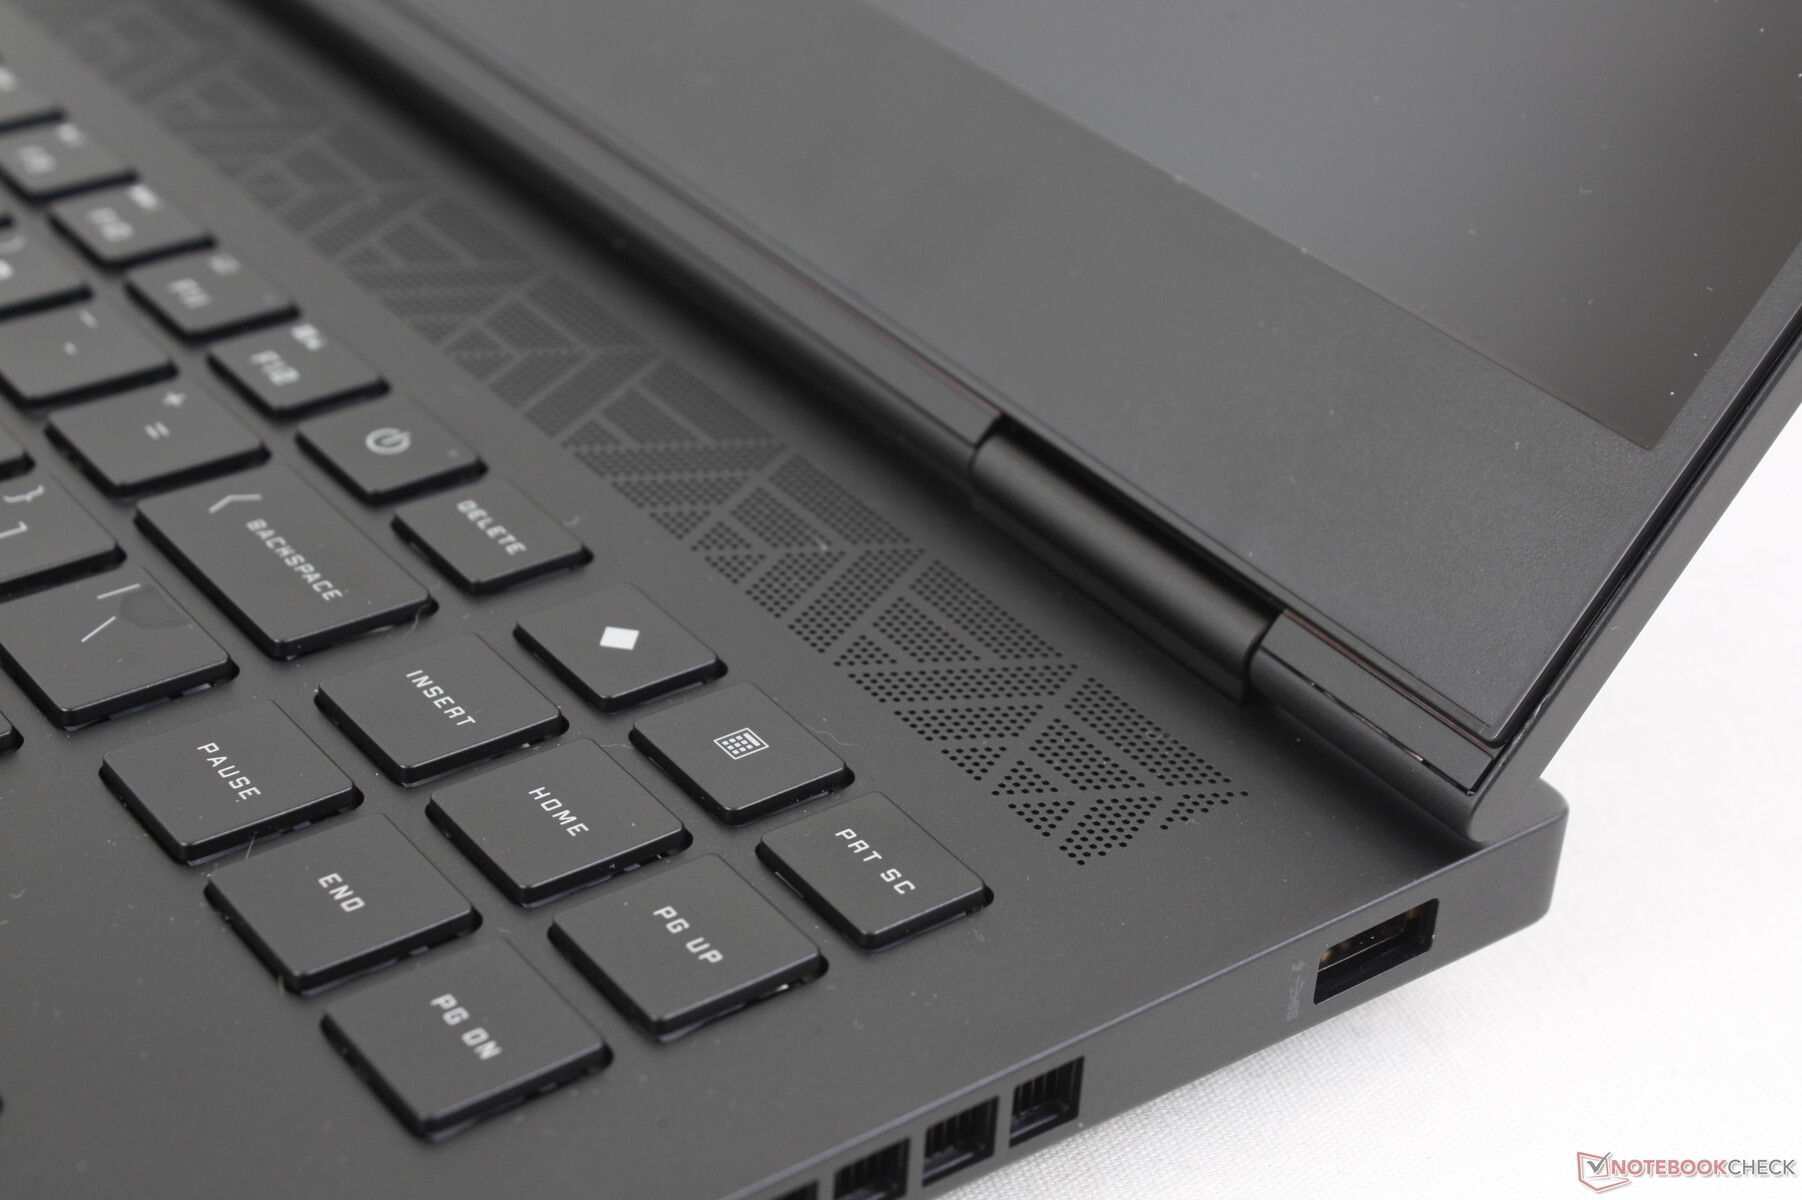
Las opciones de puerto siguen siendo idénticas a las del Omen 16 a pesar de los cambios físicos señalados anteriormente. No obstante, al menos habría estado bien ver una actualización de 1 Gbps RJ-45 a 2,5 Gbps.
Comunicación
Un Intel AX211 viene de serie para la conectividad Wi-Fi 6E y Bluetooth 5.3. Experimentamos velocidades de transferencia constantes y fiables cuando lo emparejamos con nuestra red Asus AXE11000 de 6 GHz.
Cámara web
Se incluye IR para el soporte de Hello, mientras que no está presente en el Omen 16 normal. Por lo demás, la webcam de 2 MP y el obturador de privacidad son iguales en los dos modelos Omen.


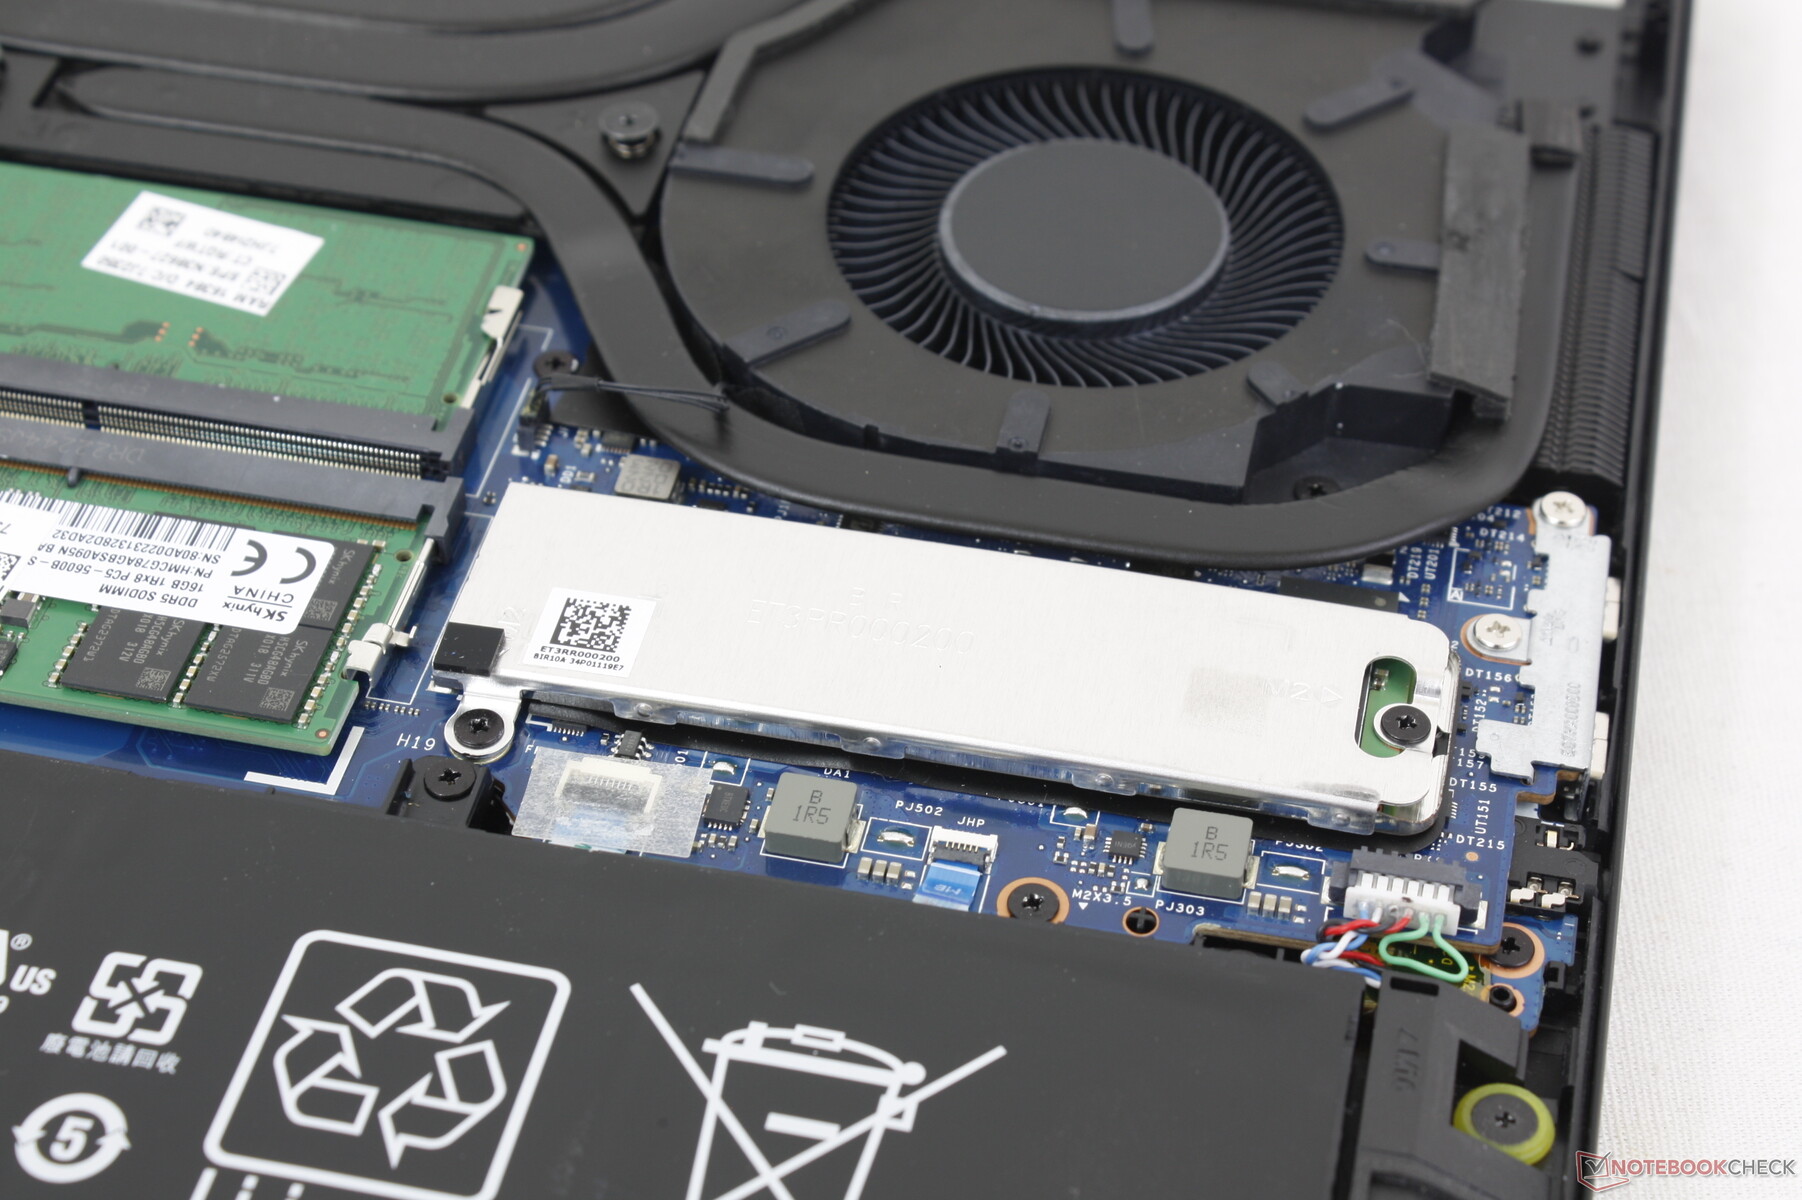
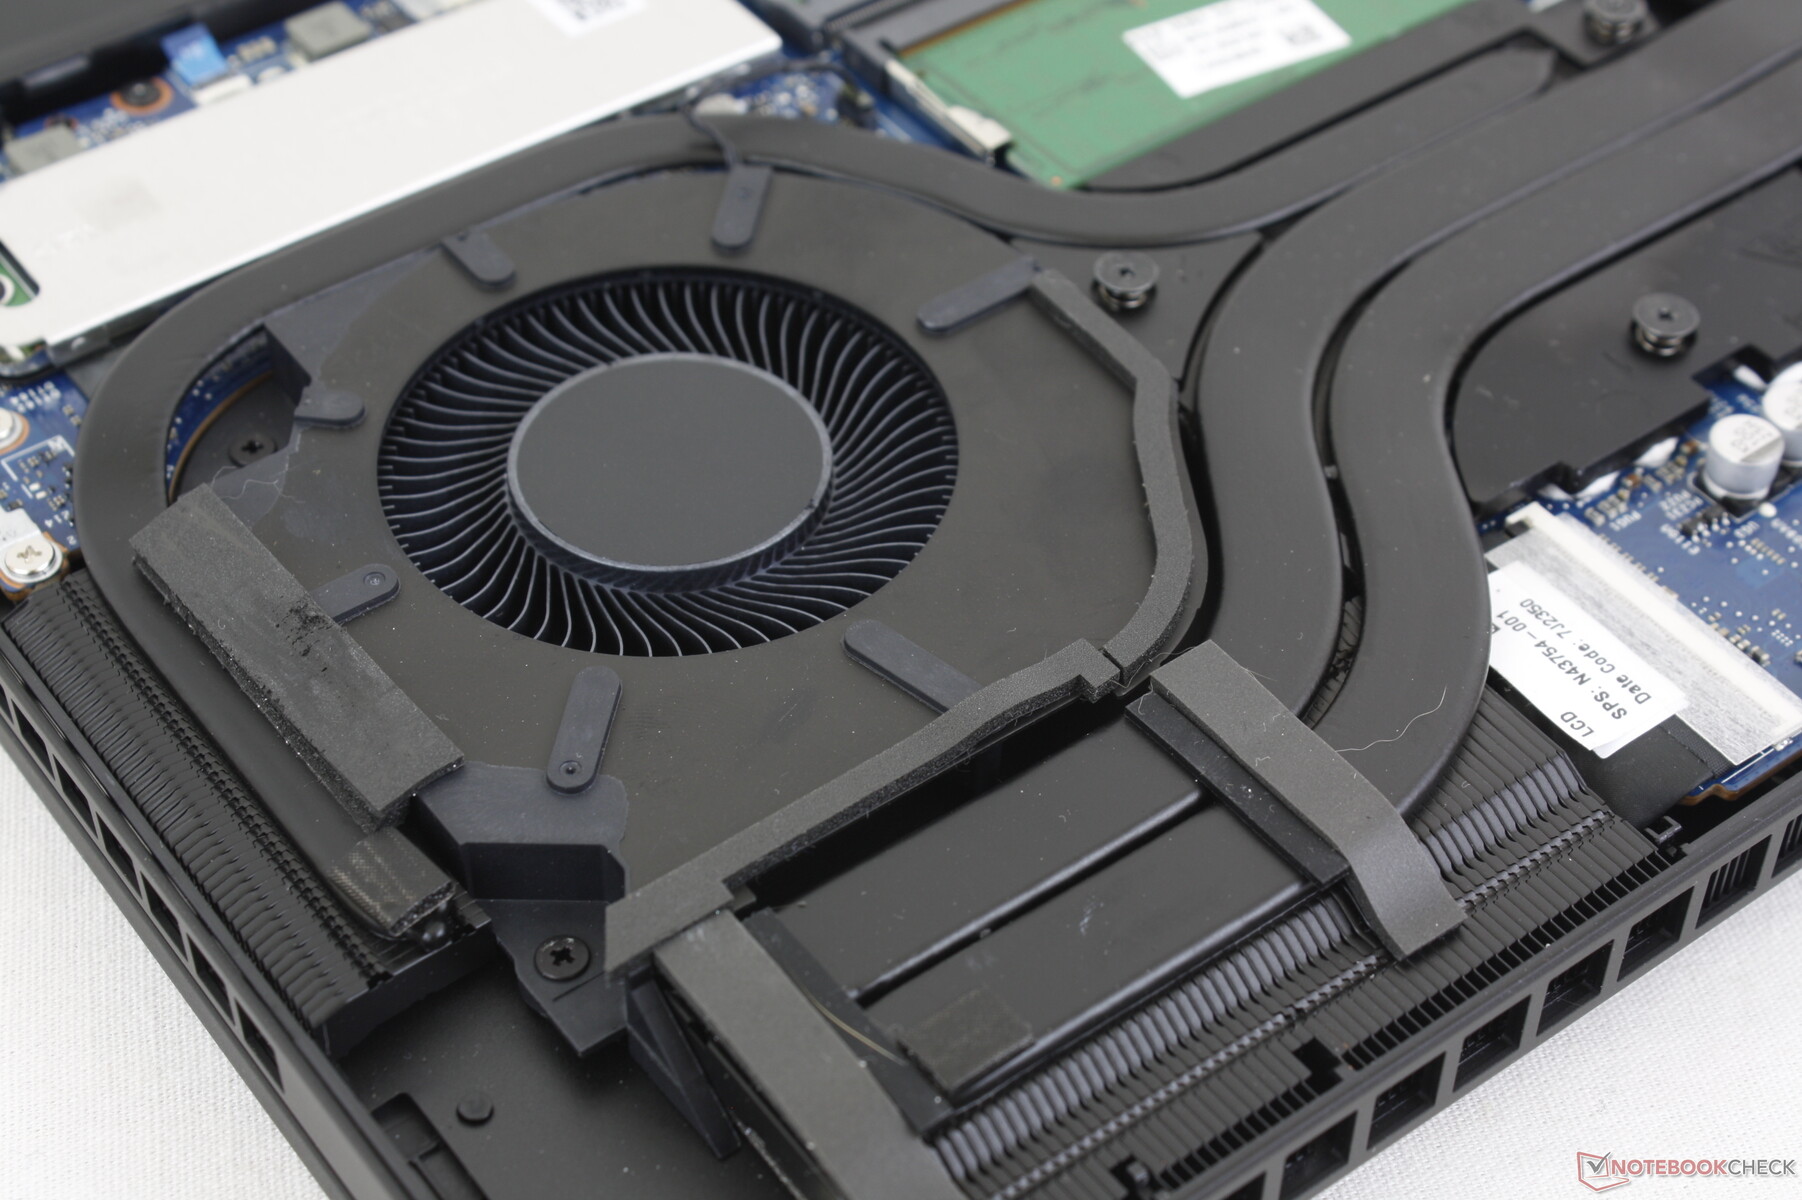
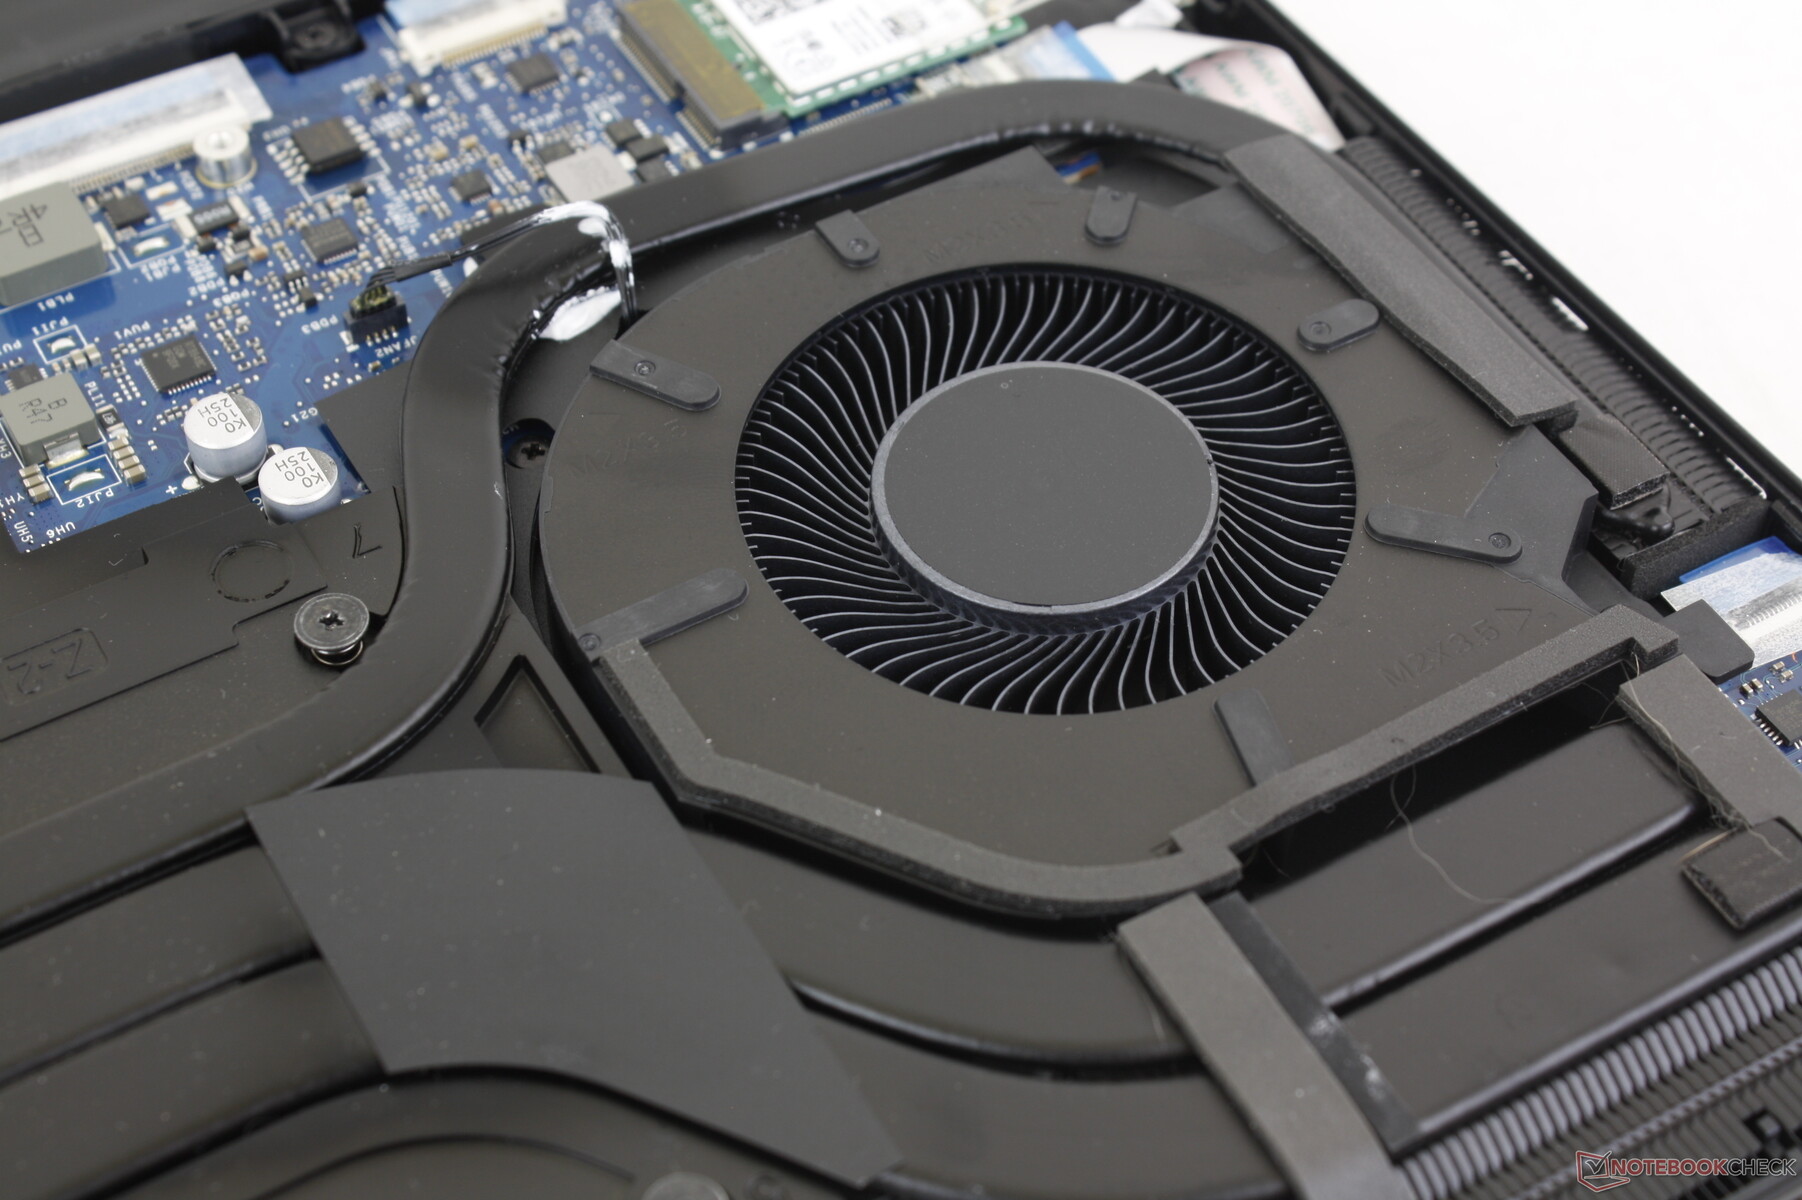
Mantenimiento
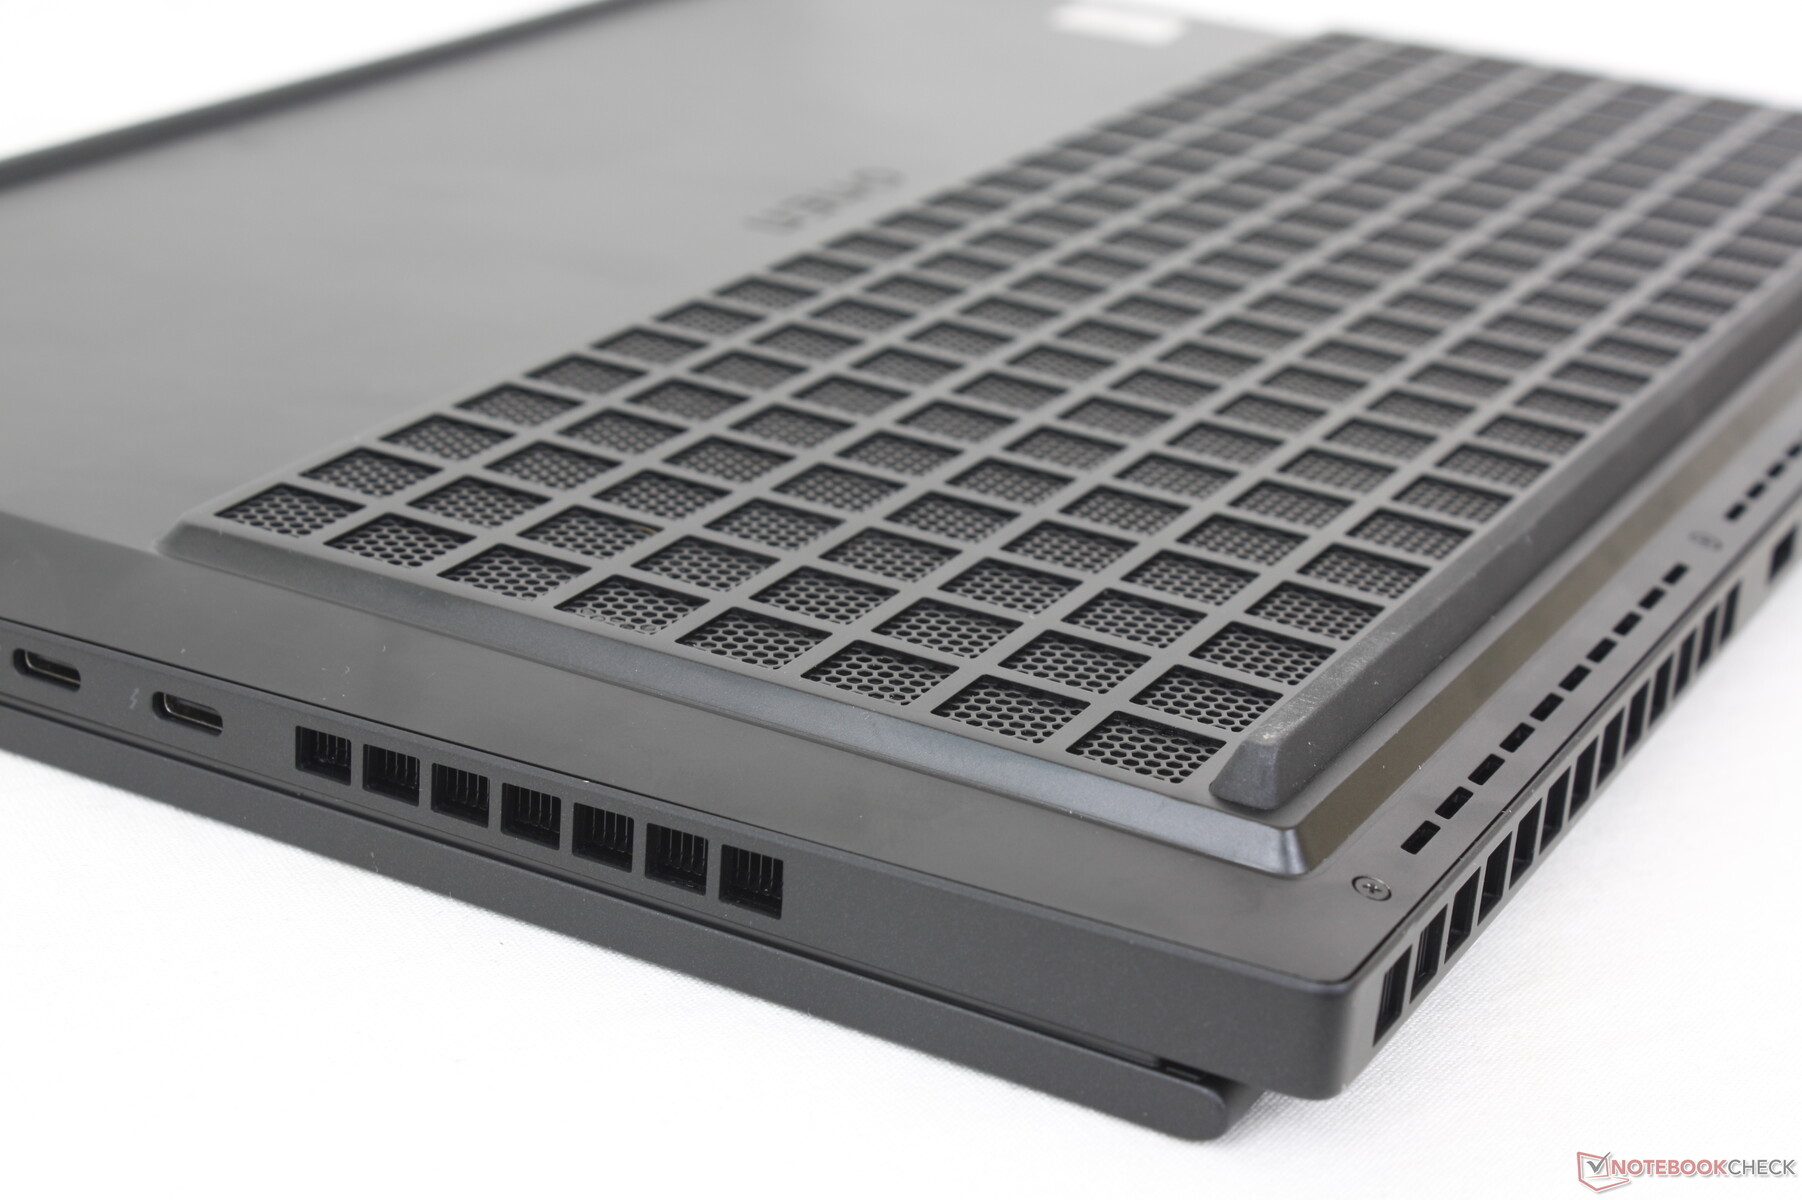
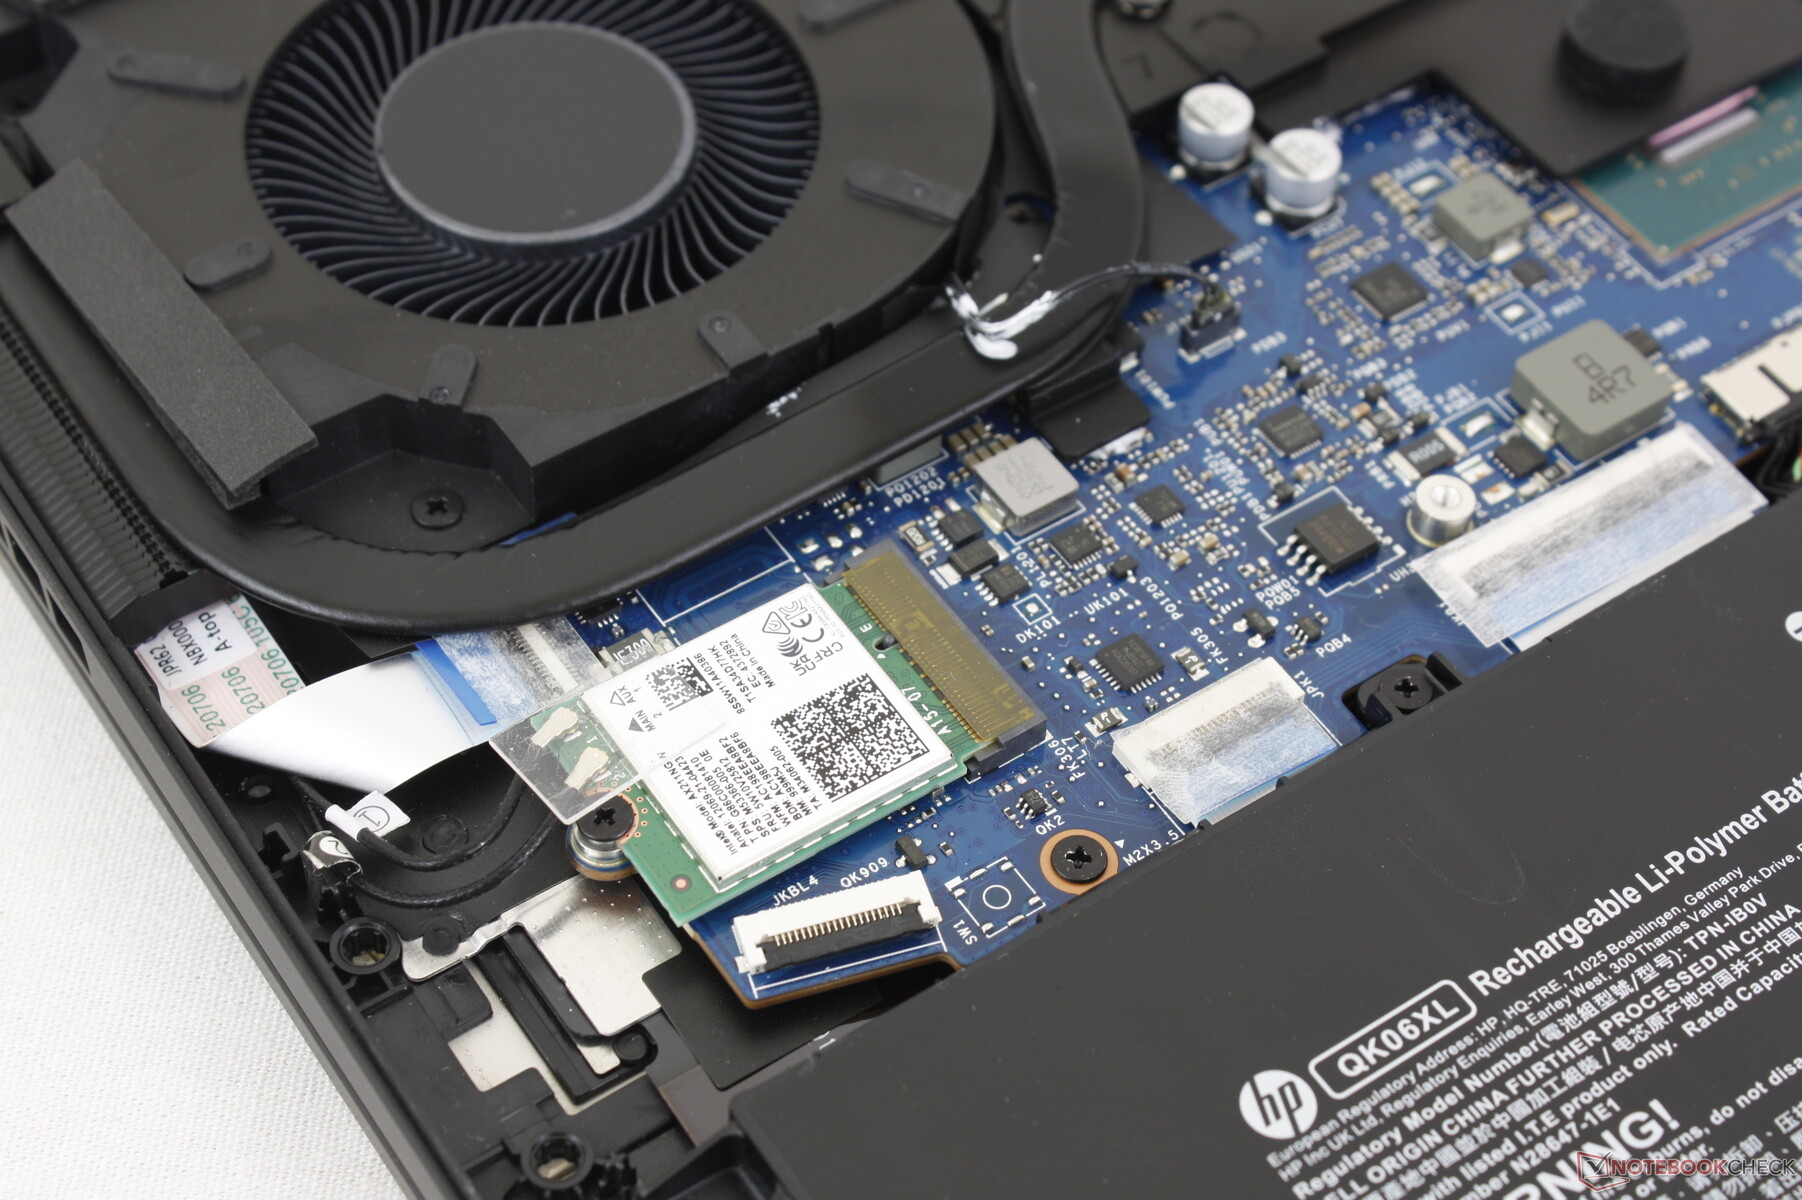
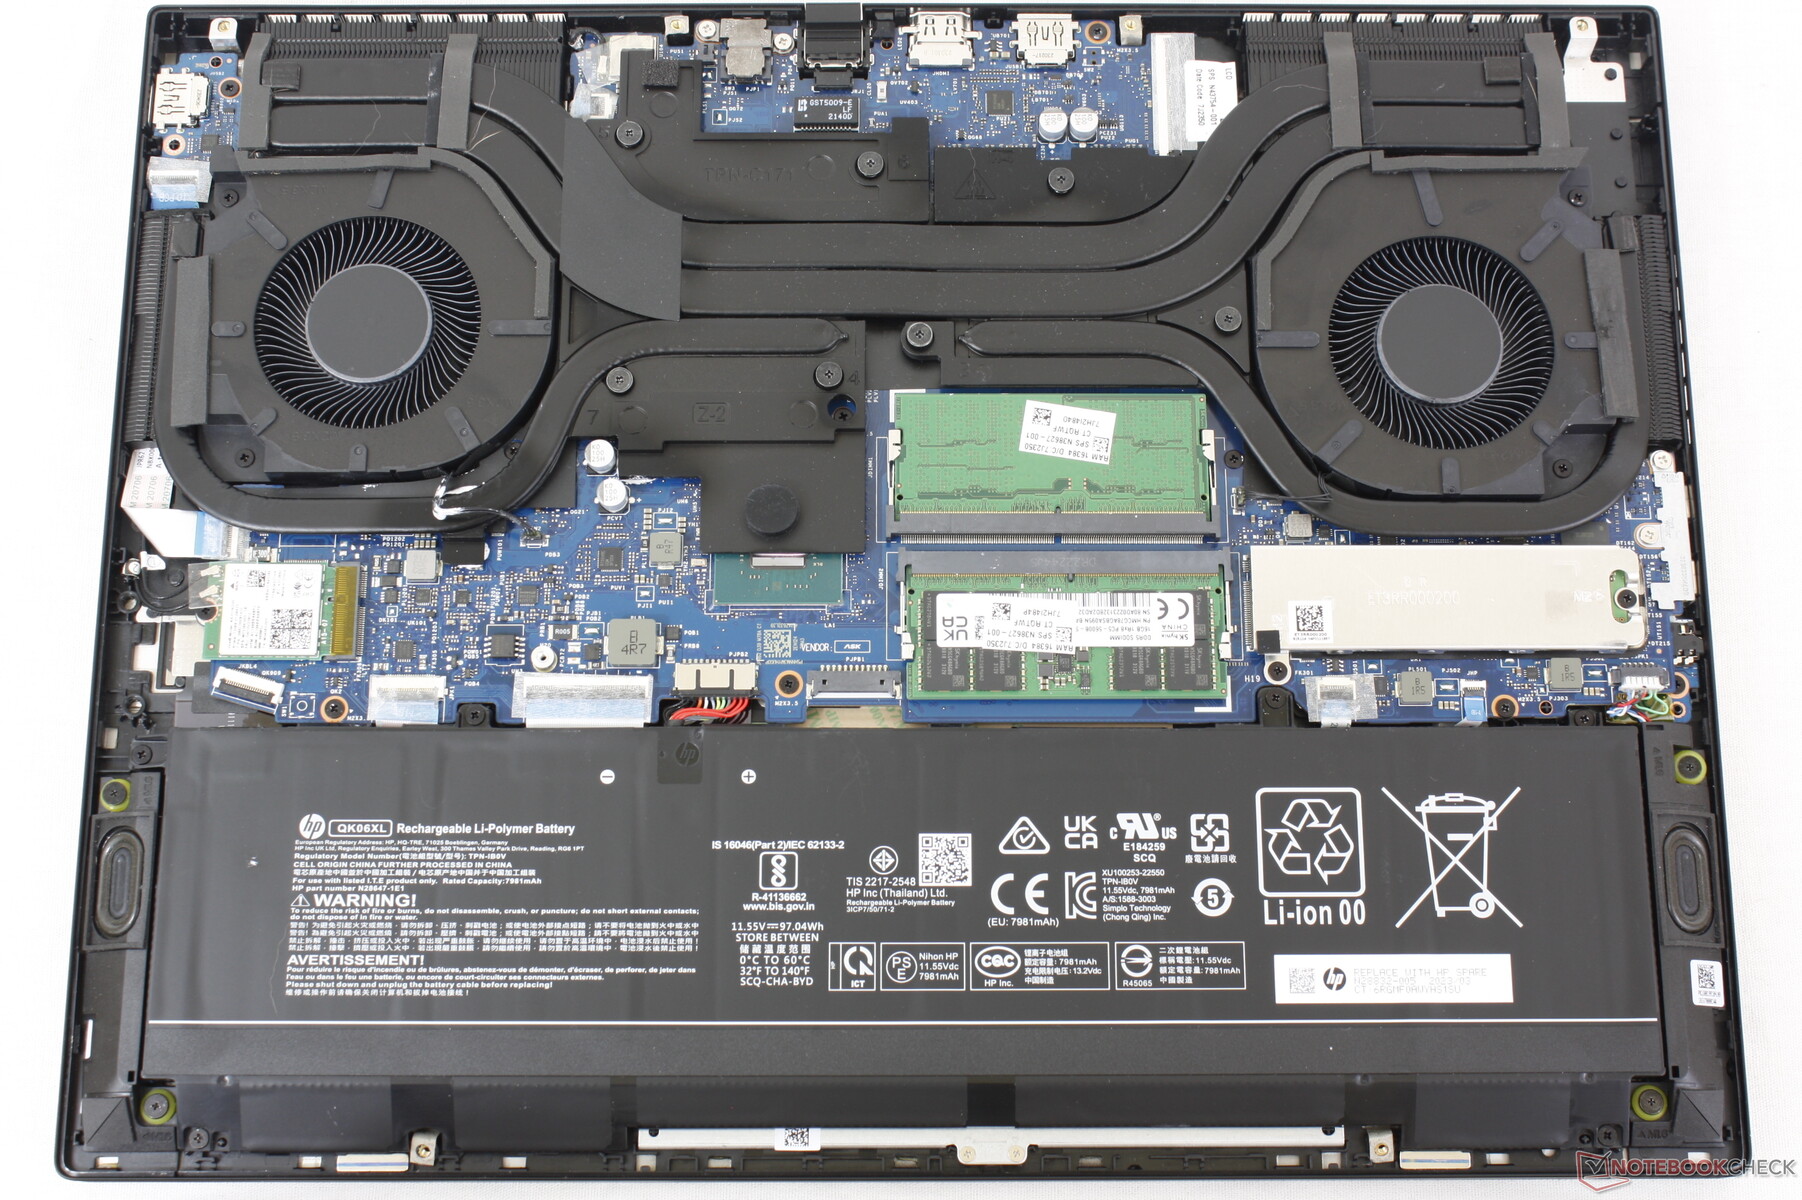
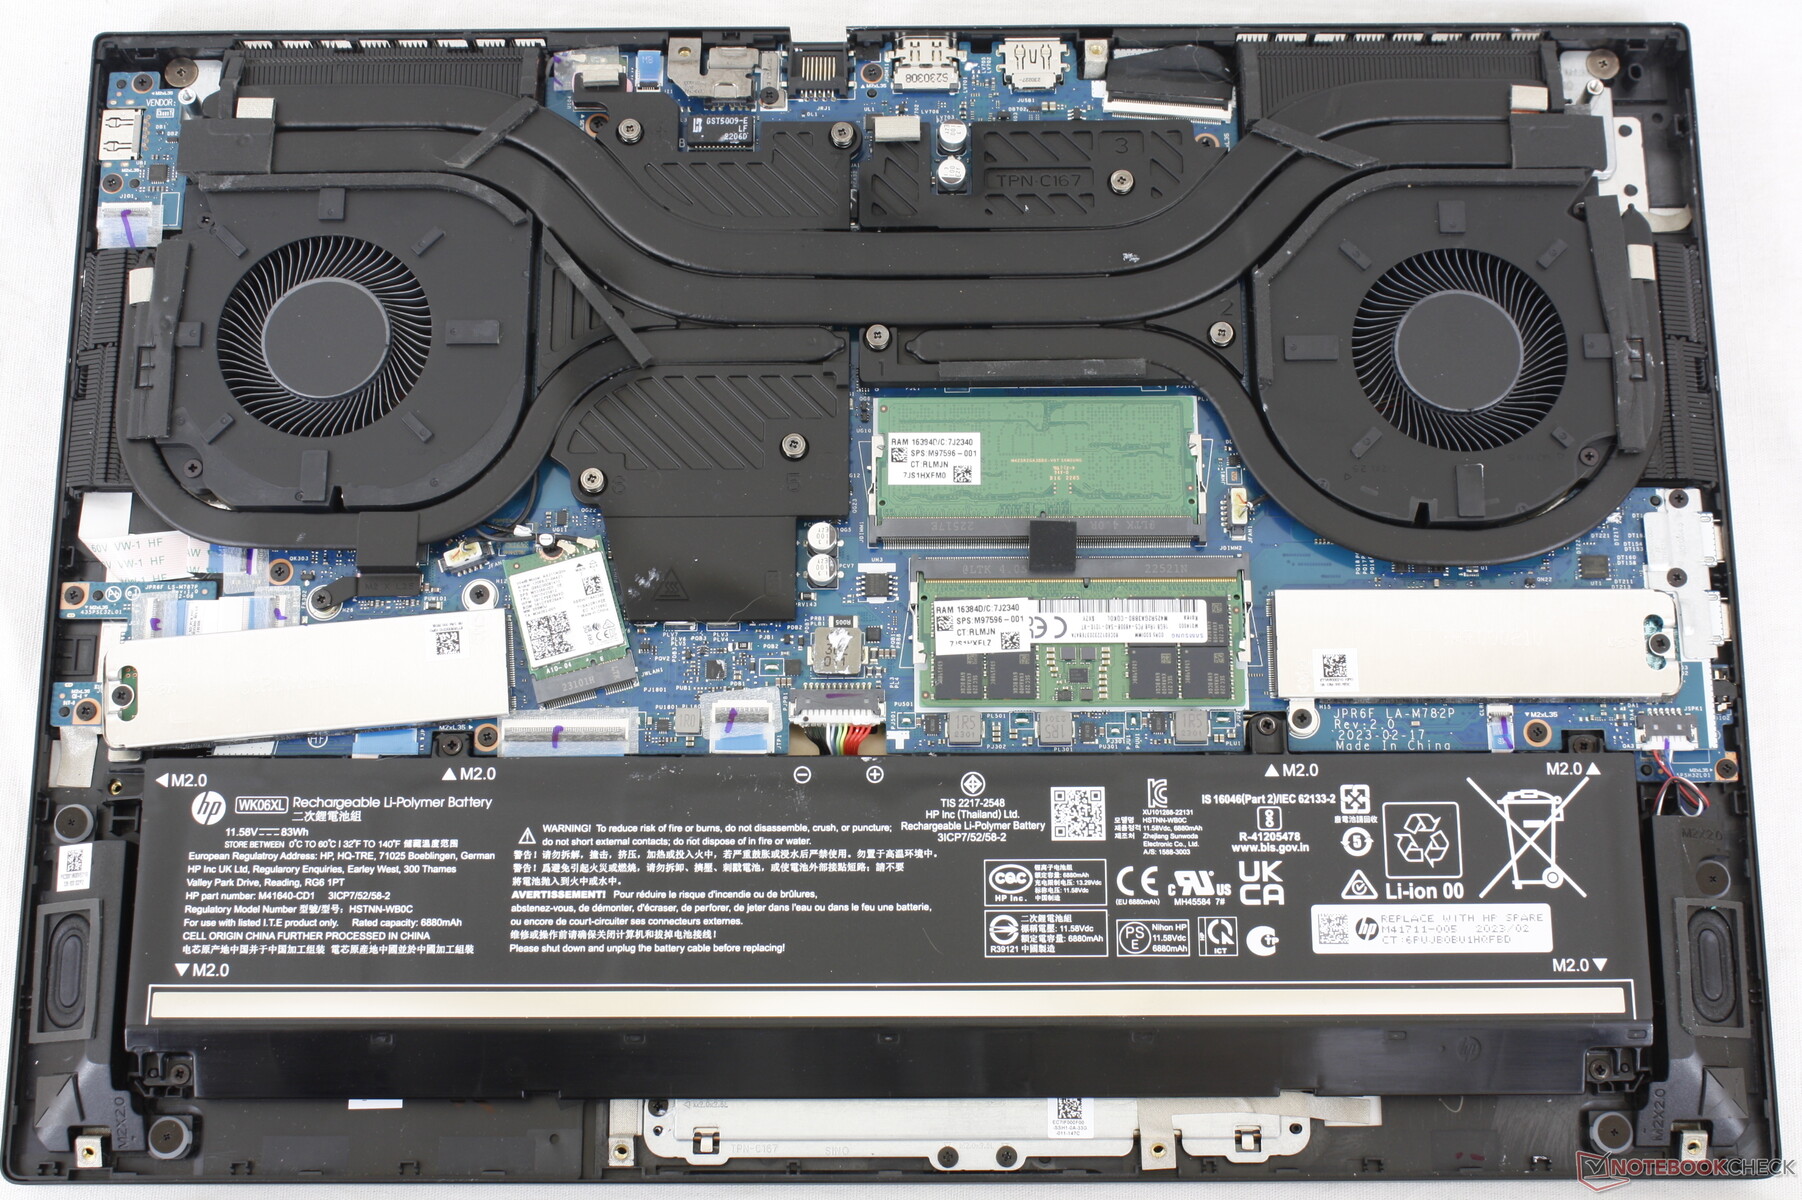
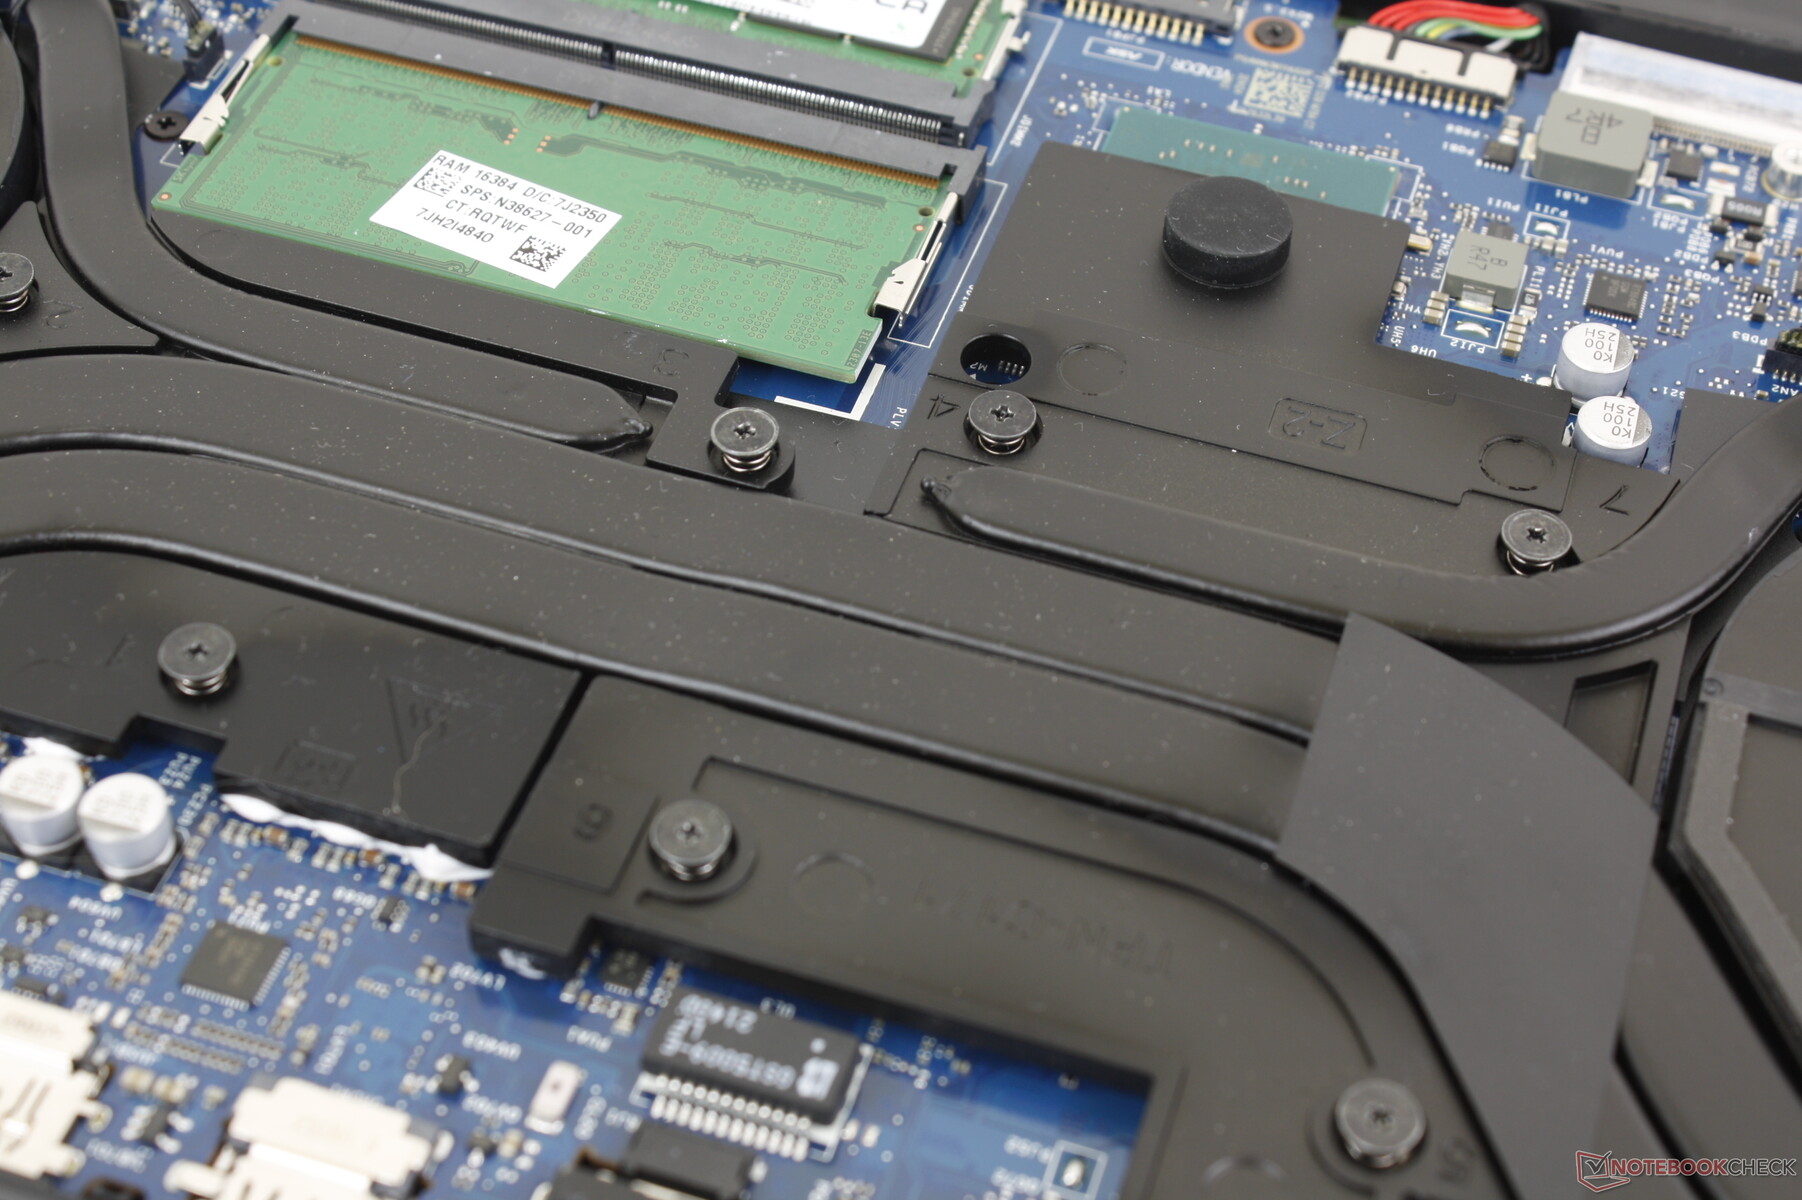
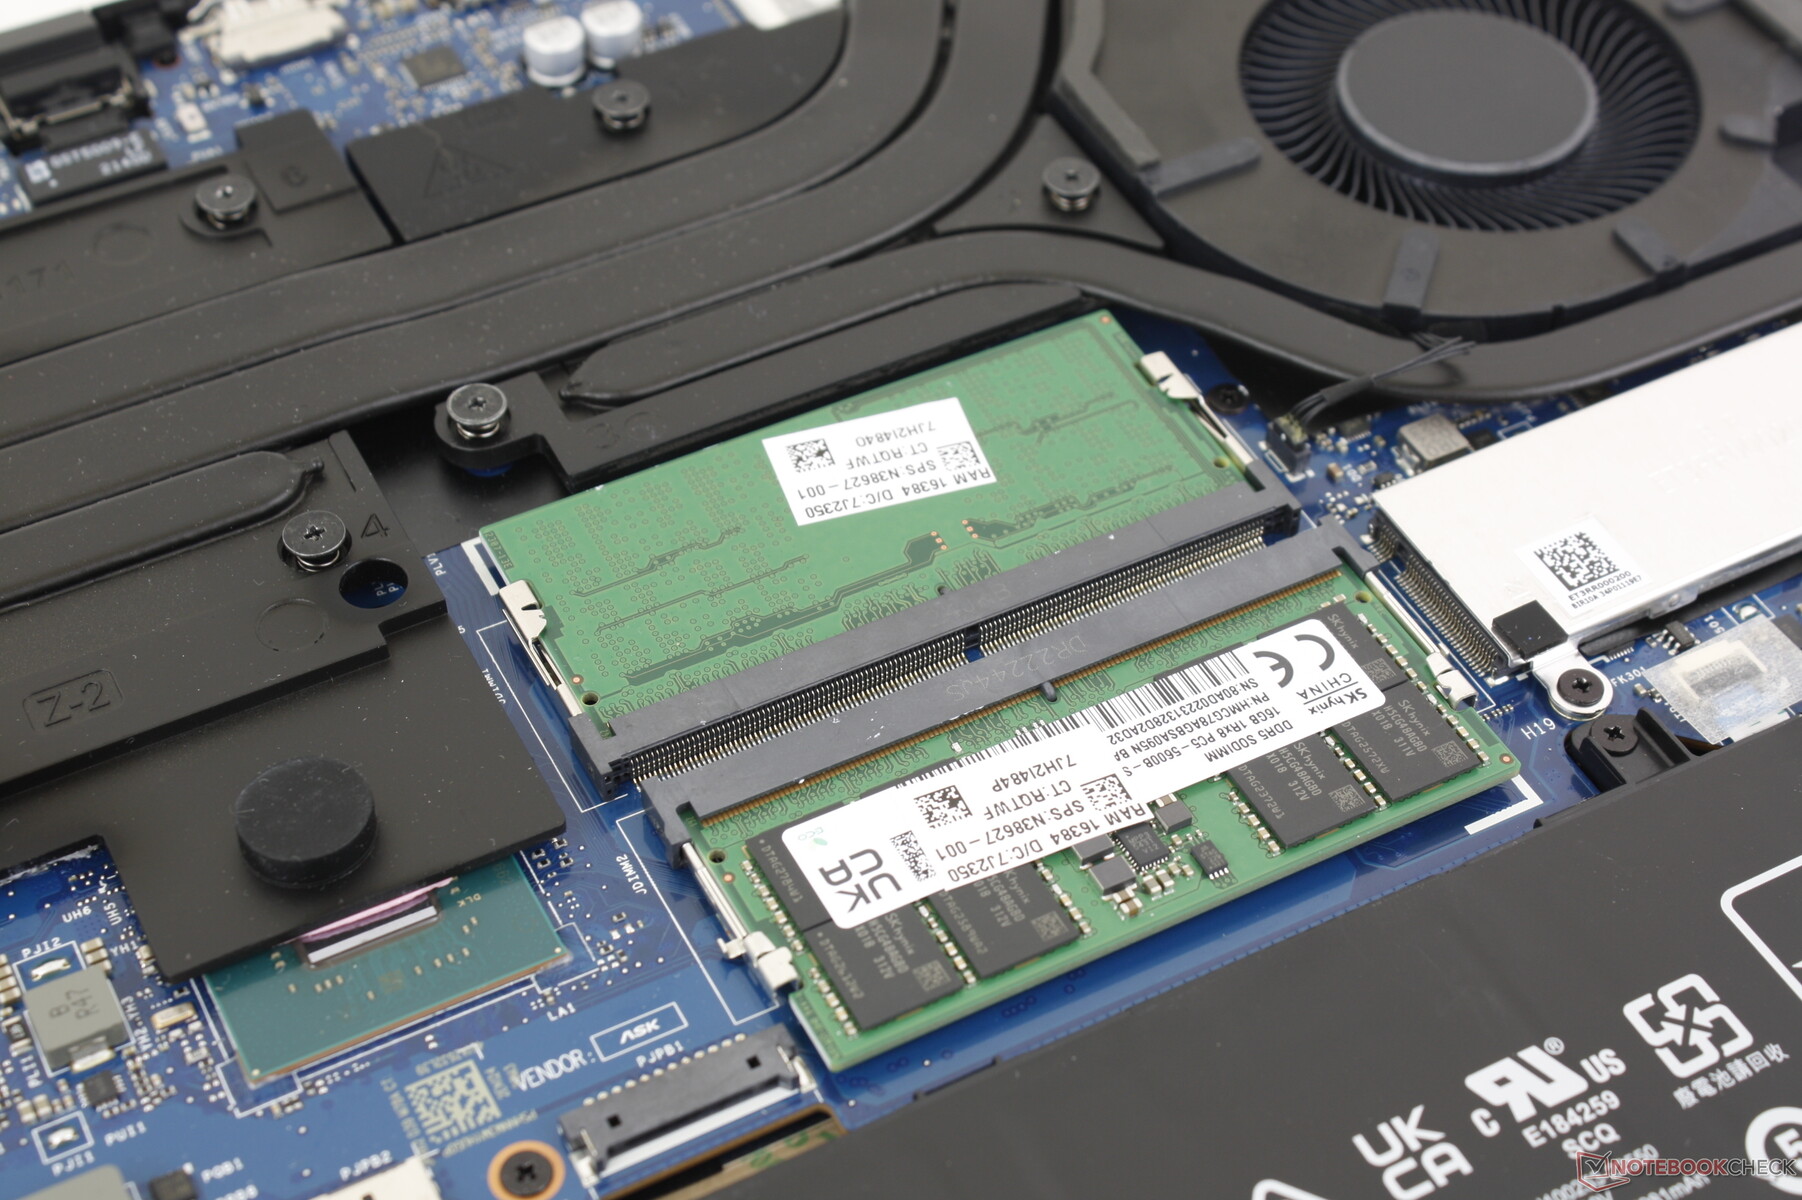
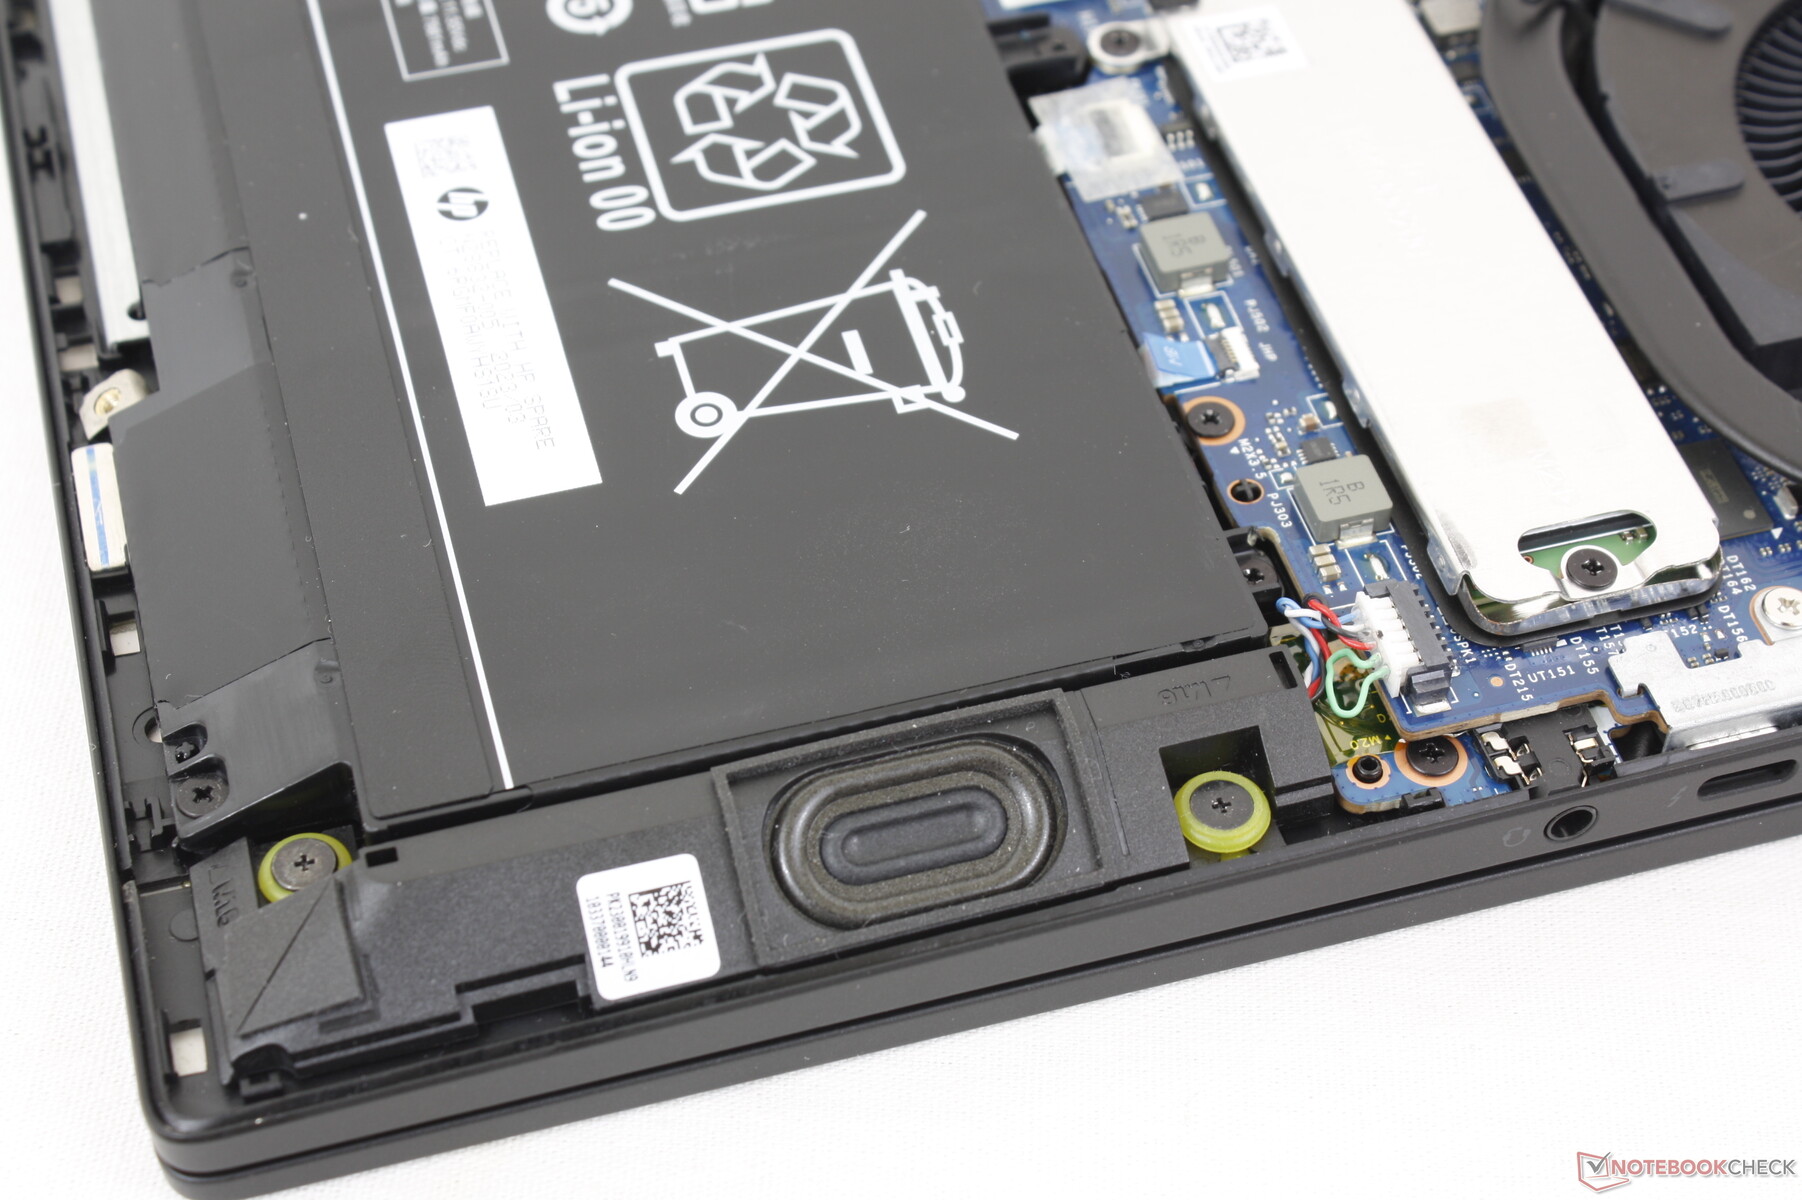
El panel inferior se sujeta con sólo seis tornillos Phillips para facilitar el acceso. Un cambio notable del Omen 16, sin embargo, es la eliminación de la segunda ranura M.2 SSD debido a la ranura M.2 WLAN reposicionada como se muestra en las imágenes de comparación a continuación. Por lo tanto, el Omen Transcend 16 sólo puede soportar hasta un SSD interno en lugar de dos. También se han realizado otros ajustes menores en los altavoces y la solución de refrigeración.
Accesorios y garantía
Algunas configuraciones incluyen auriculares inalámbricos HyperX Cloud II Core gratuitos. Por lo demás, la caja solo incluye el adaptador de CA estándar y la documentación.
Se aplica la garantía estándar limitada de un año del fabricante.
Dispositivos de entrada: aspecto familiar de Omen
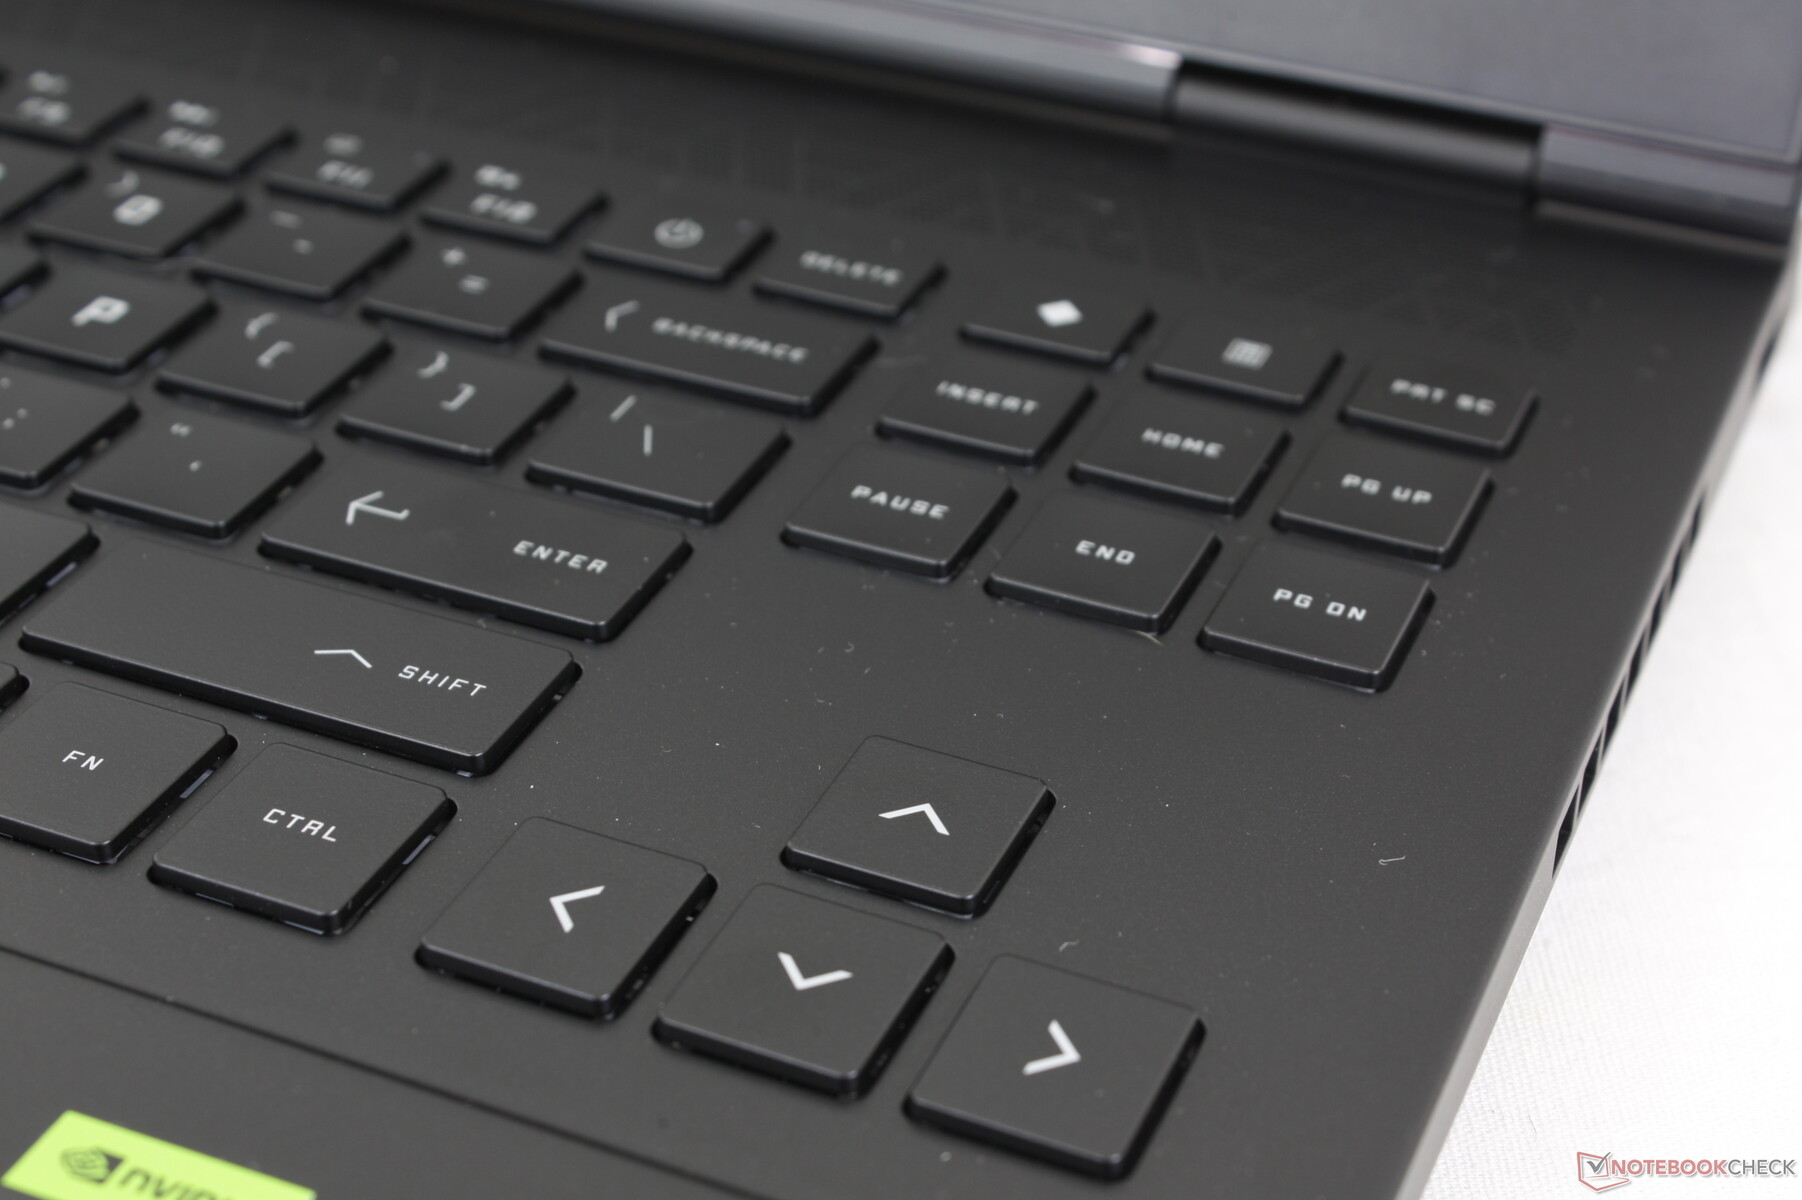
Teclado
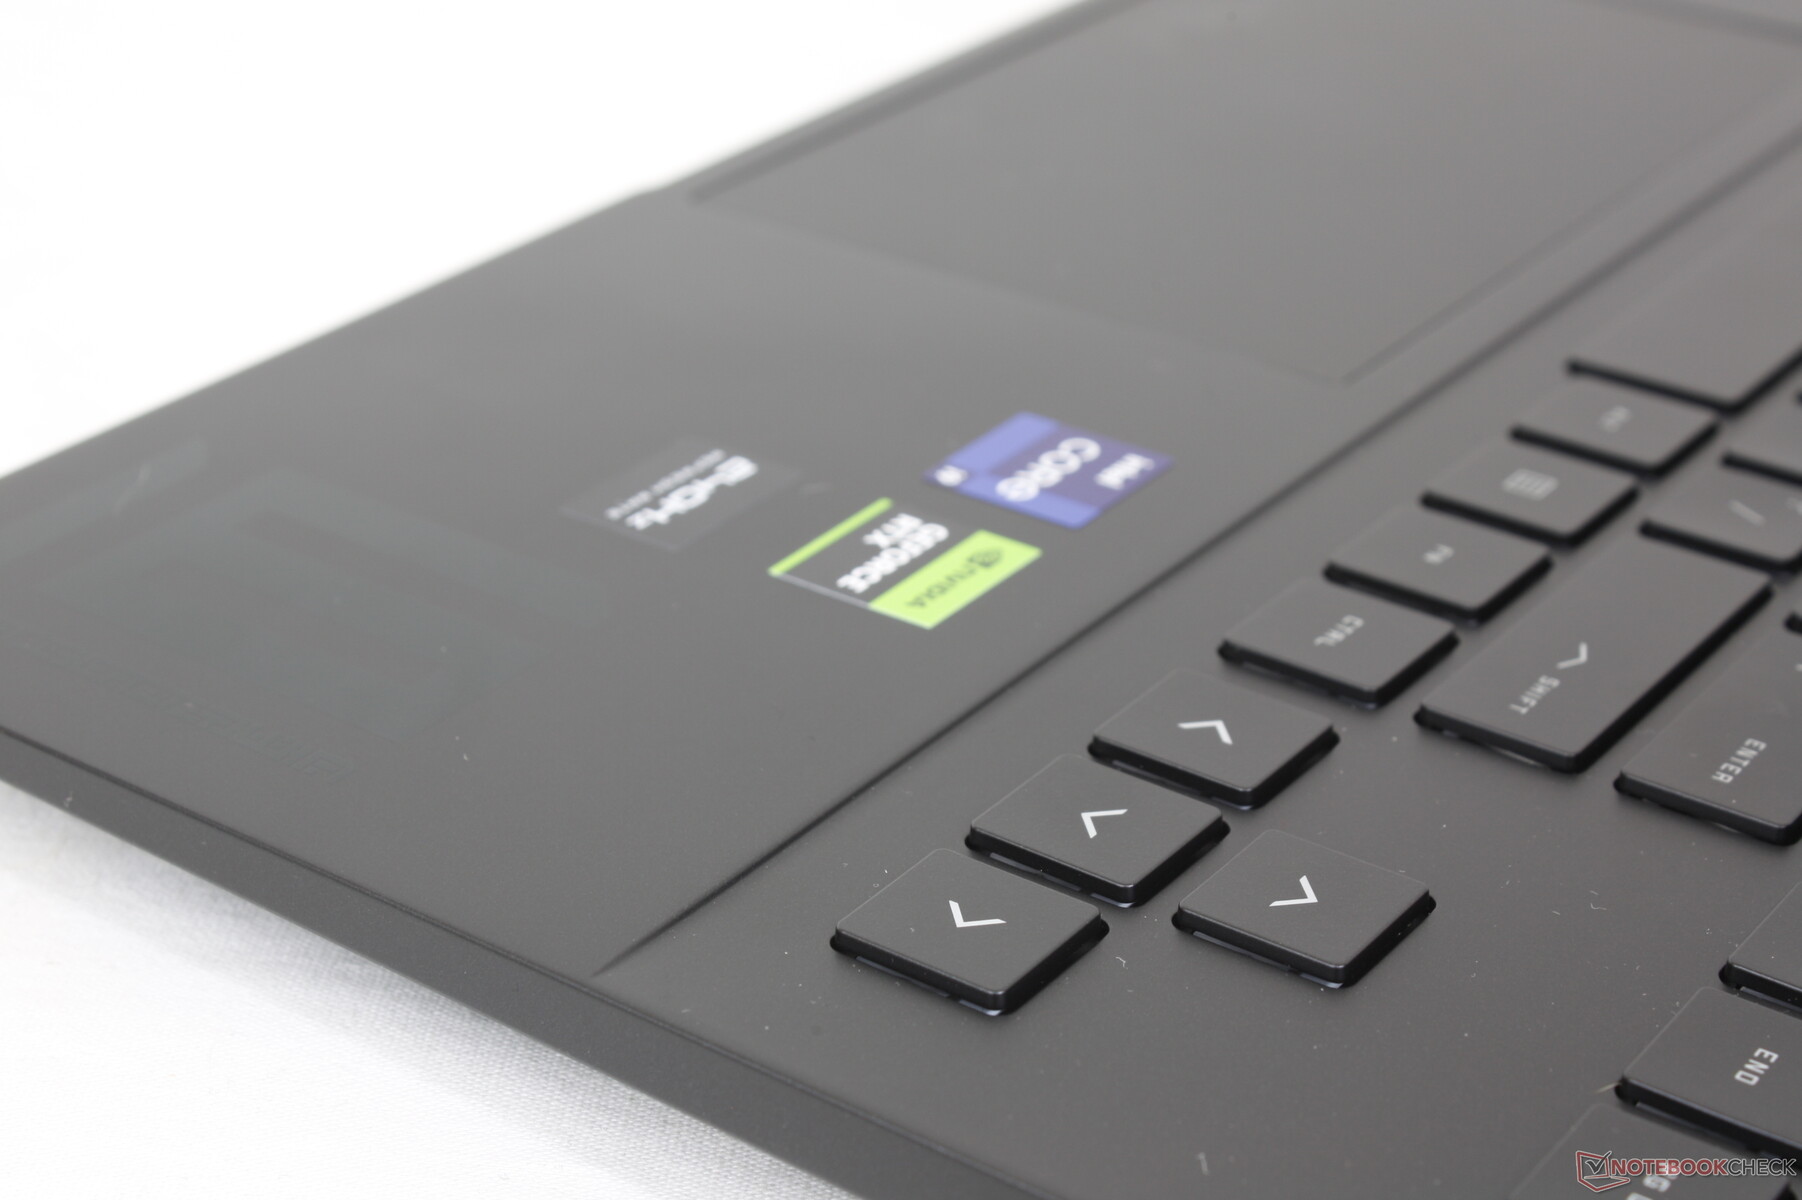
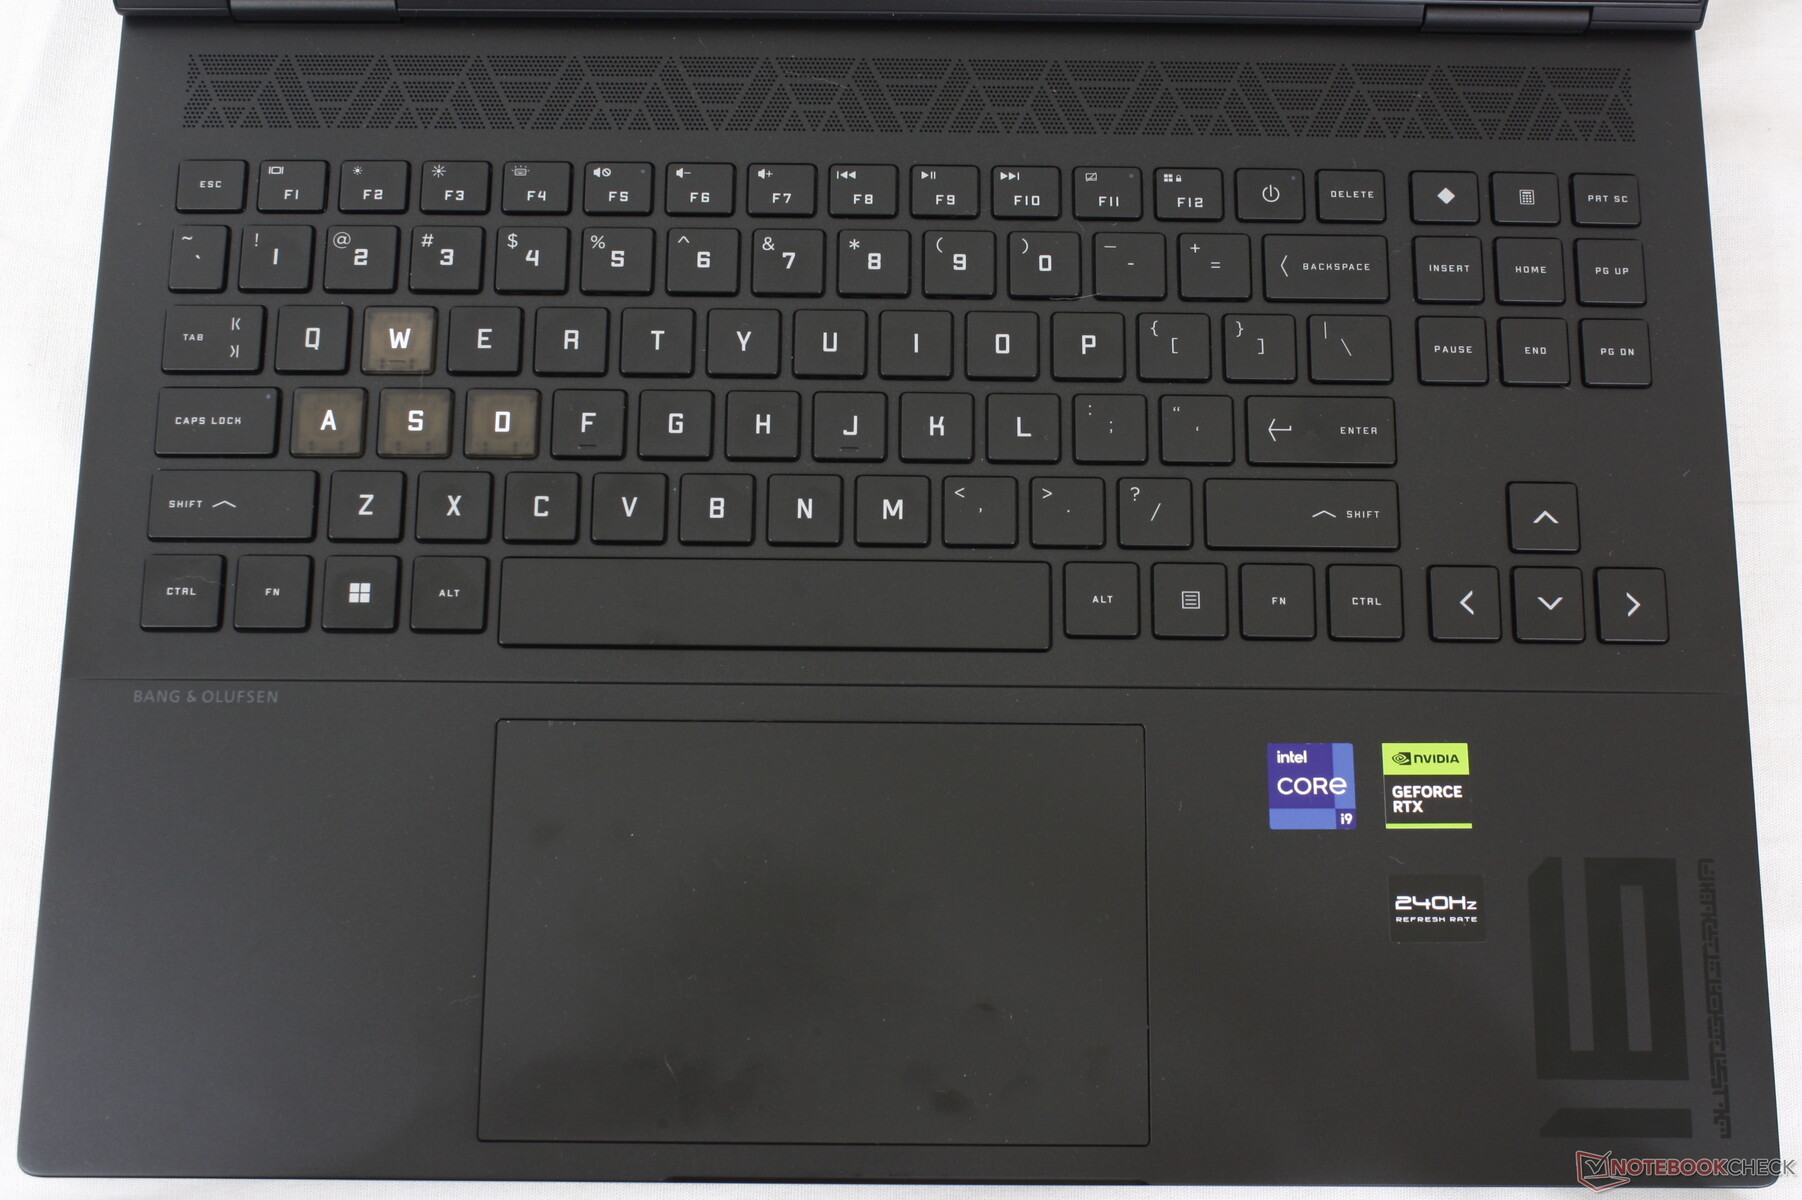
Las teclas WASD ahora están estilizadas con teclas translúcidas para una estética más gamer. Todos nuestros comentarios sobre el teclado del Omen 16 siguen siendo válidos para el Omen Transcend 16.
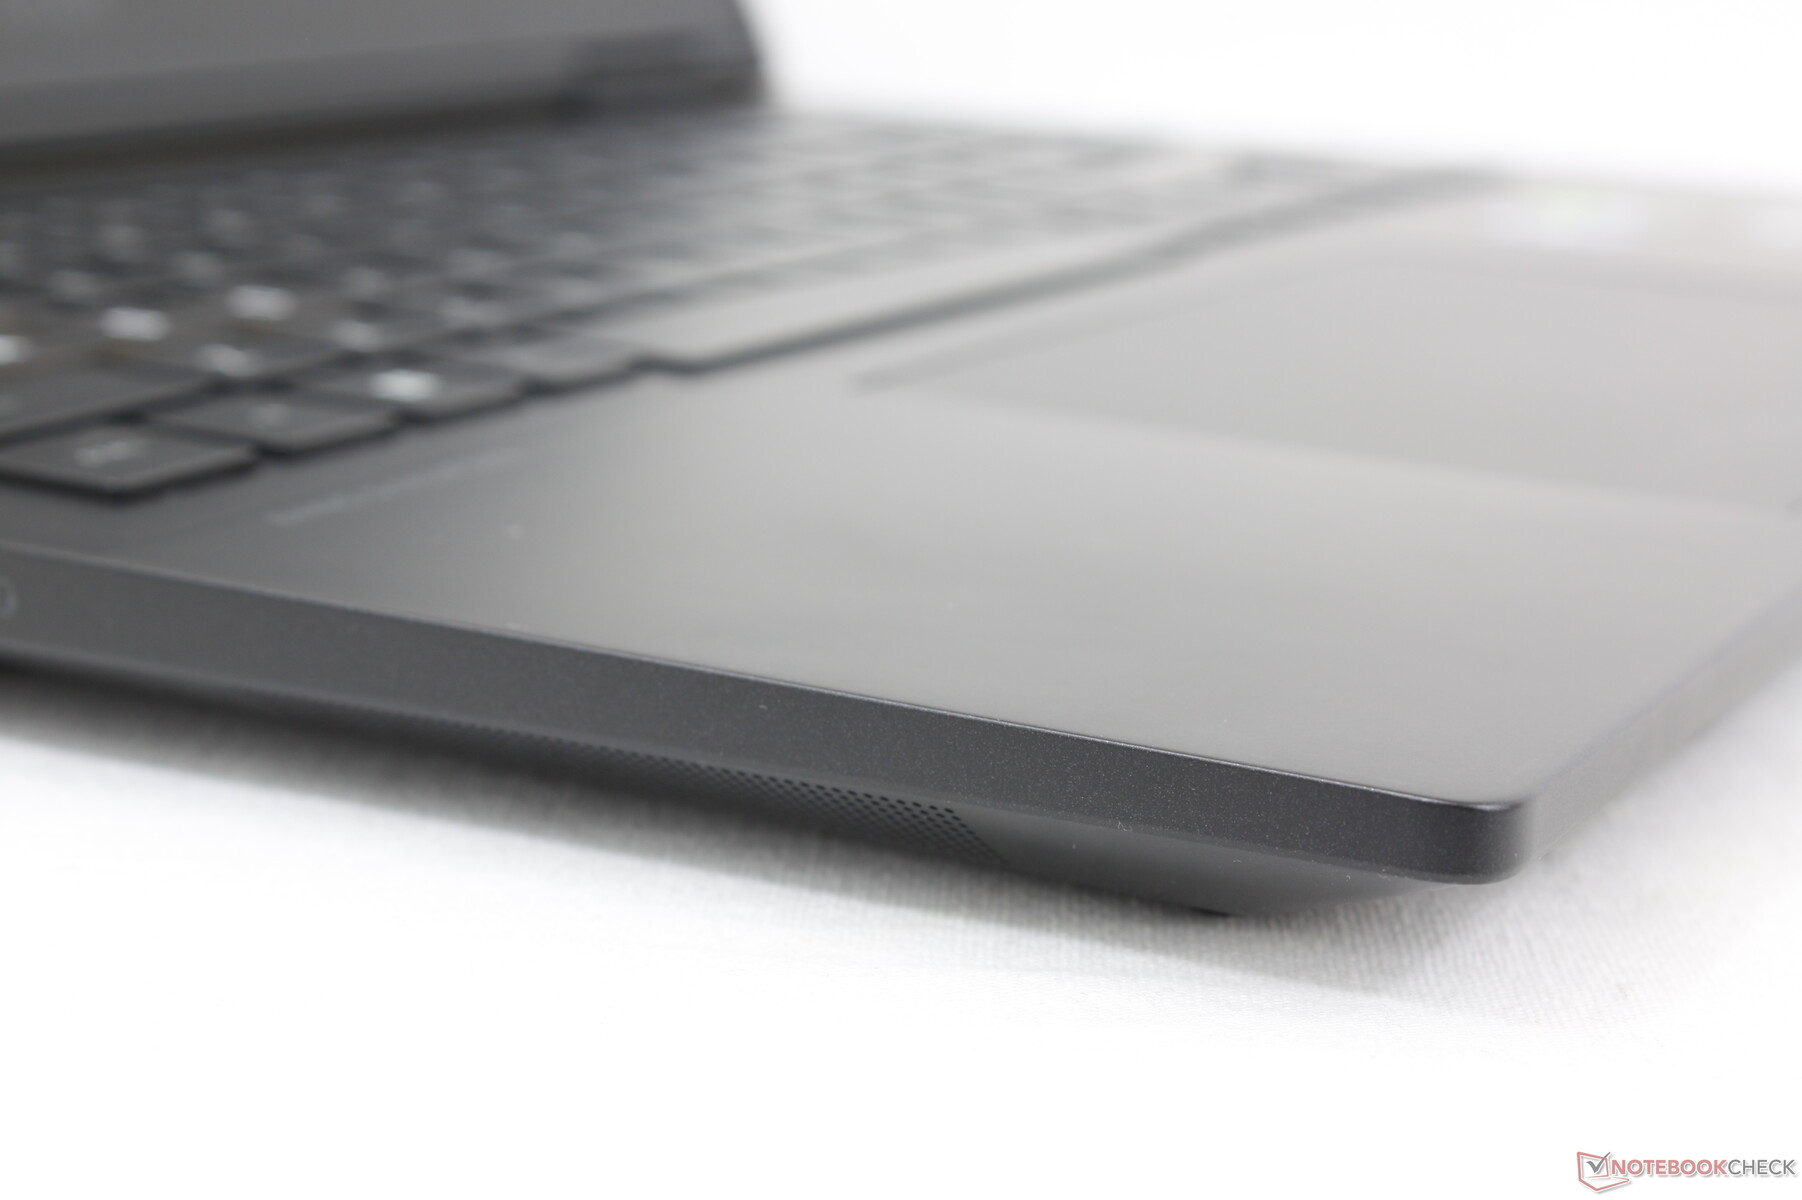
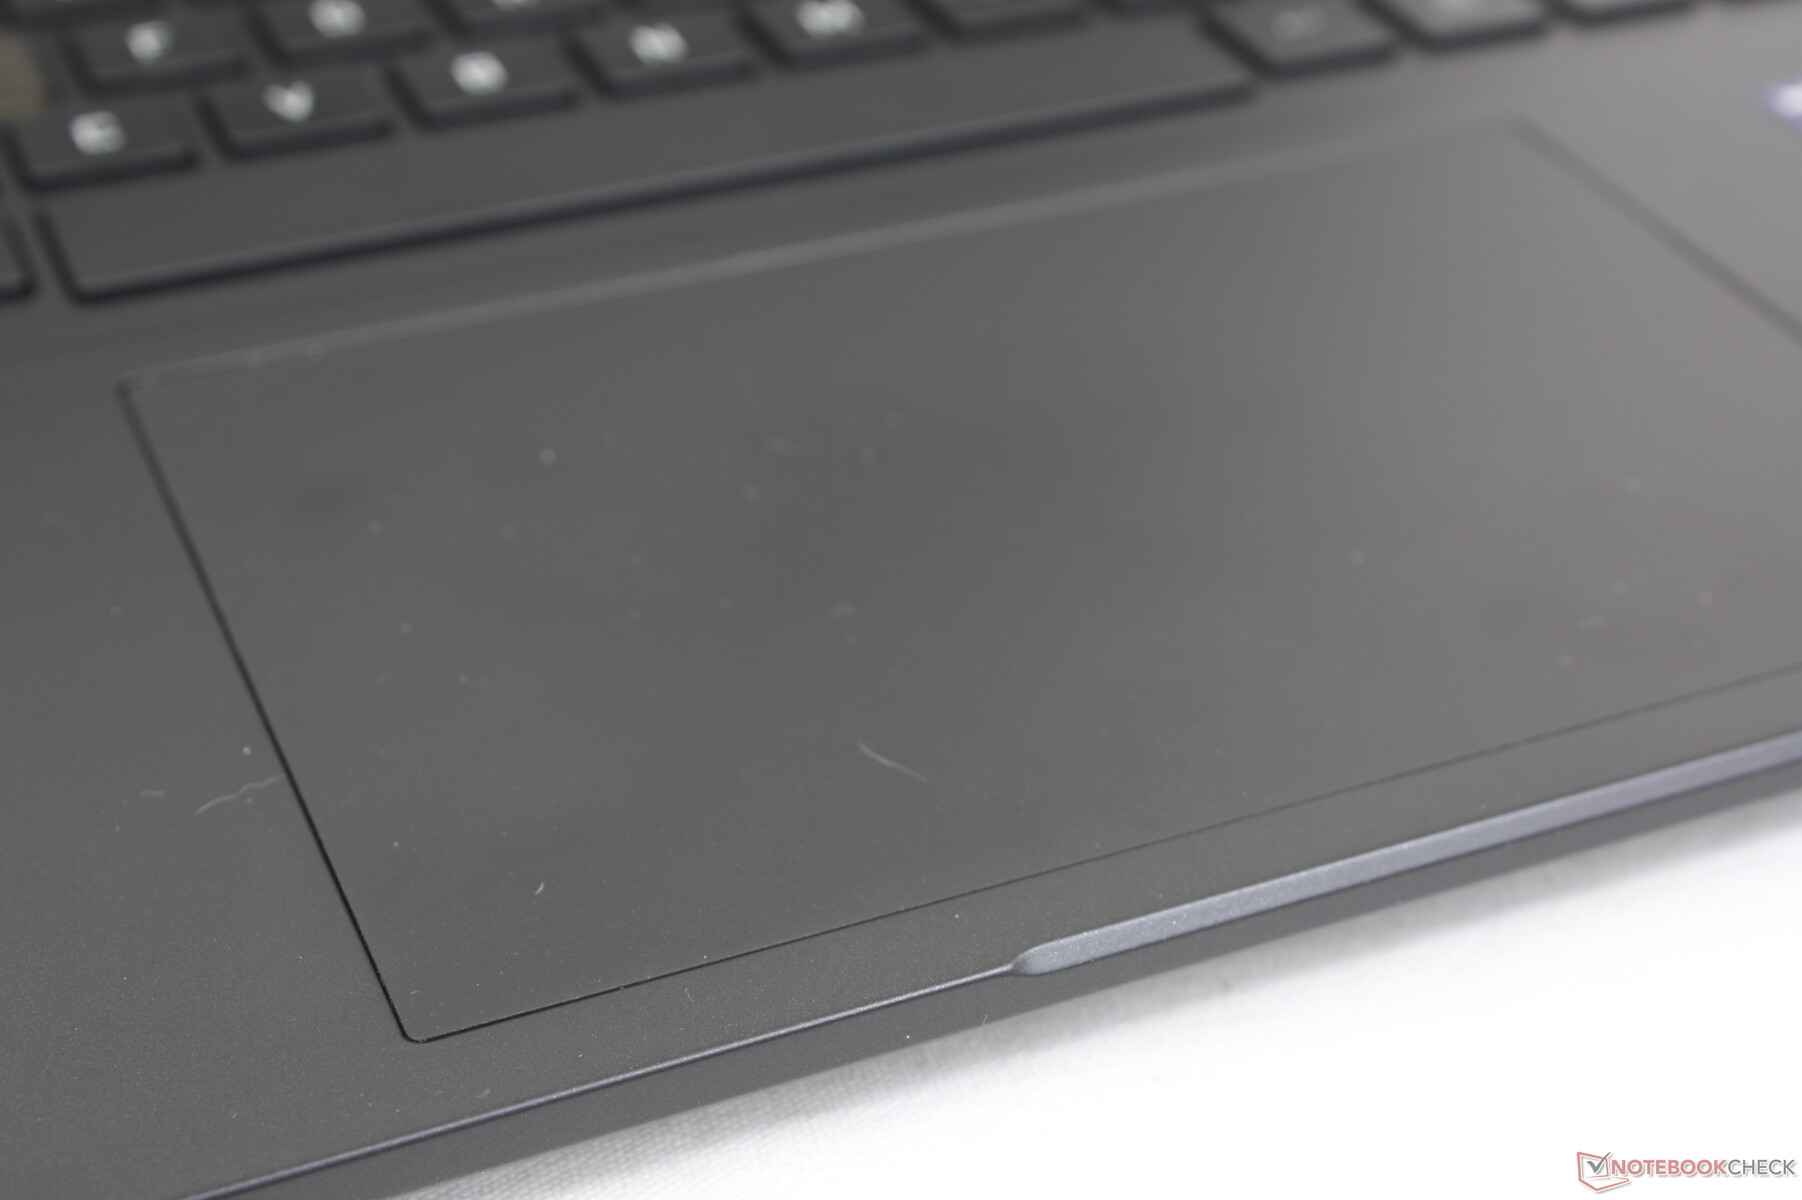
Panel táctil
El tamaño del clickpad ha cambiado de 12,5 x 8 cm en el reciente Omen 16 a un mayor 13,5 x 8,6 cm en el Omen Transcend 16. Aunque sensible y muy espacioso para el desplazamiento, la respuesta al hacer clic es poco profunda y podría haber sido más firme para un clic más satisfactorio.

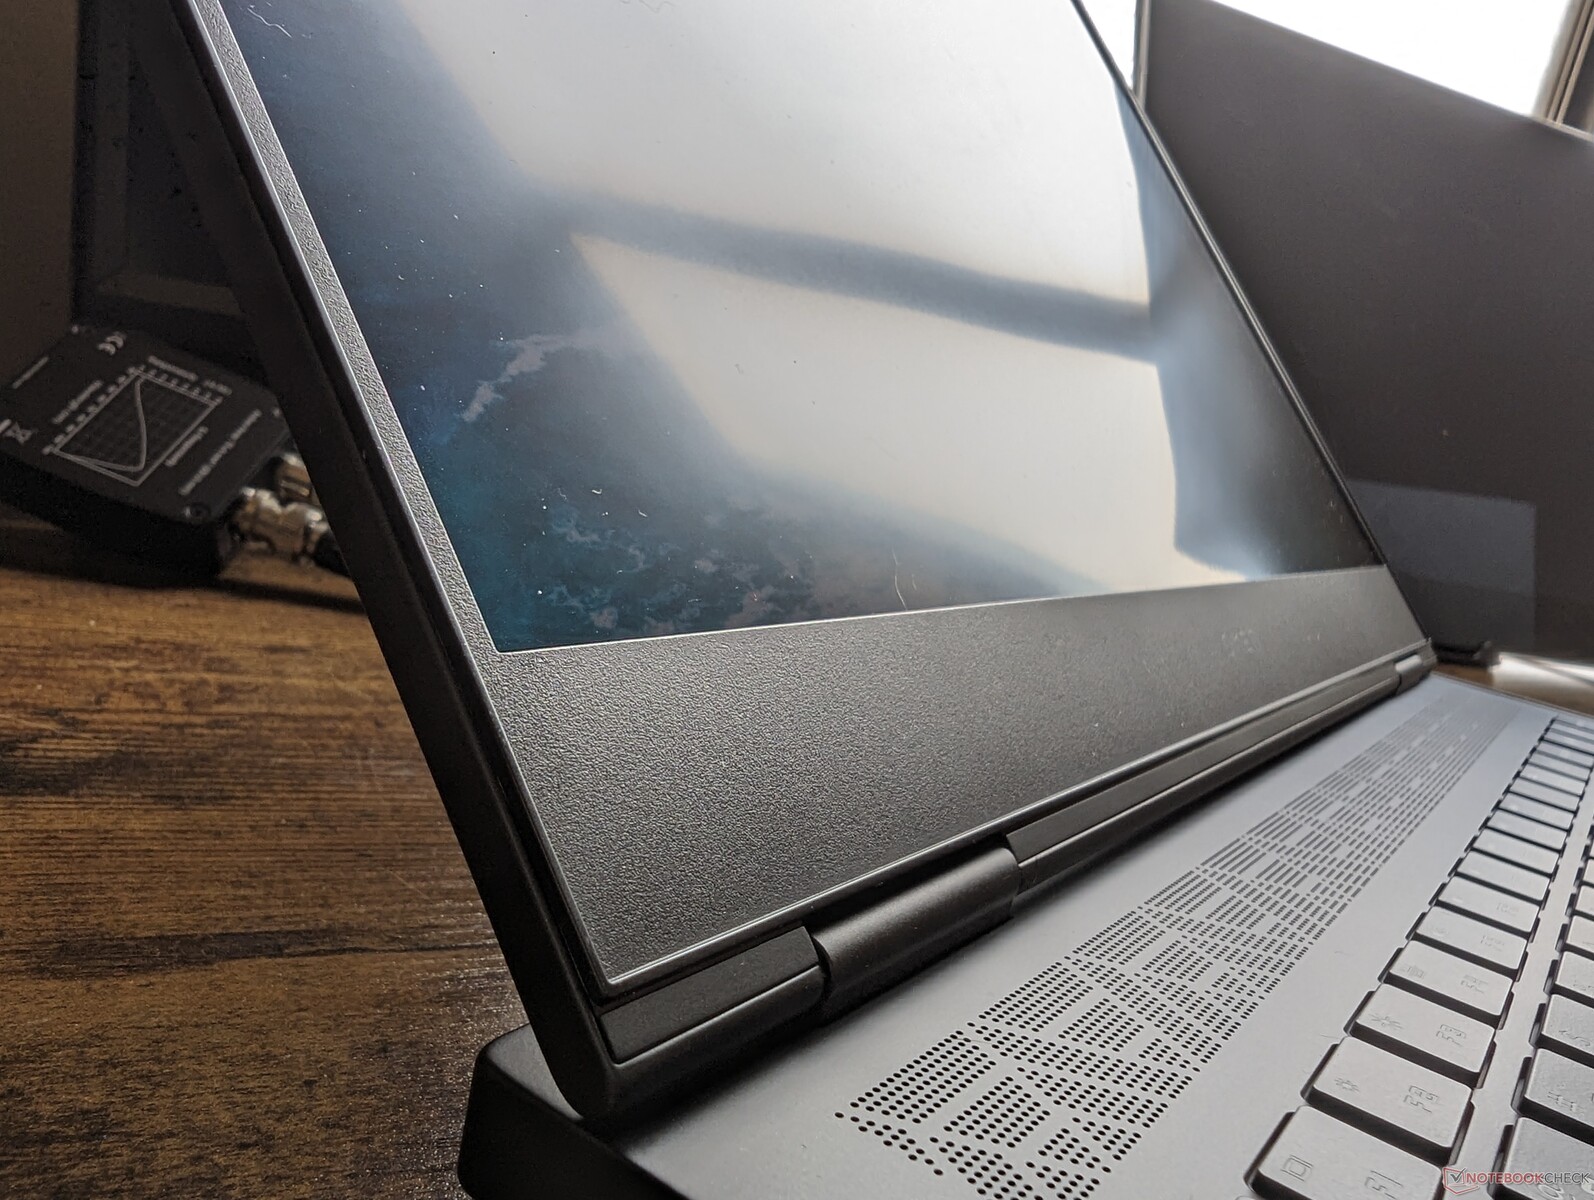
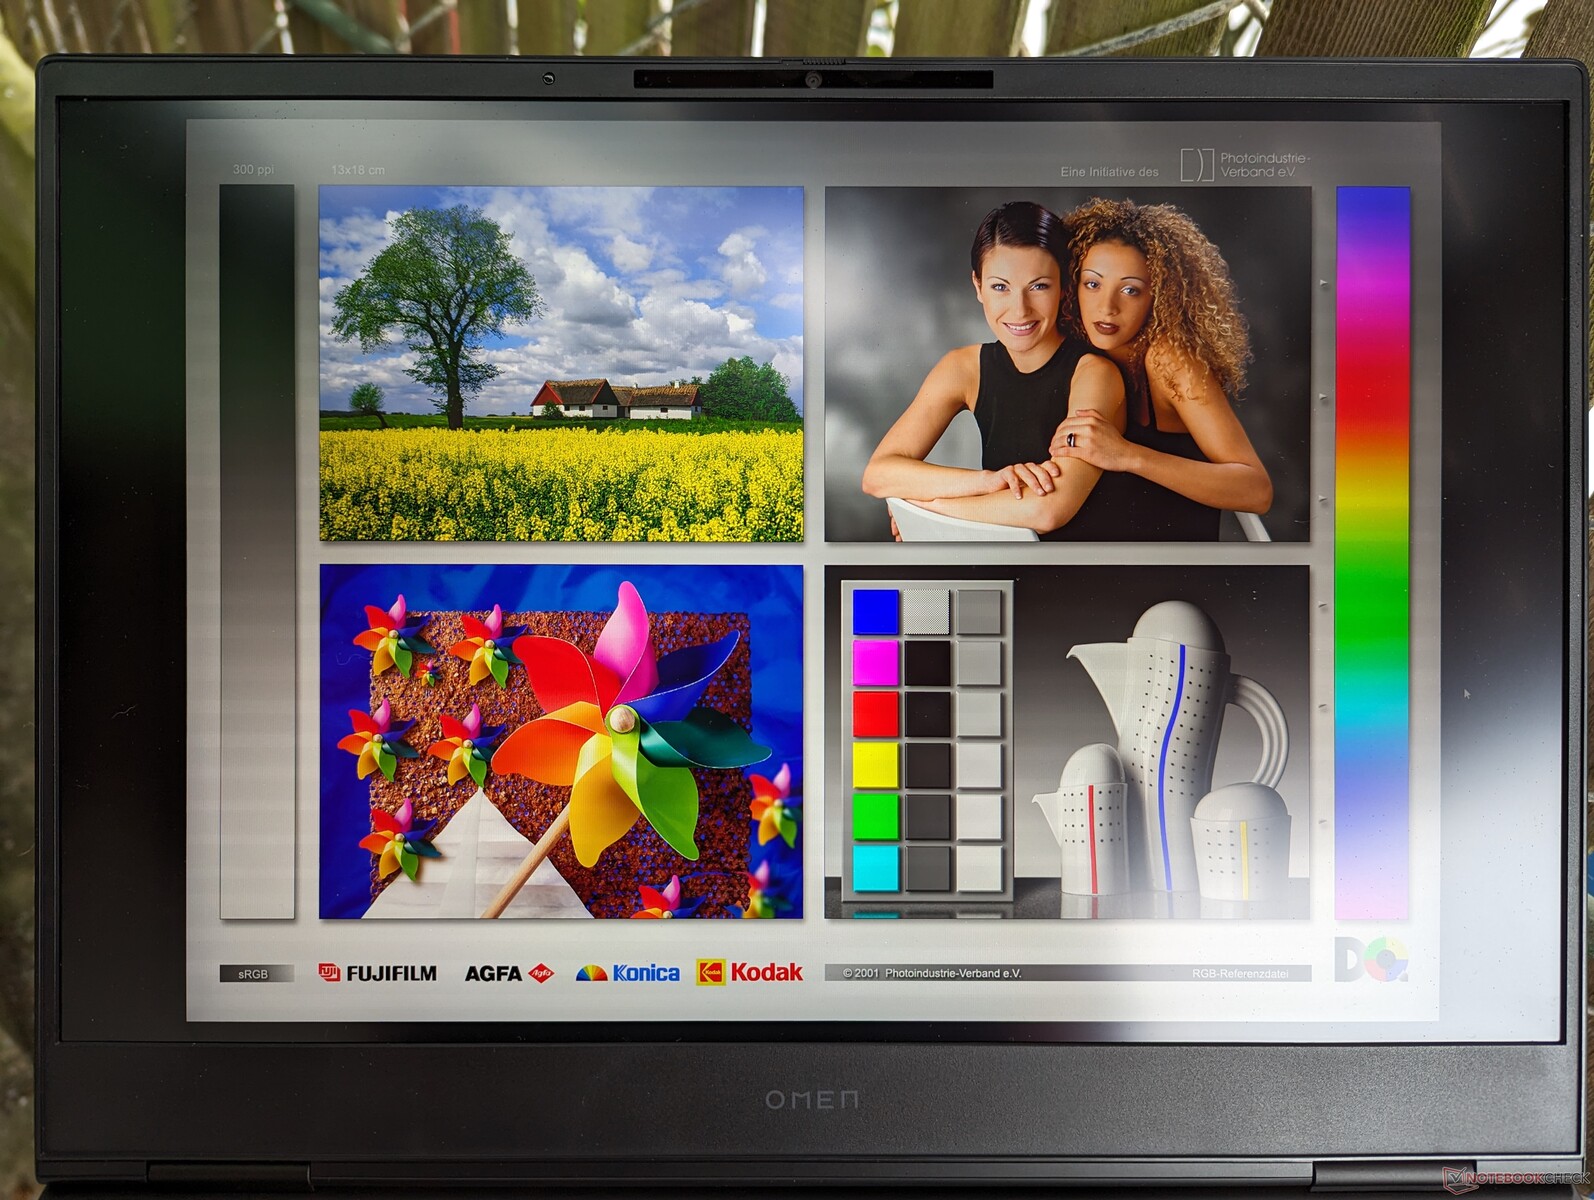
Pantalla - Mini-LED, 240 Hz, 1600p, 16:10, 1180 nits, 100% Colores P3

Otro factor diferenciador importante entre el Omen Transcend 16 y el Omen 16 es la nueva opción de panel mini-LED. Mini-LED combina las ventajas de IPS (es decir, frecuencias de actualización rápidas y asequibilidad relativa) con las ventajas de OLED (es decir, niveles de brillo más altos y niveles de negro más profundos) para ser una buena opción intermedia entre las tres tecnologías de pantalla. Las 1.000 zonas iluminadas individualmente detrás del panel ofrecen una experiencia visual cercana a los píxeles iluminados individualmente de OLED.
HP anuncia un brillo máximo de 1180 nits. Nuestras mediciones independientes usando el test de brillo HDR https://www.youtube.com/watch?v=NlAsAuBtmps®istrarían un máximo de 1233 nits para confirmar las afirmaciones de HP. Nótese que este máximo sólo está disponible bajo ciertas condiciones HDR similares a las del Asus VivoBook ya que el brillo máximo se limita a ~800 nits cuando se muestra todo blanco y nada de negro. Aún así, 800 nits es casi el doble de brillante que la mayoría de portátiles IPS.
Si lo comparamos con la pantalla mini-LED del competidorLenovo Slim Pro 9 16nuestra pantalla HP tiene una resolución nativa inferior (2560 x 1600 frente a 3200 x 2000) pero una frecuencia de actualización superior (240 Hz frente a 165 Hz).


| |||||||||||||||||||||||||
iluminación: 95 %
Brillo con batería: 791.1 cd/m²
Contraste: 19778:1 (Negro: 0.04 cd/m²)
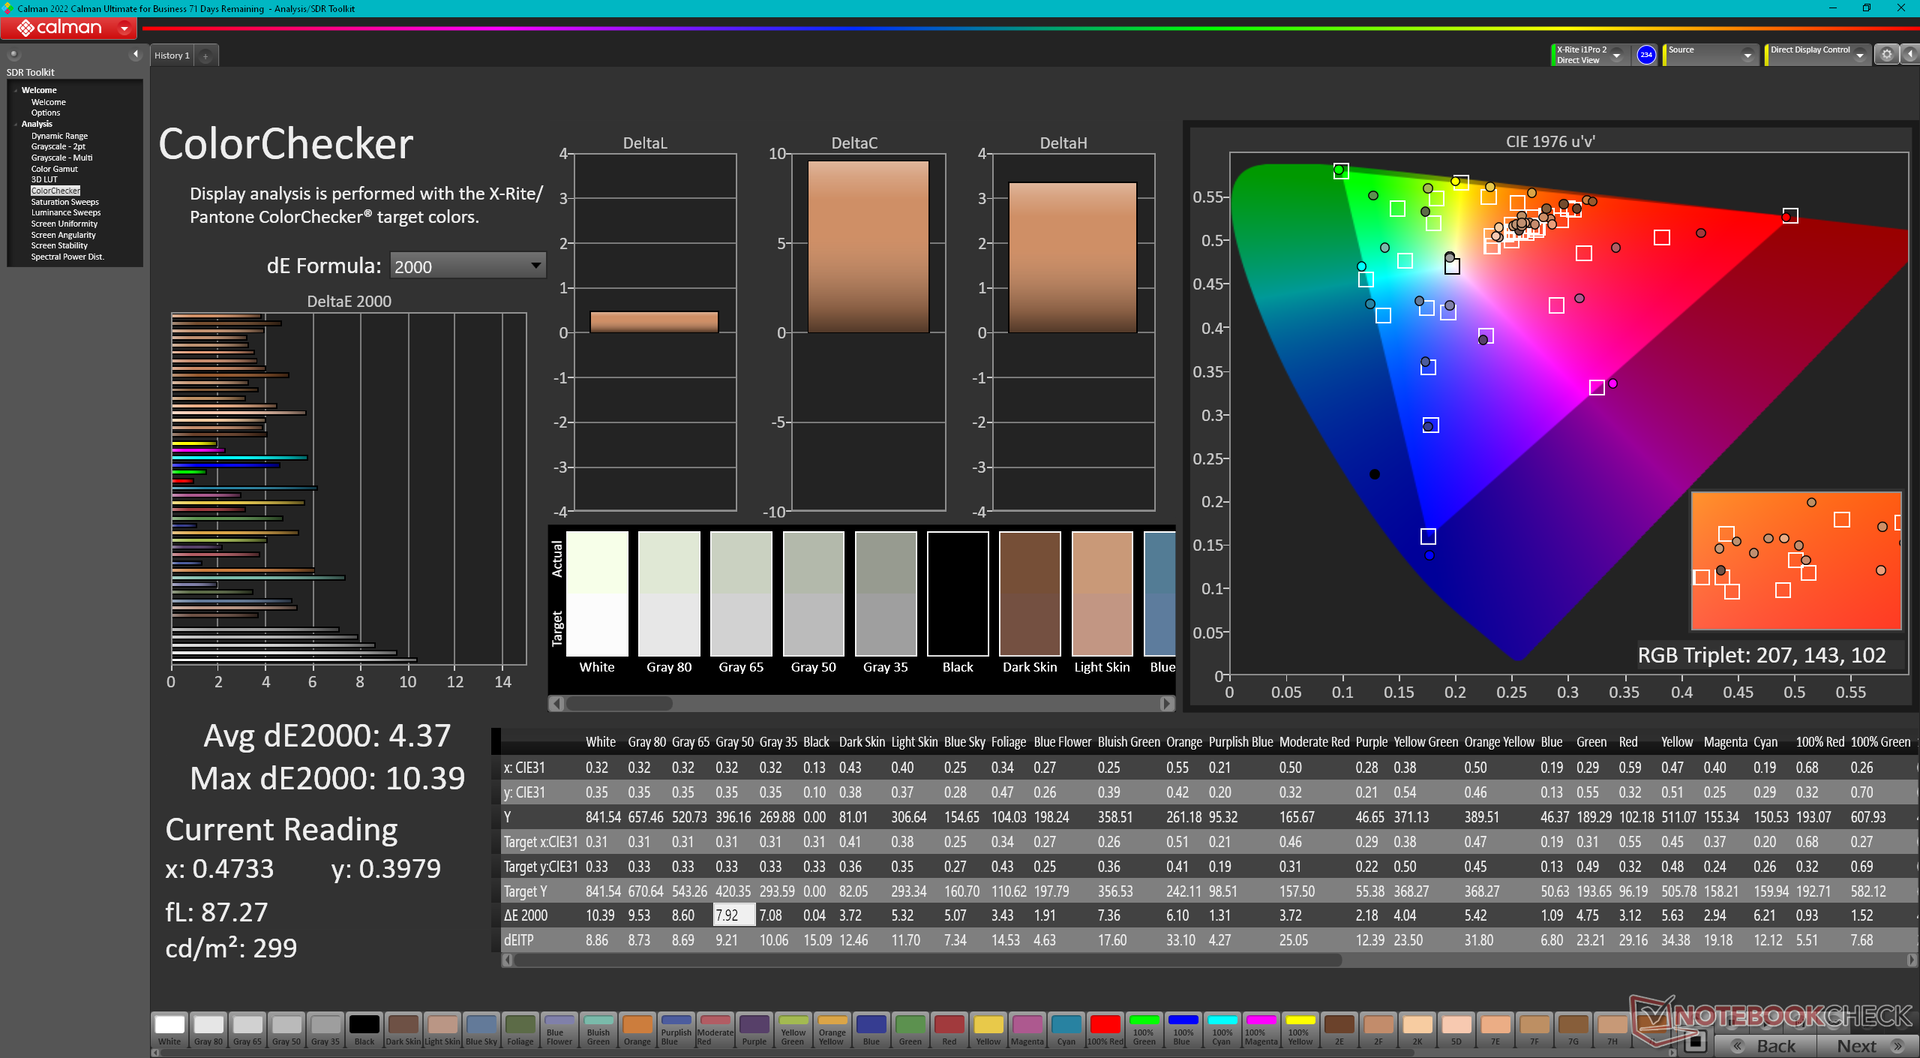
ΔE ColorChecker Calman: 4.37 | ∀{0.5-29.43 Ø4.71}
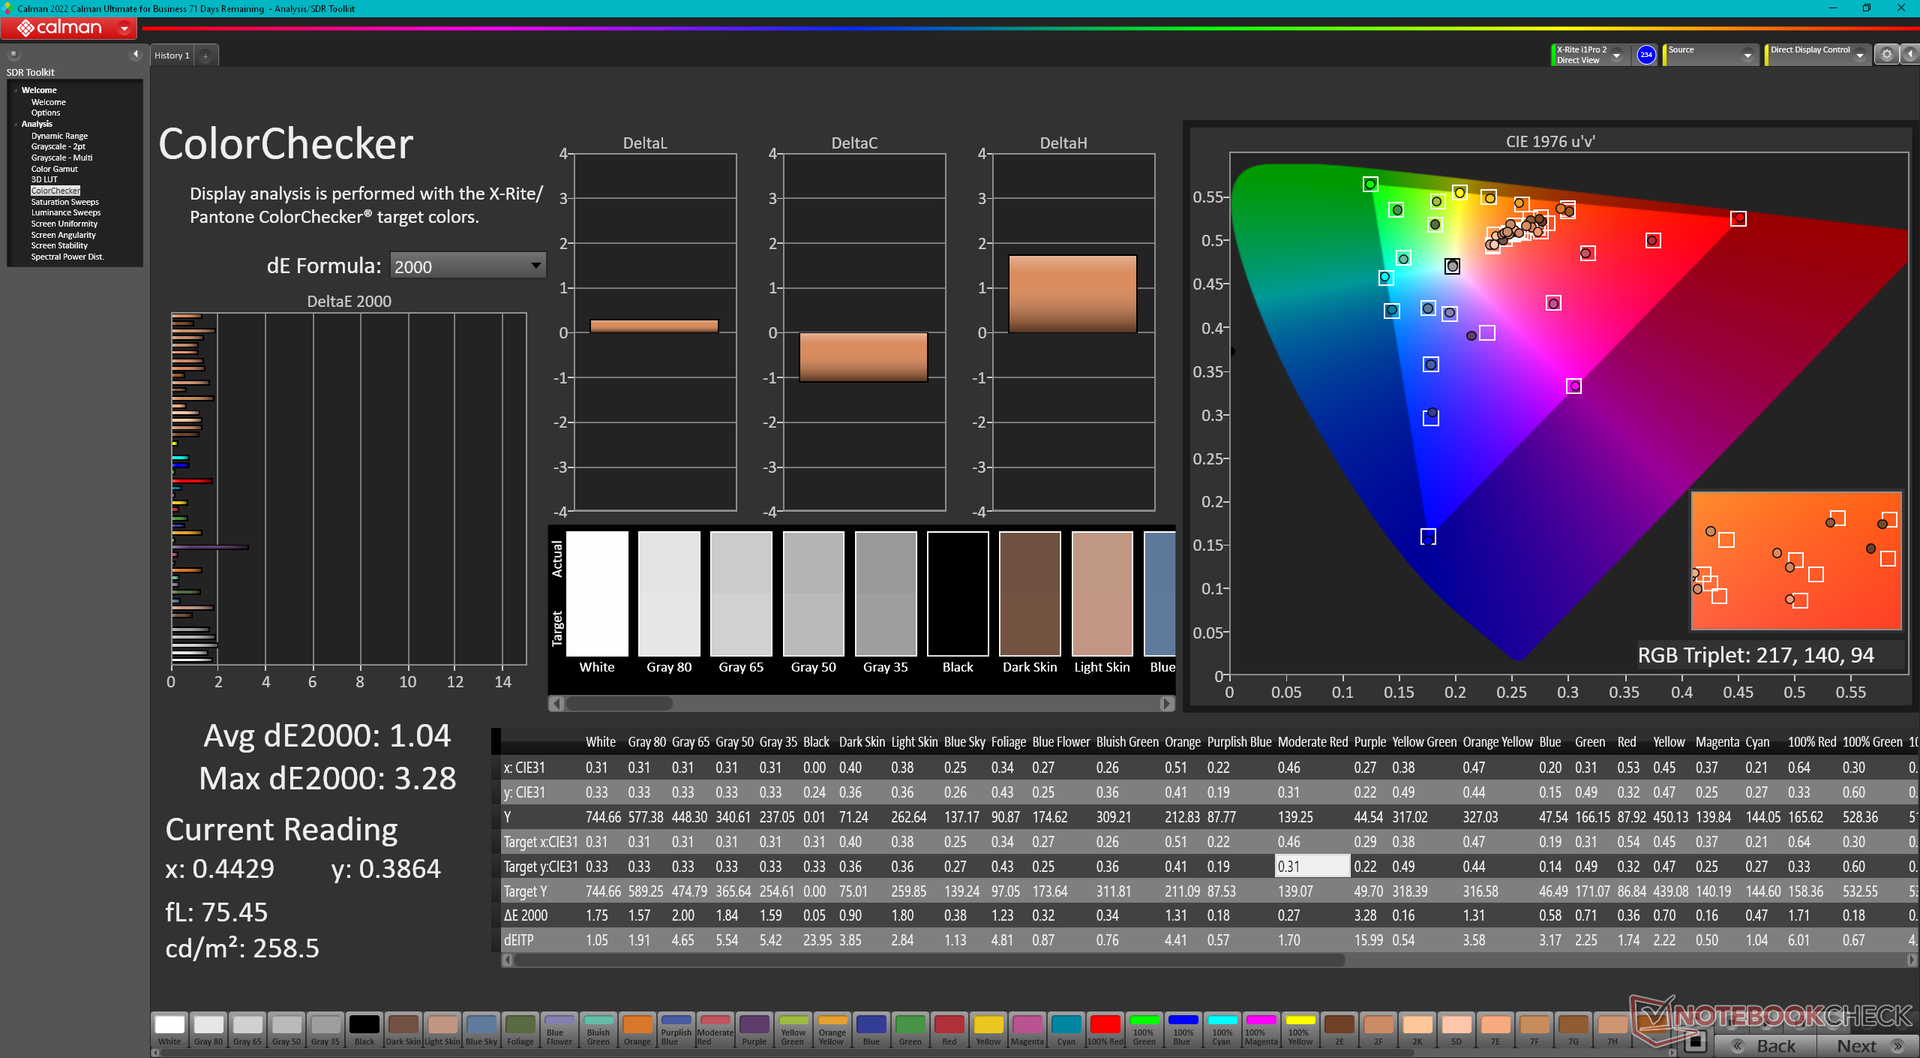
calibrated: 1.04
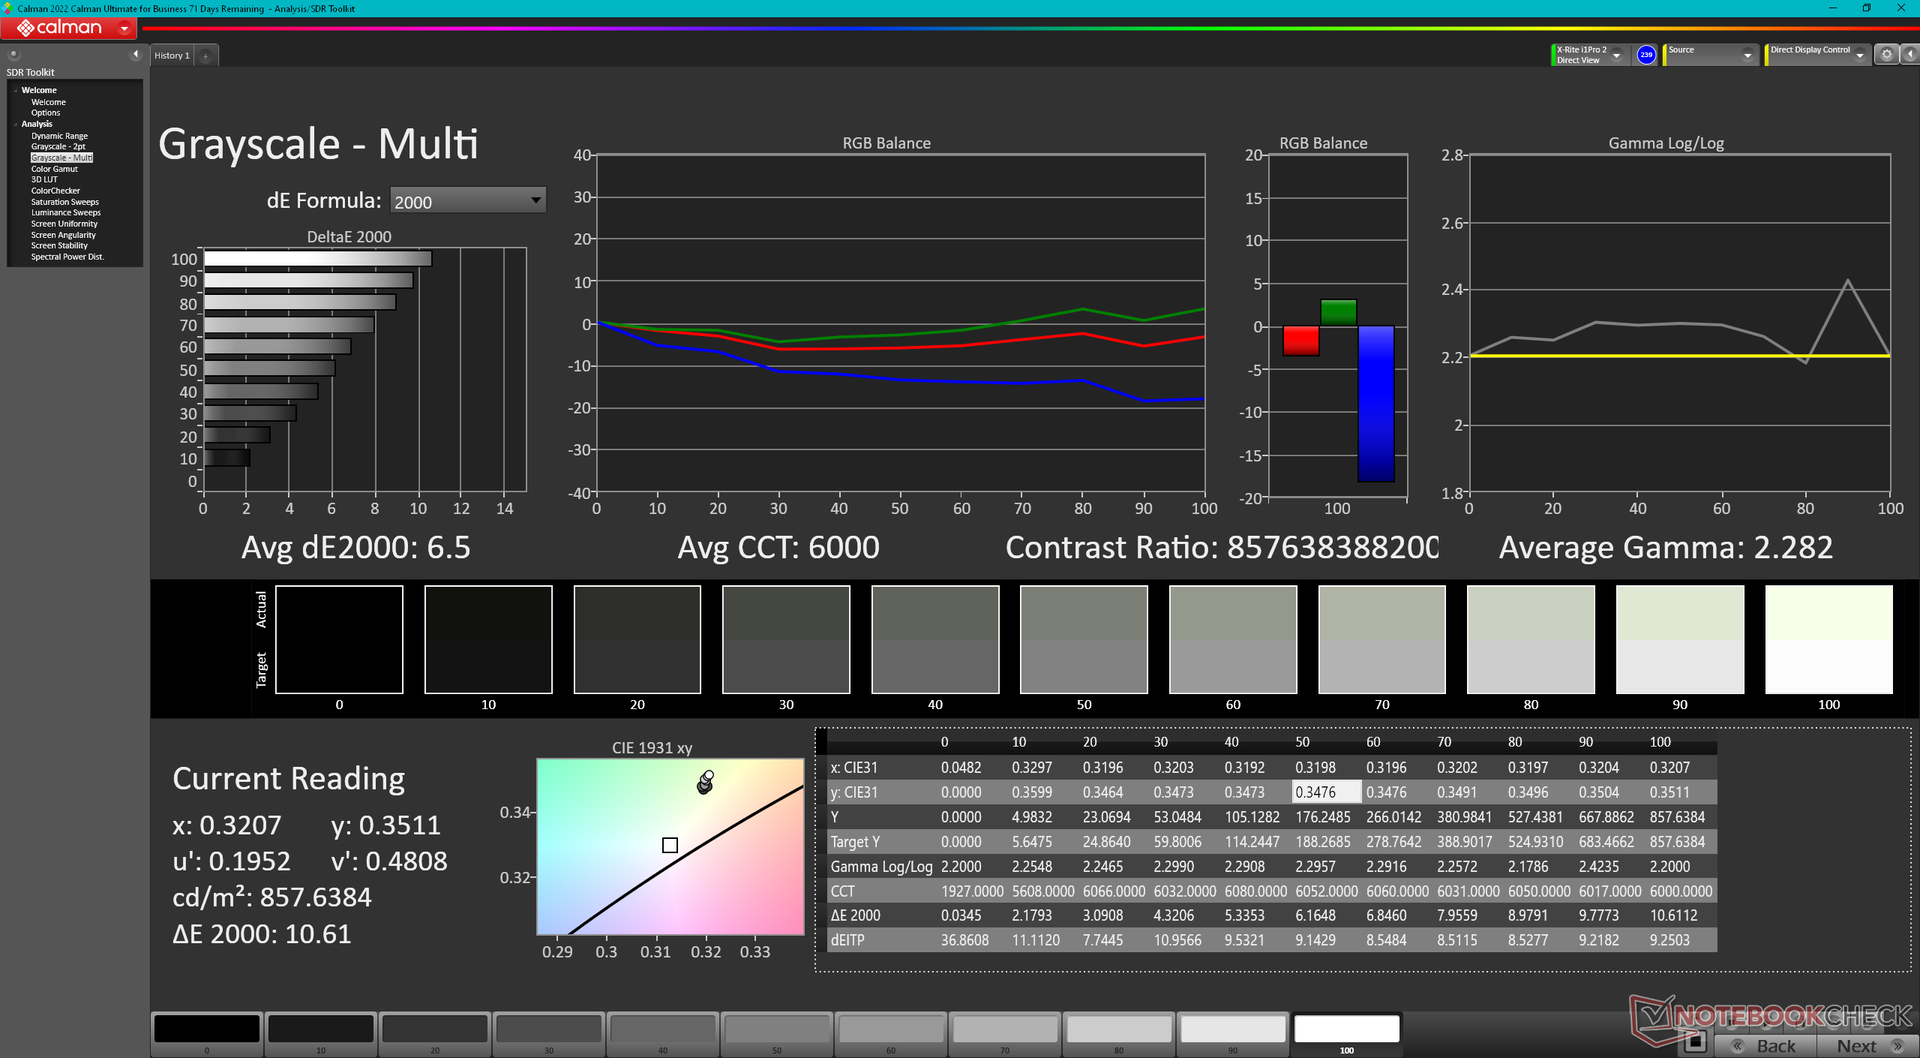
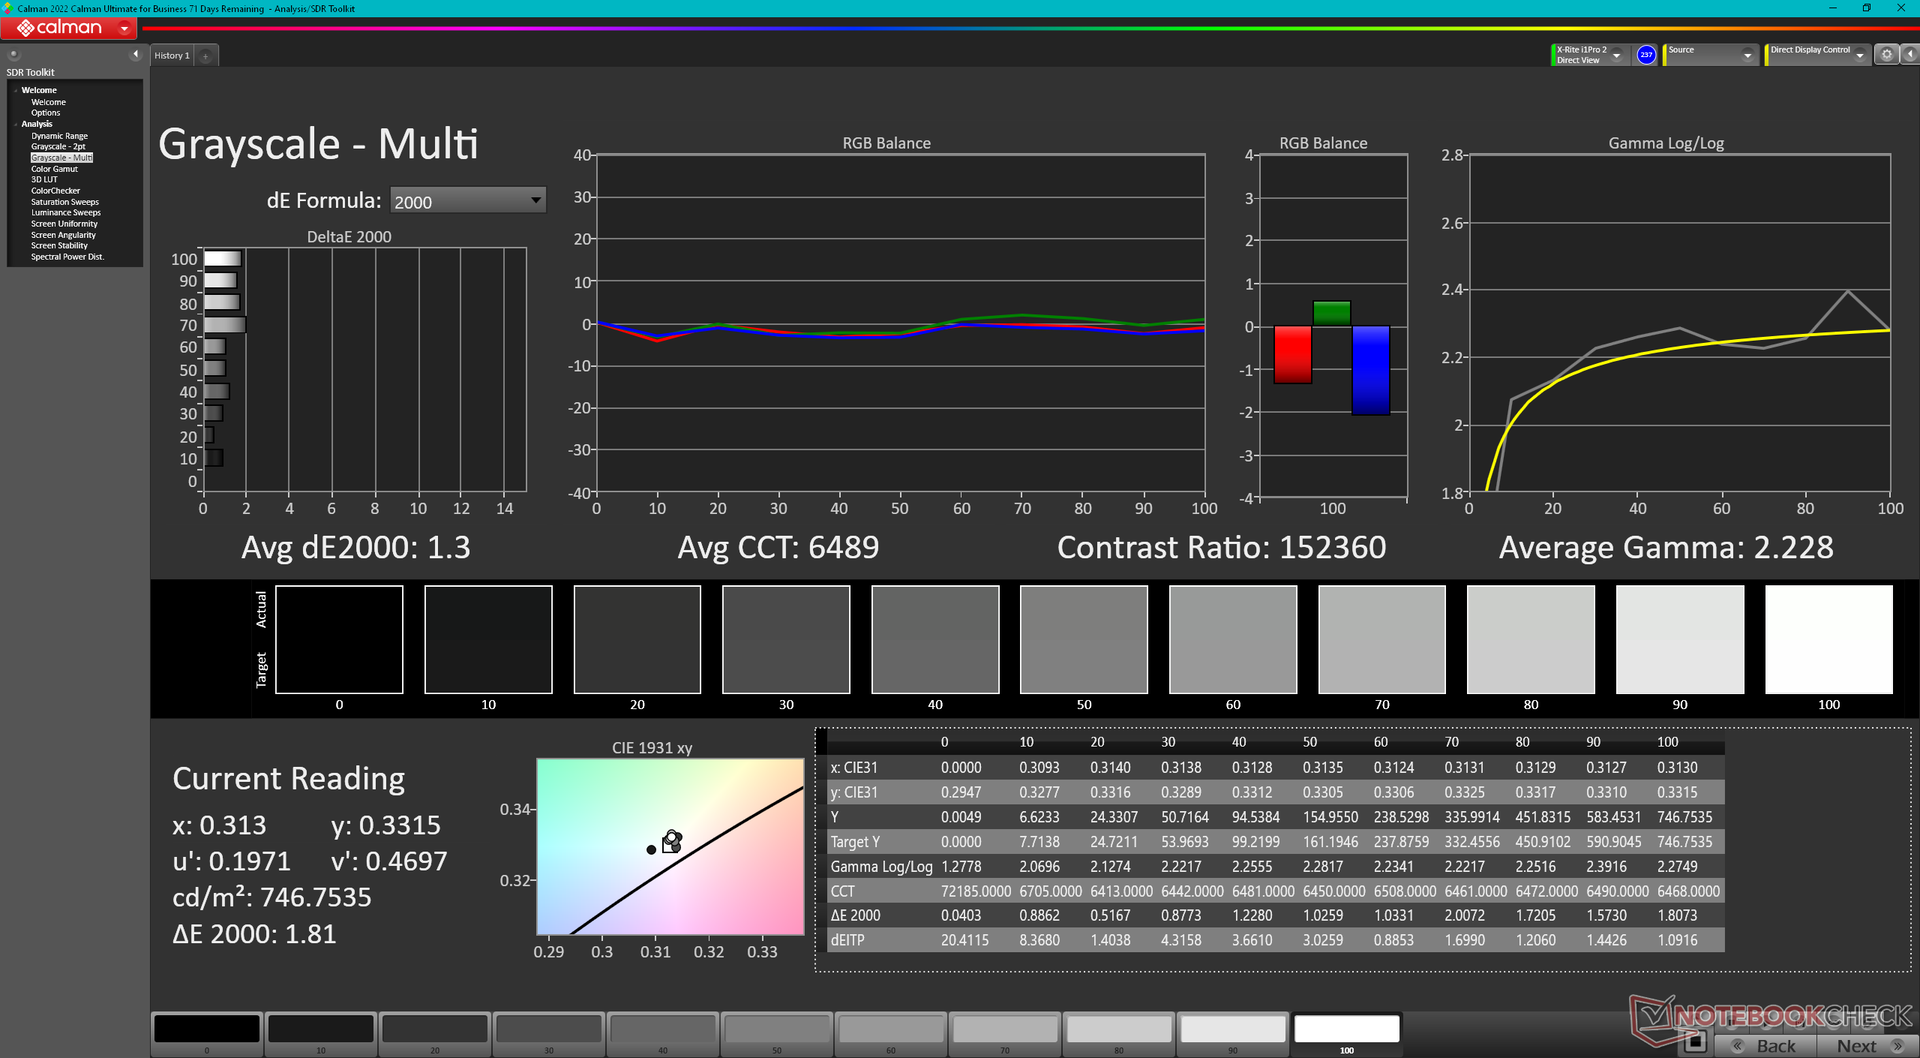
ΔE Greyscale Calman: 6.5 | ∀{0.09-98 Ø4.96}
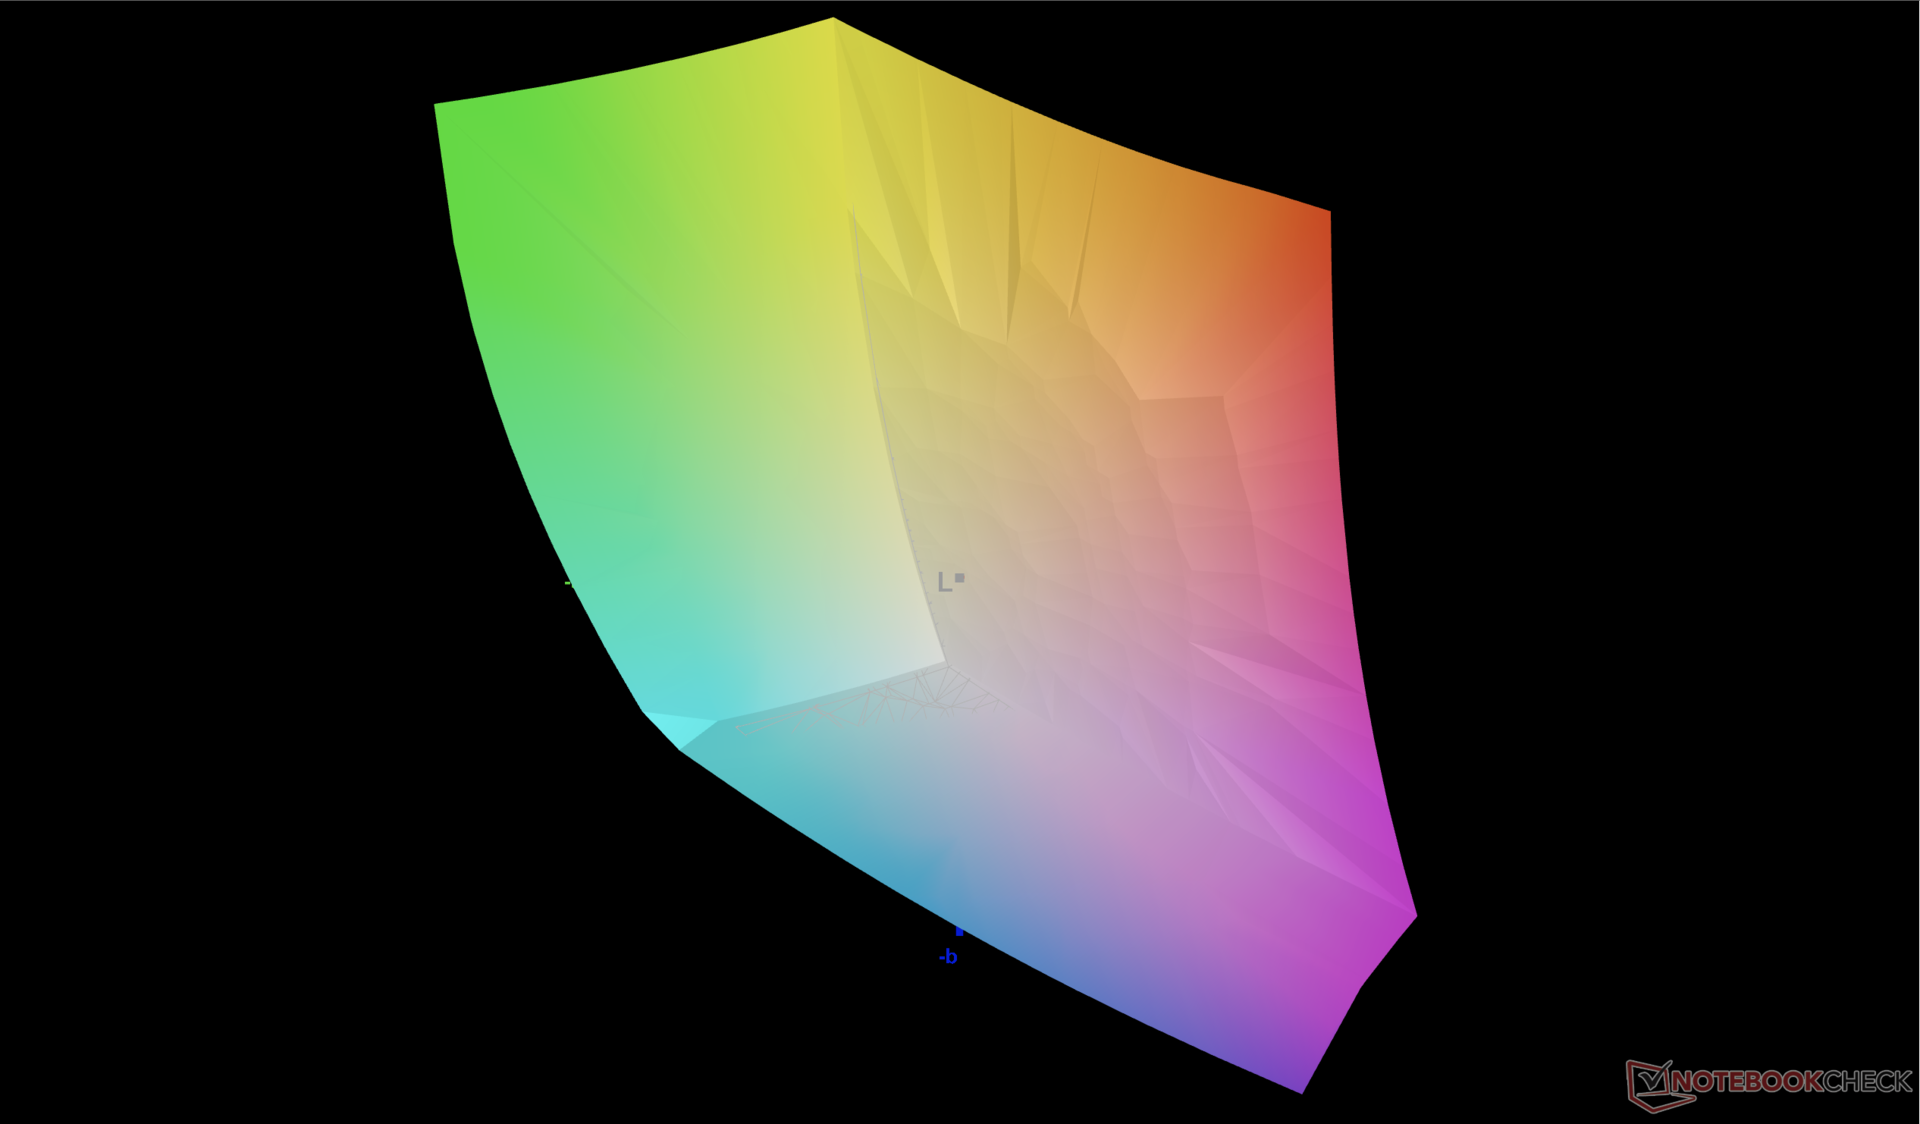
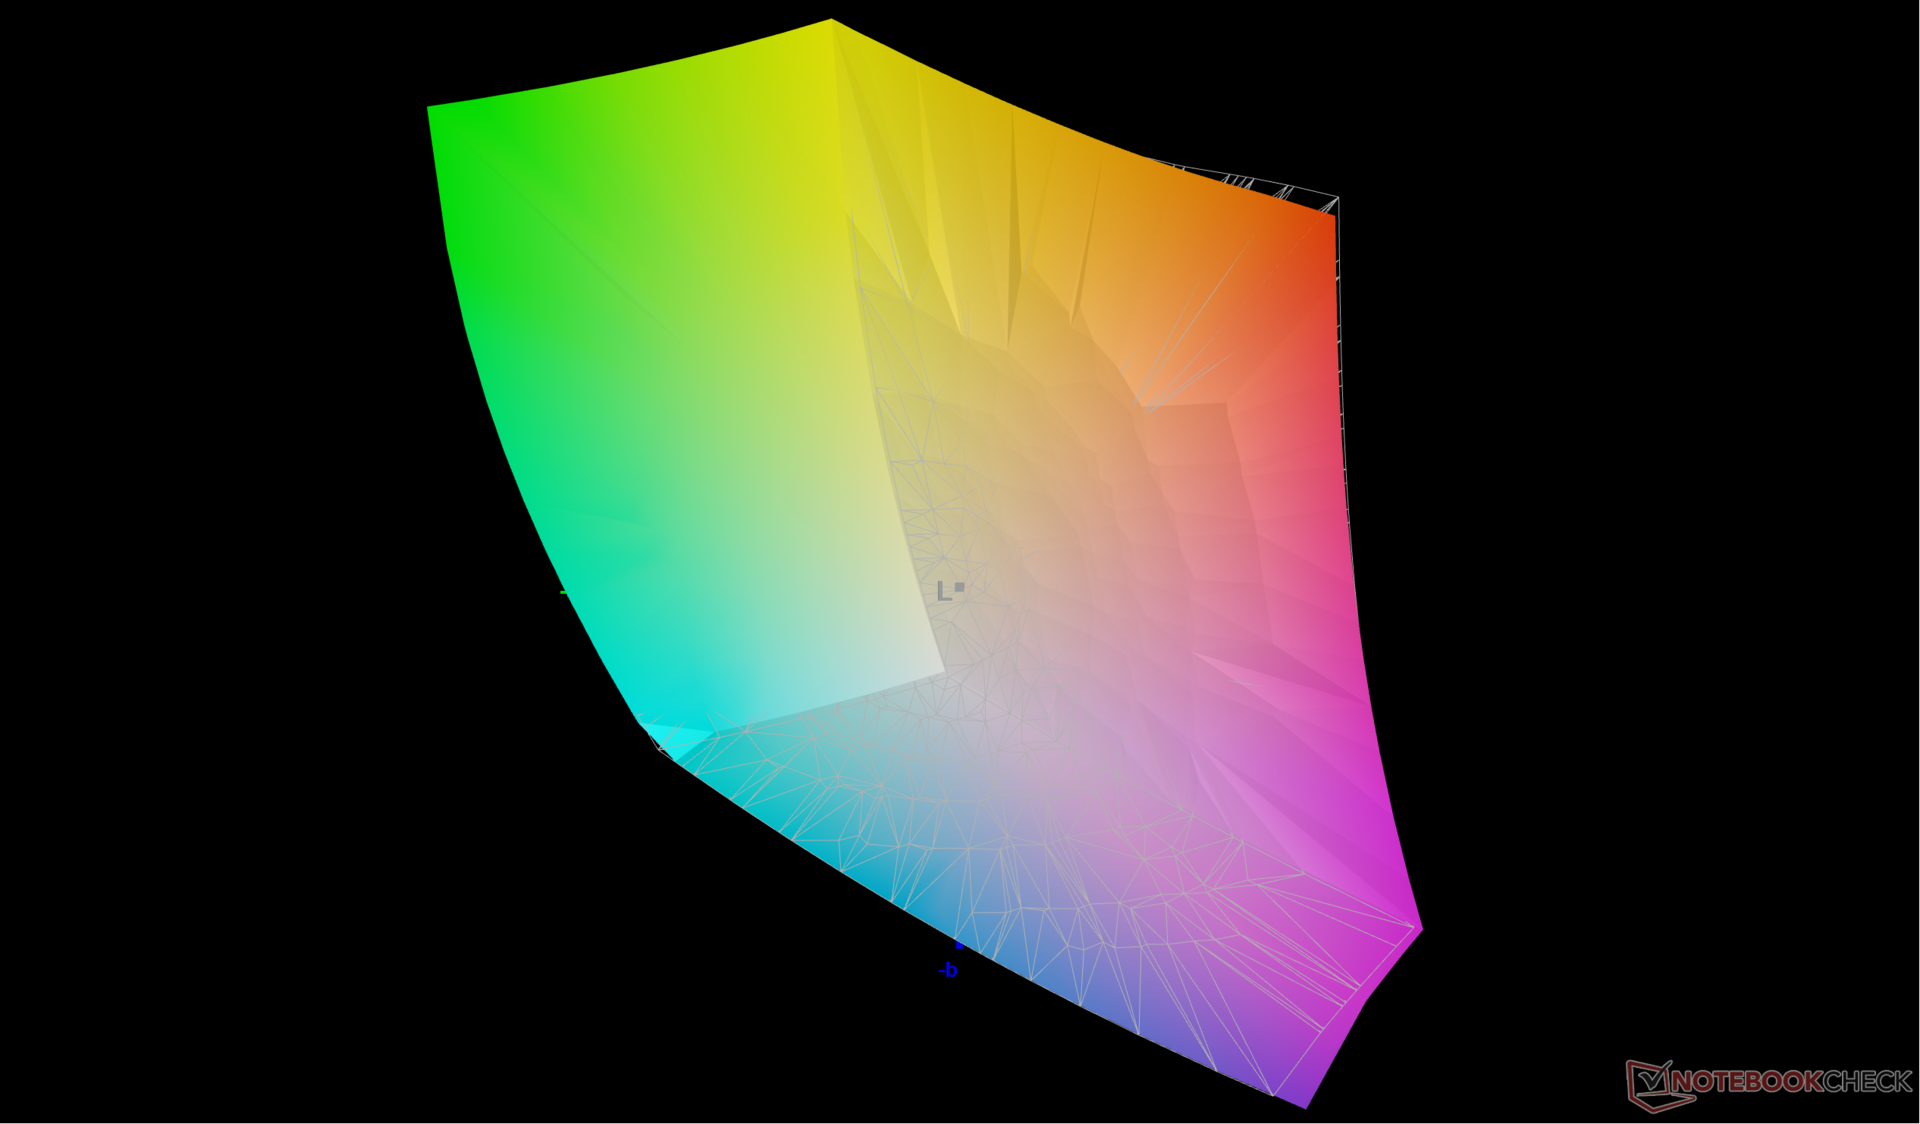
87.6% AdobeRGB 1998 (Argyll 3D)
100% sRGB (Argyll 3D)
99.2% Display P3 (Argyll 3D)
Gamma: 2.28
CCT: 6000 K
| HP Omen Transcend 16 AUOA3A6, Mini-LED, 2560x1600, 16" | Lenovo Legion Slim 7i 16 Gen 8 CSOT T3 MNG007DA2-3, IPS, 2560x1600, 16" | HP Omen 16-wf000 BOE0B7D, IPS, 2560x1440, 16.1" | Alienware x16 R1 BOE NE16NZ4, IPS, 2560x1600, 16" | Acer Nitro 16 AN16-41 BOE CQ NE16QDM-NY1, IPS, 2560x1600, 16" | Asus ROG Zephyrus M16 GU603Z BOE0A0B (BOE CQ NE160QDM-NY3), IPS, 2560x1600, 16" | |
|---|---|---|---|---|---|---|
| Display | -16% | -17% | 0% | -18% | -4% | |
| Display P3 Coverage (%) | 99.2 | 70.4 -29% | 69 -30% | 99.2 0% | 67.9 -32% | 92.8 -6% |
| sRGB Coverage (%) | 100 | 99.4 -1% | 99.2 -1% | 100 0% | 99.1 -1% | 98.5 -1% |
| AdobeRGB 1998 Coverage (%) | 87.6 | 72.5 -17% | 71.2 -19% | 88.6 1% | 69.9 -20% | 83.1 -5% |
| Response Times | 62% | 75% | 72% | 70% | 68% | |
| Response Time Grey 50% / Grey 80% * (ms) | 26.4 ? | 12 ? 55% | 4.6 ? 83% | 5.1 ? 81% | 11 ? 58% | 7.6 ? 71% |
| Response Time Black / White * (ms) | 28.2 ? | 8.9 ? 68% | 9.7 ? 66% | 10.3 ? 63% | 5 ? 82% | 10 ? 65% |
| PWM Frequency (Hz) | 3506 ? | |||||
| Screen | -95% | -86% | -67% | -95% | -79% | |
| Brightness middle (cd/m²) | 791.1 | 474.6 -40% | 310.9 -61% | 302.2 -62% | 520 -34% | 497 -37% |
| Brightness (cd/m²) | 800 | 445 -44% | 296 -63% | 285 -64% | 494 -38% | 481 -40% |
| Brightness Distribution (%) | 95 | 86 -9% | 91 -4% | 89 -6% | 91 -4% | 82 -14% |
| Black Level * (cd/m²) | 0.04 | 0.39 -875% | 0.35 -775% | 0.26 -550% | 0.39 -875% | 0.21 -425% |
| Contrast (:1) | 19778 | 1217 -94% | 888 -96% | 1162 -94% | 1333 -93% | 2367 -88% |
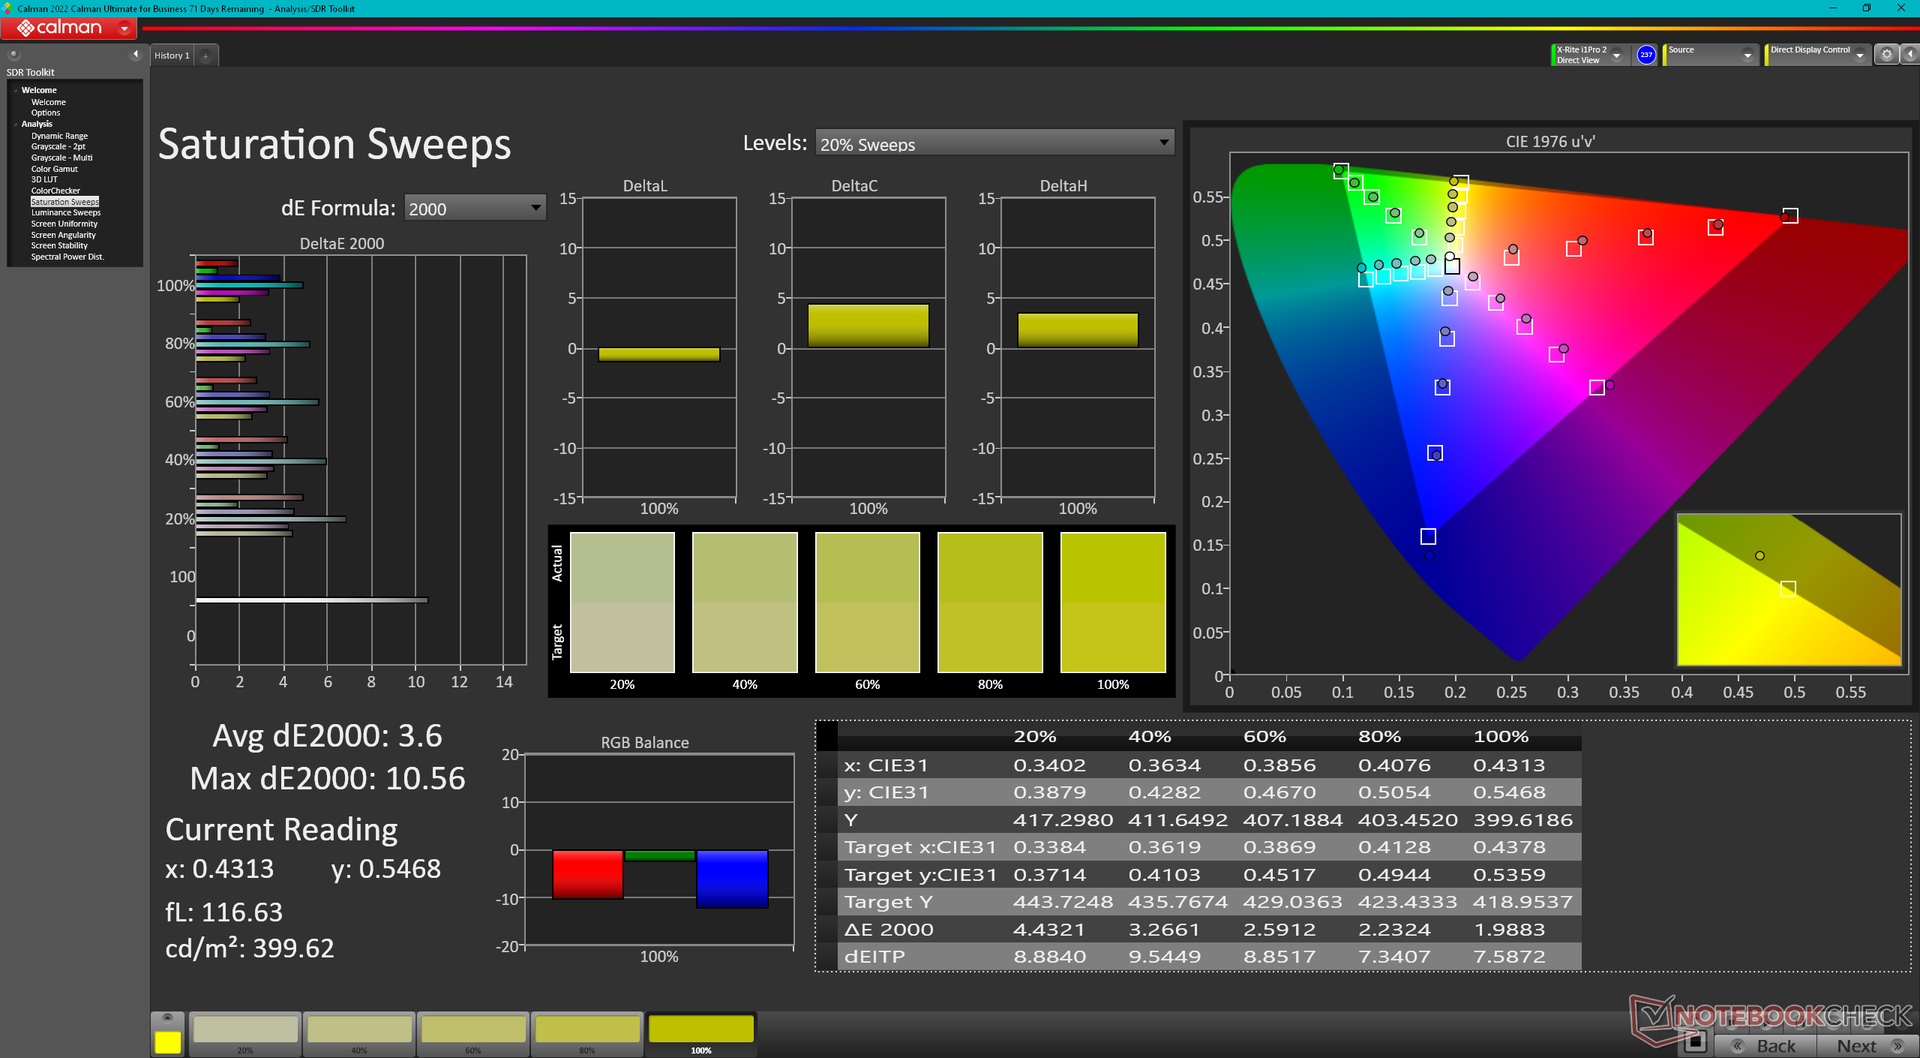
| Colorchecker dE 2000 * | 4.37 | 2.12 51% | 2.18 50% | 1.63 63% | 1.94 56% | 3.53 19% |
| Colorchecker dE 2000 max. * | 10.39 | 4.73 54% | 3.58 66% | 4.13 60% | 5.62 46% | 6.15 41% |
| Colorchecker dE 2000 calibrated * | 1.04 | 0.57 45% | 0.52 50% | 1.17 -13% | 0.74 29% | 3.53 -239% |
| Greyscale dE 2000 * | 6.5 | 2.8 57% | 2.8 57% | 2.5 62% | 2.94 55% | 1.74 73% |
| Gamma | 2.28 96% | 2.22 99% | 2.18 101% | 2.23 99% | 2.37 93% | 2.2 100% |
| CCT | 6000 108% | 6542 99% | 6002 108% | 6590 99% | 6443 101% | 6418 101% |
| Media total (Programa/Opciones) | -16% /
-56% | -9% /
-48% | 2% /
-33% | -14% /
-55% | -5% /
-42% |
* ... más pequeño es mejor
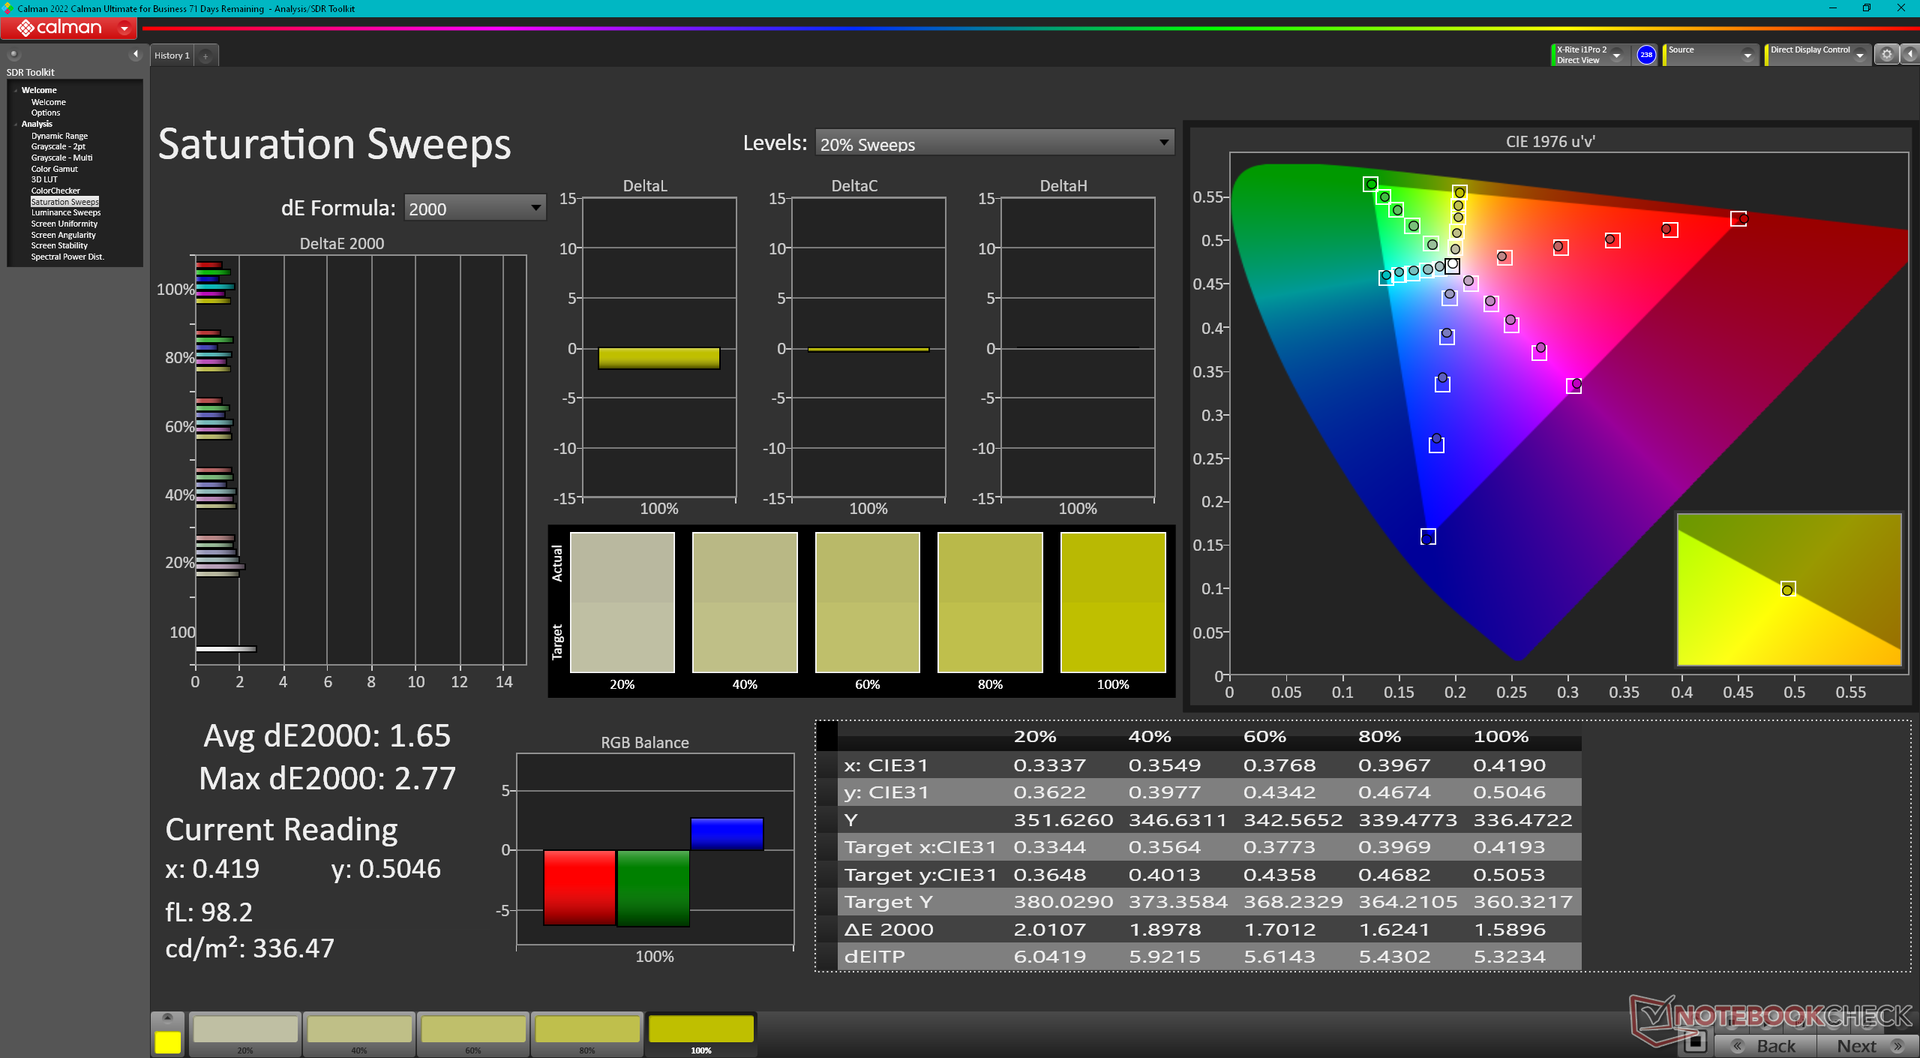
El panel no viene calibrado de fábrica. La temperatura de color es más cálida de lo previsto en 6000K, por lo que los colores en los niveles de saturación más bajos no son tan precisos como podrían ser. Calibrar el panel con nuestro colorímetro X-Rite aumentaría la temperatura de color a los 6500K estándar para obtener colores más estables en todos los niveles de saturación.
Tiempos de respuesta del display
| ↔ Tiempo de respuesta de Negro a Blanco | ||
|---|---|---|
| 28.2 ms ... subida ↗ y bajada ↘ combinada | ↗ 21.6 ms subida | 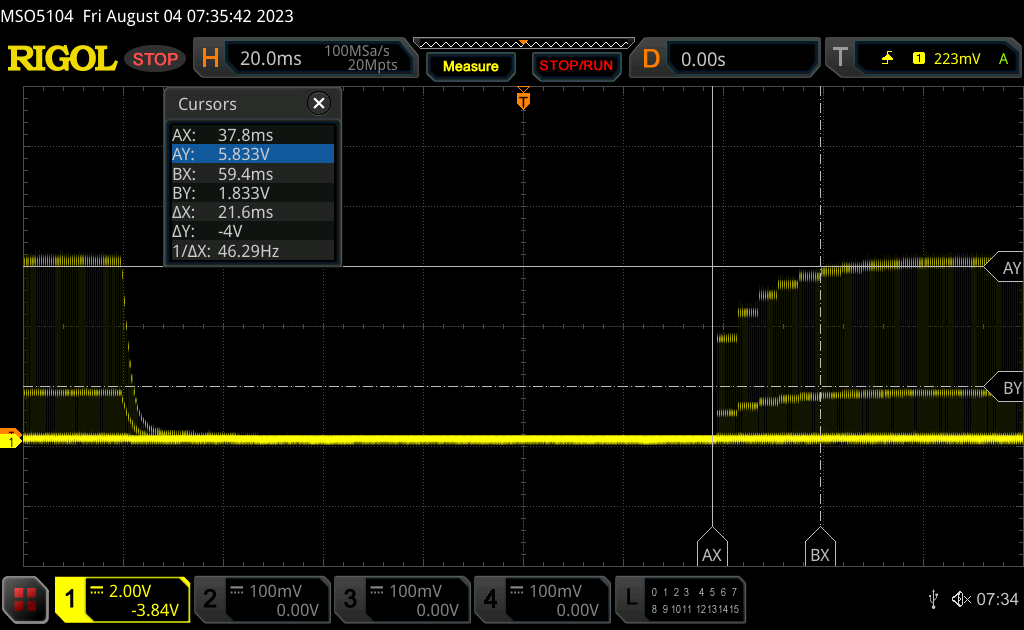 |
| ↘ 6.6 ms bajada | ||
| La pantalla mostró tiempos de respuesta relativamente lentos en nuestros tests pero podría ser demasiado lenta para los jugones. En comparación, todos los dispositivos de prueba van de ##min### (mínimo) a 240 (máximo) ms. » 75 % de todos los dispositivos son mejores. Eso quiere decir que el tiempo de respuesta es peor que la media (19.8 ms) de todos los dispositivos testados. | ||
| ↔ Tiempo de respuesta 50% Gris a 80% Gris | ||
| 26.4 ms ... subida ↗ y bajada ↘ combinada | ↗ 15 ms subida | 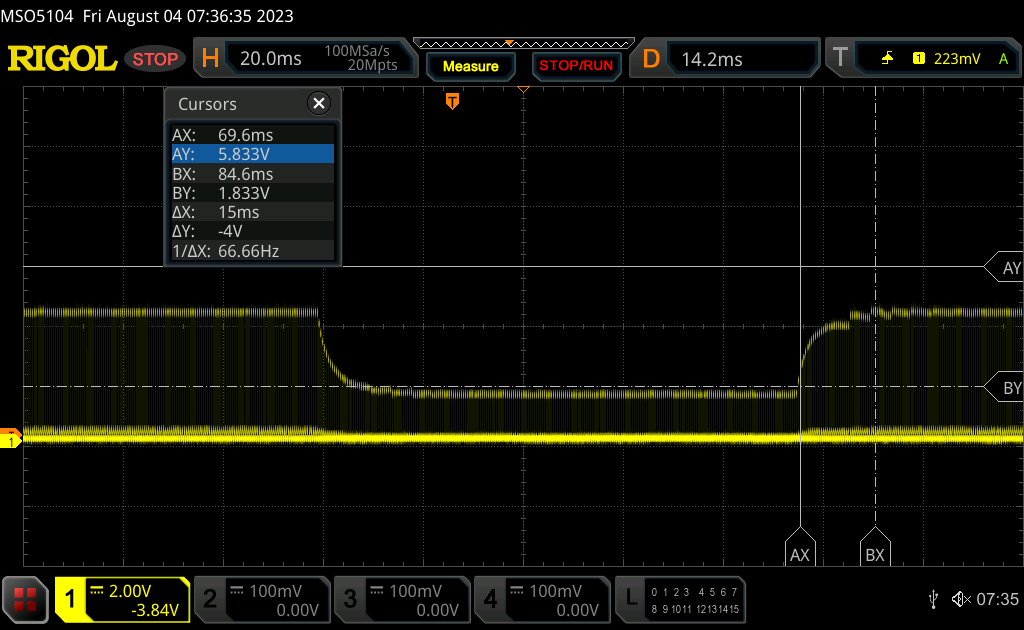 |
| ↘ 11.4 ms bajada | ||
| La pantalla mostró tiempos de respuesta relativamente lentos en nuestros tests pero podría ser demasiado lenta para los jugones. En comparación, todos los dispositivos de prueba van de ##min### (mínimo) a 636 (máximo) ms. » 36 % de todos los dispositivos son mejores. Esto quiere decir que el tiempo de respuesta medido es mejor que la media (31 ms) de todos los dispositivos testados. | ||
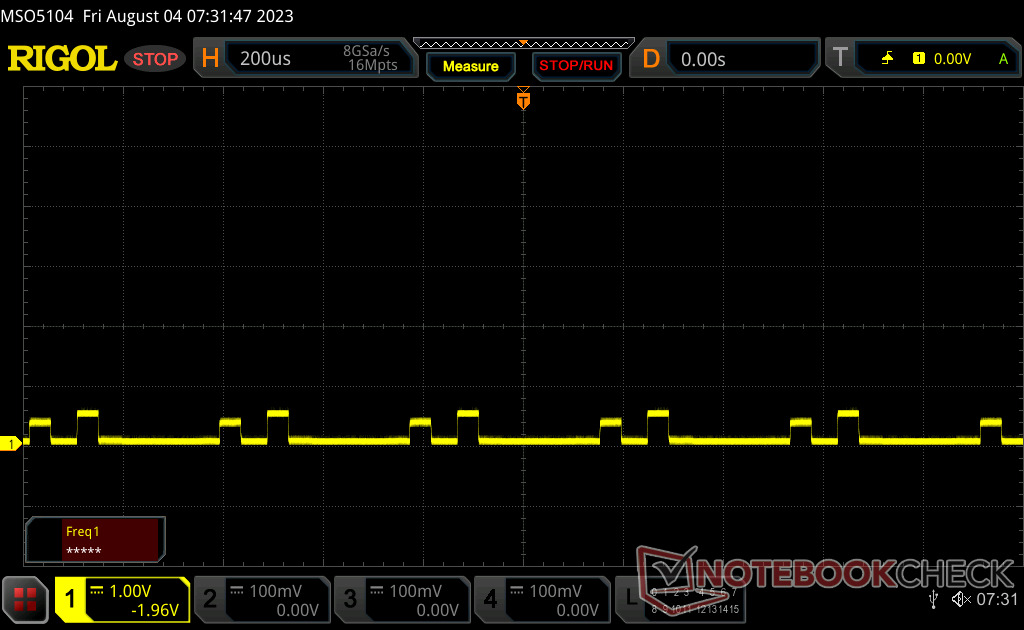
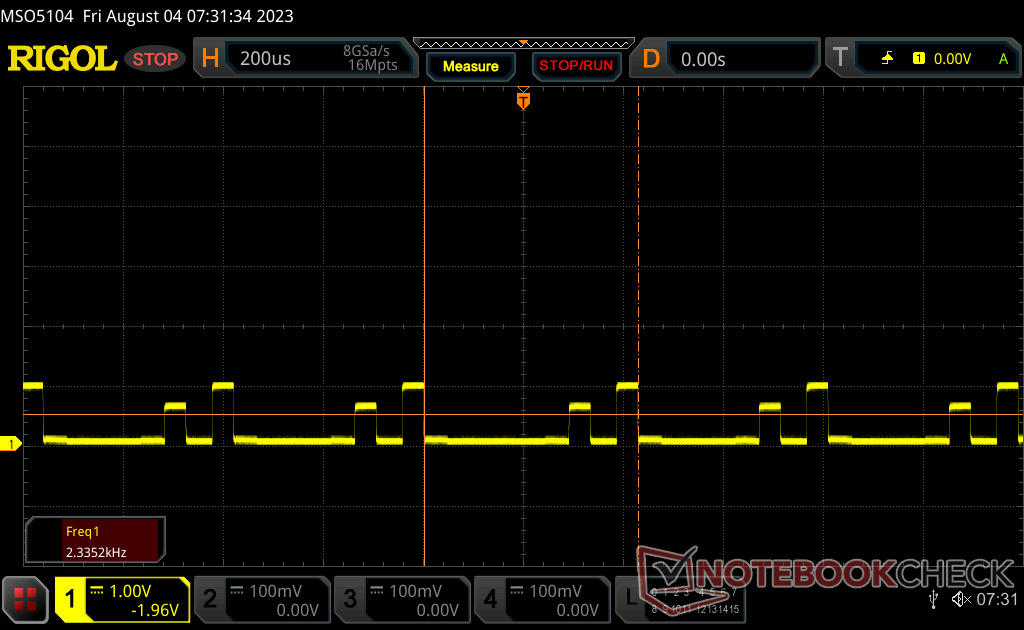
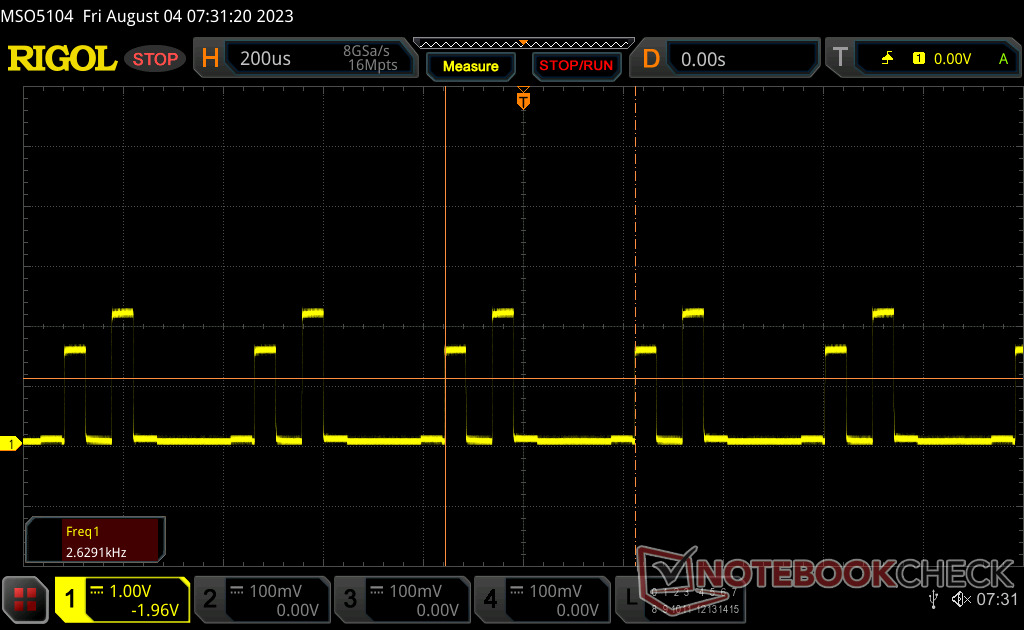
Parpadeo de Pantalla / PWM (Pulse-Width Modulation)
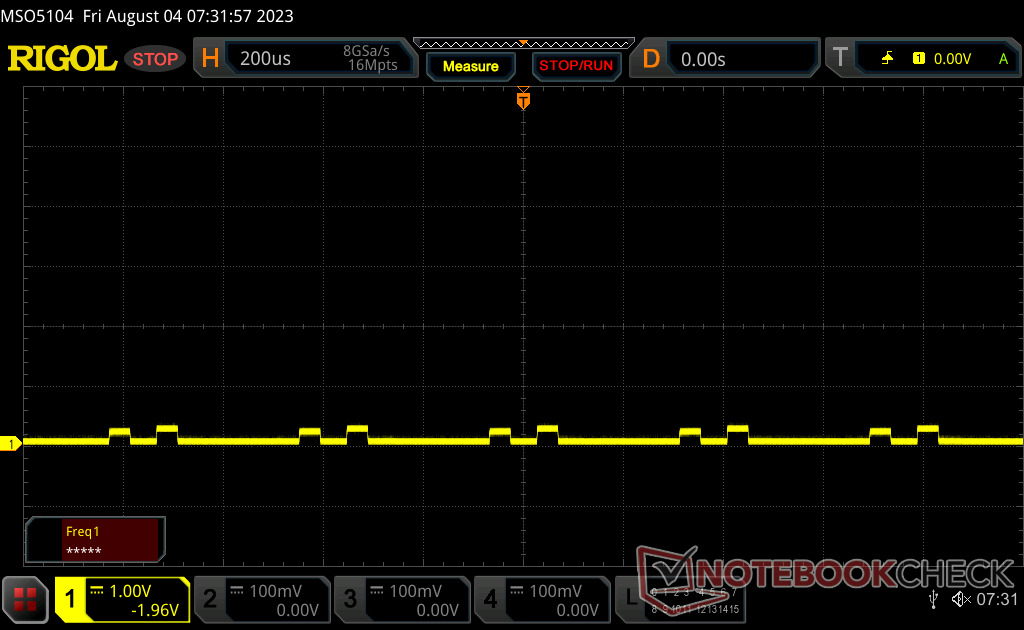
| Parpadeo de Pantalla / PWM detectado | 3506 Hz | ≤ 100 % de brillo | 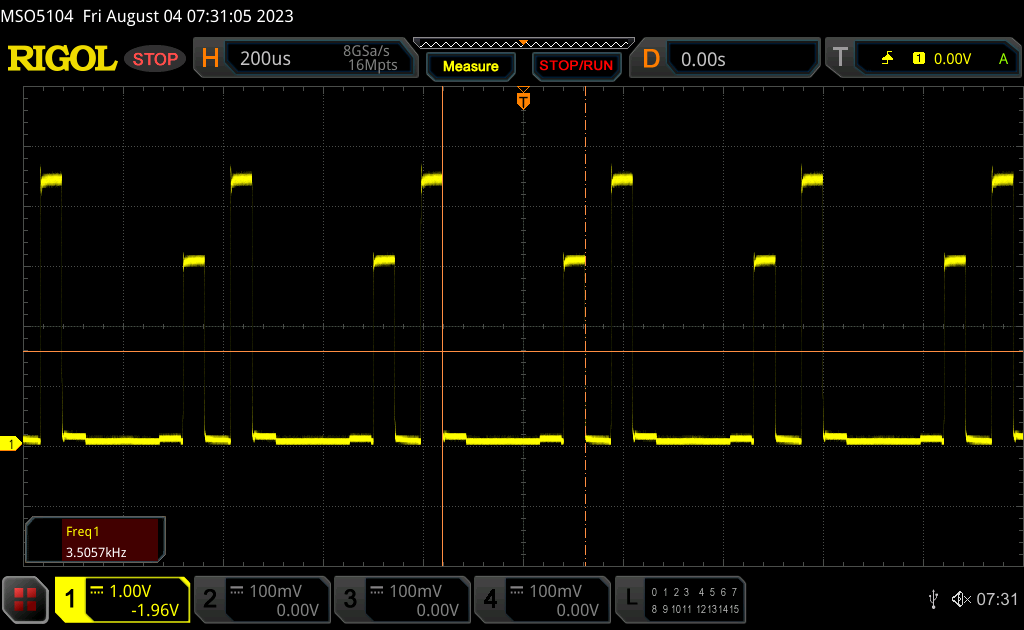 |
La retroiluminación del display parpadea a 3506 Hz (seguramente usa PWM - Pulse-Width Modulation) a un brillo del 100 % e inferior. Sobre este nivel de brillo no debería darse parpadeo / PWM. La frecuencia de 3506 Hz es bastante alta, por lo que la mayoría de gente sensible al parpadeo no debería ver parpadeo o tener fatiga visual. Comparación: 52 % de todos los dispositivos testados no usaron PWM para atenuar el display. Si se usó, medimos una media de 7754 (mínimo: 5 - máxmo: 343500) Hz. | |||
El parpadeo está presente en todos los niveles de brillo. Sin embargo, la frecuencia relativamente alta de 3506 Hz no debería ser un problema para la mayoría de los usuarios. El parpadeo también tiene la desafortunada consecuencia de hacer que los tiempos de respuesta sean más difíciles de medir con precisión.
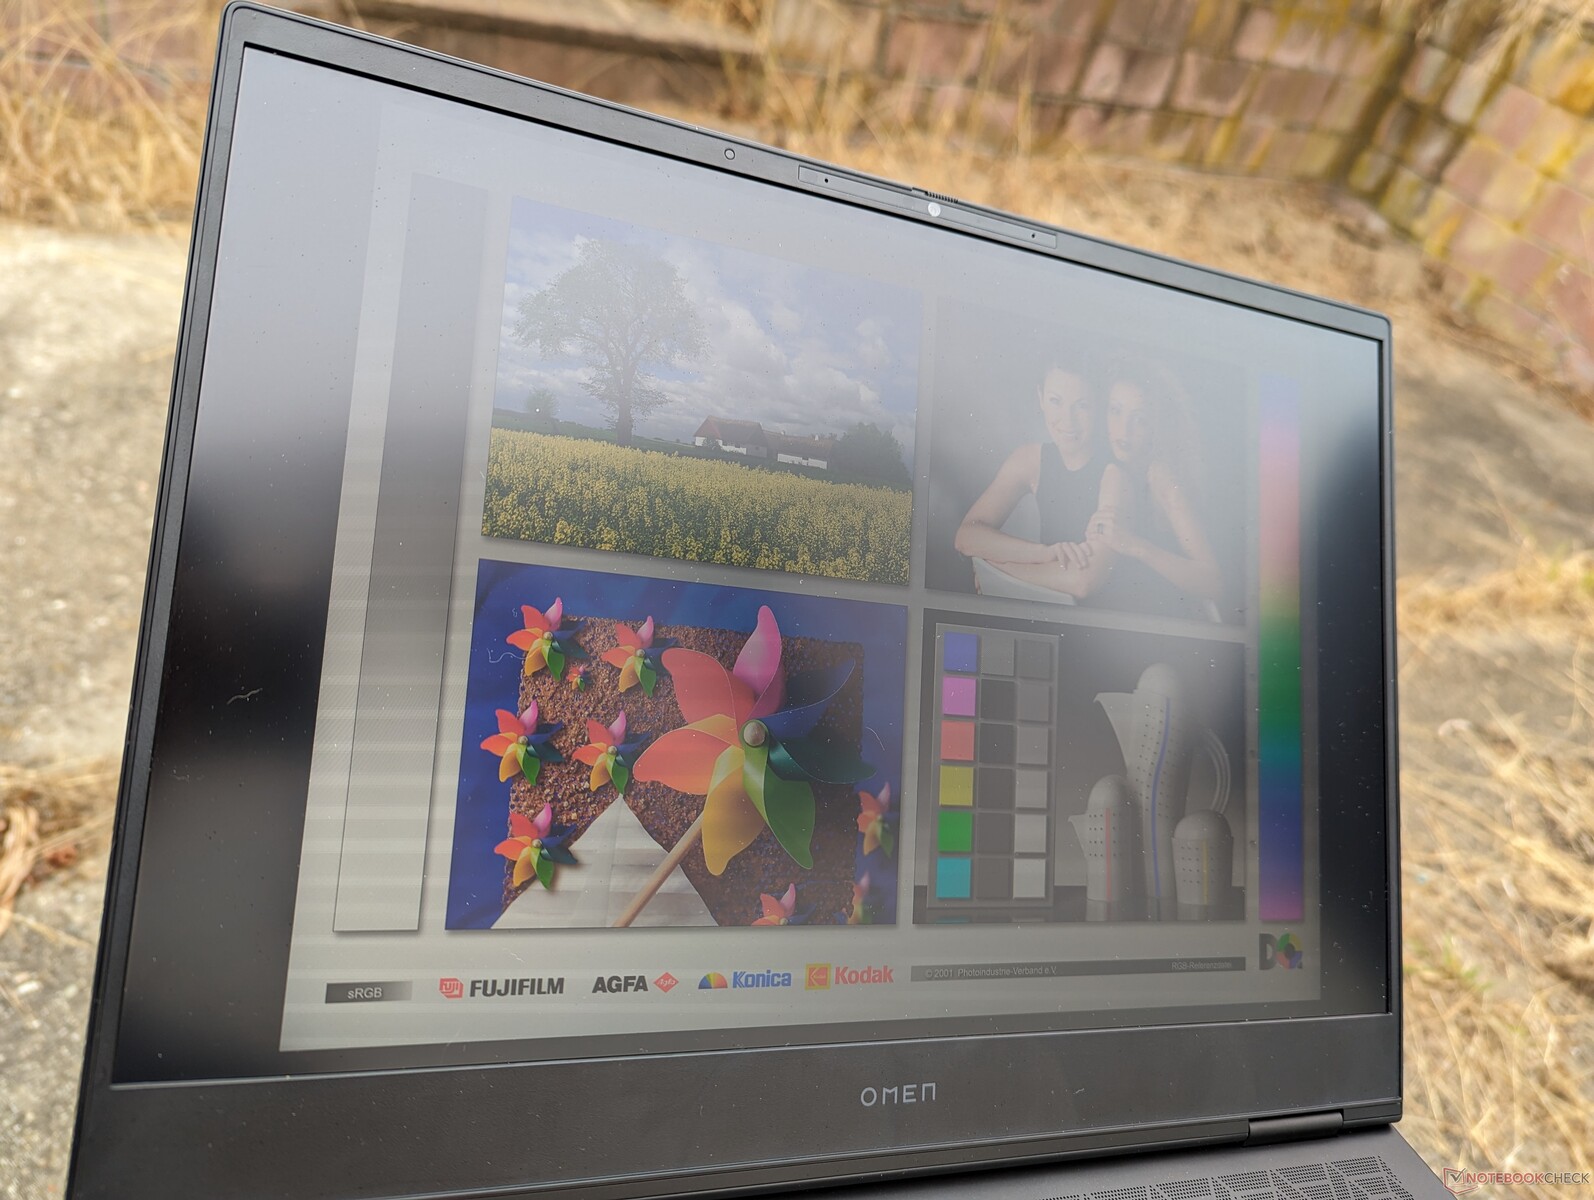
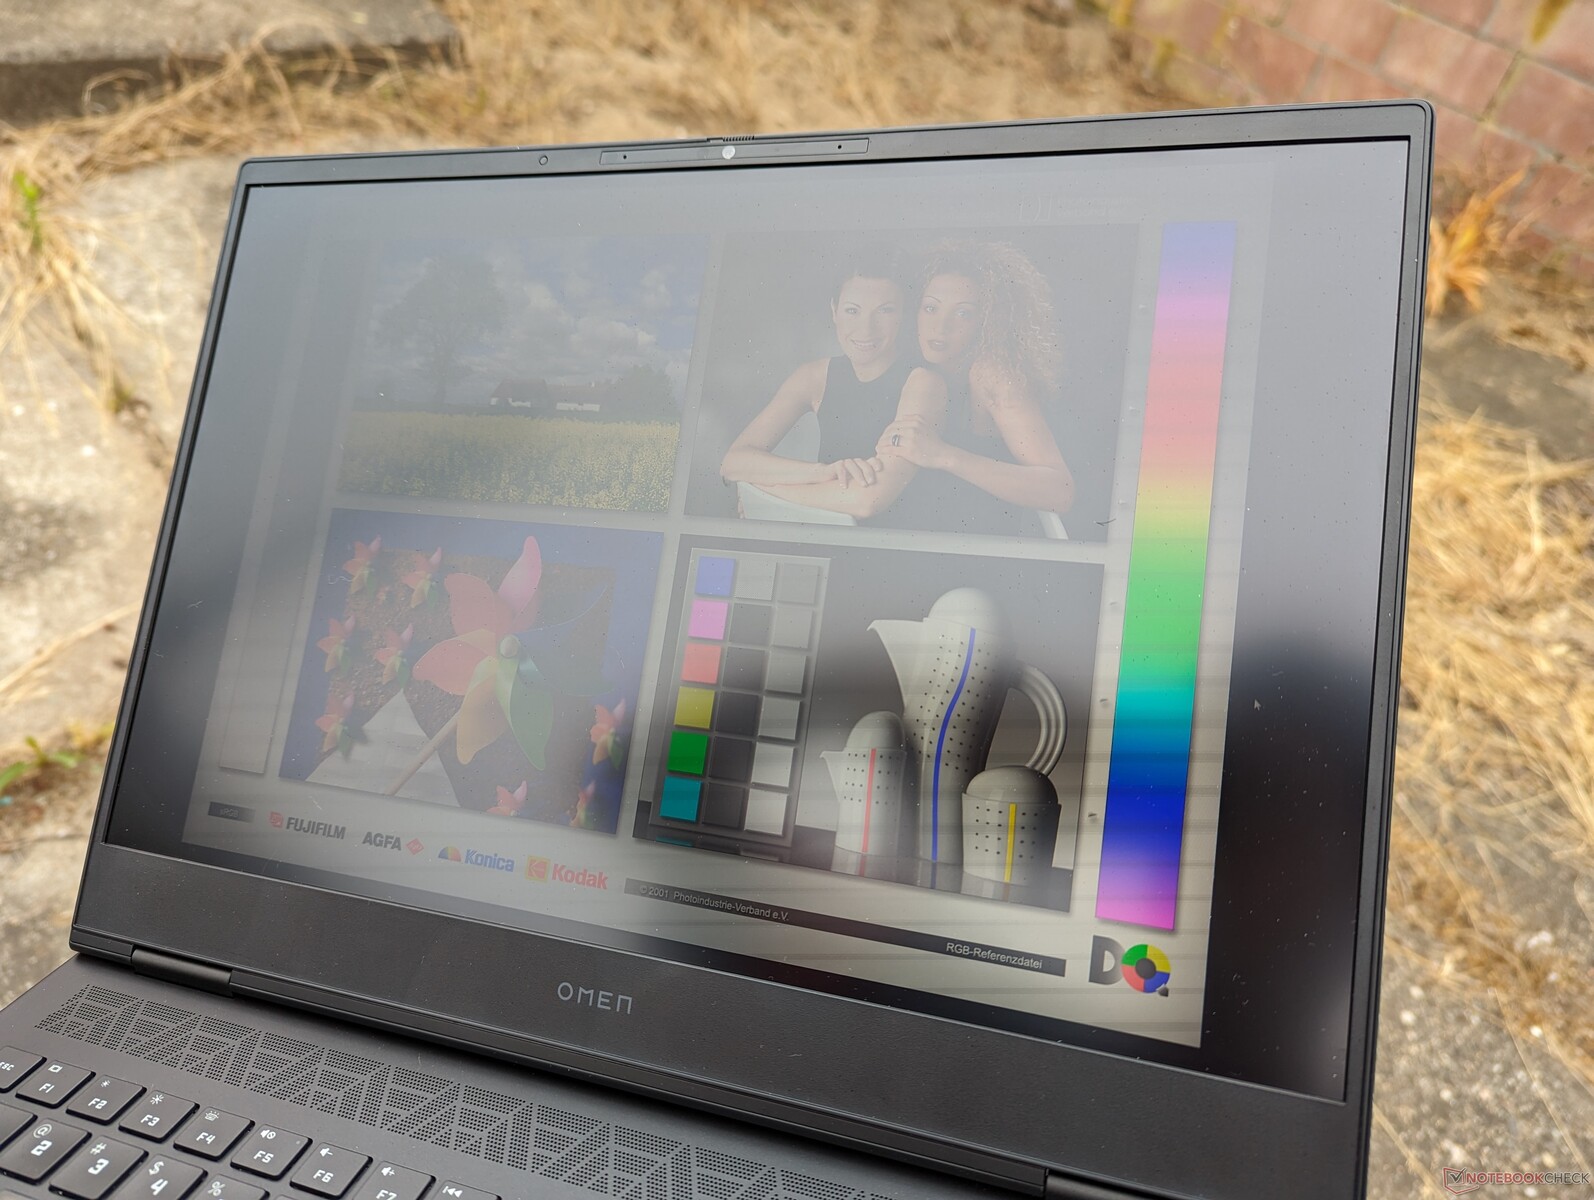
La visibilidad en exteriores es buena a la sombra, pero los colores quedan desvaídos en condiciones de mayor luminosidad o a la luz del sol. El brillo máximo de ~800 nits es sostenible con batería.
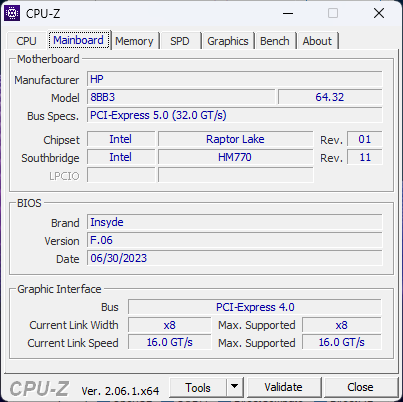
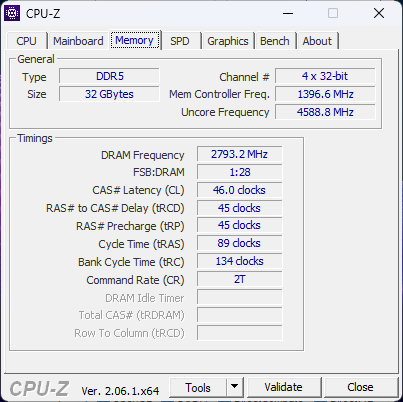
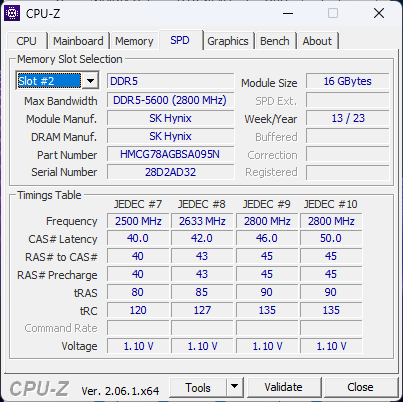
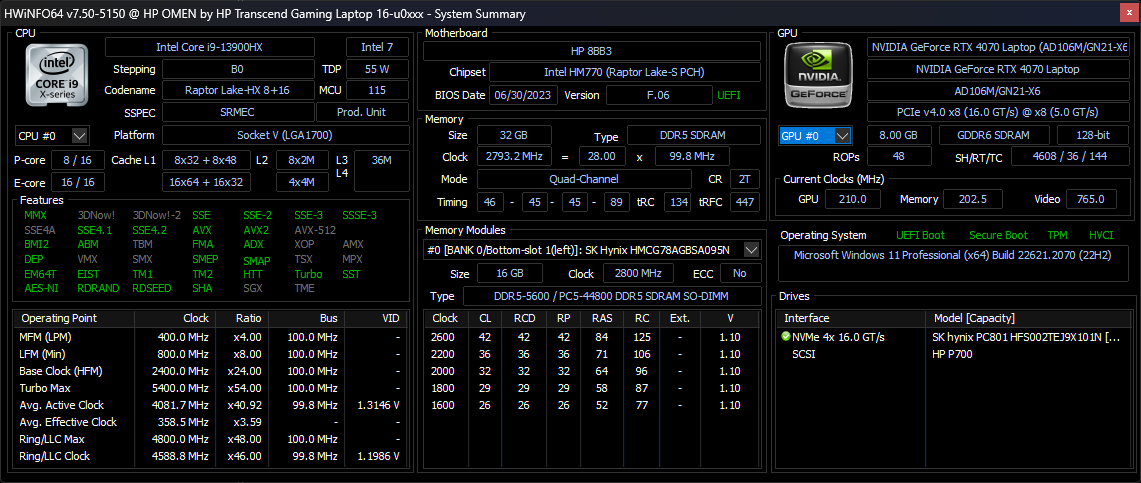
Rendimiento - 13ª generación Intel Raptor Lake-HX
Condiciones de ensayo
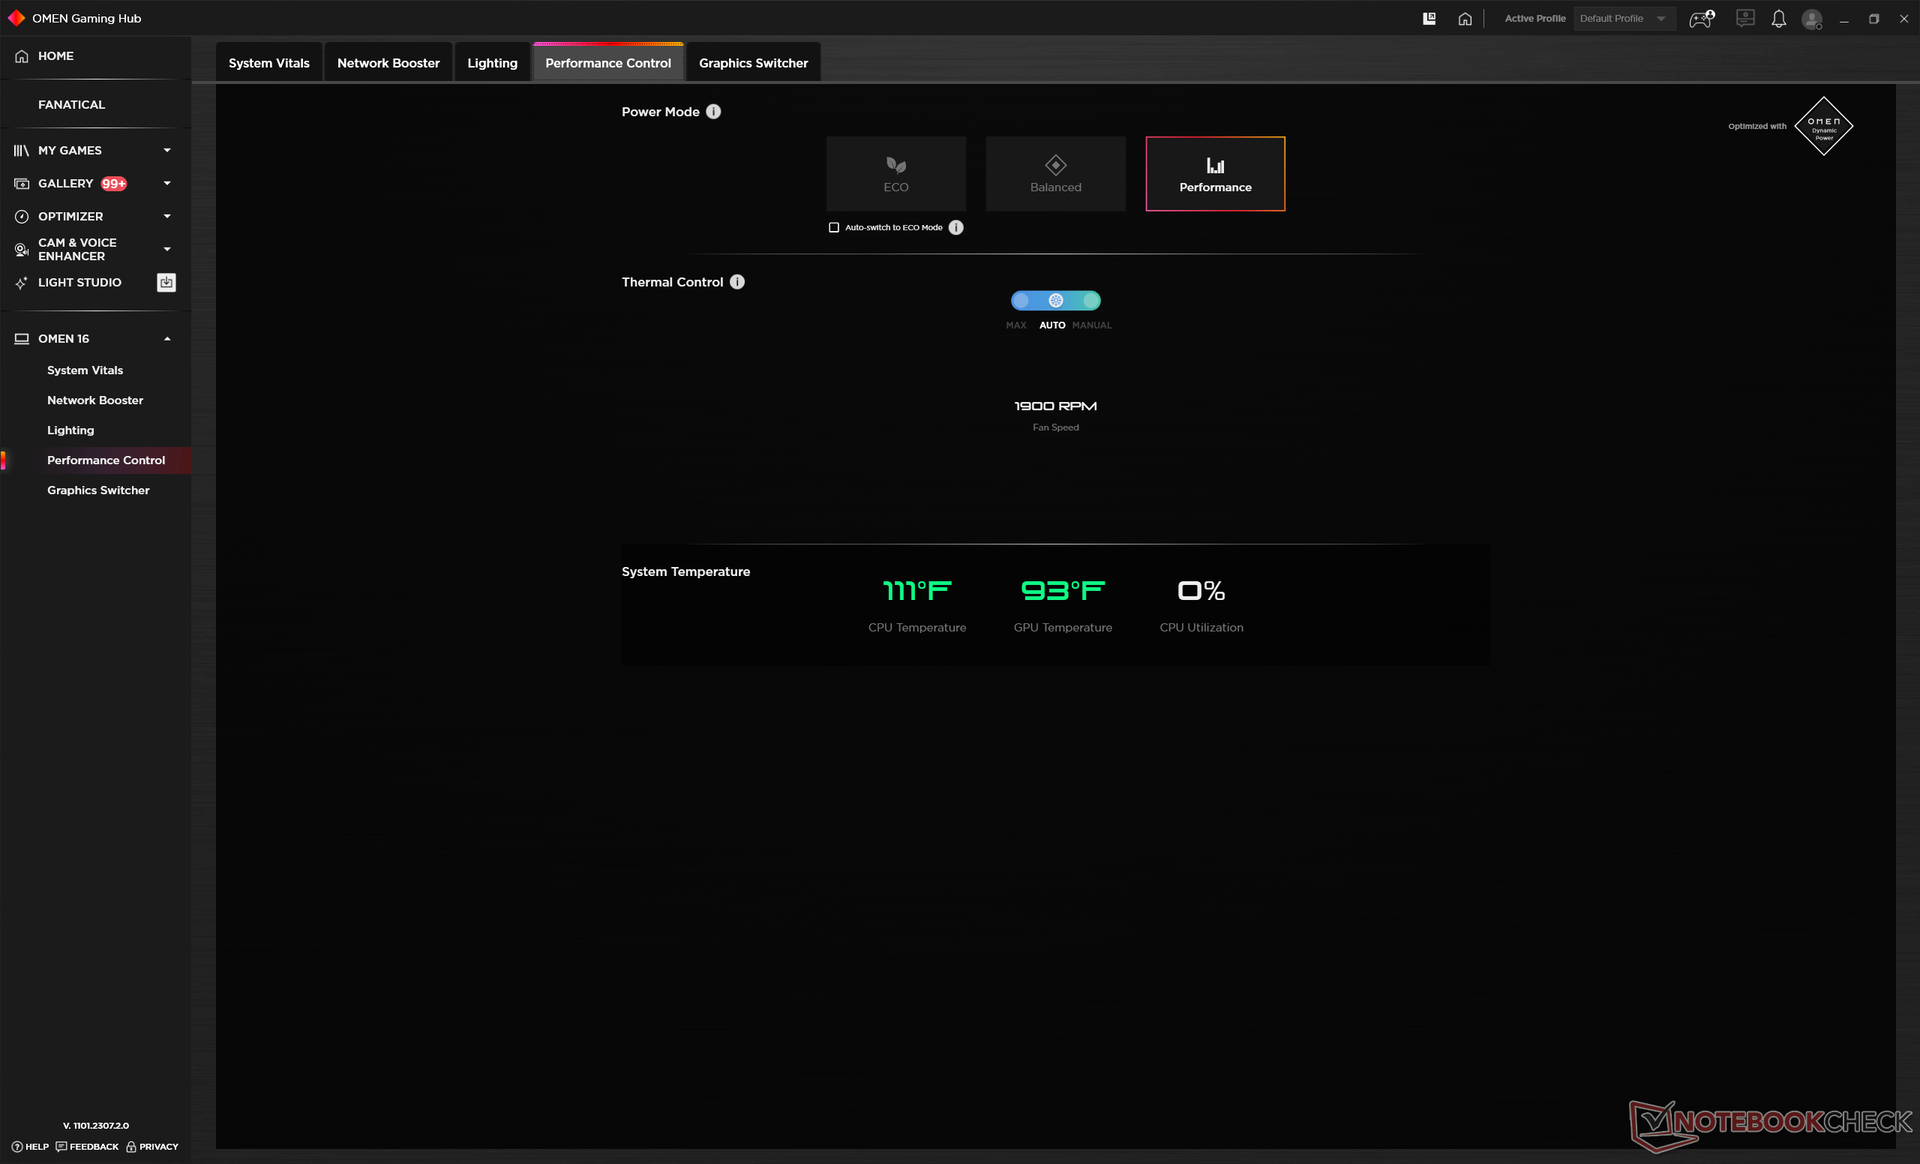
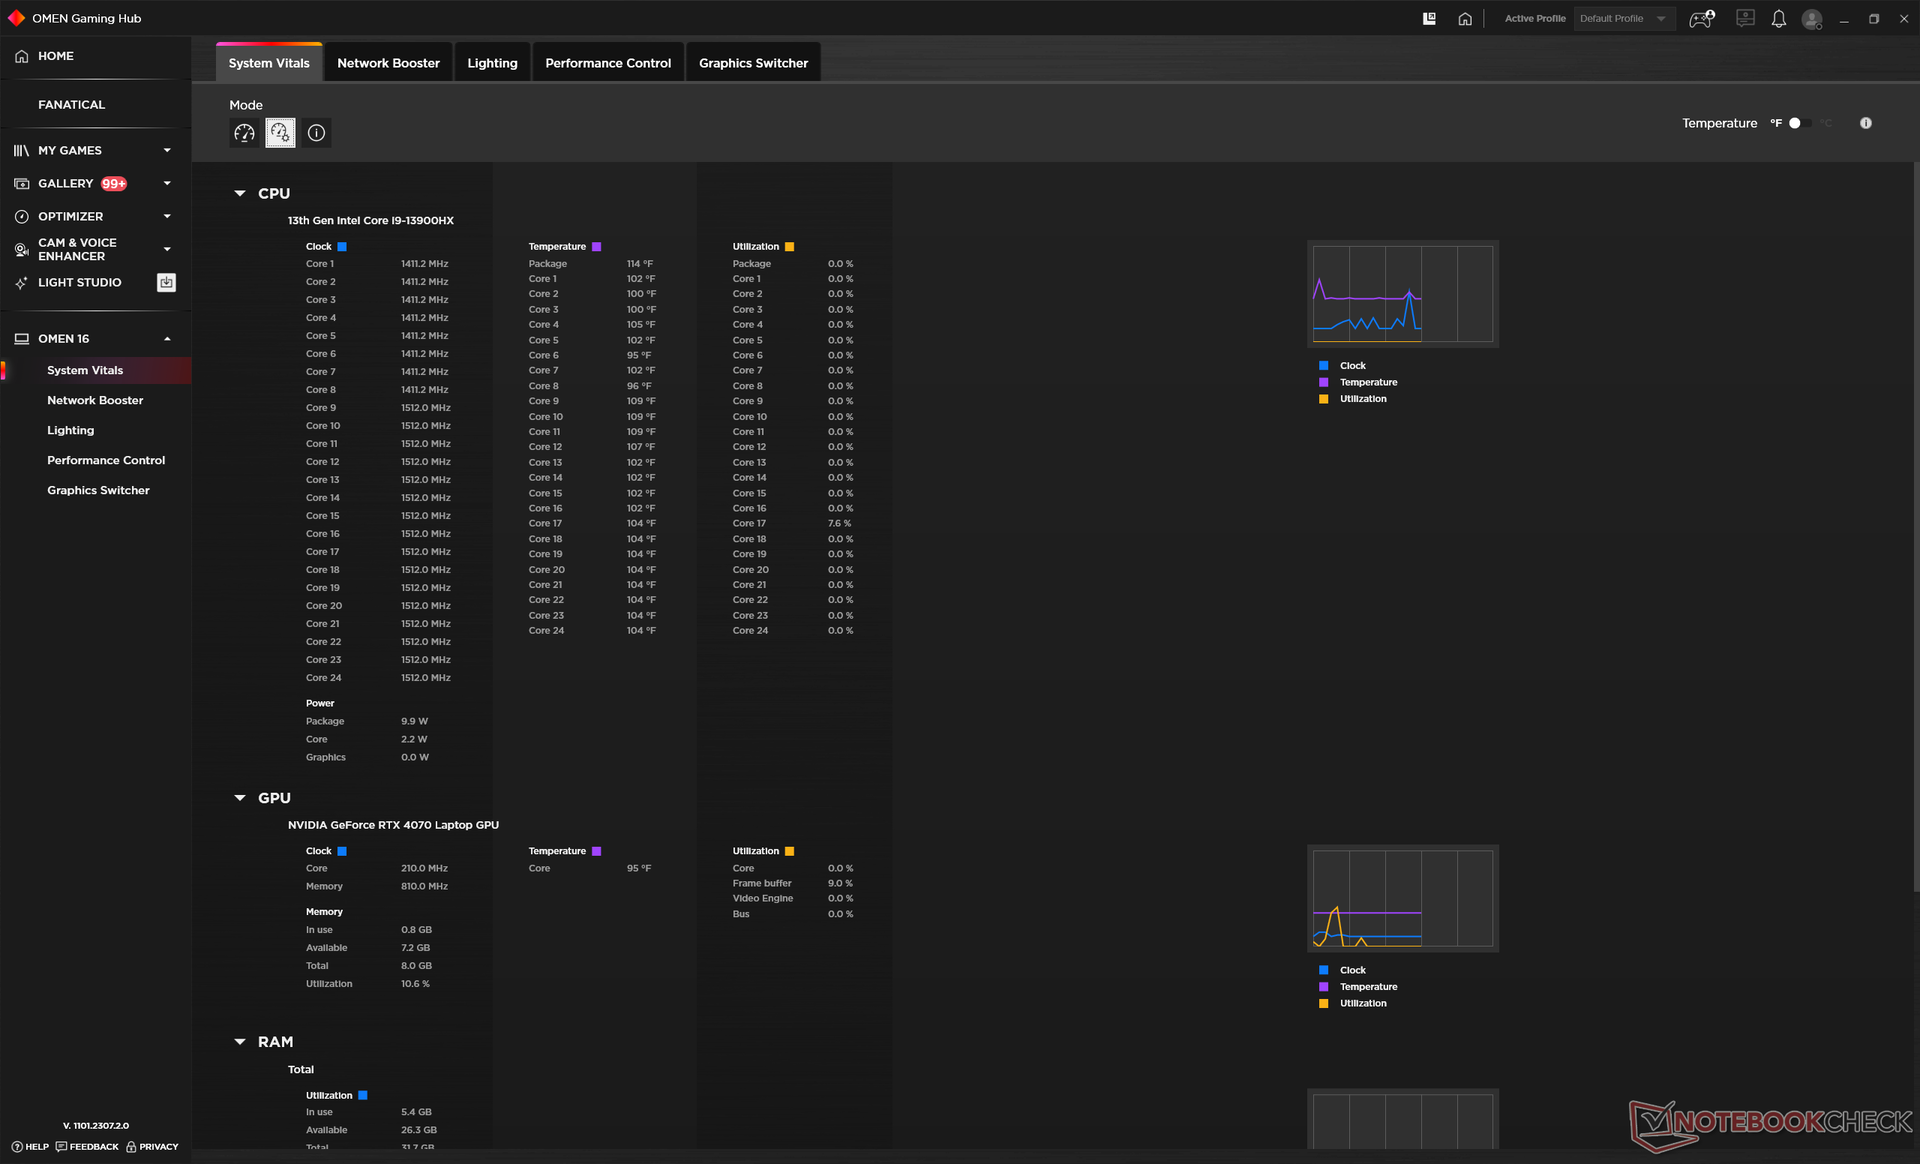
Pusimos nuestra unidad en modo Rendimiento a través de Windows y en modo Rendimiento de nuevo a través del software Omen Gaming Hub antes de ejecutar los benchmarks que se muestran a continuación. Lamentablemente, el ajuste de un perfil de energía no ajusta automáticamente el otro.
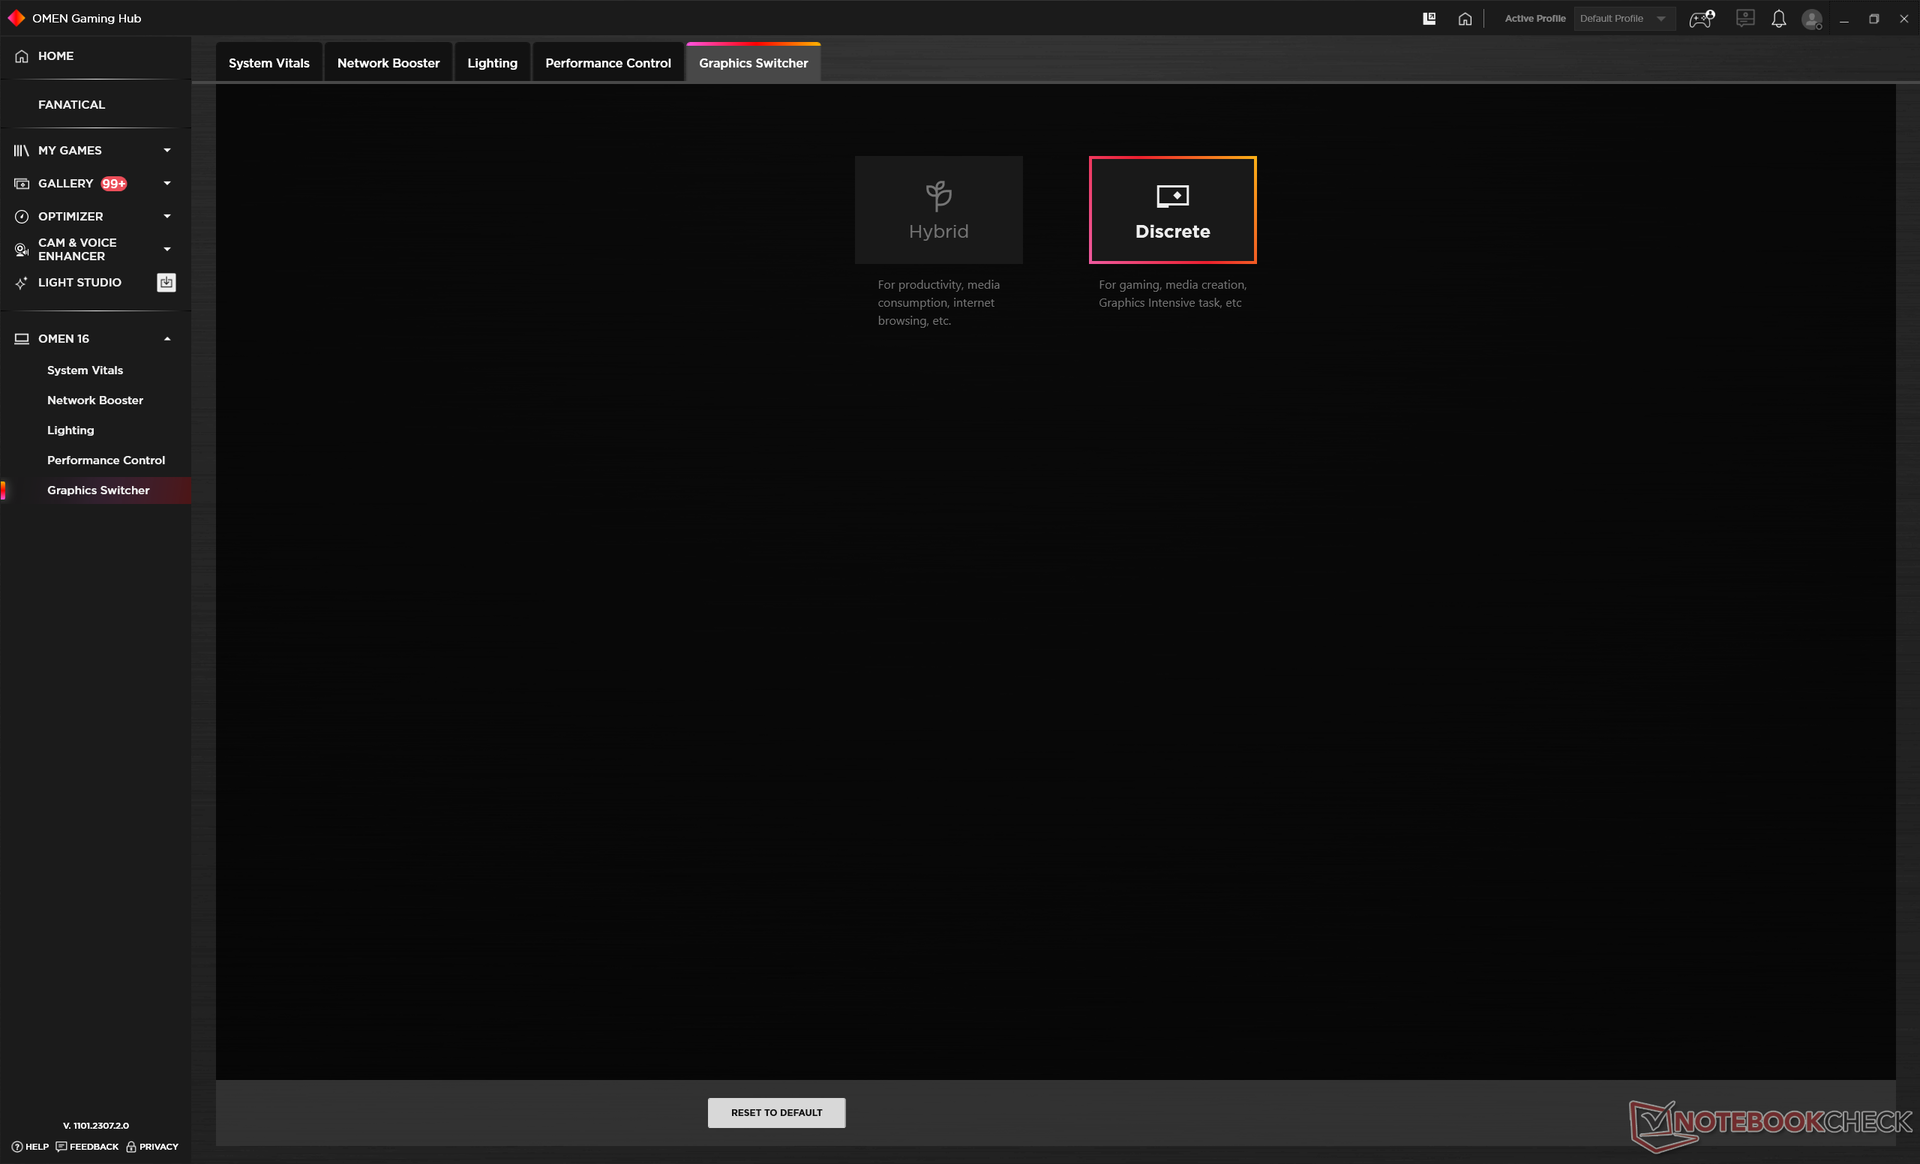
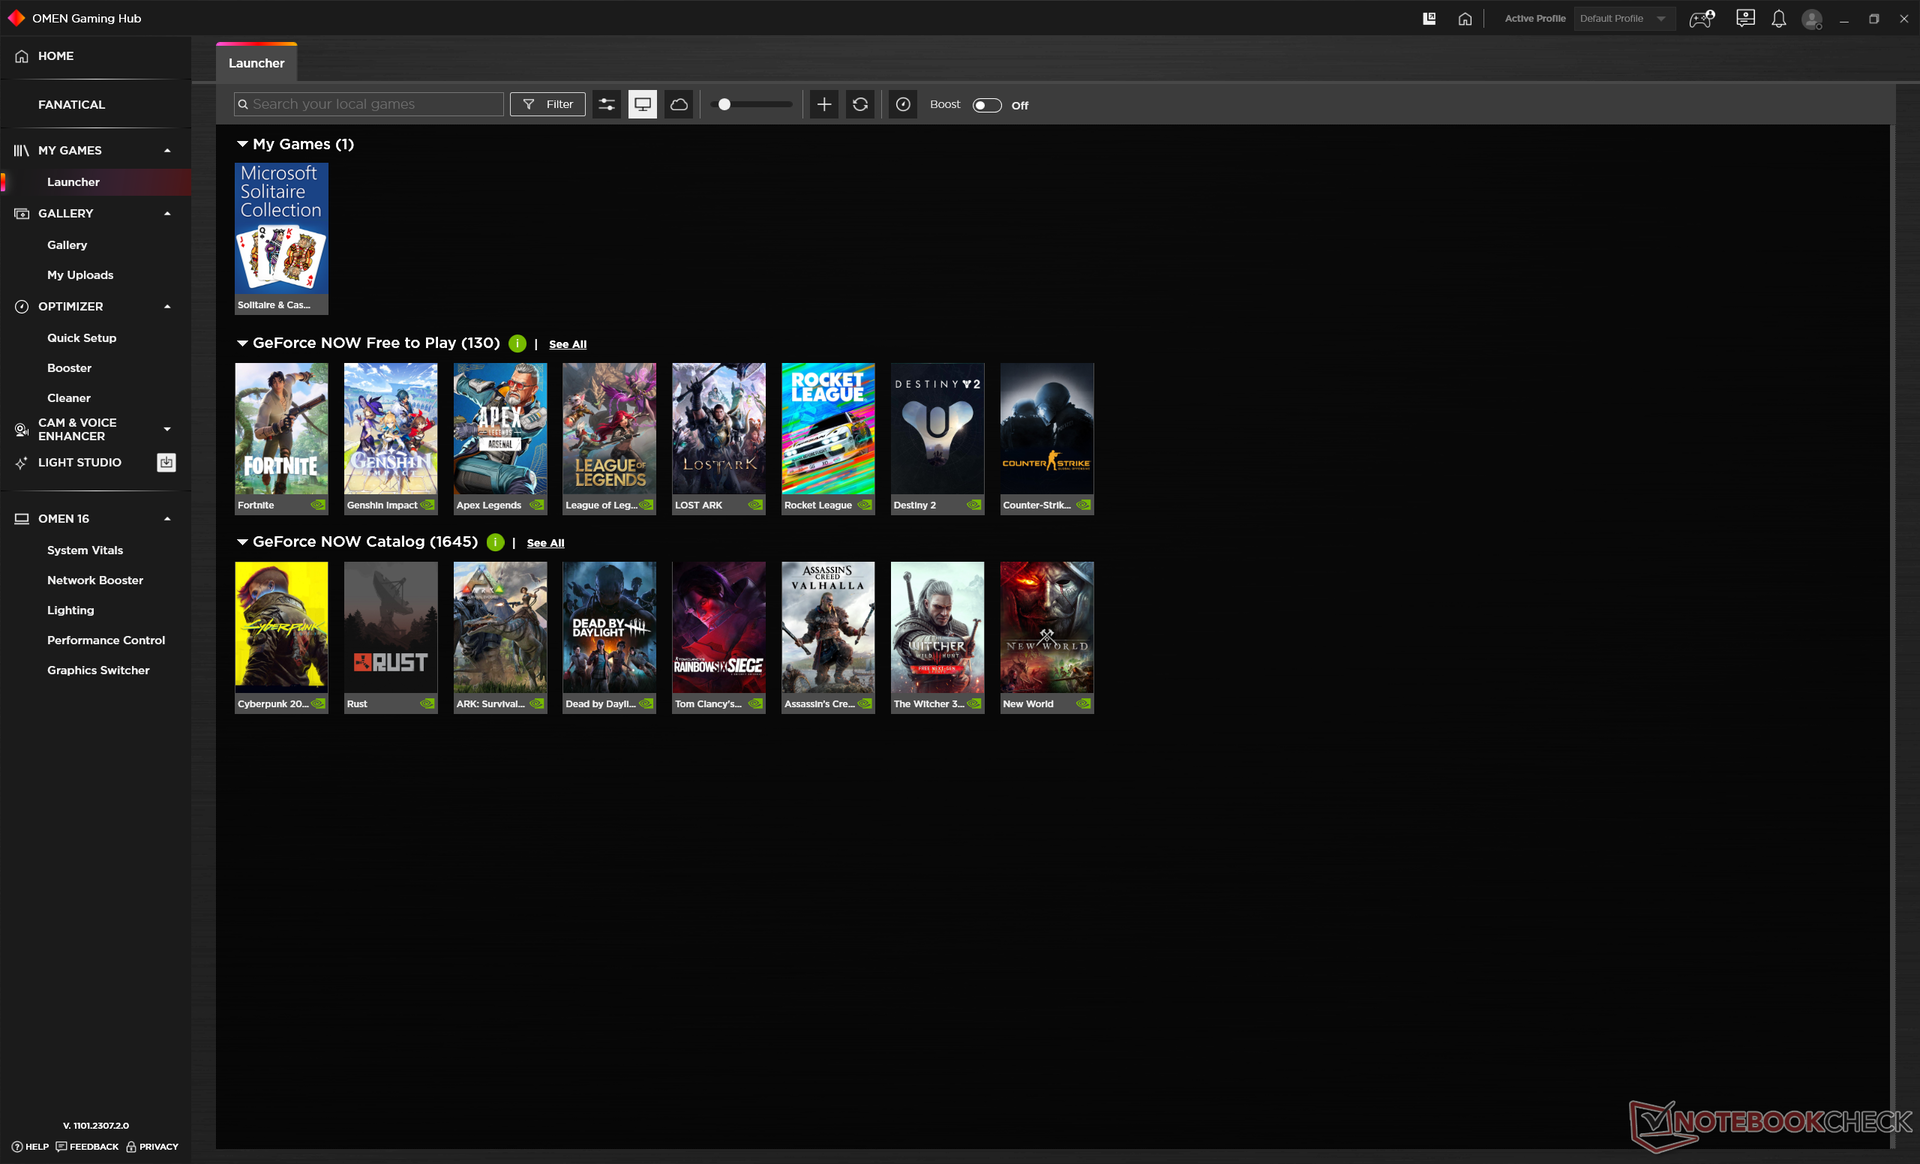
El interruptor MUX es accesible a través de Omen Gaming Hub como se muestra en las capturas de pantalla a continuación. Por lo tanto, se recomienda encarecidamente que los propietarios se familiaricen con el software ya que las características clave se conmutan aquí. Los perfiles de rendimiento y enterrado bajo varios submenús que es otro aspecto molesto del software.
Advanced Optimus u Optimus 2.0 no es compatible. Por tanto, es necesario un reinicio suave al cambiar entre la iGPU y la dGPU. G-Sync está soportado en la pantalla interna.

Procesador
ElCore i9-13900HX en el Omen Transcend 16 rinde entre un 5 y un 10 por ciento más lento que la media de portátiles de nuestra base de datos equipados con el mismo procesador. Un ejemplo extremo es el Lenovo Legion Pro 7 que puede ser hasta un 20 por ciento más rápido que nuestro HP a pesar de que ambos vienen con el Core i9-13900HX. Nuestro Omen Transcend 16 sigue siendo uno de los portátiles de juego más rápidos del mercado, pero el rendimiento del procesador podría haber sido sin duda un poco más rápido basándonos en nuestro tiempo con otros modelos de juego de gama alta.
Por lo demás, la estabilidad del rendimiento es excelente, sin grandes problemas de ralentización al ejecutar CineBench R15 xT en bucle.
Cinebench R15 Multi Loop
Cinebench R23: Multi Core | Single Core
Cinebench R20: CPU (Multi Core) | CPU (Single Core)
Cinebench R15: CPU Multi 64Bit | CPU Single 64Bit
Blender: v2.79 BMW27 CPU
7-Zip 18.03: 7z b 4 | 7z b 4 -mmt1
Geekbench 5.5: Multi-Core | Single-Core
HWBOT x265 Benchmark v2.2: 4k Preset
LibreOffice : 20 Documents To PDF
R Benchmark 2.5: Overall mean
| Blender / v2.79 BMW27 CPU | |
| Dell Inspiron 16 Plus 7610-MHJ8F | |
| HP Omen 16-n0033dx | |
| Acer Nitro 16 AN16-41 | |
| Lenovo Legion S7 16ARHA7 | |
| Asus ROG Zephyrus M16 GU603Z | |
| Lenovo Legion Pro 5 16ARX8 | |
| HP Omen Transcend 16 | |
| Medio Intel Core i9-13900HX (101 - 153, n=22) | |
| Asus Zephyrus Duo 16 GX650PY-NM006W | |
* ... más pequeño es mejor
AIDA64: FP32 Ray-Trace | FPU Julia | CPU SHA3 | CPU Queen | FPU SinJulia | FPU Mandel | CPU AES | CPU ZLib | FP64 Ray-Trace | CPU PhotoWorxx
| Performance rating | |
| Medio Intel Core i9-13900HX | |
| HP Omen Transcend 16 | |
| Alienware x16 R1 | |
| HP Omen 16-wf000 | |
| Lenovo Legion Slim 7i 16 Gen 8 | |
| Acer Nitro 16 AN16-41 | |
| Asus ROG Zephyrus M16 GU603Z | |
| AIDA64 / FP32 Ray-Trace | |
| Medio Intel Core i9-13900HX (17589 - 27615, n=22) | |
| HP Omen Transcend 16 | |
| HP Omen 16-wf000 | |
| Alienware x16 R1 | |
| Lenovo Legion Slim 7i 16 Gen 8 | |
| Acer Nitro 16 AN16-41 | |
| Asus ROG Zephyrus M16 GU603Z | |
| AIDA64 / FPU Julia | |
| Medio Intel Core i9-13900HX (88686 - 137015, n=22) | |
| HP Omen Transcend 16 | |
| Acer Nitro 16 AN16-41 | |
| HP Omen 16-wf000 | |
| Alienware x16 R1 | |
| Lenovo Legion Slim 7i 16 Gen 8 | |
| Asus ROG Zephyrus M16 GU603Z | |
| AIDA64 / CPU SHA3 | |
| Medio Intel Core i9-13900HX (4362 - 7029, n=22) | |
| HP Omen Transcend 16 | |
| HP Omen 16-wf000 | |
| Alienware x16 R1 | |
| Lenovo Legion Slim 7i 16 Gen 8 | |
| Asus ROG Zephyrus M16 GU603Z | |
| Acer Nitro 16 AN16-41 | |
| AIDA64 / CPU Queen | |
| Medio Intel Core i9-13900HX (125644 - 141385, n=22) | |
| HP Omen Transcend 16 | |
| Lenovo Legion Slim 7i 16 Gen 8 | |
| Alienware x16 R1 | |
| Acer Nitro 16 AN16-41 | |
| Asus ROG Zephyrus M16 GU603Z | |
| HP Omen 16-wf000 | |
| AIDA64 / FPU SinJulia | |
| Medio Intel Core i9-13900HX (12334 - 17179, n=22) | |
| HP Omen Transcend 16 | |
| Acer Nitro 16 AN16-41 | |
| HP Omen 16-wf000 | |
| Alienware x16 R1 | |
| Lenovo Legion Slim 7i 16 Gen 8 | |
| Asus ROG Zephyrus M16 GU603Z | |
| AIDA64 / FPU Mandel | |
| Medio Intel Core i9-13900HX (43850 - 69202, n=22) | |
| HP Omen Transcend 16 | |
| Acer Nitro 16 AN16-41 | |
| HP Omen 16-wf000 | |
| Alienware x16 R1 | |
| Lenovo Legion Slim 7i 16 Gen 8 | |
| Asus ROG Zephyrus M16 GU603Z | |
| AIDA64 / CPU AES | |
| Medio Intel Core i9-13900HX (89413 - 237881, n=22) | |
| Asus ROG Zephyrus M16 GU603Z | |
| HP Omen Transcend 16 | |
| HP Omen 16-wf000 | |
| Alienware x16 R1 | |
| Lenovo Legion Slim 7i 16 Gen 8 | |
| Acer Nitro 16 AN16-41 | |
| AIDA64 / CPU ZLib | |
| Medio Intel Core i9-13900HX (1284 - 1958, n=22) | |
| HP Omen Transcend 16 | |
| HP Omen 16-wf000 | |
| Lenovo Legion Slim 7i 16 Gen 8 | |
| Alienware x16 R1 | |
| Asus ROG Zephyrus M16 GU603Z | |
| Acer Nitro 16 AN16-41 | |
| AIDA64 / FP64 Ray-Trace | |
| Medio Intel Core i9-13900HX (9481 - 15279, n=22) | |
| HP Omen Transcend 16 | |
| HP Omen 16-wf000 | |
| Alienware x16 R1 | |
| Lenovo Legion Slim 7i 16 Gen 8 | |
| Acer Nitro 16 AN16-41 | |
| Asus ROG Zephyrus M16 GU603Z | |
| AIDA64 / CPU PhotoWorxx | |
| HP Omen Transcend 16 | |
| Alienware x16 R1 | |
| Medio Intel Core i9-13900HX (42994 - 51994, n=22) | |
| Asus ROG Zephyrus M16 GU603Z | |
| HP Omen 16-wf000 | |
| Acer Nitro 16 AN16-41 | |
| Lenovo Legion Slim 7i 16 Gen 8 | |
Rendimiento del sistema
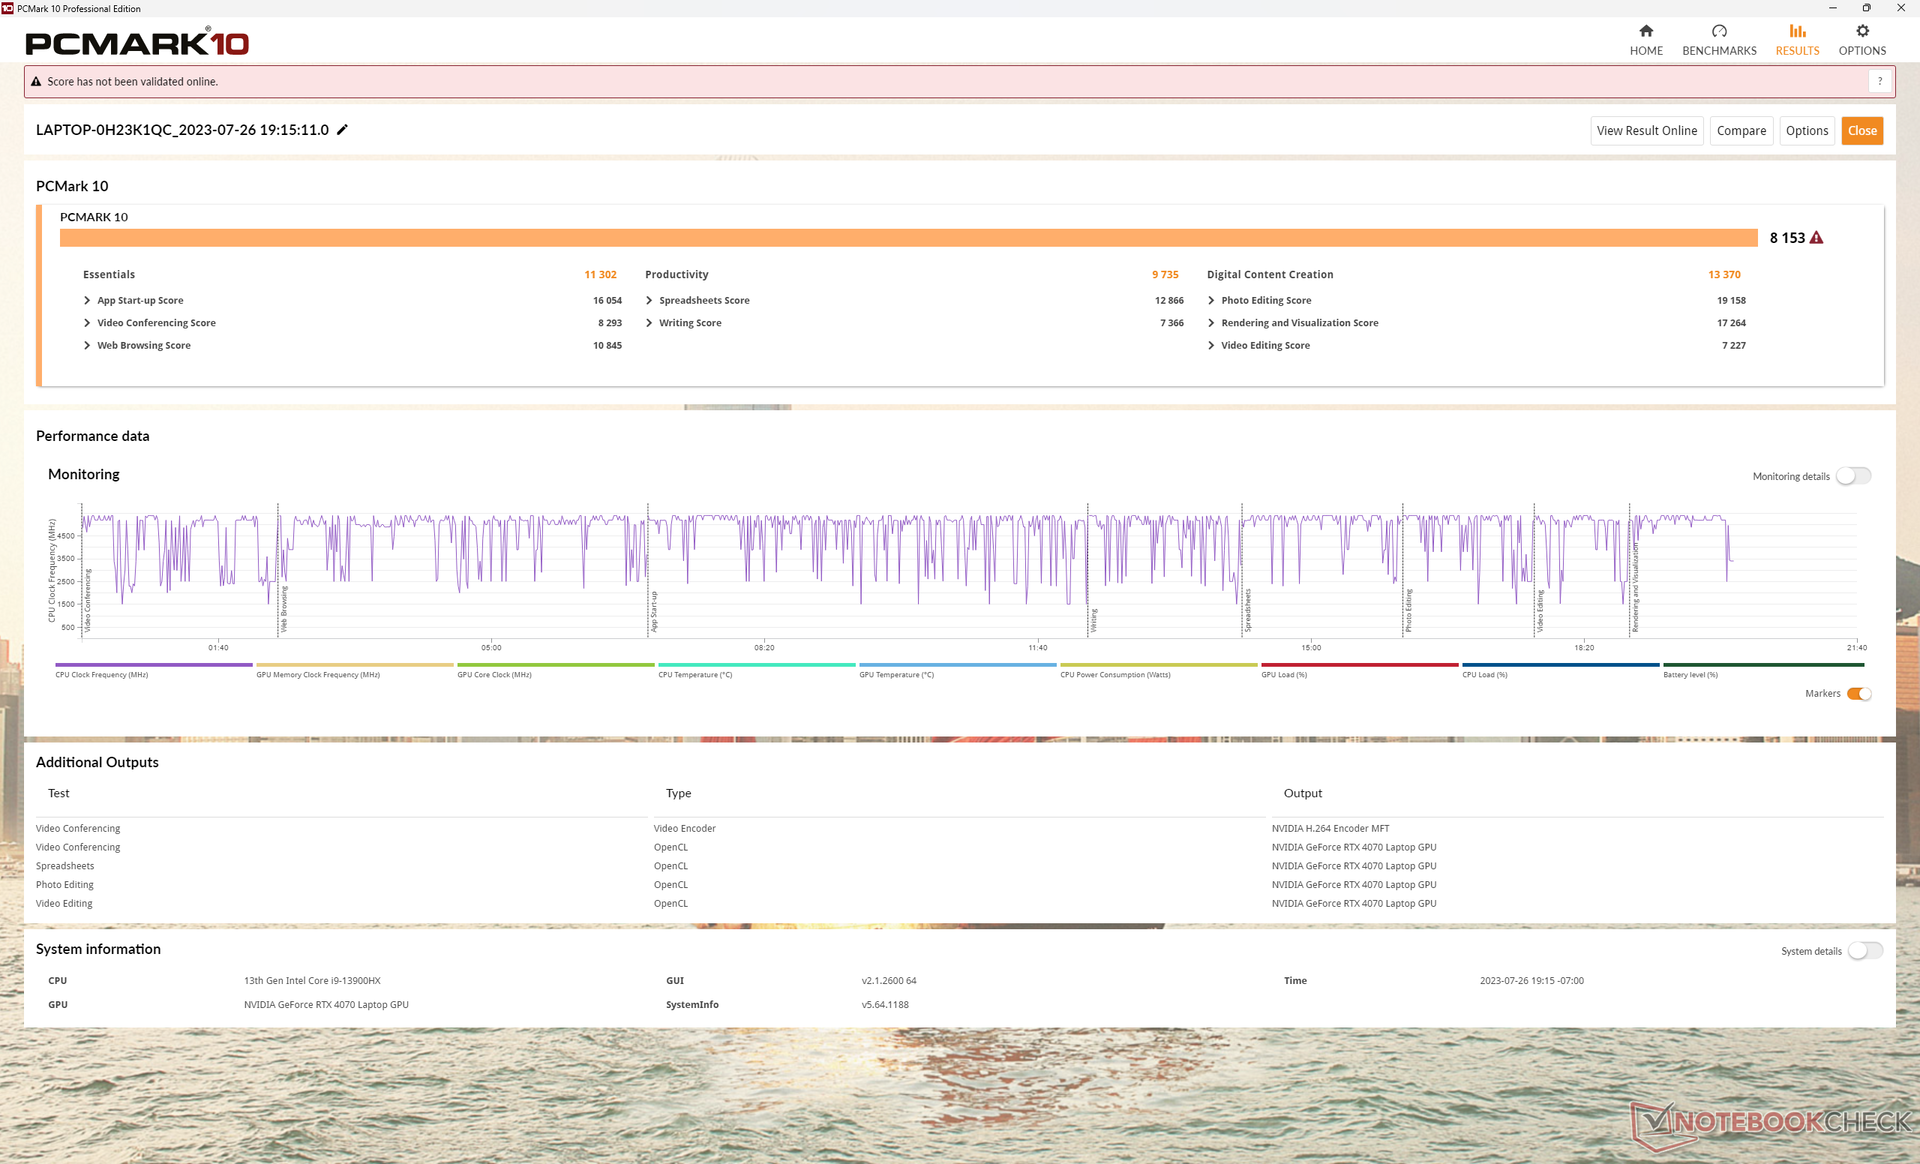
Los resultados de PCMark son ligeramente superiores a los del Omen 16 con RTX 4080, excepto en Creación de contenido digital, debido a nuestra RTX 4070 más lenta. No experimentamos problemas de despertar del reposo o BSODs a diferencia de nuestro reciente Lenovo Slim Pro 9i 16.
CrossMark: Overall | Productivity | Creativity | Responsiveness
| PCMark 10 / Score | |
| Lenovo Legion Slim 7i 16 Gen 8 | |
| Alienware x16 R1 | |
| HP Omen Transcend 16 | |
| Asus ROG Zephyrus M16 GU603Z | |
| HP Omen 16-wf000 | |
| Medio Intel Core i9-13900HX, NVIDIA GeForce RTX 4070 Laptop GPU (6956 - 8153, n=3) | |
| Acer Nitro 16 AN16-41 | |
| PCMark 10 / Essentials | |
| Lenovo Legion Slim 7i 16 Gen 8 | |
| HP Omen Transcend 16 | |
| Alienware x16 R1 | |
| Medio Intel Core i9-13900HX, NVIDIA GeForce RTX 4070 Laptop GPU (9865 - 11653, n=3) | |
| Asus ROG Zephyrus M16 GU603Z | |
| Acer Nitro 16 AN16-41 | |
| HP Omen 16-wf000 | |
| PCMark 10 / Productivity | |
| Lenovo Legion Slim 7i 16 Gen 8 | |
| Asus ROG Zephyrus M16 GU603Z | |
| Alienware x16 R1 | |
| HP Omen Transcend 16 | |
| Medio Intel Core i9-13900HX, NVIDIA GeForce RTX 4070 Laptop GPU (9470 - 9850, n=3) | |
| Acer Nitro 16 AN16-41 | |
| HP Omen 16-wf000 | |
| PCMark 10 / Digital Content Creation | |
| Alienware x16 R1 | |
| Lenovo Legion Slim 7i 16 Gen 8 | |
| HP Omen 16-wf000 | |
| HP Omen Transcend 16 | |
| Asus ROG Zephyrus M16 GU603Z | |
| Medio Intel Core i9-13900HX, NVIDIA GeForce RTX 4070 Laptop GPU (9776 - 13370, n=3) | |
| Acer Nitro 16 AN16-41 | |
| CrossMark / Overall | |
| Lenovo Legion Slim 7i 16 Gen 8 | |
| HP Omen Transcend 16 | |
| Medio Intel Core i9-13900HX, NVIDIA GeForce RTX 4070 Laptop GPU (1842 - 2029, n=3) | |
| Alienware x16 R1 | |
| Asus ROG Zephyrus M16 GU603Z | |
| HP Omen 16-wf000 | |
| Acer Nitro 16 AN16-41 | |
| CrossMark / Productivity | |
| Lenovo Legion Slim 7i 16 Gen 8 | |
| Alienware x16 R1 | |
| HP Omen Transcend 16 | |
| Asus ROG Zephyrus M16 GU603Z | |
| Medio Intel Core i9-13900HX, NVIDIA GeForce RTX 4070 Laptop GPU (1700 - 1872, n=3) | |
| HP Omen 16-wf000 | |
| Acer Nitro 16 AN16-41 | |
| CrossMark / Creativity | |
| HP Omen Transcend 16 | |
| Medio Intel Core i9-13900HX, NVIDIA GeForce RTX 4070 Laptop GPU (2088 - 2316, n=3) | |
| Lenovo Legion Slim 7i 16 Gen 8 | |
| Alienware x16 R1 | |
| Asus ROG Zephyrus M16 GU603Z | |
| HP Omen 16-wf000 | |
| Acer Nitro 16 AN16-41 | |
| CrossMark / Responsiveness | |
| Alienware x16 R1 | |
| Lenovo Legion Slim 7i 16 Gen 8 | |
| Asus ROG Zephyrus M16 GU603Z | |
| Medio Intel Core i9-13900HX, NVIDIA GeForce RTX 4070 Laptop GPU (1557 - 1752, n=3) | |
| HP Omen Transcend 16 | |
| HP Omen 16-wf000 | |
| Acer Nitro 16 AN16-41 | |
| PCMark 10 Score | 8153 puntos | |
ayuda | ||
| AIDA64 / Memory Copy | |
| HP Omen Transcend 16 | |
| Medio Intel Core i9-13900HX (67716 - 79193, n=22) | |
| Alienware x16 R1 | |
| HP Omen 16-wf000 | |
| Asus ROG Zephyrus M16 GU603Z | |
| Acer Nitro 16 AN16-41 | |
| Lenovo Legion Slim 7i 16 Gen 8 | |
| AIDA64 / Memory Read | |
| HP Omen Transcend 16 | |
| Medio Intel Core i9-13900HX (73998 - 88462, n=22) | |
| Alienware x16 R1 | |
| HP Omen 16-wf000 | |
| Asus ROG Zephyrus M16 GU603Z | |
| Acer Nitro 16 AN16-41 | |
| Lenovo Legion Slim 7i 16 Gen 8 | |
| AIDA64 / Memory Write | |
| Alienware x16 R1 | |
| HP Omen Transcend 16 | |
| Medio Intel Core i9-13900HX (65472 - 77045, n=22) | |
| HP Omen 16-wf000 | |
| Asus ROG Zephyrus M16 GU603Z | |
| Acer Nitro 16 AN16-41 | |
| Lenovo Legion Slim 7i 16 Gen 8 | |
| AIDA64 / Memory Latency | |
| Alienware x16 R1 | |
| Acer Nitro 16 AN16-41 | |
| Asus ROG Zephyrus M16 GU603Z | |
| HP Omen Transcend 16 | |
| HP Omen 16-wf000 | |
| Medio Intel Core i9-13900HX (75.3 - 91.1, n=22) | |
| Lenovo Legion Slim 7i 16 Gen 8 | |
* ... más pequeño es mejor
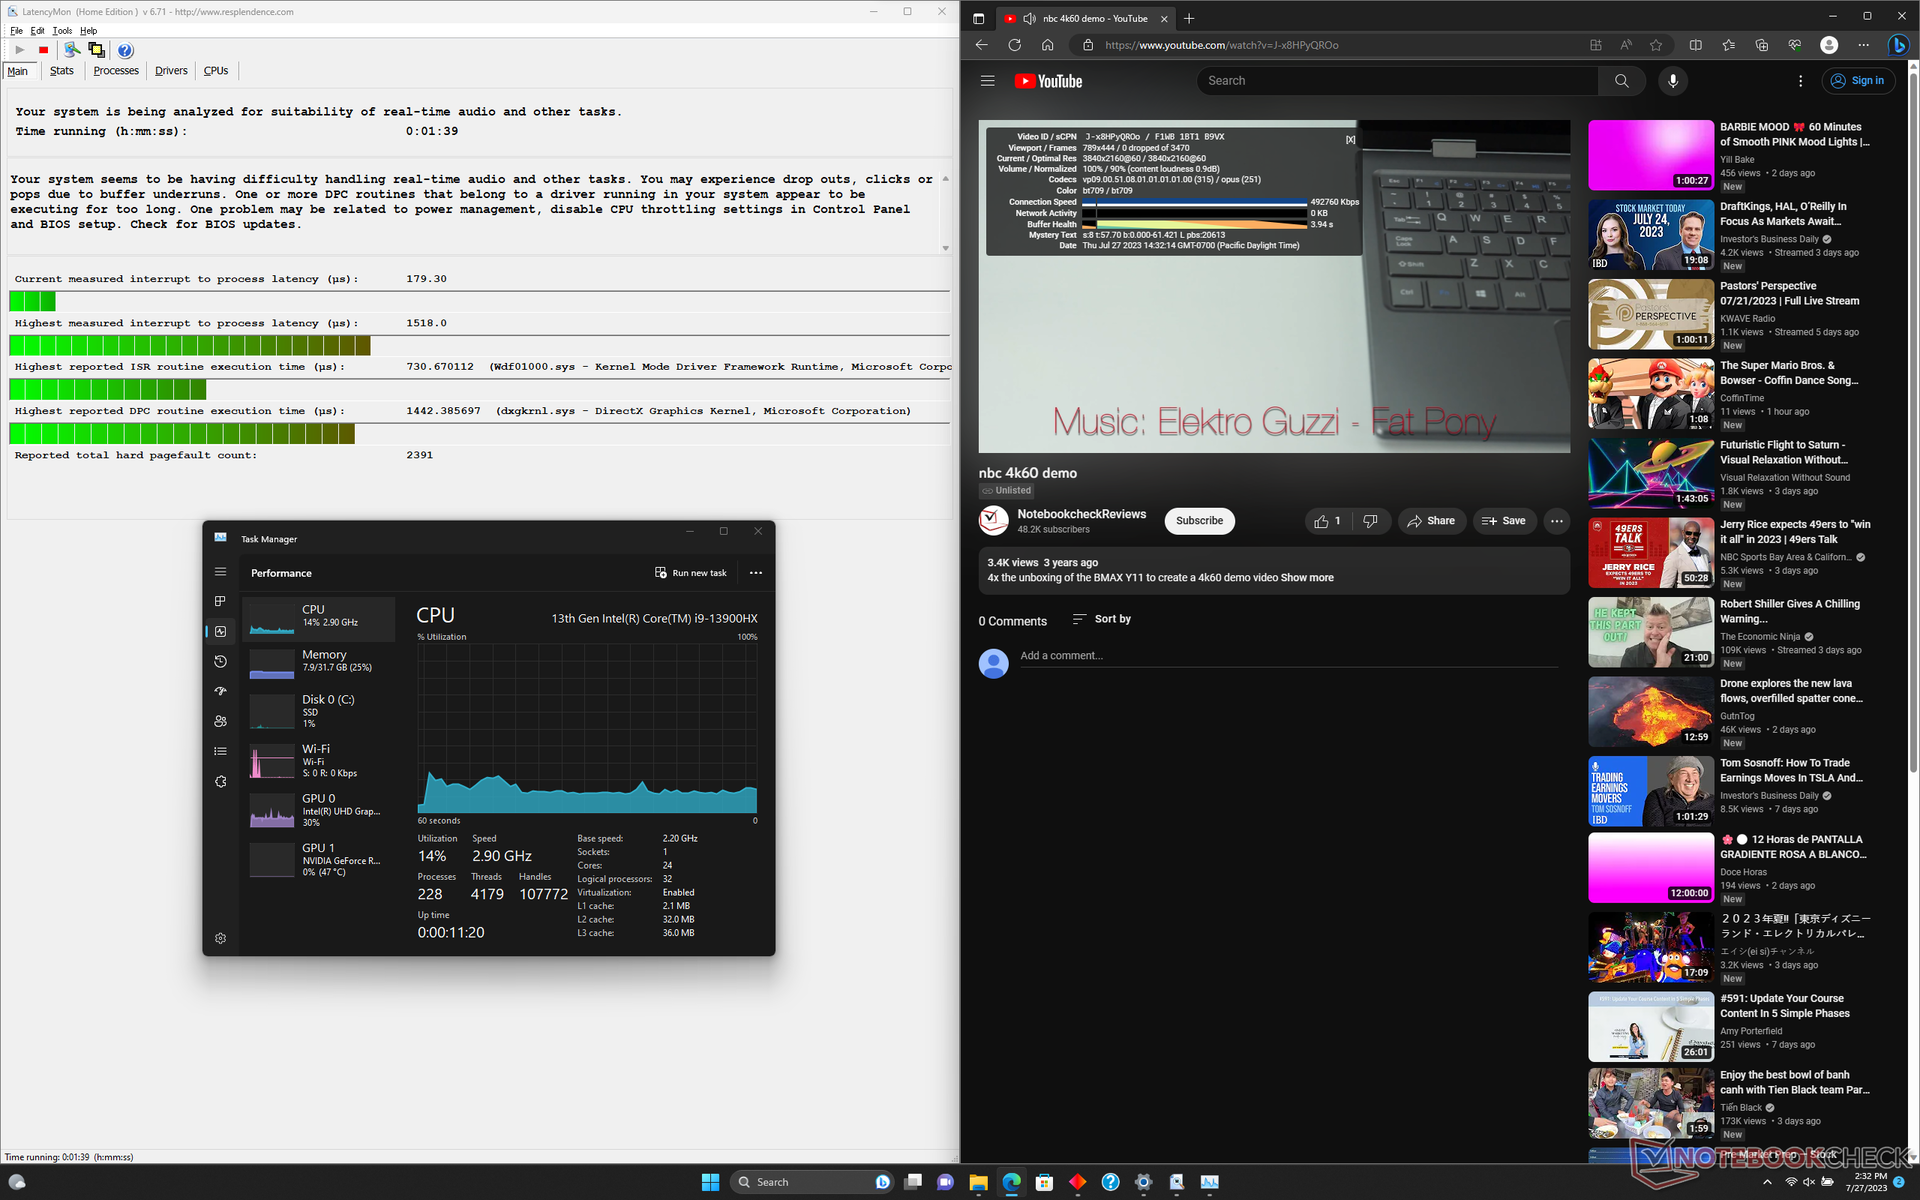
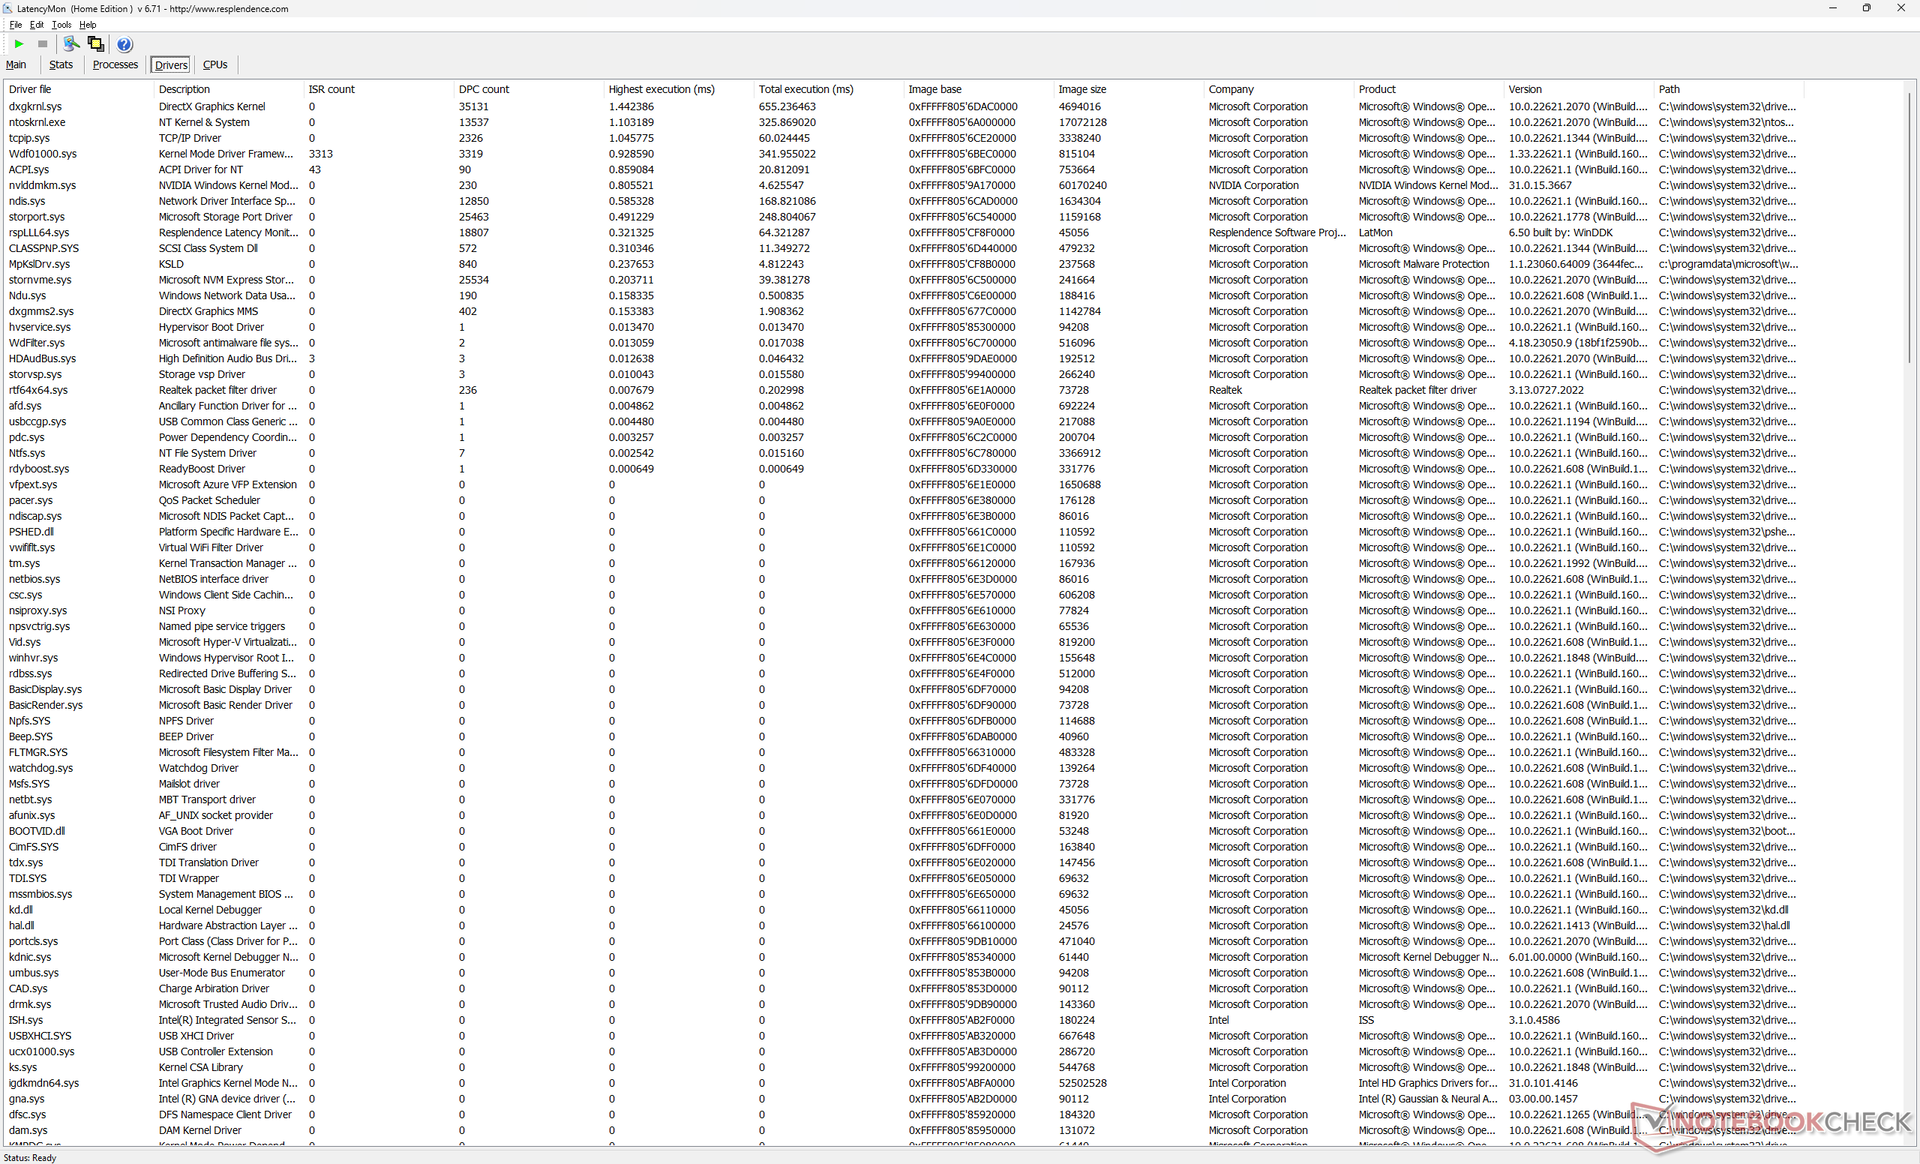
Latencia del CPD
LatencyMon revela problemas menores de CPD al abrir varias pestañas de nuestra página de inicio. por lo demás, la reproducción de vídeo 4K a 60 FPS es perfecta, sin caídas de frames.
| DPC Latencies / LatencyMon - interrupt to process latency (max), Web, Youtube, Prime95 | |
| Lenovo Legion Slim 7i 16 Gen 8 | |
| HP Omen 16-wf000 | |
| HP Omen Transcend 16 | |
| Alienware x16 R1 | |
| Acer Nitro 16 AN16-41 | |
| Asus ROG Zephyrus M16 GU603Z | |
* ... más pequeño es mejor
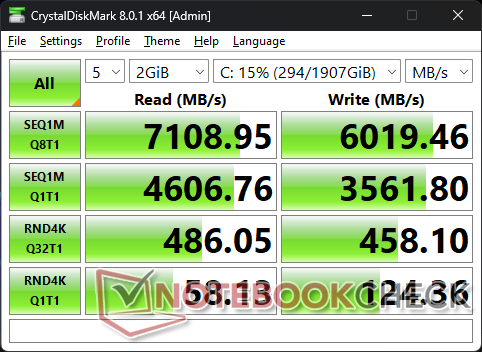
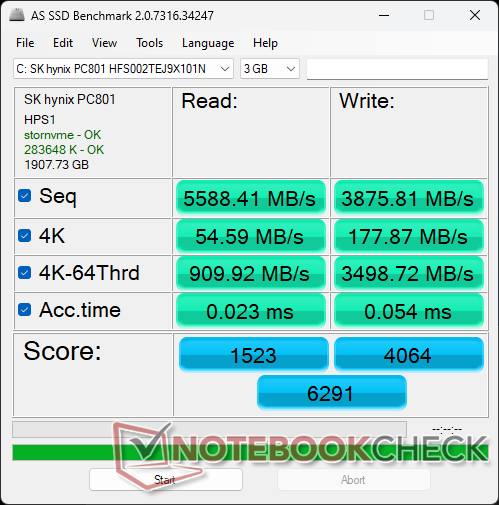
Dispositivos de almacenamiento
El Omen Transcend 16 se entrega con el mismo SK hynix PC801 SSD que se encuentra en el Omen 16. La unidad no muestra problemas de ralentización del rendimiento, por lo que es capaz de mantener una alta tasa de transferencia máxima de casi 7000 MB/s sin ningún problema durante nuestra prueba de estrés.

| Drive Performance rating - Percent | |
| Alienware x16 R1 | |
| Lenovo Legion Slim 7i 16 Gen 8 | |
| Asus ROG Zephyrus M16 GU603Z | |
| HP Omen 16-wf000 | |
| Acer Nitro 16 AN16-41 | |
| HP Omen Transcend 16 | |
* ... más pequeño es mejor
Disk Throttling: DiskSpd Read Loop, Queue Depth 8
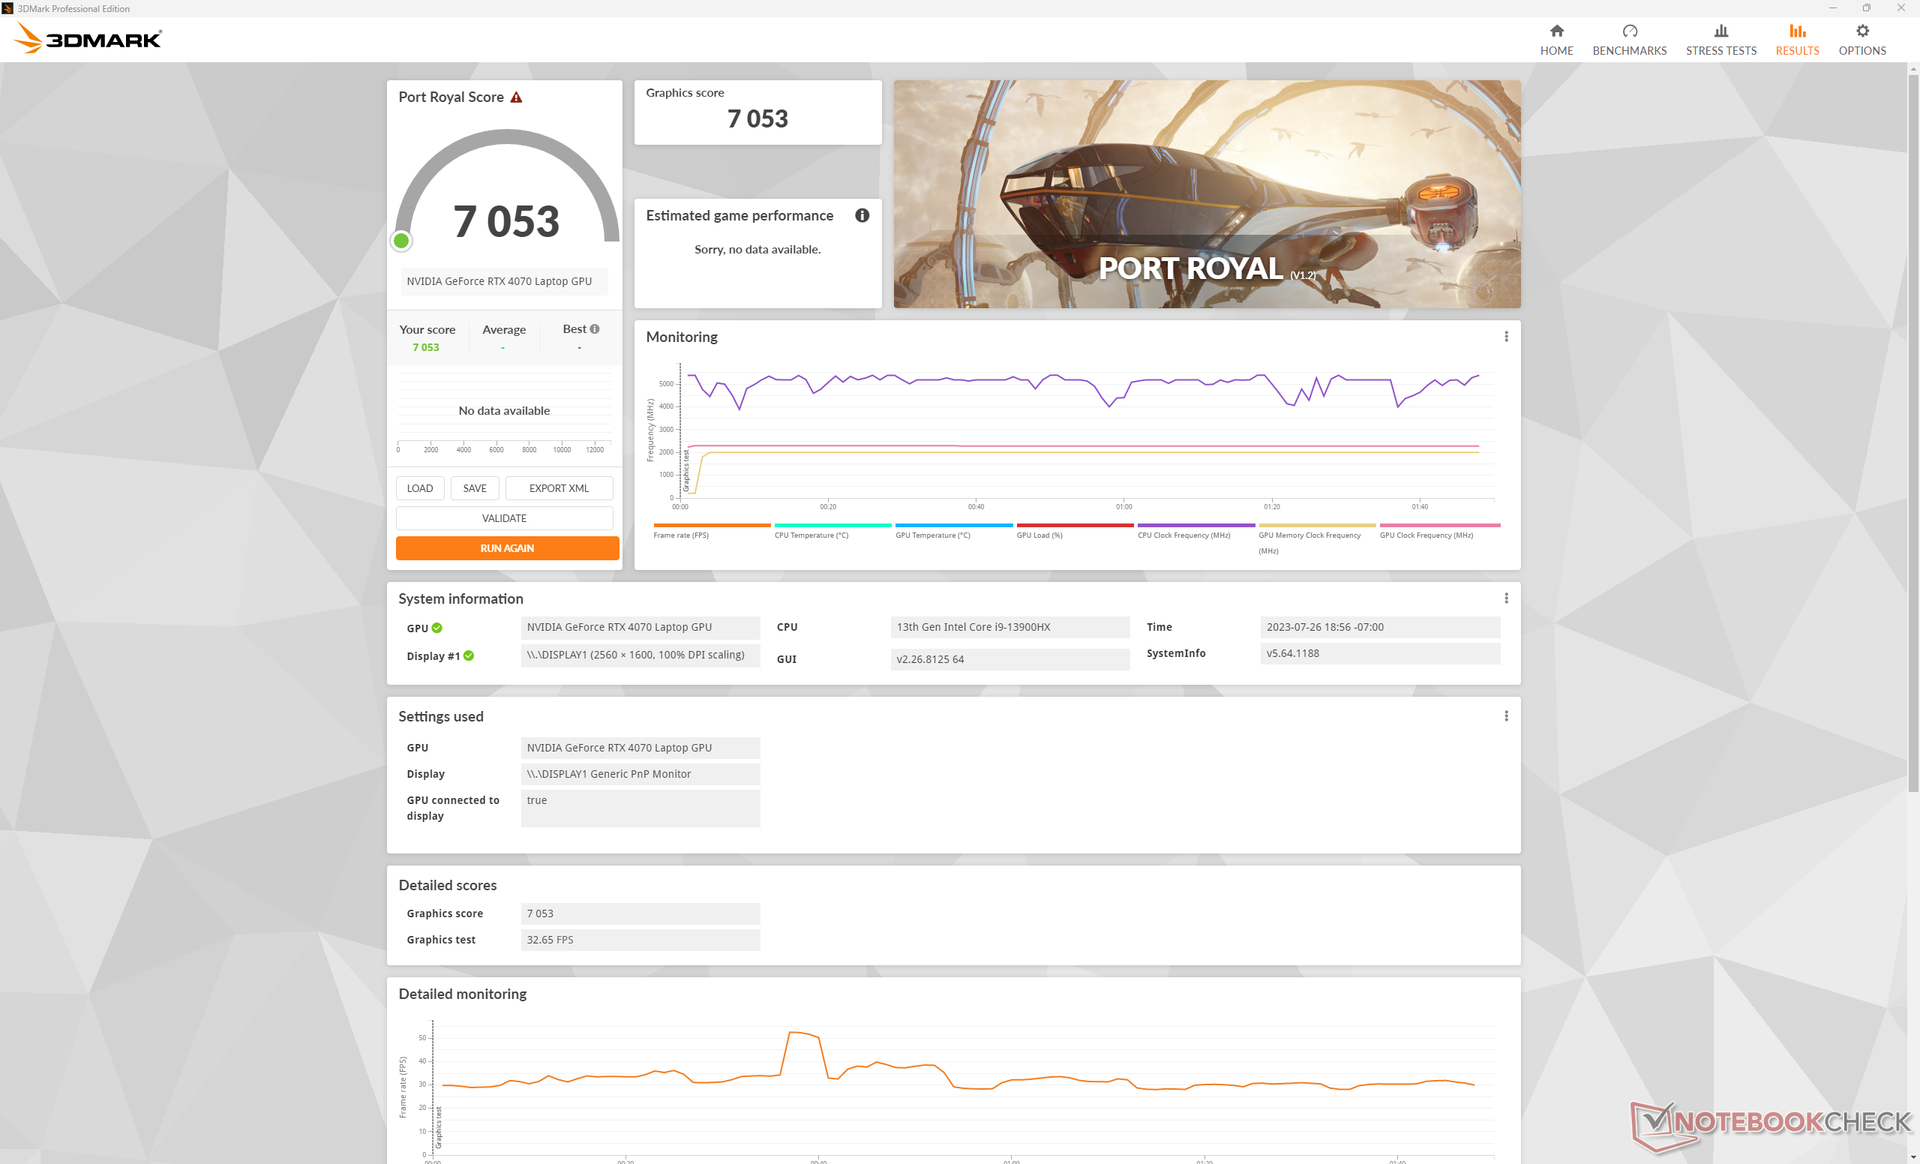
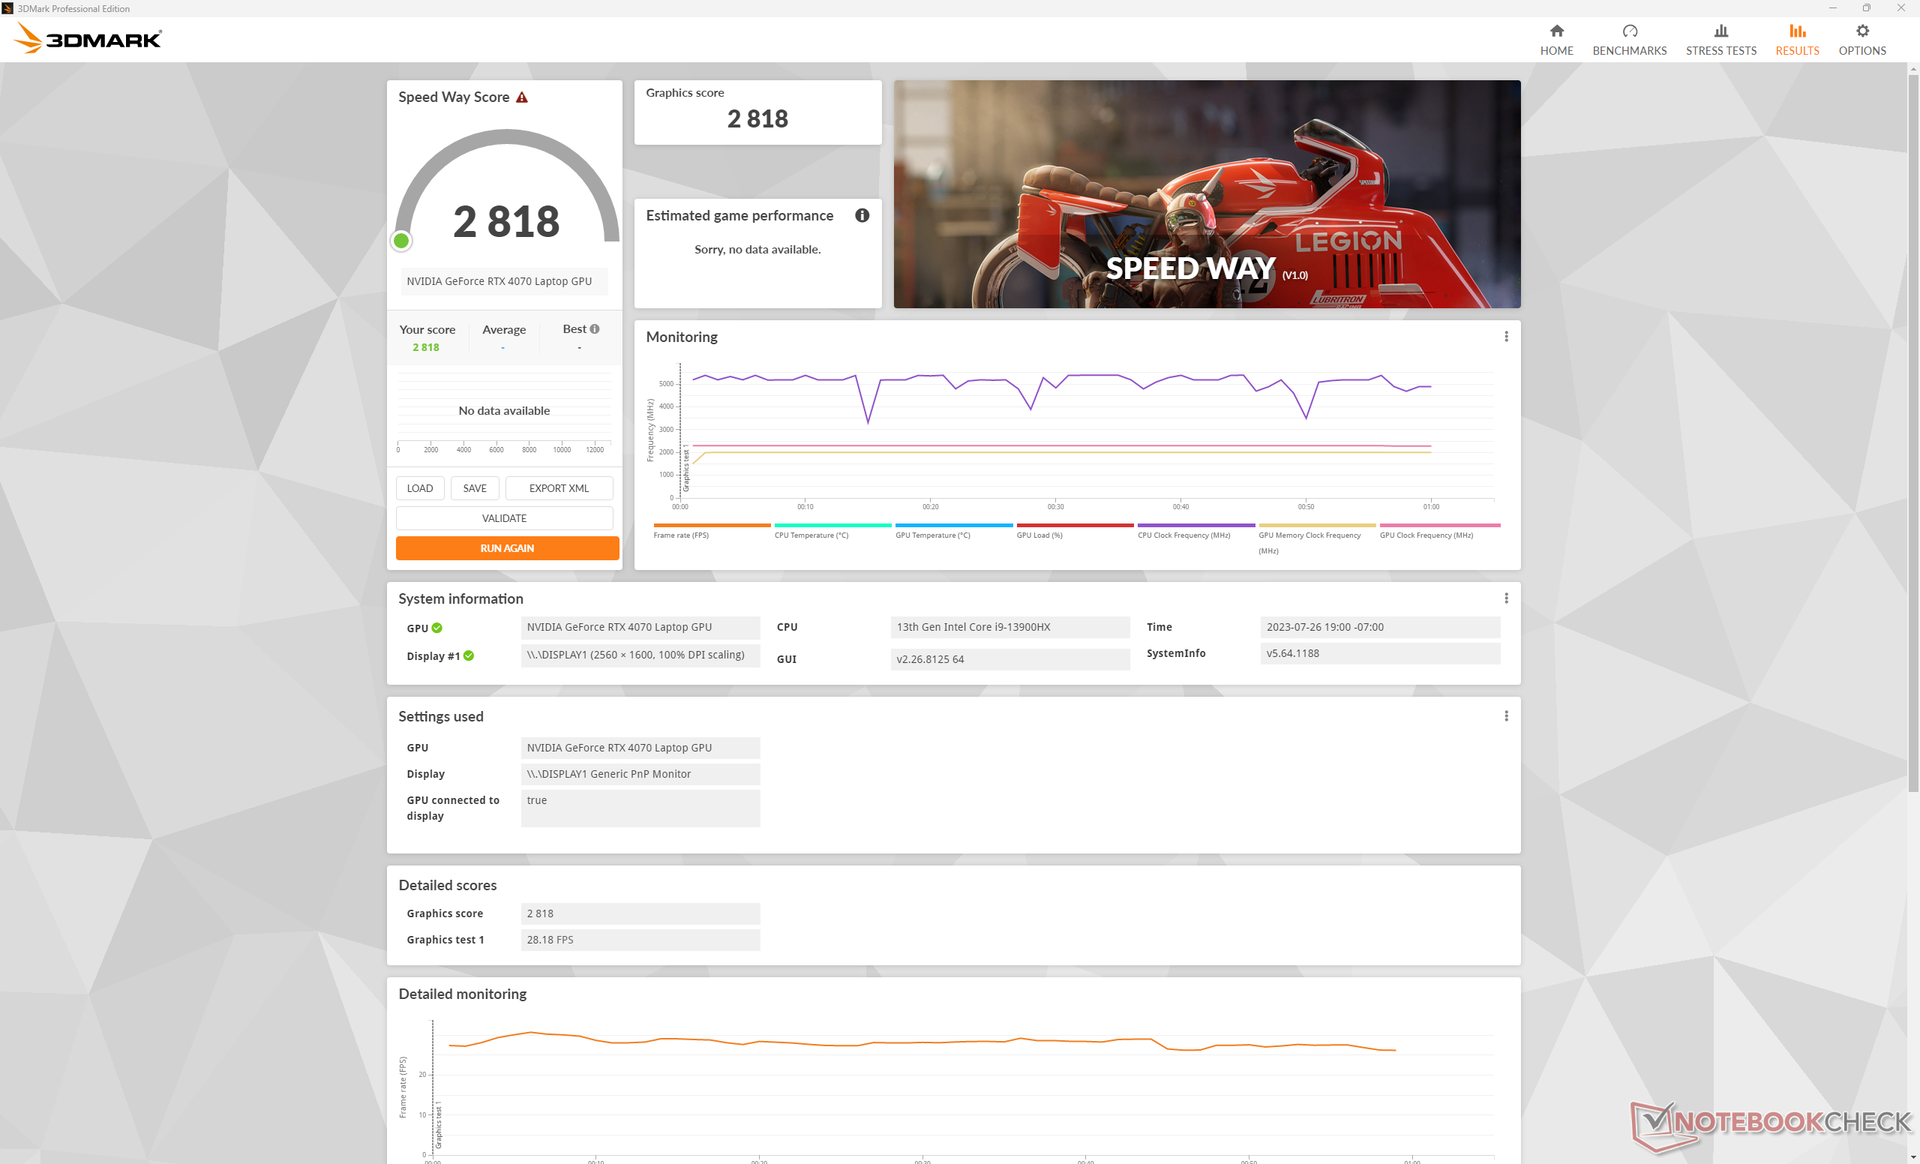
Rendimiento de la GPU - GPU TGP de 130 W
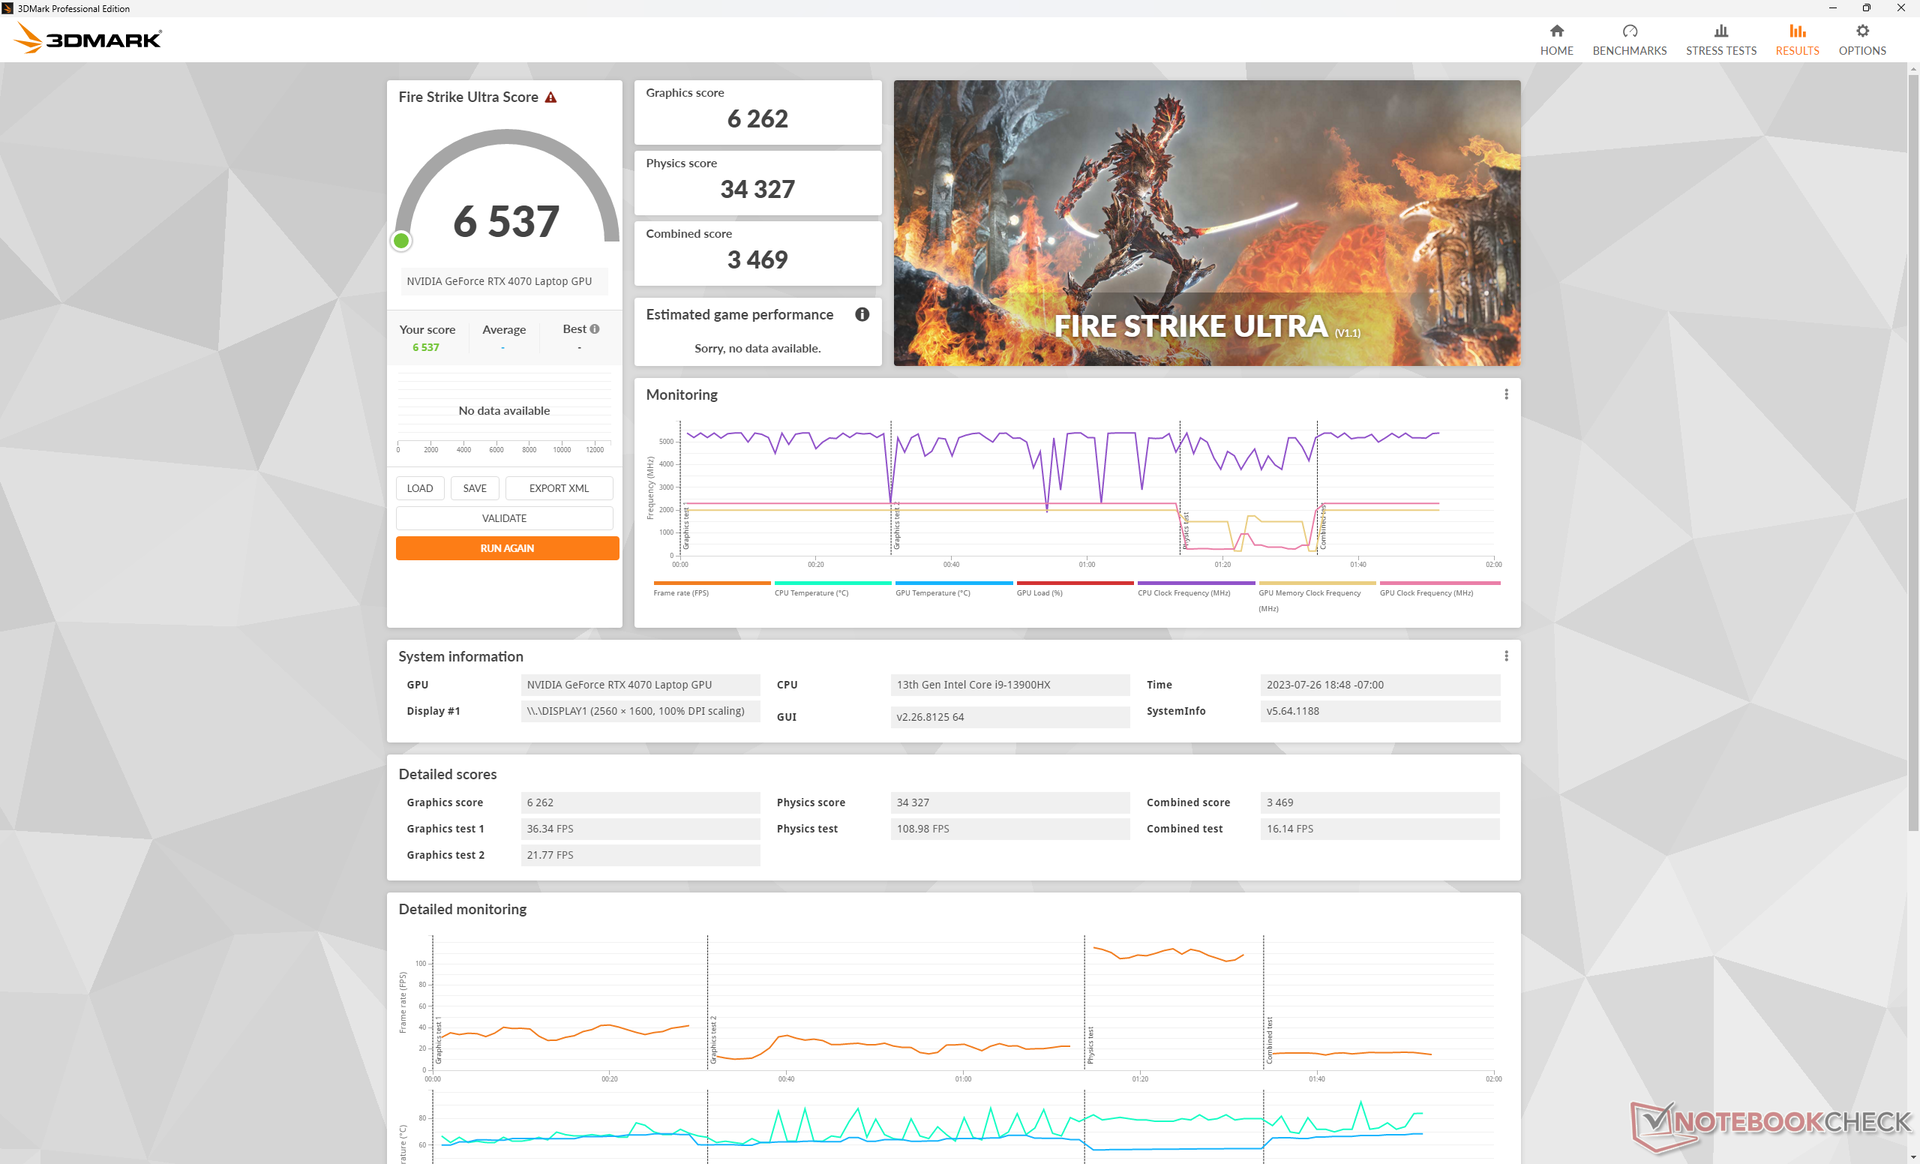
El rendimiento gráfico es comparable al del portátil medio de nuestra base de datos equipado con la misma gPU RTX 4070 MÓVIL. No obstante, elLenovo Legion Slim 7i 16 G8 con la misma GPU sigue siendo un 10% más rápido debido en parte a su objetivo TGP ligeramente superior (145 W frente a 130 W).
El cambio a la RTX 4060 Reduciría el rendimiento gráfico entre un 10 y un 20 por ciento. Por su parte, la RTX 4080 puede aumentar el rendimiento significativamente entre un 40 y un 50 por ciento, pero el Omen Transcend 16 está limitado a la RTX 4070 por ahora. En cambio, el Omen 16 normal puede configurarse con opciones de GPU superiores a la RTX 4070.
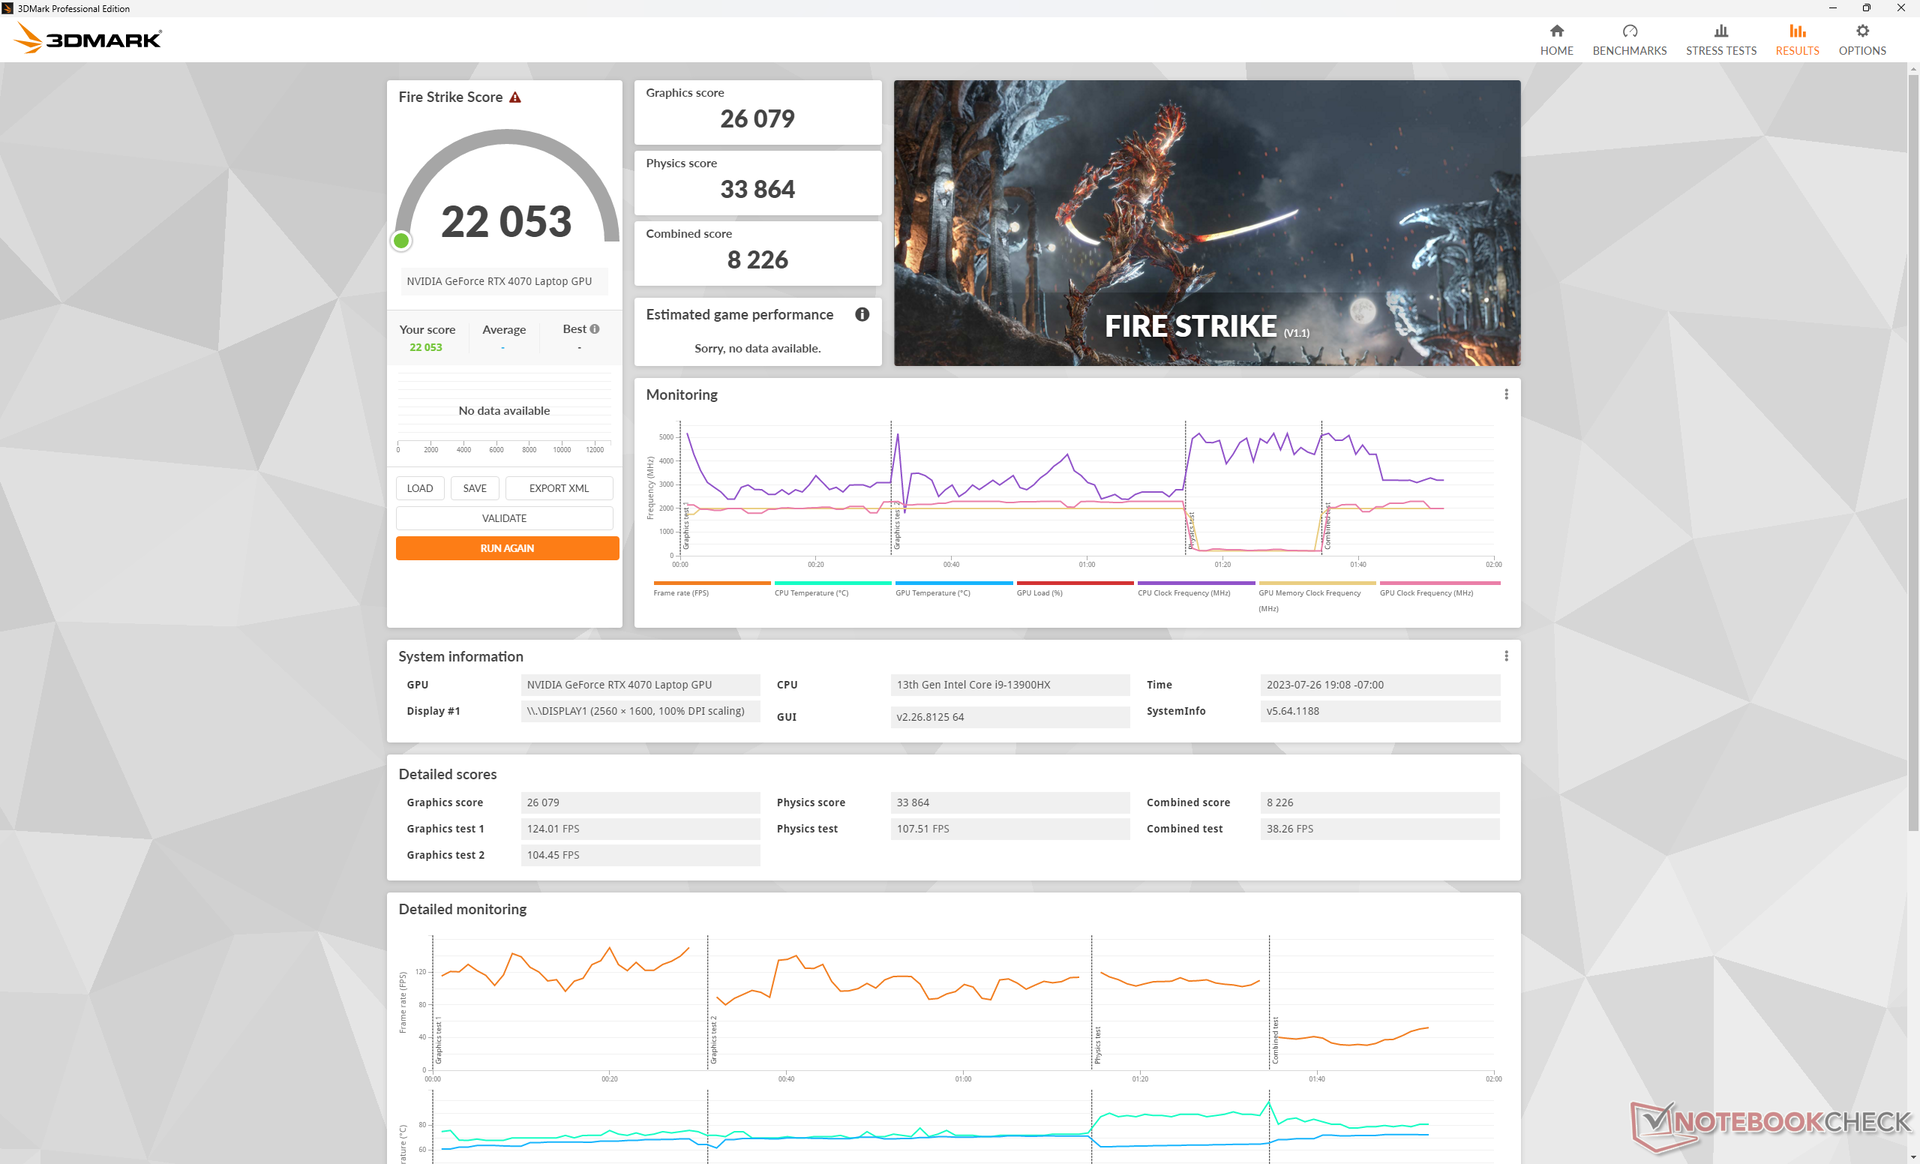
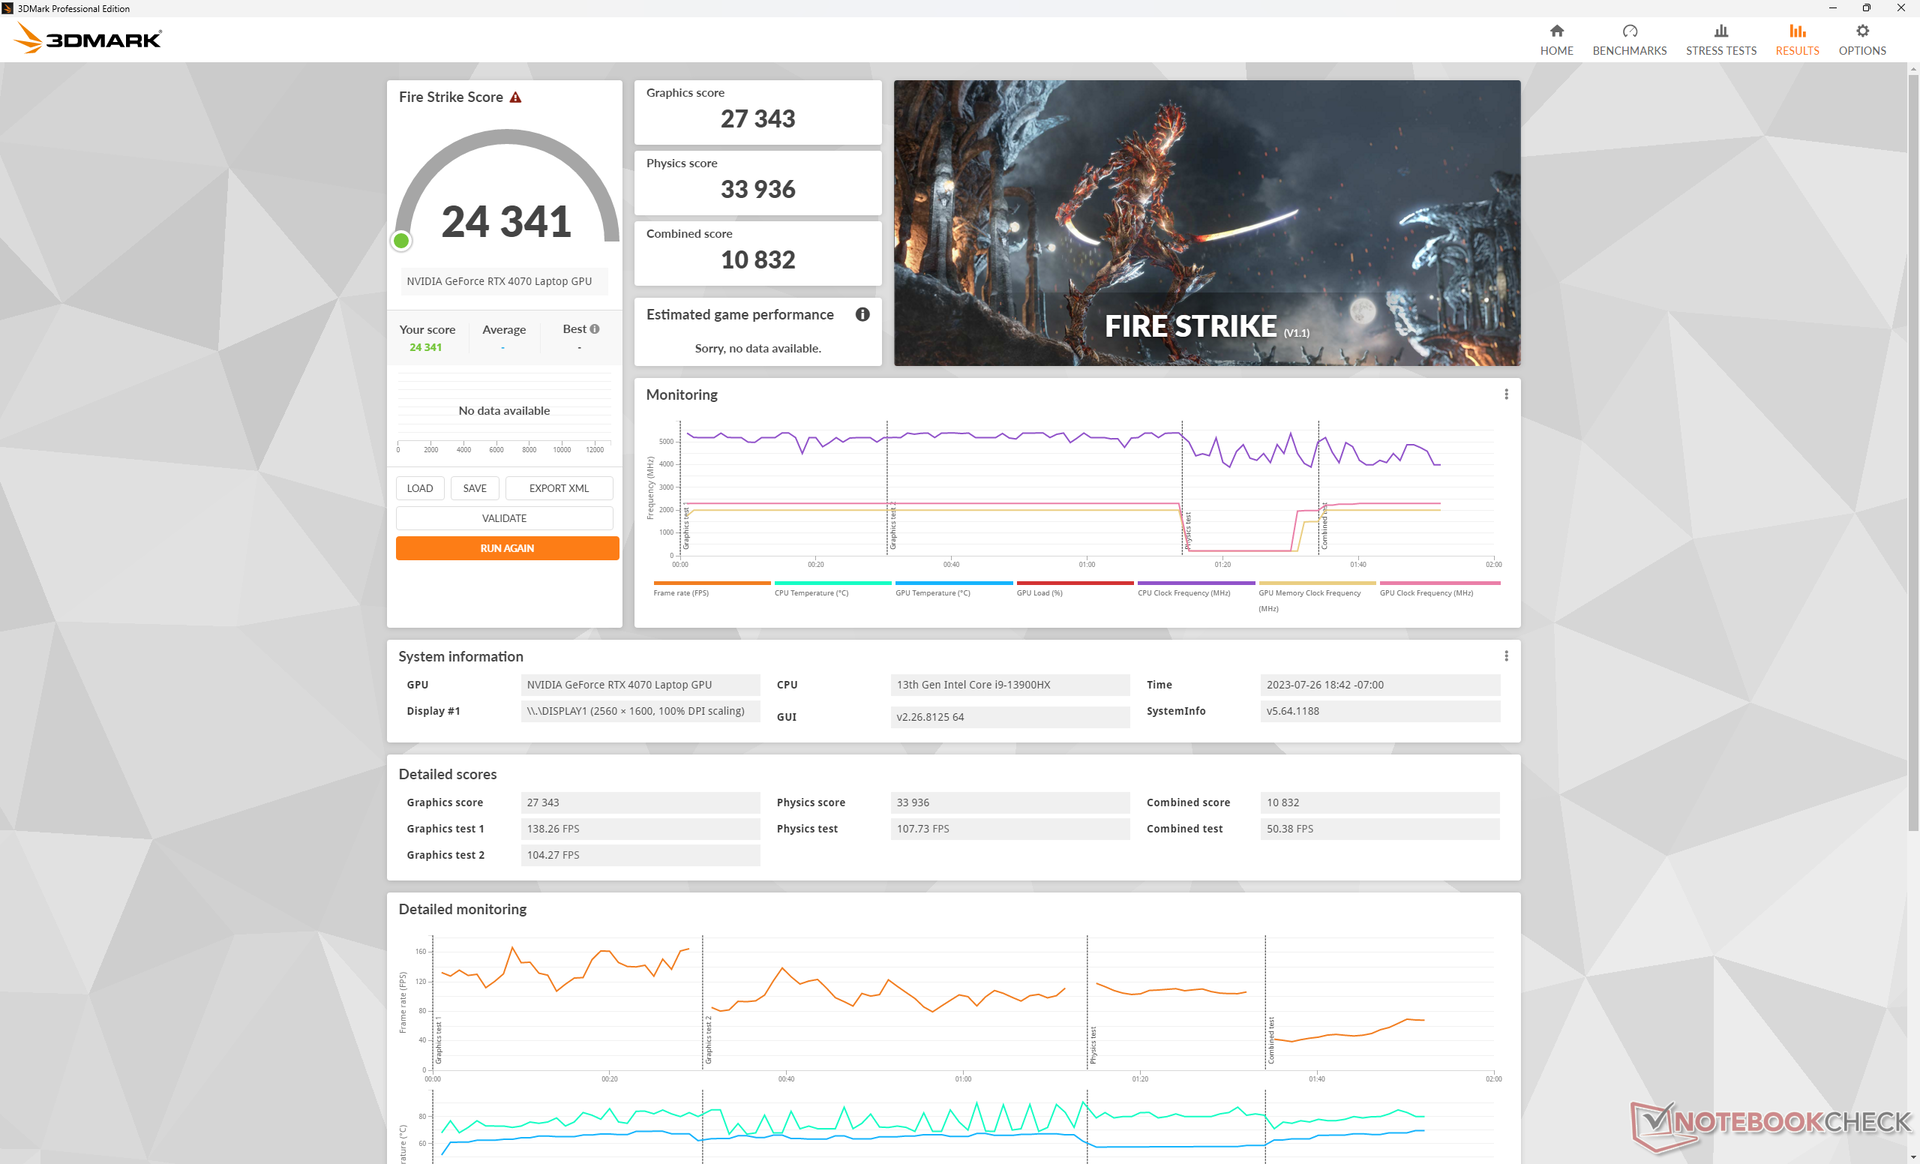
Ejecutar en modo equilibrado en lugar de modo de rendimiento disminuiría el rendimiento sólo ligeramente como se muestra en nuestra tabla Fire Strike a continuación. Es importante tener esto en cuenta ya que las diferencias de ruido de ventilador entre los modos Equilibrado y Rendimiento pueden ser significativas, lo que mostraremos en nuestra sección de Ruido del Sistema.
| Perfil de potencia | Puntuación gráfica | Puntuación física | Puntuación combinada |
| Equilibrado | 26079 (-5%) | 33864 (-0%) | 8226 (-24%) |
| Rendimiento | 27343 | 33936 | 10832 |
| 3DMark 11 Performance | 32031 puntos | |
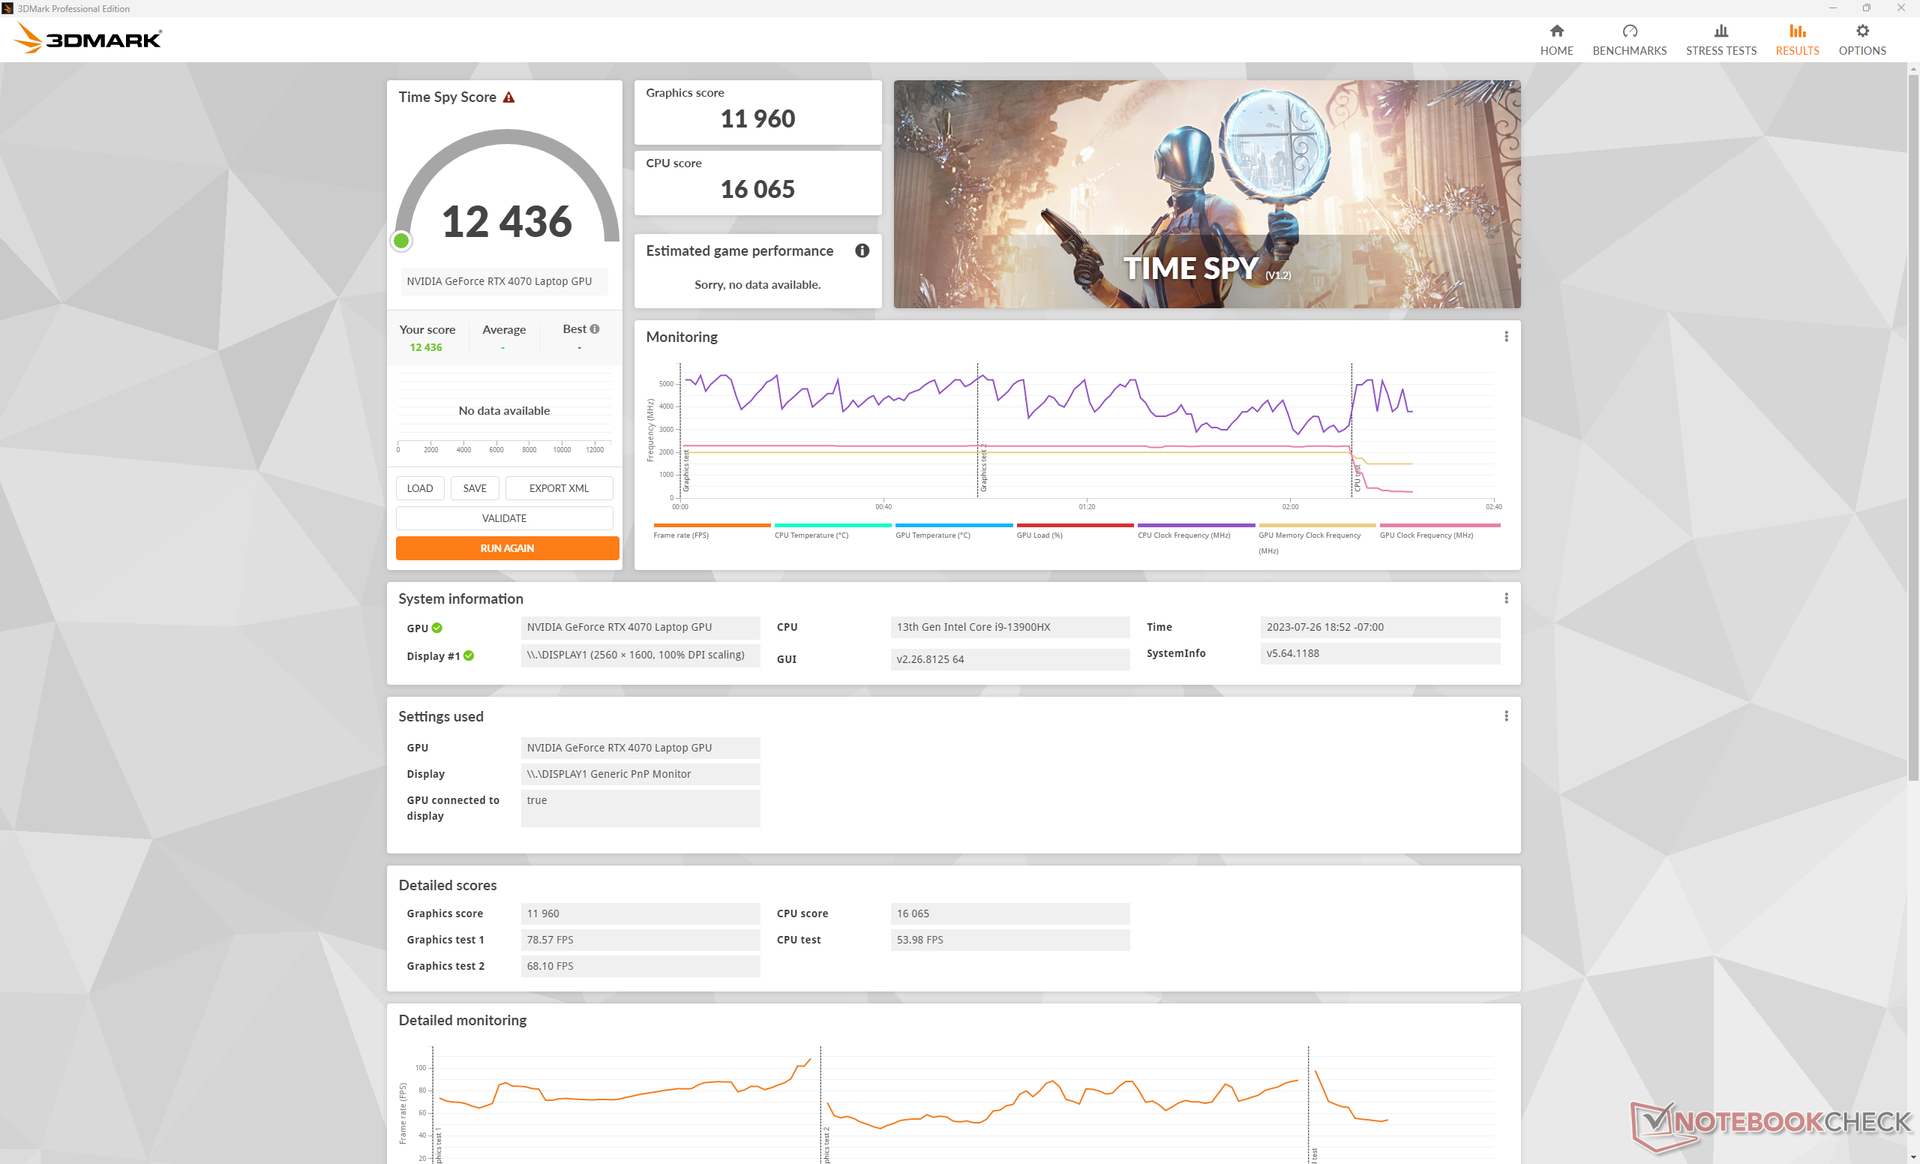
| 3DMark Fire Strike Score | 24341 puntos | |
| 3DMark Time Spy Score | 12436 puntos | |
ayuda | ||
* ... más pequeño es mejor
Rendimiento en juegos
Todos los títulos se pueden jugar con ajustes altos o máximos a la resolución QHD+ nativa, incluso títulos exigentes como Returnal o Cyberpunk 2077. Se recomienda DLSS si se activan las funciones RT o si se juega en un monitor 4K externo.
Witcher 3 FPS Chart
| bajo | medio | alto | ultra | QHD | 4K | |
|---|---|---|---|---|---|---|
| The Witcher 3 (2015) | 500.9 | 375.9 | 222.7 | 111.8 | 65.7 | |
| Dota 2 Reborn (2015) | 212 | 192 | 188.4 | 168.4 | 142.5 | |
| Final Fantasy XV Benchmark (2018) | 220 | 164.8 | 82.6 | 47.1 | ||
| X-Plane 11.11 (2018) | 191.5 | 169.8 | 132.9 | 114 | ||
| Strange Brigade (2018) | 414 | 310 | 245 | 208 | 133.3 | 71.4 |
| Cyberpunk 2077 1.6 (2022) | 128.5 | 118.1 | 103 | 87.5 | 54.5 | 23.5 |
| Tiny Tina's Wonderlands (2022) | 241.7 | 195.6 | 132.5 | 102 | 70.4 | 33.6 |
| F1 22 (2022) | 301 | 289 | 221 | 79.3 | 50.4 | 24.7 |
| Returnal (2023) | 109 | 115 | 101 | 79 | 64 | 37 |
Emisiones
Ruido del sistema: gran diferencia entre el modo equilibrado y el modo de rendimiento
El ruido general del ventilador es ligeramente más silencioso que el que experimentamos en el Omen 16pero hay que tener en cuenta que la Omen 16 viene con la GPU RTX 4080, más rápida y con un TGP más alto, de 145 W, en comparación con nuestra RTX 4070, más lenta y de 130 W.
El ruido del ventilador al jugar en modo Rendimiento puede llegar a 54,3 dB(A) en comparación con los 42 dB(A) del modo Equilibrado. Perderás un poco de rendimiento, como ya hemos dicho, pero la importante reducción de ruido puede hacer que merezca la pena considerarlo. Por lo demás, el rango medio de 50 dB(A) en juegos es comparable a alternativas como elAlienware x16 R1.
Ruido
| Ocioso |
| 29.1 / 29.1 / 29.1 dB(A) |
| Carga |
| 45.7 / 54.3 dB(A) |
 | ||
30 dB silencioso 40 dB(A) audible 50 dB(A) ruidosamente alto |
||
min: | ||
| HP Omen Transcend 16 GeForce RTX 4070 Laptop GPU, i9-13900HX, SK hynix PC801 HFS002TEJ9X101N | Lenovo Legion Slim 7i 16 Gen 8 GeForce RTX 4070 Laptop GPU, i9-13900H, Samsung PM9A1 MZVL21T0HCLR | HP Omen 16-wf000 GeForce RTX 4080 Laptop GPU, i7-13700HX, SK hynix PC801 HFS002TEJ9X101N | Alienware x16 R1 GeForce RTX 4080 Laptop GPU, i9-13900HK, SK hynix PC801 HFS001TEJ9X101N | Acer Nitro 16 AN16-41 GeForce RTX 4070 Laptop GPU, R7 7735HS, Samsung PM9A1 MZVL21T0HCLR | Asus ROG Zephyrus M16 GU603Z GeForce RTX 3070 Ti Laptop GPU, i9-12900H, Micron 3400 1TB MTFDKBA1T0TFH | |
|---|---|---|---|---|---|---|
| Noise | 13% | 1% | 9% | 6% | -2% | |
| apagado / medio ambiente * (dB) | 22.9 | 22.8 -0% | 23 -0% | 22.7 1% | 25.7 -12% | 23 -0% |
| Idle Minimum * (dB) | 29.1 | 23.6 19% | 29.6 -2% | 23.1 21% | 25.7 12% | 23 21% |
| Idle Average * (dB) | 29.1 | 23.6 19% | 29.8 -2% | 25.8 11% | 25.7 12% | 24 18% |
| Idle Maximum * (dB) | 29.1 | 25.7 12% | 30.4 -4% | 25.8 11% | 26.3 10% | 47 -62% |
| Load Average * (dB) | 45.7 | 27.6 40% | 33.8 26% | 39.3 14% | 33.9 26% | 47.91 -5% |
| Witcher 3 ultra * (dB) | 54.3 | 54.4 -0% | 57 -5% | 49.9 8% | 48.91 10% | |
| Load Maximum * (dB) | 54.3 | 54.4 -0% | 58.3 -7% | 54.8 -1% | 62 -14% | 50.25 7% |
* ... más pequeño es mejor
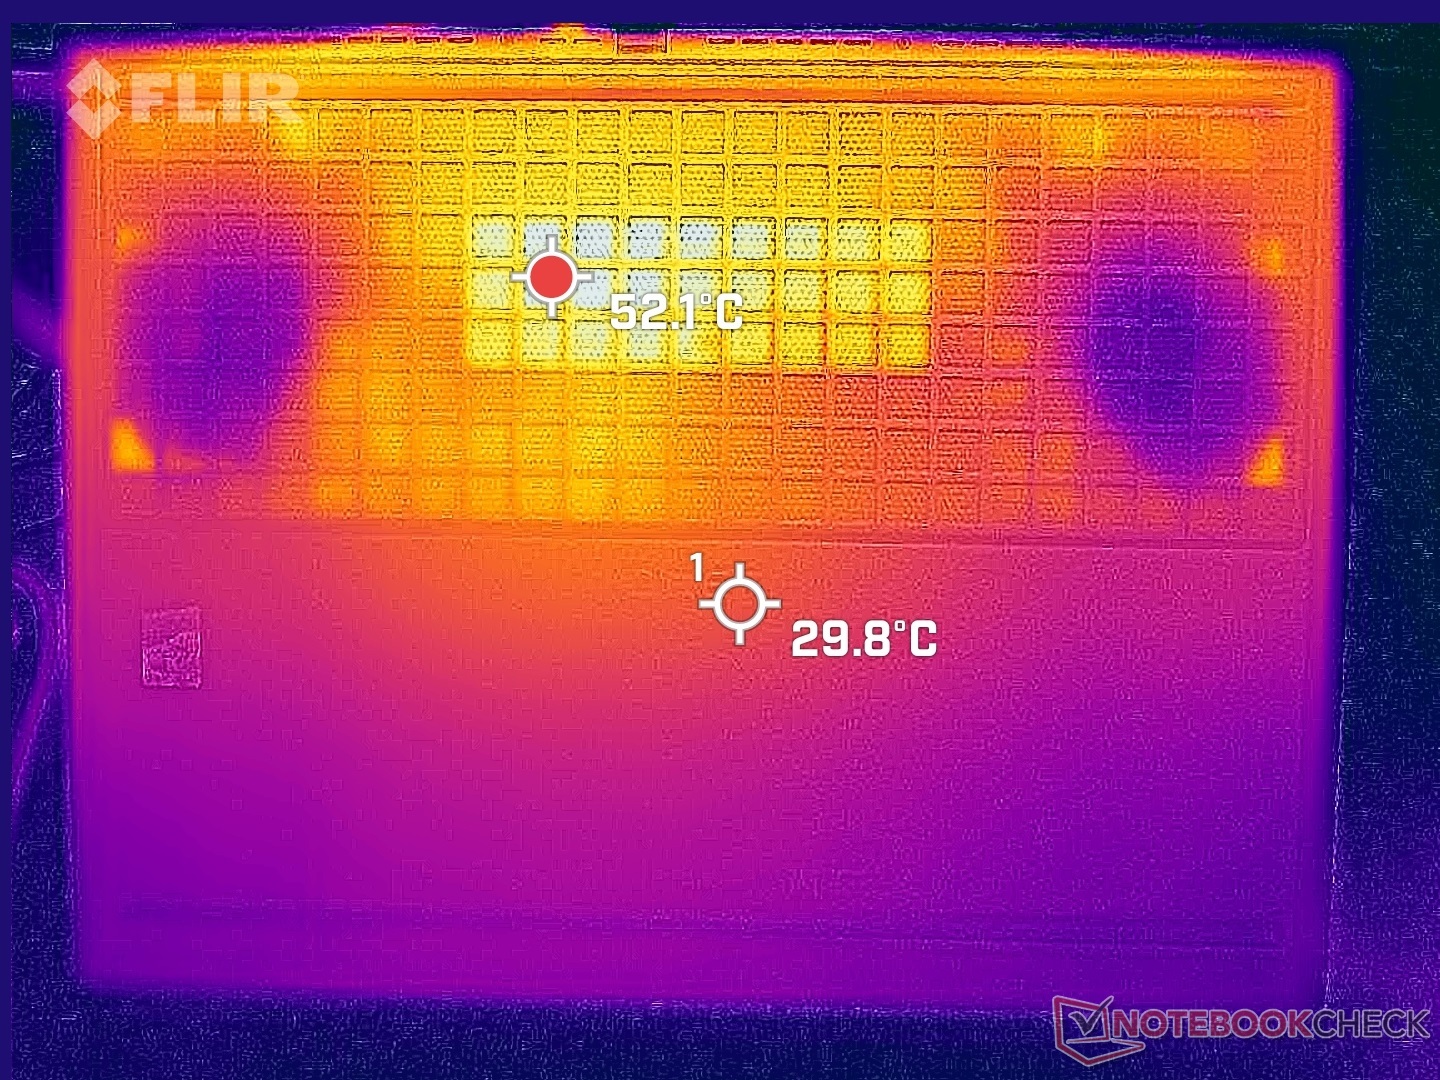
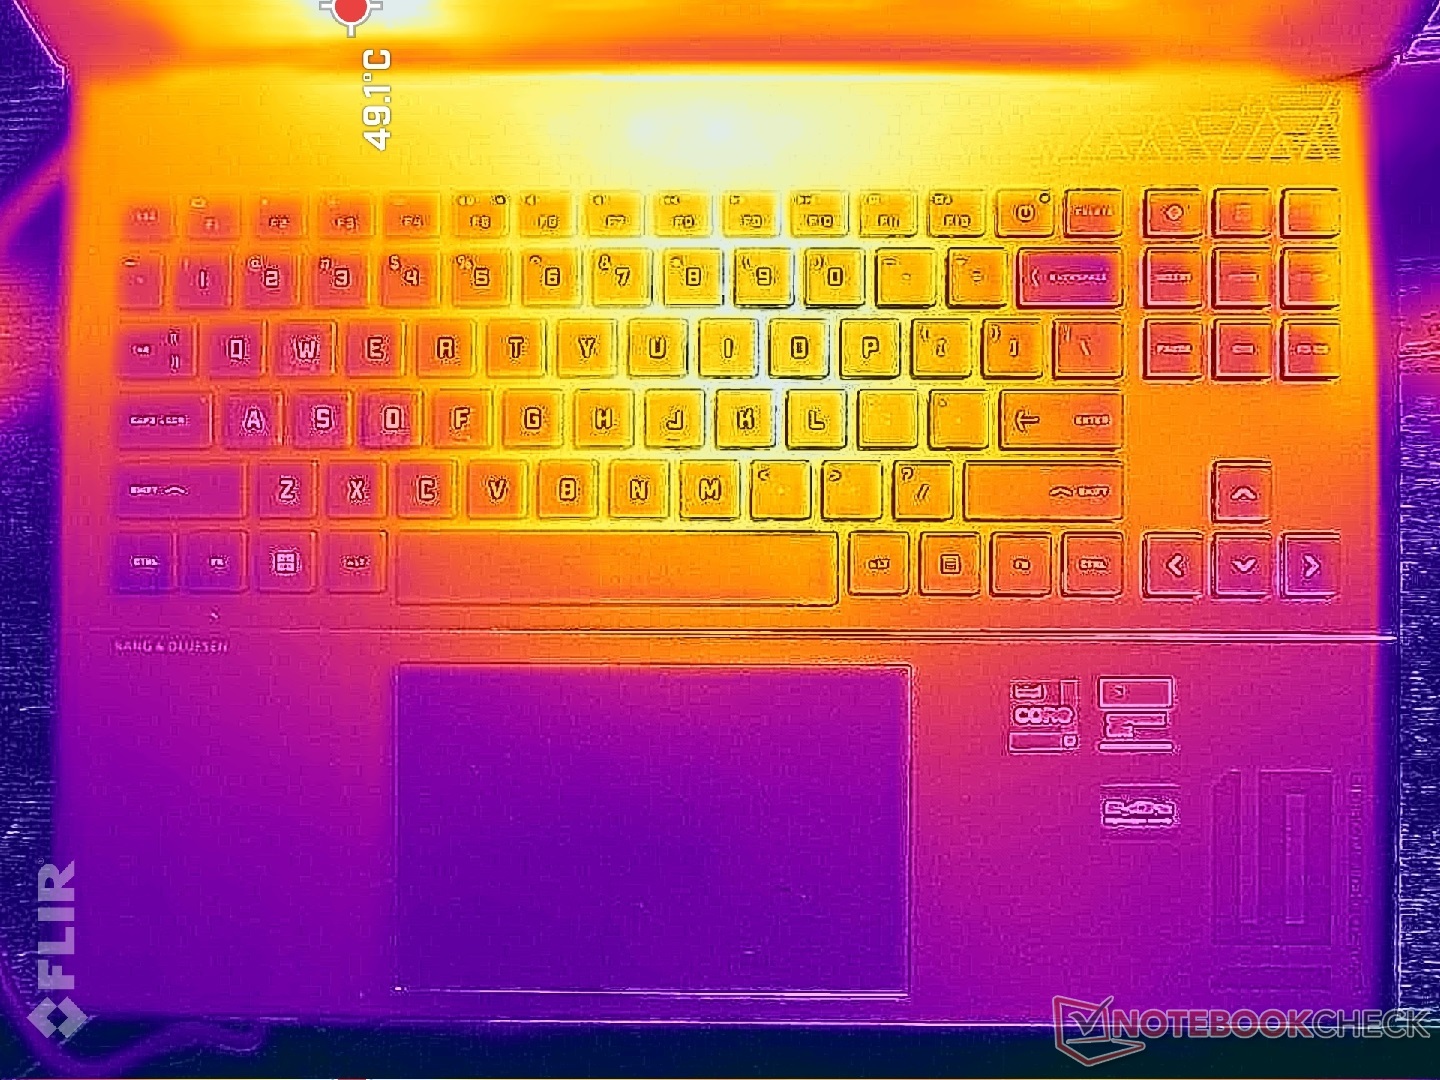
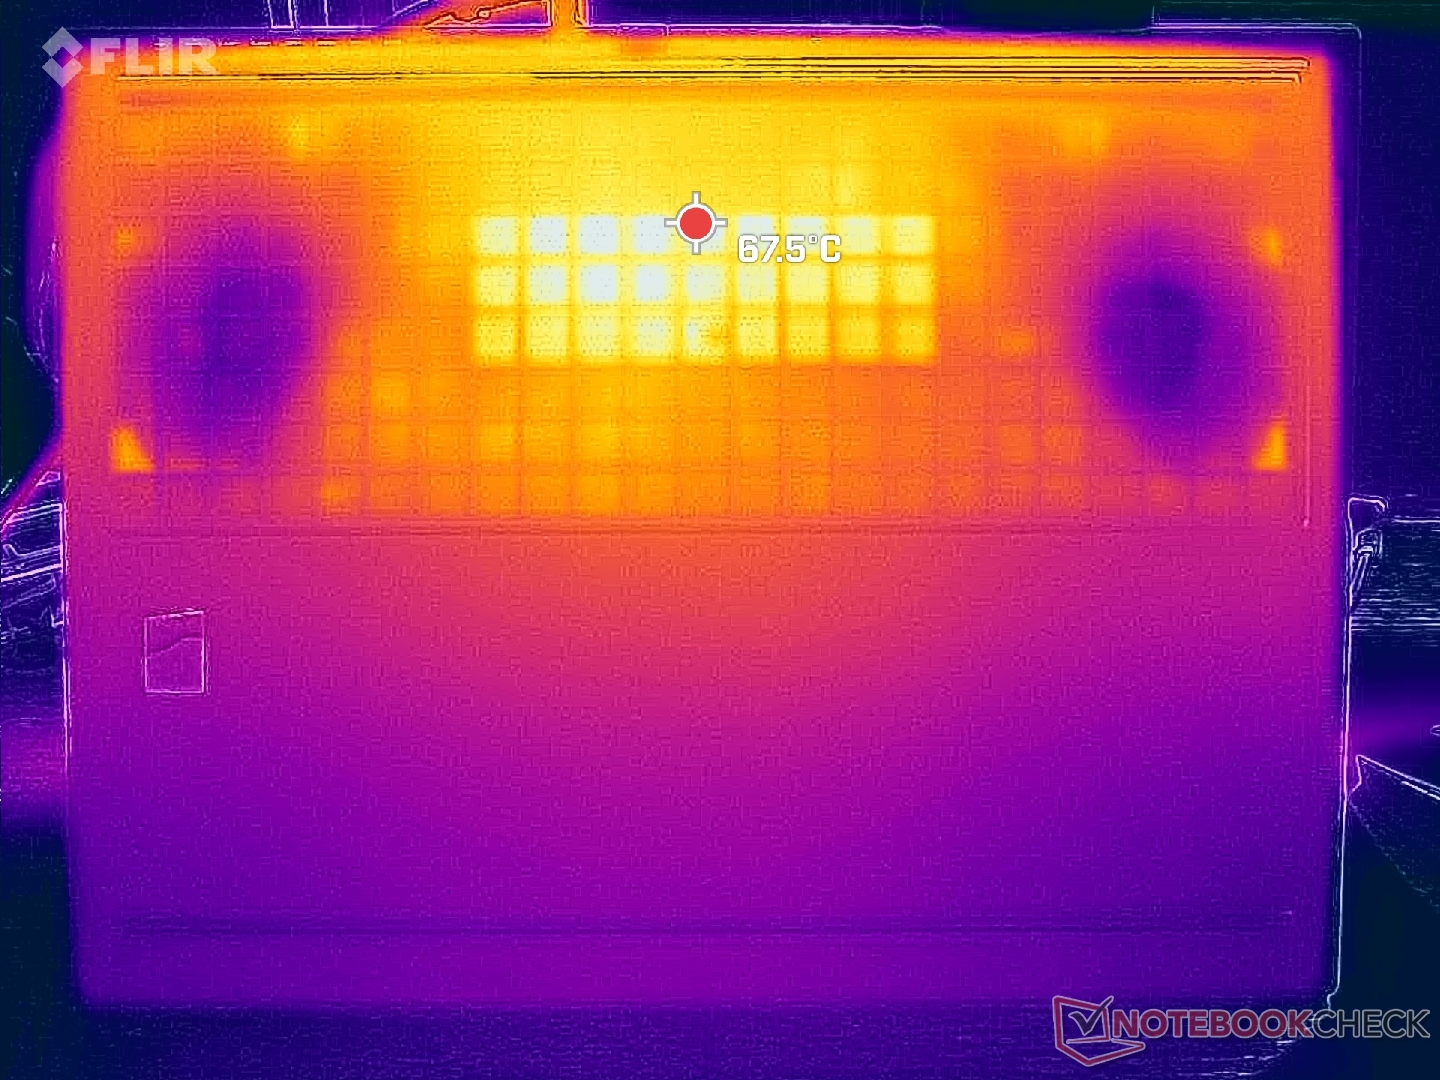
Temperatura
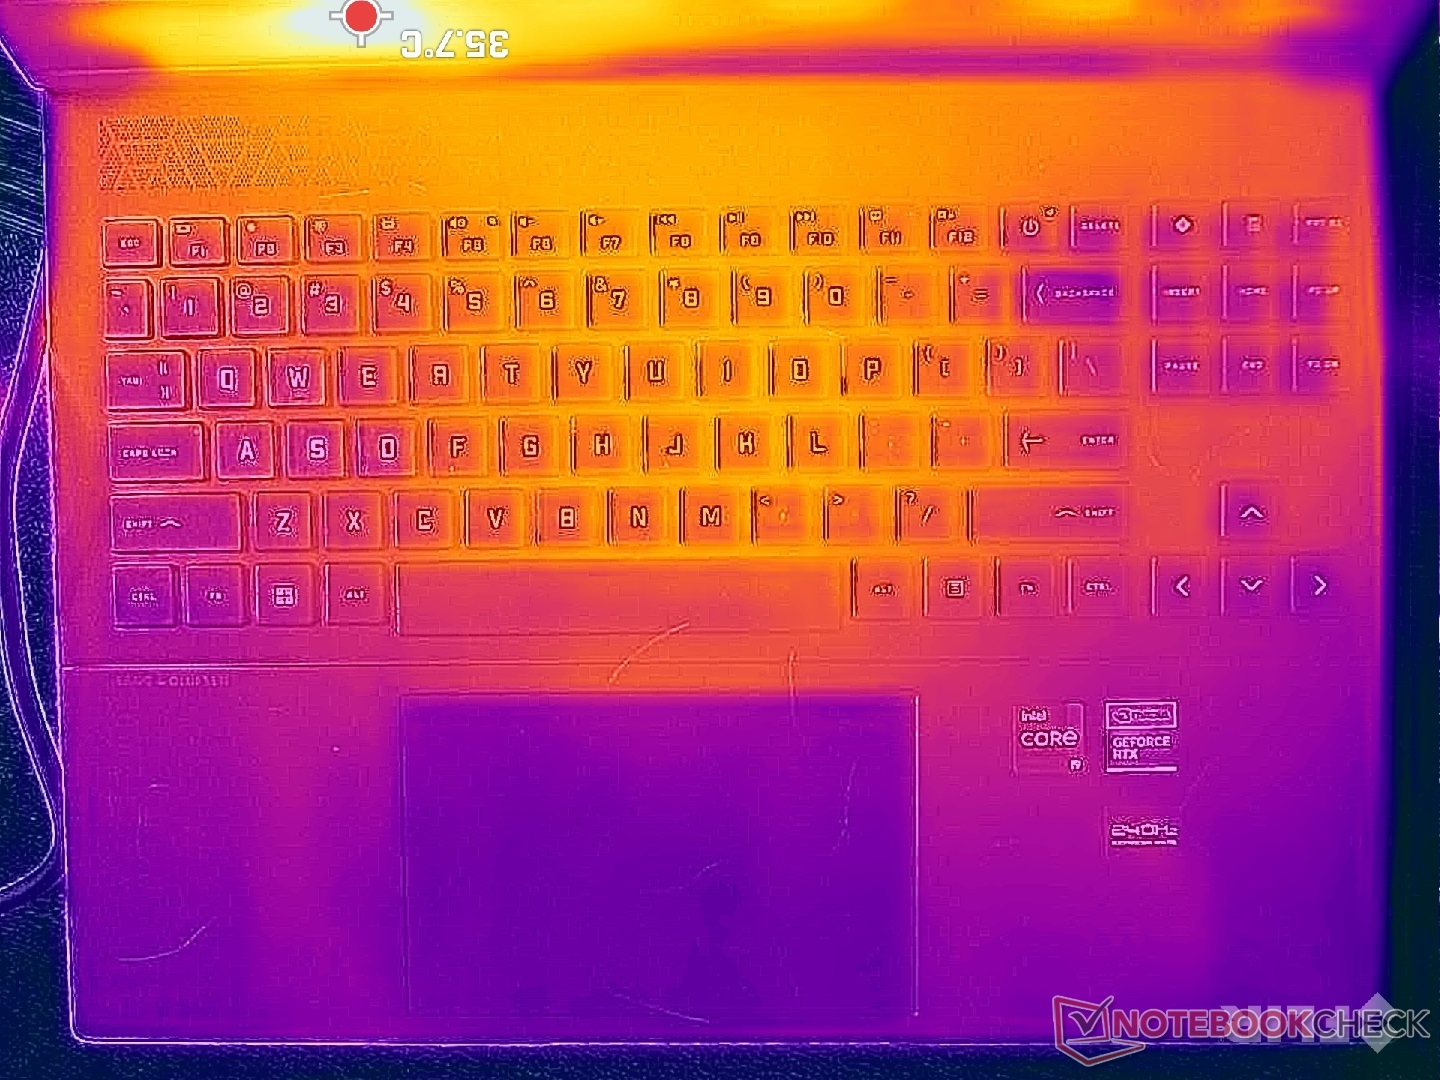
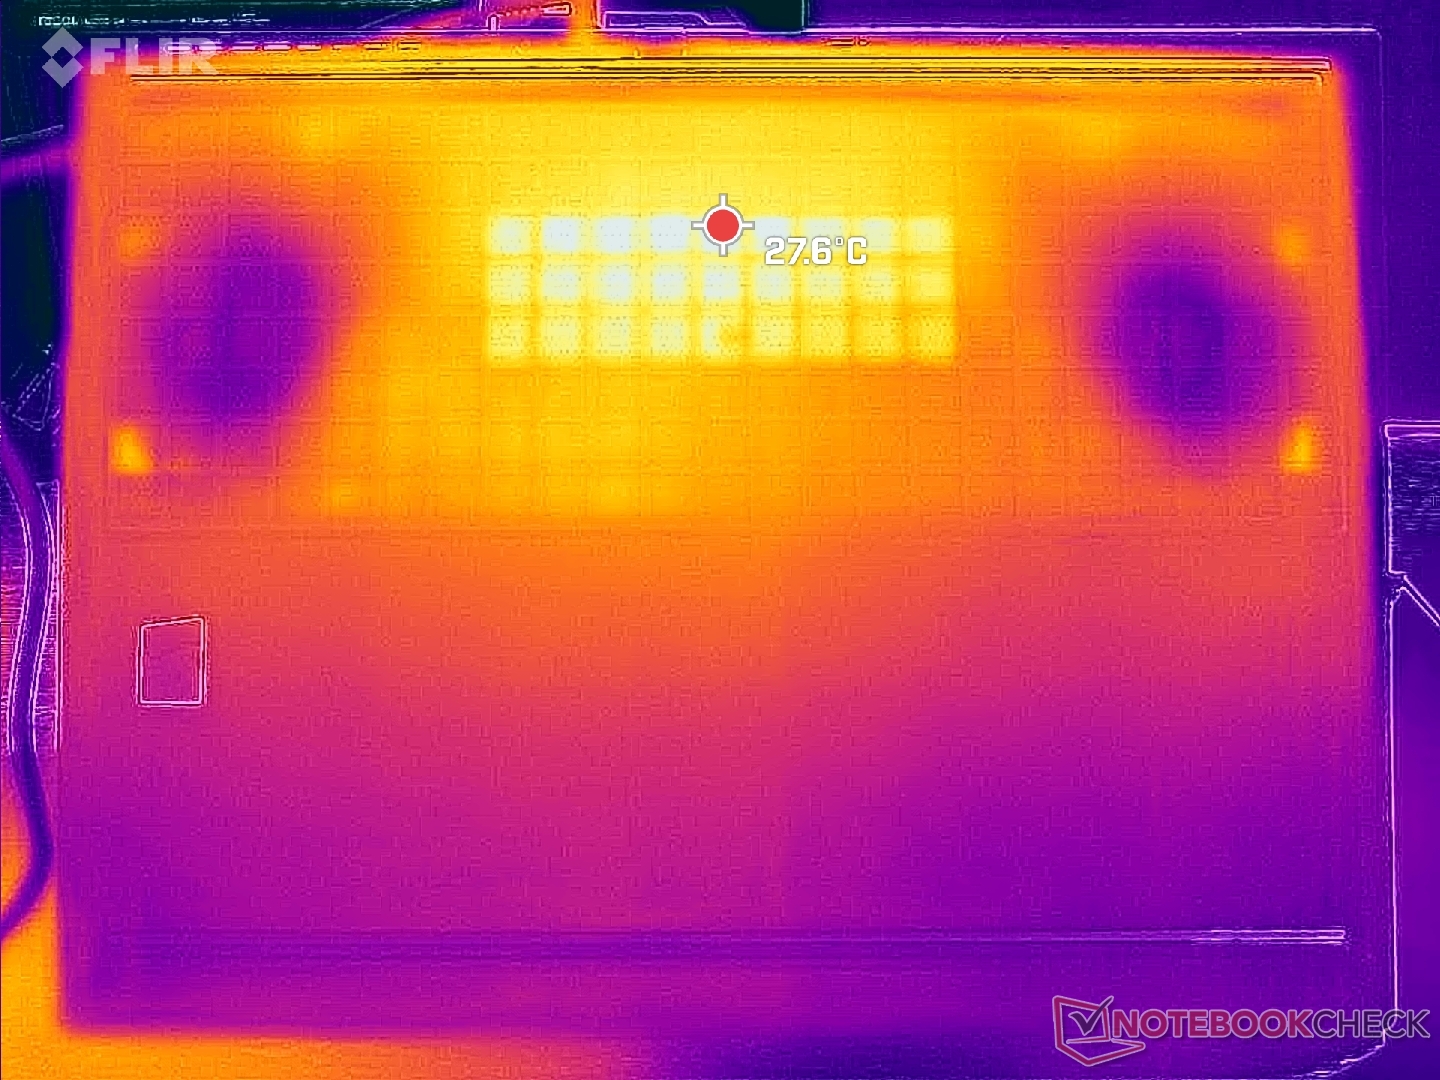
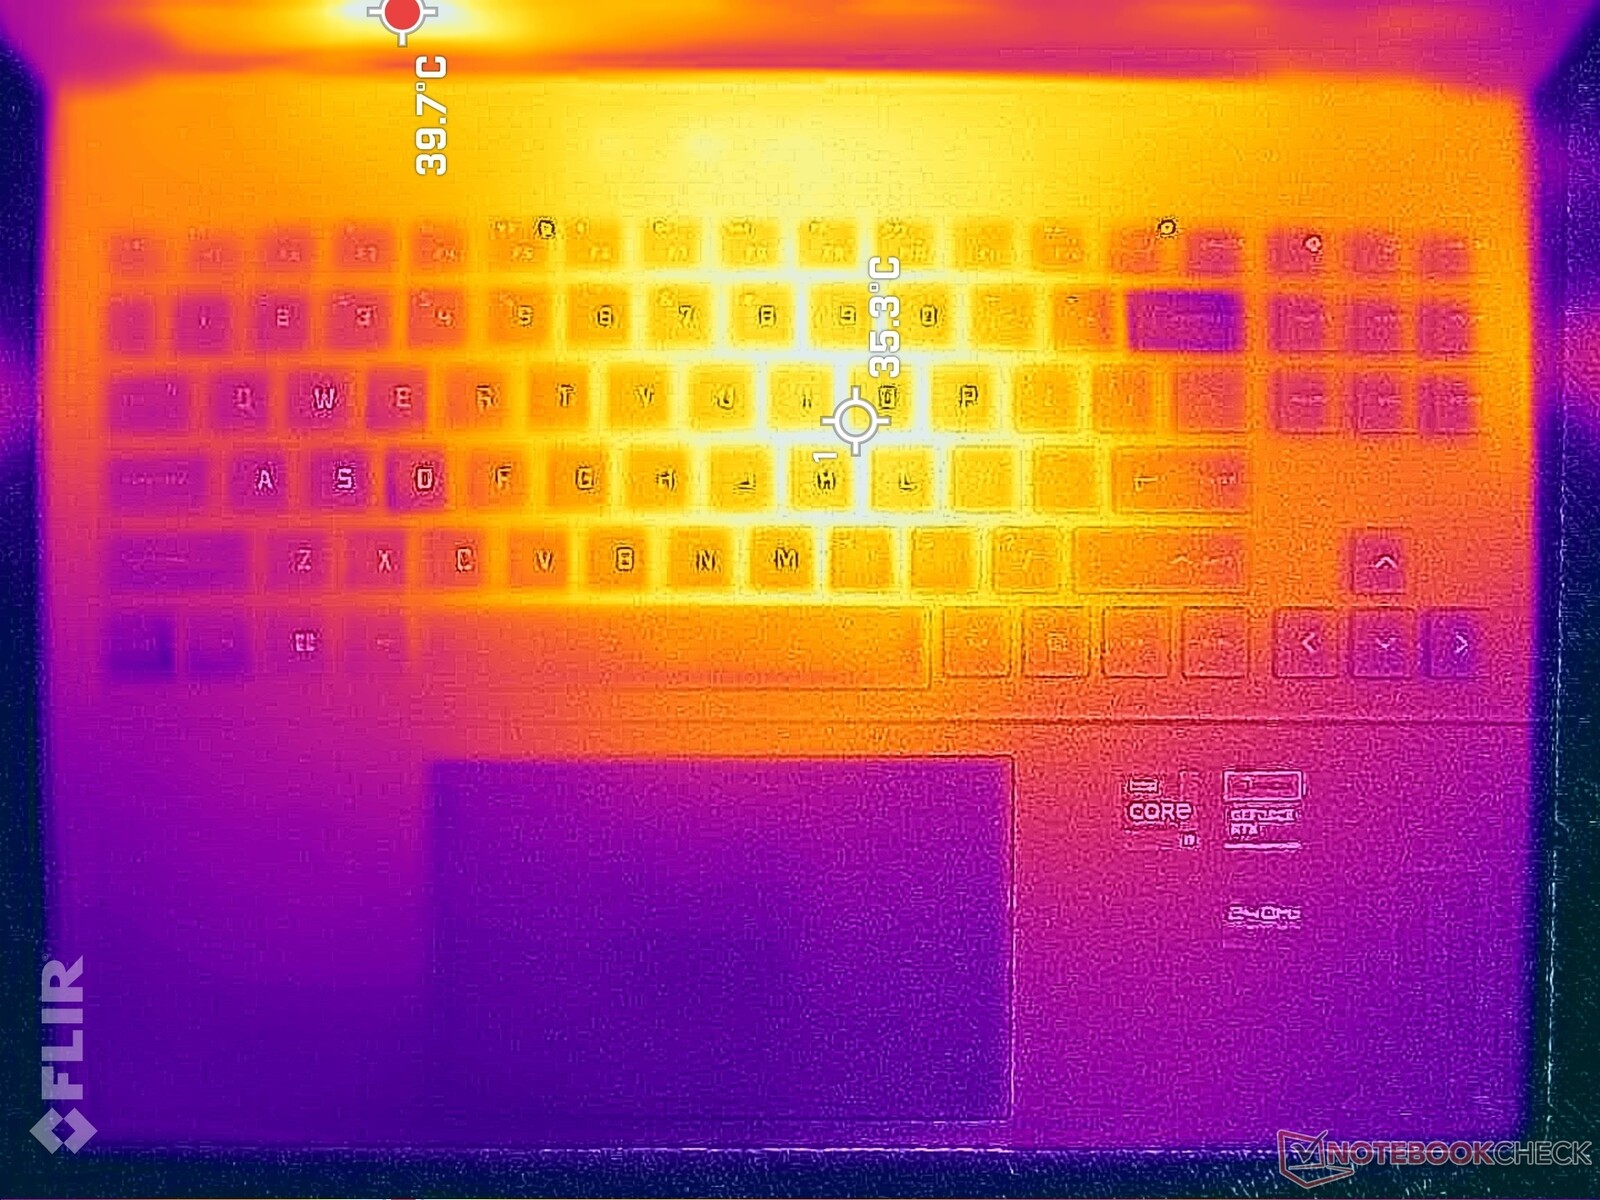
Las temperaturas de la superficie son más cálidas hacia el centro debido a la solución de refrigeración simétrica del interior. El centro del teclado puede alcanzar entre 40 y 45 C cuando se juega y la parte inferior puede ser incluso más cálida. Sin embargo, este rango sigue siendo comparable al delLegion Slim 7i 16 G8. El resto del portátil es más fresco, incluyendo los reposamanos, las teclas WASD y las teclas de flecha, donde la piel está más a menudo en contacto cuando se juega.
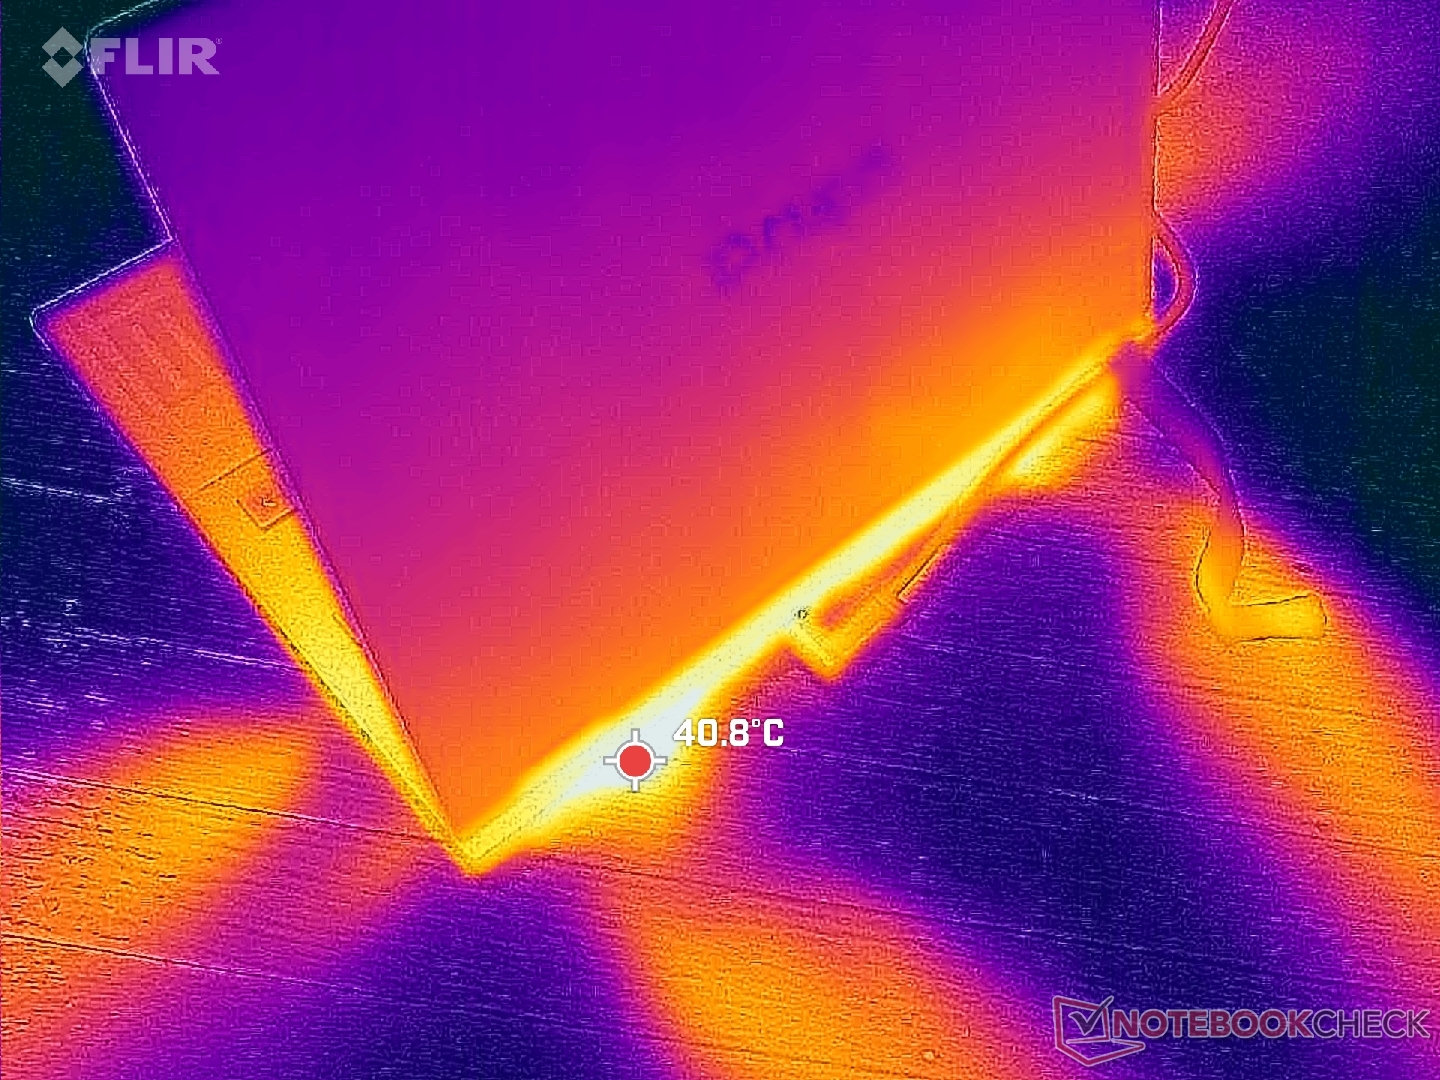
(-) La temperatura máxima en la parte superior es de 47.4 °C / 117 F, frente a la media de 40.4 °C / 105 F, que oscila entre 21.2 y 68.8 °C para la clase Gaming.
(-) El fondo se calienta hasta un máximo de 54.4 °C / 130 F, frente a la media de 43.2 °C / 110 F
(+) En reposo, la temperatura media de la parte superior es de 25.4 °C / 78# F, frente a la media del dispositivo de 33.9 °C / 93 F.
(±) Jugando a The Witcher 3, la temperatura media de la parte superior es de 32.5 °C / 91 F, frente a la media del dispositivo de 33.9 °C / 93 F.
(+) El reposamanos y el panel táctil están a una temperatura inferior a la de la piel, con un máximo de 29.6 °C / 85.3 F y, por tanto, son fríos al tacto.
(±) La temperatura media de la zona del reposamanos de dispositivos similares fue de 28.8 °C / 83.8 F (-0.8 °C / -1.5 F).
| HP Omen Transcend 16 Intel Core i9-13900HX, NVIDIA GeForce RTX 4070 Laptop GPU | Lenovo Legion Slim 7i 16 Gen 8 Intel Core i9-13900H, NVIDIA GeForce RTX 4070 Laptop GPU | HP Omen 16-wf000 Intel Core i7-13700HX, NVIDIA GeForce RTX 4080 Laptop GPU | Alienware x16 R1 Intel Core i9-13900HK, NVIDIA GeForce RTX 4080 Laptop GPU | Acer Nitro 16 AN16-41 AMD Ryzen 7 7735HS, NVIDIA GeForce RTX 4070 Laptop GPU | Asus ROG Zephyrus M16 GU603Z Intel Core i9-12900H, NVIDIA GeForce RTX 3070 Ti Laptop GPU | |
|---|---|---|---|---|---|---|
| Heat | -1% | 3% | -10% | -3% | -5% | |
| Maximum Upper Side * (°C) | 47.4 | 49.8 -5% | 45 5% | 47.2 -0% | 41.5 12% | 52 -10% |
| Maximum Bottom * (°C) | 54.4 | 48.8 10% | 48.8 10% | 47.8 12% | 51.8 5% | 51 6% |
| Idle Upper Side * (°C) | 28.4 | 29.4 -4% | 29.2 -3% | 36.8 -30% | 31.6 -11% | 29 -2% |
| Idle Bottom * (°C) | 29.2 | 30 -3% | 28.8 1% | 35.8 -23% | 34.5 -18% | 33 -13% |
* ... más pequeño es mejor
Prueba de resistencia
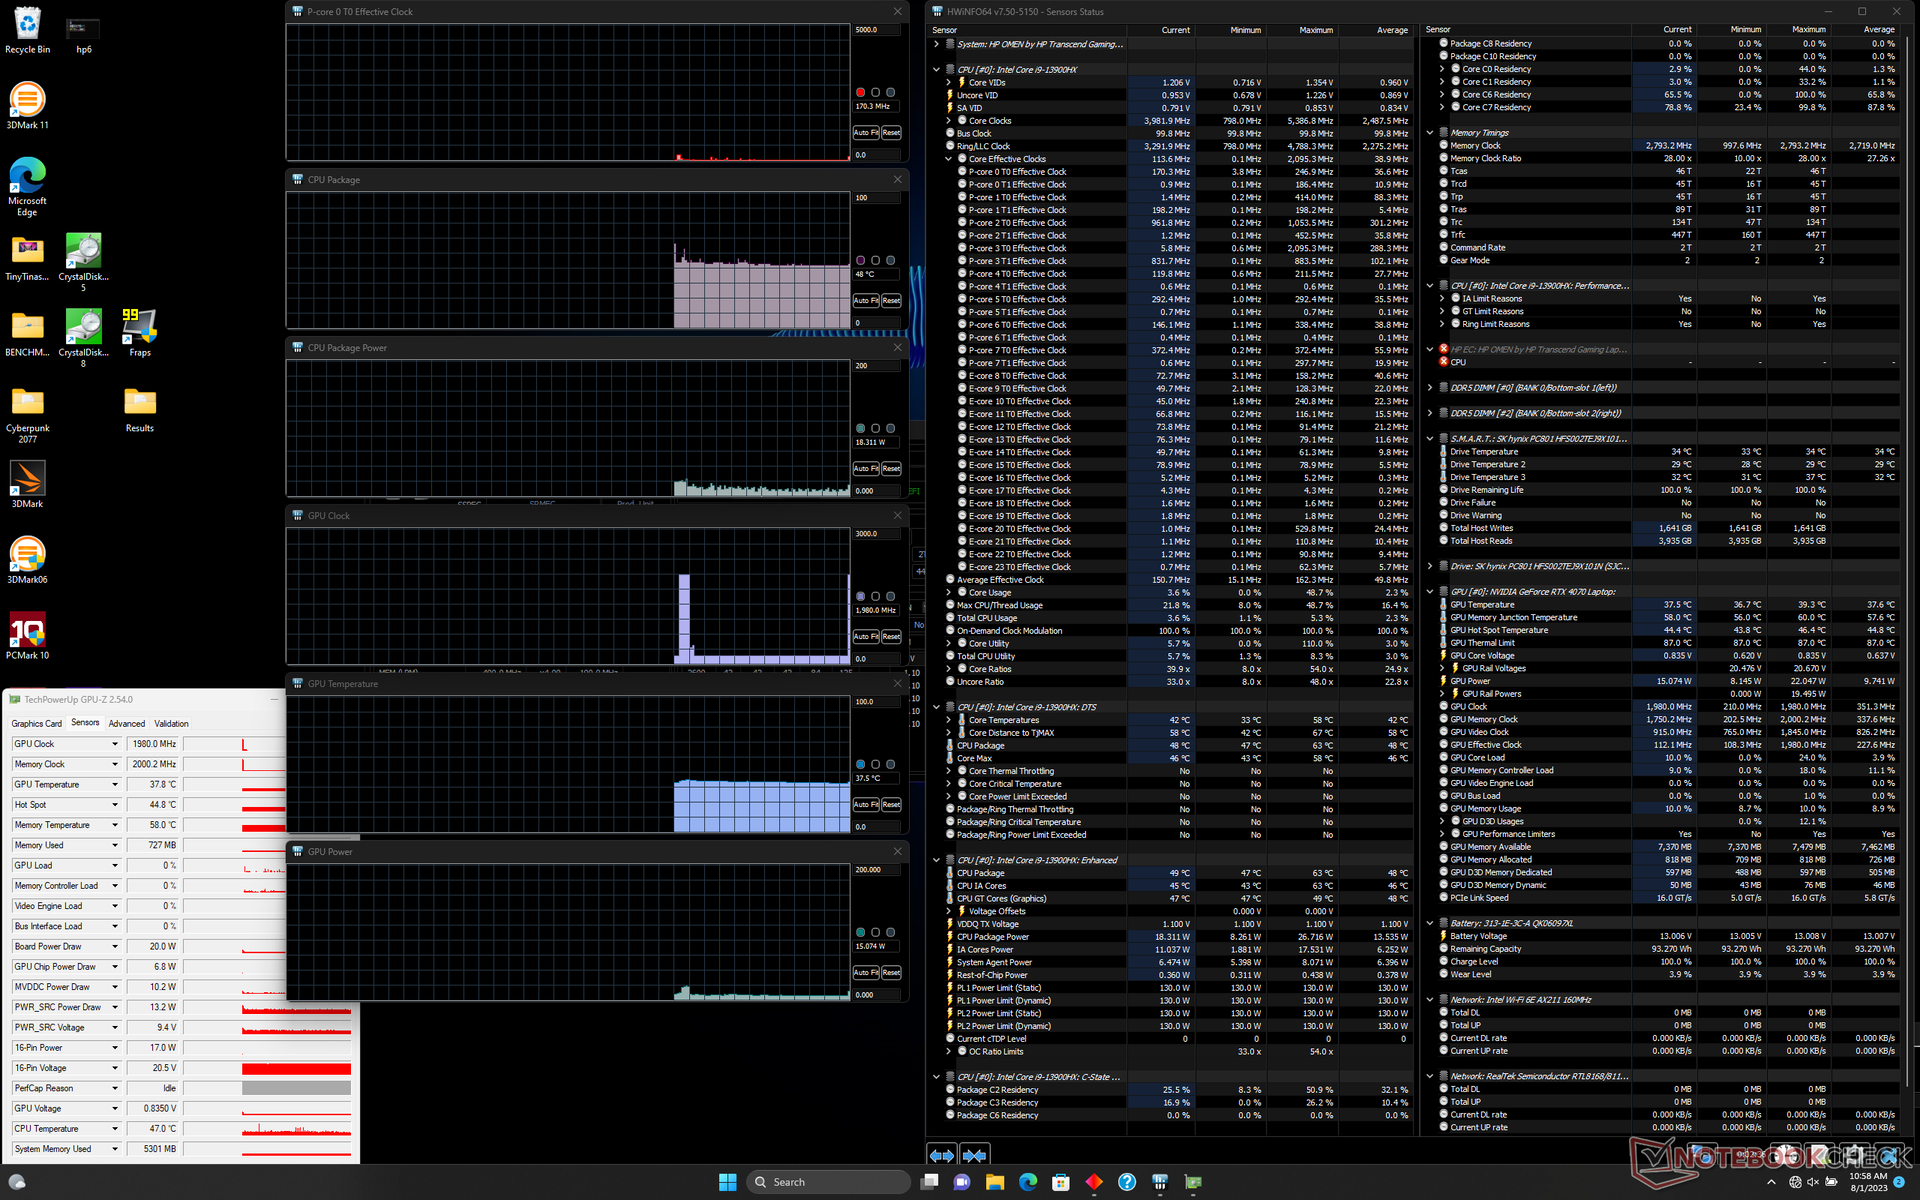
Cuando se ejecuta Prime95, la CPU alcanza los 3,1 GHz y 101 W antes de caer rápidamente y estabilizarse en torno a los 2,4 GHz y 84 W para mantener una temperatura del núcleo razonable de 81 C. La temperatura del núcleo puede llegar a los 97 C si la GPU también se somete a estrés al mismo tiempo, como se muestra en las capturas de pantalla siguientes.
La GPU Nvidia se estabilizaría a 2115 MHz, 86 C, y 94 W, respectivamente, cuando se ejecuta Witcher 3 en modo Rendimiento. Si está en modo Equilibrado, la GPU baja a 2085 MHz, 76 C y 86 W. Sólo podemos alcanzar un pico de potencia de la GPU de 105 W en el mundo real, en comparación con el objetivo de 130 W del TGP.
Funcionar con batería limita el rendimiento. Una prueba de Fire Strike con baterías arrojaría unas puntuaciones de Física y Gráficos de 21003 y 17627 puntos, respectivamente, frente a los 33936 y 27343 puntos con alimentación de red.
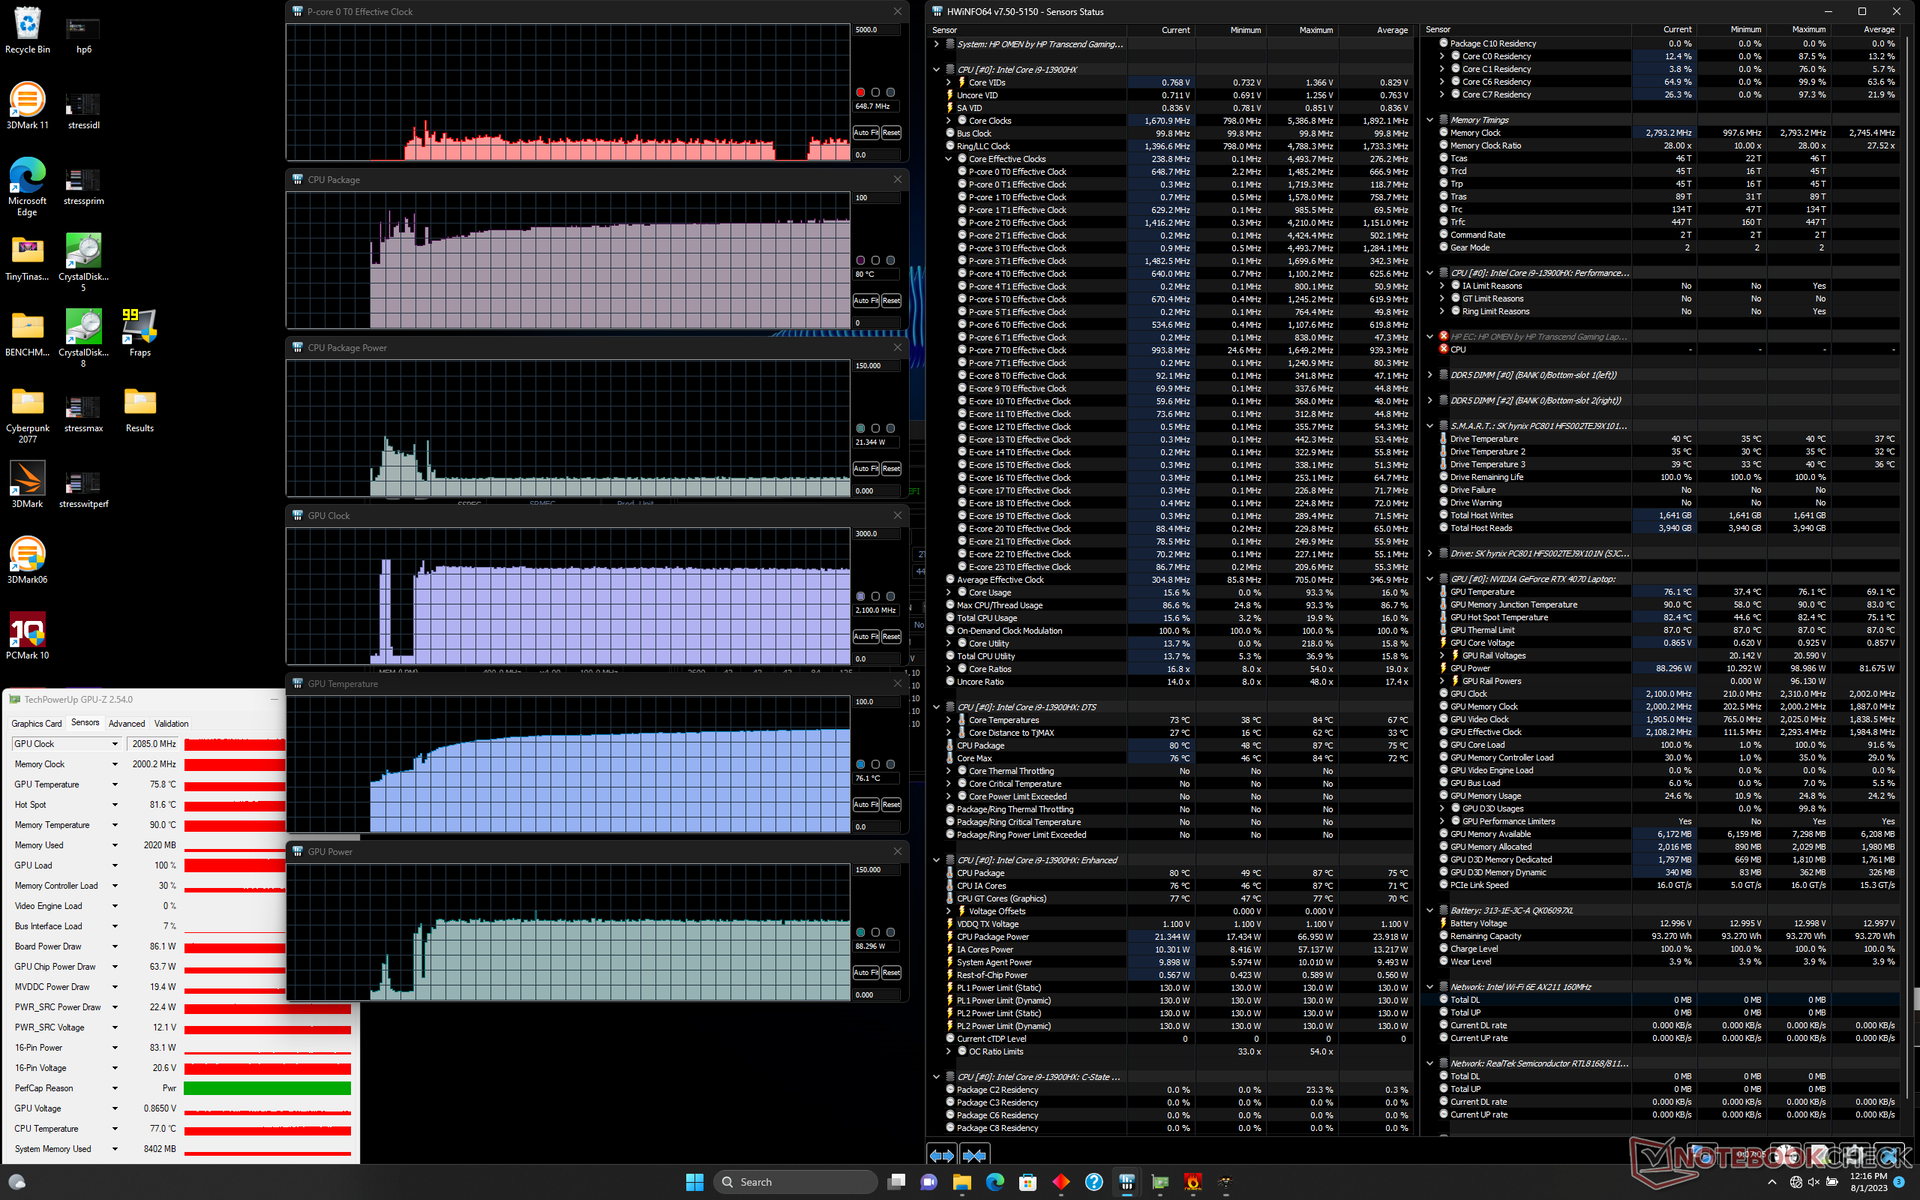
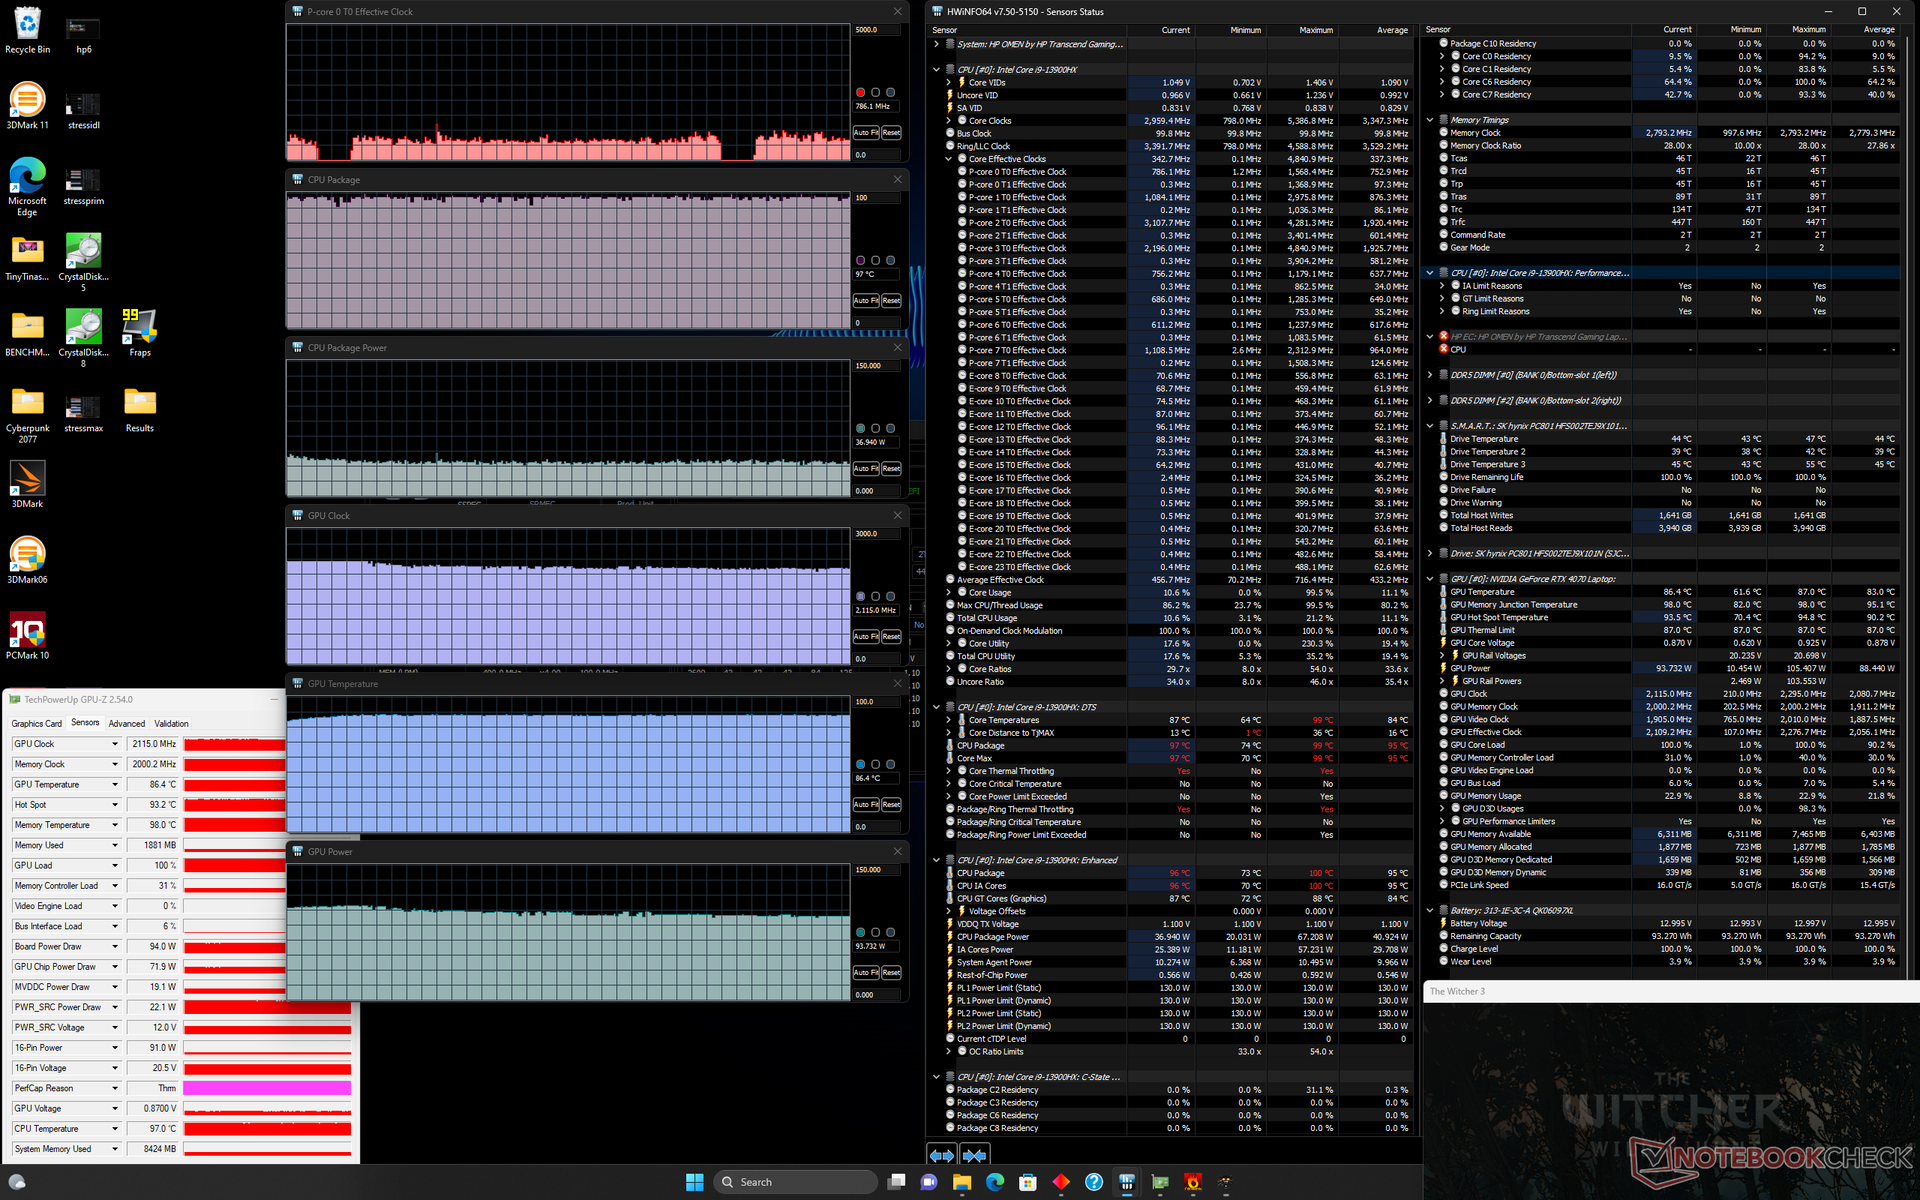
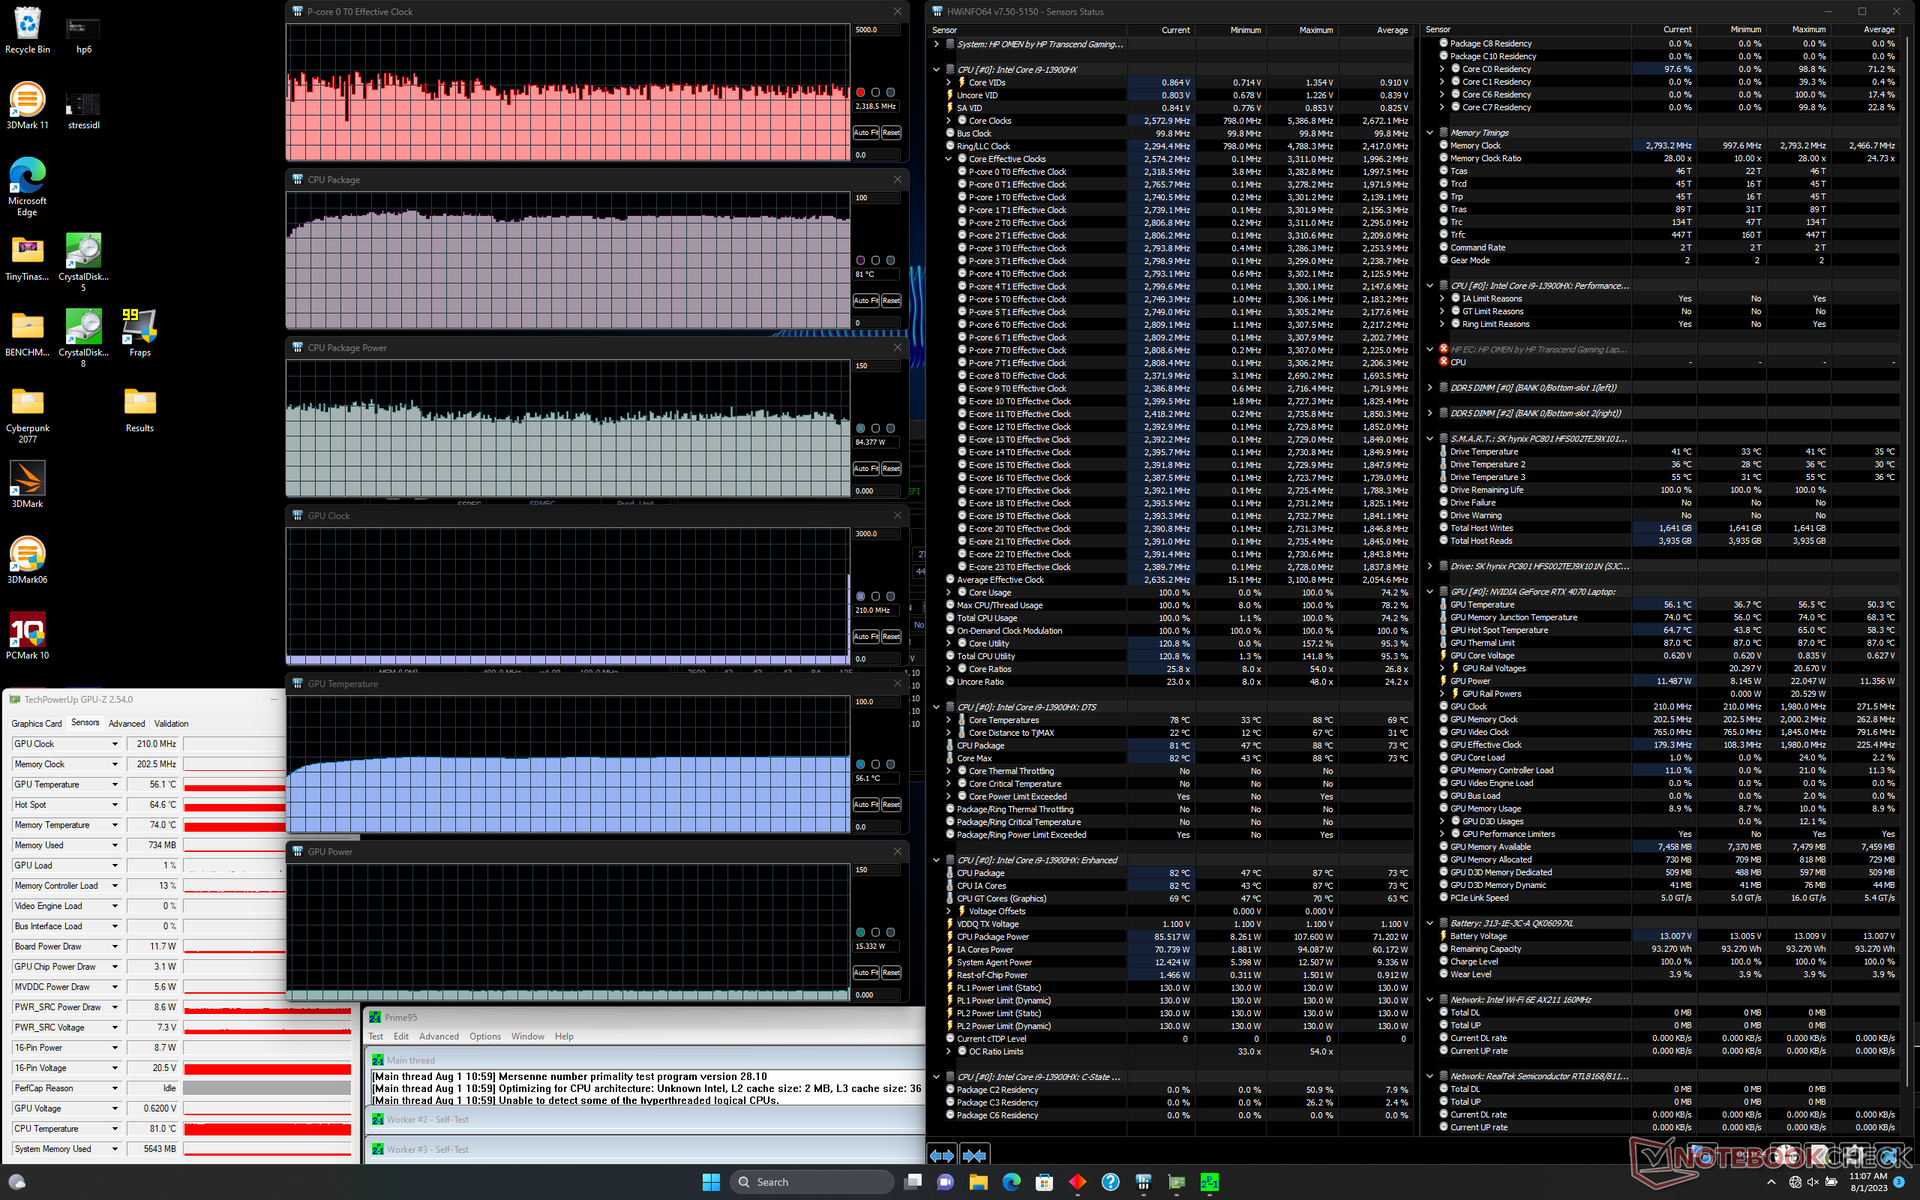
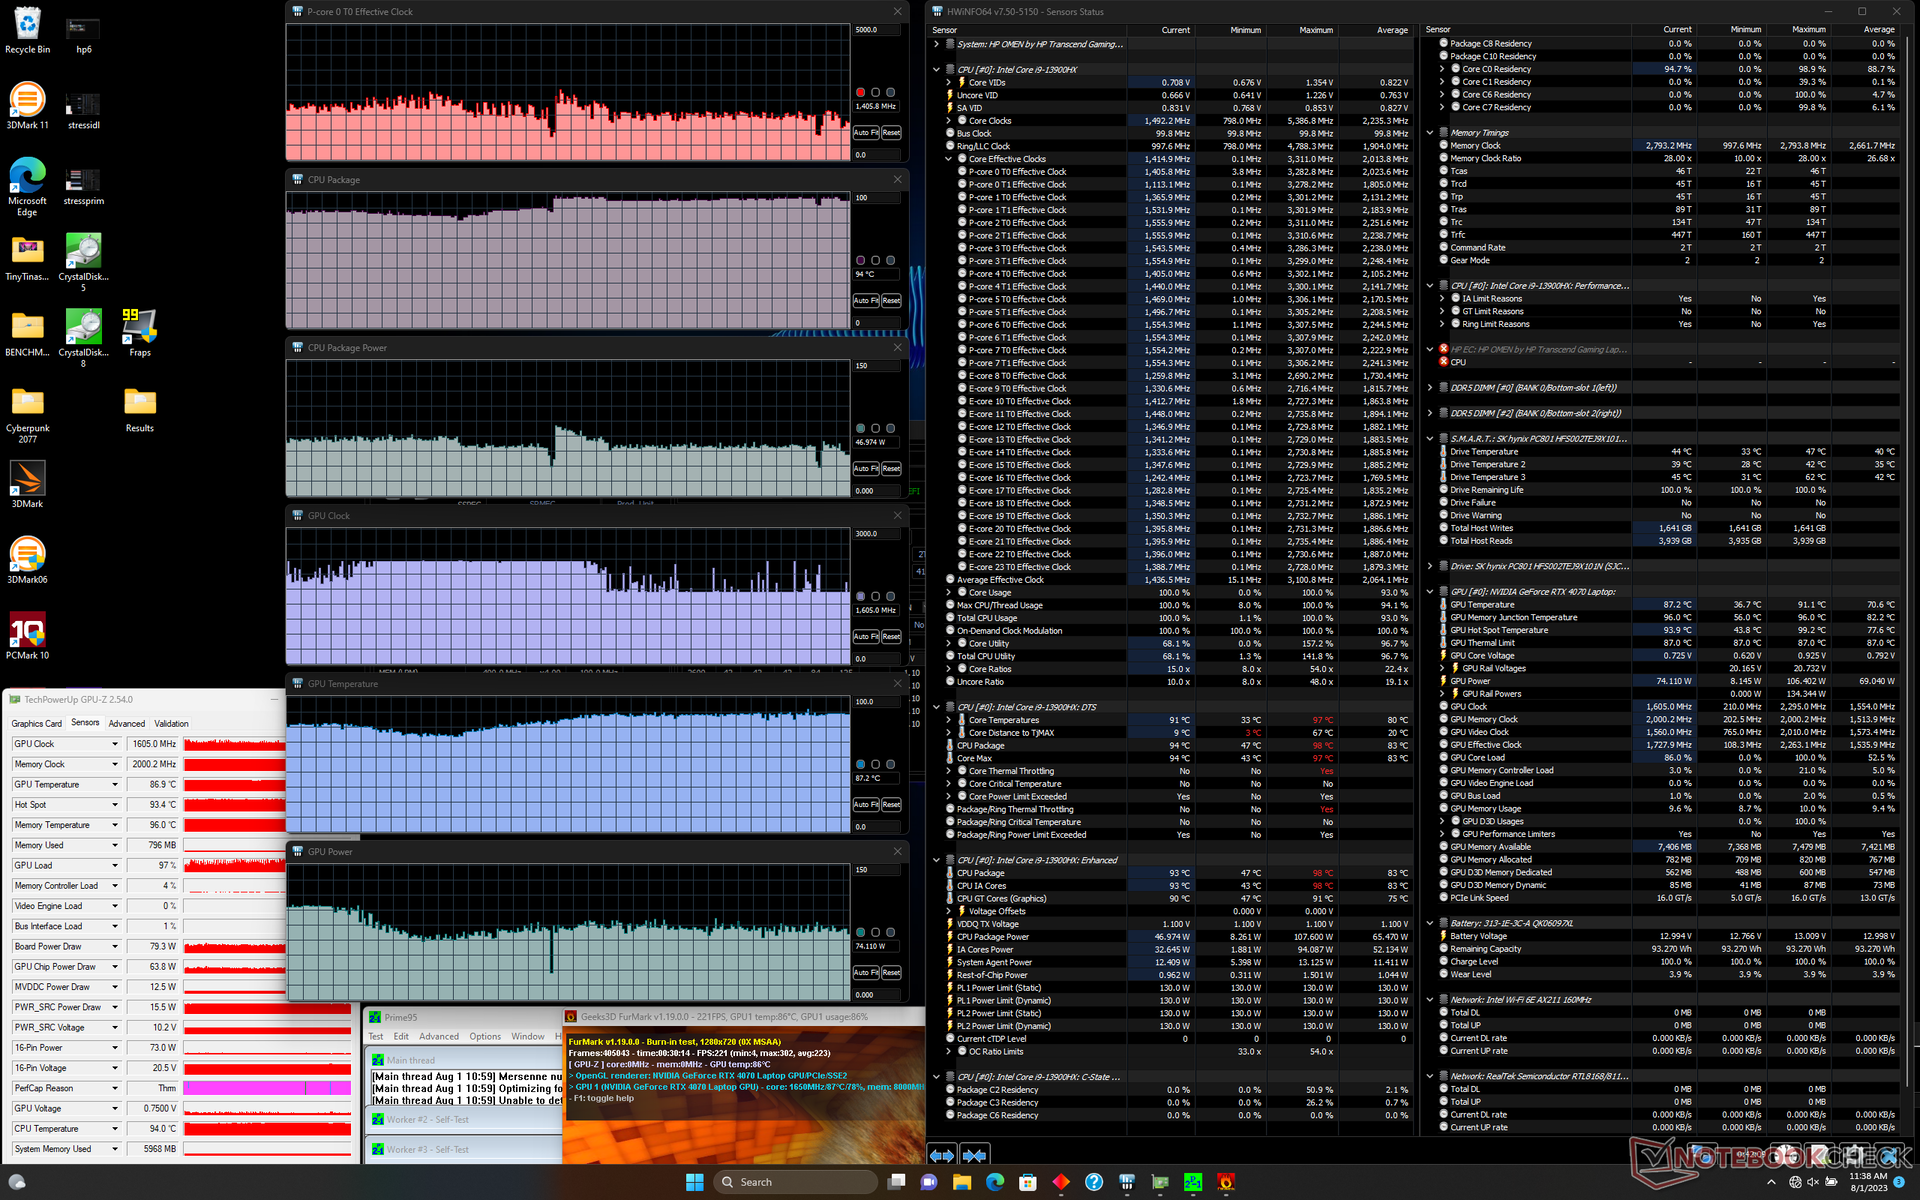
| RelojCPU (GHz) | Reloj GPU (MHz) | Temperatura mediaCPU (°C) | Temperatura media GPU (°C) | |
| Sistema en reposo | -- | -- | 48 | 38 |
| Prime95 Stress | ~2,0 - 2,4 | -- | 81 | 56 |
| Prime95+ FurMark Estrés | ~1,5 | 1605 | 94 | 87 |
| Witcher 3 Tensión (modoequilibrado) | ~0,7 | 2085 | 80 | 77 |
| Witcher 3 Estrés (modoRendimiento) | ~0,7 | 2115 | 97 | 87 |
Altavoces
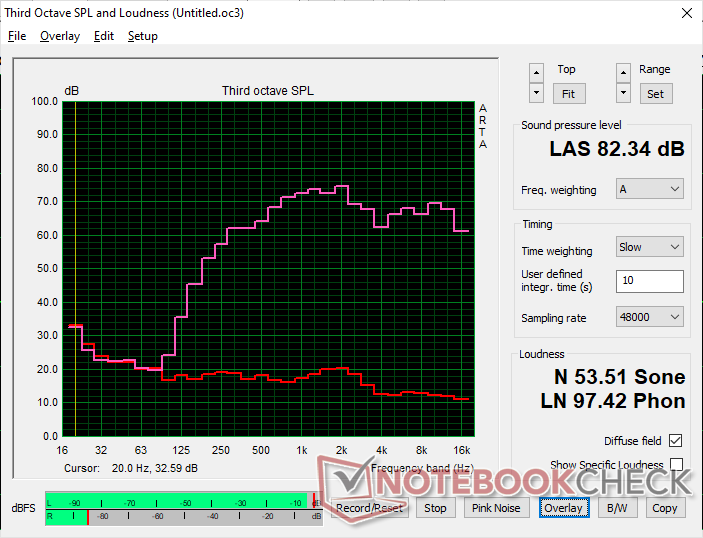
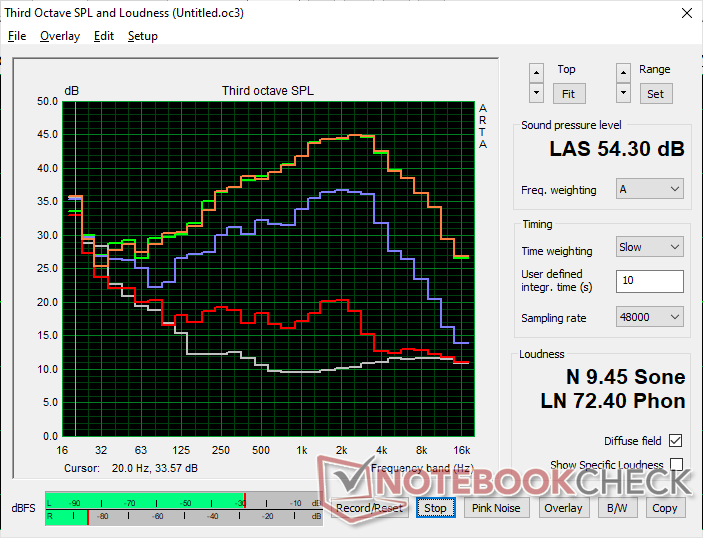
HP Omen Transcend 16 análisis de audio
(+) | los altavoces pueden reproducir a un volumen relativamente alto (#82.3 dB)
Graves 100 - 315 Hz
(-) | casi sin bajos - de media 20% inferior a la mediana
(±) | la linealidad de los graves es media (14.3% delta a frecuencia anterior)
Medios 400 - 2000 Hz
(±) | medias más altas - de media 5.2% más altas que la mediana
(+) | los medios son lineales (3.7% delta a la frecuencia anterior)
Altos 2 - 16 kHz
(+) | máximos equilibrados - a sólo 2% de la mediana
(+) | los máximos son lineales (6.7% delta a la frecuencia anterior)
Total 100 - 16.000 Hz
(±) | la linealidad del sonido global es media (17% de diferencia con la mediana)
En comparación con la misma clase
» 45% de todos los dispositivos probados de esta clase eran mejores, 12% similares, 43% peores
» El mejor tuvo un delta de 6%, la media fue 18%, el peor fue ###max##%
En comparación con todos los dispositivos probados
» 31% de todos los dispositivos probados eran mejores, 8% similares, 61% peores
» El mejor tuvo un delta de 4%, la media fue 23%, el peor fue ###max##%
Apple MacBook Pro 16 2021 M1 Pro análisis de audio
(+) | los altavoces pueden reproducir a un volumen relativamente alto (#84.7 dB)
Graves 100 - 315 Hz
(+) | buen bajo - sólo 3.8% lejos de la mediana
(+) | el bajo es lineal (5.2% delta a la frecuencia anterior)
Medios 400 - 2000 Hz
(+) | medios equilibrados - a sólo 1.3% de la mediana
(+) | los medios son lineales (2.1% delta a la frecuencia anterior)
Altos 2 - 16 kHz
(+) | máximos equilibrados - a sólo 1.9% de la mediana
(+) | los máximos son lineales (2.7% delta a la frecuencia anterior)
Total 100 - 16.000 Hz
(+) | el sonido global es lineal (4.6% de diferencia con la mediana)
En comparación con la misma clase
» 0% de todos los dispositivos probados de esta clase eran mejores, 0% similares, 100% peores
» El mejor tuvo un delta de 5%, la media fue 17%, el peor fue ###max##%
En comparación con todos los dispositivos probados
» 0% de todos los dispositivos probados eran mejores, 0% similares, 100% peores
» El mejor tuvo un delta de 4%, la media fue 23%, el peor fue ###max##%
Gestión de la energía
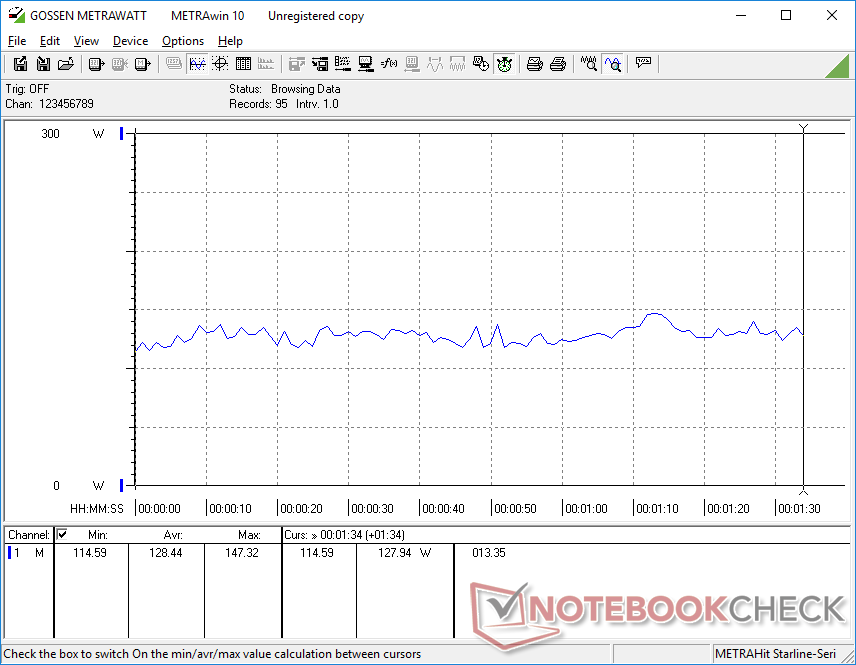
Consumo de energía: cifras elevadas al ralentí
Nuestro Omen Transcend 16 viene con una CPU más rápida pero una GPU más lenta que el Omen 16, por lo que el consumo medio de energía es más o menos el mismo entre ellos. Sus diferencias se hacen más notables cuando se estresa sólo la CPU o la GPU. Por ejemplo, nuestro Omen Transcend 16 consumiría entre 15 y 20 W más al ejecutar Prime95, mientras que consumiría unos 15 W menos al ejecutar FurMark.
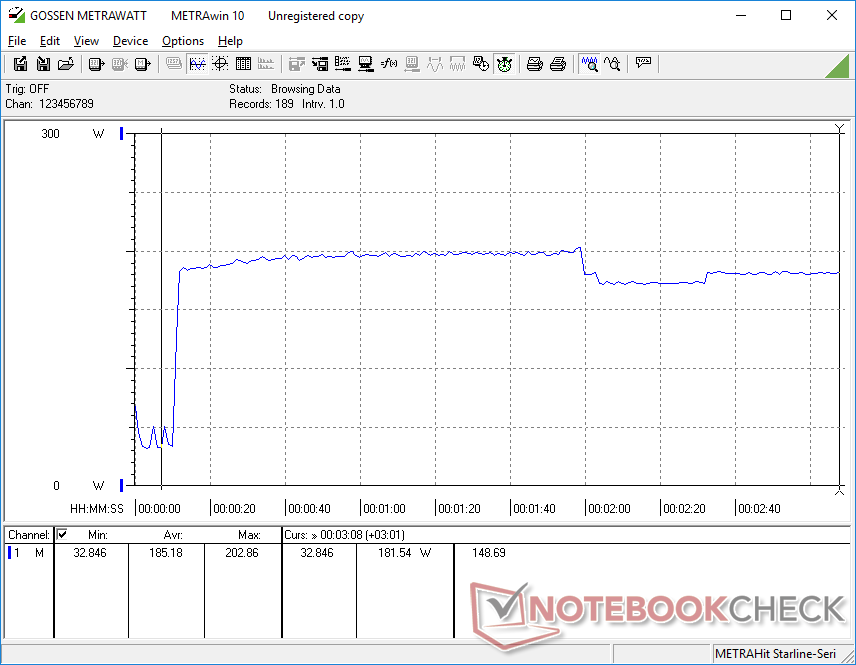
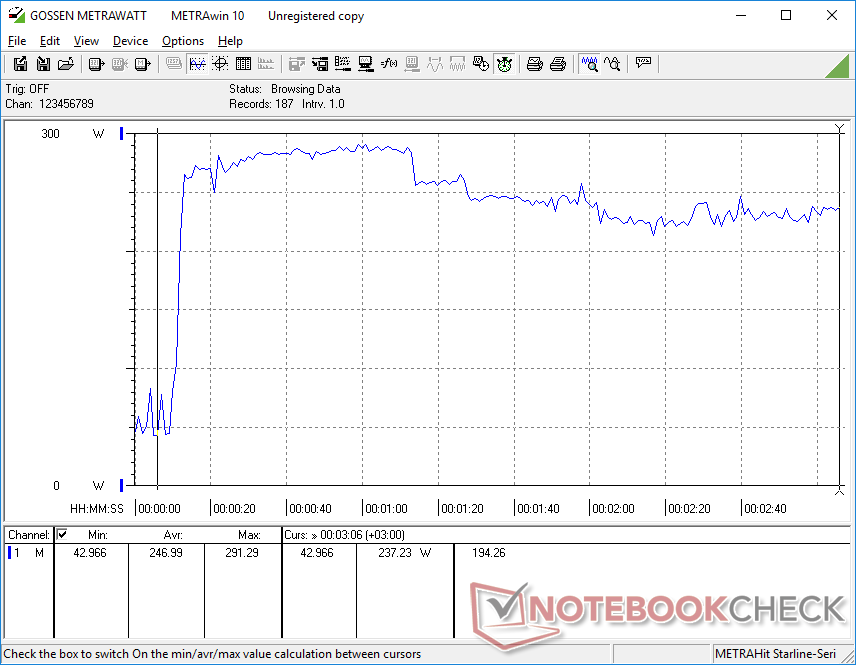
El funcionamiento en ralentí en el escritorio puede consumir hasta 55 W en el perfil Rendimiento. Se sabe que el Mini-LED suele ser más exigente que una alternativa IPS estándar.
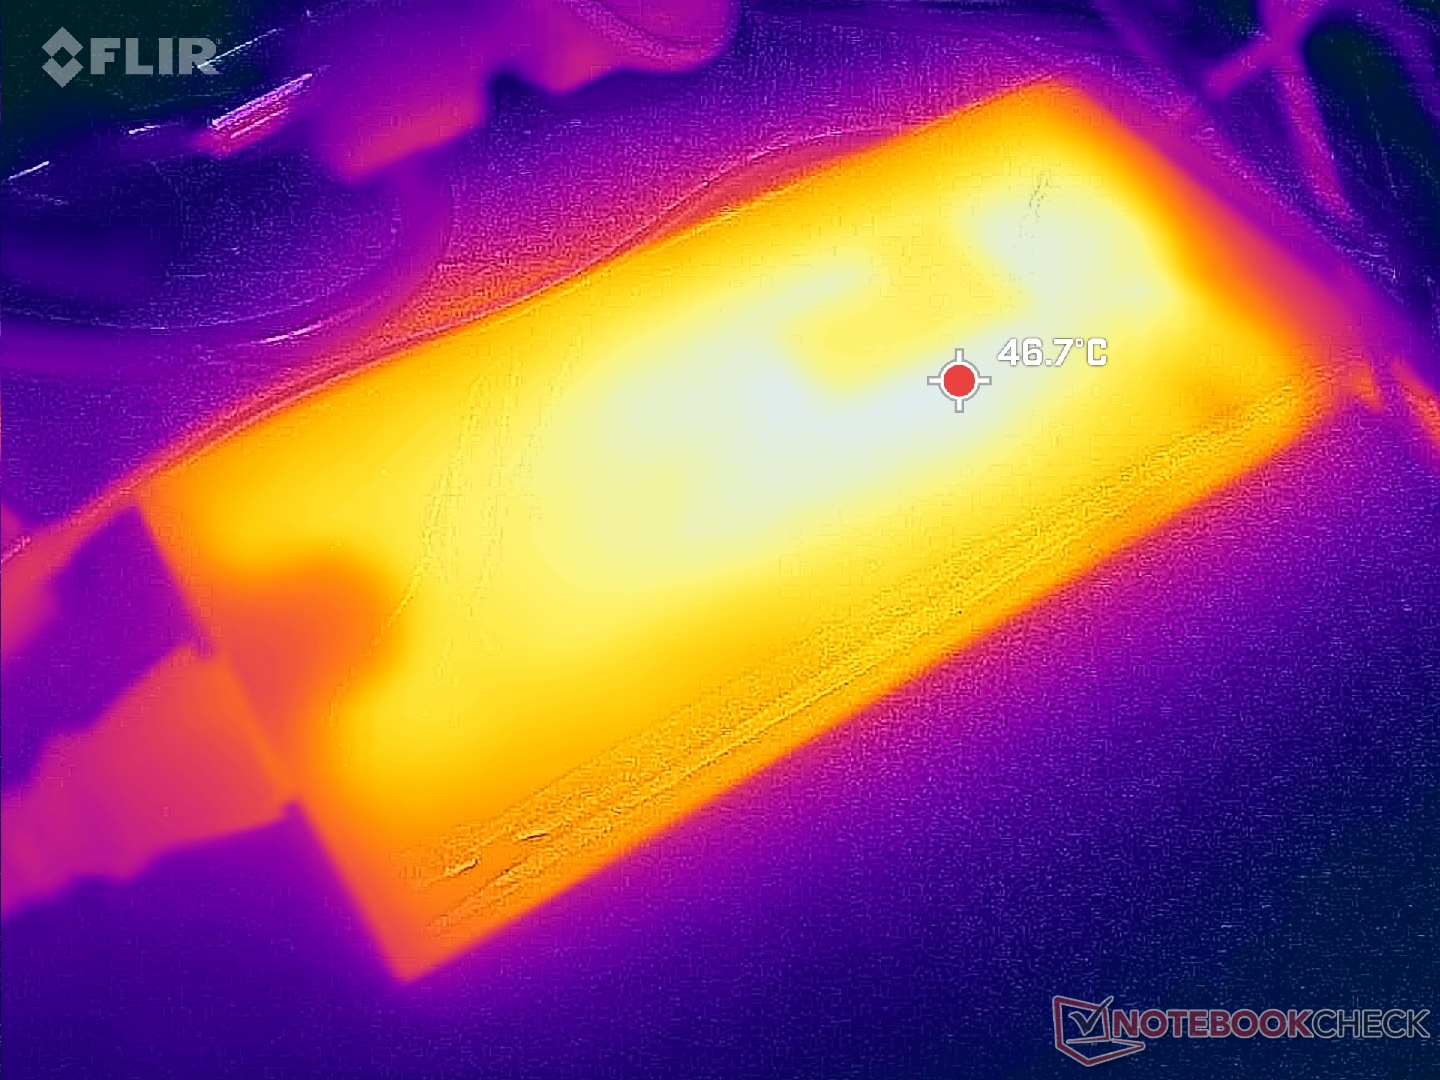
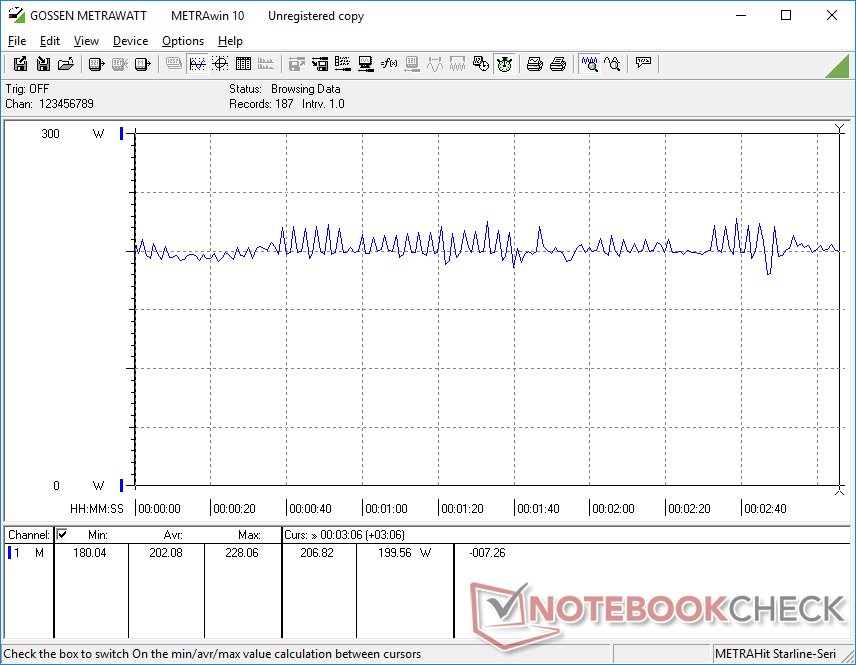
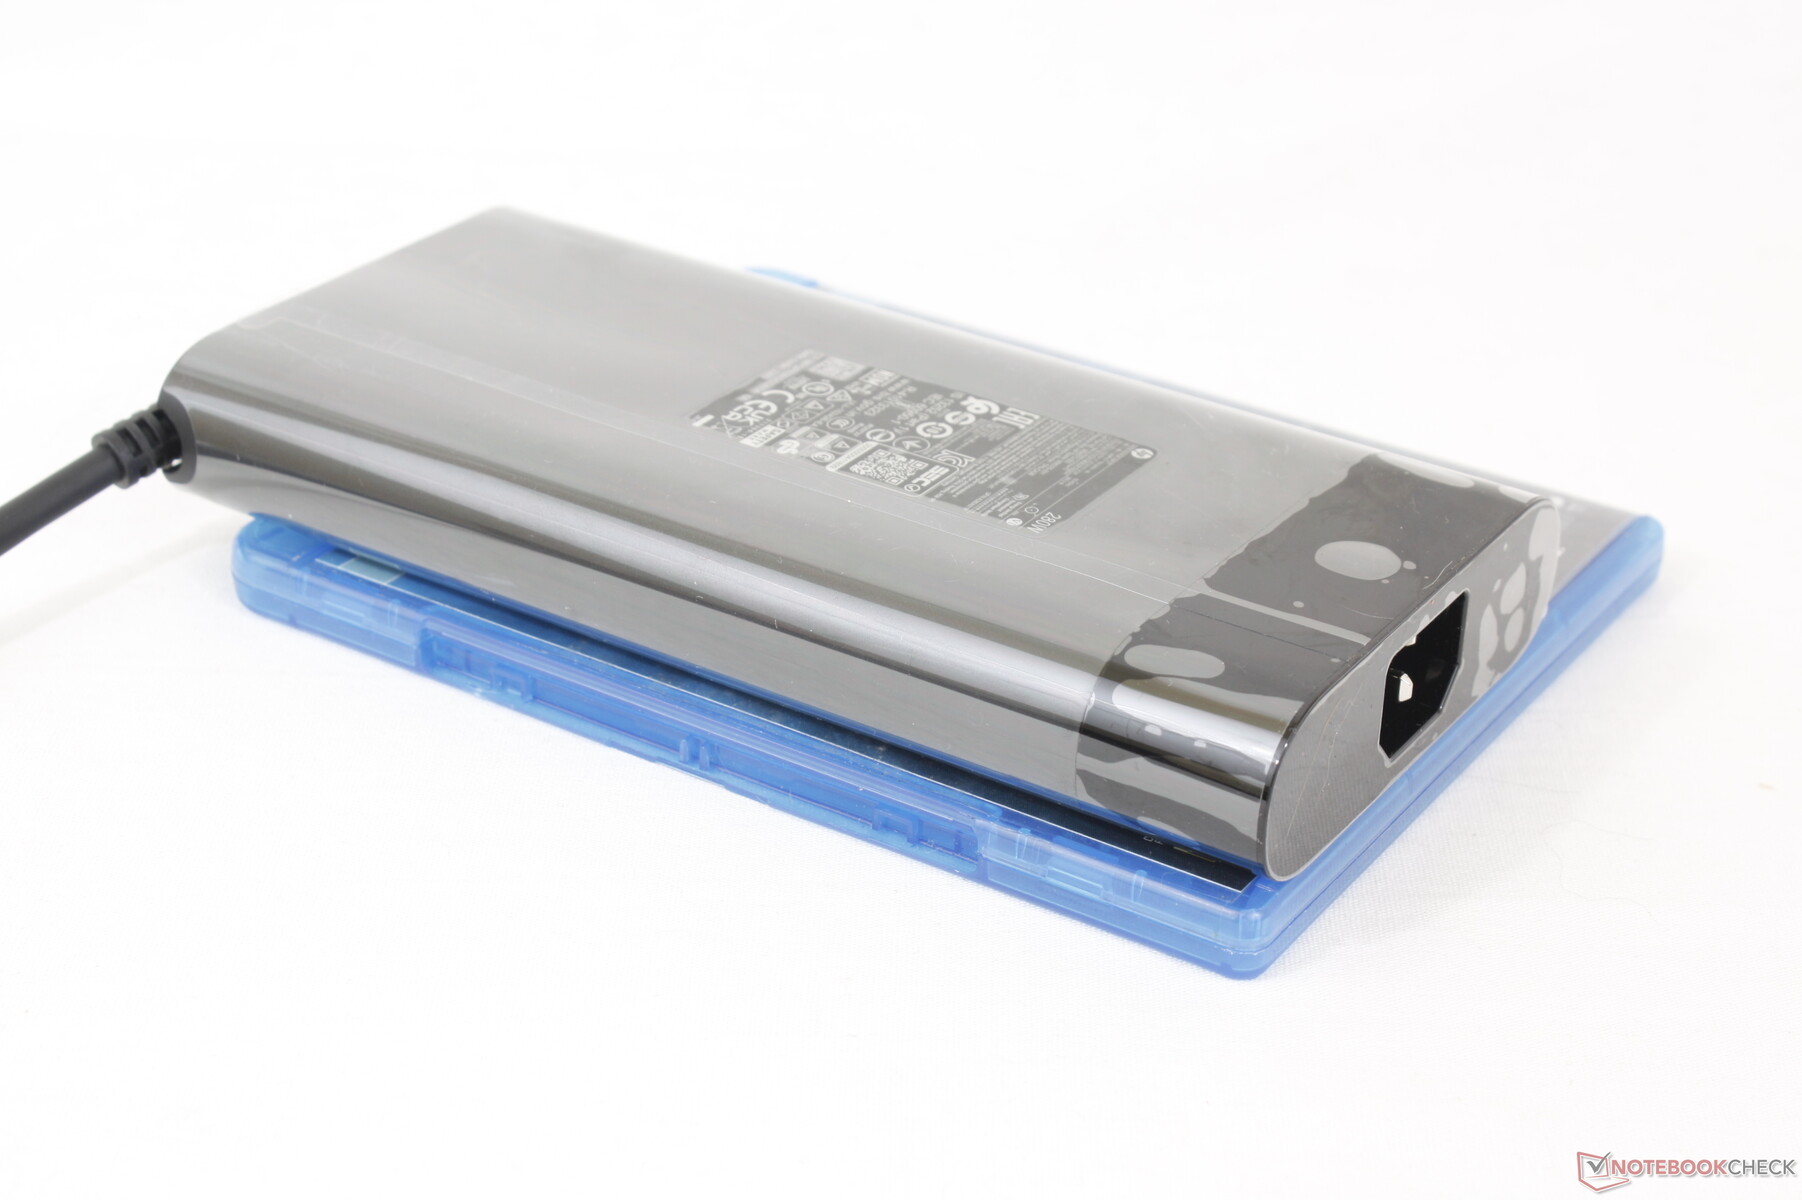
Pudimos registrar un consumo máximo de 292 W con el adaptador de CA mediano-grande (~18 x 8.7 x 2.6 cm) de 280 W cuando la CPU y la GPU están al 100% de uso. El consumo se estabilizaría en el rango de los 240 W tras aproximadamente un minuto de estrés total.
| Off / Standby | |
| Ocioso | |
| Carga |
|
Clave:
min: | |
| HP Omen Transcend 16 i9-13900HX, GeForce RTX 4070 Laptop GPU, SK hynix PC801 HFS002TEJ9X101N, Mini-LED, 2560x1600, 16" | Lenovo Legion Slim 7i 16 Gen 8 i9-13900H, GeForce RTX 4070 Laptop GPU, Samsung PM9A1 MZVL21T0HCLR, IPS, 2560x1600, 16" | HP Omen 16-wf000 i7-13700HX, GeForce RTX 4080 Laptop GPU, SK hynix PC801 HFS002TEJ9X101N, IPS, 2560x1440, 16.1" | Alienware x16 R1 i9-13900HK, GeForce RTX 4080 Laptop GPU, SK hynix PC801 HFS001TEJ9X101N, IPS, 2560x1600, 16" | Acer Nitro 16 AN16-41 R7 7735HS, GeForce RTX 4070 Laptop GPU, Samsung PM9A1 MZVL21T0HCLR, IPS, 2560x1600, 16" | Asus ROG Zephyrus M16 GU603Z i9-12900H, GeForce RTX 3070 Ti Laptop GPU, Micron 3400 1TB MTFDKBA1T0TFH, IPS, 2560x1600, 16" | |
|---|---|---|---|---|---|---|
| Power Consumption | 9% | 3% | -12% | 29% | 34% | |
| Idle Minimum * (Watt) | 19.2 | 22 -15% | 21.8 -14% | 25.2 -31% | 11.6 40% | 10.8 44% |
| Idle Average * (Watt) | 22.7 | 29 -28% | 26 -15% | 29.9 -32% | 15.6 31% | 17 25% |
| Idle Maximum * (Watt) | 55.4 | 39.5 29% | 36 35% | 49.8 10% | 16.5 70% | 17.8 68% |
| Load Average * (Watt) | 128.4 | 98.7 23% | 115.5 10% | 105.4 18% | 155 -21% | 116 10% |
| Witcher 3 ultra * (Watt) | 206 | 171.8 17% | 214 -4% | 263 -28% | 154.8 25% | 144 30% |
| Load Maximum * (Watt) | 292 | 213.2 27% | 269.7 8% | 313.8 -7% | 205 30% | 220 25% |
* ... más pequeño es mejor
Power Consumption Witcher 3 / Stresstest
Power Consumption external Monitor
Duración de la batería
La capacidad de la batería ha aumentado de 83 Wh en el Omen 16 a 97 Wh en nuestro Omen Transcend 16. No obstante, la duración de la batería sigue siendo menor debido al panel mini-LED más exigente. Somos capaces de registrar poco más de 4 horas de navegación WLAN en el mundo real en el perfil de energía equilibrado con la iGPU activa, mientras que el Omen 16 puede acercarse a las 5 horas con una configuración similar.
El adaptador de CA incluido tarda unos 90 minutos en cargar el portátil de vacío a pleno rendimiento. El sistema también se puede recargar por USB-C, pero es posible que los adaptadores de menor capacidad no funcionen. Nuestro adaptador de CA USB-C de 65 W, por ejemplo, generaría un mensaje de error de compatibilidad, mientras que nuestro adaptador USB-C de 135 W cargaría sin problemas.
| HP Omen Transcend 16 i9-13900HX, GeForce RTX 4070 Laptop GPU, 97 Wh | Lenovo Legion Slim 7i 16 Gen 8 i9-13900H, GeForce RTX 4070 Laptop GPU, 99.9 Wh | HP Omen 16-wf000 i7-13700HX, GeForce RTX 4080 Laptop GPU, 83 Wh | Alienware x16 R1 i9-13900HK, GeForce RTX 4080 Laptop GPU, 90 Wh | Acer Nitro 16 AN16-41 R7 7735HS, GeForce RTX 4070 Laptop GPU, 90 Wh | Asus ROG Zephyrus M16 GU603Z i9-12900H, GeForce RTX 3070 Ti Laptop GPU, 90 Wh | |
|---|---|---|---|---|---|---|
| Duración de Batería | -13% | 0% | -22% | 86% | 47% | |
| Reader / Idle (h) | 6.3 | 5.1 -19% | 5.5 -13% | 7.3 16% | 12.2 94% | |
| WiFi v1.3 (h) | 4.2 | 4.4 5% | 5.1 21% | 2.5 -40% | 9 114% | 7.4 76% |
| Load (h) | 1.2 | 0.9 -25% | 1.1 -8% | 0.7 -42% | 1.8 50% | 1.4 17% |
| H.264 (h) | 10.2 | 7.3 |
Pro
Contra
Veredicto - Gran diseño y pantalla mini LED única, pero ¿dónde está la GeForce RTX 4080?
El Omen Transcend 16 ofrece varias mejoras con respecto al Omen 16 estándar, como un sensor IR, una relación de aspecto 16:10, una batería de mayor capacidad y una opción mini-LED. Esta última es quizás la más singular, ya que el modelo es uno de los primeros en llevar una pantalla mini-LED QHD+ 240 Hz para una experiencia de visualización diferente a la mayoría de los otros portátiles para juegos, donde IPS y OLED siguen siendo habituales. Los usuarios que valoren el brillo y las funciones HDR1000 apreciarán especialmente las ventajas de la mini-LED.
El Omen Transcend 16 cambia las opciones de GPU superior por una CPU más rápida y un perfil más fino y ligero. Mientras tanto, su pantalla Mini-LED es extraordinariamente brillante para el contenido HDR más vibrante en cualquier portátil de juegos.
El último modelo no es necesariamente mejor que el Omen 16 normal, ya que omite algunas características importantes. En primer lugar, el Omen Transcend 16 solo admite un SSD interno, mientras que el Omen 16 admite dos. En segundo lugar, y quizás lo más importante, el Omen Transcend 16 tiene como máximo la GPU GeForce RTX 4070 de 130 W, mientras que el Omen 16 puede configurarse con la GPU GeForce RTX 4080 de 145 W como máximo. Esta limitación de GPU podría deberse al perfil más delgado y la opción de CPU Core i9-13900HX superior del Omen Transcend 16. Por tanto, los usuarios que prefieran un rendimiento de GPU más rápido podrían considerar el omen 16 normal mientras que los que prefieran un rendimiento de CPU más rápido pueden considerar el Omen Transcend 16.
Precio y disponibilidad
HP ya está distribuyendo su Omen Transcend 16 desde $1250 USD para la configuración base Core i7-13700HX y RTX 4050 hasta $2500 para nuestra configuración de revisión.
HP Omen Transcend 16
- 08/04/2023 v7 (old)
Allen Ngo
Transparencia
La selección de los dispositivos que se van a reseñar corre a cargo de nuestro equipo editorial. La muestra de prueba fue proporcionada al autor en calidad de préstamo por el fabricante o el minorista a los efectos de esta reseña. El prestamista no tuvo ninguna influencia en esta reseña, ni el fabricante recibió una copia de la misma antes de su publicación. No había ninguna obligación de publicar esta reseña. Como empresa de medios independiente, Notebookcheck no está sujeta a la autoridad de fabricantes, minoristas o editores.
Así es como prueba Notebookcheck
Cada año, Notebookcheck revisa de forma independiente cientos de portátiles y smartphones utilizando procedimientos estandarizados para asegurar que todos los resultados son comparables. Hemos desarrollado continuamente nuestros métodos de prueba durante unos 20 años y hemos establecido los estándares de la industria en el proceso. En nuestros laboratorios de pruebas, técnicos y editores experimentados utilizan equipos de medición de alta calidad. Estas pruebas implican un proceso de validación en varias fases. Nuestro complejo sistema de clasificación se basa en cientos de mediciones y puntos de referencia bien fundamentados, lo que mantiene la objetividad.Price comparison

