Análisis del Asus Vivobook Pro 16X: Portátil creador con un procesador excepcional
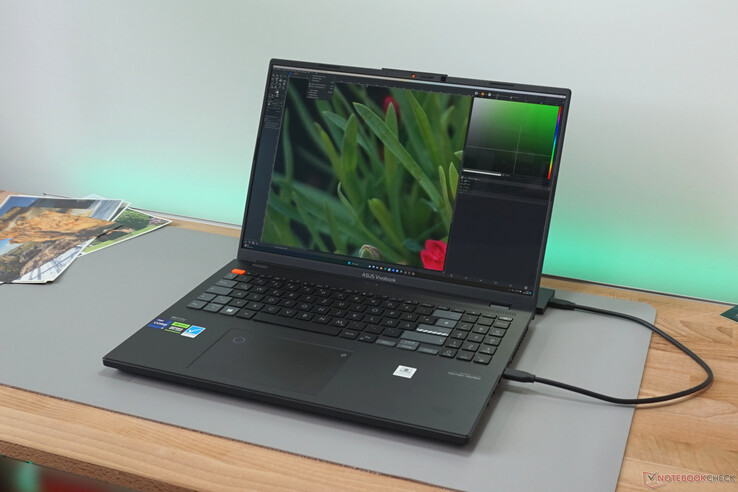
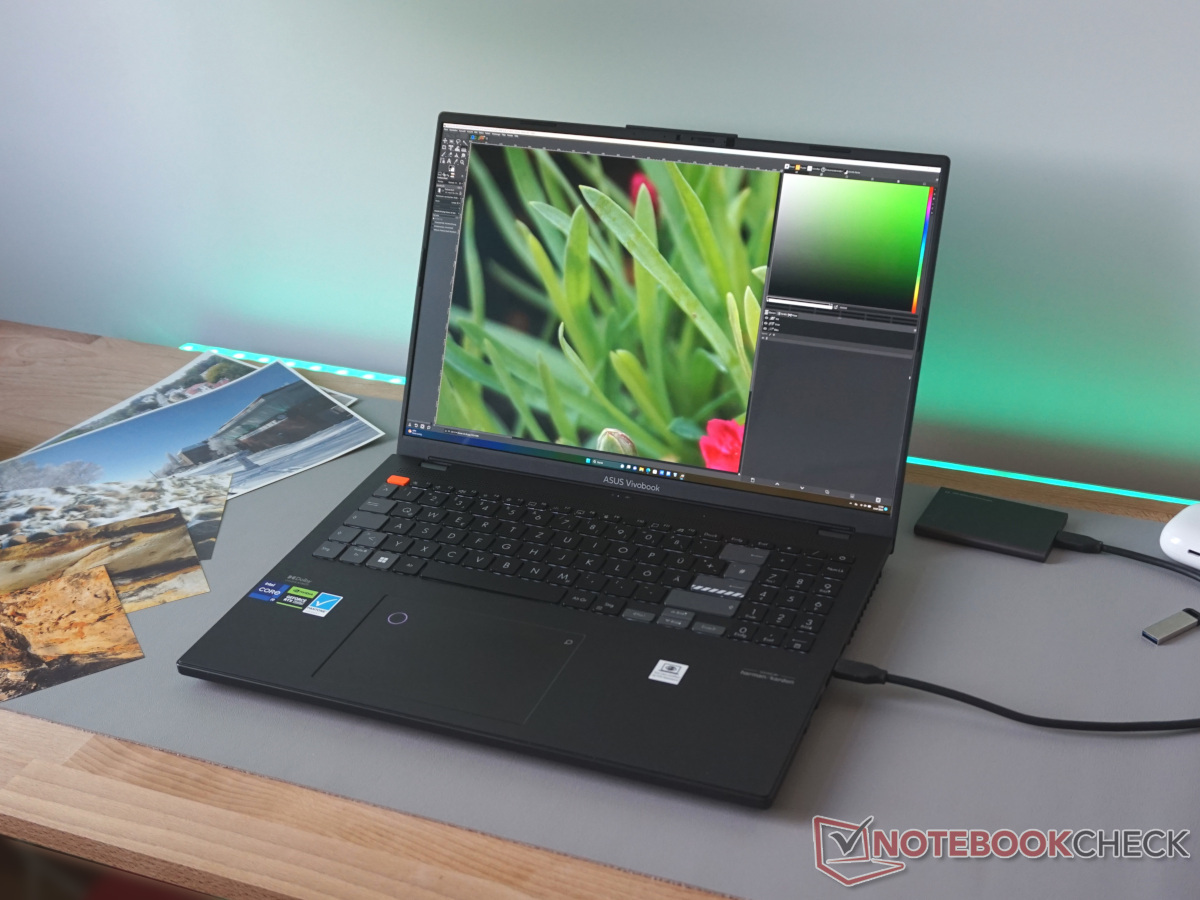
El VivoBook Pro pertenece a la categoría de portátiles multimedia dirigidos a usuarios domésticos ambiciosos para proyectos creativos. Un potente procesador, el actual modelo superiori9-13980HX en este caso, y una GPU móvil en varias configuraciones garantizan una velocidad de trabajo adecuada. Una pantalla OLED ilustra el contenido respectivo de forma casi realista y el "Asus Dial" también distingue a este modelo de los simples portátiles.
El Asus VivoBook Pro 16X que analizamos hoy no se parece mucho a los Vivobooks típicos, que cuestan a partir de unos 1.500 dólares. El procesador y la pantalla proceden de la serie profesional ProArt Studiobook, que ya hemos analizado en el modeloAsus ProArt Studiobook 16 OLED H7604. La carcasa y muchas características, por otro lado, se han mantenido simples. El VivoBook Pro 16X se mueve así en la zona gris entre un portátil hiperpotente para el hogar y un dispositivo de trabajo creativo con una apariencia (demasiado) simple.
La competencia a un nivel comparable incluye elGigabyte AERO 16 OLED o el Samsung Galaxy Book3 Ultra 16nuestro análisis revelará si el Vivobook puede puntuar con sus préstamos del segmento profesional.
Posibles contendientes en la comparación
Valoración | Fecha | Modelo | Peso | Altura | Tamaño | Resolución | Precio |
|---|---|---|---|---|---|---|---|
| 86.2 % v7 (old) | 07/2023 | Asus Vivobook Pro 16X K6604JV-MX016W i9-13980HX, GeForce RTX 4060 Laptop GPU | 2.1 kg | 22.8 mm | 16.00" | 3200x2000 | |
| 90.3 % v7 (old) | 04/2023 | Dell XPS 15 9530 RTX 4070 i7-13700H, GeForce RTX 4070 Laptop GPU | 1.9 kg | 18 mm | 15.60" | 3456x2160 | |
| 89.4 % v7 (old) | 04/2023 | Samsung Galaxy Book3 Ultra 16 i7-13700H, GeForce RTX 4050 Laptop GPU | 1.8 kg | 16.5 mm | 16.00" | 2880x1800 | |
| 88.6 % v7 (old) | 07/2023 | Schenker VISION 16 Pro (M23) i7-13700H, GeForce RTX 4070 Laptop GPU | 1.6 kg | 17.1 mm | 16.00" | 2560x1600 | |
| 86.1 % v7 (old) | 06/2023 | Asus ProArt Studiobook 16 OLED H7604 i9-13980HX, GeForce RTX 4070 Laptop GPU | 2.4 kg | 23.9 mm | 16.00" | 3200x2000 | |
| 83.8 % v7 (old) | 09/2022 | MSI Creator Z17 A12UGST-054 i9-12900H, GeForce RTX 3070 Ti Laptop GPU | 2.5 kg | 19 mm | 17.00" | 2560x1600 |
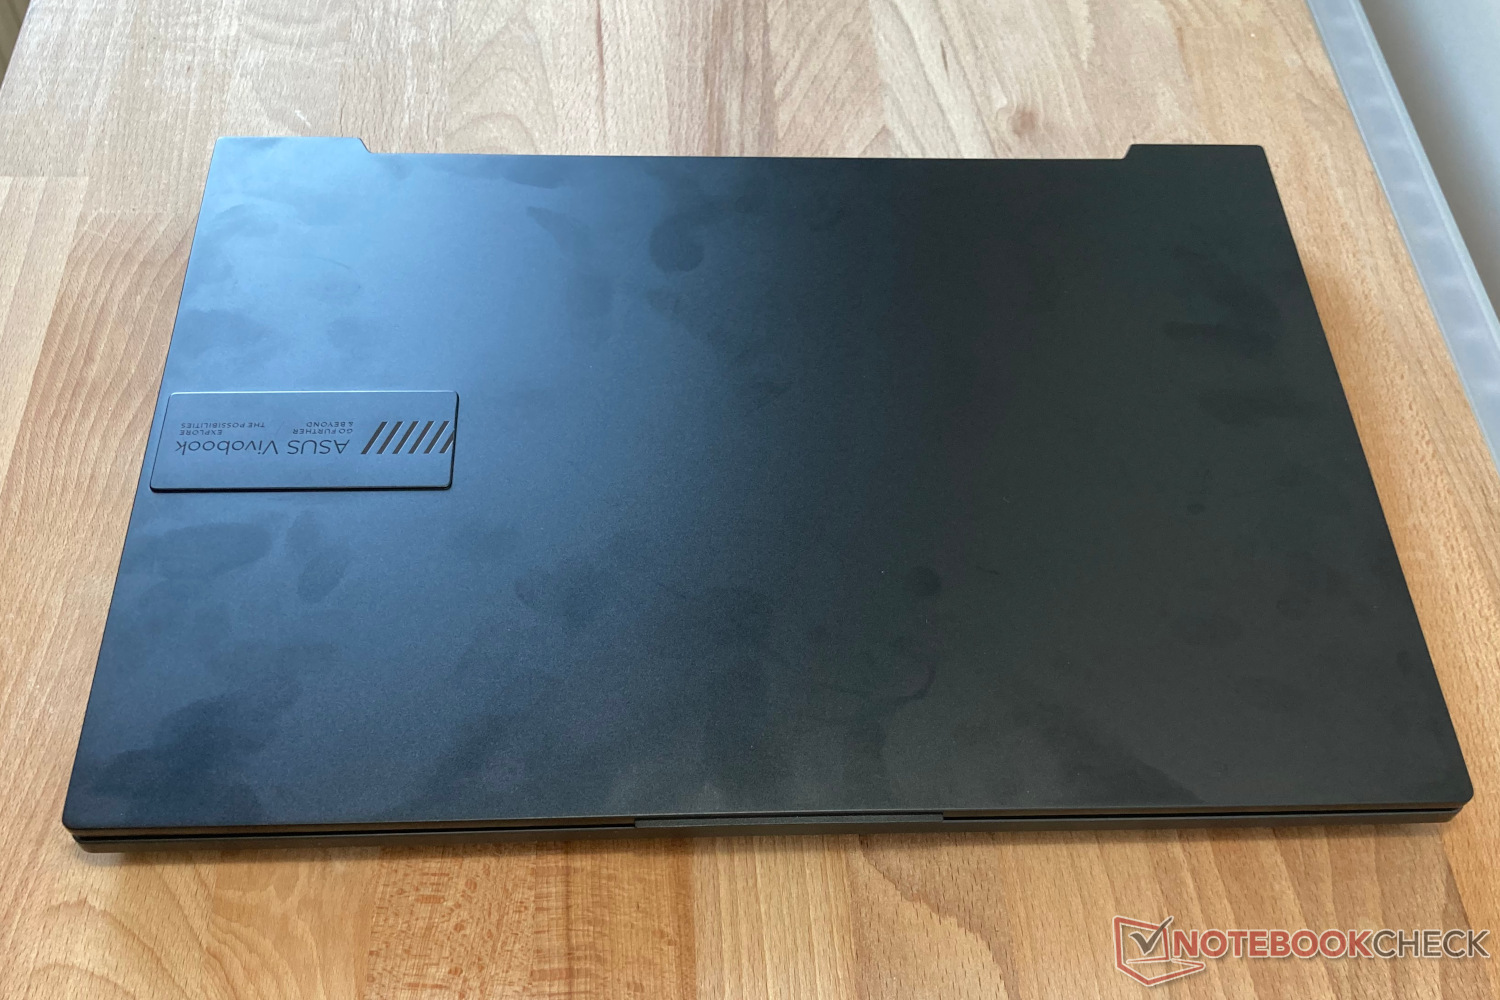
Carcasa - Demasiado plástico en el Vivobook
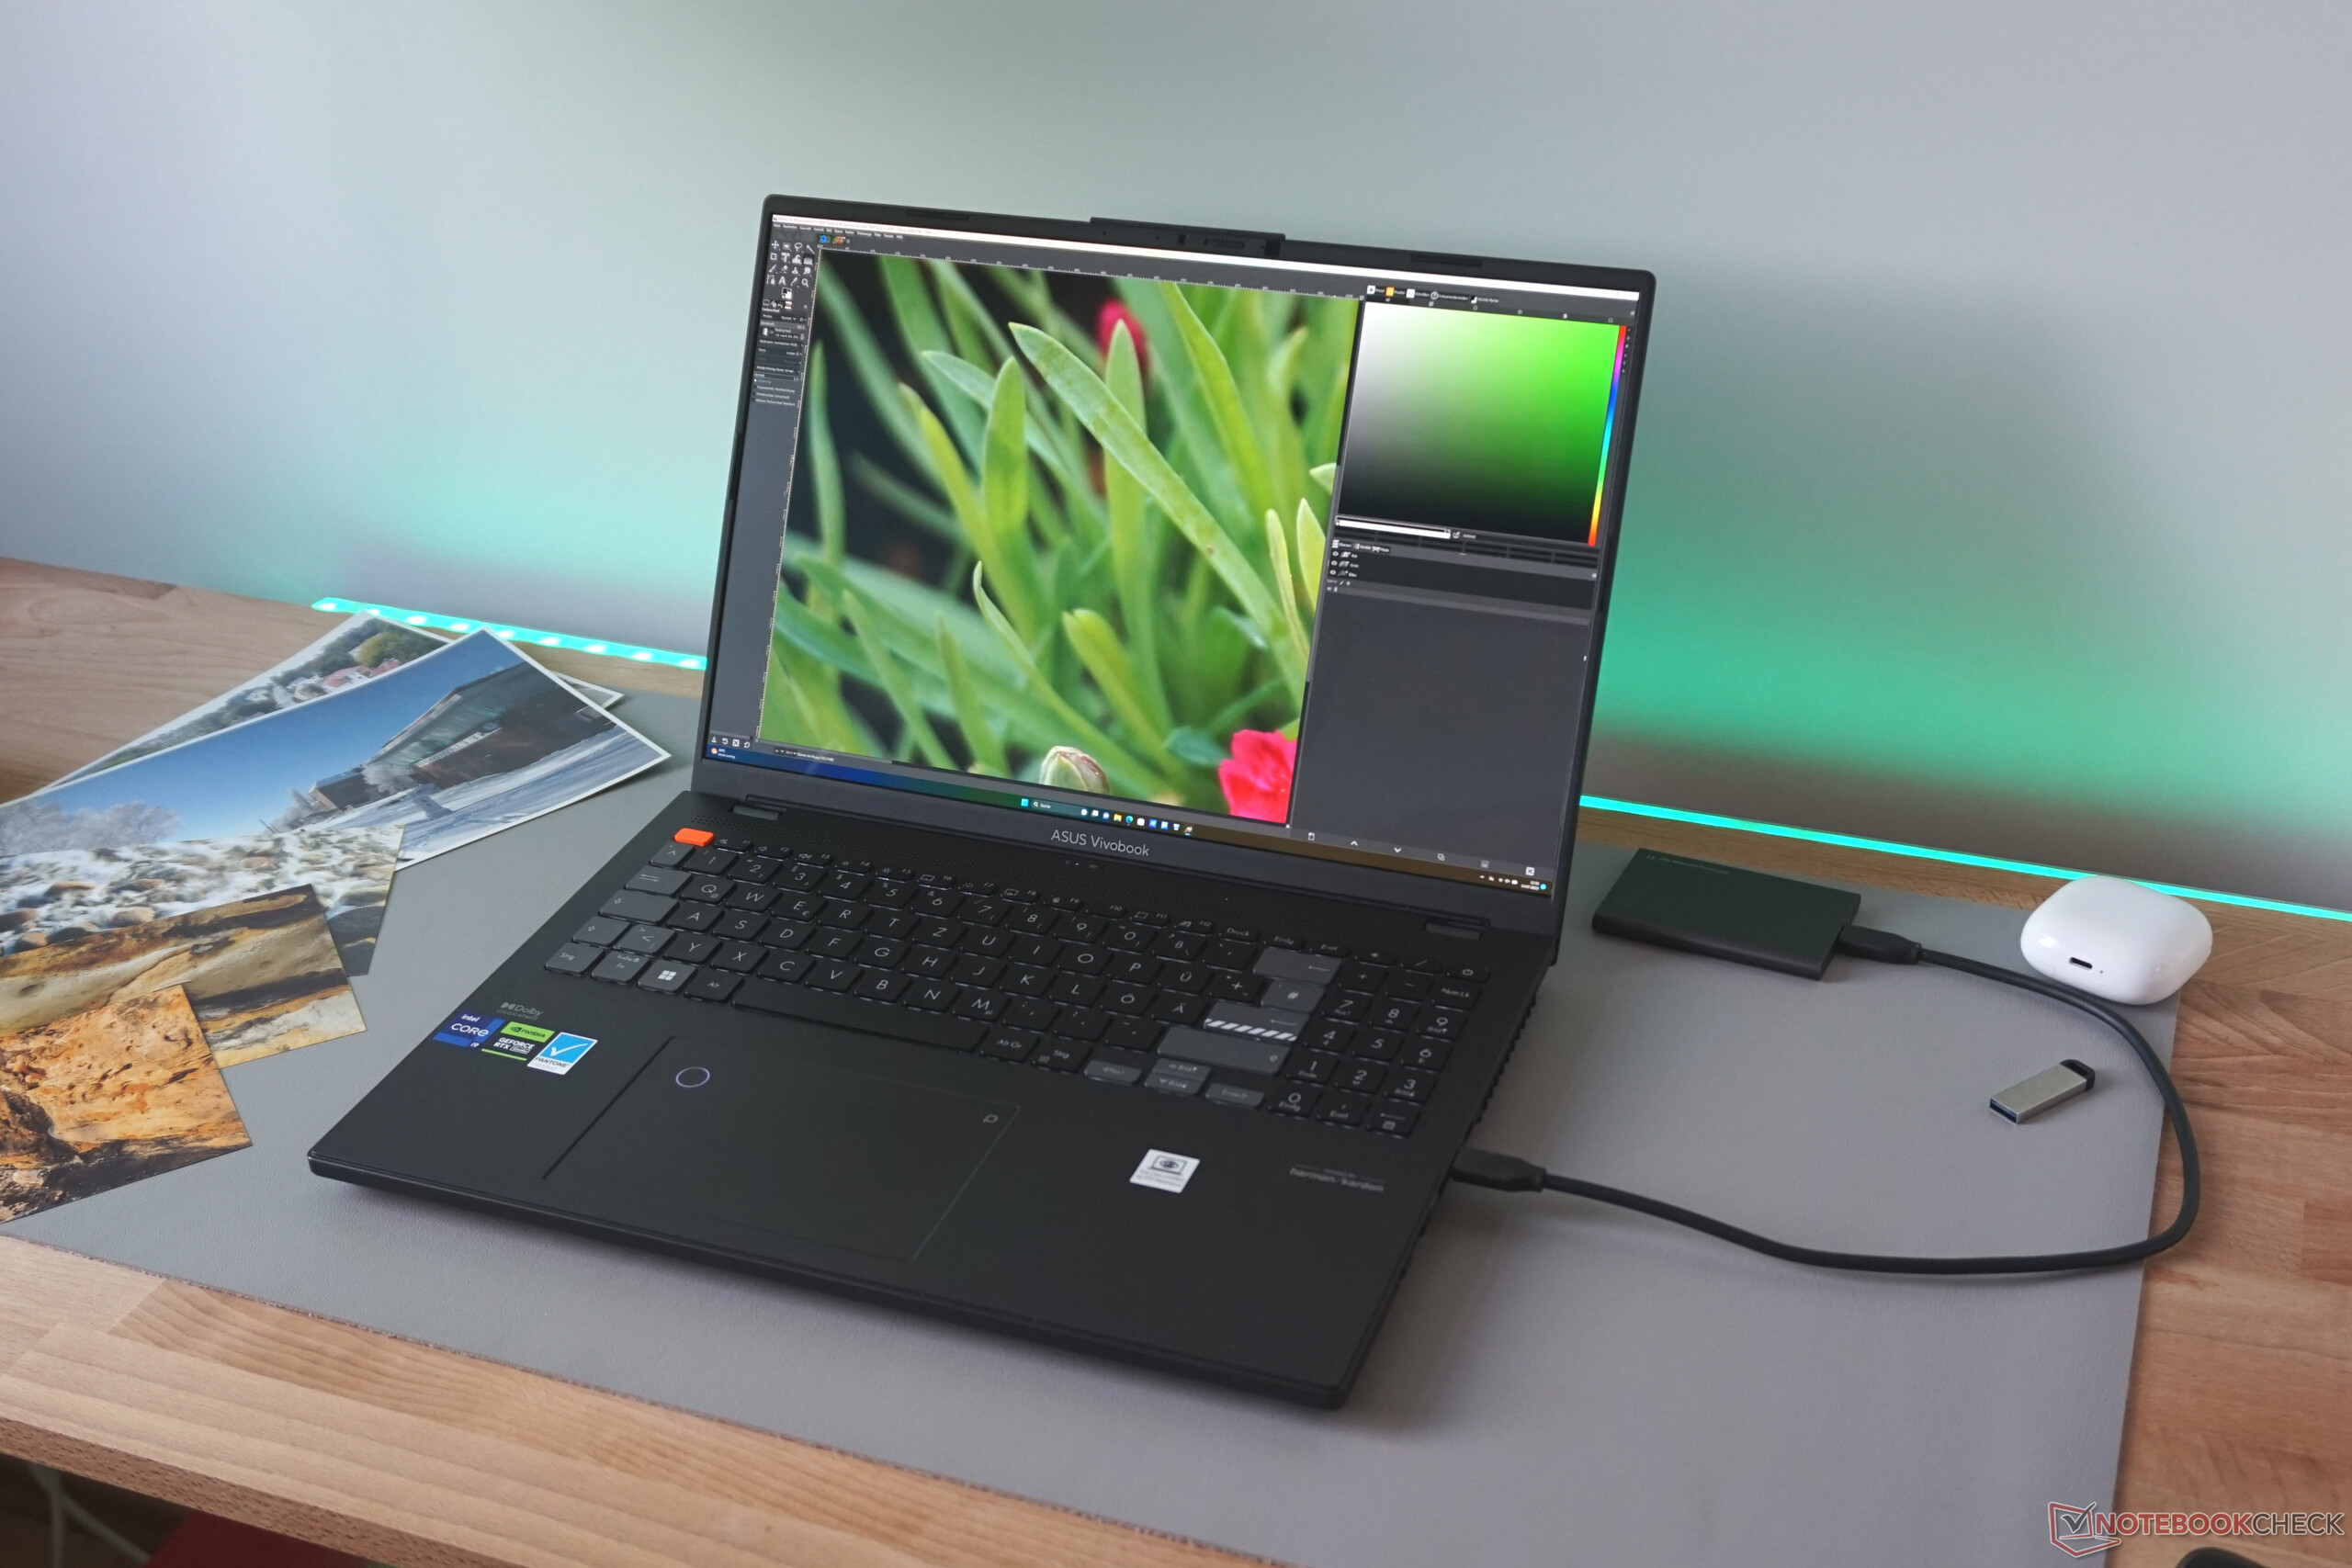
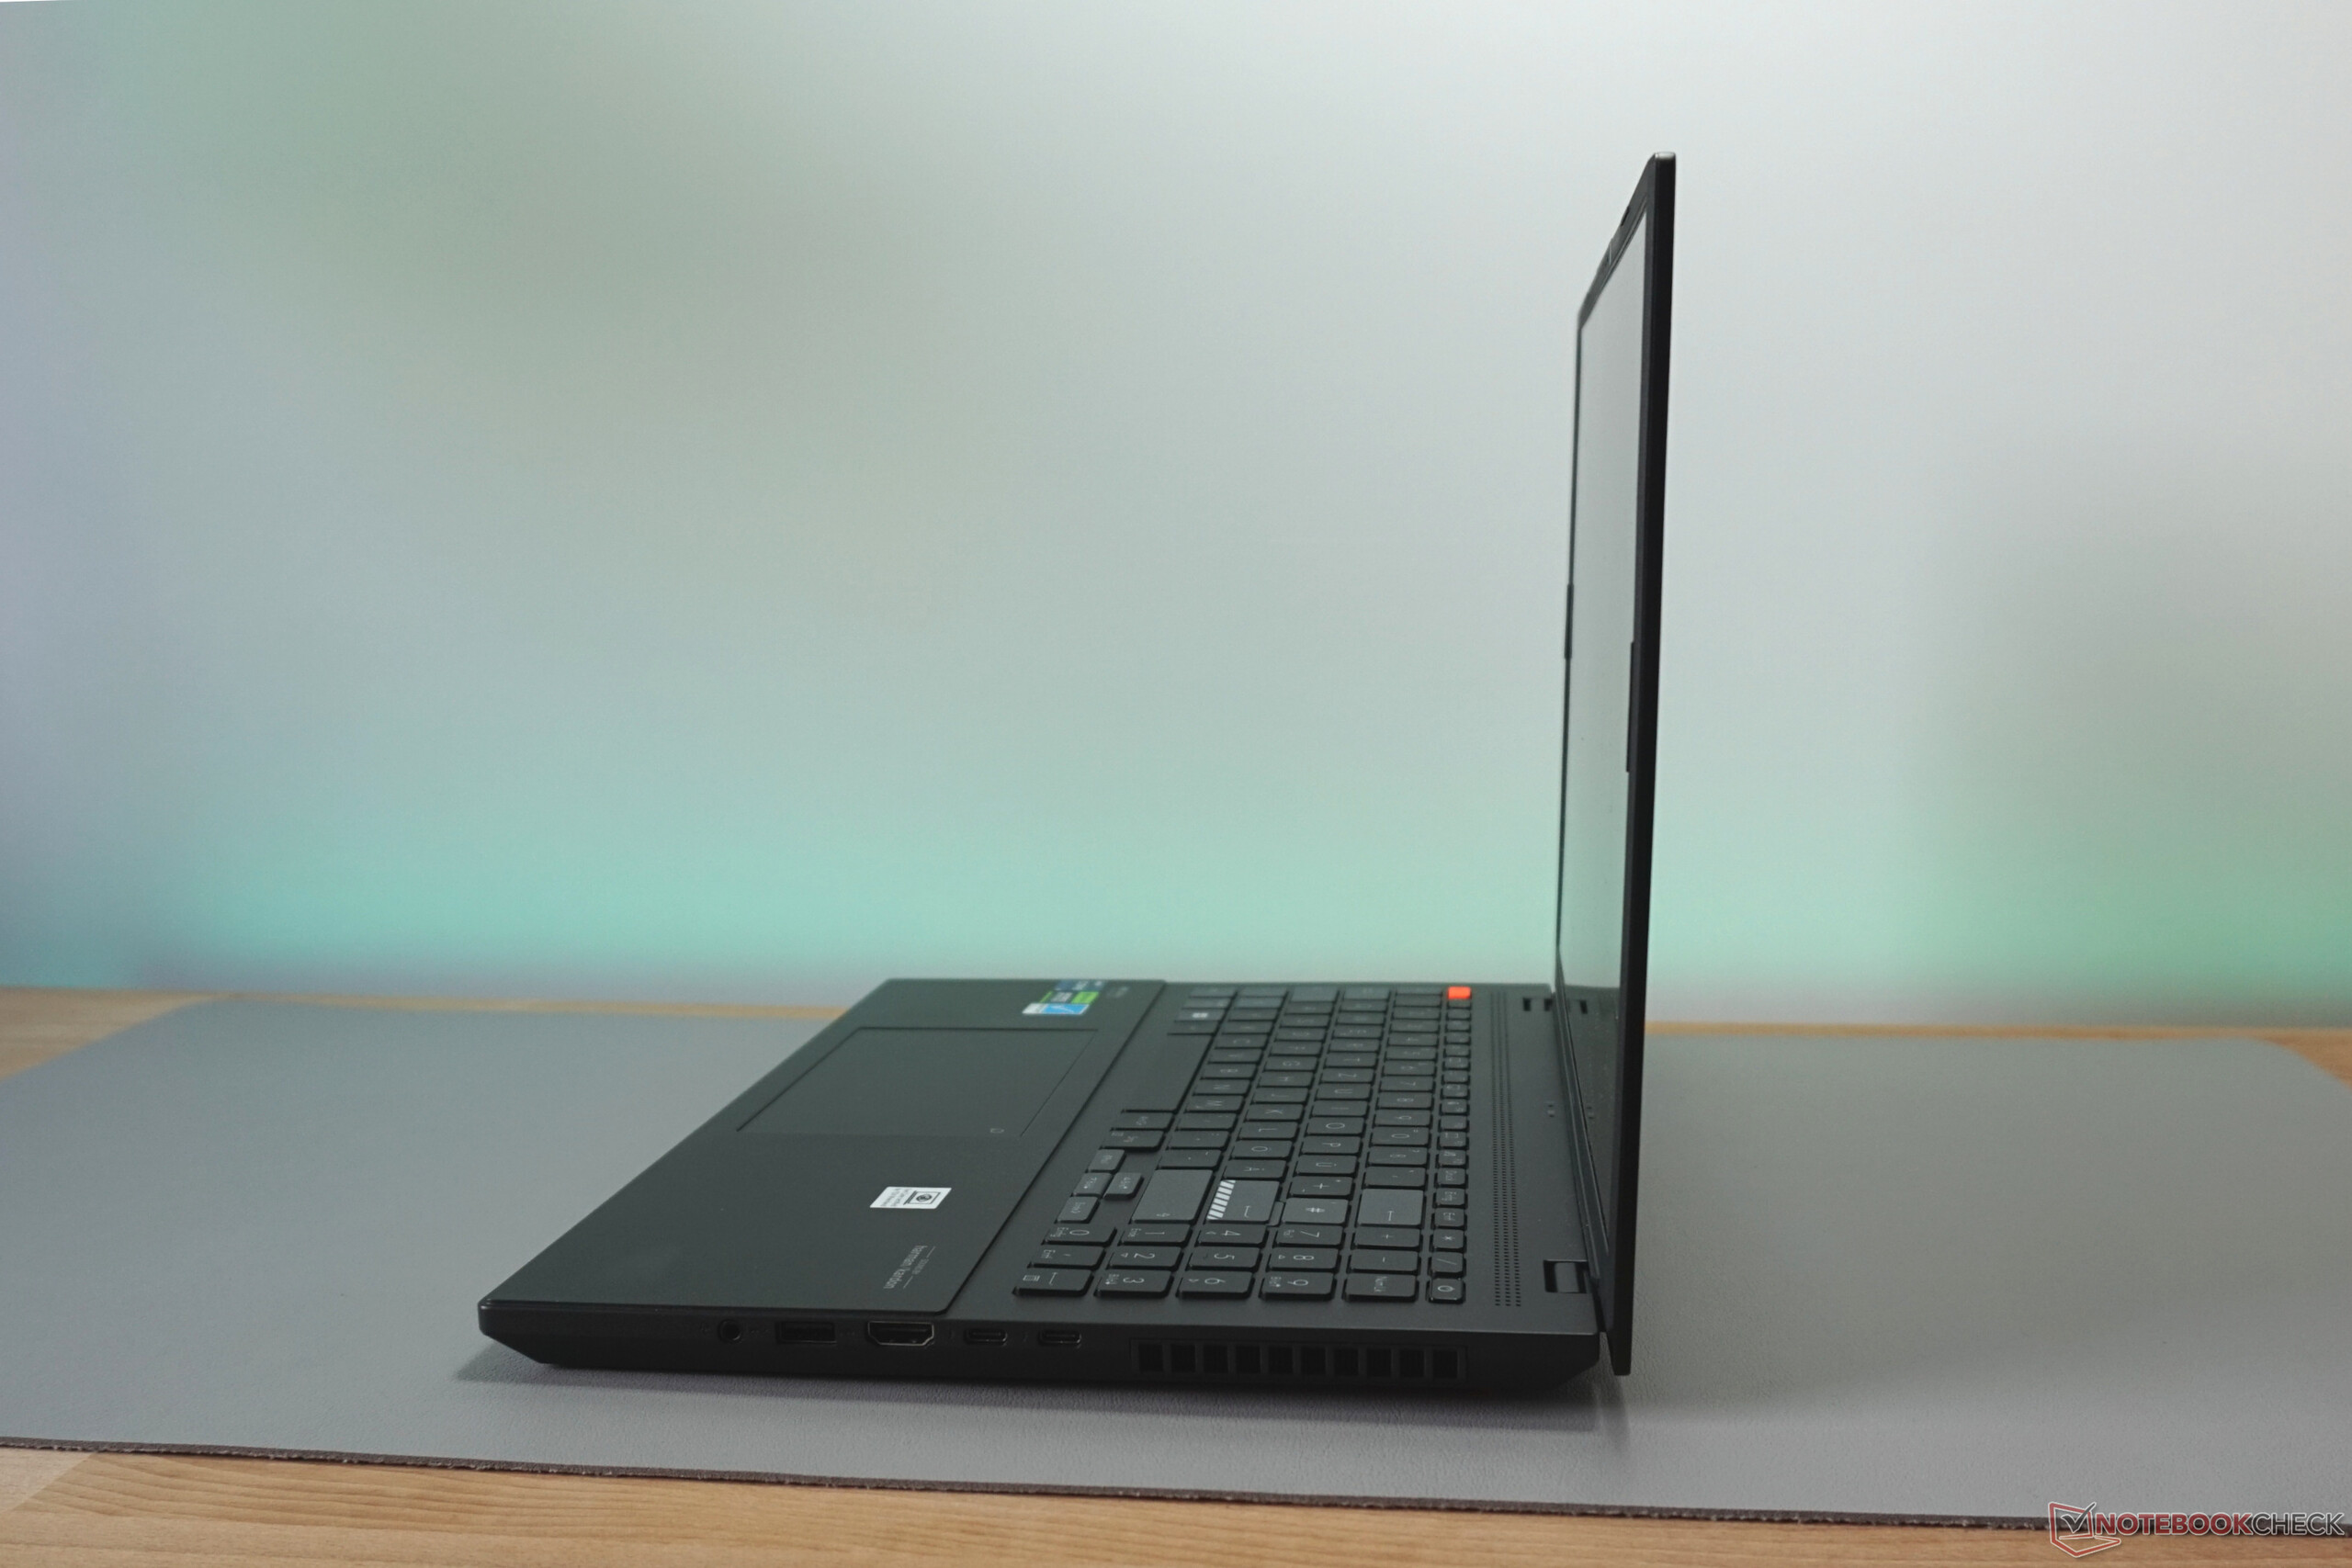
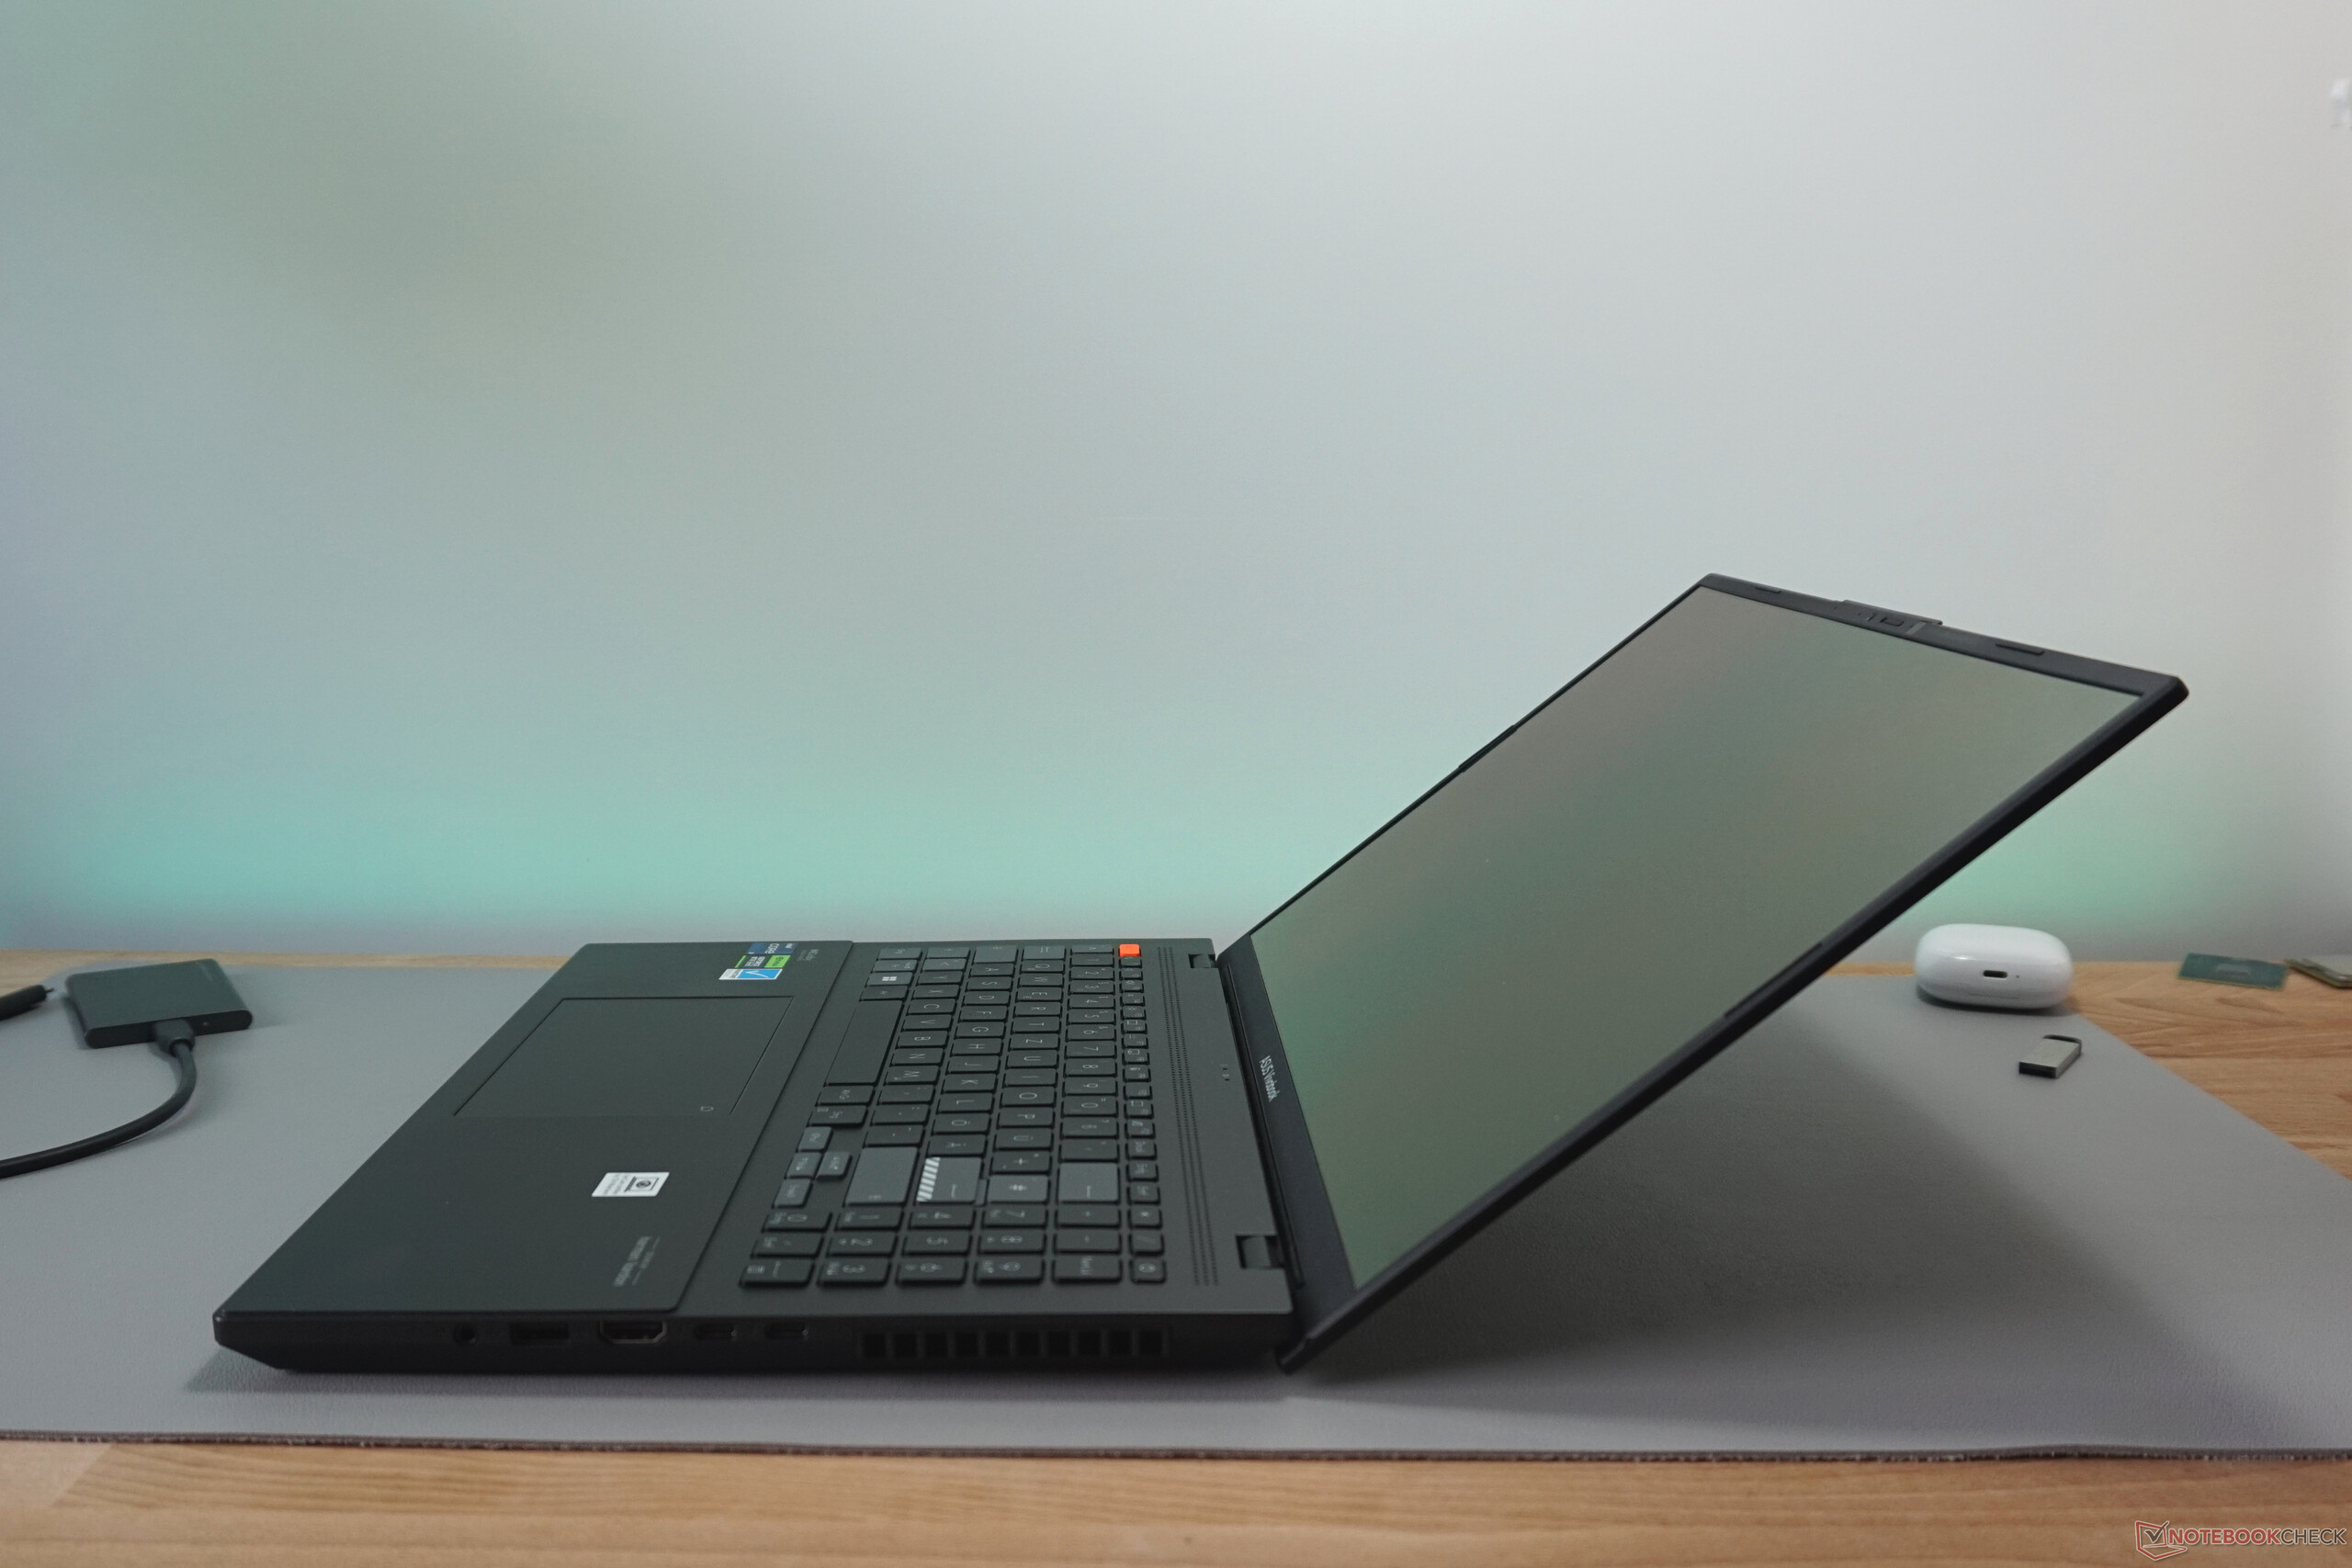
Fabricada íntegramente en plástico negro, la carcasa de Vivobook Pro 16X causa una impresión bastante sencilla. Los pies de color naranja neón le dan un toque de color. La fabricación de la base y las bisagras es sólida. Sólo una mínima torsión puede ser provocada cuando la carcasa se sujeta por una de las esquinas frontales. Además, la pantalla siempre se mantiene firme en el ángulo establecido, que llega a algo más de 140°.
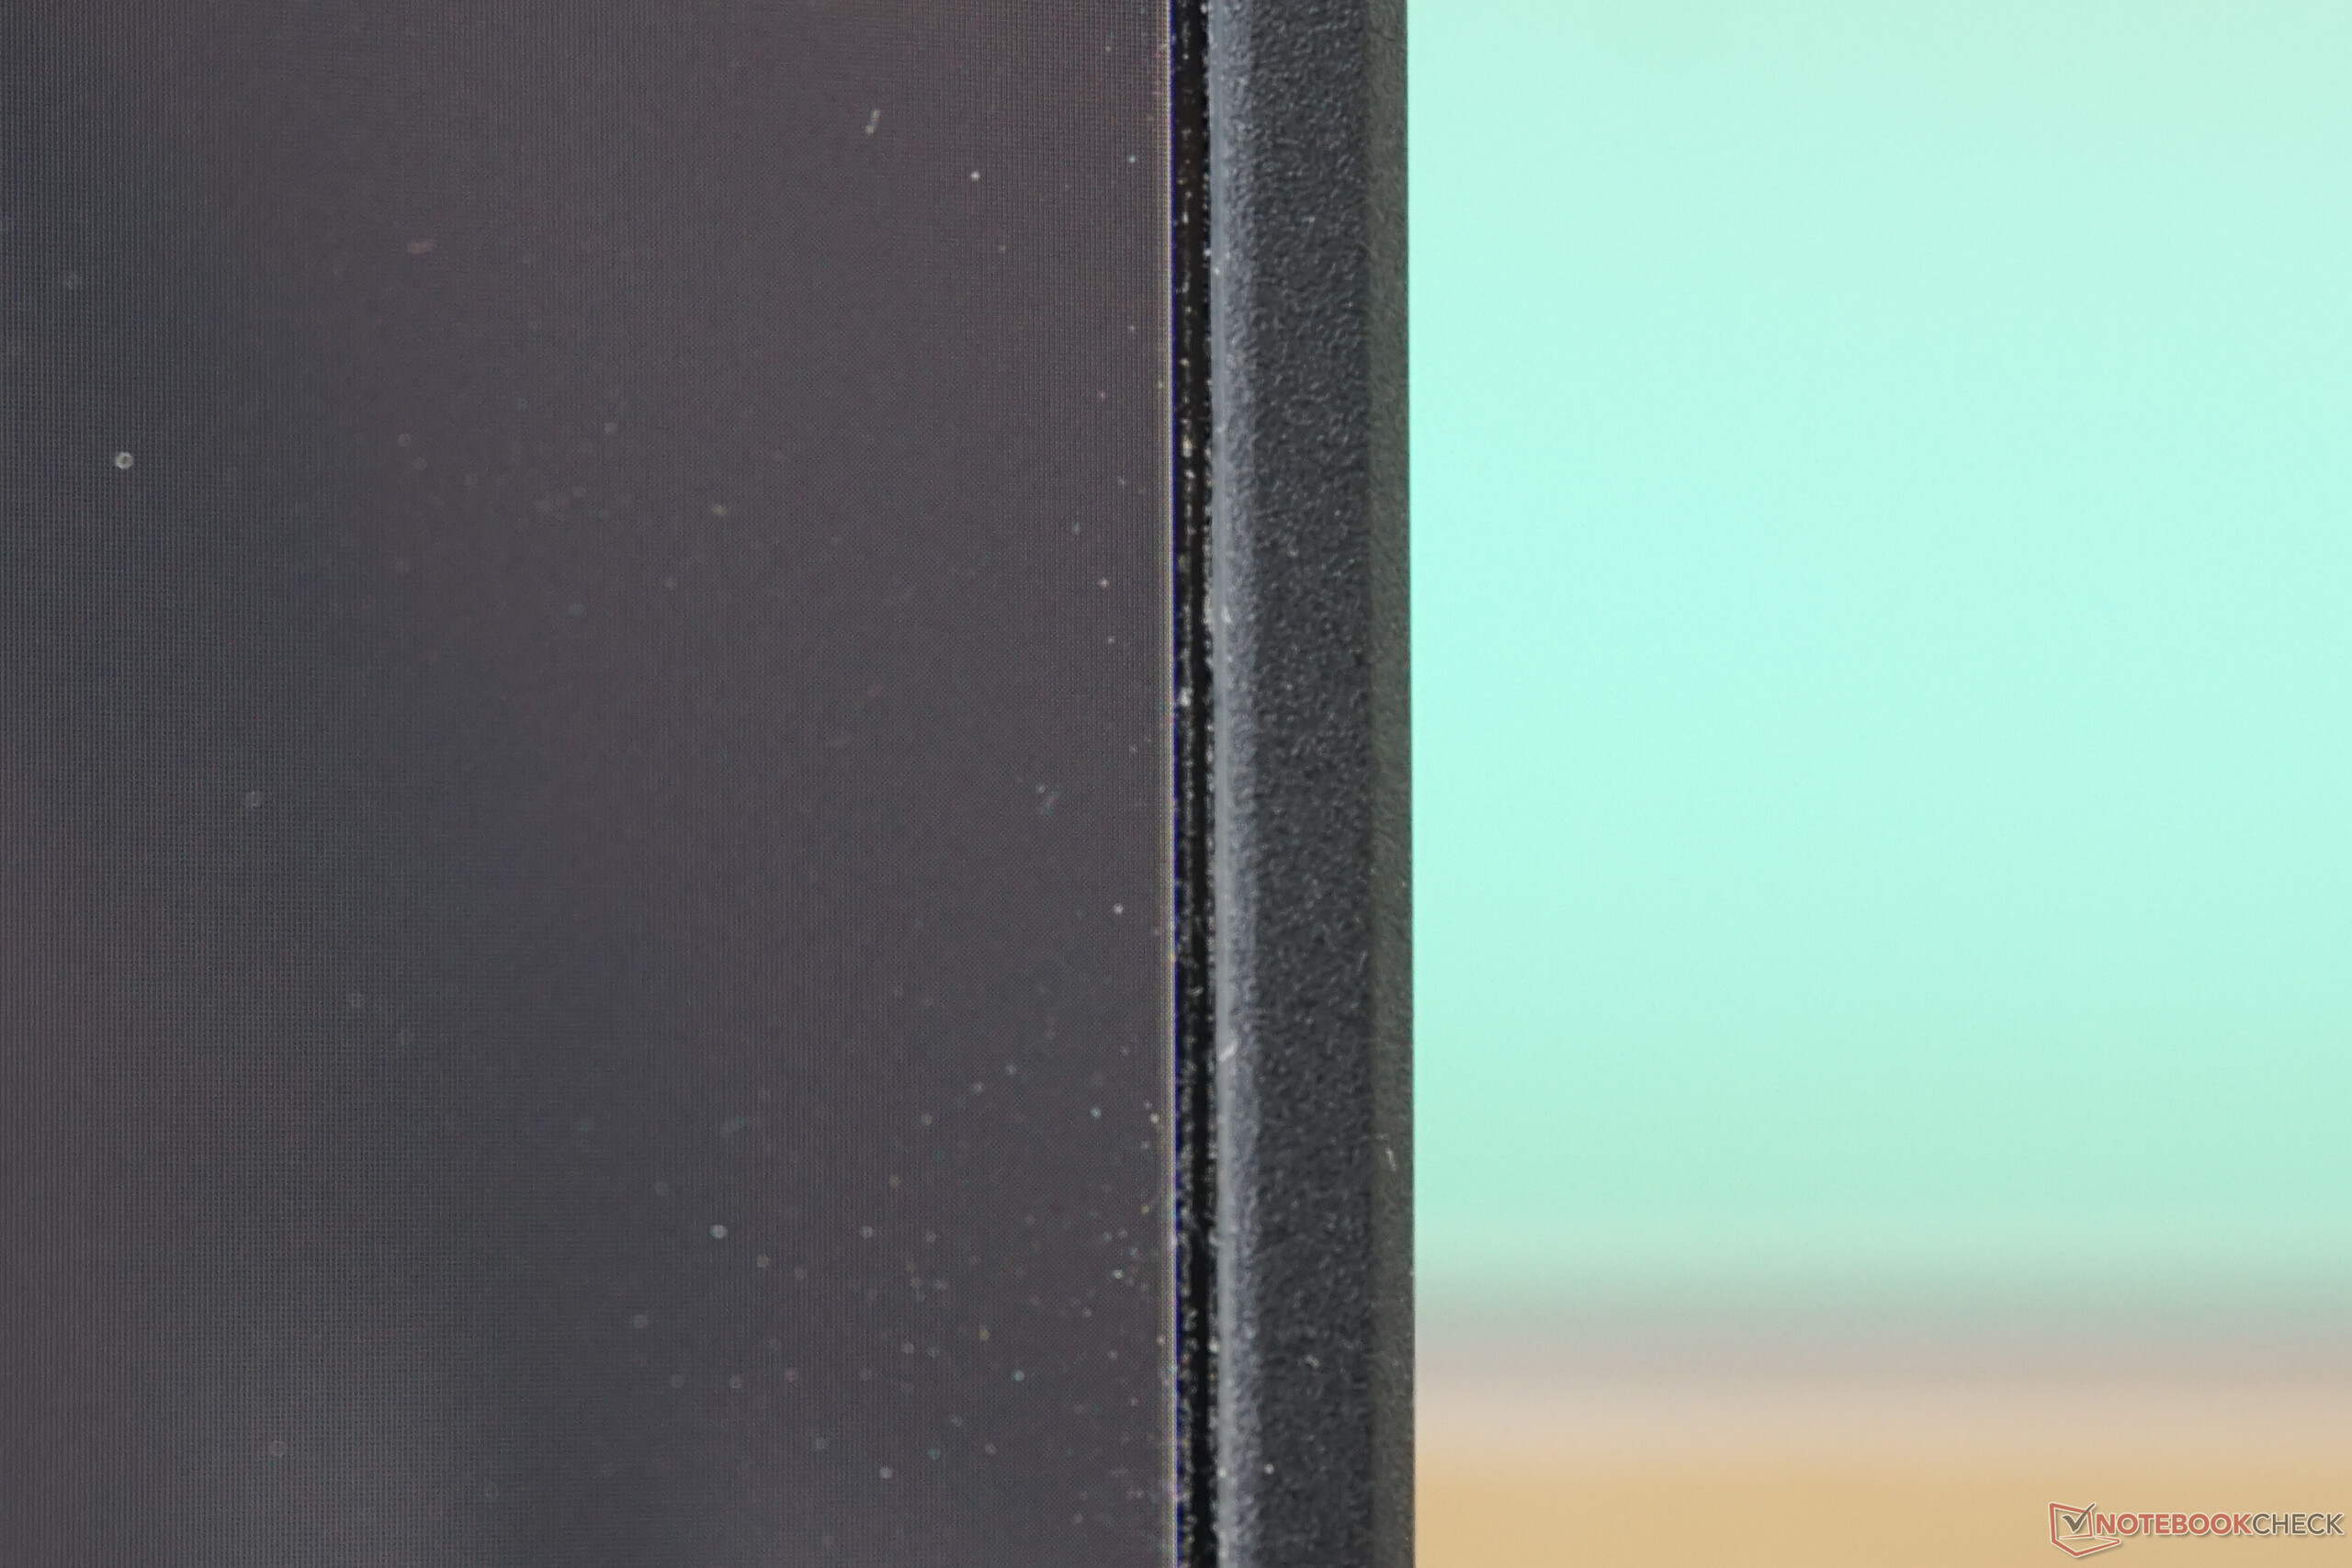
La tapa de la pantalla y el bisel de la pantalla OLED, por otro lado, podrían haber estado mejor diseñados. Dada la cubierta de plástico, no es de extrañar que la pantalla se pueda doblar. Los bordes tampoco son rectos, lo que también se manifiesta en la antiestética curvatura de la pantalla. Además, en nuestro modelo de prueba hay un hueco a la derecha de la pantalla, en el que se acumula rápidamente el polvo.
El peso y el tamaño de la carcasa son bastante medios para un portátil con pantalla de 16 pulgadas. ElSamsung Galaxy Book3 Ultrapor ejemplo, es más delgado y ligero. El Asus ProArt Studiobookes más grande y pesado.

Equipamiento - Todo lo importante incluido y dos TB4
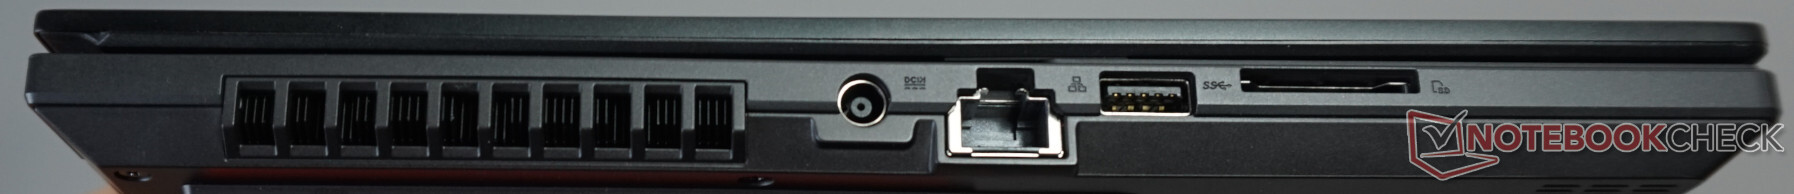
Todos los puertos importantes están distribuidos a izquierda y derecha. Ni el alcance ni el número dejan lugar a críticas. Convenientemente, hay un puerto USB-A en ambos lados. Los datos de vídeo e imagen se pueden copiar fácilmente desde una cámara a través del lector de tarjetas SD. Gracias al puerto LAN, se puede establecer una rápida conexión de red en el escritorio. Además, hay dos puertos Thunderbolt 4 para el intercambio rápido de datos, para una estación de acoplamiento o para cargar la batería en caso necesario.

Lector de tarjetas SD
Con el lector de tarjetas SD completo, nuestra tarjeta de referencia AV PRO microSD 128 GB V60 alcanza una sólida velocidad de transferencia. Una media de 120 MB/s significa que una tarjeta completa de 32 GB se copia en poco menos de 4 minutos. Con la Samsung Galaxy Book3 Ultra 16por ejemplo.
| SD Card Reader | |
| average JPG Copy Test (av. of 3 runs) | |
| Dell XPS 15 9530 RTX 4070 (Toshiba Exceria Pro SDXC 64 GB UHS-II) | |
| Media de la clase Multimedia (23 - 531, n=37, últimos 2 años) | |
| Asus Vivobook Pro 16X K6604JV-MX016W | |
| MSI Creator Z17 A12UGST-054 (AV Pro SD microSD 128 GB V60) | |
| Samsung Galaxy Book3 Ultra 16 (AV PRO microSD 128 GB V60) | |
| Asus ProArt Studiobook 16 OLED H7604 (Angelibird AV Pro V60) | |
| Schenker VISION 16 Pro (M23) (Angelbird AV Pro V60) | |
| maximum AS SSD Seq Read Test (1GB) | |
| Media de la clase Multimedia (37.3 - 1455, n=36, últimos 2 años) | |
| Dell XPS 15 9530 RTX 4070 (Toshiba Exceria Pro SDXC 64 GB UHS-II) | |
| Asus Vivobook Pro 16X K6604JV-MX016W | |
| Asus ProArt Studiobook 16 OLED H7604 (Angelibird AV Pro V60) | |
| Samsung Galaxy Book3 Ultra 16 (AV PRO microSD 128 GB V60) | |
| MSI Creator Z17 A12UGST-054 (AV Pro SD microSD 128 GB V60) | |
| Schenker VISION 16 Pro (M23) (Angelbird AV Pro V60) | |
Comunicación
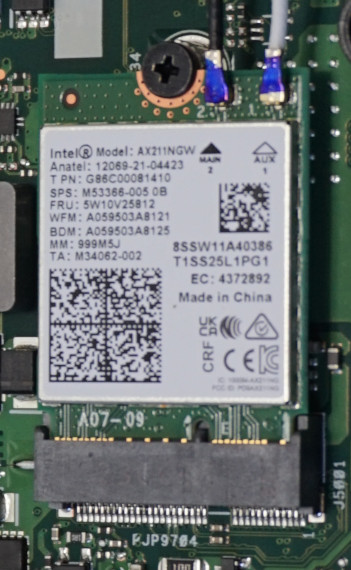
El módulo WLAN Intel AX211 instalado, que puede sustituirse, funciona a velocidades de transferencia constantemente altas. Los valores medidos para recibir datos de algo menos de 1.700 Mbps están casi un 25% por encima de la media de todos los valores registrados con idéntico hardware. El Dell XPS 15 9530, por ejemplo, obtiene una puntuación un tercio peor, aunque también utiliza el AX211 de Intel.
También lleva un puerto LAN Gigabit de Realtek para la transmisión por cable.
Cámara web
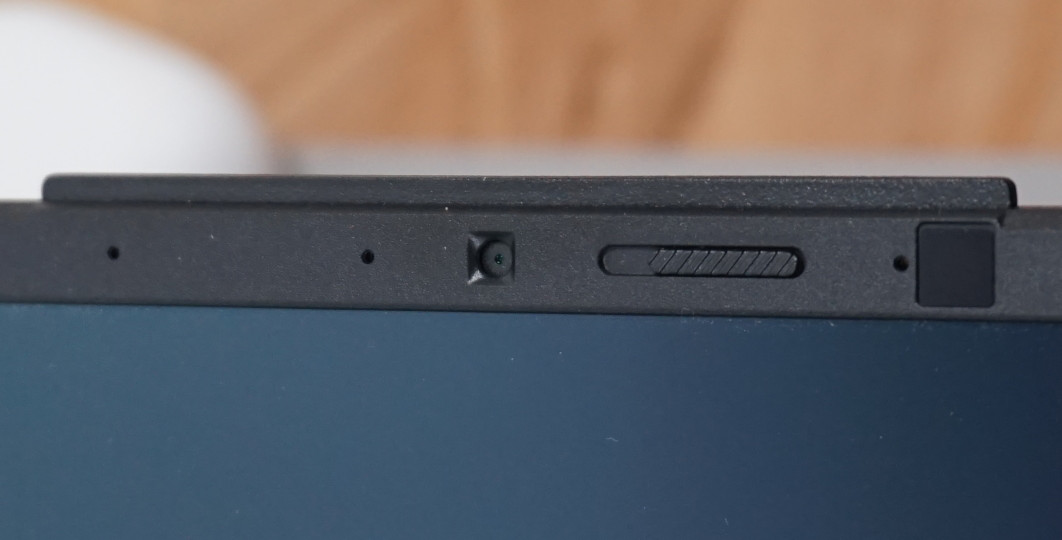
Las características de la webcam Full HD son sólidas. Hay un obturador mecánico que tiene el mismo naranja de los pies y el botón Esc . Además, hay instalada una cámara IR para el inicio de sesión mediante reconocimiento facial y un micrófono de doble matriz.
En términos de calidad de imagen, definitivamente hay margen de mejora. Aunque el brillo de la imagen de vídeo es convincente con poca luz ambiental, el ruido de la imagen aumenta enormemente al mismo tiempo. En cambio, la calidad de grabación de la voz es buena. Suena natural y se graba uniformemente desde diferentes distancias y direcciones de habla.


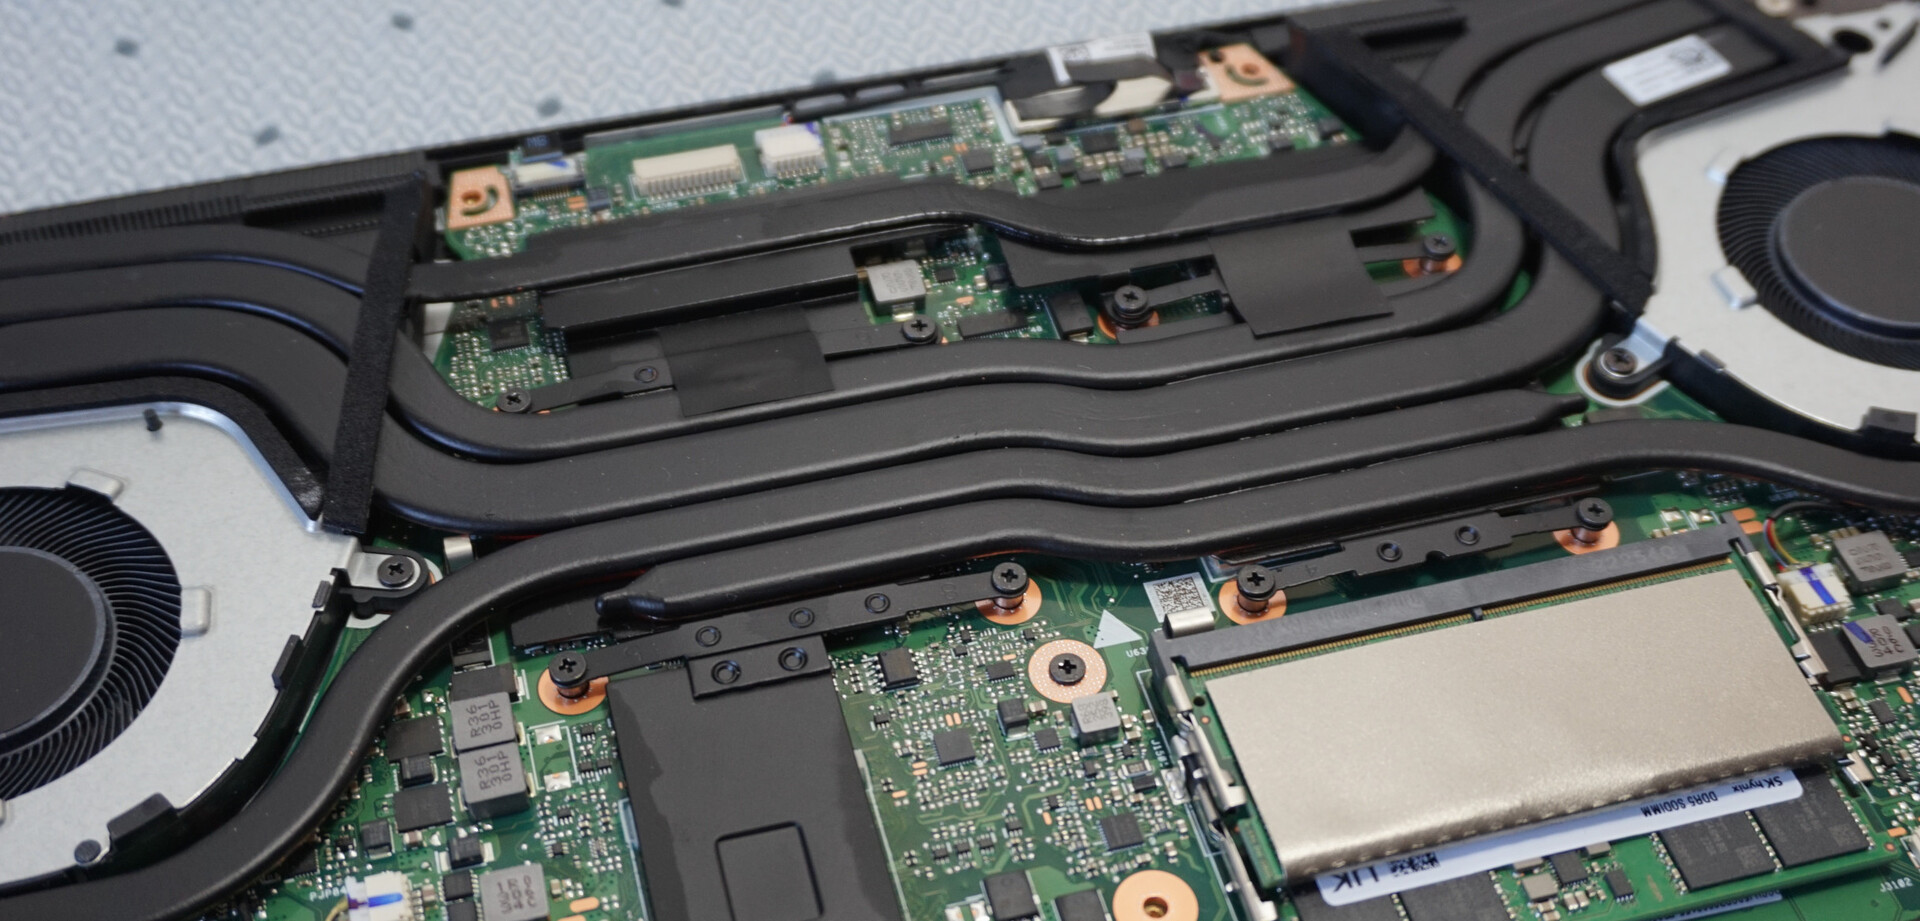
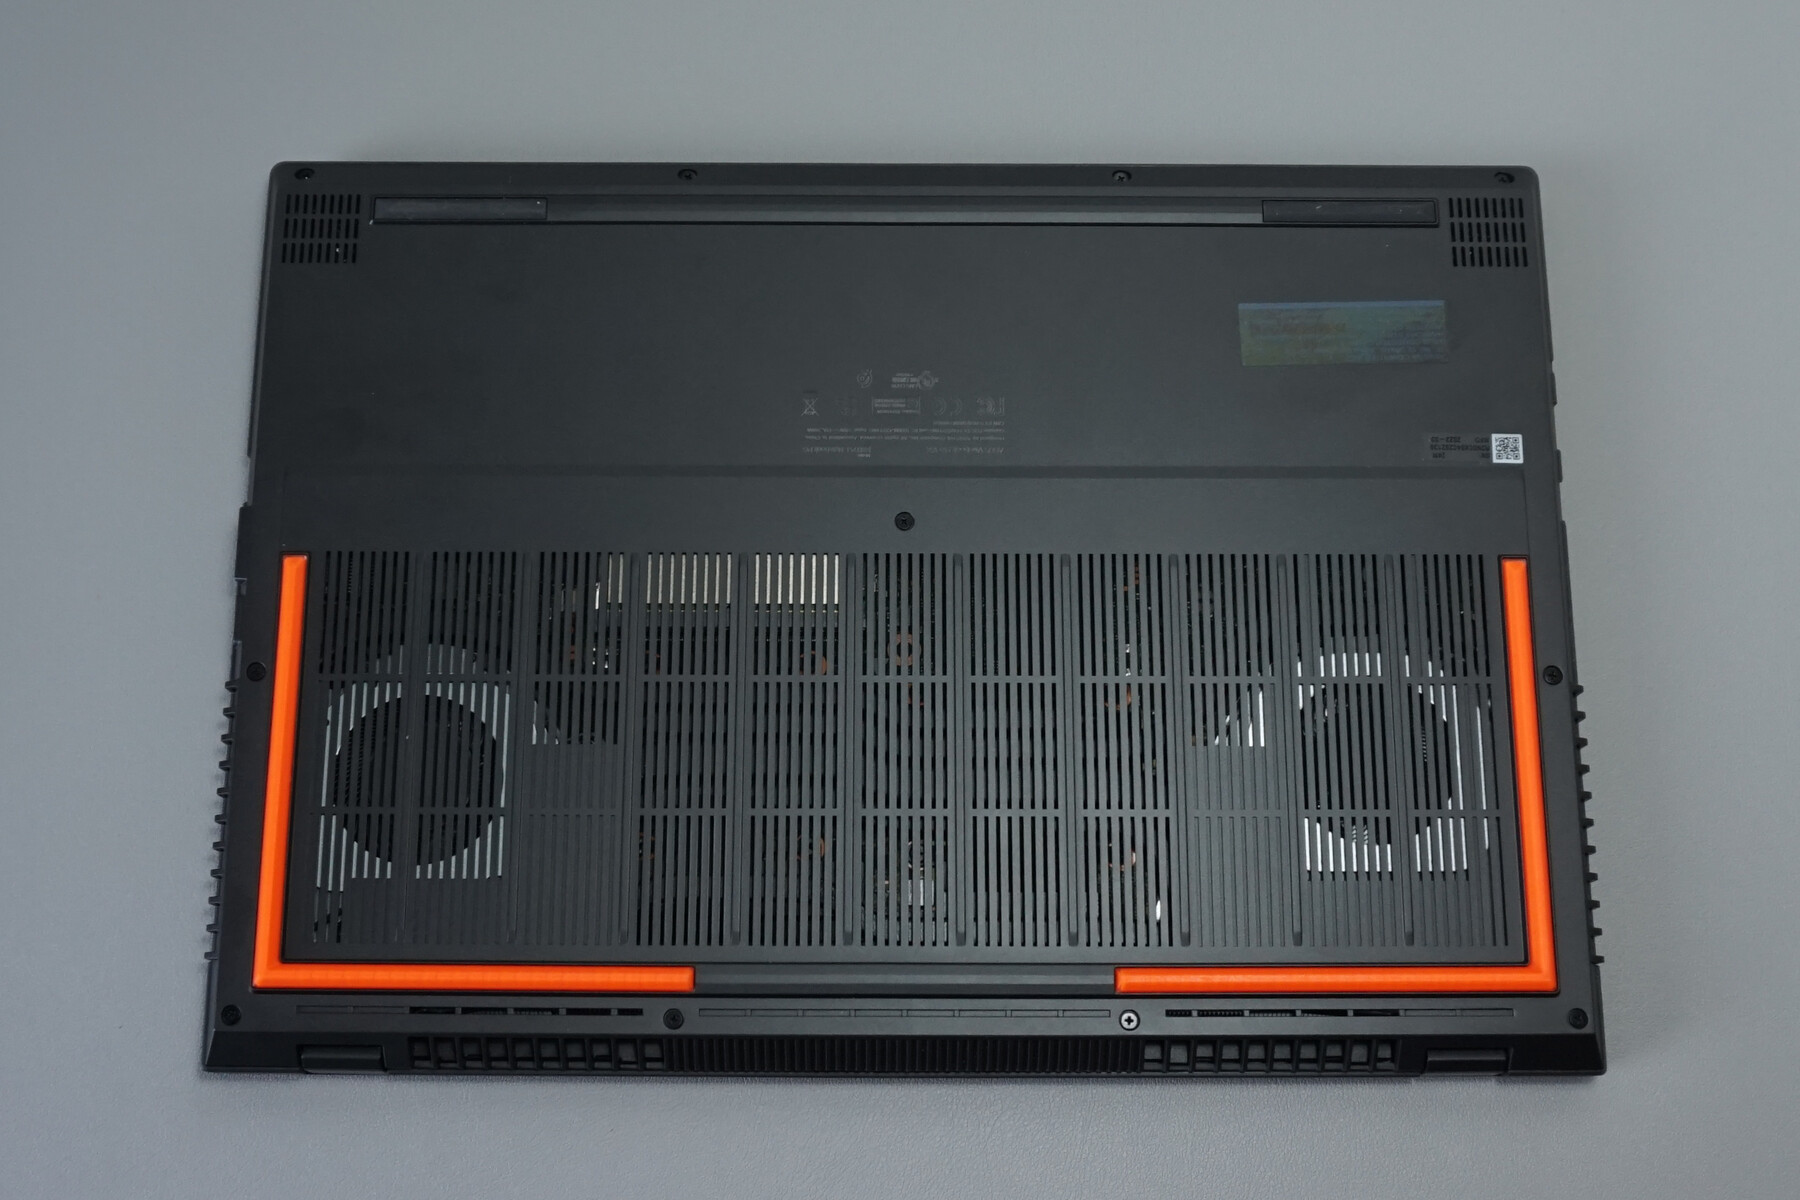
Mantenimiento
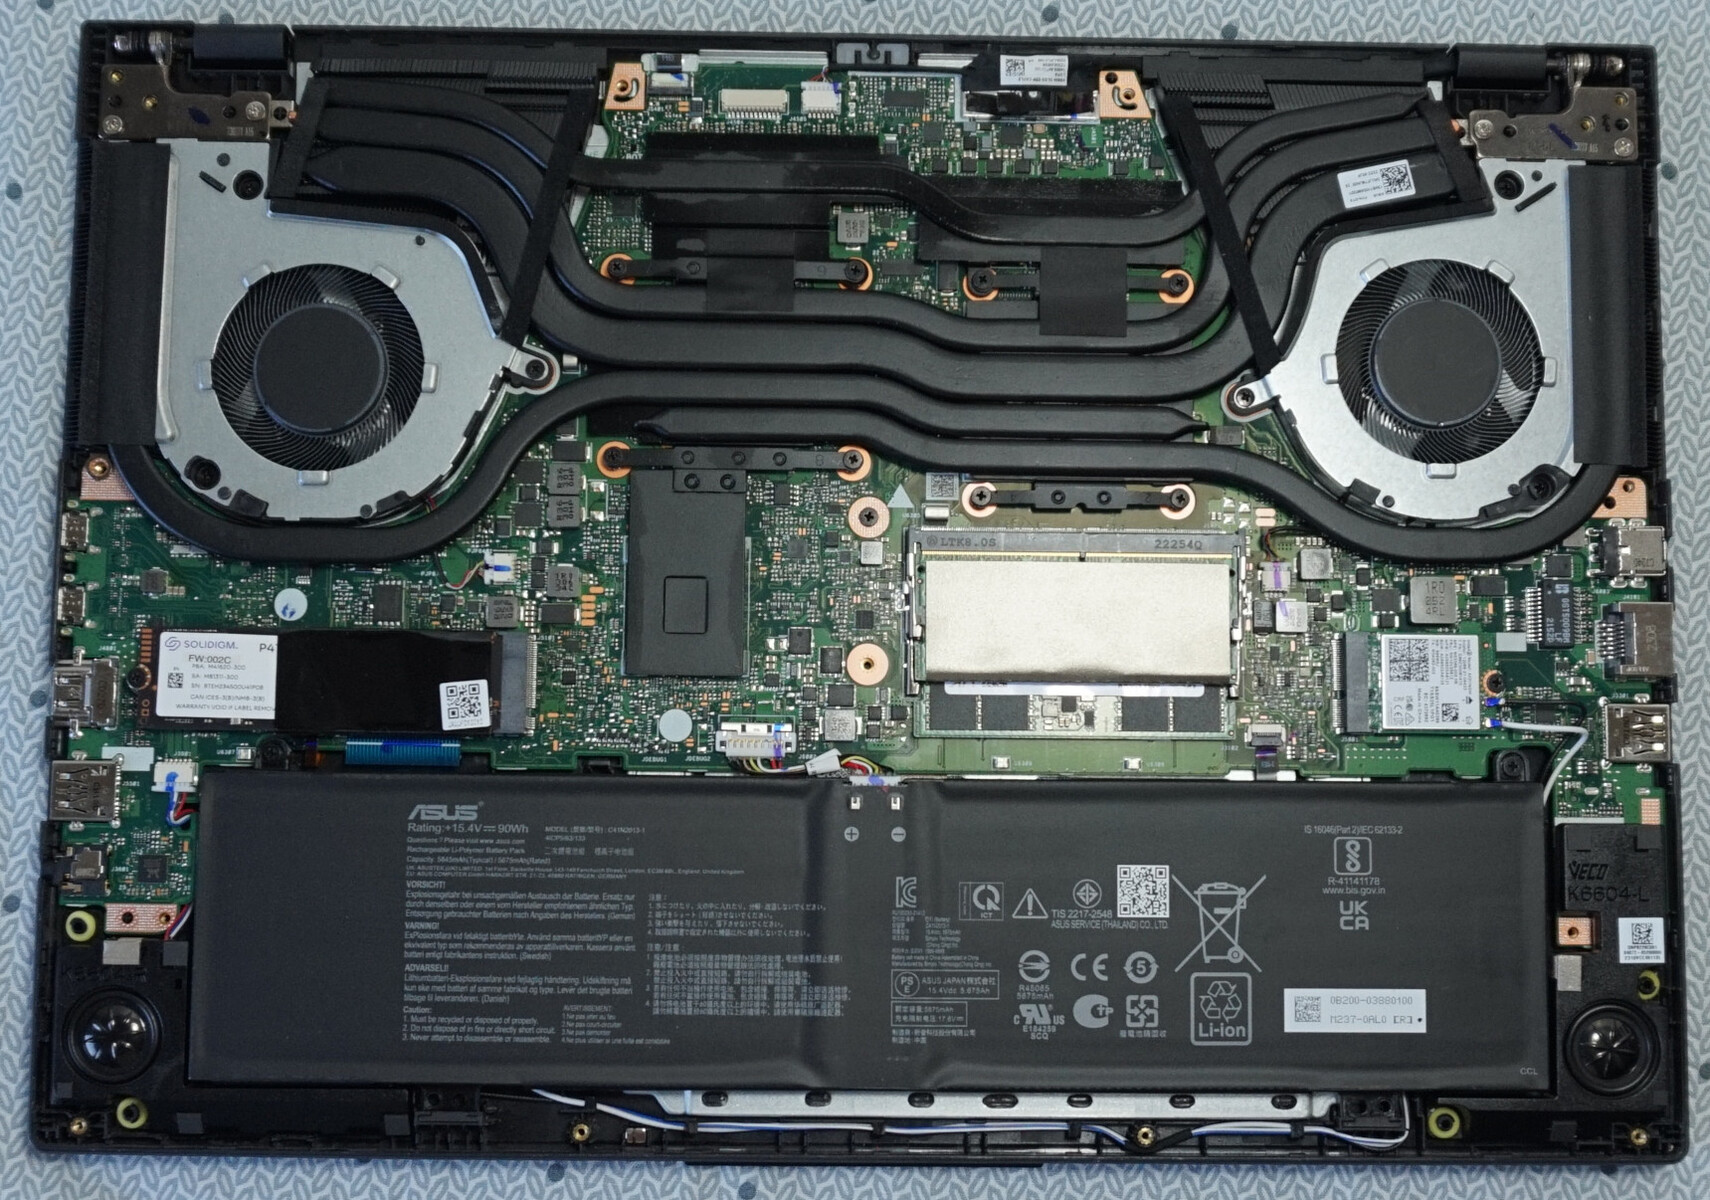
Es necesario aflojar once tornillos Phillips. También se requiere cierta fuerza para aflojar las numerosas abrazaderas de plástico. Como ocurre a menudo, se recomienda empezar junto a las bisagras. Con una pequeña herramienta de palanca o un pico, abrir la parte inferior sin dañarla debería ser fácil.
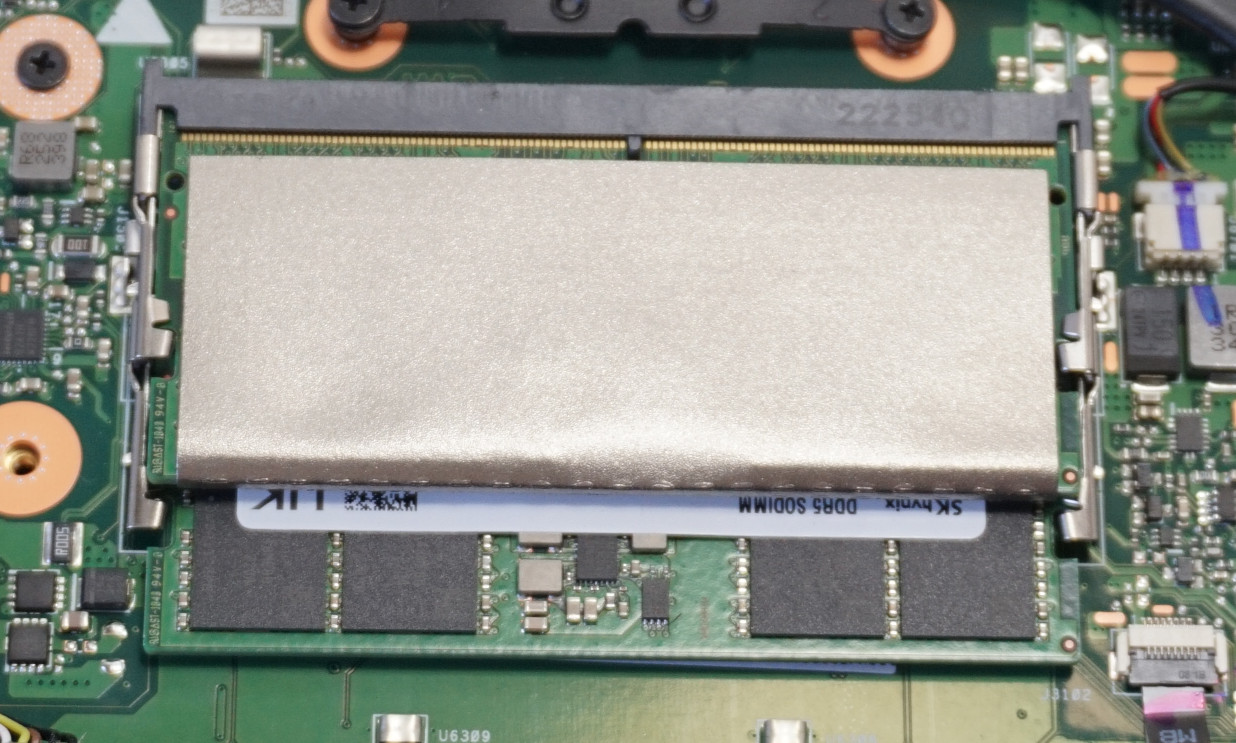
La batería, RAM, SSD y módulo WLAN son fácilmente accesibles y reemplazables. Por desgracia, no hay una segunda ranura para un SSD M.2 NVMe.
Garantía
Asus ofrece una garantía del fabricante de 2 años, pero limita la garantía legal para la batería. Para poder hacer uso de la garantía, el VivoBook debe registrarse en Asus tras la compra. Estas condiciones pueden diferir en otras regiones, por lo que los compradores interesados deben comprobarlo antes de comprar.
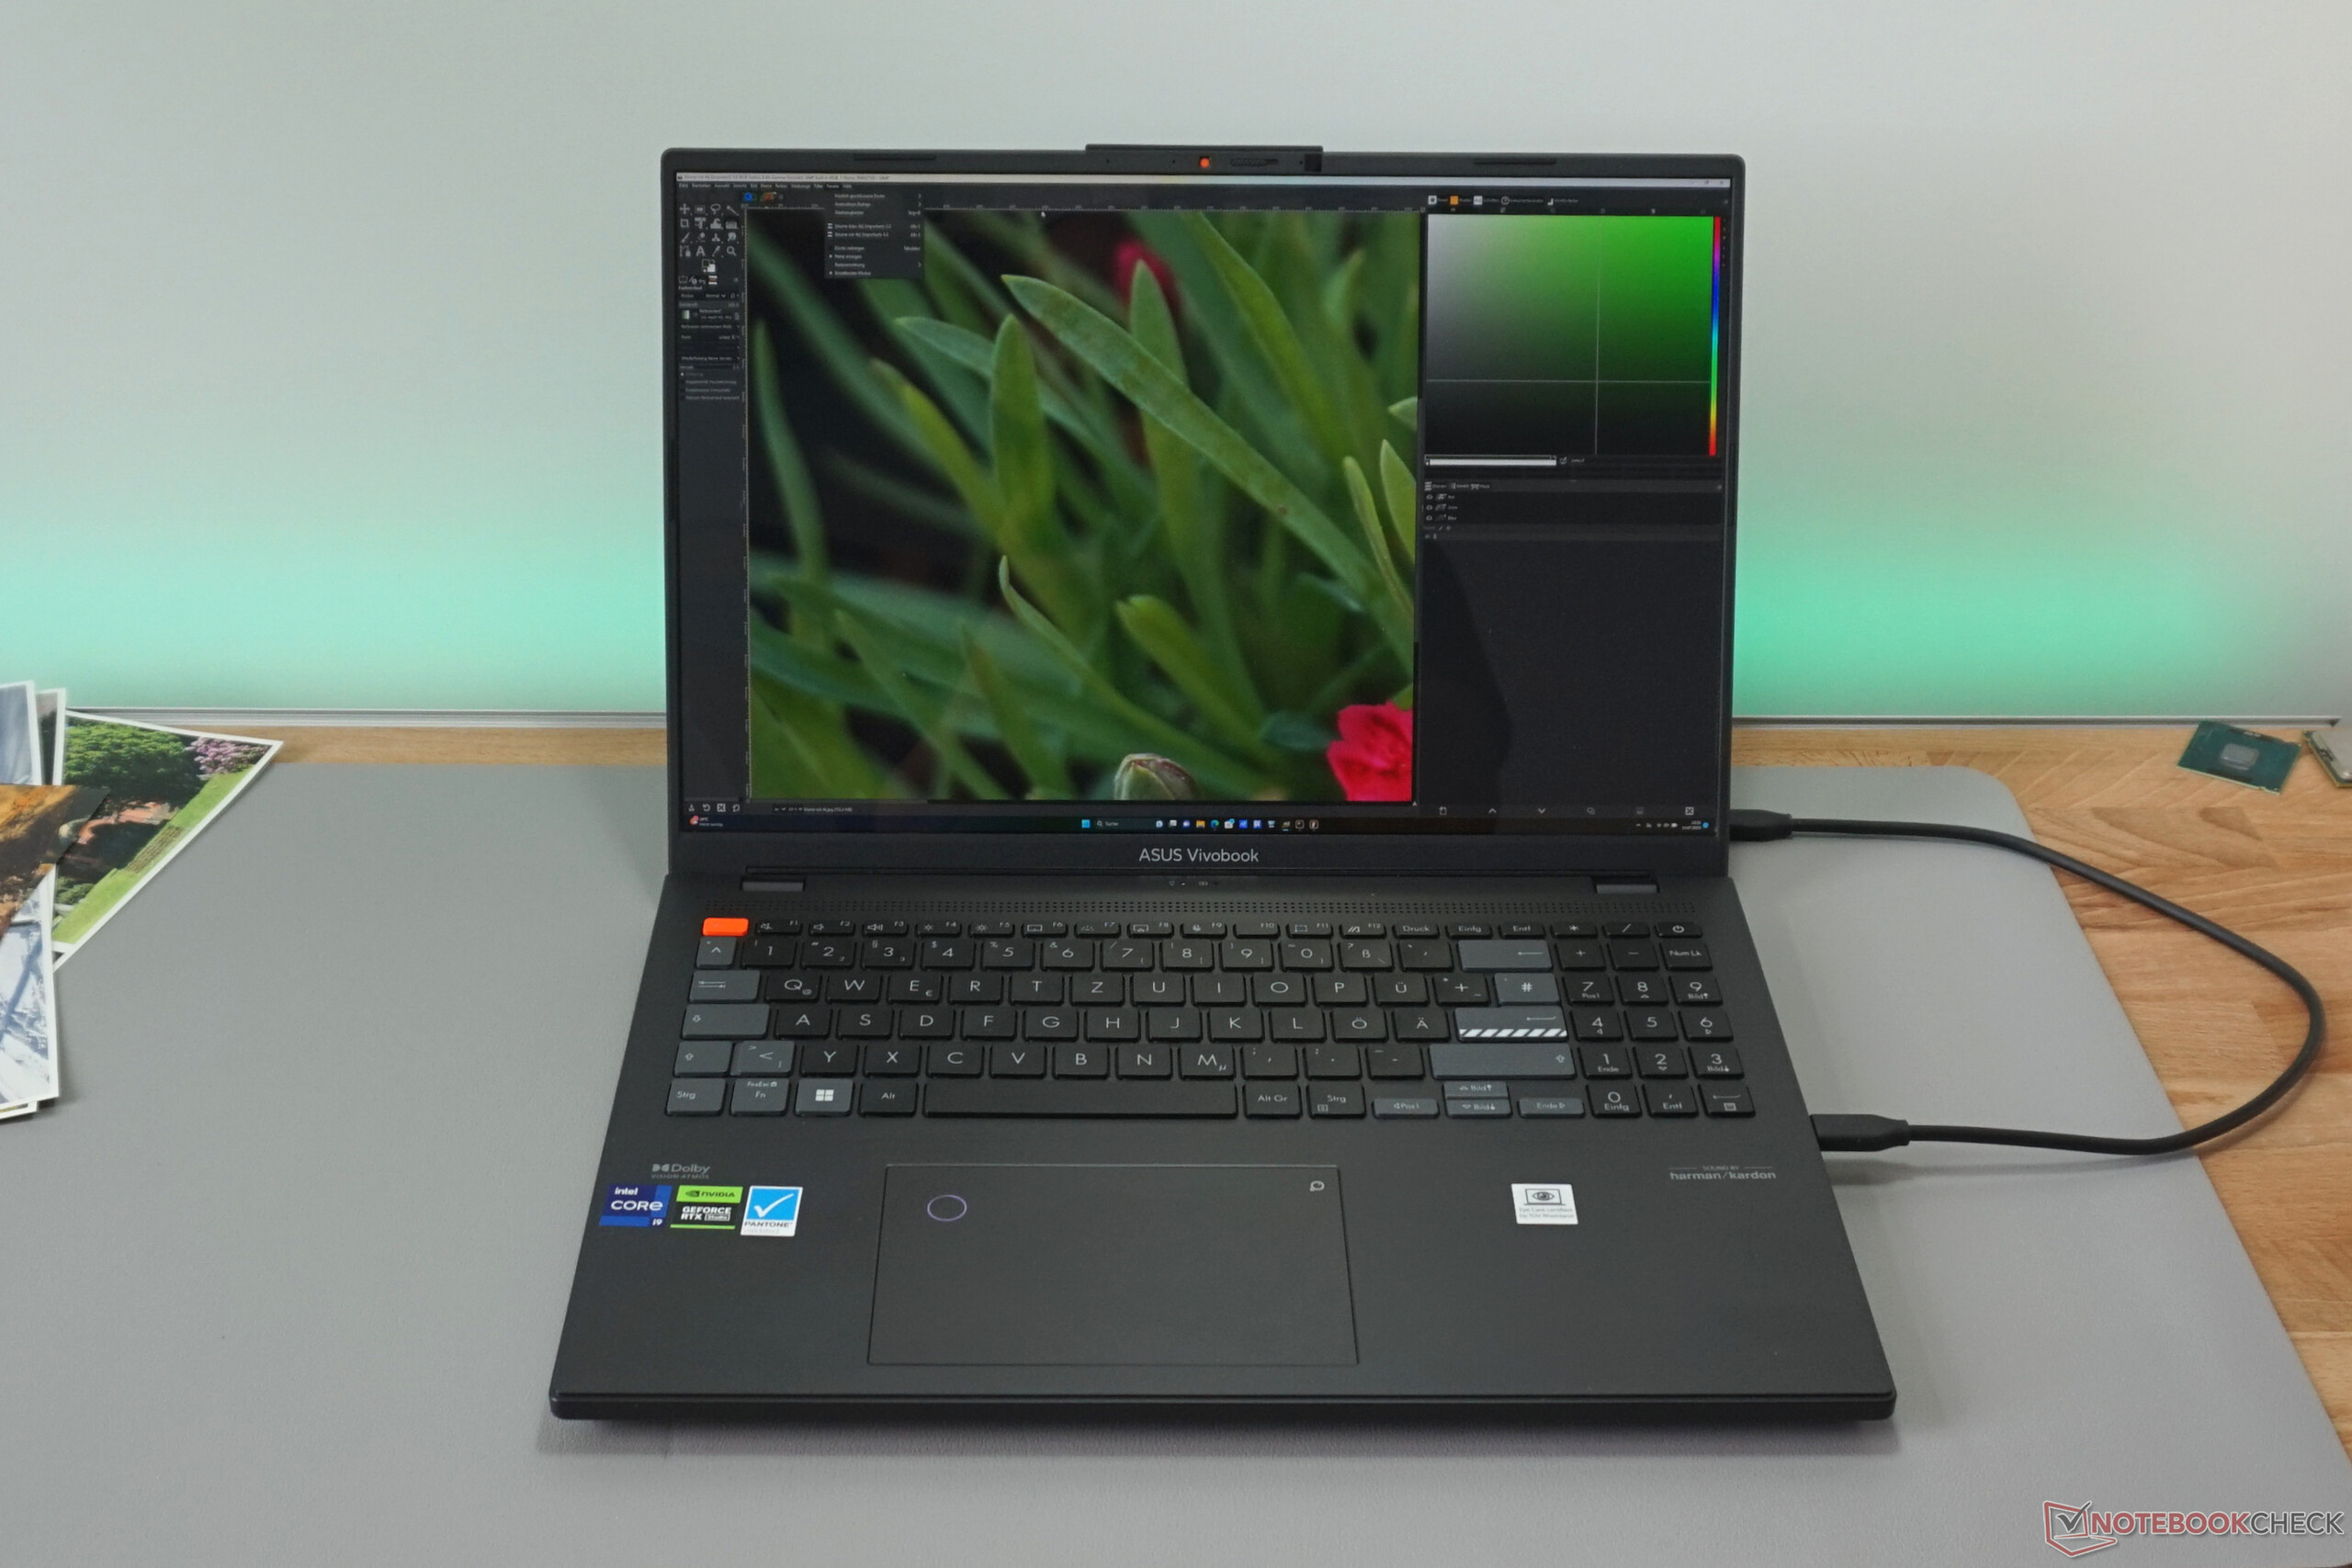
Dispositivos de entrada - Vivobook con práctico dial
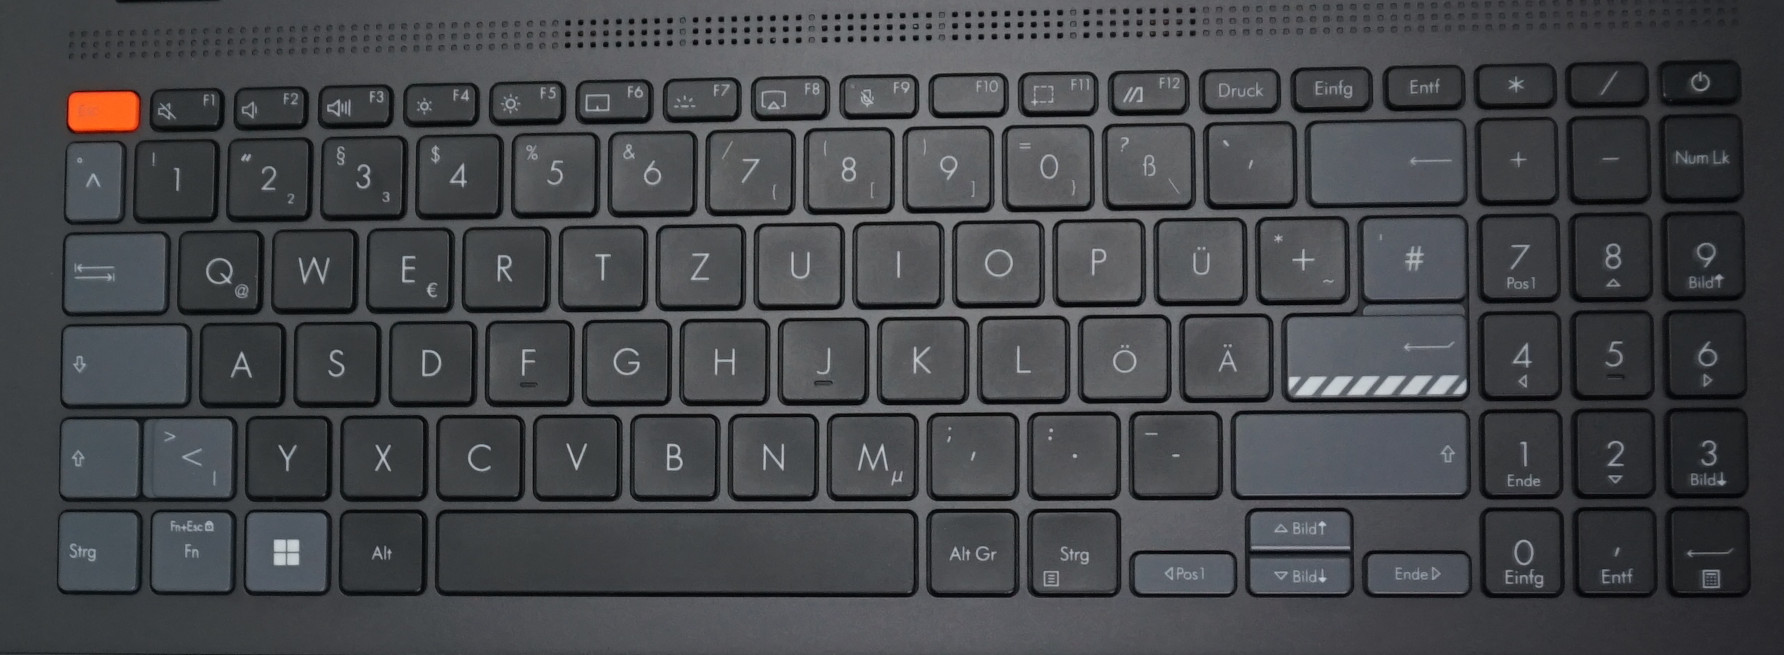
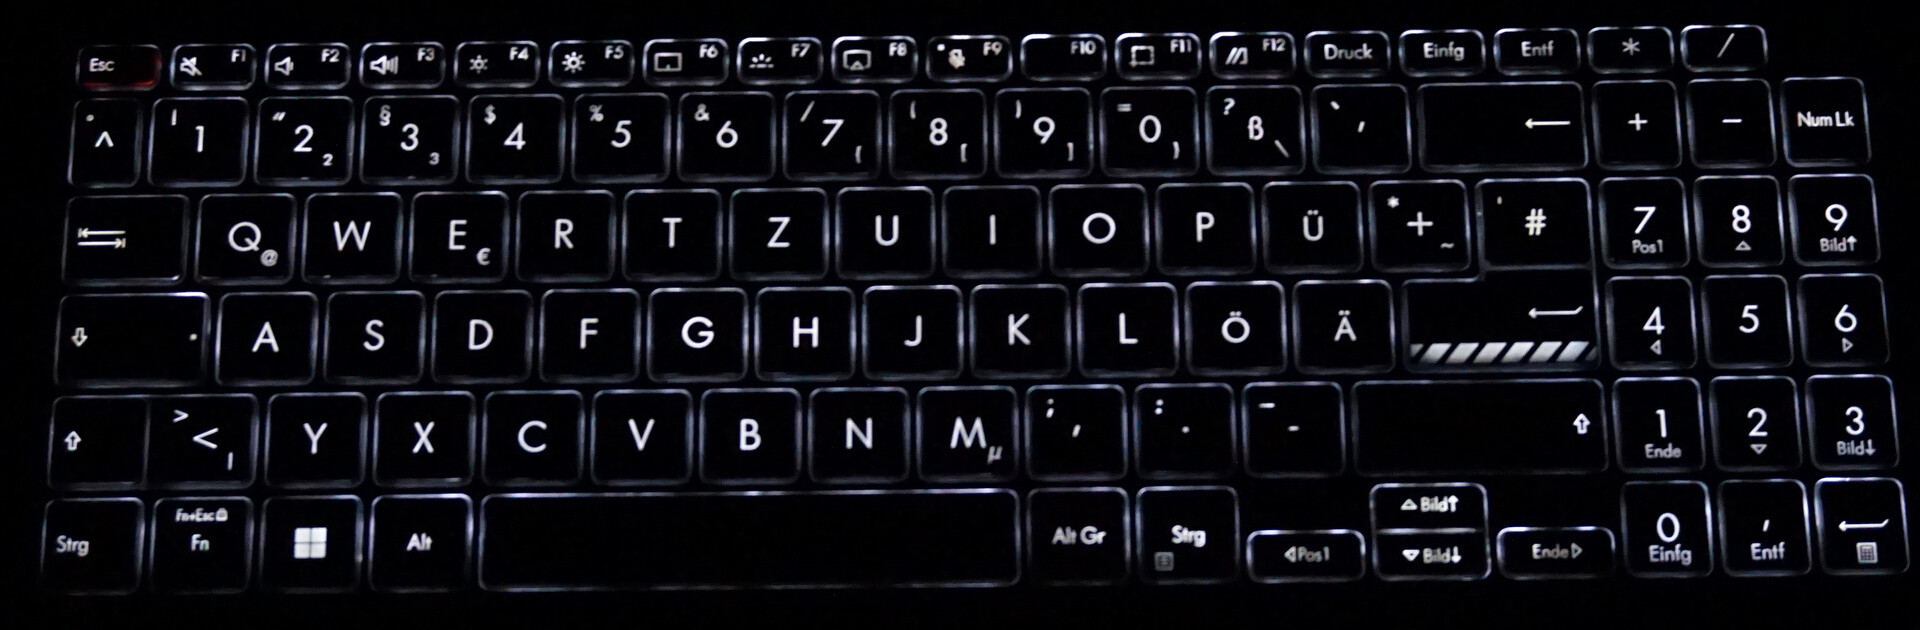
Teclado
Con un teclado numérico completo, un recorrido de 1,4 mm (nuestra medición) y una contrapresión bien dosificada, el teclado deja una excelente impresión, aunque los acentos de color no sean ciertamente del gusto de todos. Además, la retroiluminación del teclado es uniforme y de tres niveles.
Por desgracia, el marco del teclado cede demasiado al escribir. Es probable que esto sea un factor perturbador, incluso para los mecanógrafos frecuentes que son menos aprensivos.
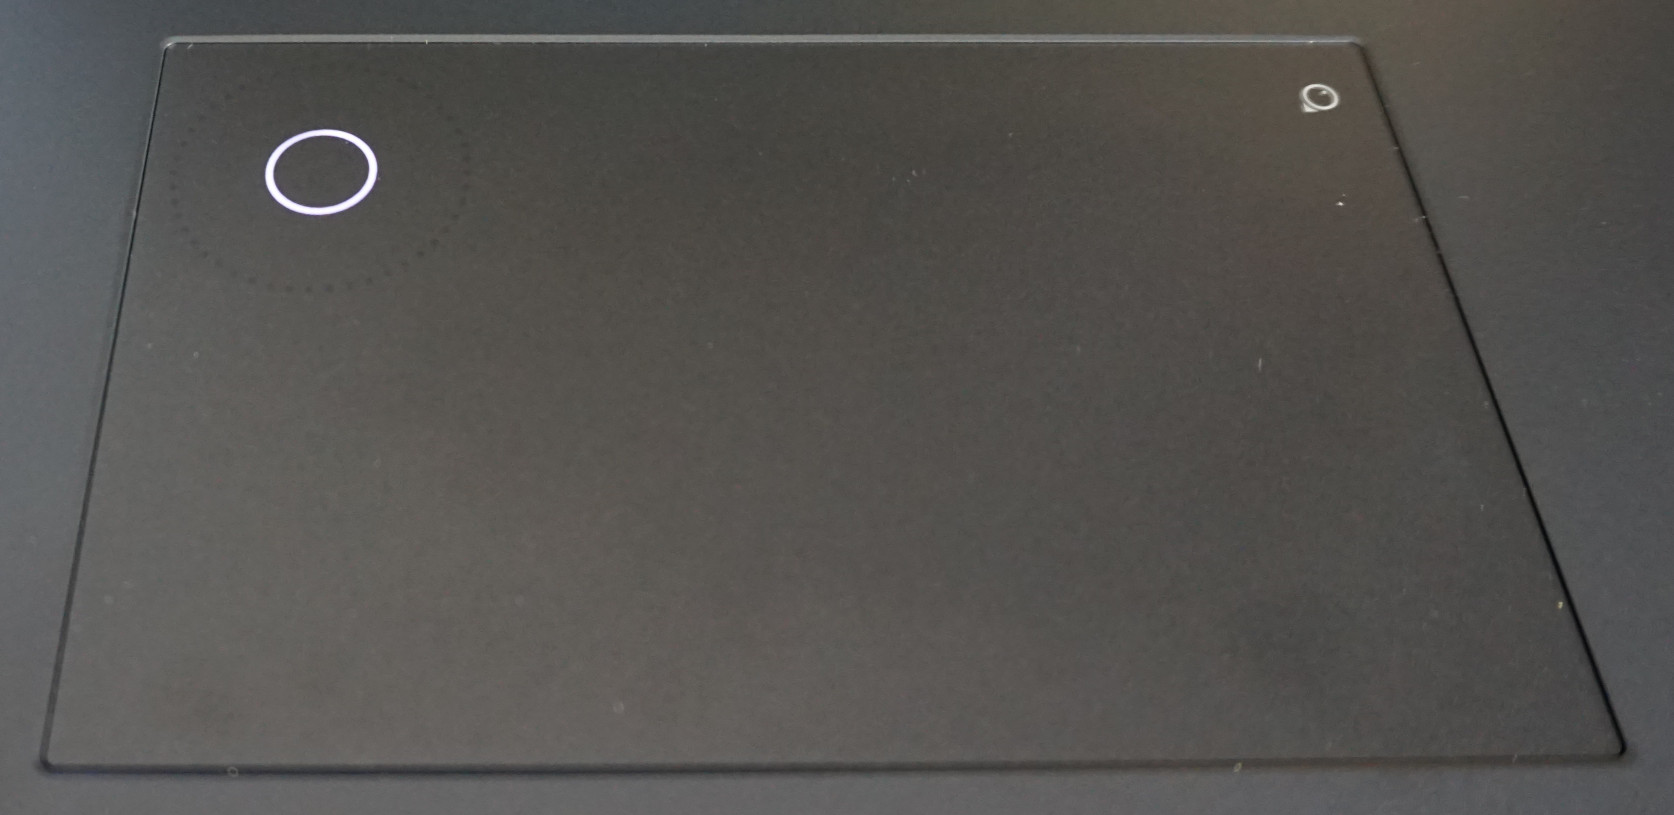
Panel táctil
Con 8 por 13 cm, el touchpad es agradablemente grande, preciso y alberga botones ocultos fáciles de pulsar, dejando una sólida impresión general.
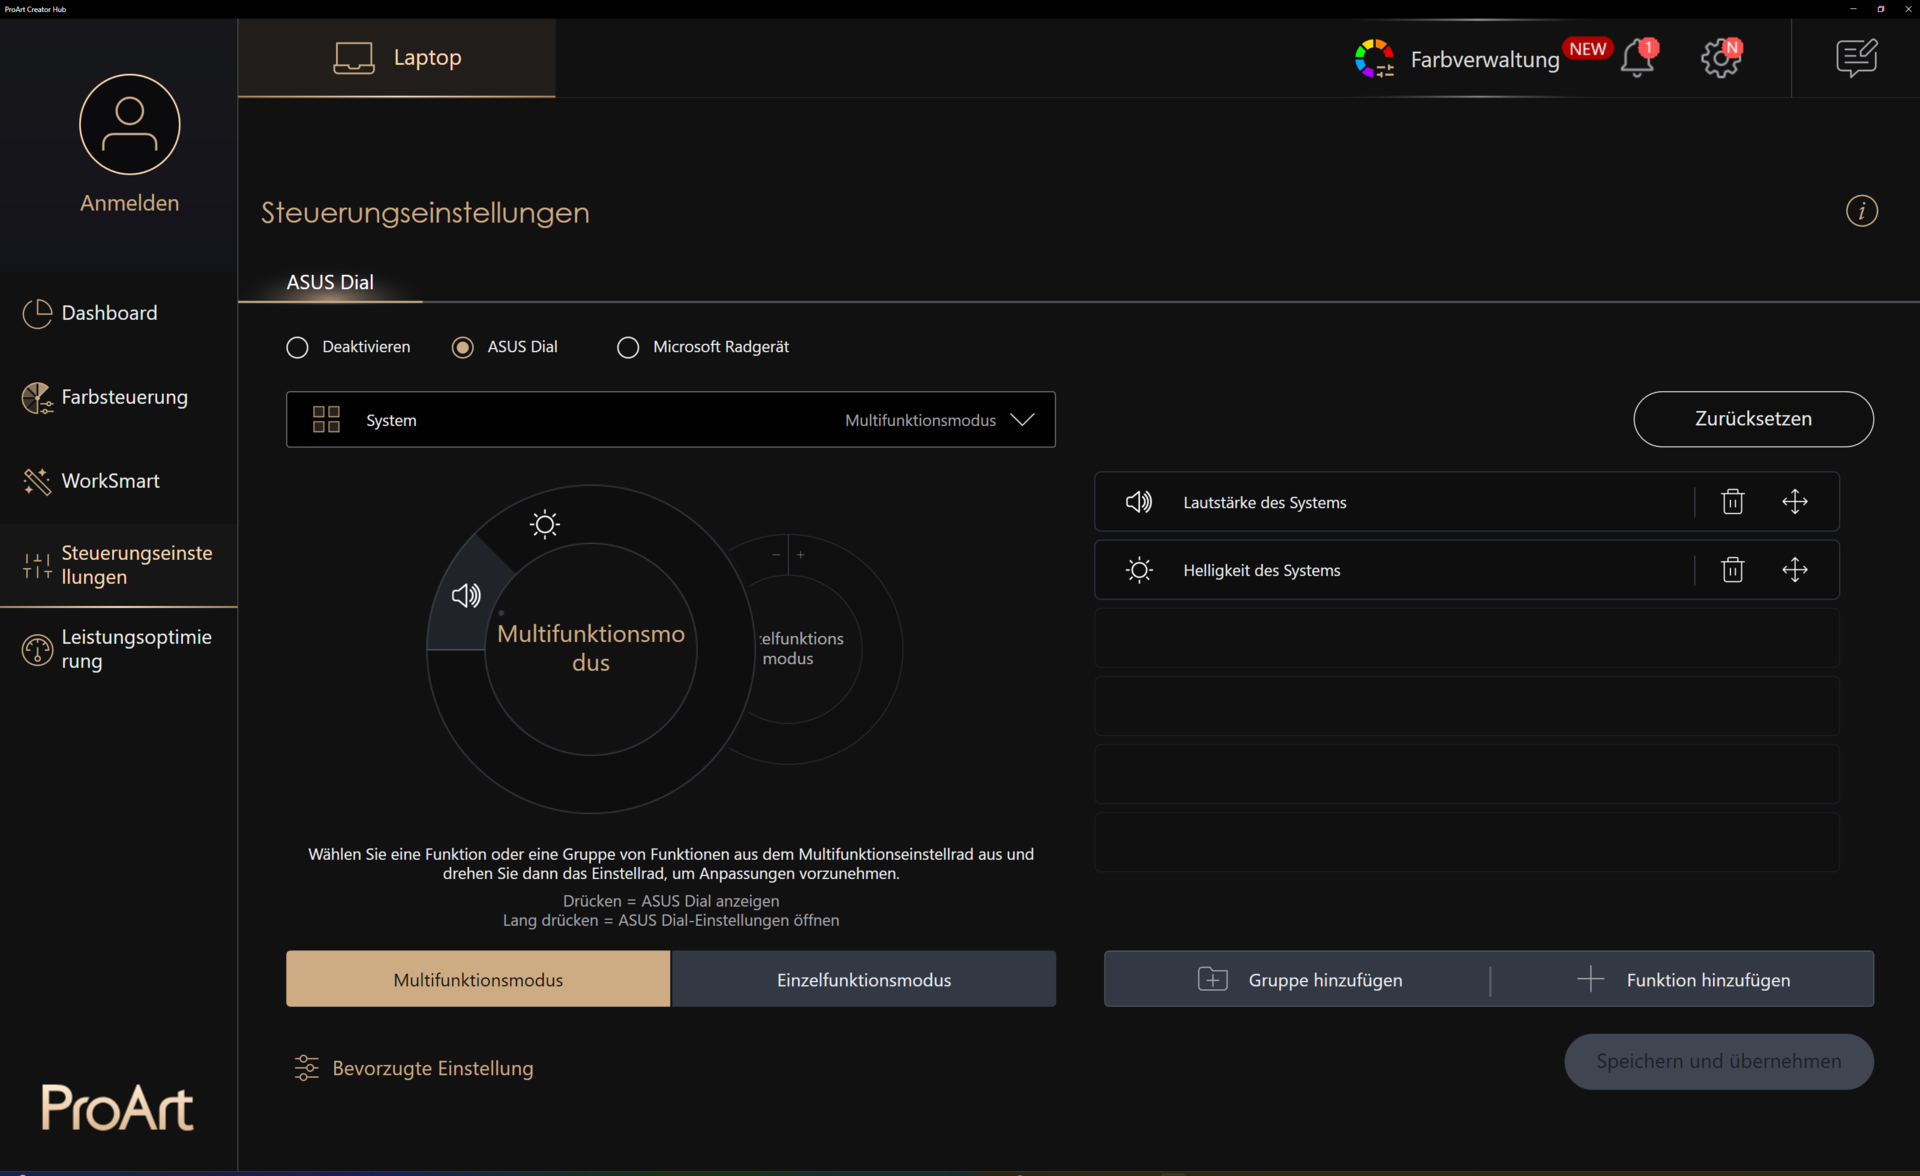
También se puede desplegar una rueda de control en la esquina superior izquierda mediante un botón en la esquina superior derecha. Esto no funciona con tanta precisión y fiabilidad como la rueda física instalada en elAsus ProArt Studiobooksin embargo, se gana su lugar a través de funciones básicas para ajustar el brillo y el volumen. El software ProArt también puede utilizarse para añadir una amplia variedad de funciones y, por ejemplo, almacenar combinaciones de teclas para diferentes aplicaciones.
En la edición de vídeo, por ejemplo, se puede pasar de un fotograma a otro. En la edición de imágenes, se puede acceder directamente a los ajustes de contraste y color. Y, por supuesto, todo lo demás se puede controlar a través del panel de control, siempre que se conozca la combinación de teclas.
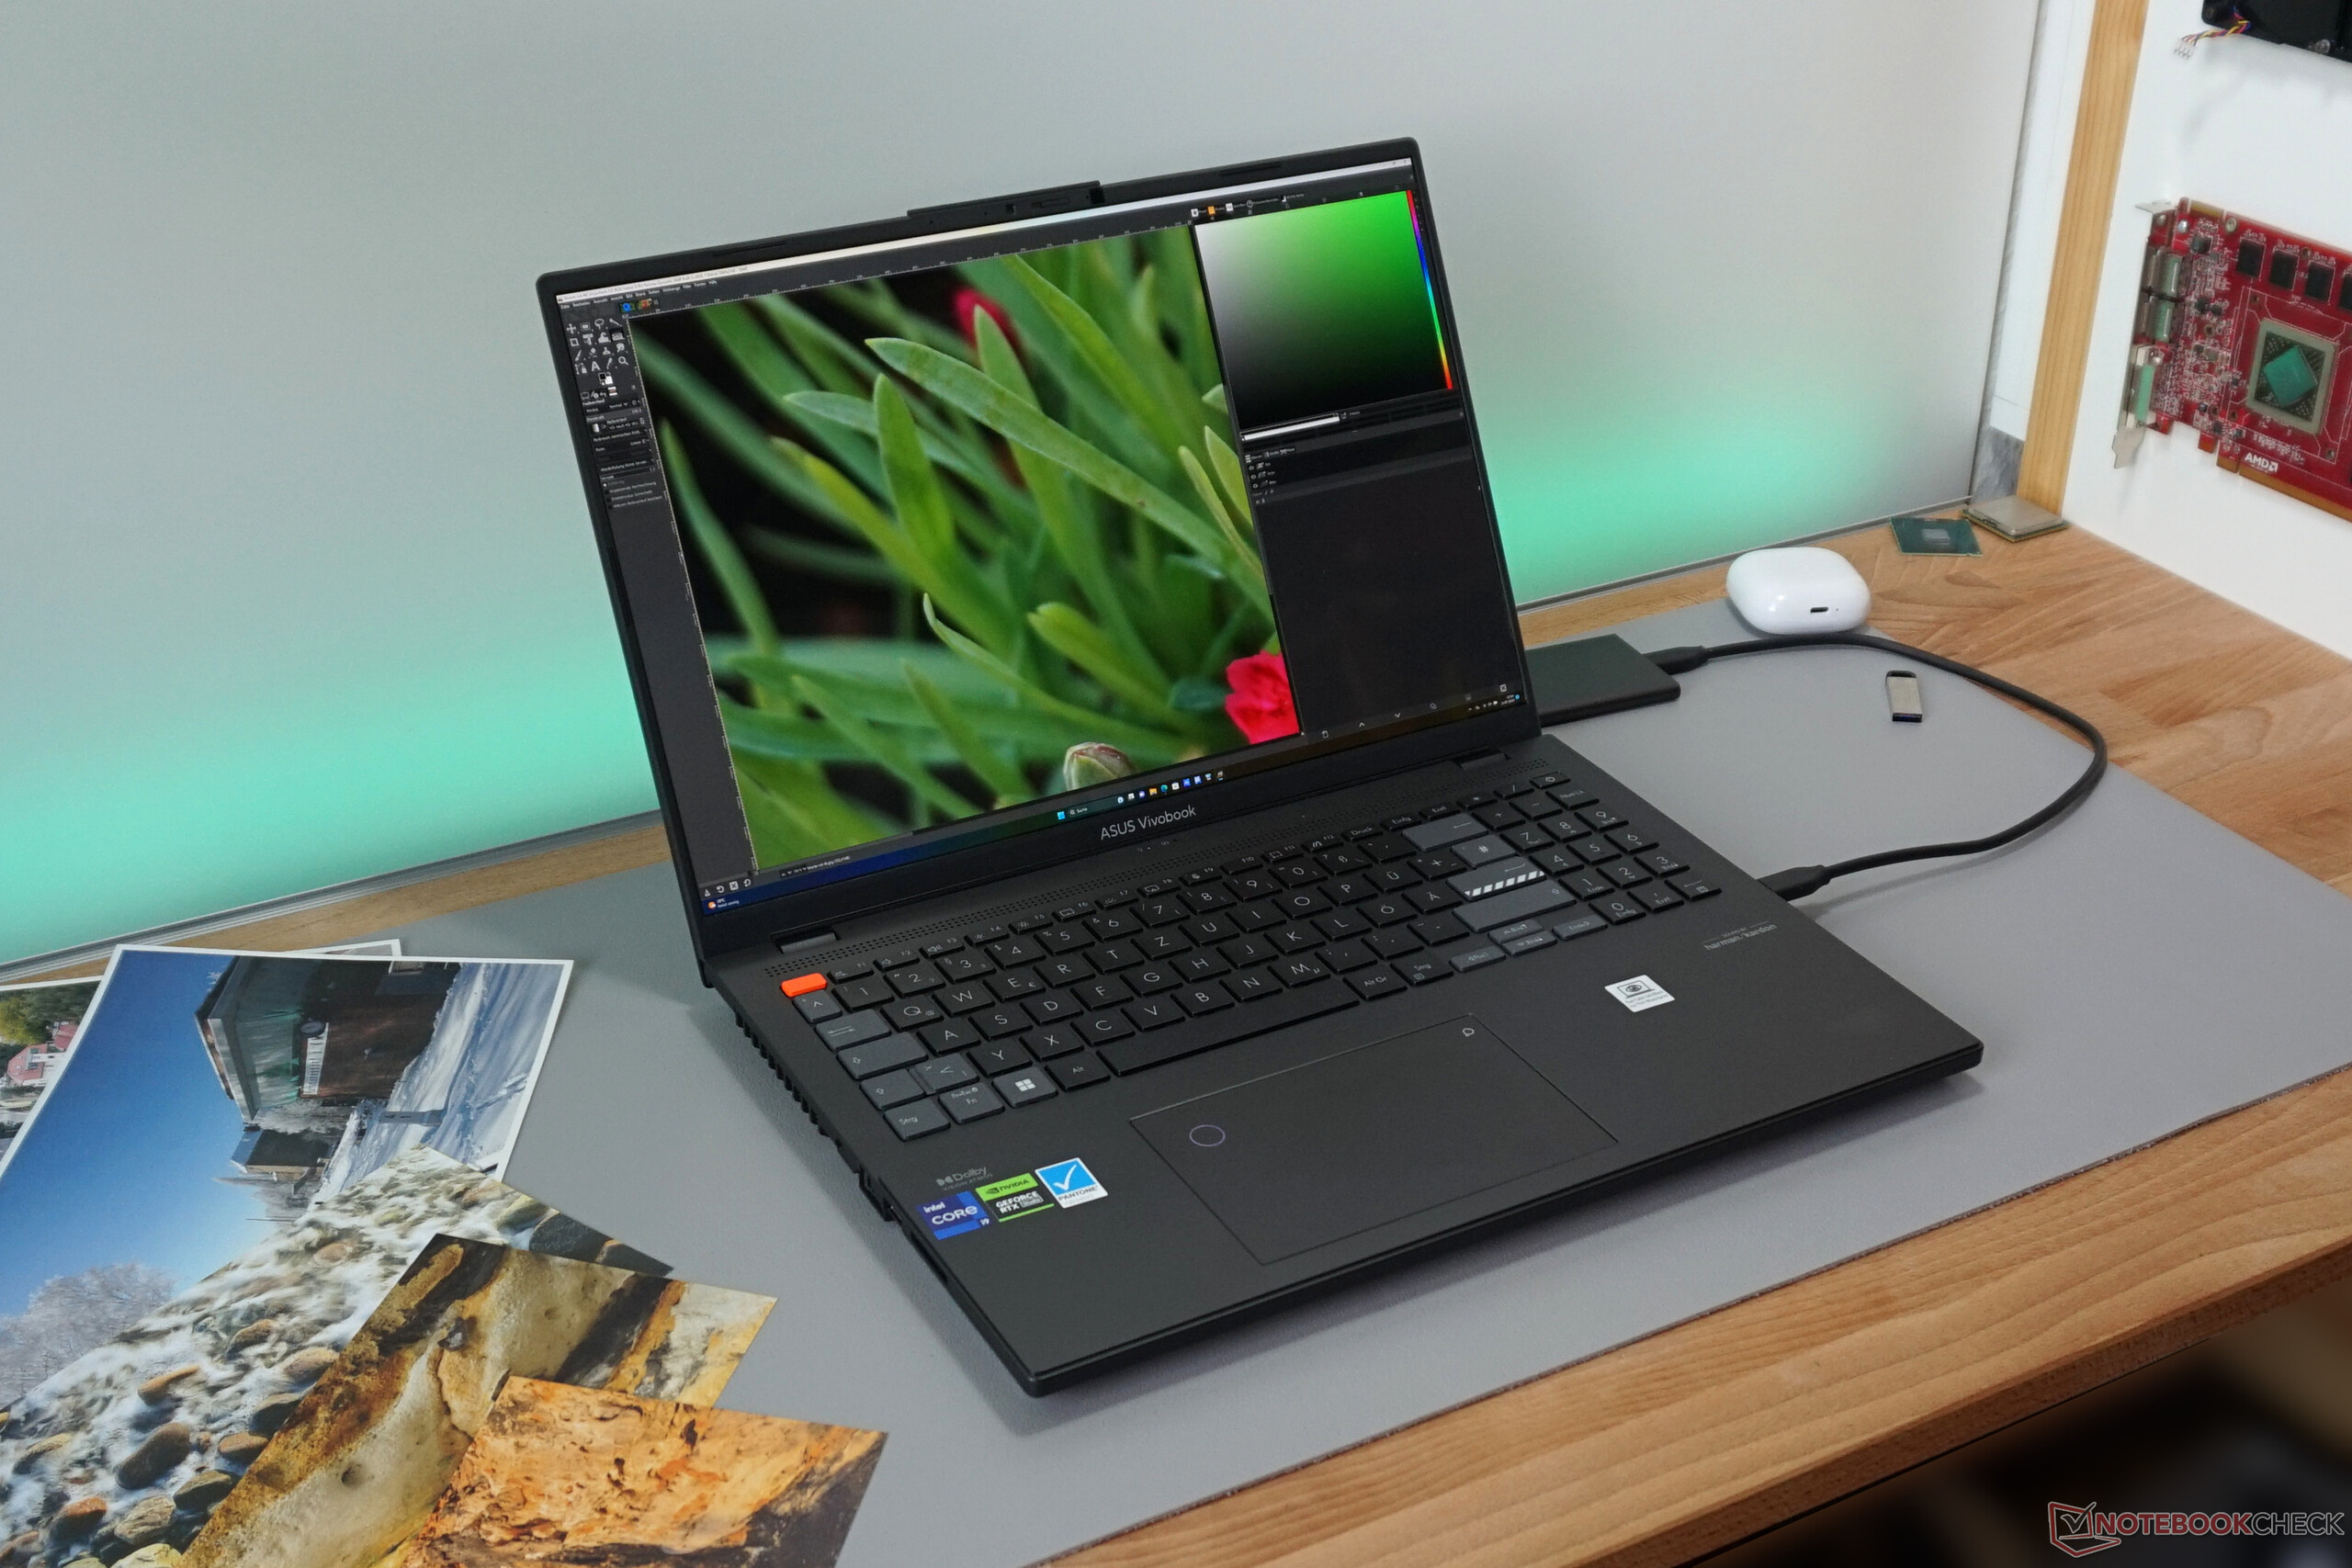
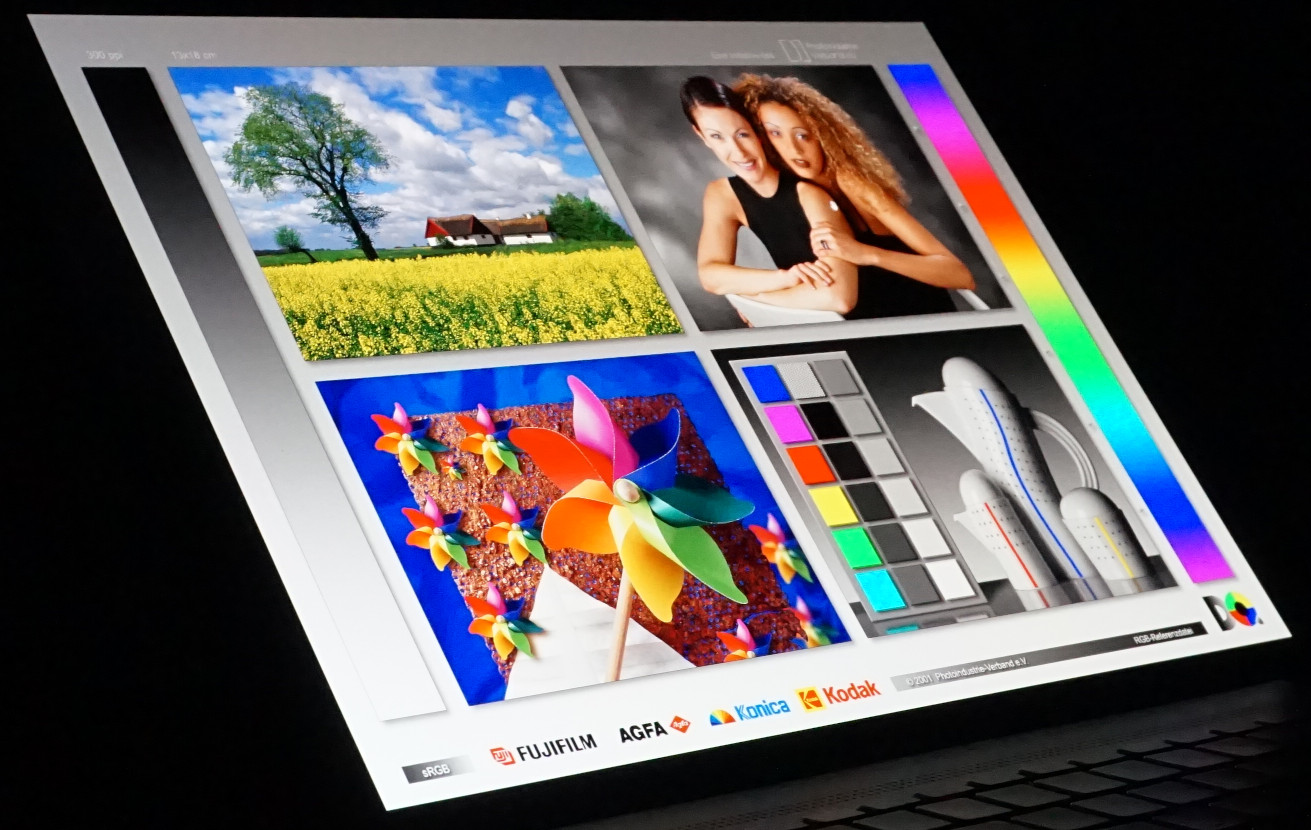
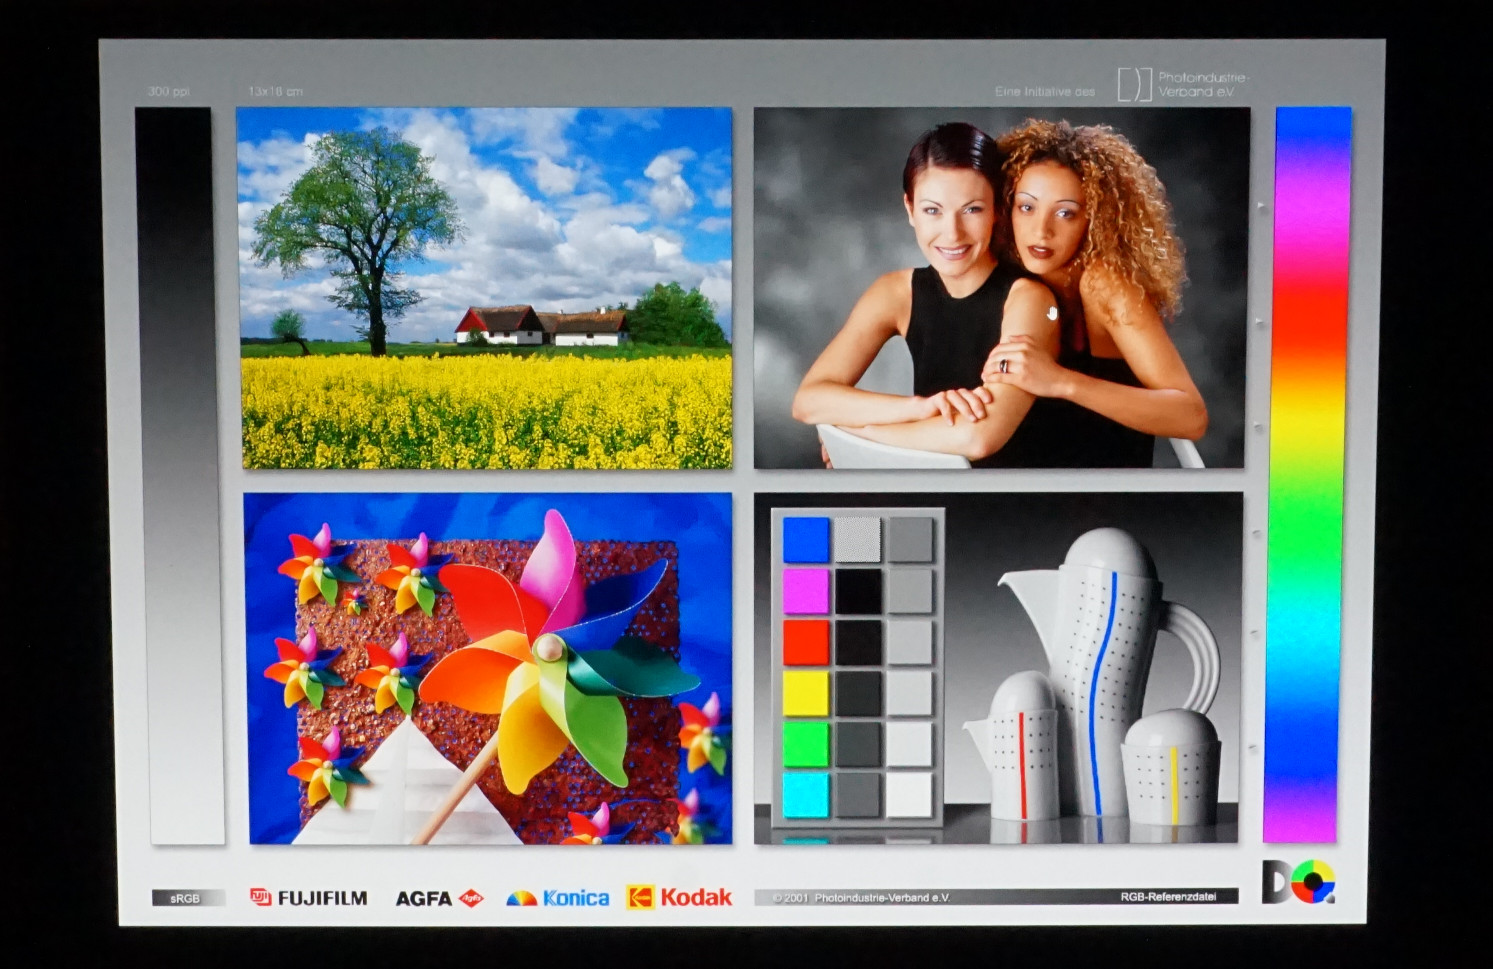
Pantalla - OLED de colores intensos sin táctil
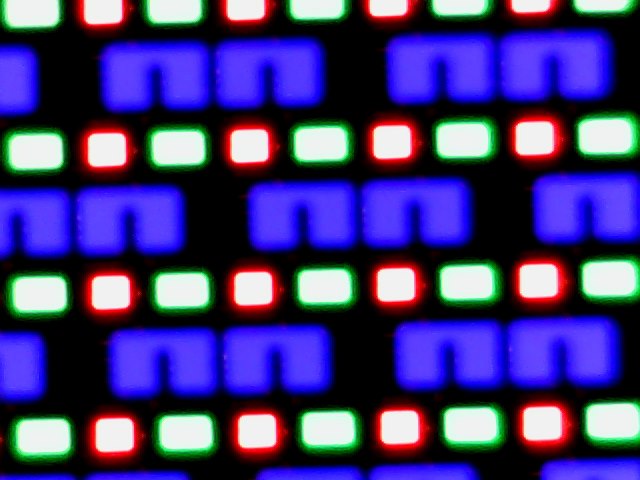
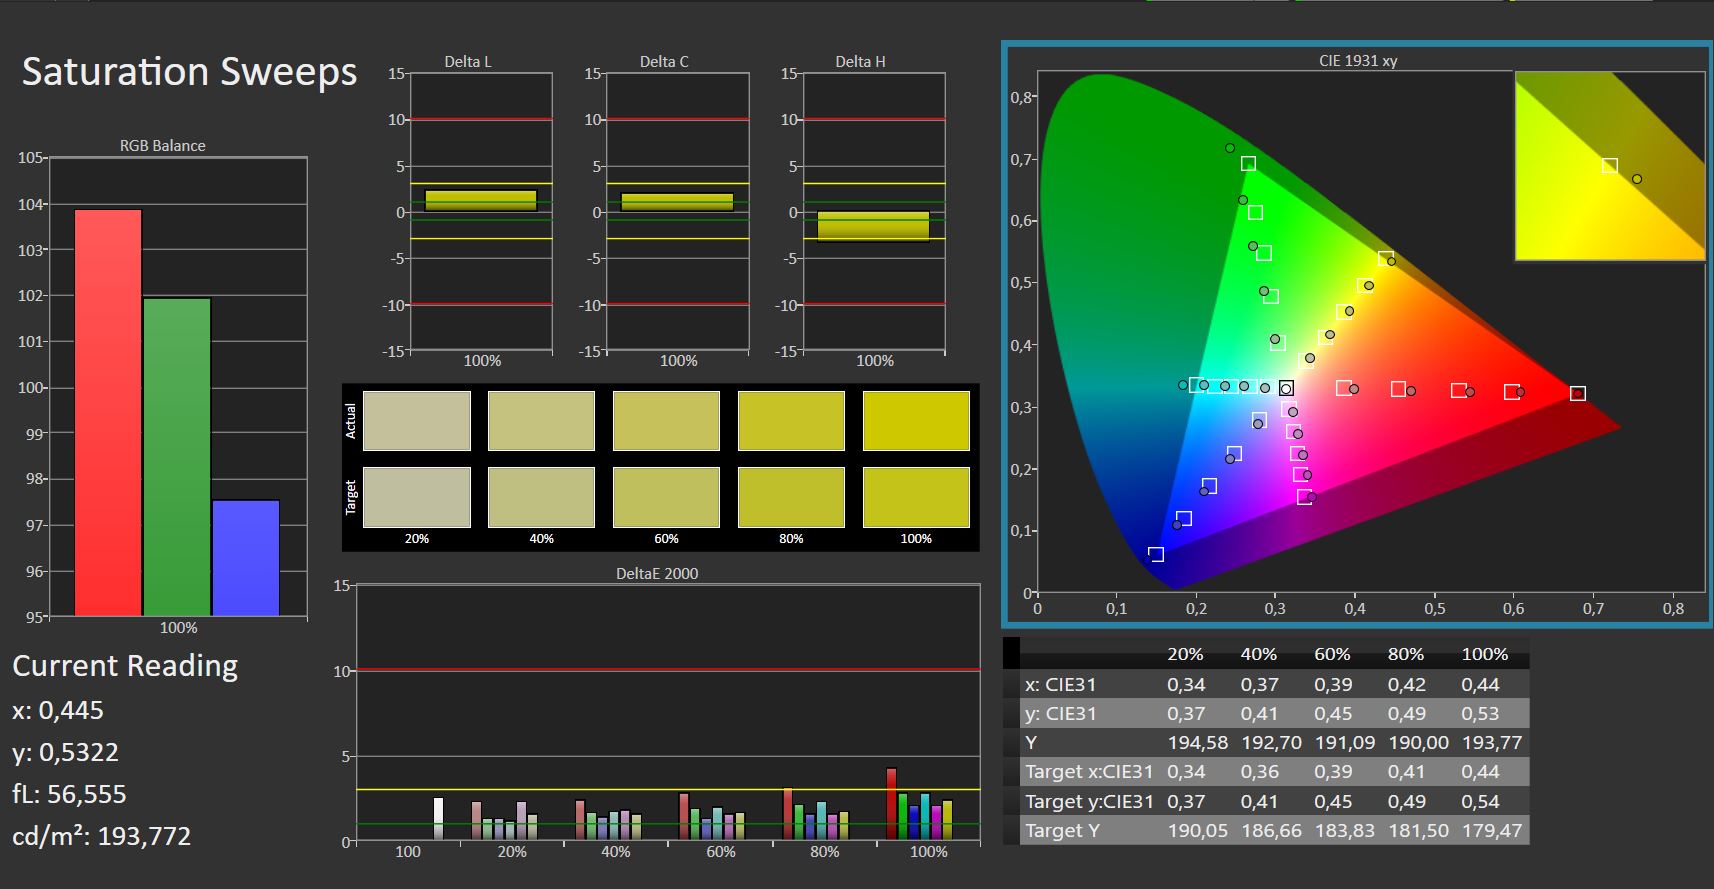
La pantalla OLED también juega a su favor en el VivoBook Pro 16X. El negro profundo y el alto contraste resultante hacen que los colores sean brillantes y vivos. Estos se reproducen casi a la perfección, incluso sin calibración adicional.
La inusual resolución de 3.200 por 2.000 píxeles corresponde al formato 16:10 y se sitúa aproximadamente en el medio entre QHD y 4K. En la pantalla de 16 pulgadas, garantiza una visualización detallada de fotos digitales de alta resolución, al menos por secciones, sin que las representaciones se vuelvan demasiado diminutas como en 4K.
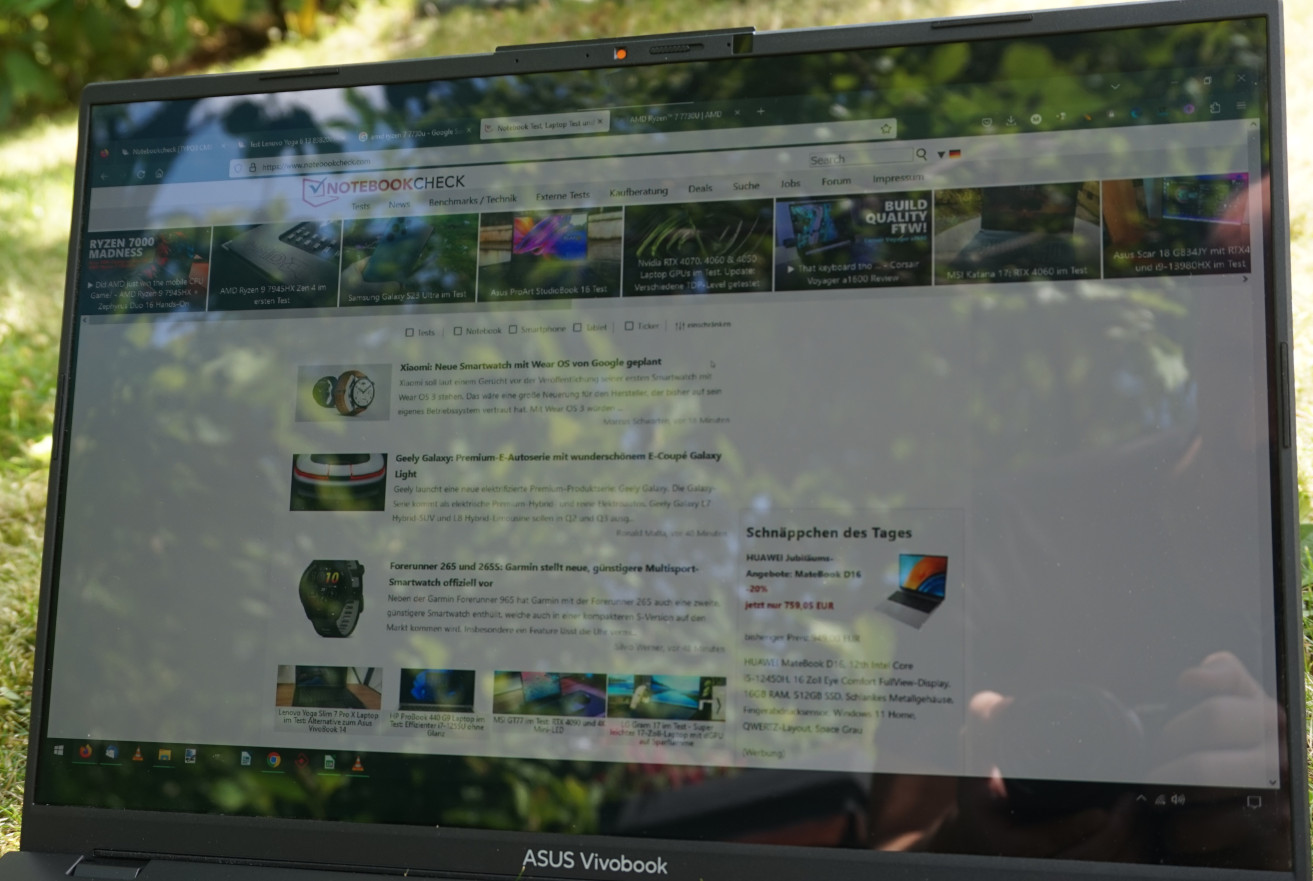
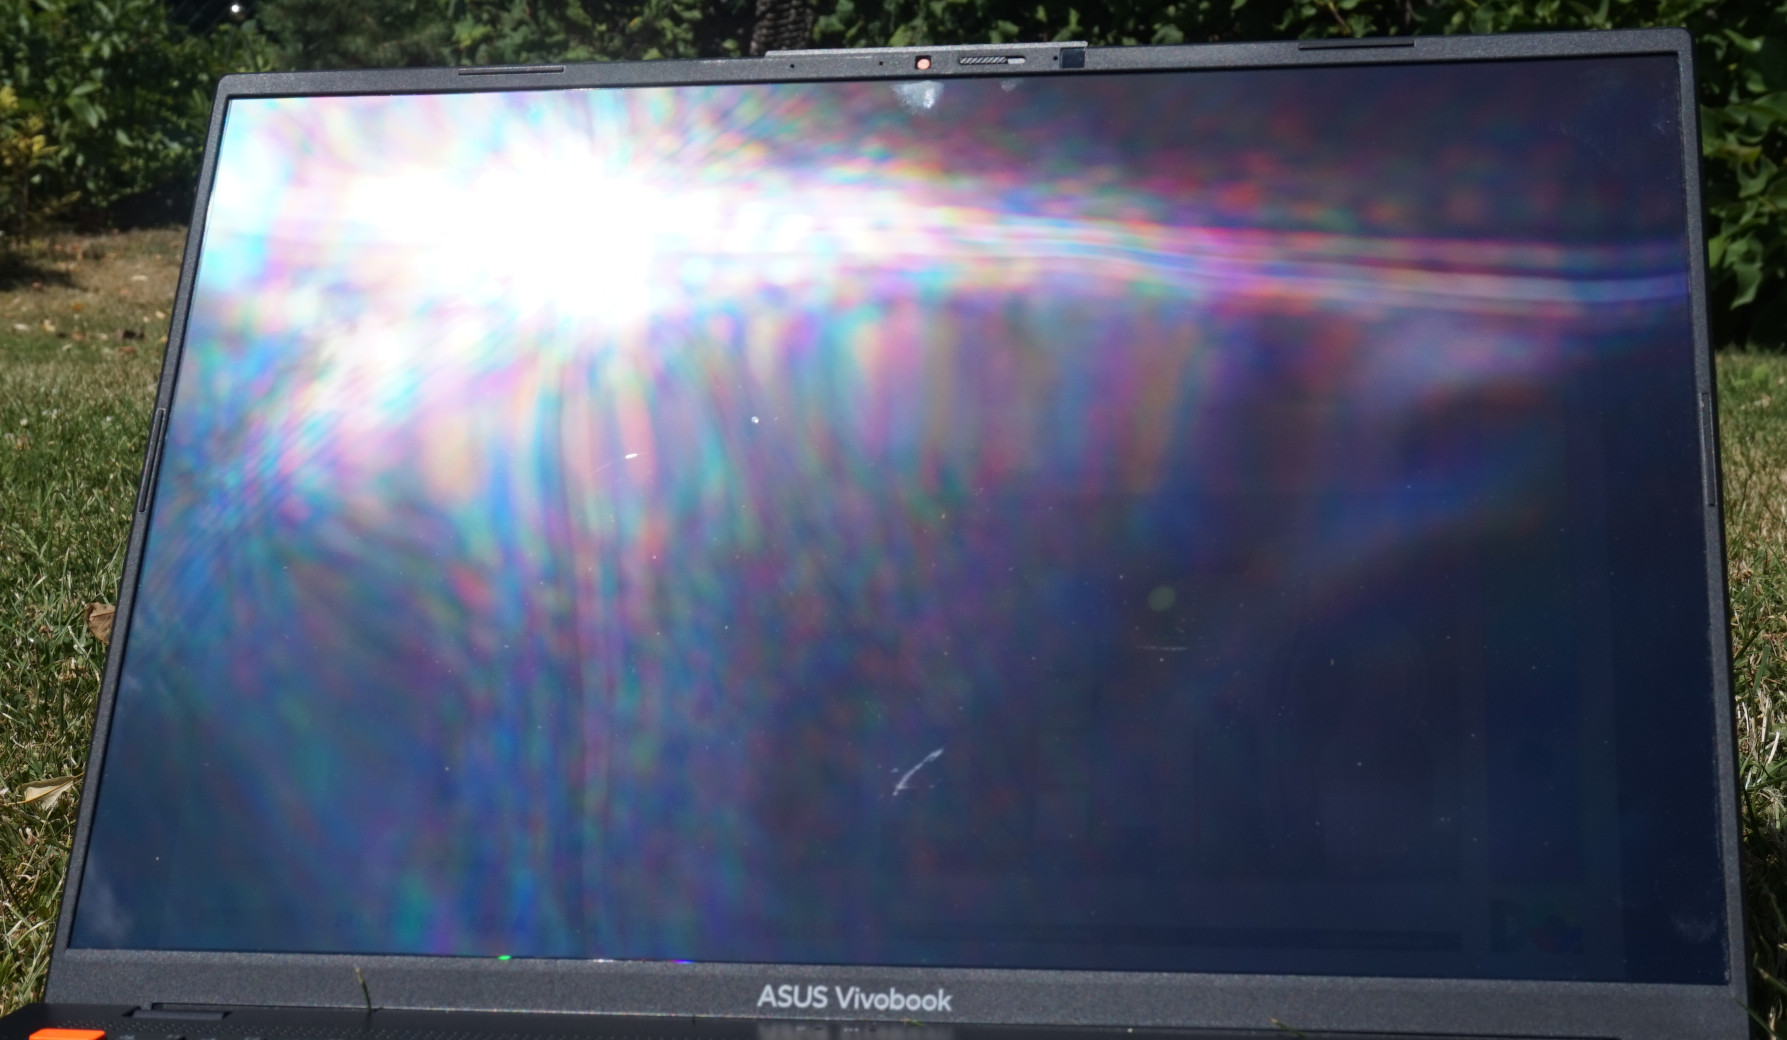
El brillo medio no tiene inconvenientes, al menos en interiores. Debido al valor de negro muy bajo, la imagen parece más brillante que en un panel IPS. Sin embargo, la superficie lustrosa impide una buena visibilidad en exteriores con algo menos de 350 cd/m² en modo SDR.
Comparado con rivales similares con pantalla OLED, el Asus VivoBook sólo usa una tasa de frames de 120 Hz, que también corresponde al parpadeo PWM medido de exactamente 120 Hz. Aunque es mucho más sutil que en TN o algunos paneles IPS, sigue siendo perceptible para los ojos sensibles. También aumenta a 240 Hz al 60% de brillo y por debajo.
El sangrado de pantalla o los halos no se producen en una pantalla OLED.
| |||||||||||||||||||||||||
iluminación: 97 %
Contraste: 5783:1 (Negro: 0.06 cd/m²)
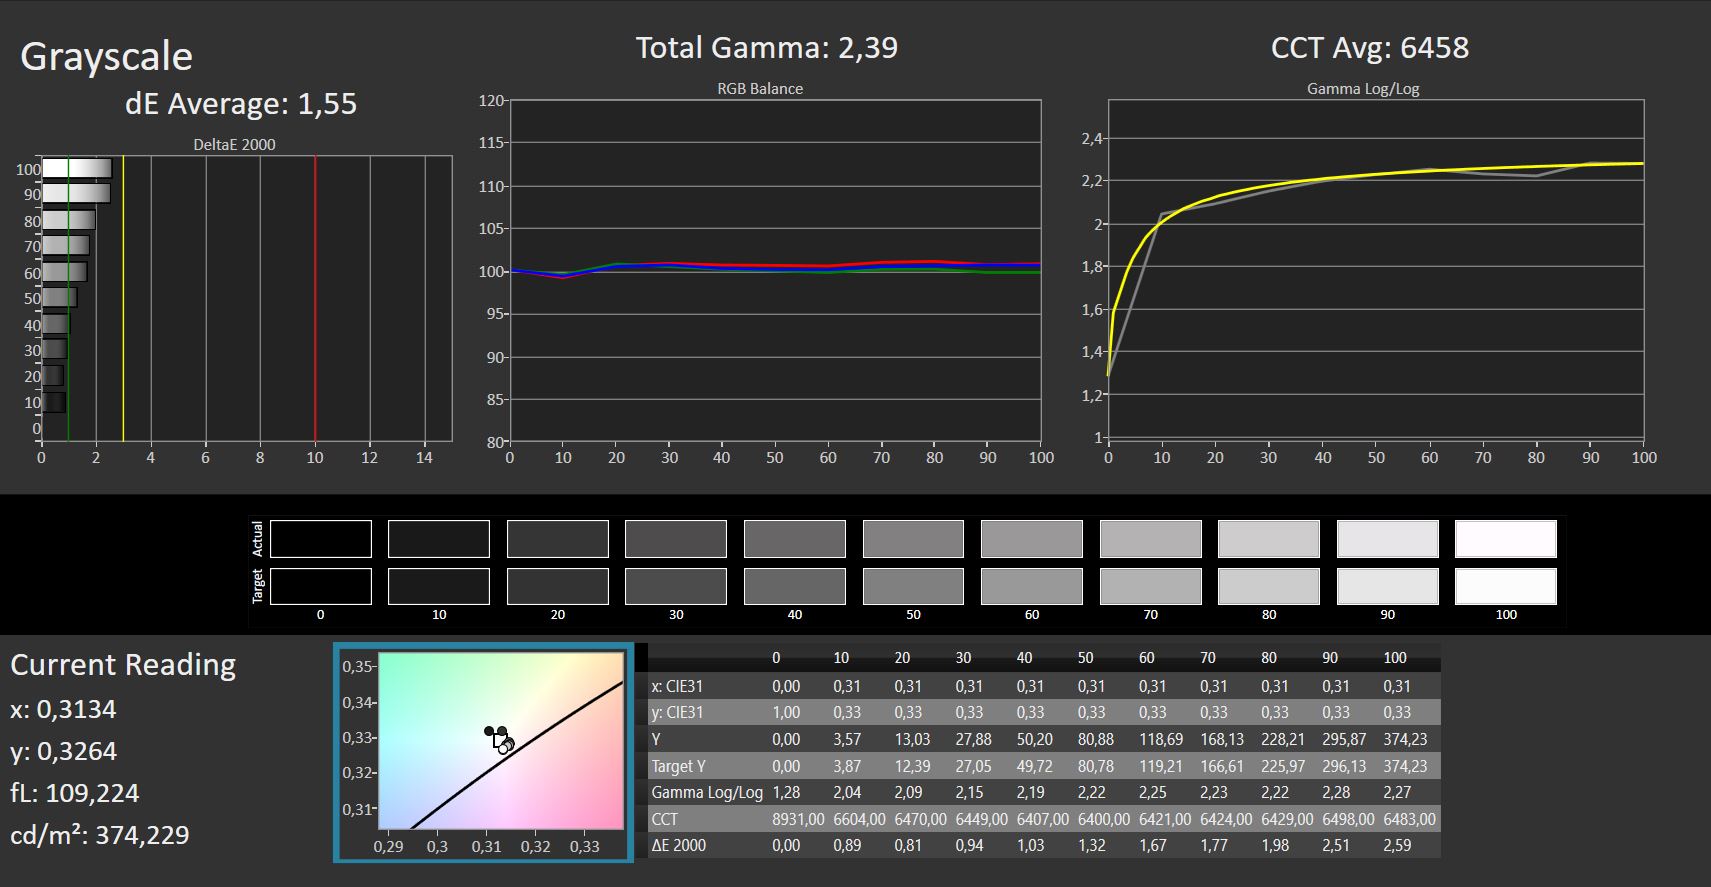
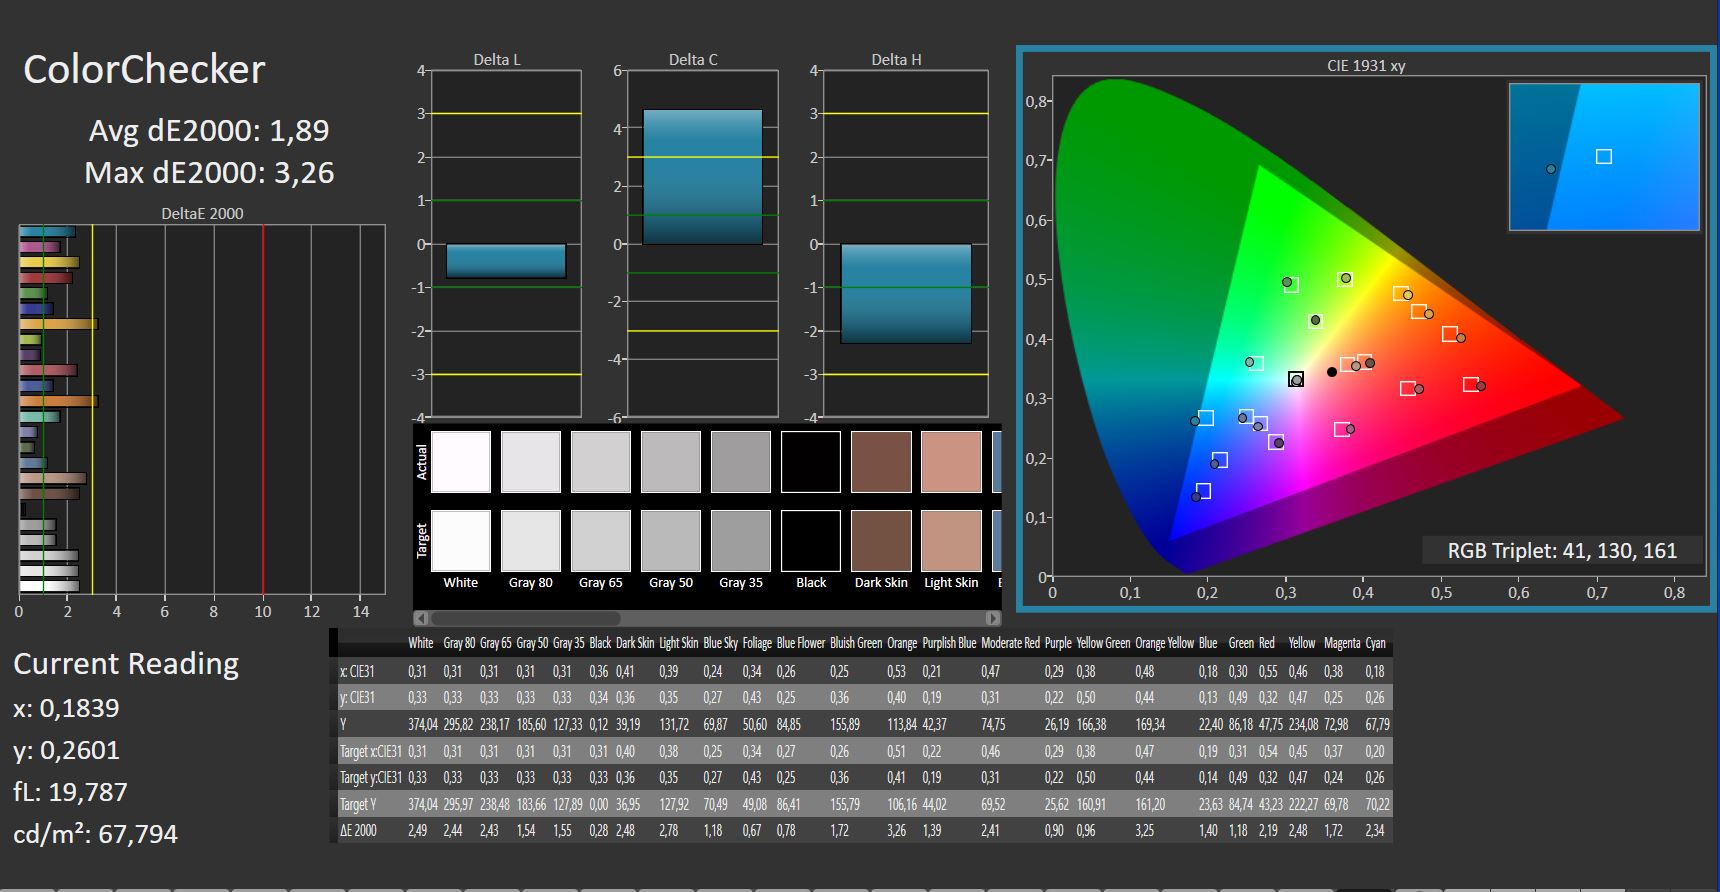
ΔE ColorChecker Calman: 1.89 | ∀{0.5-29.43 Ø4.71}
calibrated: 1.97
ΔE Greyscale Calman: 1.55 | ∀{0.09-98 Ø4.96}
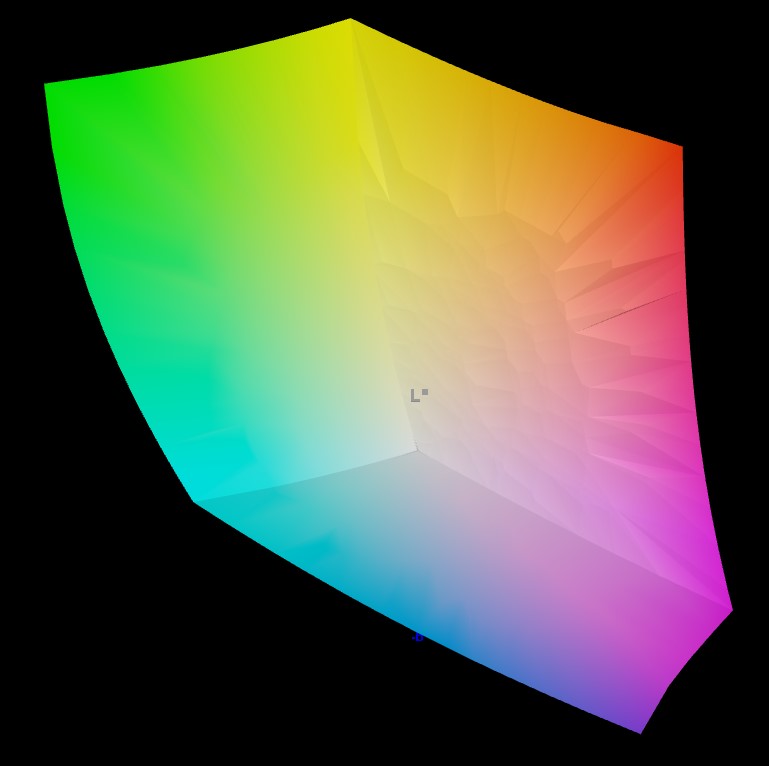
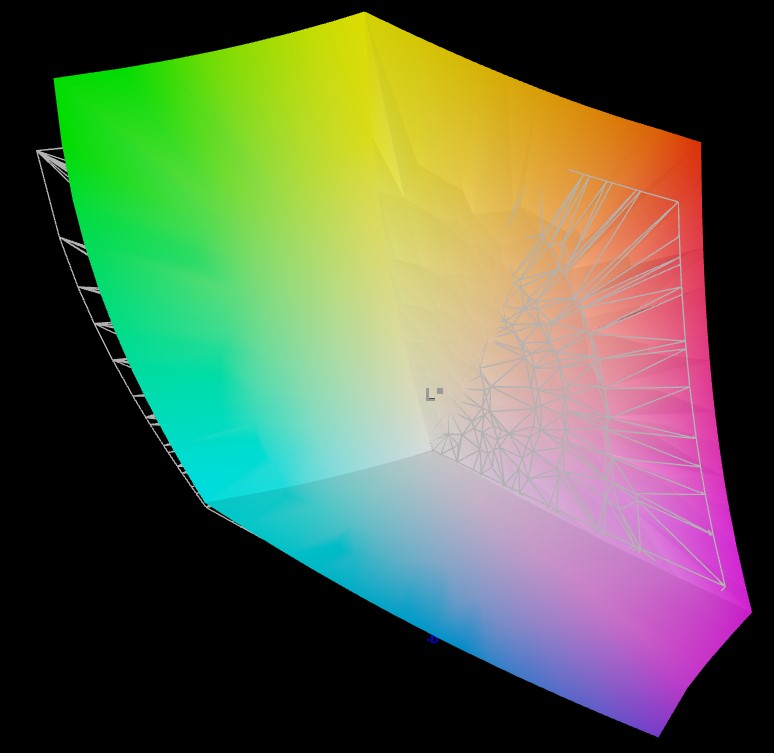
95.8% AdobeRGB 1998 (Argyll 3D)
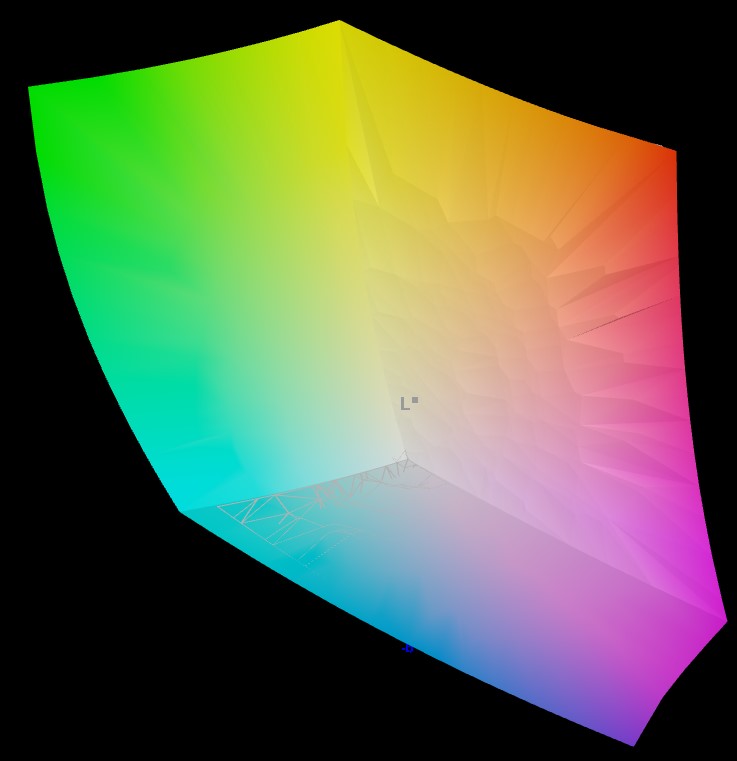
99.7% sRGB (Argyll 3D)
98.4% Display P3 (Argyll 3D)
Gamma: 2.39
CCT: 6458 K
| Asus Vivobook Pro 16X K6604JV-MX016W Samsung SDC4178 ATNA60BX01-1, OLED, 3200x2000, 16" | Dell XPS 15 9530 RTX 4070 Samsung 156XG01, OLED, 3456x2160, 15.6" | Samsung Galaxy Book3 Ultra 16 Samsung ATNA60CL03-0, AMOLED, 2880x1800, 16" | Asus ProArt Studiobook 16 OLED H7604 ATNA60BX01-1, OLED, 3200x2000, 16" | Schenker VISION 16 Pro (M23) NE160QDM-NZ1, IPS, 2560x1600, 16" | MSI Creator Z17 A12UGST-054 AUO3C9B (B170QAN01.0), IPS, 2560x1600, 17" | |
|---|---|---|---|---|---|---|
| Display | 1% | 1% | -2% | -19% | -3% | |
| Display P3 Coverage (%) | 98.4 | 99.8 1% | 99.9 2% | 99.6 1% | 68.8 -30% | 98.9 1% |
| sRGB Coverage (%) | 99.7 | 100 0% | 100 0% | 100 0% | 98.8 -1% | 99.9 0% |
| AdobeRGB 1998 Coverage (%) | 95.8 | 98.4 3% | 96.3 1% | 89.4 -7% | 70 -27% | 86.4 -10% |
| Response Times | -22% | 62% | 54% | -618% | -423% | |
| Response Time Grey 50% / Grey 80% * (ms) | 1.6 ? | 1.68 ? -5% | 0.49 ? 69% | 0.59 ? 63% | 13.7 ? -756% | 11 ? -588% |
| Response Time Black / White * (ms) | 1.4 ? | 1.94 ? -39% | 0.65 ? 54% | 0.79 ? 44% | 8.1 ? -479% | 5 ? -257% |
| PWM Frequency (Hz) | 120 ? | 239 | 240 ? | 240 ? | ||
| Screen | -44% | 11% | 23% | -91% | -147% | |
| Brightness middle (cd/m²) | 347 | 389.5 12% | 400 15% | 349 1% | 384 11% | 444 28% |
| Brightness (cd/m²) | 346 | 392 13% | 399 15% | 350 1% | 371 7% | 415 20% |
| Brightness Distribution (%) | 97 | 98 1% | 93 -4% | 95 -2% | 88 -9% | 88 -9% |
| Black Level * (cd/m²) | 0.06 | 0.03 50% | 0.02 67% | 0.3 -400% | 0.7 -1067% | |
| Contrast (:1) | 5783 | 13333 131% | 17450 202% | 1280 -78% | 634 -89% | |
| Colorchecker dE 2000 * | 1.89 | 4.95 -162% | 2.3 -22% | 2.1 -11% | 3.4 -80% | 2.48 -31% |
| Colorchecker dE 2000 max. * | 3.26 | 8.65 -165% | 4.15 -27% | 5.5 -69% | 9.2 -182% | 3.52 -8% |
| Colorchecker dE 2000 calibrated * | 1.97 | 1.53 22% | 1.66 16% | 2.1 -7% | 1.3 34% | 2.91 -48% |
| Greyscale dE 2000 * | 1.55 | 2 -29% | 2.7 -74% | 1.2 23% | 3.4 -119% | 3.33 -115% |
| Gamma | 2.39 92% | 2.27 97% | 2.266 97% | 2.19 100% | 2.16 102% | 2.33 94% |
| CCT | 6458 101% | 6265 104% | 7047 92% | 6545 99% | 7462 87% | 6230 104% |
| Media total (Programa/Opciones) | -22% /
-29% | 25% /
16% | 25% /
22% | -243% /
-151% | -191% /
-155% |
* ... más pequeño es mejor
No del todo perfecta en los tonos muy oscuros, la pantalla no cubre completamente el espacio de color sRGB, aunque el 99,7% también es completamente suficiente. Lo mismo puede decirse del espacio de color AdobeRGB, que está cubierto en casi un 96%. Aquí, el VivoBook Pro 16X también está claramente por delante delAsus Studiobook 16que sólo alcanza el 89% en AdobeRGB, según nuestras mediciones.
Con un DeltaE medio inferior a 2, la reproducción del color es casi natural. Ni siquiera los ojos entrenados son capaces de notar la diferencia. Esto se aplica sin más calibraciones, que no aportaron ninguna mejora. En vista de las desviaciones mínimas, esto es innecesario de todos modos.
Tiempos de respuesta del display
| ↔ Tiempo de respuesta de Negro a Blanco | ||
|---|---|---|
| 1.4 ms ... subida ↗ y bajada ↘ combinada | ↗ 0.6 ms subida | 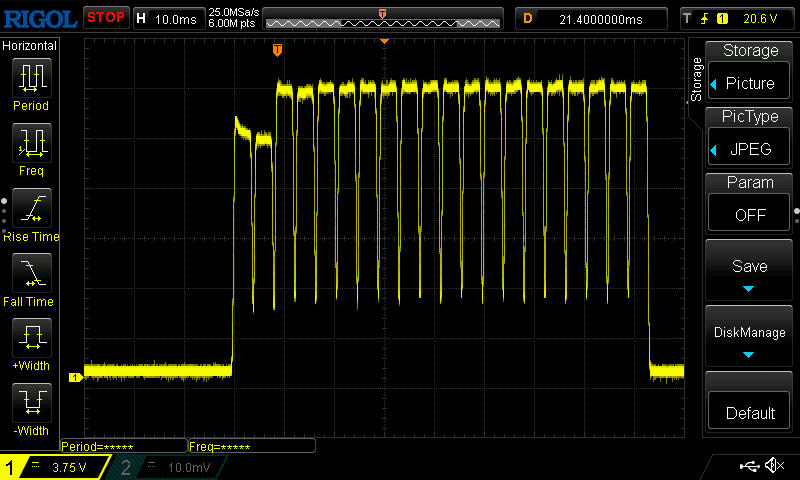 |
| ↘ 0.8 ms bajada | ||
| La pantalla mostró tiempos de respuesta muy rápidos en nuestros tests y debería ser adecuada para juegos frenéticos. En comparación, todos los dispositivos de prueba van de ##min### (mínimo) a 240 (máximo) ms. » 8 % de todos los dispositivos son mejores. Esto quiere decir que el tiempo de respuesta medido es mejor que la media (19.8 ms) de todos los dispositivos testados. | ||
| ↔ Tiempo de respuesta 50% Gris a 80% Gris | ||
| 1.6 ms ... subida ↗ y bajada ↘ combinada | ↗ 0.8 ms subida | 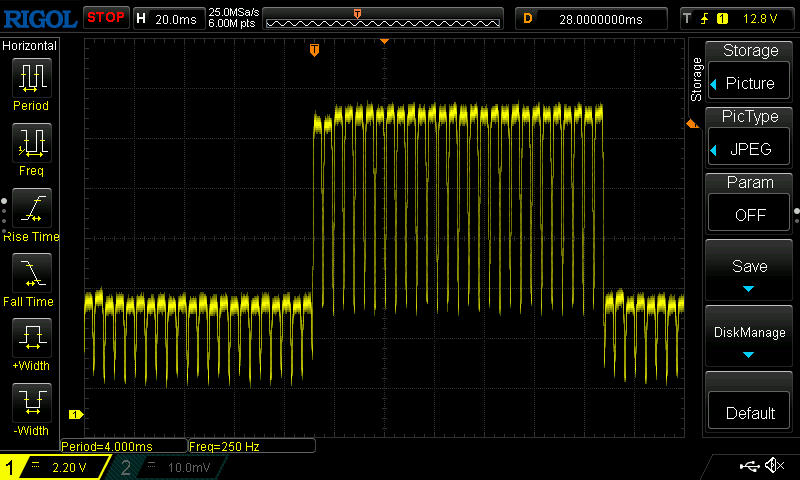 |
| ↘ 0.8 ms bajada | ||
| La pantalla mostró tiempos de respuesta muy rápidos en nuestros tests y debería ser adecuada para juegos frenéticos. En comparación, todos los dispositivos de prueba van de ##min### (mínimo) a 636 (máximo) ms. » 8 % de todos los dispositivos son mejores. Esto quiere decir que el tiempo de respuesta medido es mejor que la media (31 ms) de todos los dispositivos testados. | ||
Parpadeo de Pantalla / PWM (Pulse-Width Modulation)
| Parpadeo de Pantalla / PWM detectado | 120 Hz | ≤ 100 % de brillo |  |
La retroiluminación del display parpadea a 120 Hz (seguramente usa PWM - Pulse-Width Modulation) a un brillo del 100 % e inferior. Sobre este nivel de brillo no debería darse parpadeo / PWM. La frecuencia de 120 Hz es bajísima, por lo que el parpadeo puede causar fatiga visual y cefaleas cuando se usa mucho tiempo. Comparación: 52 % de todos los dispositivos testados no usaron PWM para atenuar el display. Si se usó, medimos una media de 7754 (mínimo: 5 - máxmo: 343500) Hz. | |||


En particular, la superficie brillante de la pantalla hace que los reflejos dificulten mucho la legibilidad en un entorno luminoso y la hagan casi imposible a la luz del sol. Por otro lado, puedes trabajar con el VivoBook Pro en exteriores siempre que te sientes a la sombra. Pero deberías sentarte en interiores para la edición de imágenes.
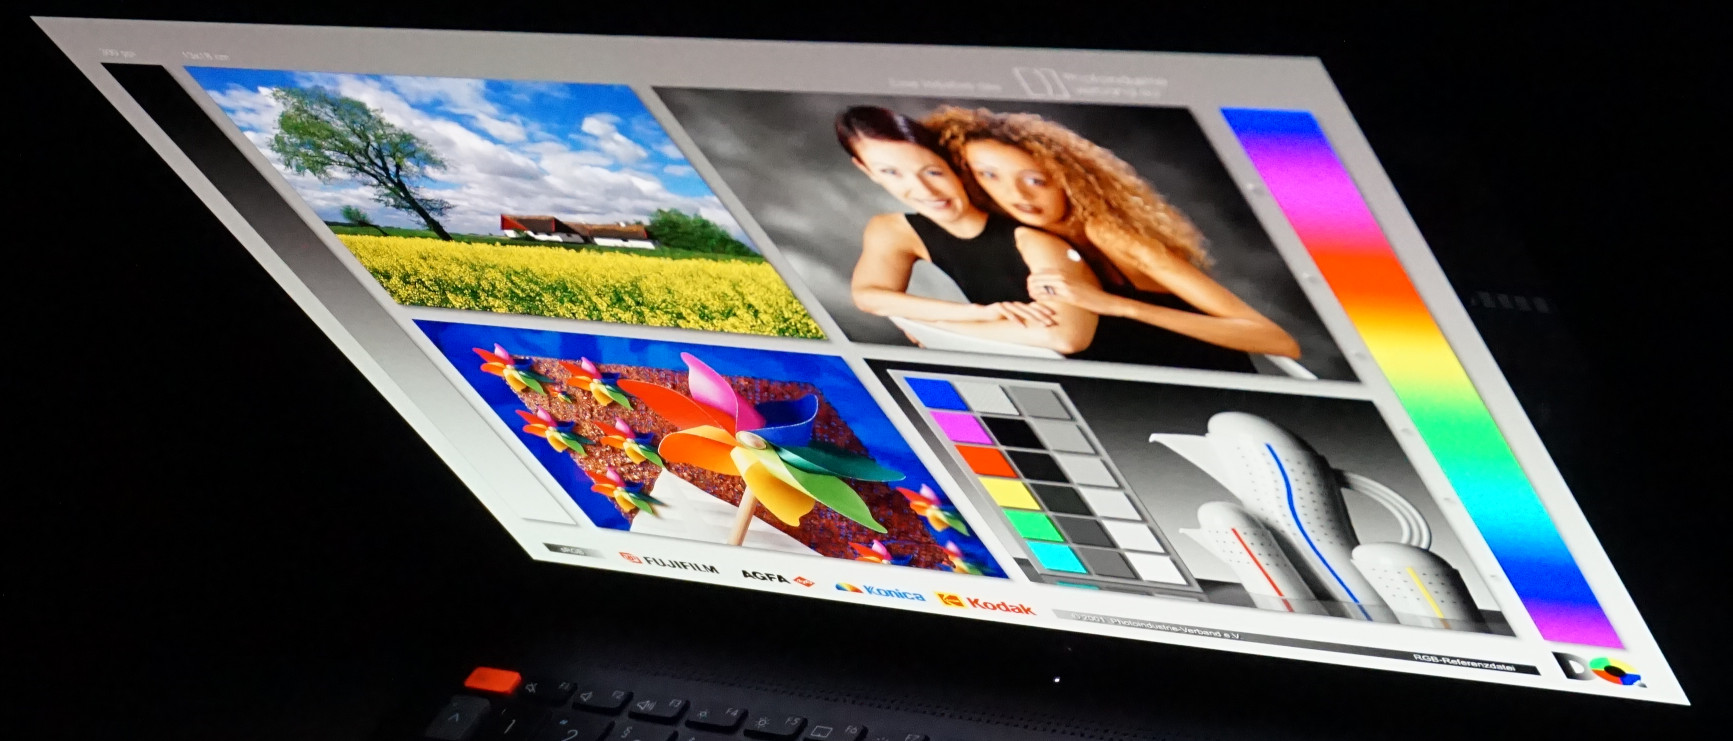
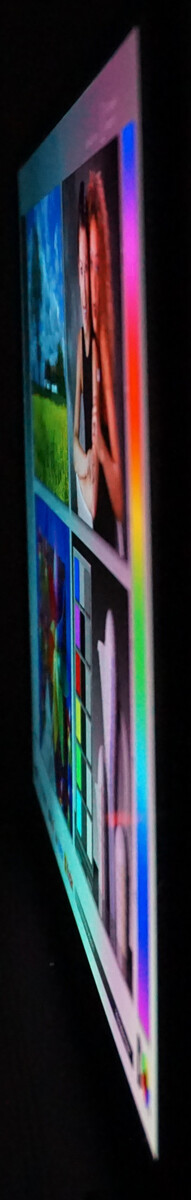
Como cabe esperar de un panel OLED, el brillo y la reproducción del color se mantienen estables desde todos los ángulos de visión normales. También son típicas de los OLED las desviaciones de color significativas en un ángulo muy pronunciado de más de 80°.
Rendimiento - Velocidad de trabajo en el VivoBook al máximo
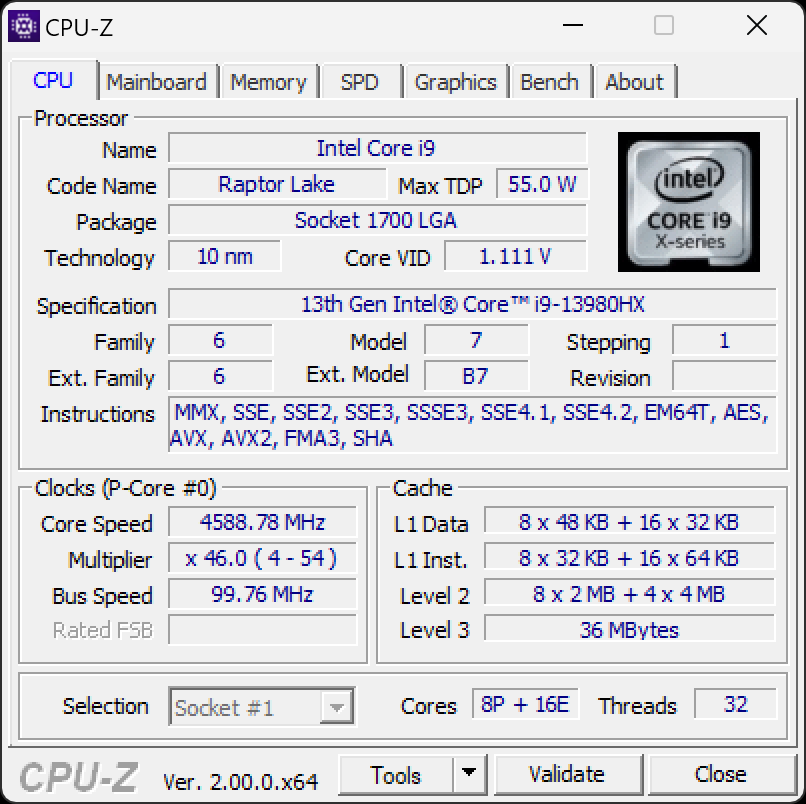
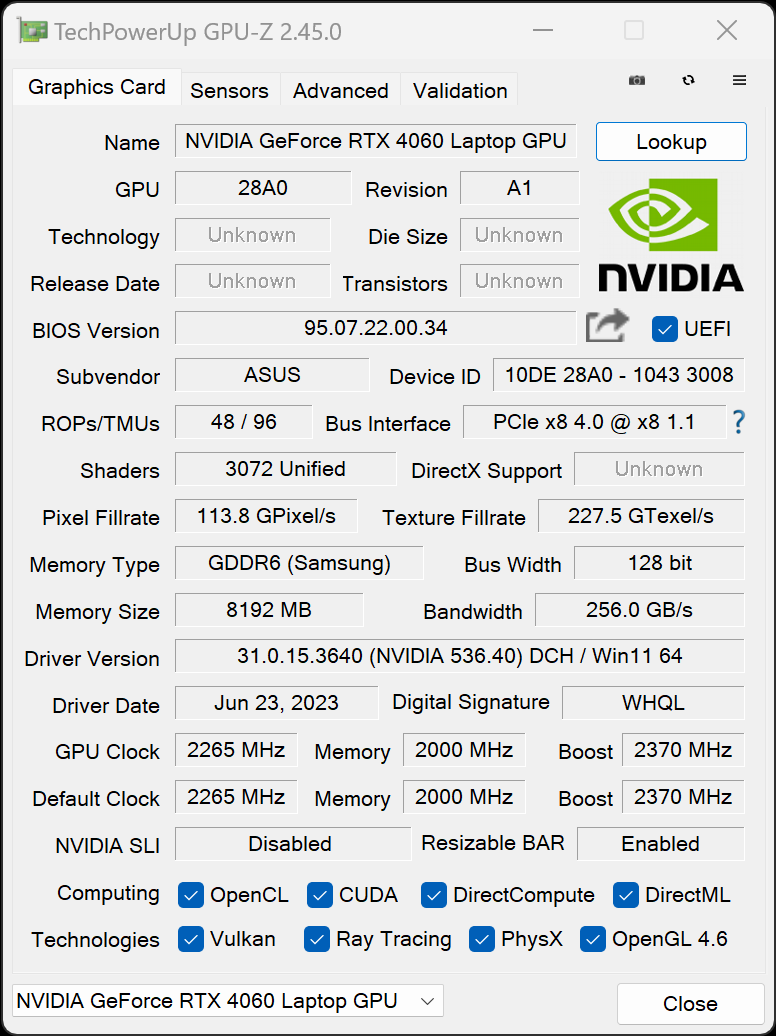
Nuestra muy buena impresión general se debe principalmente alIntel Core i9-13980HXuno de los mejores procesadores móviles del momento. La opción Nvidia GeForce RTX 4060opcional, como en nuestra unidad de prueba, o la RTX 4070están pensados principalmente para acelerar el procesamiento de imágenes, la edición de vídeo, el renderizado y, por supuesto, las aplicaciones 3D.
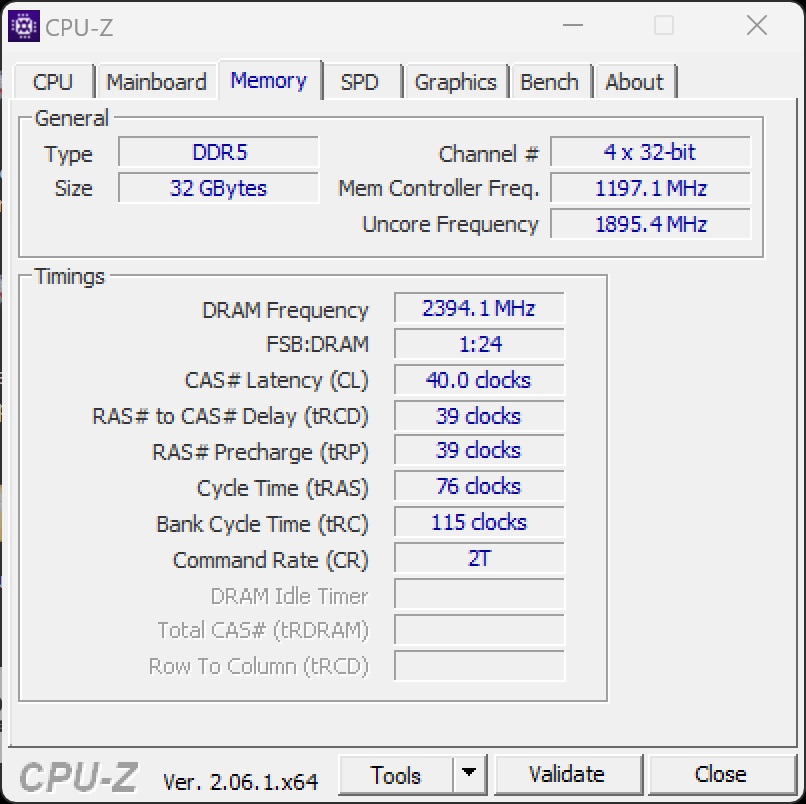
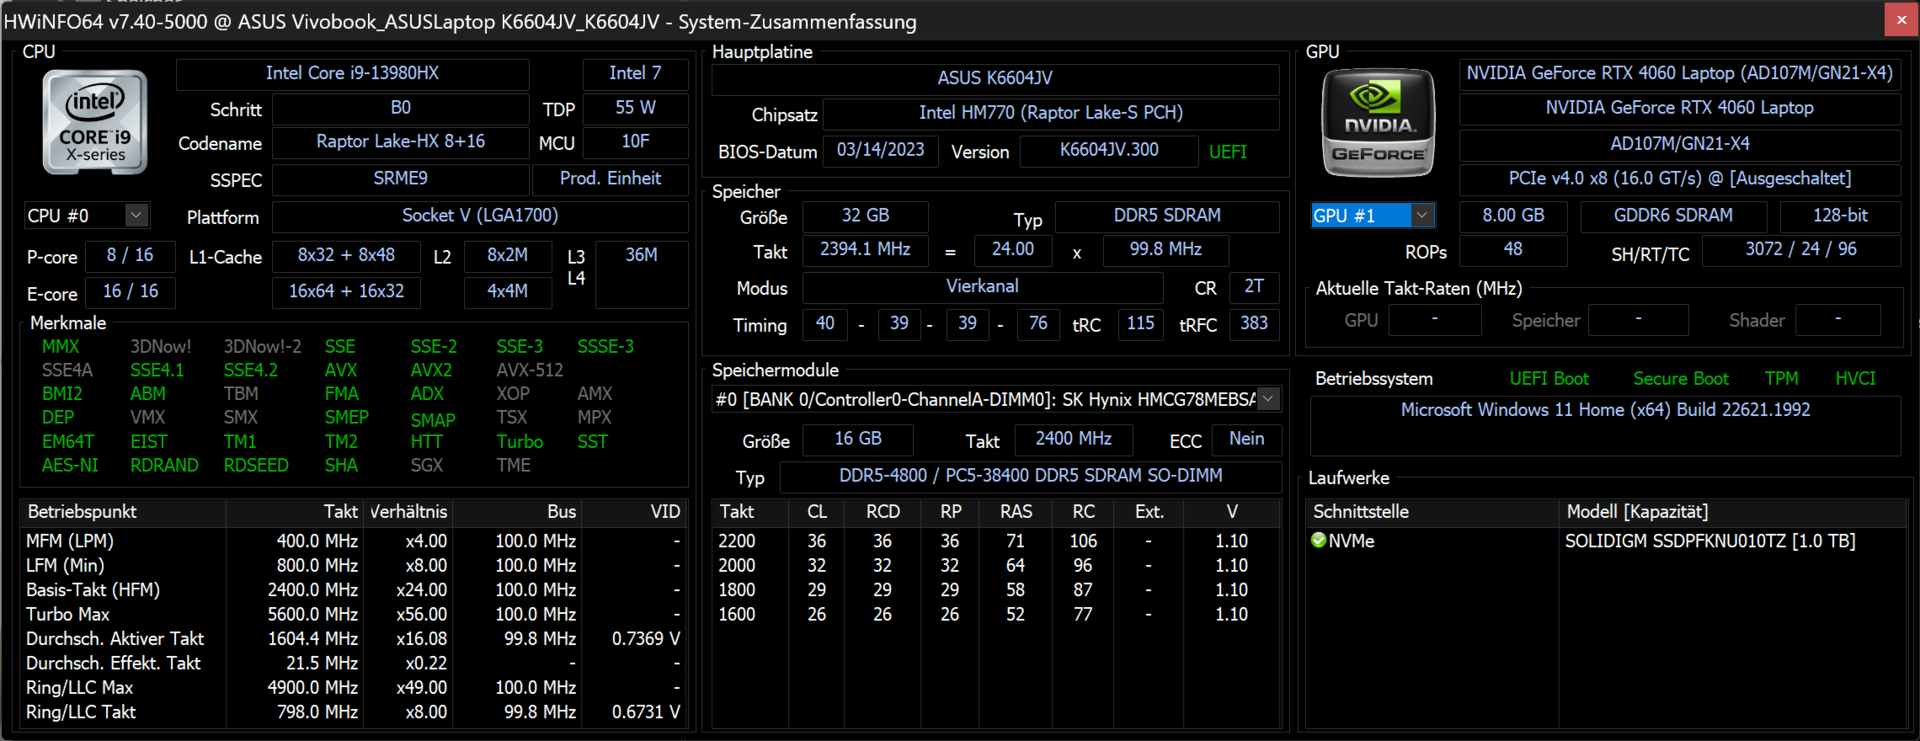
El Asus VivoBook Pro 16X impresiona por su enorme velocidad de trabajo. Maneja aplicaciones complejas y gráficamente exigentes sin esfuerzo y le gusta la multitarea. 32 GB de RAM, que no agota el reloj máximo posible de 5.600 MHz, sino 4.800 MHz, complementan bien el sistema.
Condiciones de ensayo
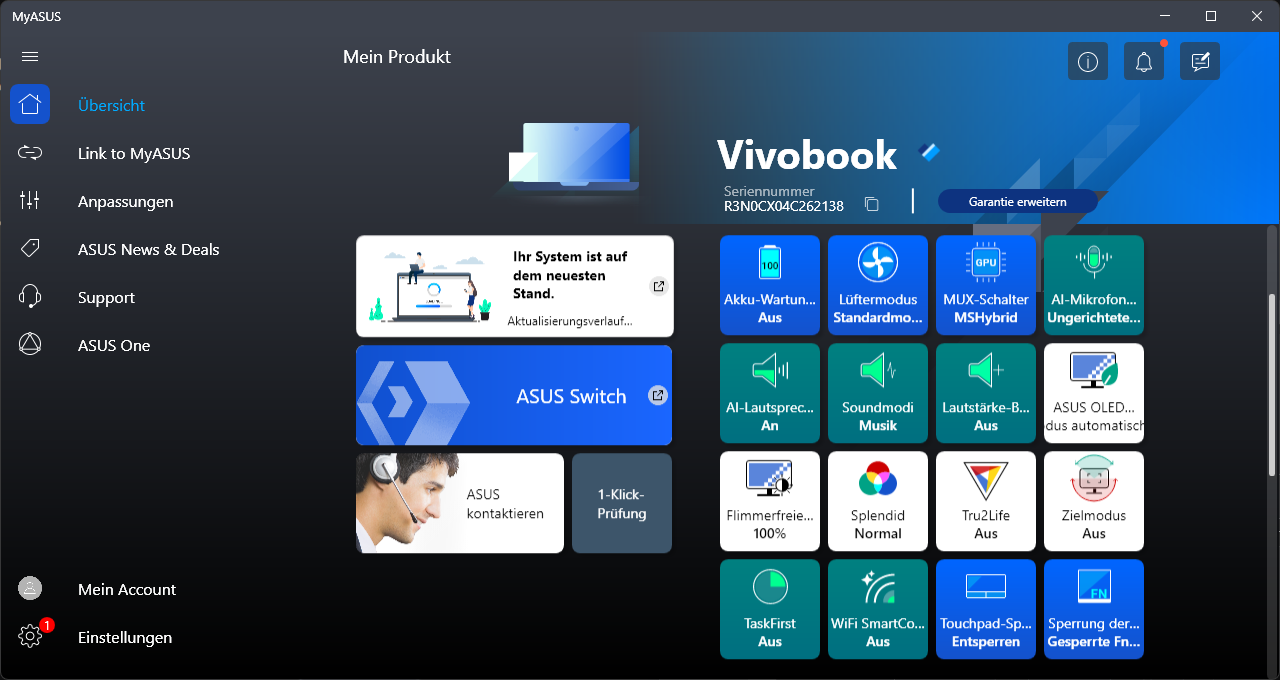
Las opciones de configuración del VivoBook Pro 16X se limitan a tres modos. Máximo rendimiento también resulta en el máximo ruido del ventilador, mientras que la ganancia de rendimiento es notable en situaciones extremas, pero sólo juegan un papel subordinado en el trabajo diario.
Por esta razón, para todas las pruebas se utilizó el modo "Estándar", en el que se reduce ligeramente la alimentación del procesador y la tarjeta gráfica. Además, se añade "Silencioso" como complemento. Aquí, la atención se centra en el trabajo casi silencioso, por lo que el máximo rendimiento informático posible siempre tiene que reducirse tras cargas cortas. No obstante, no registramos ninguna ralentización grave en modo Estándar .
El consumo máximo de energía de la CPU y la GPU, así como el ruido del ventilador medido se resumen en la siguiente tabla.
| Perfil energético | Carga de la CPU | Carga de la GPU | Volumen máx. del ventilador |
|---|---|---|---|
| Estándar | 157/80 vatios | 90 vatios | 37,0 dB(A) |
| Rendimiento | 157/157 vatios | 115 vatios | 56,7 dB(A) |
| Silencioso | 105/55 vatios | 80 vatios | 29,2 dB(A) |
Procesador
No hay muchos portátiles que superen al Asus VivoBook Pro con su Intel Core i9-13980HXen términos de potencia de cálculo pura. Portátiles más grandes y pesados para juegos como el Lenovo Legion Pro 7 o el Asus ROG Strix G17 están a la par o mejor gracias al AMD Ryzen 9 7945HX. Con 8 núcleos de rendimiento y un total de 32 hilos, una velocidad de reloj máxima de 5,6 GHz y un controlador externo, el i9-13980HX está ciertamente bien equipado.
En Asus ProArt Studiobook 16 también está al mismo nivel siempre que se configure el modo Rendimiento . Y esto a pesar del hecho de que el VivoBook "sólo" puede consumir 157 W en vez de 170 W. Nuestros benchmarks son a menudo 10% mejores. Debido al significativo aumento de potencia del ventilador, los valores de rendimiento sostenido también son ligeramente mejores, como puede verse claramente en el bucle Cinebench R15. Los valores para Estándar y Rendimiento están en el diagrama.
En modo Estándar con ruido de ventilador moderado, los valores medidos son más débiles, pero siguen siendo excelentes. Portátiles multimedia de posición similar con CPUs más pequeñas como elIntel Core i7-13700H son claramente superados. Esto se refleja en la evaluación de varios benchmarks de CPU, donde hay una clara brecha con el VivoBook.
En modo silencioso , la CPU se ralentiza relativamente rápido porque de otro modo se calentaría demasiado debido a la refrigeración reducida. Cuando se desenchufa, se produce una caída significativa del rendimiento. Por ejemplo, se alcanzan algo menos de 11.000 puntos en la prueba multinúcleo Cinebench R23. Esto es algo menos de un tercio de la puntuación en modo estándar , pero no está lejos de la media de todos los portátiles multimedia que hemos analizado en los últimos 2 años.
Puedes encontrar más pruebas e información en nuestra Lista de pruebas de CPU.
Cinebench R15 Multi Sustained Load
Cinebench R23: Multi Core | Single Core
Cinebench R20: CPU (Multi Core) | CPU (Single Core)
Cinebench R15: CPU Multi 64Bit | CPU Single 64Bit
Blender: v2.79 BMW27 CPU
7-Zip 18.03: 7z b 4 | 7z b 4 -mmt1
Geekbench 5.5: Multi-Core | Single-Core
HWBOT x265 Benchmark v2.2: 4k Preset
LibreOffice : 20 Documents To PDF
R Benchmark 2.5: Overall mean
| CPU Performance rating | |
| Asus ProArt Studiobook 16 OLED H7604 | |
| Medio Intel Core i9-13980HX | |
| Asus Vivobook Pro 16X K6604JV-MX016W | |
| MSI Creator Z17 A12UGST-054 | |
| Dell XPS 15 9530 RTX 4070 | |
| Media de la clase Multimedia | |
| Schenker VISION 16 Pro (M23) | |
| Samsung Galaxy Book3 Ultra 16 | |
| Cinebench R23 / Multi Core | |
| Asus ProArt Studiobook 16 OLED H7604 | |
| Medio Intel Core i9-13980HX (28301 - 33052, n=11) | |
| Asus Vivobook Pro 16X K6604JV-MX016W | |
| Media de la clase Multimedia (4861 - 33362, n=74, últimos 2 años) | |
| MSI Creator Z17 A12UGST-054 | |
| Dell XPS 15 9530 RTX 4070 | |
| Samsung Galaxy Book3 Ultra 16 | |
| Schenker VISION 16 Pro (M23) | |
| Cinebench R23 / Single Core | |
| Asus ProArt Studiobook 16 OLED H7604 | |
| Medio Intel Core i9-13980HX (1825 - 2169, n=9) | |
| Media de la clase Multimedia (1128 - 2459, n=66, últimos 2 años) | |
| Schenker VISION 16 Pro (M23) | |
| MSI Creator Z17 A12UGST-054 | |
| Dell XPS 15 9530 RTX 4070 | |
| Asus Vivobook Pro 16X K6604JV-MX016W | |
| Samsung Galaxy Book3 Ultra 16 | |
| Cinebench R20 / CPU (Multi Core) | |
| Asus ProArt Studiobook 16 OLED H7604 | |
| Medio Intel Core i9-13980HX (10353 - 12437, n=10) | |
| Asus Vivobook Pro 16X K6604JV-MX016W | |
| Media de la clase Multimedia (1887 - 12912, n=57, últimos 2 años) | |
| MSI Creator Z17 A12UGST-054 | |
| Dell XPS 15 9530 RTX 4070 | |
| Samsung Galaxy Book3 Ultra 16 | |
| Schenker VISION 16 Pro (M23) | |
| Cinebench R20 / CPU (Single Core) | |
| Asus ProArt Studiobook 16 OLED H7604 | |
| Medio Intel Core i9-13980HX (717 - 825, n=10) | |
| Media de la clase Multimedia (425 - 853, n=57, últimos 2 años) | |
| Schenker VISION 16 Pro (M23) | |
| Asus Vivobook Pro 16X K6604JV-MX016W | |
| MSI Creator Z17 A12UGST-054 | |
| Dell XPS 15 9530 RTX 4070 | |
| Samsung Galaxy Book3 Ultra 16 | |
| Cinebench R15 / CPU Multi 64Bit | |
| Medio Intel Core i9-13980HX (4358 - 5172, n=11) | |
| Asus Vivobook Pro 16X K6604JV-MX016W | |
| Asus ProArt Studiobook 16 OLED H7604 | |
| Dell XPS 15 9530 RTX 4070 | |
| MSI Creator Z17 A12UGST-054 | |
| Media de la clase Multimedia (856 - 5224, n=61, últimos 2 años) | |
| Samsung Galaxy Book3 Ultra 16 | |
| Schenker VISION 16 Pro (M23) | |
| Cinebench R15 / CPU Single 64Bit | |
| Asus ProArt Studiobook 16 OLED H7604 | |
| Medio Intel Core i9-13980HX (289 - 312, n=11) | |
| Asus Vivobook Pro 16X K6604JV-MX016W | |
| Media de la clase Multimedia (184.8 - 326, n=59, últimos 2 años) | |
| Schenker VISION 16 Pro (M23) | |
| Dell XPS 15 9530 RTX 4070 | |
| MSI Creator Z17 A12UGST-054 | |
| Samsung Galaxy Book3 Ultra 16 | |
| Blender / v2.79 BMW27 CPU | |
| Media de la clase Multimedia (100 - 557, n=58, últimos 2 años) | |
| Schenker VISION 16 Pro (M23) | |
| Samsung Galaxy Book3 Ultra 16 | |
| Dell XPS 15 9530 RTX 4070 | |
| MSI Creator Z17 A12UGST-054 | |
| Asus Vivobook Pro 16X K6604JV-MX016W | |
| Medio Intel Core i9-13980HX (97 - 136, n=10) | |
| Asus ProArt Studiobook 16 OLED H7604 | |
| 7-Zip 18.03 / 7z b 4 | |
| Asus ProArt Studiobook 16 OLED H7604 | |
| Medio Intel Core i9-13980HX (104616 - 129804, n=10) | |
| Asus Vivobook Pro 16X K6604JV-MX016W | |
| MSI Creator Z17 A12UGST-054 | |
| Schenker VISION 16 Pro (M23) | |
| Samsung Galaxy Book3 Ultra 16 | |
| Dell XPS 15 9530 RTX 4070 | |
| Media de la clase Multimedia (26062 - 130368, n=55, últimos 2 años) | |
| 7-Zip 18.03 / 7z b 4 -mmt1 | |
| Asus ProArt Studiobook 16 OLED H7604 | |
| Asus Vivobook Pro 16X K6604JV-MX016W | |
| Medio Intel Core i9-13980HX (6230 - 7163, n=10) | |
| Schenker VISION 16 Pro (M23) | |
| Dell XPS 15 9530 RTX 4070 | |
| Media de la clase Multimedia (3666 - 7545, n=56, últimos 2 años) | |
| MSI Creator Z17 A12UGST-054 | |
| Samsung Galaxy Book3 Ultra 16 | |
| Geekbench 5.5 / Multi-Core | |
| Medio Intel Core i9-13980HX (18475 - 22200, n=10) | |
| Asus ProArt Studiobook 16 OLED H7604 | |
| Asus Vivobook Pro 16X K6604JV-MX016W | |
| MSI Creator Z17 A12UGST-054 | |
| Dell XPS 15 9530 RTX 4070 | |
| Media de la clase Multimedia (4652 - 20422, n=56, últimos 2 años) | |
| Schenker VISION 16 Pro (M23) | |
| Samsung Galaxy Book3 Ultra 16 | |
| Geekbench 5.5 / Single-Core | |
| Asus ProArt Studiobook 16 OLED H7604 | |
| Medio Intel Core i9-13980HX (1796 - 2139, n=10) | |
| Asus Vivobook Pro 16X K6604JV-MX016W | |
| Media de la clase Multimedia (805 - 2974, n=56, últimos 2 años) | |
| Dell XPS 15 9530 RTX 4070 | |
| Schenker VISION 16 Pro (M23) | |
| MSI Creator Z17 A12UGST-054 | |
| Samsung Galaxy Book3 Ultra 16 | |
| HWBOT x265 Benchmark v2.2 / 4k Preset | |
| Medio Intel Core i9-13980HX (27 - 33.4, n=9) | |
| Asus ProArt Studiobook 16 OLED H7604 | |
| Asus Vivobook Pro 16X K6604JV-MX016W | |
| Media de la clase Multimedia (5.26 - 36.1, n=56, últimos 2 años) | |
| MSI Creator Z17 A12UGST-054 | |
| Dell XPS 15 9530 RTX 4070 | |
| Samsung Galaxy Book3 Ultra 16 | |
| Schenker VISION 16 Pro (M23) | |
| LibreOffice / 20 Documents To PDF | |
| Asus Vivobook Pro 16X K6604JV-MX016W | |
| Media de la clase Multimedia (23.9 - 146.7, n=57, últimos 2 años) | |
| Samsung Galaxy Book3 Ultra 16 | |
| Schenker VISION 16 Pro (M23) | |
| Asus ProArt Studiobook 16 OLED H7604 | |
| Dell XPS 15 9530 RTX 4070 | |
| Medio Intel Core i9-13980HX (35 - 51.4, n=10) | |
| MSI Creator Z17 A12UGST-054 | |
| R Benchmark 2.5 / Overall mean | |
| Samsung Galaxy Book3 Ultra 16 | |
| Media de la clase Multimedia (0.3604 - 0.947, n=56, últimos 2 años) | |
| MSI Creator Z17 A12UGST-054 | |
| Dell XPS 15 9530 RTX 4070 | |
| Schenker VISION 16 Pro (M23) | |
| Asus Vivobook Pro 16X K6604JV-MX016W | |
| Medio Intel Core i9-13980HX (0.3793 - 0.4462, n=10) | |
| Asus ProArt Studiobook 16 OLED H7604 | |
* ... más pequeño es mejor
AIDA64: FP32 Ray-Trace | FPU Julia | CPU SHA3 | CPU Queen | FPU SinJulia | FPU Mandel | CPU AES | CPU ZLib | FP64 Ray-Trace | CPU PhotoWorxx
| Performance rating | |
| Asus ProArt Studiobook 16 OLED H7604 | |
| Medio Intel Core i9-13980HX | |
| Asus Vivobook Pro 16X K6604JV-MX016W | |
| Media de la clase Multimedia | |
| Samsung Galaxy Book3 Ultra 16 | |
| Schenker VISION 16 Pro (M23) | |
| Dell XPS 15 9530 RTX 4070 | |
| MSI Creator Z17 A12UGST-054 | |
| AIDA64 / FP32 Ray-Trace | |
| Asus ProArt Studiobook 16 OLED H7604 | |
| Medio Intel Core i9-13980HX (21332 - 29553, n=9) | |
| Asus Vivobook Pro 16X K6604JV-MX016W | |
| Media de la clase Multimedia (2214 - 50388, n=53, últimos 2 años) | |
| Samsung Galaxy Book3 Ultra 16 | |
| Dell XPS 15 9530 RTX 4070 | |
| Schenker VISION 16 Pro (M23) | |
| MSI Creator Z17 A12UGST-054 | |
| AIDA64 / FPU Julia | |
| Asus ProArt Studiobook 16 OLED H7604 | |
| Medio Intel Core i9-13980HX (108001 - 148168, n=9) | |
| Asus Vivobook Pro 16X K6604JV-MX016W | |
| Media de la clase Multimedia (12867 - 201874, n=54, últimos 2 años) | |
| Schenker VISION 16 Pro (M23) | |
| Samsung Galaxy Book3 Ultra 16 | |
| Dell XPS 15 9530 RTX 4070 | |
| MSI Creator Z17 A12UGST-054 | |
| AIDA64 / CPU SHA3 | |
| Asus ProArt Studiobook 16 OLED H7604 | |
| Medio Intel Core i9-13980HX (5264 - 7142, n=9) | |
| Asus Vivobook Pro 16X K6604JV-MX016W | |
| Media de la clase Multimedia (626 - 8623, n=54, últimos 2 años) | |
| Samsung Galaxy Book3 Ultra 16 | |
| Schenker VISION 16 Pro (M23) | |
| Dell XPS 15 9530 RTX 4070 | |
| MSI Creator Z17 A12UGST-054 | |
| AIDA64 / CPU Queen | |
| Medio Intel Core i9-13980HX (126758 - 143409, n=9) | |
| Asus ProArt Studiobook 16 OLED H7604 | |
| Asus Vivobook Pro 16X K6604JV-MX016W | |
| MSI Creator Z17 A12UGST-054 | |
| Dell XPS 15 9530 RTX 4070 | |
| Samsung Galaxy Book3 Ultra 16 | |
| Schenker VISION 16 Pro (M23) | |
| Media de la clase Multimedia (13483 - 181505, n=41, últimos 2 años) | |
| AIDA64 / FPU SinJulia | |
| Medio Intel Core i9-13980HX (13785 - 17117, n=9) | |
| Asus ProArt Studiobook 16 OLED H7604 | |
| Asus Vivobook Pro 16X K6604JV-MX016W | |
| MSI Creator Z17 A12UGST-054 | |
| Samsung Galaxy Book3 Ultra 16 | |
| Schenker VISION 16 Pro (M23) | |
| Media de la clase Multimedia (886 - 28794, n=54, últimos 2 años) | |
| Dell XPS 15 9530 RTX 4070 | |
| AIDA64 / FPU Mandel | |
| Asus ProArt Studiobook 16 OLED H7604 | |
| Medio Intel Core i9-13980HX (53398 - 73758, n=9) | |
| Asus Vivobook Pro 16X K6604JV-MX016W | |
| Media de la clase Multimedia (6395 - 105740, n=53, últimos 2 años) | |
| Samsung Galaxy Book3 Ultra 16 | |
| Dell XPS 15 9530 RTX 4070 | |
| Schenker VISION 16 Pro (M23) | |
| MSI Creator Z17 A12UGST-054 | |
| AIDA64 / CPU AES | |
| Asus ProArt Studiobook 16 OLED H7604 | |
| Medio Intel Core i9-13980HX (105169 - 136520, n=9) | |
| Asus Vivobook Pro 16X K6604JV-MX016W | |
| MSI Creator Z17 A12UGST-054 | |
| Samsung Galaxy Book3 Ultra 16 | |
| Schenker VISION 16 Pro (M23) | |
| Media de la clase Multimedia (8171 - 126790, n=54, últimos 2 años) | |
| Dell XPS 15 9530 RTX 4070 | |
| AIDA64 / CPU ZLib | |
| Asus ProArt Studiobook 16 OLED H7604 | |
| Medio Intel Core i9-13980HX (1513 - 2039, n=9) | |
| Asus Vivobook Pro 16X K6604JV-MX016W | |
| Samsung Galaxy Book3 Ultra 16 | |
| Media de la clase Multimedia (143.8 - 2022, n=54, últimos 2 años) | |
| MSI Creator Z17 A12UGST-054 | |
| Schenker VISION 16 Pro (M23) | |
| Dell XPS 15 9530 RTX 4070 | |
| AIDA64 / FP64 Ray-Trace | |
| Medio Intel Core i9-13980HX (11431 - 16325, n=9) | |
| Asus ProArt Studiobook 16 OLED H7604 | |
| Asus Vivobook Pro 16X K6604JV-MX016W | |
| Media de la clase Multimedia (1014 - 26875, n=54, últimos 2 años) | |
| Samsung Galaxy Book3 Ultra 16 | |
| Dell XPS 15 9530 RTX 4070 | |
| Schenker VISION 16 Pro (M23) | |
| MSI Creator Z17 A12UGST-054 | |
| AIDA64 / CPU PhotoWorxx | |
| Media de la clase Multimedia (8187 - 88154, n=54, últimos 2 años) | |
| Asus ProArt Studiobook 16 OLED H7604 | |
| Samsung Galaxy Book3 Ultra 16 | |
| Medio Intel Core i9-13980HX (37069 - 52949, n=9) | |
| Schenker VISION 16 Pro (M23) | |
| Dell XPS 15 9530 RTX 4070 | |
| Asus Vivobook Pro 16X K6604JV-MX016W | |
| MSI Creator Z17 A12UGST-054 | |
Rendimiento del sistema

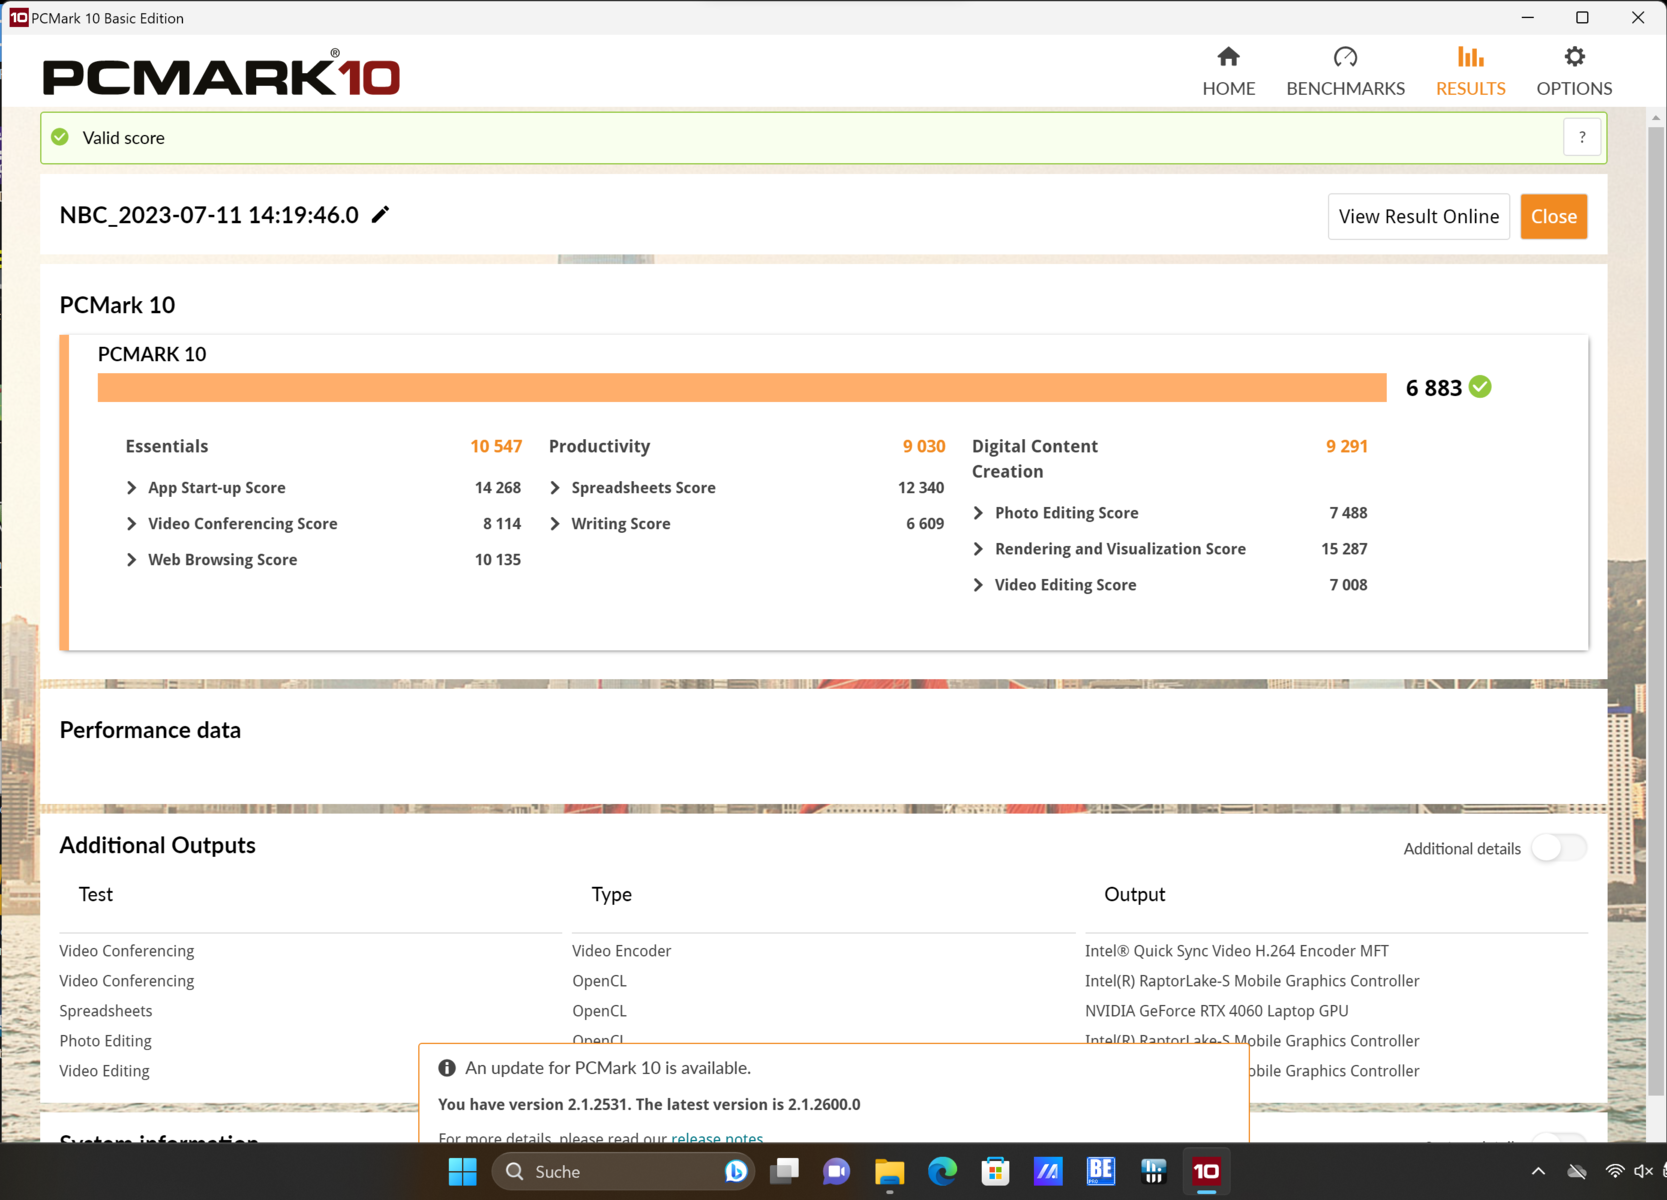
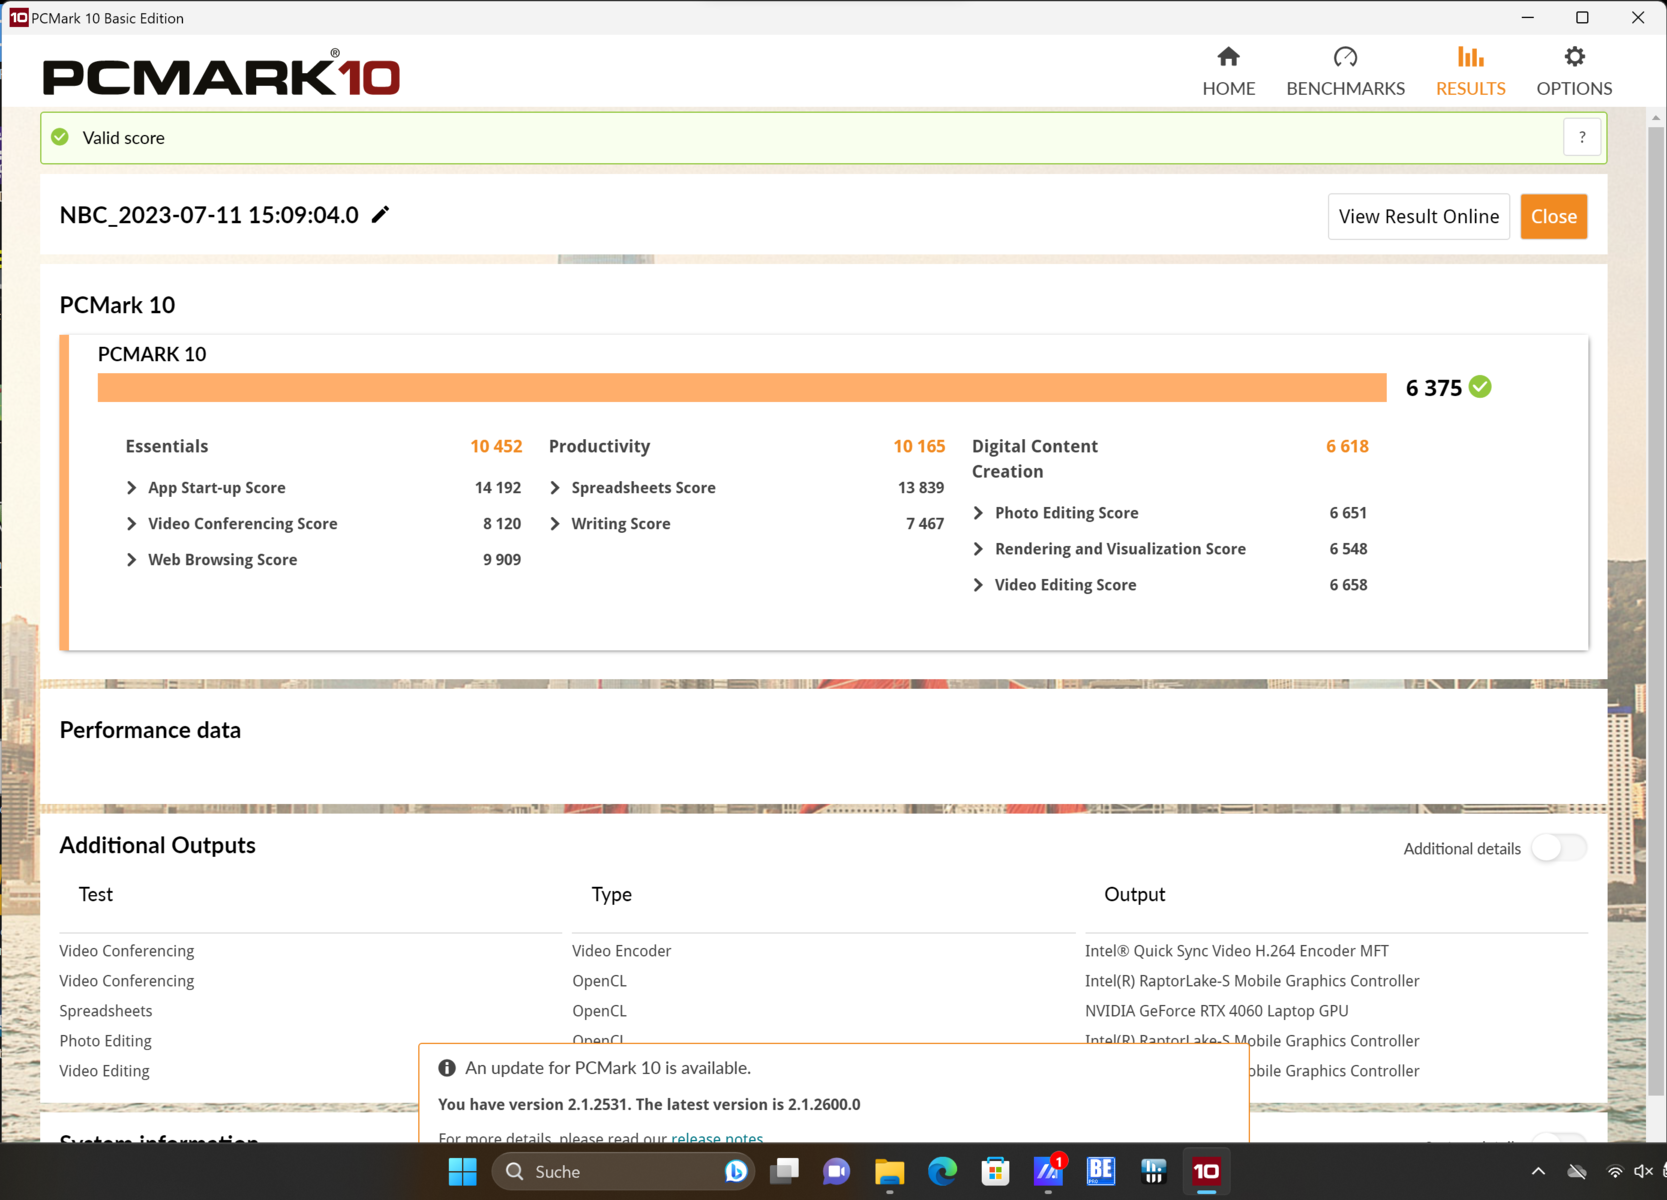
En contraste con las pruebas puras de CPU, la puntuación con PCMark 10 es un poco más débil. Sin embargo, si se selecciona el modo Rendimiento aquí, sólo hay una pequeña brecha con los mejores modelos. En CrossMark, el portátil Asus está muy por delante, incluso en la configuración estándar.
En general, el Vivobook Pro es consistentemente rápido. Las aplicaciones exigentes no lo agotan por completo, por lo que el portátil siempre permanece usable. Instalaciones, arranques paralelos de programas y similares no suponen un problema.
CrossMark: Overall | Productivity | Creativity | Responsiveness
| PCMark 10 / Score | |
| Media de la clase Multimedia (4325 - 10386, n=52, últimos 2 años) | |
| Asus ProArt Studiobook 16 OLED H7604 | |
| Schenker VISION 16 Pro (M23) | |
| Dell XPS 15 9530 RTX 4070 | |
| MSI Creator Z17 A12UGST-054 | |
| Asus Vivobook Pro 16X K6604JV-MX016W | |
| Medio Intel Core i9-13980HX, NVIDIA GeForce RTX 4060 Laptop GPU (n=1) | |
| Samsung Galaxy Book3 Ultra 16 | |
| PCMark 10 / Essentials | |
| Dell XPS 15 9530 RTX 4070 | |
| Asus ProArt Studiobook 16 OLED H7604 | |
| Schenker VISION 16 Pro (M23) | |
| Asus Vivobook Pro 16X K6604JV-MX016W | |
| Medio Intel Core i9-13980HX, NVIDIA GeForce RTX 4060 Laptop GPU (n=1) | |
| Samsung Galaxy Book3 Ultra 16 | |
| Media de la clase Multimedia (8025 - 11664, n=51, últimos 2 años) | |
| MSI Creator Z17 A12UGST-054 | |
| PCMark 10 / Productivity | |
| Media de la clase Multimedia (7323 - 18233, n=51, últimos 2 años) | |
| Asus ProArt Studiobook 16 OLED H7604 | |
| Schenker VISION 16 Pro (M23) | |
| MSI Creator Z17 A12UGST-054 | |
| Asus Vivobook Pro 16X K6604JV-MX016W | |
| Medio Intel Core i9-13980HX, NVIDIA GeForce RTX 4060 Laptop GPU (n=1) | |
| Samsung Galaxy Book3 Ultra 16 | |
| Dell XPS 15 9530 RTX 4070 | |
| PCMark 10 / Digital Content Creation | |
| Schenker VISION 16 Pro (M23) | |
| Dell XPS 15 9530 RTX 4070 | |
| Asus ProArt Studiobook 16 OLED H7604 | |
| Media de la clase Multimedia (3651 - 16240, n=51, últimos 2 años) | |
| MSI Creator Z17 A12UGST-054 | |
| Samsung Galaxy Book3 Ultra 16 | |
| Asus Vivobook Pro 16X K6604JV-MX016W | |
| Medio Intel Core i9-13980HX, NVIDIA GeForce RTX 4060 Laptop GPU (n=1) | |
| CrossMark / Overall | |
| Asus ProArt Studiobook 16 OLED H7604 | |
| Asus Vivobook Pro 16X K6604JV-MX016W | |
| Medio Intel Core i9-13980HX, NVIDIA GeForce RTX 4060 Laptop GPU (n=1) | |
| MSI Creator Z17 A12UGST-054 | |
| Schenker VISION 16 Pro (M23) | |
| Dell XPS 15 9530 RTX 4070 | |
| Media de la clase Multimedia (866 - 2728, n=60, últimos 2 años) | |
| Samsung Galaxy Book3 Ultra 16 | |
| CrossMark / Productivity | |
| Asus ProArt Studiobook 16 OLED H7604 | |
| Asus Vivobook Pro 16X K6604JV-MX016W | |
| Medio Intel Core i9-13980HX, NVIDIA GeForce RTX 4060 Laptop GPU (n=1) | |
| MSI Creator Z17 A12UGST-054 | |
| Schenker VISION 16 Pro (M23) | |
| Media de la clase Multimedia (931 - 2489, n=60, últimos 2 años) | |
| Dell XPS 15 9530 RTX 4070 | |
| Samsung Galaxy Book3 Ultra 16 | |
| CrossMark / Creativity | |
| Asus ProArt Studiobook 16 OLED H7604 | |
| Asus Vivobook Pro 16X K6604JV-MX016W | |
| Medio Intel Core i9-13980HX, NVIDIA GeForce RTX 4060 Laptop GPU (n=1) | |
| Media de la clase Multimedia (907 - 3465, n=60, últimos 2 años) | |
| MSI Creator Z17 A12UGST-054 | |
| Dell XPS 15 9530 RTX 4070 | |
| Schenker VISION 16 Pro (M23) | |
| Samsung Galaxy Book3 Ultra 16 | |
| CrossMark / Responsiveness | |
| MSI Creator Z17 A12UGST-054 | |
| Asus ProArt Studiobook 16 OLED H7604 | |
| Schenker VISION 16 Pro (M23) | |
| Asus Vivobook Pro 16X K6604JV-MX016W | |
| Medio Intel Core i9-13980HX, NVIDIA GeForce RTX 4060 Laptop GPU (n=1) | |
| Dell XPS 15 9530 RTX 4070 | |
| Media de la clase Multimedia (605 - 2024, n=60, últimos 2 años) | |
| Samsung Galaxy Book3 Ultra 16 | |
| PCMark 10 Score | 6883 puntos | |
ayuda | ||
| AIDA64 / Memory Copy | |
| Media de la clase Multimedia (11299 - 132135, n=54, últimos 2 años) | |
| Asus ProArt Studiobook 16 OLED H7604 | |
| Samsung Galaxy Book3 Ultra 16 | |
| Medio Intel Core i9-13980HX (62189 - 80776, n=9) | |
| Asus Vivobook Pro 16X K6604JV-MX016W | |
| Dell XPS 15 9530 RTX 4070 | |
| Schenker VISION 16 Pro (M23) | |
| MSI Creator Z17 A12UGST-054 | |
| AIDA64 / Memory Read | |
| Media de la clase Multimedia (11624 - 174586, n=54, últimos 2 años) | |
| Asus ProArt Studiobook 16 OLED H7604 | |
| Medio Intel Core i9-13980HX (62624 - 89096, n=9) | |
| Asus Vivobook Pro 16X K6604JV-MX016W | |
| Schenker VISION 16 Pro (M23) | |
| Dell XPS 15 9530 RTX 4070 | |
| Samsung Galaxy Book3 Ultra 16 | |
| MSI Creator Z17 A12UGST-054 | |
| AIDA64 / Memory Write | |
| Samsung Galaxy Book3 Ultra 16 | |
| Media de la clase Multimedia (11755 - 134998, n=54, últimos 2 años) | |
| Asus ProArt Studiobook 16 OLED H7604 | |
| Medio Intel Core i9-13980HX (59912 - 79917, n=9) | |
| Asus Vivobook Pro 16X K6604JV-MX016W | |
| Dell XPS 15 9530 RTX 4070 | |
| Schenker VISION 16 Pro (M23) | |
| MSI Creator Z17 A12UGST-054 | |
| AIDA64 / Memory Latency | |
| Media de la clase Multimedia (7 - 535, n=53, últimos 2 años) | |
| Samsung Galaxy Book3 Ultra 16 | |
| MSI Creator Z17 A12UGST-054 | |
| Asus Vivobook Pro 16X K6604JV-MX016W | |
| Medio Intel Core i9-13980HX (79.4 - 93.2, n=9) | |
| Dell XPS 15 9530 RTX 4070 | |
| Asus ProArt Studiobook 16 OLED H7604 | |
| Schenker VISION 16 Pro (M23) | |
* ... más pequeño es mejor
Latencia del CPD
La edición de audio en tiempo real no cuenta entre los puntos fuertes del Asus VivoBook Pro 16X. En la configuración actual, el driver de modo kernel y el driver Studio de Nvidia, entre otros, causan latencias demasiado altas. Sin embargo, esto puede ser muy diferente con controladores modificados y otro software.
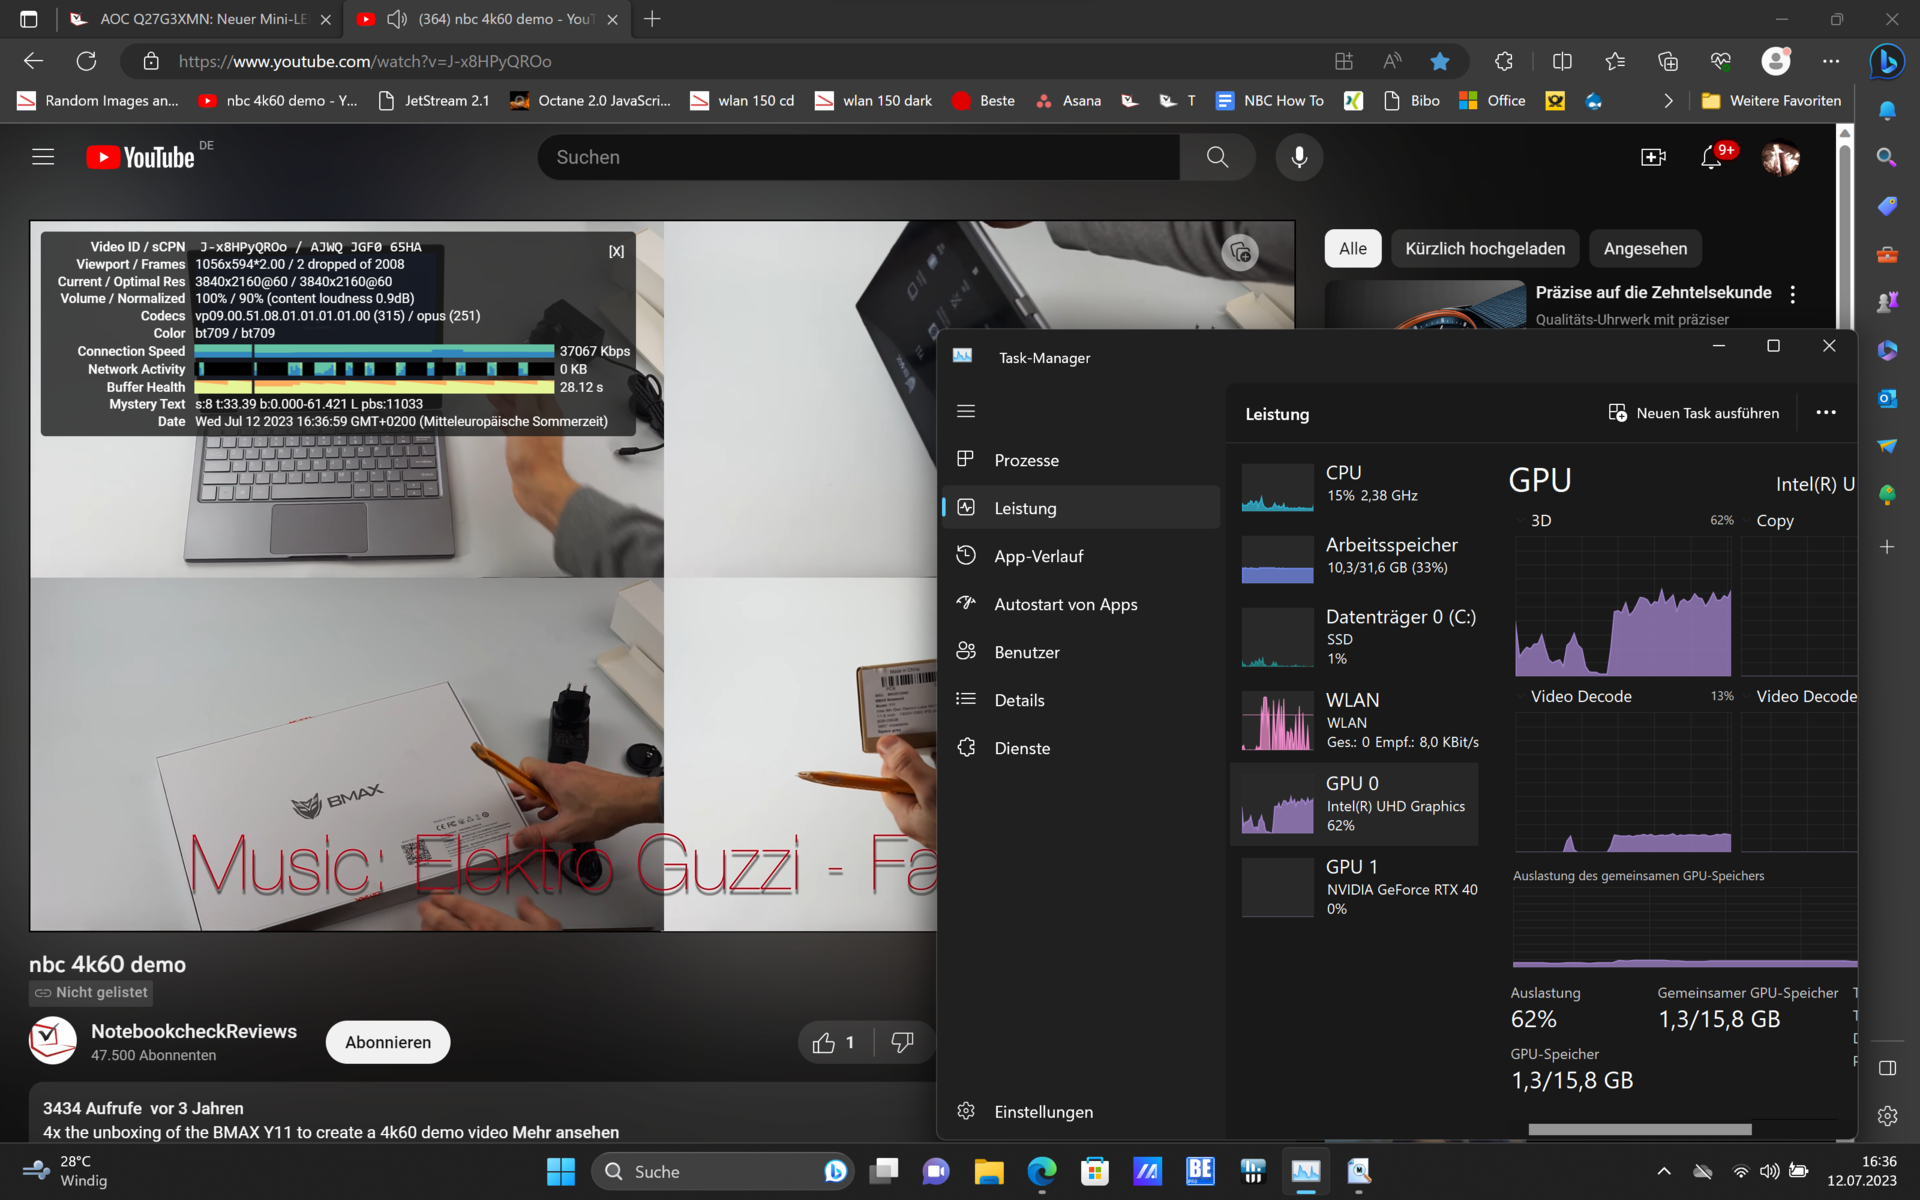
Sólo se registraron 3 frames perdidos durante el streaming de vídeo 4K; un portátil multimedia no debería perder ningún frame.
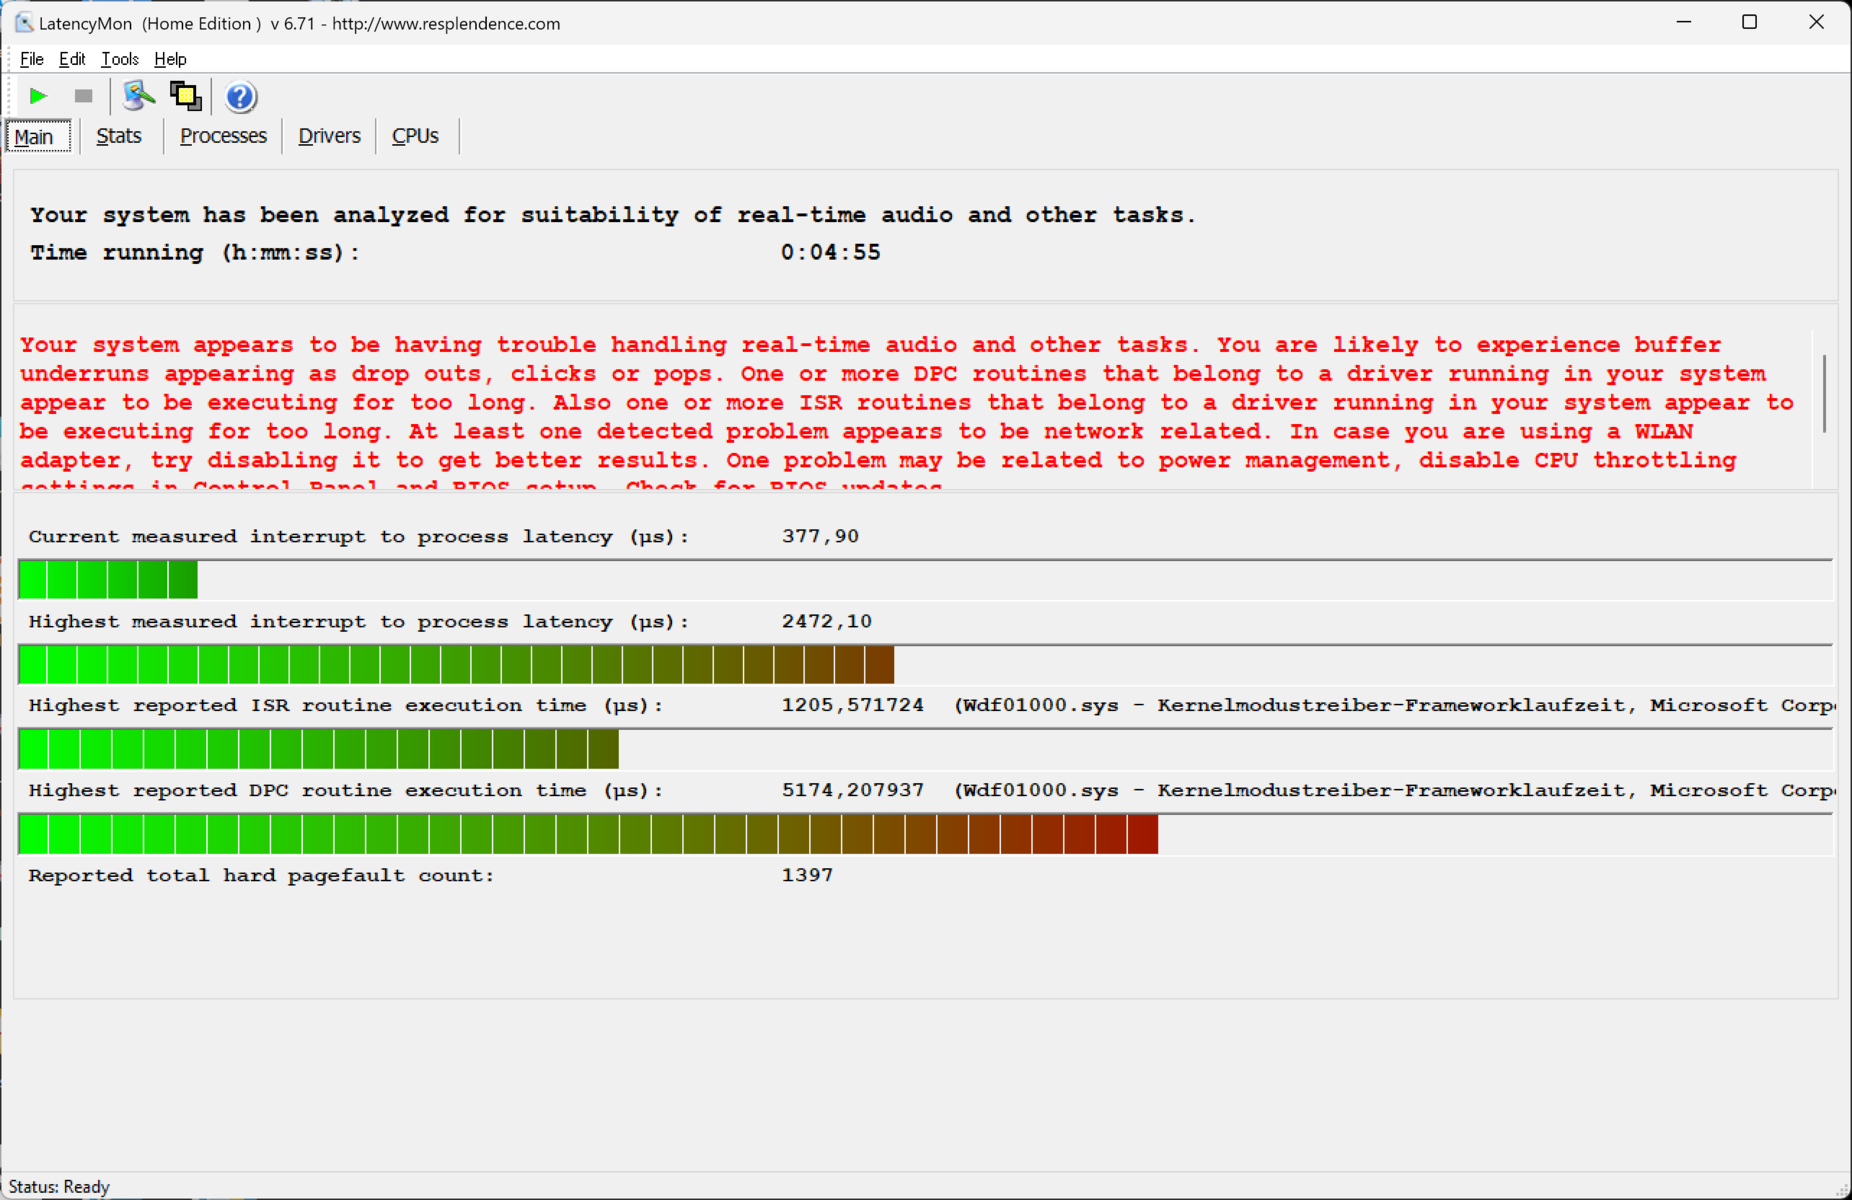
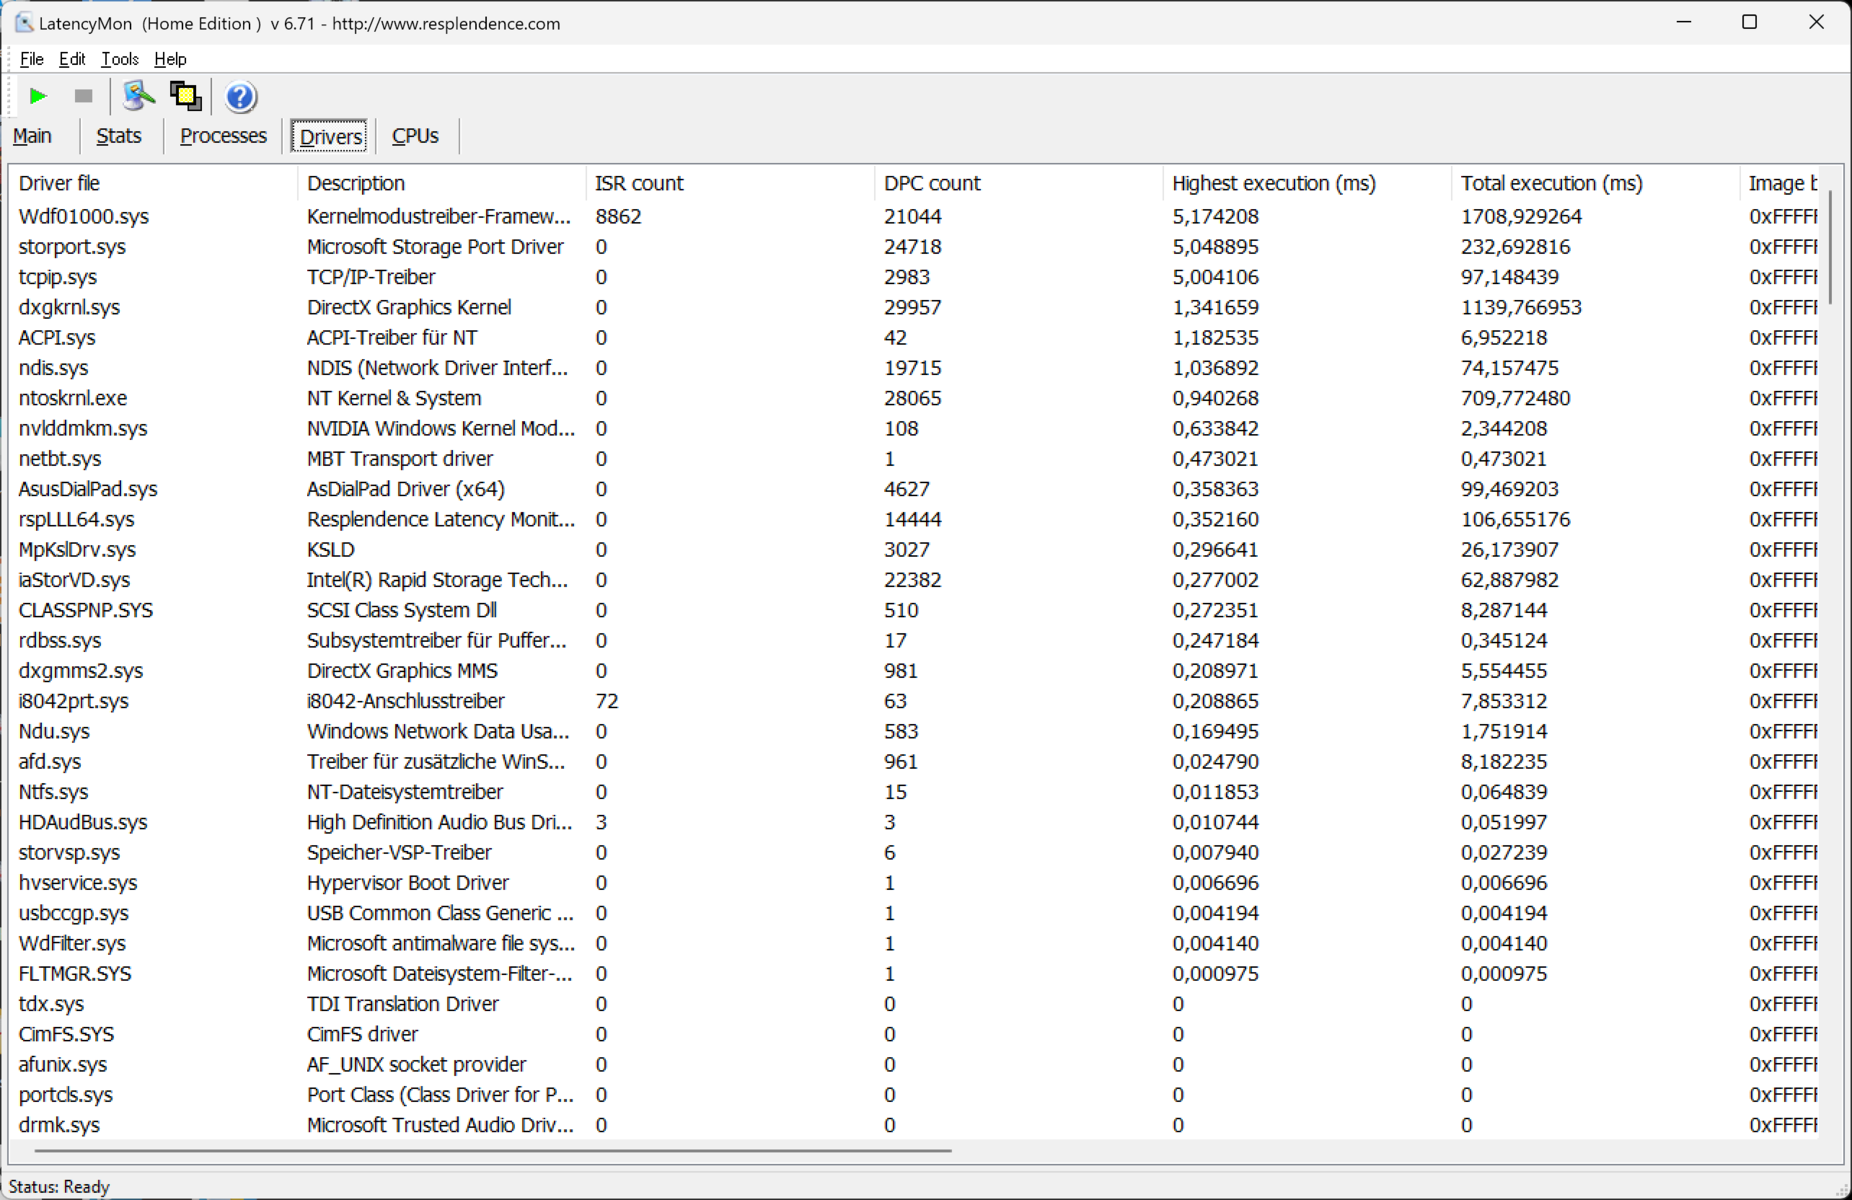
| DPC Latencies / LatencyMon - interrupt to process latency (max), Web, Youtube, Prime95 | |
| Samsung Galaxy Book3 Ultra 16 | |
| Asus Vivobook Pro 16X K6604JV-MX016W | |
| Asus ProArt Studiobook 16 OLED H7604 | |
| MSI Creator Z17 A12UGST-054 | |
| Dell XPS 15 9530 RTX 4070 | |
| Schenker VISION 16 Pro (M23) | |
* ... más pequeño es mejor
Dispositivos de almacenamiento
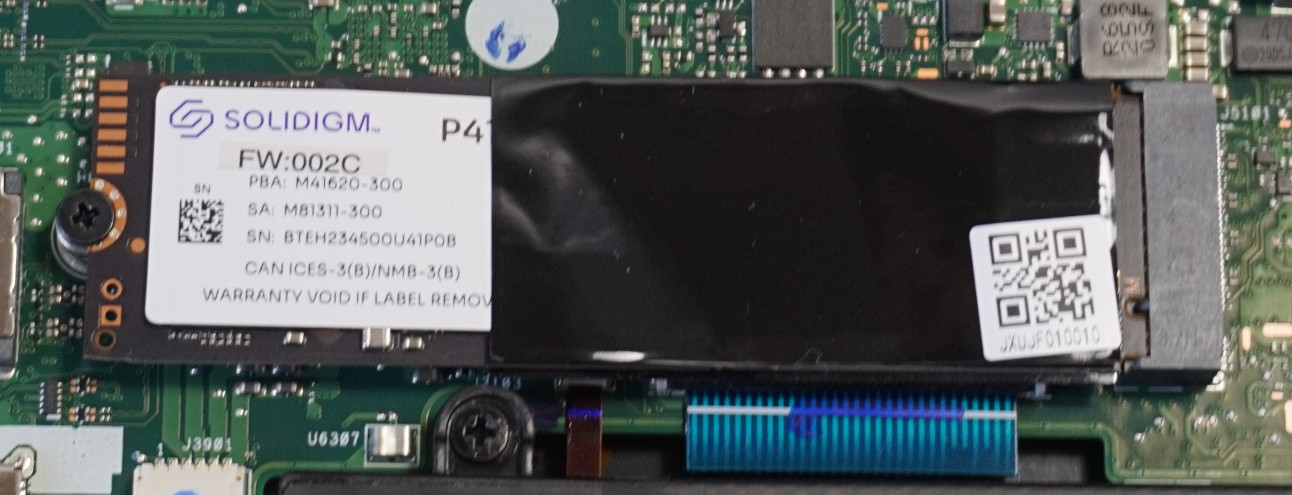
Para una SSD PCIe 4.0, los valores que registramos son sistemáticamente débiles, aunque el fabricante especifica una velocidad de transferencia máxima de algo más de 4000 MB/s, lo que supone apenas dos tercios del máximo teórico. También medimos valores por debajo de la media en otras pruebas de lectura y escritura.
Durante los procesos intensivos de lectura y escritura que se producen al editar datos sin procesar, este comportamiento puede tener un impacto negativo en el rendimiento del sistema. Por otro lado, no deberían observarse efectos negativos en el resto de tareas.
El Samsung Galaxy Book3 Ultra o el Schenker Vision 16 Pro están claramente por delante aquí. Pero al menos el SSD puede reemplazarse con poco esfuerzo.

* ... más pequeño es mejor
Sustained Read Performance: DiskSpd Read Loop, Queue Depth 8
Tarjeta gráfica
Además del chip Intel UHD Graphics integrado, laNvidia GeForce RTX 4060está instalado. En teoría, ambos disponen de una potencia máxima posible de 140 W, que el fabricante permite de hecho.
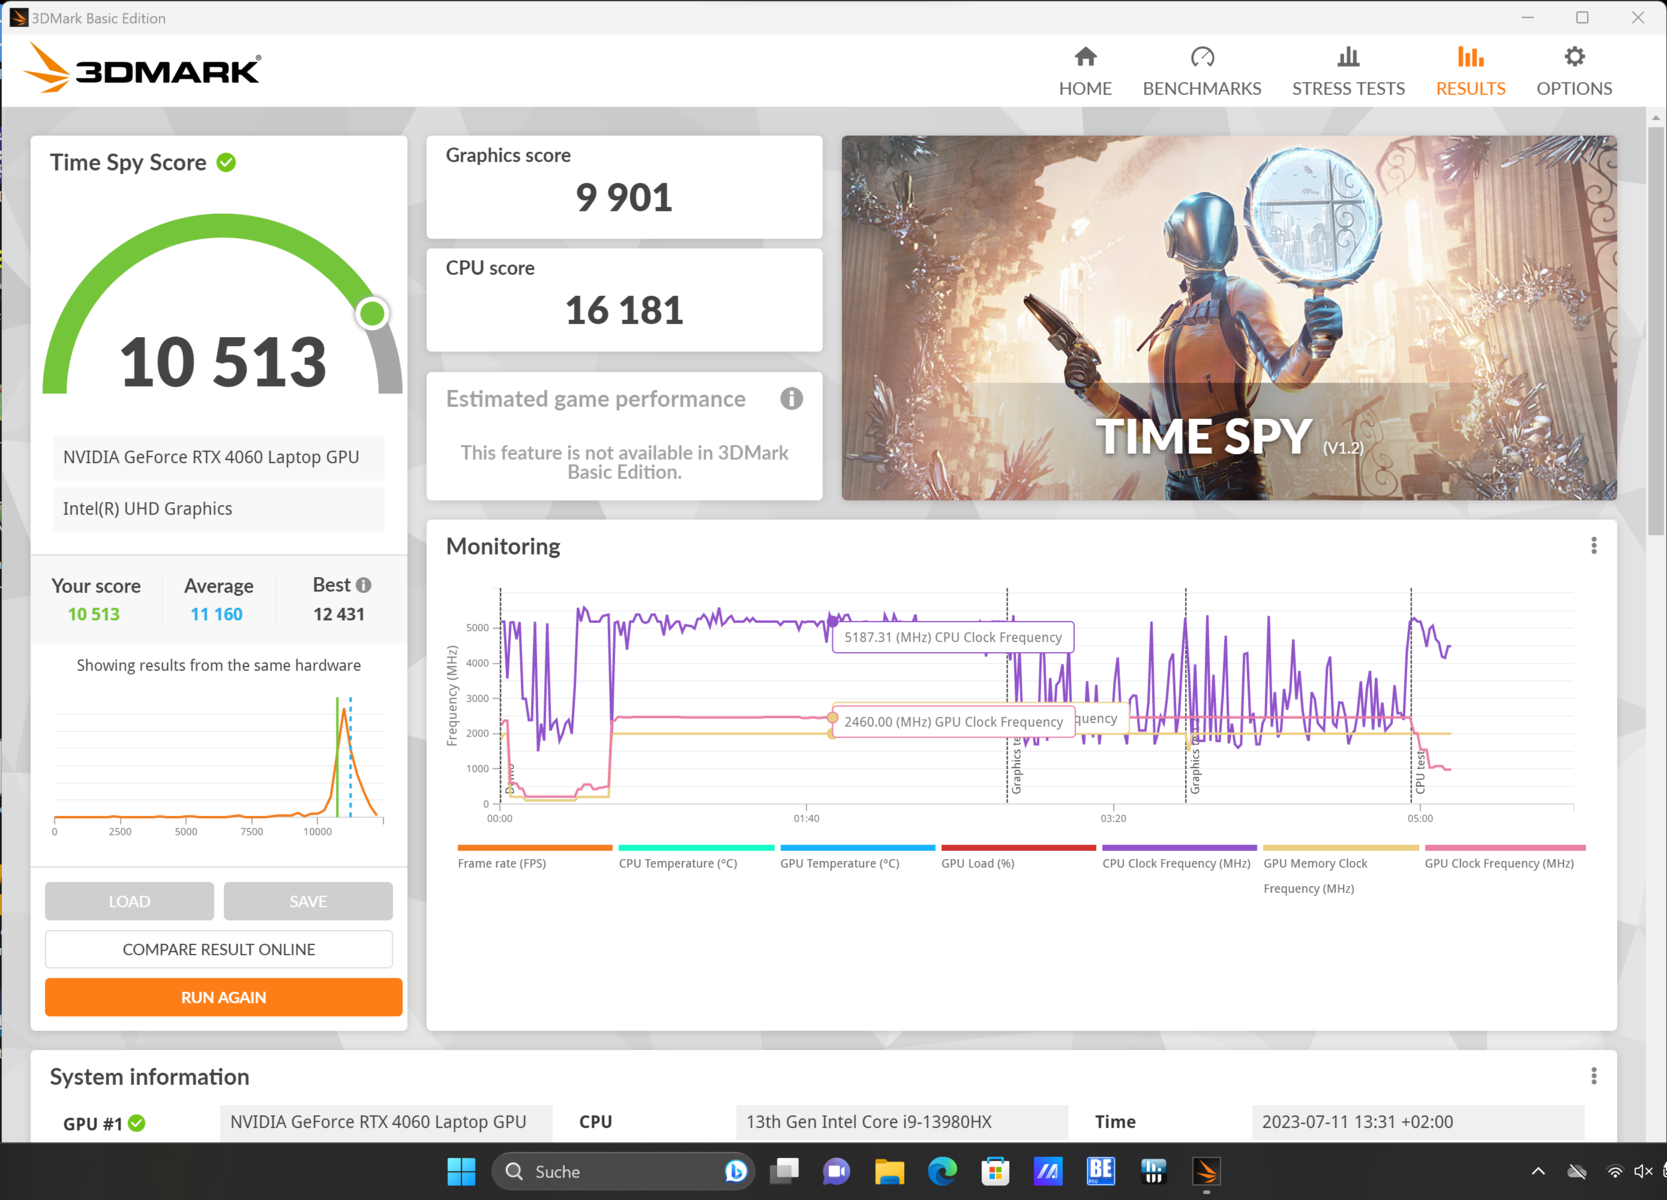
Sin embargo, sólo se alcanzan 115 W, incluso en tareas exigentes, lo que corresponde a la carga máxima sin boost dinámico de la CPU. Sólo en el test de estrés observamos rendimientos de más de 130 W durante cortos periodos de tiempo.
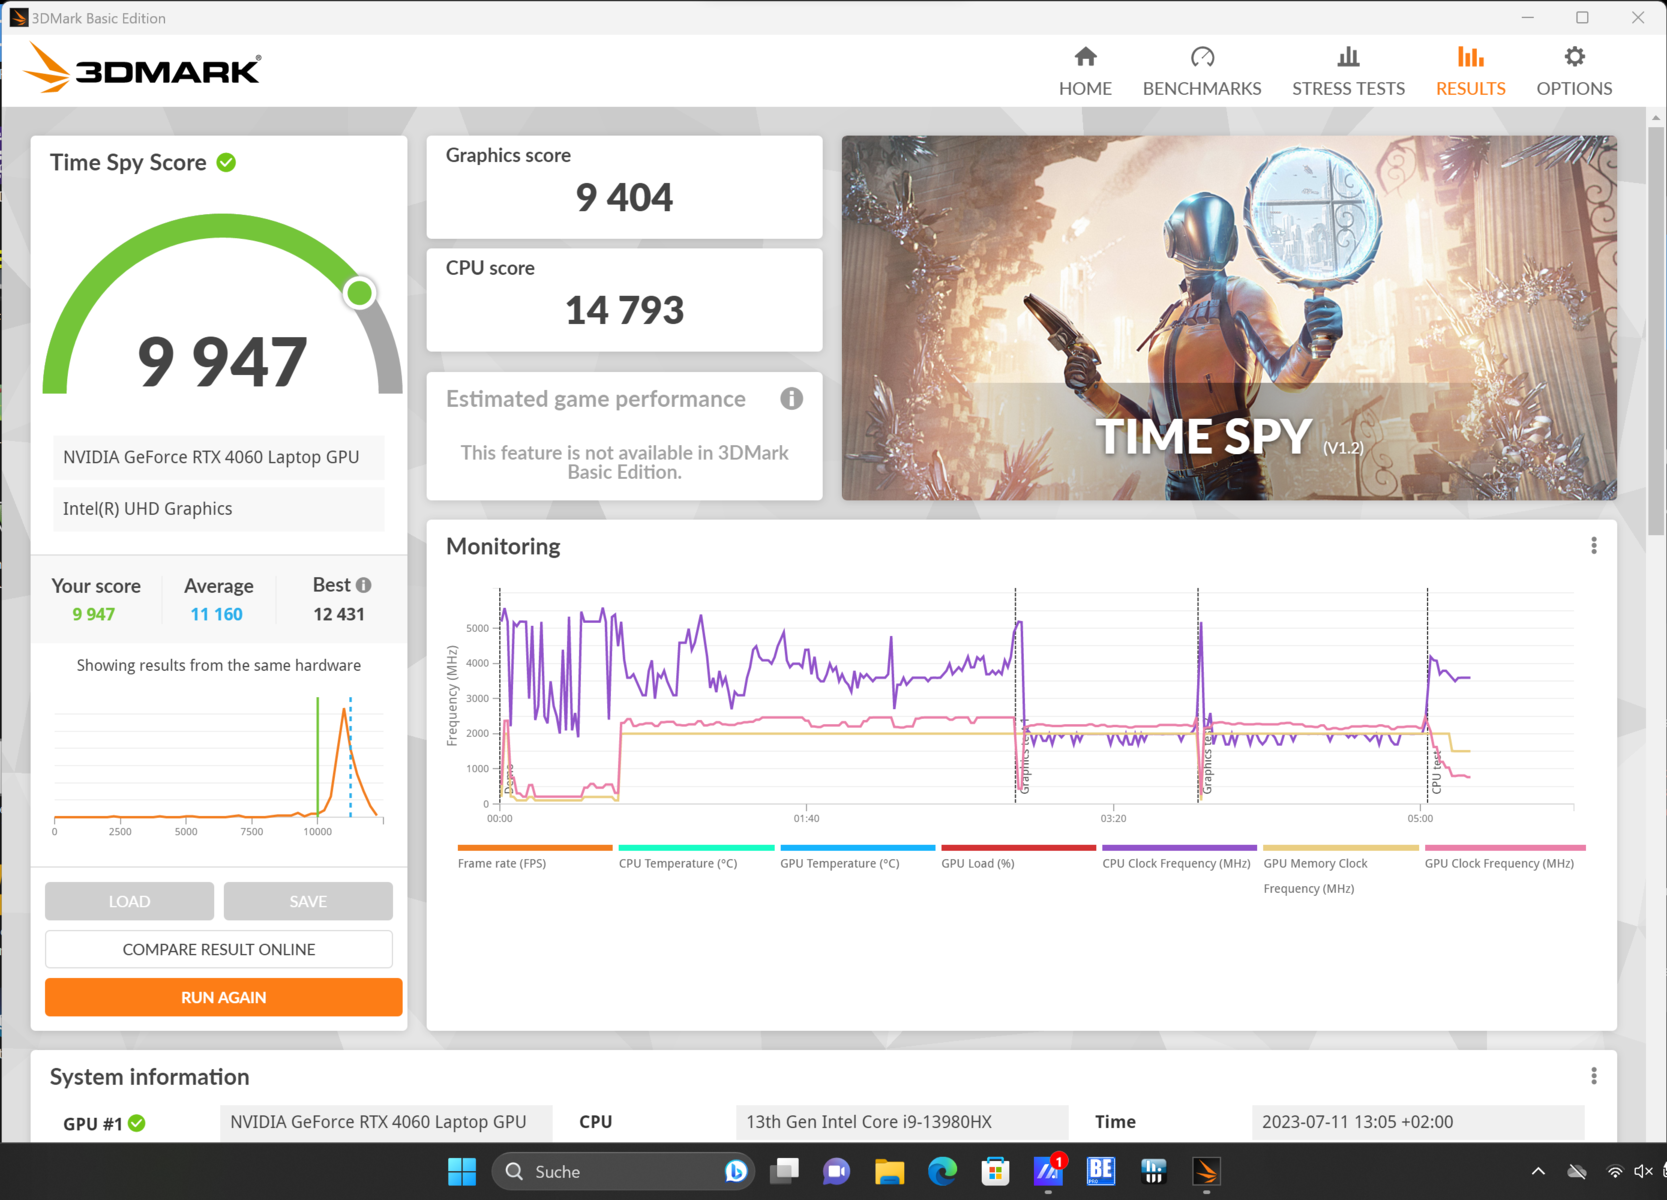
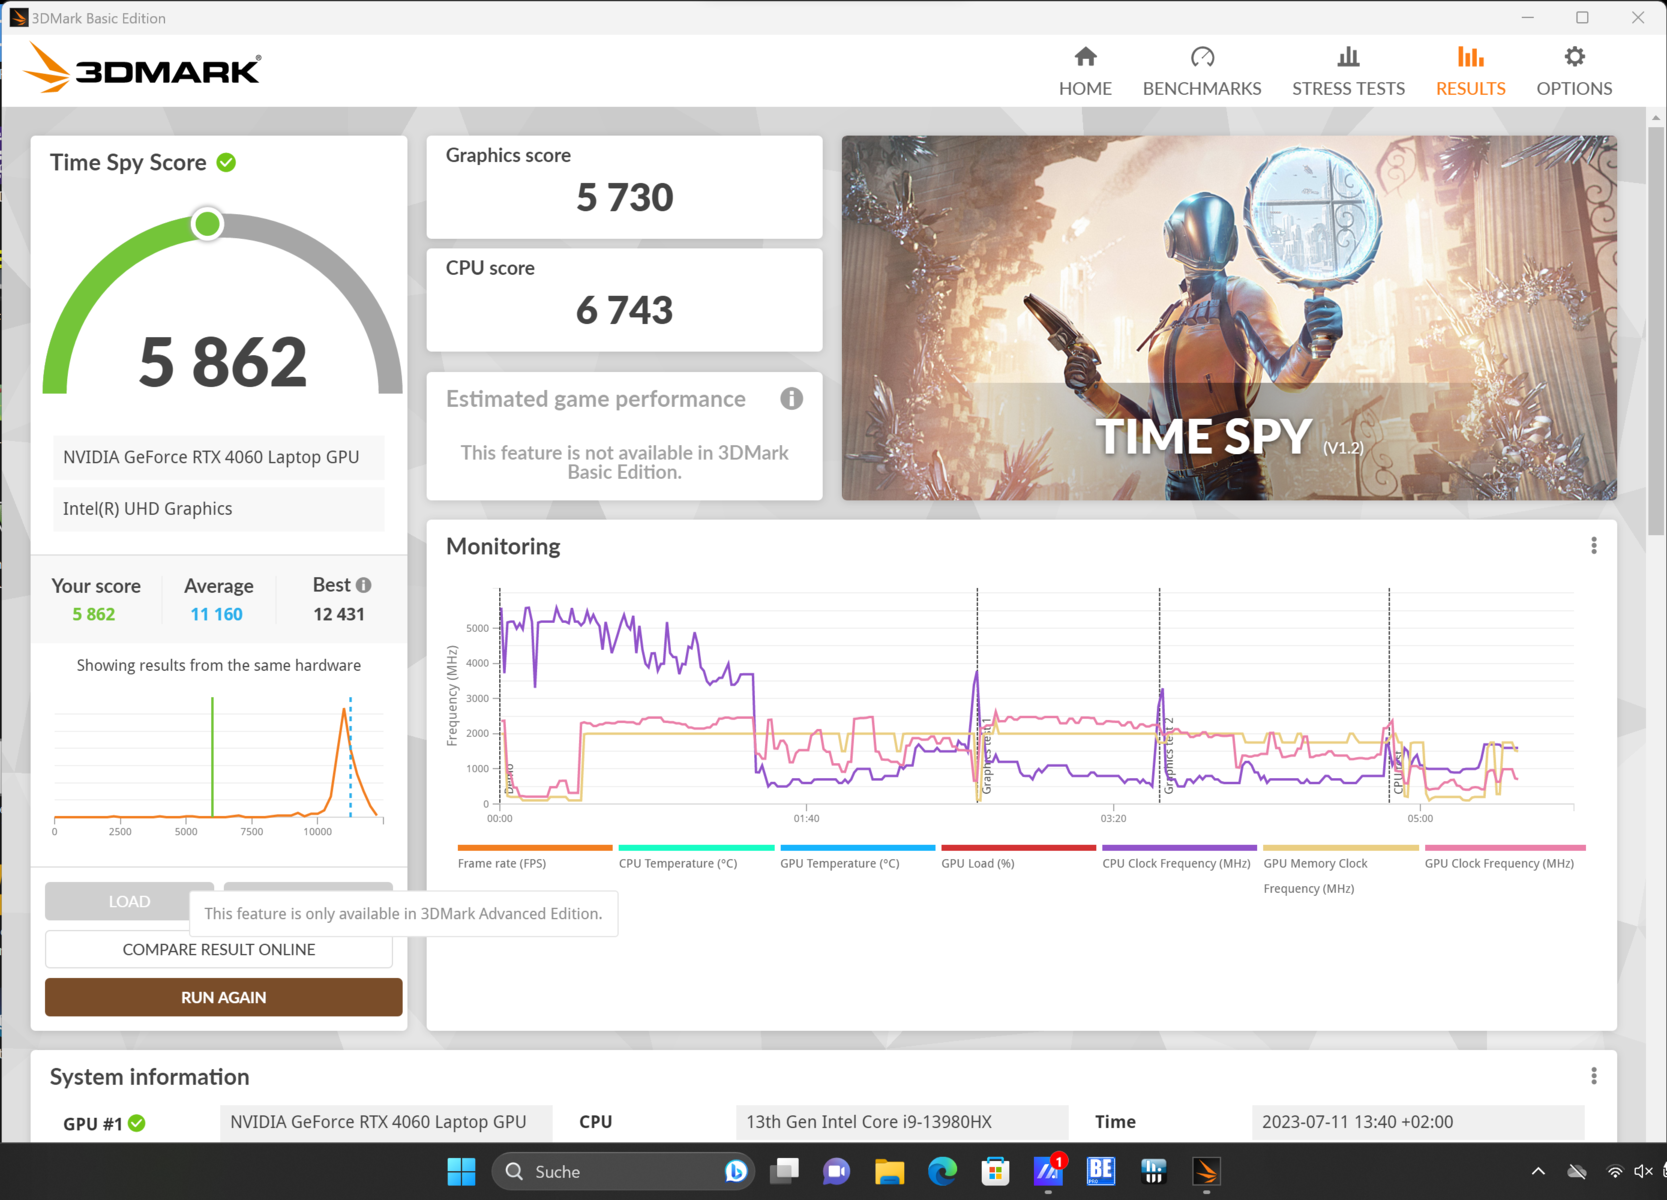
Sin embargo, esto apenas juega un papel en la evaluación del rendimiento. Tanto 3DMark Time Spy como los índices de HWiNFO muestran que el rendimiento gráfico realmente no aumenta más. En modo Estándar , en el que sólo se permite un total de 90 W, el reloj de la GPU es casi tan alto como cuando se permite la máxima potencia. En el artículo enlazadoaquírevelamos en detalle por qué la carga máxima apenas beneficia a las pequeñas RTX 4050 y RTX 4060.
En comparación con otros portátiles multimedia, el rendimiento está más o menos en línea con las expectativas de la GPU instalada. El Samsung Galaxy Book3 Ultra con su RTX 4050 rinde bastante peor. Sin embargo, un MSI Creator Z17 con la RTX 3070 Ti también es ligeramente peor en las puntuaciones 3DMark. En Blender, sólo los portátiles Creator con la RTX 4070 más potente rinden mejor.
El rendimiento gráfico completo puede usarse casi por completo en modo Estándar . En modo Silencioso , la fuente de alimentación cae gradualmente a poco más de 20 W. Las limitadas opciones de ventilación resultan en una notable caída de rendimiento.
Al menos esto no aumenta en modo batería. Entre otras cosas, Witcher 3 sigue siendo jugable en los ajustes más altos, por lo que el resto de tareas gráficamente exigentes también deberían ser ejecutables.
Puedes encontrar más pruebas e información en nuestra Lista de pruebas de GPU.
| 3DMark 11 Performance | 25913 puntos | |
| 3DMark Cloud Gate Standard Score | 42137 puntos | |
| 3DMark Fire Strike Score | 20396 puntos | |
| 3DMark Time Spy Score | 9947 puntos | |
ayuda | ||
* ... más pequeño es mejor
Rendimiento en juegos
Dado que el chip gráfico, como ya se ha mencionado anteriormente, no tiene que utilizarse al máximo para obtener el mejor rendimiento, el VivoBook Pro 16X también rinde sólidamente en juegos, a pesar de la delgada carcasa y la limitada fuente de alimentación. En presencia de un ruido de ventilador moderado, puede seguir el ritmo delAcer Predator Helios 16y su idéntica GPU.
Por tanto, jugar a títulos actuales y exigentes es posible sin problemas. Si la resolución se establece en Full HD, el nuevo F1 23 se puede jugar sin problemas con el máximo nivel de detalle.
| The Witcher 3 - 1920x1080 Ultra Graphics & Postprocessing (HBAO+) | |
| Asus ProArt Studiobook 16 OLED H7604 | |
| Schenker VISION 16 Pro (M23) | |
| Acer Predator Helios 16 PH16-71-731Q | |
| Asus Vivobook Pro 16X K6604JV-MX016W | |
| MSI Creator Z17 A12UGST-054 | |
| Dell XPS 15 9530 RTX 4070 | |
| Samsung Galaxy Book3 Ultra 16 | |
| Media de la clase Multimedia (11 - 121, n=7, últimos 2 años) | |
| Star Wars Jedi Survivor | |
| 1920x1080 High Preset | |
| Schenker VISION 16 Pro (M23) | |
| Medio NVIDIA GeForce RTX 4060 Laptop GPU (50.1 - 77.6, n=8) | |
| Asus Vivobook Pro 16X K6604JV-MX016W | |
| 1920x1080 Epic Preset | |
| Schenker VISION 16 Pro (M23) | |
| Medio NVIDIA GeForce RTX 4060 Laptop GPU (45.5 - 66.7, n=10) | |
| Asus Vivobook Pro 16X K6604JV-MX016W | |
El Asus VivoBook Pro es incapaz de mantener la tasa de frames en el test de aguante Witcher 3. Aunque las típicas fluctuaciones día-noche pueden verse en la curva, las tasas caen algo más del 5% en general. Asumiendo que un portátil multimedia rara vez tiene que pedir el máximo rendimiento durante largos periodos de tiempo, esto no parece ser un problema. Especialmente porque algo más de 90 FPS sigue siendo un valor excelente.
Witcher 3 FPS chart
| bajo | medio | alto | ultra | QHD | |
|---|---|---|---|---|---|
| GTA V (2015) | 168.3 | 105.4 | 82 | ||
| The Witcher 3 (2015) | 180 | 98 | |||
| Dota 2 Reborn (2015) | 181.4 | 165.2 | |||
| Final Fantasy XV Benchmark (2018) | 84.4 | 65.2 | |||
| X-Plane 11.11 (2018) | 108.8 | ||||
| Far Cry 5 (2018) | 129 | 123 | 94 | ||
| Strange Brigade (2018) | 199.3 | 165.4 | 120.5 | ||
| Call of Duty Modern Warfare 2 2022 (2022) | 88 | 61 | |||
| Star Wars Jedi Survivor (2023) | 59 | 55 | 36 | ||
| F1 23 (2023) | 168.1 | 51.7 | 32.2 | ||
| Cyberpunk 2077 (2023) | 72.33 | 42.41 |
Emisiones - Mucha refrigeración para el portátil Creator
Ruido
El altísimo volumen que medimos bajo carga máxima es difícilmente alcanzable en el uso práctico. En modo Estándar , casi todo en la oficina debería ahogar al VivoBook, ya que los ventiladores son entonces sólo una cuarta parte más ruidosos. El portátil es básicamente inaudible cuando los ventiladores están en silencio. Entonces medimos una séptima parte del volumen máximo posible.
El trabajo silencioso es por tanto muy posible con el Asus VivoBook, incluso si puedes oir los ventiladores cuando escuchas de cerca. Que esto no es un hecho lo demuestra, por ejemplo, el MSI Creator Z17donde incluso el modo Silencioso puede ser molesto en ambientes silenciosos.
Ruido
| Ocioso |
| 26.6 / 26.6 / 29.2 dB(A) |
| Carga |
| 53.4 / 56.9 dB(A) |
 | ||
30 dB silencioso 40 dB(A) audible 50 dB(A) ruidosamente alto |
||
min: | ||
| Asus Vivobook Pro 16X K6604JV-MX016W GeForce RTX 4060 Laptop GPU, i9-13980HX, Solidigm P41 Plus SSDPFKNU010TZ | Dell XPS 15 9530 RTX 4070 GeForce RTX 4070 Laptop GPU, i7-13700H, SK hynix PC801 HFS001TEJ9X101N | Samsung Galaxy Book3 Ultra 16 GeForce RTX 4050 Laptop GPU, i7-13700H, Samsung PM9A1 MZVL2512HCJQ | Asus ProArt Studiobook 16 OLED H7604 GeForce RTX 4070 Laptop GPU, i9-13980HX, Phison EM2804TBMTCB47 | Schenker VISION 16 Pro (M23) GeForce RTX 4070 Laptop GPU, i7-13700H, Samsung 990 Pro 1 TB | MSI Creator Z17 A12UGST-054 GeForce RTX 3070 Ti Laptop GPU, i9-12900H, Micron 3400 1TB MTFDKBA1T0TFH | |
|---|---|---|---|---|---|---|
| Noise | 20% | 10% | 8% | 2% | -8% | |
| apagado / medio ambiente * (dB) | 25.2 | 23.1 8% | 25 1% | 24.5 3% | 25.9 -3% | 26 -3% |
| Idle Minimum * (dB) | 26.6 | 23.1 13% | 26 2% | 24.5 8% | 25.9 3% | 31.8 -20% |
| Idle Average * (dB) | 26.6 | 23.1 13% | 27 -2% | 24.5 8% | 25.9 3% | 31.8 -20% |
| Idle Maximum * (dB) | 29.2 | 24.2 17% | 28 4% | 24.5 16% | 32 -10% | 31.8 -9% |
| Load Average * (dB) | 53.4 | 27.1 49% | 40 25% | 47.6 11% | 47.2 12% | 53.9 -1% |
| Load Maximum * (dB) | 56.9 | 44.6 22% | 41 28% | 56.7 -0% | 53.1 7% | 54.9 4% |
| Witcher 3 ultra * (dB) | 40.1 | 39 | 55.9 | 53.1 | 53.9 |
* ... más pequeño es mejor
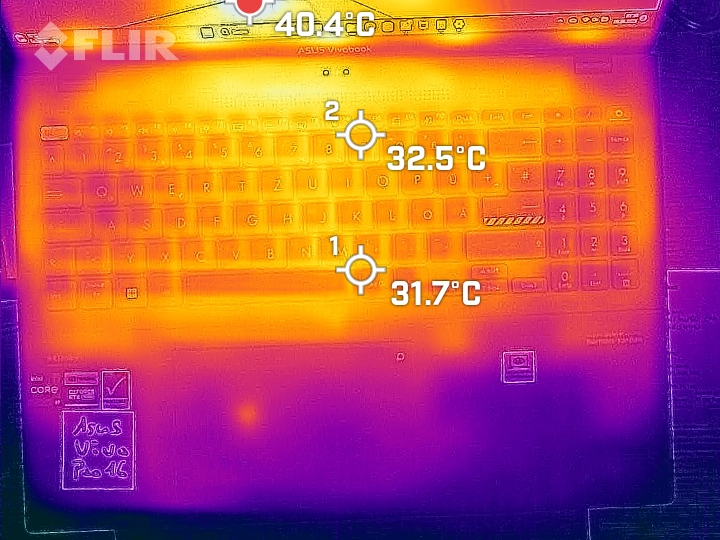
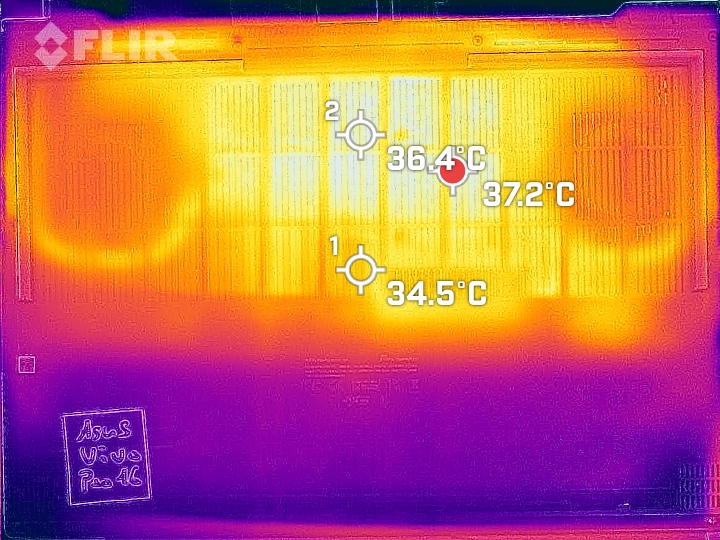
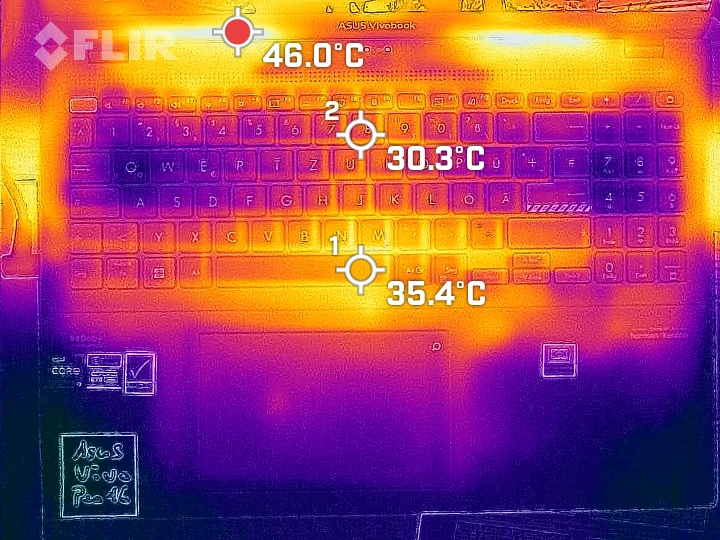
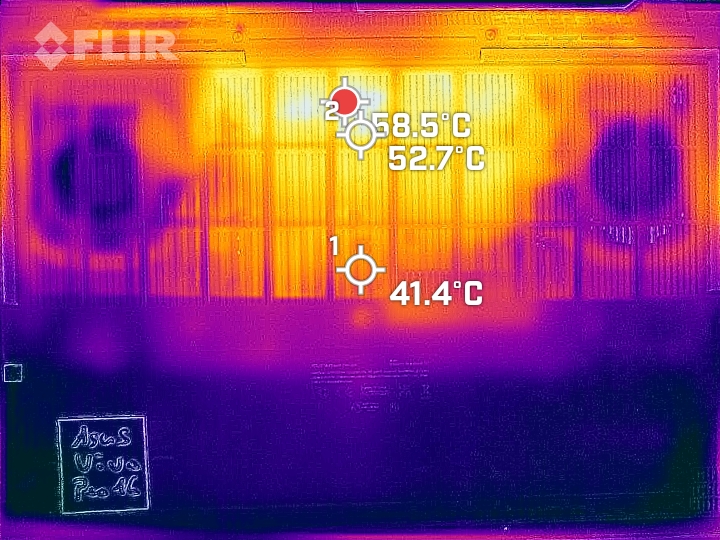
Temperatura
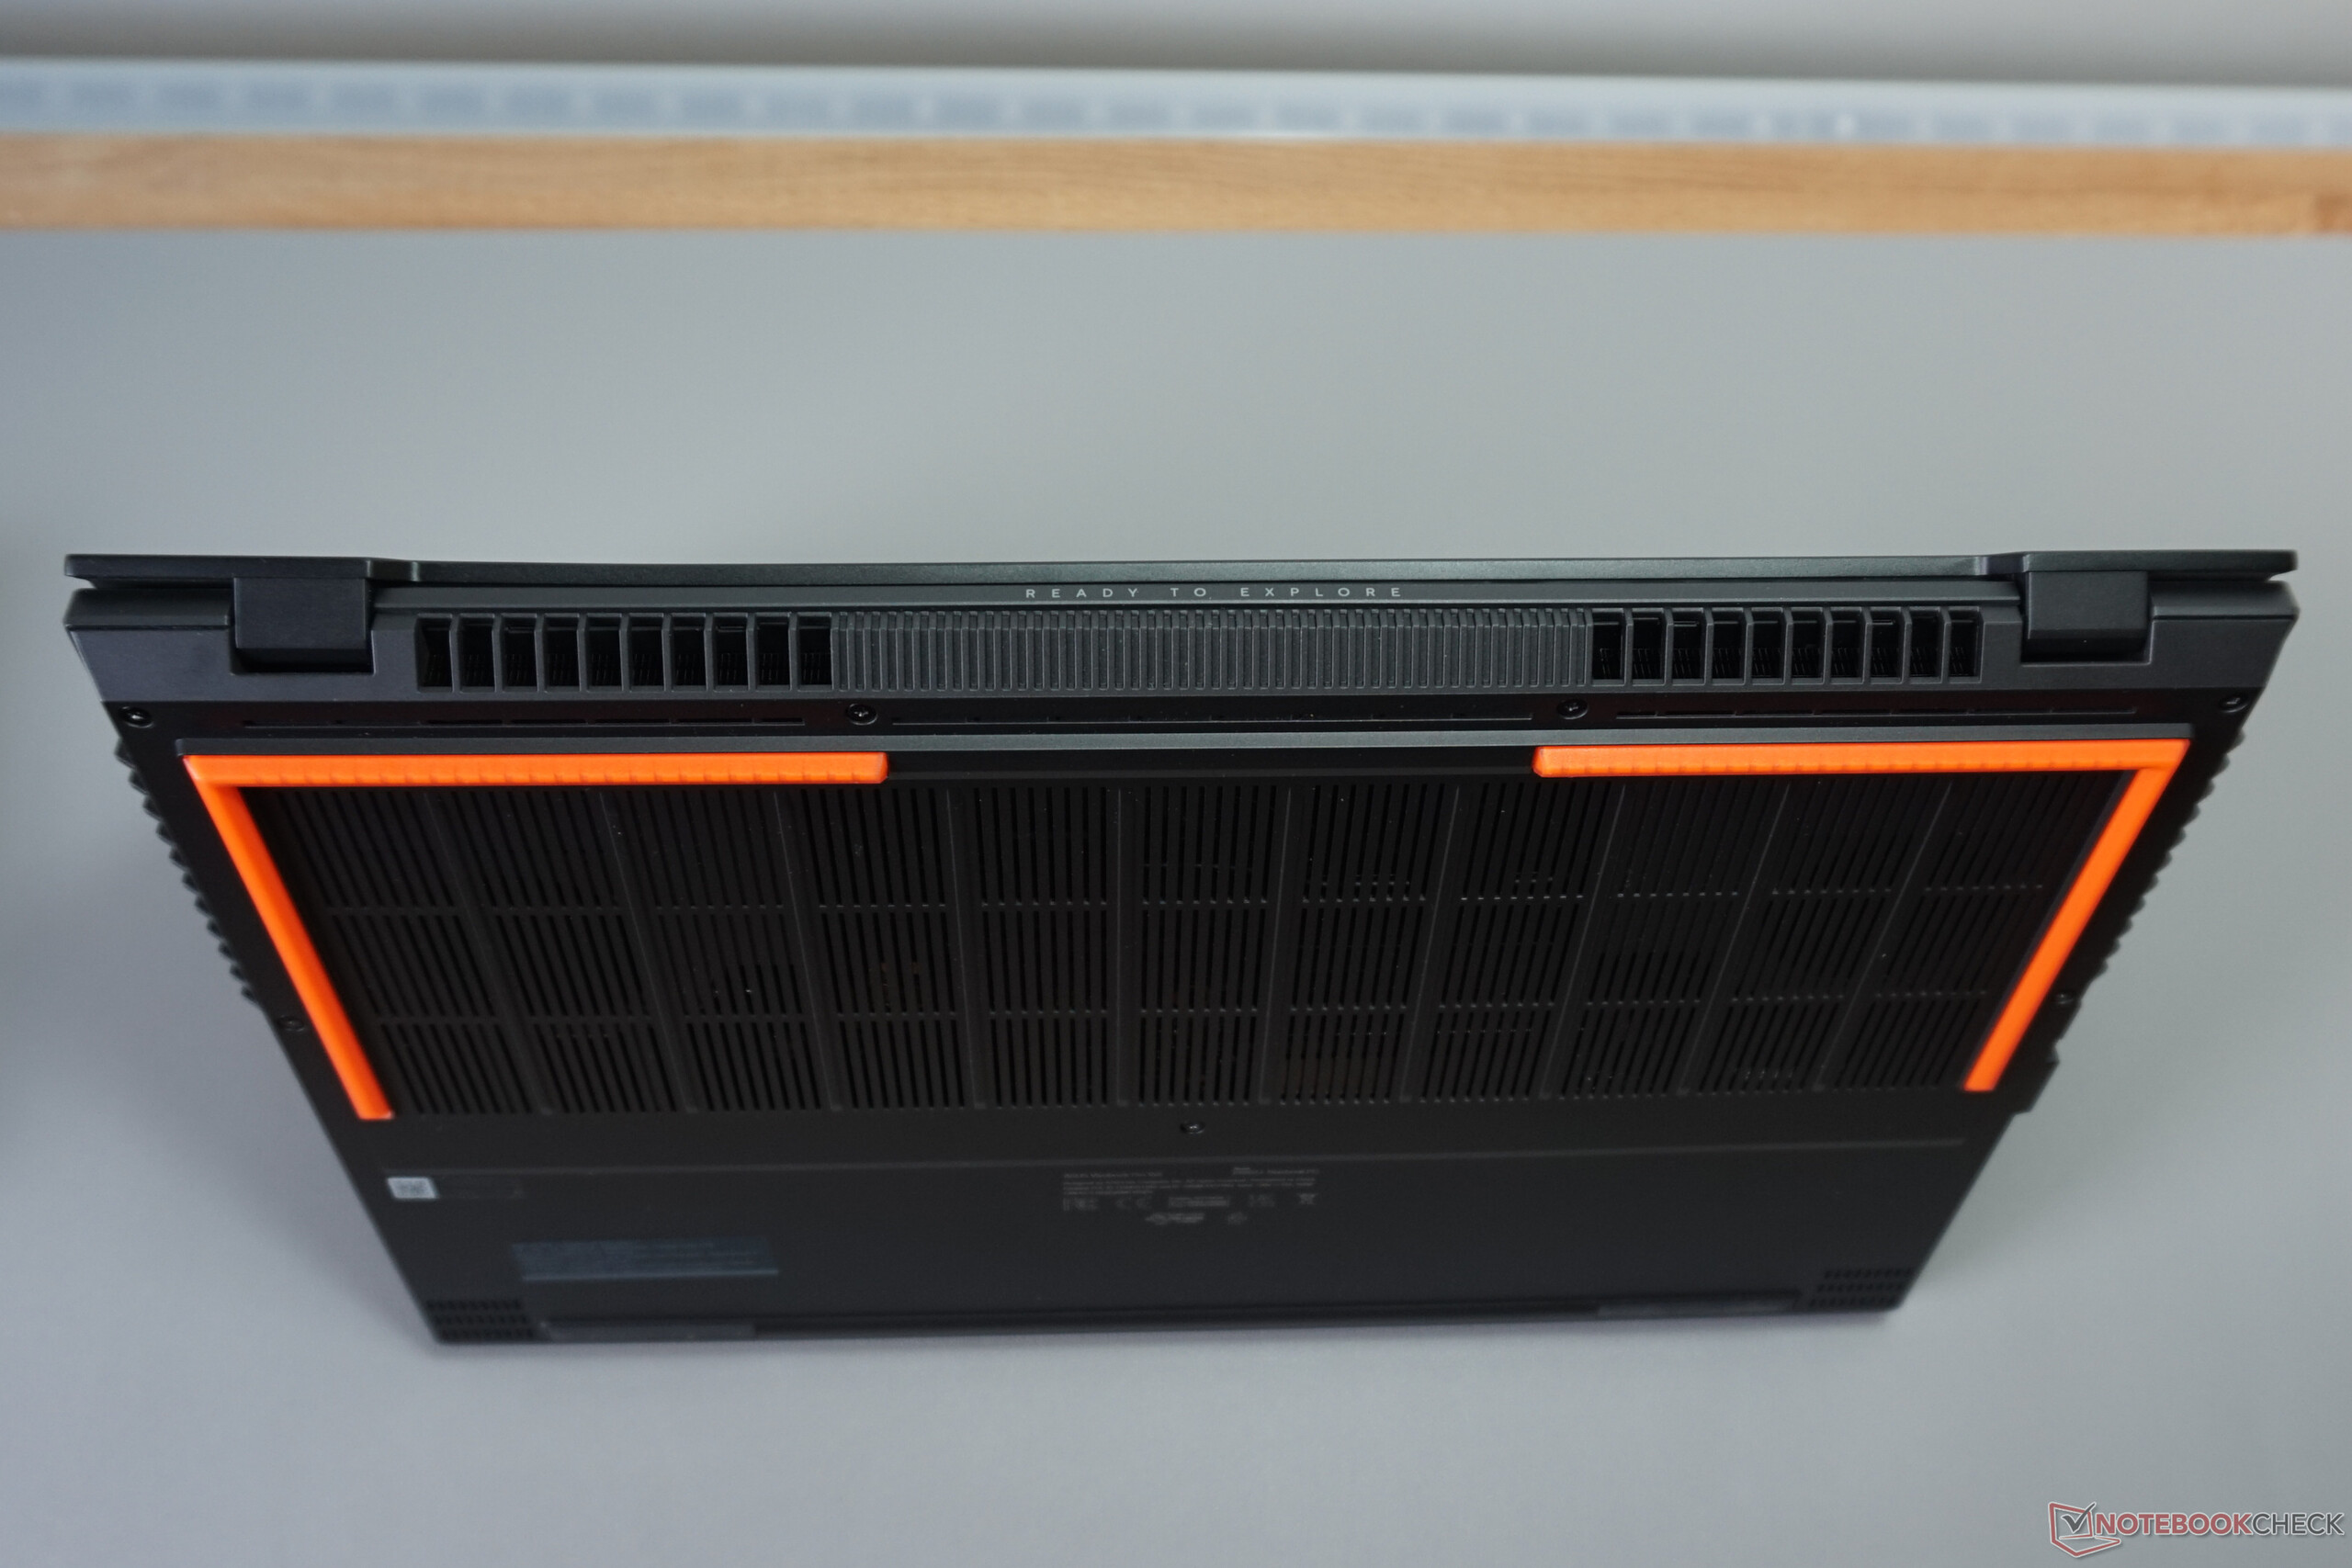
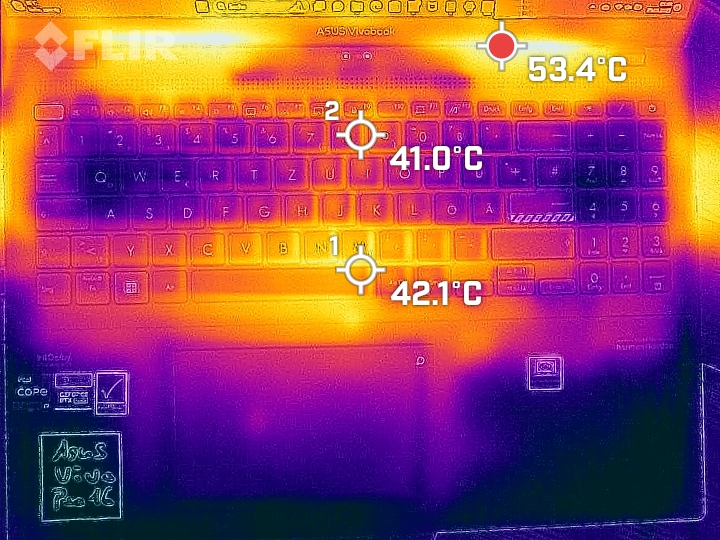
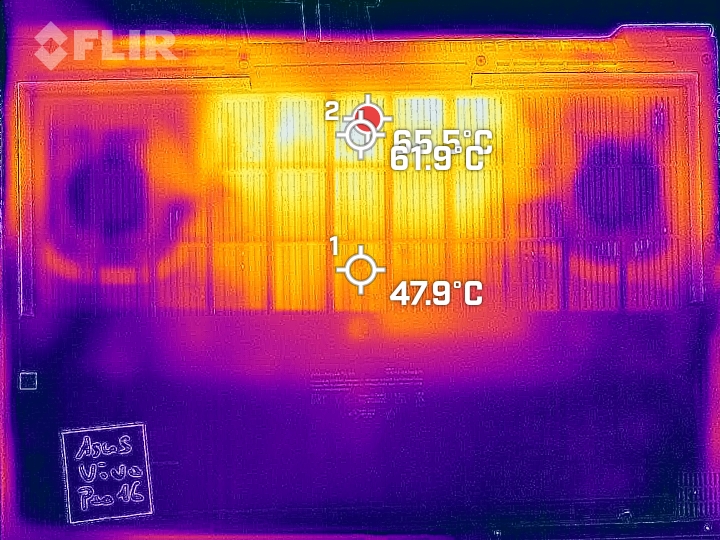
El touchpad se calienta hasta 34 °C en la prueba de estrés. También medimos 60 °C en la parte inferior. La carcasa relativamente delgada definitivamente se calienta demasiado en lo que es un escenario excepcional.
El test de resistencia Witcher 3 simula una carga algo más realista. El reposamanos se mantiene por debajo de los 30 °C y la parte inferior alcanza un máximo de 47 °C. Aunque el VivoBook debería colocarse siempre sobre una superficie firme, no se calienta demasiado al trabajar con él, ni siquiera cuando las demandas sobre el hardware son altas.
(+) La temperatura máxima en la parte superior es de 39.7 °C / 103 F, frente a la media de 36.8 °C / 98 F, que oscila entre 21 y 71 °C para la clase Multimedia.
(-) El fondo se calienta hasta un máximo de 60 °C / 140 F, frente a la media de 39.1 °C / 102 F
(+) En reposo, la temperatura media de la parte superior es de 28.2 °C / 83# F, frente a la media del dispositivo de 31.3 °C / 88 F.
(+) Jugando a The Witcher 3, la temperatura media de la parte superior es de 30.8 °C / 87 F, frente a la media del dispositivo de 31.3 °C / 88 F.
(+) Los reposamanos y el panel táctil alcanzan como máximo la temperatura de la piel (33.8 °C / 92.8 F) y, por tanto, no están calientes.
(-) La temperatura media de la zona del reposamanos de dispositivos similares fue de 28.7 °C / 83.7 F (-5.1 °C / -9.1 F).
| Asus Vivobook Pro 16X K6604JV-MX016W Intel Core i9-13980HX, NVIDIA GeForce RTX 4060 Laptop GPU | Dell XPS 15 9530 RTX 4070 Intel Core i7-13700H, NVIDIA GeForce RTX 4070 Laptop GPU | Samsung Galaxy Book3 Ultra 16 Intel Core i7-13700H, NVIDIA GeForce RTX 4050 Laptop GPU | Asus ProArt Studiobook 16 OLED H7604 Intel Core i9-13980HX, NVIDIA GeForce RTX 4070 Laptop GPU | Schenker VISION 16 Pro (M23) Intel Core i7-13700H, NVIDIA GeForce RTX 4070 Laptop GPU | MSI Creator Z17 A12UGST-054 Intel Core i9-12900H, NVIDIA GeForce RTX 3070 Ti Laptop GPU | |
|---|---|---|---|---|---|---|
| Heat | 2% | 19% | 1% | 7% | -13% | |
| Maximum Upper Side * (°C) | 39.7 | 45.6 -15% | 41 -3% | 44.1 -11% | 46.7 -18% | 63.9 -61% |
| Maximum Bottom * (°C) | 60 | 42 30% | 44 27% | 48 20% | 54.1 10% | 68 -13% |
| Idle Upper Side * (°C) | 30.9 | 34.4 -11% | 23 26% | 32.7 -6% | 26.5 14% | 28.3 8% |
| Idle Bottom * (°C) | 34.7 | 33.2 4% | 26 25% | 34.9 -1% | 26.8 23% | 30.2 13% |
* ... más pequeño es mejor
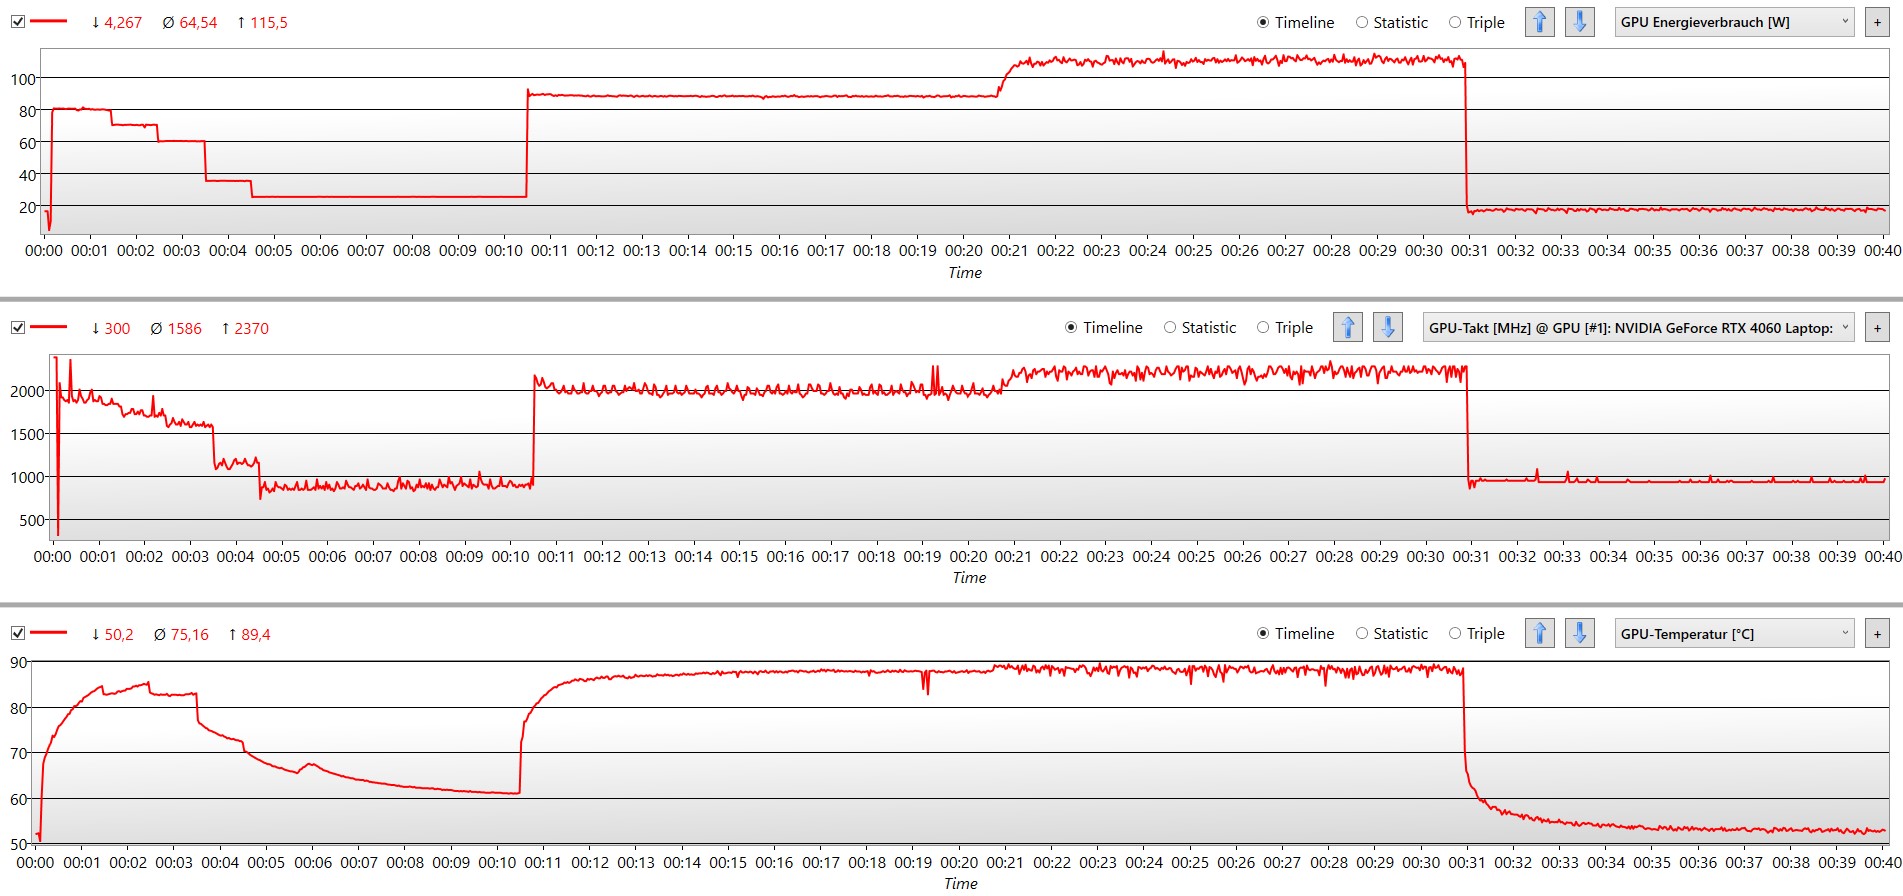
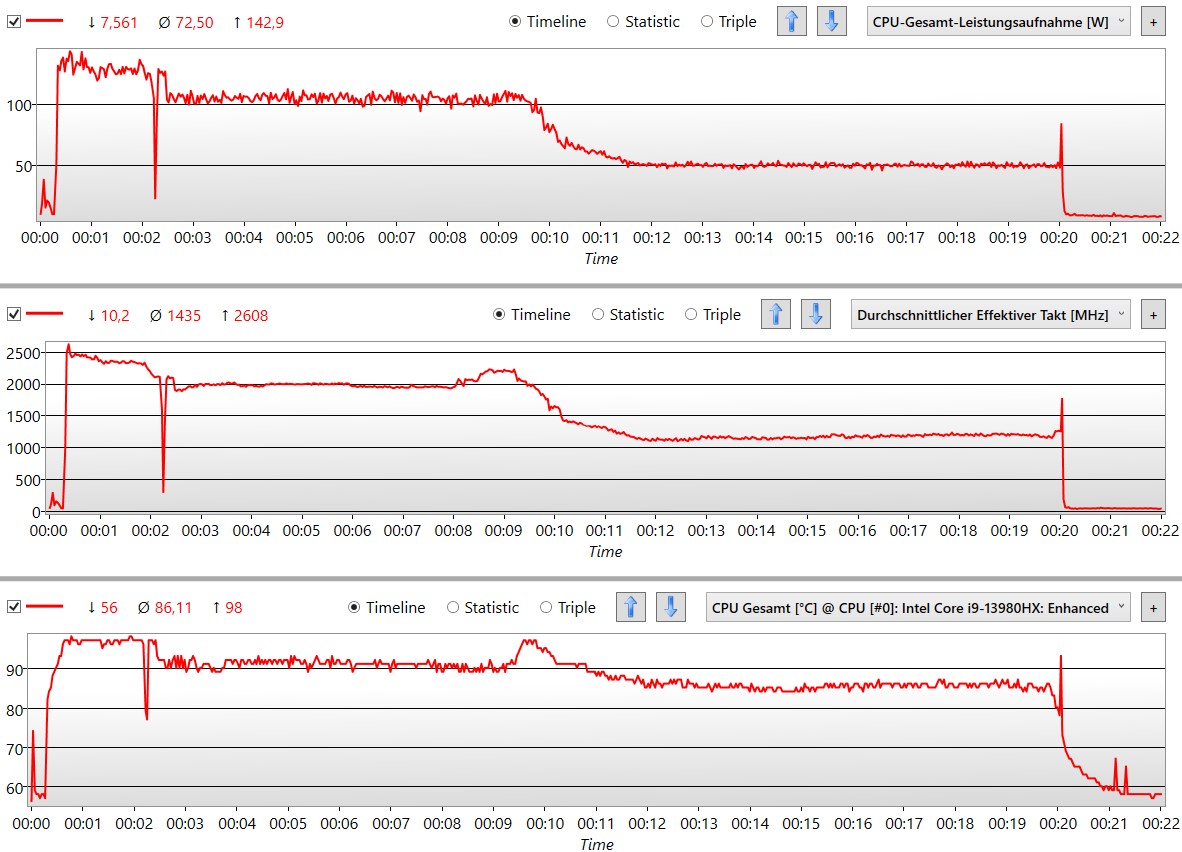
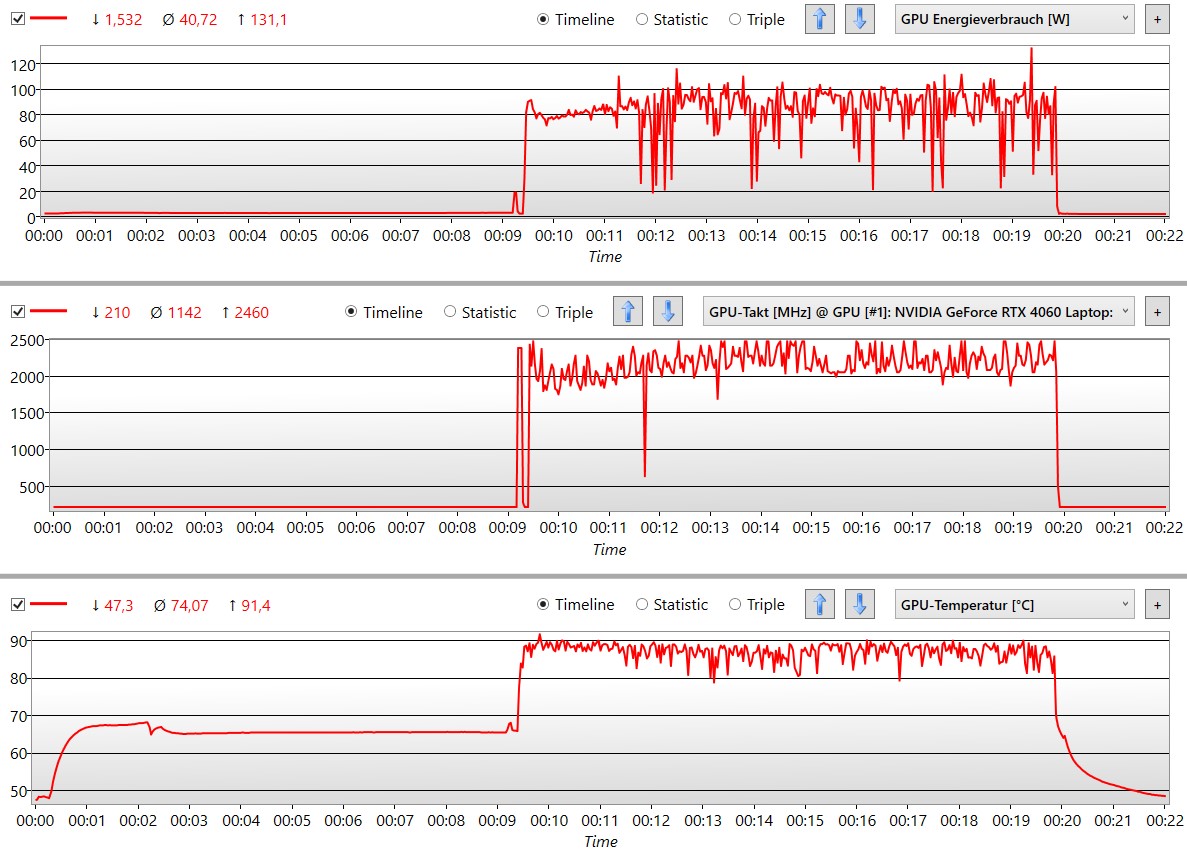
Prueba de resistencia
A máxima potencia del ventilador y máxima carga, la temperatura de la CPU sube hasta casi 100 °C, y la de la GPU supera los 90 °C. El procesador, en particular, tiene que ralentizarse muy rápidamente. Su velocidad de reloj se mantiene estable en 2,0 GHz después de unos 2 minutos.
Si también se necesita la GPU, la alimentación máxima del procesador baja de poco más de 100 W a 50 W. Al mismo tiempo, el chip gráfico puede seguir funcionando a su velocidad de reloj máxima, pero de vez en cuando tiene que acelerarse de 2,4 a 2,0 GHz.
Altavoces
Los altavoces son incapaces de reproducir graves y medios bajos, lo que no es sorprendente en un portátil. En cambio, los medios y agudos, importantes para la reproducción de la voz, son sólidos.
Así, la música no demasiado cargada de graves suena bien. La precisión de reproducción podría ser un poco mejor, ya que se nota que faltan ciertos elementos en la música por encima de la calidad MP3. Pero se trata de una crítica sin importancia.
Asus Vivobook Pro 16X K6604JV-MX016W análisis de audio
(+) | los altavoces pueden reproducir a un volumen relativamente alto (#87.4 dB)
Graves 100 - 315 Hz
(±) | lubina reducida - en promedio 14% inferior a la mediana
(±) | la linealidad de los graves es media (12.4% delta a frecuencia anterior)
Medios 400 - 2000 Hz
(+) | medios equilibrados - a sólo 1.2% de la mediana
(+) | los medios son lineales (3.7% delta a la frecuencia anterior)
Altos 2 - 16 kHz
(±) | máximos más altos - de media 7.1% más altos que la mediana
(+) | los máximos son lineales (4.8% delta a la frecuencia anterior)
Total 100 - 16.000 Hz
(+) | el sonido global es lineal (12.7% de diferencia con la mediana)
En comparación con la misma clase
» 24% de todos los dispositivos probados de esta clase eran mejores, 5% similares, 71% peores
» El mejor tuvo un delta de 5%, la media fue 17%, el peor fue ###max##%
En comparación con todos los dispositivos probados
» 12% de todos los dispositivos probados eran mejores, 3% similares, 86% peores
» El mejor tuvo un delta de 4%, la media fue 23%, el peor fue ###max##%
Apple MacBook Pro 16 2021 M1 Pro análisis de audio
(+) | los altavoces pueden reproducir a un volumen relativamente alto (#84.7 dB)
Graves 100 - 315 Hz
(+) | buen bajo - sólo 3.8% lejos de la mediana
(+) | el bajo es lineal (5.2% delta a la frecuencia anterior)
Medios 400 - 2000 Hz
(+) | medios equilibrados - a sólo 1.3% de la mediana
(+) | los medios son lineales (2.1% delta a la frecuencia anterior)
Altos 2 - 16 kHz
(+) | máximos equilibrados - a sólo 1.9% de la mediana
(+) | los máximos son lineales (2.7% delta a la frecuencia anterior)
Total 100 - 16.000 Hz
(+) | el sonido global es lineal (4.6% de diferencia con la mediana)
En comparación con la misma clase
» 0% de todos los dispositivos probados de esta clase eran mejores, 0% similares, 100% peores
» El mejor tuvo un delta de 5%, la media fue 17%, el peor fue ###max##%
En comparación con todos los dispositivos probados
» 0% de todos los dispositivos probados eran mejores, 0% similares, 100% peores
» El mejor tuvo un delta de 4%, la media fue 23%, el peor fue ###max##%
Gestión de la energía - i9 hambriento en el Vivobook
Consumo de energía
Sobre todo, el potentísimo i9-13980HX dispara el consumo de energía sin carga. Medimos una media de 16 W. Para comparar, el Samsung Galaxy Book3 Ultra, cuyo i7-13700H procesador no es mucho peor y cuya pantalla también es una OLED de 16 pulgadas, consume 5 W. En consecuencia, el VivoBook no es realmente eficiente en tareas sencillas.
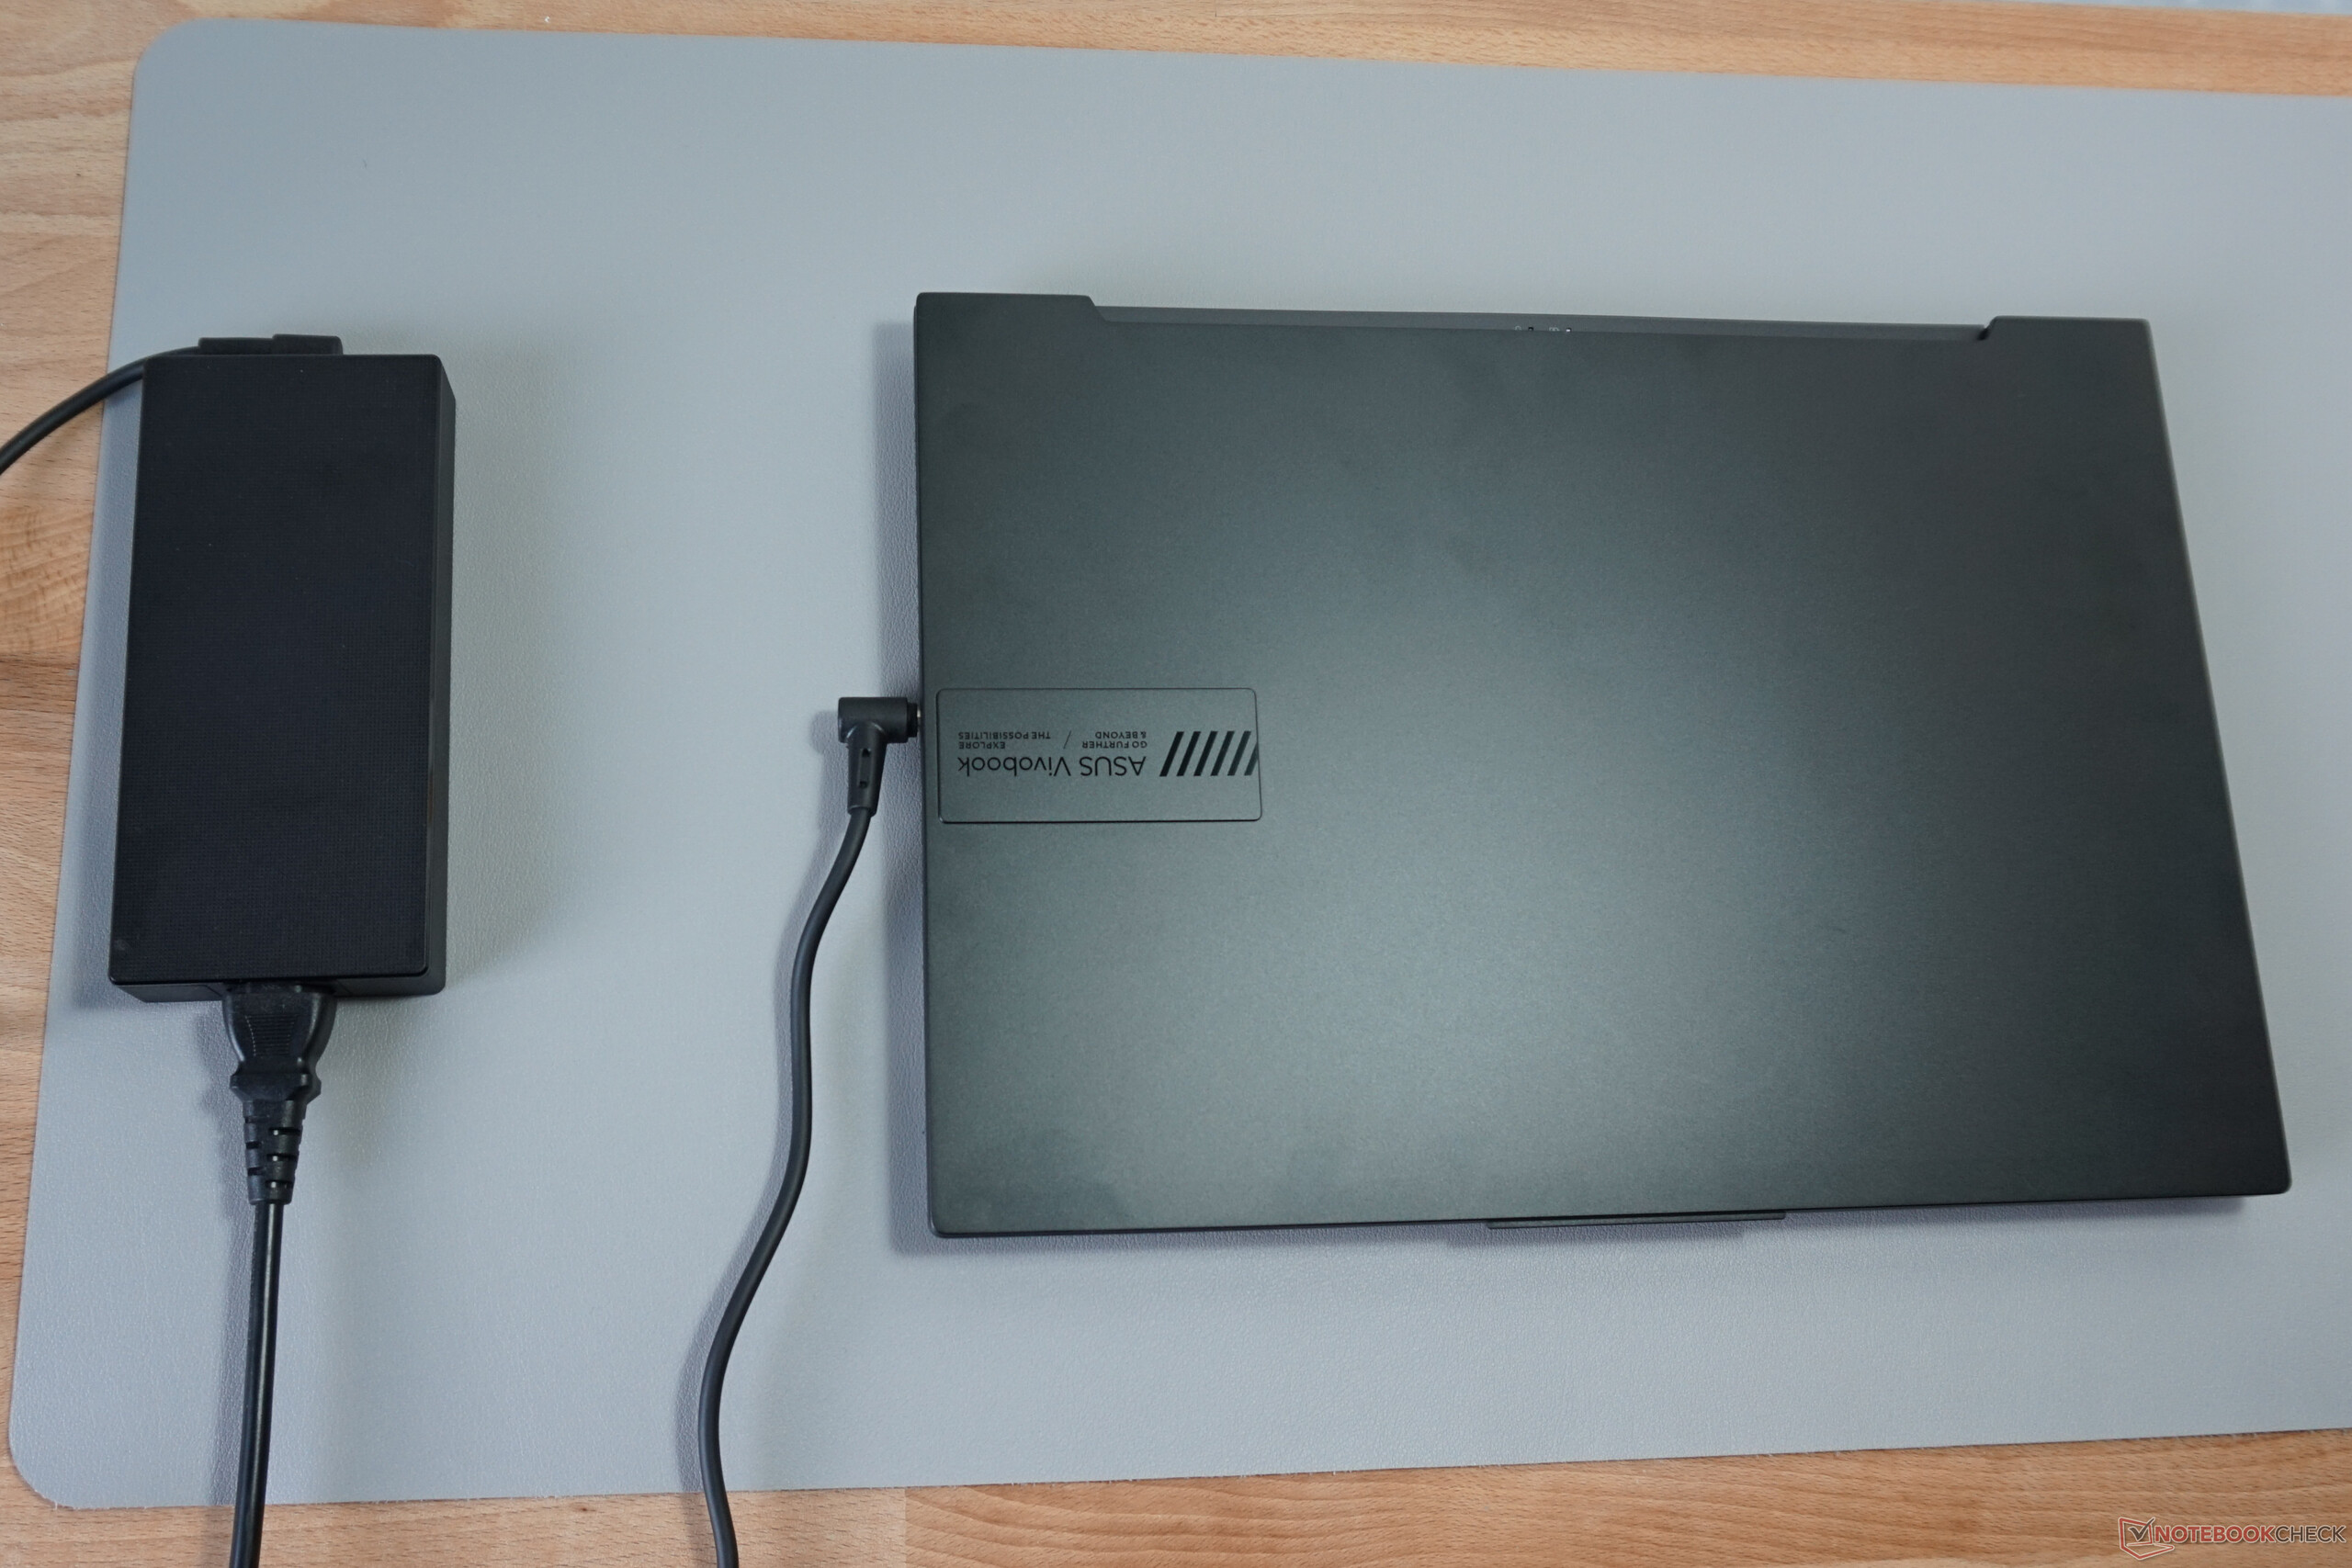
El consumo máximo de energía alcanza los 244 W, pero sólo muy brevemente. Una carga típica ronda los 150 W, por lo que la fuente de alimentación de 240 vatios está bien dimensionada.
| Off / Standby | |
| Ocioso | |
| Carga |
|
Clave:
min: | |
| Asus Vivobook Pro 16X K6604JV-MX016W i9-13980HX, GeForce RTX 4060 Laptop GPU, Solidigm P41 Plus SSDPFKNU010TZ, OLED, 3200x2000, 16" | Dell XPS 15 9530 RTX 4070 i7-13700H, GeForce RTX 4070 Laptop GPU, SK hynix PC801 HFS001TEJ9X101N, OLED, 3456x2160, 15.6" | Samsung Galaxy Book3 Ultra 16 i7-13700H, GeForce RTX 4050 Laptop GPU, Samsung PM9A1 MZVL2512HCJQ, AMOLED, 2880x1800, 16" | Asus ProArt Studiobook 16 OLED H7604 i9-13980HX, GeForce RTX 4070 Laptop GPU, Phison EM2804TBMTCB47, OLED, 3200x2000, 16" | Schenker VISION 16 Pro (M23) i7-13700H, GeForce RTX 4070 Laptop GPU, Samsung 990 Pro 1 TB, IPS, 2560x1600, 16" | MSI Creator Z17 A12UGST-054 i9-12900H, GeForce RTX 3070 Ti Laptop GPU, Micron 3400 1TB MTFDKBA1T0TFH, IPS, 2560x1600, 17" | Medio NVIDIA GeForce RTX 4060 Laptop GPU | Media de la clase Multimedia | |
|---|---|---|---|---|---|---|---|---|
| Power Consumption | 6% | 58% | -8% | 29% | -75% | 12% | 48% | |
| Idle Minimum * (Watt) | 13.8 | 20 -45% | 3 78% | 12.8 7% | 8.6 38% | 34.6 -151% | 11.5 ? 17% | 5.66 ? 59% |
| Idle Average * (Watt) | 16 | 20.7 -29% | 5 69% | 19.9 -24% | 12 25% | 43 -169% | 16 ? -0% | 10.2 ? 36% |
| Idle Maximum * (Watt) | 19 | 22.4 -18% | 11 42% | 20.3 -7% | 12.4 35% | 44.9 -136% | 20.3 ? -7% | 12.5 ? 34% |
| Load Average * (Watt) | 147 | 77.1 48% | 72 51% | 131.4 11% | 80 46% | 145 1% | 92.9 ? 37% | 65.2 ? 56% |
| Witcher 3 ultra * (Watt) | 147.8 | 95.4 35% | 69.7 53% | 196.5 -33% | 147.7 -0% | 152.4 -3% | ||
| Load Maximum * (Watt) | 244 | 133.4 45% | 108 56% | 246.8 -1% | 173.1 29% | 220 10% | 210 ? 14% | 113.5 ? 53% |
* ... más pequeño es mejor
Power consumption Witcher 3 / Stress test
Power consumption with an external monitor
Duración de la batería
El VivoBook sólo puede extraer cortas duraciones de la gran batería de 90 Wh, lo que se debe principalmente al alto consumo de energía de 13.8 W sin carga. En términos puramente matemáticos, esto debería resultar en una duración máxima de 6.5 horas, que en realidad se logra cuando se navega por internet con brillo reducido.
La navegación en modo oscuro aporta tres cuartos de hora más, pero el fondo de la página web siempre tiene que ser negro. La reproducción de vídeo en modo avión sólo dura algo menos de 5 horas.
Se podría conseguir mucho más con un procesador más eficiente y unos ajustes más moderados en general. Por ejemplo, elSamsung Galaxy Book3 Ultray su batería más pequeña logra 13 horas de reproducción de vídeo y casi 10 horas en nuestra prueba de navegación web.
Asus anuncia que la batería se carga un 50% tras 30 minutos, lo que se confirmó en nuestras pruebas.
| Asus Vivobook Pro 16X K6604JV-MX016W i9-13980HX, GeForce RTX 4060 Laptop GPU, 90 Wh | Dell XPS 15 9530 RTX 4070 i7-13700H, GeForce RTX 4070 Laptop GPU, 86 Wh | Samsung Galaxy Book3 Ultra 16 i7-13700H, GeForce RTX 4050 Laptop GPU, 76 Wh | Asus ProArt Studiobook 16 OLED H7604 i9-13980HX, GeForce RTX 4070 Laptop GPU, 90 Wh | Schenker VISION 16 Pro (M23) i7-13700H, GeForce RTX 4070 Laptop GPU, 80 Wh | MSI Creator Z17 A12UGST-054 i9-12900H, GeForce RTX 3070 Ti Laptop GPU, 90 Wh | Media de la clase Multimedia | |
|---|---|---|---|---|---|---|---|
| Duración de Batería | 12% | 74% | -9% | 18% | 12% | 107% | |
| H.264 (h) | 5.3 | 13.4 153% | 6 13% | 7.8 47% | 5.5 4% | 17.1 ? 223% | |
| WiFi v1.3 (h) | 6.5 | 8 23% | 9.6 48% | 5.6 -14% | 7.8 20% | 5.5 -15% | 12.2 ? 88% |
| Load (h) | 1.5 | 1.5 0% | 1.8 20% | 1.1 -27% | 1.3 -13% | 2.2 47% | 1.664 ? 11% |
Pro
Contra
Veredicto - Algo básico, pero muy rápido
Gracias a una pantalla OLED de colores precisos con 6 millones de píxeles, una RTX 4060 bien ajustada y un i9-13980HX extremadamente potente, el Asus VivoBook Pro 16X ofrece las cualidades perfectas para un portátil multimedia ambicioso. Además, la refrigeración en la relativamente compacta carcasa es sólida, no molesta en ajustes estándar y es casi imperceptible en modo silencioso .
Tal vez no tan elegante, pero ciertamente a la par con el modelo premium Asus Studiobook en términos de competencias básicas.
También está la rueda de control, que no está físicamente presente, sino integrada en el touchpad. Las funciones básicas y la programación adicional del software "Asus ProArt" amplían enormemente las opciones de manejo. Y tampoco hay lagunas en la conectividad.
Las diferencias con el considerablemente más caro Asus ProArt Studiobook 16 OLED se encuentran fuera de la pantalla y los valores de rendimiento. La carcasa no está construida muy sólidamente, lo que también impacta negativamente en el teclado. Además, el enfriamiento no es tan convincente en situaciones extremas, pero realmente no tiene que serlo. Desde un punto de vista pragmático, el VivoBook Pro 16X es por tanto la opción preferible.
El Samsung Galaxy Book3 Ultra 16 no es tan rápido, pero tiene mucha más resistencia y es incluso más delgado.
Precio y disponibilidad
En Estados Unidos, el Asus Vivobook Pro 16X viene en varias configuraciones. Amazon, por ejemplo, ofrece la variante más potente (CPU Intel Core i9-13980HX, GPU RTX 4070, 32 GB de RAM, 1 TB SSD) a un precio rebajado de 1.994,99 dólares. Best Buy ofrece una variante idéntica, pero solo con 16 GB de RAM, por 1.999,99 dólares. Cambia la RTX 4070 por una RTX 4060 y tendrás otra variante por 1 .799,99 dólares.
Los precios son a fecha de 26.07.2023 y están sujetos a cambios.
Asus Vivobook Pro 16X K6604JV-MX016W
- 07/25/2023 v7 (old)
Mario Petzold
Transparencia
La selección de los dispositivos que se van a reseñar corre a cargo de nuestro equipo editorial. La muestra de prueba fue proporcionada al autor en calidad de préstamo por el fabricante o el minorista a los efectos de esta reseña. El prestamista no tuvo ninguna influencia en esta reseña, ni el fabricante recibió una copia de la misma antes de su publicación. No había ninguna obligación de publicar esta reseña. Como empresa de medios independiente, Notebookcheck no está sujeta a la autoridad de fabricantes, minoristas o editores.
Así es como prueba Notebookcheck
Cada año, Notebookcheck revisa de forma independiente cientos de portátiles y smartphones utilizando procedimientos estandarizados para asegurar que todos los resultados son comparables. Hemos desarrollado continuamente nuestros métodos de prueba durante unos 20 años y hemos establecido los estándares de la industria en el proceso. En nuestros laboratorios de pruebas, técnicos y editores experimentados utilizan equipos de medición de alta calidad. Estas pruebas implican un proceso de validación en varias fases. Nuestro complejo sistema de clasificación se basa en cientos de mediciones y puntos de referencia bien fundamentados, lo que mantiene la objetividad.Price comparison

