Análisis del portátil Asus TUF Gaming F17: El buen rendimiento 3D y la duración de la batería se unen a una pantalla poco brillante
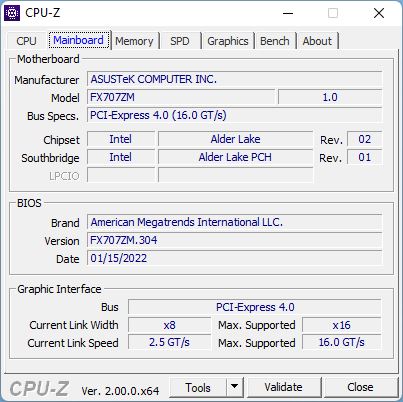
Tras la pequeña actualización del año pasado, Asus ha optado por una importante revisión de su asequible portátil de juego de 17 pulgadas este año. El resultado es una carcasa de nuevo diseño y actualizada, una CPU Intel Alder Lake con soporte de RAM DDR5, y un total de cuatro opciones de GPU incluyendo la GTX 3060 de nuestro modelo de pruebas.
Además de su predecesor inmediato de la 11ª generación, incluimos en nuestro grupo de comparación una serie de portátiles de 17 pulgadas para juegos, como el Lenovo Legion 5 17y el MSI GE76 Raider (misma CPU), el MSI Katana GF76 (misma GPU con CPU de 11ª generación), y el Schenker XMG Core 17 (CPU de 10ª generación).
Posibles contendientes en la comparación
Valoración | Fecha | Modelo | Peso | Altura | Tamaño | Resolución | Precio |
|---|---|---|---|---|---|---|---|
| 84.1 % v7 (old) | 04/2022 | Asus TUF Gaming F17 FX707Z-HX011W i7-12700H, GeForce RTX 3060 Laptop GPU | 2.5 kg | 25 mm | 17.30" | 1920x1080 | |
| 82.8 % v7 (old) | 06/2021 | Asus TUF Gaming F17 FX706HM i9-11900H, GeForce RTX 3060 Laptop GPU | 2.7 kg | 26 mm | 17.30" | 1920x1080 | |
| 85.2 % v7 (old) | 02/2022 | Lenovo Legion 5 17ACH6H-82JY0003GE R5 5600H, GeForce RTX 3060 Laptop GPU | 3.1 kg | 24.3 mm | 17.30" | 1920x1080 | |
| 87.5 % v7 (old) | 01/2022 | MSI GE76 Raider i9-12900HK, GeForce RTX 3080 Ti Laptop GPU | 3 kg | 26 mm | 17.30" | 1920x1080 | |
| 80.4 % v7 (old) | 06/2021 | MSI Katana GF76 11UE i7-11800H, GeForce RTX 3060 Laptop GPU | 2.7 kg | 25.2 mm | 17.30" | 1920x1080 | |
| 83.9 % v7 (old) | 06/2021 | Schenker XMG Core 17 (Early 2021) i7-10870H, GeForce RTX 3060 Laptop GPU | 2.5 kg | 30.05 mm | 17.30" | 2560x1440 |
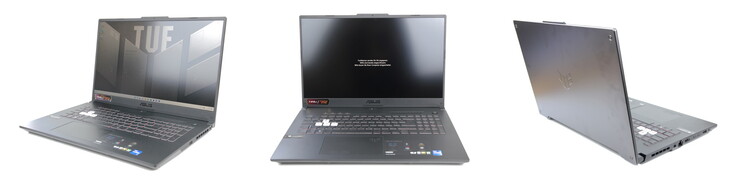
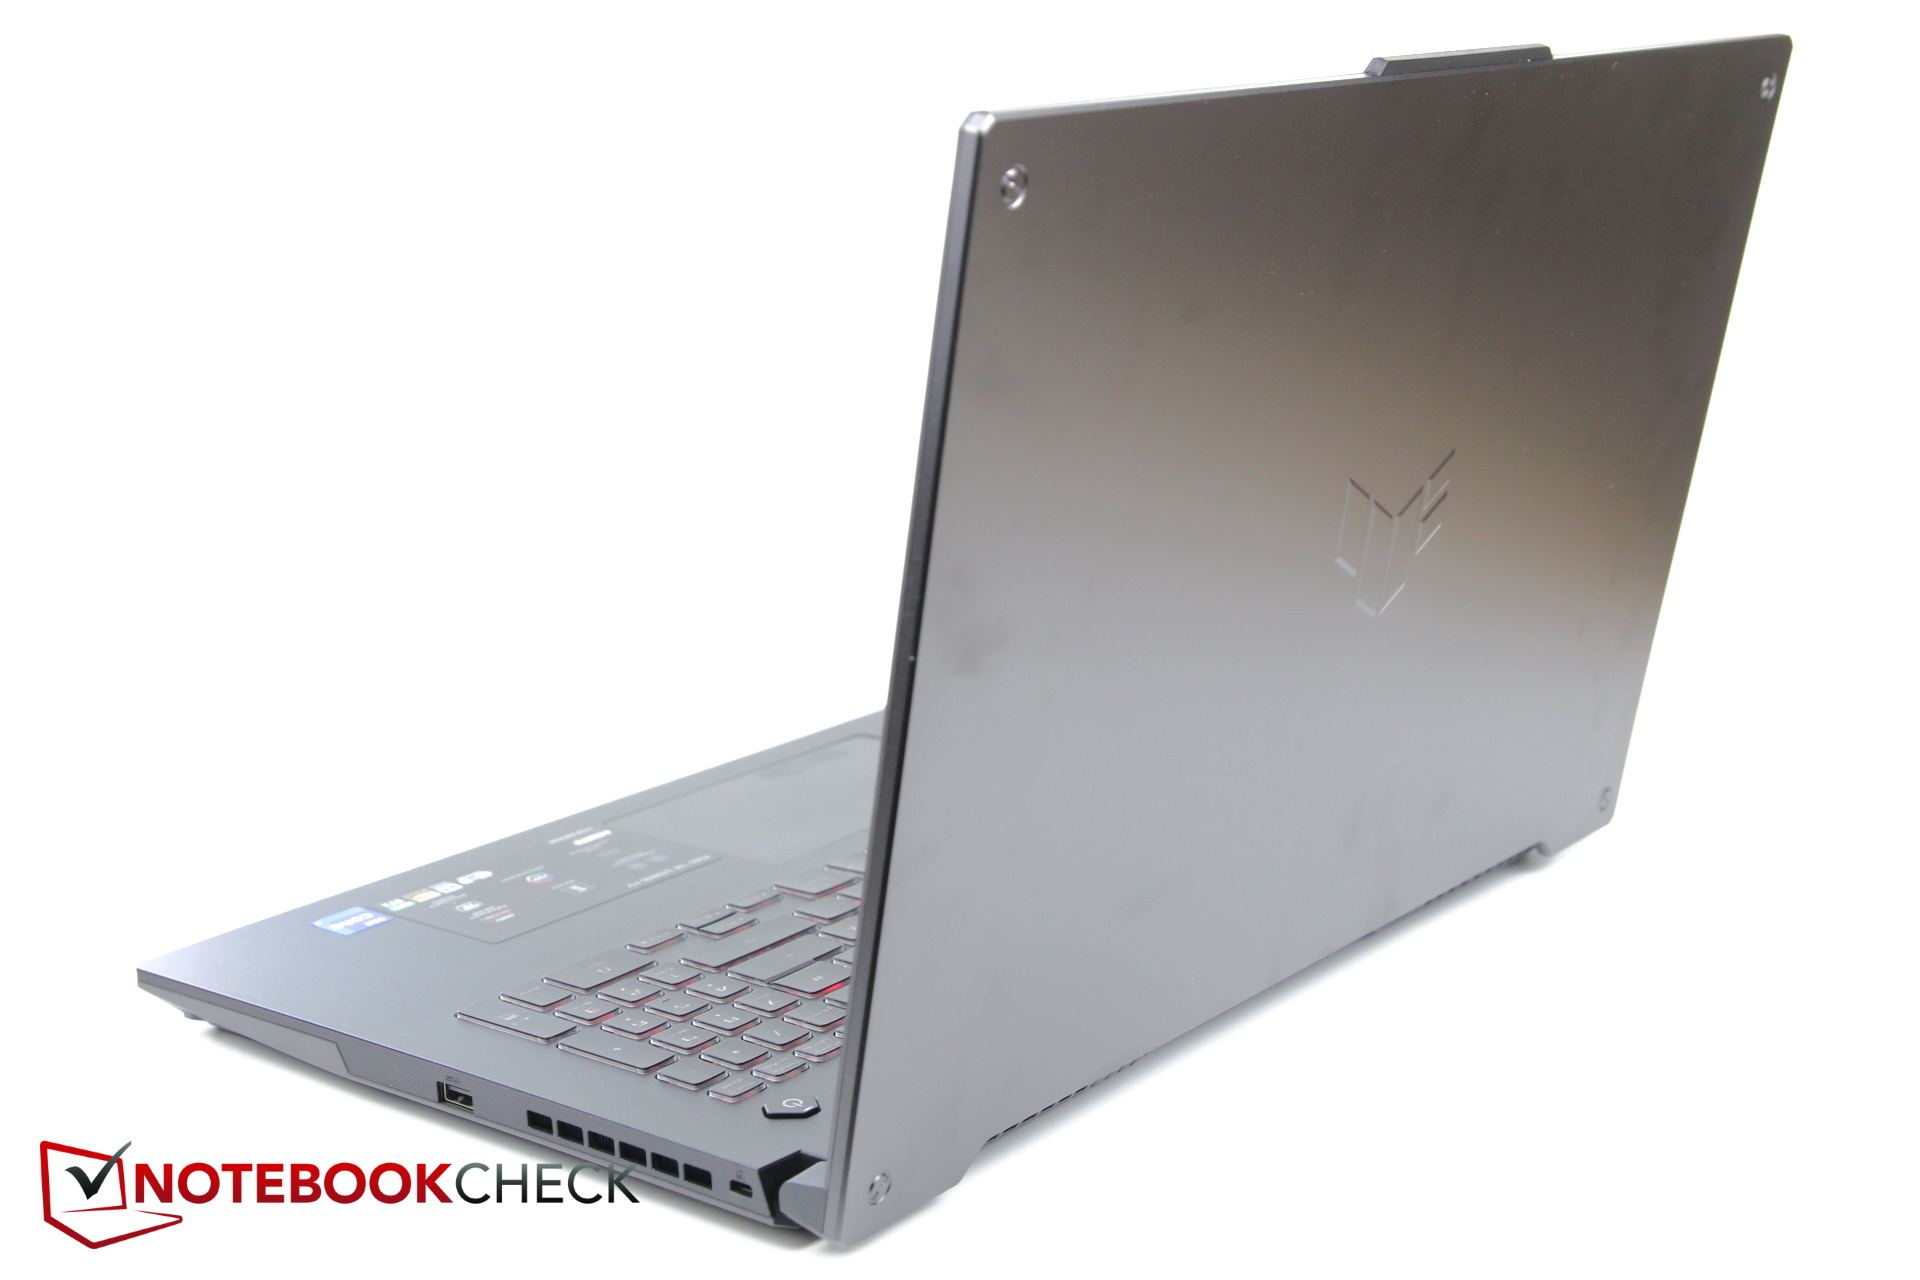
Caja - Tapa de metal, base de plástico
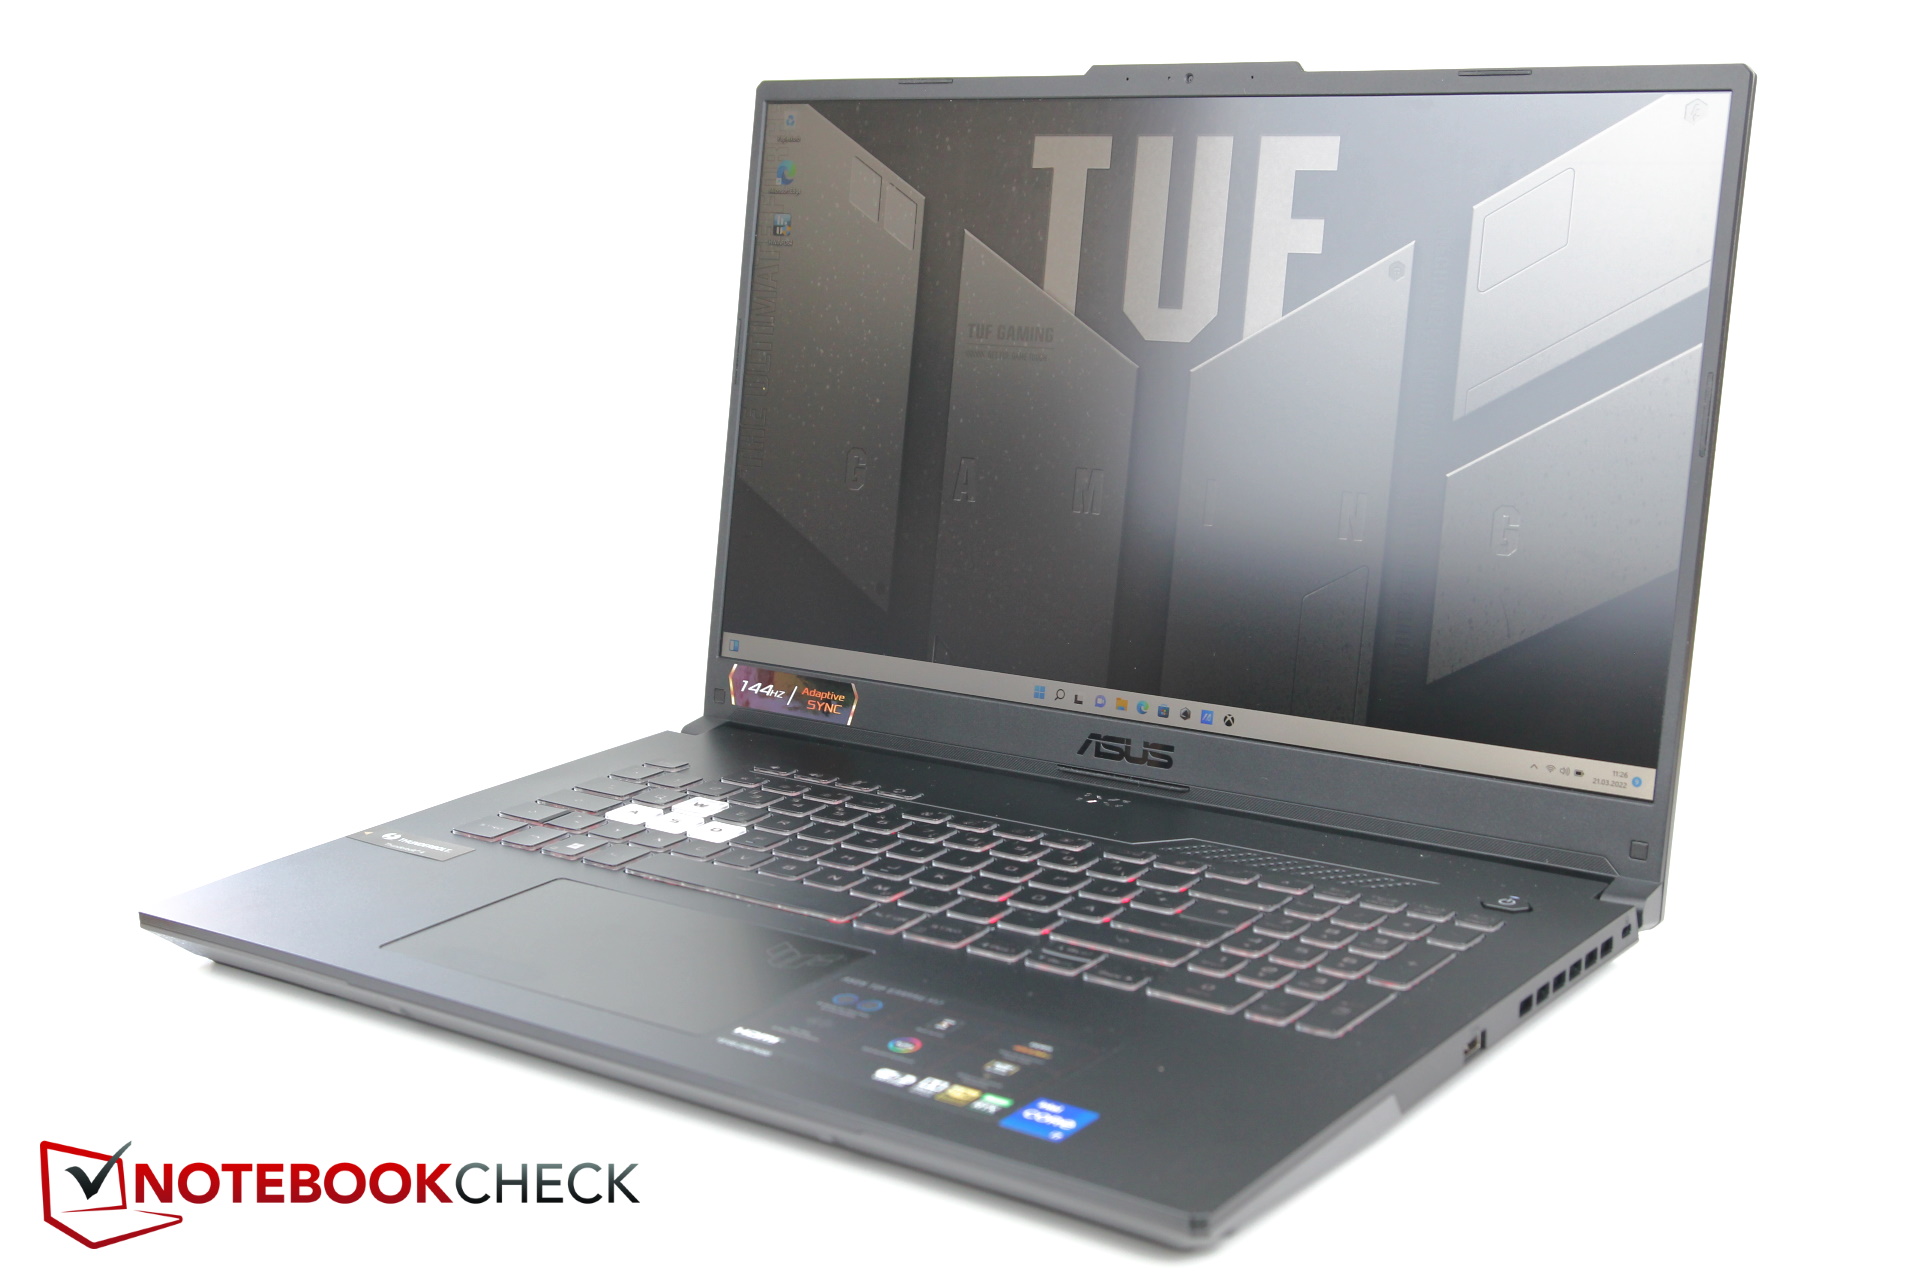
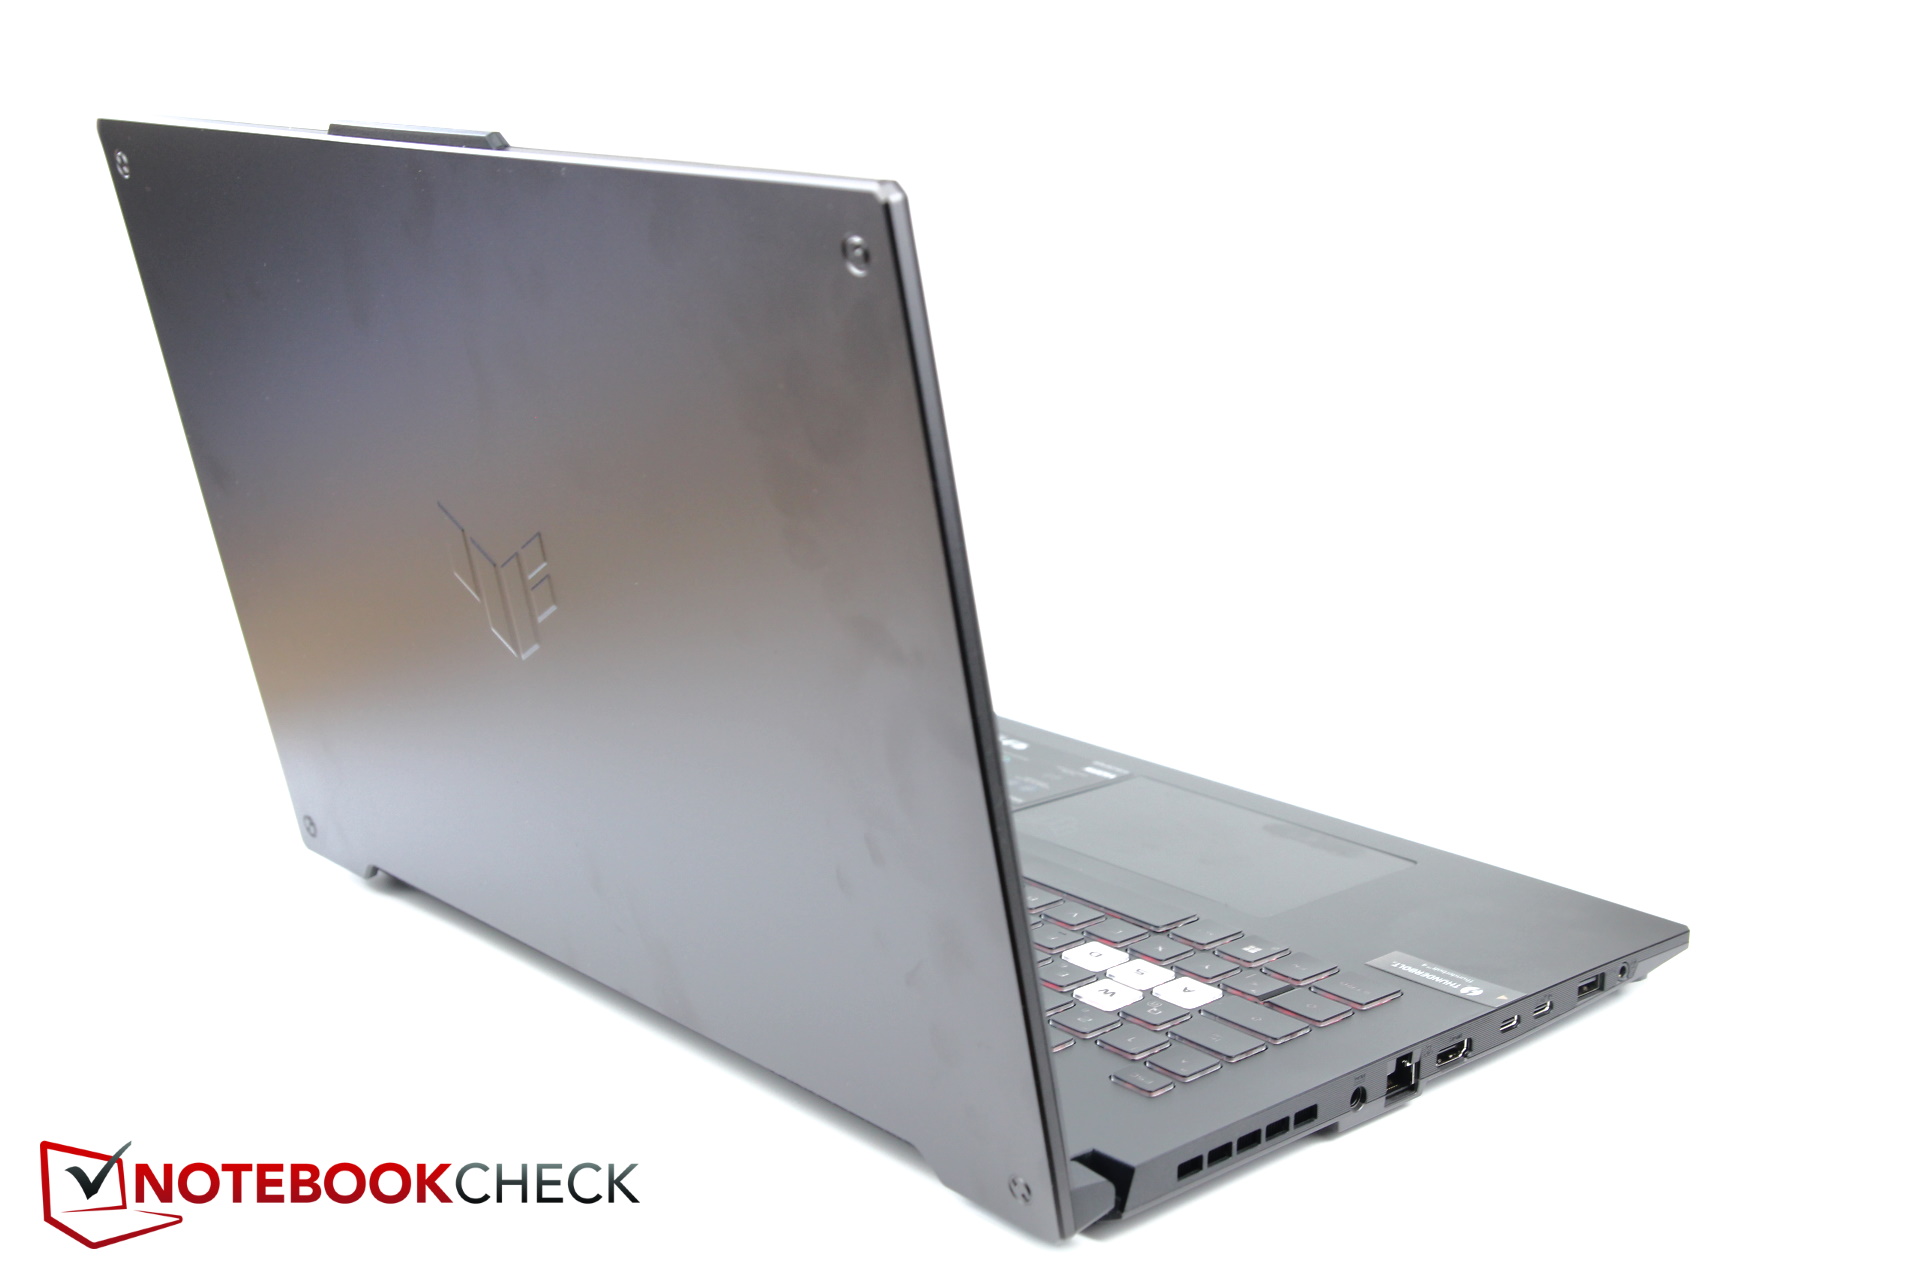
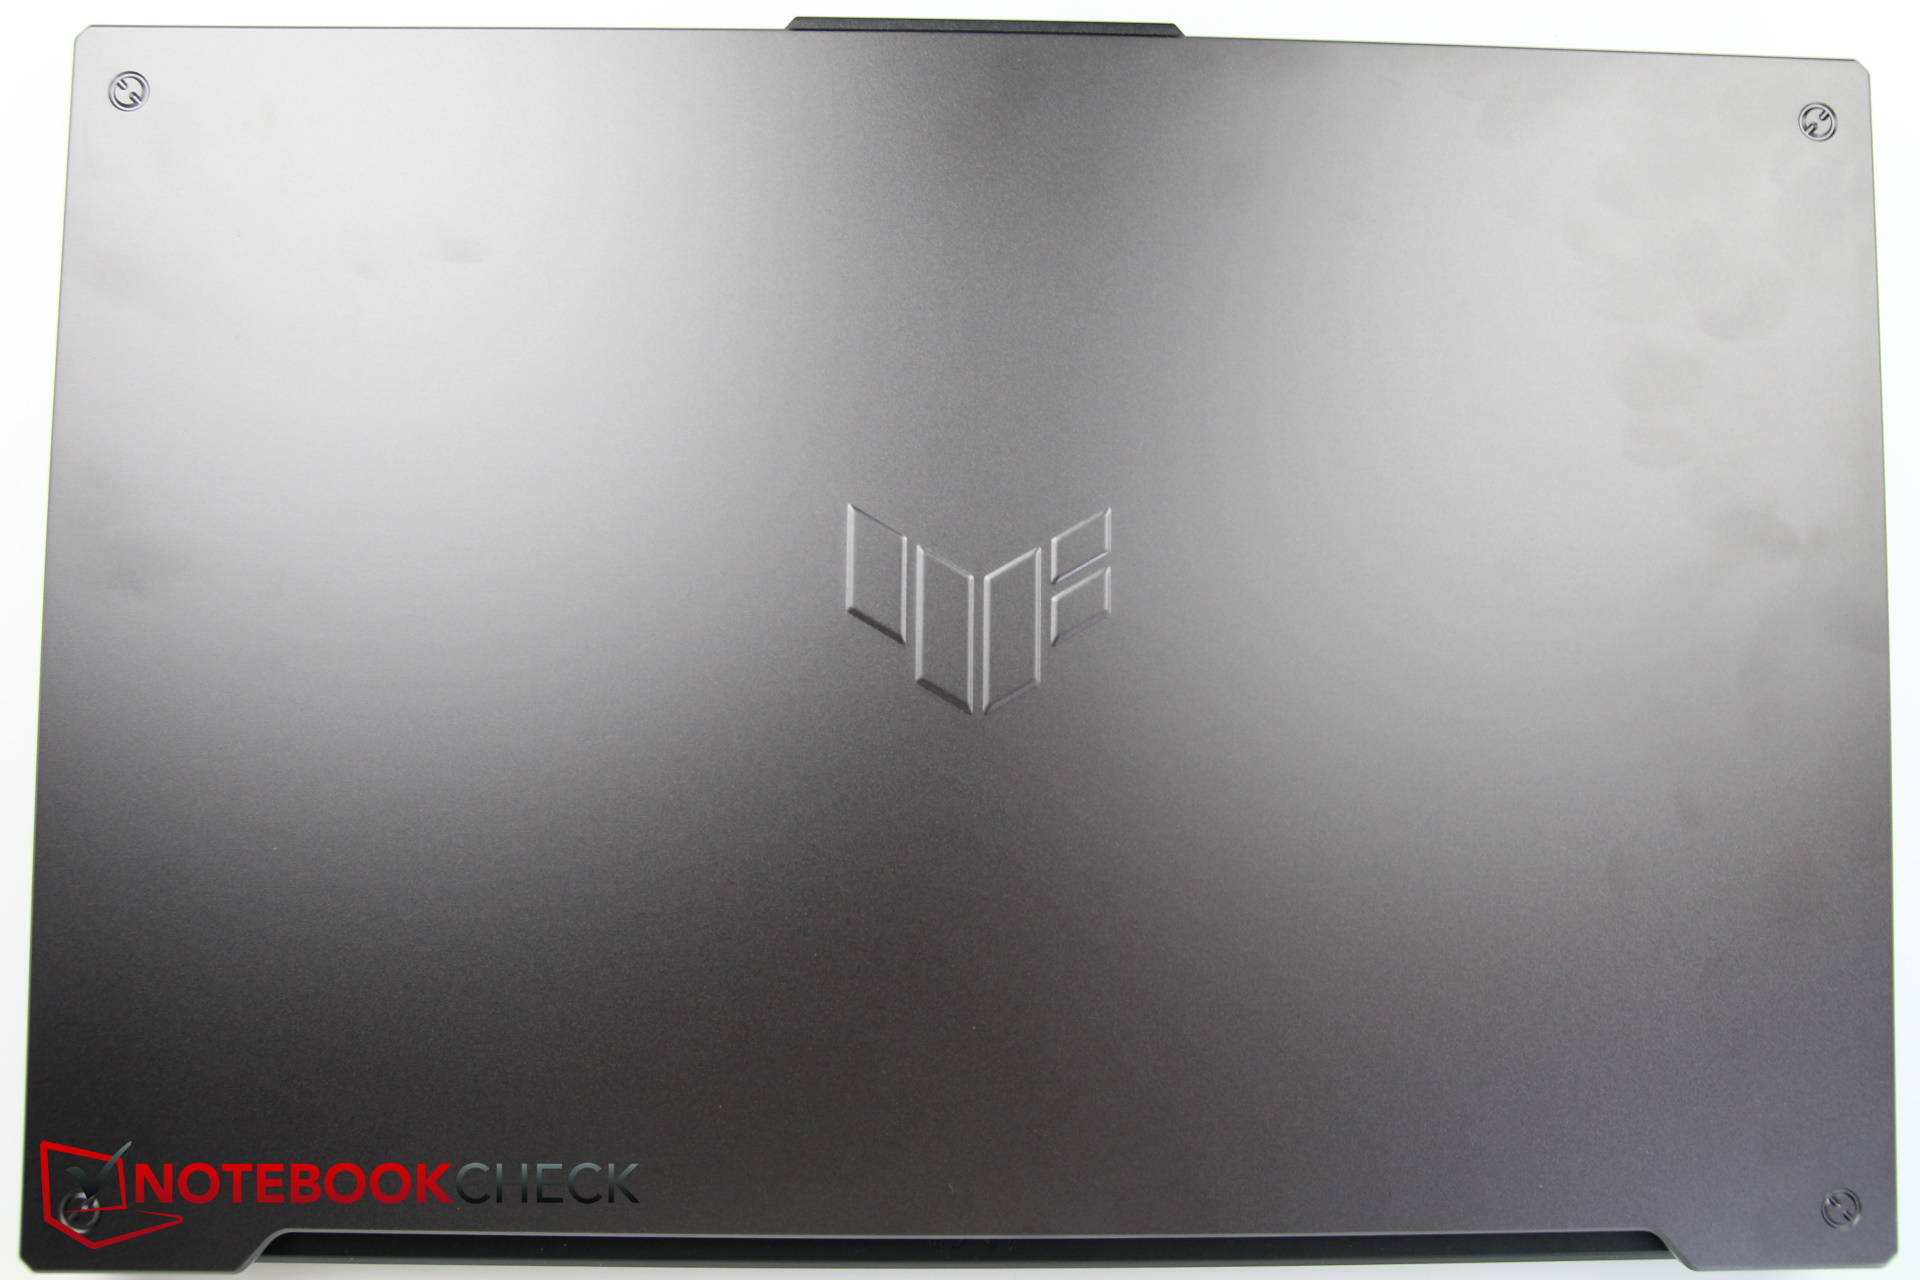
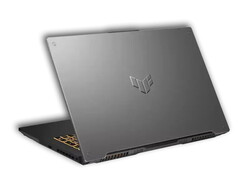
El diseño actualizado viene en colores similares a su predecesor. Se ha eliminado el logotipo de TUF, que antes era muy prominente, y se ha sustituido por una impresión mucho más pequeña que sobresale en el centro de la tapa metálica de la pantalla. Las esquinas adornadas con "falsos tornillos" no han cambiado.
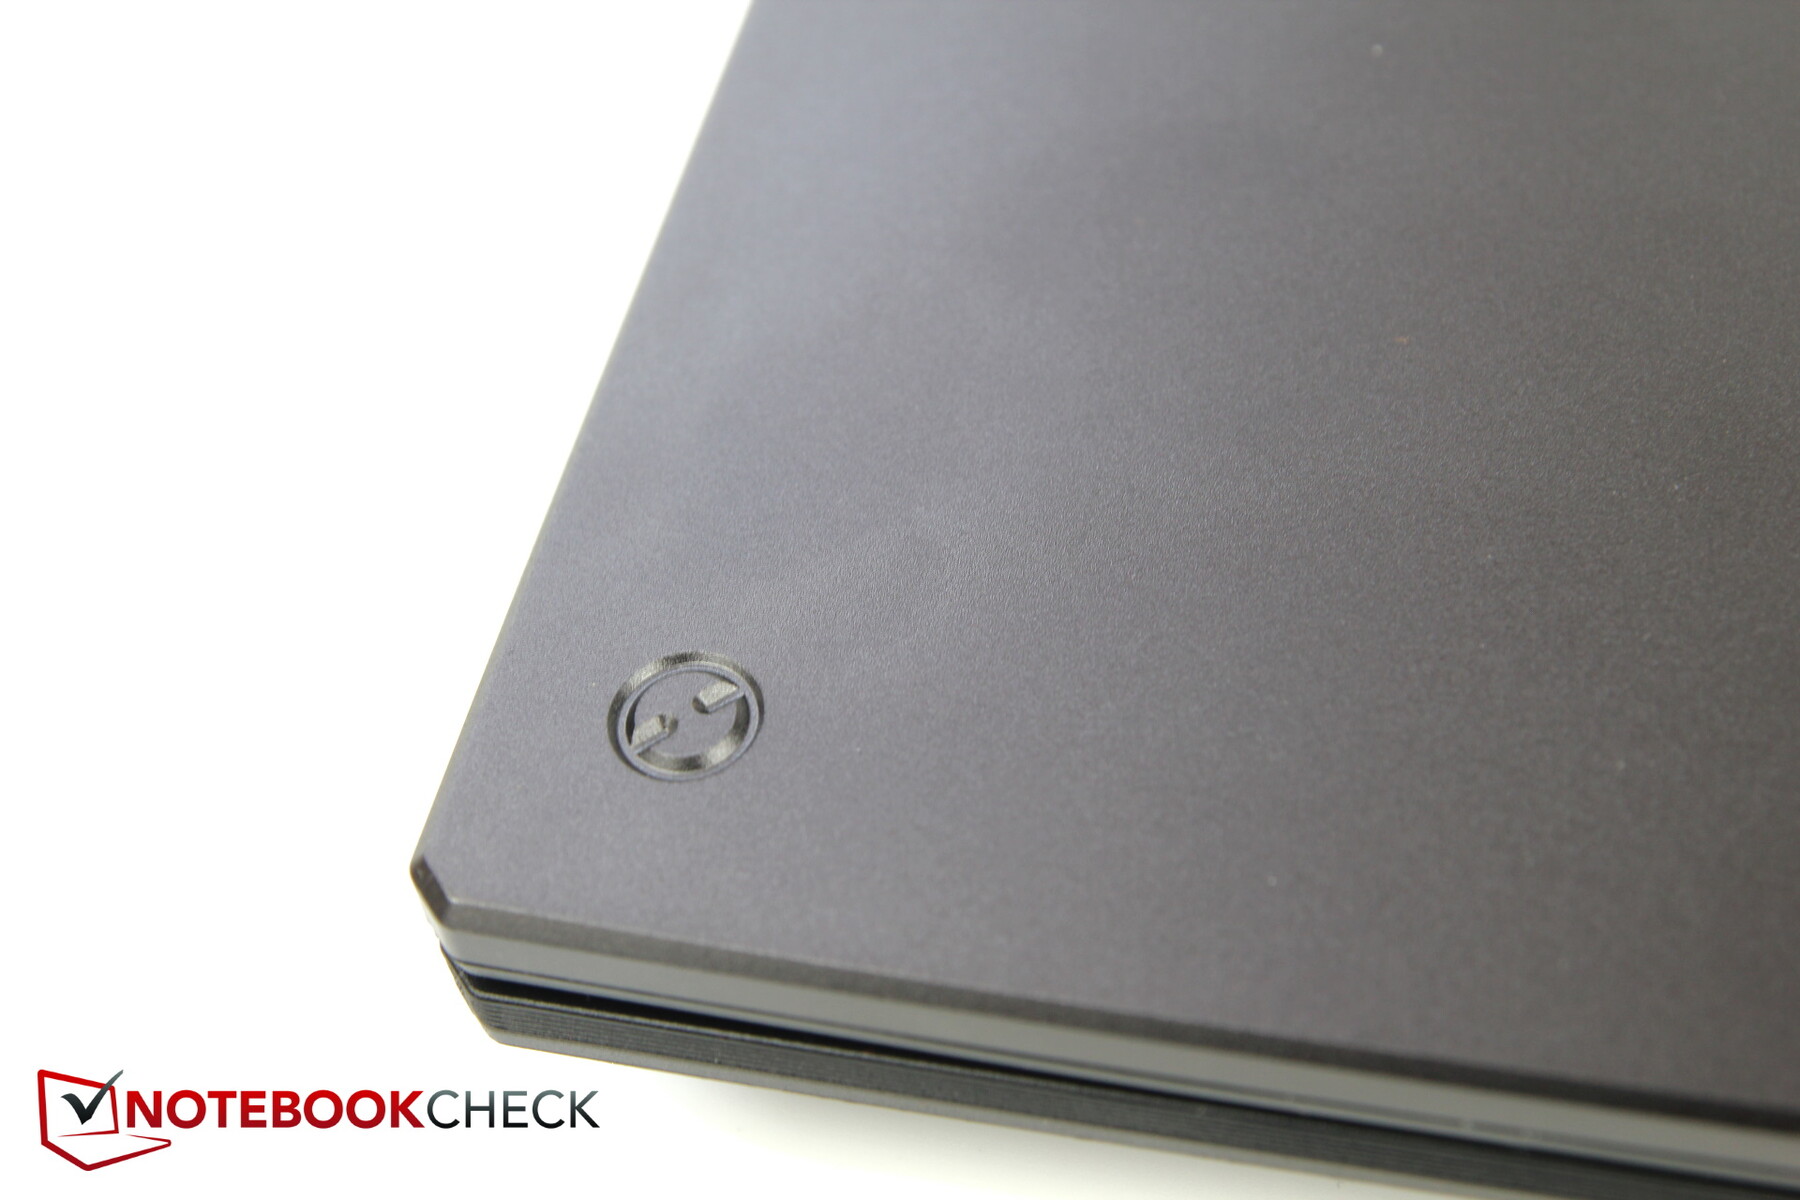
En la parte superior encontramos una especie de muesca física sobresaliente que alberga la cámara y los micrófonos y que sirve de pestillo para abrir la tapa de la pantalla. No hay forma de abrir el portátil con una sola mano; se necesitan las dos.
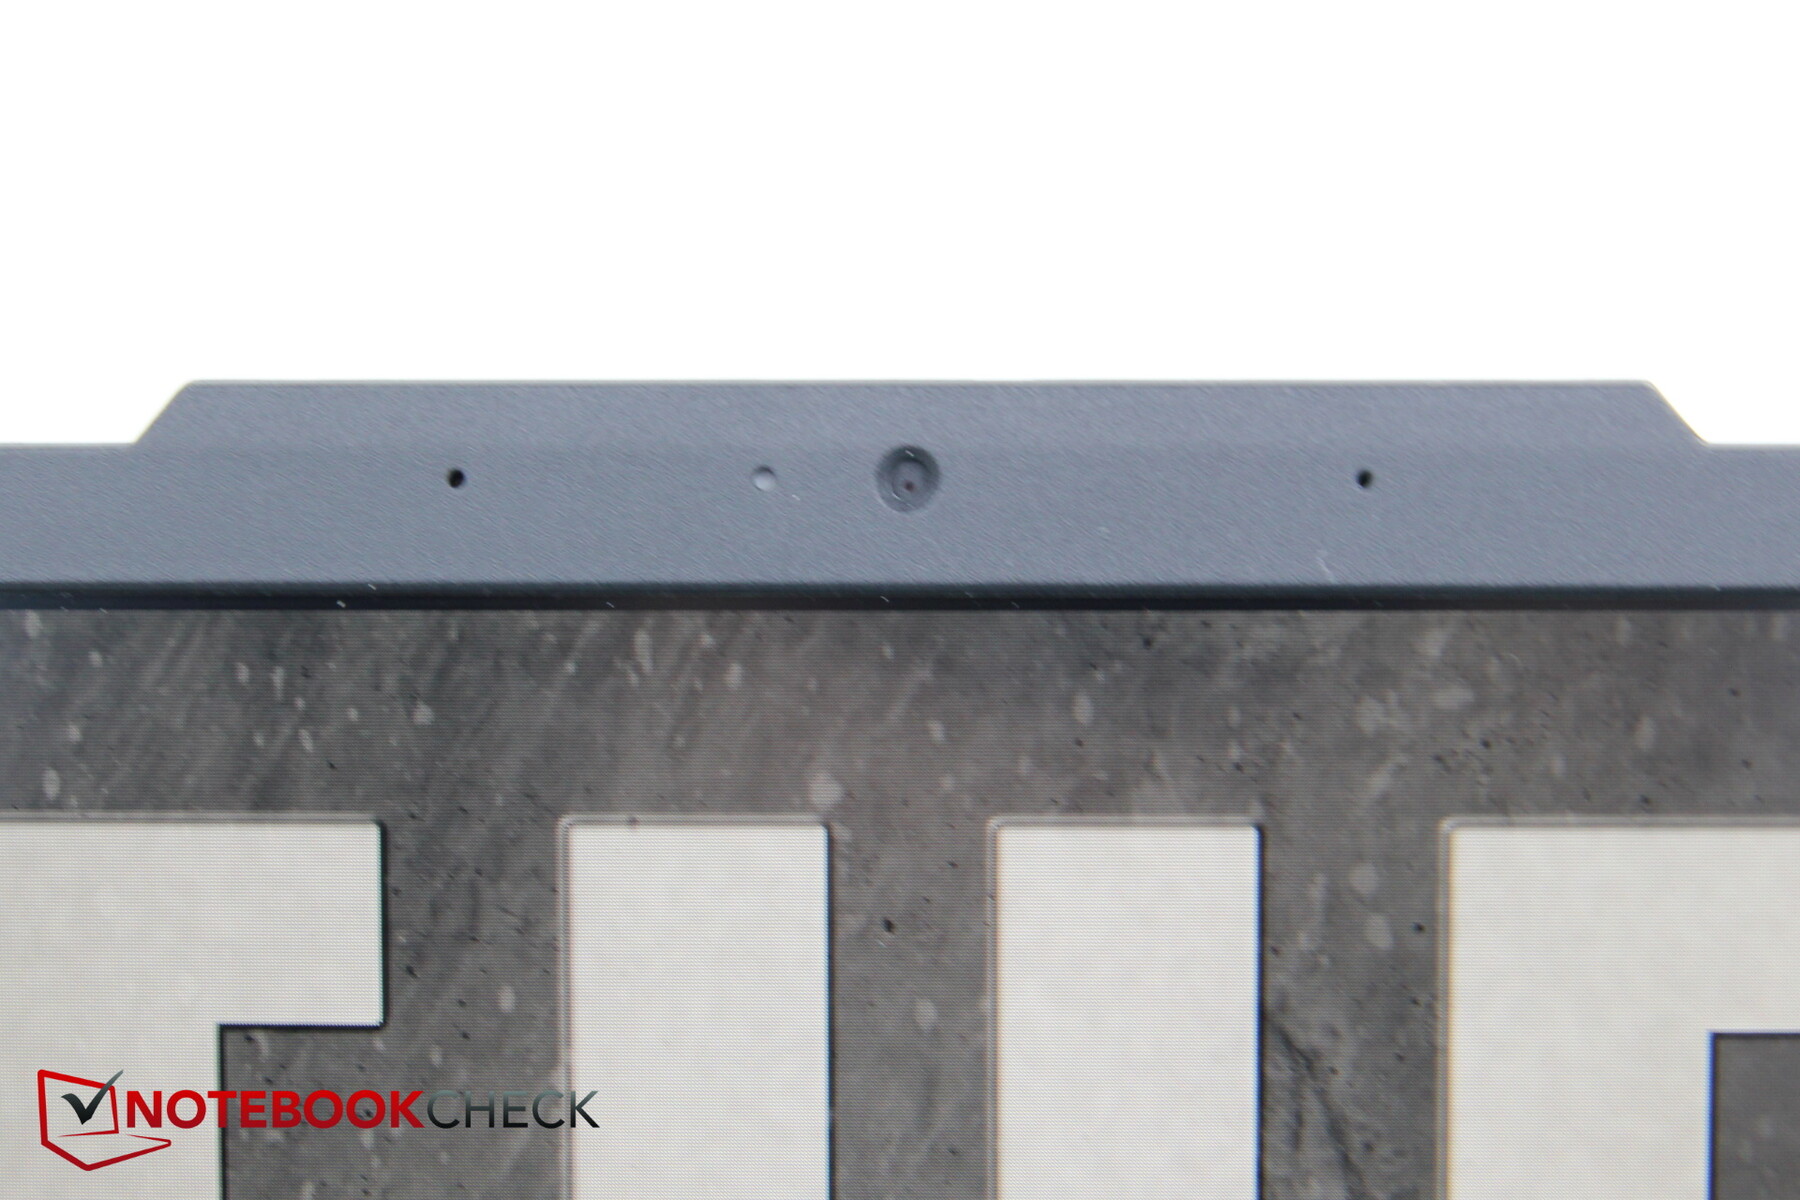
Con la tapa de la pantalla cerrada, un pequeño panel LED en forma de estrella muestra el estado actual del portátil, por ejemplo, si se está cargando o si se ha puesto en modo avión.
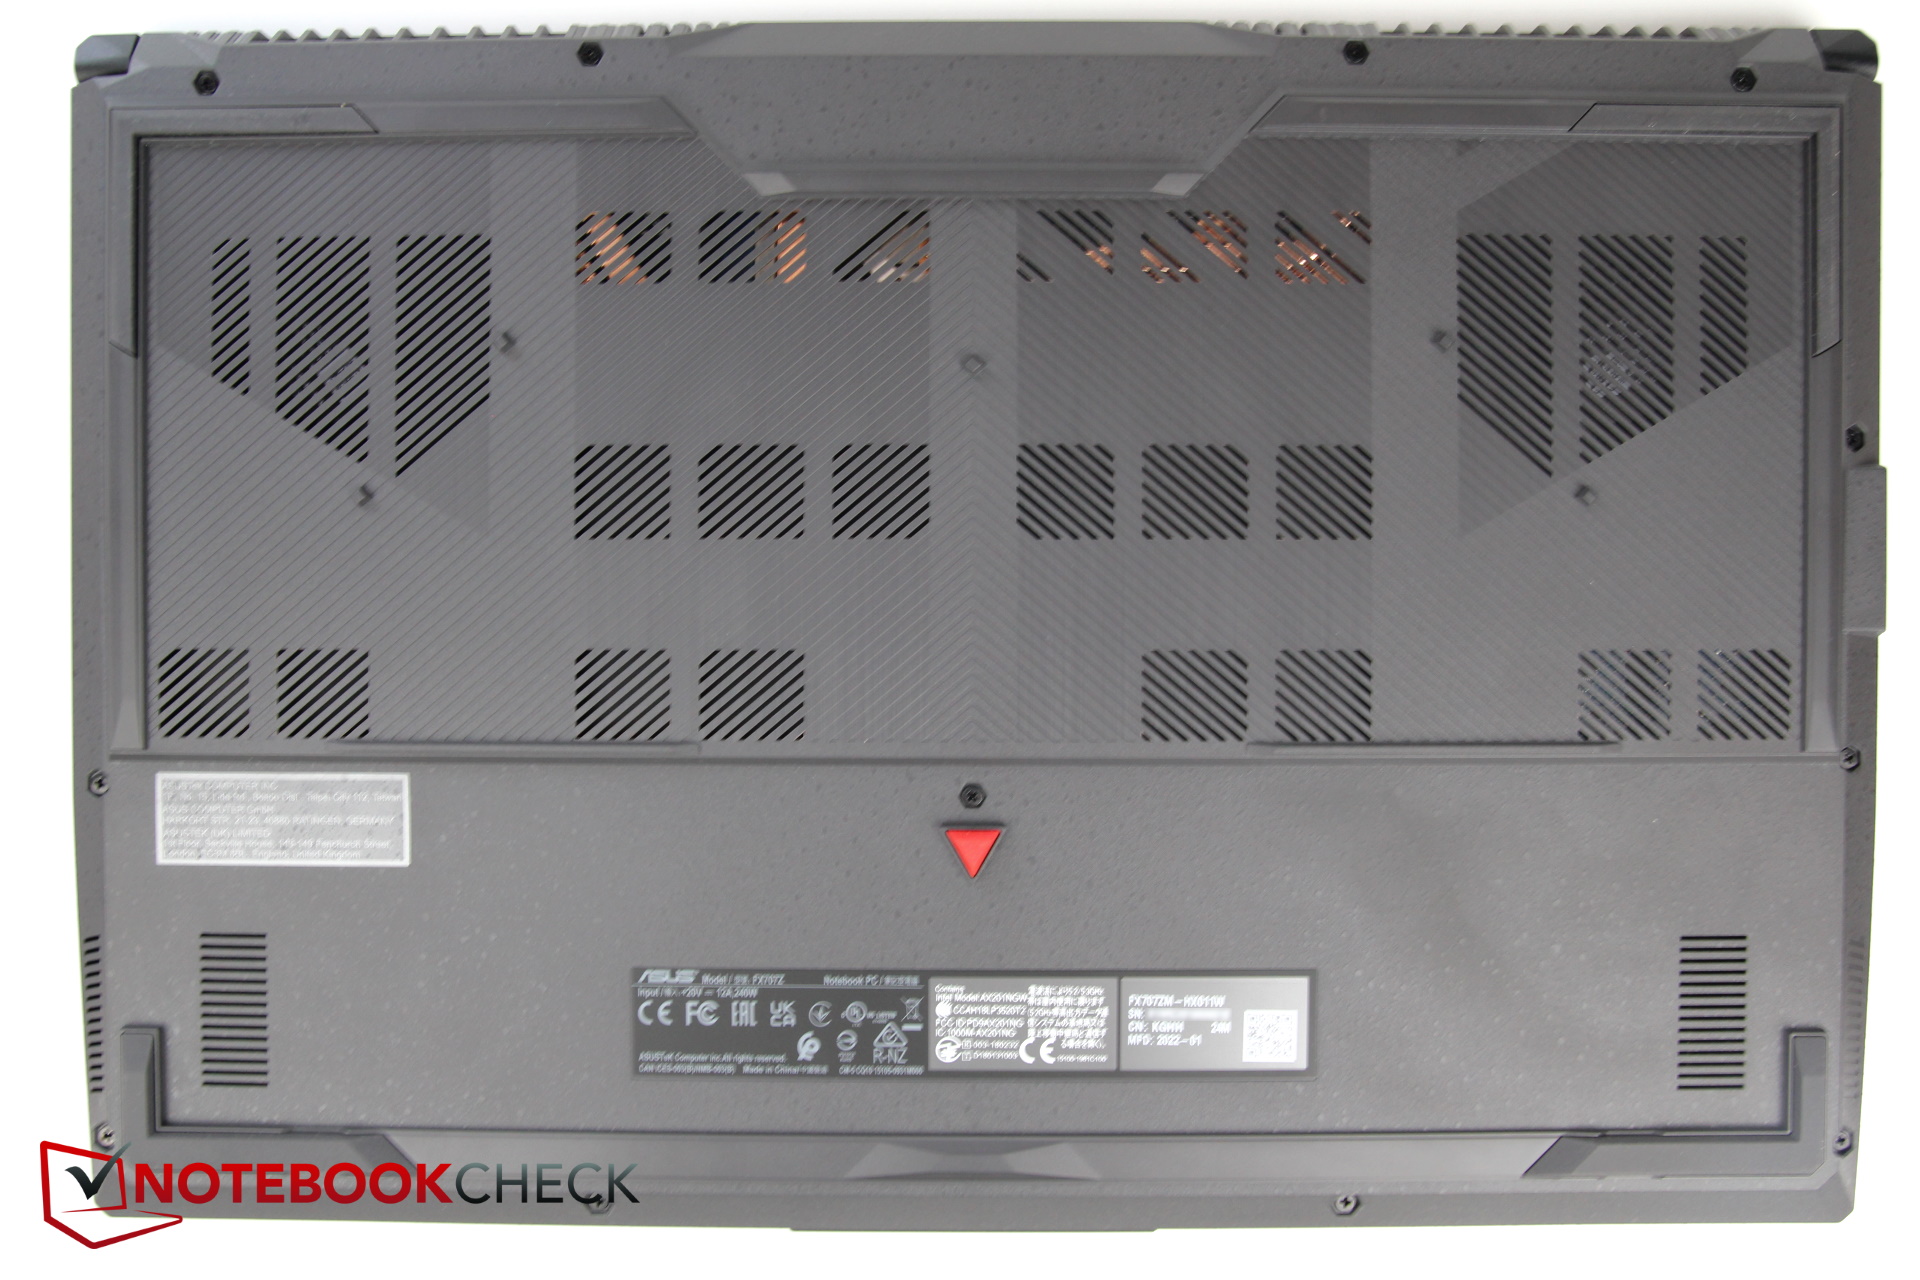
Otra diferencia se encuentra con la tapa de la pantalla abierta. La base, hecha de plástico resistente, ya no está adornada con "elegantes" degradados, sino que está completamente nivelada y, por tanto, plana. En consecuencia, el teclado ya no está empotrado en la carcasa superior.
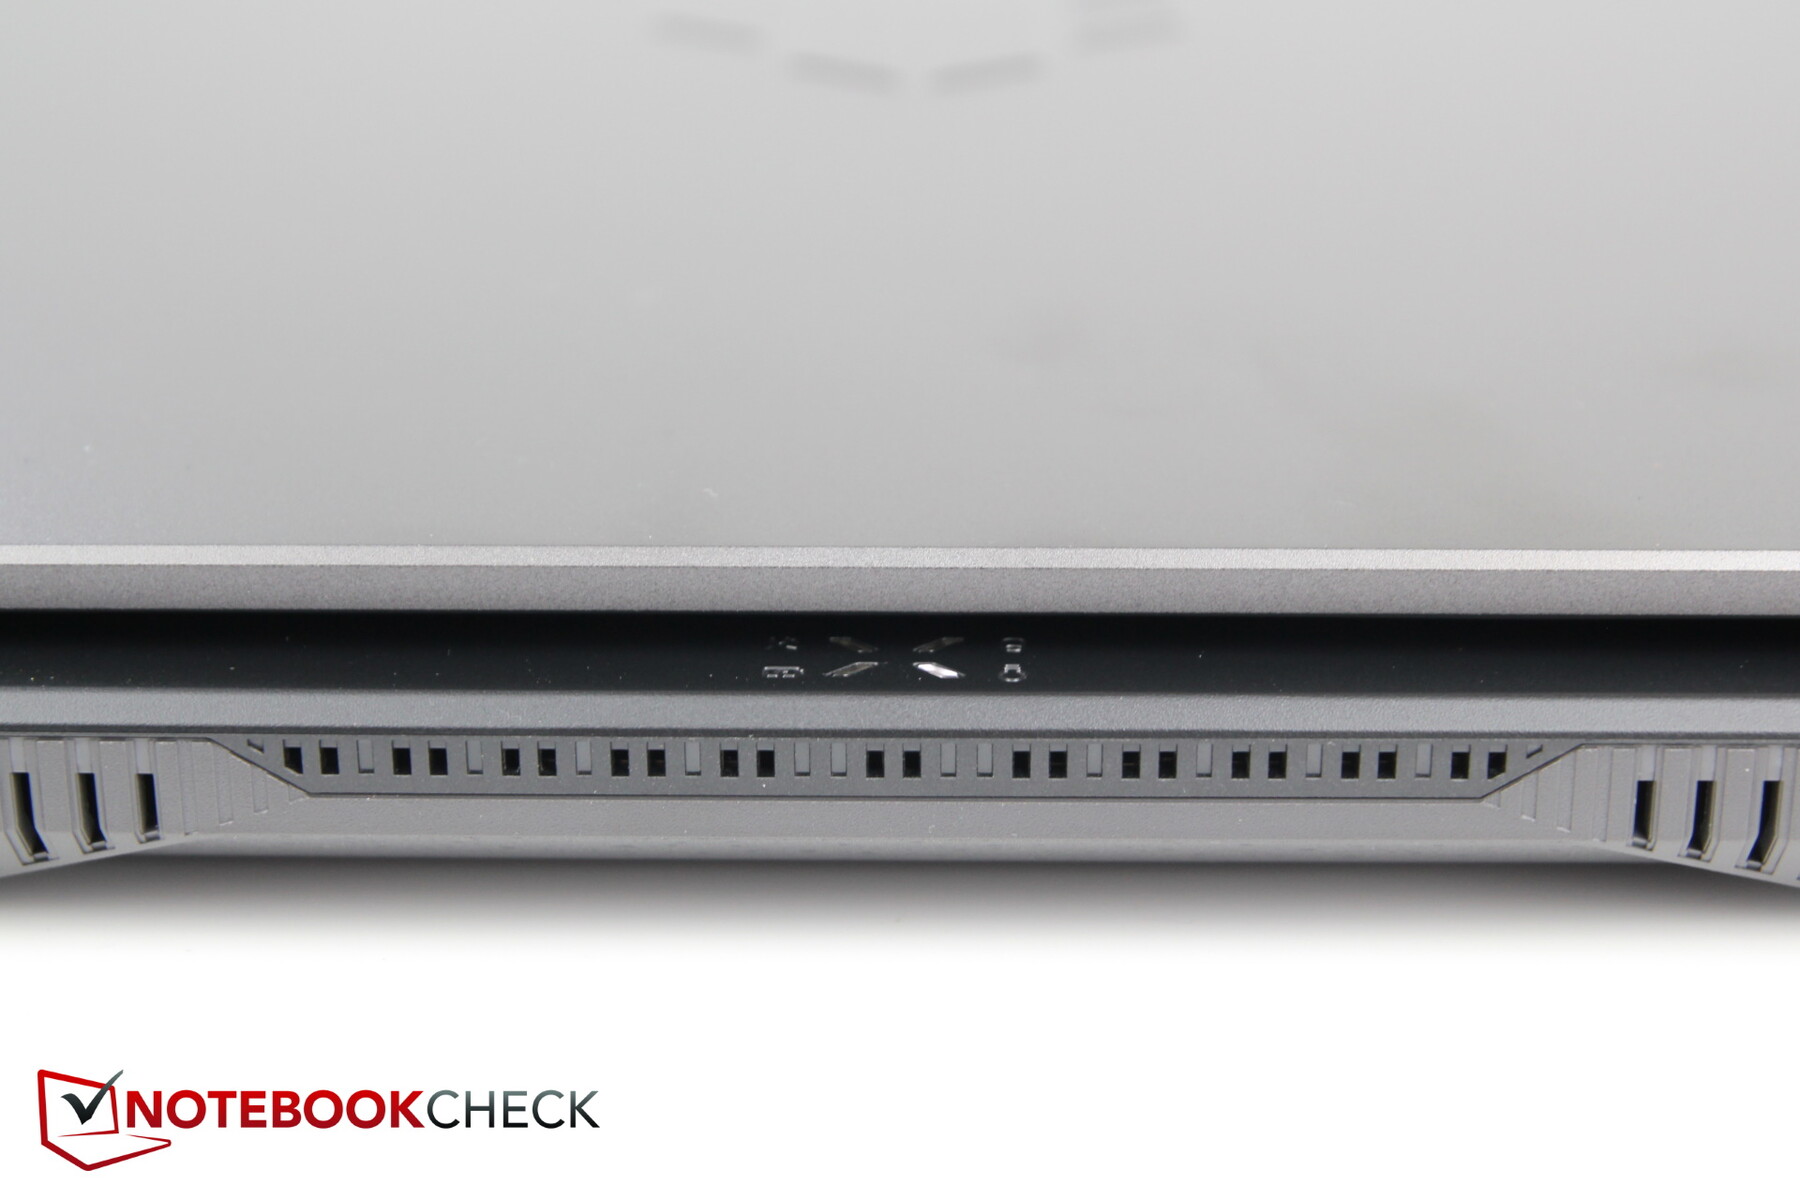
Las rejillas de ventilación ya no están situadas a lo largo de toda la anchura del aparato, sino que se han hecho mucho más pequeñas y ahora están situadas en el lado derecho.

En cuanto al grosor, las especificaciones oficiales de Asus de 22,9 mm son engañosas. Puede que sólo tenga ese grosor en su punto más delgado, sin embargo, más del 50% de su superficie se eleva otros 2-3 mm, lo que da como resultado un grosor en el mundo real más cercano a los 25 mm.
En términos de espacio, el nuevo diseño es ligeramente más estrecho que su predecesor por unos pocos milímetros, y ha sido capaz de reducir unos 200 g (7 oz) de peso.
La mayoría de sus competidores (ciertamente más antiguos) son más grandes, excepto el Lenovo Legion, ligeramente más delgado pero significativamente más pesado.
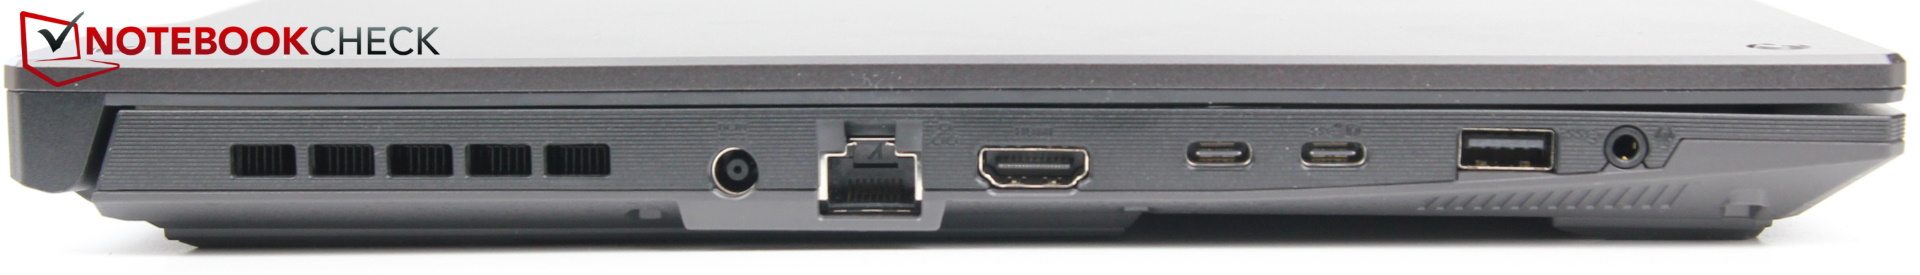
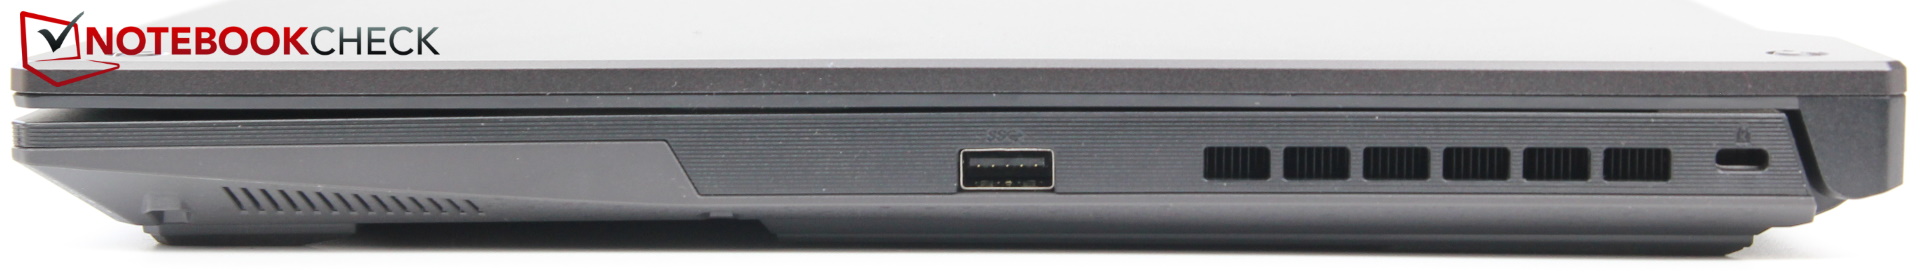
Conectividad - Thunderbolt 4; Wi-Fi deficiente
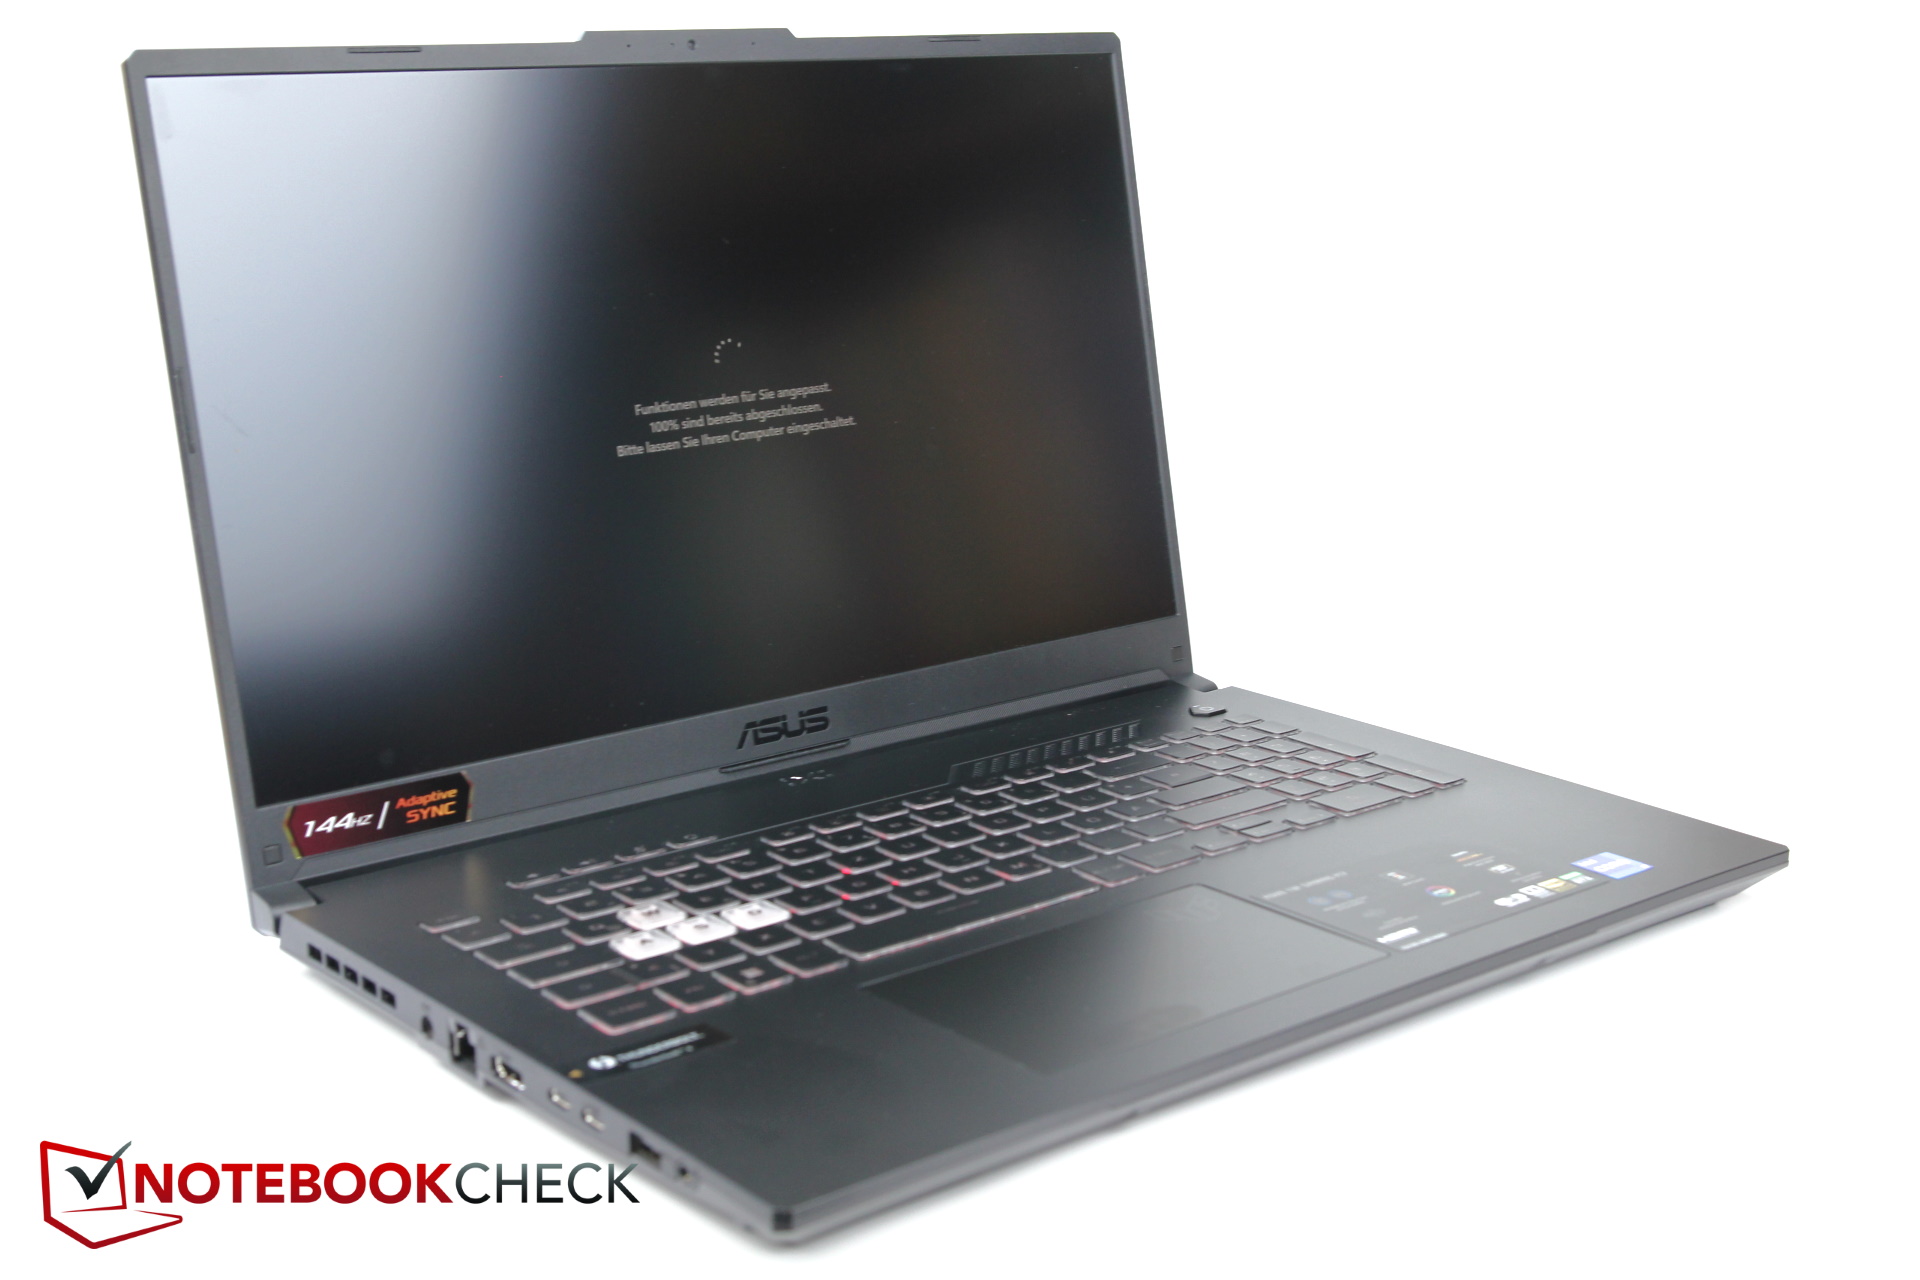
Los puertos se han mantenido en gran medida idénticos a los de su predecesor, con la notable excepción de un puerto USB-A que se ha convertido en un puerto USB-C, lo que da lugar a un total de dos puertos USB-C, uno de los cuales está conectado a un controlador Thunderbolt 4.
Además, todos los puertos se han desplazado ligeramente hacia delante dado que los laterales traseros están equipados con rejillas de ventilación adicionales. Los diestros se alegrarán de saber que el lado derecho del dispositivo solo está equipado con un único puerto USB, mientras que los zurdos probablemente tengan problemas con esta posición. También nos pareció que la toma de auriculares del dispositivo estaba demasiado cerca del puerto USB-A. Por lo demás, la separación de los puertos es buena en general.
Comunicación
Las comunicaciones por cable son gestionadas por el controlador integrado de la CPU que se presentó por primera vez en 2015. En consecuencia, solo soporta velocidades de hasta 1 Gbps. En comparación, muchos controladores de red modernos soportan velocidades de 2.5 Gbps y más.
Las comunicaciones inalámbricas las gestiona el adaptador Intel AX201, muy común. Por desgracia, la implementación del F17 resultó ser especialmente lenta, con velocidades de transferencia de sólo la mitad que en sus competidores. Esto ya ocurría en su predecesor, y nos decepciona ver que no se ha abordado y mejorado.
Cámara web
El F17 está equipado con una cámara web común de 720p con colores pobres y una calidad de imagen general muy pobre.


Seguridad
El F17 cuenta con un bloqueo Kensington y un TPM 2.0. Otras características de seguridad, como por ejemplo un lector de huellas dactilares, no están disponibles.
Accesorios y garantía
Como es habitual en la gama de precios del F17, no hay más accesorios en la caja que una fuente de alimentación de 240 W.
Los clientes europeos obtienen una garantía limitada de 24 meses, mientras que los clientes de EE.UU. tienen que conformarse, una vez más, con sólo 12 meses.
Mantenimiento
La cubierta inferior se sujeta con 12 tornillos Phillips fácilmente visibles. Lamentablemente, vienen en tres longitudes diferentes, por lo que hay que tener en cuenta qué tornillo va donde.
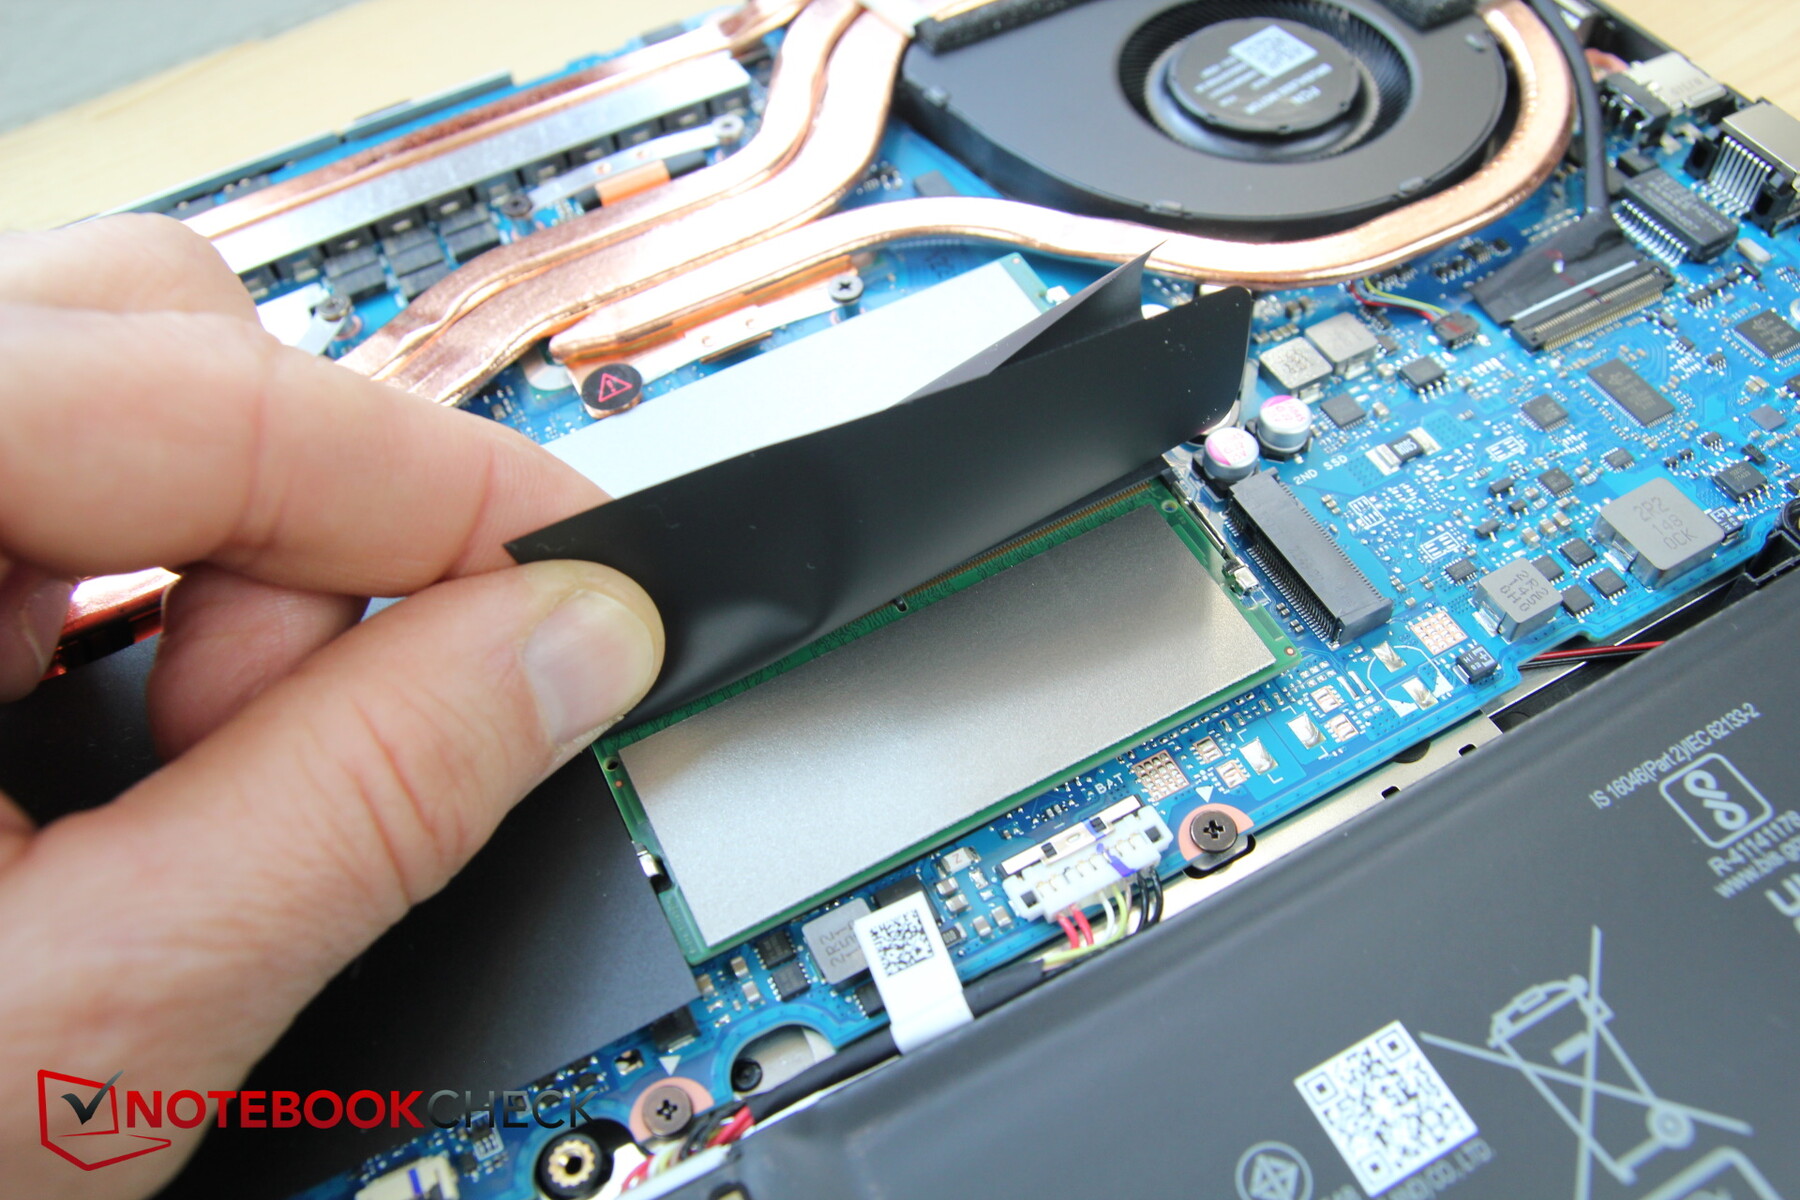
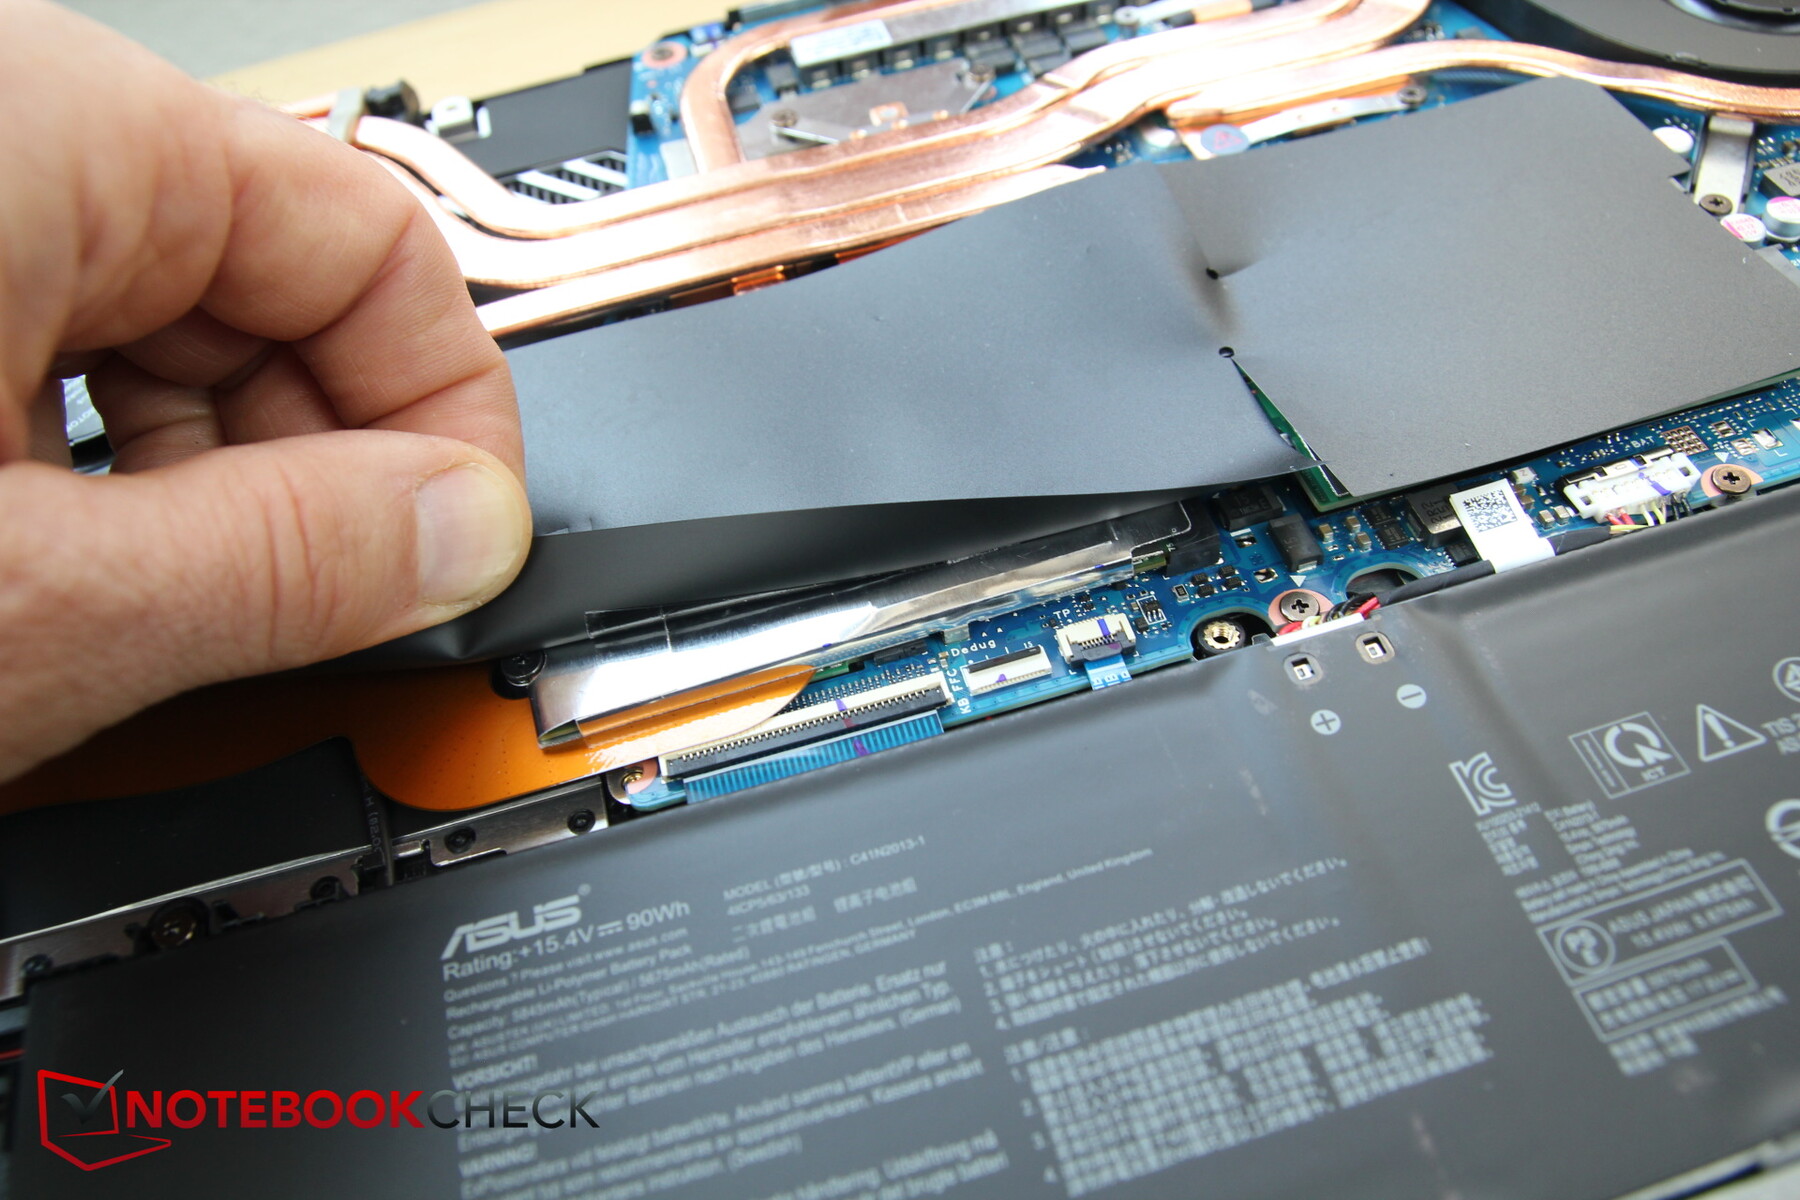
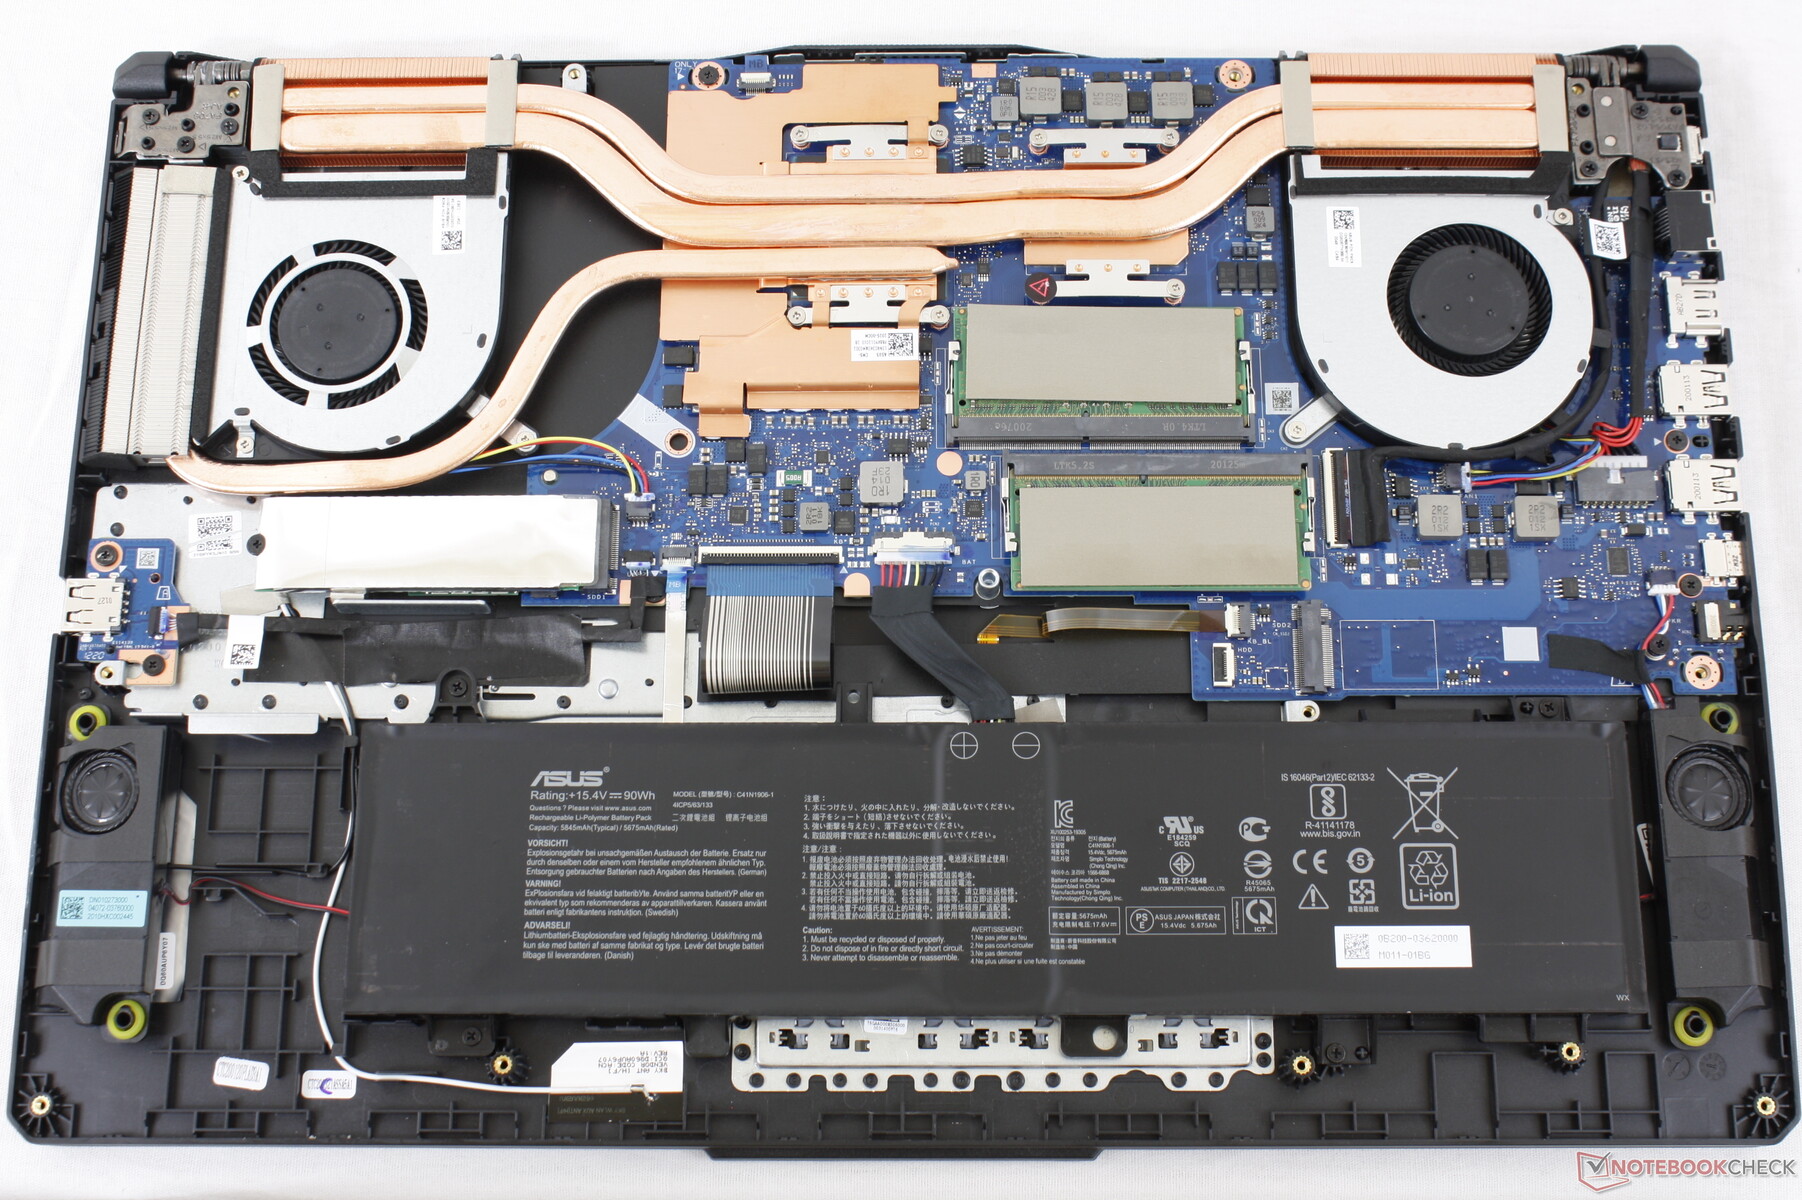
Quitar la cubierta inferior resultó ser una experiencia relativamente sencilla. Una vez retirada la cubierta, tienes acceso a los ventiladores, la batería, el SSD y la RAM. Estos dos últimos están protegidos por una cubierta de plástico negro asegurada con cinta adhesiva, además de que el SSD también está cubierto por una especie de lámina metálica para mejorar la disipación del calor. Hay una ranura M.2 secundaria para un SSD adicional.
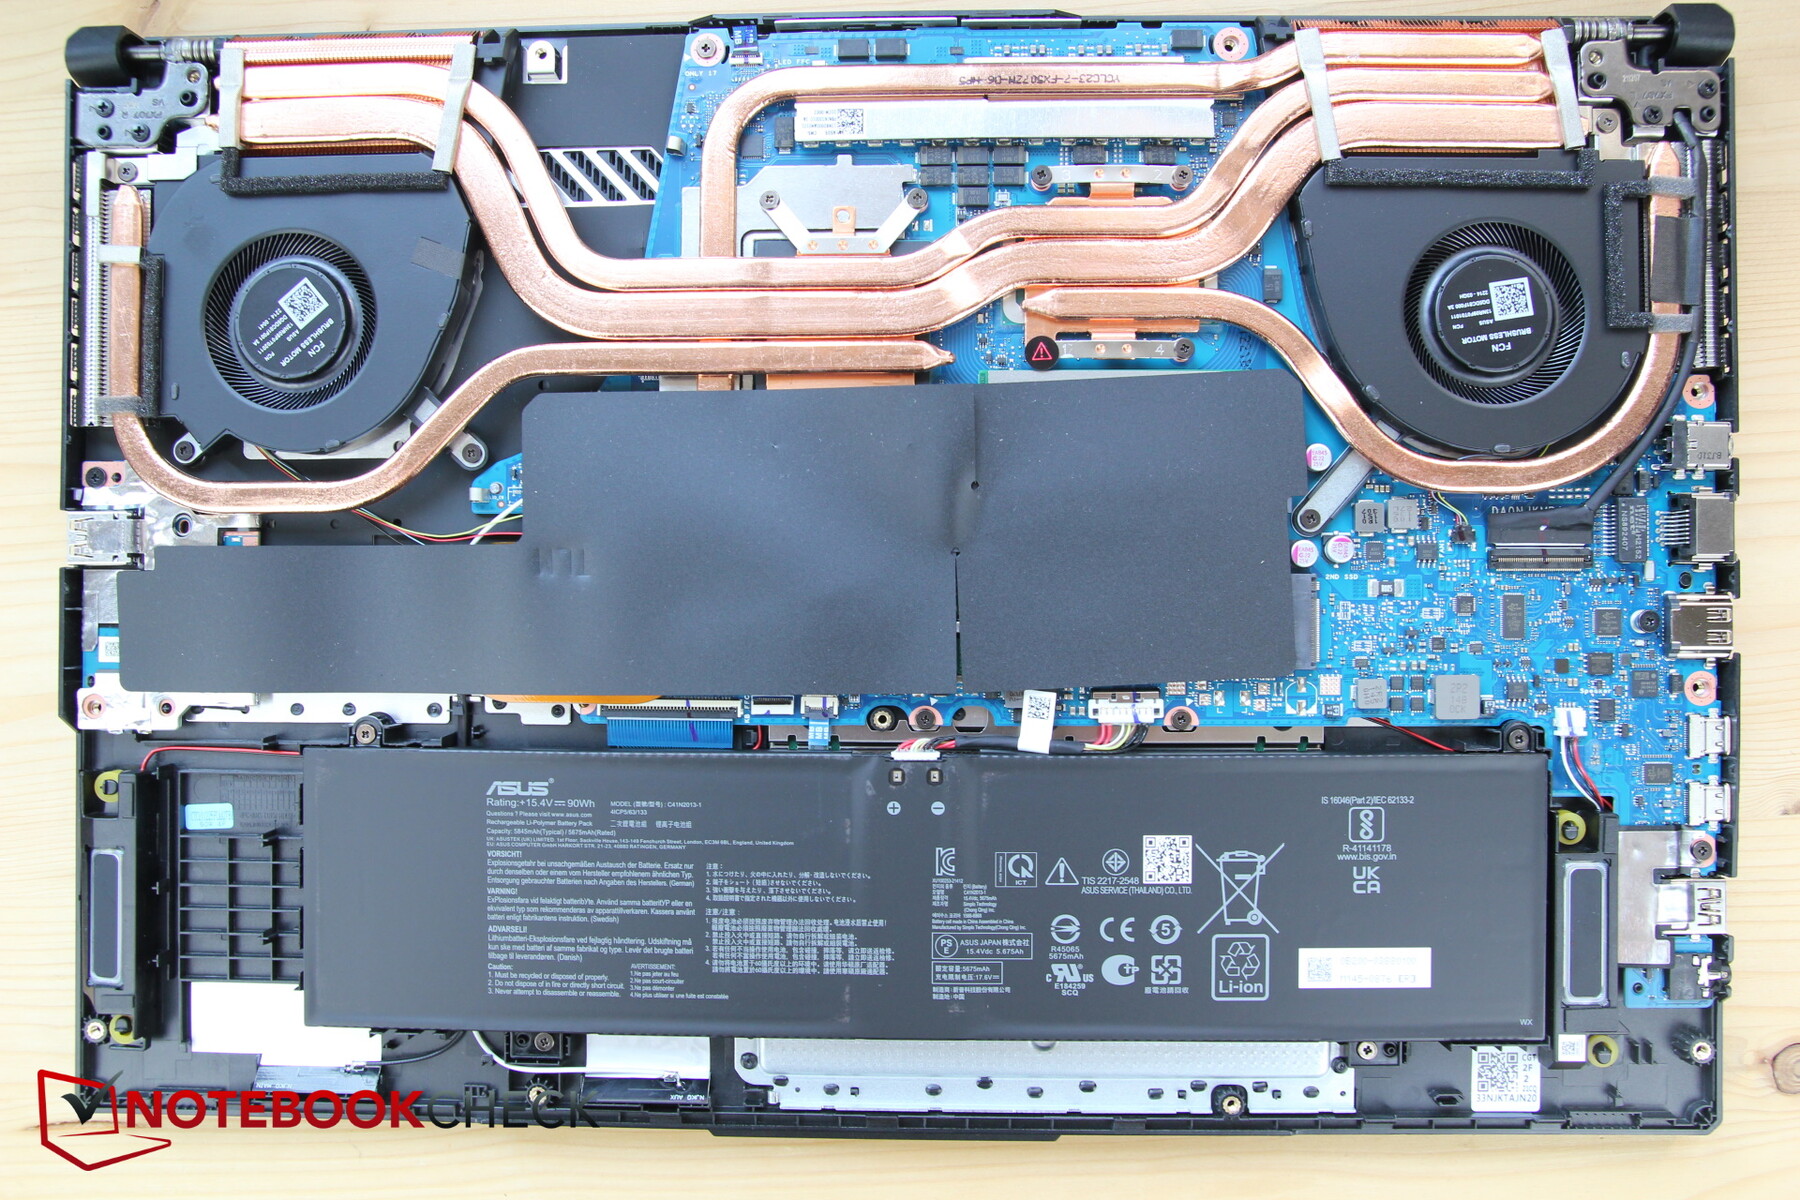
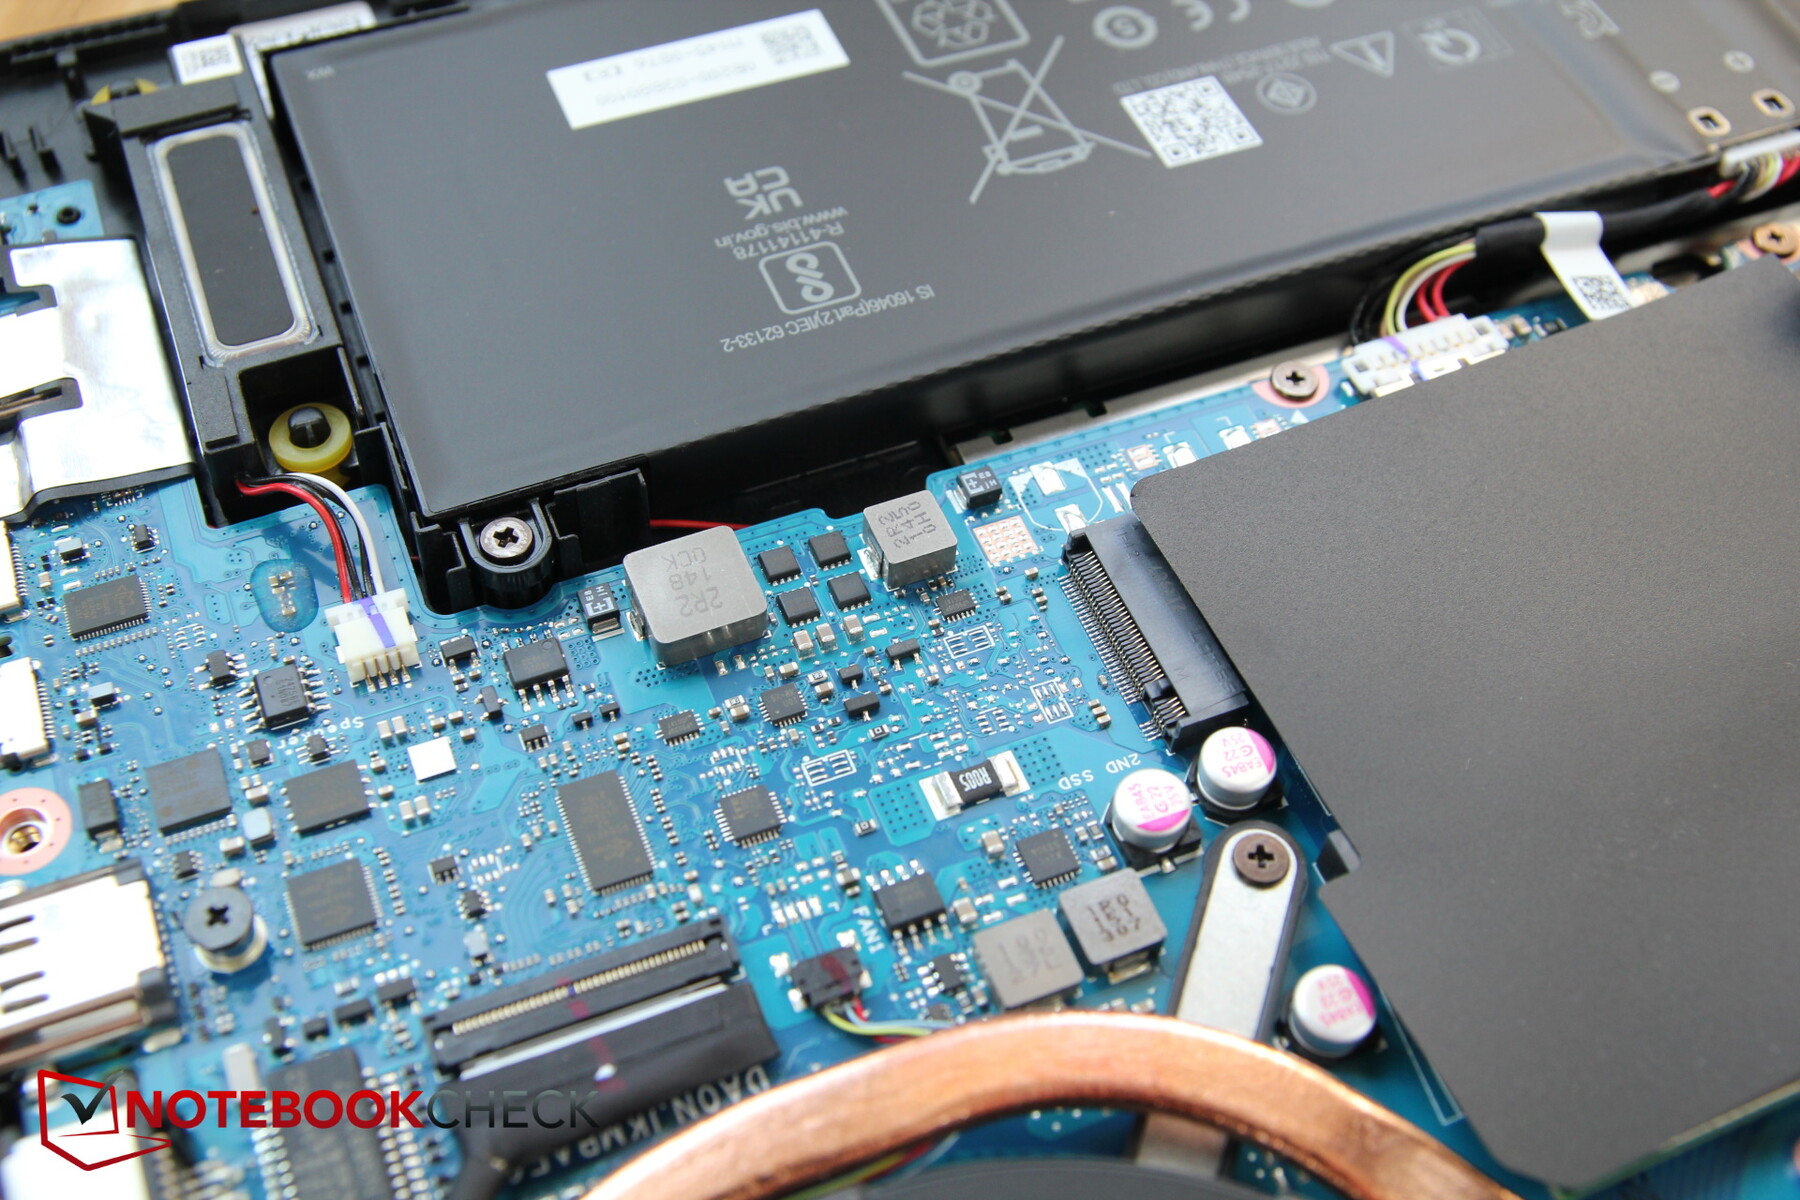
El nuevo modelo tiene un aspecto bastante diferente por dentro en comparación con el FX706. Destaca por los tubos de calor adicionales, los altavoces más grandes, los SSD reposicionados y mucho más.

Dispositivos de entrada - Teclas pequeñas
Teclado
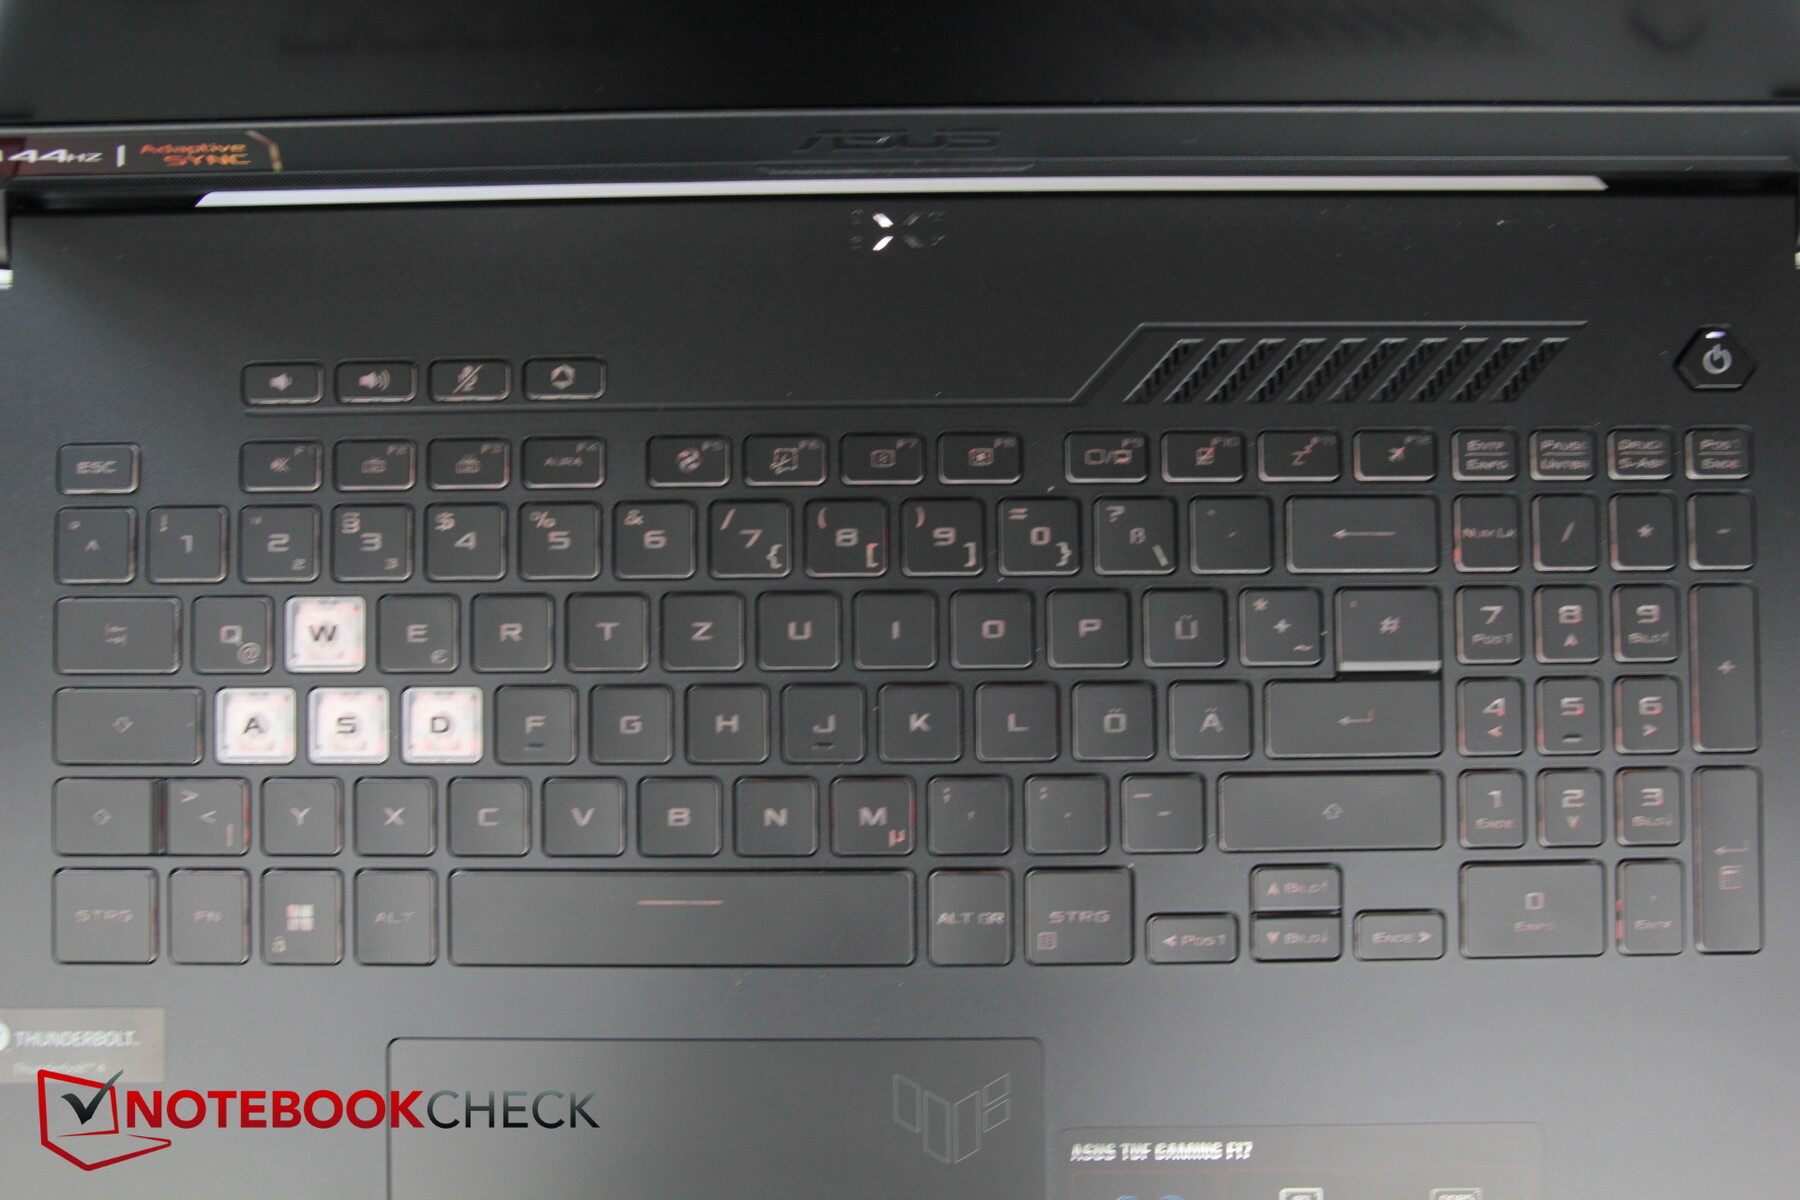
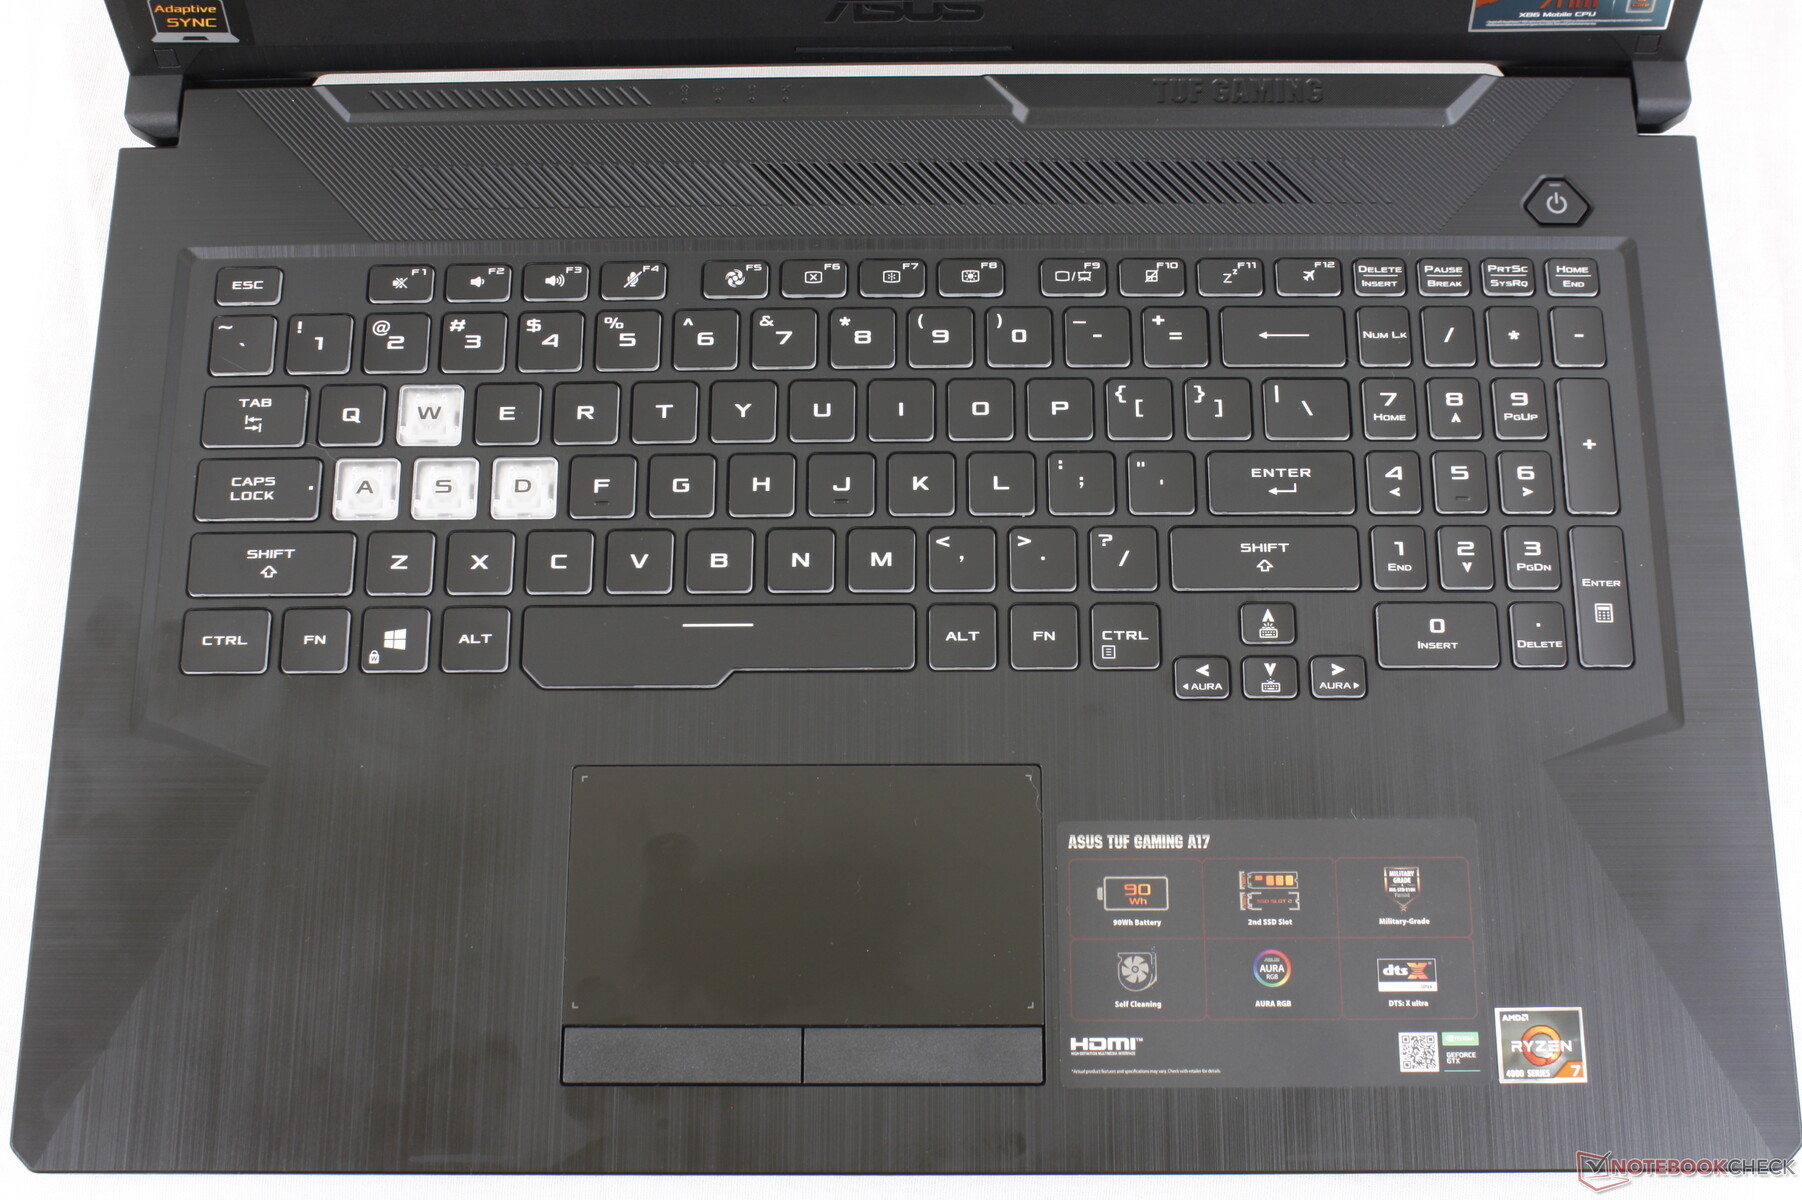
La distribución del teclado sigue siendo prácticamente idéntica, con un teclado numérico muy estrecho para un portátil de 17 pulgadas. Las teclas del cursor siguen siendo sólo la mitad del tamaño de las teclas normales; las teclas arriba/abajo ocupan el espacio de una tecla de tamaño normal.
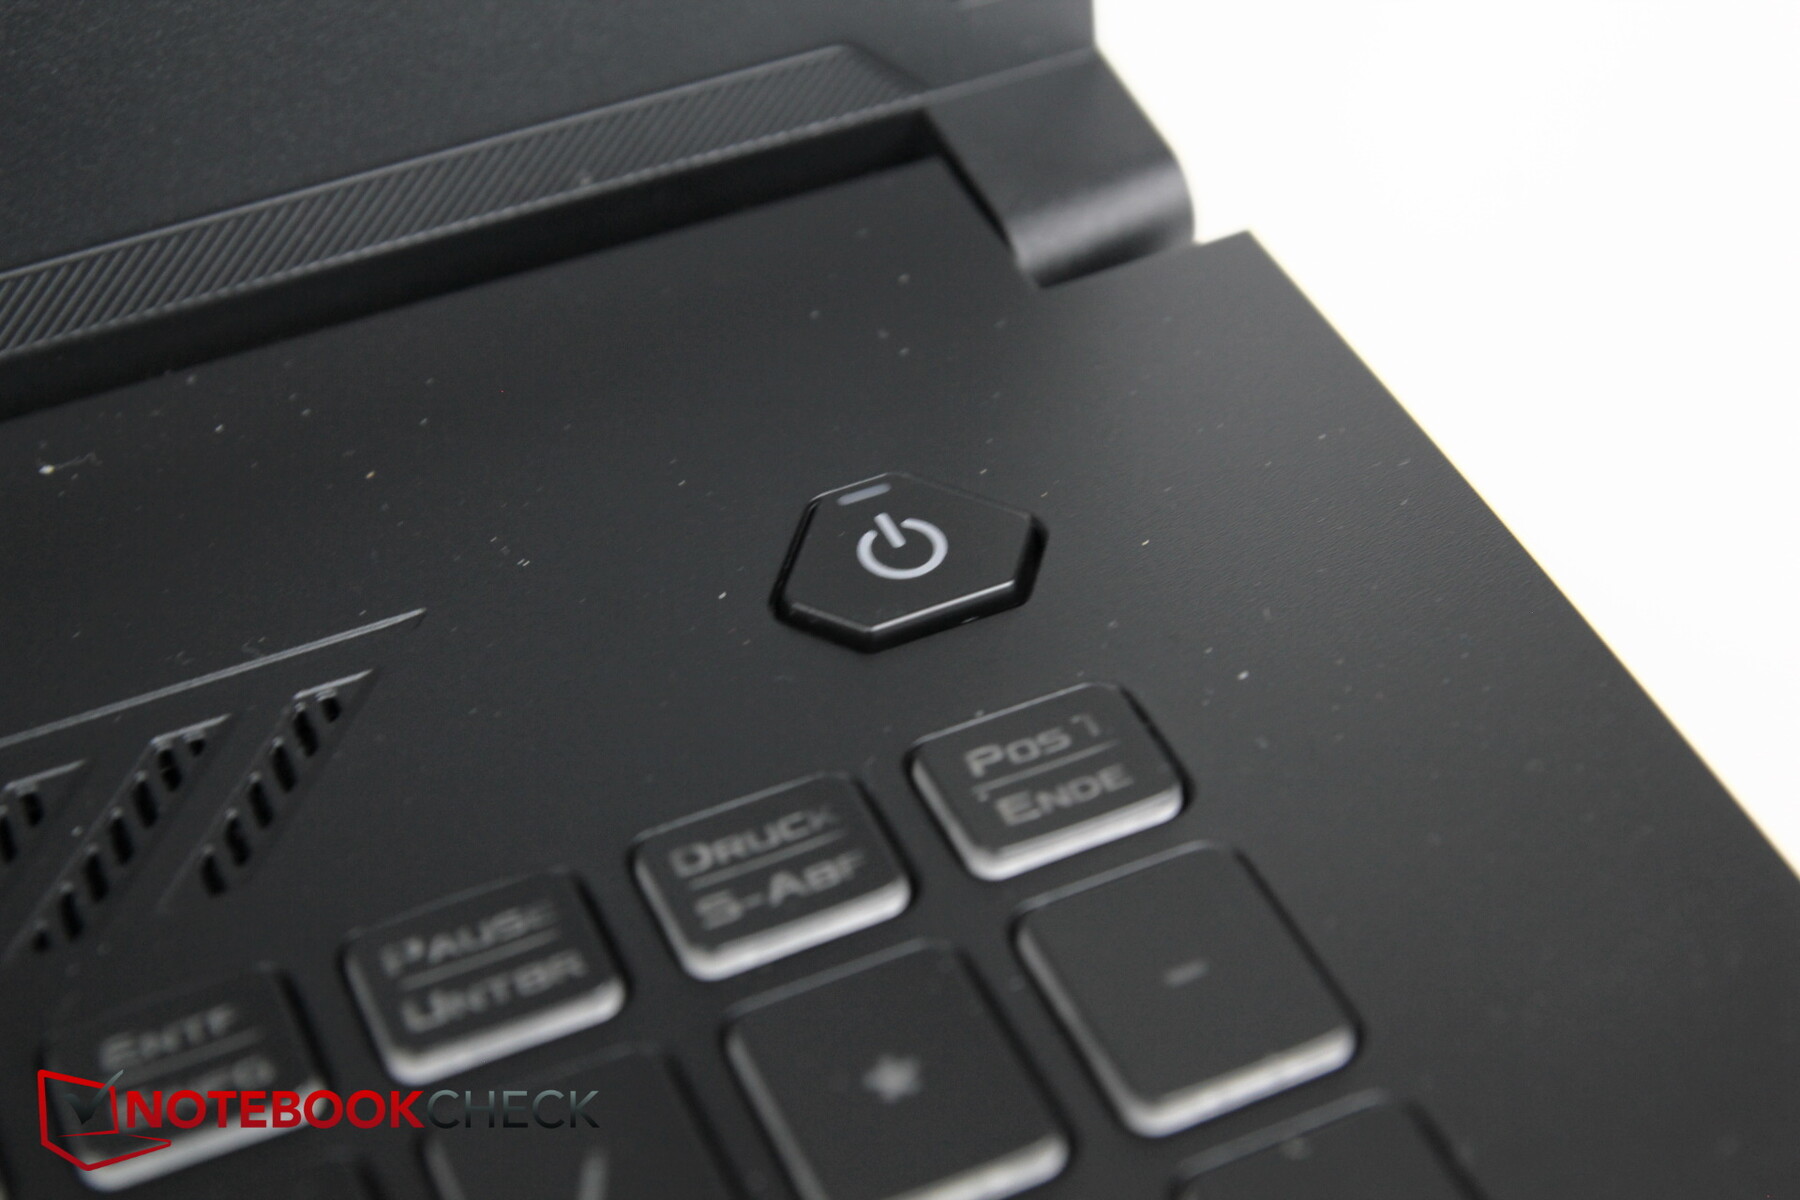
Lo nuevo son las cuatro teclas de función adicionales en la parte superior izquierda, encima del teclado, que sirven para subir y bajar el volumen, silenciar y lanzar el software Armory Crate. Como antes, el botón de encendido es una entidad dedicada y separada en la esquina superior derecha, y como es habitual en los portátiles para juegos, las teclas WASD tienen un color blanco translúcido separado que contrasta mucho con el resto del teclado.
El teclado está retroiluminado con una luz de fondo RGB de tres niveles que no se puede personalizar por tecla, sino sólo por zona.
El recorrido de las teclas sigue siendo relativamente corto, con una respuesta significativa pero algo más suave que en su predecesor. En general, el teclado es muy agradable para escribir, con emisiones de ruido moderadas.

Teclado táctil
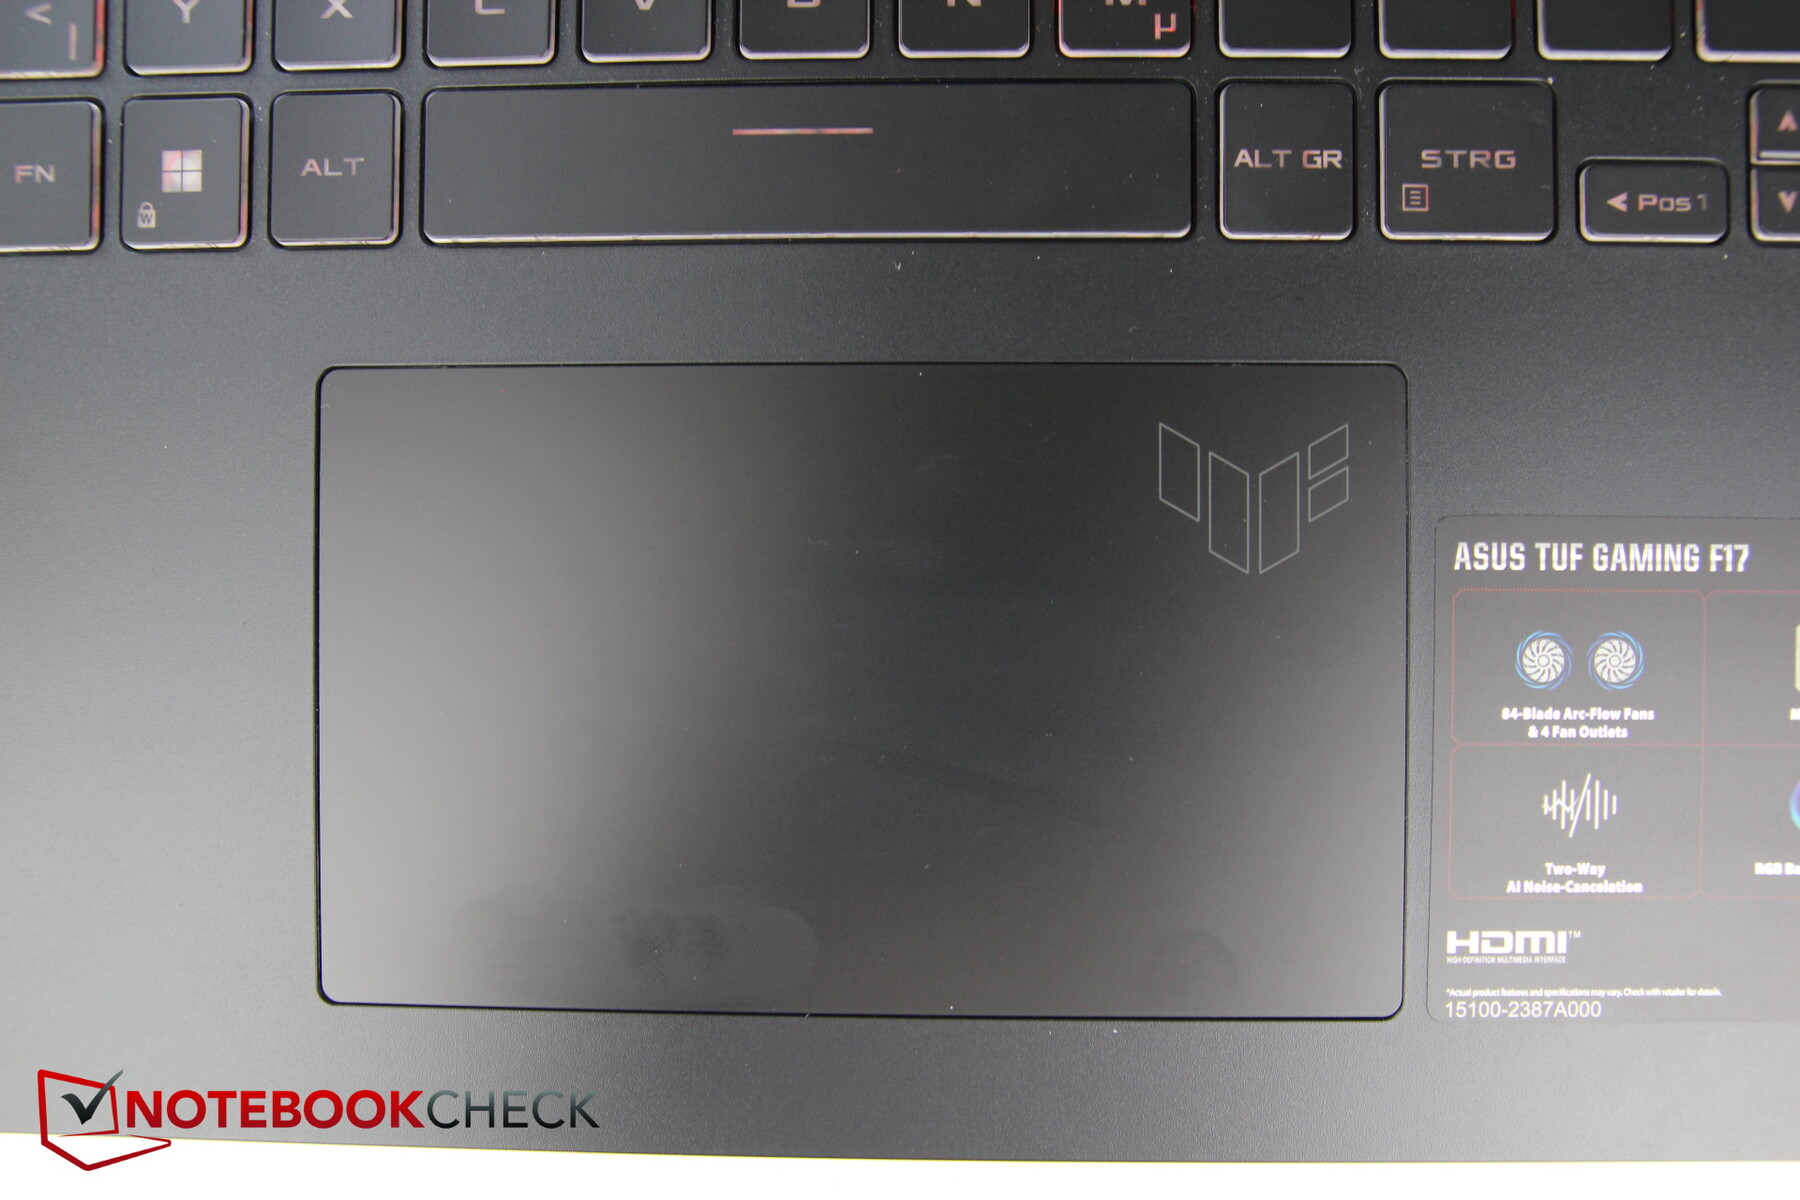
El touchpad ya no tiene botones dedicados, pero ahora es un poco más grande que antes (aprox. 13 x 7,7 cm / 5,1 x 3 pulgadas). Su superficie es agradablemente suave y sólo ligeramente pegajosa con movimientos muy lentos. También descubrimos la presencia de un pequeño punto muerto en la esquina inferior derecha.
Los botones integrados funcionan bien sin problemas y con una emisión de ruido moderada.
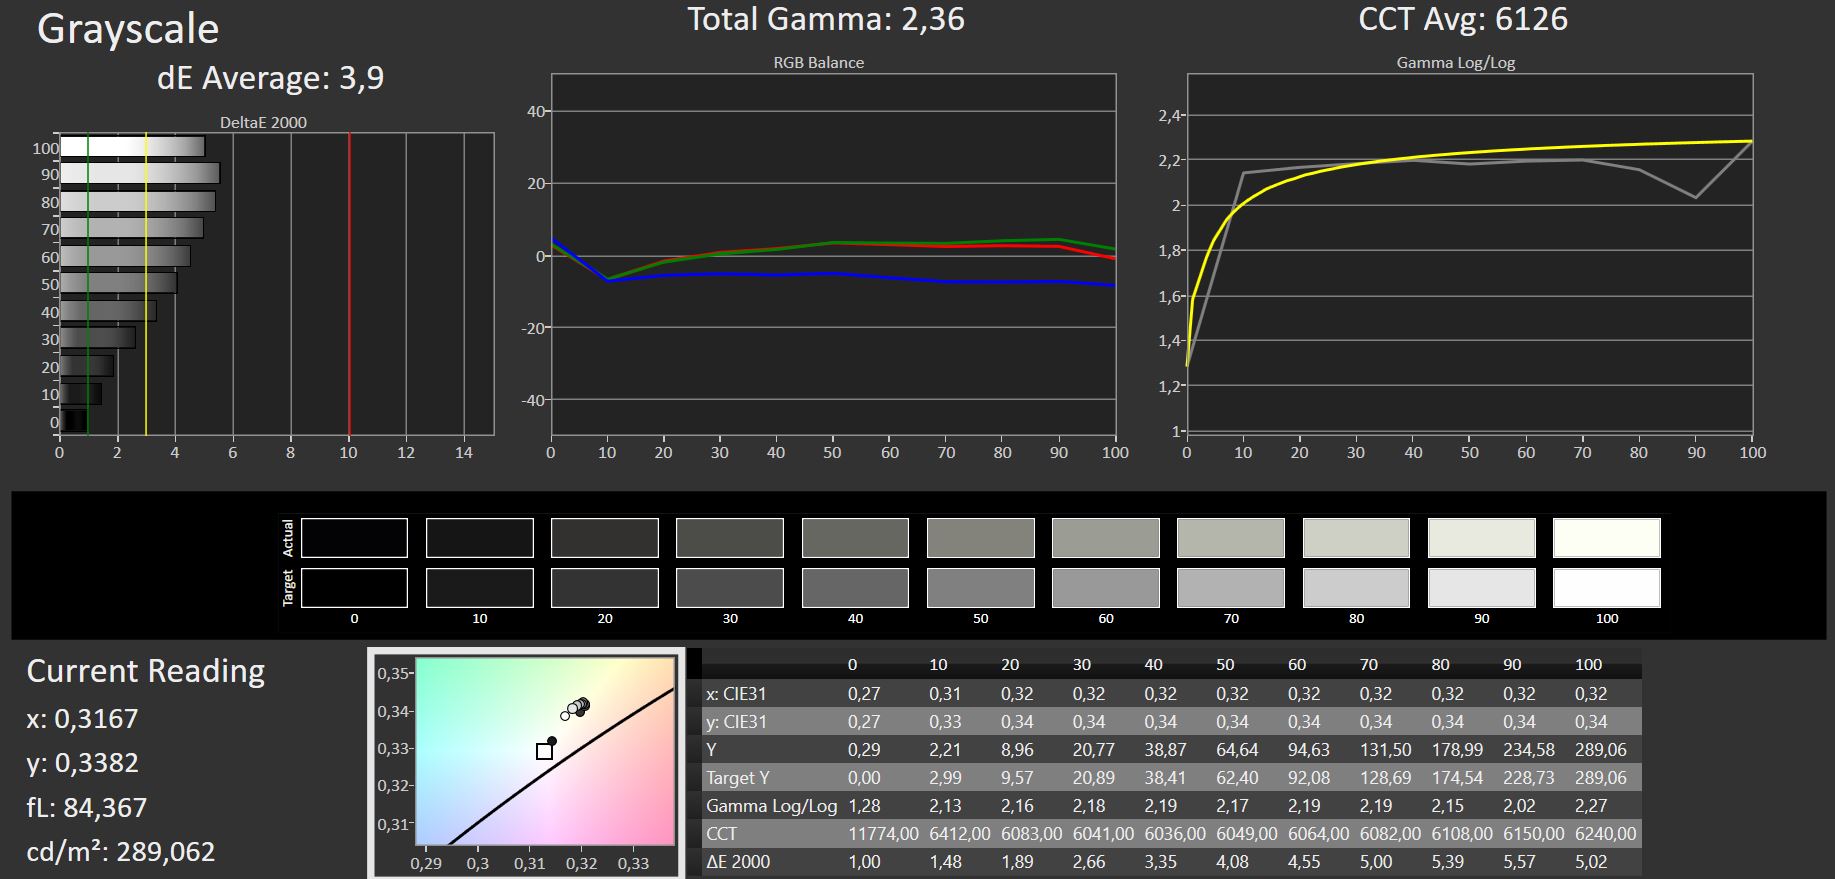
Pantalla - Escasa y no está realmente hecha para jugar
La única pantalla que trae este Asus es un panel FHD IPS de 144 Hz fabricado por AU Optronics.
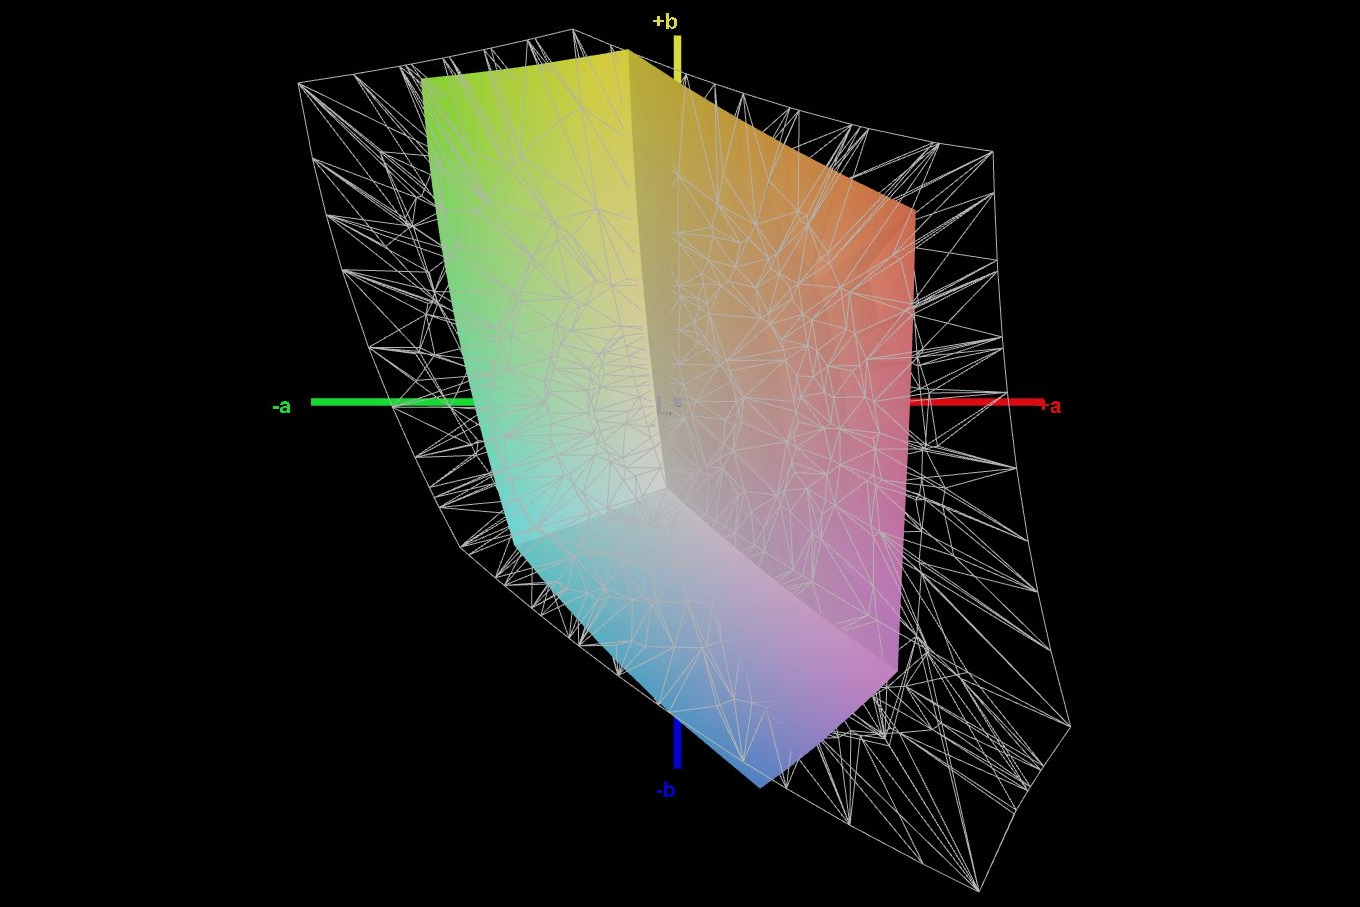
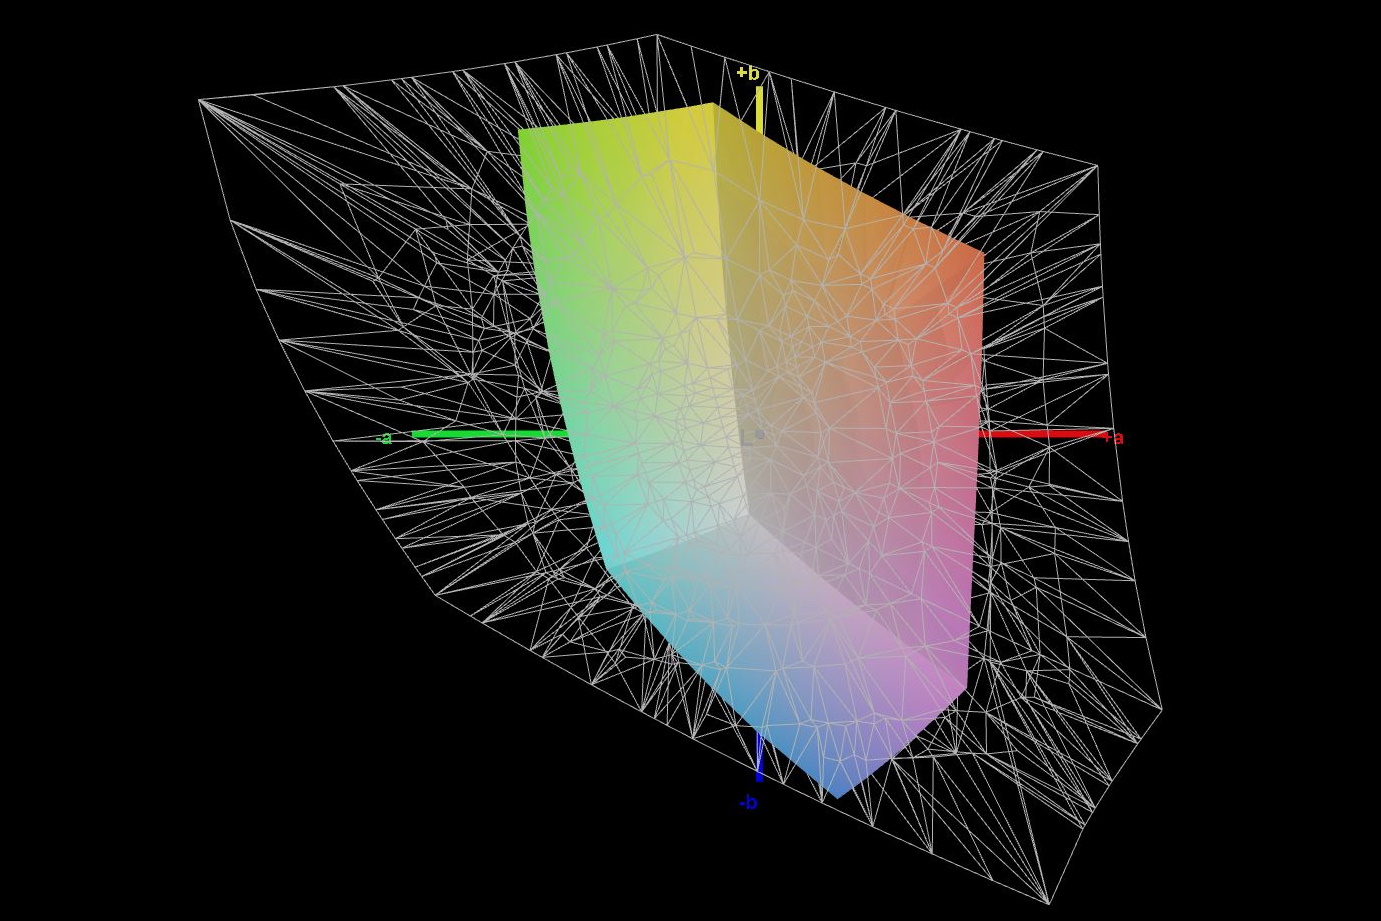
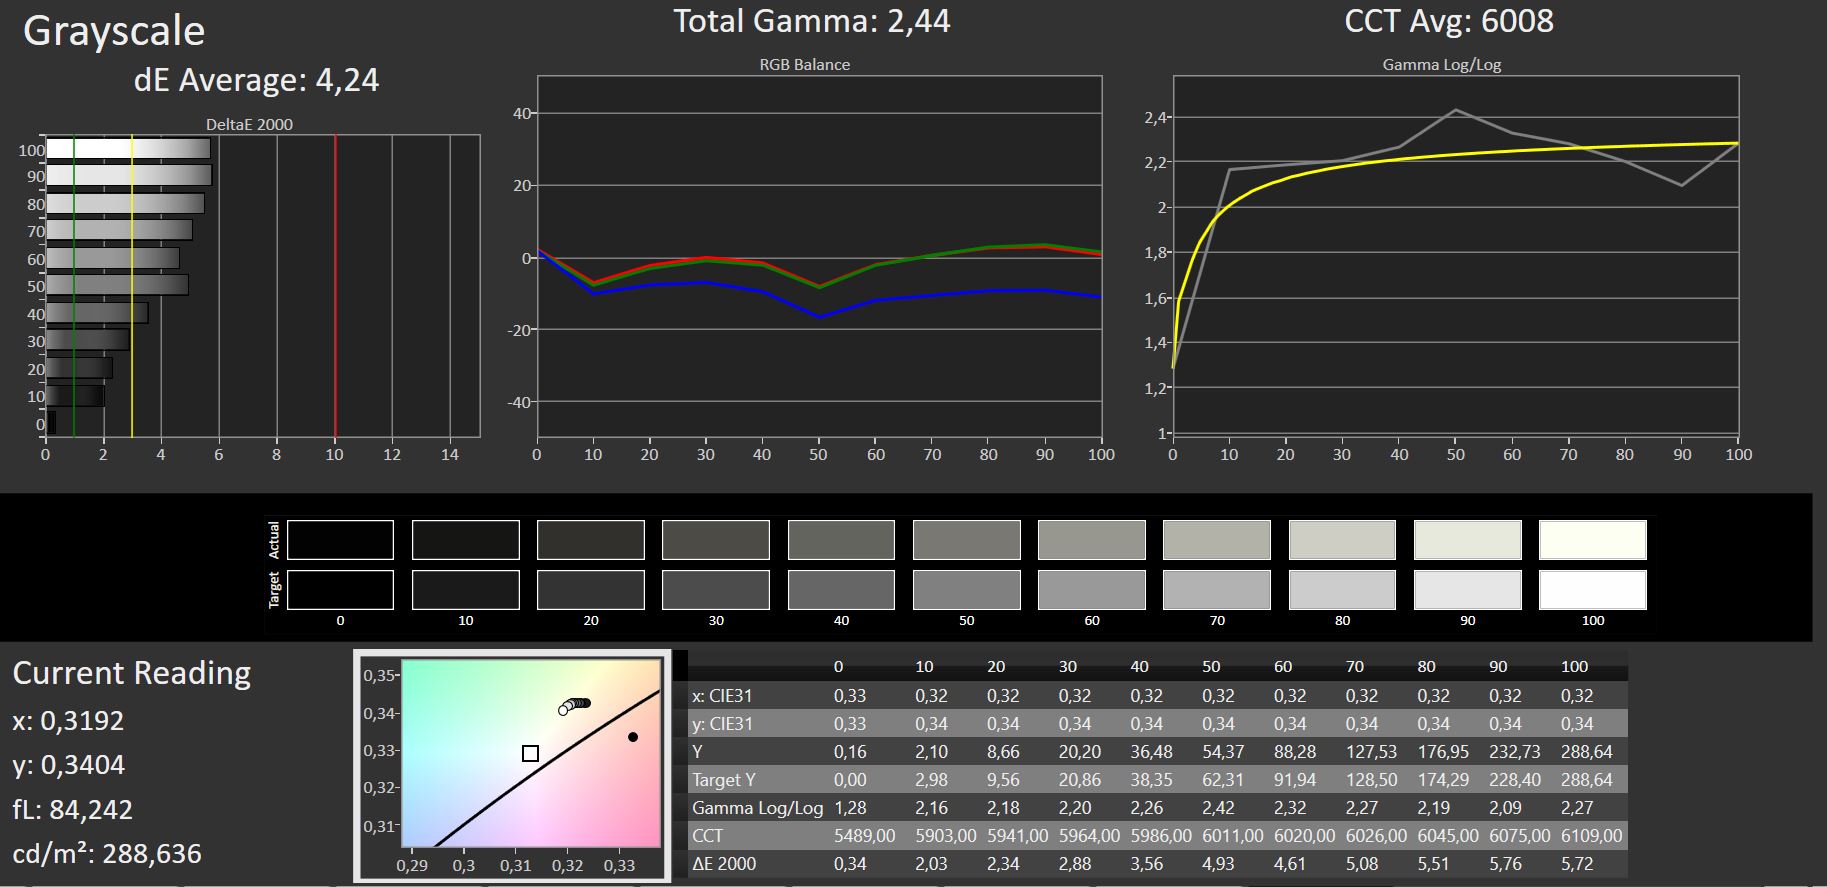
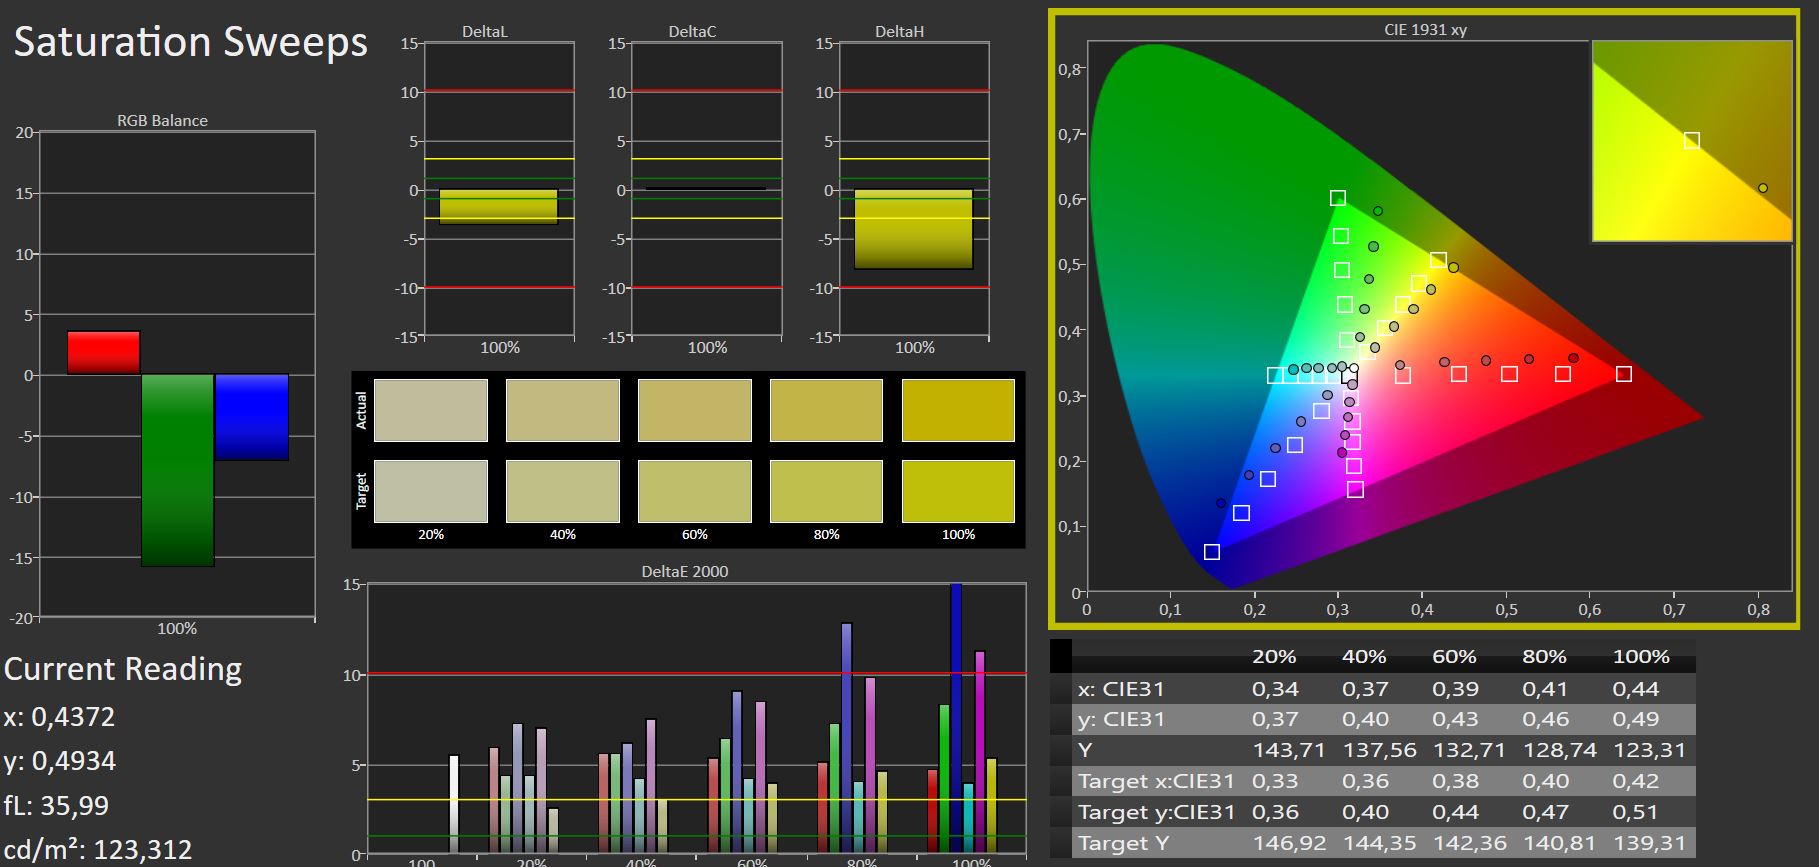
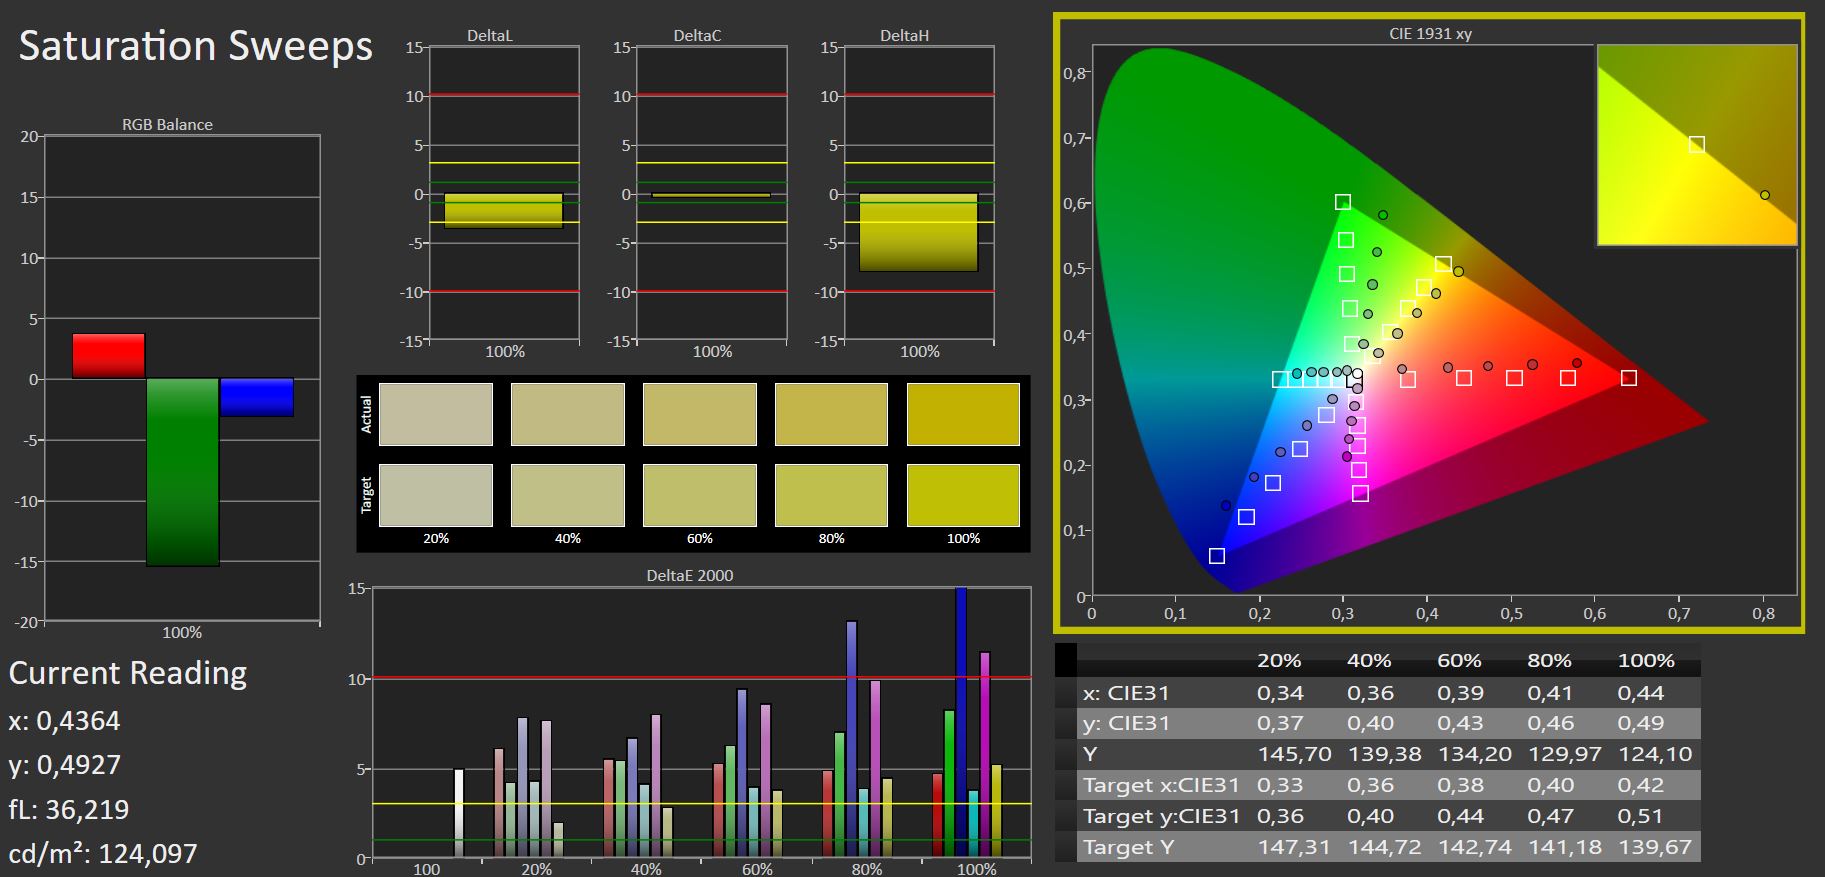
El panel es bien conocido y lleva bastante tiempo en el mercado, y dado su bajo brillo de sólo 268 nits, los lentos tiempos de respuesta de 30-40 ms, y la cobertura del espacio de color de un 60 % de sRGB y alrededor de un 41 % de AdobeRGB, estamos acostumbrados a verlo en los portátiles más asequibles como el MSI GF75 Thin.
En el lado positivo su nivel de negro es bastante bajo debido al bajo brillo general, haciendo que su ratio de contraste sea comparativamente alto. El desarrollo de la iluminación es decente con un 89 %.
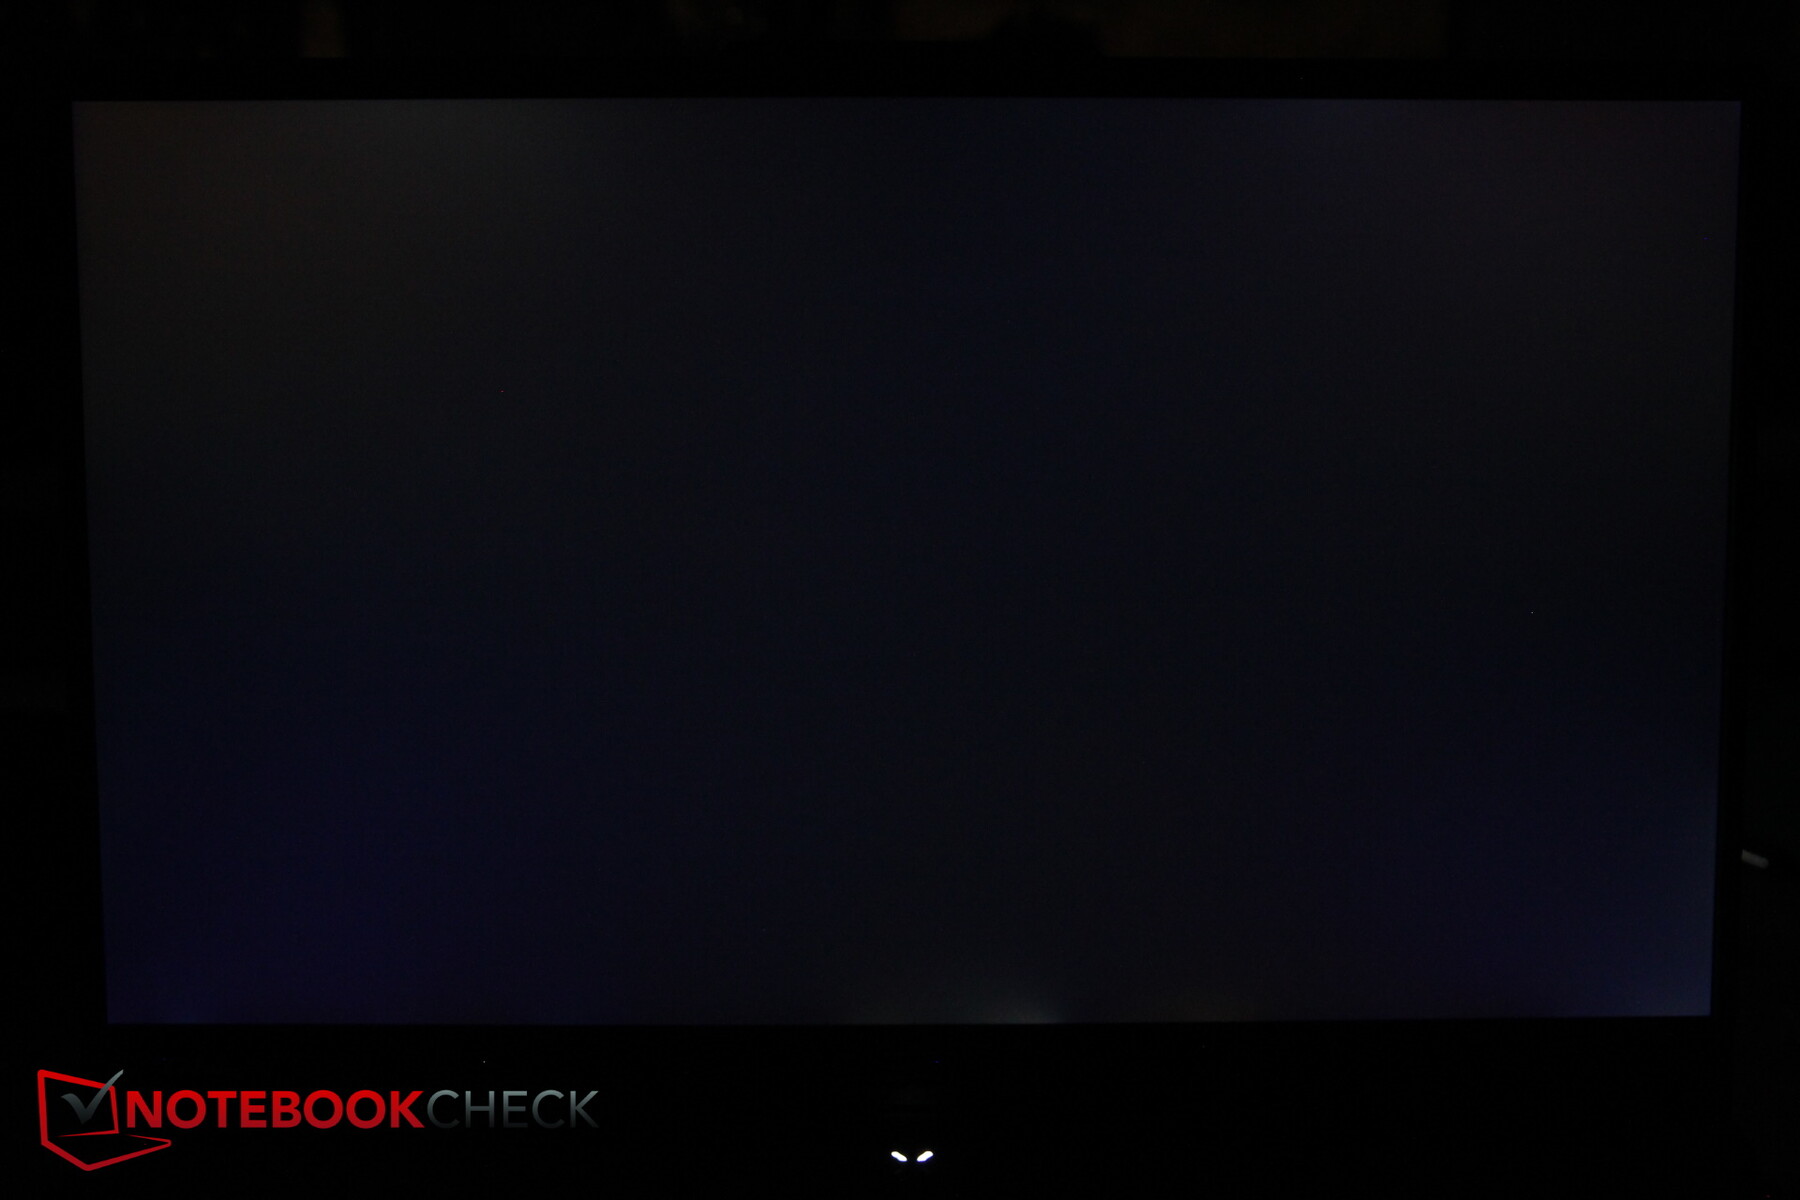
Y mientras que el panel no sufre de parpadeo PWM, sufre de un menor pero aún notable sangrado de luz de fondo a lo largo de sus bordes.
| |||||||||||||||||||||||||
iluminación: 89 %
Contraste: 1688:1 (Negro: 0.17 cd/m²)
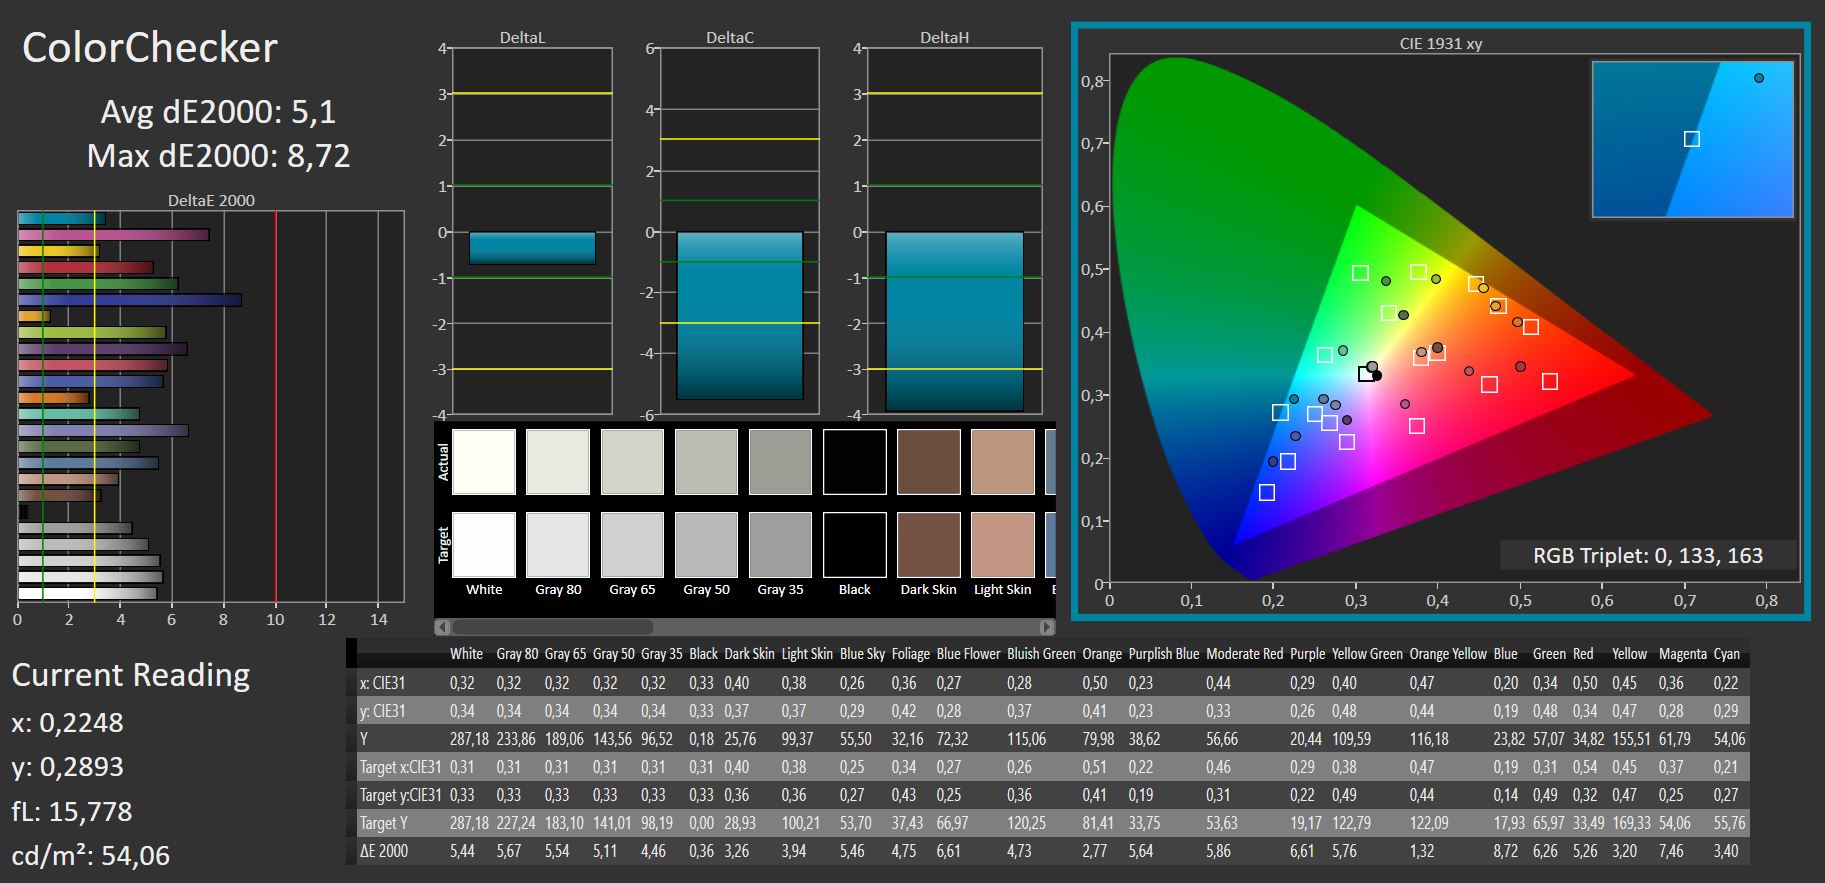
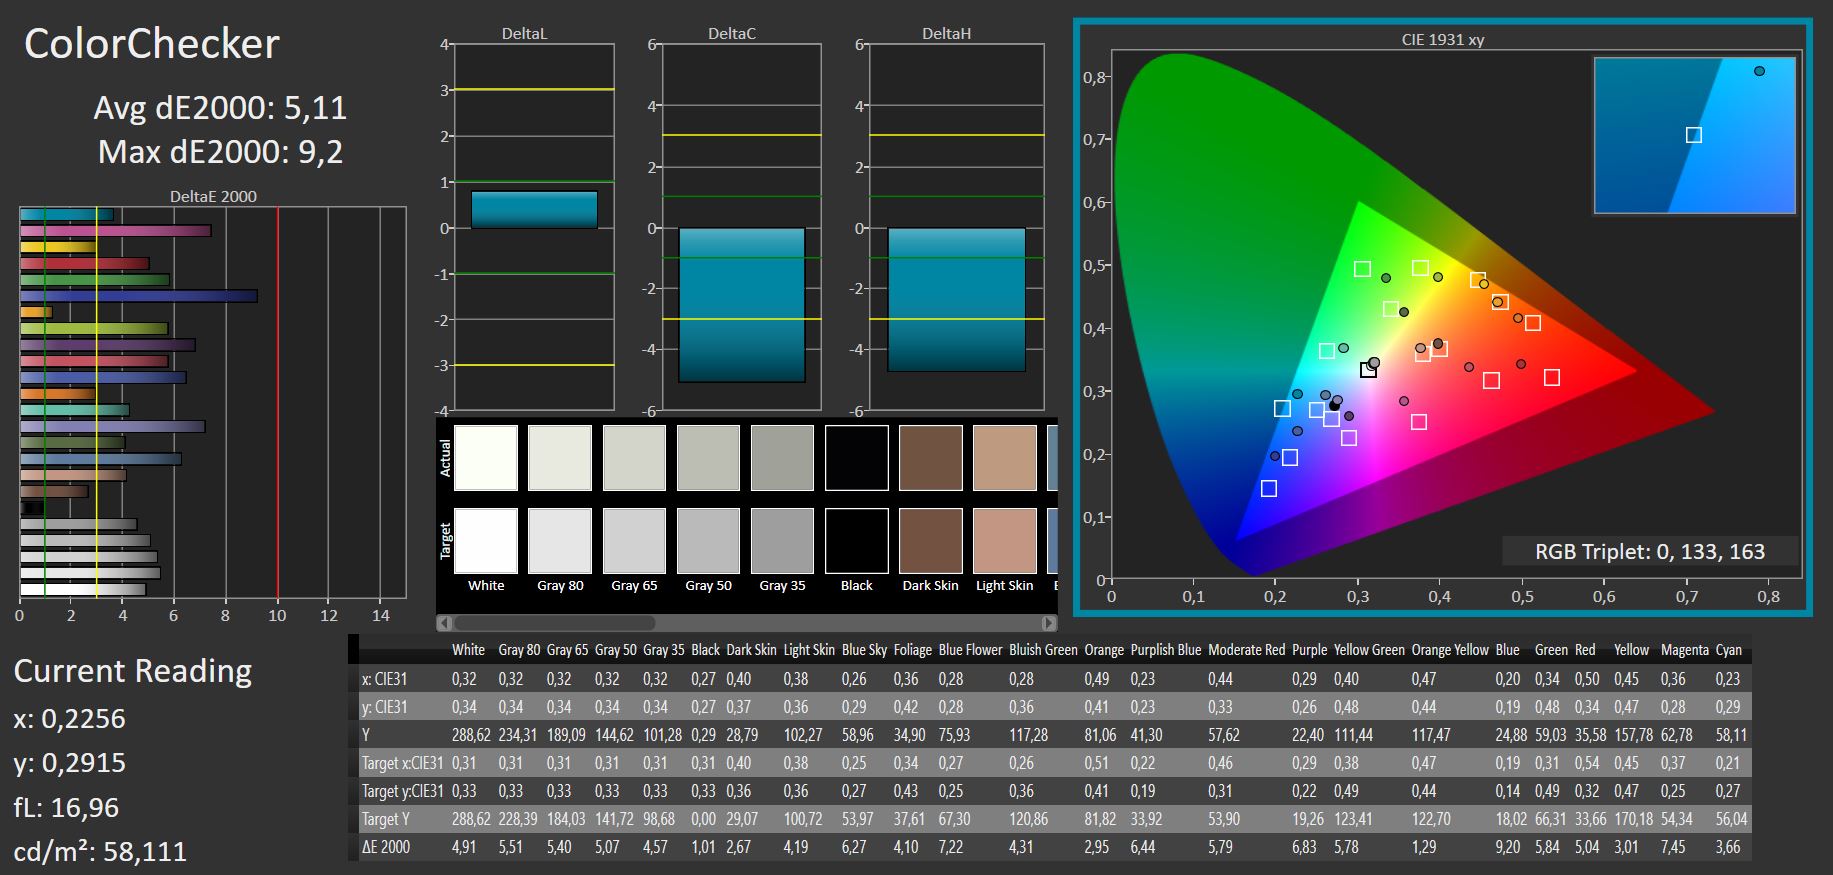
ΔE ColorChecker Calman: 5.1 | ∀{0.5-29.43 Ø4.71}
calibrated: 5.1
ΔE Greyscale Calman: 4.24 | ∀{0.09-98 Ø4.96}
41.5% AdobeRGB 1998 (Argyll 3D)
59.7% sRGB (Argyll 3D)
40.2% Display P3 (Argyll 3D)
Gamma: 2.44
CCT: 6008 K
| Asus TUF Gaming F17 FX707Z-HX011W AU Optronics B173HAN04.9 (AUO4B9D), IPS, 1920x1080, 17.3" | Asus TUF Gaming F17 FX706HM AU Optronics AUI8294 (B173HAN04.9), IPS, 1920x1080, 17.3" | Lenovo Legion 5 17ACH6H-82JY0003GE LEN173FHD, IPS, 1920x1080, 17.3" | MSI GE76 Raider AU Optronics B173HAN05.4 (AUOE295), IPS-Level, 1920x1080, 17.3" | MSI Katana GF76 11UE AU Optronics B173HAN04.9, IPS, 1920x1080, 17.3" | Schenker XMG Core 17 (Early 2021) BOE CQ NE173QHM-NY2, IPS, 2560x1440, 17.3" | |
|---|---|---|---|---|---|---|
| Display | 0% | 62% | 57% | -1% | 67% | |
| Display P3 Coverage (%) | 40.2 | 40.1 0% | 64.8 61% | 63.1 57% | 39.8 -1% | 68.1 69% |
| sRGB Coverage (%) | 59.7 | 60 1% | 97.2 63% | 94 57% | 59.5 0% | 98.5 65% |
| AdobeRGB 1998 Coverage (%) | 41.5 | 41.4 0% | 66.7 61% | 65.2 57% | 41.12 -1% | 69.3 67% |
| Response Times | 21% | 66% | 77% | 9% | 62% | |
| Response Time Grey 50% / Grey 80% * (ms) | 39.2 ? | 32.4 17% | 15 ? 62% | 5.6 ? 86% | 36.8 ? 6% | 16.8 ? 57% |
| Response Time Black / White * (ms) | 29.6 ? | 22.4 24% | 9 ? 70% | 9.6 ? 68% | 26 ? 12% | 10 ? 66% |
| PWM Frequency (Hz) | ||||||
| Screen | -5% | 21% | 24% | -15% | 4% | |
| Brightness middle (cd/m²) | 287 | 266 -7% | 323 13% | 290 1% | 260 -9% | 370 29% |
| Brightness (cd/m²) | 268 | 264 -1% | 305 14% | 290 8% | 251 -6% | 333 24% |
| Brightness Distribution (%) | 89 | 79 -11% | 89 0% | 96 8% | 85 -4% | 84 -6% |
| Black Level * (cd/m²) | 0.17 | 0.32 -88% | 0.25 -47% | 0.23 -35% | 0.26 -53% | 0.38 -124% |
| Contrast (:1) | 1688 | 831 -51% | 1292 -23% | 1261 -25% | 1000 -41% | 974 -42% |
| Colorchecker dE 2000 * | 5.1 | 3.97 22% | 1.87 63% | 1.59 69% | 3.9 24% | 2.41 53% |
| Colorchecker dE 2000 max. * | 8.72 | 8.93 -2% | 4.84 44% | 3.17 64% | 20.64 -137% | 7.32 16% |
| Colorchecker dE 2000 calibrated * | 5.1 | 3.5 31% | 0.92 82% | 0.87 83% | 3.71 27% | 1.19 77% |
| Greyscale dE 2000 * | 4.24 | 1.8 58% | 2.57 39% | 2.5 41% | 1.6 62% | 3.9 8% |
| Gamma | 2.44 90% | 2.31 95% | 2.42 91% | 2.253 98% | 2.068 106% | 2.287 96% |
| CCT | 6008 108% | 6754 96% | 7012 93% | 6640 98% | 6511 100% | 7302 89% |
| Color Space (Percent of AdobeRGB 1998) (%) | 41.4 | 69 | ||||
| Color Space (Percent of sRGB) (%) | 60 | 93 | ||||
| Media total (Programa/Opciones) | 5% /
-1% | 50% /
36% | 53% /
39% | -2% /
-9% | 44% /
26% |
* ... más pequeño es mejor
La calibración manual del panel de visualización apenas mejoró su calidad de imagen. Aunque la precisión de la escala de grises mejoró ligeramente, no encontramos ninguna mejora en la precisión del color.
Tiempos de respuesta del display
| ↔ Tiempo de respuesta de Negro a Blanco | ||
|---|---|---|
| 29.6 ms ... subida ↗ y bajada ↘ combinada | ↗ 15.4 ms subida | 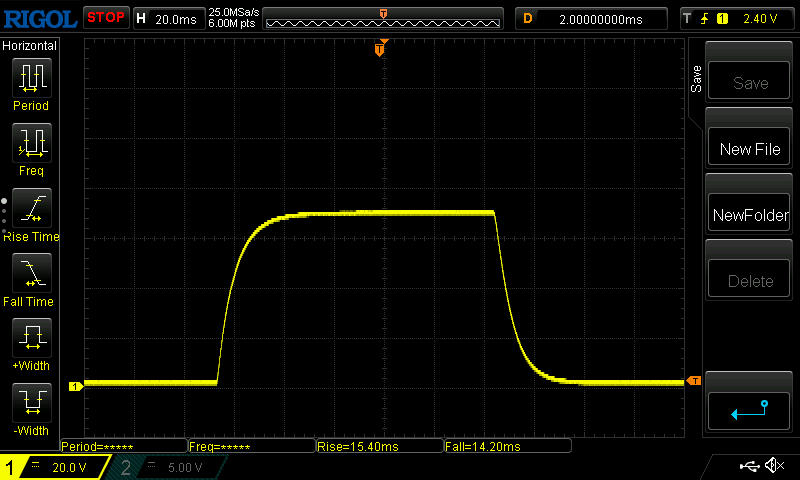 |
| ↘ 14.2 ms bajada | ||
| La pantalla mostró tiempos de respuesta relativamente lentos en nuestros tests pero podría ser demasiado lenta para los jugones. En comparación, todos los dispositivos de prueba van de ##min### (mínimo) a 240 (máximo) ms. » 79 % de todos los dispositivos son mejores. Eso quiere decir que el tiempo de respuesta es peor que la media (19.8 ms) de todos los dispositivos testados. | ||
| ↔ Tiempo de respuesta 50% Gris a 80% Gris | ||
| 39.2 ms ... subida ↗ y bajada ↘ combinada | ↗ 18.2 ms subida | 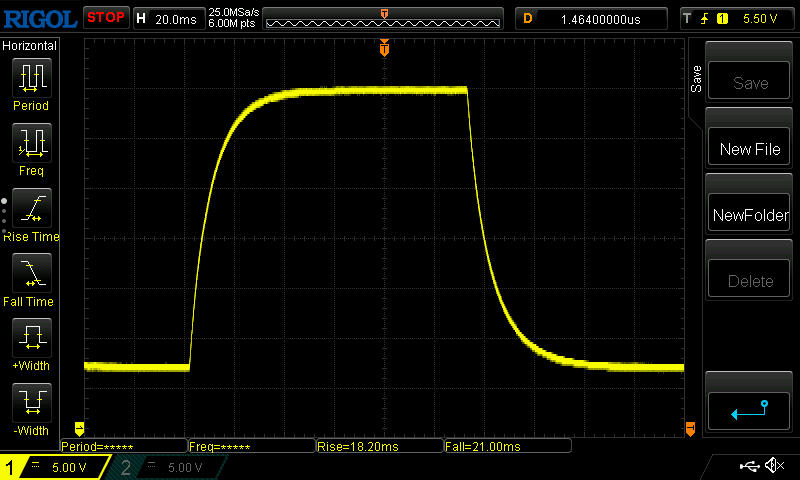 |
| ↘ 21 ms bajada | ||
| La pantalla mostró tiempos de respuesta lentos en nuestros tests y podría ser demasiado lenta para los jugones. En comparación, todos los dispositivos de prueba van de ##min### (mínimo) a 636 (máximo) ms. » 60 % de todos los dispositivos son mejores. Eso quiere decir que el tiempo de respuesta es peor que la media (30.9 ms) de todos los dispositivos testados. | ||
Parpadeo de Pantalla / PWM (Pulse-Width Modulation)
| Parpadeo de Pantalla / PWM no detectado | 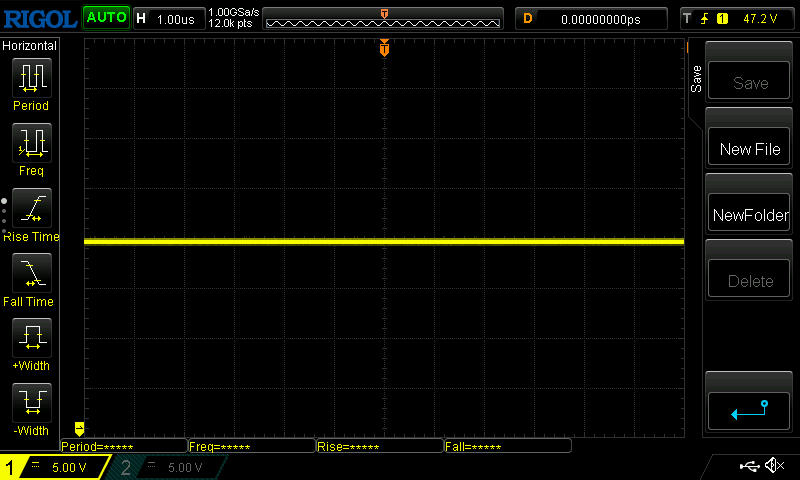 | ||
Comparación: 52 % de todos los dispositivos testados no usaron PWM para atenuar el display. Si se usó, medimos una media de 7744 (mínimo: 5 - máxmo: 343500) Hz. | |||
La usabilidad en exteriores era muy limitada debido a la baja luminosidad. La imagen es simplemente demasiado oscura para ser legible y utilizable en entornos luminosos.
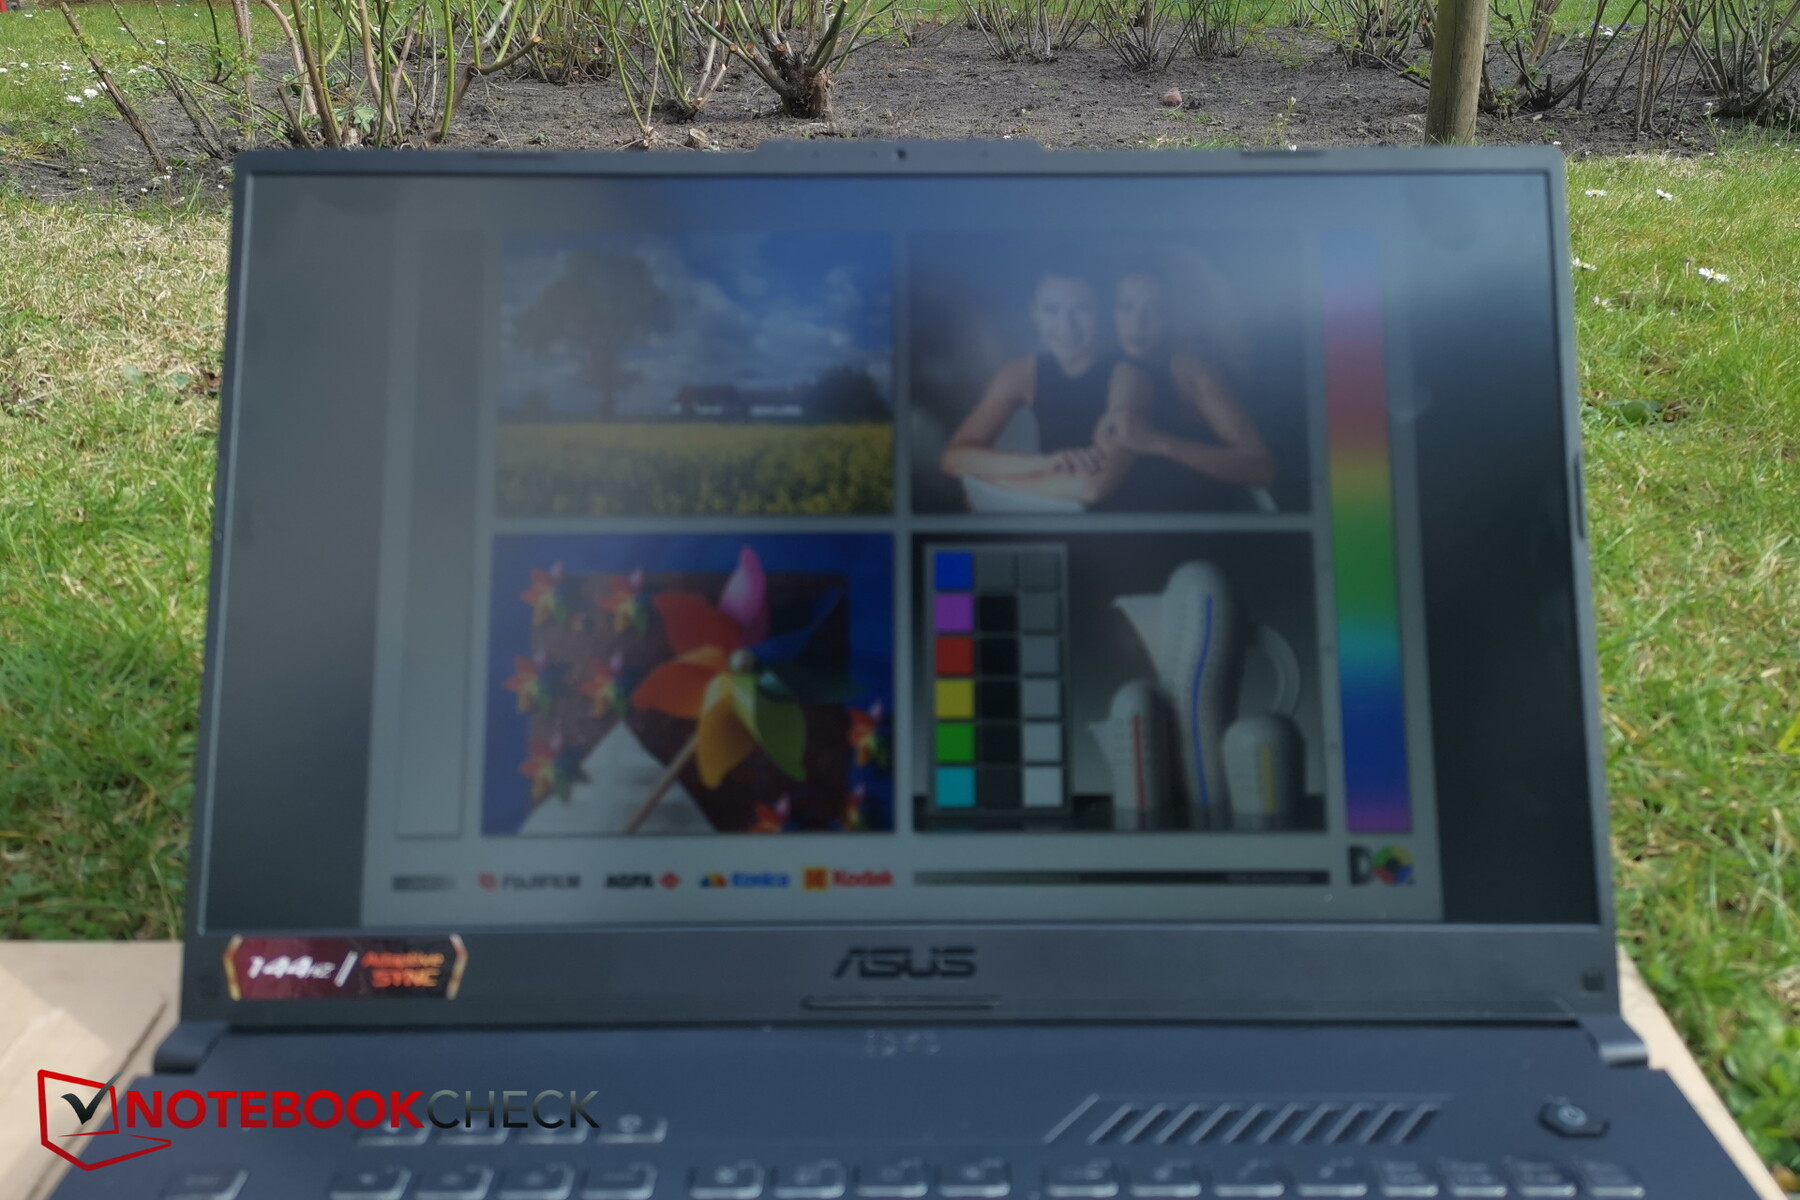
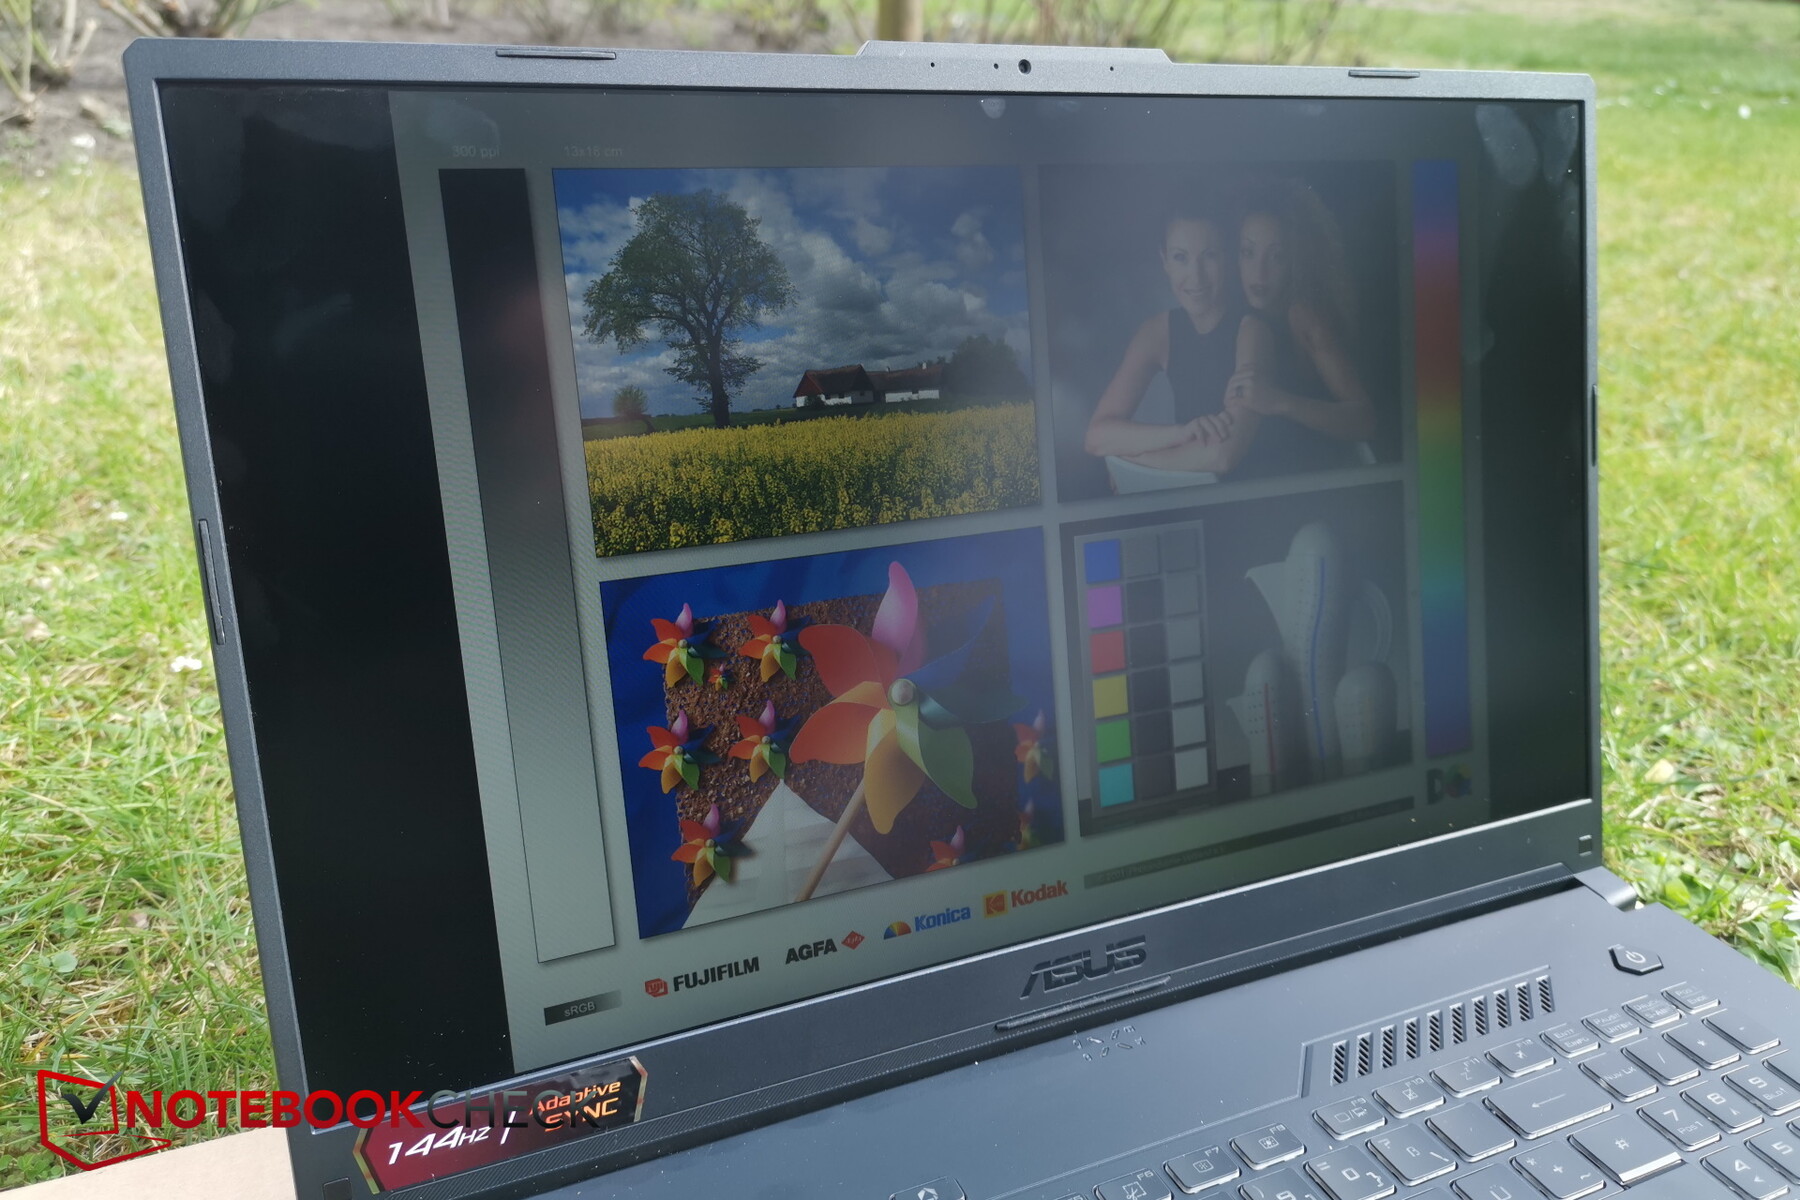
Para ser un panel IPS, encontramos que este panel de AU Optronics ofrece ángulos de visión comparativamente pobres, con notables caídas de brillo en ángulos extremos que hacen que esta pantalla ya tenue sea aún más tenue y menos utilizable.

Rendimiento - Máximo rendimiento 3D
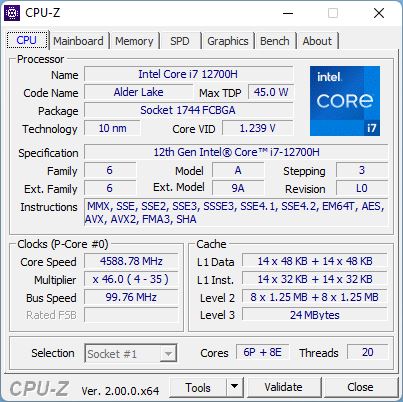
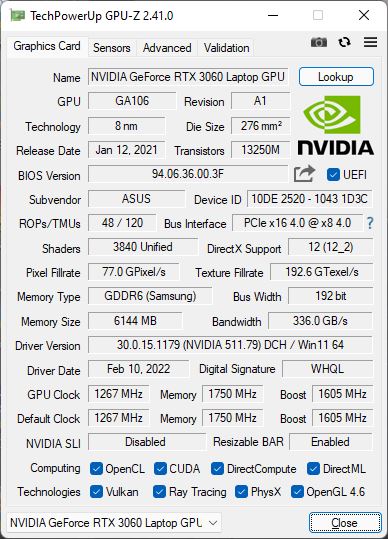
La combinación de Intel Core i7-12700H y Nvidia Geforce RTX 3060 emparejada con 16 GB de RAM DDR5 debería ser lo bastante potente para todas las tareas y retos, incluyendo los juegos modernos que, salvo quizá algunas excepciones, deberían ejecutarse de forma perfectamente fluida con los máximos detalles en resolución FHD nativa.
Si bien el procesador es idéntico para todas las SKUs la GPU no lo es, y Asus ofrece la posibilidad de elegir entre cuatro GPUs diferentes: RTX 3050, RTX 3050 Ti, RTX 3060 y RTX 3070.
Condiciones de la prueba
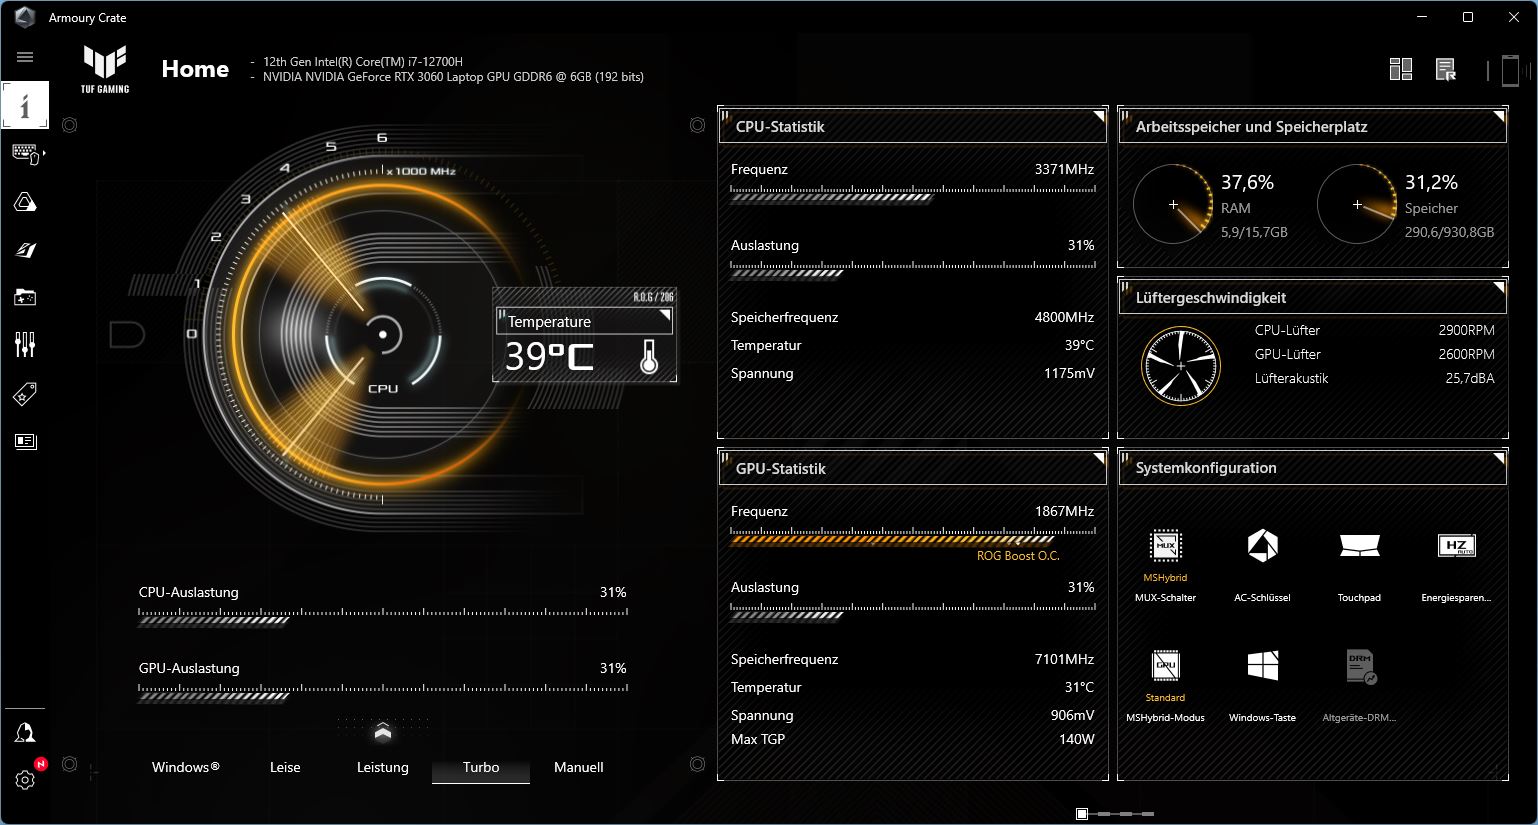
Para lograr los mejores resultados posibles, configuramos el perfil de rendimiento en "Turbo" a través del software Armory Crate incluido.
Dado que muchas opciones sólo pueden configurarse con el propio software de Asus, los usuarios no tendrán más remedio que utilizarlo. Hay que tener en cuenta que algunos fabricantes utilizan su software para recoger los datos de actividad del usuario.
Procesador
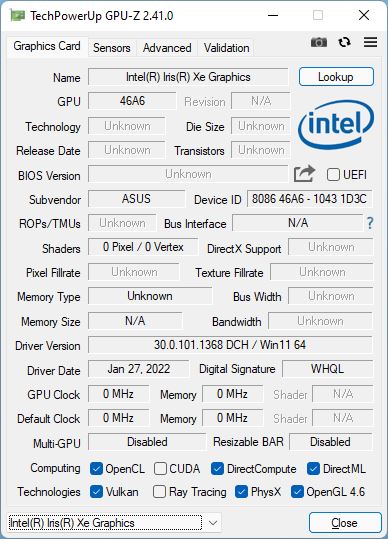
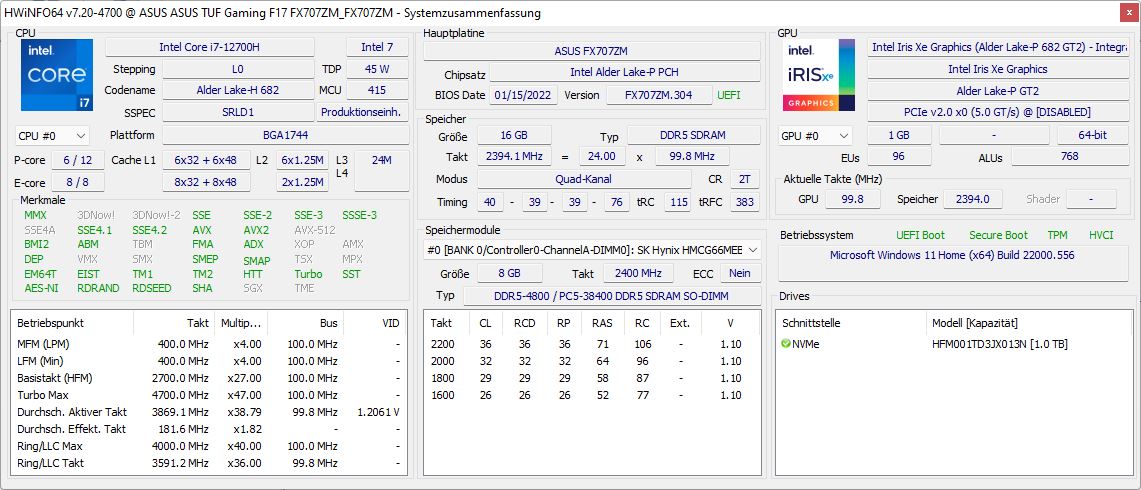
El Intel Core i7-12700H es un miembro de la actual familia Alder Lake de Intel y cuenta con un total de 14 núcleos (6 x P-cores, 8 x E-cores) para un total de 20 hilos. Su GPU Intel Xe Graphics integrada cuenta con 96 UE y funciona a un máximo de 1,4 GHz.
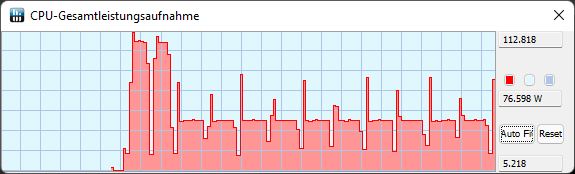
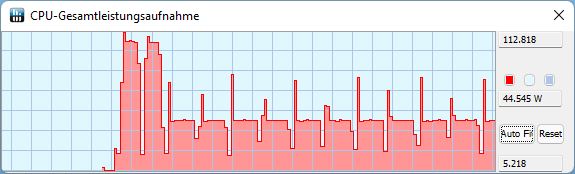
Durante nuestro bucle de CineBench de 30 minutos, nuestro i7-12700H empezó a un nivel comparable al Core i9-12900HK del MSI GE76 Raider, pero luego cayó rápidamente a un nivel más adecuado para el i9-11900H de la última generación. Esto se hace muy evidente cuando se mira el TDP de la CPU. Durante las dos primeras ejecuciones el consumo de energía de la CPU alcanza un pico de 111 W durante unos segundos antes de reducirse a 45 W. A partir de la tercera iteración el pico se registra en unos 75-80 W mucho más bajos que luego se reducen muy rápidamente a sólo 45 W.
En otras palabras: el rendimiento en ráfagas a corto plazo es alrededor de un 30 % más rápido que en su predecesor, mientras que el rendimiento sostenido a largo plazo no lo es.
En cuanto a la batería, el rendimiento bajó de 2.820 (primera ejecución) y 1.925 (segunda ejecución y posteriores) a sólo 1.768 puntos. Este descenso de rendimiento es notable, pero sigue siendo relativamente menor.
Cinebench R15 Multi Sustained Load
Cinebench R23: Multi Core | Single Core
Cinebench R20: CPU (Multi Core) | CPU (Single Core)
Cinebench R15: CPU Multi 64Bit | CPU Single 64Bit
Blender: v2.79 BMW27 CPU
7-Zip 18.03: 7z b 4 | 7z b 4 -mmt1
Geekbench 5.5: Multi-Core | Single-Core
HWBOT x265 Benchmark v2.2: 4k Preset
LibreOffice : 20 Documents To PDF
R Benchmark 2.5: Overall mean
| CPU Performance rating | |
| Media de la clase Gaming | |
| MSI GE76 Raider | |
| Medio Intel Core i7-12700H | |
| Asus TUF Gaming F17 FX707Z-HX011W | |
| Asus TUF Gaming F17 FX706HM | |
| MSI Katana GF76 11UE | |
| Lenovo Legion 5 17ACH6H-82JY0003GE | |
| Schenker XMG Core 17 (Early 2021) | |
| Cinebench R23 / Multi Core | |
| Media de la clase Gaming (10488 - 42661, n=104, últimos 2 años) | |
| MSI GE76 Raider | |
| Medio Intel Core i7-12700H (4032 - 19330, n=64) | |
| Asus TUF Gaming F17 FX707Z-HX011W | |
| Asus TUF Gaming F17 FX706HM | |
| MSI Katana GF76 11UE | |
| Lenovo Legion 5 17ACH6H-82JY0003GE | |
| Schenker XMG Core 17 (Early 2021) | |
| Cinebench R23 / Single Core | |
| Media de la clase Gaming (1601 - 2415, n=104, últimos 2 años) | |
| MSI GE76 Raider | |
| Asus TUF Gaming F17 FX707Z-HX011W | |
| Medio Intel Core i7-12700H (778 - 1826, n=63) | |
| Asus TUF Gaming F17 FX706HM | |
| MSI Katana GF76 11UE | |
| Lenovo Legion 5 17ACH6H-82JY0003GE | |
| Schenker XMG Core 17 (Early 2021) | |
| Cinebench R20 / CPU (Multi Core) | |
| Media de la clase Gaming (4029 - 16433, n=103, últimos 2 años) | |
| MSI GE76 Raider | |
| Medio Intel Core i7-12700H (1576 - 7407, n=64) | |
| Asus TUF Gaming F17 FX707Z-HX011W | |
| Asus TUF Gaming F17 FX706HM | |
| MSI Katana GF76 11UE | |
| Lenovo Legion 5 17ACH6H-82JY0003GE | |
| Schenker XMG Core 17 (Early 2021) | |
| Cinebench R20 / CPU (Single Core) | |
| Media de la clase Gaming (622 - 913, n=103, últimos 2 años) | |
| MSI GE76 Raider | |
| Asus TUF Gaming F17 FX707Z-HX011W | |
| Medio Intel Core i7-12700H (300 - 704, n=64) | |
| Asus TUF Gaming F17 FX706HM | |
| MSI Katana GF76 11UE | |
| Lenovo Legion 5 17ACH6H-82JY0003GE | |
| Schenker XMG Core 17 (Early 2021) | |
| Cinebench R15 / CPU Multi 64Bit | |
| Media de la clase Gaming (1578 - 6330, n=102, últimos 2 años) | |
| MSI GE76 Raider | |
| Asus TUF Gaming F17 FX707Z-HX011W | |
| Medio Intel Core i7-12700H (1379 - 2916, n=70) | |
| Asus TUF Gaming F17 FX706HM | |
| MSI Katana GF76 11UE | |
| Lenovo Legion 5 17ACH6H-82JY0003GE | |
| Schenker XMG Core 17 (Early 2021) | |
| Cinebench R15 / CPU Single 64Bit | |
| Media de la clase Gaming (188.8 - 350, n=103, últimos 2 años) | |
| MSI GE76 Raider | |
| Asus TUF Gaming F17 FX707Z-HX011W | |
| Medio Intel Core i7-12700H (113 - 263, n=65) | |
| Asus TUF Gaming F17 FX706HM | |
| MSI Katana GF76 11UE | |
| Lenovo Legion 5 17ACH6H-82JY0003GE | |
| Schenker XMG Core 17 (Early 2021) | |
| Blender / v2.79 BMW27 CPU | |
| Schenker XMG Core 17 (Early 2021) | |
| Lenovo Legion 5 17ACH6H-82JY0003GE | |
| MSI Katana GF76 11UE | |
| Asus TUF Gaming F17 FX707Z-HX011W | |
| Asus TUF Gaming F17 FX706HM | |
| Medio Intel Core i7-12700H (168 - 732, n=63) | |
| MSI GE76 Raider | |
| Media de la clase Gaming (79 - 330, n=101, últimos 2 años) | |
| 7-Zip 18.03 / 7z b 4 | |
| Media de la clase Gaming (33491 - 148086, n=102, últimos 2 años) | |
| MSI GE76 Raider | |
| Medio Intel Core i7-12700H (22844 - 73067, n=63) | |
| Asus TUF Gaming F17 FX707Z-HX011W | |
| Asus TUF Gaming F17 FX706HM | |
| Lenovo Legion 5 17ACH6H-82JY0003GE | |
| MSI Katana GF76 11UE | |
| Schenker XMG Core 17 (Early 2021) | |
| 7-Zip 18.03 / 7z b 4 -mmt1 | |
| Media de la clase Gaming (4824 - 7436, n=102, últimos 2 años) | |
| MSI GE76 Raider | |
| Asus TUF Gaming F17 FX706HM | |
| Medio Intel Core i7-12700H (2743 - 5972, n=63) | |
| Asus TUF Gaming F17 FX707Z-HX011W | |
| MSI Katana GF76 11UE | |
| Schenker XMG Core 17 (Early 2021) | |
| Lenovo Legion 5 17ACH6H-82JY0003GE | |
| Geekbench 5.5 / Multi-Core | |
| Media de la clase Gaming (6460 - 28263, n=102, últimos 2 años) | |
| MSI GE76 Raider | |
| Asus TUF Gaming F17 FX707Z-HX011W | |
| Medio Intel Core i7-12700H (5144 - 13745, n=64) | |
| MSI Katana GF76 11UE | |
| Asus TUF Gaming F17 FX706HM | |
| Schenker XMG Core 17 (Early 2021) | |
| Lenovo Legion 5 17ACH6H-82JY0003GE | |
| Geekbench 5.5 / Single-Core | |
| Media de la clase Gaming (1403 - 2474, n=102, últimos 2 años) | |
| MSI GE76 Raider | |
| Asus TUF Gaming F17 FX707Z-HX011W | |
| Medio Intel Core i7-12700H (803 - 1851, n=64) | |
| Asus TUF Gaming F17 FX706HM | |
| MSI Katana GF76 11UE | |
| Lenovo Legion 5 17ACH6H-82JY0003GE | |
| Schenker XMG Core 17 (Early 2021) | |
| HWBOT x265 Benchmark v2.2 / 4k Preset | |
| Media de la clase Gaming (11.5 - 44.4, n=102, últimos 2 años) | |
| MSI GE76 Raider | |
| Medio Intel Core i7-12700H (4.67 - 21.8, n=64) | |
| Asus TUF Gaming F17 FX706HM | |
| Asus TUF Gaming F17 FX707Z-HX011W | |
| MSI Katana GF76 11UE | |
| Lenovo Legion 5 17ACH6H-82JY0003GE | |
| Schenker XMG Core 17 (Early 2021) | |
| LibreOffice / 20 Documents To PDF | |
| Asus TUF Gaming F17 FX707Z-HX011W | |
| Schenker XMG Core 17 (Early 2021) | |
| Lenovo Legion 5 17ACH6H-82JY0003GE | |
| Media de la clase Gaming (33.2 - 88.8, n=102, últimos 2 años) | |
| MSI Katana GF76 11UE | |
| Medio Intel Core i7-12700H (34.2 - 95.3, n=63) | |
| Asus TUF Gaming F17 FX706HM | |
| MSI GE76 Raider | |
| R Benchmark 2.5 / Overall mean | |
| Schenker XMG Core 17 (Early 2021) | |
| MSI Katana GF76 11UE | |
| Lenovo Legion 5 17ACH6H-82JY0003GE | |
| Asus TUF Gaming F17 FX706HM | |
| Medio Intel Core i7-12700H (0.4441 - 1.052, n=63) | |
| Asus TUF Gaming F17 FX707Z-HX011W | |
| MSI GE76 Raider | |
| Media de la clase Gaming (0.3439 - 0.59, n=102, últimos 2 años) | |
* ... más pequeño es mejor
AIDA64: FP32 Ray-Trace | FPU Julia | CPU SHA3 | CPU Queen | FPU SinJulia | FPU Mandel | CPU AES | CPU ZLib | FP64 Ray-Trace | CPU PhotoWorxx
| Performance rating | |
| Media de la clase Gaming | |
| MSI GE76 Raider | |
| Medio Intel Core i7-12700H | |
| Lenovo Legion 5 17ACH6H-82JY0003GE | |
| Asus TUF Gaming F17 FX707Z-HX011W | |
| Schenker XMG Core 17 (Early 2021) | |
| Asus TUF Gaming F17 FX706HM -9! | |
| MSI Katana GF76 11UE -9! | |
| AIDA64 / FP32 Ray-Trace | |
| Media de la clase Gaming (10227 - 85542, n=102, últimos 2 años) | |
| Lenovo Legion 5 17ACH6H-82JY0003GE | |
| Medio Intel Core i7-12700H (2585 - 17957, n=64) | |
| Schenker XMG Core 17 (Early 2021) | |
| MSI GE76 Raider | |
| Asus TUF Gaming F17 FX707Z-HX011W | |
| AIDA64 / FPU Julia | |
| Media de la clase Gaming (51376 - 372155, n=102, últimos 2 años) | |
| Lenovo Legion 5 17ACH6H-82JY0003GE | |
| Medio Intel Core i7-12700H (12439 - 90760, n=64) | |
| Schenker XMG Core 17 (Early 2021) | |
| MSI GE76 Raider | |
| Asus TUF Gaming F17 FX707Z-HX011W | |
| AIDA64 / CPU SHA3 | |
| Media de la clase Gaming (2180 - 10115, n=102, últimos 2 años) | |
| MSI GE76 Raider | |
| Medio Intel Core i7-12700H (833 - 4242, n=64) | |
| Lenovo Legion 5 17ACH6H-82JY0003GE | |
| Schenker XMG Core 17 (Early 2021) | |
| Asus TUF Gaming F17 FX707Z-HX011W | |
| AIDA64 / CPU Queen | |
| Media de la clase Gaming (49785 - 173351, n=86, últimos 2 años) | |
| MSI GE76 Raider | |
| Asus TUF Gaming F17 FX707Z-HX011W | |
| Medio Intel Core i7-12700H (57923 - 103202, n=63) | |
| Lenovo Legion 5 17ACH6H-82JY0003GE | |
| Schenker XMG Core 17 (Early 2021) | |
| AIDA64 / FPU SinJulia | |
| Media de la clase Gaming (4424 - 33636, n=102, últimos 2 años) | |
| MSI GE76 Raider | |
| Lenovo Legion 5 17ACH6H-82JY0003GE | |
| Medio Intel Core i7-12700H (3249 - 9939, n=64) | |
| Schenker XMG Core 17 (Early 2021) | |
| Asus TUF Gaming F17 FX707Z-HX011W | |
| AIDA64 / FPU Mandel | |
| Media de la clase Gaming (25115 - 196829, n=102, últimos 2 años) | |
| Lenovo Legion 5 17ACH6H-82JY0003GE | |
| Medio Intel Core i7-12700H (7135 - 44760, n=64) | |
| Schenker XMG Core 17 (Early 2021) | |
| MSI GE76 Raider | |
| Asus TUF Gaming F17 FX707Z-HX011W | |
| AIDA64 / CPU AES | |
| Media de la clase Gaming (39258 - 247074, n=102, últimos 2 años) | |
| MSI GE76 Raider | |
| Lenovo Legion 5 17ACH6H-82JY0003GE | |
| Medio Intel Core i7-12700H (31839 - 144360, n=64) | |
| Asus TUF Gaming F17 FX707Z-HX011W | |
| Schenker XMG Core 17 (Early 2021) | |
| AIDA64 / CPU ZLib | |
| Media de la clase Gaming (574 - 2531, n=102, últimos 2 años) | |
| MSI GE76 Raider | |
| Medio Intel Core i7-12700H (305 - 1171, n=64) | |
| Asus TUF Gaming F17 FX707Z-HX011W | |
| Lenovo Legion 5 17ACH6H-82JY0003GE | |
| Schenker XMG Core 17 (Early 2021) | |
| MSI Katana GF76 11UE | |
| Asus TUF Gaming F17 FX706HM | |
| AIDA64 / FP64 Ray-Trace | |
| Media de la clase Gaming (5509 - 45446, n=102, últimos 2 años) | |
| Lenovo Legion 5 17ACH6H-82JY0003GE | |
| Medio Intel Core i7-12700H (1437 - 9692, n=64) | |
| Schenker XMG Core 17 (Early 2021) | |
| MSI GE76 Raider | |
| Asus TUF Gaming F17 FX707Z-HX011W | |
| AIDA64 / CPU PhotoWorxx | |
| Media de la clase Gaming (12271 - 89891, n=102, últimos 2 años) | |
| MSI GE76 Raider | |
| Medio Intel Core i7-12700H (12863 - 52207, n=64) | |
| Asus TUF Gaming F17 FX707Z-HX011W | |
| Schenker XMG Core 17 (Early 2021) | |
| Lenovo Legion 5 17ACH6H-82JY0003GE | |
Rendimiento del sistema
En PCMark 10 el F17 rindió mucho peor de lo que hubiéramos esperado, entre un 6 y un 15% por debajo de la media de sistemas comparables. Es capaz de superar a su propio predecesor sólo en la creación de contenidos digitales, pero rinde mucho más lento en general. Pudimos reproducir estos resultados ejecutando la prueba por segunda vez.
Subjetivamente, el sistema funcionó con mucha fluidez y sin ningún tipo de contratiempos notables.
CrossMark: Overall | Productivity | Creativity | Responsiveness
| PCMark 10 / Score | |
| Media de la clase Gaming (5828 - 12414, n=93, últimos 2 años) | |
| MSI GE76 Raider | |
| Medio Intel Core i7-12700H, NVIDIA GeForce RTX 3060 Laptop GPU (5986 - 8156, n=12) | |
| Asus TUF Gaming F17 FX706HM | |
| Lenovo Legion 5 17ACH6H-82JY0003GE | |
| MSI Katana GF76 11UE | |
| Asus TUF Gaming F17 FX707Z-HX011W | |
| Schenker XMG Core 17 (Early 2021) | |
| PCMark 10 / Essentials | |
| MSI GE76 Raider | |
| Media de la clase Gaming (8810 - 11935, n=97, últimos 2 años) | |
| Asus TUF Gaming F17 FX706HM | |
| Medio Intel Core i7-12700H, NVIDIA GeForce RTX 3060 Laptop GPU (9289 - 12144, n=12) | |
| MSI Katana GF76 11UE | |
| Lenovo Legion 5 17ACH6H-82JY0003GE | |
| Asus TUF Gaming F17 FX707Z-HX011W | |
| Schenker XMG Core 17 (Early 2021) | |
| PCMark 10 / Productivity | |
| Media de la clase Gaming (6845 - 25323, n=95, últimos 2 años) | |
| MSI GE76 Raider | |
| Medio Intel Core i7-12700H, NVIDIA GeForce RTX 3060 Laptop GPU (6161 - 10362, n=12) | |
| Asus TUF Gaming F17 FX706HM | |
| Lenovo Legion 5 17ACH6H-82JY0003GE | |
| MSI Katana GF76 11UE | |
| Schenker XMG Core 17 (Early 2021) | |
| Asus TUF Gaming F17 FX707Z-HX011W | |
| PCMark 10 / Digital Content Creation | |
| Media de la clase Gaming (7602 - 19954, n=95, últimos 2 años) | |
| MSI GE76 Raider | |
| Medio Intel Core i7-12700H, NVIDIA GeForce RTX 3060 Laptop GPU (8950 - 12554, n=12) | |
| Asus TUF Gaming F17 FX707Z-HX011W | |
| Asus TUF Gaming F17 FX706HM | |
| Lenovo Legion 5 17ACH6H-82JY0003GE | |
| MSI Katana GF76 11UE | |
| Schenker XMG Core 17 (Early 2021) | |
| CrossMark / Overall | |
| Media de la clase Gaming (1366 - 2409, n=94, últimos 2 años) | |
| Medio Intel Core i7-12700H, NVIDIA GeForce RTX 3060 Laptop GPU (1649 - 2017, n=11) | |
| Asus TUF Gaming F17 FX707Z-HX011W | |
| Lenovo Legion 5 17ACH6H-82JY0003GE | |
| CrossMark / Productivity | |
| Media de la clase Gaming (1386 - 2254, n=94, últimos 2 años) | |
| Medio Intel Core i7-12700H, NVIDIA GeForce RTX 3060 Laptop GPU (1536 - 1958, n=11) | |
| Asus TUF Gaming F17 FX707Z-HX011W | |
| Lenovo Legion 5 17ACH6H-82JY0003GE | |
| CrossMark / Creativity | |
| Media de la clase Gaming (1343 - 2786, n=94, últimos 2 años) | |
| Asus TUF Gaming F17 FX707Z-HX011W | |
| Medio Intel Core i7-12700H, NVIDIA GeForce RTX 3060 Laptop GPU (1816 - 2084, n=11) | |
| Lenovo Legion 5 17ACH6H-82JY0003GE | |
| CrossMark / Responsiveness | |
| Media de la clase Gaming (1226 - 2334, n=94, últimos 2 años) | |
| Medio Intel Core i7-12700H, NVIDIA GeForce RTX 3060 Laptop GPU (1210 - 2207, n=11) | |
| Asus TUF Gaming F17 FX707Z-HX011W | |
| Lenovo Legion 5 17ACH6H-82JY0003GE | |
| PCMark 10 Score | 5986 puntos | |
ayuda | ||
| AIDA64 / Memory Copy | |
| Media de la clase Gaming (21750 - 129946, n=102, últimos 2 años) | |
| MSI GE76 Raider | |
| Medio Intel Core i7-12700H (25615 - 80511, n=64) | |
| Asus TUF Gaming F17 FX707Z-HX011W | |
| Lenovo Legion 5 17ACH6H-82JY0003GE | |
| Schenker XMG Core 17 (Early 2021) | |
| AIDA64 / Memory Read | |
| Media de la clase Gaming (22956 - 118858, n=102, últimos 2 años) | |
| MSI GE76 Raider | |
| Asus TUF Gaming F17 FX707Z-HX011W | |
| Medio Intel Core i7-12700H (25586 - 79442, n=64) | |
| Lenovo Legion 5 17ACH6H-82JY0003GE | |
| Schenker XMG Core 17 (Early 2021) | |
| AIDA64 / Memory Write | |
| Media de la clase Gaming (22297 - 135096, n=102, últimos 2 años) | |
| MSI GE76 Raider | |
| Asus TUF Gaming F17 FX707Z-HX011W | |
| Medio Intel Core i7-12700H (23679 - 88660, n=64) | |
| Schenker XMG Core 17 (Early 2021) | |
| Lenovo Legion 5 17ACH6H-82JY0003GE | |
| AIDA64 / Memory Latency | |
| Media de la clase Gaming (75.3 - 165.4, n=102, últimos 2 años) | |
| MSI GE76 Raider | |
| Lenovo Legion 5 17ACH6H-82JY0003GE | |
| Medio Intel Core i7-12700H (76.2 - 133.9, n=62) | |
| Schenker XMG Core 17 (Early 2021) | |
| MSI Katana GF76 11UE | |
| Asus TUF Gaming F17 FX706HM | |
| Asus TUF Gaming F17 FX707Z-HX011W | |
* ... más pequeño es mejor
Latencias del CPD
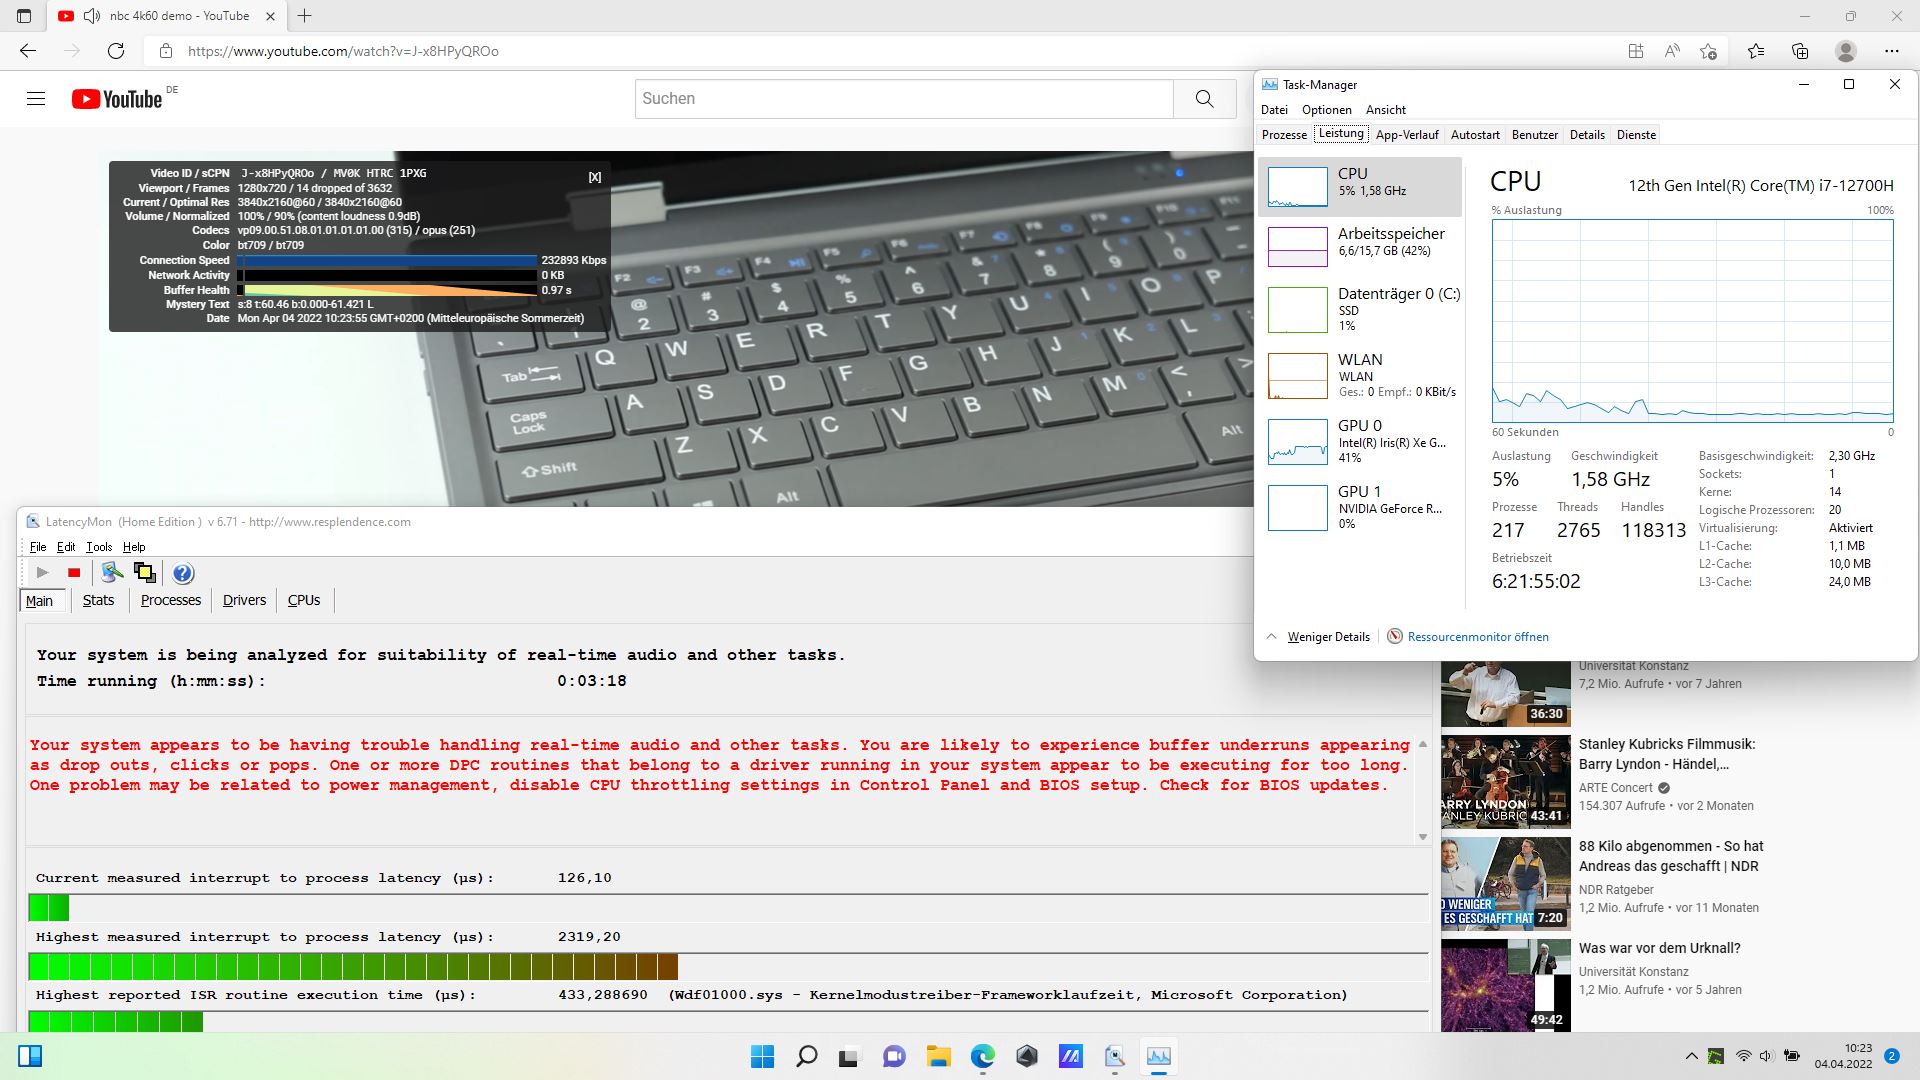
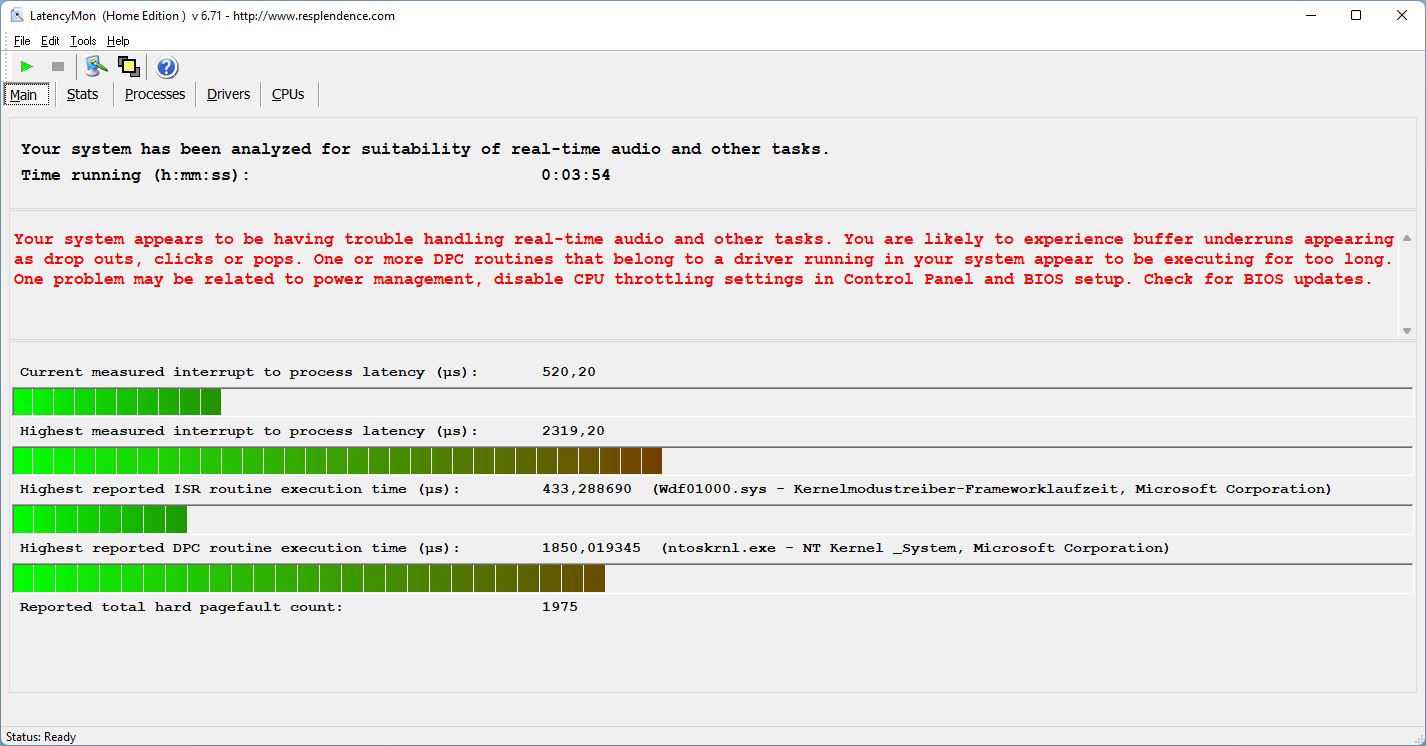
Desgraciadamente, encontramos latencias significativas del CPD al iniciar el navegador Edge. Como nota positiva, éstas no empeoraron a partir de ese momento independientemente de la prueba que ejecutáramos. Esto significa que nuestra prueba de vídeo 4K/60 FPS de YouTube no funcionó muy bien, con un total de 14 fotogramas caídos. Nuestro principal sospechoso de este comportamiento es el controlador del kernel NT.
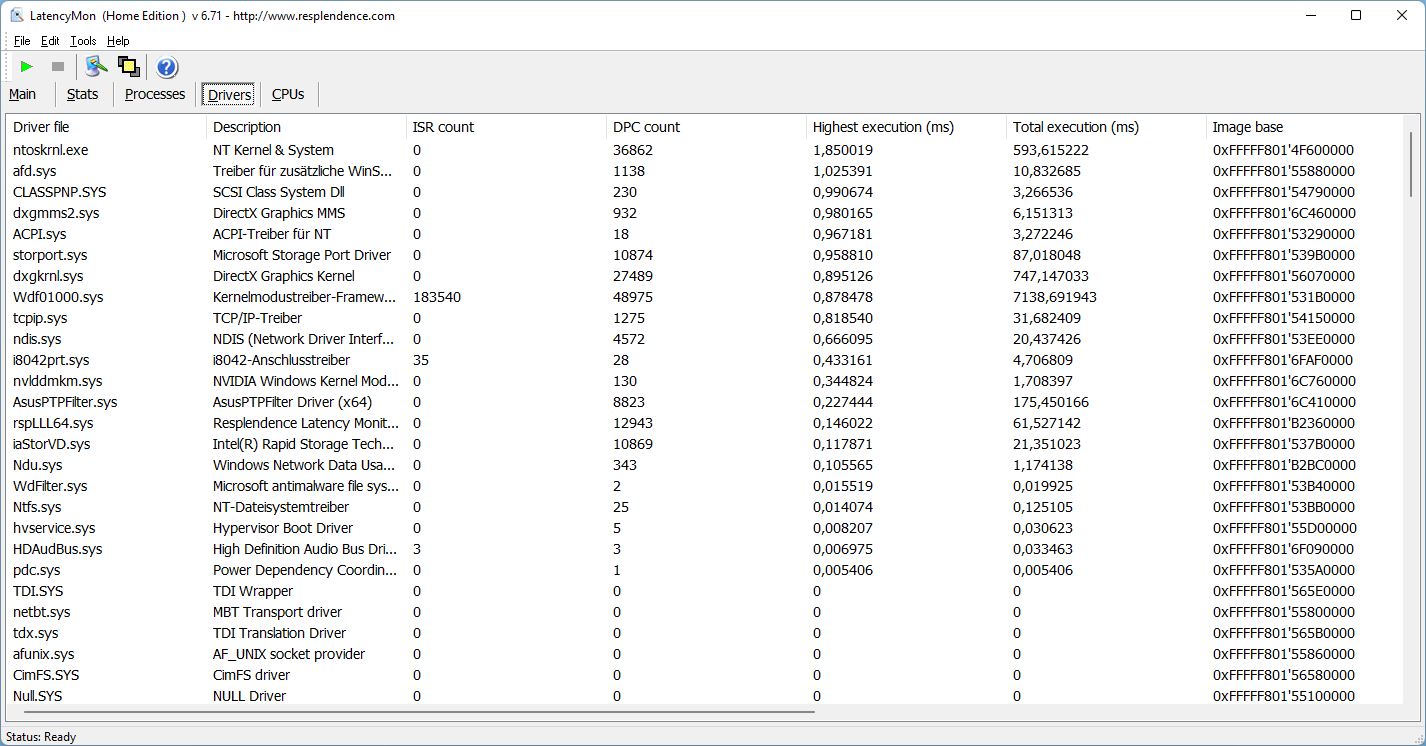
| DPC Latencies / LatencyMon - interrupt to process latency (max), Web, Youtube, Prime95 | |
| MSI Katana GF76 11UE | |
| Asus TUF Gaming F17 FX707Z-HX011W | |
| MSI GE76 Raider | |
| Lenovo Legion 5 17ACH6H-82JY0003GE | |
| Asus TUF Gaming F17 FX706HM | |
| Schenker XMG Core 17 (Early 2021) | |
* ... más pequeño es mejor
Dispositivos de almacenamiento
Nuestra unidad de pruebas estaba equipada con un SSD SK Hynix PCIe 3 de 1 TB, que puede encontrarse en el puesto 44 de nuestra Lista de los mejores SSD/HDD. El mismo SSD ya estaba instalado en el predecesor del F17. Tiene un buen rendimiento en general, pero es incapaz de seguir el ritmo de los SSD de Samsung que se encuentran en el XMG Core o el MSI Raider.
El rendimiento de lectura sostenida resultó ser bastante inconsistente y fluctuó al poco tiempo. Esta puede ser una de las razones de su rendimiento general por debajo de la media en PCMark.

* ... más pequeño es mejor
Sustained Read: DiskSpd Read Loop, Queue Depth 8
Rendimiento de la GPU
Para nuestro deleite (y el de todos los jugadores) las RTX 3060 Está configurada para usar su máximo de 140 W TGP (incluyendo 25 W de Dynamic Boost). En consecuencia, el F17 rindió mejor que la media de portátiles equipados con RTX 3060 en 3DMark, y sólo el Lenovo Legion fue capaz de mantener el ritmo.
Con la batería, la tasa de fotogramas mientras se ejecutaba Witcher 3 en FHD con detalles máximos cayó de 80 FPS a sólo 35 FPS. Esto puede sonar demasiado dramático, pero hemos visto portátiles con GPUs más potentes que funcionan incluso más lento en batería.
| 3DMark 11 Performance | 28010 puntos | |
| 3DMark Cloud Gate Standard Score | 55142 puntos | |
| 3DMark Fire Strike Score | 21179 puntos | |
| 3DMark Time Spy Score | 9490 puntos | |
ayuda | ||
Rendimiento de los juegos
Cuando se enfrentó a sus competidores en nuestra prueba Witcher 3, el F17 consiguió el primer puesto. Incluso el MSI Raider con RTX 3080 fue un 50% más rápido. De media, el F17 resultó ser entre un 6 y un 10 % más rápido que el portátil medio equipado con RTX 3060 y alrededor de un 15 % más rápido que el Lenovo Legion 5 con su GPU RTX 3060 de 130 W.
Far Cry 5 corrió con más de 100 FPS en FHD y detalles máximos, lo que significa el primer lugar para el F17 también.
Cyberpunk 2077 1.5 logró unos buenos 78 FPS en detalles máximos con Raytracing desactivado.
En general, todos los juegos actuales deberían funcionar muy bien en FHD con detalles máximos en el Asus TUF Gaming, que lo hizo mejor que la mayoría de sus competidores en nuestras pruebas de juego.
| Cyberpunk 2077 1.6 | |
| 1920x1080 Medium Preset | |
| Medio NVIDIA GeForce RTX 3060 Laptop GPU (68 - 118, n=14) | |
| Asus TUF Gaming F17 FX707Z-HX011W | |
| 1920x1080 High Preset | |
| Asus TUF Gaming F17 FX707Z-HX011W | |
| Medio NVIDIA GeForce RTX 3060 Laptop GPU (42.2 - 87.7, n=14) | |
| 1920x1080 Ultra Preset | |
| Asus TUF Gaming F17 FX707Z-HX011W | |
| Medio NVIDIA GeForce RTX 3060 Laptop GPU (40 - 78.8, n=16) | |
| 1920x1080 Ray Tracing Ultra Preset (DLSS off) | |
| Asus TUF Gaming F17 FX707Z-HX011W | |
| Medio NVIDIA GeForce RTX 3060 Laptop GPU (12.6 - 28.9, n=7) | |
En Witcher 3, las frecuencias de cuadro se mantuvieron constantes durante toda la hora que duró la prueba, sin que el rendimiento disminuyera en absoluto.
Witcher 3 FPS Graph
| bajo | medio | alto | ultra | |
|---|---|---|---|---|
| GTA V (2015) | 177 | 171 | 161 | 97.5 |
| The Witcher 3 (2015) | 360 | 261.7 | 159 | 86.1 |
| Dota 2 Reborn (2015) | 168 | 154 | 144 | 135 |
| Final Fantasy XV Benchmark (2018) | 173 | 105 | 78 | |
| X-Plane 11.11 (2018) | 128 | 115 | 94.3 | |
| Far Cry 5 (2018) | 163 | 130 | 124 | 118 |
| Strange Brigade (2018) | 289 | 202 | 163 | 142 |
| Cyberpunk 2077 1.6 (2022) | 92 | 82 | 79.1 | 78.8 |
Emisiones - Relativamente silencioso y fresco
Emisiones acústicas
En reposo, los ventiladores estuvieron apagados la mayor parte del tiempo, incluso en modo Turbo. Bajo carga, el F17 permaneció más silencioso que casi todos sus competidores. También pudimos oír algunos ruidos de la bobina en ciertas situaciones, por ejemplo al ejecutar 3DMark 06, que sólo se notaron con nuestros oídos colocados muy cerca del dispositivo.
Ruido
| Ocioso |
| 24 / 24 / 24 dB(A) |
| Carga |
| 42.6 / 46.84 dB(A) |
 | ||
30 dB silencioso 40 dB(A) audible 50 dB(A) ruidosamente alto |
||
min: | ||
| Asus TUF Gaming F17 FX707Z-HX011W GeForce RTX 3060 Laptop GPU, i7-12700H, SK Hynix HFM001TD3JX013N | Asus TUF Gaming F17 FX706HM GeForce RTX 3060 Laptop GPU, i9-11900H, SK Hynix HFM001TD3JX013N | Lenovo Legion 5 17ACH6H-82JY0003GE GeForce RTX 3060 Laptop GPU, R5 5600H, Samsung PM991a MZALQ512HBLU | MSI GE76 Raider GeForce RTX 3080 Ti Laptop GPU, i9-12900HK, Samsung PM9A1 MZVL22T0HBLB | MSI Katana GF76 11UE GeForce RTX 3060 Laptop GPU, i7-11800H, Kingston OM8PCP3512F-AB | Schenker XMG Core 17 (Early 2021) GeForce RTX 3060 Laptop GPU, i7-10870H, Samsung SSD 970 EVO Plus 1TB | |
|---|---|---|---|---|---|---|
| Noise | -14% | -6% | -20% | -26% | -23% | |
| apagado / medio ambiente * (dB) | 24 | 25 -4% | 25 -4% | 26 -8% | 25 -4% | 25 -4% |
| Idle Minimum * (dB) | 24 | 26 -8% | 25 -4% | 26 -8% | 33 -38% | 30 -25% |
| Idle Average * (dB) | 24 | 31 -29% | 25 -4% | 27 -13% | 34 -42% | 32 -33% |
| Idle Maximum * (dB) | 24 | 33 -38% | 30.5 -27% | 40 -67% | 35 -46% | 36 -50% |
| Load Average * (dB) | 42.6 | 48 -13% | 37.5 12% | 50 -17% | 53 -24% | 53 -24% |
| Witcher 3 ultra * (dB) | 46.84 | 47 -0% | 53 -13% | 49 -5% | 51 -9% | |
| Load Maximum * (dB) | 46.84 | 49 -5% | 51 -9% | 53 -13% | 57 -22% | 54 -15% |
* ... más pequeño es mejor
Temperatura
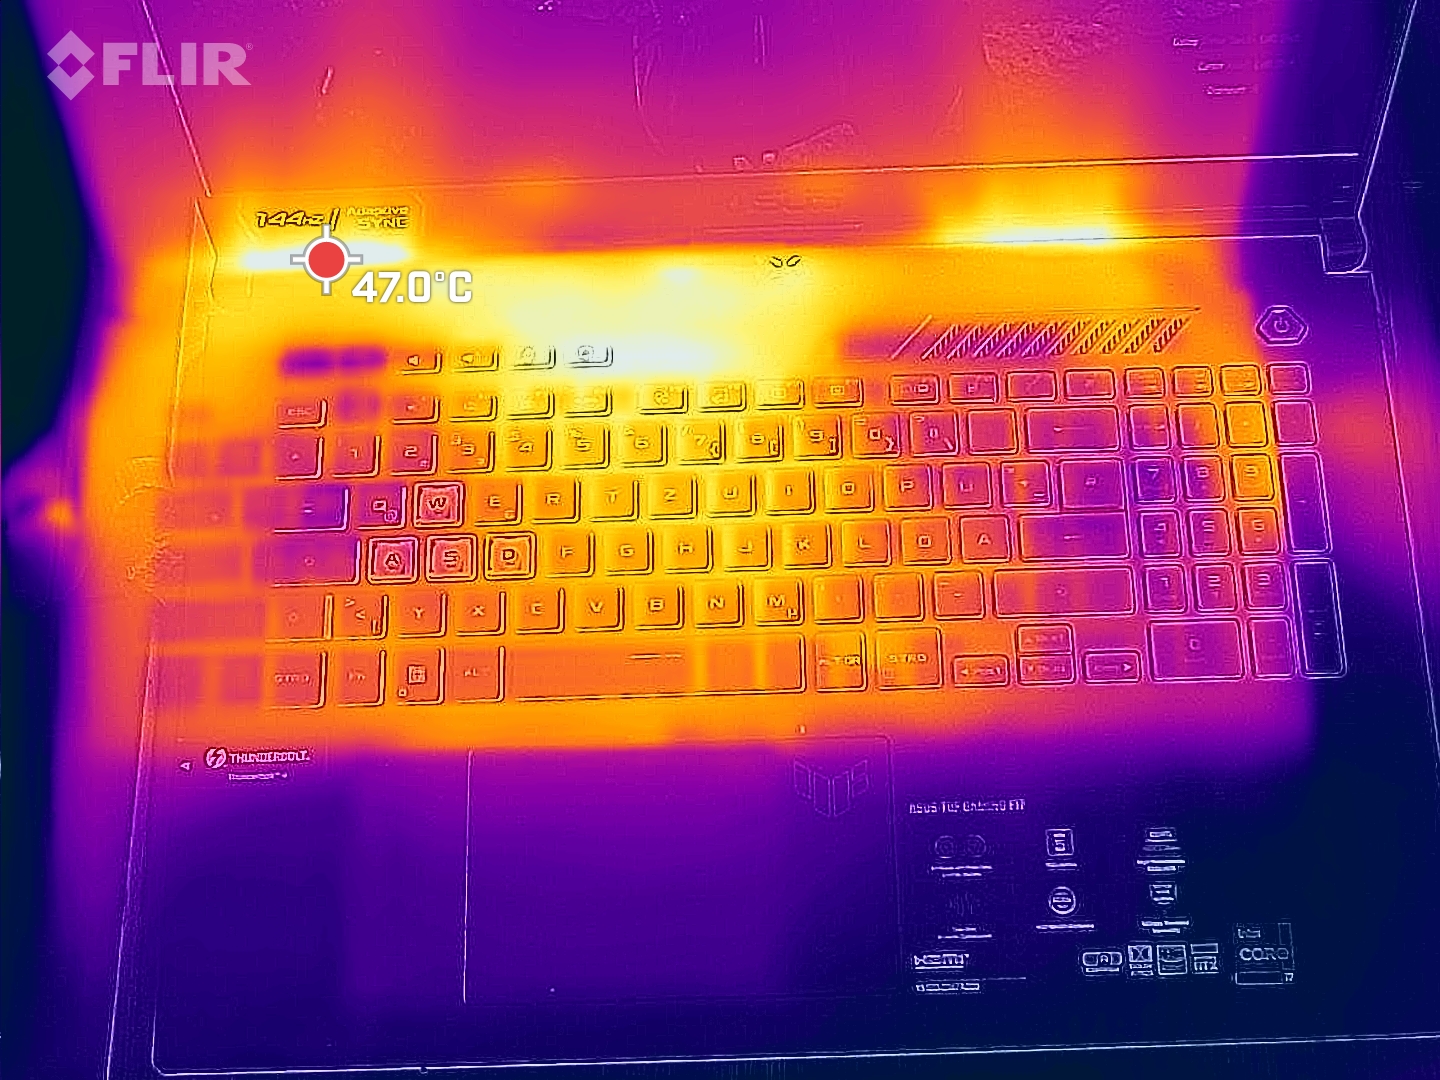
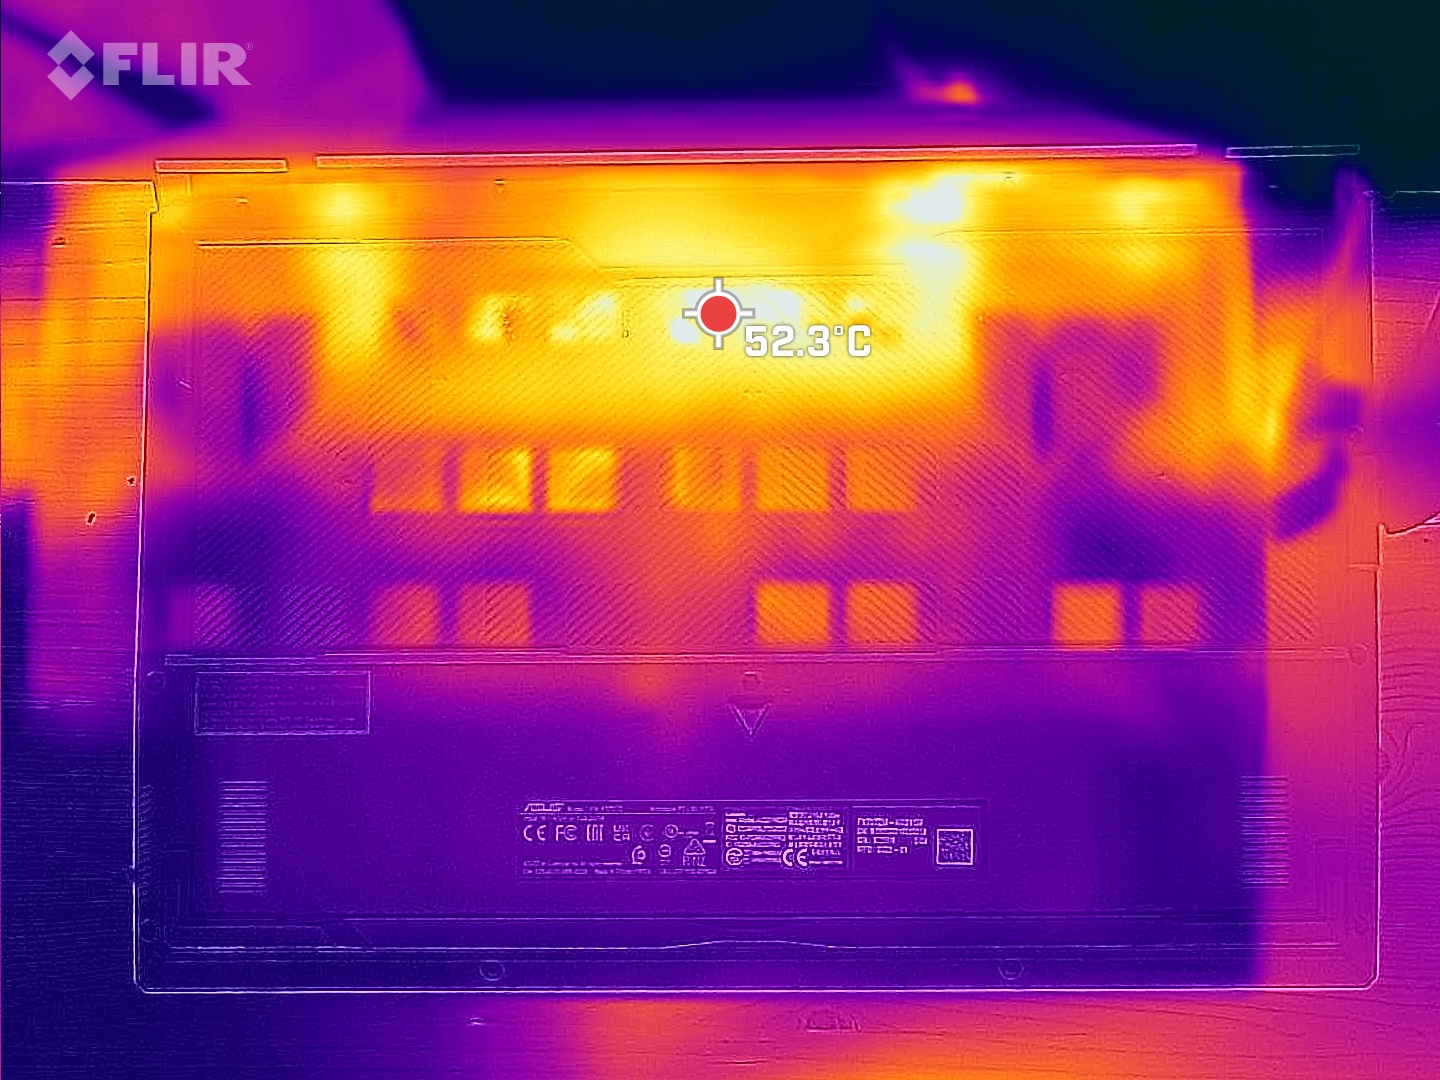
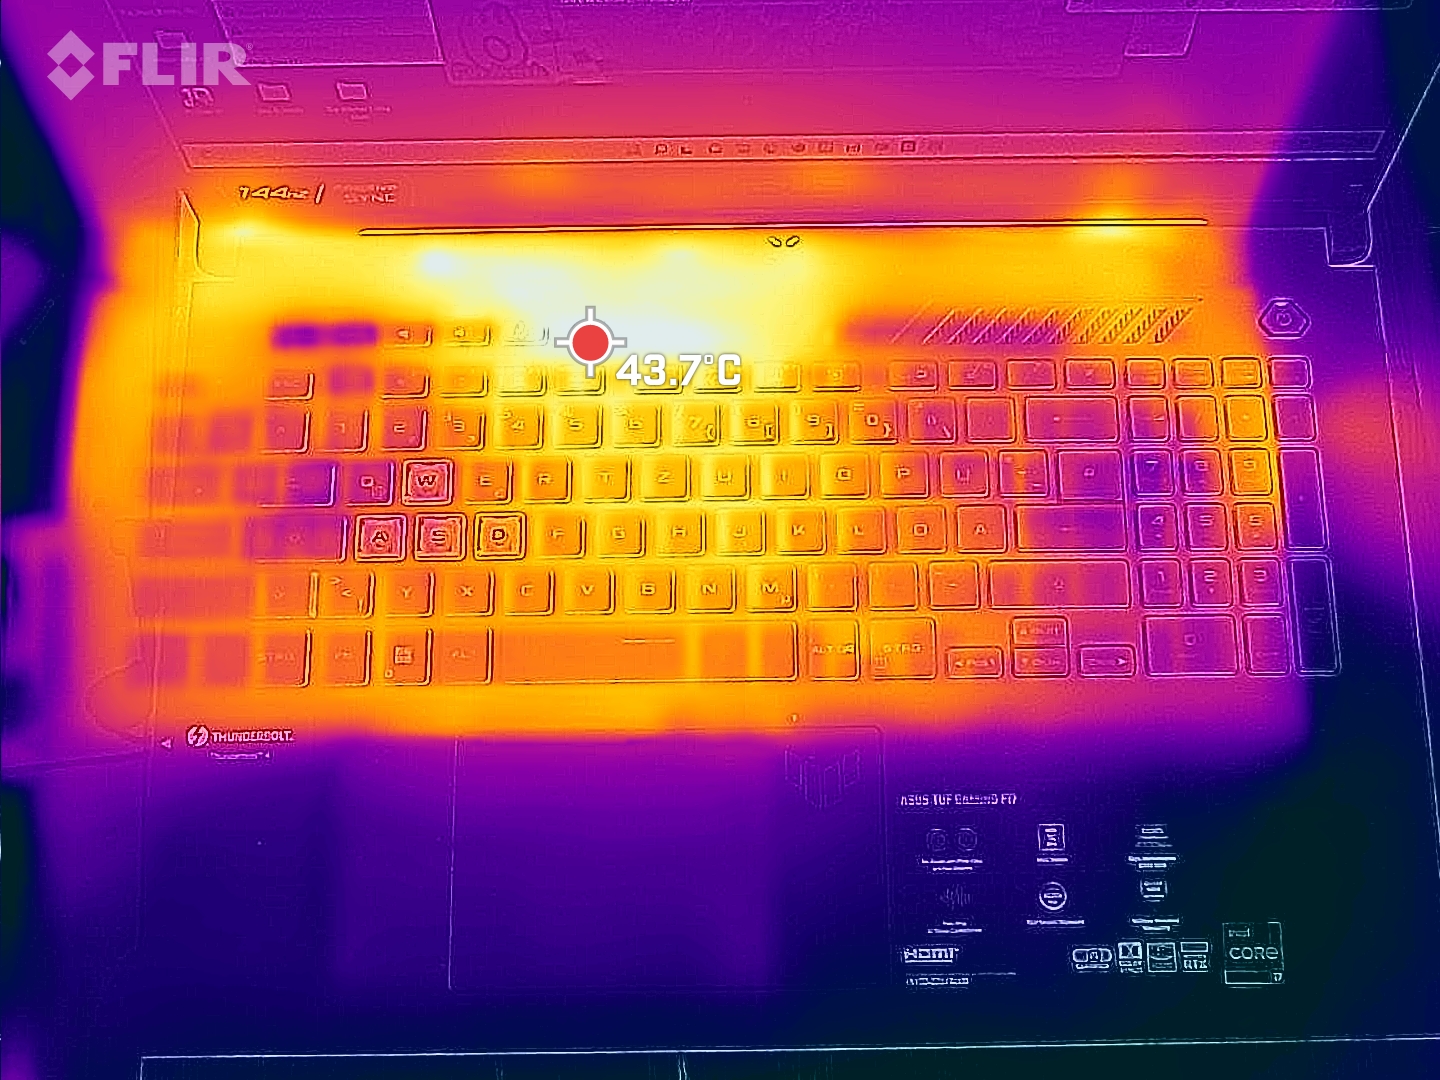
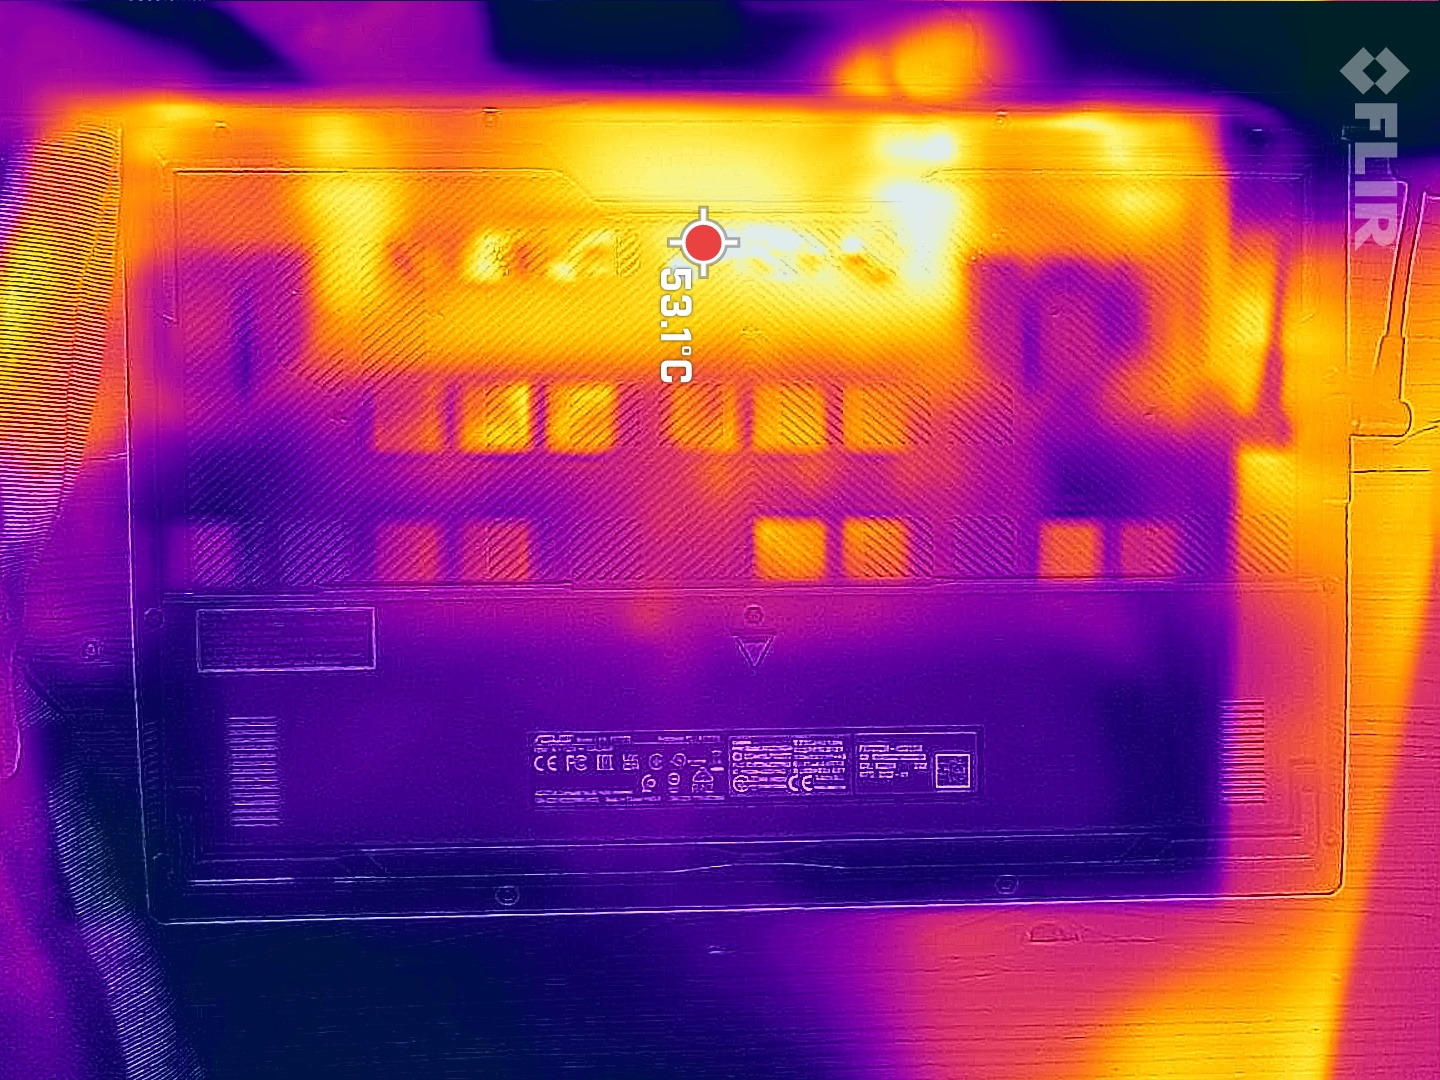
Las temperaturas fueron similares a las de otros portátiles para juegos de 17 pulgadas y significativamente menores que en el predecesor del F17. Los puntos calientes están situados en la parte superior hacia la parte trasera y pueden alcanzar hasta 50 °C.
Los reposamanos permanecen agradablemente frescos en todo momento. El área alrededor de las teclas WASD puede alcanzar una temperatura cálida pero aún aceptable de 43 °C mientras se juega.
(-) La temperatura máxima en la parte superior es de 52 °C / 126 F, frente a la media de 40.4 °C / 105 F, que oscila entre 21.2 y 68.8 °C para la clase Gaming.
(-) El fondo se calienta hasta un máximo de 47 °C / 117 F, frente a la media de 43.2 °C / 110 F
(+) En reposo, la temperatura media de la parte superior es de 28.8 °C / 84# F, frente a la media del dispositivo de 33.9 °C / 93 F.
(-) Jugando a The Witcher 3, la temperatura media de la parte superior es de 39.9 °C / 104 F, frente a la media del dispositivo de 33.9 °C / 93 F.
(+) El reposamanos y el panel táctil están a una temperatura inferior a la de la piel, con un máximo de 30 °C / 86 F y, por tanto, son fríos al tacto.
(±) La temperatura media de la zona del reposamanos de dispositivos similares fue de 28.8 °C / 83.8 F (-1.2 °C / -2.2 F).
| Asus TUF Gaming F17 FX707Z-HX011W Intel Core i7-12700H, NVIDIA GeForce RTX 3060 Laptop GPU | Asus TUF Gaming F17 FX706HM Intel Core i9-11900H, NVIDIA GeForce RTX 3060 Laptop GPU | Lenovo Legion 5 17ACH6H-82JY0003GE AMD Ryzen 5 5600H, NVIDIA GeForce RTX 3060 Laptop GPU | MSI GE76 Raider Intel Core i9-12900HK, NVIDIA GeForce RTX 3080 Ti Laptop GPU | MSI Katana GF76 11UE Intel Core i7-11800H, NVIDIA GeForce RTX 3060 Laptop GPU | Schenker XMG Core 17 (Early 2021) Intel Core i7-10870H, NVIDIA GeForce RTX 3060 Laptop GPU | |
|---|---|---|---|---|---|---|
| Heat | -22% | -1% | -2% | -2% | -1% | |
| Maximum Upper Side * (°C) | 52 | 58.5 -13% | 42.2 19% | 43 17% | 51 2% | 44 15% |
| Maximum Bottom * (°C) | 47 | 58.5 -24% | 50.9 -8% | 47 -0% | 52 -11% | 50 -6% |
| Idle Upper Side * (°C) | 31 | 38 -23% | 34.3 -11% | 33 -6% | 32 -3% | 30 3% |
| Idle Bottom * (°C) | 31 | 39 -26% | 32 -3% | 37 -19% | 29 6% | 36 -16% |
* ... más pequeño es mejor
Prueba de esfuerzo
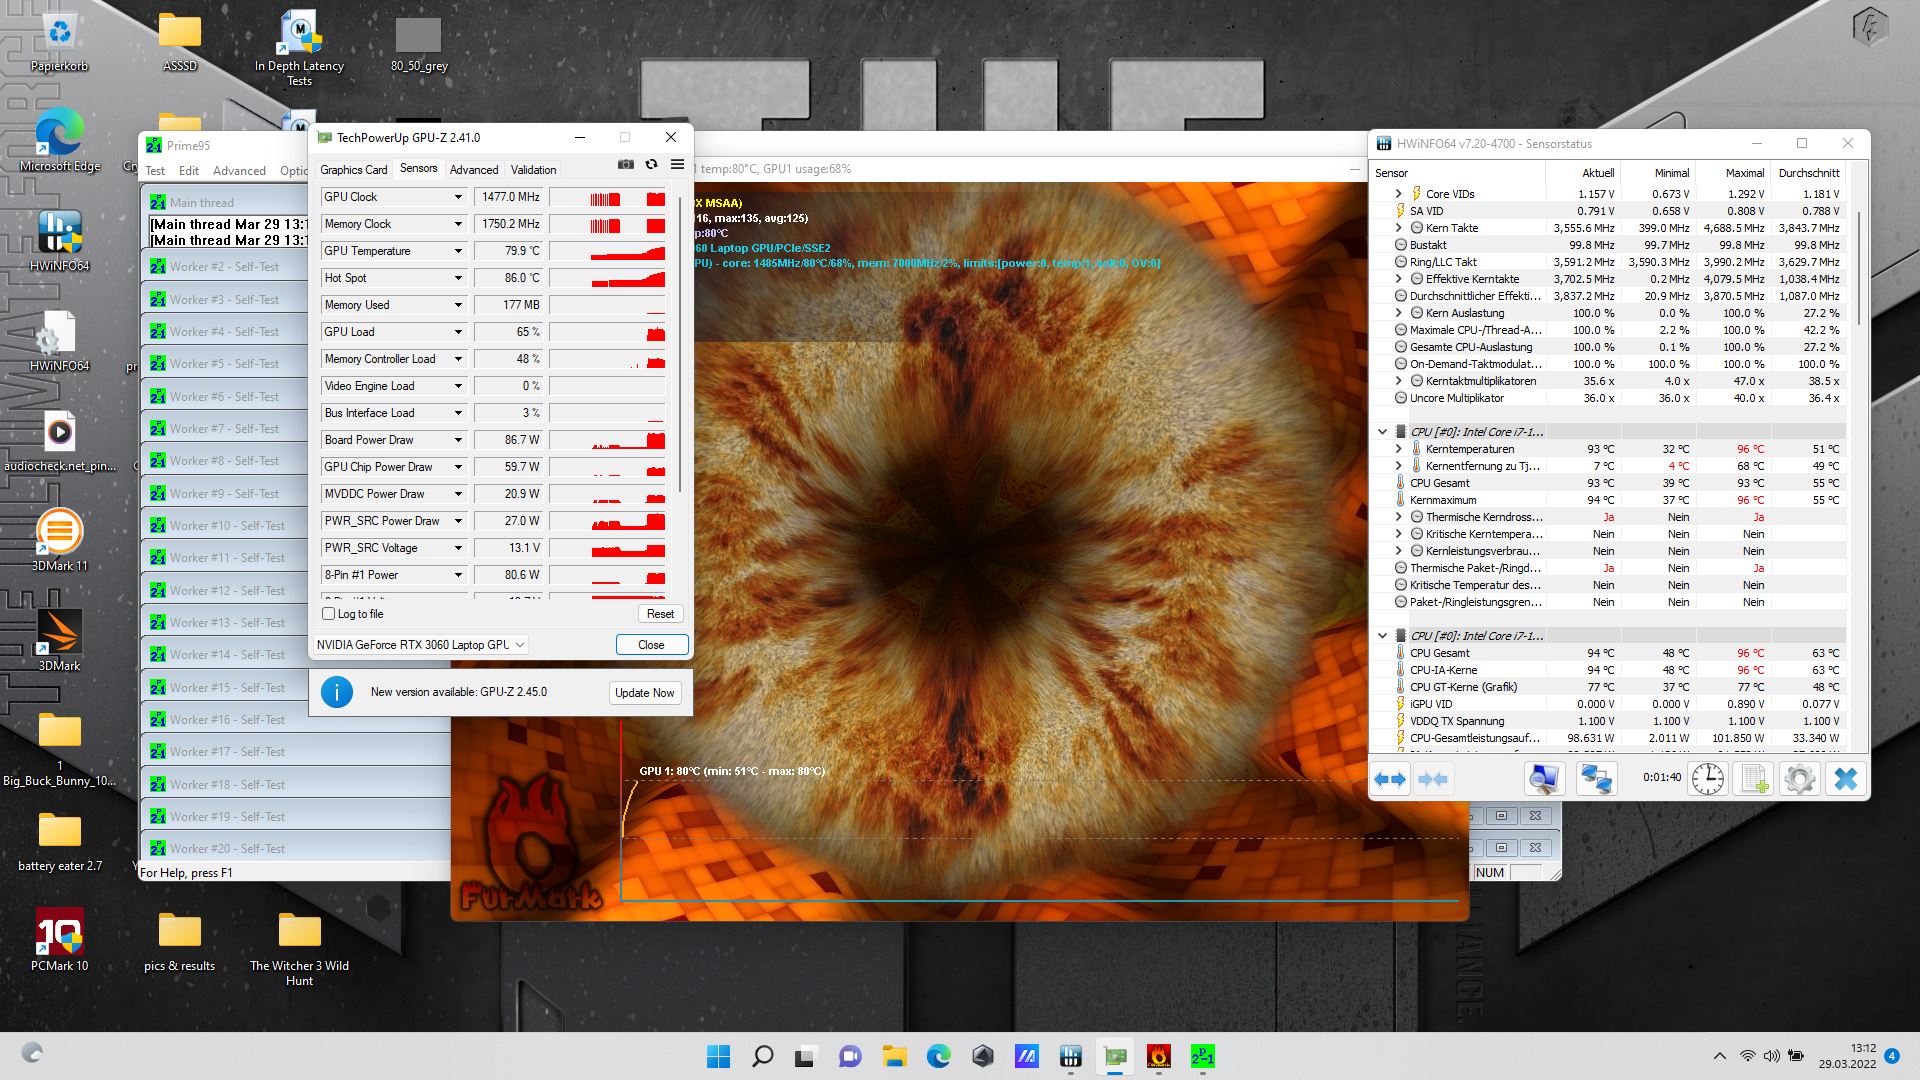
Al ejecutar nuestra prueba de estrés de una hora de duración, la CPU comenzó a 3,6 GHz en todos los núcleos, que luego cayó a 2,5 GHz después de menos de un minuto y a 2,3 GHz al final de la prueba después de una hora completa. Las temperaturas registradas fueron de 83 °C de media, con un pico de 87 °C.
La GPU comienza a 1,6 GHz pero luego cae a 1,3 GHz con una temperatura media registrada de 81 °C.
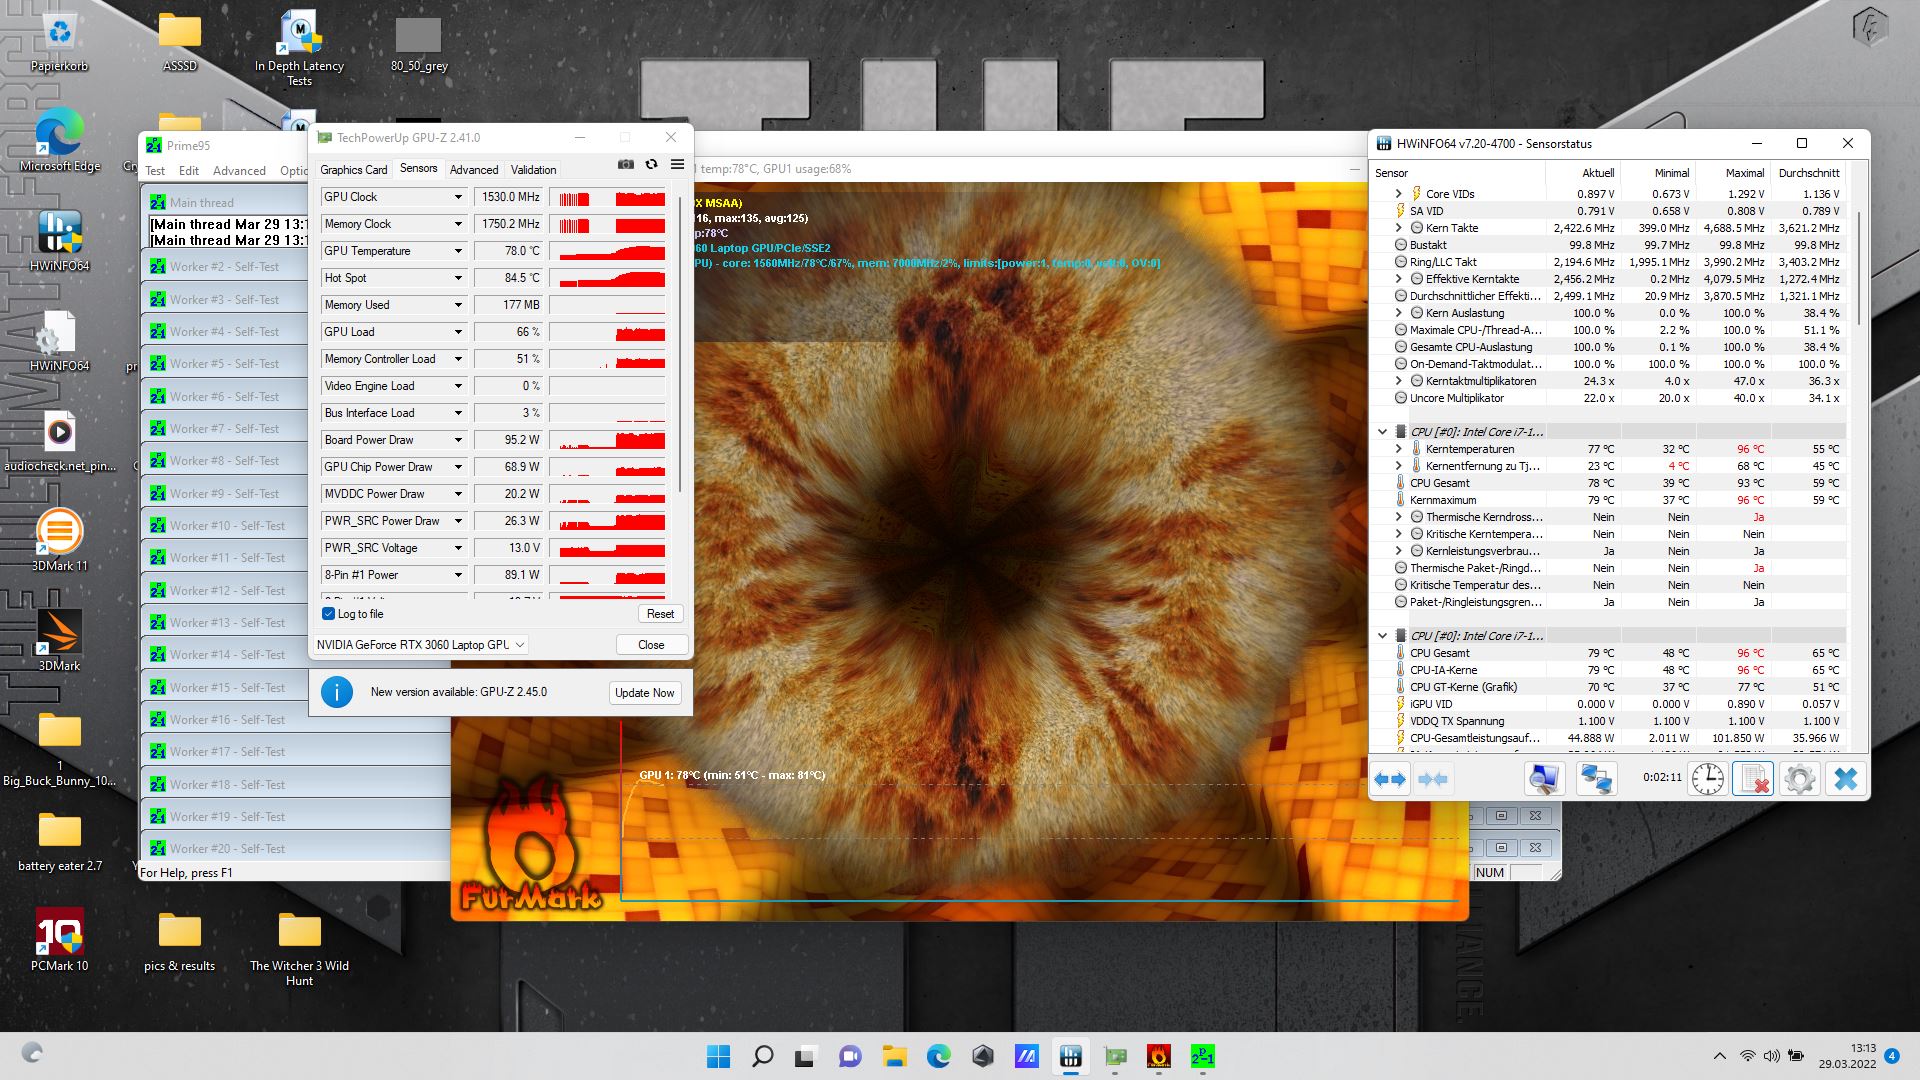
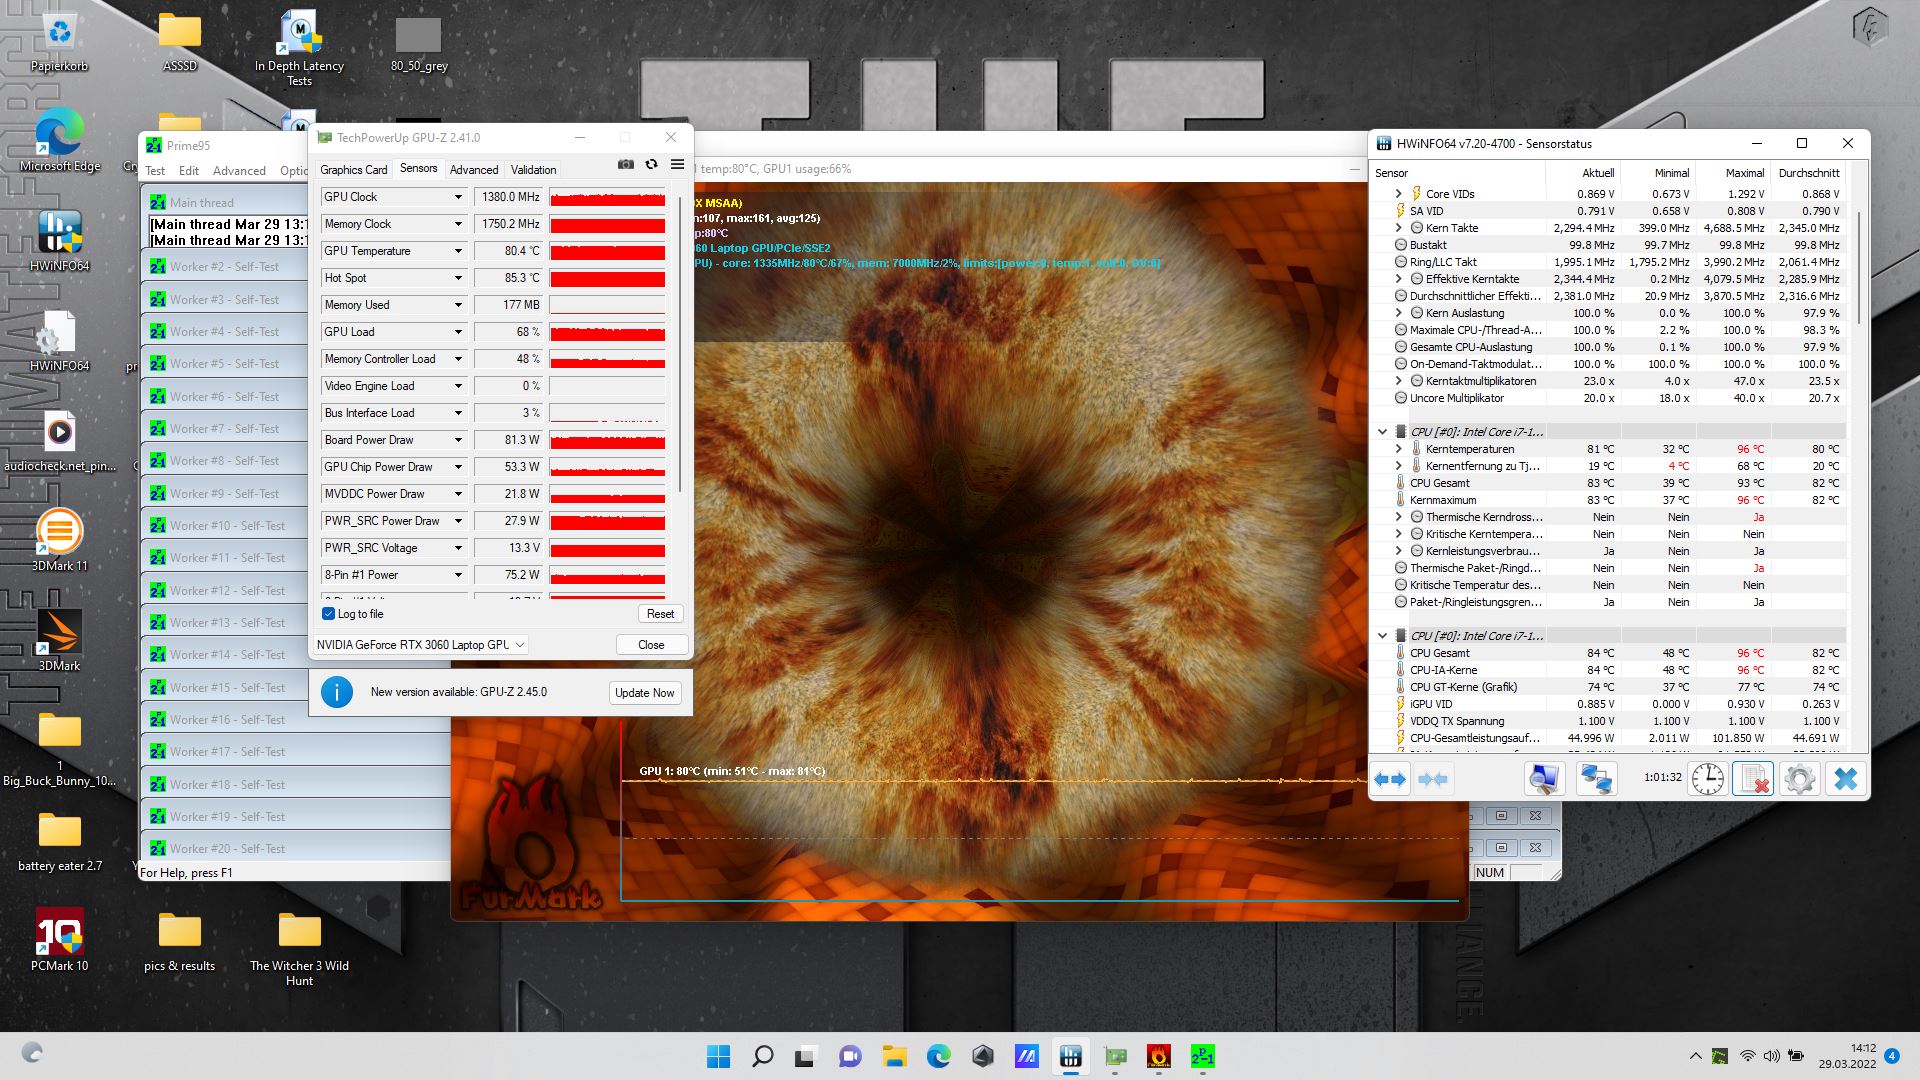
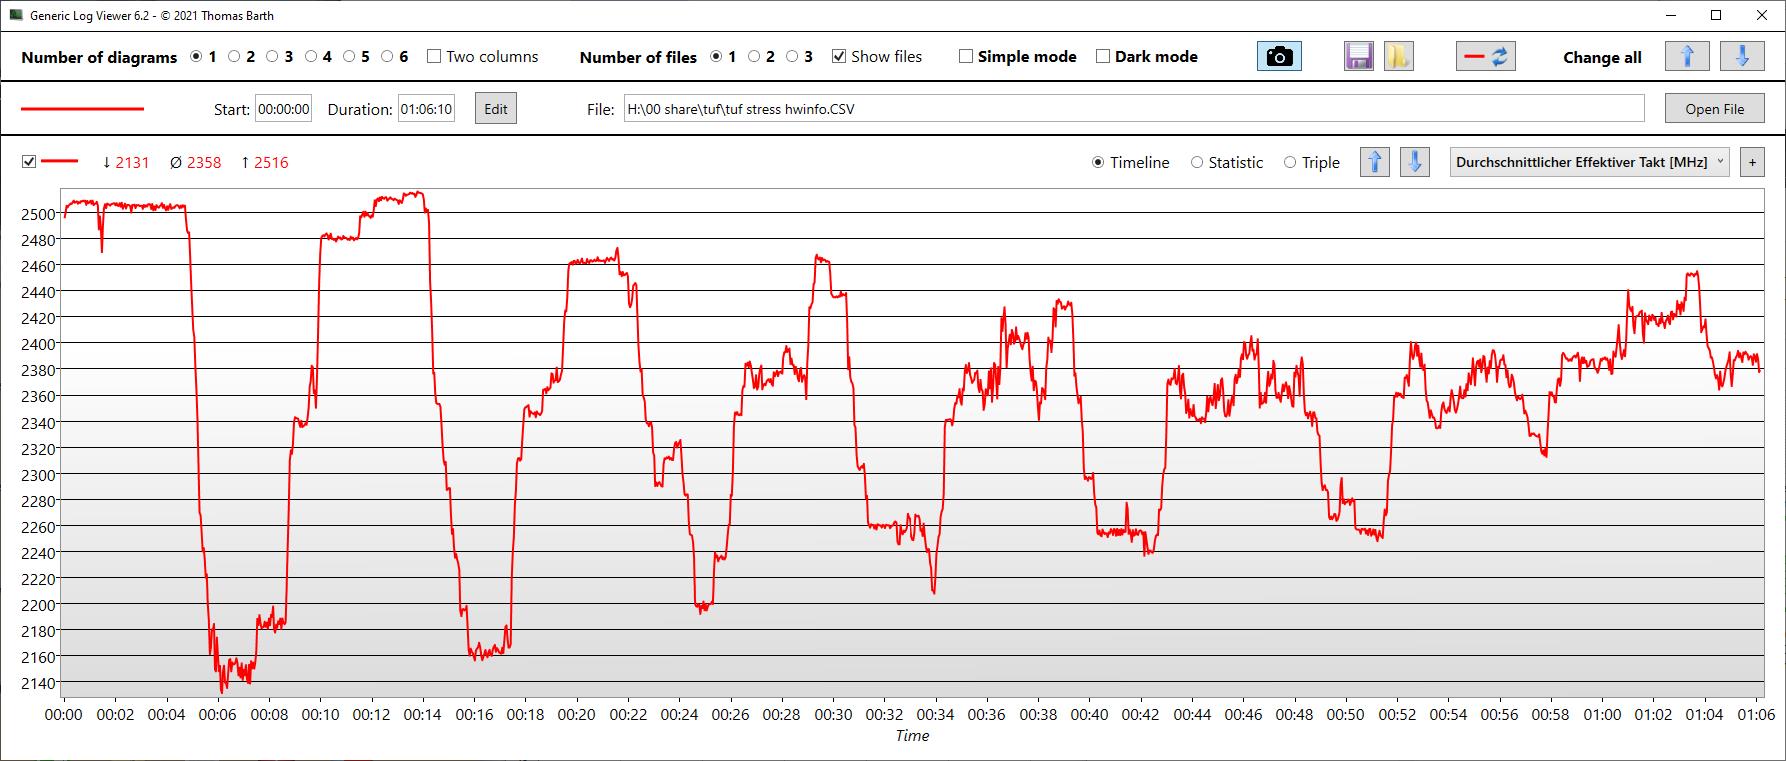
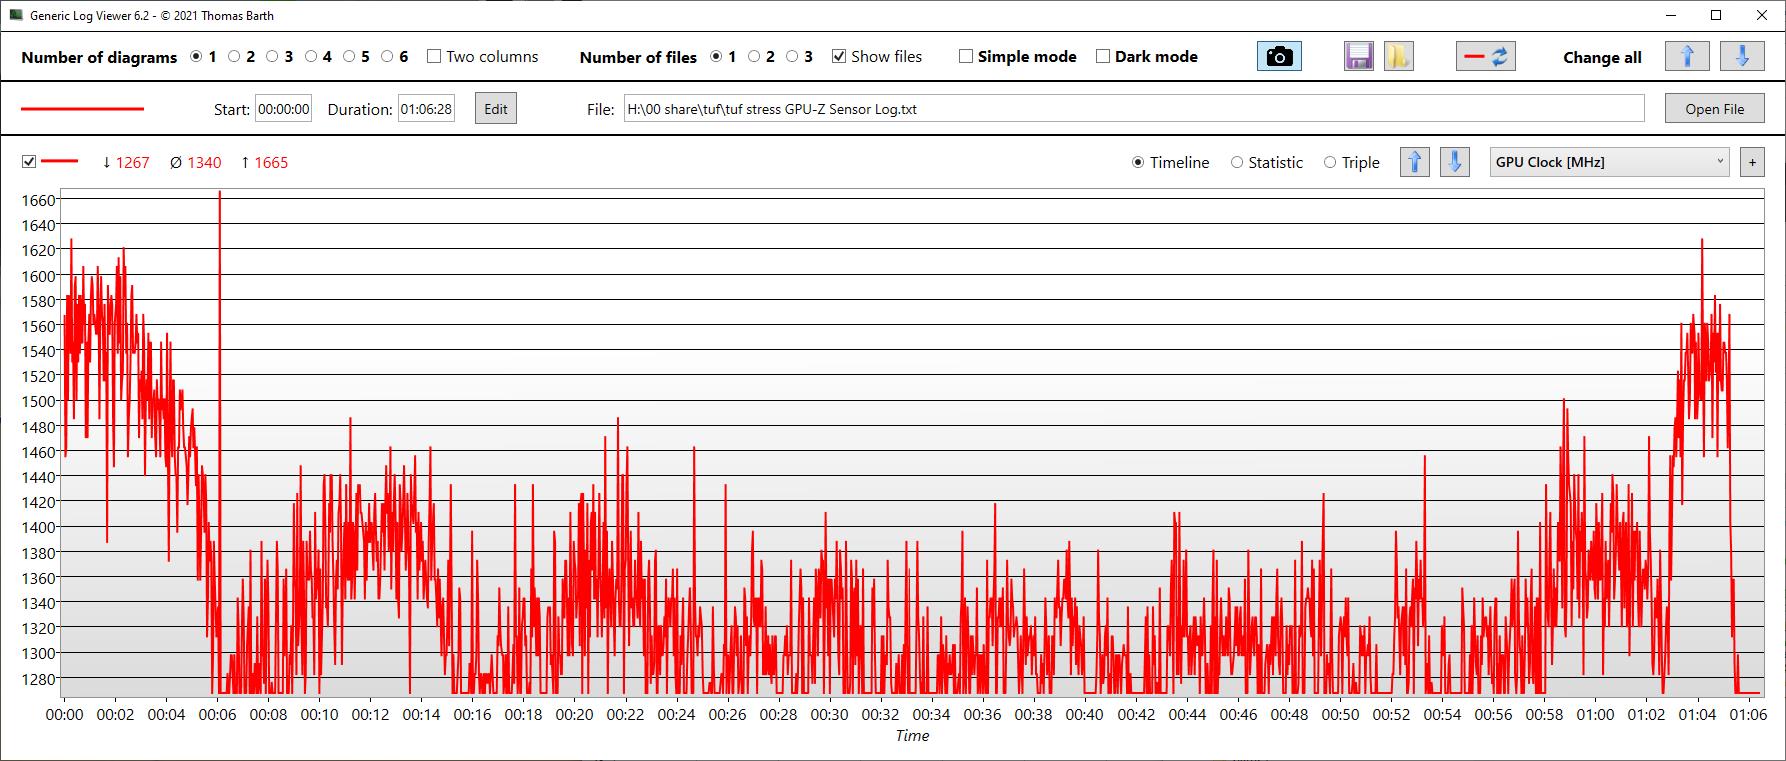
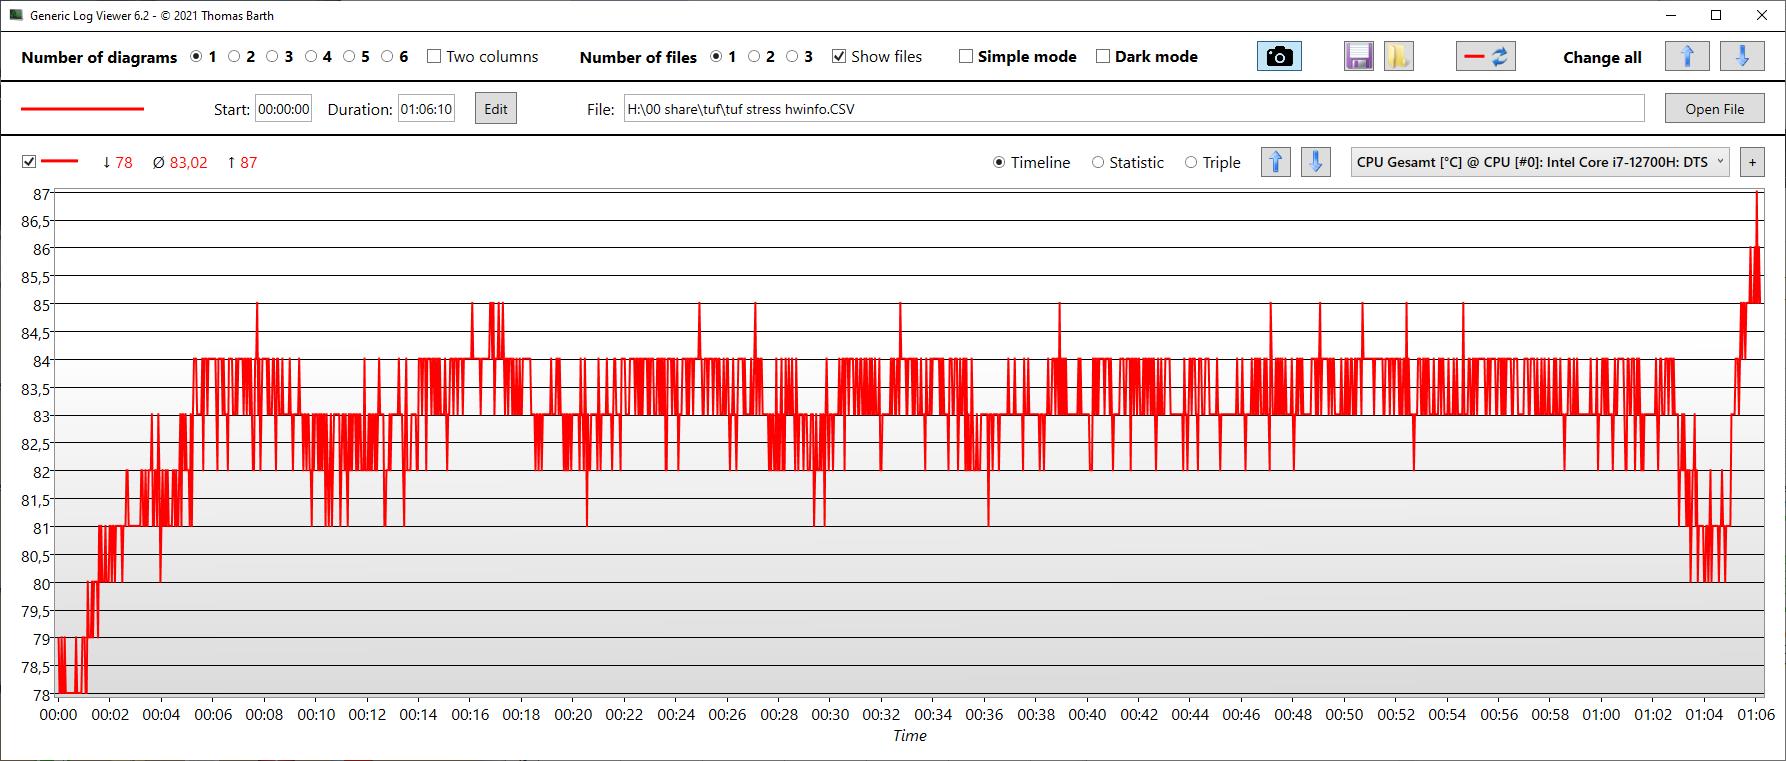
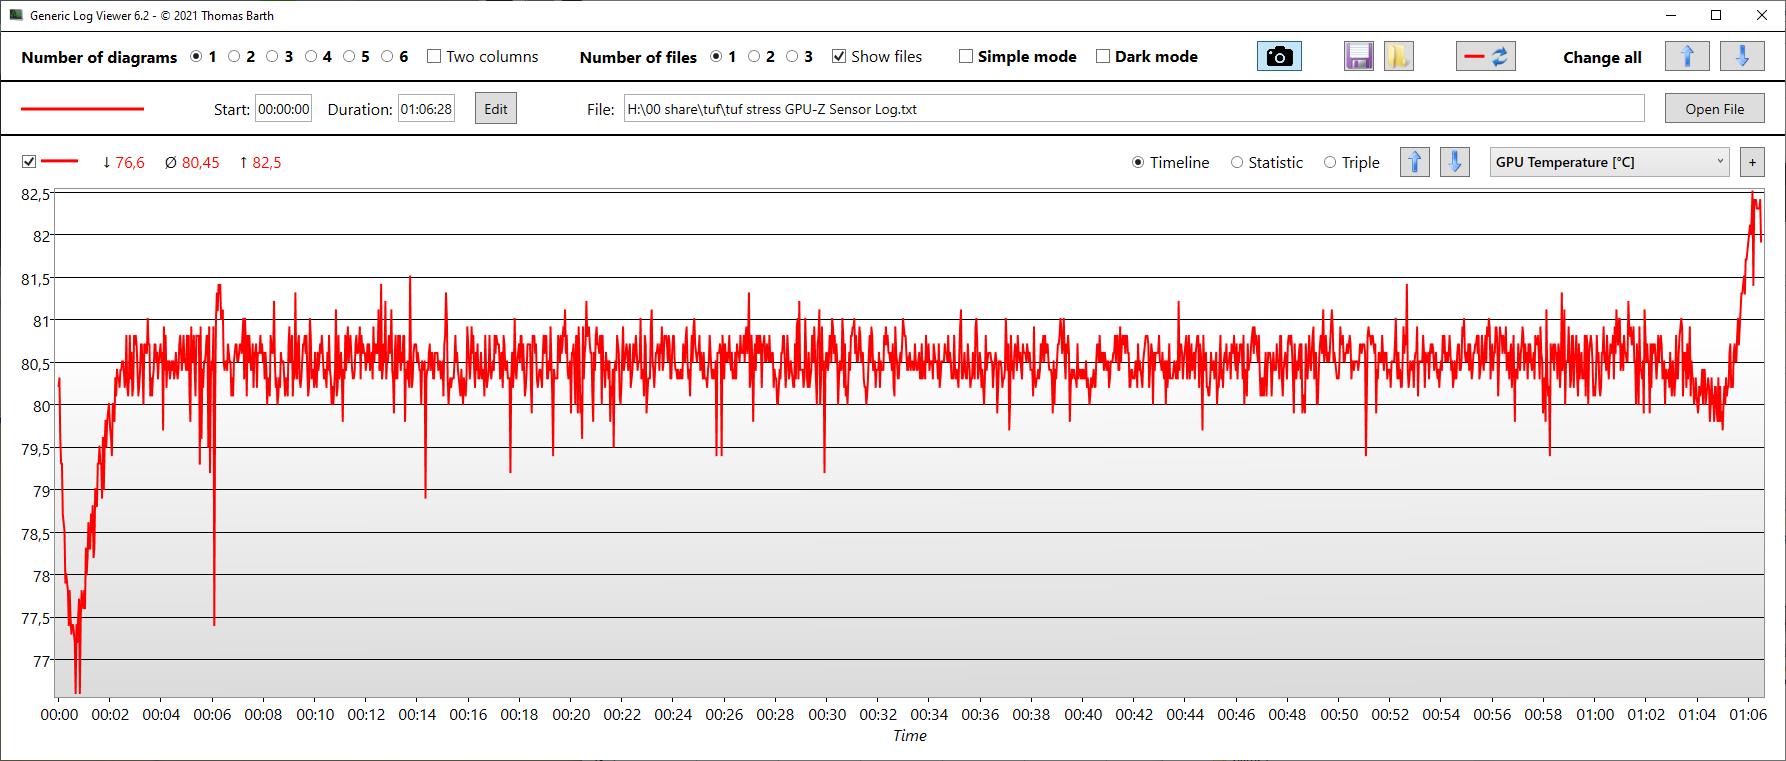
| Reloj dela CPU (GHz) | Reloj de la GPU (MHz) | Temperatura media dela CPU (°C) | Temperatura media de la GPU (°C) | |
| Prime95 + FurMark Stress | 2,4 | 1.340 | 83 | 81 |
Altavoces
Los altavoces han aumentado de tamaño en comparación con su predecesor. A pesar de ello, su rendimiento es mediocre en el mejor de los casos, con mínimas mejoras en términos de graves. Se pueden conectar altavoces analógicos y auriculares a la toma de audio de 3,5 mm del F17.
Asus TUF Gaming F17 FX707Z-HX011W análisis de audio
(±) | la sonoridad del altavoz es media pero buena (79.5 dB)
Graves 100 - 315 Hz
(±) | lubina reducida - en promedio 13.1% inferior a la mediana
(±) | la linealidad de los graves es media (9% delta a frecuencia anterior)
Medios 400 - 2000 Hz
(±) | medias más altas - de media 9.1% más altas que la mediana
(±) | la linealidad de los medios es media (7.8% delta respecto a la frecuencia anterior)
Altos 2 - 16 kHz
(+) | máximos equilibrados - a sólo 3.9% de la mediana
(±) | la linealidad de los máximos es media (9.1% delta a frecuencia anterior)
Total 100 - 16.000 Hz
(±) | la linealidad del sonido global es media (20.4% de diferencia con la mediana)
En comparación con la misma clase
» 72% de todos los dispositivos probados de esta clase eran mejores, 6% similares, 22% peores
» El mejor tuvo un delta de 6%, la media fue 18%, el peor fue ###max##%
En comparación con todos los dispositivos probados
» 54% de todos los dispositivos probados eran mejores, 8% similares, 38% peores
» El mejor tuvo un delta de 4%, la media fue 23%, el peor fue ###max##%
Lenovo Legion 5 17ACH6H-82JY0003GE análisis de audio
(±) | la sonoridad del altavoz es media pero buena (78.3 dB)
Graves 100 - 315 Hz
(-) | casi sin bajos - de media 19.1% inferior a la mediana
(±) | la linealidad de los graves es media (13.8% delta a frecuencia anterior)
Medios 400 - 2000 Hz
(+) | medios equilibrados - a sólo 3% de la mediana
(+) | los medios son lineales (5% delta a la frecuencia anterior)
Altos 2 - 16 kHz
(+) | máximos equilibrados - a sólo 4.8% de la mediana
(+) | los máximos son lineales (6.7% delta a la frecuencia anterior)
Total 100 - 16.000 Hz
(±) | la linealidad del sonido global es media (15.8% de diferencia con la mediana)
En comparación con la misma clase
» 37% de todos los dispositivos probados de esta clase eran mejores, 7% similares, 56% peores
» El mejor tuvo un delta de 6%, la media fue 18%, el peor fue ###max##%
En comparación con todos los dispositivos probados
» 24% de todos los dispositivos probados eran mejores, 5% similares, 70% peores
» El mejor tuvo un delta de 4%, la media fue 23%, el peor fue ###max##%
Gestión de la energía - Larga duración de la batería
Consumo de energía
El consumo de energía en reposo fue extraordinariamente bajo, por cortesía de la tenue pantalla del F17.
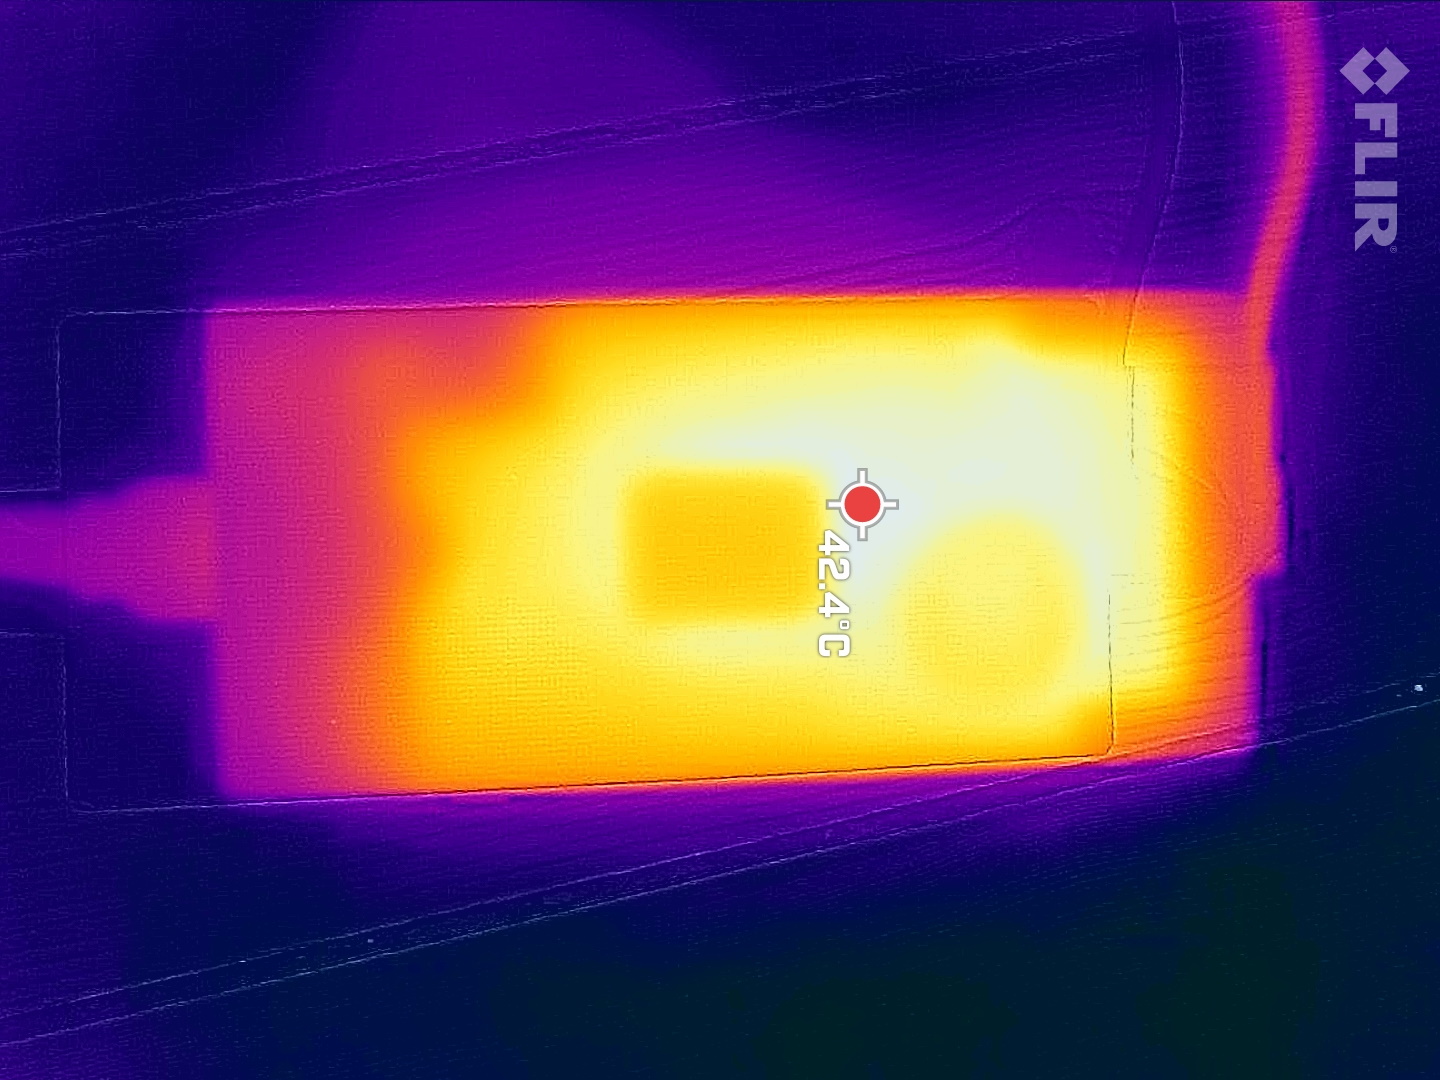
Debido al elevado TGP de la GPU, el consumo de energía bajo carga fue bastante elevado. Mientras jugaba, el F17 puede haber superado a sus competidores, pero también mostró un consumo de energía más alto que todos ellos, excepto el Schenker Core, que consumió más energía pero tuvo un peor rendimiento que el F17.
| Ocioso | |
| Carga |
|
Clave:
min: | |
| Asus TUF Gaming F17 FX707Z-HX011W i7-12700H, GeForce RTX 3060 Laptop GPU, SK Hynix HFM001TD3JX013N, IPS, 1920x1080, 17.3" | Asus TUF Gaming F17 FX706HM i9-11900H, GeForce RTX 3060 Laptop GPU, SK Hynix HFM001TD3JX013N, IPS, 1920x1080, 17.3" | Lenovo Legion 5 17ACH6H-82JY0003GE R5 5600H, GeForce RTX 3060 Laptop GPU, Samsung PM991a MZALQ512HBLU, IPS, 1920x1080, 17.3" | MSI GE76 Raider i9-12900HK, GeForce RTX 3080 Ti Laptop GPU, Samsung PM9A1 MZVL22T0HBLB, IPS-Level, 1920x1080, 17.3" | MSI Katana GF76 11UE i7-11800H, GeForce RTX 3060 Laptop GPU, Kingston OM8PCP3512F-AB, IPS, 1920x1080, 17.3" | Schenker XMG Core 17 (Early 2021) i7-10870H, GeForce RTX 3060 Laptop GPU, Samsung SSD 970 EVO Plus 1TB, IPS, 2560x1440, 17.3" | Medio NVIDIA GeForce RTX 3060 Laptop GPU | Media de la clase Gaming | |
|---|---|---|---|---|---|---|---|---|
| Power Consumption | -16% | -58% | -66% | -20% | -53% | -40% | -69% | |
| Idle Minimum * (Watt) | 6.6 | 10.3 -56% | 15.6 -136% | 12 -82% | 9 -36% | 13 -97% | 10.4 ? -58% | 13.1 ? -98% |
| Idle Average * (Watt) | 8.3 | 13.1 -58% | 20.7 -149% | 17 -105% | 13 -57% | 16 -93% | 14.5 ? -75% | 19 ? -129% |
| Idle Maximum * (Watt) | 11.8 | 14.1 -19% | 22.9 -94% | 28 -137% | 20 -69% | 29 -146% | 21.4 ? -81% | 24.6 ? -108% |
| Load Average * (Watt) | 119 | 110 8% | 134 -13% | 118 1% | 102 14% | 100 16% | 109.3 ? 8% | 111.3 ? 6% |
| Witcher 3 ultra * (Watt) | 169 | 138 18% | 135 20% | 252 -49% | 149 12% | 173 -2% | ||
| Load Maximum * (Watt) | 222 | 190 14% | 170 23% | 272 -23% | 187 16% | 213 4% | 206 ? 7% | 260 ? -17% |
* ... más pequeño es mejor
Power Consumption Witcher 3 / Stresstest
Power Consumption with External Display
Duración de la batería
El TUF Gaming F17 viene con una batería relativamente grande de 90 Wh, y el modelo actual ofrece una impresionante duración de batería en general como lo hizo el predecesor.
El dispositivo duró más de 7.5 horas en nuestro test de reproducción de vídeo a brillo reducido, y entre 7 y 8.5 horas en nuestro test Wi-Fi dependiendo del brillo del display.
| Asus TUF Gaming F17 FX707Z-HX011W i7-12700H, GeForce RTX 3060 Laptop GPU, 90 Wh | Asus TUF Gaming F17 FX706HM i9-11900H, GeForce RTX 3060 Laptop GPU, 90 Wh | Lenovo Legion 5 17ACH6H-82JY0003GE R5 5600H, GeForce RTX 3060 Laptop GPU, 80 Wh | MSI GE76 Raider i9-12900HK, GeForce RTX 3080 Ti Laptop GPU, 99.99 Wh | MSI Katana GF76 11UE i7-11800H, GeForce RTX 3060 Laptop GPU, 53 Wh | Schenker XMG Core 17 (Early 2021) i7-10870H, GeForce RTX 3060 Laptop GPU, 62 Wh | Media de la clase Gaming | |
|---|---|---|---|---|---|---|---|
| Duración de Batería | 2% | -40% | -41% | -50% | -42% | -16% | |
| H.264 (h) | 7.7 | 8.5 10% | 3.5 -55% | 3.9 -49% | 4.7 -39% | 8.27 ? 7% | |
| WiFi v1.3 (h) | 8.7 | 7.6 -13% | 4.4 -49% | 5.1 -41% | 3.7 -57% | 4.9 -44% | 7.08 ? -19% |
| Load (h) | 2.3 | 2.5 9% | 1.9 -17% | 1.3 -43% | 1.3 -43% | 1.496 ? -35% | |
| Reader / Idle (h) | 5.5 | 4.8 | 7.7 | 7.84 ? | |||
| Witcher 3 ultra (h) | 0.8 |
Pro
Contra
Veredicto - Excelente rendimiento 3D pero no es una pantalla para juegos
Uno de los puntos fuertes del Asus TUF Gaming F17 es sin duda su excelente rendimiento en juegos. El hecho de que Asus haya configurado la GPU RTX 3060 para su máximo especificado de 140 W se hace notar inmediatamente en nuestras pruebas. Para un portátil de 17 pulgadas el F17 también ofrece una duración de batería muy larga, lo que lo hace algo portátil.
En el lado opuesto está la pantalla. Puede salvarse por su buena relación de contraste general, pero su brillo general es simplemente demasiado bajo, y sus tiempos de respuesta son demasiado lentos para un dispositivo de juegos. El sucesor del F17 tiene que mejorar esto.
El Asus TUF (Gaming F)17 ofrece un rendimiento de juego comparativamente alto, pero a cambio sufre de una mala pantalla y un pobre rendimiento Wi-Fi.
Precio y disponibilidad
En el momento de escribir este artículo, el Asus TUF Gaming F17 actualizado a 2022 aún no estaba disponible en Norteamérica. Con la actual escasez de la cadena de suministro, tampoco está claro cuándo cambiará eso.
Asus TUF Gaming F17 FX707Z-HX011W
- 04/14/2022 v7 (old)
Christian Hintze
Price comparison

