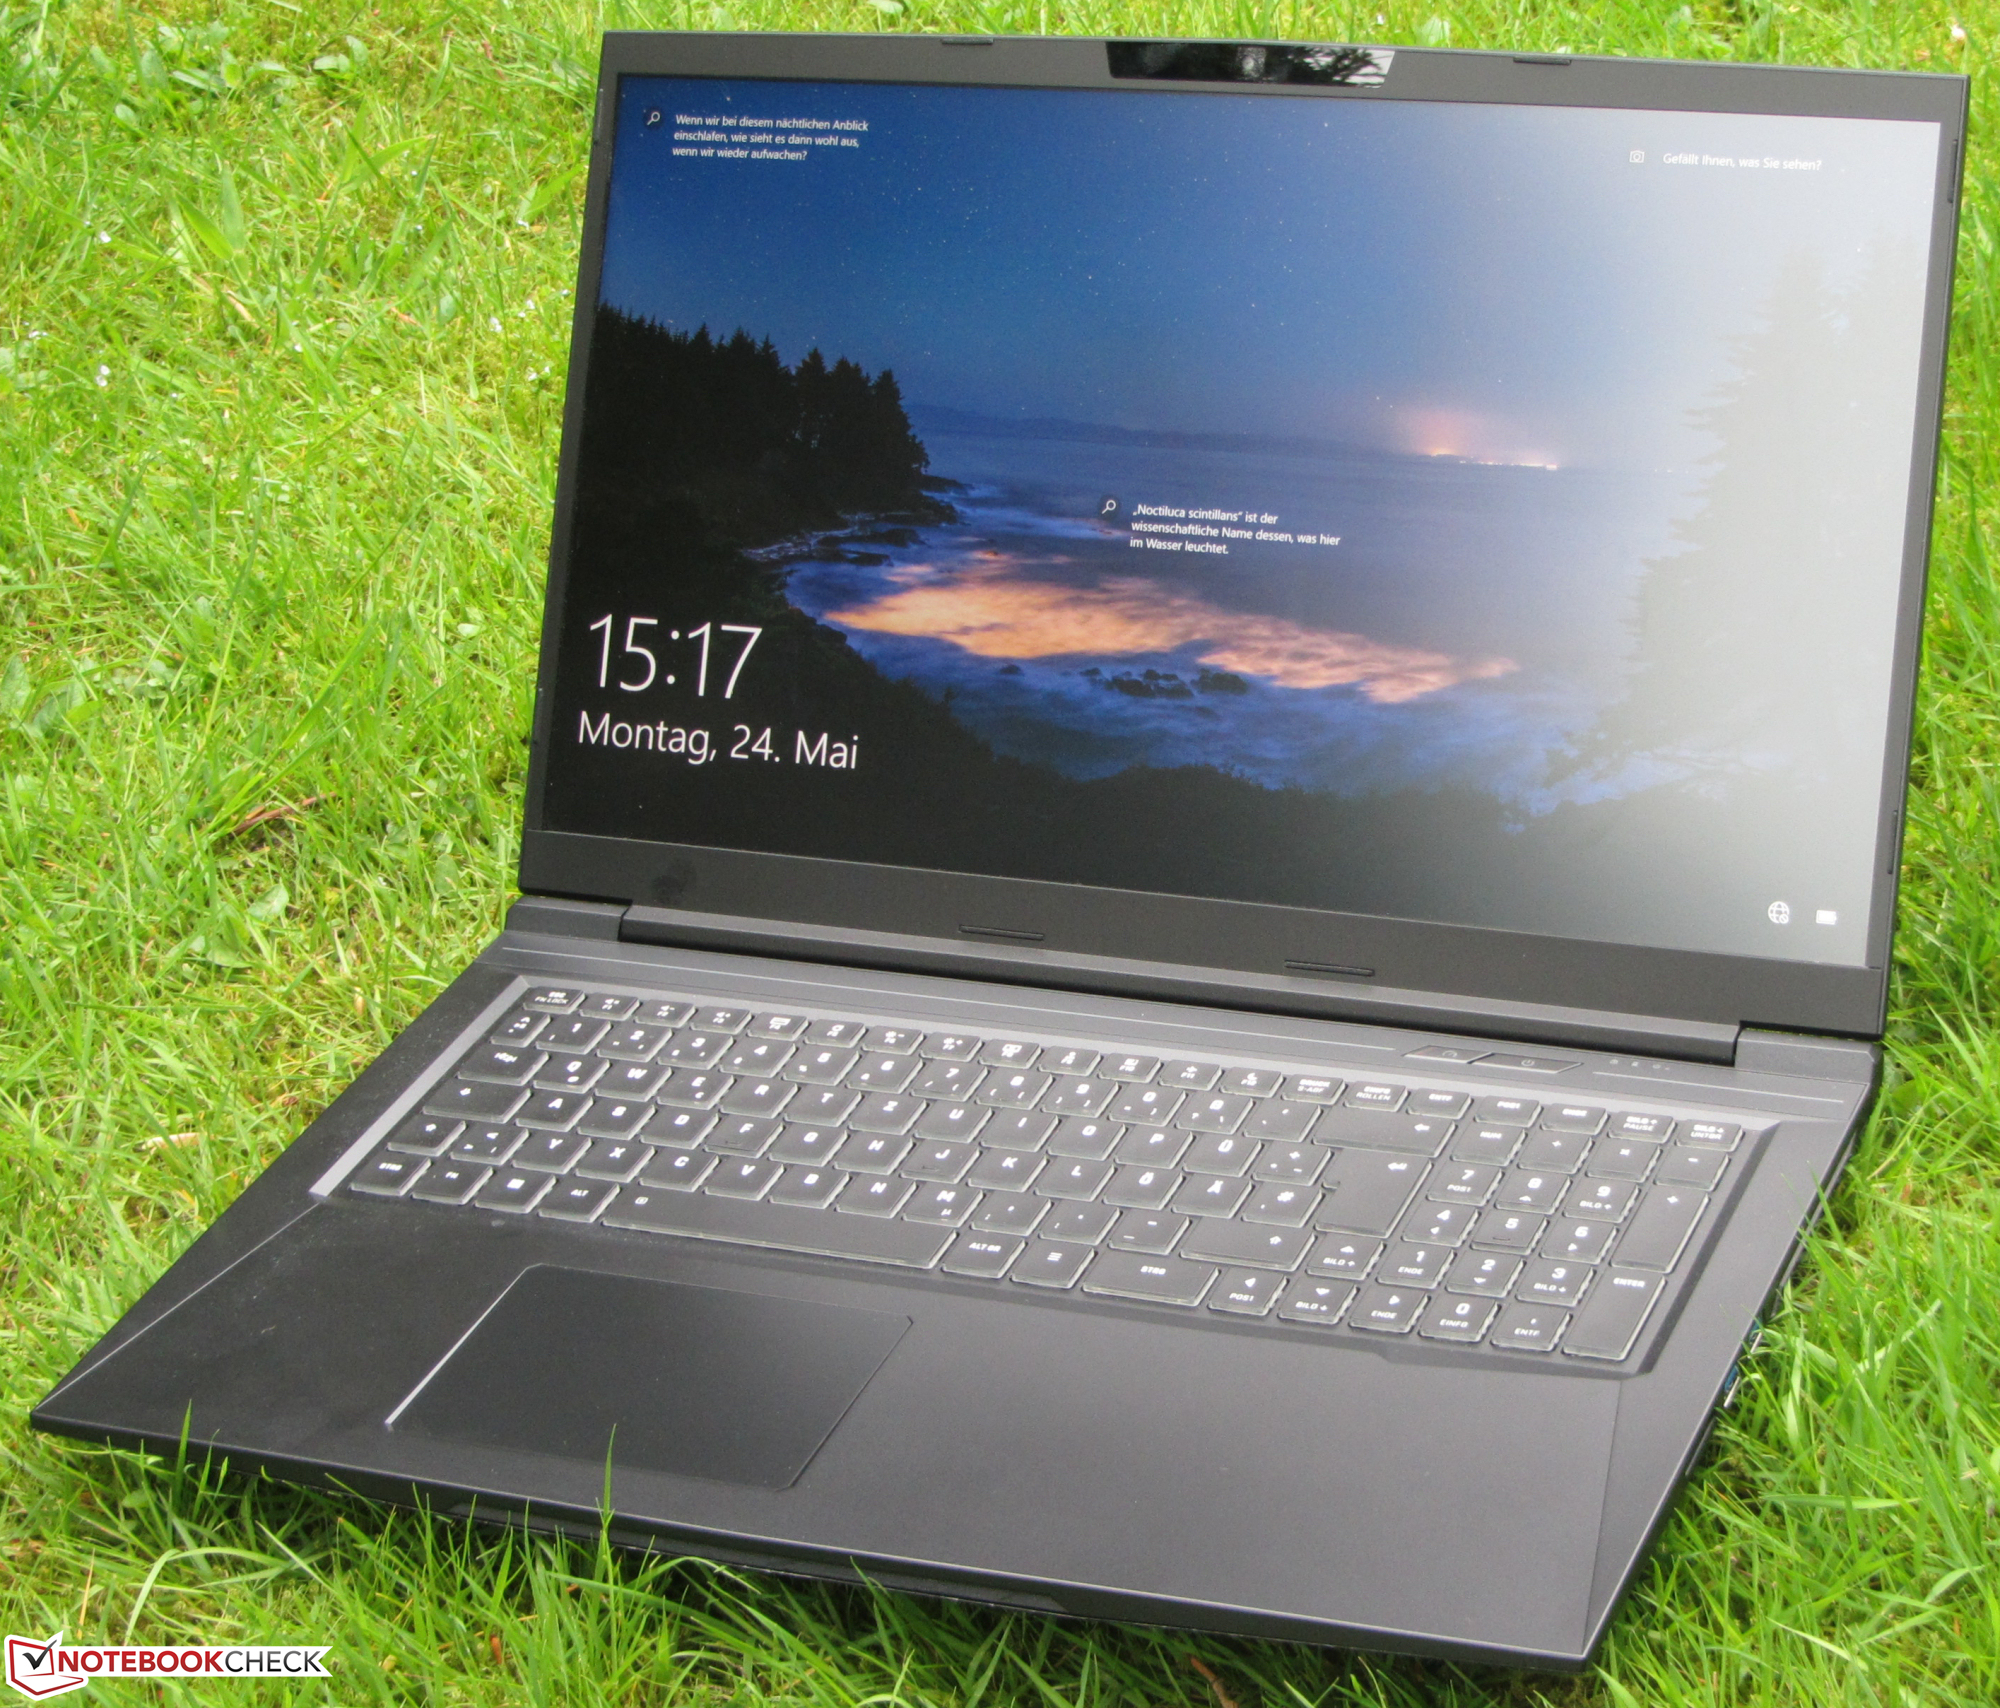
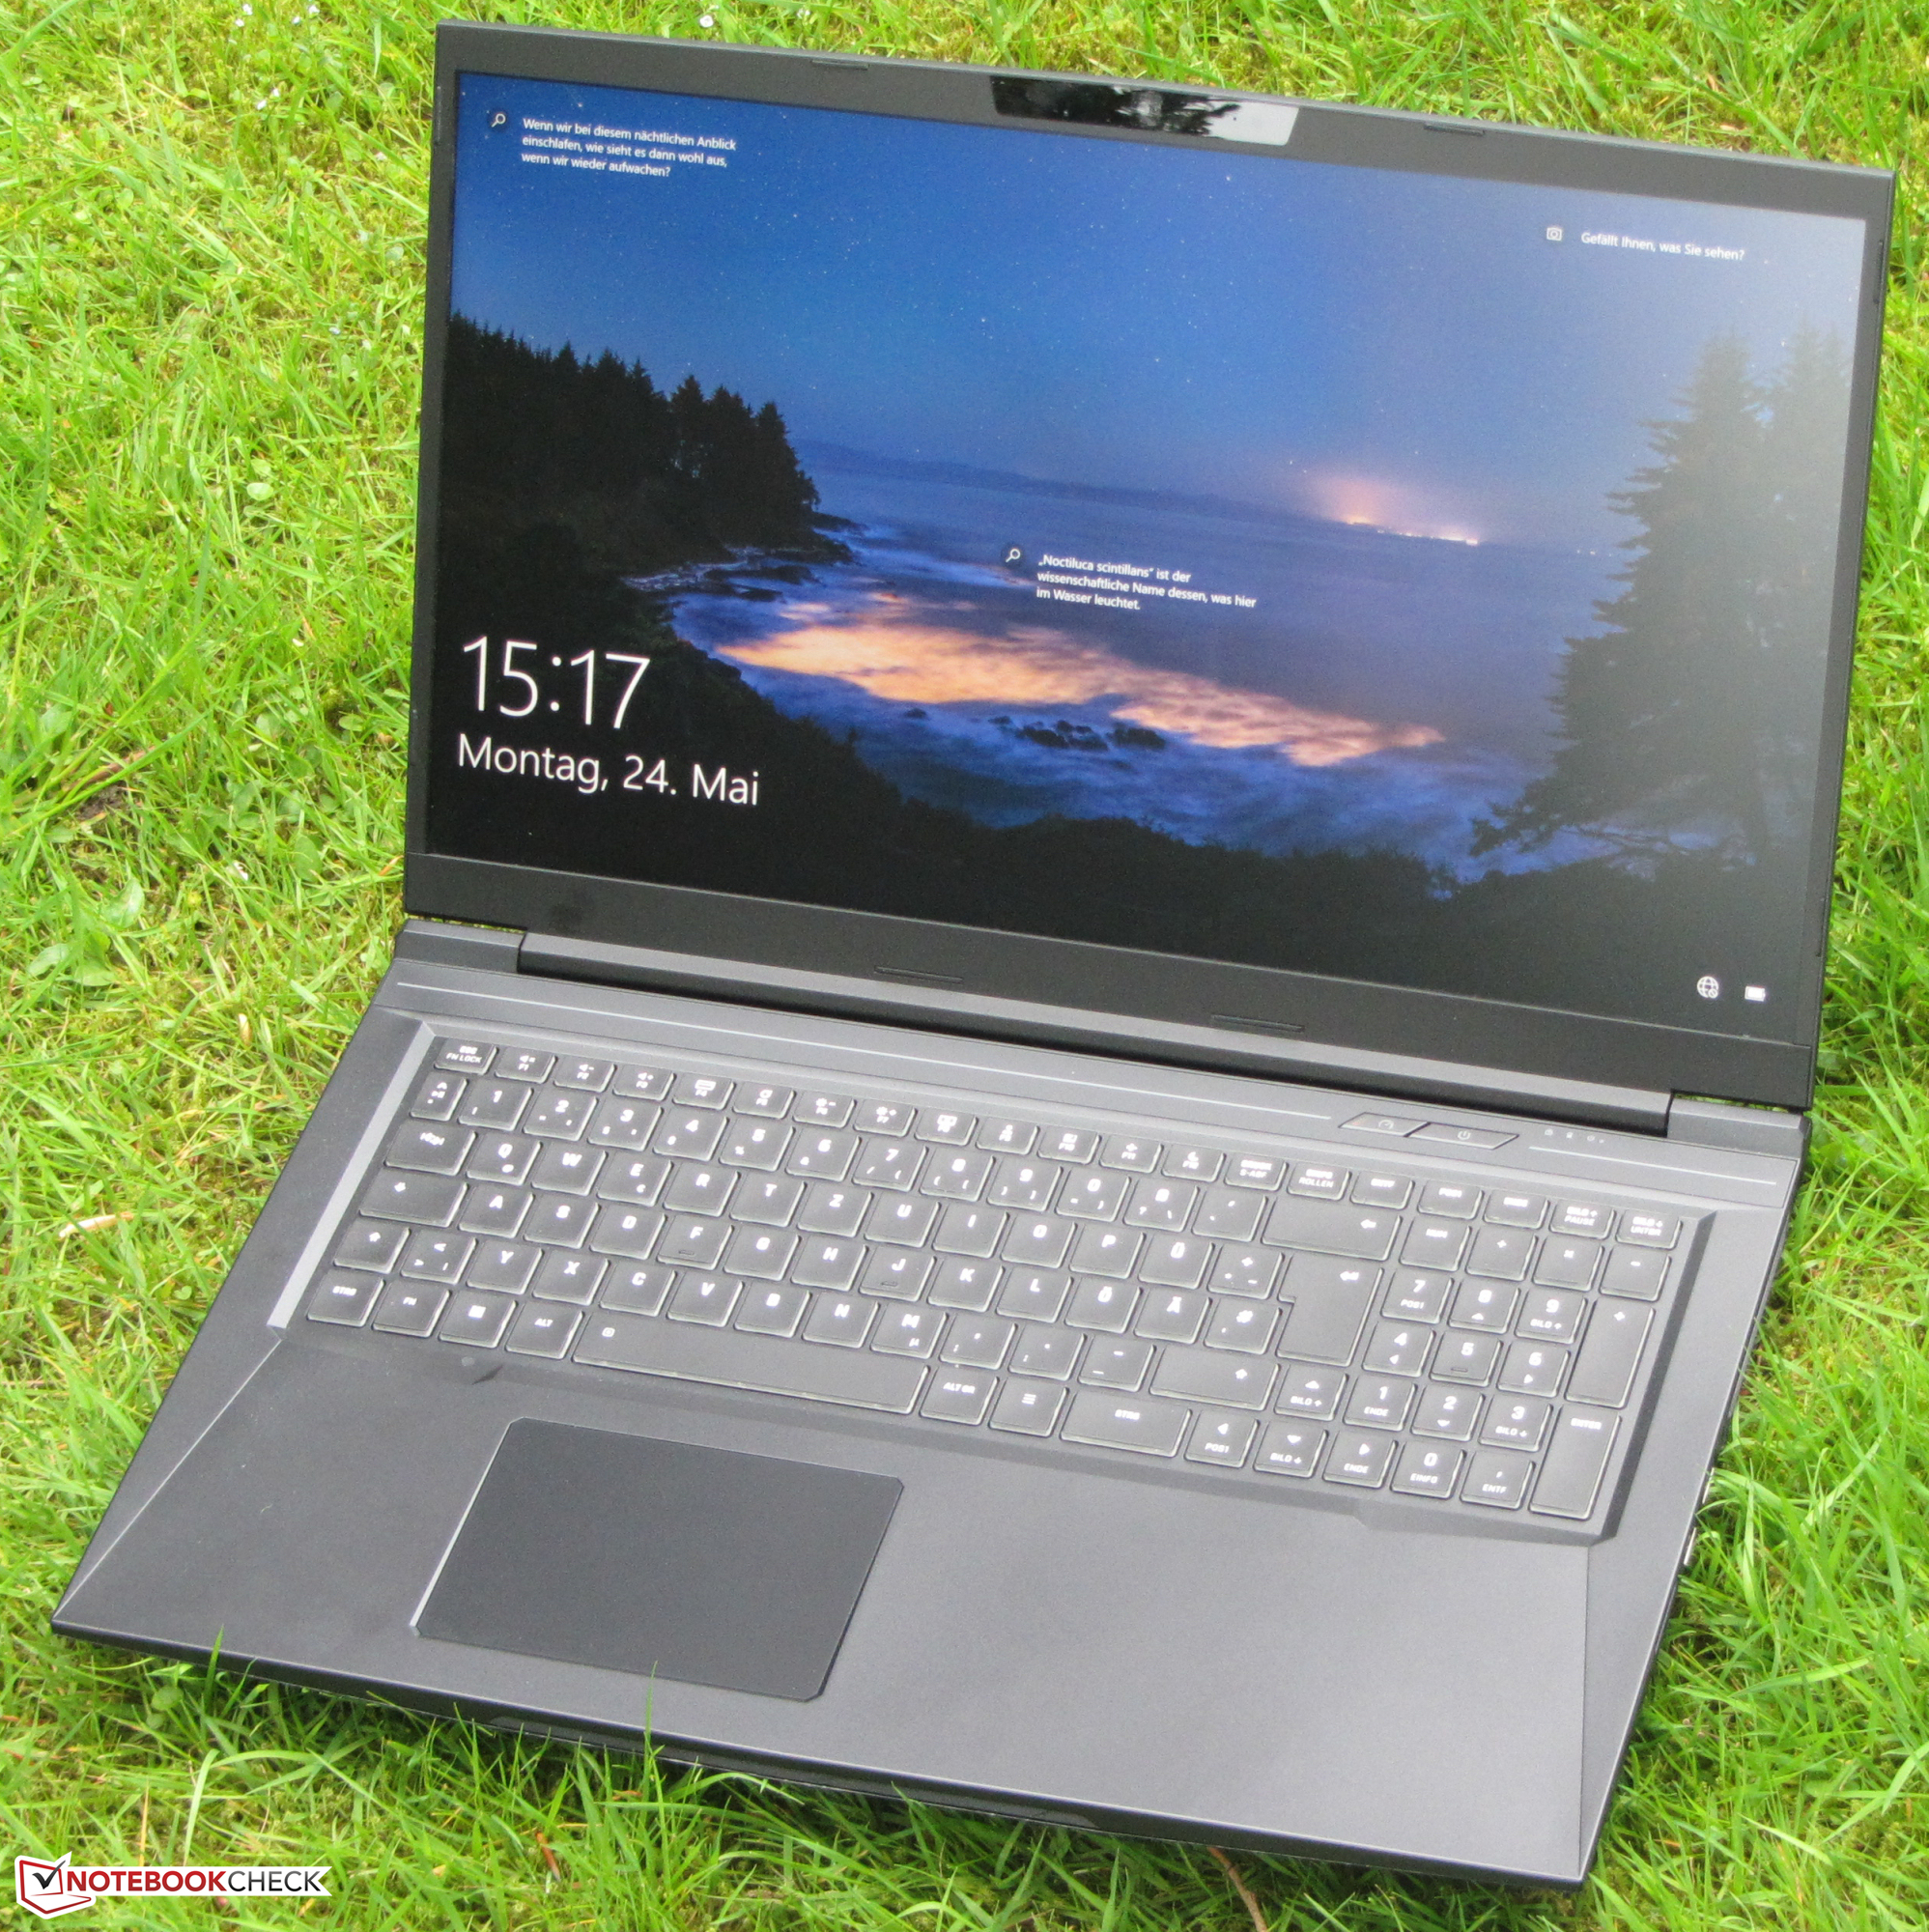
Análisis del Schenker XMG Core 17 (Tongfang GM7MG0R): Portátil de juegos configurable con pantalla WQHD

Con el XMG Core 17 (principios de 2021), Schenker añade a su oferta un portátil para juegos de la gama media alta. La unidad de prueba que nos han proporcionado funciona con un Core i7-10870Hy un procesadorGeForce RTX-3060 portátilGPU. Entre los competidores se encuentran dispositivos como el MSI Alpha 17 A4DEKy elAcer Predator Helios 300 PH317-54y el Medion Erazer Beast X10.
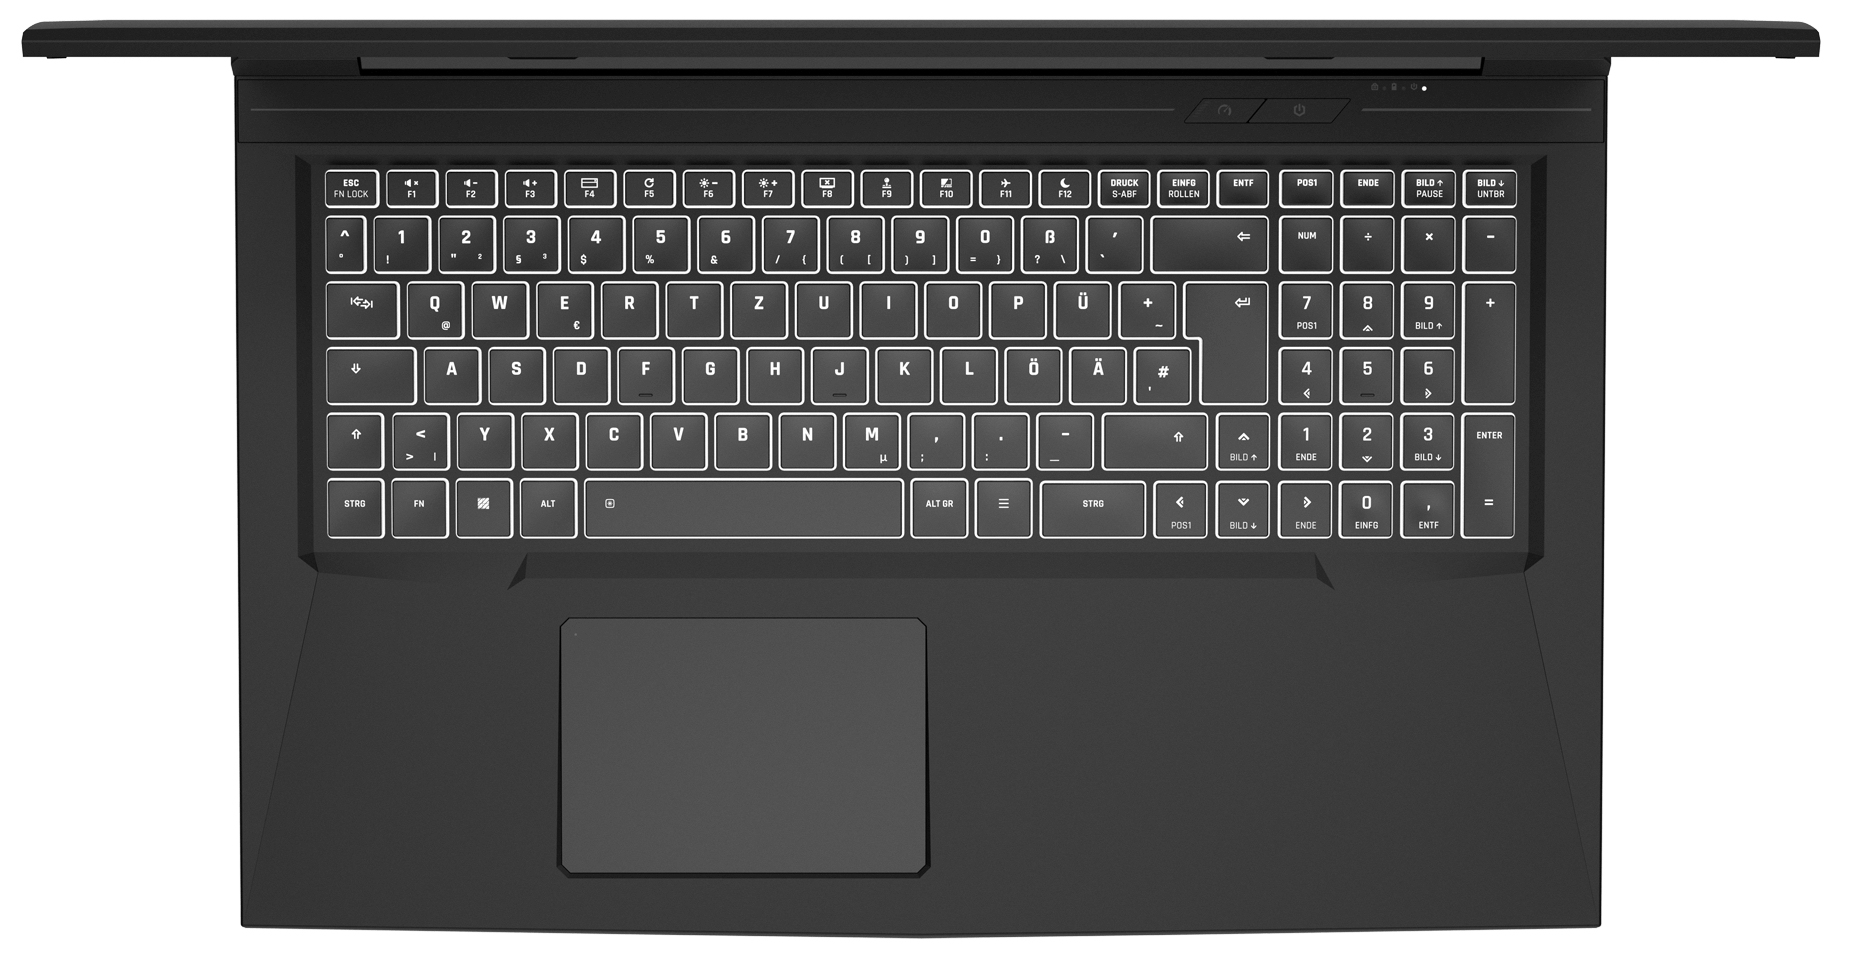
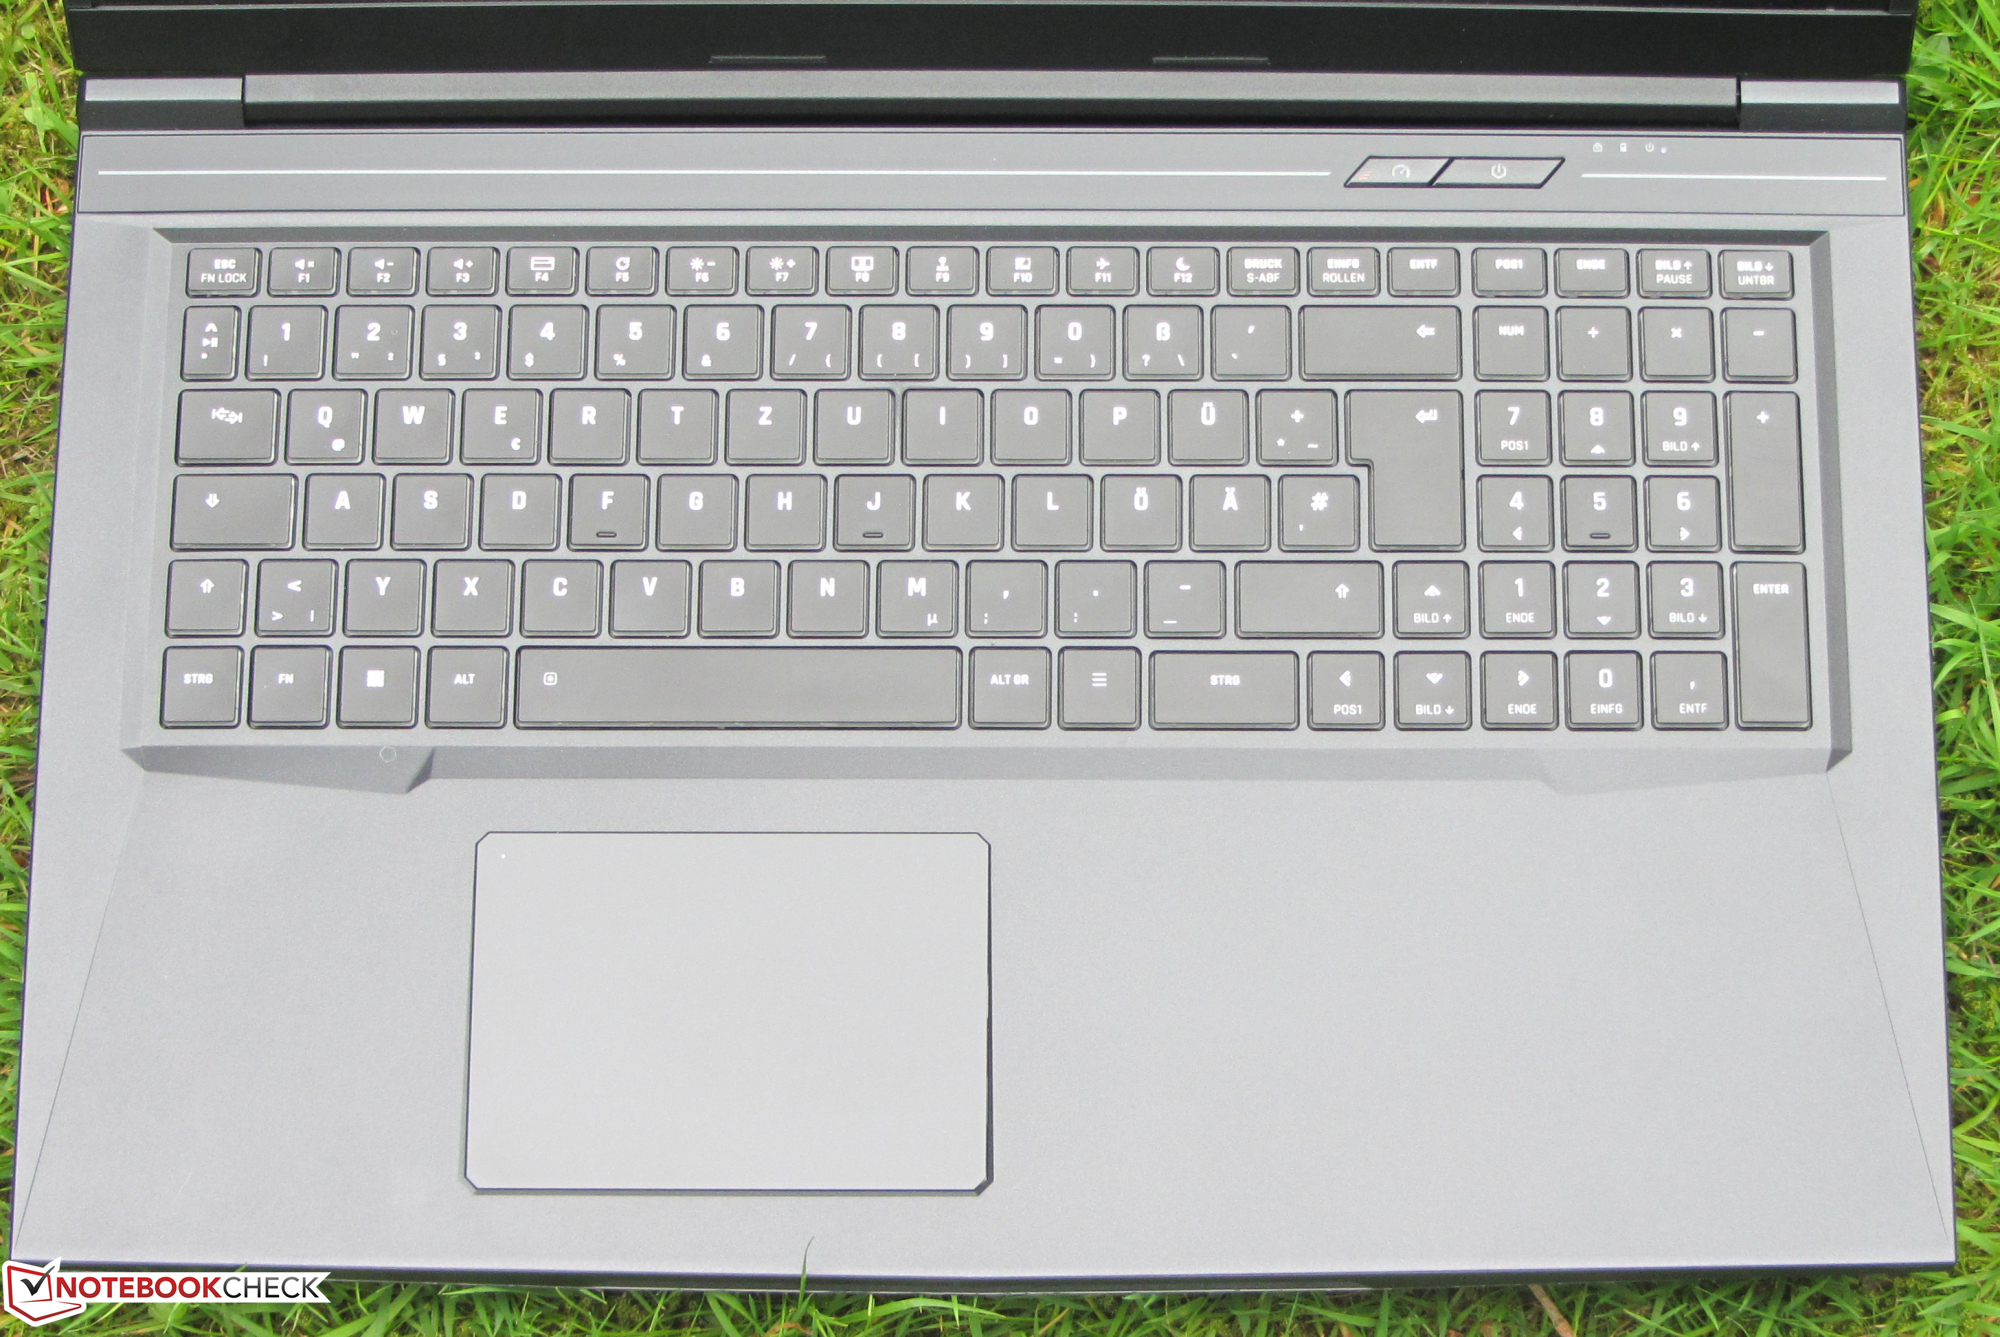
Dado que la construcción del portátil es en gran medida idéntica a la de sus dos predecesores, no hablaremos de la carcasa, el equipo de conexión, los dispositivos de entrada y los altavoces, excepto cuando haya diferencias. Puedes encontrar la información correspondiente a estas características en nuestro análisis delXMG Core 17 (2019).
Possible Competitors in the Comparison
Valoración | Fecha | Modelo | Peso | Altura | Tamaño | Resolución | Precio |
|---|---|---|---|---|---|---|---|
| 83.9 % v7 (old) | 06/2021 | Schenker XMG Core 17 (Early 2021) i7-10870H, GeForce RTX 3060 Laptop GPU | 2.5 kg | 30.05 mm | 17.30" | 2560x1440 | |
| 83.3 % v7 (old) | 02/2021 | MSI Alpha 17 A4DEK R7 4800H, Radeon RX 5600M | 2.6 kg | 28 mm | 17.30" | 1920x1080 | |
| 83.6 % v7 (old) | 10/2020 | Acer Predator Helios 300 PH317-54-75G8 i7-10750H, GeForce RTX 2060 Mobile | 2.8 kg | 25 mm | 17.30" | 1920x1080 | |
| 84.7 % v7 (old) | 11/2020 | Medion Erazer Beast X10 MD61804 i7-10750H, GeForce RTX 2070 Super Max-Q | 2.3 kg | 24.6 mm | 17.30" | 1920x1080 |
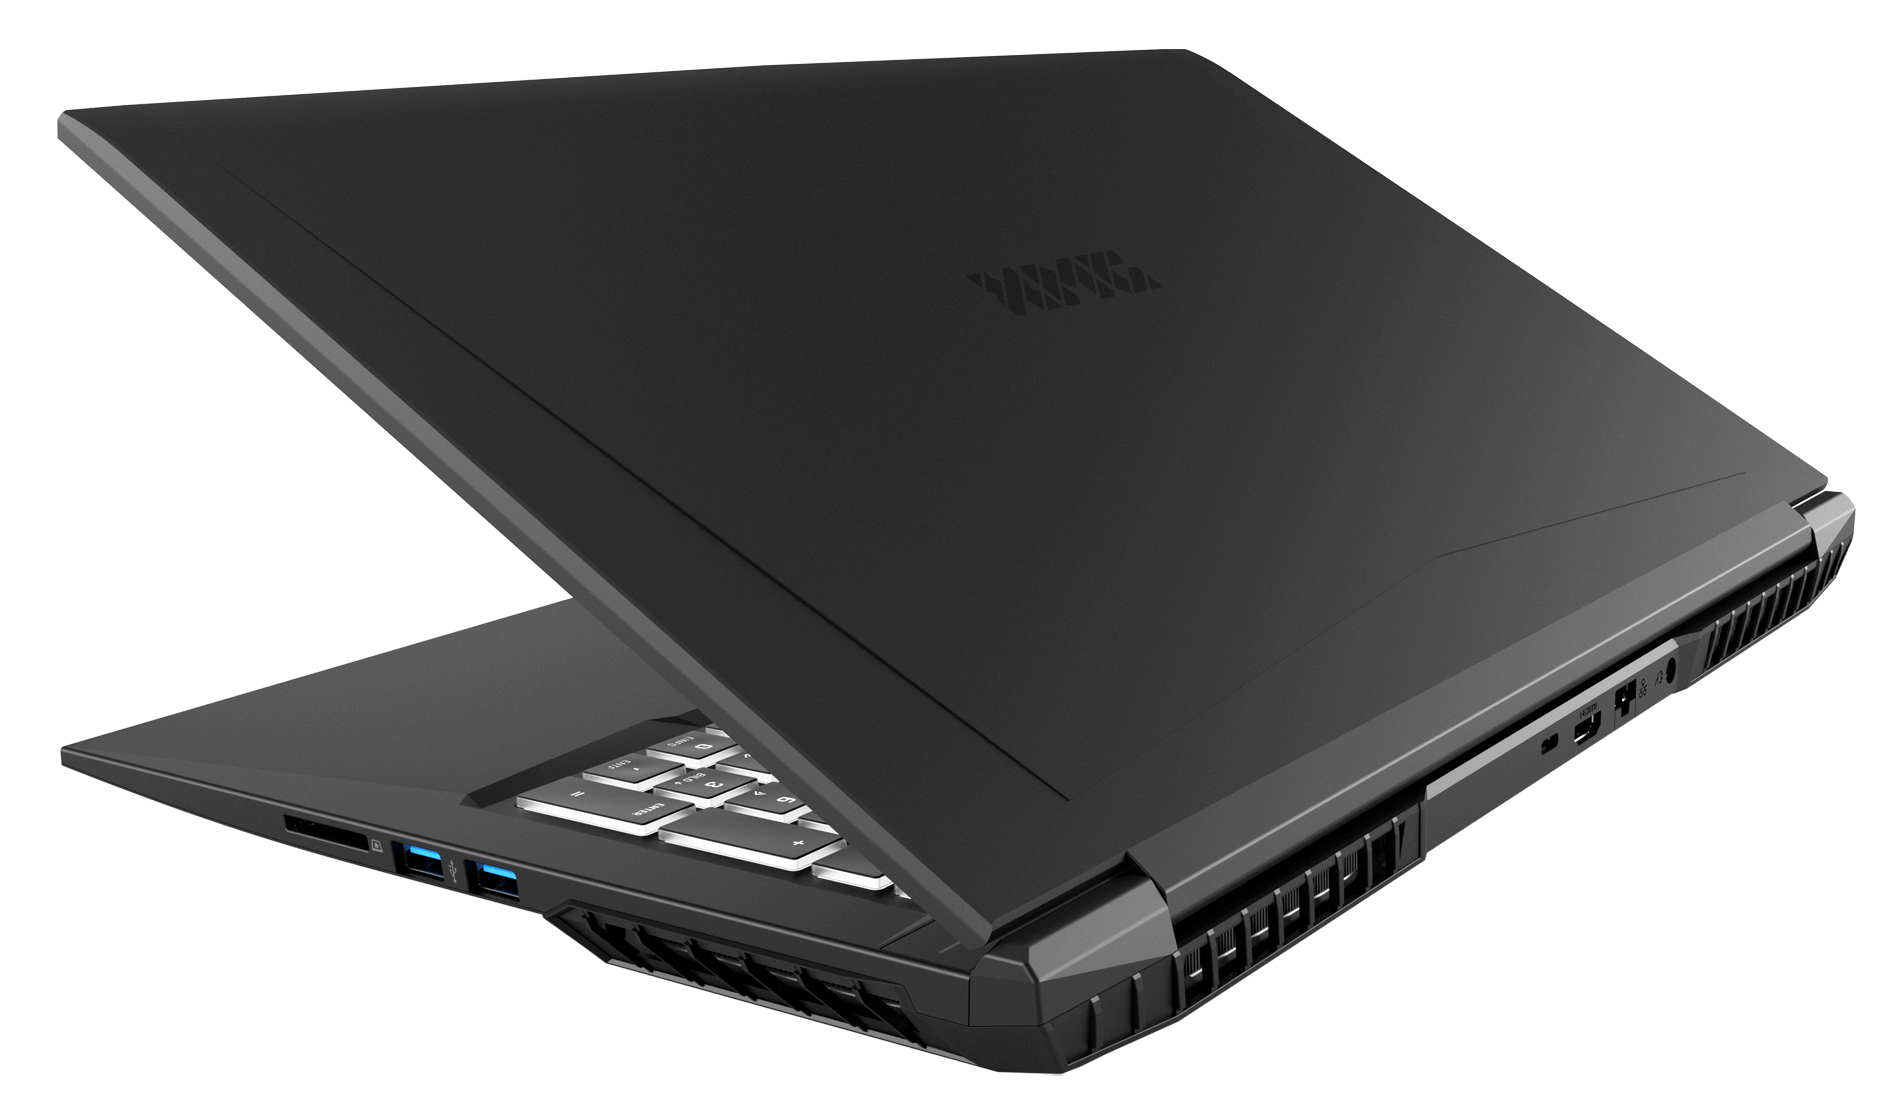
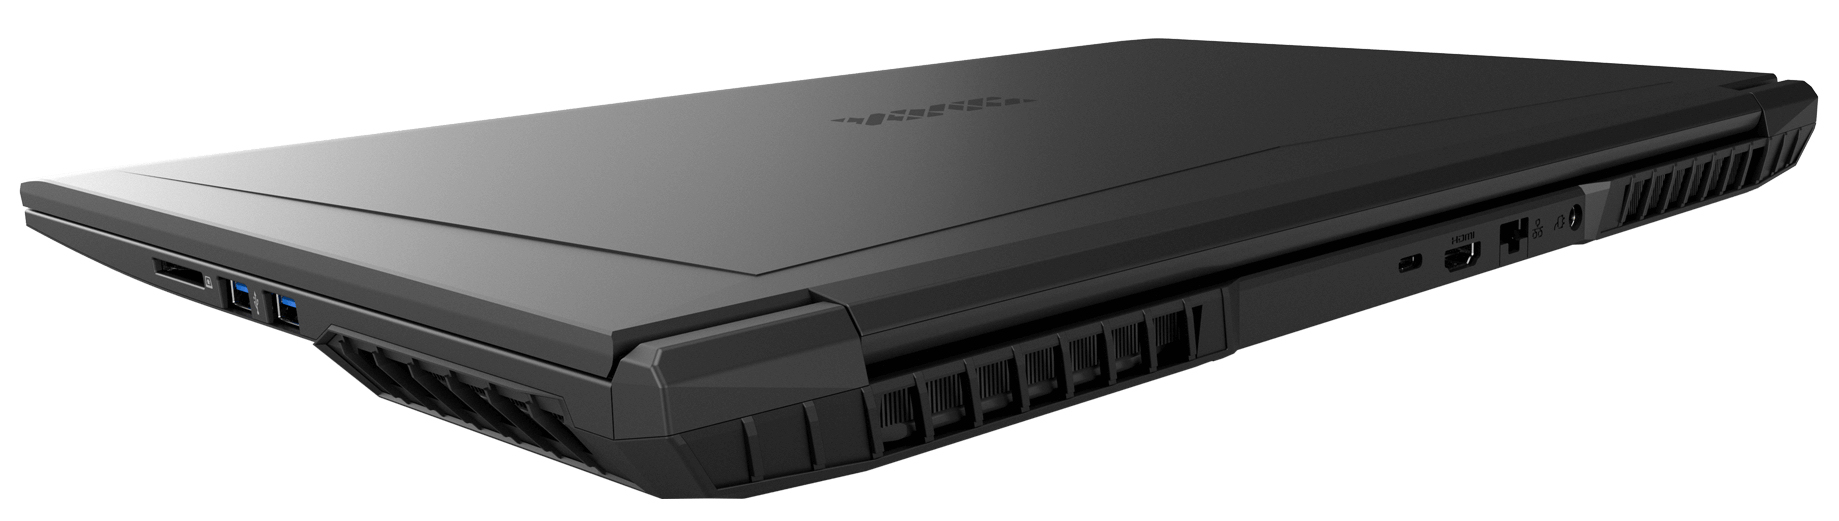
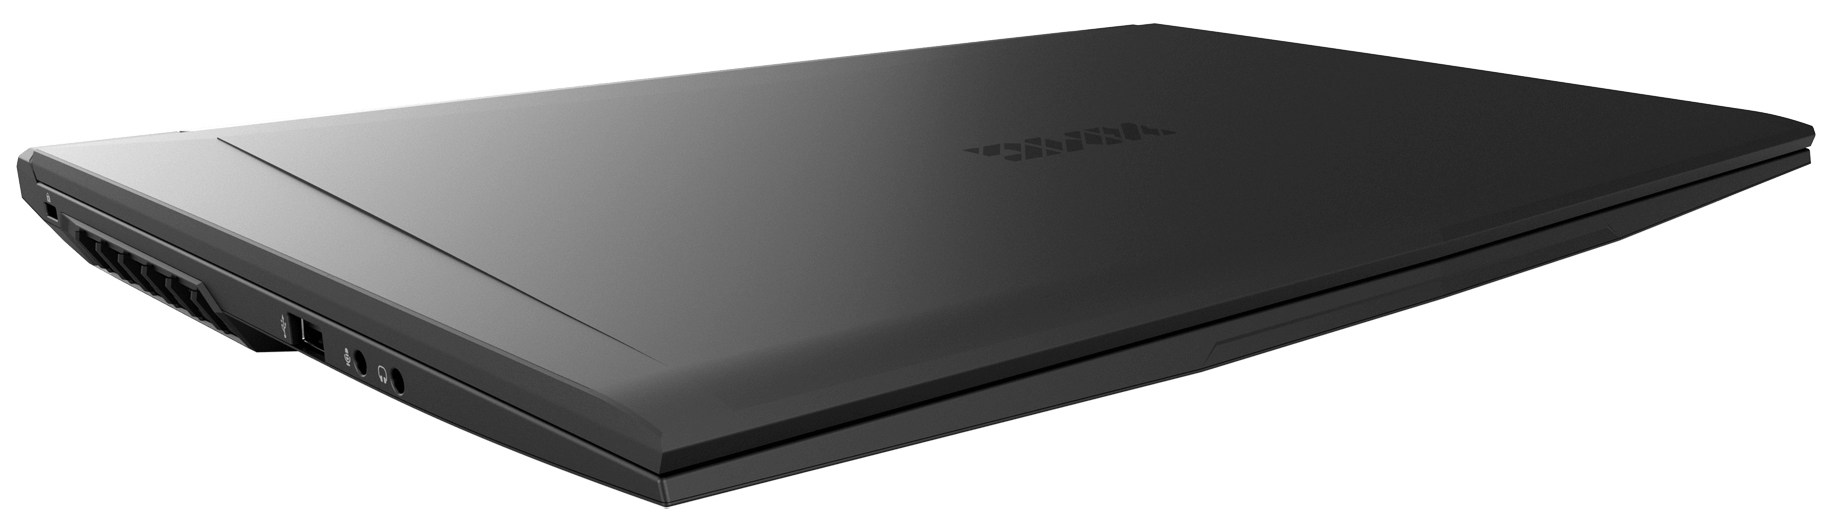
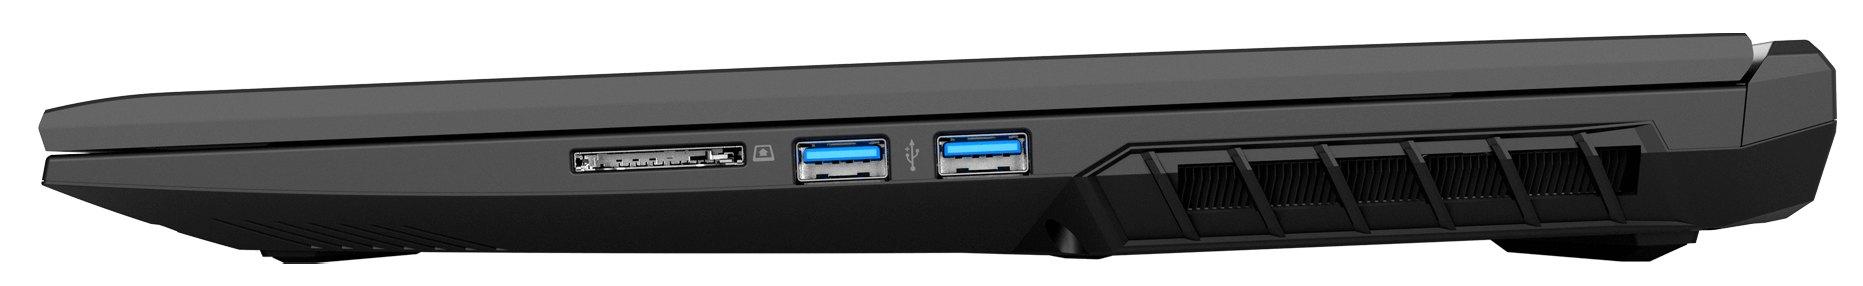
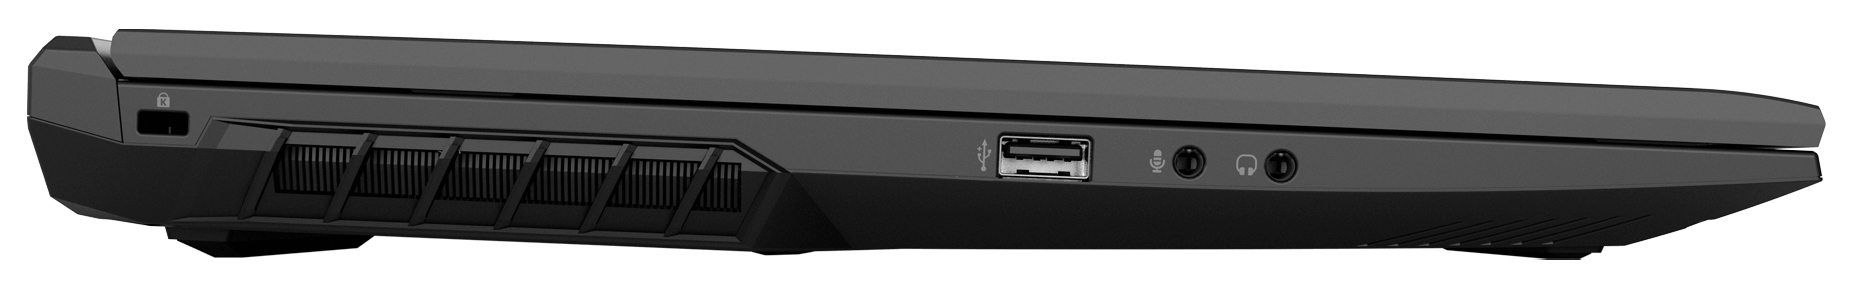
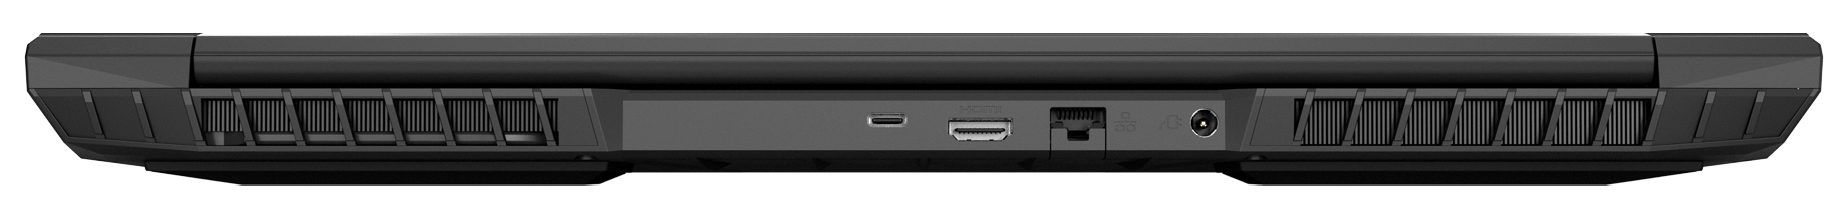
Conexiones - El portátil Schenker no ofrece Thunderbolt
En cuanto a las conexiones, algo ha cambiado respecto a los predecesores: Se han eliminadolas dos conexiones Mini-DisplayPort, y el puerto USB-C soporta ahora el estándar USB 3.2 Gen 2 (antes: USB 3.2 Gen 1) y también DisplayPort vía USB-C.
| SD Card Reader | |
| average JPG Copy Test (av. of 3 runs) | |
| Media de la clase Gaming (20.9 - 210, n=55, últimos 2 años) | |
| MSI Alpha 17 A4DEK (Toshiba Exceria Pro SDXC 64 GB UHS-II) | |
| Schenker XMG Core 17 (Toshiba Exceria Pro SDXC 64 GB UHS-II) | |
| Schenker XMG Core 17 Comet Lake (Toshiba Exceria Pro SDXC 64 GB UHS-II) | |
| Schenker XMG Core 17 (Early 2021) (AV PRO microSD 128 GB V60) | |
| maximum AS SSD Seq Read Test (1GB) | |
| Media de la clase Gaming (25.5 - 261, n=52, últimos 2 años) | |
| MSI Alpha 17 A4DEK (Toshiba Exceria Pro SDXC 64 GB UHS-II) | |
| Schenker XMG Core 17 (Toshiba Exceria Pro SDXC 64 GB UHS-II) | |
| Schenker XMG Core 17 Comet Lake (Toshiba Exceria Pro SDXC 64 GB UHS-II) | |
| Schenker XMG Core 17 (Early 2021) (AV PRO microSD 128 GB V60) | |
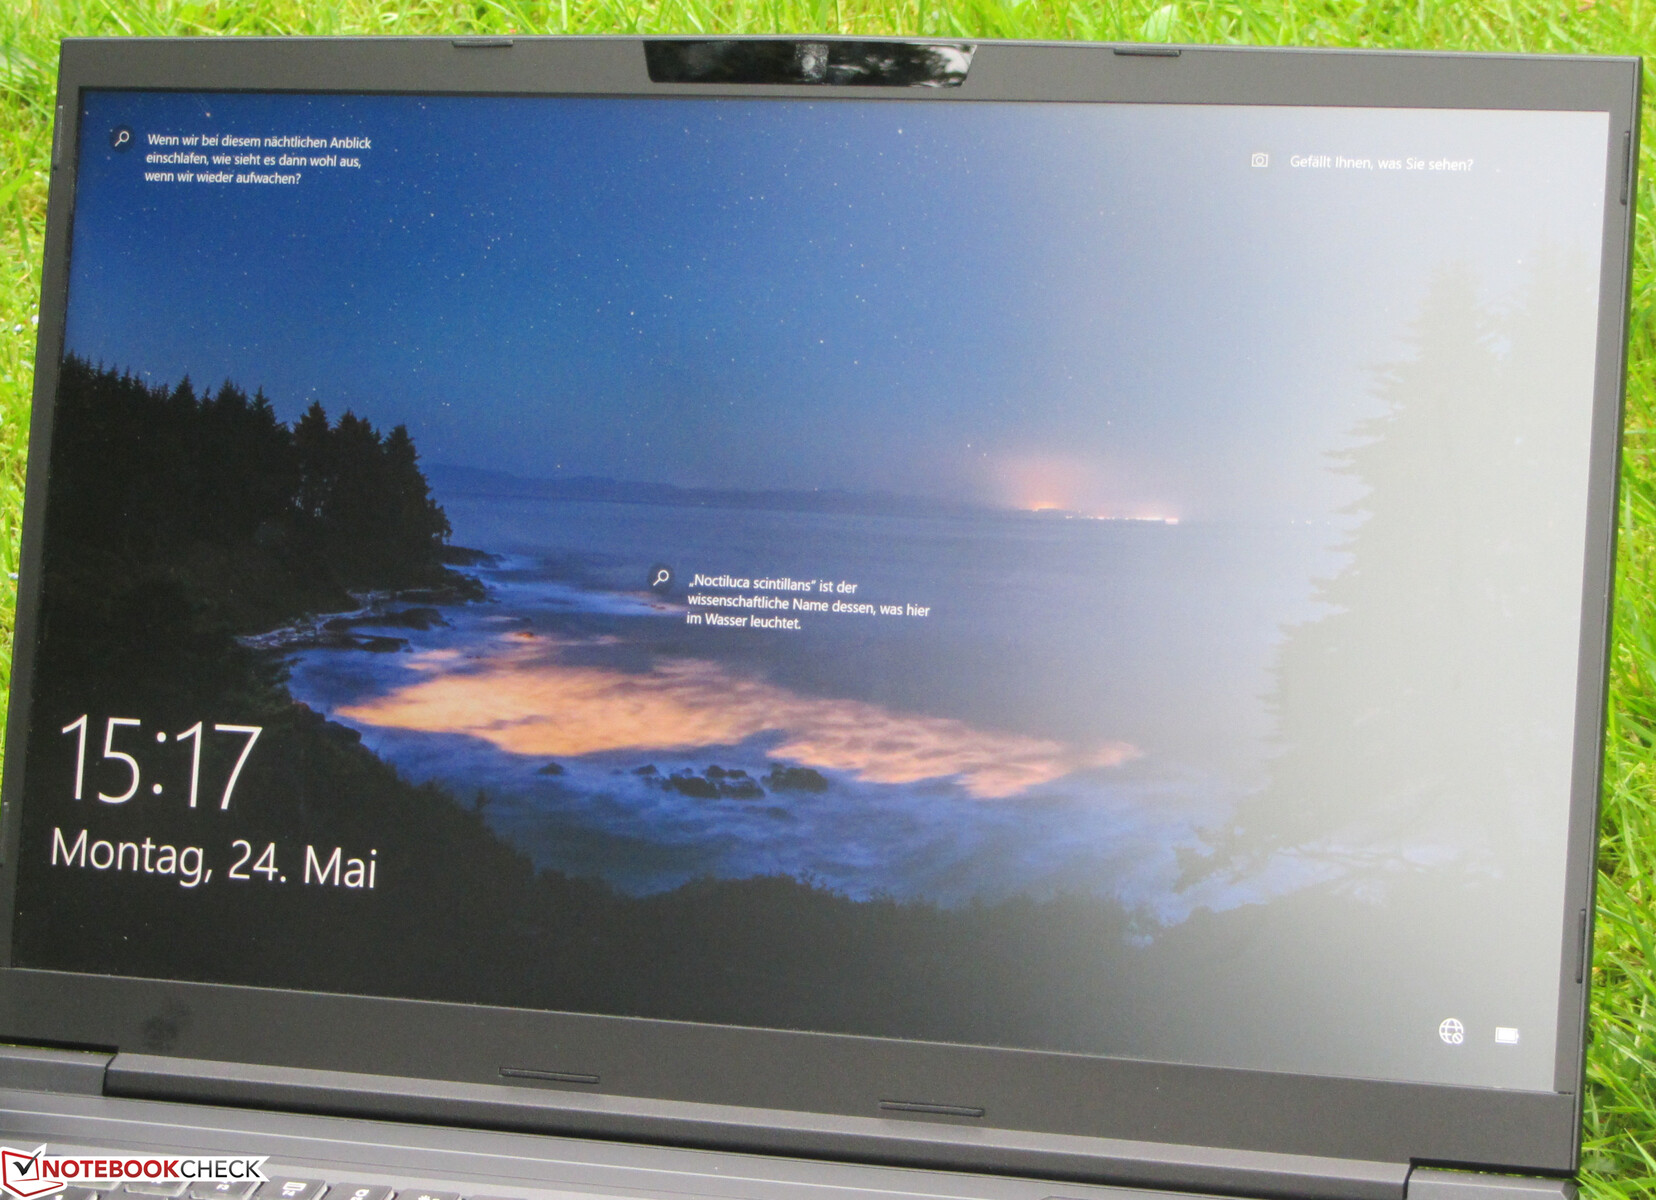
Pantalla - IPS WQHD de 165 Hz
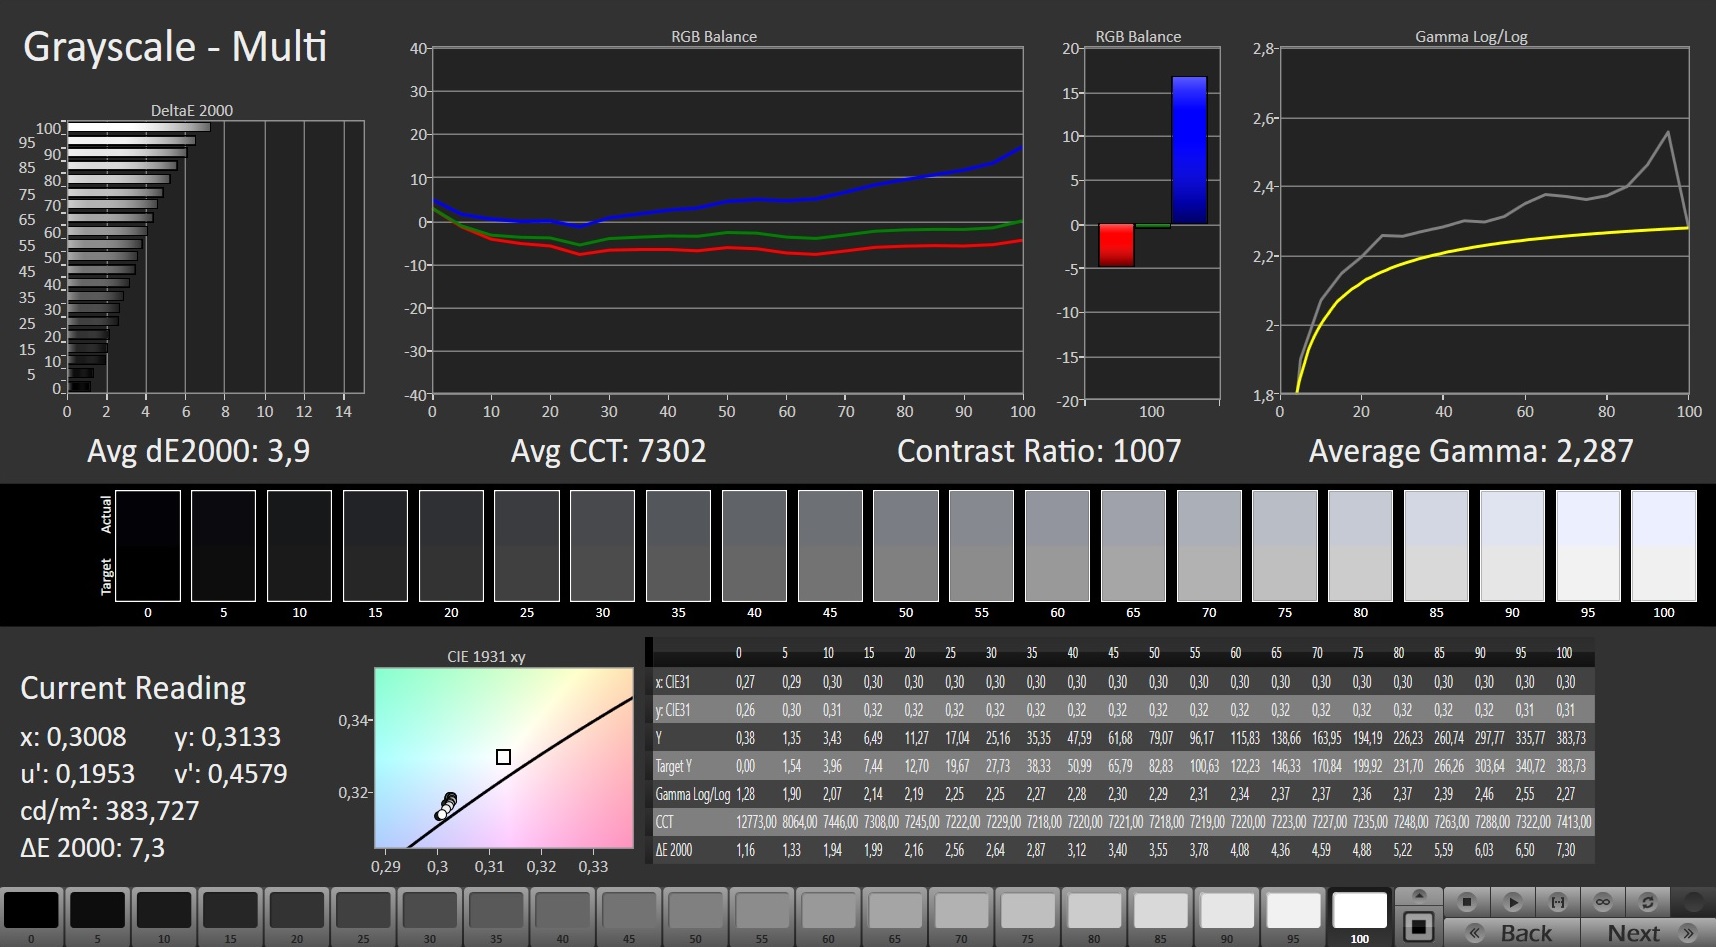
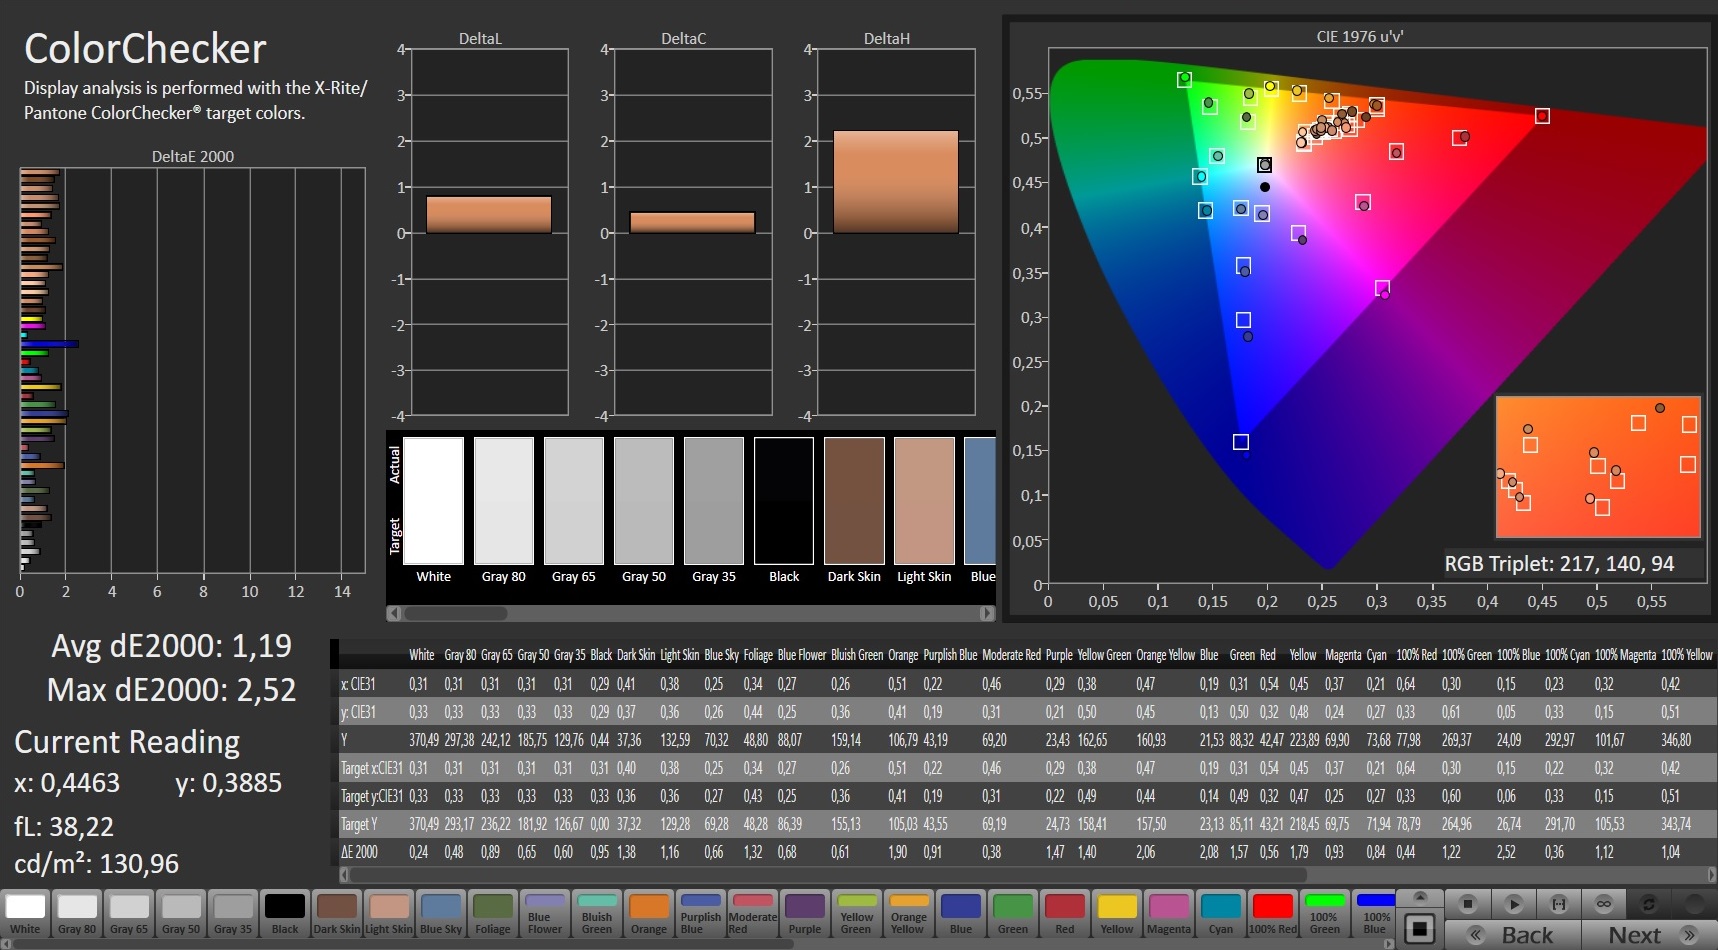
Mientras que el valor de brillo (332.7 cd/m²) de la pantalla mate de 17.3 pulgadas (2560 x 1440 pixeles) resulta bueno, el contraste (974:1) podría mejorar un poco, apenas faltando el objetivo (> 1000:1). El panel de 165-Hz ofrece rápidos tiempos de respuesta y no produce ningún parpadeo PWM. Como alternativa, Schenker también ofrece la opción de una pantalla FHD (IPS, 144 Hz)
| |||||||||||||||||||||||||
iluminación: 84 %
Brillo con batería: 370 cd/m²
Contraste: 974:1 (Negro: 0.38 cd/m²)
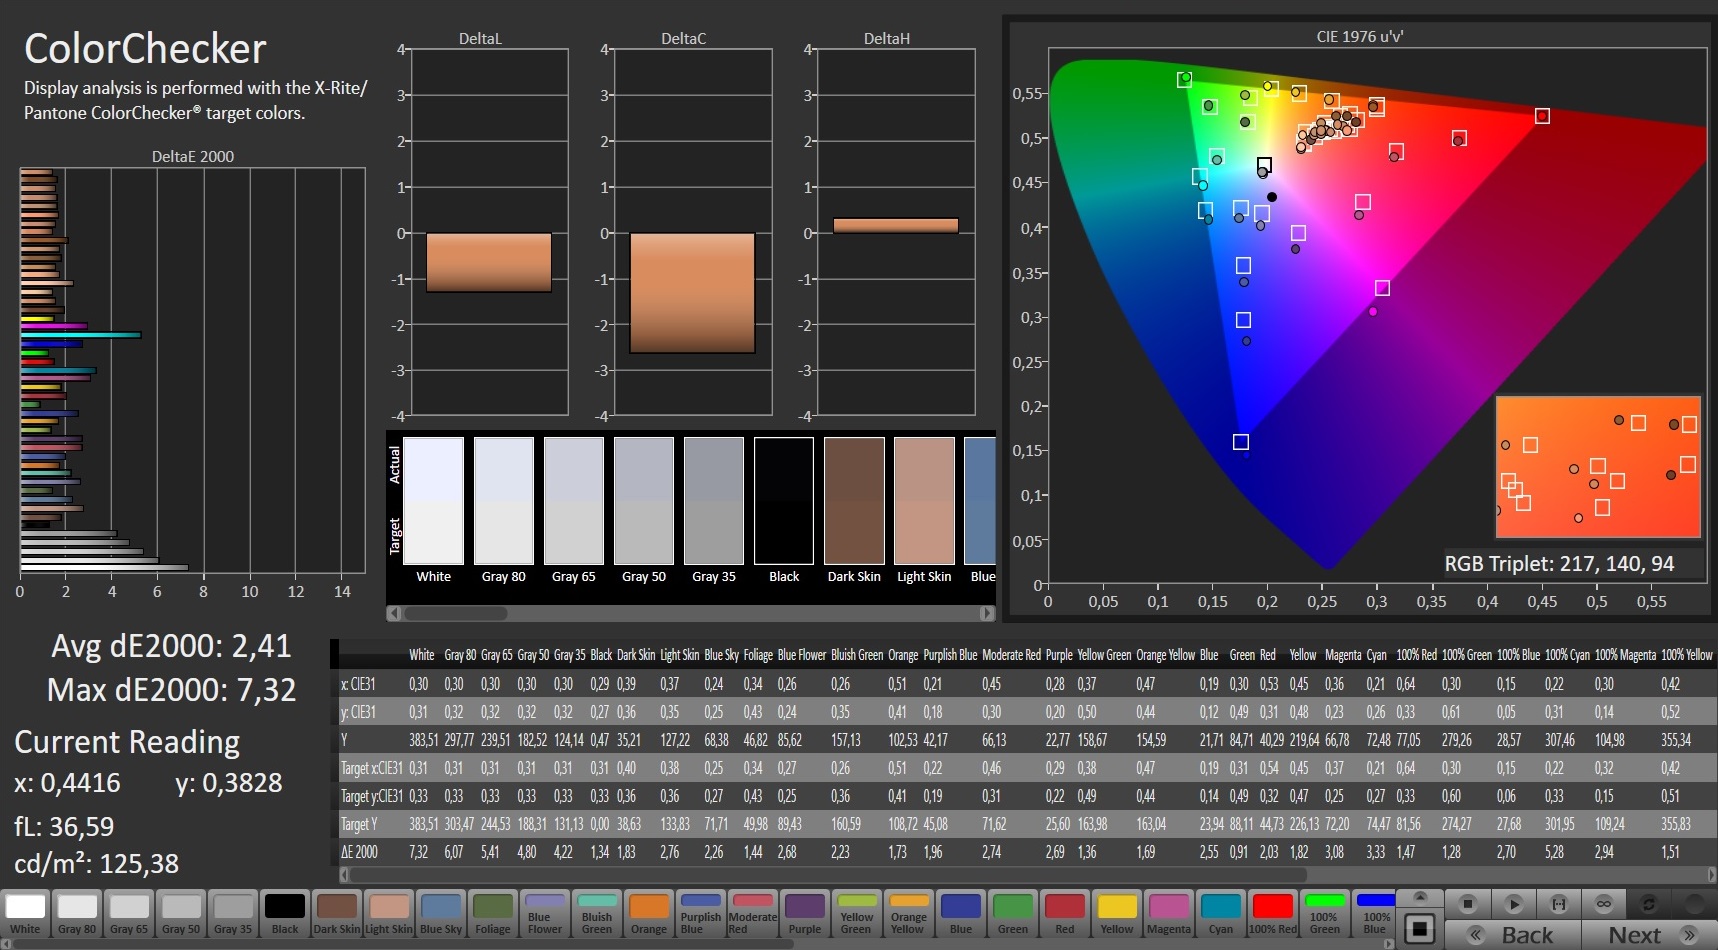
ΔE ColorChecker Calman: 2.41 | ∀{0.5-29.43 Ø4.71}
calibrated: 1.19
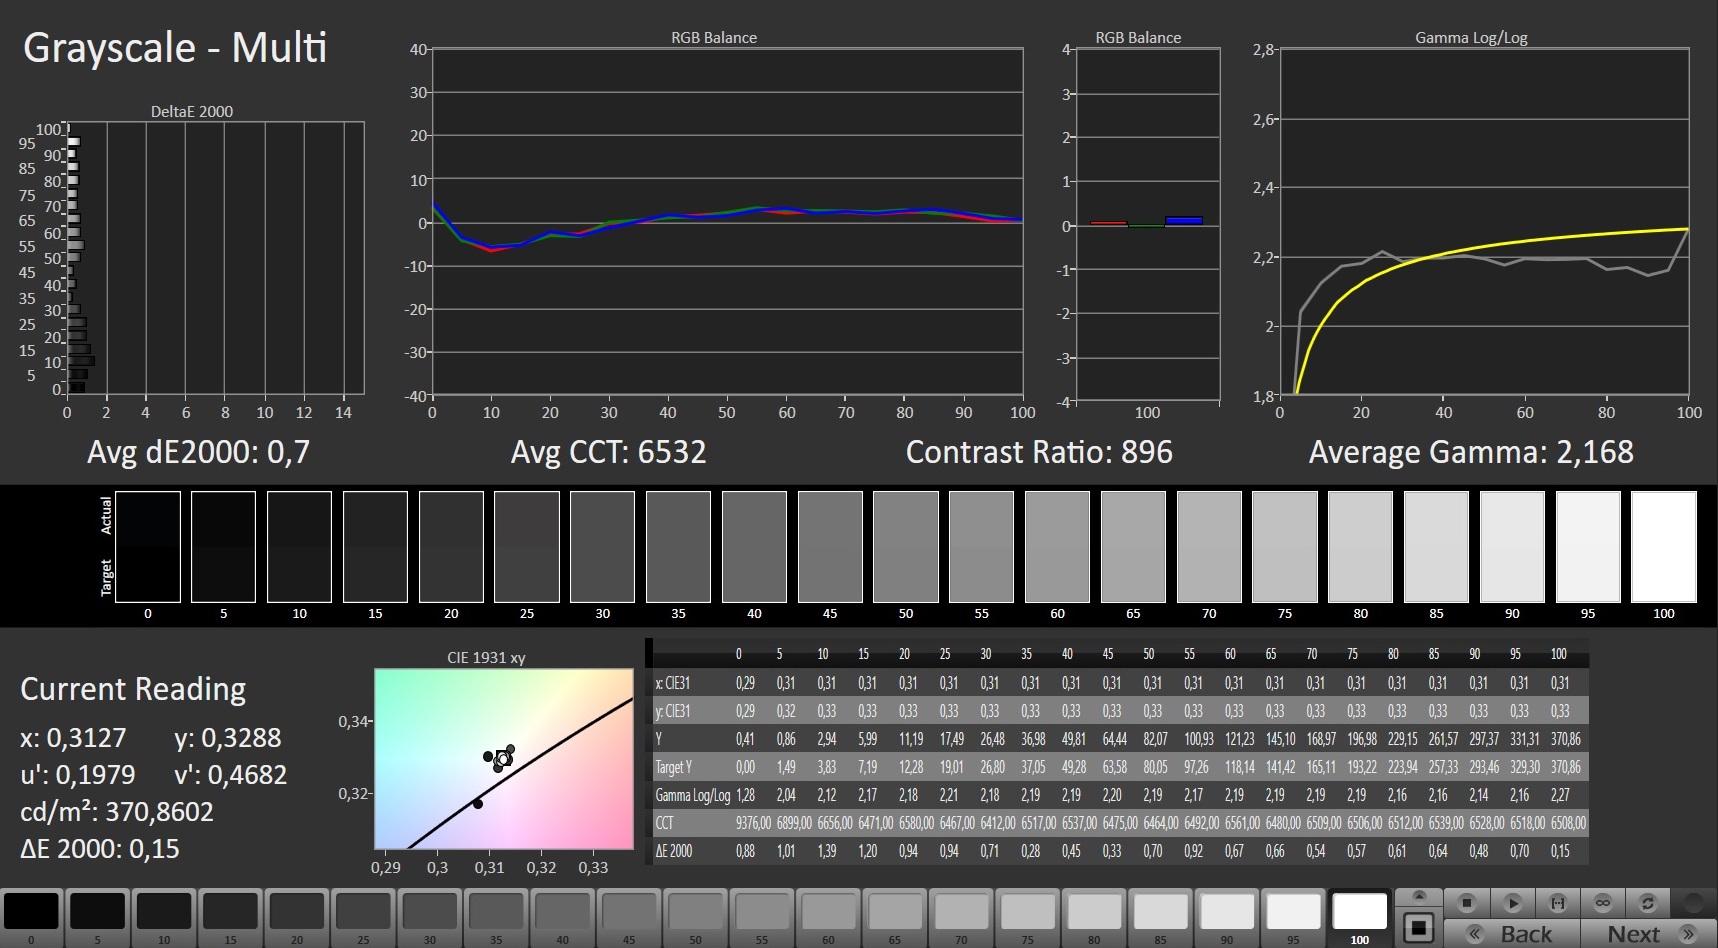
ΔE Greyscale Calman: 3.9 | ∀{0.09-98 Ø4.96}
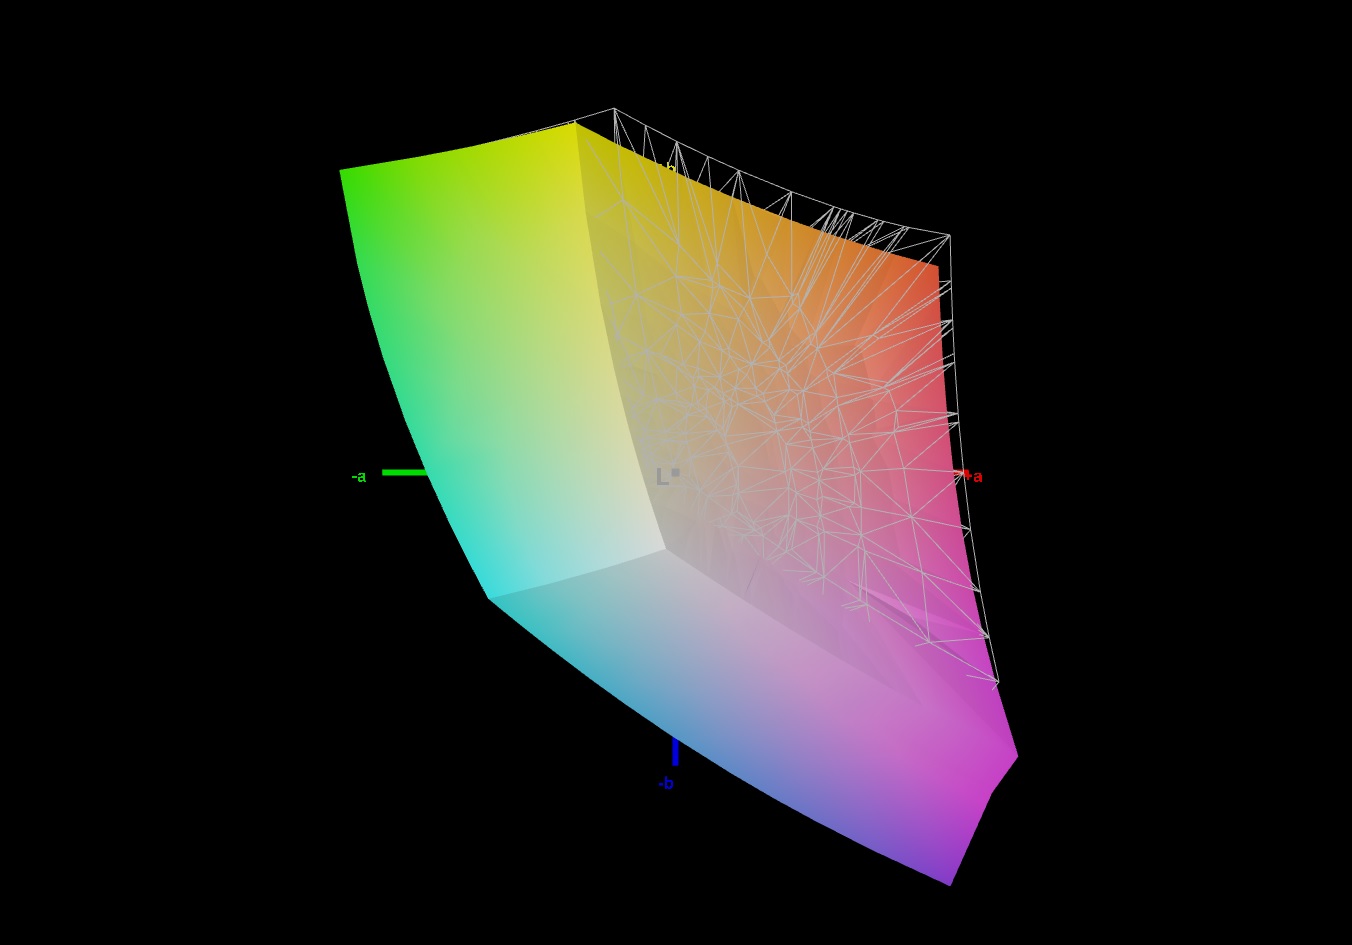
93% sRGB (Argyll 1.6.3 3D)
69% AdobeRGB 1998 (Argyll 1.6.3 3D)
69.3% AdobeRGB 1998 (Argyll 3D)
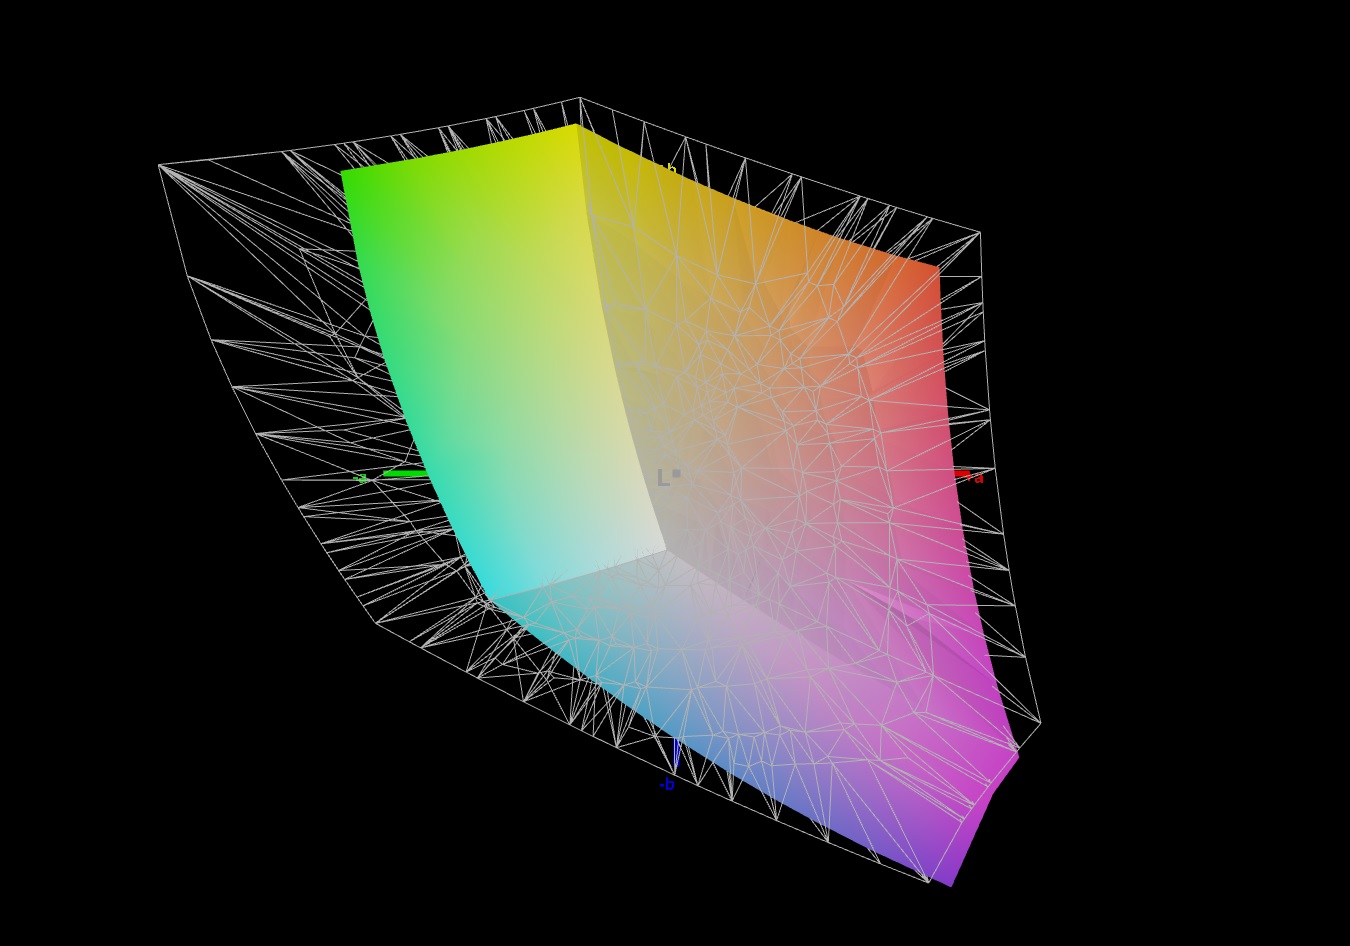
98.5% sRGB (Argyll 3D)
68.1% Display P3 (Argyll 3D)
Gamma: 2.287
CCT: 7302 K
| Schenker XMG Core 17 (Early 2021) BOE CQ NE173QHM-NY2, IPS, 2560x1440, 17.3" | MSI Alpha 17 A4DEK AU Optronics AUO978F, IPS, 1920x1080, 17.3" | Acer Predator Helios 300 PH317-54-75G8 Chi Mei N173HCE-G33, IPS, 1920x1080, 17.3" | Medion Erazer Beast X10 MD61804 LG Phillips LP173WFG-SPB3, IPS, 1920x1080, 17.3" | Schenker XMG Core 17 LG Philips LP173WFG-SPB1 (LGD0615), IPS, 1920x1080, 17.3" | Schenker XMG Core 17 Comet Lake BOE HF NV173FHM-N44, IPS, 1920x1080, 17.3" | |
|---|---|---|---|---|---|---|
| Display | -41% | -6% | -4% | -4% | -5% | |
| Display P3 Coverage (%) | 68.1 | 39.55 -42% | 62.6 -8% | 64.5 -5% | 64.4 -5% | 65.3 -4% |
| sRGB Coverage (%) | 98.5 | 59.2 -40% | 94.3 -4% | 95.6 -3% | 95.6 -3% | 92.6 -6% |
| AdobeRGB 1998 Coverage (%) | 69.3 | 40.86 -41% | 64.7 -7% | 65.6 -5% | 65.6 -5% | 66.5 -4% |
| Response Times | -165% | -3% | 7% | 9% | -3% | |
| Response Time Grey 50% / Grey 80% * (ms) | 16.8 ? | 40 ? -138% | 16.4 ? 2% | 14.4 ? 14% | 14.4 ? 14% | 17.6 ? -5% |
| Response Time Black / White * (ms) | 10 ? | 29.2 ? -192% | 10.8 ? -8% | 10 ? -0% | 9.6 ? 4% | 10 ? -0% |
| PWM Frequency (Hz) | 24510 ? | 1000 ? | ||||
| Screen | -46% | 27% | -5% | 1% | -16% | |
| Brightness middle (cd/m²) | 370 | 254 -31% | 322 -13% | 313 -15% | 329 -11% | 315 -15% |
| Brightness (cd/m²) | 333 | 254 -24% | 308 -8% | 297 -11% | 286 -14% | 298 -11% |
| Brightness Distribution (%) | 84 | 93 11% | 92 10% | 88 5% | 79 -6% | 88 5% |
| Black Level * (cd/m²) | 0.38 | 0.23 39% | 0.18 53% | 0.27 29% | 0.3 21% | 0.29 24% |
| Contrast (:1) | 974 | 1104 13% | 1789 84% | 1159 19% | 1097 13% | 1086 11% |
| Colorchecker dE 2000 * | 2.41 | 4.12 -71% | 1.53 37% | 2.96 -23% | 2.52 -5% | 4.3 -78% |
| Colorchecker dE 2000 max. * | 7.32 | 19.66 -169% | 3.14 57% | 9.83 -34% | 6.9 6% | 7.3 -0% |
| Colorchecker dE 2000 calibrated * | 1.19 | 3.78 -218% | 0.74 38% | 1.03 13% | 1.31 -10% | 2.29 -92% |
| Greyscale dE 2000 * | 3.9 | 3.2 18% | 1.9 51% | 4.9 -26% | 2.98 24% | 4.3 -10% |
| Gamma | 2.287 96% | 2.179 101% | 2.144 103% | 2.187 101% | 2.38 92% | 2.084 106% |
| CCT | 7302 89% | 6754 96% | 6809 95% | 7559 86% | 6738 96% | 7434 87% |
| Color Space (Percent of AdobeRGB 1998) (%) | 69 | 41 -41% | 65 -6% | 66 -4% | 60 -13% | 66 -4% |
| Color Space (Percent of sRGB) (%) | 93 | 59 -37% | 87 -6% | 89 -4% | 95 2% | 92 -1% |
| Media total (Programa/Opciones) | -84% /
-60% | 6% /
17% | -1% /
-3% | 2% /
1% | -8% /
-12% |
* ... más pequeño es mejor
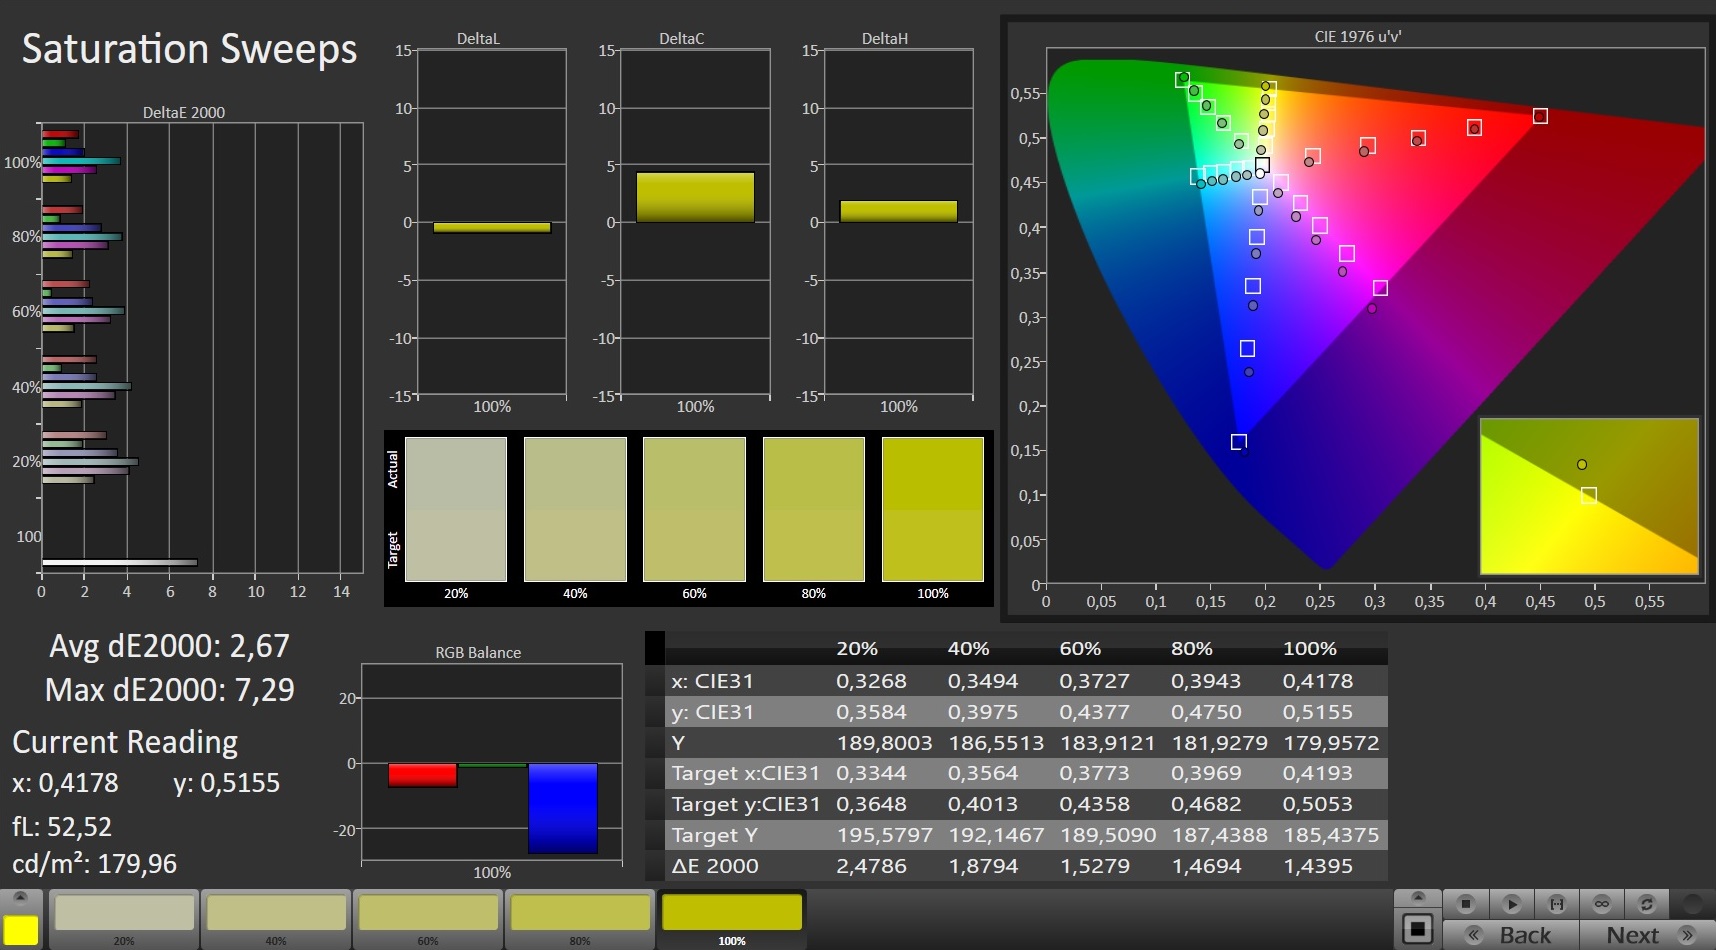
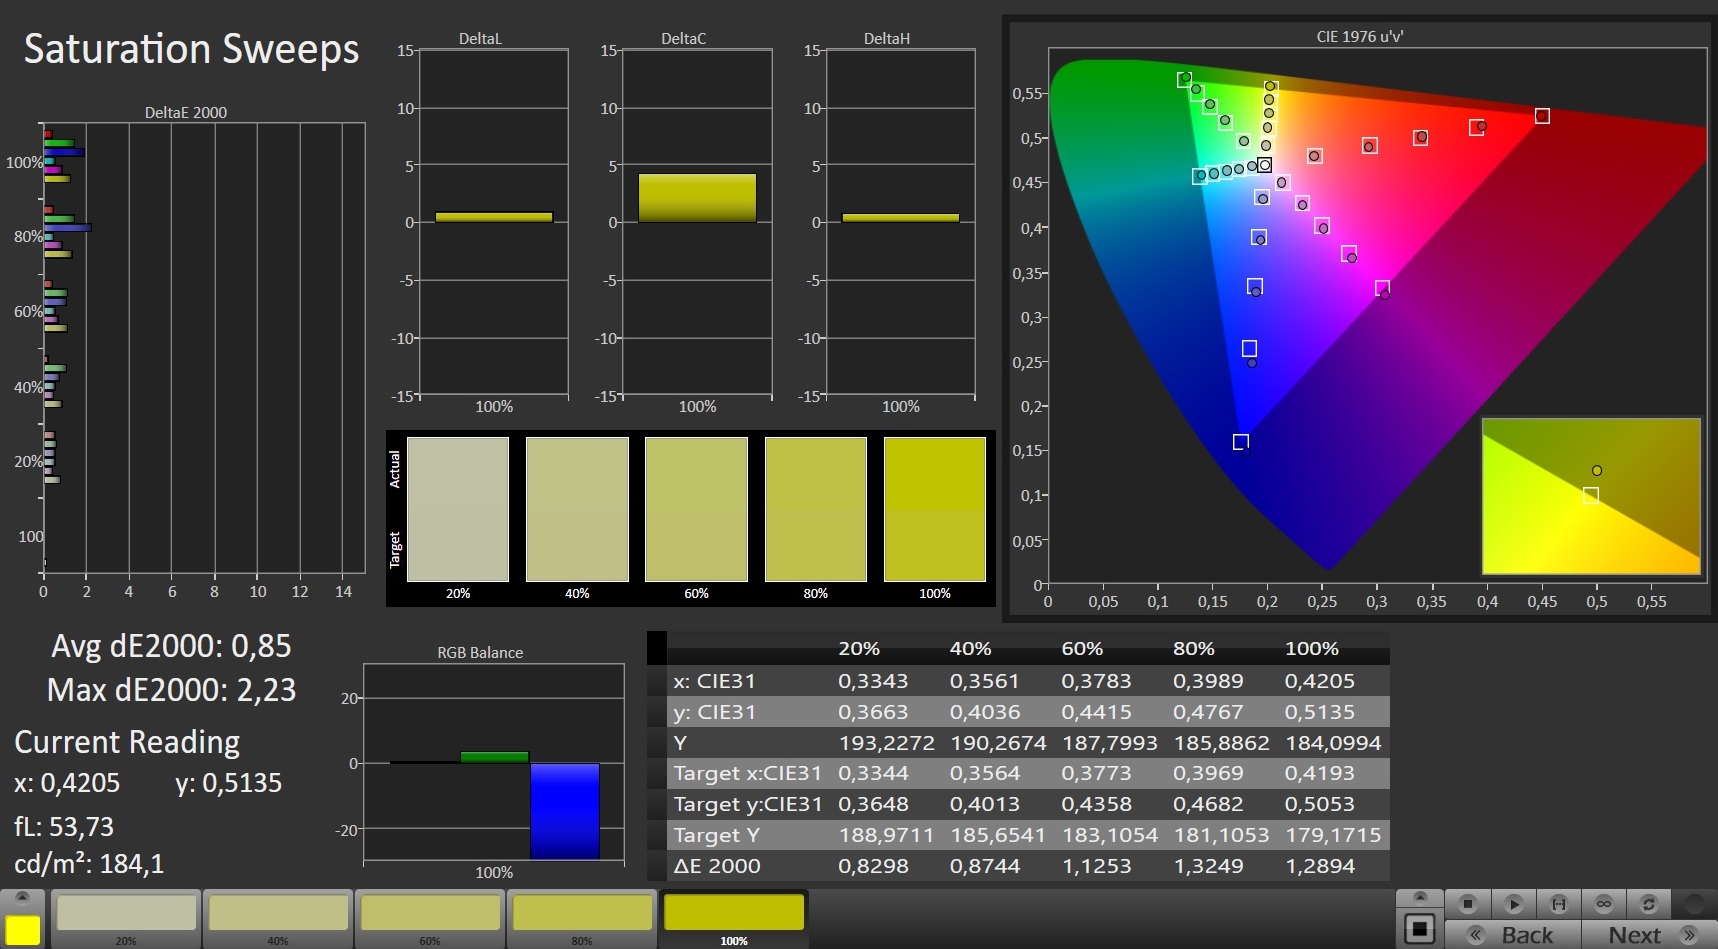
En el estado de entrega, la pantalla ofrece una buena reproducción del color, cumpliendo el objetivo (Delta E < 3) con una desviación del color de 2,41. La pantalla no sufre de un tinte azul. A través de la calibración, se pueden lograr algunas mejoras, con la desviación de color cayendo a 1,19 y la pantalla en escala de grises se vuelve más equilibrada. Los espacios de color AdobeRGB (69%) y sRGB (93%) no están totalmente cubiertos
Tiempos de respuesta del display
| ↔ Tiempo de respuesta de Negro a Blanco | ||
|---|---|---|
| 10 ms ... subida ↗ y bajada ↘ combinada | ↗ 4.8 ms subida | 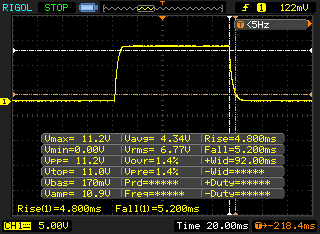 |
| ↘ 5.2 ms bajada | ||
| La pantalla mostró buenos tiempos de respuesta en nuestros tests pero podría ser demasiado lenta para los jugones competitivos. En comparación, todos los dispositivos de prueba van de ##min### (mínimo) a 240 (máximo) ms. » 27 % de todos los dispositivos son mejores. Esto quiere decir que el tiempo de respuesta medido es mejor que la media (19.8 ms) de todos los dispositivos testados. | ||
| ↔ Tiempo de respuesta 50% Gris a 80% Gris | ||
| 16.8 ms ... subida ↗ y bajada ↘ combinada | ↗ 8.4 ms subida | 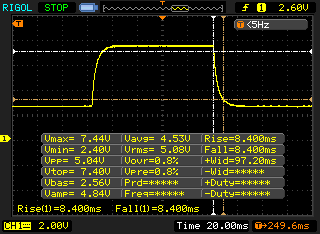 |
| ↘ 8.4 ms bajada | ||
| La pantalla mostró buenos tiempos de respuesta en nuestros tests pero podría ser demasiado lenta para los jugones competitivos. En comparación, todos los dispositivos de prueba van de ##min### (mínimo) a 636 (máximo) ms. » 31 % de todos los dispositivos son mejores. Esto quiere decir que el tiempo de respuesta medido es mejor que la media (30.9 ms) de todos los dispositivos testados. | ||
Parpadeo de Pantalla / PWM (Pulse-Width Modulation)
| Parpadeo de Pantalla / PWM no detectado | 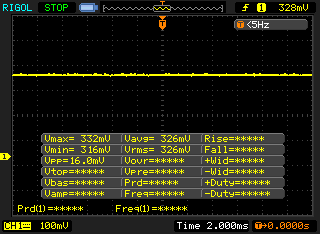 | ||
Comparación: 52 % de todos los dispositivos testados no usaron PWM para atenuar el display. Si se usó, medimos una media de 7748 (mínimo: 5 - máxmo: 343500) Hz. | |||
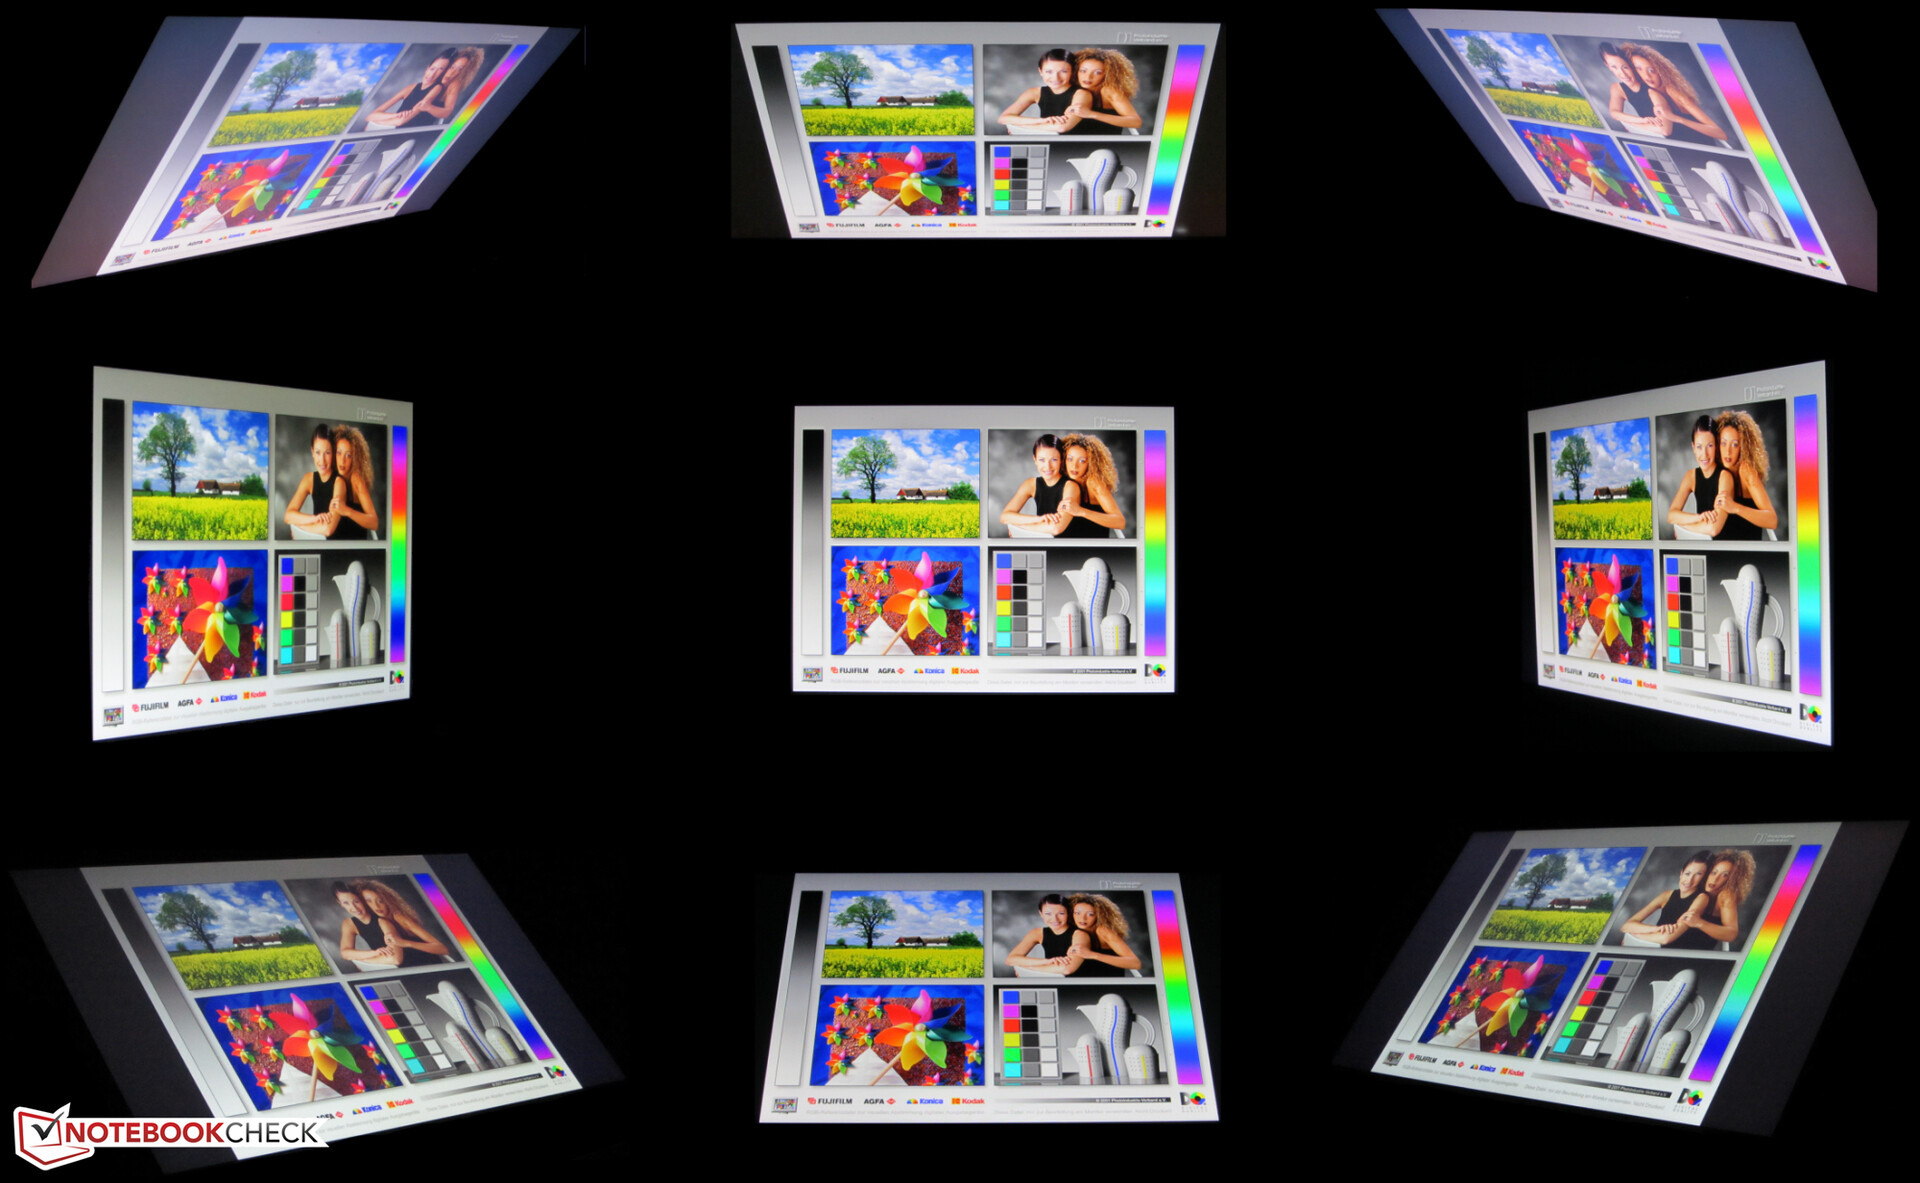
Los ángulos de visión del panel IPS son estables y el contenido de la pantalla se puede leer desde cualquier posición. En exteriores, el contenido de la pantalla puede leerse si el sol no es demasiado brillante
Rendimiento - Suficiente para los próximos años
El XMG Core 17 es capaz de llevar a la pantalla todos los juegos actuales sin problemas y también da la talla en todas las demás áreas de aplicación
Condiciones de la prueba
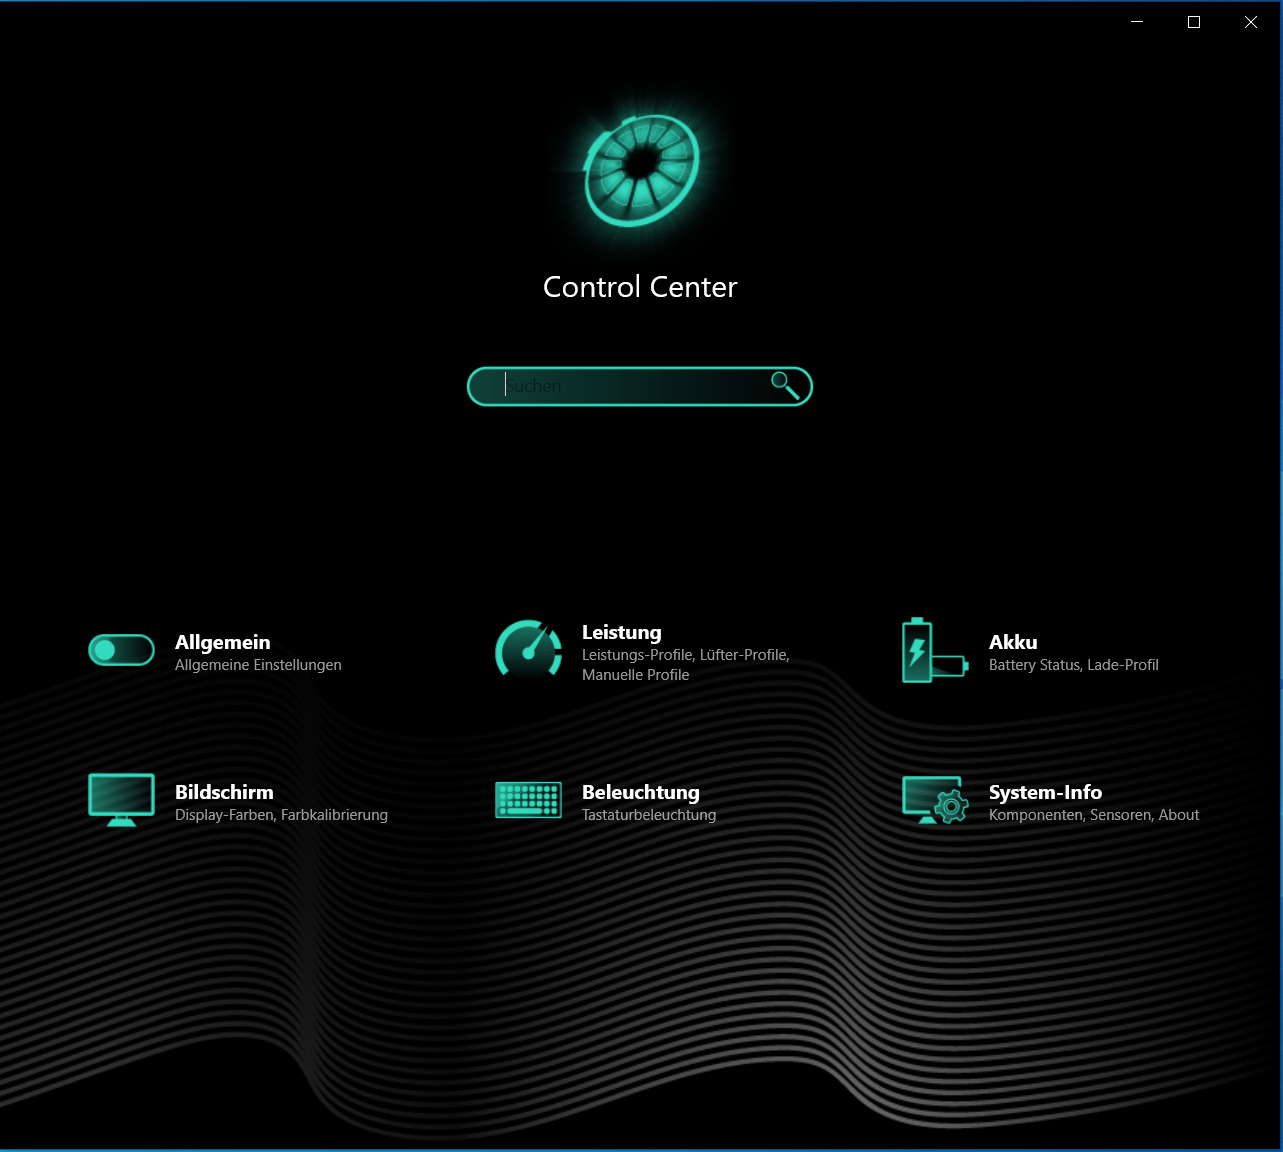
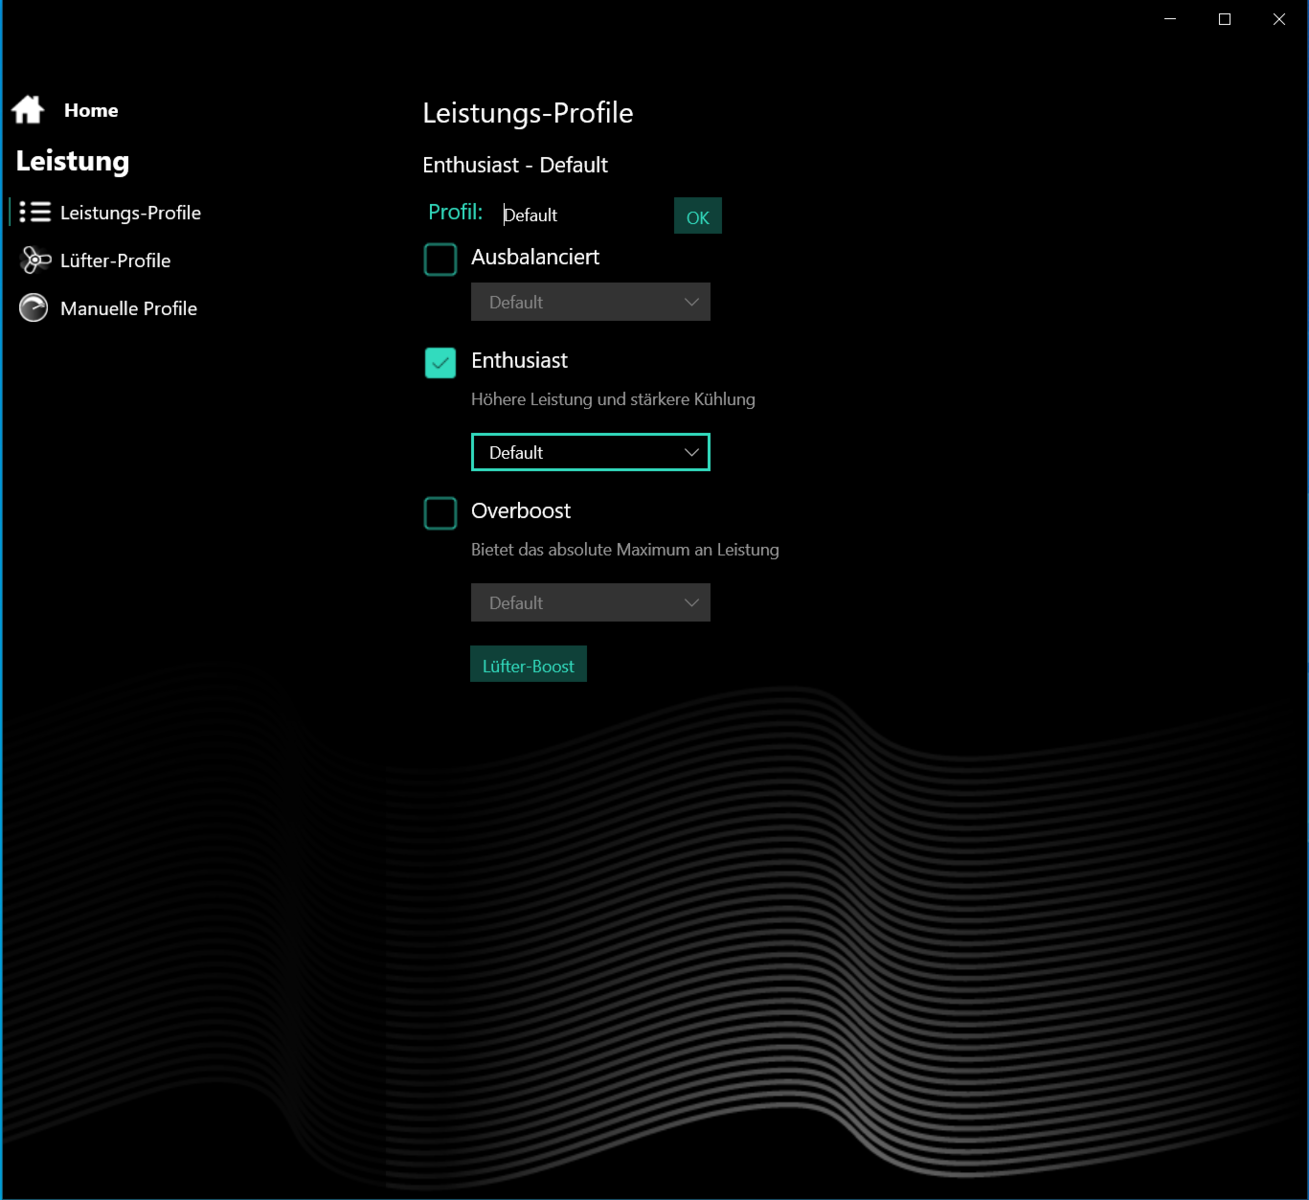
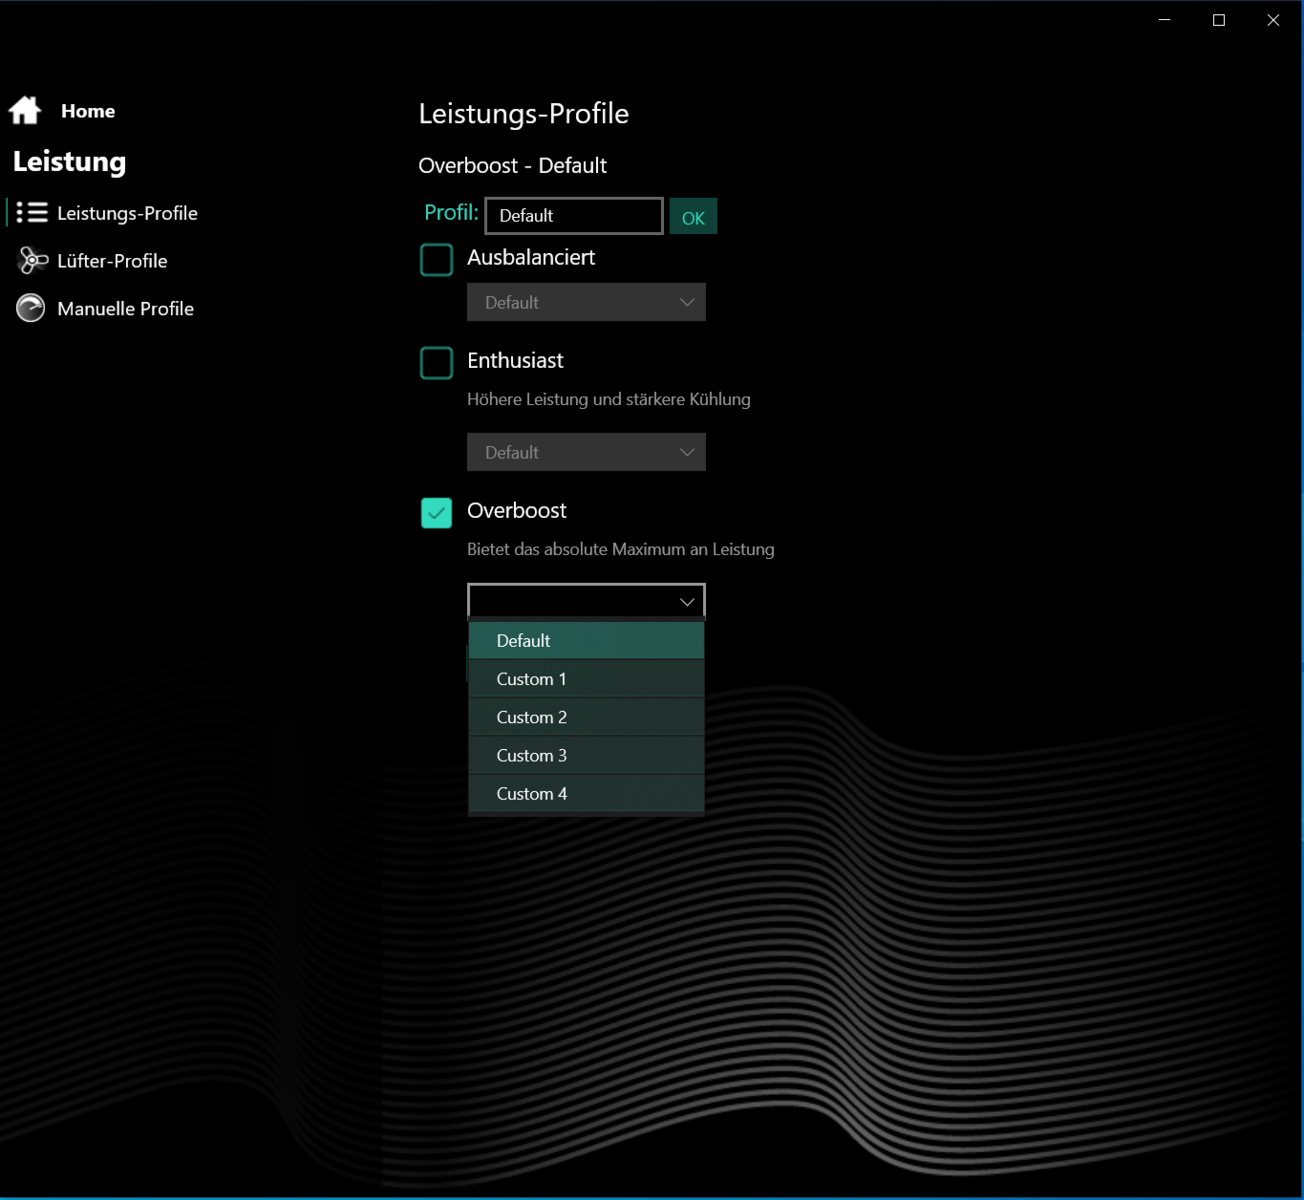
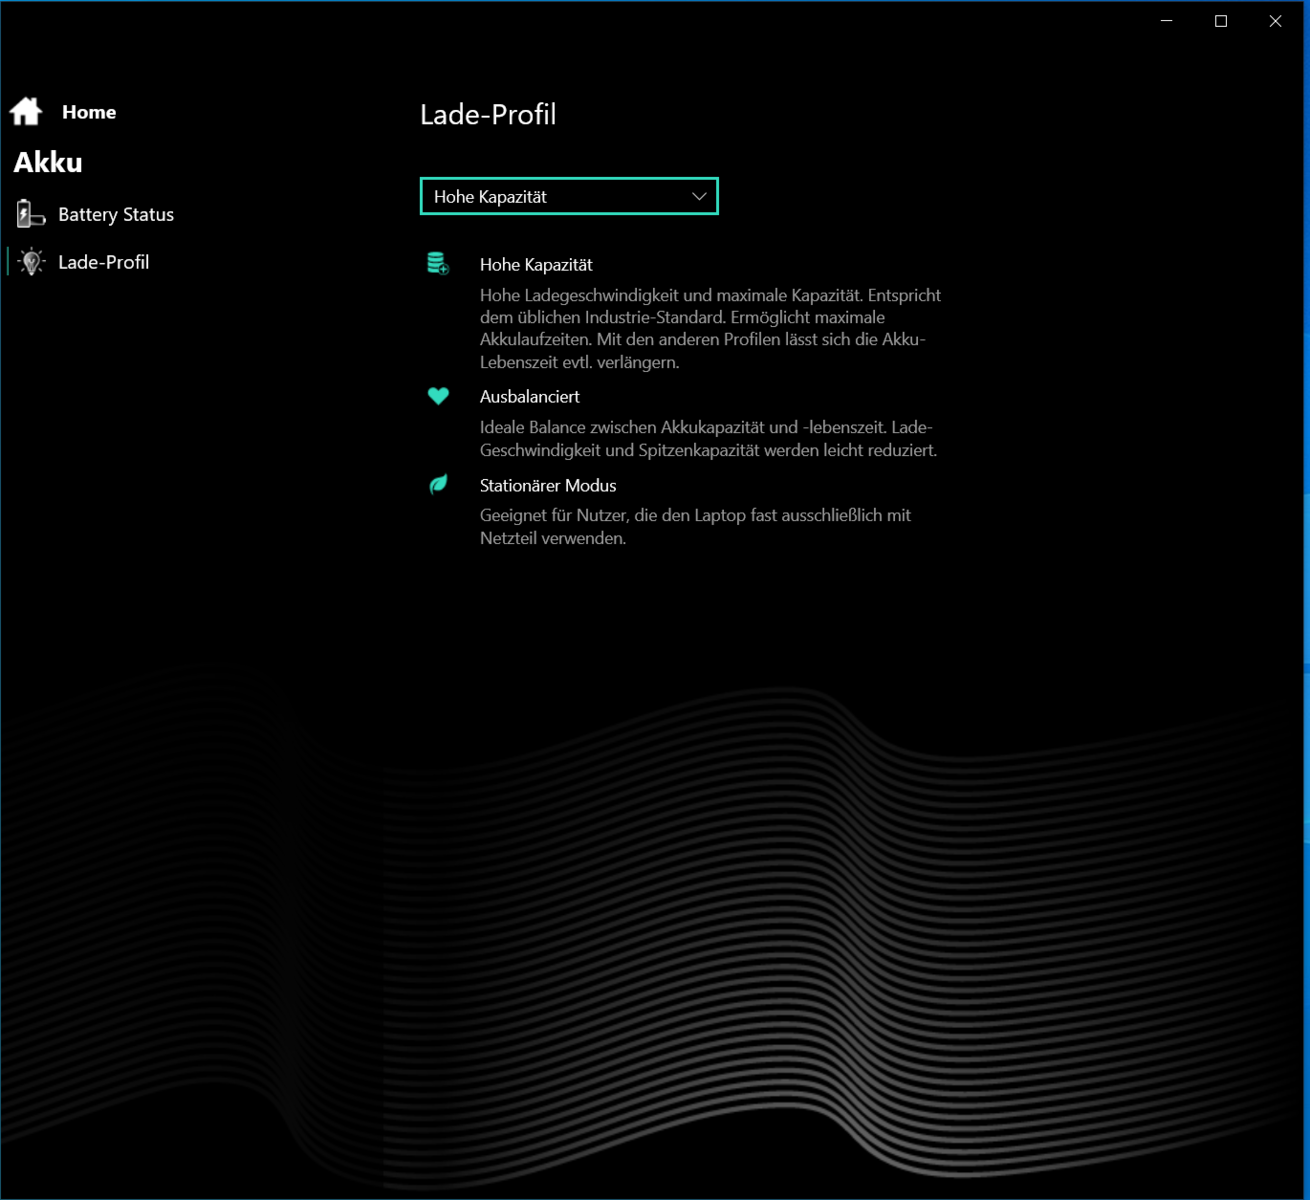
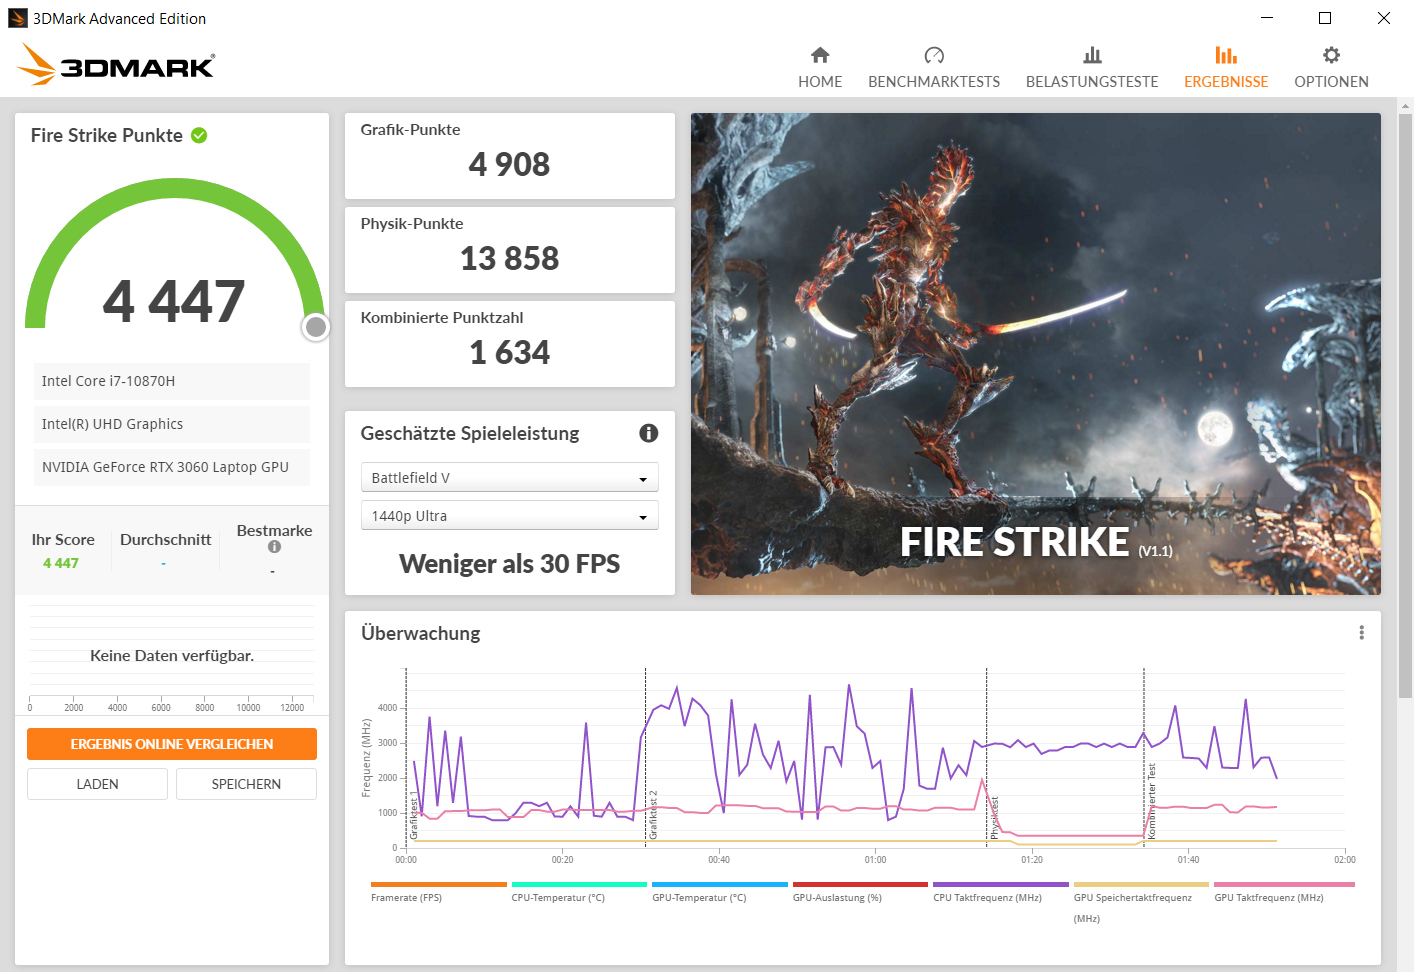
Puedes cambiar entre los tres perfiles de rendimiento "Equilibrado", "Entusiasta" y "Overboost" a través del Centro de Control preinstalado o de la tecla de cambio de perfil (junto al botón de encendido). Para nuestra prueba, utilizamos el perfil "Enthusiast" (PL1/PL2: 60 vatios) y el control automático del ventilador. También se realizaron varias pruebas con el perfil "Overboost" (PL1/PL2: 75 vatios) activado. Durante las pruebas de batería, utilizamos el perfil "Equilibrado" (PL1/PL2: 35 vatios).
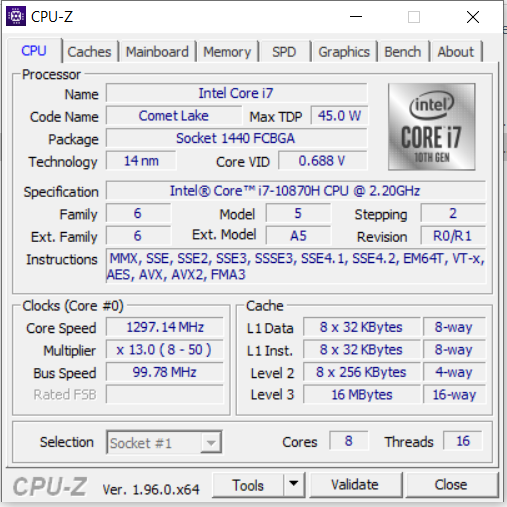
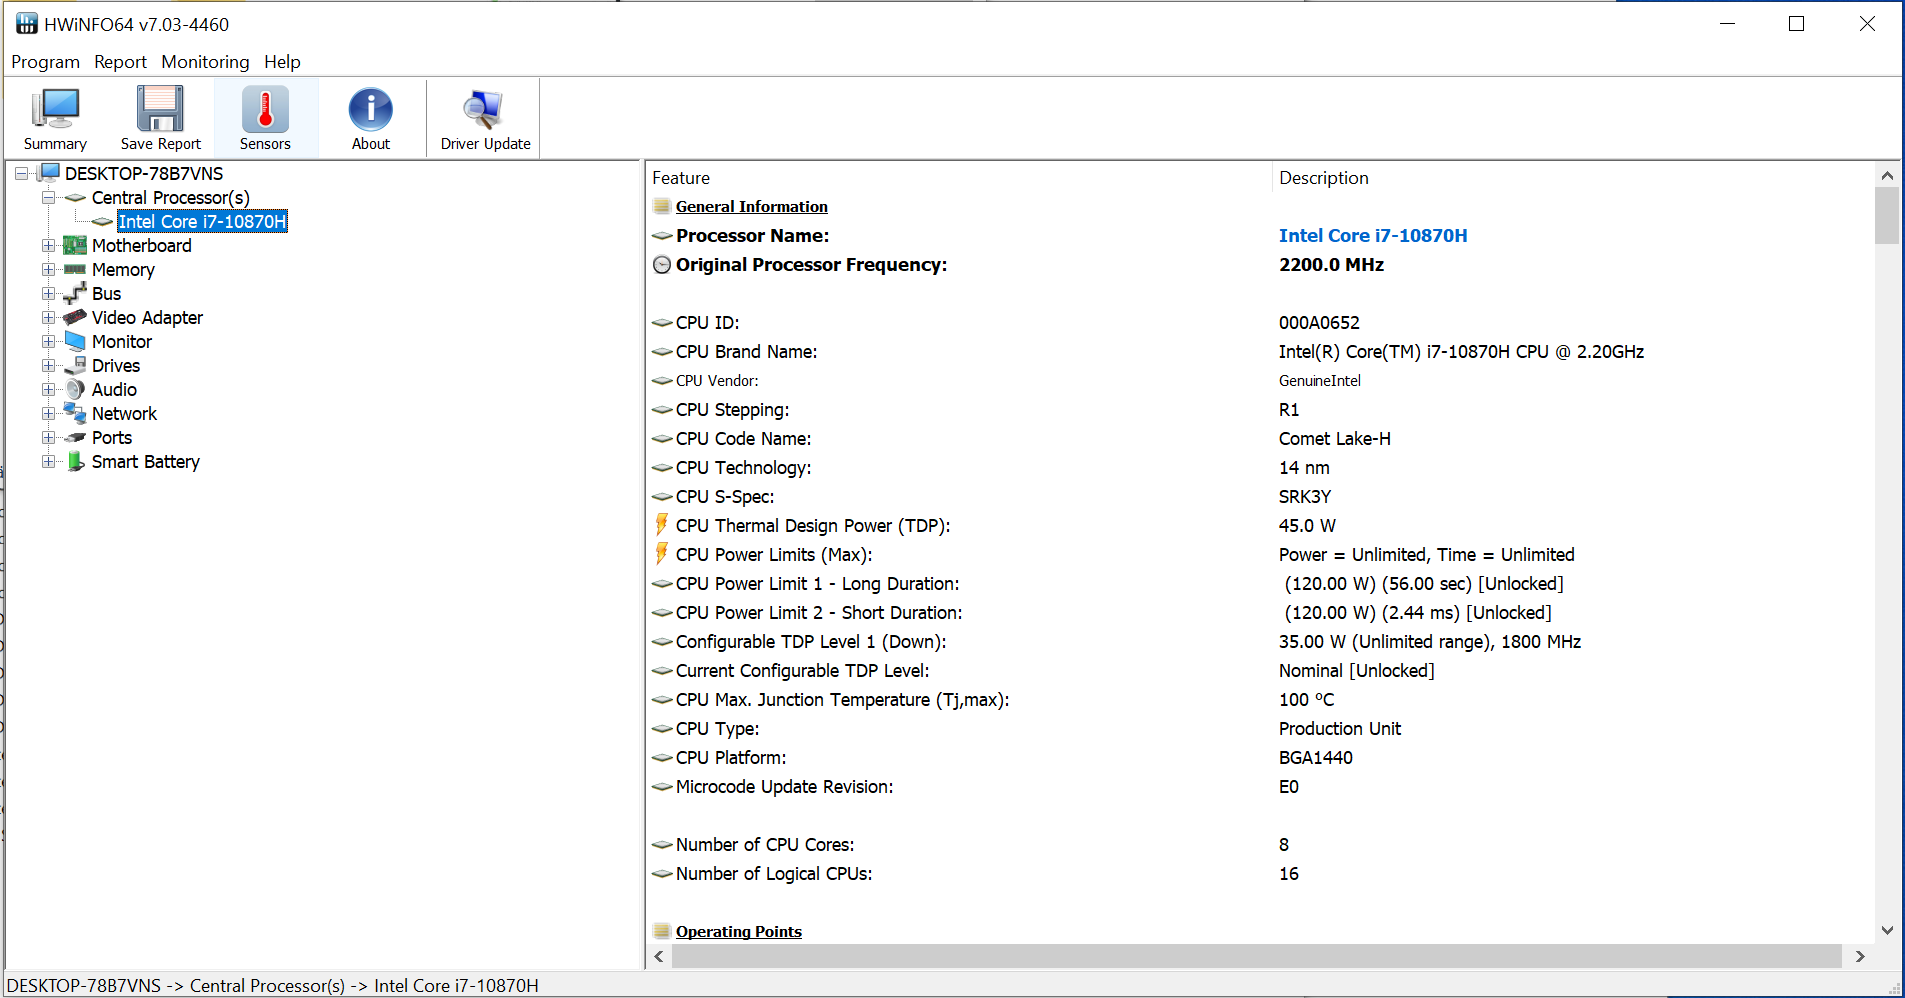
Procesador
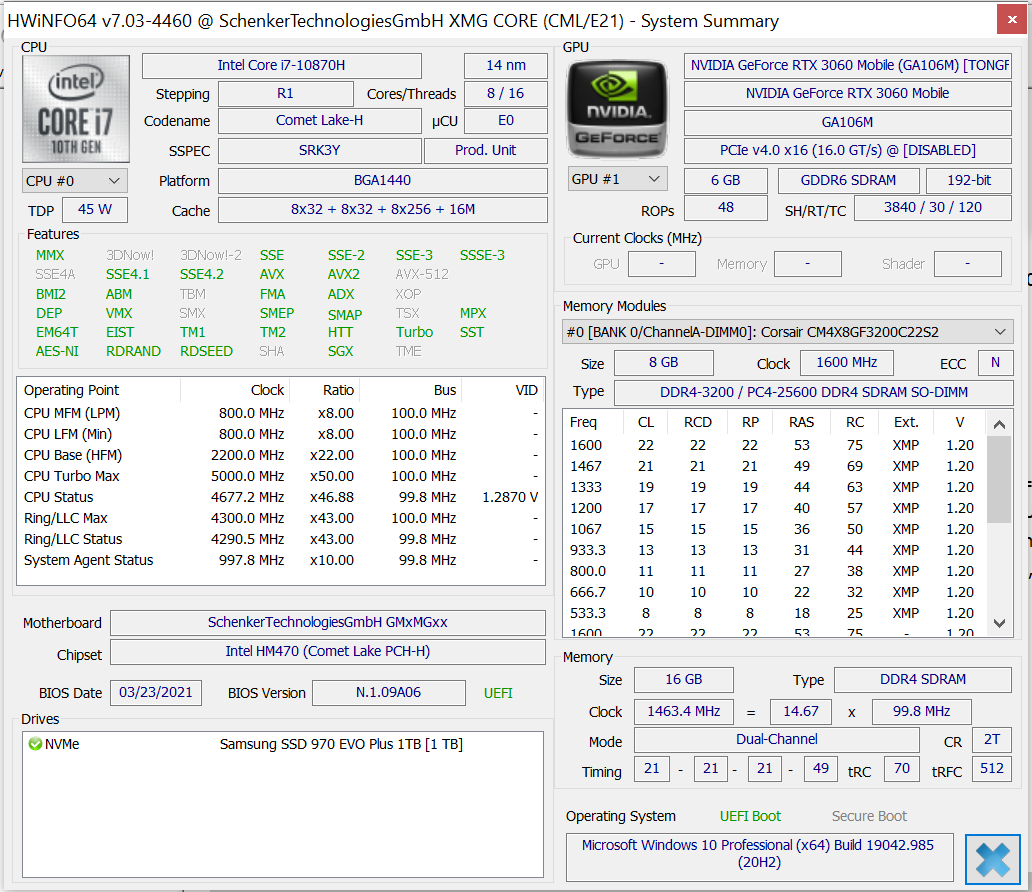
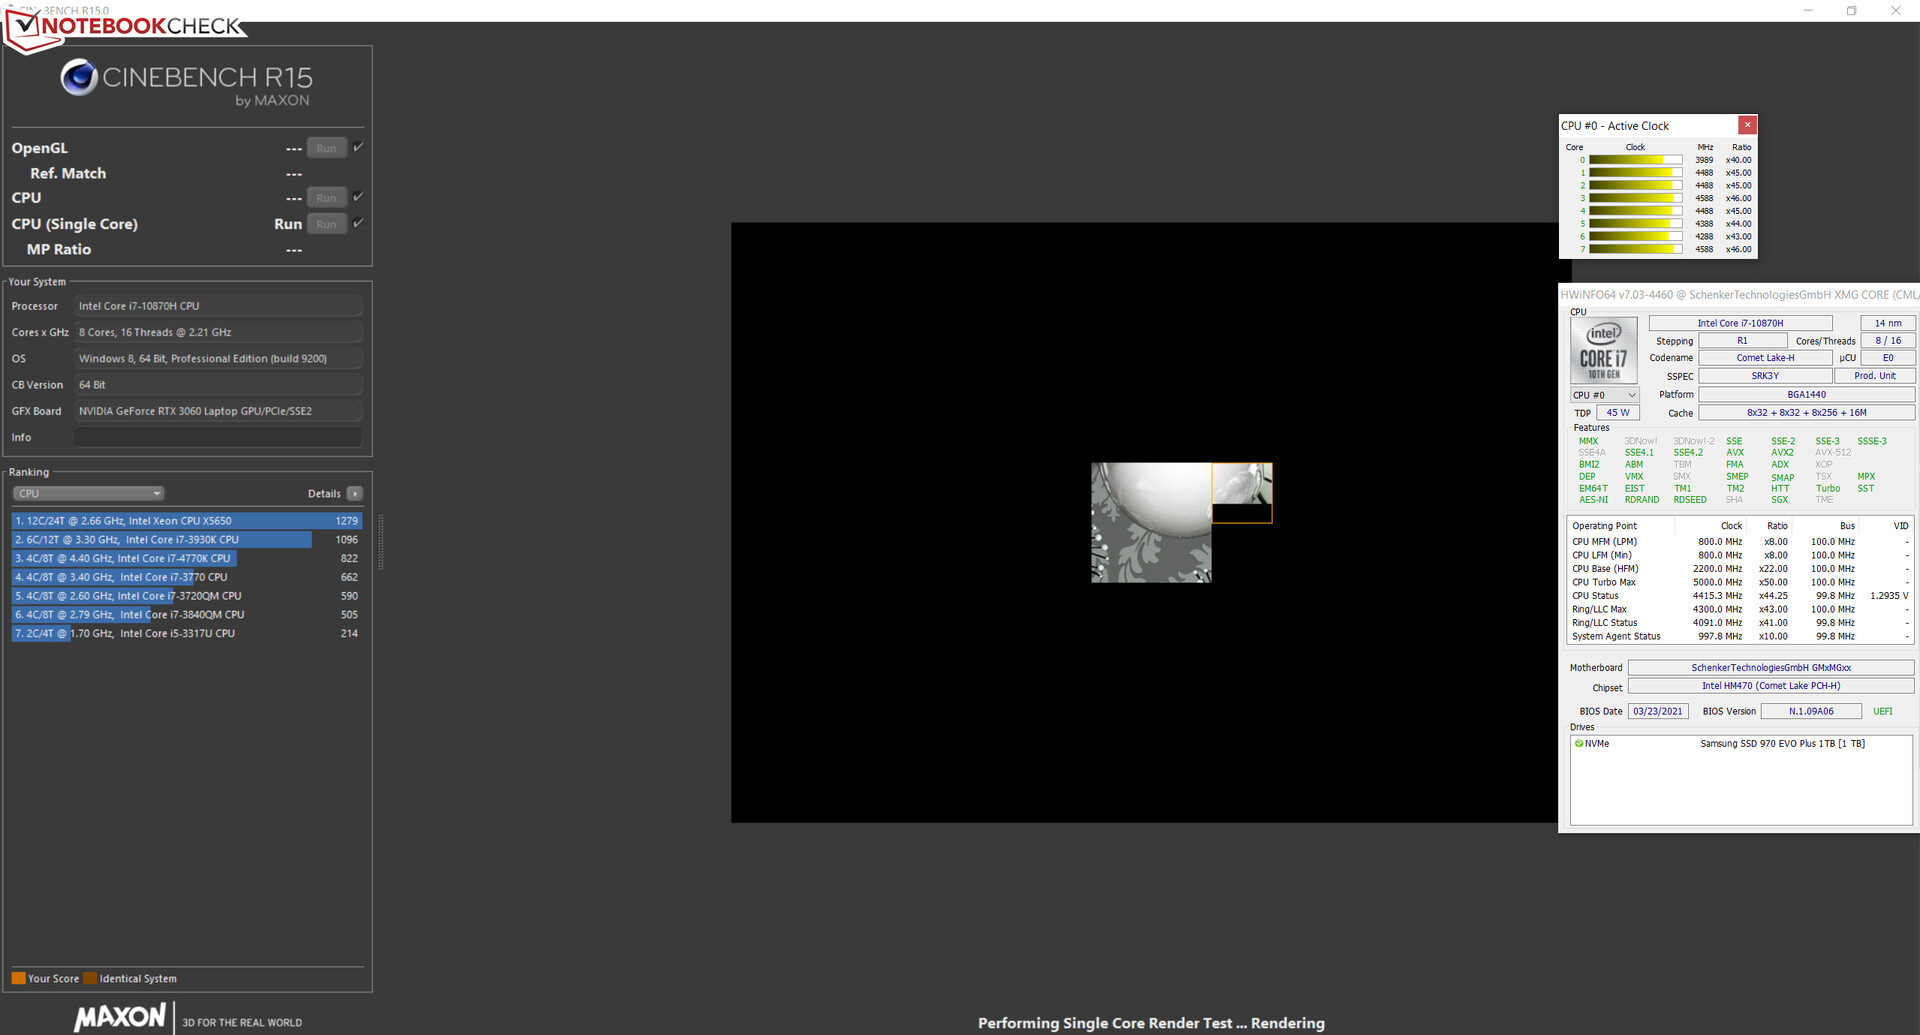
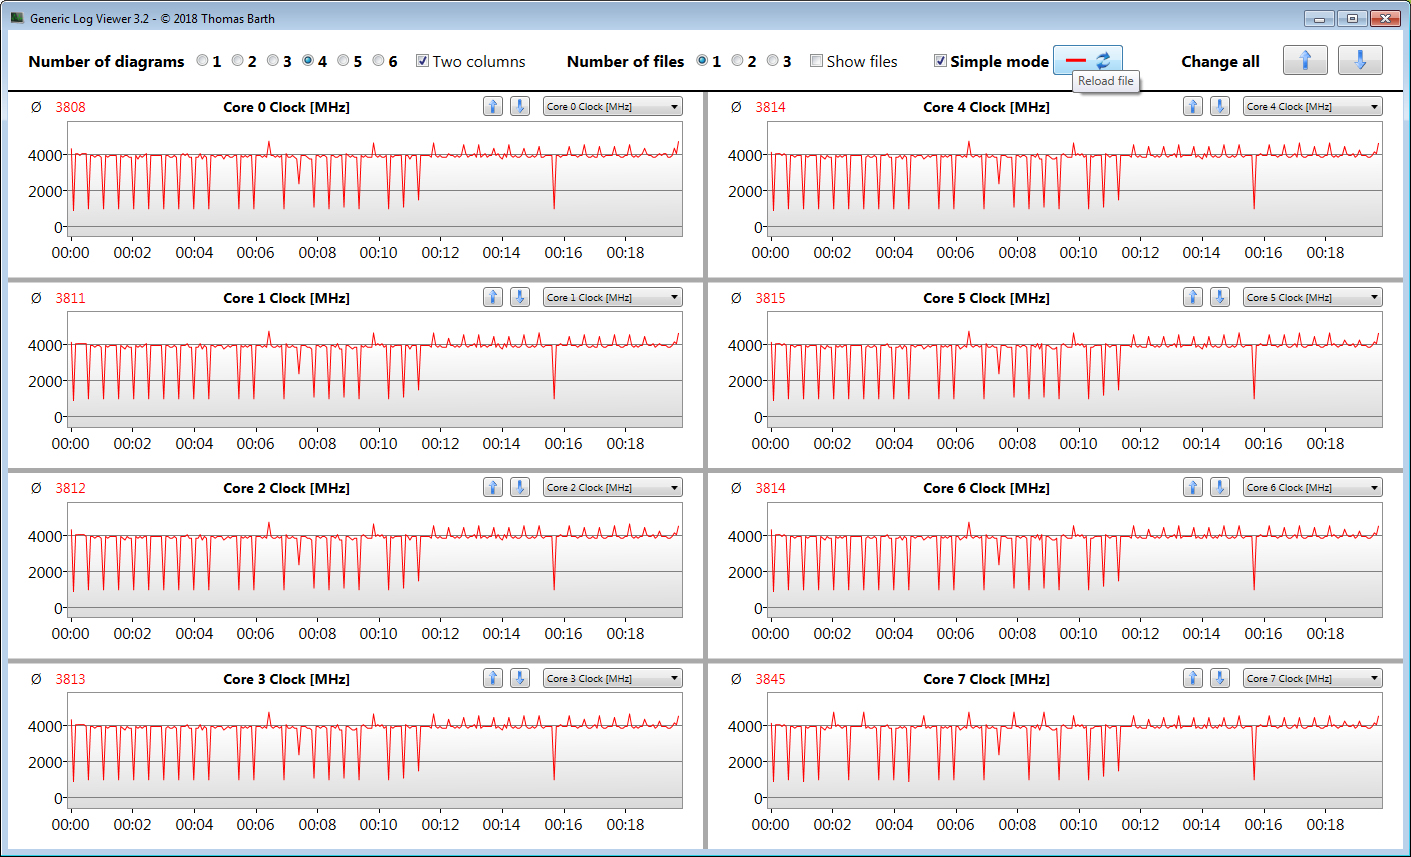
ElCore i7-10870H(Comet Lake) funciona a una velocidad de reloj básica de 2,2 GHz. A través de Turbo, se puede aumentar hasta un máximo de 4,2 GHz (ocho núcleos) y 5 GHz (un solo núcleo). Soporta Hyperthreading (dos hilos por núcleo).
El procesador pasa por las pruebas de CPU del benchmark Cinebench R15 entre 3 y 3,8 GHz (multihilo) y entre 4 y 4,8 GHz (un solo hilo). En funcionamiento en batería, la CPU funciona a velocidades de reloj entre 2,6 y 2,9 GHz (multihilo) y entre 2,4 y 4,2 GHz (un solo hilo).
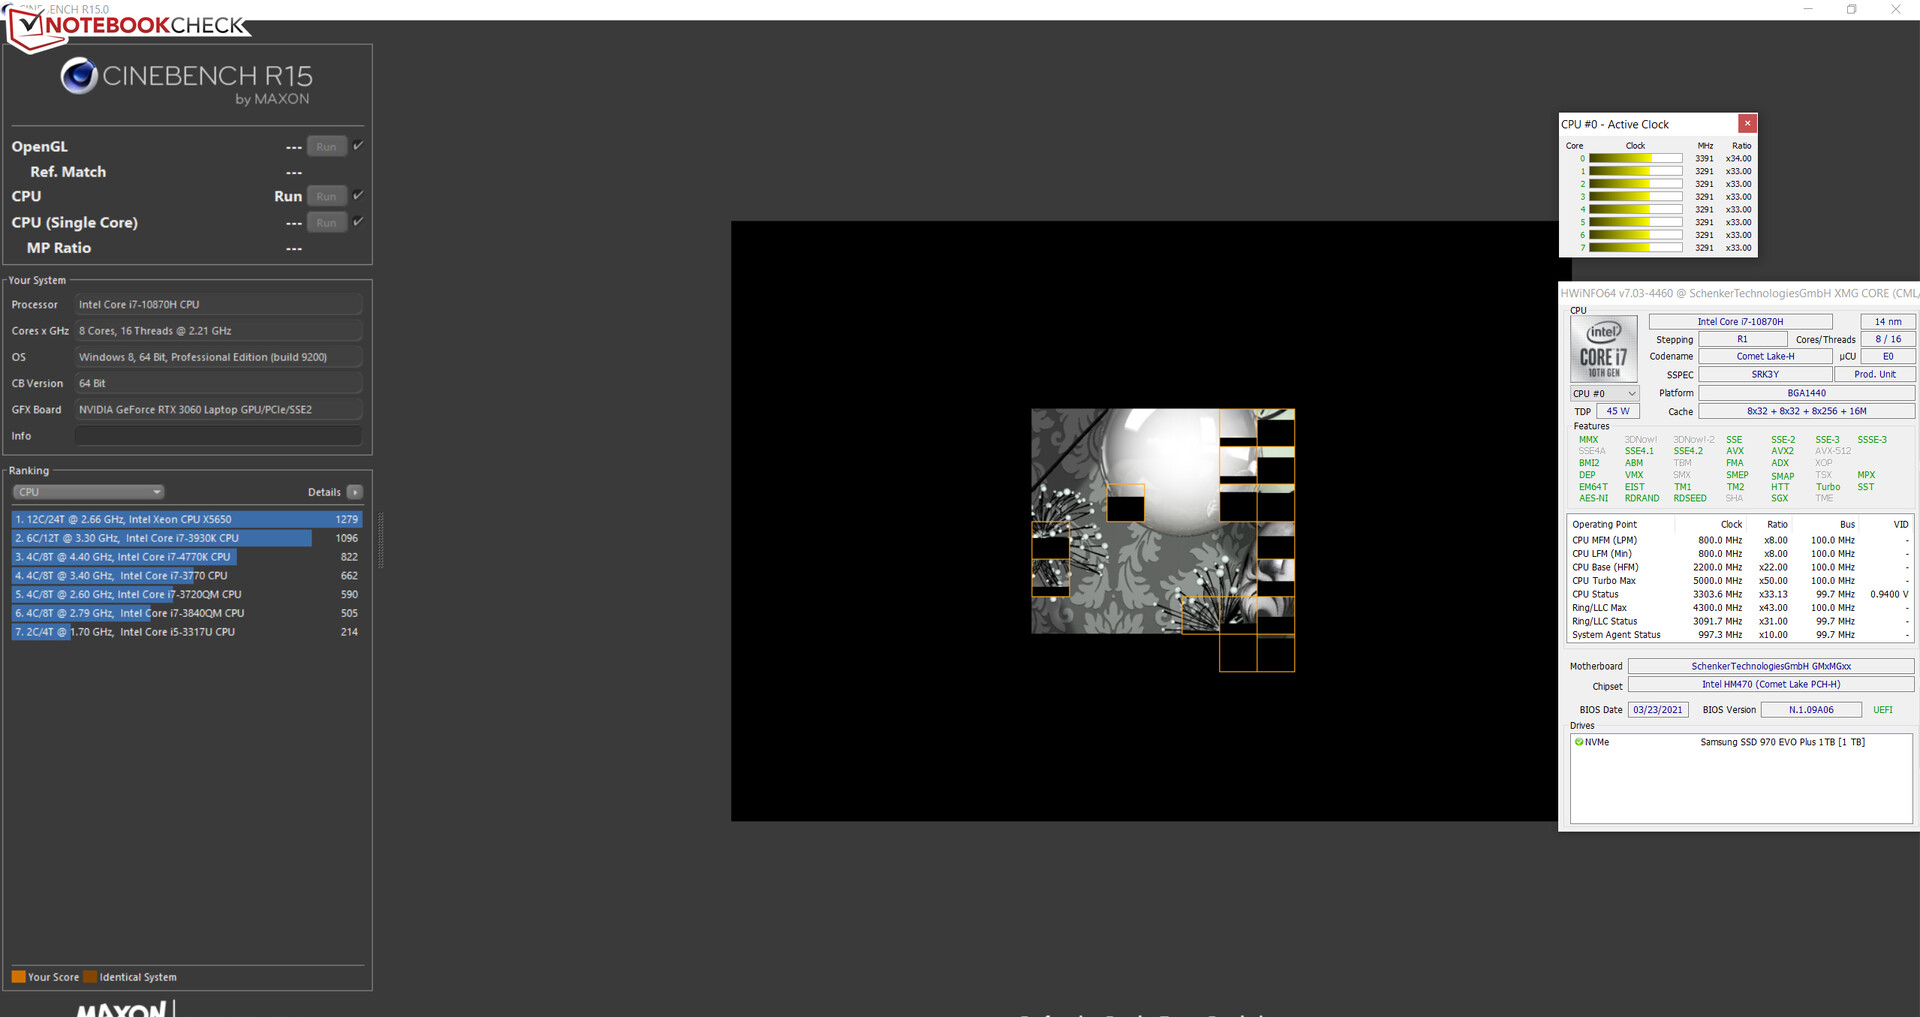
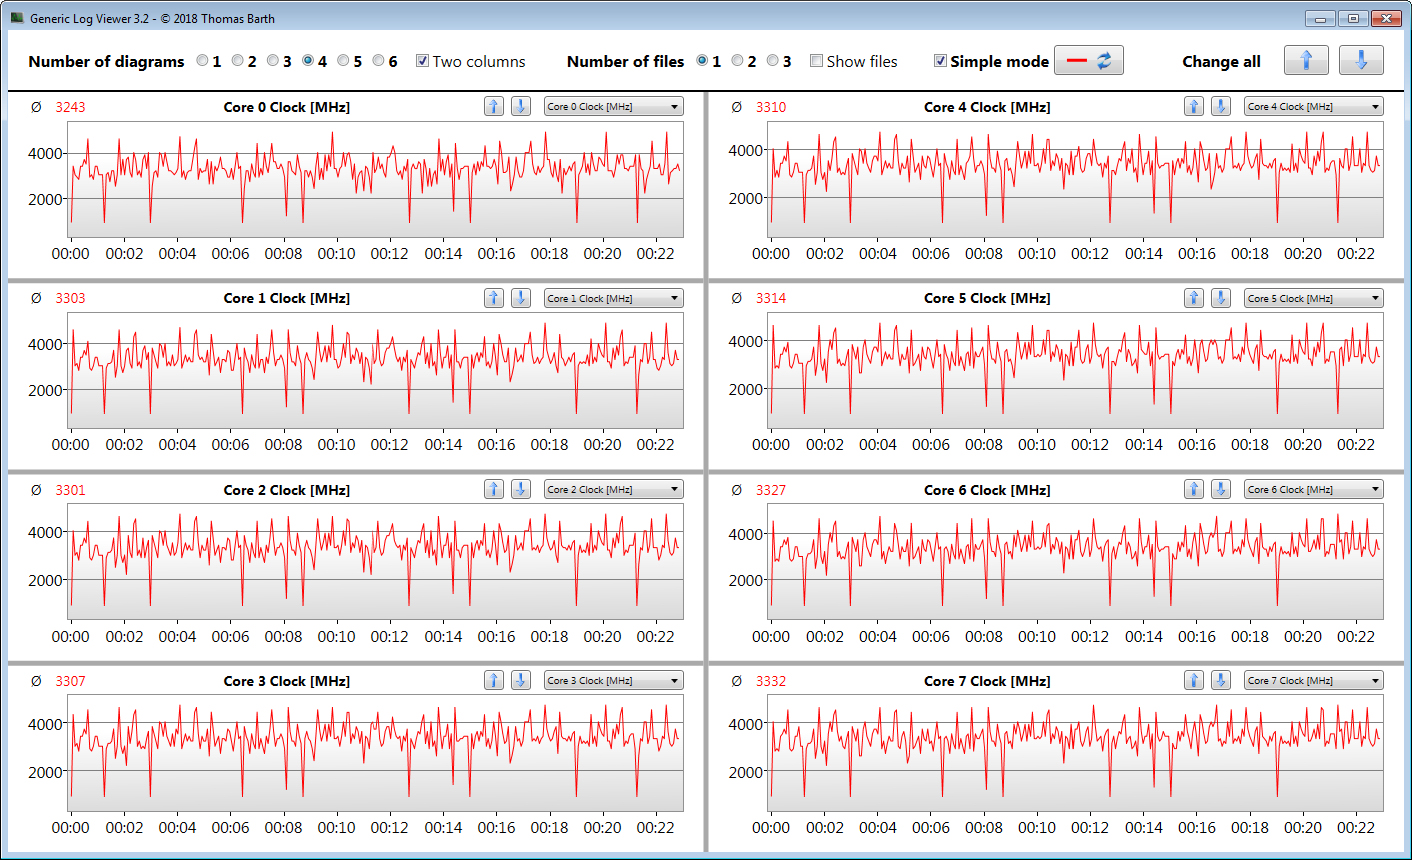
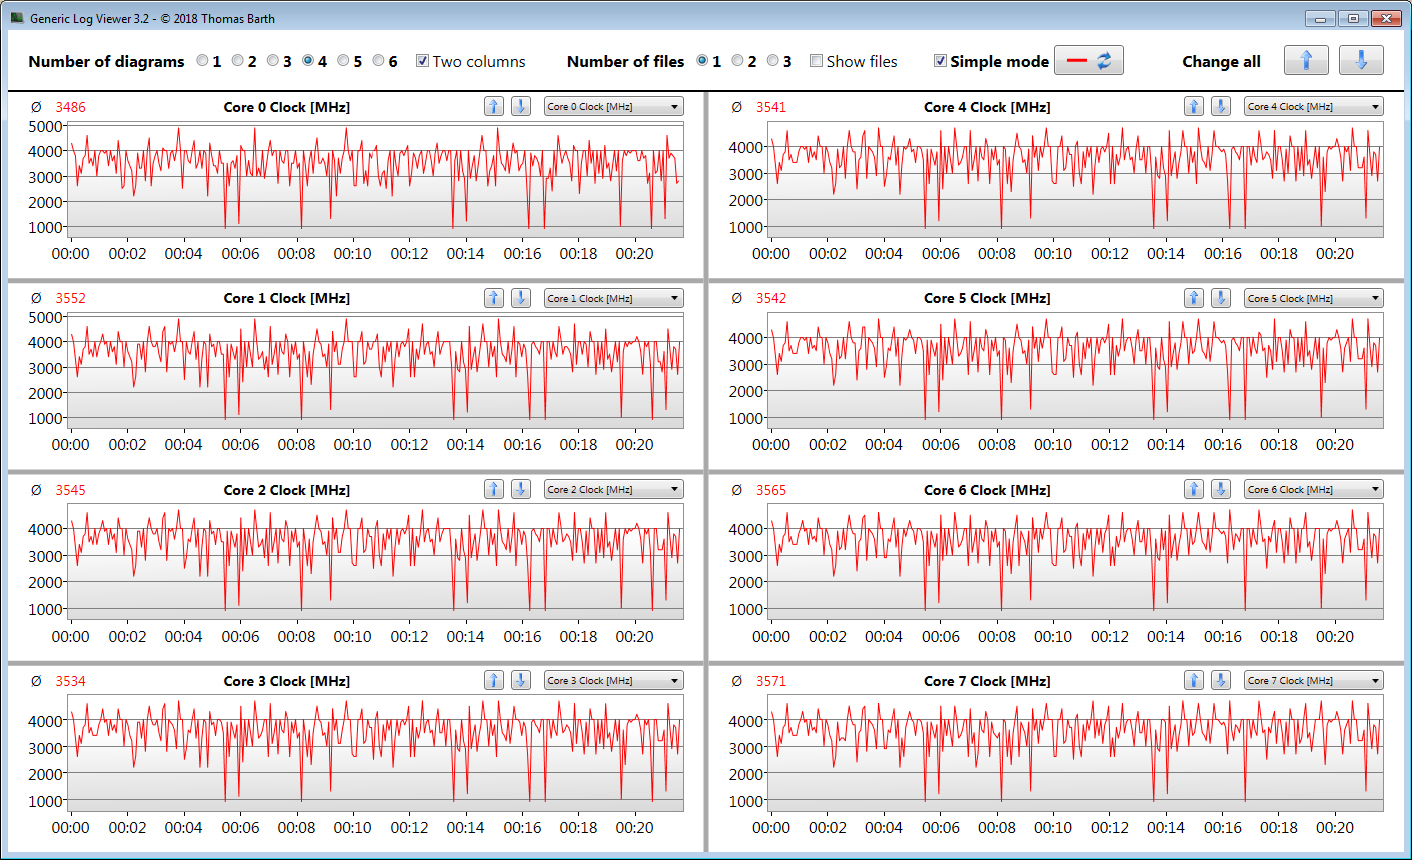
Evaluamos si el Turbo de la CPU también se utiliza constantemente en el funcionamiento de la red ejecutando la prueba multihilo del benchmark Cinebench R15 durante al menos 30 minutos en un bucle constante. El Turbo se utiliza a un nivel medio. El perfil de rendimiento "Overboost" sólo hace que la velocidad de reloj aumente ligeramente.
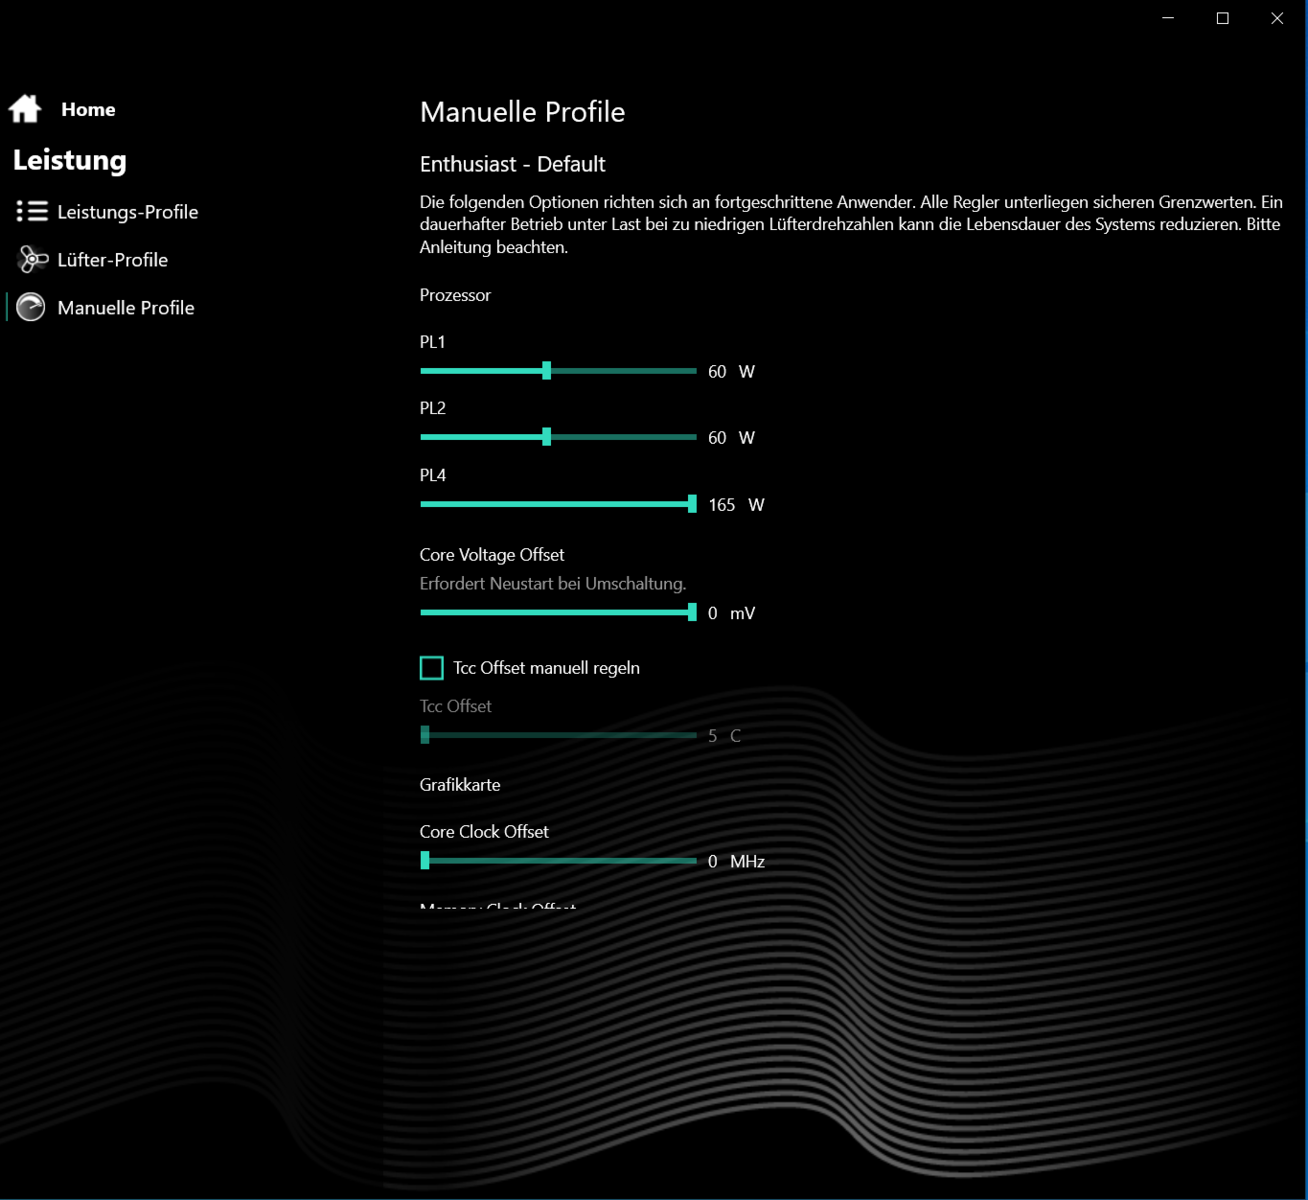
En general, el Core i7 no aprovecha plenamente sus capacidades en los benchmarks multihilo. Para sacarle más rendimiento, habría que aumentar los límites de potencia de la CPU, lo que sería posible a través del Centro de Control preinstalado, donde el máximo configurable sería de 120 vatios (PL1/PL2). También hemos ejecutado el bucle de la CB15 con esta configuración de rendimiento para probarlo, sin encontrarnos con ningún problema.
* ... más pequeño es mejor
Rendimiento del sistema
El sistema, rápido y fluido, también ofrecerá suficiente rendimiento durante los próximos años para las áreas de aplicación más exigentes, como los juegos y el procesamiento de vídeo e imágenes. Los resultados de PC-Mark también son buenos.
| PCMark 8 Home Score Accelerated v2 | 4073 puntos | |
| PCMark 8 Creative Score Accelerated v2 | 5816 puntos | |
| PCMark 8 Work Score Accelerated v2 | 5375 puntos | |
| PCMark 10 Score | 5685 puntos | |
ayuda | ||
Latencias del CPD
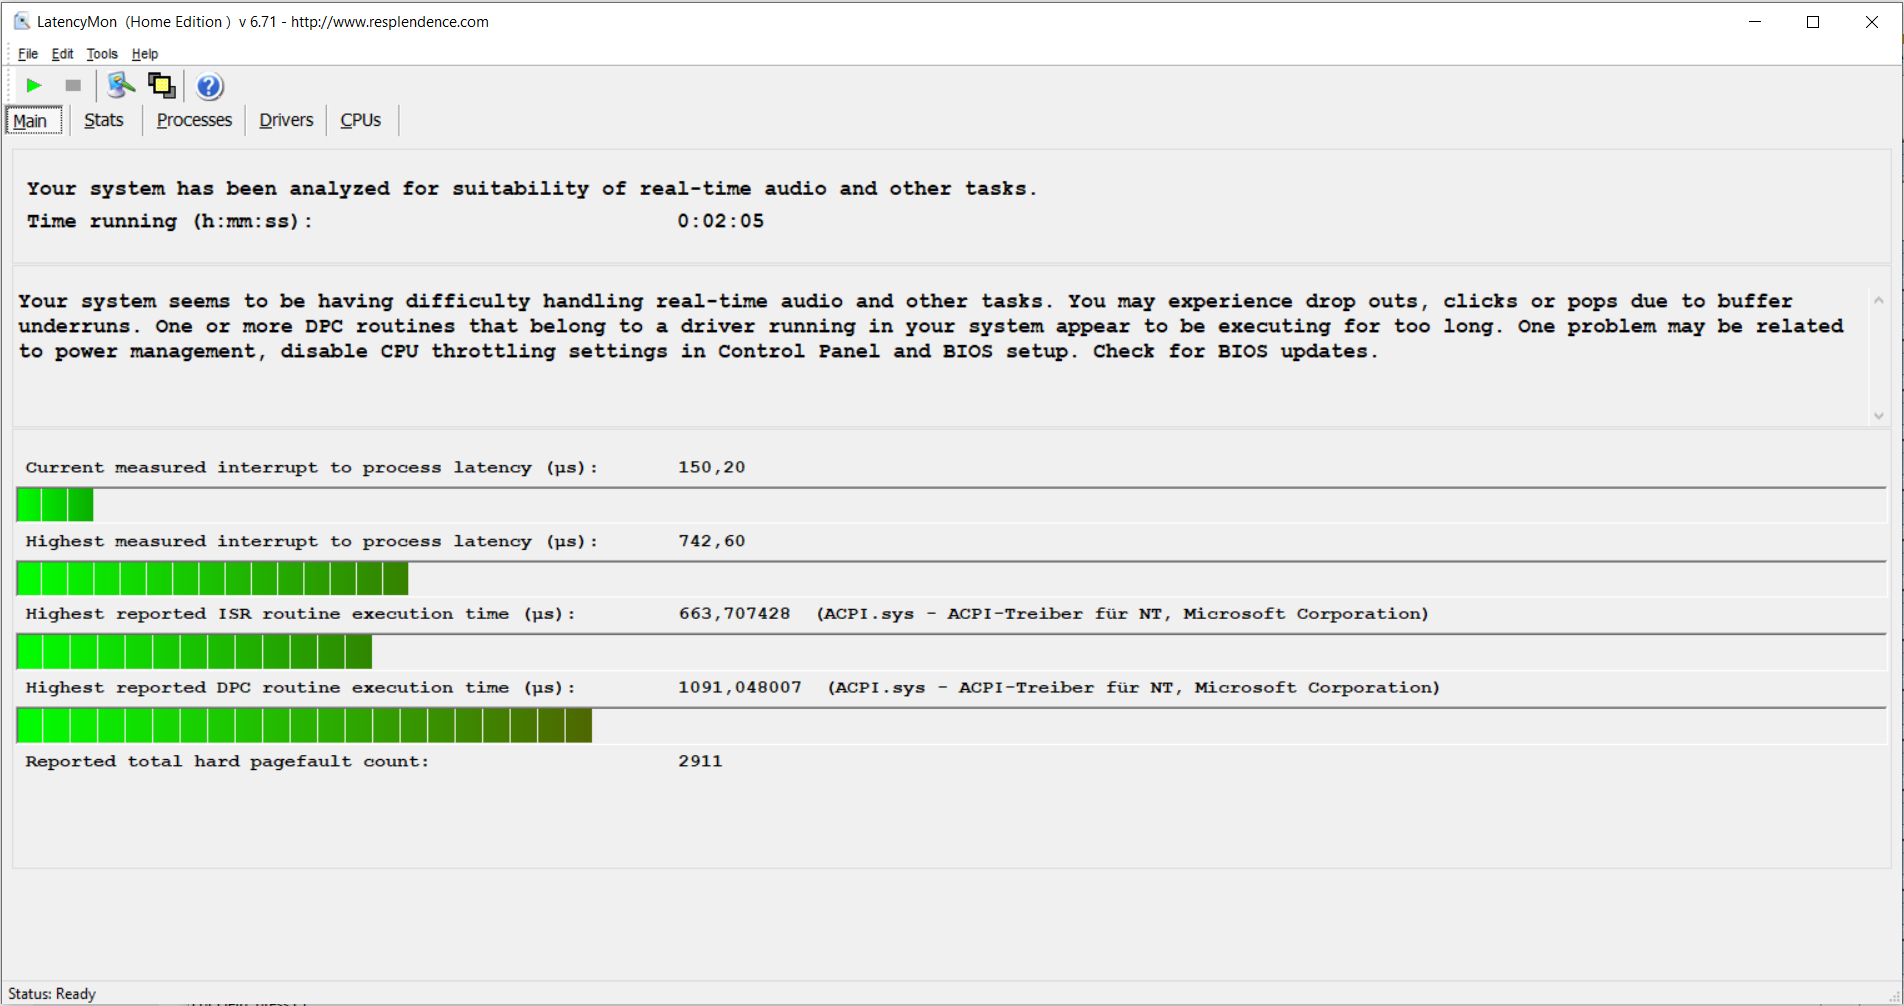
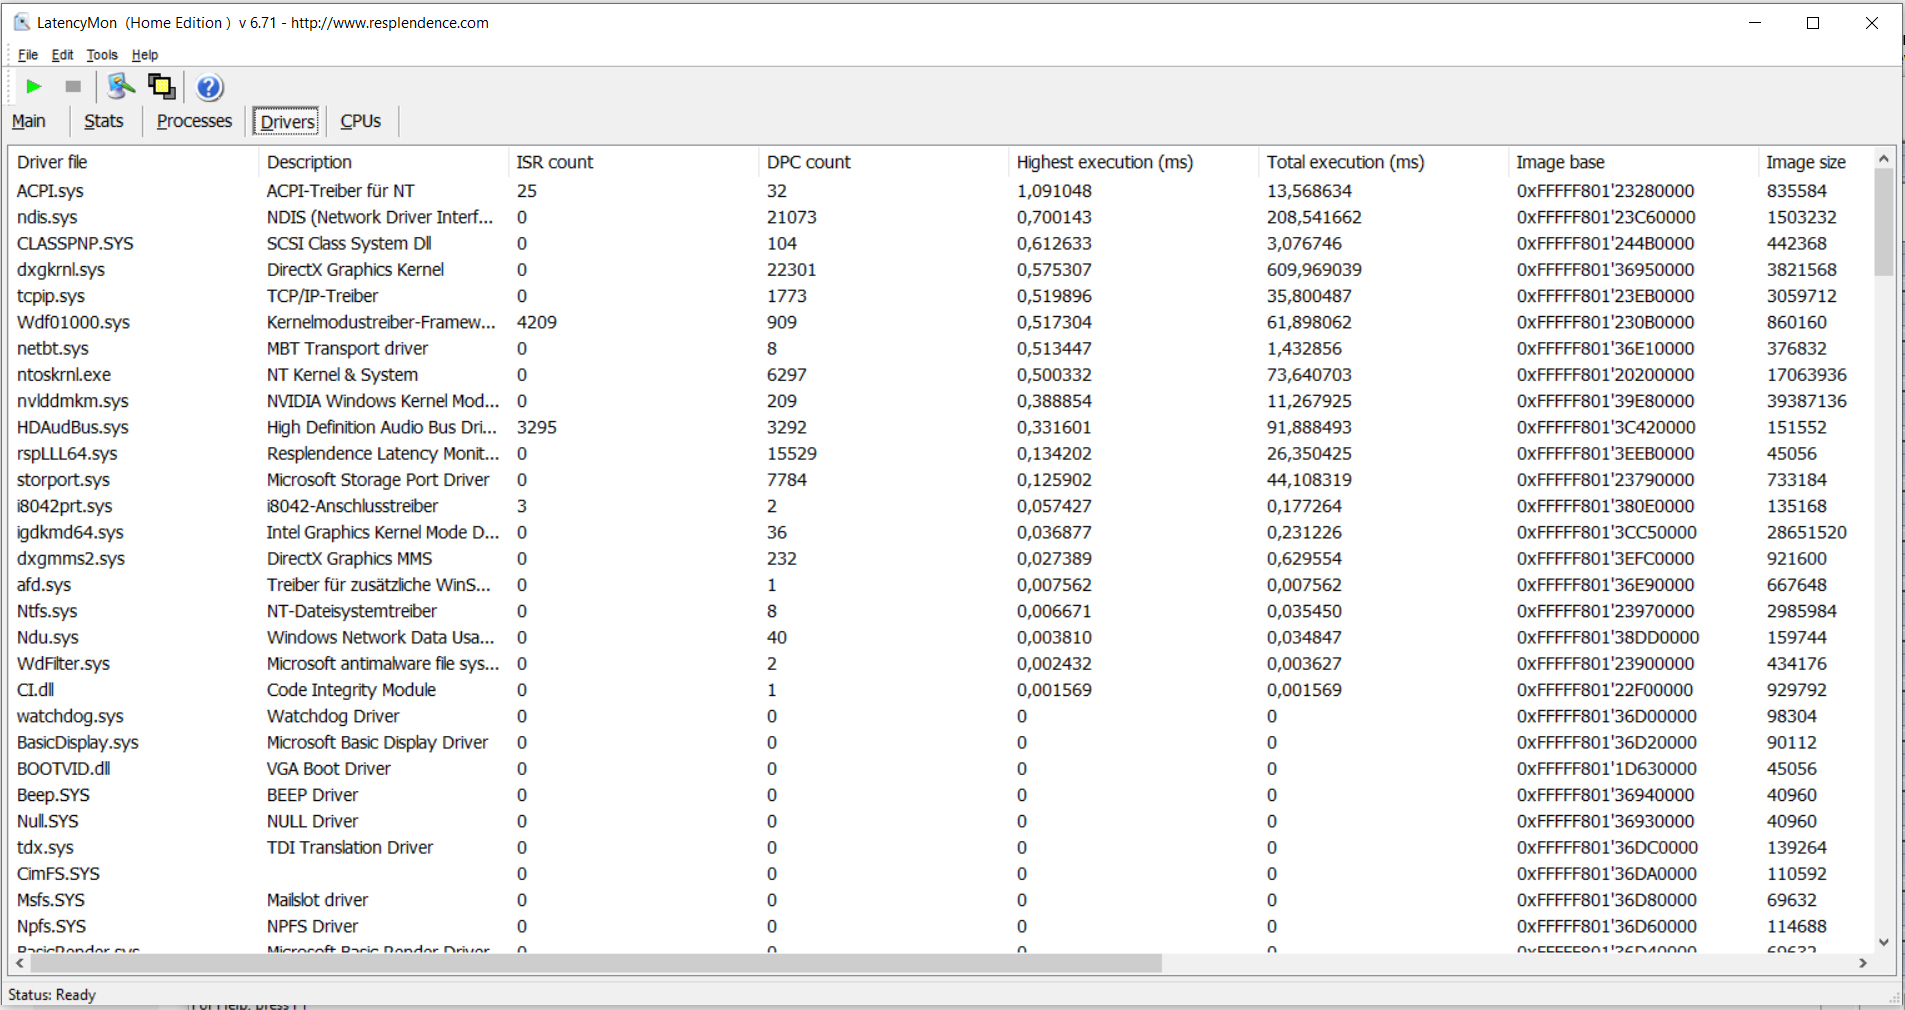
En nuestra prueba estandarizada de Latency Monitor (navegación web, reproducción de vídeo 4K, carga alta de Prime95), pudimos observar un comportamiento llamativo en cuanto a las latencias del CPD. Esto significa que el sistema no parece ser adecuado para el procesamiento de vídeo y audio en tiempo real
| DPC Latencies / LatencyMon - interrupt to process latency (max), Web, Youtube, Prime95 | |
| MSI Alpha 17 A4DEK | |
| Schenker XMG Core 17 Comet Lake | |
| Medion Erazer Beast X10 MD61804 | |
| Schenker XMG Core 17 (Early 2021) | |
| Acer Predator Helios 300 PH317-54-75G8 | |
* ... más pequeño es mejor
Solución de almacenamiento
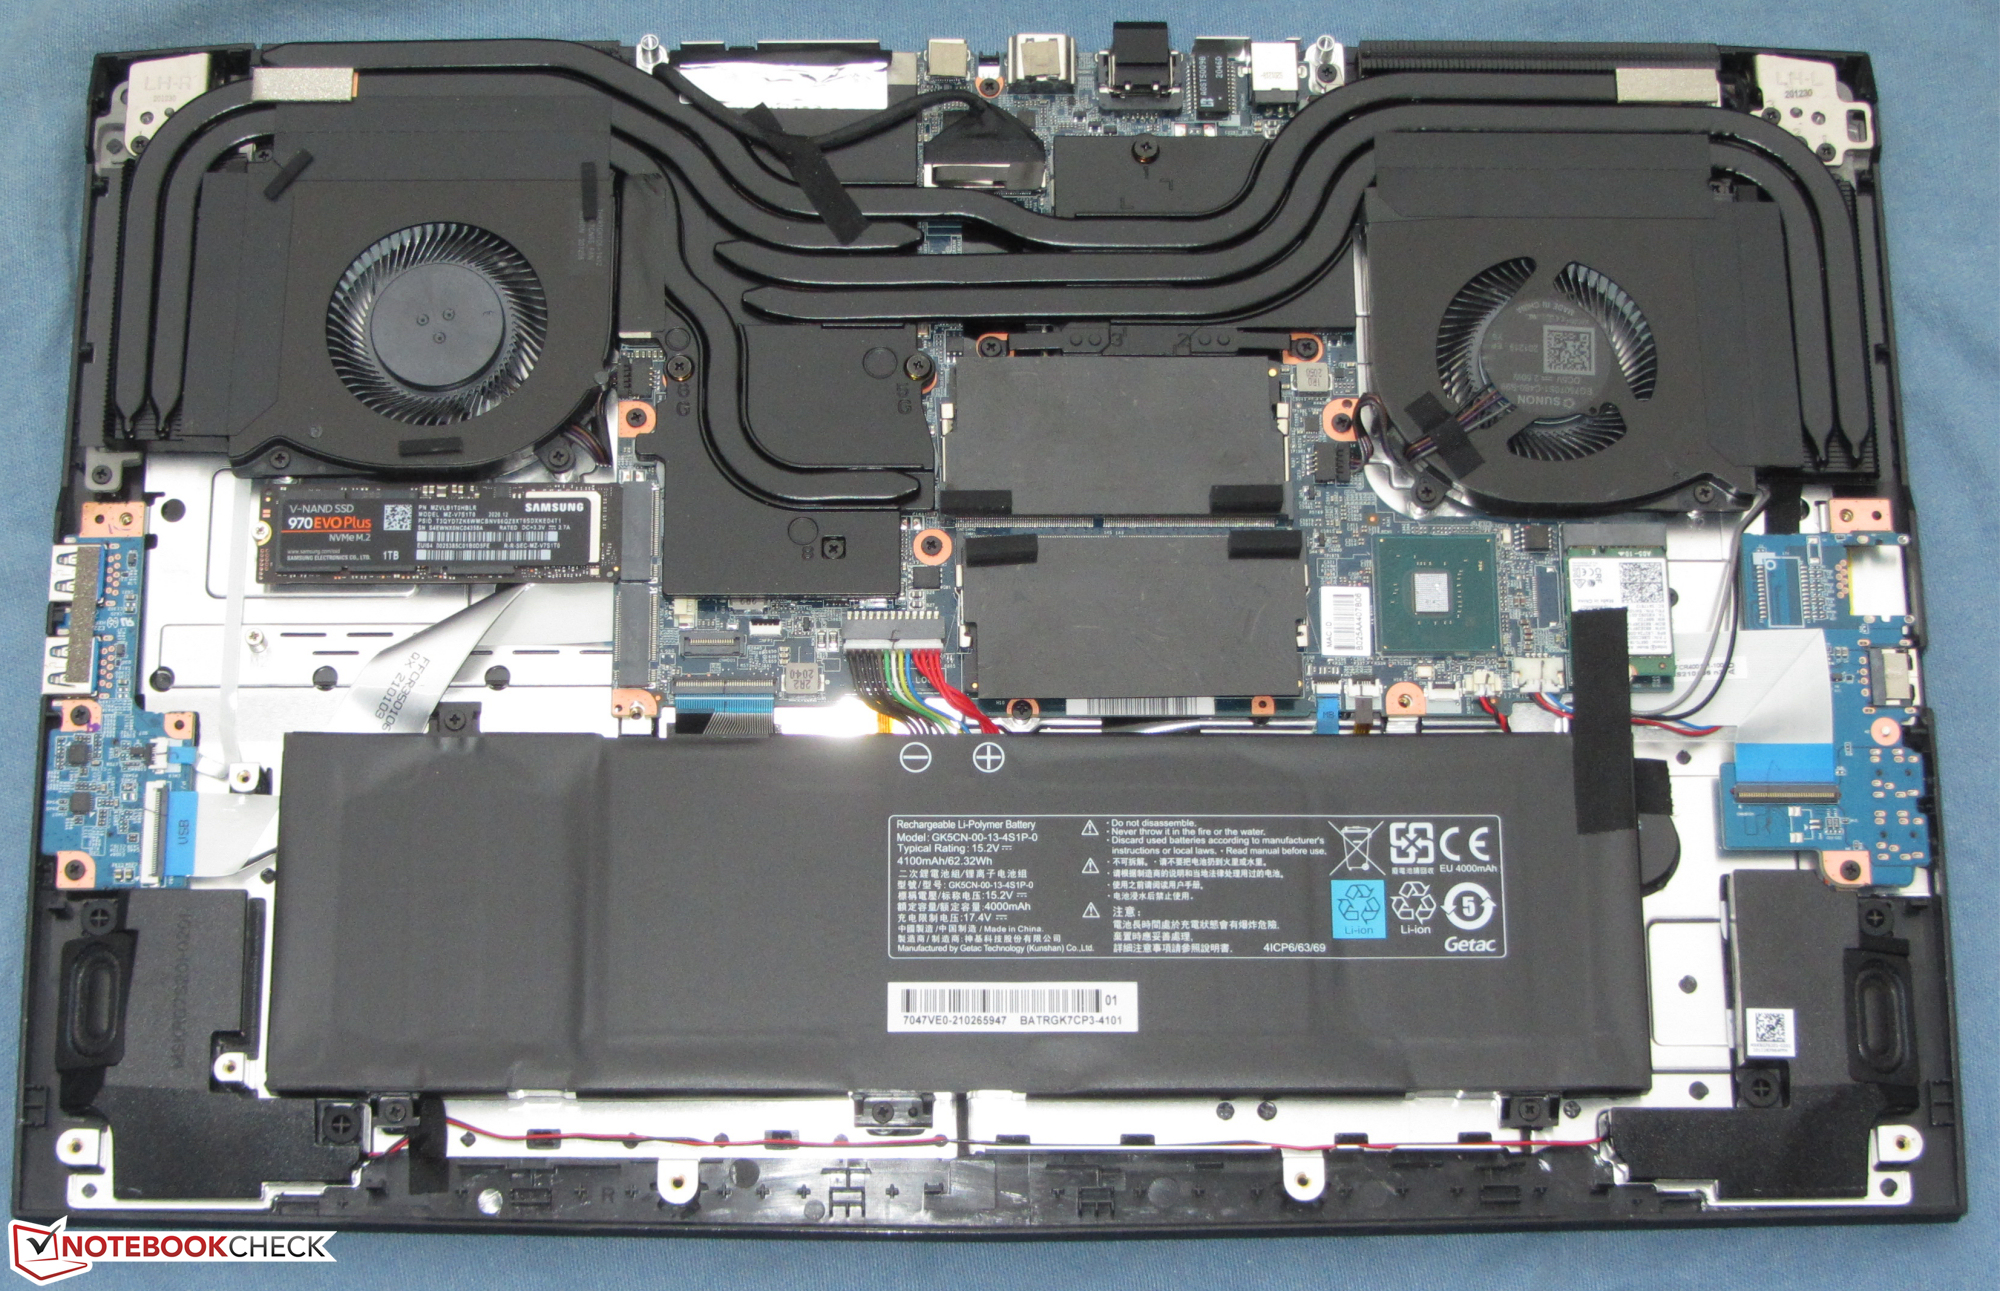
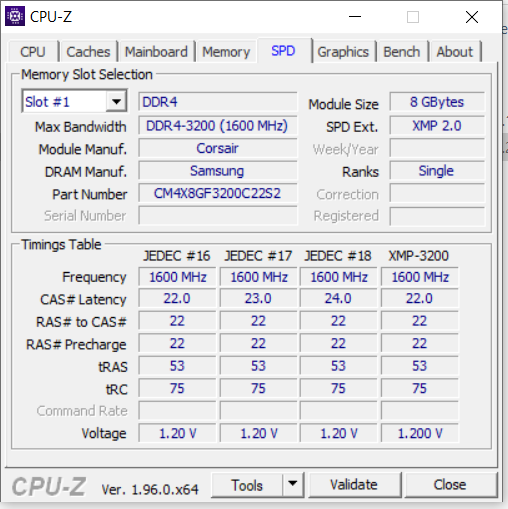
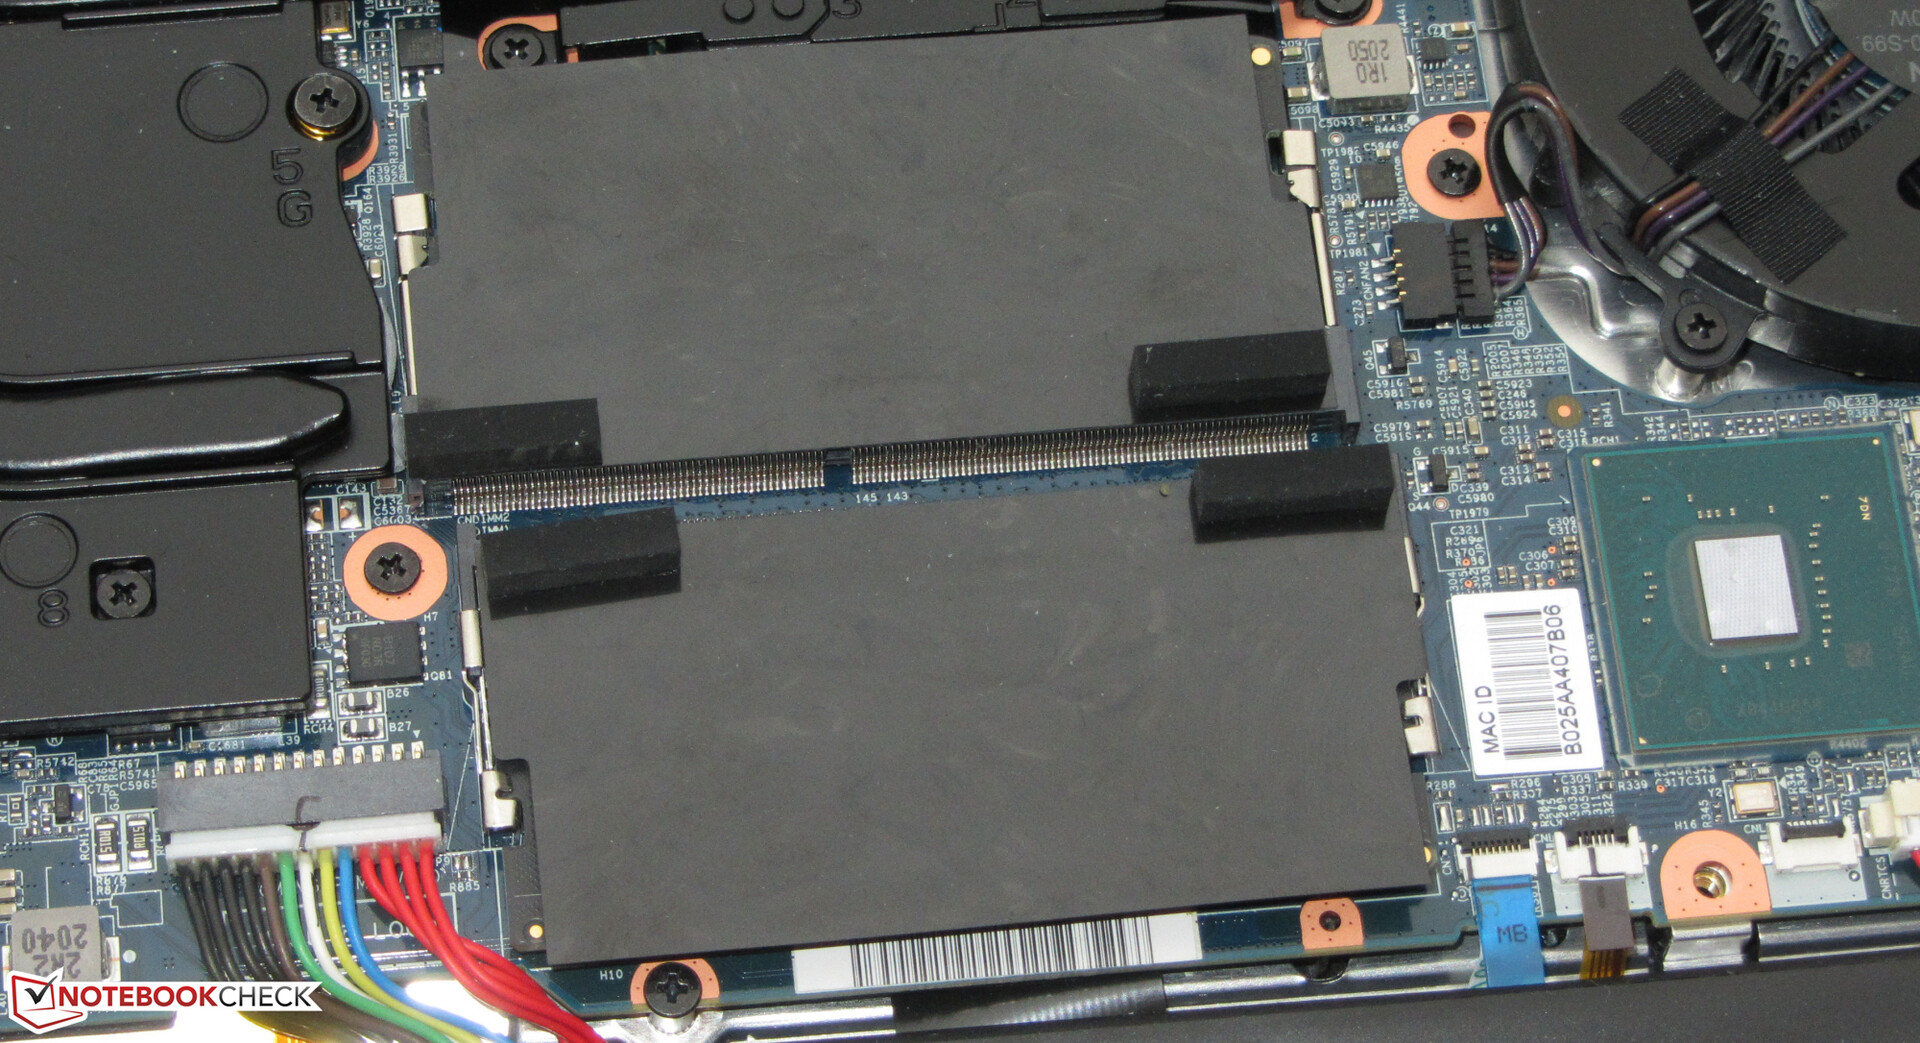
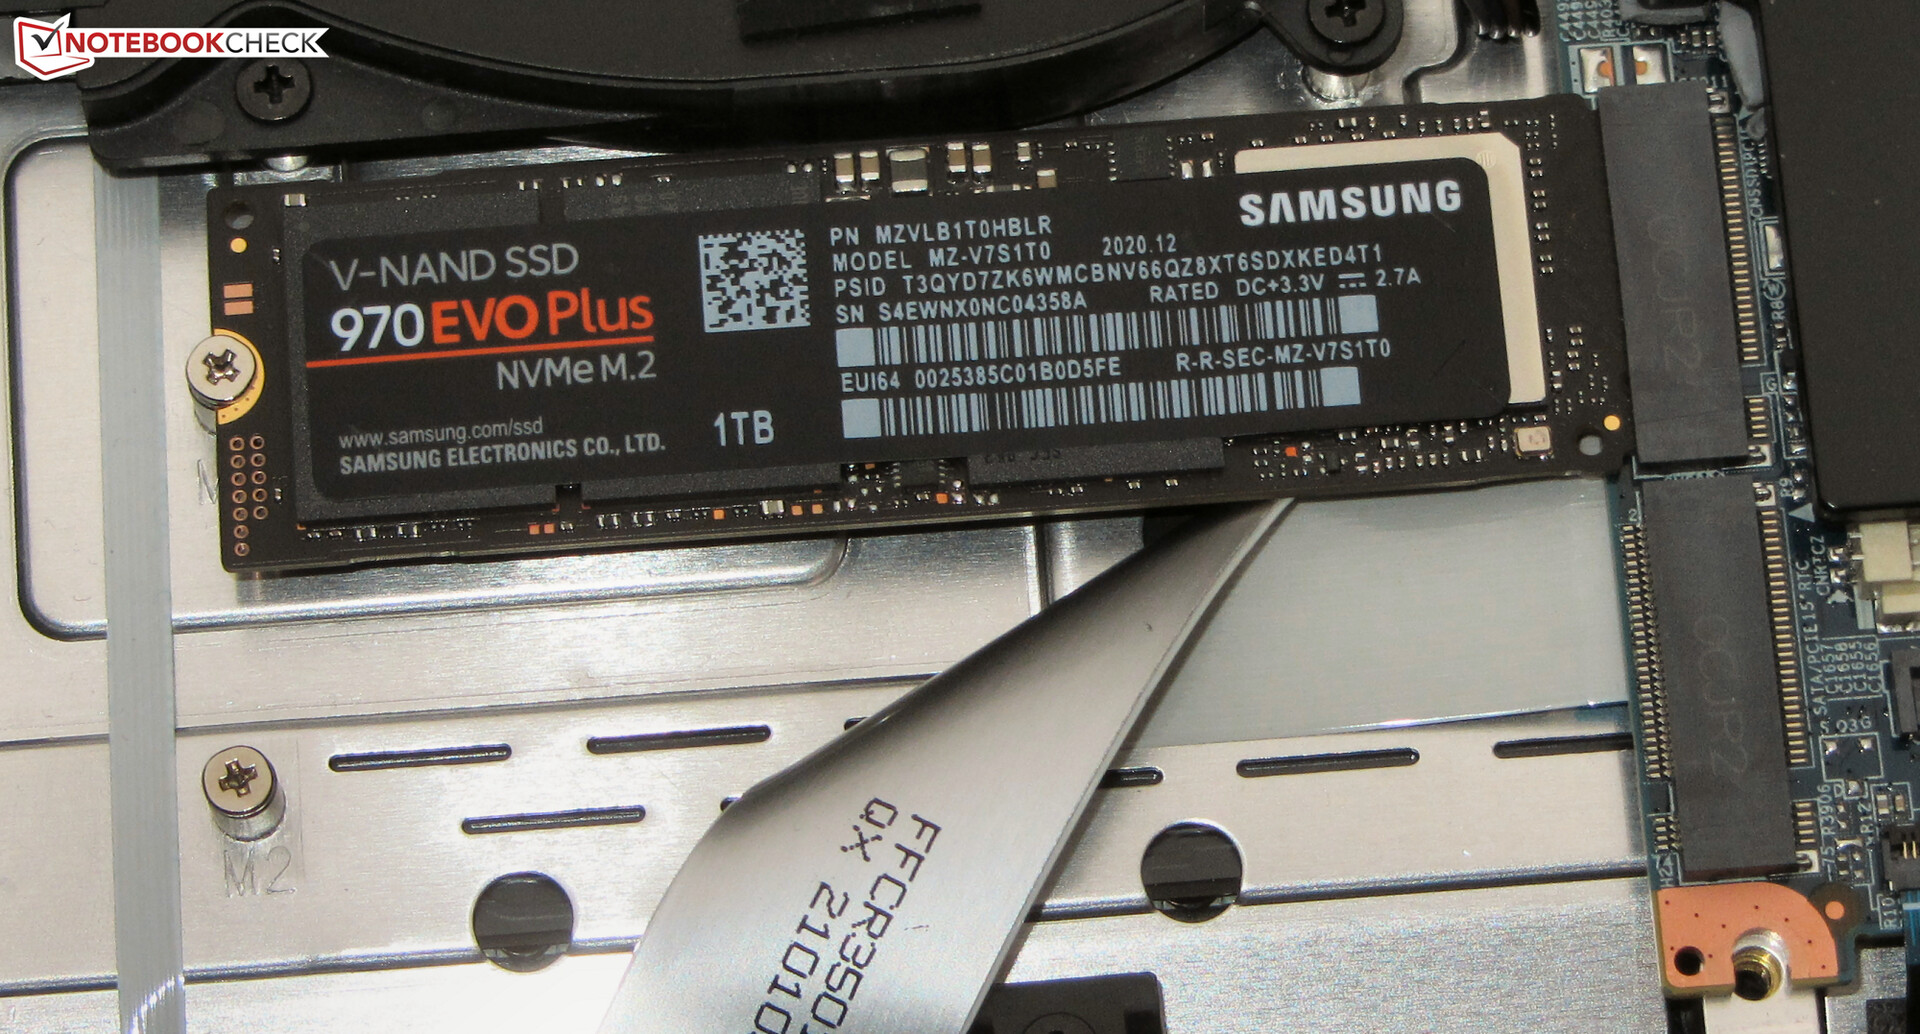
Un SSD NVMe (M.2-2280) de Samsung sirve como unidad de sistema. Ofrece 1 TB de almacenamiento y ofrece buenas tasas de transferencia. El portátil puede aceptar un total de dos SSDs NVMe, y soporta RAID-0.

| Schenker XMG Core 17 (Early 2021) Samsung SSD 970 EVO Plus 1TB | MSI Alpha 17 A4DEK Kingston OM8PCP3512F-AB | Acer Predator Helios 300 PH317-54-75G8 WDC PC SN730 SDBQNTY-1T00 | Medion Erazer Beast X10 MD61804 Samsung PM981a MZVLB1T0HBLR | Schenker XMG Core 17 Samsung SSD 970 EVO Plus 500GB | Schenker XMG Core 17 Comet Lake Samsung SSD 970 EVO Plus 1TB | |
|---|---|---|---|---|---|---|
| CrystalDiskMark 5.2 / 6 | -31% | -12% | -17% | -29% | 4% | |
| Write 4K (MB/s) | 145.7 | 204.7 40% | 141.9 -3% | 151 4% | 99.3 -32% | 169.5 16% |
| Read 4K (MB/s) | 51.3 | 50.4 -2% | 48.75 -5% | 49.29 -4% | 38.47 -25% | 51.5 0% |
| Write Seq (MB/s) | 3036 | 985 -68% | 2734 -10% | 1109 -63% | 1449 -52% | 3009 -1% |
| Read Seq (MB/s) | 2837 | 1193 -58% | 1921 -32% | 1049 -63% | 1237 -56% | 2959 4% |
| Write 4K Q32T1 (MB/s) | 511 | 537 5% | 422.6 -17% | 494.4 -3% | 364.4 -29% | 536 5% |
| Read 4K Q32T1 (MB/s) | 582 | 300 -48% | 509 -13% | 569 -2% | 421.9 -28% | 621 7% |
| Write Seq Q32T1 (MB/s) | 3294 | 982 -70% | 3055 -7% | 3017 -8% | 3276 -1% | 3339 1% |
| Read Seq Q32T1 (MB/s) | 3522 | 1985 -44% | 3257 -8% | 3542 1% | 3338 -5% | 3561 1% |
| AS SSD | -43% | -11% | -3% | -20% | 11% | |
| Seq Read (MB/s) | 2876 | 251.9 -91% | 2828 -2% | 2470 -14% | 2283 -21% | 2937 2% |
| Seq Write (MB/s) | 2803 | 925 -67% | 2677 -4% | 2473 -12% | 2779 -1% | 2858 2% |
| 4K Read (MB/s) | 55.3 | 58.2 5% | 39.94 -28% | 50.2 -9% | 29.99 -46% | 50.3 -9% |
| 4K Write (MB/s) | 106.9 | 98 -8% | 100.9 -6% | 124.4 16% | 99.1 -7% | 130.6 22% |
| 4K-64 Read (MB/s) | 1662 | 461.4 -72% | 1562 -6% | 1711 3% | 1156 -30% | 1710 3% |
| 4K-64 Write (MB/s) | 2101 | 924 -56% | 1867 -11% | 1848 -12% | 2333 11% | 2355 12% |
| Access Time Read * (ms) | 0.067 | 0.09 -34% | 0.039 42% | 0.092 -37% | 0.037 45% | |
| Access Time Write * (ms) | 0.037 | 0.022 41% | 0.037 -0% | 0.029 22% | 0.037 -0% | 0.028 24% |
| Score Read (Points) | 2005 | 545 -73% | 1885 -6% | 2008 0% | 1414 -29% | 2054 2% |
| Score Write (Points) | 2488 | 1114 -55% | 2236 -10% | 2220 -11% | 2710 9% | 2771 11% |
| Score Total (Points) | 5520 | 1994 -64% | 5076 -8% | 5257 -5% | 4871 -12% | 5873 6% |
| Copy ISO MB/s (MB/s) | 2029 | 1870 -8% | 1909 -6% | 1394 -31% | 2225 10% | |
| Copy Program MB/s (MB/s) | 691 | 545 -21% | 588 -15% | 379.8 -45% | 779 13% | |
| Copy Game MB/s (MB/s) | 1513 | 1083 -28% | 975 -36% | 976 -35% | 1590 5% | |
| Media total (Programa/Opciones) | -37% /
-38% | -12% /
-11% | -10% /
-8% | -25% /
-23% | 8% /
8% |
* ... más pequeño es mejor
Constant Performance Reads: DiskSpd Read Loop, Queue Depth 8
Tarjeta gráfica
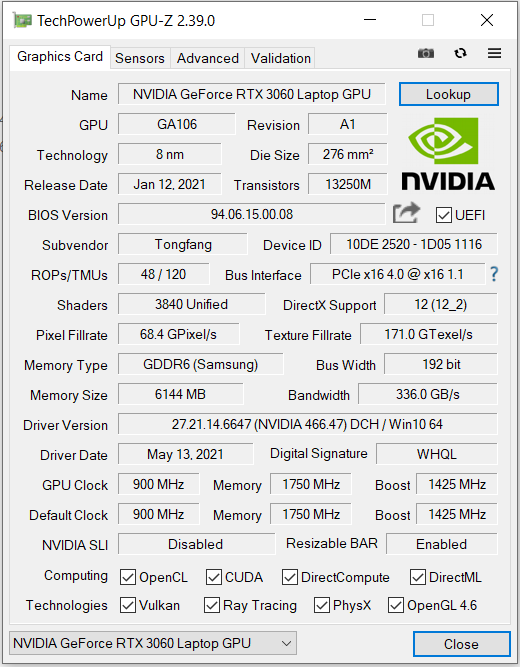
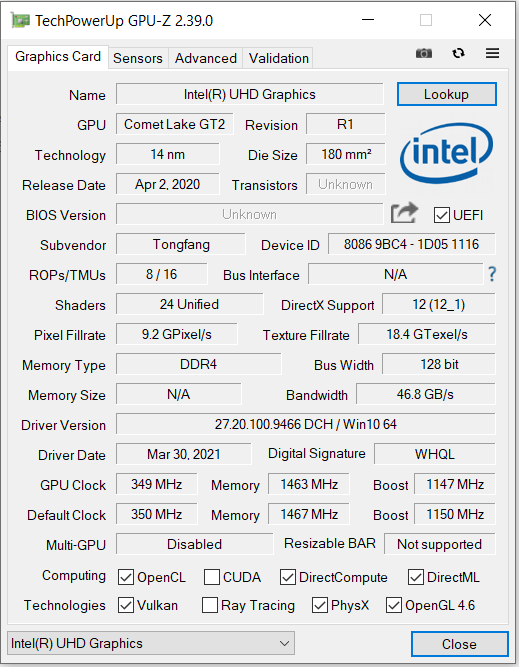
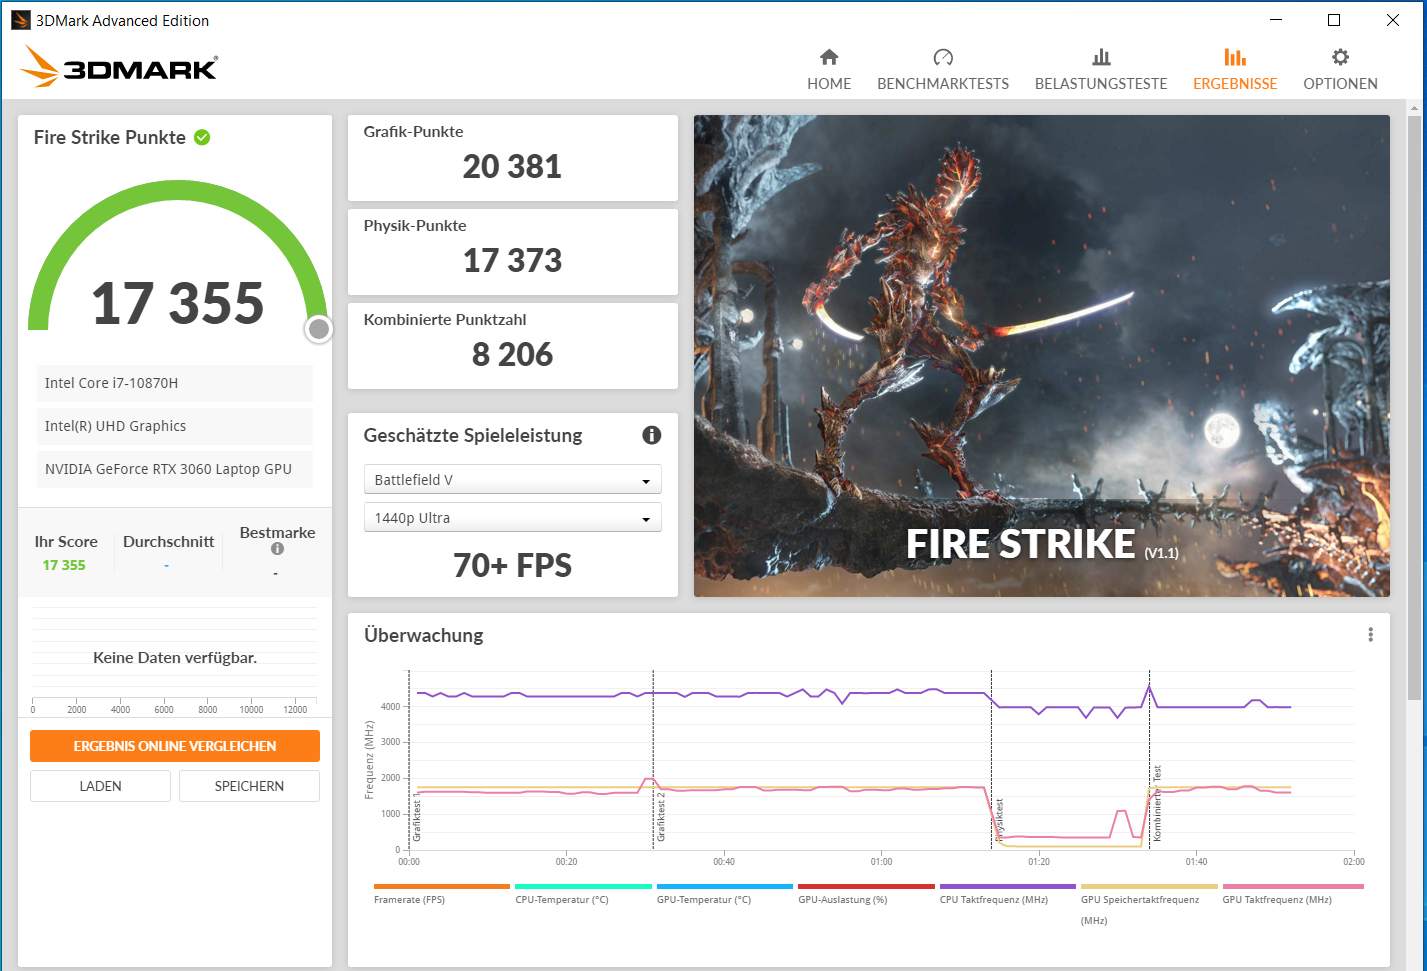
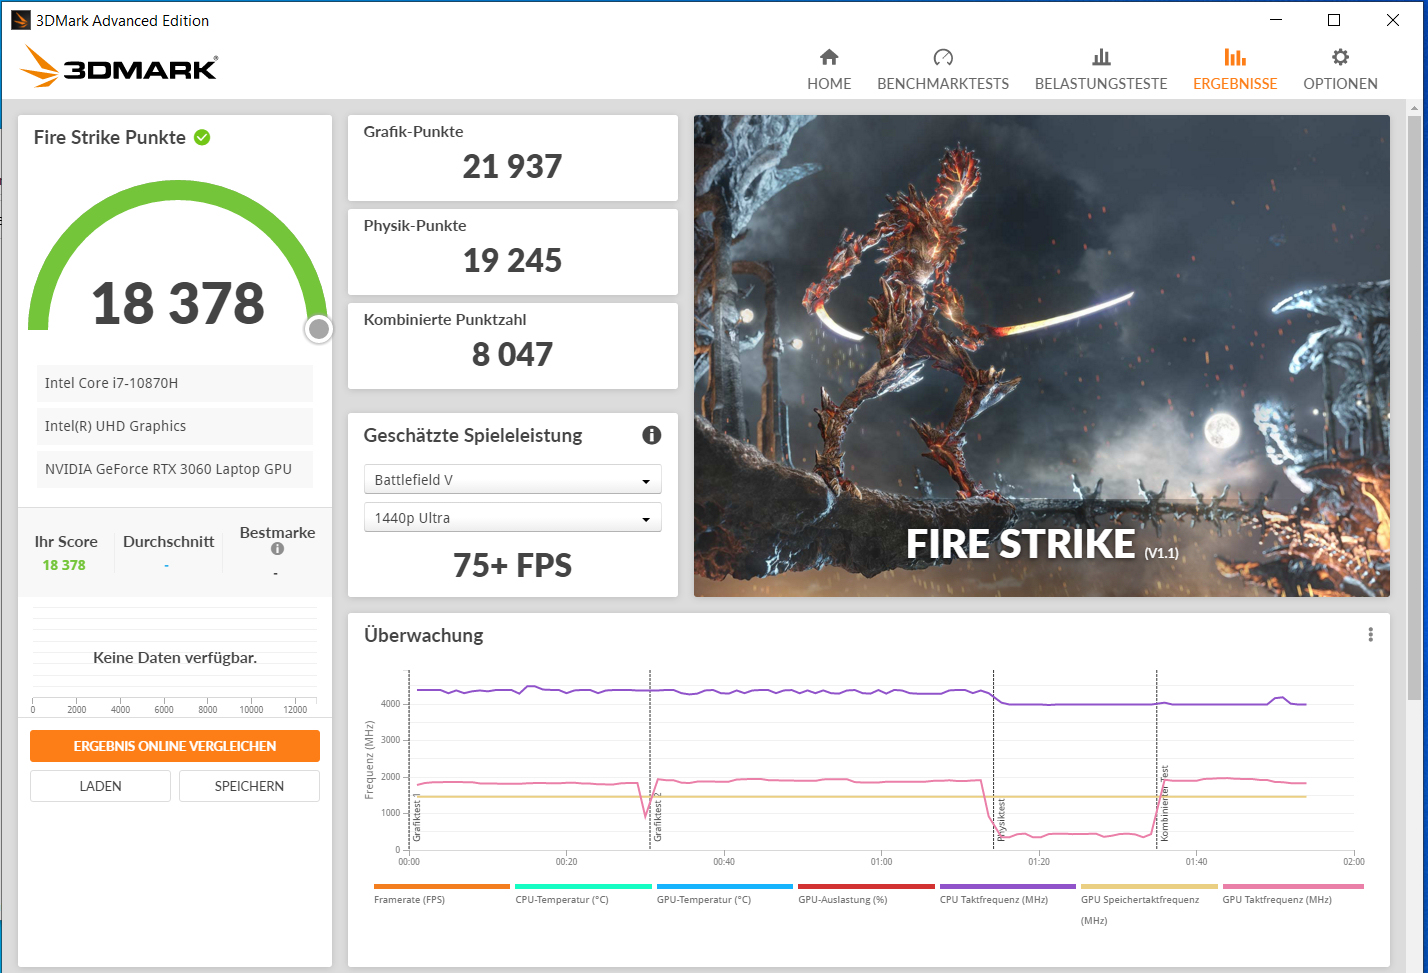
ElGeForce RTX-3060representa el actual modelo de entrada de Nvidia en la gama alta de GPUs. La GPU es capaz de utilizar el rápido almacenamiento de gráficos GDDR6 (6144 MB). El UHD Graphics-630integrado en el procesador está activo, y el portátil utiliza la solución de conmutación de gráficos Optimus de Nvidia. La GPU GeForce puede desactivarse en la BIOS.
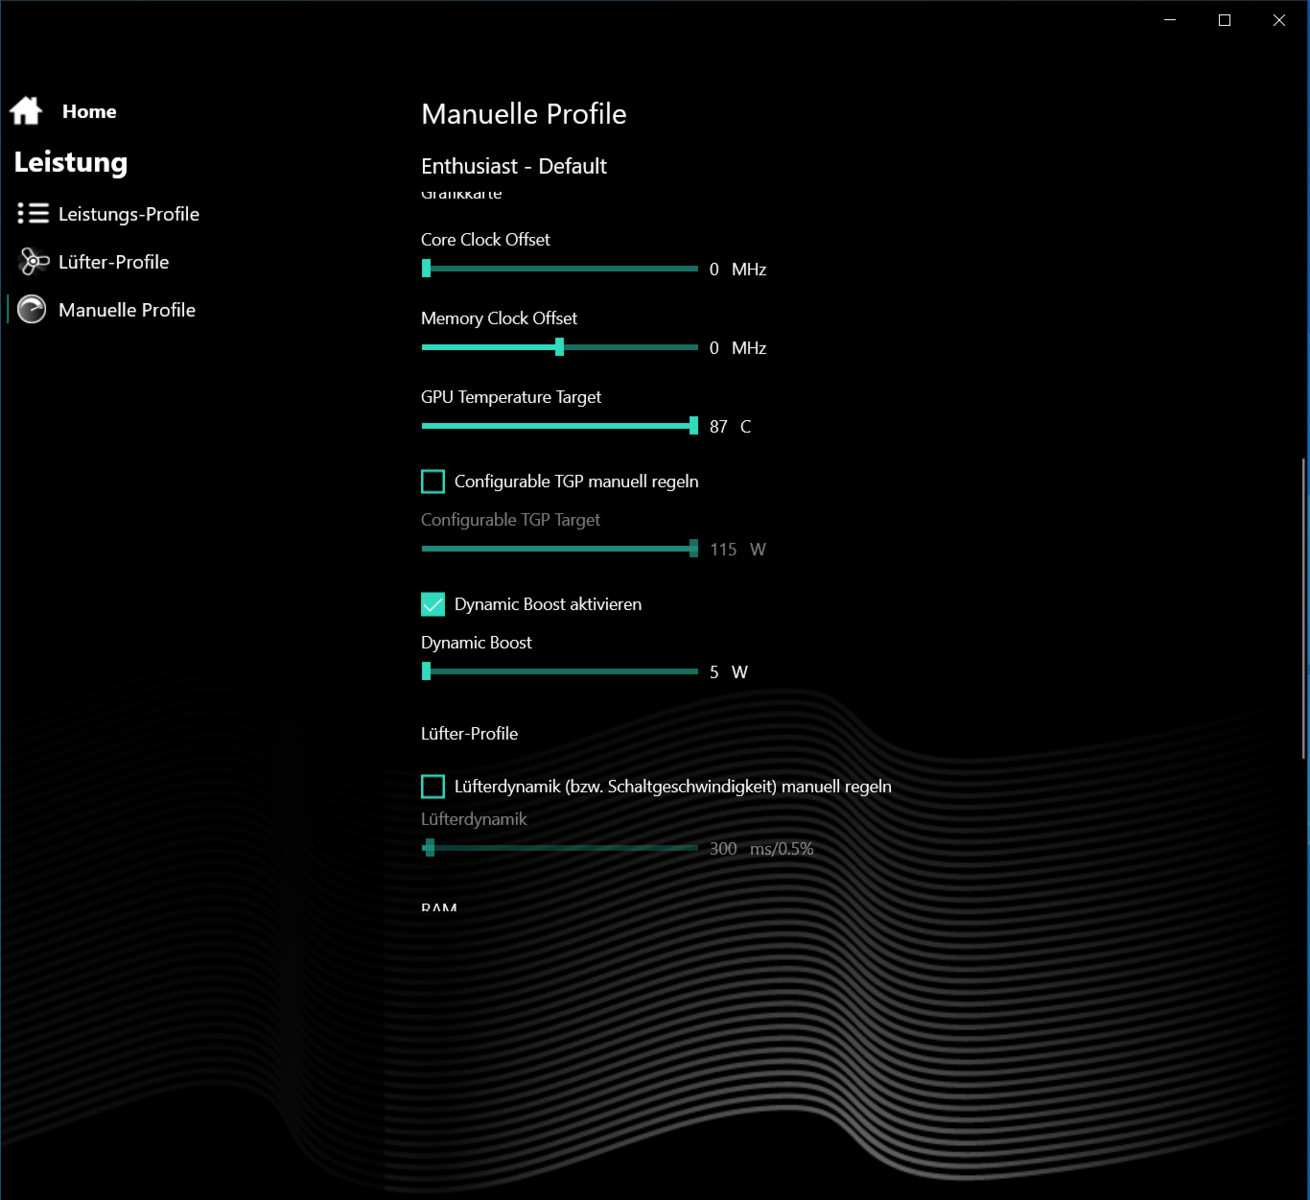
Los fabricantes de portátiles pueden configurar el TGP y con ello el rendimiento informático máximo disponible de un núcleo gráfico RTX 3000 con bastante libertad siempre que se mantengan dentro de los límites definidos por Nvidia (Resumen de todos los portátiles RTX 3060 incluyendo sus TGPs). Schenker extiende esta opción a los usuarios, permitiéndoles ajustar libremente el TGP hasta un máximo de 130 vatios (115 vatios + 15 vatios de Dynamic Boost).
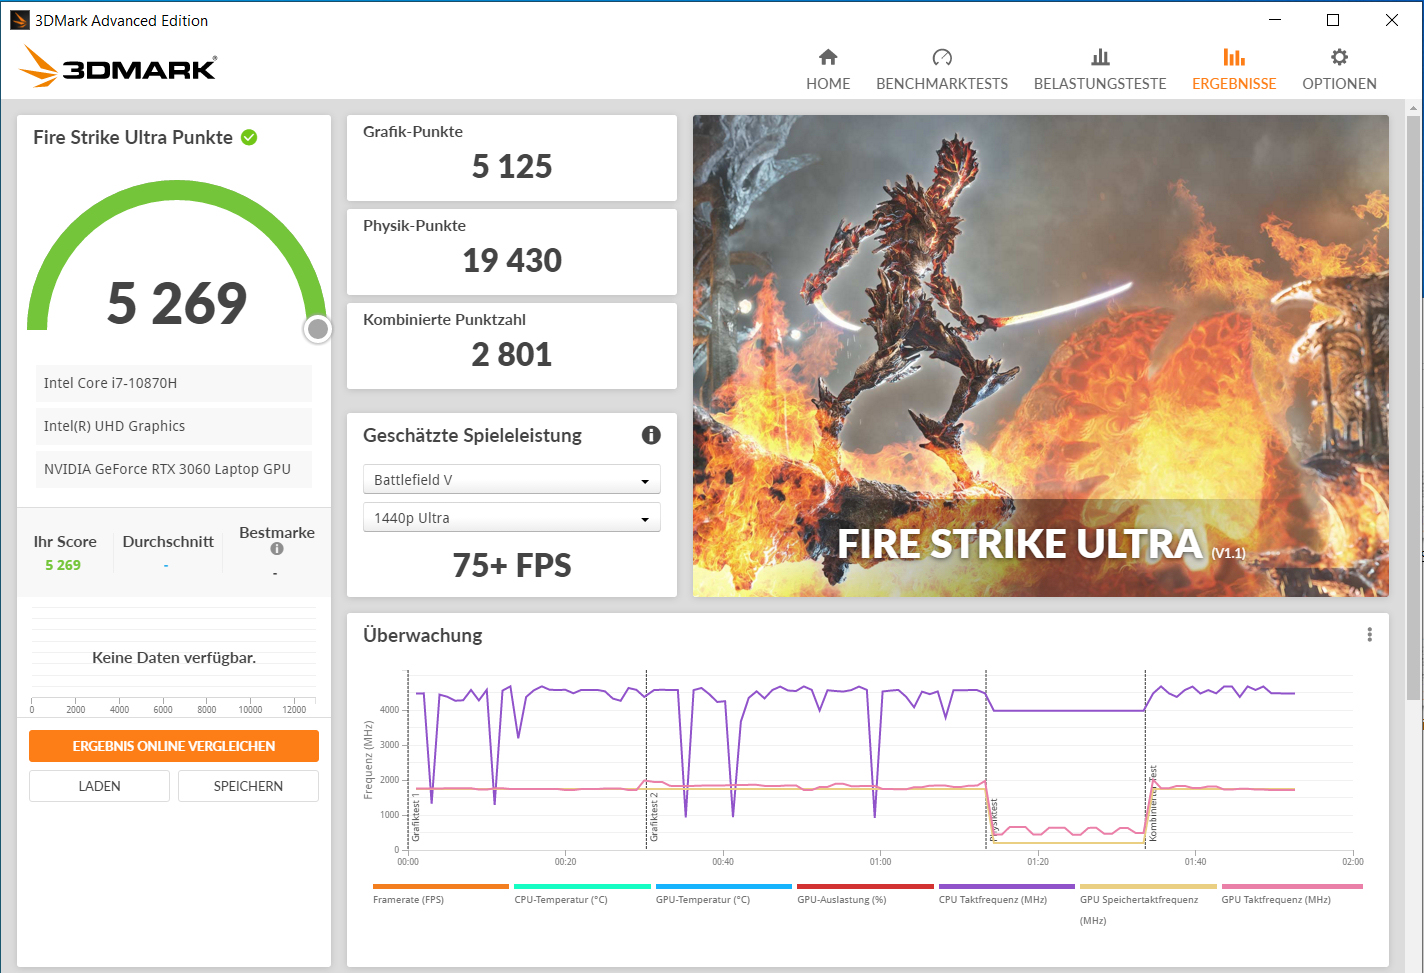
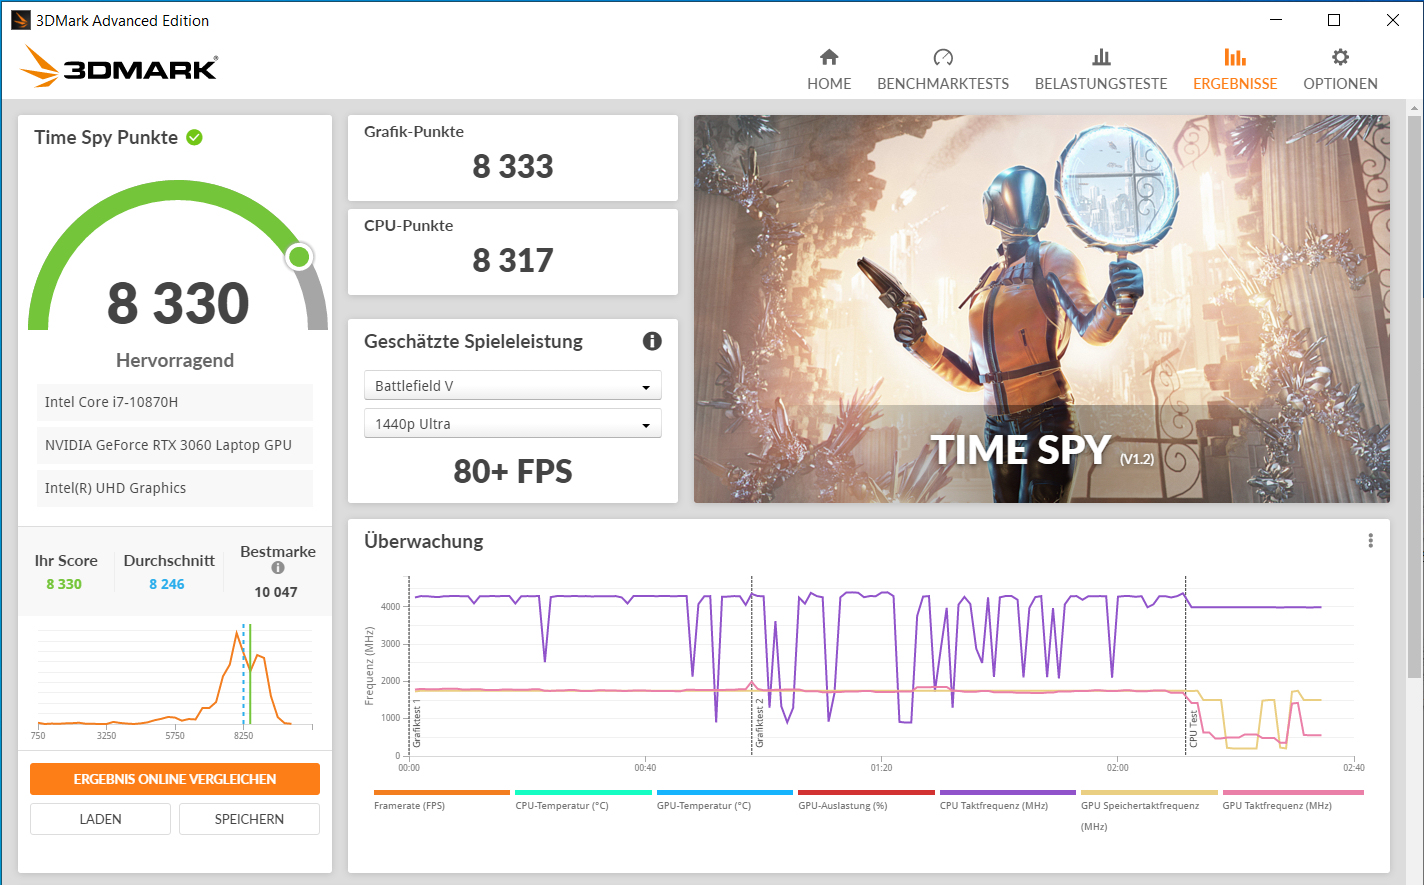
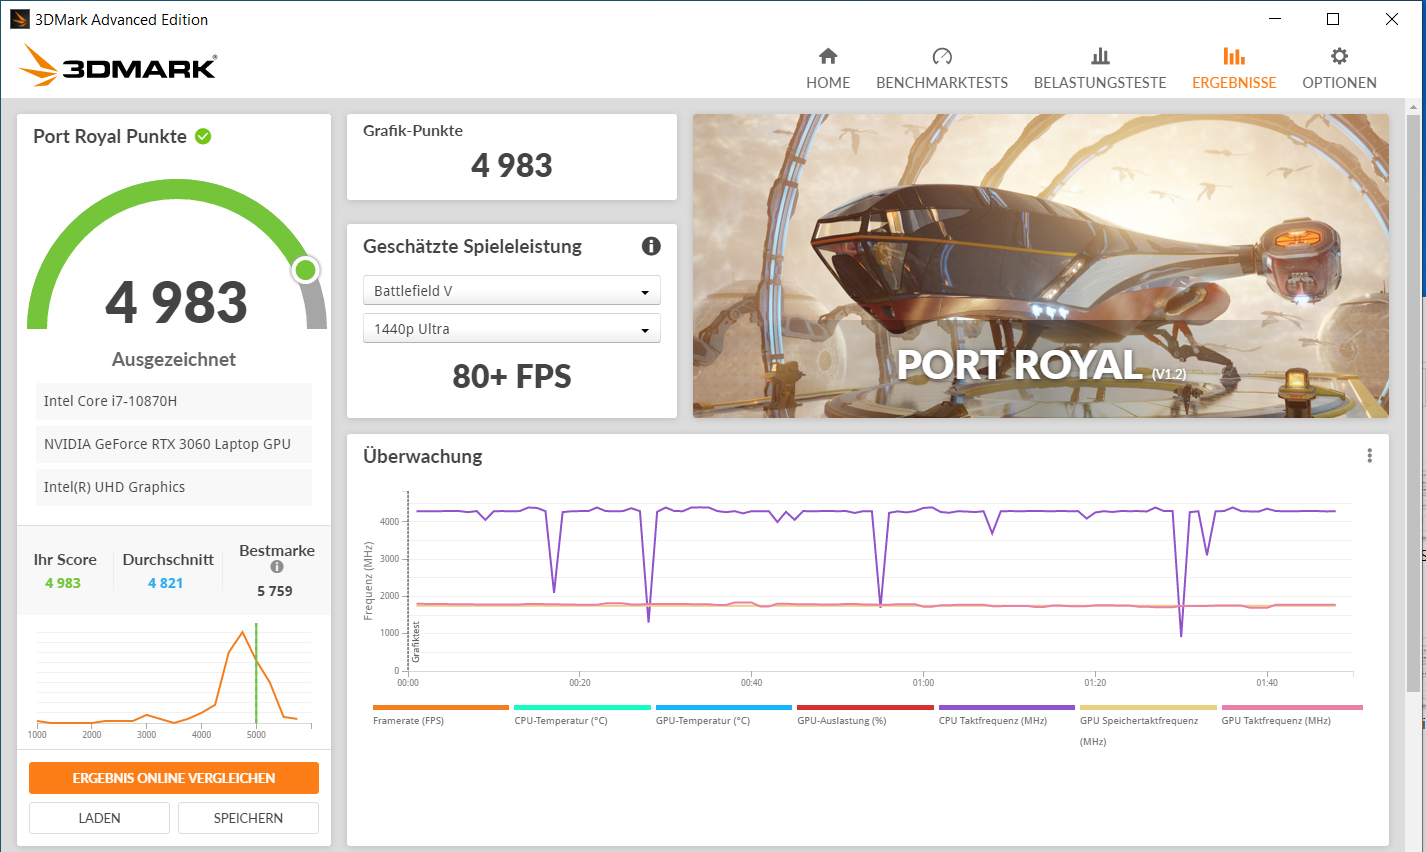
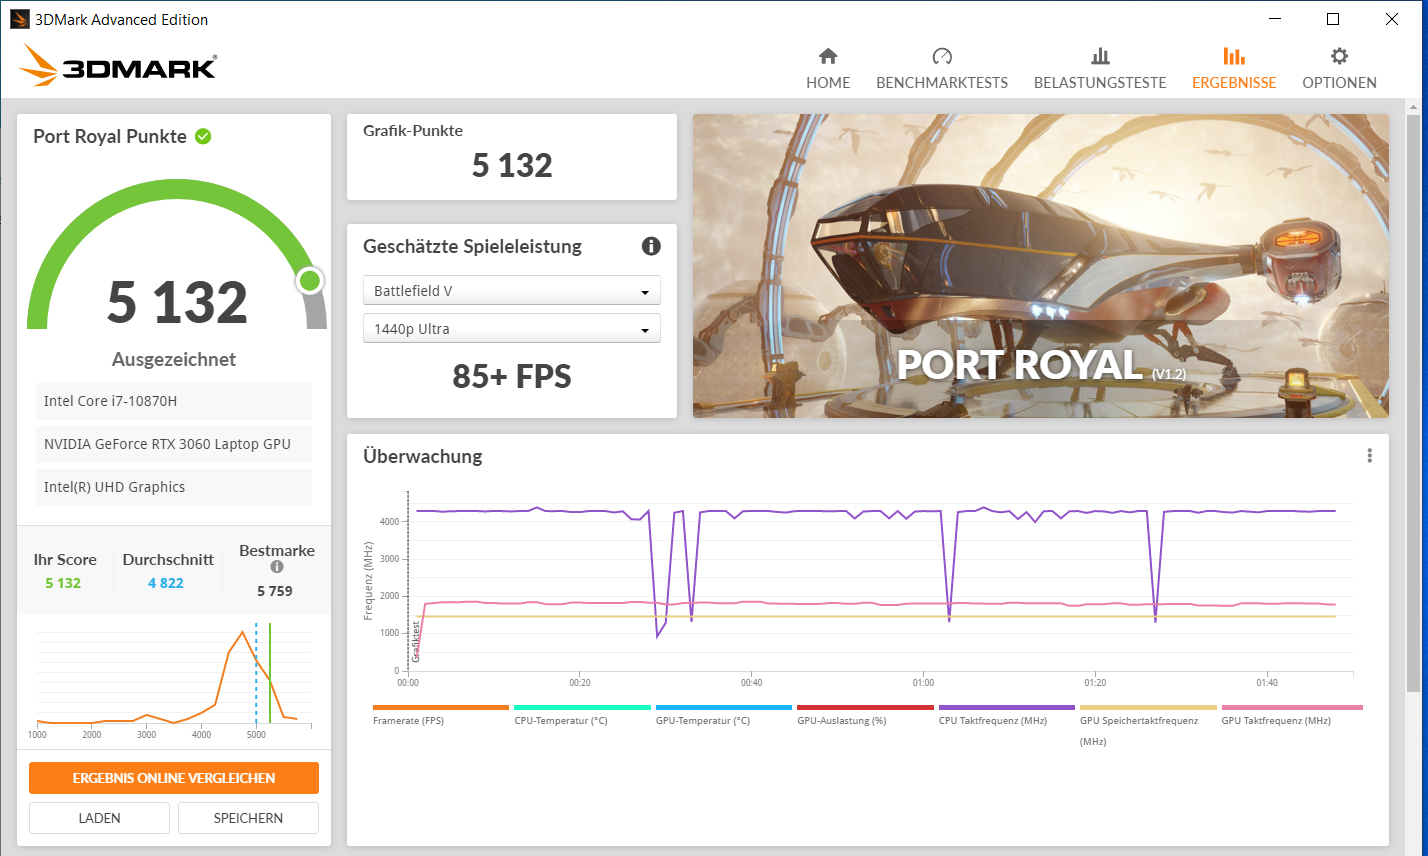
Sin embargo, a un alto TGP el aumento de rendimiento resulta ser limitado: Aunque el perfil "Overboost" (115 vatios + 5 vatios de Dynamic Boost) utiliza un TGP que es aproximadamente 26% mayor que el perfil "Enthusiast" (90 vatios + 5 vatios Dynamic Boost)Esto se aplica tanto a las pruebas de GPU como a las de juegos.


| 3DMark 11 Performance | 21813 puntos | |
| 3DMark Cloud Gate Standard Score | 41707 puntos | |
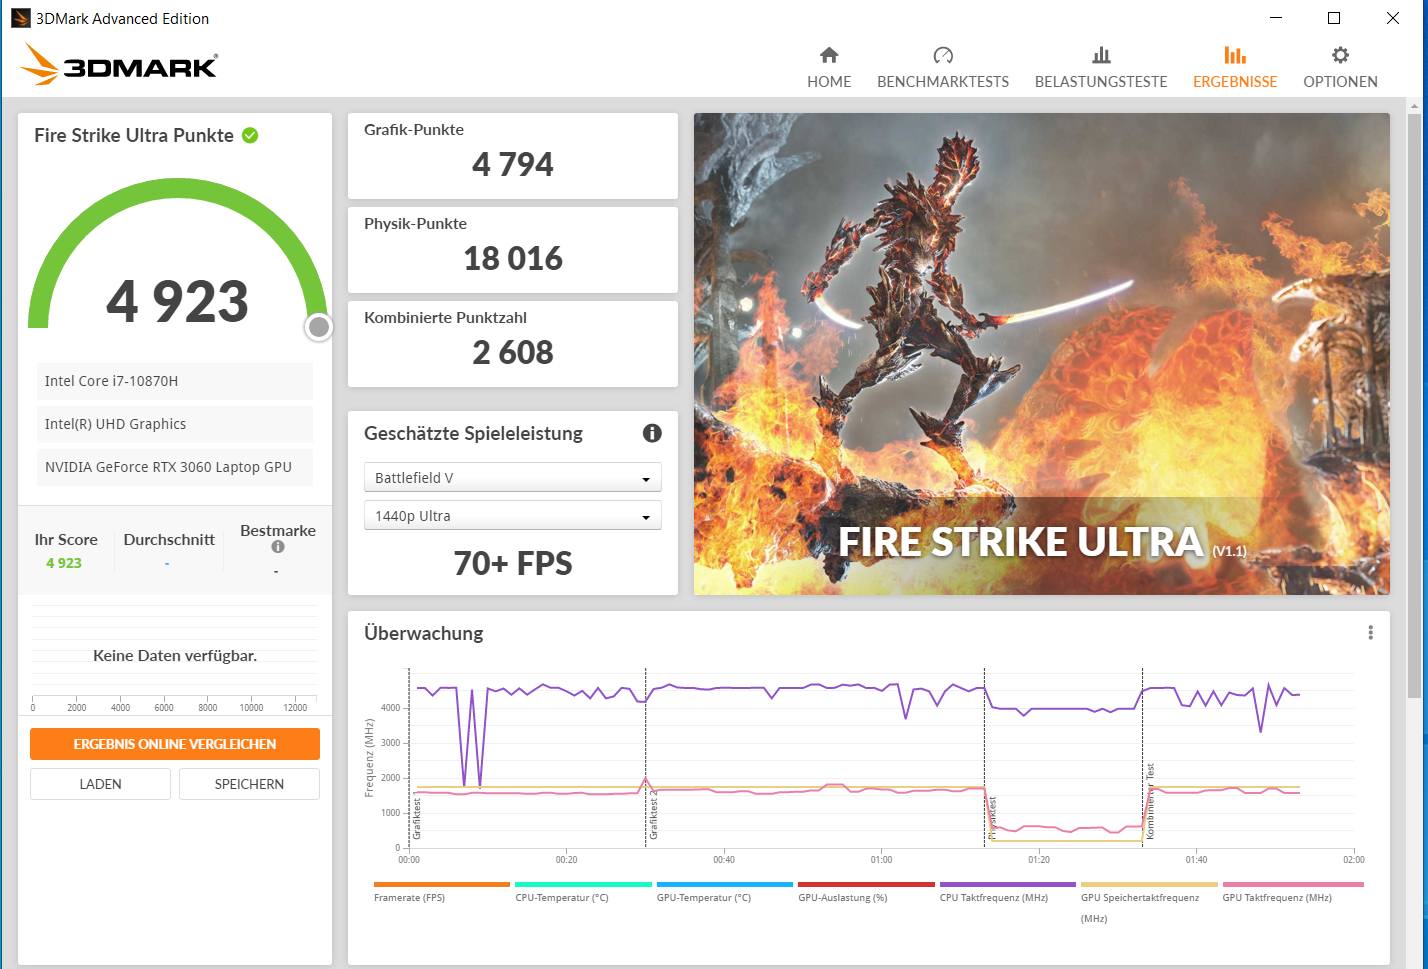
| 3DMark Fire Strike Score | 17355 puntos | |
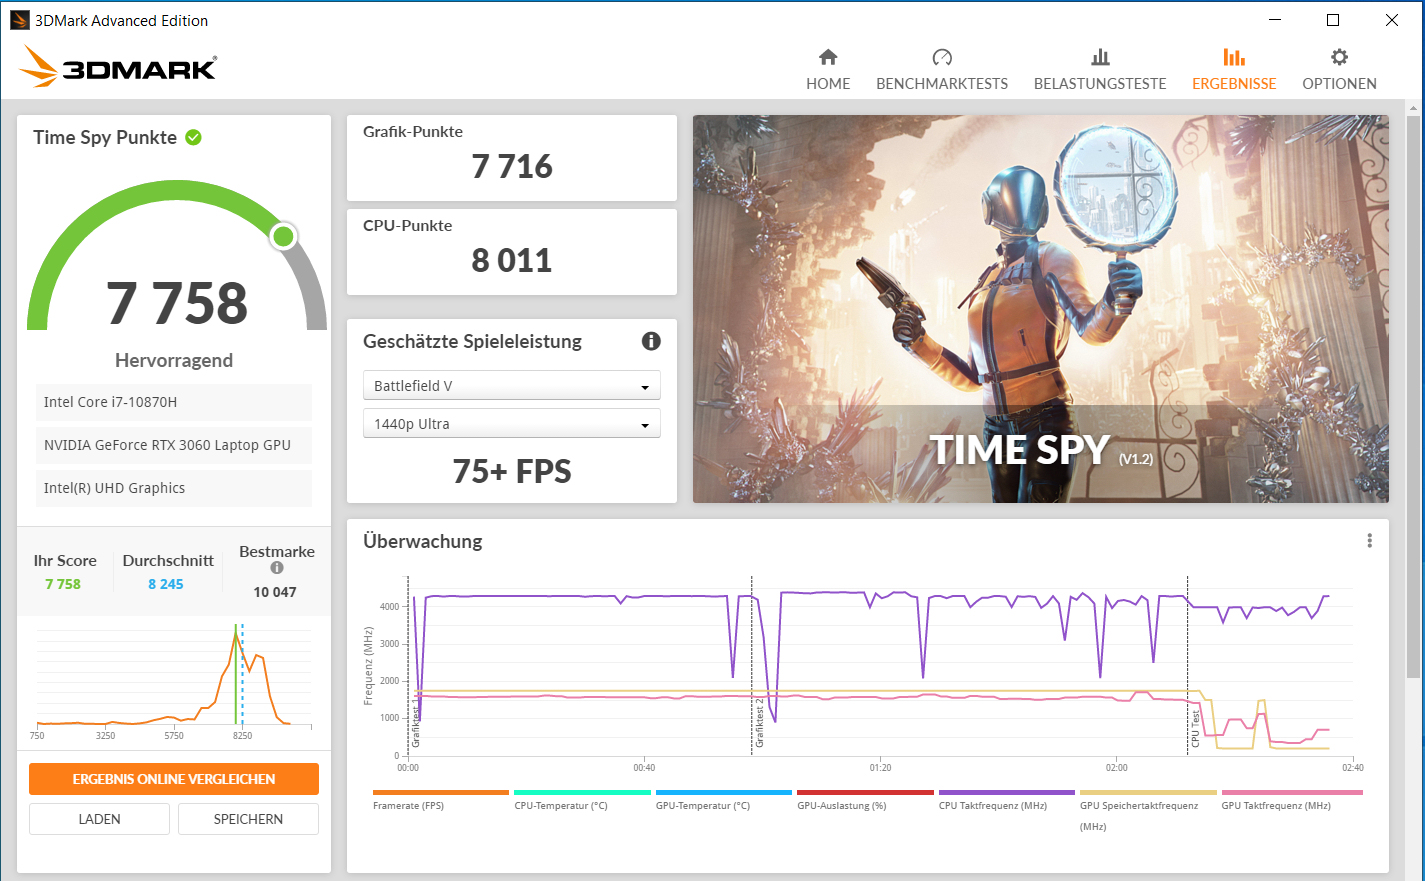
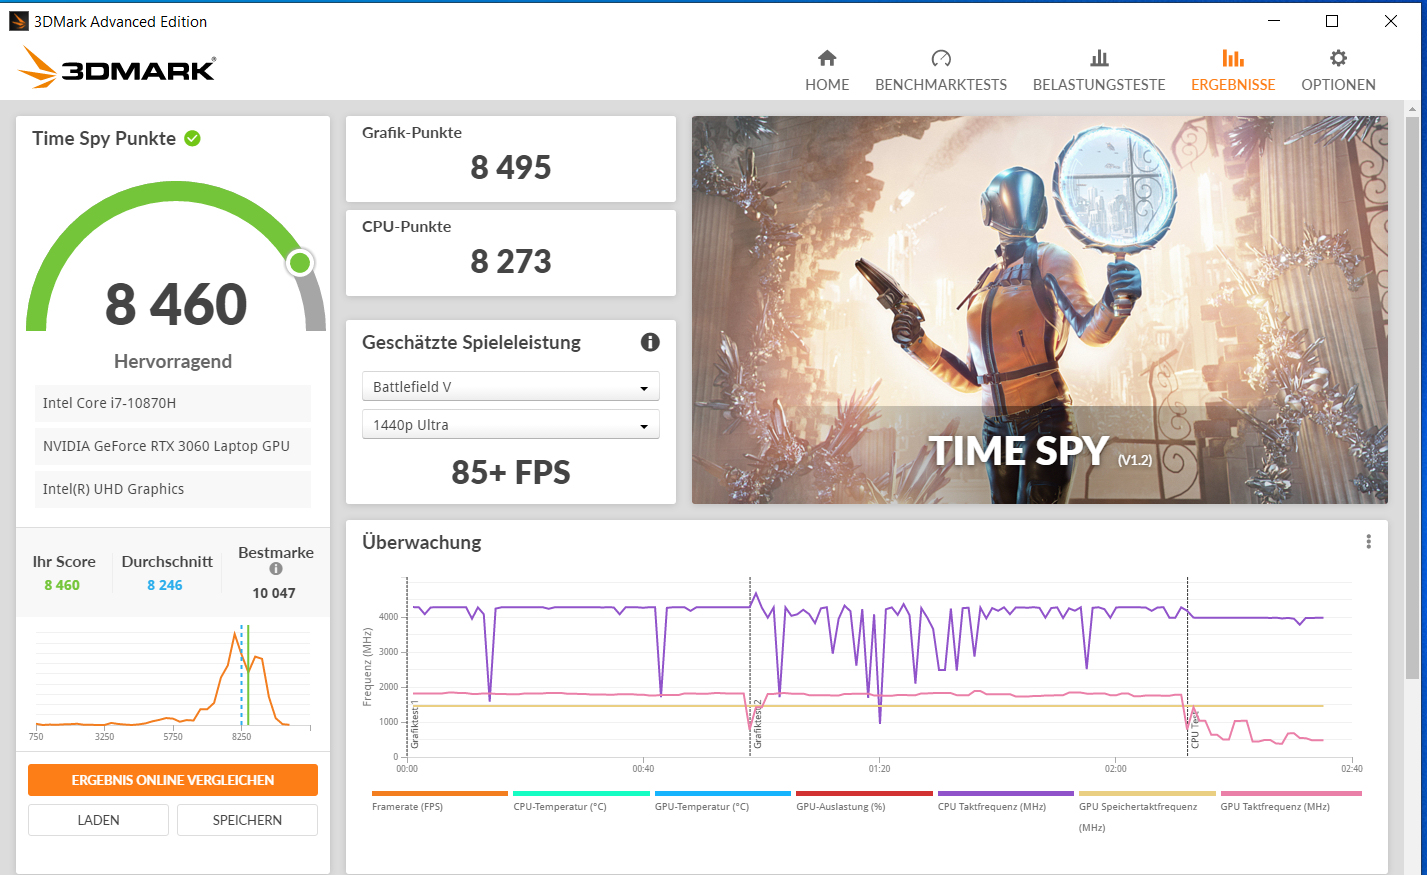
| 3DMark Time Spy Score | 7758 puntos | |
ayuda | ||
| 3DMark | |
| 1920x1080 Fire Strike Graphics | |
| Media de la clase Gaming (12242 - 62849, n=116, últimos 2 años) | |
| Schenker XMG Core 17 (Early 2021) (Overboost, TGP: 130 Watt) | |
| Schenker XMG Core 17 (Early 2021) (Overboost) | |
| Medion Erazer Beast X10 MD61804 | |
| Medio NVIDIA GeForce RTX 3060 Laptop GPU (16354 - 23109, n=49) | |
| Schenker XMG Core 17 (Early 2021) | |
| MSI Alpha 17 A4DEK | |
| Acer Predator Helios 300 PH317-54-75G8 | |
| Schenker XMG Core 17 | |
| Schenker XMG Core 17 Comet Lake | |
| 2560x1440 Time Spy Graphics | |
| Media de la clase Gaming (5012 - 26212, n=116, últimos 2 años) | |
| Schenker XMG Core 17 (Early 2021) (Overboost, TGP: 130 Watt) | |
| Schenker XMG Core 17 (Early 2021) (Overboost) | |
| Medio NVIDIA GeForce RTX 3060 Laptop GPU (6285 - 9235, n=49) | |
| Medion Erazer Beast X10 MD61804 | |
| Schenker XMG Core 17 (Early 2021) | |
| Acer Predator Helios 300 PH317-54-75G8 | |
| MSI Alpha 17 A4DEK | |
| Schenker XMG Core 17 | |
| Schenker XMG Core 17 Comet Lake | |
Rendimiento de los juegos
El hardware es capaz de llevar todos los juegos actuales a la pantalla sin problemas. En general, se puede utilizar la resolución completa de la pantalla (2560 x 1440 píxeles, WQHD) y los ajustes de alta a máxima calidad mientras se juega. La resolución FHD permitiría un nivel de calidad máximo en todo momento.
Comparado con todos los portátiles RTX 3060 que hemos probado hasta ahora, el Core 17 lo hace muy bien. En general, las diferencias en las tasas de frames entre los dispositivos no resultan demasiado grandes, a pesar de las diferentes configuraciones TGP. Como muestran los resultados del Core 17, incluso un aumento significativo del valor de TGP sólo lleva a un ligero aumento de las tasas de frames
| The Witcher 3 - 1920x1080 Ultra Graphics & Postprocessing (HBAO+) | |
| Media de la clase Gaming (104.7 - 240, n=7, últimos 2 años) | |
| Medion Erazer Beast X10 MD61804 | |
| Schenker XMG Core 15 Ampere | |
| Schenker XMG Core 17 (Early 2021) (Overboost) | |
| Razer Blade 15 Base Edition 2021, i7-10750H RTX 3060 | |
| Schenker XMG Core 17 (Early 2021) | |
| Schenker XMG Core 17 (Early 2021, RTX 3060, 5800H) | |
| Medio NVIDIA GeForce RTX 3060 Laptop GPU (58.2 - 91.5, n=48) | |
| Acer Aspire Nitro 5 AN515-55-57GF | |
| MSI GF65 Thin 10UE | |
| Acer Predator Helios 300 PH317-54-75G8 | |
| MSI Alpha 17 A4DEK | |
| Schenker XMG Core 17 | |
| Schenker XMG Core 17 Comet Lake | |
| Dota 2 Reborn - 1920x1080 ultra (3/3) best looking | |
| Media de la clase Gaming (84.8 - 252, n=108, últimos 2 años) | |
| Medio NVIDIA GeForce RTX 3060 Laptop GPU (90.7 - 154.8, n=49) | |
| Schenker XMG Core 17 (Early 2021, RTX 3060, 5800H) | |
| Razer Blade 15 Base Edition 2021, i7-10750H RTX 3060 | |
| Schenker XMG Core 17 (Early 2021) | |
| Acer Aspire Nitro 5 AN515-55-57GF | |
| Schenker XMG Core 17 Comet Lake | |
| Schenker XMG Core 17 (Early 2021) (Overboost) | |
| MSI Alpha 17 A4DEK | |
| Schenker XMG Core 15 Ampere | |
| MSI GF65 Thin 10UE | |
| X-Plane 11.11 - 1920x1080 high (fps_test=3) | |
| Media de la clase Gaming (55.5 - 148.5, n=110, últimos 2 años) | |
| Medio NVIDIA GeForce RTX 3060 Laptop GPU (61.9 - 109.3, n=48) | |
| Razer Blade 15 Base Edition 2021, i7-10750H RTX 3060 | |
| Schenker XMG Core 17 (Early 2021, RTX 3060, 5800H) | |
| Schenker XMG Core 17 Comet Lake | |
| Schenker XMG Core 17 (Early 2021) (Overboost) | |
| Schenker XMG Core 17 (Early 2021) | |
| Acer Aspire Nitro 5 AN515-55-57GF | |
| Schenker XMG Core 15 Ampere | |
| MSI GF65 Thin 10UE | |
| MSI Alpha 17 A4DEK | |
| Final Fantasy XV Benchmark | |
| 2560x1440 High Quality | |
| Media de la clase Gaming (32.5 - 184.3, n=87, últimos 2 años) | |
| Schenker XMG Core 17 (Early 2021) (1.3, Overboost, TGP: 130 Watt) | |
| Schenker XMG Core 17 (Early 2021) (1.3, Overboost) | |
| Schenker XMG Core 17 (Early 2021) (1.3) | |
| Medio NVIDIA GeForce RTX 3060 Laptop GPU (41.1 - 73.7, n=25) | |
| MSI GF65 Thin 10UE (1.3) | |
| 1920x1080 High Quality | |
| Media de la clase Gaming (41 - 215, n=95, últimos 2 años) | |
| Schenker XMG Core 17 (Early 2021) (1.3, Overboost, TGP: 130 Watt) | |
| Schenker XMG Core 17 (Early 2021) (1.3, Overboost) | |
| Razer Blade 15 Base Edition 2021, i7-10750H RTX 3060 (1.3) | |
| Schenker XMG Core 17 (Early 2021) (1.3) | |
| Medio NVIDIA GeForce RTX 3060 Laptop GPU (55 - 100.9, n=42) | |
| Acer Aspire Nitro 5 AN515-55-57GF (1.3) | |
| MSI GF65 Thin 10UE (1.3) | |
| Schenker XMG Core 17 | |
| MSI Alpha 17 A4DEK | |
| Strange Brigade | |
| 2560x1440 ultra AA:ultra AF:16 | |
| Media de la clase Gaming (52.8 - 354, n=76, últimos 2 años) | |
| Schenker XMG Core 17 (Early 2021) (1.47.22.14 D3D12, Overboost) | |
| Schenker XMG Core 17 (Early 2021) (1.47.22.14 D3D12, Overboost, TGP: 130 Watt) | |
| Schenker XMG Core 17 (Early 2021) (1.47.22.14 D3D12) | |
| Medio NVIDIA GeForce RTX 3060 Laptop GPU (75.4 - 118.4, n=17) | |
| 1920x1080 ultra AA:ultra AF:16 | |
| Media de la clase Gaming (76.3 - 458, n=87, últimos 2 años) | |
| Schenker XMG Core 17 (Early 2021) (1.47.22.14 D3D12, Overboost, TGP: 130 Watt) | |
| Schenker XMG Core 17 (Early 2021) (1.47.22.14 D3D12, Overboost) | |
| Razer Blade 15 Base Edition 2021, i7-10750H RTX 3060 (1.47.22.14 D3D12) | |
| Medio NVIDIA GeForce RTX 3060 Laptop GPU (102.2 - 166.3, n=43) | |
| Schenker XMG Core 17 (Early 2021) (1.47.22.14 D3D12) | |
| Acer Aspire Nitro 5 AN515-55-57GF (1.47.22.14 D3D12) | |
| MSI GF65 Thin 10UE (1.47.22.14 D3D12) | |
| Shadow of the Tomb Raider | |
| 1920x1080 Highest Preset AA:T | |
| Media de la clase Gaming (96 - 116, n=2, últimos 2 años) | |
| Schenker XMG Core 17 (Early 2021) | |
| Medio NVIDIA GeForce RTX 3060 Laptop GPU (84 - 95, n=4) | |
| Schenker XMG Core 17 (Early 2021, RTX 3060, 5800H) | |
| Schenker XMG Core 15 Ampere | |
| Acer Predator Helios 300 PH317-54-75G8 | |
| 2560x1440 Highest Preset AA:T | |
| Schenker XMG Core 15 Ampere | |
| Medio NVIDIA GeForce RTX 3060 Laptop GPU (66 - 71, n=3) | |
| Schenker XMG Core 17 (Early 2021, RTX 3060, 5800H) | |
| Schenker XMG Core 17 (Early 2021) | |
| Far Cry 5 | |
| 1920x1080 Ultra Preset AA:T | |
| Media de la clase Gaming (70 - 151, n=6, últimos 2 años) | |
| Schenker XMG Core 17 (Early 2021) (Overboost, TGP: 130 Watt) | |
| Schenker XMG Core 17 (Early 2021) | |
| Medio NVIDIA GeForce RTX 3060 Laptop GPU (80 - 120, n=31) | |
| Schenker XMG Core 17 (Early 2021) (Overboost) | |
| Schenker XMG Core 15 Ampere | |
| MSI GF65 Thin 10UE | |
| Acer Aspire Nitro 5 AN515-55-57GF | |
| Schenker XMG Core 17 | |
| 2560x1440 Ultra Preset AA:T | |
| Media de la clase Gaming (93 - 149, n=5, últimos 2 años) | |
| Schenker XMG Core 17 (Early 2021) (Overboost, TGP: 130 Watt) | |
| Schenker XMG Core 15 Ampere | |
| Schenker XMG Core 17 (Early 2021) (Overboost) | |
| Schenker XMG Core 17 (Early 2021) | |
| Medio NVIDIA GeForce RTX 3060 Laptop GPU (58 - 92, n=12) | |
| GTA V | |
| 1920x1080 Highest AA:4xMSAA + FX AF:16x | |
| Media de la clase Gaming (48.3 - 186.9, n=94, últimos 2 años) | |
| Schenker XMG Core 17 (Early 2021, RTX 3060, 5800H) | |
| Schenker XMG Core 17 (Early 2021) (Overboost) | |
| Medio NVIDIA GeForce RTX 3060 Laptop GPU (69.2 - 109.8, n=46) | |
| Schenker XMG Core 17 (Early 2021) (Overboost, TGP: 130 Watt) | |
| Schenker XMG Core 17 (Early 2021) | |
| Razer Blade 15 Base Edition 2021, i7-10750H RTX 3060 | |
| Acer Aspire Nitro 5 AN515-55-57GF | |
| MSI GF65 Thin 10UE | |
| 2560x1440 Highest AA:4xMSAA + FX AF:16x | |
| Media de la clase Gaming (36.9 - 183.9, n=72, últimos 2 años) | |
| Schenker XMG Core 17 (Early 2021) (Overboost, TGP: 130 Watt) | |
| Schenker XMG Core 17 (Early 2021) (Overboost) | |
| Schenker XMG Core 17 (Early 2021) | |
| Medio NVIDIA GeForce RTX 3060 Laptop GPU (52 - 86.5, n=23) | |
| Performance rating - Percent | |
| Media de la clase Gaming -1! | |
| Schenker XMG Core 17 (Early 2021, RTX 3060, 5800H) -7! | |
| Schenker XMG Core 15 Ampere -6! | |
| Medio NVIDIA GeForce RTX 3060 Laptop GPU | |
| Schenker XMG Core 17 (Early 2021) | |
| Schenker XMG Core 17 (Early 2021) -5! | |
| Schenker XMG Core 17 (Early 2021) -2! | |
| Razer Blade 15 Base Edition 2021, i7-10750H RTX 3060 -7! | |
| Acer Aspire Nitro 5 AN515-55-57GF -6! | |
| Schenker XMG Core 17 Comet Lake -10! | |
| Acer Predator Helios 300 PH317-54-75G8 -11! | |
| MSI GF65 Thin 10UE -5! | |
| Medion Erazer Beast X10 MD61804 -12! | |
| Schenker XMG Core 17 -10! | |
| MSI Alpha 17 A4DEK -9! | |
| The Witcher 3 - 1920x1080 Ultra Graphics & Postprocessing (HBAO+) | |
| Media de la clase Gaming (104.7 - 240, n=7, últimos 2 años) | |
| Medion Erazer Beast X10 MD61804 | |
| Schenker XMG Core 15 Ampere | |
| Schenker XMG Core 17 (Early 2021) (Overboost) | |
| Razer Blade 15 Base Edition 2021, i7-10750H RTX 3060 | |
| Schenker XMG Core 17 (Early 2021) | |
| Schenker XMG Core 17 (Early 2021, RTX 3060, 5800H) | |
| Medio NVIDIA GeForce RTX 3060 Laptop GPU (58.2 - 91.5, n=48) | |
| Acer Aspire Nitro 5 AN515-55-57GF | |
| MSI GF65 Thin 10UE | |
| Acer Predator Helios 300 PH317-54-75G8 | |
| MSI Alpha 17 A4DEK | |
| Schenker XMG Core 17 | |
| Schenker XMG Core 17 Comet Lake | |
| Dota 2 Reborn - 1920x1080 ultra (3/3) best looking | |
| Media de la clase Gaming (84.8 - 252, n=108, últimos 2 años) | |
| Medio NVIDIA GeForce RTX 3060 Laptop GPU (90.7 - 154.8, n=49) | |
| Schenker XMG Core 17 (Early 2021, RTX 3060, 5800H) | |
| Razer Blade 15 Base Edition 2021, i7-10750H RTX 3060 | |
| Schenker XMG Core 17 (Early 2021) | |
| Acer Aspire Nitro 5 AN515-55-57GF | |
| Schenker XMG Core 17 Comet Lake | |
| Schenker XMG Core 17 (Early 2021) (Overboost) | |
| MSI Alpha 17 A4DEK | |
| Schenker XMG Core 15 Ampere | |
| MSI GF65 Thin 10UE | |
| X-Plane 11.11 - 1920x1080 high (fps_test=3) | |
| Media de la clase Gaming (55.5 - 148.5, n=110, últimos 2 años) | |
| Medio NVIDIA GeForce RTX 3060 Laptop GPU (61.9 - 109.3, n=48) | |
| Razer Blade 15 Base Edition 2021, i7-10750H RTX 3060 | |
| Schenker XMG Core 17 (Early 2021, RTX 3060, 5800H) | |
| Schenker XMG Core 17 Comet Lake | |
| Schenker XMG Core 17 (Early 2021) (Overboost) | |
| Schenker XMG Core 17 (Early 2021) | |
| Acer Aspire Nitro 5 AN515-55-57GF | |
| Schenker XMG Core 15 Ampere | |
| MSI GF65 Thin 10UE | |
| MSI Alpha 17 A4DEK | |
| Final Fantasy XV Benchmark | |
| 2560x1440 High Quality | |
| Media de la clase Gaming (32.5 - 184.3, n=87, últimos 2 años) | |
| Schenker XMG Core 17 (Early 2021) (1.3, Overboost, TGP: 130 Watt) | |
| Schenker XMG Core 17 (Early 2021) (1.3, Overboost) | |
| Schenker XMG Core 17 (Early 2021) (1.3) | |
| Medio NVIDIA GeForce RTX 3060 Laptop GPU (41.1 - 73.7, n=25) | |
| MSI GF65 Thin 10UE (1.3) | |
| 1920x1080 High Quality | |
| Media de la clase Gaming (41 - 215, n=95, últimos 2 años) | |
| Schenker XMG Core 17 (Early 2021) (1.3, Overboost, TGP: 130 Watt) | |
| Schenker XMG Core 17 (Early 2021) (1.3, Overboost) | |
| Razer Blade 15 Base Edition 2021, i7-10750H RTX 3060 (1.3) | |
| Schenker XMG Core 17 (Early 2021) (1.3) | |
| Medio NVIDIA GeForce RTX 3060 Laptop GPU (55 - 100.9, n=42) | |
| Acer Aspire Nitro 5 AN515-55-57GF (1.3) | |
| MSI GF65 Thin 10UE (1.3) | |
| Schenker XMG Core 17 | |
| MSI Alpha 17 A4DEK | |
| Strange Brigade | |
| 2560x1440 ultra AA:ultra AF:16 | |
| Media de la clase Gaming (52.8 - 354, n=76, últimos 2 años) | |
| Schenker XMG Core 17 (Early 2021) (1.47.22.14 D3D12, Overboost) | |
| Schenker XMG Core 17 (Early 2021) (1.47.22.14 D3D12, Overboost, TGP: 130 Watt) | |
| Schenker XMG Core 17 (Early 2021) (1.47.22.14 D3D12) | |
| Medio NVIDIA GeForce RTX 3060 Laptop GPU (75.4 - 118.4, n=17) | |
| 1920x1080 ultra AA:ultra AF:16 | |
| Media de la clase Gaming (76.3 - 458, n=87, últimos 2 años) | |
| Schenker XMG Core 17 (Early 2021) (1.47.22.14 D3D12, Overboost, TGP: 130 Watt) | |
| Schenker XMG Core 17 (Early 2021) (1.47.22.14 D3D12, Overboost) | |
| Razer Blade 15 Base Edition 2021, i7-10750H RTX 3060 (1.47.22.14 D3D12) | |
| Medio NVIDIA GeForce RTX 3060 Laptop GPU (102.2 - 166.3, n=43) | |
| Schenker XMG Core 17 (Early 2021) (1.47.22.14 D3D12) | |
| Acer Aspire Nitro 5 AN515-55-57GF (1.47.22.14 D3D12) | |
| MSI GF65 Thin 10UE (1.47.22.14 D3D12) | |
| Shadow of the Tomb Raider | |
| 1920x1080 Highest Preset AA:T | |
| Media de la clase Gaming (96 - 116, n=2, últimos 2 años) | |
| Schenker XMG Core 17 (Early 2021) | |
| Medio NVIDIA GeForce RTX 3060 Laptop GPU (84 - 95, n=4) | |
| Schenker XMG Core 17 (Early 2021, RTX 3060, 5800H) | |
| Schenker XMG Core 15 Ampere | |
| Acer Predator Helios 300 PH317-54-75G8 | |
| 2560x1440 Highest Preset AA:T | |
| Schenker XMG Core 15 Ampere | |
| Medio NVIDIA GeForce RTX 3060 Laptop GPU (66 - 71, n=3) | |
| Schenker XMG Core 17 (Early 2021, RTX 3060, 5800H) | |
| Schenker XMG Core 17 (Early 2021) | |
| Far Cry 5 | |
| 1920x1080 Ultra Preset AA:T | |
| Media de la clase Gaming (70 - 151, n=6, últimos 2 años) | |
| Schenker XMG Core 17 (Early 2021) (Overboost, TGP: 130 Watt) | |
| Schenker XMG Core 17 (Early 2021) | |
| Medio NVIDIA GeForce RTX 3060 Laptop GPU (80 - 120, n=31) | |
| Schenker XMG Core 17 (Early 2021) (Overboost) | |
| Schenker XMG Core 15 Ampere | |
| MSI GF65 Thin 10UE | |
| Acer Aspire Nitro 5 AN515-55-57GF | |
| Schenker XMG Core 17 | |
| 2560x1440 Ultra Preset AA:T | |
| Media de la clase Gaming (93 - 149, n=5, últimos 2 años) | |
| Schenker XMG Core 17 (Early 2021) (Overboost, TGP: 130 Watt) | |
| Schenker XMG Core 15 Ampere | |
| Schenker XMG Core 17 (Early 2021) (Overboost) | |
| Schenker XMG Core 17 (Early 2021) | |
| Medio NVIDIA GeForce RTX 3060 Laptop GPU (58 - 92, n=12) | |
| GTA V | |
| 1920x1080 Highest AA:4xMSAA + FX AF:16x | |
| Media de la clase Gaming (48.3 - 186.9, n=94, últimos 2 años) | |
| Schenker XMG Core 17 (Early 2021, RTX 3060, 5800H) | |
| Schenker XMG Core 17 (Early 2021) (Overboost) | |
| Medio NVIDIA GeForce RTX 3060 Laptop GPU (69.2 - 109.8, n=46) | |
| Schenker XMG Core 17 (Early 2021) (Overboost, TGP: 130 Watt) | |
| Schenker XMG Core 17 (Early 2021) | |
| Razer Blade 15 Base Edition 2021, i7-10750H RTX 3060 | |
| Acer Aspire Nitro 5 AN515-55-57GF | |
| MSI GF65 Thin 10UE | |
| 2560x1440 Highest AA:4xMSAA + FX AF:16x | |
| Media de la clase Gaming (36.9 - 183.9, n=72, últimos 2 años) | |
| Schenker XMG Core 17 (Early 2021) (Overboost, TGP: 130 Watt) | |
| Schenker XMG Core 17 (Early 2021) (Overboost) | |
| Schenker XMG Core 17 (Early 2021) | |
| Medio NVIDIA GeForce RTX 3060 Laptop GPU (52 - 86.5, n=23) | |
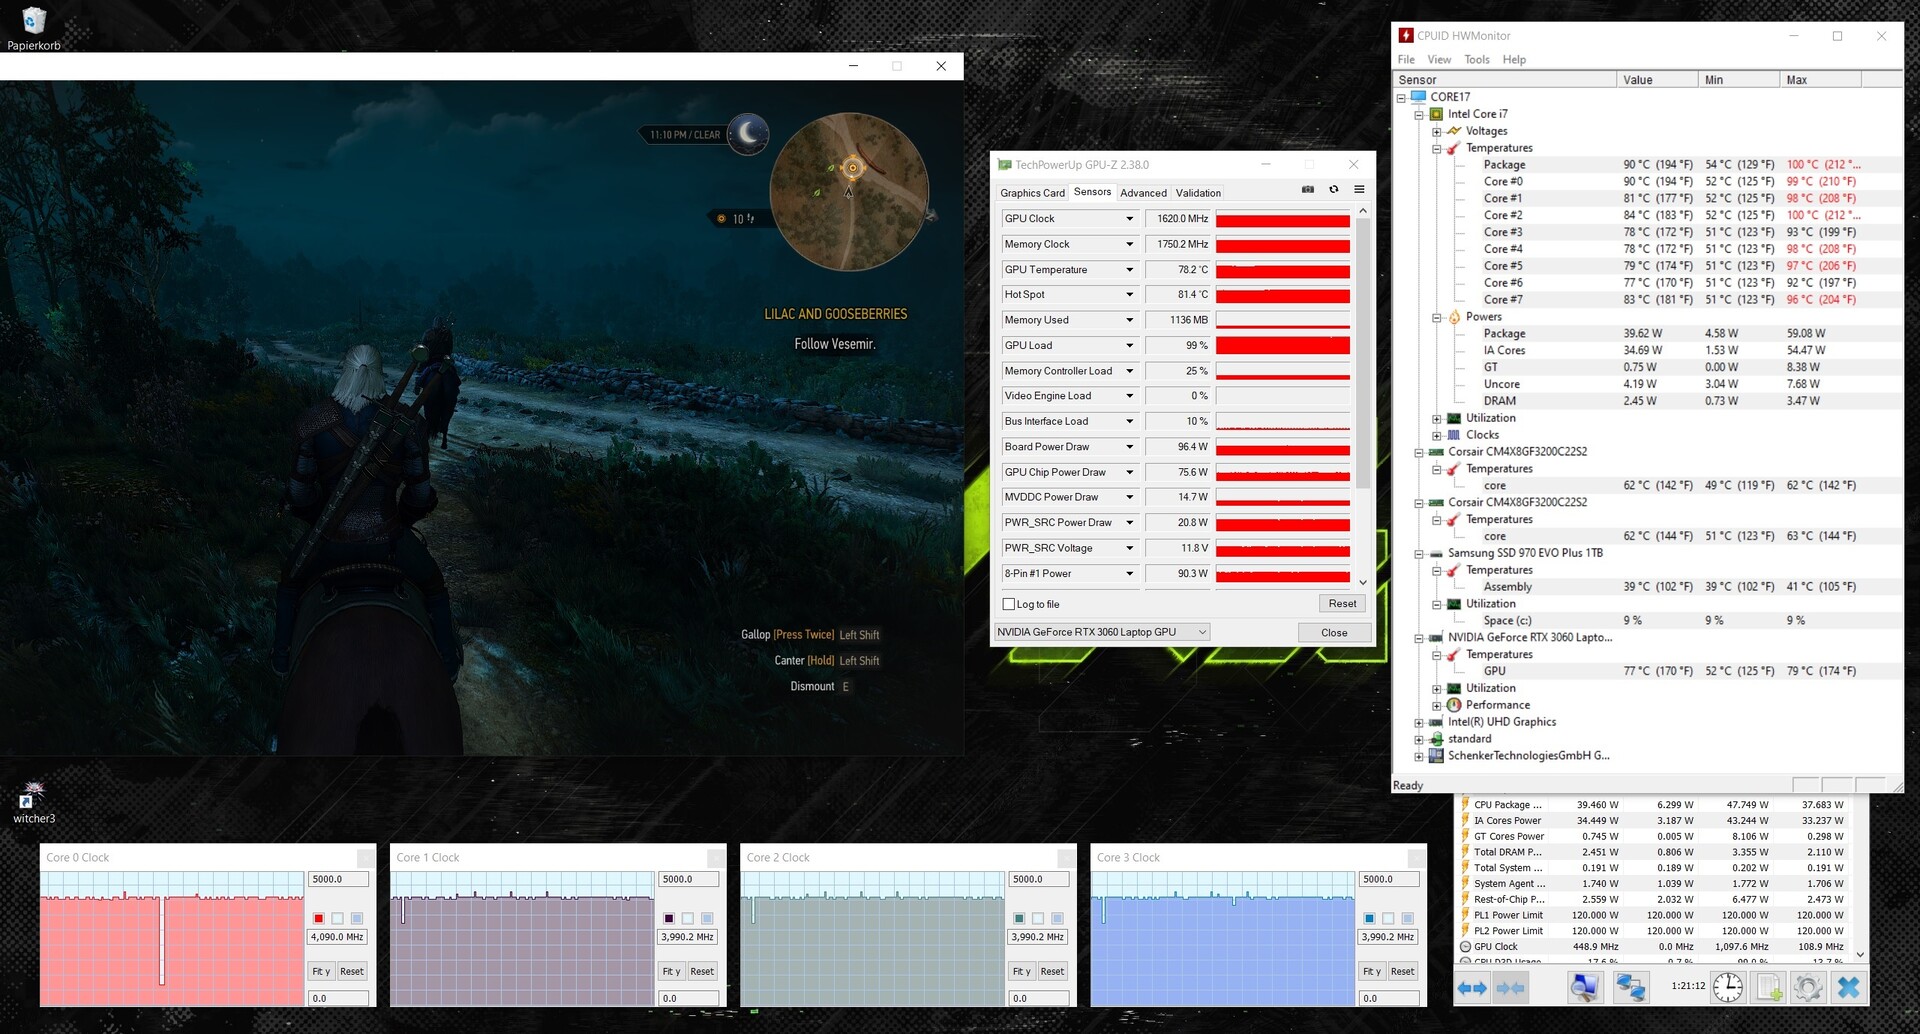
Para evaluar si las frecuencias de cuadro también se mantienen constantes durante un periodo de tiempo más largo, ejecutamos el juego"The Witcher 3" durante unos 60 minutos con resolución Full-HD y ajustes de máxima calidad, sin mover el personaje del juego. No notamos ninguna caída en la velocidad de fotogramas.
| bajo | medio | alto | ultra | QHD | |
|---|---|---|---|---|---|
| GTA V (2015) | 179 | 172 | 150 | 86.9 | 74.3 |
| The Witcher 3 (2015) | 302 | 229 | 144 | 79.5 | |
| Dota 2 Reborn (2015) | 146 | 136 | 124 | 118 | |
| Final Fantasy XV Benchmark (2018) | 141 | 105 | 79.9 | 59.6 | |
| X-Plane 11.11 (2018) | 89.5 | 81.7 | 68.7 | ||
| Far Cry 5 (2018) | 145 | 113 | 108 | 102 | 82 |
| Strange Brigade (2018) | 345 | 191 | 154 | 134 | 101 |
| Shadow of the Tomb Raider (2018) | 113 | 106 | 102 | 95 | 66 |
| Watch Dogs Legion (2020) | 82.1 | 77 | 70.7 | 50.8 | 33.9 |
| Dirt 5 (2020) | 140 | 102 | 89.1 | 71.5 | 56.1 |
| Yakuza Like a Dragon (2020) | 127 | 106 | 105 | 92.2 | 61.8 |
| Outriders (2021) | 122 | 103 | 98.9 | 90.1 | 65.1 |
| Resident Evil Village (2021) | 160 | 140 | 136 | 121 | 81.6 |
| Mass Effect Legendary Edition (2021) | 109 | 92.9 | 91.9 | ||
| Days Gone (2021) | 173 | 121 | 107 | 81.1 | 58.9 |
Emisiones - El ordenador Schenker puede producir mucho ruido
Emisiones acústicas
Durante el funcionamiento al ralentí y con poca carga, el desarrollo del ruido se mantiene dentro de los límites. Los ventiladores suelen funcionar a bajas velocidades. Bajo carga, se aceleran, y registramos un nivel de ruido máximo de 54 dB(A) (prueba de esfuerzo) y 51 dB(A) (prueba"The Witcher 3"), lo que hace que el uso de auriculares sea casi un requisito
Ruido
| Ocioso |
| 30 / 32 / 36 dB(A) |
| Carga |
| 53 / 54 dB(A) |
 | ||
30 dB silencioso 40 dB(A) audible 50 dB(A) ruidosamente alto |
||
min: | ||
| Schenker XMG Core 17 (Early 2021) i7-10870H, GeForce RTX 3060 Laptop GPU | MSI Alpha 17 A4DEK R7 4800H, Radeon RX 5600M | Acer Predator Helios 300 PH317-54-75G8 i7-10750H, GeForce RTX 2060 Mobile | Medion Erazer Beast X10 MD61804 i7-10750H, GeForce RTX 2070 Super Max-Q | Schenker XMG Core 17 i7-9750H, GeForce GTX 1660 Ti Mobile | Schenker XMG Core 17 Comet Lake i7-10750H, GeForce GTX 1650 Ti Mobile | Media de la clase Gaming | |
|---|---|---|---|---|---|---|---|
| Noise | 6% | 6% | 3% | 1% | 9% | 11% | |
| apagado / medio ambiente * (dB) | 25 | 25 -0% | 24 4% | 25 -0% | 30 -20% | 25 -0% | 24.1 ? 4% |
| Idle Minimum * (dB) | 30 | 31 -3% | 25 17% | 26 13% | 30 -0% | 25 17% | 26 ? 13% |
| Idle Average * (dB) | 32 | 32 -0% | 30 6% | 29 9% | 32 -0% | 31 3% | 27.5 ? 14% |
| Idle Maximum * (dB) | 36 | 33 8% | 37 -3% | 35 3% | 35 3% | 32 11% | 30.1 ? 16% |
| Load Average * (dB) | 53 | 38 28% | 48 9% | 52 2% | 47 11% | 48 9% | 43.8 ? 17% |
| Witcher 3 ultra * (dB) | 51 | 46 10% | 50 2% | 53 -4% | 48 6% | 44 14% | |
| Load Maximum * (dB) | 54 | 54 -0% | 52 4% | 55 -2% | 51 6% | 51 6% | 54.3 ? -1% |
* ... más pequeño es mejor
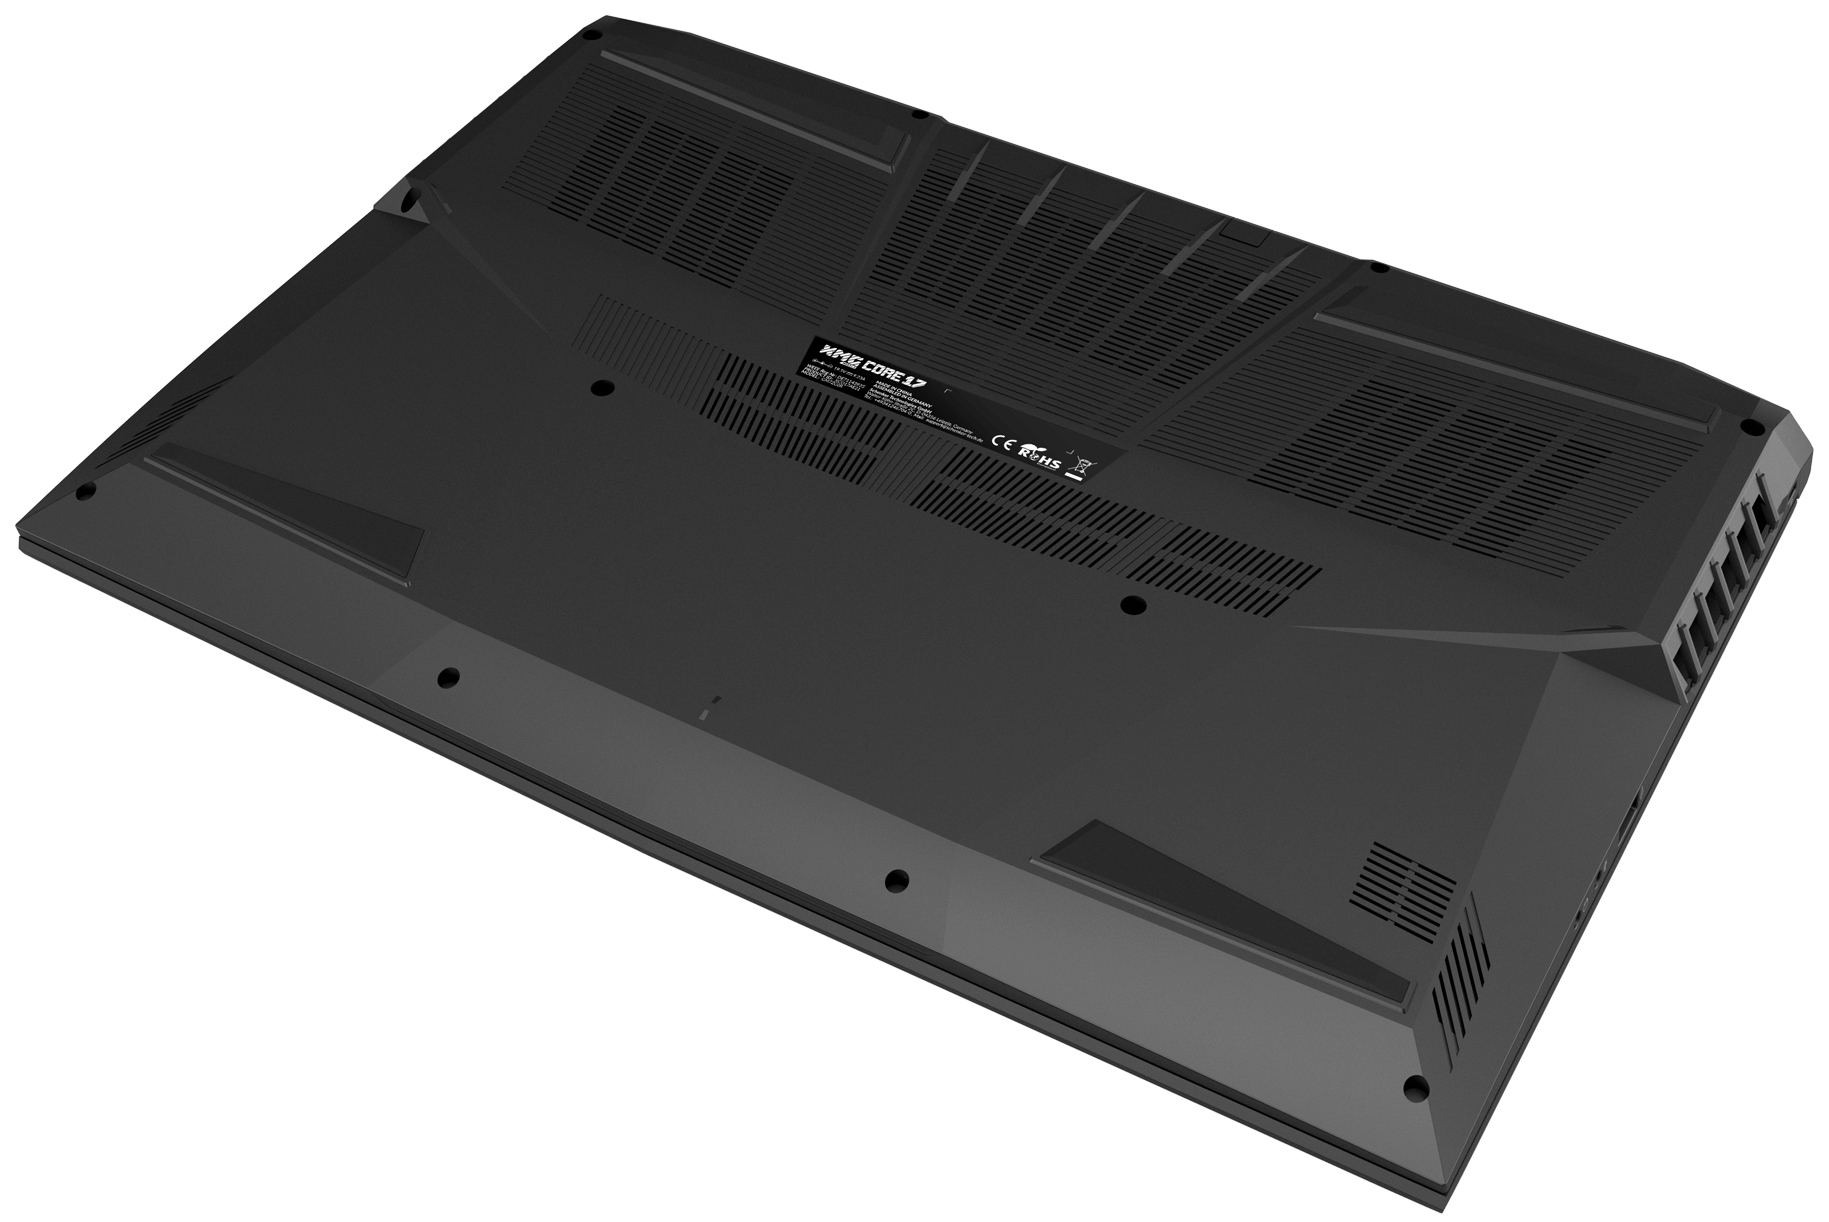
Temperaturas
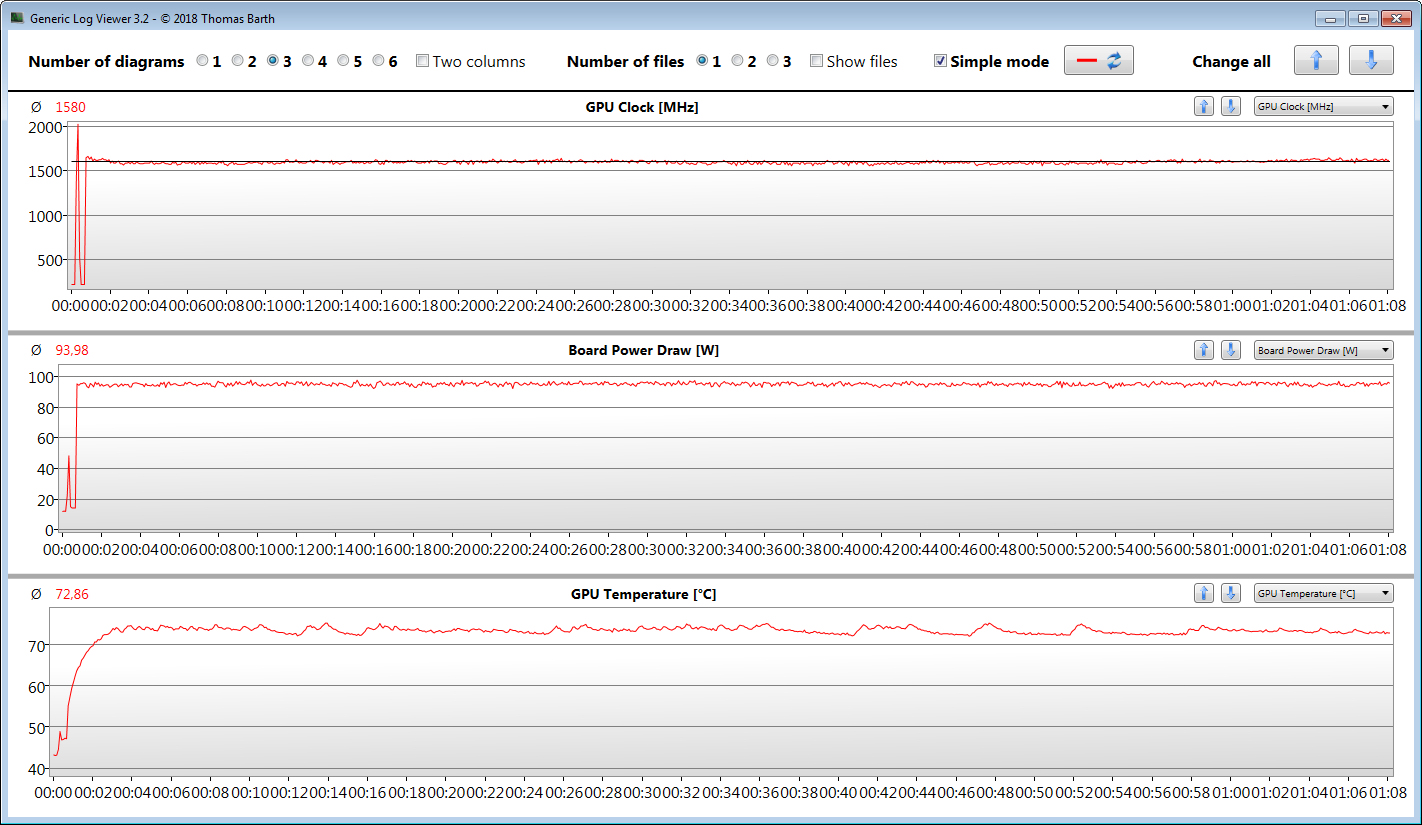
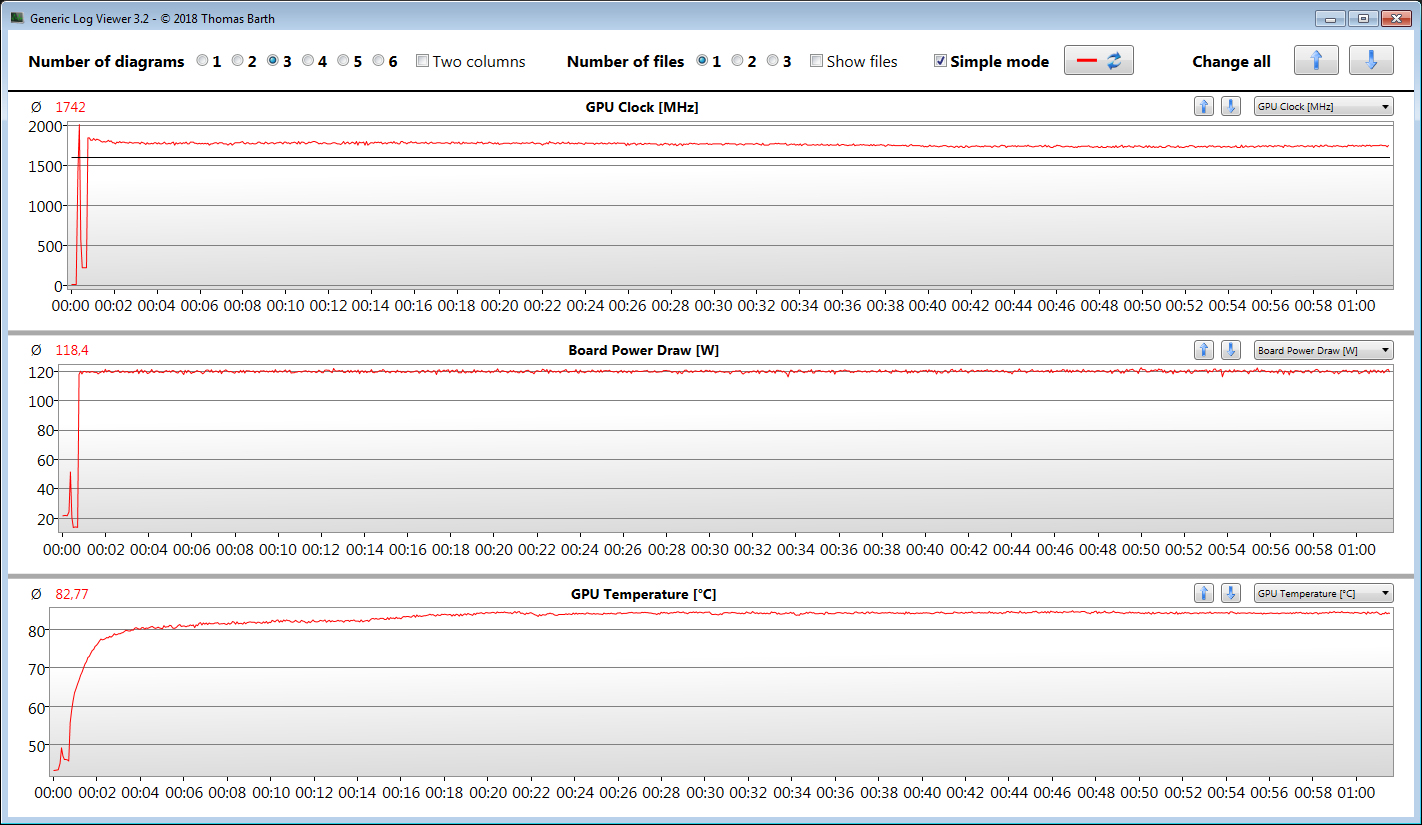
La CPU y la GPU se someten a nuestra prueba de estrés (Prime95 y Furmark durante al menos una hora) a 3,2 GHz y 1327 MHz respectivamente. La prueba de estrés representa un escenario extremo y la utilizamos para evaluar si el sistema también se mantiene estable a plena carga
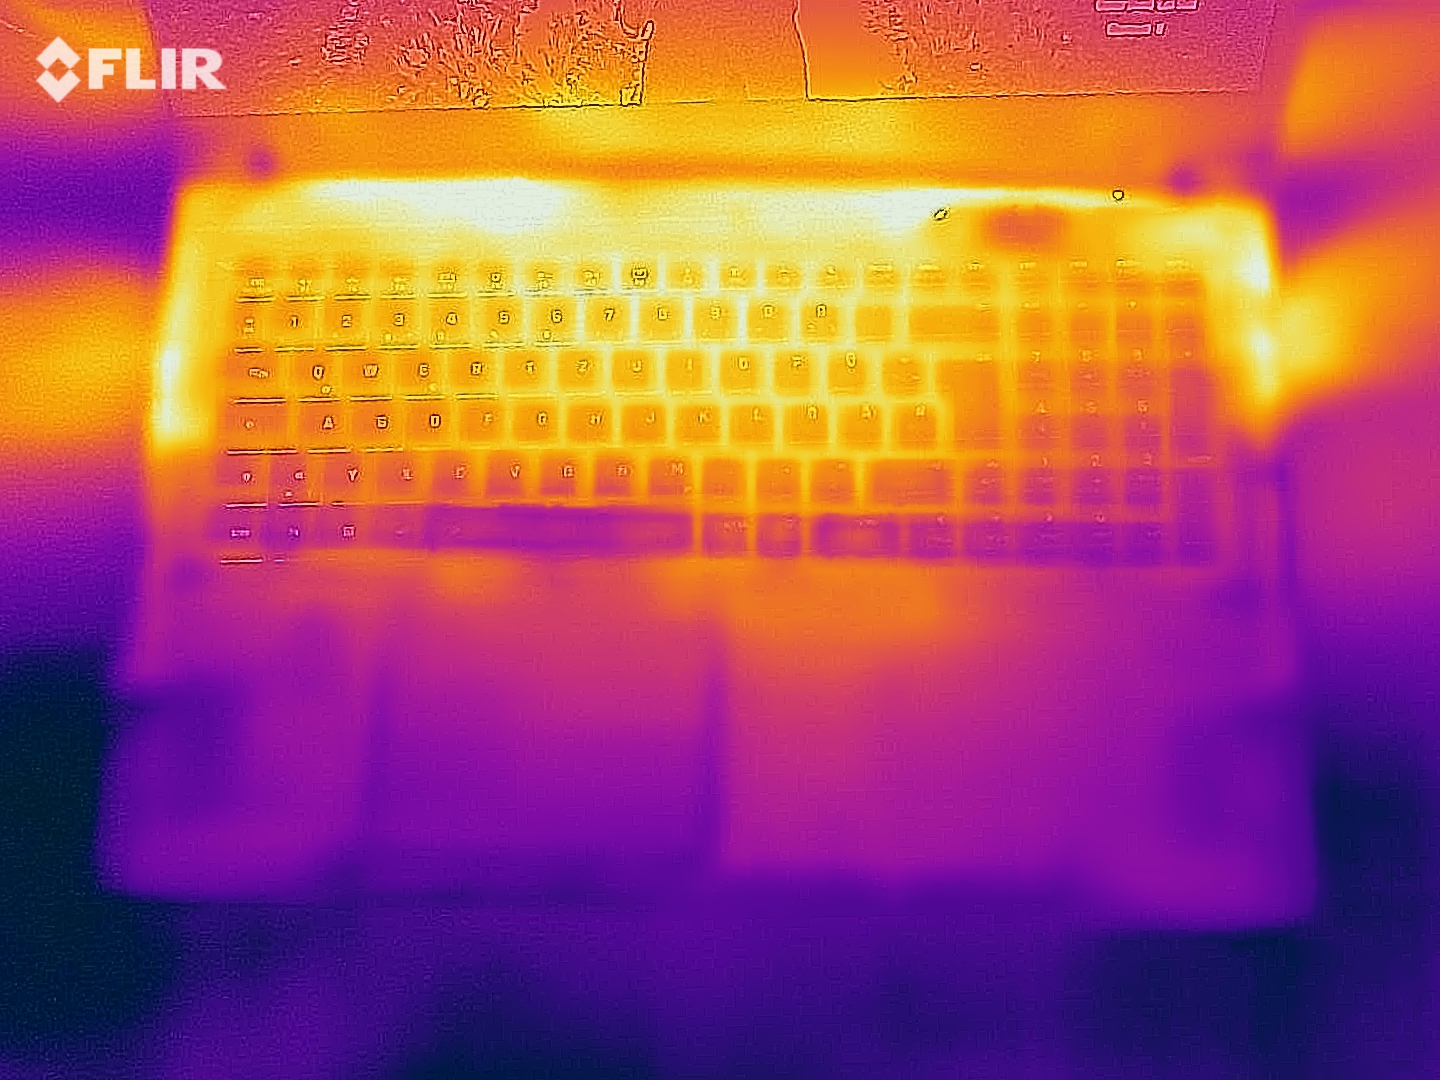
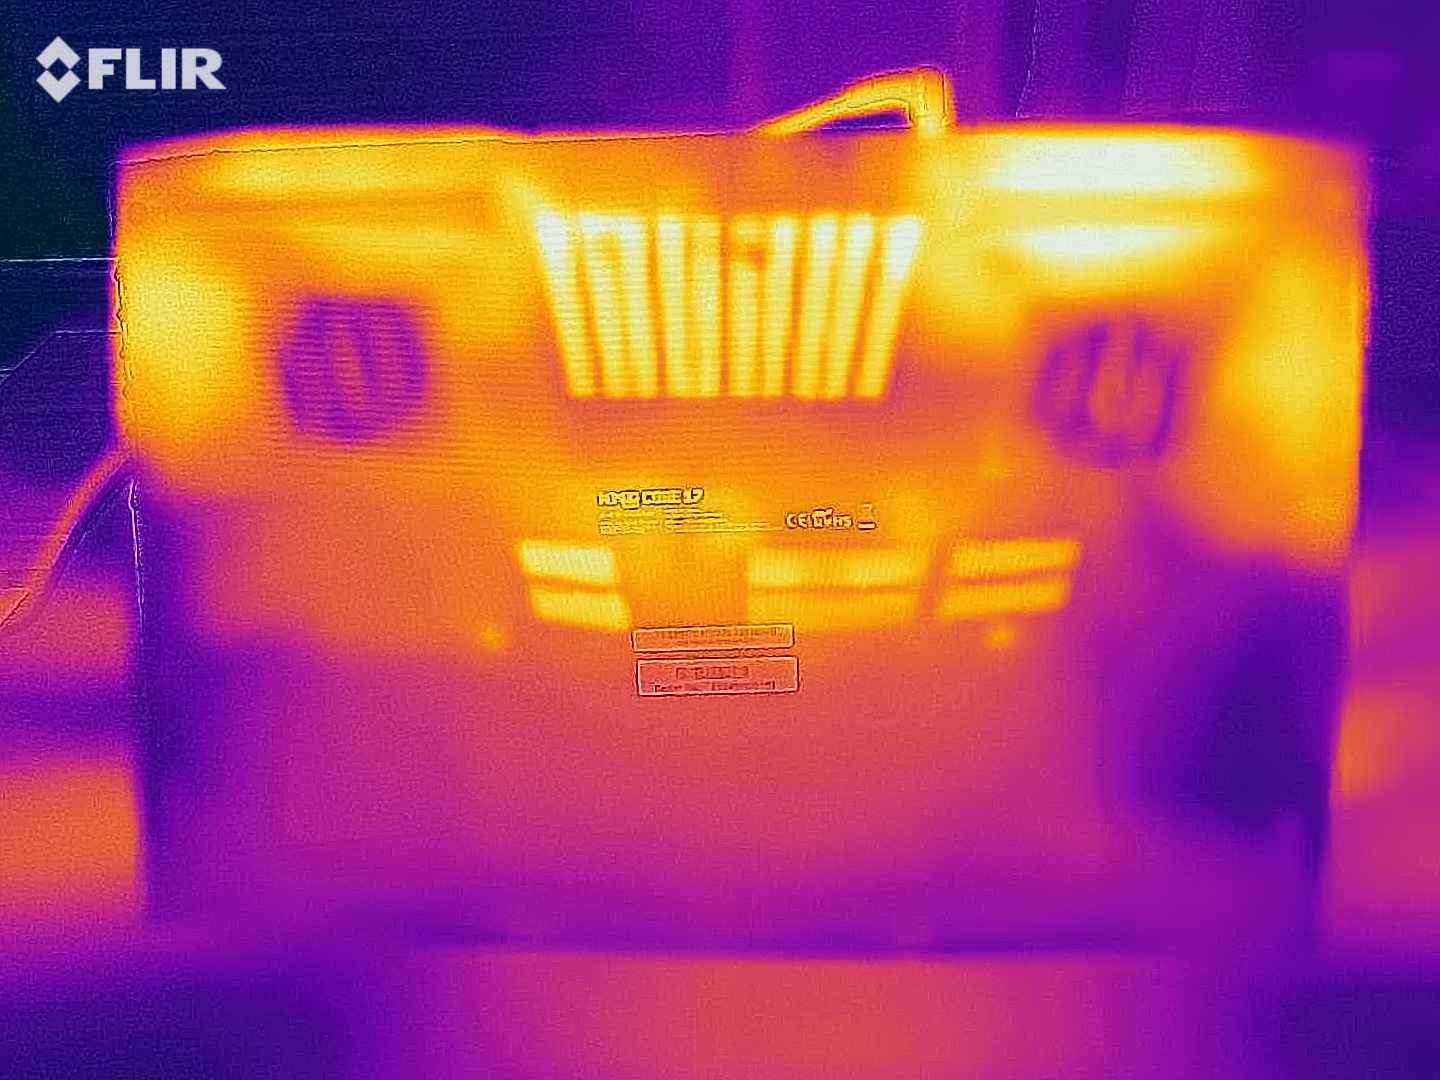
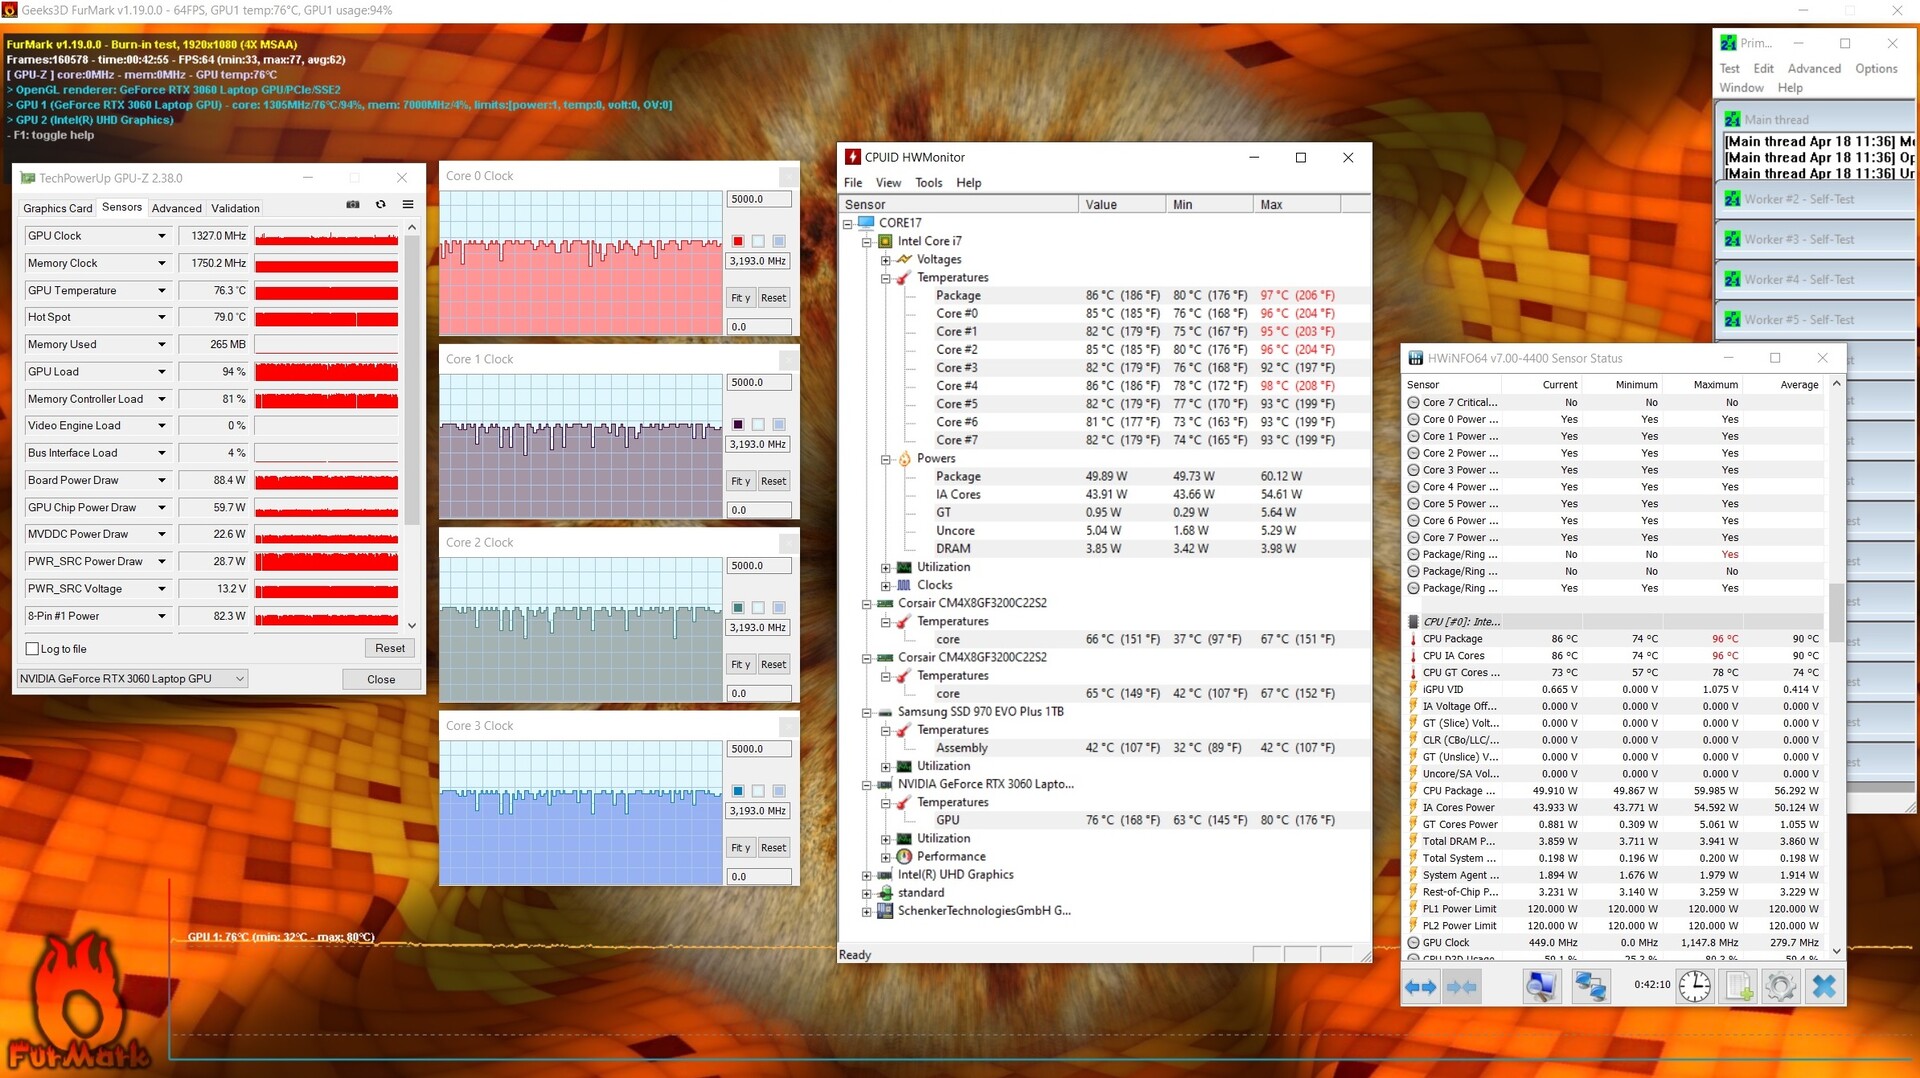
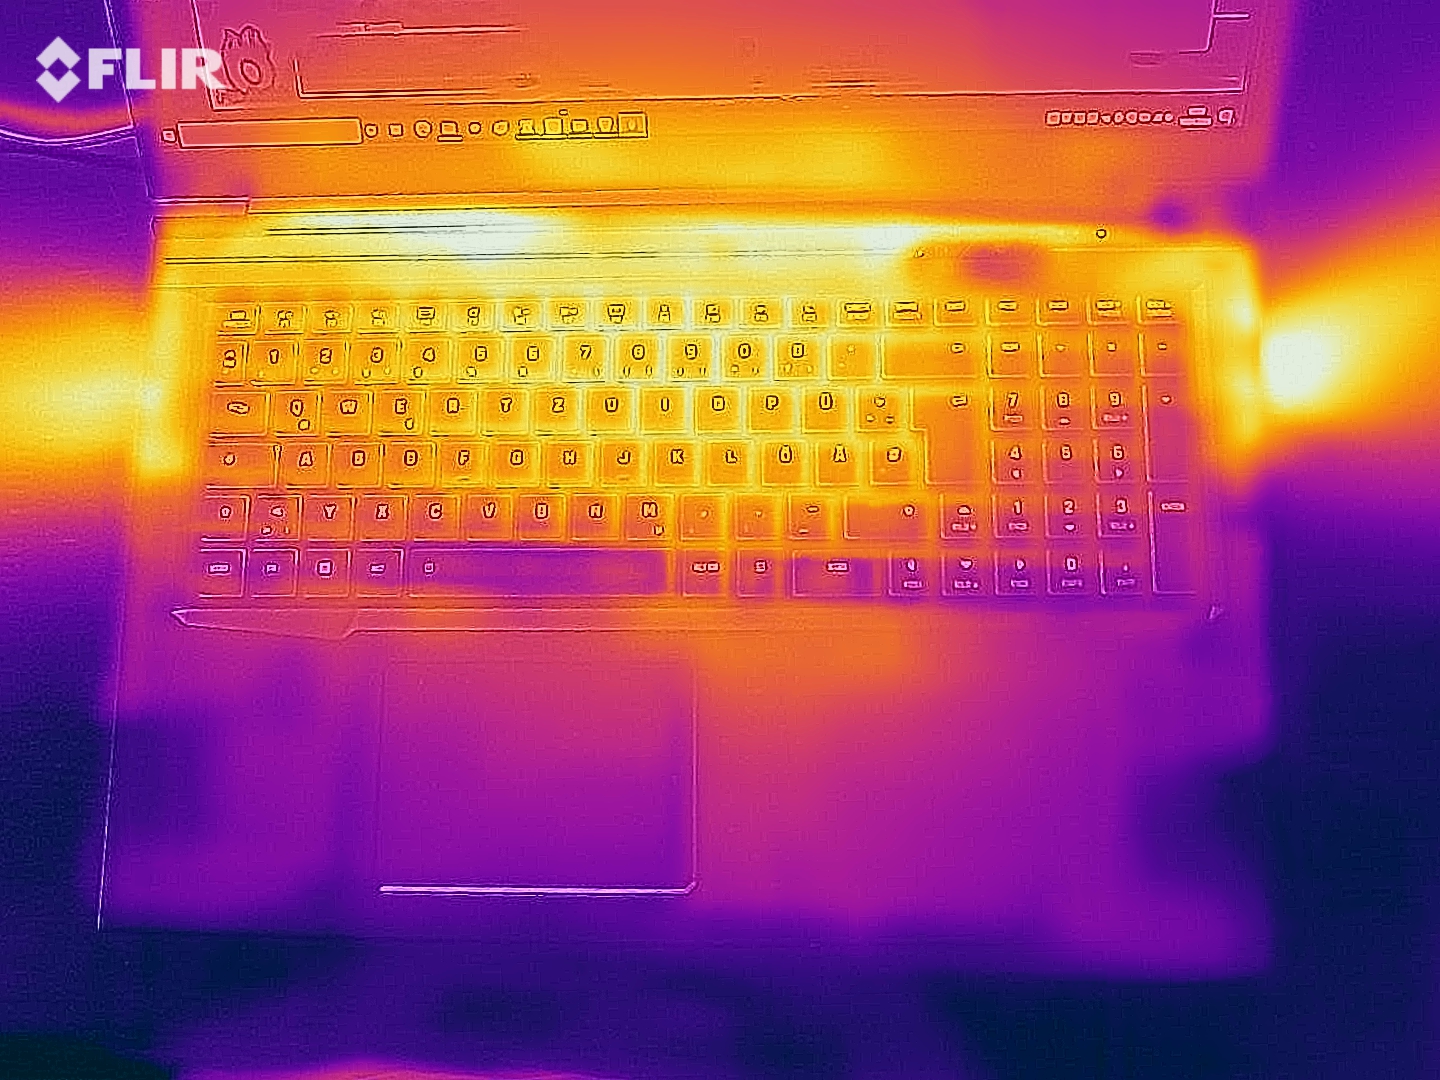
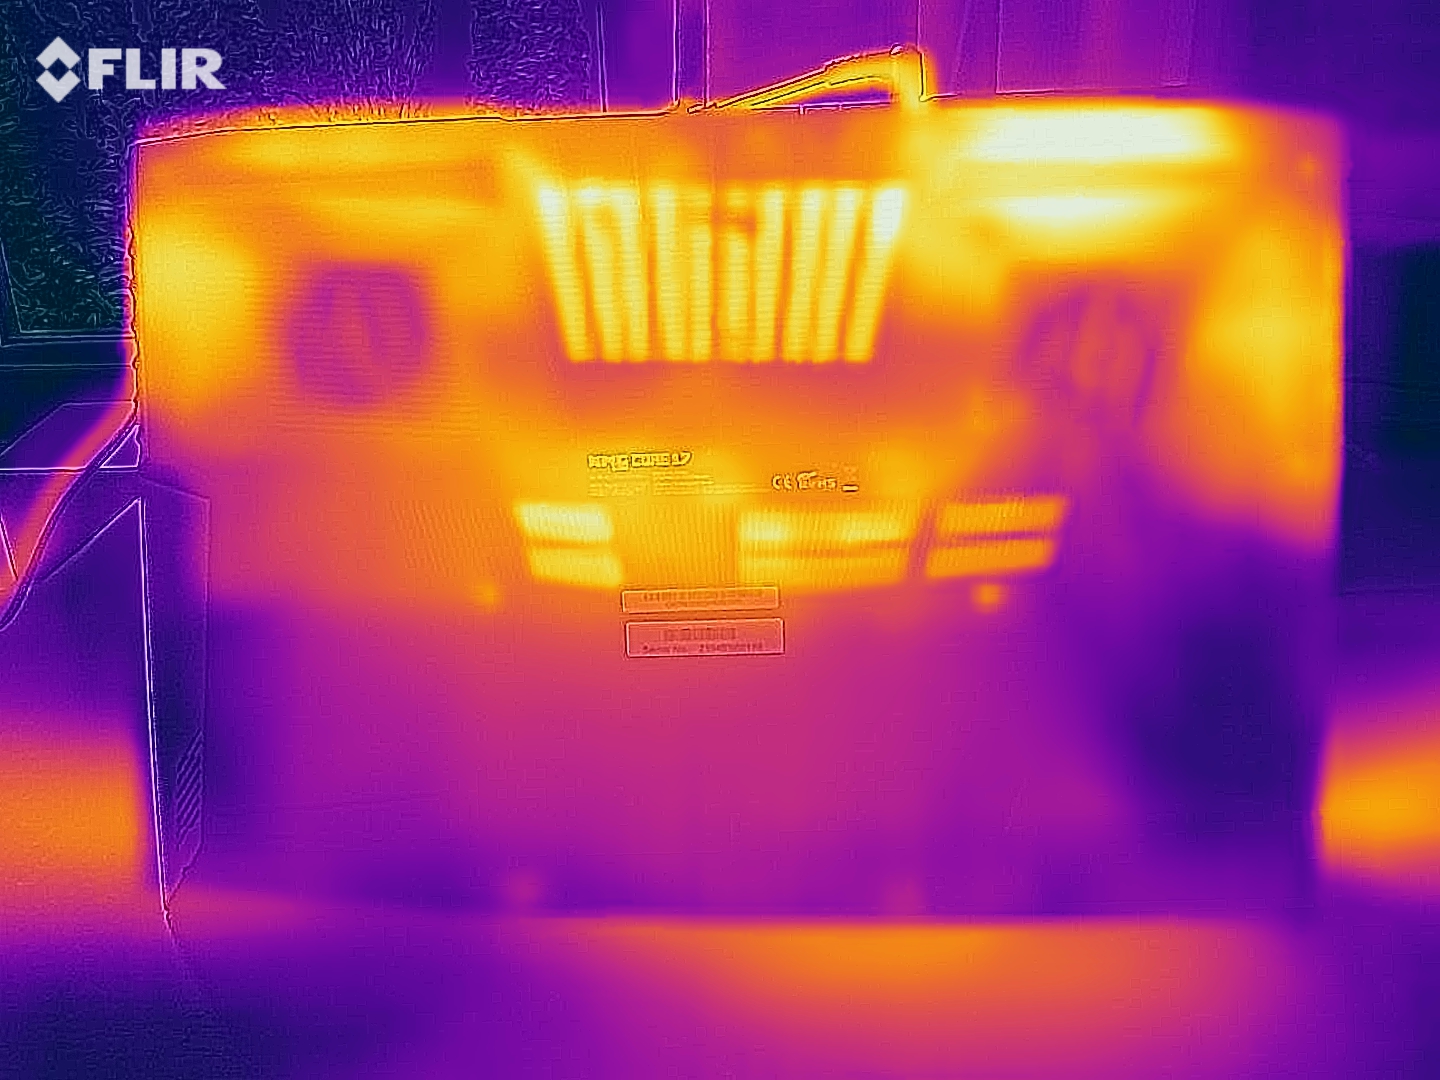
Teniendo en cuenta el hardware del portátil, no se calienta demasiado durante la prueba de estrés. El desarrollo de calor resulta mínimamente mayor cuando se ejecuta nuestra prueba"The Witcher 3". En ambos casos, no deberías poner el portátil en tu regazo.
(±) La temperatura máxima en la parte superior es de 44 °C / 111 F, frente a la media de 40.4 °C / 105 F, que oscila entre 21.2 y 68.8 °C para la clase Gaming.
(-) El fondo se calienta hasta un máximo de 50 °C / 122 F, frente a la media de 43.2 °C / 110 F
(+) En reposo, la temperatura media de la parte superior es de 28.9 °C / 84# F, frente a la media del dispositivo de 33.9 °C / 93 F.
(±) Jugando a The Witcher 3, la temperatura media de la parte superior es de 37.3 °C / 99 F, frente a la media del dispositivo de 33.9 °C / 93 F.
(+) Los reposamanos y el panel táctil alcanzan como máximo la temperatura de la piel (32 °C / 89.6 F) y, por tanto, no están calientes.
(-) La temperatura media de la zona del reposamanos de dispositivos similares fue de 28.8 °C / 83.8 F (-3.2 °C / -5.8 F).
| Schenker XMG Core 17 (Early 2021) i7-10870H, GeForce RTX 3060 Laptop GPU | MSI Alpha 17 A4DEK R7 4800H, Radeon RX 5600M | Acer Predator Helios 300 PH317-54-75G8 i7-10750H, GeForce RTX 2060 Mobile | Medion Erazer Beast X10 MD61804 i7-10750H, GeForce RTX 2070 Super Max-Q | Schenker XMG Core 17 i7-9750H, GeForce GTX 1660 Ti Mobile | Schenker XMG Core 17 Comet Lake i7-10750H, GeForce GTX 1650 Ti Mobile | Media de la clase Gaming | |
|---|---|---|---|---|---|---|---|
| Heat | 16% | -6% | -4% | -2% | 7% | 1% | |
| Maximum Upper Side * (°C) | 44 | 44 -0% | 53 -20% | 51 -16% | 47 -7% | 45 -2% | 45.2 ? -3% |
| Maximum Bottom * (°C) | 50 | 43 14% | 59 -18% | 56 -12% | 50 -0% | 48 4% | 48.2 ? 4% |
| Idle Upper Side * (°C) | 30 | 25 17% | 29 3% | 31 -3% | 34 -13% | 27 10% | 31 ? -3% |
| Idle Bottom * (°C) | 36 | 24 33% | 32 11% | 30 17% | 32 11% | 30 17% | 34.2 ? 5% |
* ... más pequeño es mejor
Altavoces
Schenker XMG Core 17 (Early 2021) análisis de audio
(+) | los altavoces pueden reproducir a un volumen relativamente alto (#82 dB)
Graves 100 - 315 Hz
(-) | casi sin bajos - de media 27.5% inferior a la mediana
(±) | la linealidad de los graves es media (12.8% delta a frecuencia anterior)
Medios 400 - 2000 Hz
(+) | medios equilibrados - a sólo 2.3% de la mediana
(+) | los medios son lineales (5.4% delta a la frecuencia anterior)
Altos 2 - 16 kHz
(+) | máximos equilibrados - a sólo 3.5% de la mediana
(±) | la linealidad de los máximos es media (9.9% delta a frecuencia anterior)
Total 100 - 16.000 Hz
(±) | la linealidad del sonido global es media (17.5% de diferencia con la mediana)
En comparación con la misma clase
» 49% de todos los dispositivos probados de esta clase eran mejores, 12% similares, 39% peores
» El mejor tuvo un delta de 6%, la media fue 18%, el peor fue ###max##%
En comparación con todos los dispositivos probados
» 34% de todos los dispositivos probados eran mejores, 8% similares, 58% peores
» El mejor tuvo un delta de 4%, la media fue 23%, el peor fue ###max##%
Gestión de la energía - El Core 17 ofrece una duración aceptable de la batería
Consumo de energía
No hay nada llamativo en cuanto al consumo de energía. En toda la gama de cargas, los valores se mantienen en un nivel normal para el hardware utilizado aquí. La fuente de alimentación tiene una potencia nominal de 180 vatios
| Off / Standby | |
| Ocioso | |
| Carga |
|
Clave:
min: | |
| Schenker XMG Core 17 (Early 2021) i7-10870H, GeForce RTX 3060 Laptop GPU | MSI Alpha 17 A4DEK R7 4800H, Radeon RX 5600M | Acer Predator Helios 300 PH317-54-75G8 i7-10750H, GeForce RTX 2060 Mobile | Medion Erazer Beast X10 MD61804 i7-10750H, GeForce RTX 2070 Super Max-Q | Schenker XMG Core 17 i7-9750H, GeForce GTX 1660 Ti Mobile | Schenker XMG Core 17 Comet Lake i7-10750H, GeForce GTX 1650 Ti Mobile | Media de la clase Gaming | |
|---|---|---|---|---|---|---|---|
| Power Consumption | 23% | 25% | -23% | 21% | 16% | -7% | |
| Idle Minimum * (Watt) | 13 | 9 31% | 6 54% | 19 -46% | 10 23% | 12 8% | 13 ? -0% |
| Idle Average * (Watt) | 16 | 12 25% | 11 31% | 22 -38% | 13 19% | 15 6% | 19 ? -19% |
| Idle Maximum * (Watt) | 29 | 18 38% | 19 34% | 30 -3% | 21 28% | 24 17% | 24.5 ? 16% |
| Load Average * (Watt) | 100 | 76 24% | 96 4% | 118 -18% | 89 11% | 105 -5% | 111.1 ? -11% |
| Witcher 3 ultra * (Watt) | 173 | 136 21% | 144 17% | 176 -2% | 128 26% | 93 46% | |
| Load Maximum * (Watt) | 213 | 222 -4% | 197 8% | 274 -29% | 177 17% | 168 21% | 260 ? -22% |
* ... más pequeño es mejor
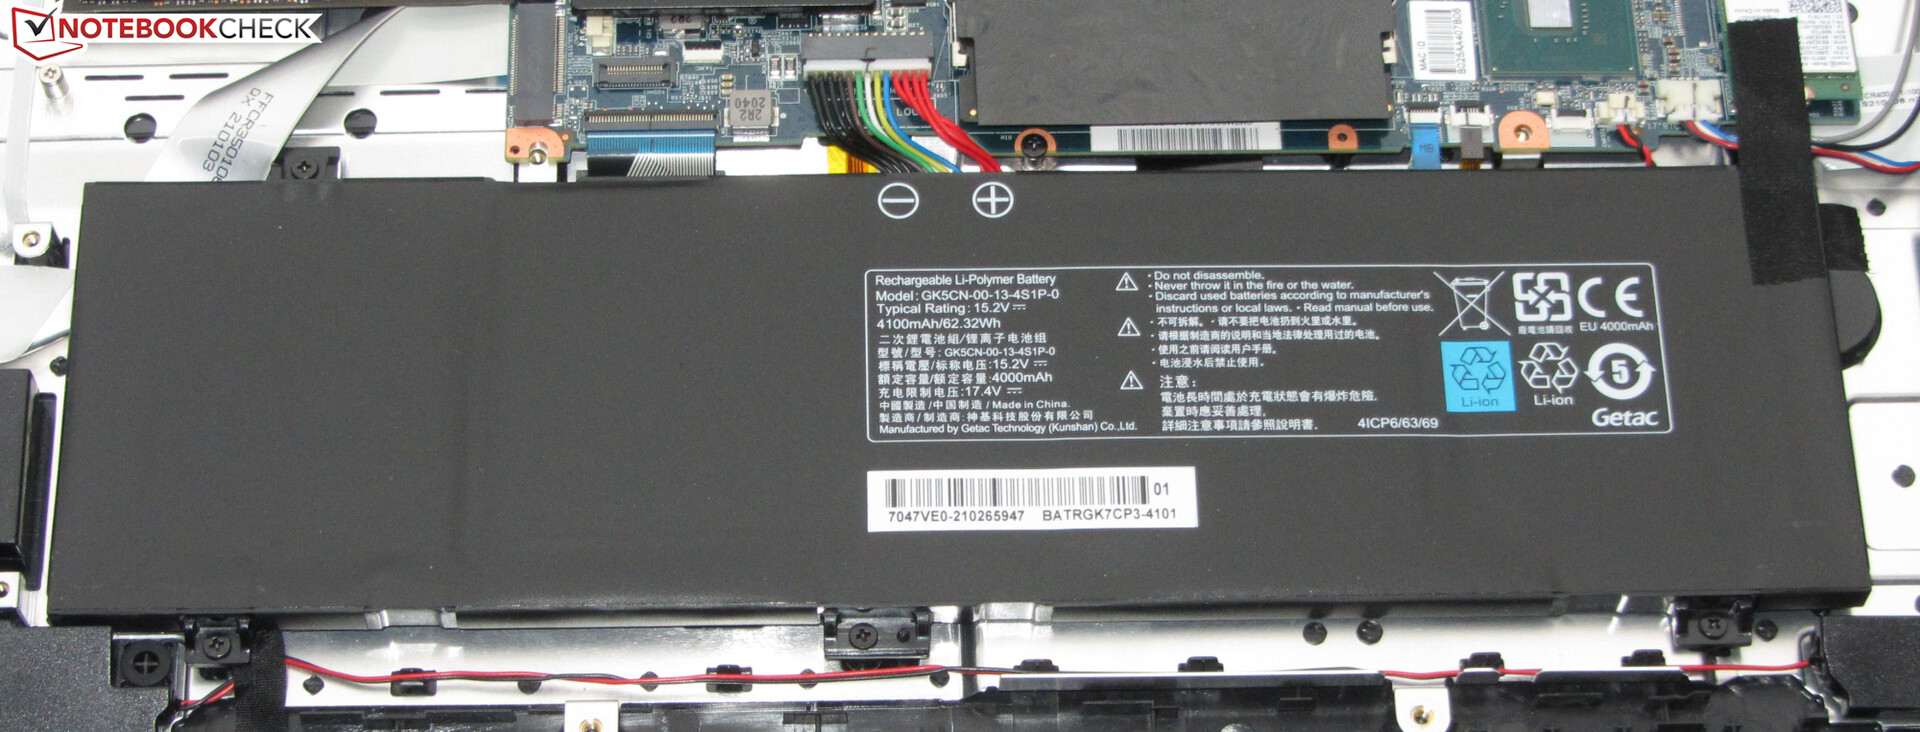
Duración de la batería
En el test WLAN (carga de webs a través de un script) y el test de vídeo (corto Big Buck Bunny ejecutado en bucle; codificación H.264, FHD), el Core 17 dura 4:53 horas y 4:43 horas respectivamente. Durante ambas pruebas, las funciones de ahorro de energía del portátil están desactivadas, y el brillo de la pantalla se reduce a unos 150 cd/m². Mientras se ejecutaba la prueba de vídeo, los módulos de comunicación también se apagaron
| Schenker XMG Core 17 (Early 2021) i7-10870H, GeForce RTX 3060 Laptop GPU, 62 Wh | MSI Alpha 17 A4DEK R7 4800H, Radeon RX 5600M, 65 Wh | Acer Predator Helios 300 PH317-54-75G8 i7-10750H, GeForce RTX 2060 Mobile, 59 Wh | Medion Erazer Beast X10 MD61804 i7-10750H, GeForce RTX 2070 Super Max-Q, 91.2 Wh | Schenker XMG Core 17 i7-9750H, GeForce GTX 1660 Ti Mobile, 46.74 Wh | Schenker XMG Core 17 Comet Lake i7-10750H, GeForce GTX 1650 Ti Mobile, 62.3 Wh | Media de la clase Gaming | |
|---|---|---|---|---|---|---|---|
| Duración de Batería | 33% | 26% | 56% | 4% | 4% | 36% | |
| Reader / Idle (h) | 7.7 | 10.5 36% | 8.2 6% | 11.4 48% | 8.1 5% | 8.27 ? 7% | |
| H.264 (h) | 4.7 | 5.9 26% | 8.5 81% | 5.3 13% | 8.32 ? 77% | ||
| WiFi v1.3 (h) | 4.9 | 7.3 49% | 5.1 4% | 6.8 39% | 4.7 -4% | 5.1 4% | 7.11 ? 45% |
| Load (h) | 1.3 | 1.5 15% | 2.2 69% | 2 54% | 1.3 0% | 1.502 ? 16% |
Pro
Contra
Veredicto
La CPUCore i7-10870H(maxPL1/2: 120 vatios) ylaGPU del portátilGeForce RTX-3060(maxTGP:130 vatios) llevan a la pantalla todos los juegos actuales sin problemas. No tendrás que preocuparte por laralentización, y la CPU y la GPU siempre son capaces de mantener su rendimiento constante.
Con el XMG Core 17 (principios de 2021), Schenker ofrece un portátil para juegos de gama media muy completo.
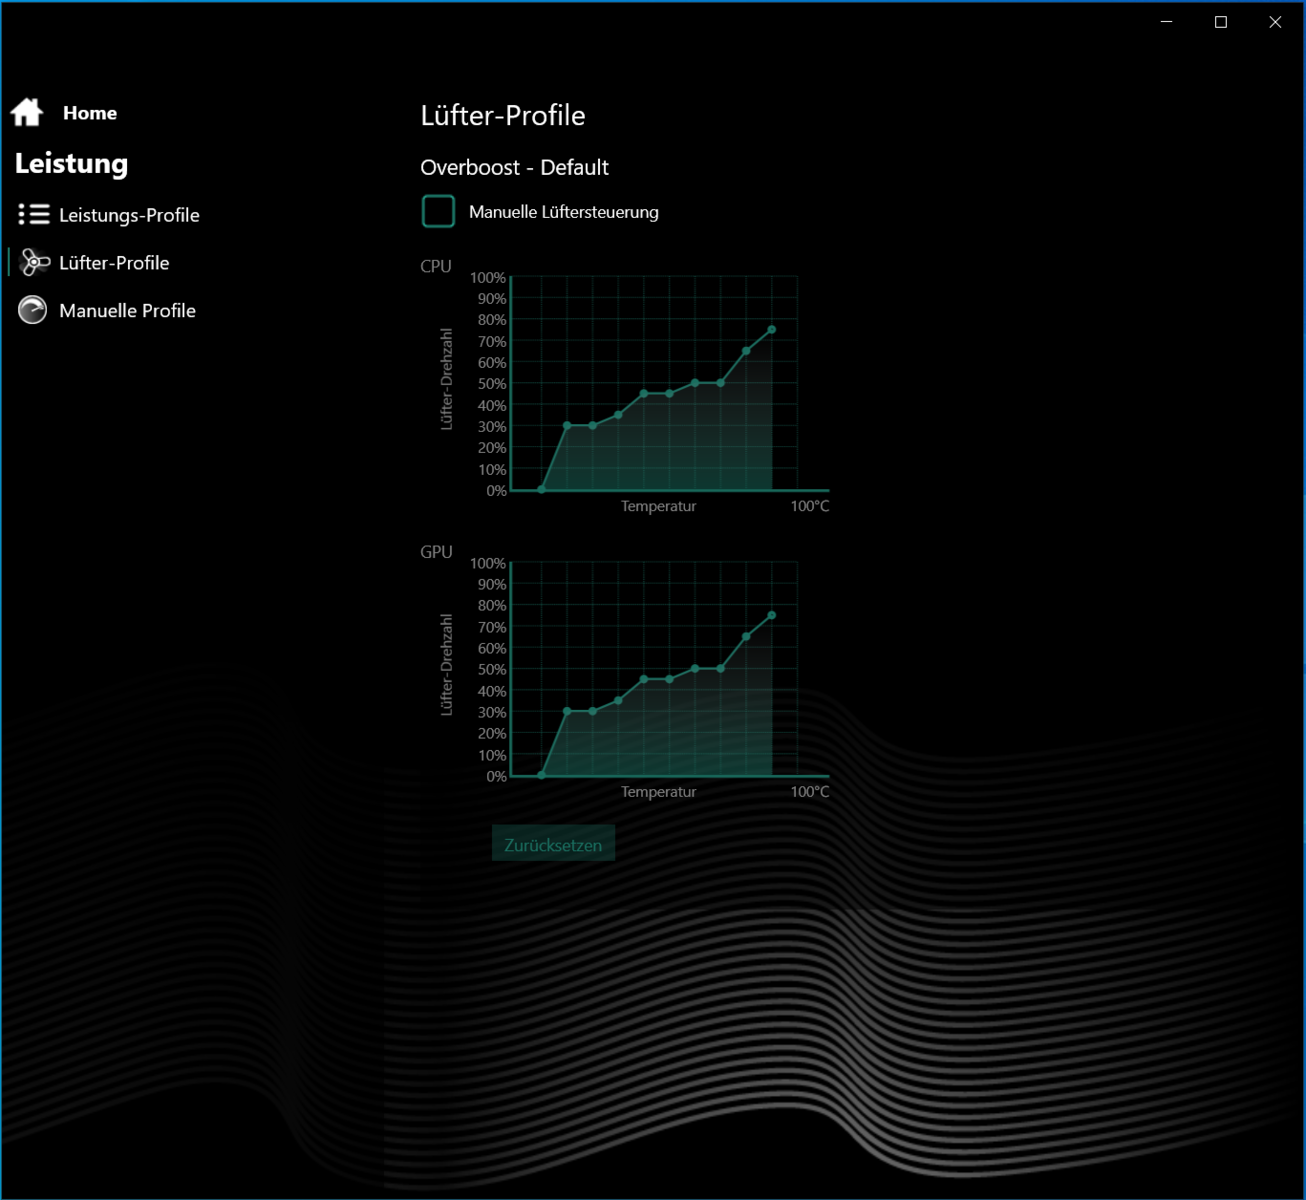
Aunque el control automático del ventilador hace que el portátil sea muy ruidoso bajo carga, puedes hacer algunos ajustes aquí, y el Centro de Control ofrece un control manual de las curvas del ventilador. Particularmente durante el juego (prueba"The Witcher 3"), aún hay algo de potencial de optimización en comparación con otros portátiles RTX 3060.
El display (WQHD, IPS, 165 Hz) ofrece un buen valor de brillo, ángulos de visión estables, tiempos de respuesta cortos, una buena reproducción del color, y una cobertura del espacio de color muy decente. Sin embargo, el contraste podría ser mayor, y la duración de la batería tampoco es muy inspiradora para nadie.
Ten en cuenta que algunas de las valoraciones de las categorías individuales son diferentes a las del Core 17 de 2019, ya que hemos actualizado el sistema de valoración. Esto significa que las valoraciones de ambos modelos Core 17 no son comparables.
Precio y disponibilidad
El Schenker XMG Core 17 (Early 2021) se puede configurar individualmente en la tienda online Schenker (Bestware) a partir de unos 1450 euros (~1773 dólares). La configuración del equipo que se nos proporcionó para las pruebas está disponible por unos 1840 euros (~2250 dólares)
Schenker XMG Core 17 (Early 2021)
- 05/31/2021 v7 (old)
Sascha Mölck
Price comparison

