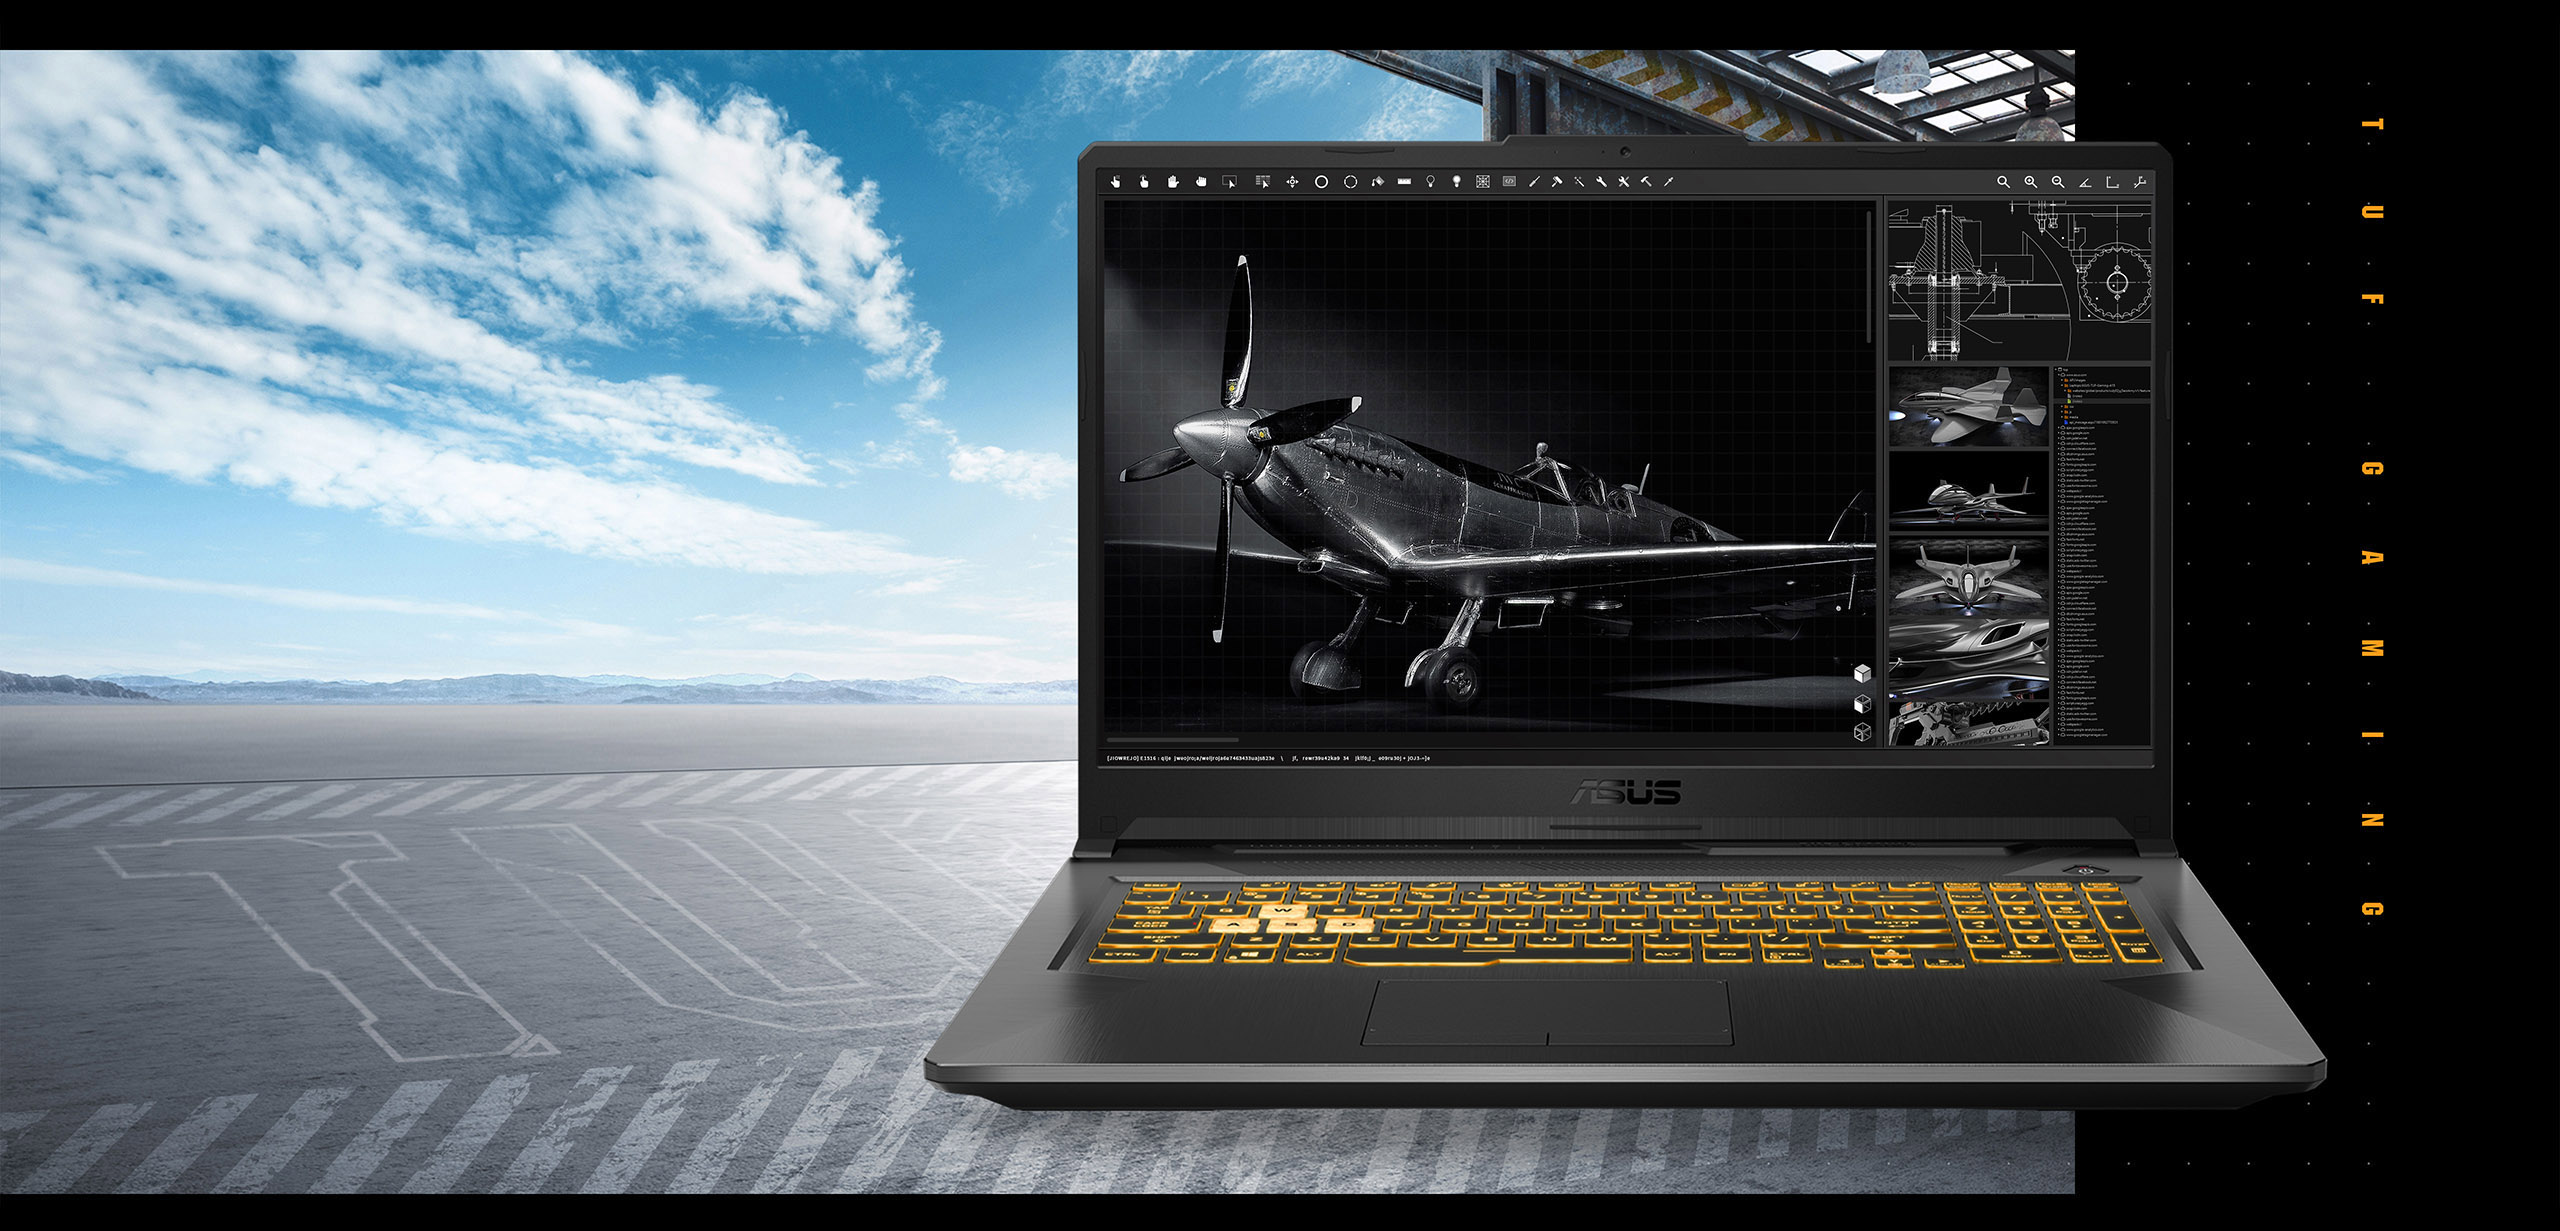
Análisis del portátil Asus TUF Gaming F17: Buen dispositivo para juegos con RTX 3060 pero pantalla media a pesar de los 144 Hz
Asus nos ha enviado su nuevo y asequible portátil para juegos TUF con un procesador Tiger Lake y una RTX 3060. El año pasado, analizamos el TUF A17, un modelo de la serie anterior equipado con un Ryzen 7 y una GTX 1660 Ti. El nuevo modelo debería ser mucho más rápido, al menos en aplicaciones gráficas y juegos, aunque el TGP total de 95 vatios está más bien en el rango de rendimiento medio-bajo de una RTX 3060. La pantalla ahora soporta 144 Hz en vez de los 120 Hz anteriores.
Además del predecesor virtual, naturalmente también queremos compararlo con la competencia que se encuentra en el mismo segmento de precios. Esto incluye principalmente el Schenker XMG Core 17, pero también elMSI Alpha 17y, a falta de más competencia de 17 pulgadas, elMSI GF65 Thiny elAcer Nitro 5 AN515-55rivales de 15 pulgadas.
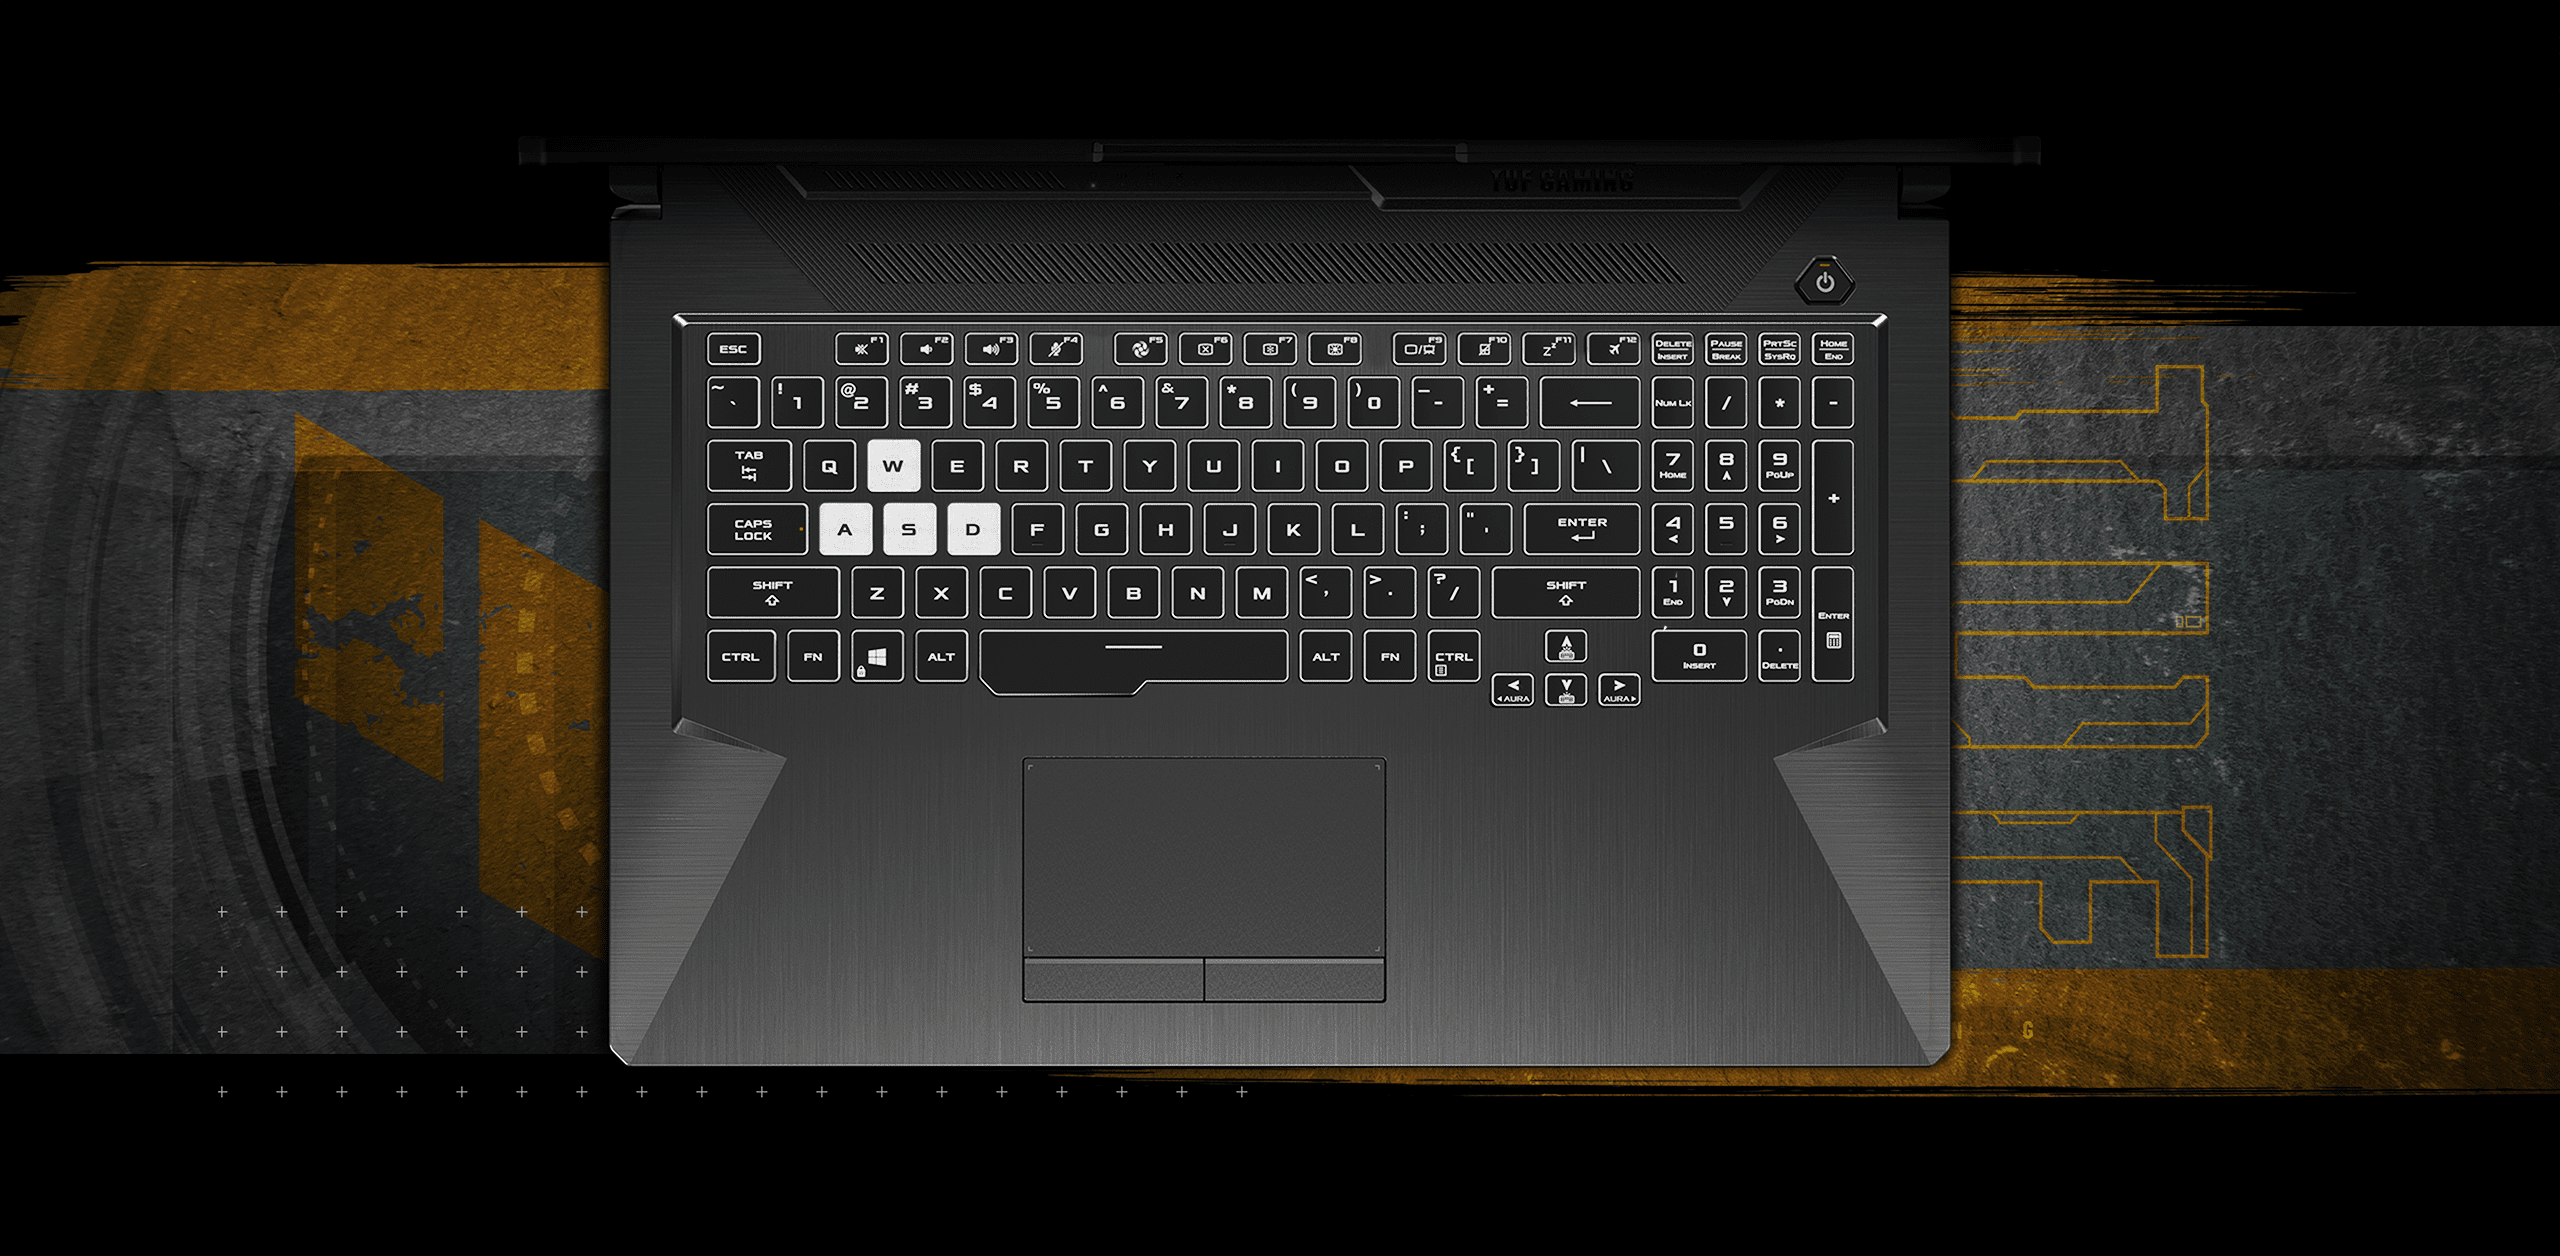
Como el exterior sigue siendo el mismo, no entraremos en detalles sobre la carcasa, el mantenimiento, los dispositivos de entrada, etc., mientras no haya cambios. Esta información se puede encontrar en la revisión del revisión del Asus TUF A17.
Possible contenders in comparison
Valoración | Fecha | Modelo | Peso | Altura | Tamaño | Resolución | Precio |
|---|---|---|---|---|---|---|---|
| 82.8 % v7 (old) | 06/2021 | Asus TUF Gaming F17 FX706HM i9-11900H, GeForce RTX 3060 Laptop GPU | 2.7 kg | 26 mm | 17.30" | 1920x1080 | |
| 82.9 % v7 (old) | 05/2020 | Asus TUF A17 FA706IU-AS76 R7 4800H, GeForce GTX 1660 Ti Mobile | 2.6 kg | 26 mm | 17.30" | 1920x1080 | |
| 83.9 % v7 (old) | 06/2021 | Schenker XMG Core 17 (Early 2021) i7-10870H, GeForce RTX 3060 Laptop GPU | 2.5 kg | 30.05 mm | 17.30" | 2560x1440 | |
| 83.3 % v7 (old) | 02/2021 | MSI Alpha 17 A4DEK R7 4800H, Radeon RX 5600M | 2.6 kg | 28 mm | 17.30" | 1920x1080 | |
| 80.4 % v7 (old) | 03/2021 | MSI GF65 Thin 10UE i7-10750H, GeForce RTX 3060 Laptop GPU | 1.9 kg | 21.7 mm | 15.60" | 1920x1080 | |
| 80.5 % v7 (old) | 05/2021 | Acer Aspire Nitro 5 AN515-55-57GF i5-10300H, GeForce RTX 3060 Laptop GPU | 2.3 kg | 23.9 mm | 15.60" | 1920x1080 |
Caja - Más pequeña y con más metal
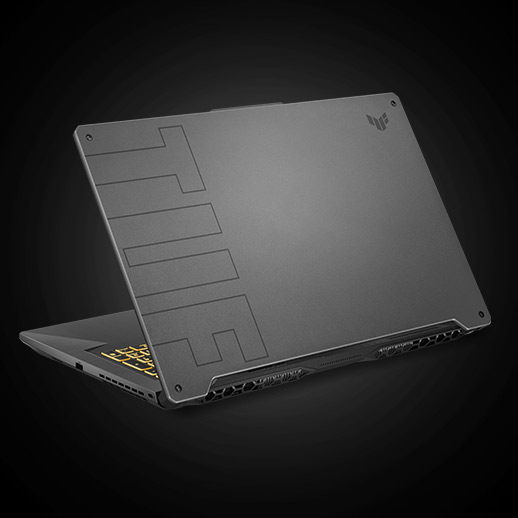


El MSI Alpha es ligeramente más profundo y grueso, mientras que el Schenker XMG es más grueso pero más pequeño en general. Nuestro F17 es casi el dispositivo más pesado en comparación
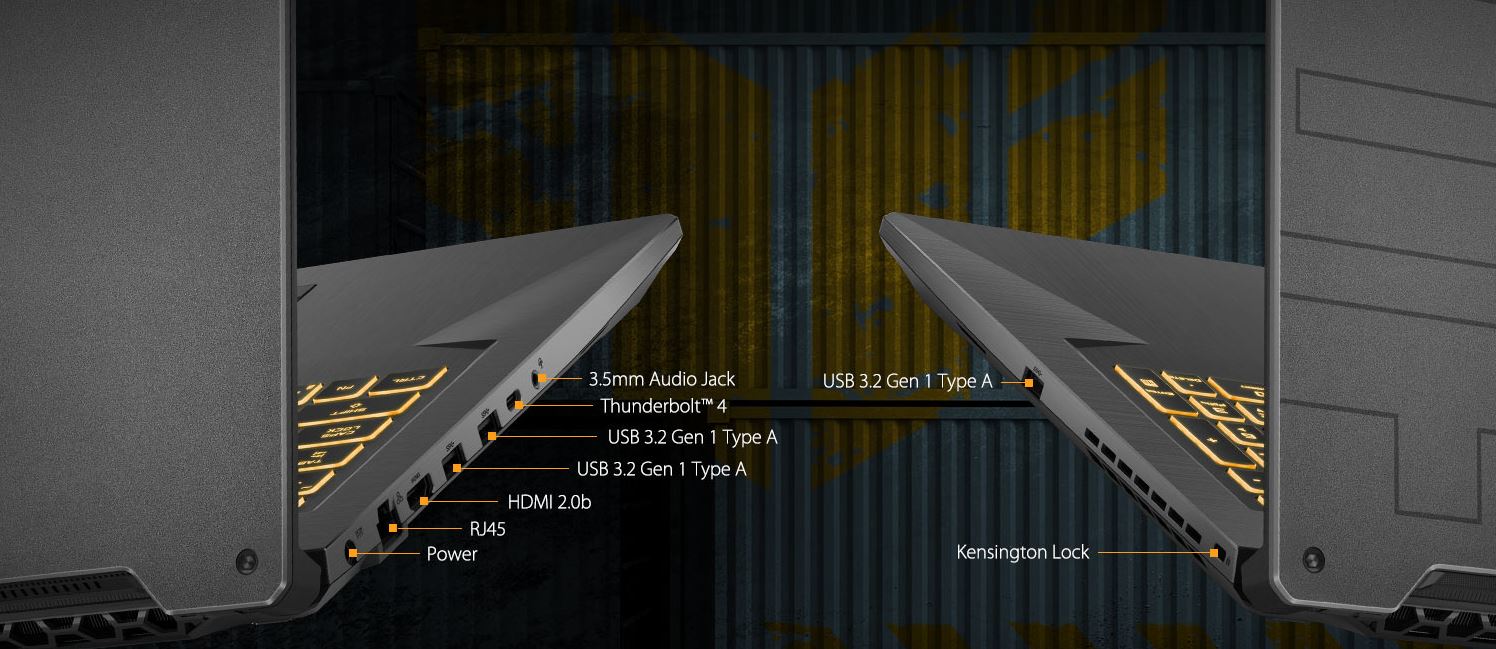
Conectividad - Thunderbolt 4
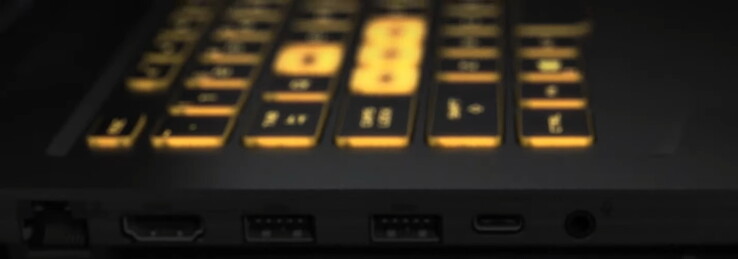
Es genial que el F17 haya integrado Thunderbolt 4. El resto de puertos son los estándar, y su distribución está muy concentrada en el lado izquierdo, lo que es muy conveniente para los usuarios diestros. No hay puertos en la parte delantera ni en la trasera. Una característica que se echa en falta es el lector de tarjetas SD
Comunicación
En términos de Bluetooth, el F17 ofrece el último Bluetooth 5.2, pero el dispositivo de Asus se queda atrás en términos de velocidad de transferencia Wi-Fi. La velocidad de recepción de datos, en particular, está por debajo de la media; el A17 tampoco puntuó especialmente bien en este aspecto, y la competencia es más rápida
Cámara web


Seguridad
Dispone de una ranura para un candado Kensington y también es compatible con TPM 2.0.
Accesorios
A excepción de los folletos habituales, el único extra es una hoja de papel de tamaño A5 con pegatinas de juegos TUF
Garantía
El fabricante ofrece una garantía estándar de un año
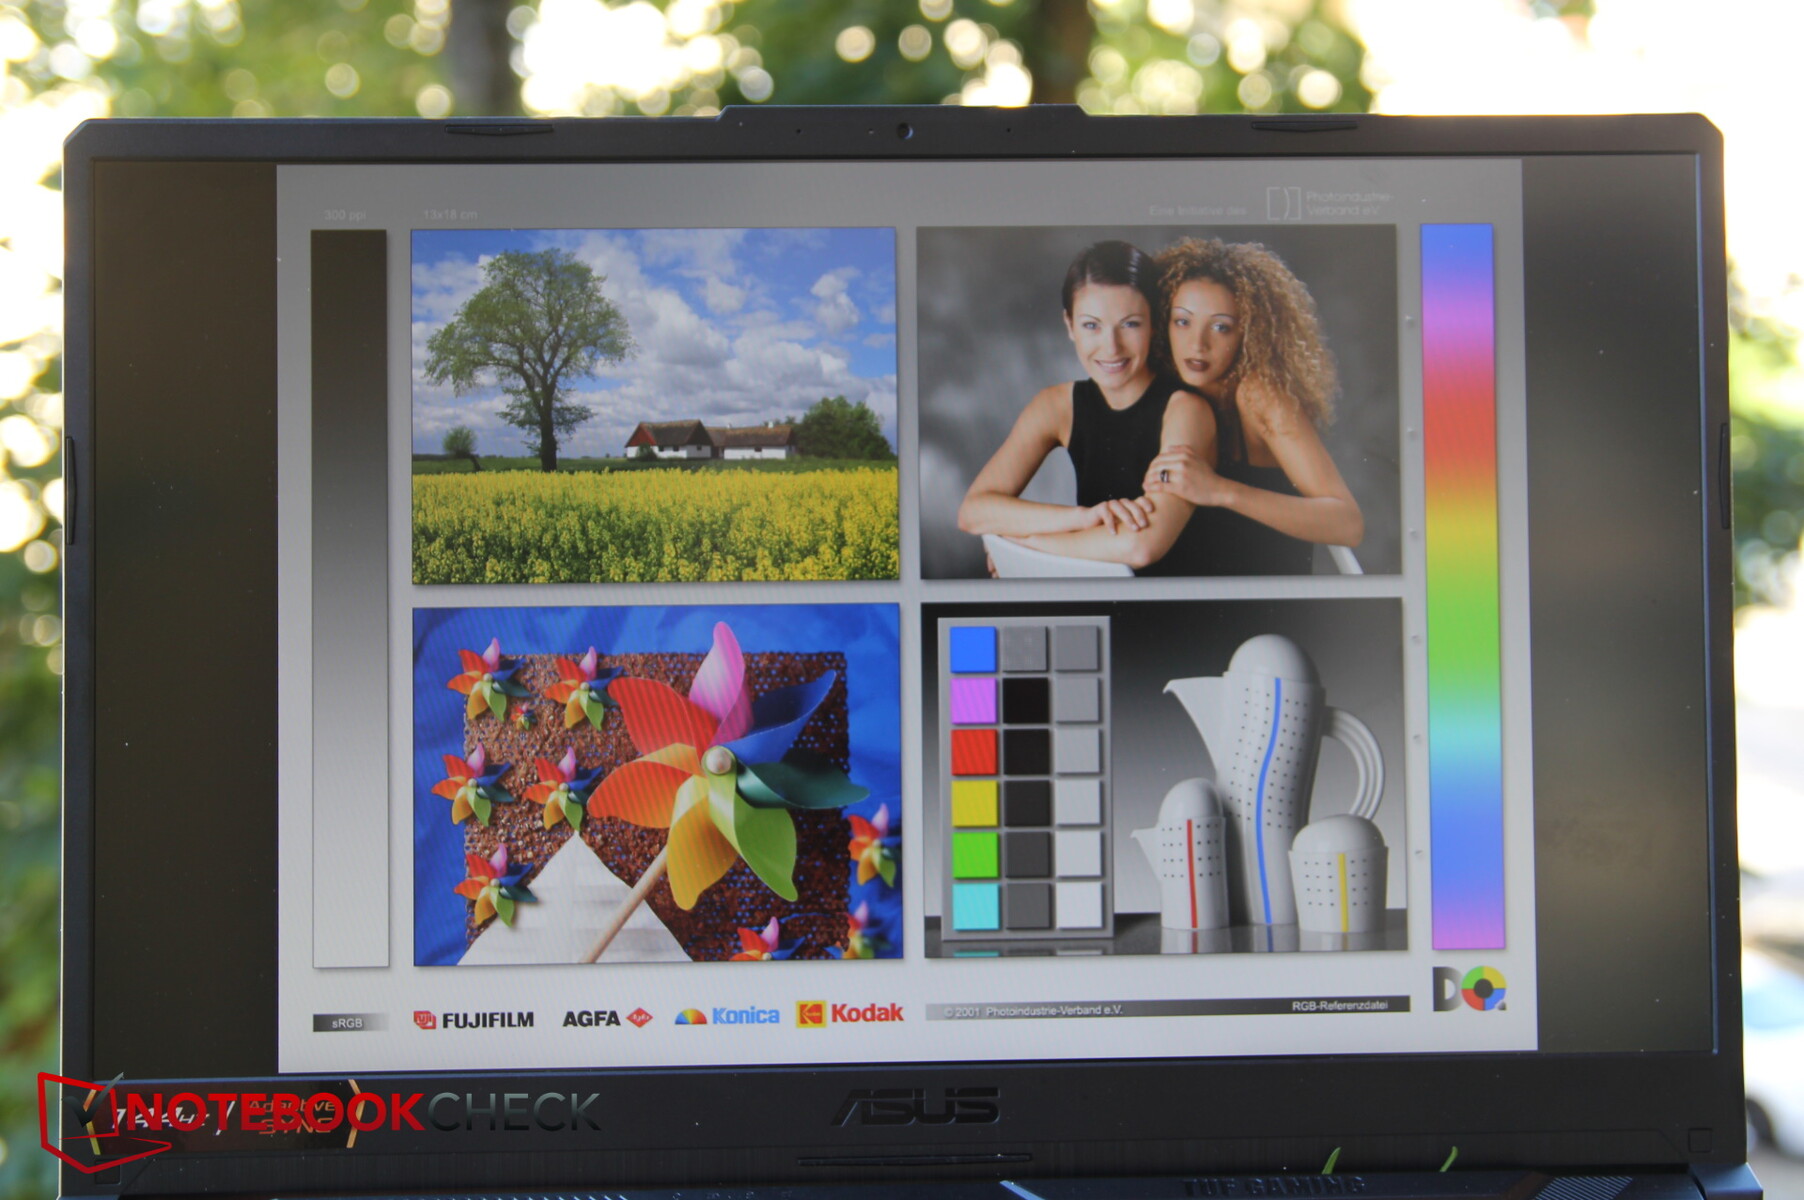
Pantalla - Hay mejores opciones
No tenemos la mejor configuración en lo que respecta a la pantalla, ya que sigue habiendo una variante con una cobertura sRGB del 100% y una tasa de refresco de 300 Hz.
El modelo actual es un display IPS Full HD mate de 17.3 pulgadas con una tasa de refresco de 144 Hz y Adaptive Sync. El panel de AU Optronics ofrece de todo menos tasas máximas, lo que no es inusual en este rango de precios. La competencia incluso rinde peor aquí en algunos casos, y sólo el display del Schenker es mejor.
El brillo medio de 264 nits está apenas bien, pero la distribución del brillo de sólo el 79% es extremadamente desigual. El brillo máximo se reduce mucho con la batería, y sólo registramos 144 nits, pero esto se puede desactivar en el controlador.
Por desgracia, los tiempos de respuesta tampoco son geniales para un dispositivo de juego, lo que puede tener un impacto negativo en los shooters muy rápidos.
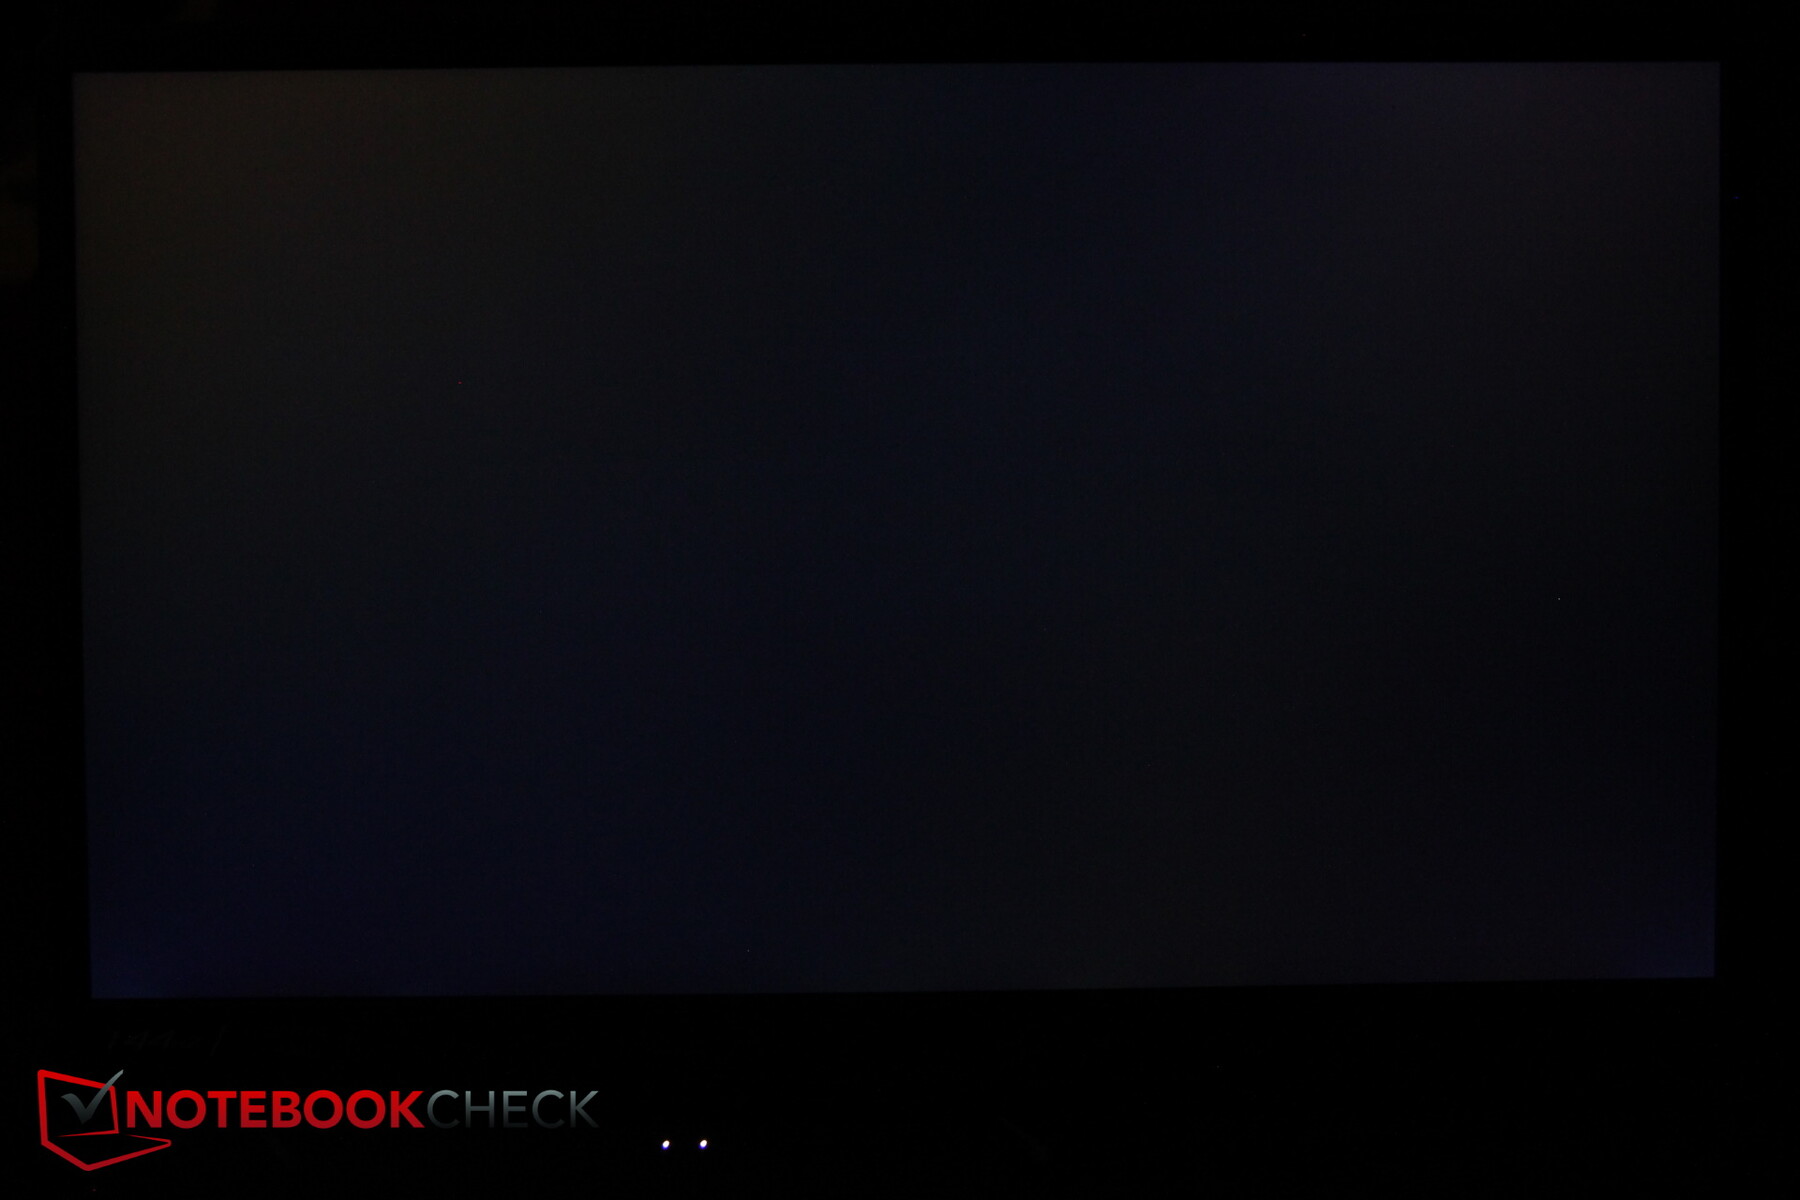
El sangrado de pantalla está mínimamente presente en las esquinas y los bordes, pero apenas se nota incluso en escenas oscuras y, por tanto, no es molesto.
| |||||||||||||||||||||||||
iluminación: 79 %
Brillo con batería: 144 cd/m²
Contraste: 831:1 (Negro: 0.32 cd/m²)
ΔE ColorChecker Calman: 3.97 | ∀{0.5-29.43 Ø4.73}
calibrated: 3.5
ΔE Greyscale Calman: 1.8 | ∀{0.09-98 Ø4.97}
60% sRGB (Argyll 1.6.3 3D)
41.4% AdobeRGB 1998 (Argyll 1.6.3 3D)
41.4% AdobeRGB 1998 (Argyll 3D)
60% sRGB (Argyll 3D)
40.1% Display P3 (Argyll 3D)
Gamma: 2.31
CCT: 6754 K
| Asus TUF Gaming F17 FX706HM AU Optronics AUI8294 (B173HAN04.9), IPS, 1920x1080, 17.3" | Asus TUF A17 FA706IU-AS76 BOE NV173FHM-NX1, IPS, 1920x1080, 17.3" | Schenker XMG Core 17 (Early 2021) BOE CQ NE173QHM-NY2, IPS, 2560x1440, 17.3" | MSI Alpha 17 A4DEK AU Optronics AUO978F, IPS, 1920x1080, 17.3" | MSI GF65 Thin 10UE AU Optronics B156HAN08.4, IPS, 1920x1080, 15.6" | |
|---|---|---|---|---|---|
| Display | 1% | 67% | -1% | -6% | |
| Display P3 Coverage (%) | 40.1 | 40.55 1% | 68.1 70% | 39.55 -1% | 37.65 -6% |
| sRGB Coverage (%) | 60 | 59.7 0% | 98.5 64% | 59.2 -1% | 56.3 -6% |
| AdobeRGB 1998 Coverage (%) | 41.4 | 41.89 1% | 69.3 67% | 40.86 -1% | 38.9 -6% |
| Response Times | 23% | 52% | -27% | -28% | |
| Response Time Grey 50% / Grey 80% * (ms) | 32.4 | 22.4 ? 31% | 16.8 ? 48% | 40 ? -23% | 36.8 ? -14% |
| Response Time Black / White * (ms) | 22.4 | 19.2 ? 14% | 10 ? 55% | 29.2 ? -30% | 31.6 ? -41% |
| PWM Frequency (Hz) | |||||
| Screen | -12% | 18% | -13% | -18% | |
| Brightness middle (cd/m²) | 266 | 264.8 0% | 370 39% | 254 -5% | 266.5 0% |
| Brightness (cd/m²) | 264 | 253 -4% | 333 26% | 254 -4% | 262 -1% |
| Brightness Distribution (%) | 79 | 90 14% | 84 6% | 93 18% | 91 15% |
| Black Level * (cd/m²) | 0.32 | 0.31 3% | 0.38 -19% | 0.23 28% | 0.18 44% |
| Contrast (:1) | 831 | 854 3% | 974 17% | 1104 33% | 1481 78% |
| Colorchecker dE 2000 * | 3.97 | 4.73 -19% | 2.41 39% | 4.12 -4% | 5.33 -34% |
| Colorchecker dE 2000 max. * | 8.93 | 18.89 -112% | 7.32 18% | 19.66 -120% | 18.28 -105% |
| Colorchecker dE 2000 calibrated * | 3.5 | 4.64 -33% | 1.19 66% | 3.78 -8% | 4.36 -25% |
| Greyscale dE 2000 * | 1.8 | 1.4 22% | 3.9 -117% | 3.2 -78% | 4.5 -150% |
| Gamma | 2.31 95% | 2.16 102% | 2.287 96% | 2.179 101% | 2.35 94% |
| CCT | 6754 96% | 6641 98% | 7302 89% | 6754 96% | 6289 103% |
| Color Space (Percent of AdobeRGB 1998) (%) | 41.4 | 38.4 -7% | 69 67% | 41 -1% | 35.6 -14% |
| Color Space (Percent of sRGB) (%) | 60 | 59.3 -1% | 93 55% | 59 -2% | 55.8 -7% |
| Media total (Programa/Opciones) | 4% /
-5% | 46% /
31% | -14% /
-12% | -17% /
-17% |
* ... más pequeño es mejor
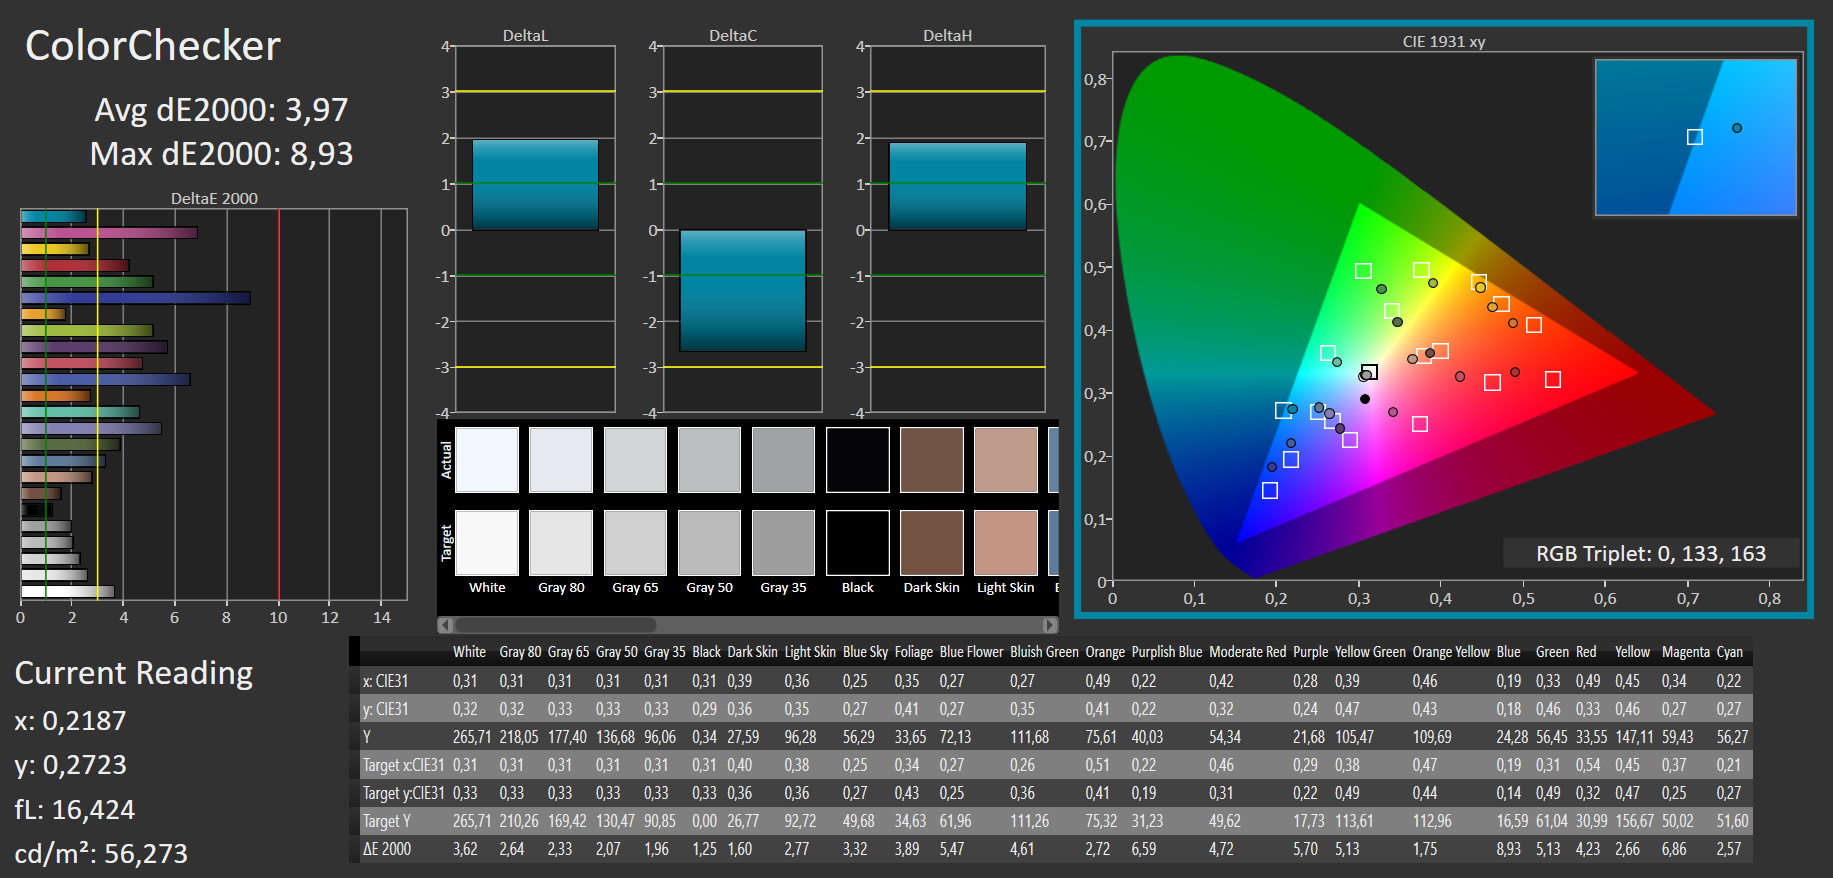
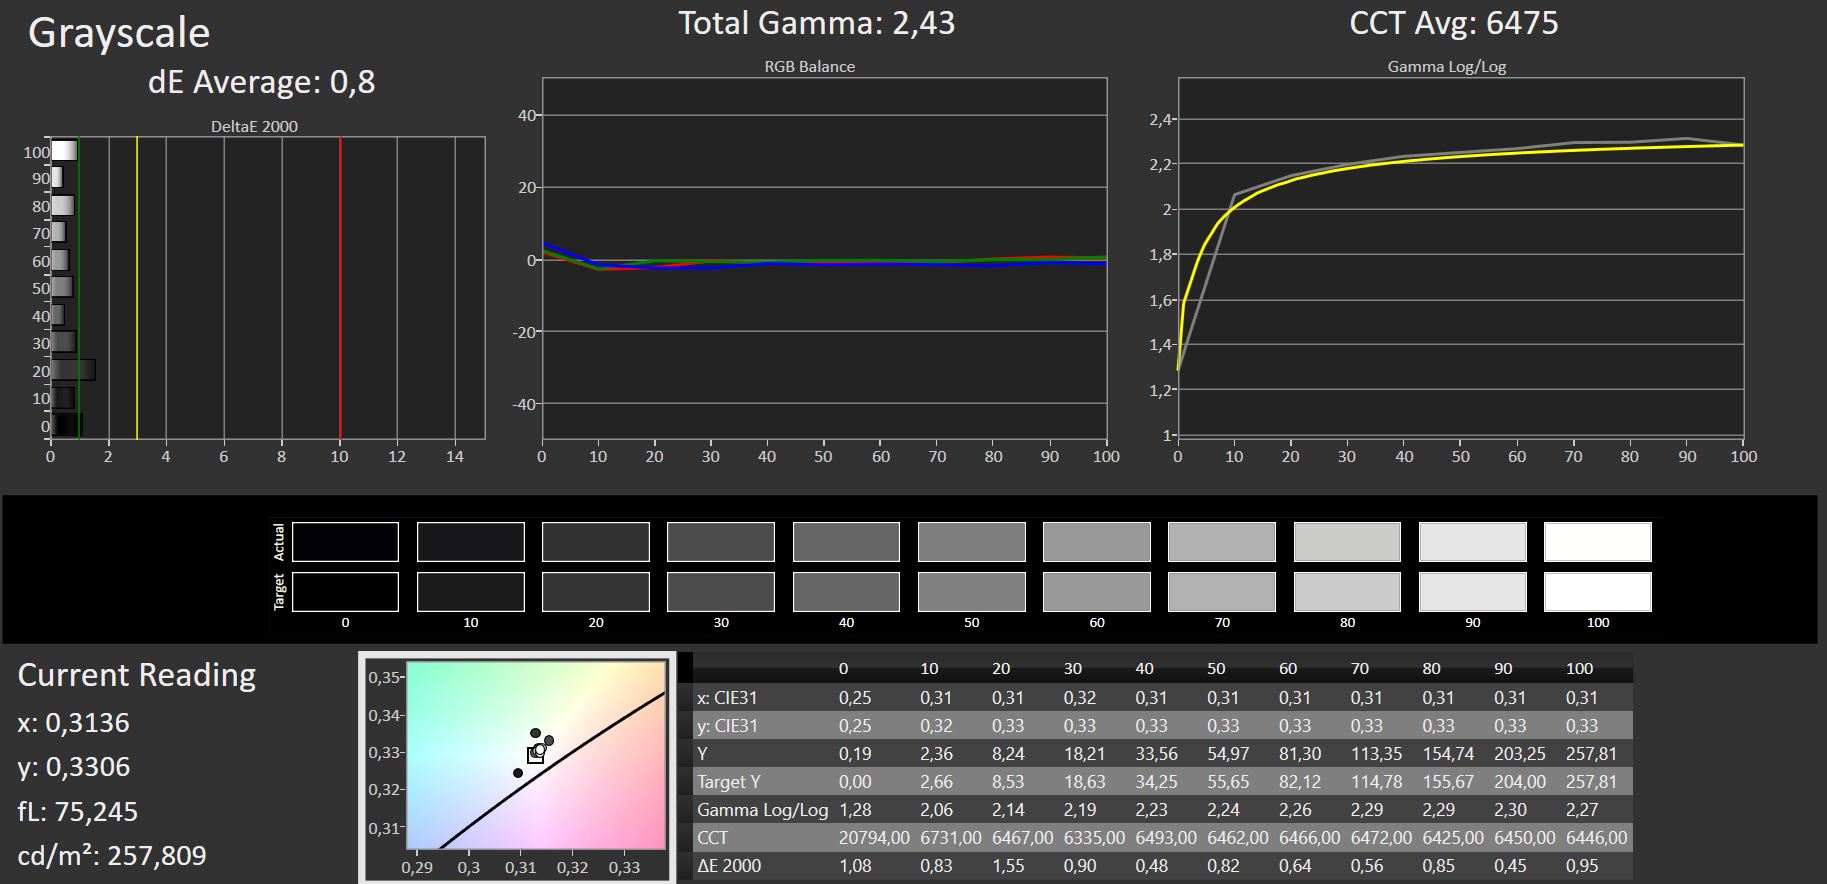
El nivel de negro es aceptable, pero el contraste está claramente por debajo de 1.000:1 y podría mejorarse en consecuencia.
La pantalla está calibrada bastante bien al menos, y las desviaciones de color son bastante bajas. La calibración manual sólo permite reducirlas mínimamente.

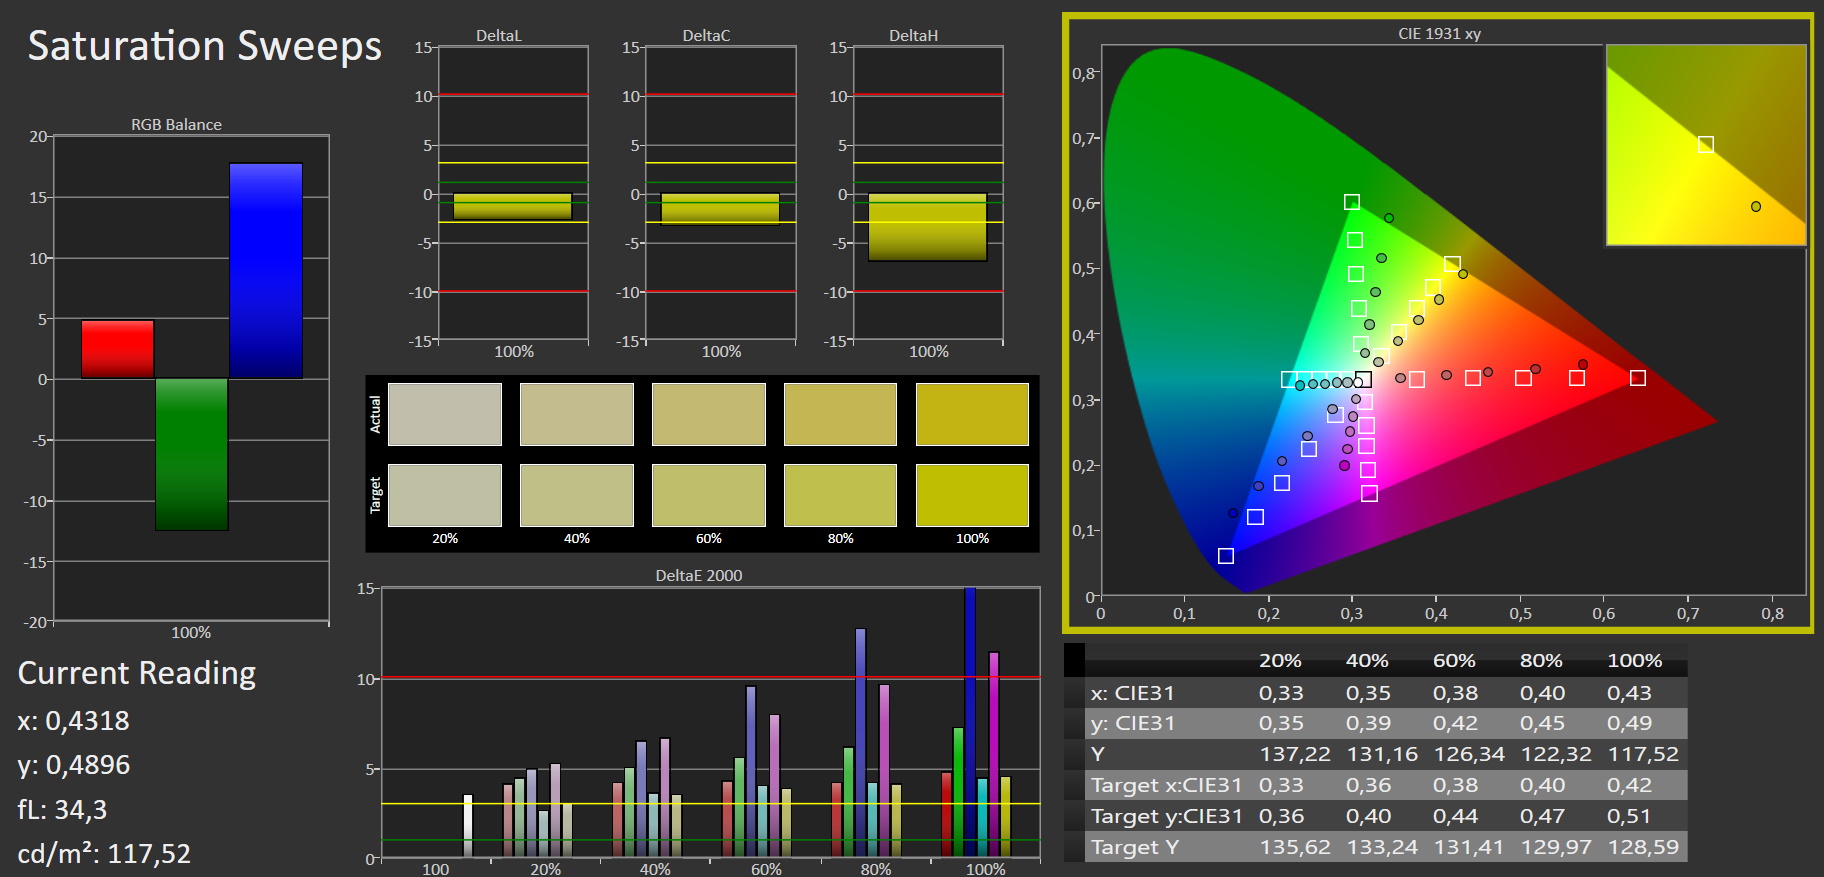
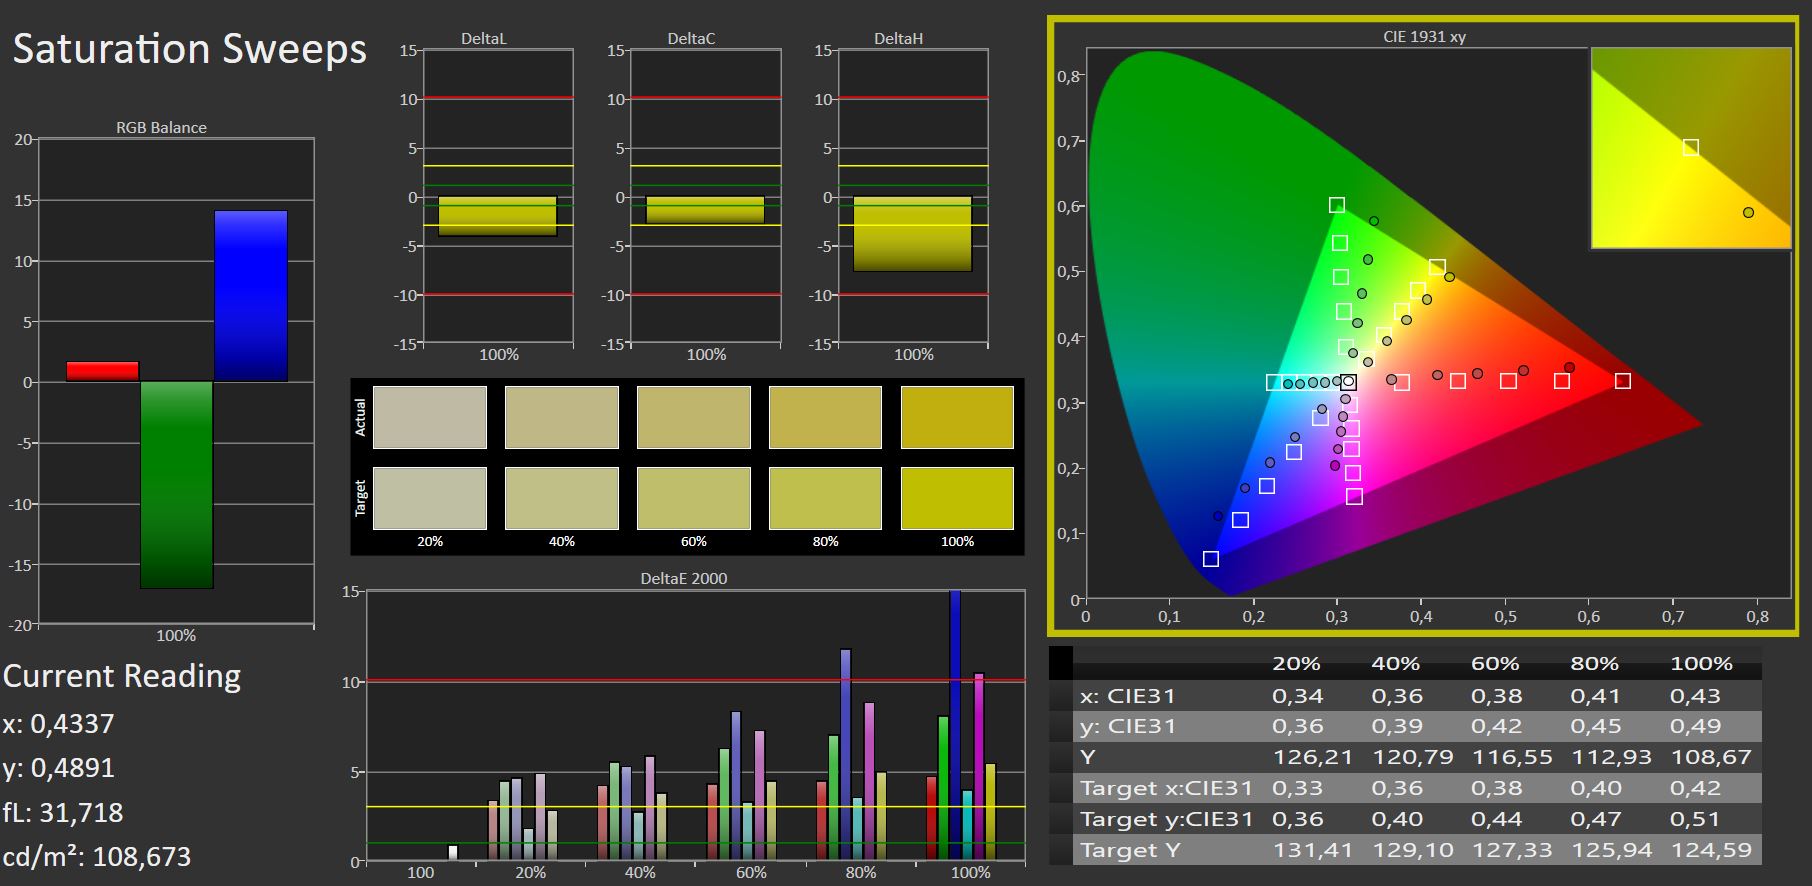
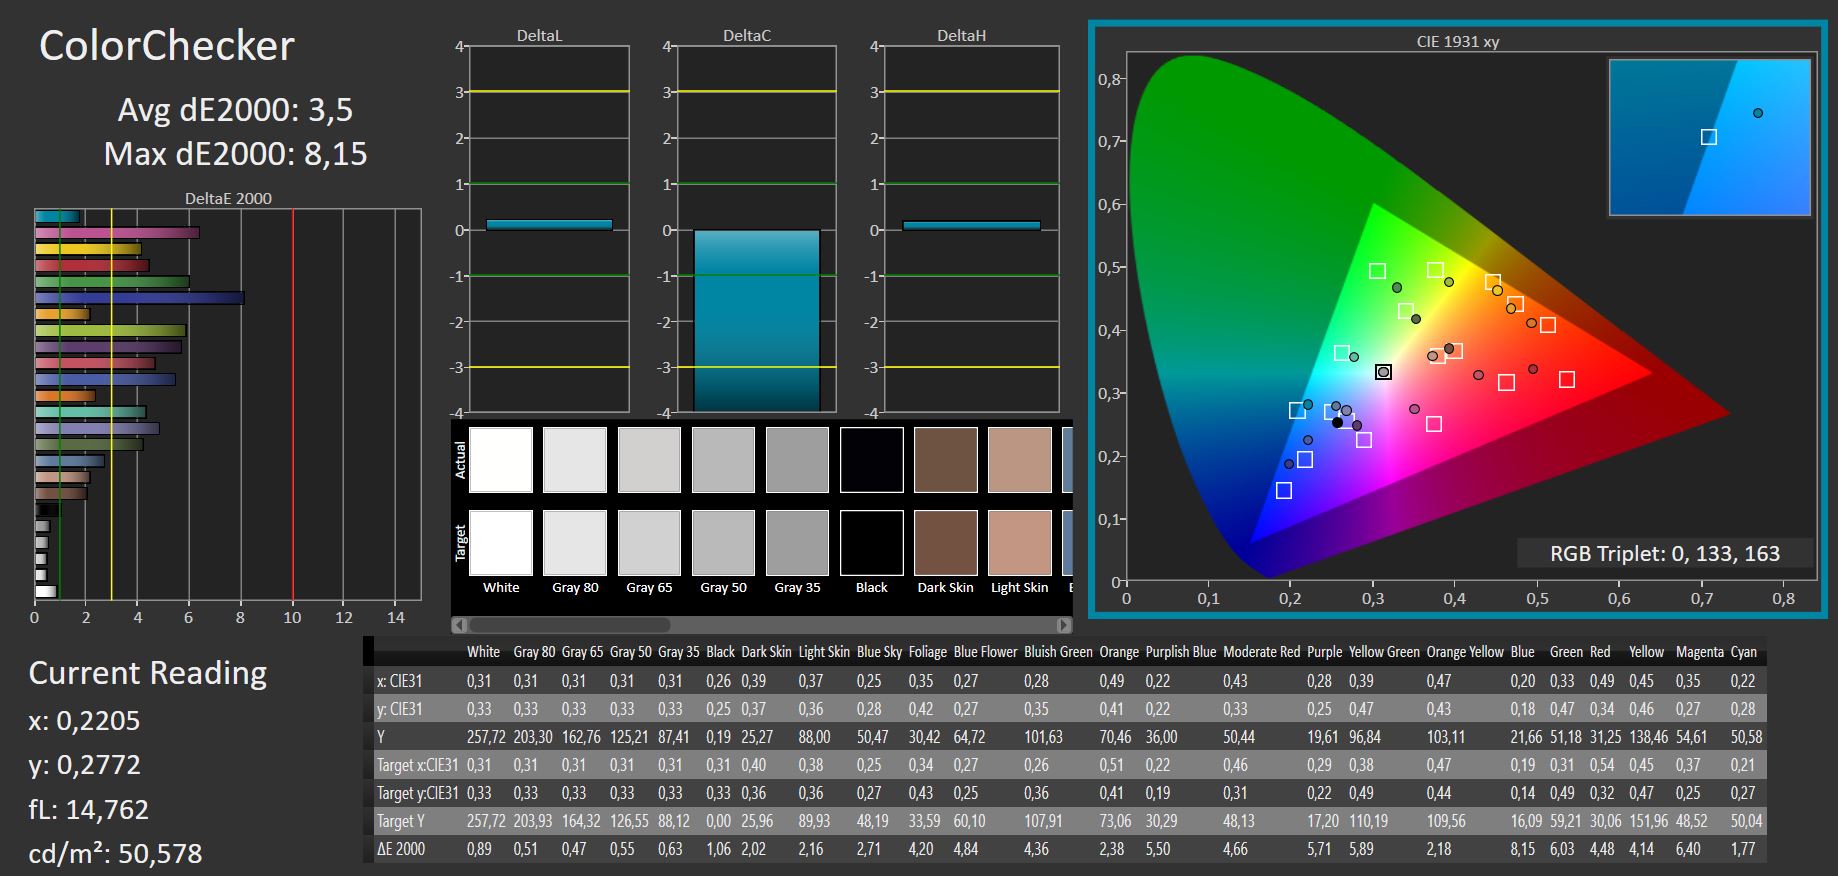
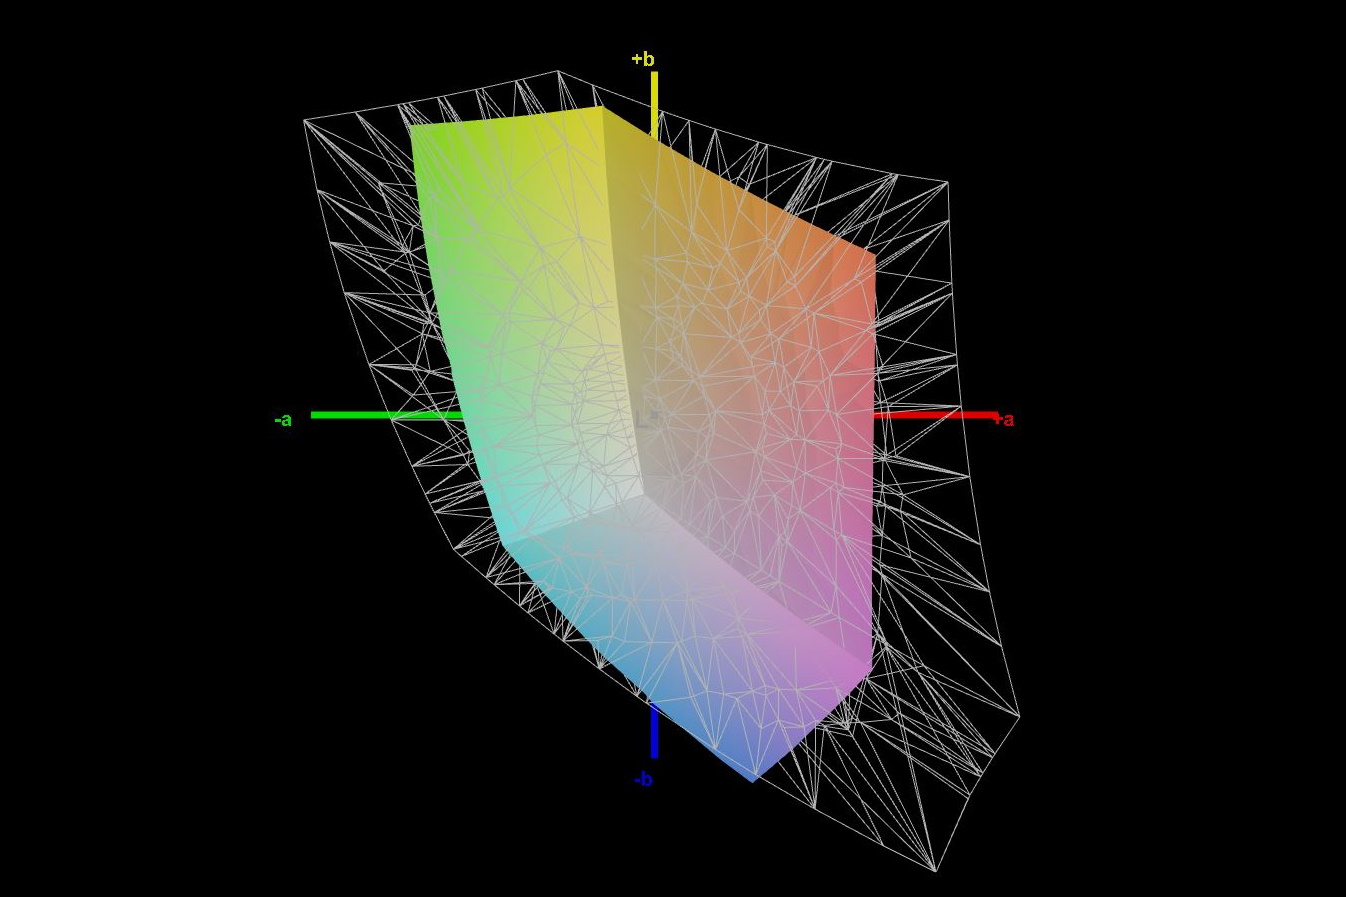
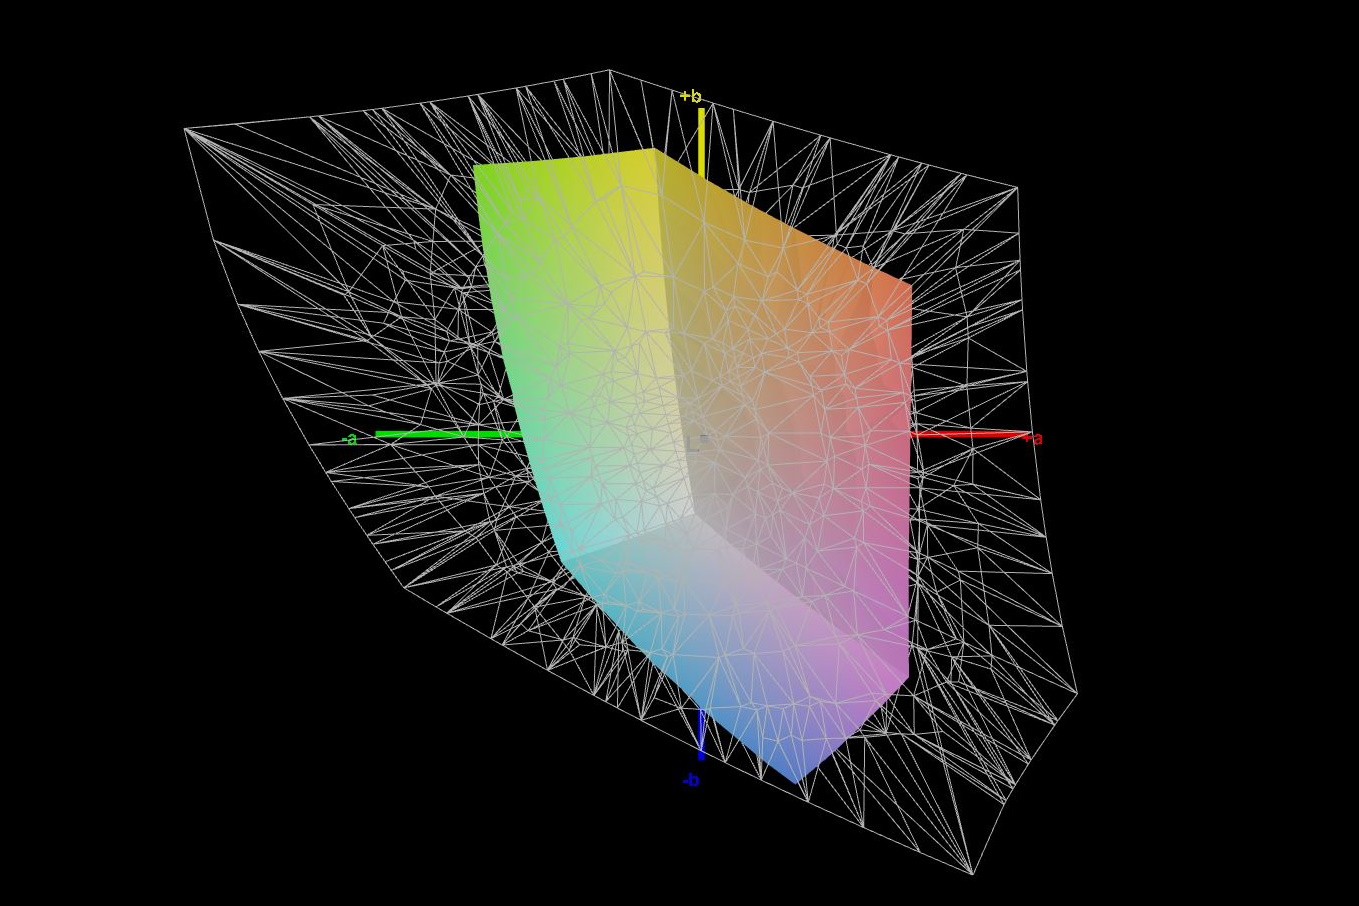
El espacio de color disponible es bastante estrecho; sólo el 60% de sRGB y el 41% de AdobeRGB no son índices particularmente buenos. Sin embargo, la competencia puntúa igualmente mal aquí, y sólo el portátil Schenker, ligeramente más caro, puede hacer un mejor trabajo
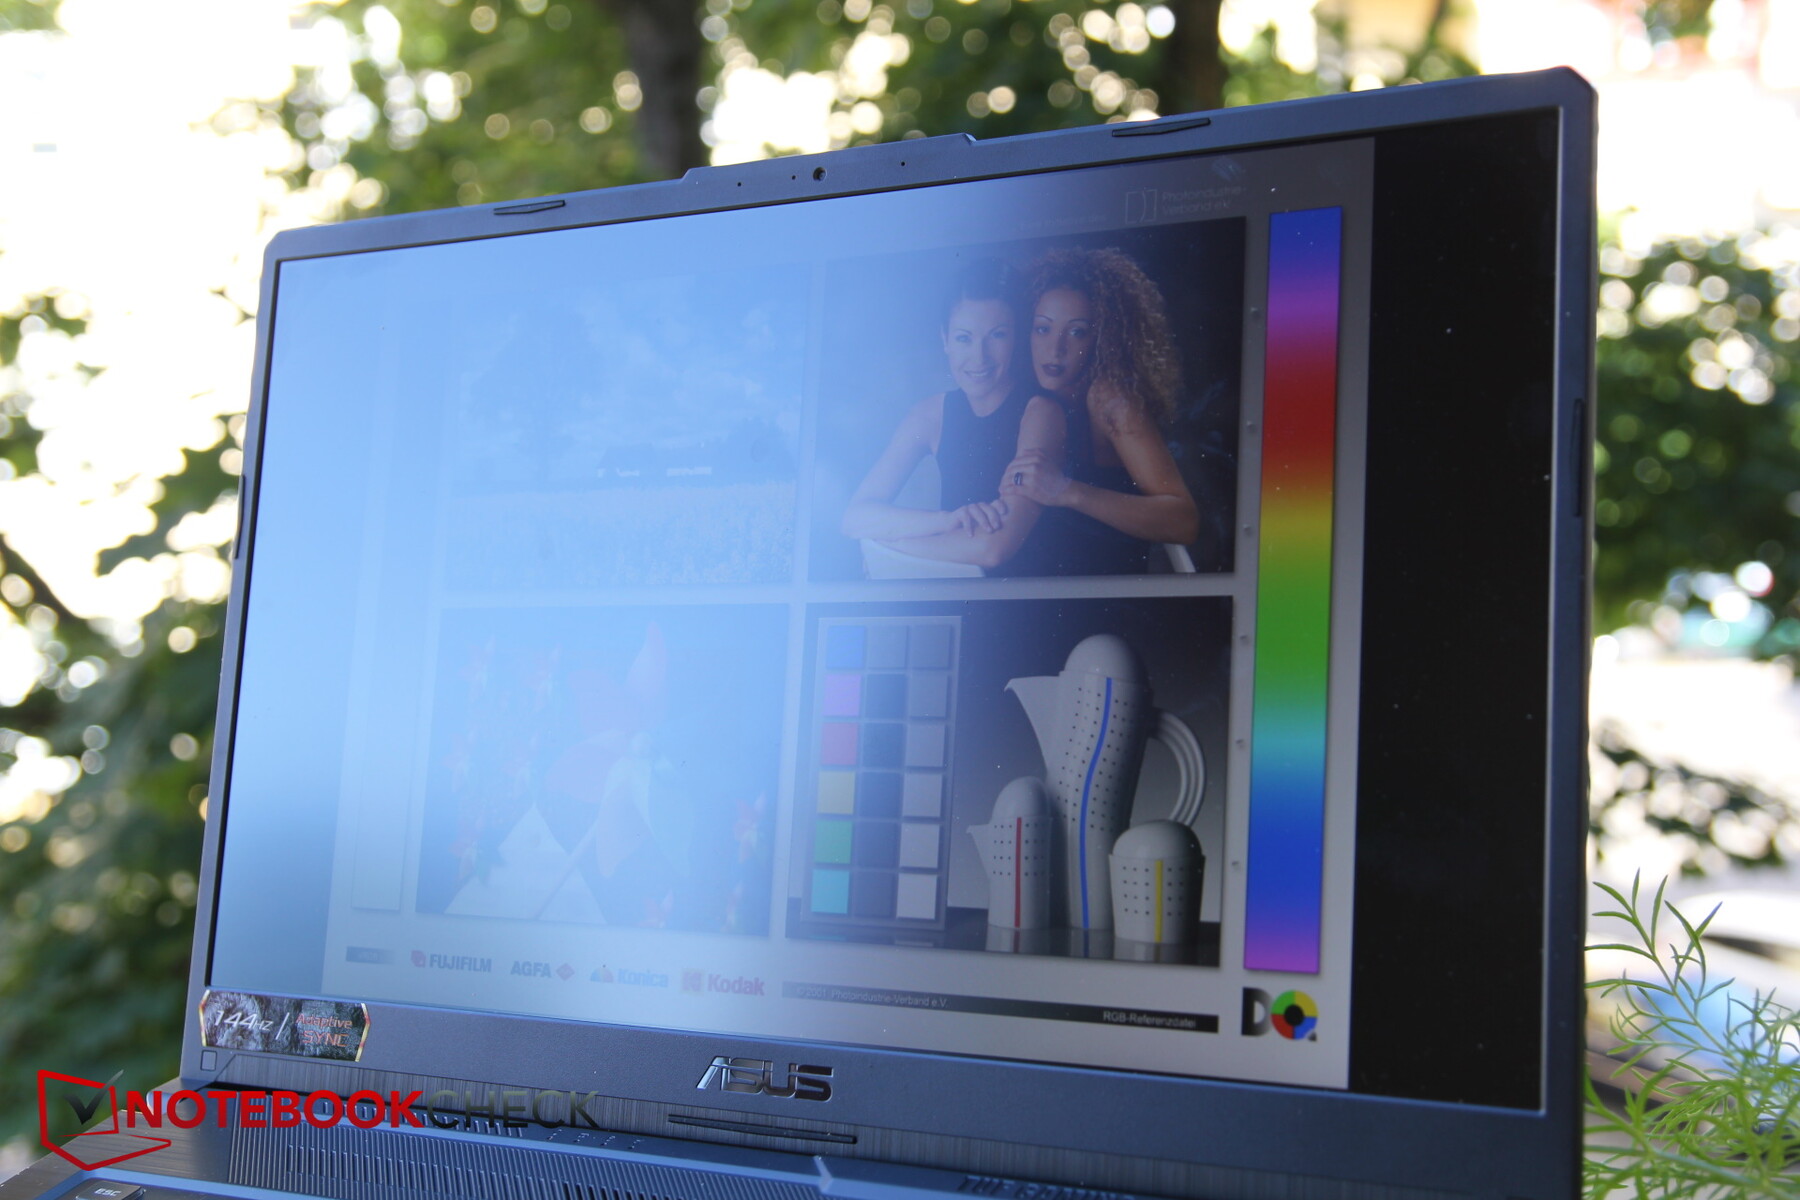
Aunque la superficie mate elimina la mayoría de los reflejos, como el brillo, ya de por sí moderado, se reduce adicionalmente de forma considerable con la batería, la visibilidad en exteriores no es óptima. Recomendamos buscar un lugar con mucha sombra y ver la pantalla desde un ángulo directo
Tiempos de respuesta del display
| ↔ Tiempo de respuesta de Negro a Blanco | ||
|---|---|---|
| 22.4 ms ... subida ↗ y bajada ↘ combinada | ↗ ms subida |  |
| ↘ ms bajada | ||
| La pantalla mostró buenos tiempos de respuesta en nuestros tests pero podría ser demasiado lenta para los jugones competitivos. En comparación, todos los dispositivos de prueba van de ##min### (mínimo) a 240 (máximo) ms. » 50 % de todos los dispositivos son mejores. Eso quiere decir que el tiempo de respuesta es peor que la media (19.9 ms) de todos los dispositivos testados. | ||
| ↔ Tiempo de respuesta 50% Gris a 80% Gris | ||
| 32.4 ms ... subida ↗ y bajada ↘ combinada | ↗ ms subida |  |
| ↘ ms bajada | ||
| La pantalla mostró tiempos de respuesta lentos en nuestros tests y podría ser demasiado lenta para los jugones. En comparación, todos los dispositivos de prueba van de ##min### (mínimo) a 636 (máximo) ms. » 44 % de todos los dispositivos son mejores. Eso quiere decir que el tiempo de respuesta es similar al dispositivo testado medio (31.1 ms). | ||
Parpadeo de Pantalla / PWM (Pulse-Width Modulation)
| Parpadeo de Pantalla / PWM no detectado |  | ||
Comparación: 52 % de todos los dispositivos testados no usaron PWM para atenuar el display. Si se usó, medimos una media de 7791 (mínimo: 5 - máxmo: 343500) Hz. | |||
Teniendo en cuenta que se trata de un panel IPS, la estabilidad del ángulo de visión podría ser mejor. Cuando se mira la pantalla desde ángulos oblicuos, las pérdidas de brillo se notan con bastante rapidez

Rendimiento - Cumple bien las expectativas
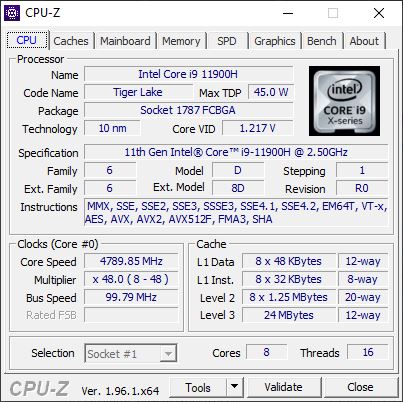
Dado que el juego ya está incluido en el nombre del F17, el portátil tiene que demostrar su valía precisamente en este campo. UnIntel Core i9-11900H junto con una GPU Nvidia GeForce RTX 3060 Laptop, y 16 GB de RAM ilustran estas ambiciones, aunque los portátiles de 17 pulgadas suelen contar con un hardware incluso de mayor rendimiento. Pero el F17 también es un dispositivo de juego para clientes preocupados por el precio, por lo que el TUF Gaming también estará disponible con unaRTX 3050o3050 Tien un futuro próximo. Asimismo, esta CPU representa la configuración superior, con modelos Core i7 y Core i5 también disponibles como alternativas.
El software MyAsus maneja teóricamente todos los perfiles de rendimiento y de ventilador relevantes. Teóricamente, porque Asus parece estar usando un nuevo software en este momento, y se nos señala el programa Asus Armoury Crate dentro de MyAsus. En realidad, todos los ajustes relevantes se pueden encontrar aquí, pero el software es bastante desordenado. Para las pruebas de rendimiento, hemos puesto el perfil del ventilador en "Windows", lo que significa que Windows decide y que sus perfiles de rendimiento tienen prioridad. Hemos puesto el control deslizante de Windows en "Mejor rendimiento".
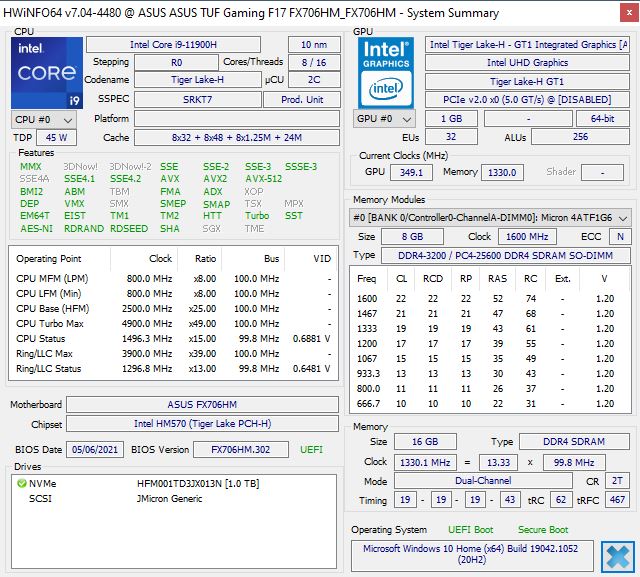
Procesador
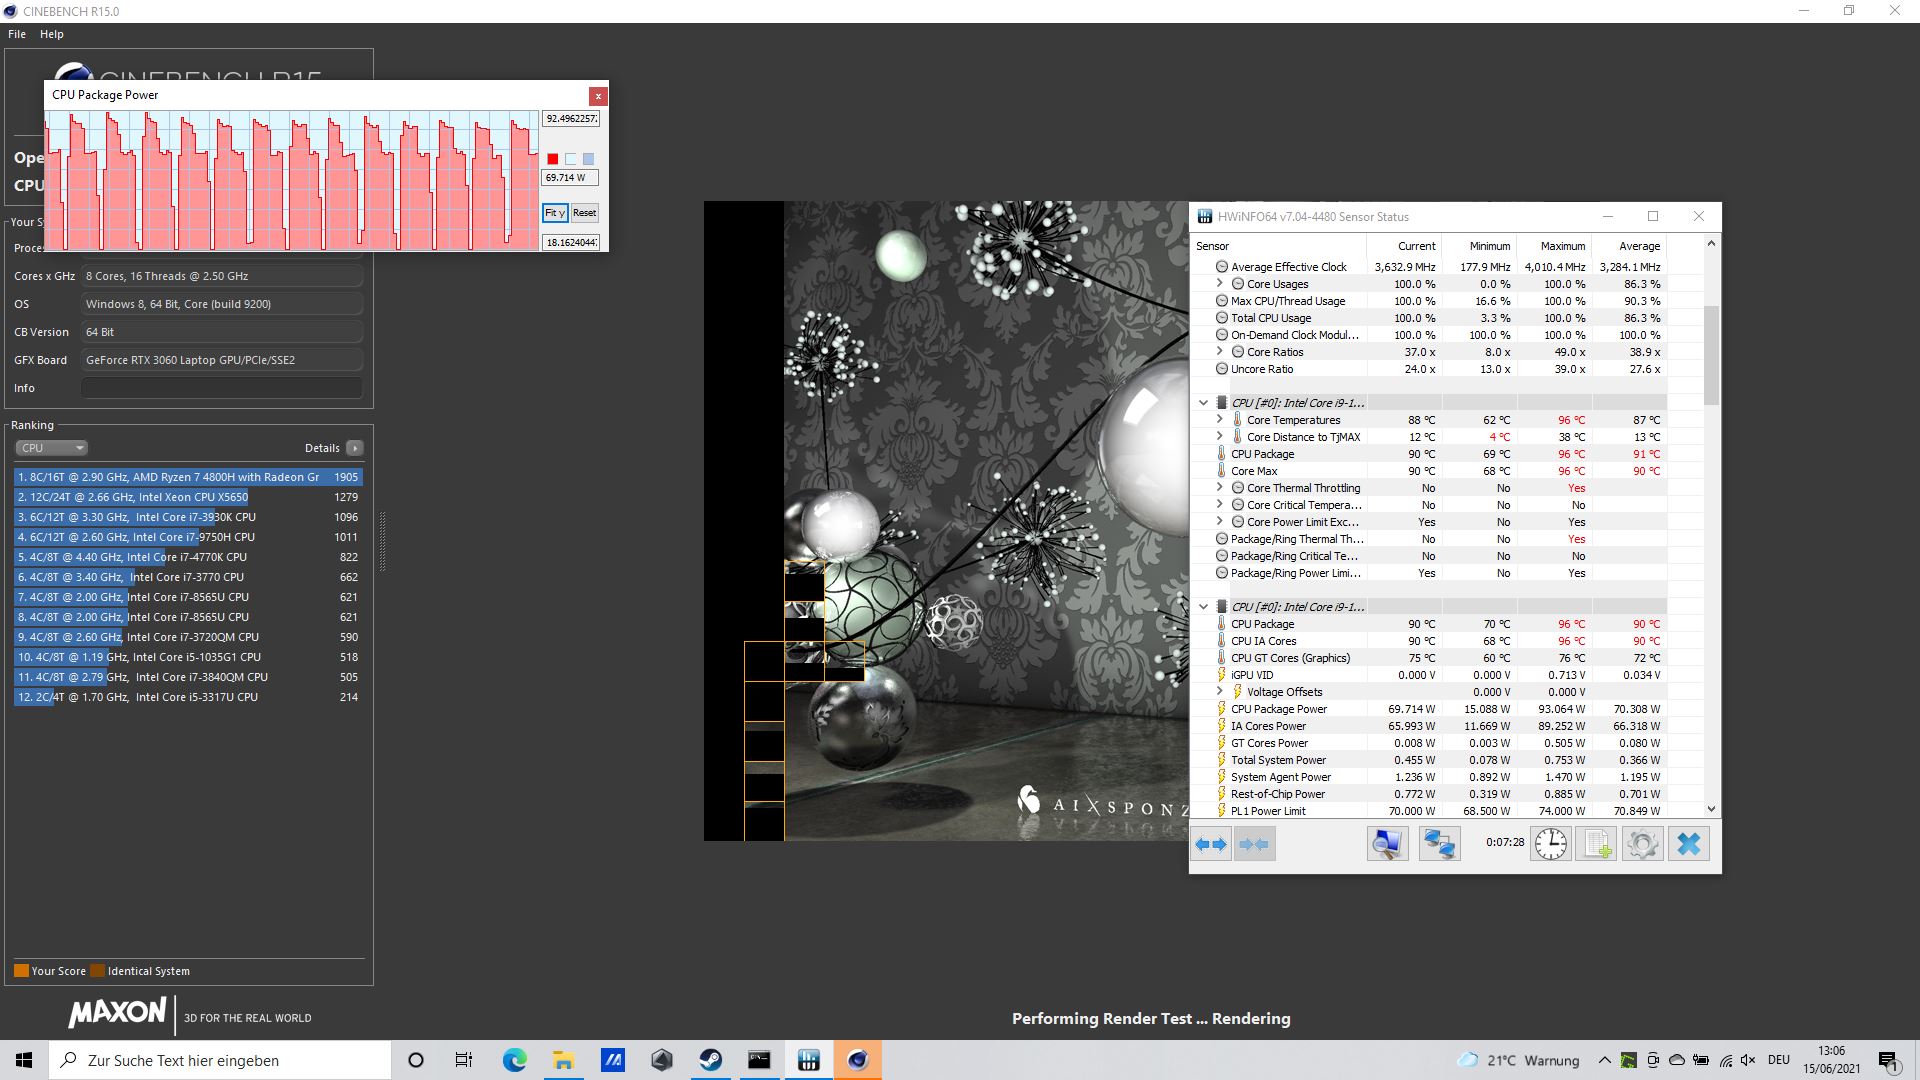
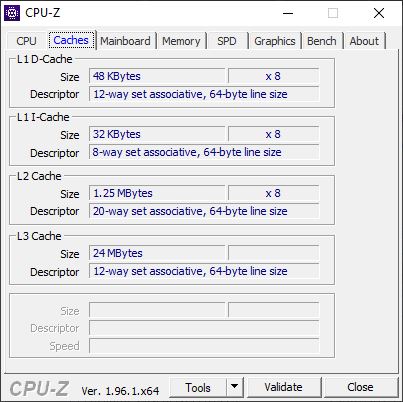
ElIntel Core i9-11900Hes una CPU octa-core con núcleos que funcionan a una velocidad de reloj base de 2,5 GHz. Todos los núcleos pueden funcionar simultáneamente a 4,4 GHz en modo Turbo, y un núcleo por sí solo puede alcanzar hasta 4,9 GHz. El TDP es teóricamente de 45 vatios, pero se puede configurar.
El rendimiento es relativamente constante en el bucle multihilo de Cinebench. Al principio de una ejecución, el TDP se dispara brevemente hasta los 92 vatios (más tarde sólo 85 vatios), y baja a unos 68 vatios después de la mitad de una ejecución. La CPU a veces sólo consigue entre 80 y 85 vatios al principio de las siguientes ejecuciones debido a la alta temperatura del núcleo, y los 92 vatios sólo se aplican al primer par de ejecuciones.
En general, el i9-11900H está a la par con el Ryzen 7 4800H del año pasado que se encuentra en el Schenker XMG o el TUF A17 cuando se trata de la prueba Cinebench multihilo. Sin embargo, el rendimiento parece caer un poco más con el tiempo; también es ligeramente más errático y marginalmente menos constante.
En cuanto a la batería, el F17 sólo obtiene 1.358 puntos en lugar de los 1.700 a 2.000 puntos anteriores, lo que significa que el rendimiento de su CPU se ralentiza bastante.
Cinebench R20: CPU (Single Core) | CPU (Multi Core)
Cinebench R15: CPU Single 64Bit | CPU Multi 64Bit
Blender: v2.79 BMW27 CPU
7-Zip 18.03: 7z b 4 -mmt1 | 7z b 4
Geekbench 5.5: Single-Core | Multi-Core
HWBOT x265 Benchmark v2.2: 4k Preset
LibreOffice : 20 Documents To PDF
R Benchmark 2.5: Overall mean
| Cinebench R23 / Single Core | |
| Media de la clase Gaming (1166 - 2356, n=110, últimos 2 años) | |
| Medio Intel Core i9-11900H (1574 - 1605, n=4) | |
| Asus TUF Gaming F17 FX706HM | |
| MSI GF65 Thin 10UE | |
| Schenker XMG Core 17 (Early 2021) | |
| Acer Aspire Nitro 5 AN515-55-57GF | |
| Cinebench R23 / Multi Core | |
| Media de la clase Gaming (10488 - 40970, n=110, últimos 2 años) | |
| Medio Intel Core i9-11900H (11135 - 13012, n=4) | |
| Asus TUF Gaming F17 FX706HM | |
| Schenker XMG Core 17 (Early 2021) | |
| MSI GF65 Thin 10UE | |
| Acer Aspire Nitro 5 AN515-55-57GF | |
| Cinebench R20 / CPU (Single Core) | |
| Media de la clase Gaming (442 - 895, n=109, últimos 2 años) | |
| Medio Intel Core i9-11900H (600 - 615, n=5) | |
| Asus TUF Gaming F17 FX706HM | |
| MSI Alpha 17 A4DEK | |
| MSI GF65 Thin 10UE | |
| Asus TUF A17 FA706IU-AS76 | |
| Schenker XMG Core 17 (Early 2021) | |
| Acer Aspire Nitro 5 AN515-55-57GF | |
| Cinebench R20 / CPU (Multi Core) | |
| Media de la clase Gaming (4029 - 16108, n=109, últimos 2 años) | |
| Medio Intel Core i9-11900H (4324 - 5160, n=5) | |
| MSI Alpha 17 A4DEK | |
| Asus TUF Gaming F17 FX706HM | |
| Asus TUF A17 FA706IU-AS76 | |
| Schenker XMG Core 17 (Early 2021) | |
| MSI GF65 Thin 10UE | |
| Acer Aspire Nitro 5 AN515-55-57GF | |
| Cinebench R15 / CPU Single 64Bit | |
| Media de la clase Gaming (188.8 - 343, n=109, últimos 2 años) | |
| Asus TUF Gaming F17 FX706HM | |
| Medio Intel Core i9-11900H (236 - 243, n=5) | |
| MSI GF65 Thin 10UE | |
| Schenker XMG Core 17 (Early 2021) | |
| MSI Alpha 17 A4DEK | |
| Asus TUF A17 FA706IU-AS76 | |
| Acer Aspire Nitro 5 AN515-55-57GF | |
| Cinebench R15 / CPU Multi 64Bit | |
| Media de la clase Gaming (1578 - 6271, n=109, últimos 2 años) | |
| Medio Intel Core i9-11900H (1770 - 2211, n=5) | |
| Asus TUF Gaming F17 FX706HM | |
| MSI Alpha 17 A4DEK | |
| Asus TUF A17 FA706IU-AS76 | |
| Schenker XMG Core 17 (Early 2021) | |
| MSI GF65 Thin 10UE | |
| Acer Aspire Nitro 5 AN515-55-57GF | |
| Blender / v2.79 BMW27 CPU | |
| Acer Aspire Nitro 5 AN515-55-57GF | |
| MSI GF65 Thin 10UE | |
| Schenker XMG Core 17 (Early 2021) | |
| Asus TUF A17 FA706IU-AS76 | |
| MSI Alpha 17 A4DEK | |
| Medio Intel Core i9-11900H (231 - 270, n=5) | |
| Asus TUF Gaming F17 FX706HM | |
| Media de la clase Gaming (80 - 330, n=107, últimos 2 años) | |
| 7-Zip 18.03 / 7z b 4 -mmt1 | |
| Media de la clase Gaming (4199 - 7436, n=108, últimos 2 años) | |
| Asus TUF Gaming F17 FX706HM | |
| Medio Intel Core i9-11900H (5582 - 6018, n=5) | |
| Schenker XMG Core 17 (Early 2021) | |
| MSI GF65 Thin 10UE | |
| Acer Aspire Nitro 5 AN515-55-57GF | |
| Asus TUF A17 FA706IU-AS76 | |
| MSI Alpha 17 A4DEK | |
| 7-Zip 18.03 / 7z b 4 | |
| Media de la clase Gaming (33491 - 148086, n=108, últimos 2 años) | |
| Medio Intel Core i9-11900H (49486 - 57263, n=5) | |
| MSI Alpha 17 A4DEK | |
| Asus TUF Gaming F17 FX706HM | |
| Asus TUF A17 FA706IU-AS76 | |
| Schenker XMG Core 17 (Early 2021) | |
| MSI GF65 Thin 10UE | |
| Acer Aspire Nitro 5 AN515-55-57GF | |
| Geekbench 5.5 / Single-Core | |
| Media de la clase Gaming (986 - 2474, n=108, últimos 2 años) | |
| Medio Intel Core i9-11900H (1576 - 1692, n=5) | |
| Asus TUF Gaming F17 FX706HM | |
| MSI GF65 Thin 10UE | |
| Schenker XMG Core 17 (Early 2021) | |
| MSI Alpha 17 A4DEK | |
| Acer Aspire Nitro 5 AN515-55-57GF | |
| Asus TUF A17 FA706IU-AS76 | |
| Geekbench 5.5 / Multi-Core | |
| Media de la clase Gaming (6460 - 27010, n=108, últimos 2 años) | |
| Medio Intel Core i9-11900H (7725 - 9856, n=5) | |
| MSI Alpha 17 A4DEK | |
| Asus TUF A17 FA706IU-AS76 | |
| Asus TUF Gaming F17 FX706HM | |
| Schenker XMG Core 17 (Early 2021) | |
| MSI GF65 Thin 10UE | |
| Acer Aspire Nitro 5 AN515-55-57GF | |
| HWBOT x265 Benchmark v2.2 / 4k Preset | |
| Media de la clase Gaming (11.5 - 44.3, n=108, últimos 2 años) | |
| Medio Intel Core i9-11900H (13.6 - 16.7, n=5) | |
| Asus TUF Gaming F17 FX706HM | |
| MSI Alpha 17 A4DEK | |
| Asus TUF A17 FA706IU-AS76 | |
| Schenker XMG Core 17 (Early 2021) | |
| MSI GF65 Thin 10UE | |
| Acer Aspire Nitro 5 AN515-55-57GF | |
| LibreOffice / 20 Documents To PDF | |
| Asus TUF A17 FA706IU-AS76 | |
| Acer Aspire Nitro 5 AN515-55-57GF | |
| MSI Alpha 17 A4DEK | |
| Schenker XMG Core 17 (Early 2021) | |
| Media de la clase Gaming (19 - 88.8, n=108, últimos 2 años) | |
| Asus TUF Gaming F17 FX706HM | |
| MSI GF65 Thin 10UE | |
| Medio Intel Core i9-11900H (40.5 - 49.3, n=5) | |
| R Benchmark 2.5 / Overall mean | |
| Acer Aspire Nitro 5 AN515-55-57GF | |
| Asus TUF A17 FA706IU-AS76 | |
| MSI GF65 Thin 10UE | |
| Schenker XMG Core 17 (Early 2021) | |
| MSI Alpha 17 A4DEK | |
| Medio Intel Core i9-11900H (0.52 - 0.544, n=5) | |
| Asus TUF Gaming F17 FX706HM | |
| Media de la clase Gaming (0.3439 - 0.759, n=109, últimos 2 años) | |
* ... más pequeño es mejor
Rendimiento del sistema
Nuestro F17 se lleva fácilmente el primer puesto en PCMark 10, mientras que el A17 y el XMG se quedan atrás entre un 7% y un 20% dependiendo de la prueba
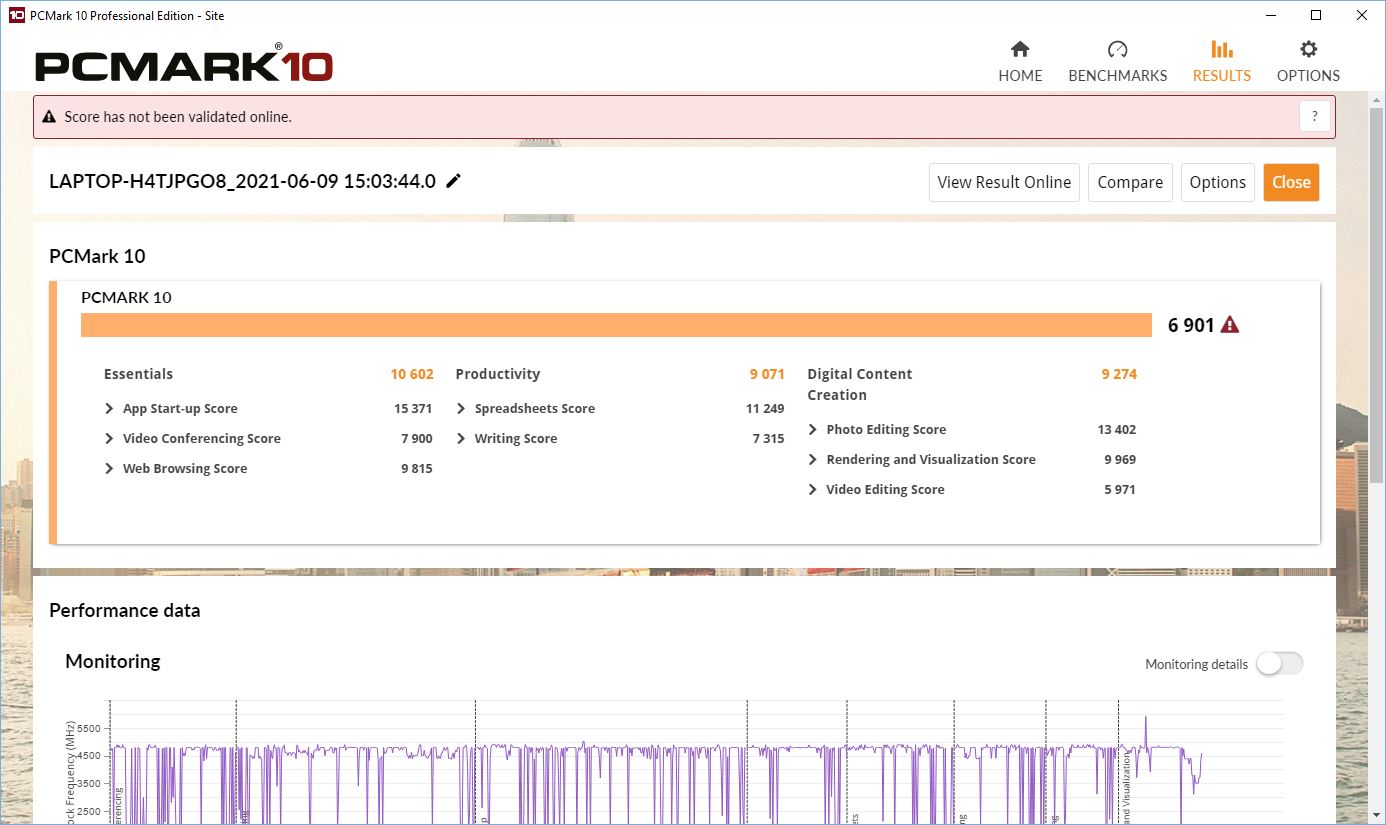
| PCMark 10 Score | 6901 puntos | |
ayuda | ||
Latencias del CPD
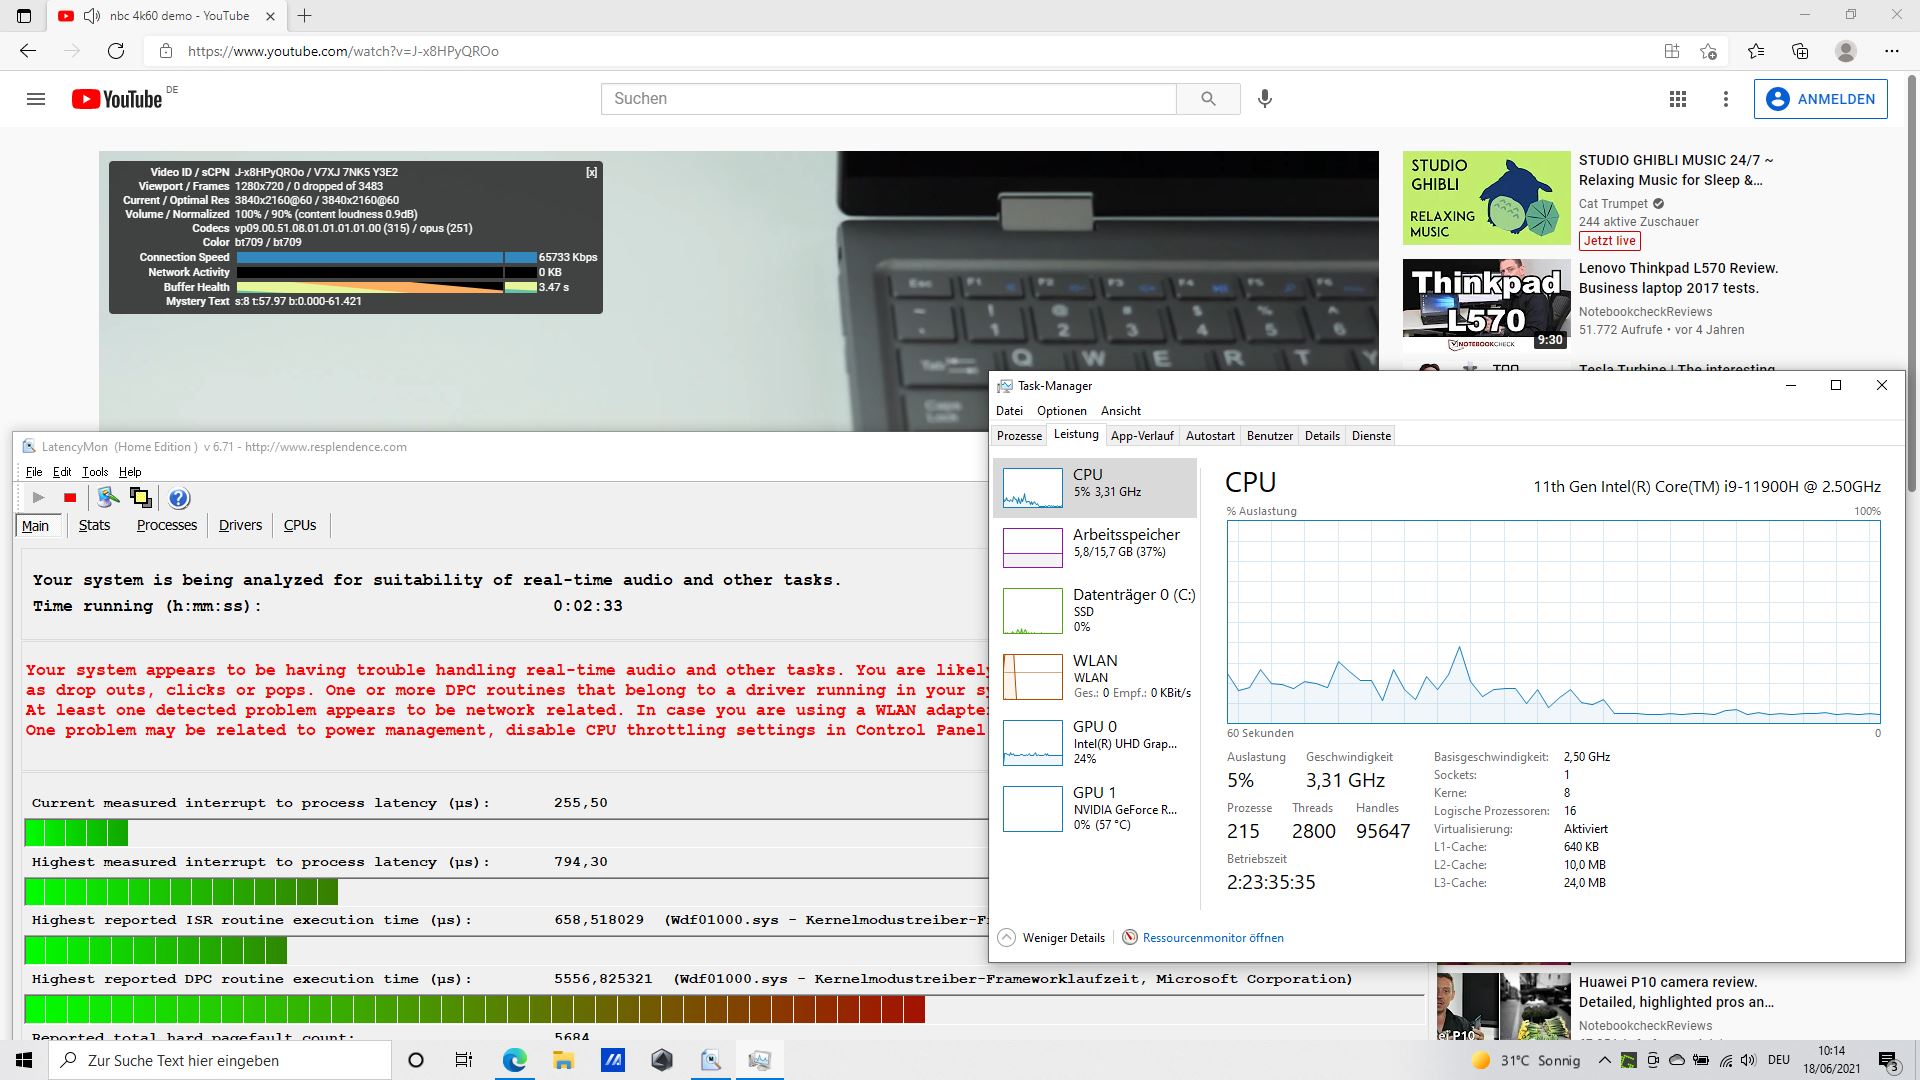
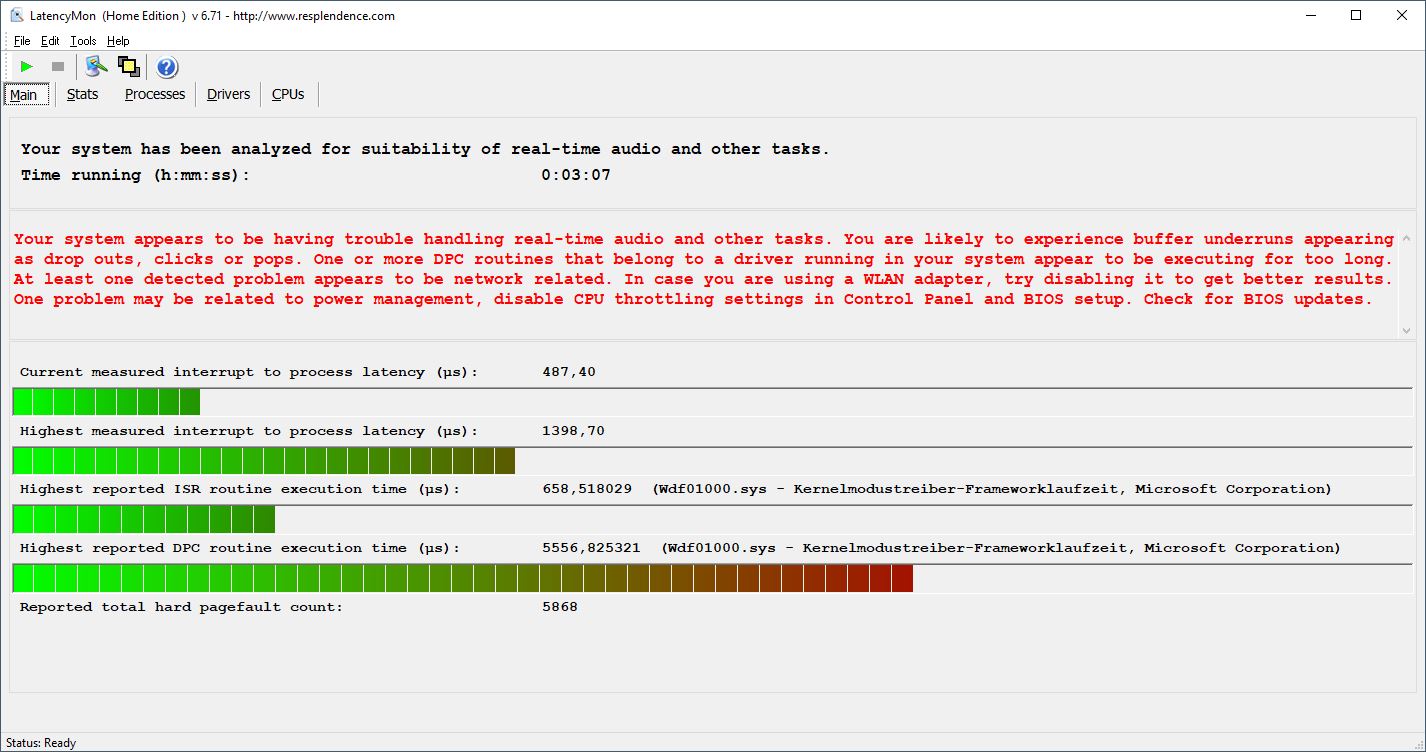
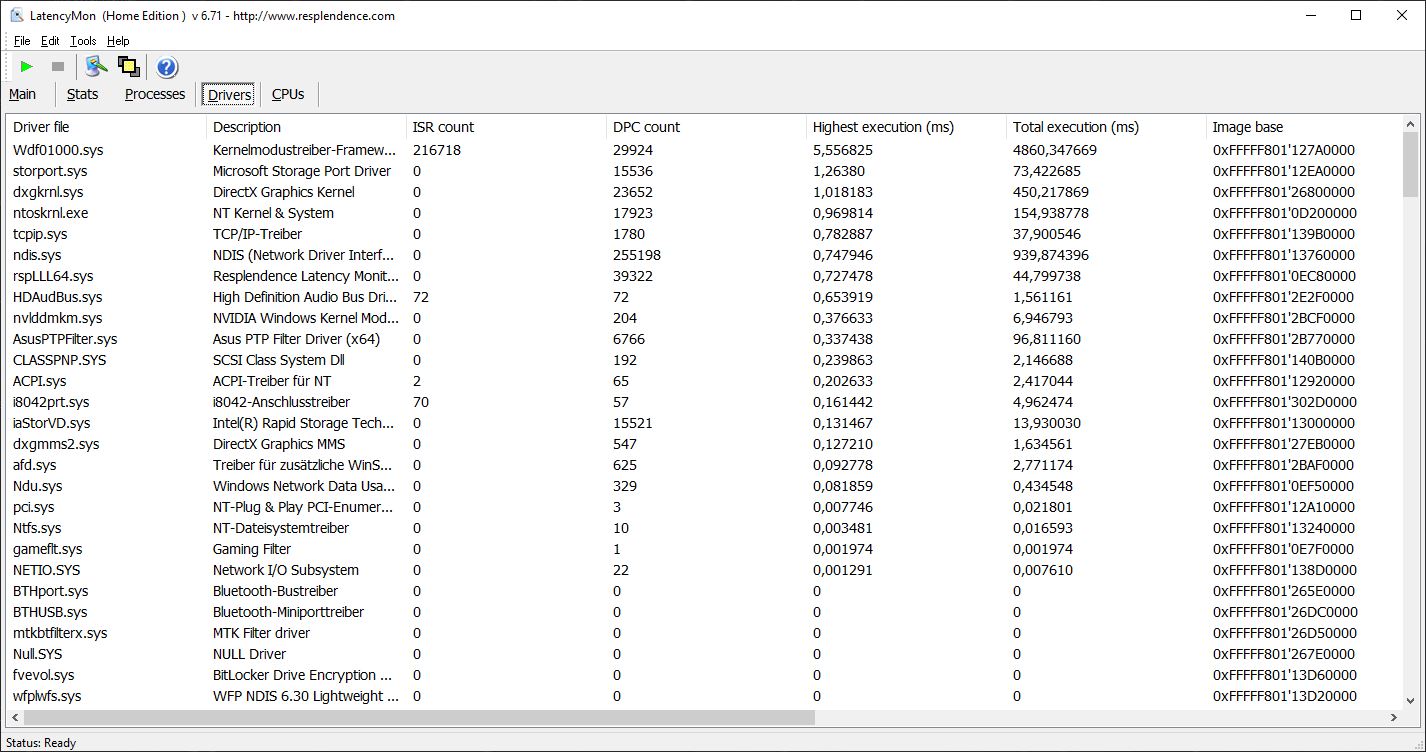
El F17 no se atasca al abrir varias pestañas del navegador, pero sí al reproducir nuestro vídeo 4K/60 fps de YouTube. Al menos no hubo caídas de frames de las que quejarse, pero LatencyMon siguió detectando latencias, lo que significa que podría haber problemas al reproducir audio en tiempo real. El Kernel Mode Driver Framework Runtime es particularmente problemático
| DPC Latencies / LatencyMon - interrupt to process latency (max), Web, Youtube, Prime95 | |
| Asus TUF A17 FA706IU-AS76 | |
| MSI Alpha 17 A4DEK | |
| Asus TUF Gaming F17 FX706HM | |
| Schenker XMG Core 17 (Early 2021) | |
* ... más pequeño es mejor
Almacenamiento
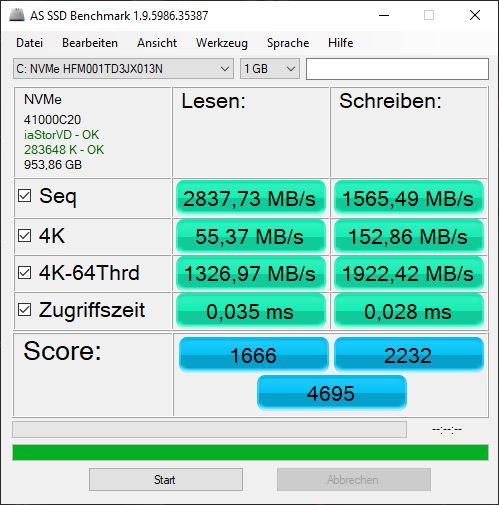
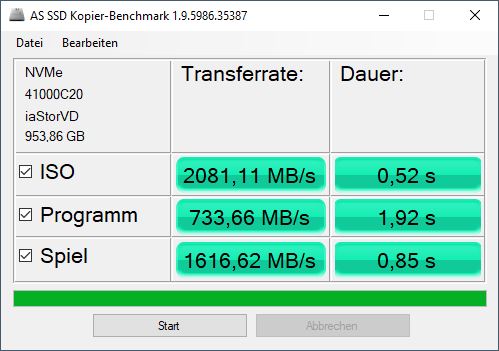
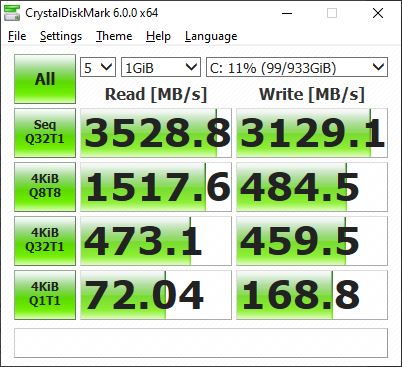
El almacenamiento masivo consiste en un SSD NVMe de 1 TB, pero el F17 también está disponible con un SSD más pequeño de 512 GB. Esta unidad de almacenamiento ocupa el puesto 28 en nuestro artículoHDD/SSD Benchmarks. Alcanza buenos índices en comparación y logra dejar atrás a la competencia montada (de presupuesto), lo que seguramente es una razón para el rendimiento comparativamente bueno del sistema
| Asus TUF Gaming F17 FX706HM SK Hynix HFM001TD3JX013N | Asus TUF A17 FA706IU-AS76 Intel SSD 660p 1TB SSDPEKNW010T8 | Schenker XMG Core 17 (Early 2021) Samsung SSD 970 EVO Plus 1TB | MSI Alpha 17 A4DEK Kingston OM8PCP3512F-AB | MSI GF65 Thin 10UE Samsung SSD PM981 MZVLB1T0HALR | Acer Aspire Nitro 5 AN515-55-57GF WDC PC SN530 SDBPNPZ-512G | Apple MacBook 12 (Early 2016) 1.1 GHz Apple SSD AP0256 | Acer Predator Helios 300 PH315-53-77N5 WDC PC SN730 SDBQNTY-512GB | Medio SK Hynix HFM001TD3JX013N | |
|---|---|---|---|---|---|---|---|---|---|
| CrystalDiskMark 5.2 / 6 | -12% | -1% | -24% | -12% | -26% | -12% | 3% | ||
| Write 4K (MB/s) | 168.8 | 189.7 12% | 145.7 -14% | 204.7 21% | 157.3 -7% | 118 -30% | 137.5 -19% | 155.8 ? -8% | |
| Read 4K (MB/s) | 72 | 62.3 -13% | 51.3 -29% | 50.4 -30% | 46.69 -35% | 48.5 -33% | 48.24 -33% | 57 ? -21% | |
| Write Seq (MB/s) | 1681 | 3036 | 985 | 2389 | 1828 | 2644 | 3943 ? | ||
| Read Seq (MB/s) | 1608 | 2837 | 1193 | 2196 | 1530 | 1718 | 2180 ? | ||
| Write 4K Q32T1 (MB/s) | 459.5 | 468.6 2% | 511 11% | 537 17% | 407.6 -11% | 400 -13% | 416.6 -9% | 452 ? -2% | |
| Read 4K Q32T1 (MB/s) | 473.1 | 541 14% | 582 23% | 300 -37% | 519 10% | 493 4% | 525 11% | 447 ? -6% | |
| Write Seq Q32T1 (MB/s) | 3129 | 1770 -43% | 3294 5% | 982 -69% | 2401 -23% | 1828 -42% | 2705 -14% | 2859 ? -9% | |
| Read Seq Q32T1 (MB/s) | 3529 | 1898 -46% | 3522 0% | 1985 -44% | 3344 -5% | 2128 -40% | 3213 -9% | 3515 ? 0% | |
| Write 4K Q8T8 (MB/s) | 484.5 | 791 ? 63% | |||||||
| Read 4K Q8T8 (MB/s) | 1518 | 1649 ? 9% | |||||||
| AS SSD | -50% | -0% | -54% | -12% | -49% | -116% | -19% | -11% | |
| Seq Read (MB/s) | 2837 | 1320 -53% | 2876 1% | 251.9 -91% | 3002 6% | 1479 -48% | 1056 -63% | 2753 -3% | 2839 ? 0% |
| Seq Write (MB/s) | 1565 | 1539 -2% | 2803 79% | 925 -41% | 2420 55% | 1715 10% | 651 -58% | 2495 59% | 1917 ? 22% |
| 4K Read (MB/s) | 55.4 | 56.3 2% | 55.3 0% | 58.2 5% | 48.46 -13% | 27.8 -50% | 16.4 -70% | 38.64 -30% | 53 ? -4% |
| 4K Write (MB/s) | 152.9 | 158.5 4% | 106.9 -30% | 98 -36% | 114.3 -25% | 106 -31% | 22.1 -86% | 88.8 -42% | 127.3 ? -17% |
| 4K-64 Read (MB/s) | 1327 | 586 -56% | 1662 25% | 461.4 -65% | 1873 41% | 406 -69% | 509 -62% | 952 -28% | 1369 ? 3% |
| 4K-64 Write (MB/s) | 1922 | 820 -57% | 2101 9% | 924 -52% | 1882 -2% | 1119 -42% | 283 -85% | 1568 -18% | 1939 ? 1% |
| Access Time Read * (ms) | 0.035 | 0.043 -23% | 0.067 -91% | 0.09 -157% | 0.045 -29% | 0.128 -266% | 0.186 -431% | 0.0468 ? -34% | |
| Access Time Write * (ms) | 0.028 | 0.113 -304% | 0.037 -32% | 0.022 21% | 0.101 -261% | 0.04 -43% | 0.044 -57% | 0.0532 ? -90% | |
| Score Read (Points) | 1666 | 775 -53% | 2005 20% | 545 -67% | 2221 33% | 581 -65% | 1266 -24% | 1706 ? 2% | |
| Score Write (Points) | 2232 | 1132 -49% | 2488 11% | 1114 -50% | 2238 0% | 1396 -37% | 1906 -15% | 2258 ? 1% | |
| Score Total (Points) | 4695 | 2333 -50% | 5520 18% | 1994 -58% | 5565 19% | 2294 -51% | 3811 -19% | 4797 ? 2% | |
| Copy ISO MB/s (MB/s) | 2081 | 1736 -17% | 2029 -2% | 2421 16% | 1747 -16% | 545 -74% | 2037 -2% | 1908 ? -8% | |
| Copy Program MB/s (MB/s) | 734 | 553 -25% | 691 -6% | 705 -4% | 975 33% | 475.6 -35% | 665 ? -9% | ||
| Copy Game MB/s (MB/s) | 1617 | 1264 -22% | 1513 -6% | 1490 -8% | 1453 -10% | 1018 -37% | 1349 ? -17% | ||
| Media total (Programa/Opciones) | -31% /
-39% | -1% /
-0% | -39% /
-43% | -12% /
-12% | -38% /
-42% | -116% /
-116% | -16% /
-17% | -4% /
-6% |
* ... más pequeño es mejor

Continuous load read: DiskSpd Read Loop, Queue Depth 8
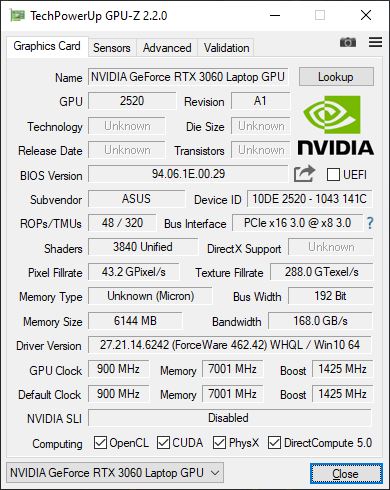
Tarjeta gráfica
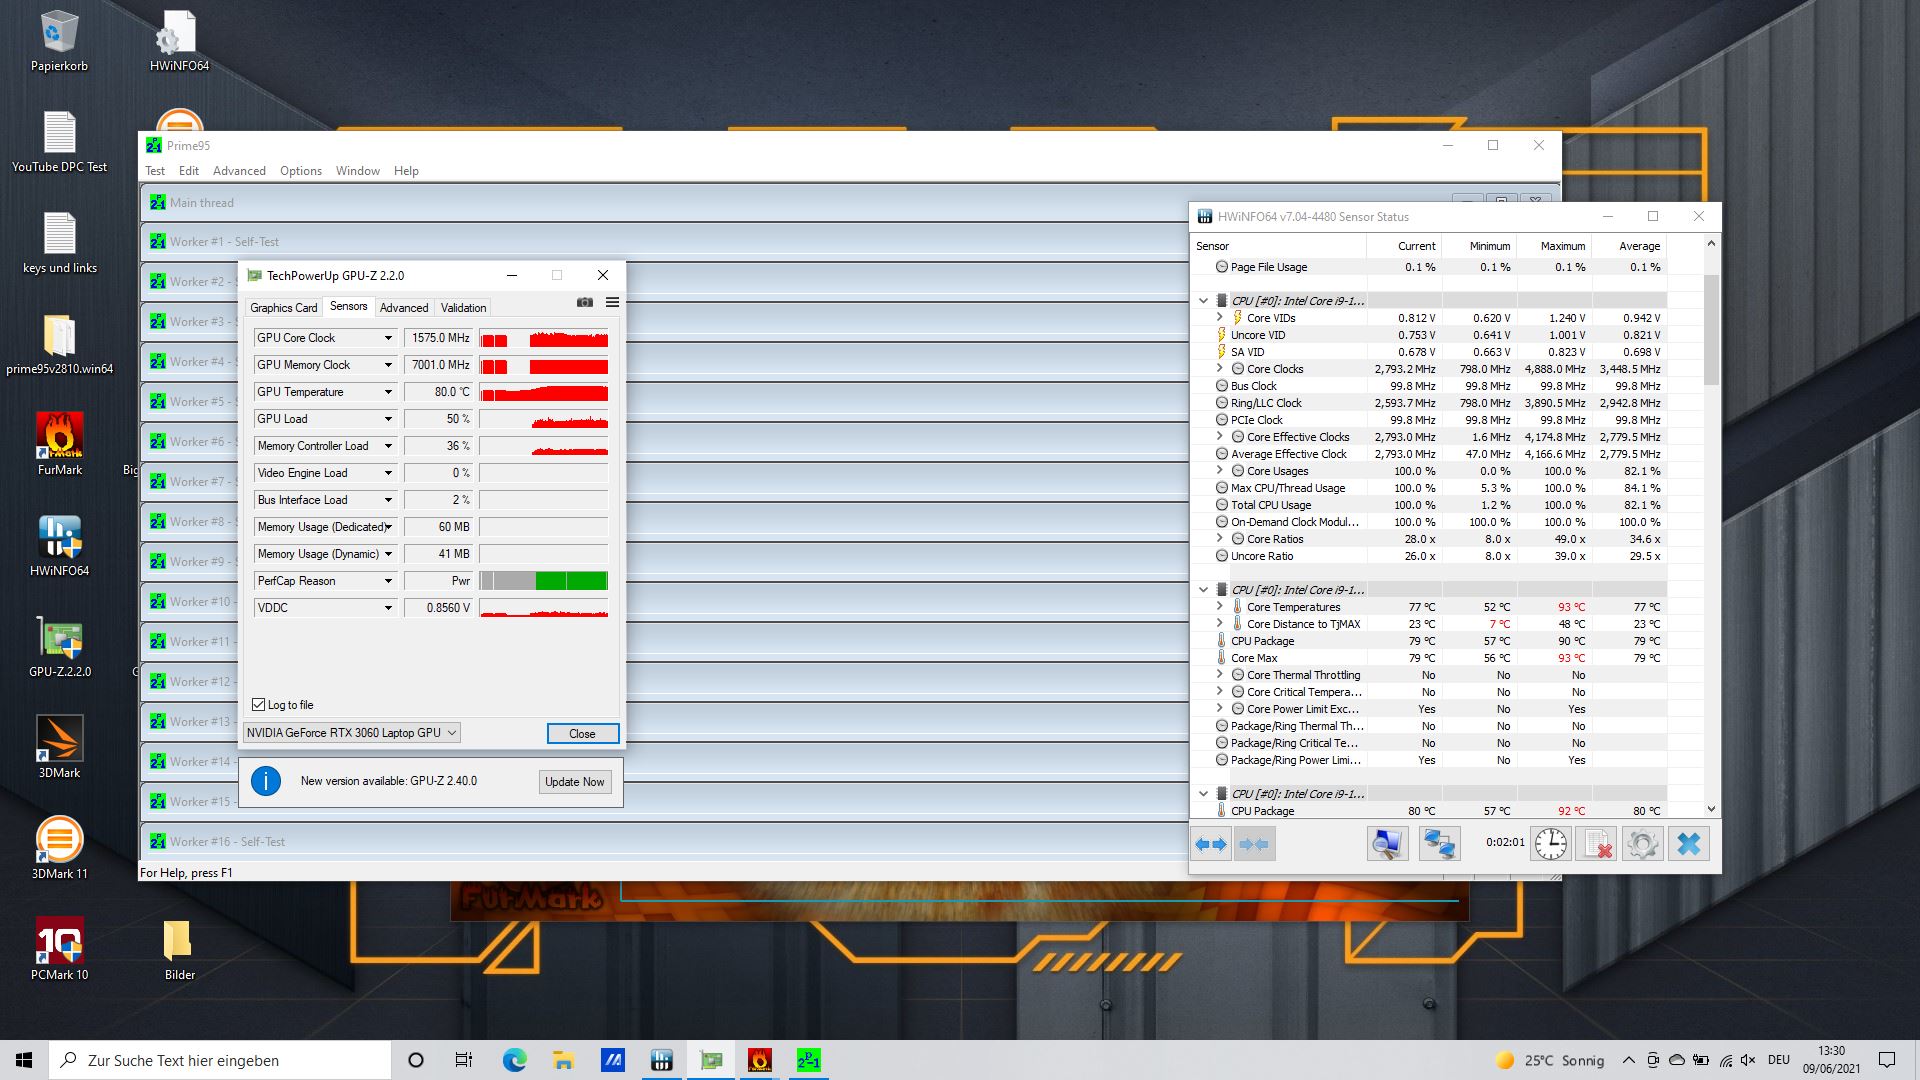
Asus ha utilizado una Nvidia GeForce RTX 3060, pero el F17 pronto estará disponible con una RTX 3050 y su variante Ti también. El TGP de una RTX 3060 oscila entre unos 60 y 130 vatios, lo que significa que su rendimiento es muy variable dependiendo del modelo. En la TUF Gaming F17, el TGP con Dynamic Boost es de 95 vatios, por lo que se sitúa más o menos en la mitad del rango de rendimiento.
En consecuencia, la tarjeta rinde en torno al nivel medio esperado. En la mayoría de los casos, la XMG Pro está un insignificante 3% por delante de nuestra F17, a pesar de su mayor TGP de 130 vatios. La A17, con su 1660 Ti, es superada entre un 25% y un 80%.
Ejecutar 3DMark 11 de nuevo con la energía de la batería sólo produce 19.609 puntos gráficos en lugar de los 25.793 puntos anteriores cuando está enchufado. En otras palabras, el rendimiento gráfico se reduce en un 24% cuando el portátil está en marcha.
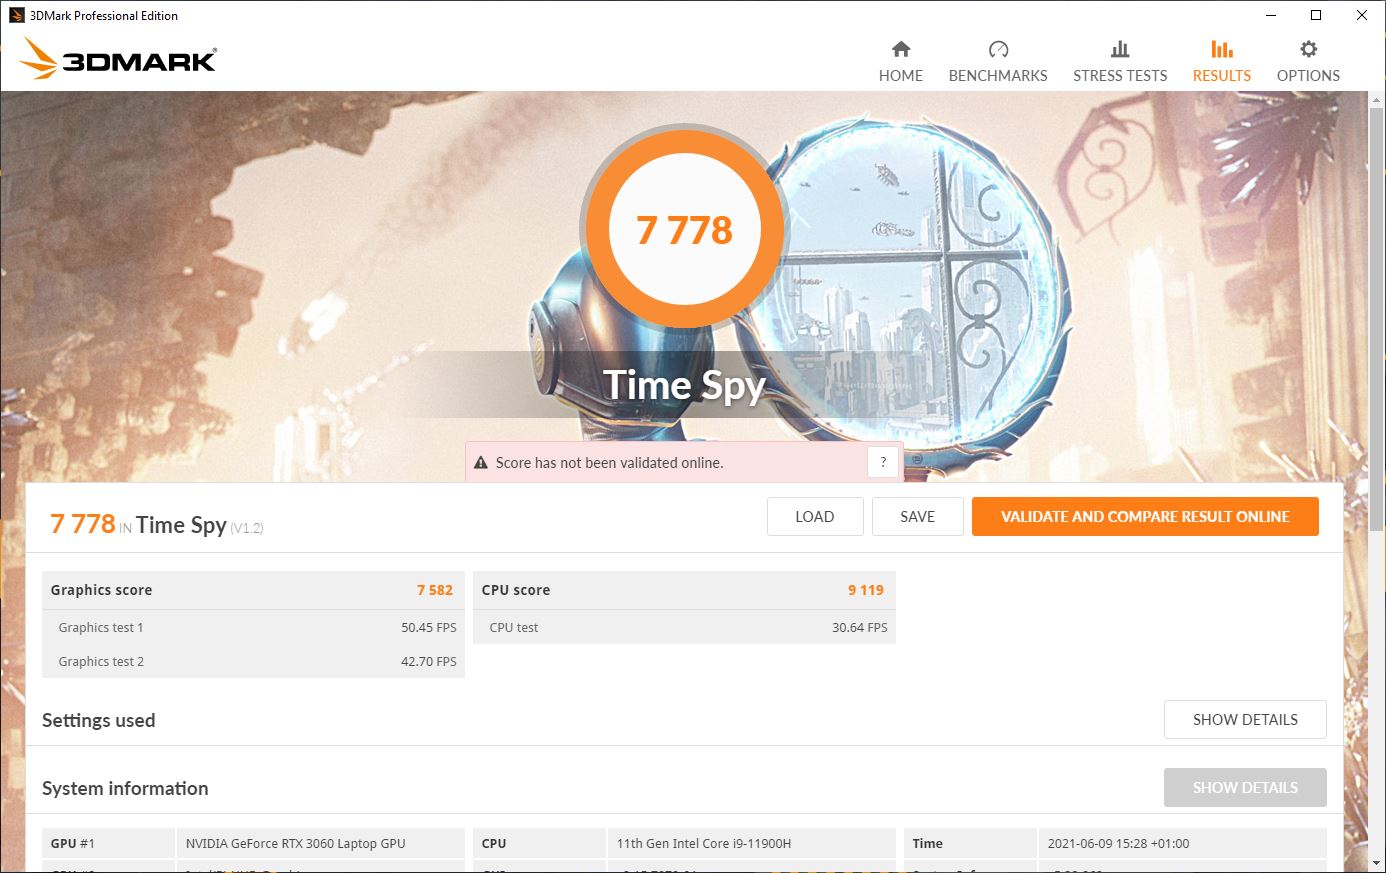
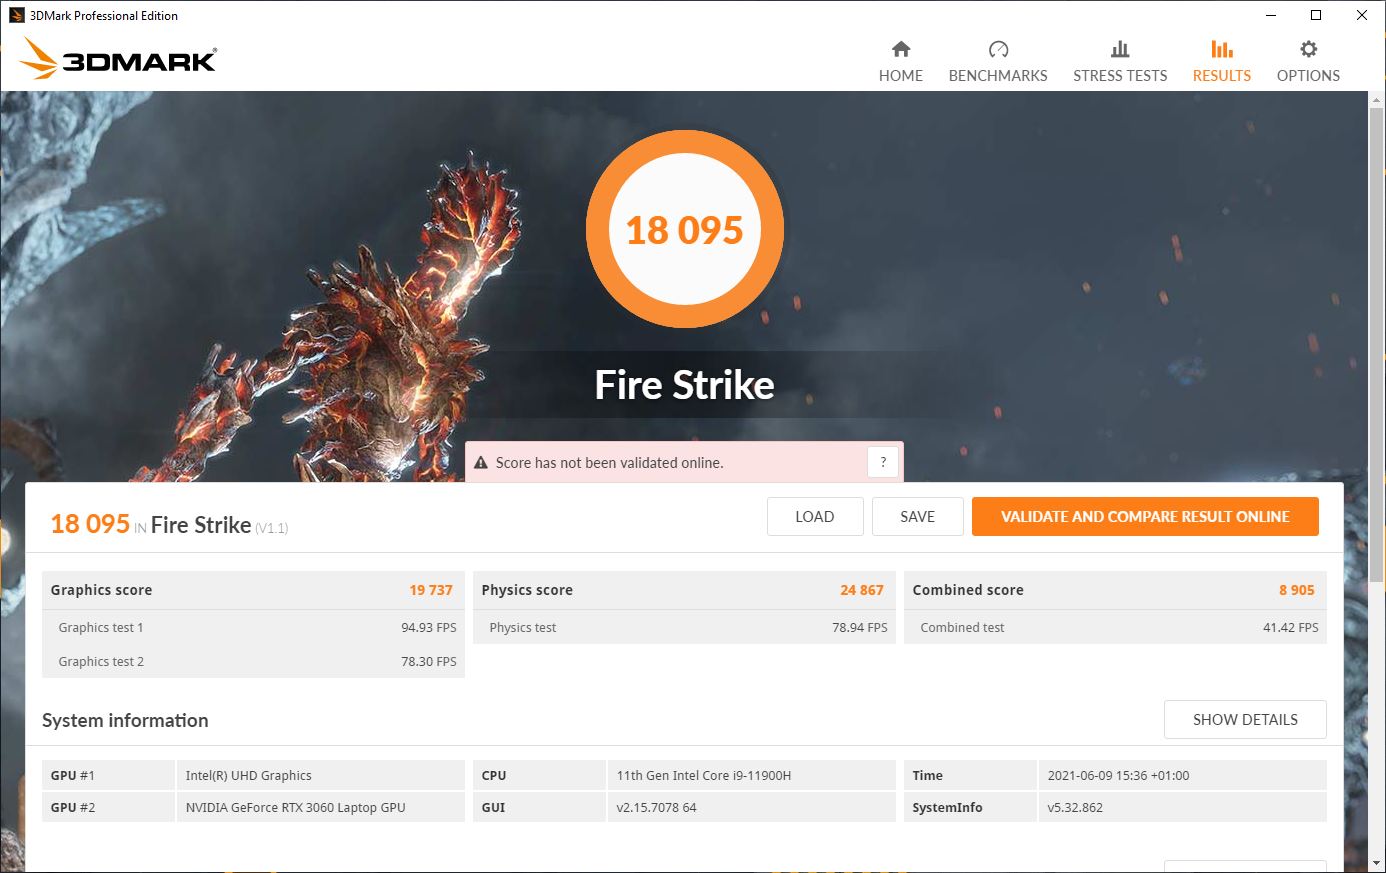
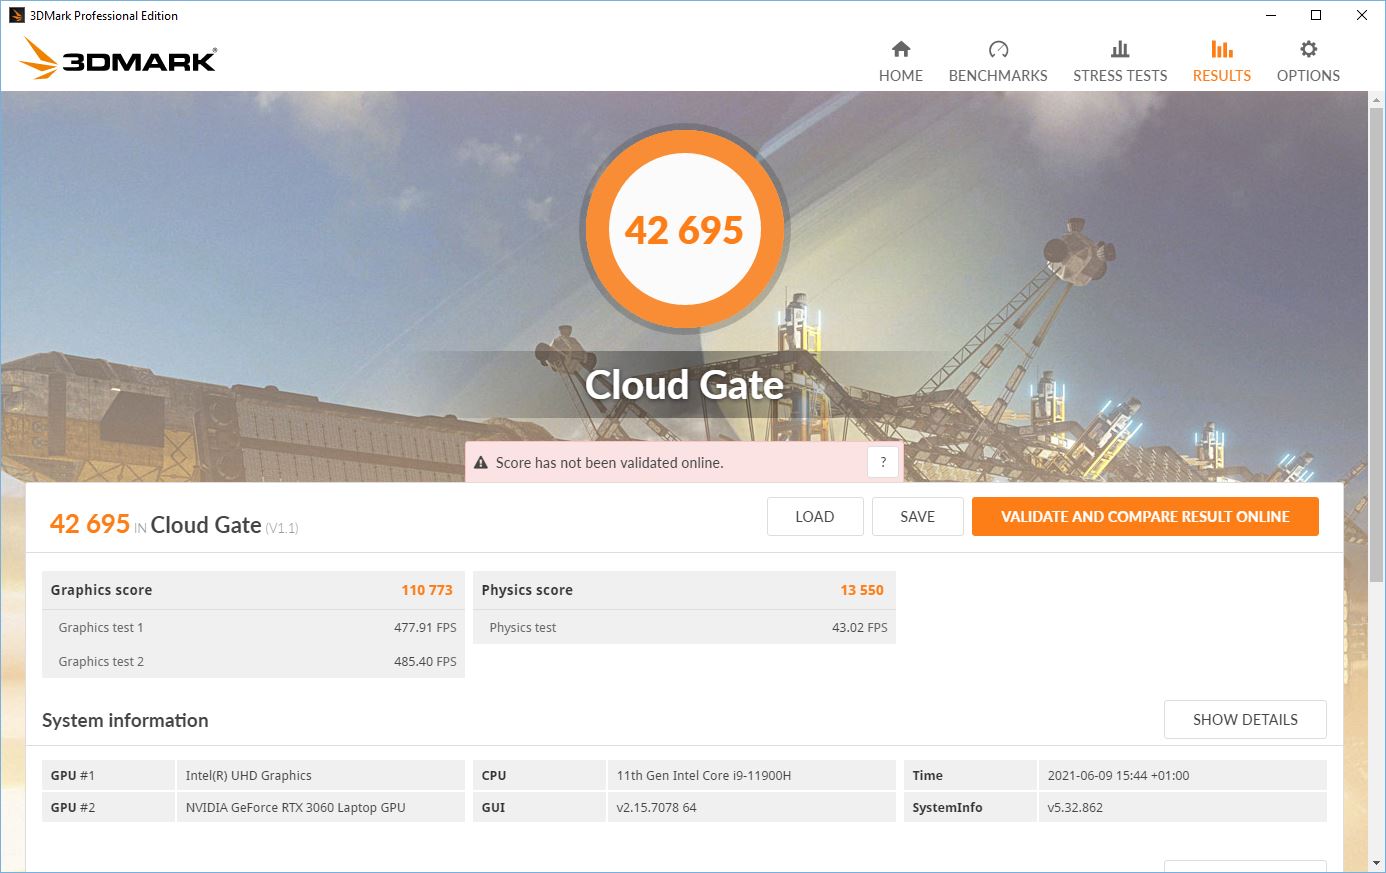
| 3DMark 11 Performance | 22367 puntos | |
| 3DMark Cloud Gate Standard Score | 42695 puntos | |
| 3DMark Fire Strike Score | 18095 puntos | |
| 3DMark Time Spy Score | 7778 puntos | |
ayuda | ||
Rendimiento de los juegos
La tarjeta gráfica debería ser capaz de ejecutar todos los juegos más recientes sin problemas a una resolución Full HD y con los máximos detalles. En The Witcher 3, el dispositivo de Schenker sólo tiene una ventaja de alrededor del 5% con su mayor TGP. El juego también se ejecuta sin problemas en la configuración Ultra con resolución Full HD y 74 fps. En todos los juegos que hemos probado, la RTX 3060 del F17 rinde entre un 3% y un 5% menos que una RTX 3060 media. Aunque la Schenker es un 7% más rápida, también tiene un TGP mucho mayor
Las tasas de fotogramas de Witcher 3se mantienen bastante constantes a lo largo del tiempo; sólo parecen fluctuar con más fuerza hacia el final del periodo de prueba de una hora
| bajo | medio | alto | ultra | |
|---|---|---|---|---|
| GTA V (2015) | 181 | 173 | 141 | 80.4 |
| The Witcher 3 (2015) | 328.6 | 218.6 | 140.7 | 74 |
| Dota 2 Reborn (2015) | 165 | 147 | 135 | 121 |
| Final Fantasy XV Benchmark (2018) | 140 | 95.1 | 72.3 | |
| X-Plane 11.11 (2018) | 118 | 97.1 | 80.1 | |
| Far Cry 5 (2018) | 146 | 107 | 100 | 93 |
| Strange Brigade (2018) | 367 | 187 | 149 | 130 |
Emisiones - Relativamente silencioso y equilibrado
Emisiones acústicas
Usando el perfil de ventilador "Windows" al menos (y el ajuste "Mejor Rendimiento" en Windows), el F17 funciona de forma bastante silenciosa, adaptándose dinámicamente a sus necesidades de refrigeración sin llegar a ser irritantemente ruidoso. Sin embargo, también se puede seleccionar un modo de rendimiento "Turbo" en el software Armoury Crate; éste activa la eGPU independientemente del nivel de carga, haciendo que los ventiladores sean un poco más ruidosos en el proceso. No obstante, no funcionan a toda velocidad sin tener en cuenta la carga, sino que se adaptan dinámicamente a ella también en este modo
Ruido
| Ocioso |
| 26 / 31 / 33 dB(A) |
| Carga |
| 48 / 49 dB(A) |
 | ||
30 dB silencioso 40 dB(A) audible 50 dB(A) ruidosamente alto |
||
min: | ||
| Asus TUF Gaming F17 FX706HM GeForce RTX 3060 Laptop GPU, i9-11900H, SK Hynix HFM001TD3JX013N | Asus TUF A17 FA706IU-AS76 GeForce GTX 1660 Ti Mobile, R7 4800H, Intel SSD 660p 1TB SSDPEKNW010T8 | Schenker XMG Core 17 (Early 2021) GeForce RTX 3060 Laptop GPU, i7-10870H, Samsung SSD 970 EVO Plus 1TB | MSI Alpha 17 A4DEK Radeon RX 5600M, R7 4800H, Kingston OM8PCP3512F-AB | MSI GF65 Thin 10UE GeForce RTX 3060 Laptop GPU, i7-10750H, Samsung SSD PM981 MZVLB1T0HALR | Acer Aspire Nitro 5 AN515-55-57GF GeForce RTX 3060 Laptop GPU, i5-10300H, WDC PC SN530 SDBPNPZ-512G | |
|---|---|---|---|---|---|---|
| Noise | -4% | -8% | -1% | -4% | 1% | |
| apagado / medio ambiente * (dB) | 25 | 28.7 -15% | 25 -0% | 25 -0% | 24.7 1% | 25 -0% |
| Idle Minimum * (dB) | 26 | 28.7 -10% | 30 -15% | 31 -19% | 33.1 -27% | 25 4% |
| Idle Average * (dB) | 31 | 30.5 2% | 32 -3% | 32 -3% | 33.1 -7% | 30 3% |
| Idle Maximum * (dB) | 33 | 32.5 2% | 36 -9% | 33 -0% | 33.1 -0% | 33 -0% |
| Load Average * (dB) | 48 | 42.5 11% | 53 -10% | 38 21% | 42.7 11% | 46 4% |
| Witcher 3 ultra * (dB) | 47 | 50.1 -7% | 51 -9% | 46 2% | 40.6 14% | 47 -0% |
| Load Maximum * (dB) | 49 | 53.4 -9% | 54 -10% | 54 -10% | 59.4 -21% | 50 -2% |
* ... más pequeño es mejor
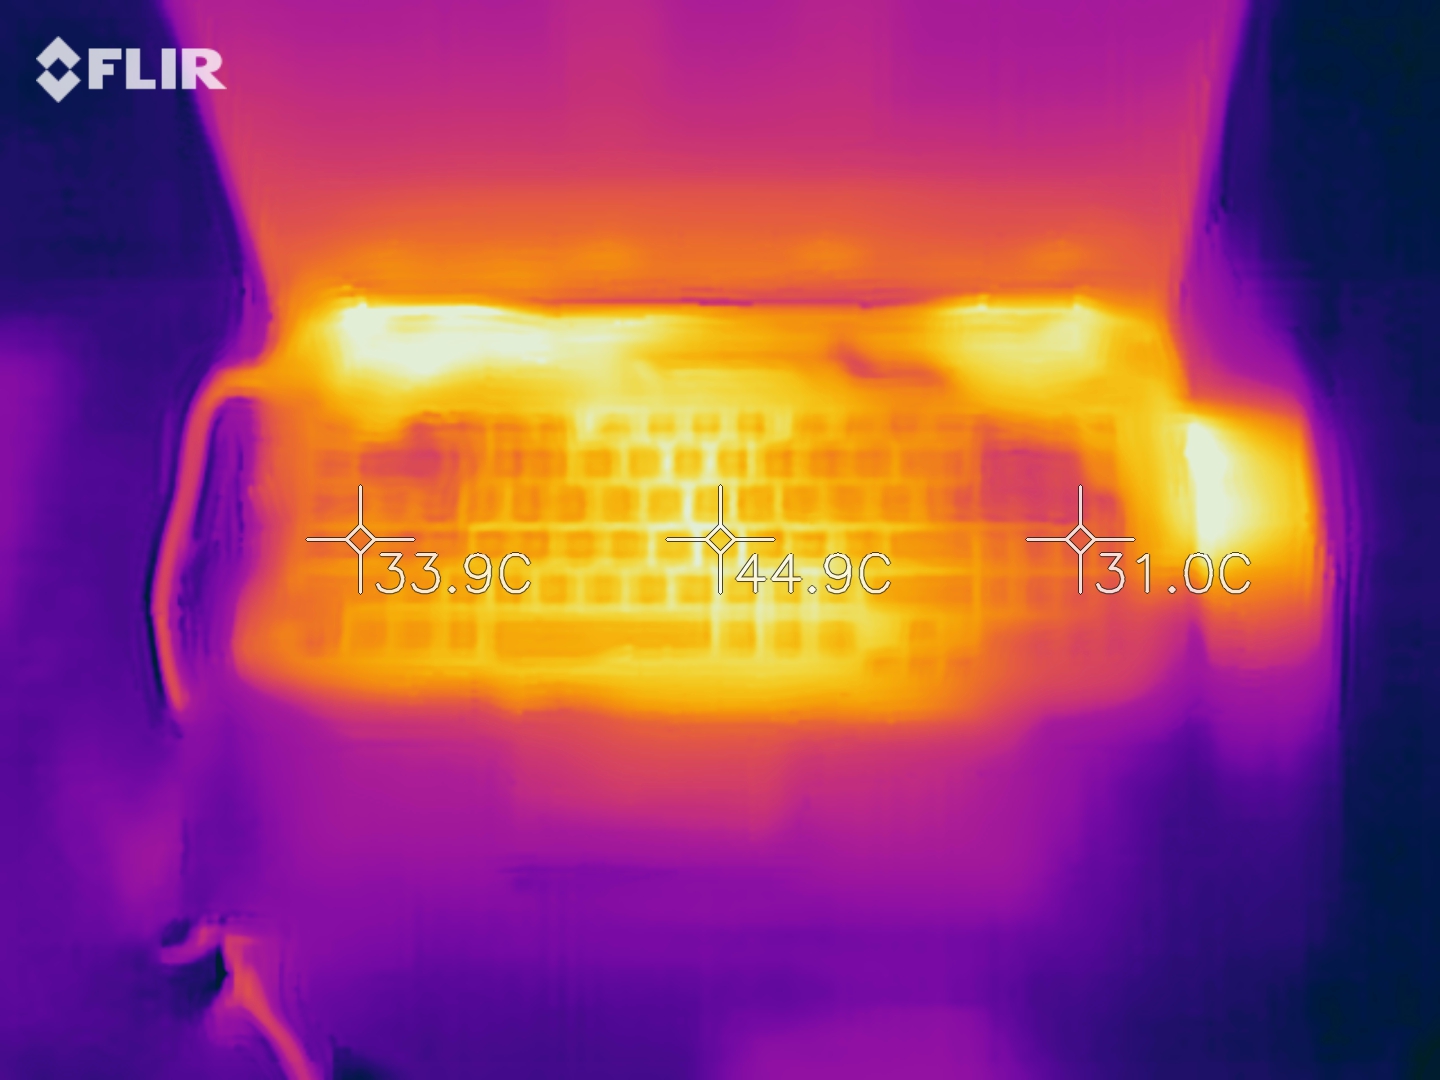
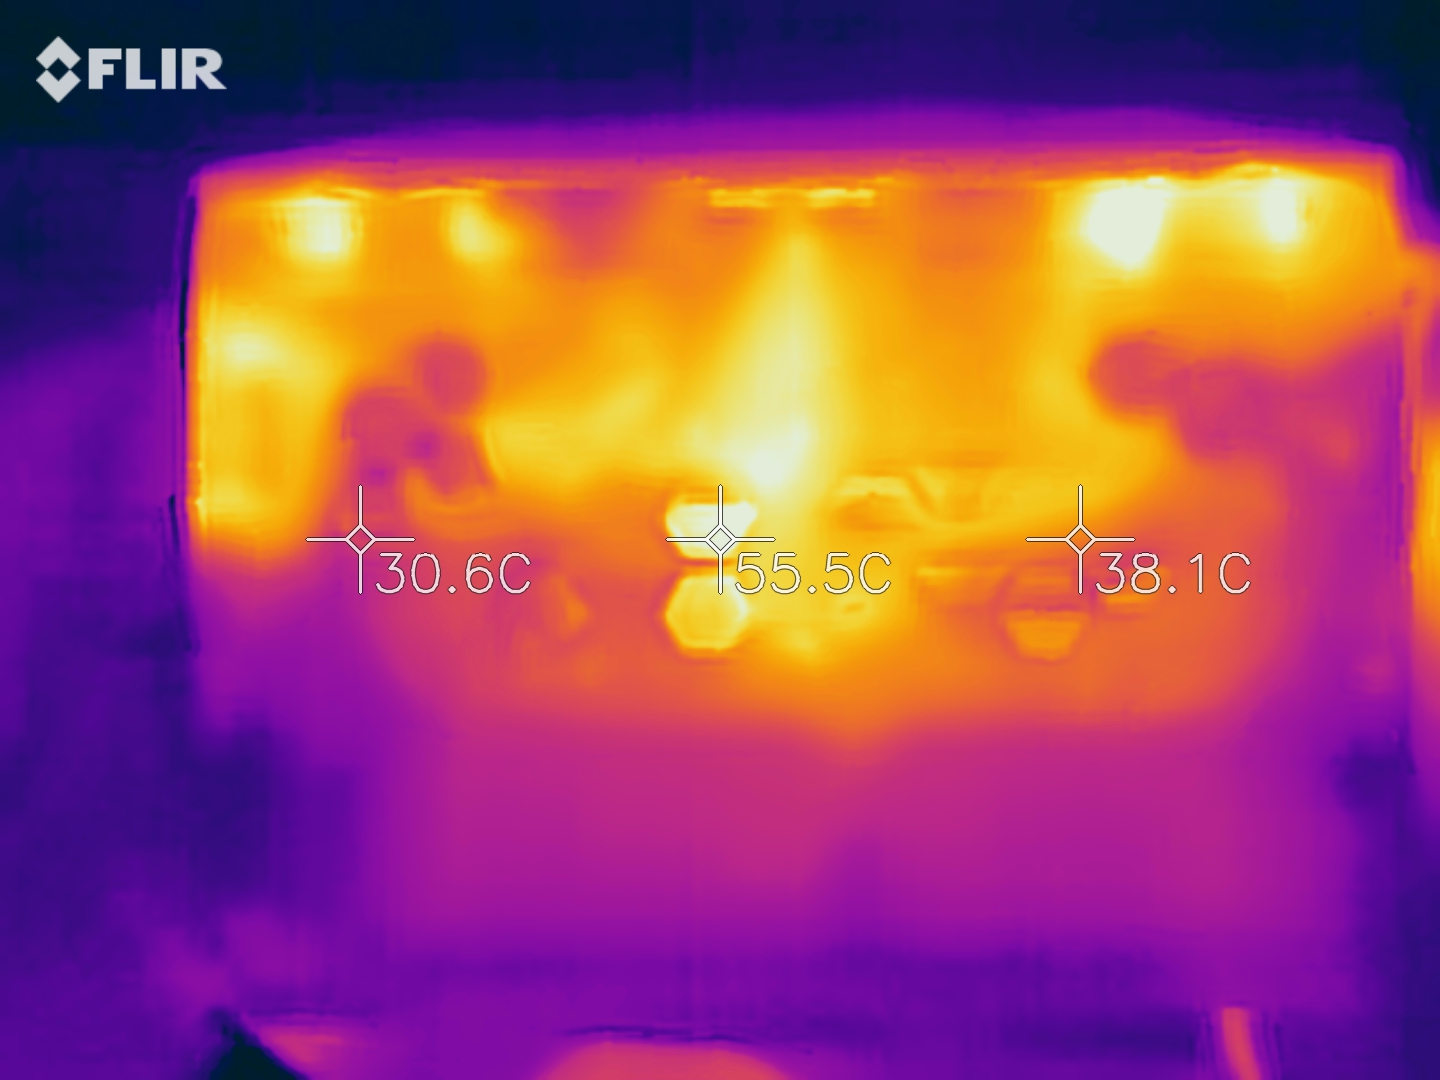
Temperatura
Bajo carga máxima, el F17 se calienta hasta algo menos de 60 °C (~140 °F). Los puntos calientes están a la izquierda y a la derecha hacia la pantalla; los reposamanos siempre se mantienen a la temperatura más fría, e incluso las teclas WASD no se calientan en exceso
(-) La temperatura máxima en la parte superior es de 58.5 °C / 137 F, frente a la media de 40.4 °C / 105 F, que oscila entre 21.2 y 68.8 °C para la clase Gaming.
(-) El fondo se calienta hasta un máximo de 58.5 °C / 137 F, frente a la media de 43.2 °C / 110 F
(±) En reposo, la temperatura media de la parte superior es de 34 °C / 93# F, frente a la media del dispositivo de 33.9 °C / 93 F.
(-) Jugando a The Witcher 3, la temperatura media de la parte superior es de 39.8 °C / 104 F, frente a la media del dispositivo de 33.9 °C / 93 F.
(+) El reposamanos y el panel táctil están a una temperatura inferior a la de la piel, con un máximo de 31 °C / 87.8 F y, por tanto, son fríos al tacto.
(-) La temperatura media de la zona del reposamanos de dispositivos similares fue de 28.8 °C / 83.8 F (-2.2 °C / -4 F).
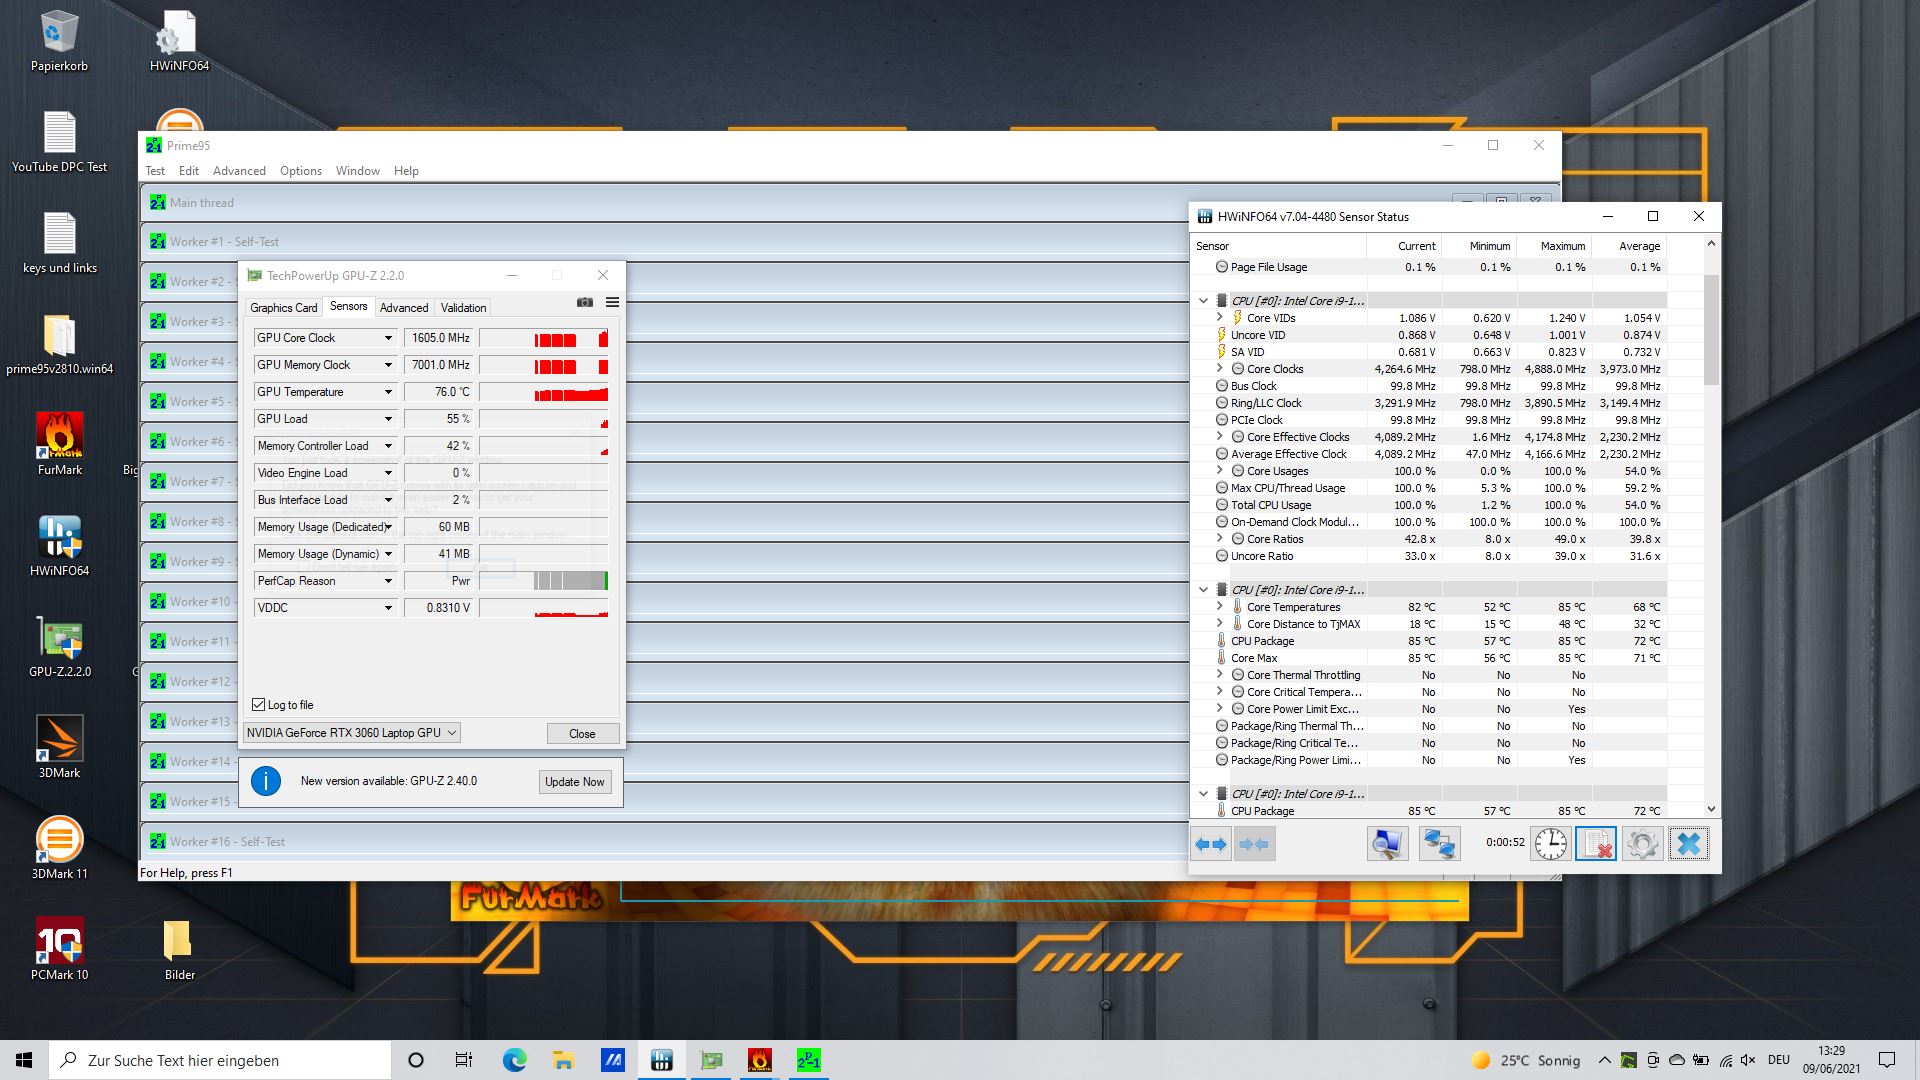
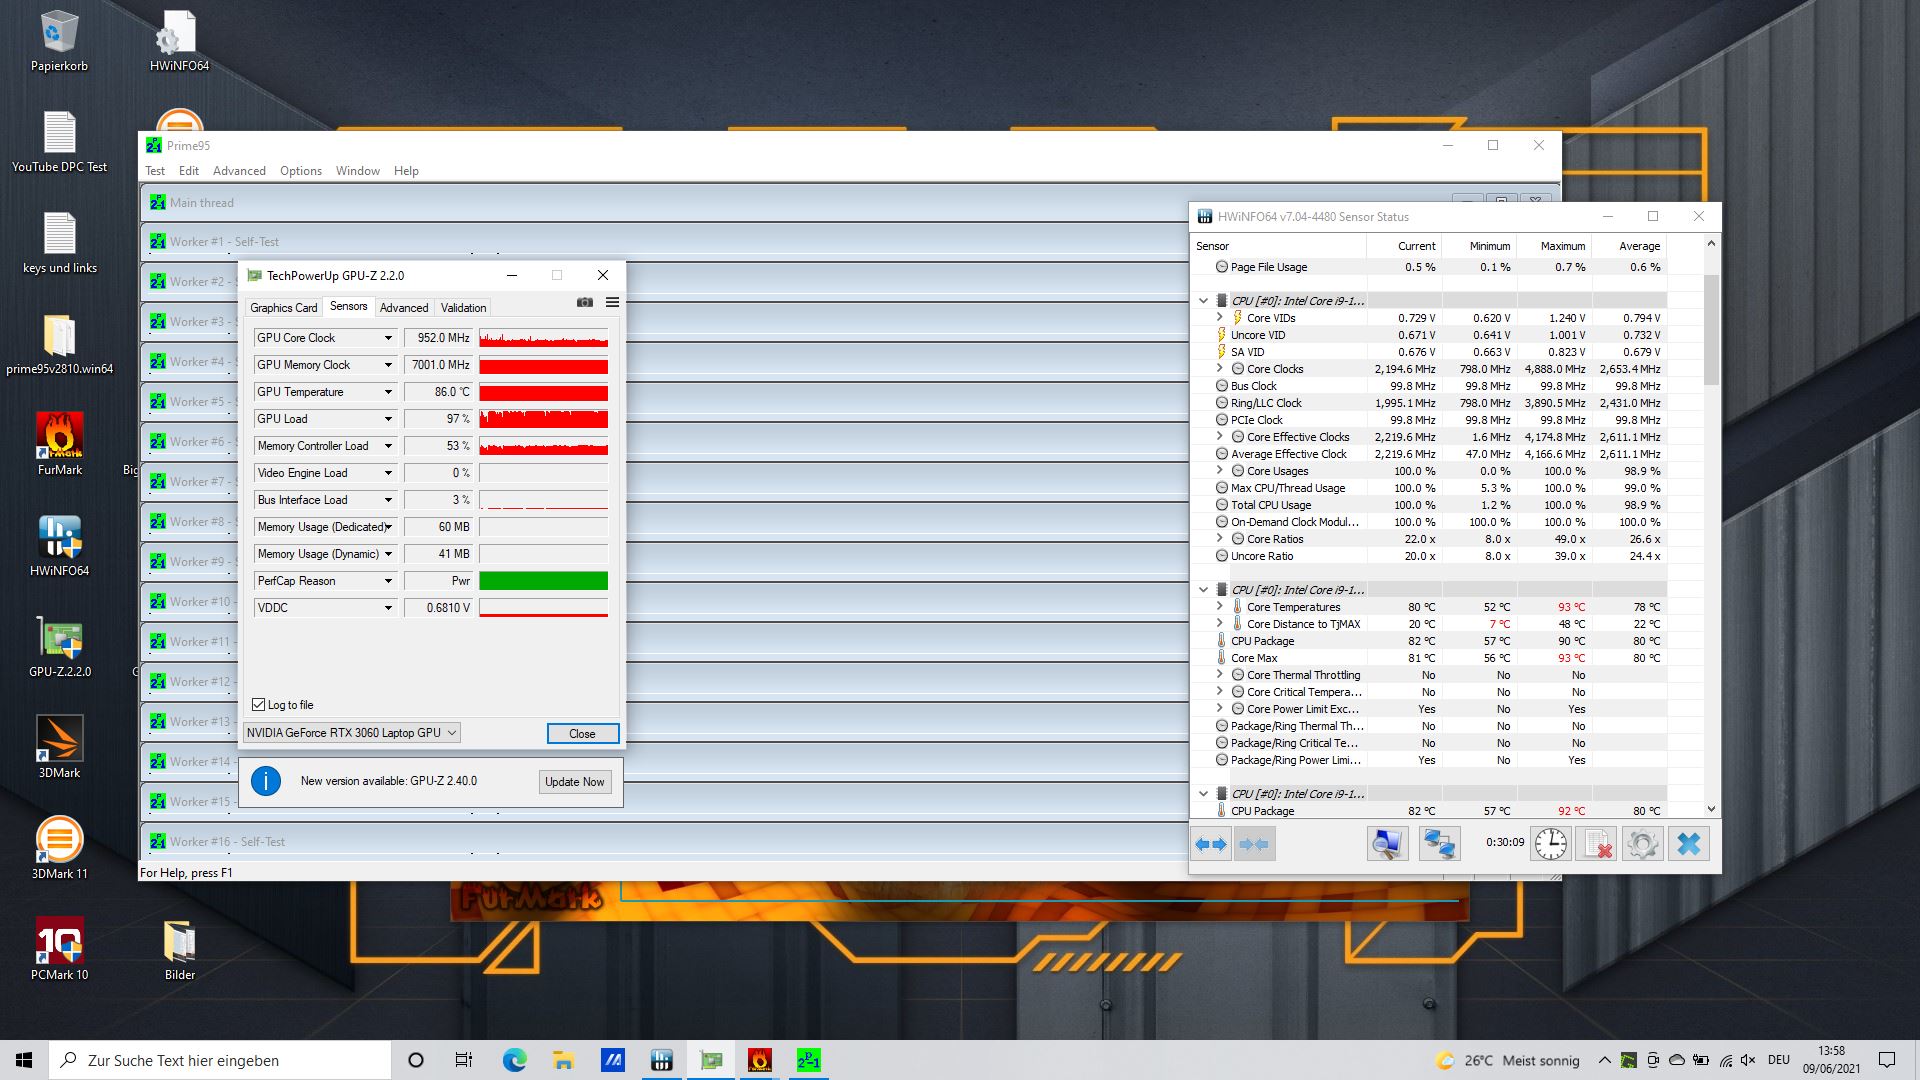
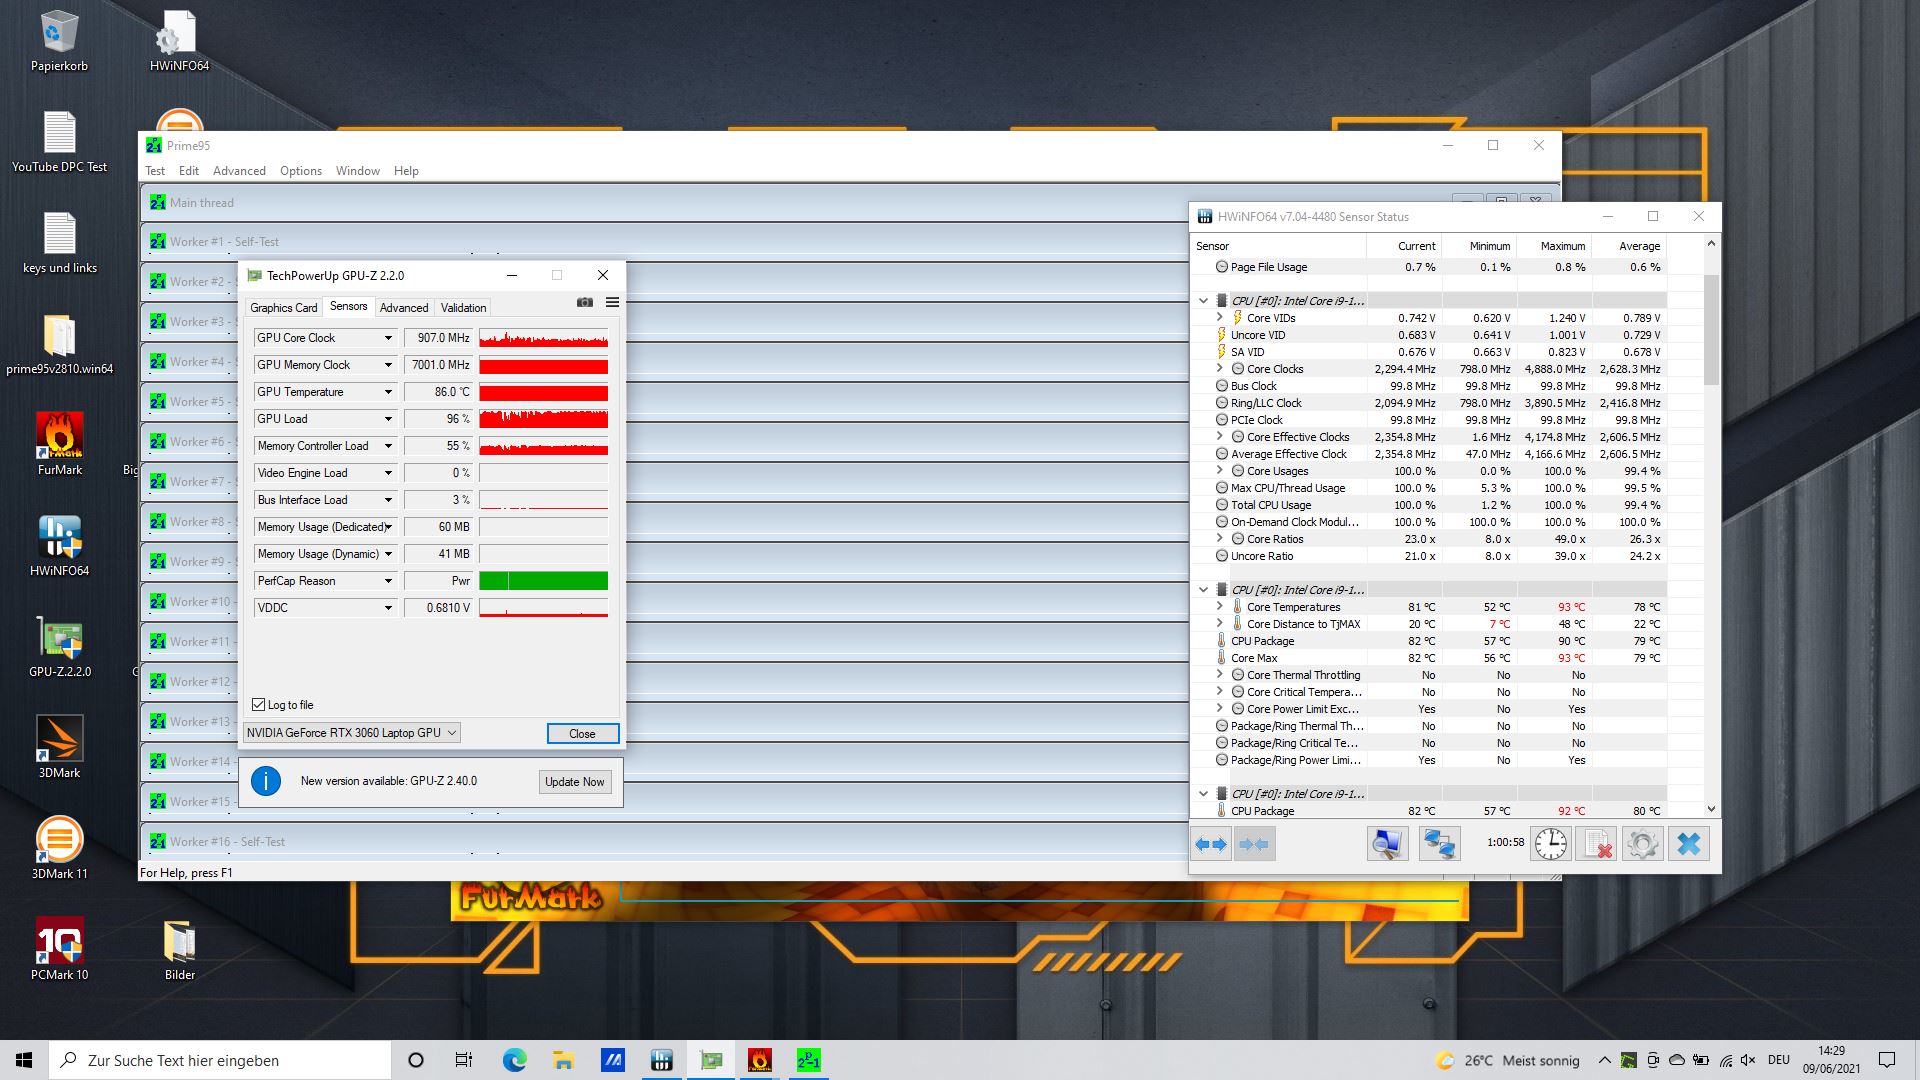
El Asus empieza nuestro test de estrés a unos 4.3 GHz. La ralentización térmica entra en juego al poco tiempo, ya que las temperaturas del núcleo alcanzan más de 90 °C. La velocidad de la CPU se sitúa finalmente en torno a los 2.3 GHz y, por tanto, ligeramente por debajo de la velocidad base de 2.5 GHz.
La velocidad de la tarjeta gráfica es de unos 1,6 GHz al principio. Desciende de forma bastante continua durante la duración de la prueba para alcanzar finalmente los 900 MHz.
Una nueva ejecución de 3DMark 11 directamente después de la prueba de estrés resulta en una puntuación de 22,300 en lugar de los 25,793 puntos originales. Esto significa que el portátil necesita algo de tiempo para recuperarse, pero la pérdida de rendimiento no es muy alta.
Altavoces
Los altavoces son, en el mejor de los casos, mediocres en comparación con el rendimiento ya decepcionante de los altavoces de los portátiles actuales. Son demasiado silenciosos, prácticamente no hay graves, e incluso los medios y los agudos podrían estar más equilibrados.
Por lo tanto, se recomiendan los dispositivos de audio externos, como los auriculares, que se pueden conectar mediante la toma de auriculares combinada.
Asus TUF Gaming F17 FX706HM análisis de audio
(±) | la sonoridad del altavoz es media pero buena (79 dB)
Graves 100 - 315 Hz
(-) | casi sin bajos - de media 15.8% inferior a la mediana
(±) | la linealidad de los graves es media (8.7% delta a frecuencia anterior)
Medios 400 - 2000 Hz
(±) | medias más altas - de media 5.5% más altas que la mediana
(+) | los medios son lineales (6.8% delta a la frecuencia anterior)
Altos 2 - 16 kHz
(+) | máximos equilibrados - a sólo 3.2% de la mediana
(±) | la linealidad de los máximos es media (9.3% delta a frecuencia anterior)
Total 100 - 16.000 Hz
(±) | la linealidad del sonido global es media (17.8% de diferencia con la mediana)
En comparación con la misma clase
» 53% de todos los dispositivos probados de esta clase eran mejores, 10% similares, 37% peores
» El mejor tuvo un delta de 6%, la media fue 18%, el peor fue ###max##%
En comparación con todos los dispositivos probados
» 36% de todos los dispositivos probados eran mejores, 8% similares, 56% peores
» El mejor tuvo un delta de 4%, la media fue 24%, el peor fue ###max##%
Schenker XMG Core 17 (Early 2021) análisis de audio
(+) | los altavoces pueden reproducir a un volumen relativamente alto (#82 dB)
Graves 100 - 315 Hz
(-) | casi sin bajos - de media 27.5% inferior a la mediana
(±) | la linealidad de los graves es media (12.8% delta a frecuencia anterior)
Medios 400 - 2000 Hz
(+) | medios equilibrados - a sólo 2.3% de la mediana
(+) | los medios son lineales (5.4% delta a la frecuencia anterior)
Altos 2 - 16 kHz
(+) | máximos equilibrados - a sólo 3.5% de la mediana
(±) | la linealidad de los máximos es media (9.9% delta a frecuencia anterior)
Total 100 - 16.000 Hz
(±) | la linealidad del sonido global es media (17.5% de diferencia con la mediana)
En comparación con la misma clase
» 49% de todos los dispositivos probados de esta clase eran mejores, 12% similares, 40% peores
» El mejor tuvo un delta de 6%, la media fue 18%, el peor fue ###max##%
En comparación con todos los dispositivos probados
» 34% de todos los dispositivos probados eran mejores, 8% similares, 58% peores
» El mejor tuvo un delta de 4%, la media fue 24%, el peor fue ###max##%
Gestión de la energía - Batería de gran tamaño y bajo consumo de energía
Consumo de energía
El F17 consume sólo unos pocos puntos porcentuales más que el A17 con su GTX 1660 Ti, mientras que el XMG Pro, que es alrededor de un 7% más rápido en aplicaciones gráficas, consume un 30% más. En general, el TUF Gaming tiene un consumo de energía relativamente bajo. Medimos un consumo máximo de 190 vatios, que debería cubrirse fácilmente con el adaptador de corriente de 200 vatios
| Off / Standby | |
| Ocioso | |
| Carga |
|
Clave:
min: | |
| Asus TUF Gaming F17 FX706HM i9-11900H, GeForce RTX 3060 Laptop GPU, SK Hynix HFM001TD3JX013N, IPS, 1920x1080, 17.3" | Asus TUF A17 FA706IU-AS76 R7 4800H, GeForce GTX 1660 Ti Mobile, Intel SSD 660p 1TB SSDPEKNW010T8, IPS, 1920x1080, 17.3" | Schenker XMG Core 17 (Early 2021) i7-10870H, GeForce RTX 3060 Laptop GPU, Samsung SSD 970 EVO Plus 1TB, IPS, 2560x1440, 17.3" | MSI Alpha 17 A4DEK R7 4800H, Radeon RX 5600M, Kingston OM8PCP3512F-AB, IPS, 1920x1080, 17.3" | MSI GF65 Thin 10UE i7-10750H, GeForce RTX 3060 Laptop GPU, Samsung SSD PM981 MZVLB1T0HALR, IPS, 1920x1080, 15.6" | Acer Aspire Nitro 5 AN515-55-57GF i5-10300H, GeForce RTX 3060 Laptop GPU, WDC PC SN530 SDBPNPZ-512G, IPS, 1920x1080, 15.6" | Medio NVIDIA GeForce RTX 3060 Laptop GPU | Media de la clase Gaming | |
|---|---|---|---|---|---|---|---|---|
| Power Consumption | 7% | -30% | 1% | 10% | 21% | -14% | -35% | |
| Idle Minimum * (Watt) | 10.3 | 7.4 28% | 13 -26% | 9 13% | 5.4 48% | 5 51% | 10.4 ? -1% | 13.2 ? -28% |
| Idle Average * (Watt) | 13.1 | 10.5 20% | 16 -22% | 12 8% | 12.8 2% | 9 31% | 14.5 ? -11% | 18.9 ? -44% |
| Idle Maximum * (Watt) | 14.1 | 17 -21% | 29 -106% | 18 -28% | 19.5 -38% | 13 8% | 21.4 ? -52% | 24.3 ? -72% |
| Load Average * (Watt) | 110 | 103.7 6% | 100 9% | 76 31% | 86.6 21% | 84 24% | 109.3 ? 1% | 108.3 ? 2% |
| Witcher 3 ultra * (Watt) | 138 | 128.1 7% | 173 -25% | 136 1% | 115.7 16% | 125 9% | ||
| Load Maximum * (Watt) | 190 | 183.2 4% | 213 -12% | 222 -17% | 175.2 8% | 190 -0% | 206 ? -8% | 254 ? -34% |
* ... más pequeño es mejor
Duración de la batería
Con 90 Wh, la batería es bastante grande; esto tiene un efecto muy positivo en la duración, que es sorprendentemente larga para un portátil de juegos. Los competidores Schenker XMG Pro y MSI Alpha sólo están equipados con baterías de 62 Wh y 65 Wh, respectivamente.
En la prueba WLAN, el F17 duró 7,5 horas y, por tanto, unas 2,5 horas más que el XMG Pro.
| Asus TUF Gaming F17 FX706HM i9-11900H, GeForce RTX 3060 Laptop GPU, 90 Wh | Asus TUF A17 FA706IU-AS76 R7 4800H, GeForce GTX 1660 Ti Mobile, 90 Wh | Schenker XMG Core 17 (Early 2021) i7-10870H, GeForce RTX 3060 Laptop GPU, 62 Wh | MSI Alpha 17 A4DEK R7 4800H, Radeon RX 5600M, 65 Wh | MSI GF65 Thin 10UE i7-10750H, GeForce RTX 3060 Laptop GPU, 51 Wh | Acer Aspire Nitro 5 AN515-55-57GF i5-10300H, GeForce RTX 3060 Laptop GPU, 57.5 Wh | Media de la clase Gaming | |
|---|---|---|---|---|---|---|---|
| Duración de Batería | 22% | -43% | -22% | -48% | -31% | -17% | |
| H.264 (h) | 8.5 | 4.7 -45% | 6.2 -27% | 8.26 ? -3% | |||
| WiFi v1.3 (h) | 7.6 | 8.5 12% | 4.9 -36% | 7.3 -4% | 4.6 -39% | 5.7 -25% | 7.04 ? -7% |
| Load (h) | 2.5 | 3.3 32% | 1.3 -48% | 1.5 -40% | 1.1 -56% | 1.5 -40% | 1.47 ? -41% |
| Reader / Idle (h) | 9.1 | 7.7 | 10.5 | 11.1 | 8.71 ? |
Pro
Contra
Veredicto - Buen portátil para juegos de presupuesto
La RTX 3060 del F17 solo tiene un TGP máximo de 95 vatios, pero su rendimiento en los juegos es solo ligeramente inferior al del XMG Pro con su TGP de 130 vatios. Como resultado, definitivamente no te equivocarás con el portátil de juegos económico en términos de rendimiento. El Thunderbolt 4 no es una obviedad para un dispositivo de juego económico, y los clientes también estarán satisfechos con el SSD, que es bueno para este rango de precios, y sobre todo con la fuerte duración de la batería. Además, la pantalla soporta Adaptive Sync y 144 Hz.
Sin embargo, las tasas restantes del monitor son menos impresionantes, y la débil conexión Wi-Fi también es digna de crítica. Pero los aspectos positivos prevalecen con creces, por lo que los usuarios obtendrán un buen portátil para juegos con el F17. La única cuestión ahora es a qué precio se venderá el portátil, lo que determinará si su compra es recomendable o si hay mejores alternativas en este rango de precios.
El TUF Gaming F17 ofrece un buen rendimiento en juegos, Thunderbolt 4 y 144 Hz con Adaptive Sync. Sin embargo, la pantalla podría ser mejor, así como el rendimiento Wi-Fi.
Precio y disponibilidad
Asus TUF Gaming F17 FX706HM
- 06/24/2021 v7 (old)
Christian Hintze
Price comparison

