Análisis del portátil Asus ZenBook 14X (2023): El ultrabook OLED al límite

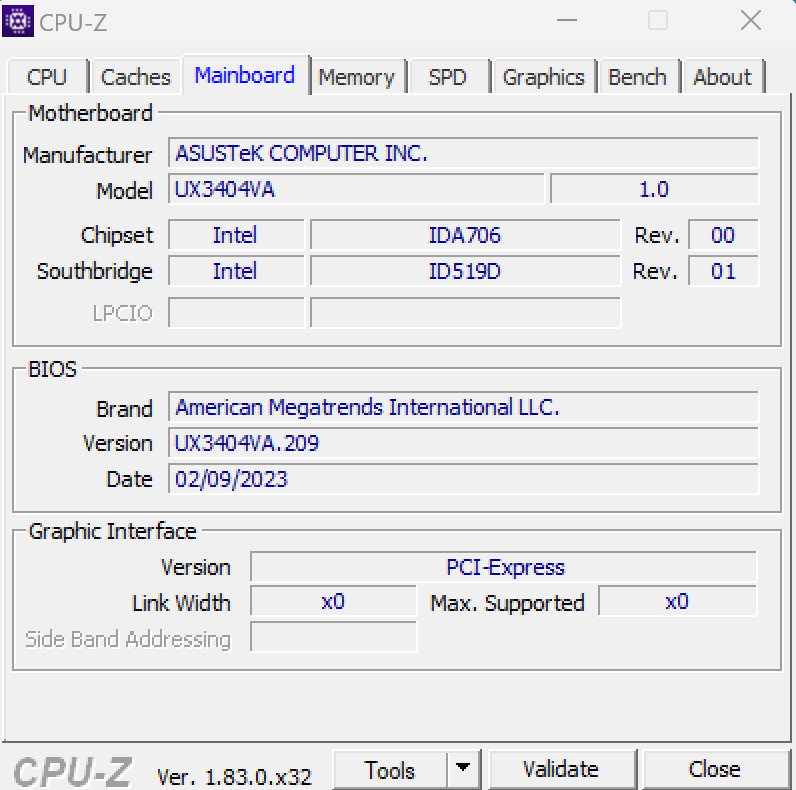
Asus ha renovado ligeramente el Asus ZenBook 14X para que ahora se parezca mucho al compacto ultrabook de 13 pulgadas ZenBook S13. Sin embargo, el peso del 14" con su chasis excepcionalmente bueno es significativamente mayor, 1.56 kg. A cambio, Asus instala el mucho más potente Intel Core i9-13900H y, si hace falta, una Nvidia GeForce RTX 3050. Como el predecesor, se instala una pantalla OLED 2.8K, que ha pasado de 90 Hz a unos muy buenos 120 Hz.
Dado que no hay muchos competidores con pantalla OLED en el segmento de 14 pulgadas, también hemos incluido competidores IPS para comparar. Interesante aquí es el Asus ROG Flow Z13 GZ301V tablet, que está equipado con el mismo potente procesador Intel Core i9.
Posibles contendientes en la comparación
Valoración | Fecha | Modelo | Peso | Altura | Tamaño | Resolución | Precio |
|---|---|---|---|---|---|---|---|
| 88.5 % v7 (old) | 06/2023 | Asus ZenBook 14X UX3404VC i9-13900H, Iris Xe G7 96EUs | 1.6 kg | 16.9 mm | 14.50" | 2880x1800 | |
| 91.9 % v7 (old) | 06/2022 | Apple MacBook Pro 13 2022 M2 M2, M2 10-Core GPU | 1.4 kg | 15.6 mm | 13.30" | 2560x1600 | |
| 89.2 % v7 (old) | 04/2023 | Lenovo Slim Pro 7 14ARP8 R7 7735HS, GeForce RTX 3050 6GB Laptop GPU | 1.6 kg | 15.6 mm | 14.50" | 2560x1600 | |
| 89.1 % v7 (old) | 04/2023 | Asus ROG Flow Z13 GZ301V i9-13900H, GeForce RTX 4060 Laptop GPU | 1.6 kg | 14.2 mm | 13.40" | 2560x1600 | |
| 87.3 % v7 (old) | 09/2022 | Dell XPS 13 Plus 9320 i7-1280P OLED i7-1280P, Iris Xe G7 96EUs | 1.3 kg | 15.28 mm | 13.40" | 3456x2160 | |
| 87.2 % v7 (old) | 09/2022 | Dell Inspiron 14 Plus 7420 i7-12700H, GeForce RTX 3050 4GB Laptop GPU | 1.7 kg | 18.87 mm | 14.00" | 2240x1400 | |
| 86.6 % v7 (old) | 10/2022 | LG Gram 14Z90Q i5-1240P, Iris Xe G7 80EUs | 980 g | 16.8 mm | 14.00" | 1920x1200 |
Maletín - No hay nada de más calidad que esto
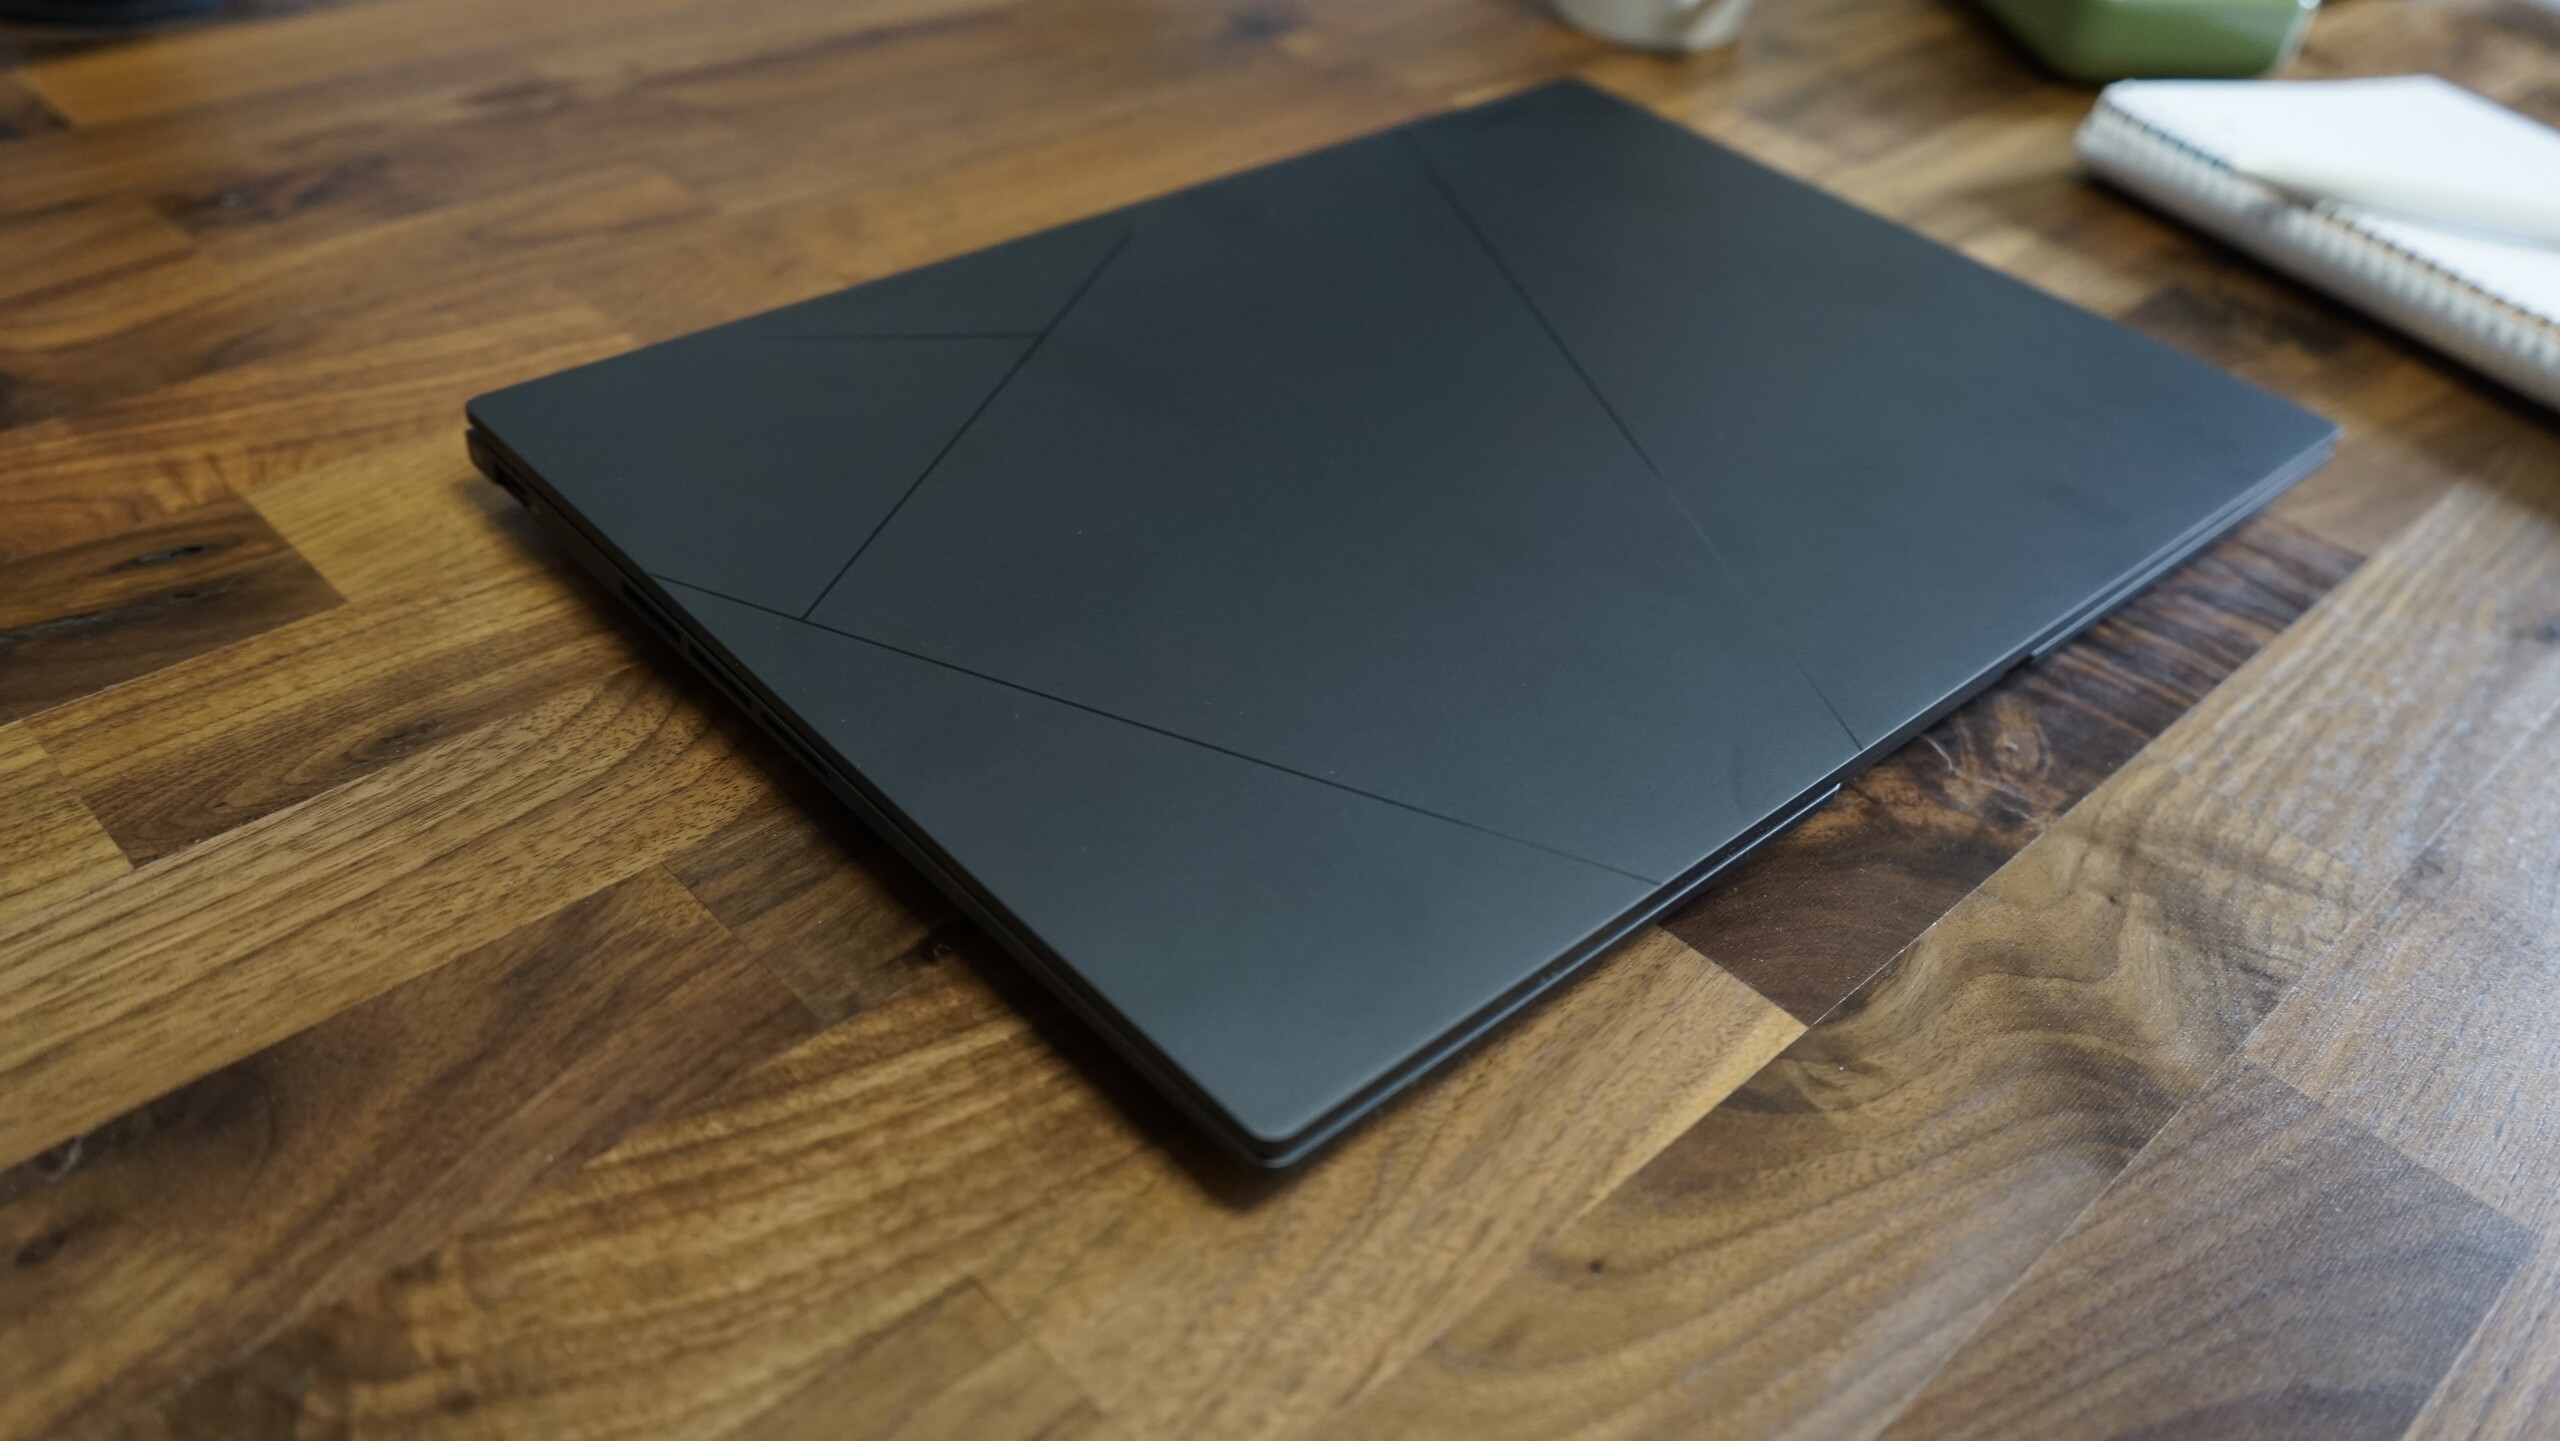
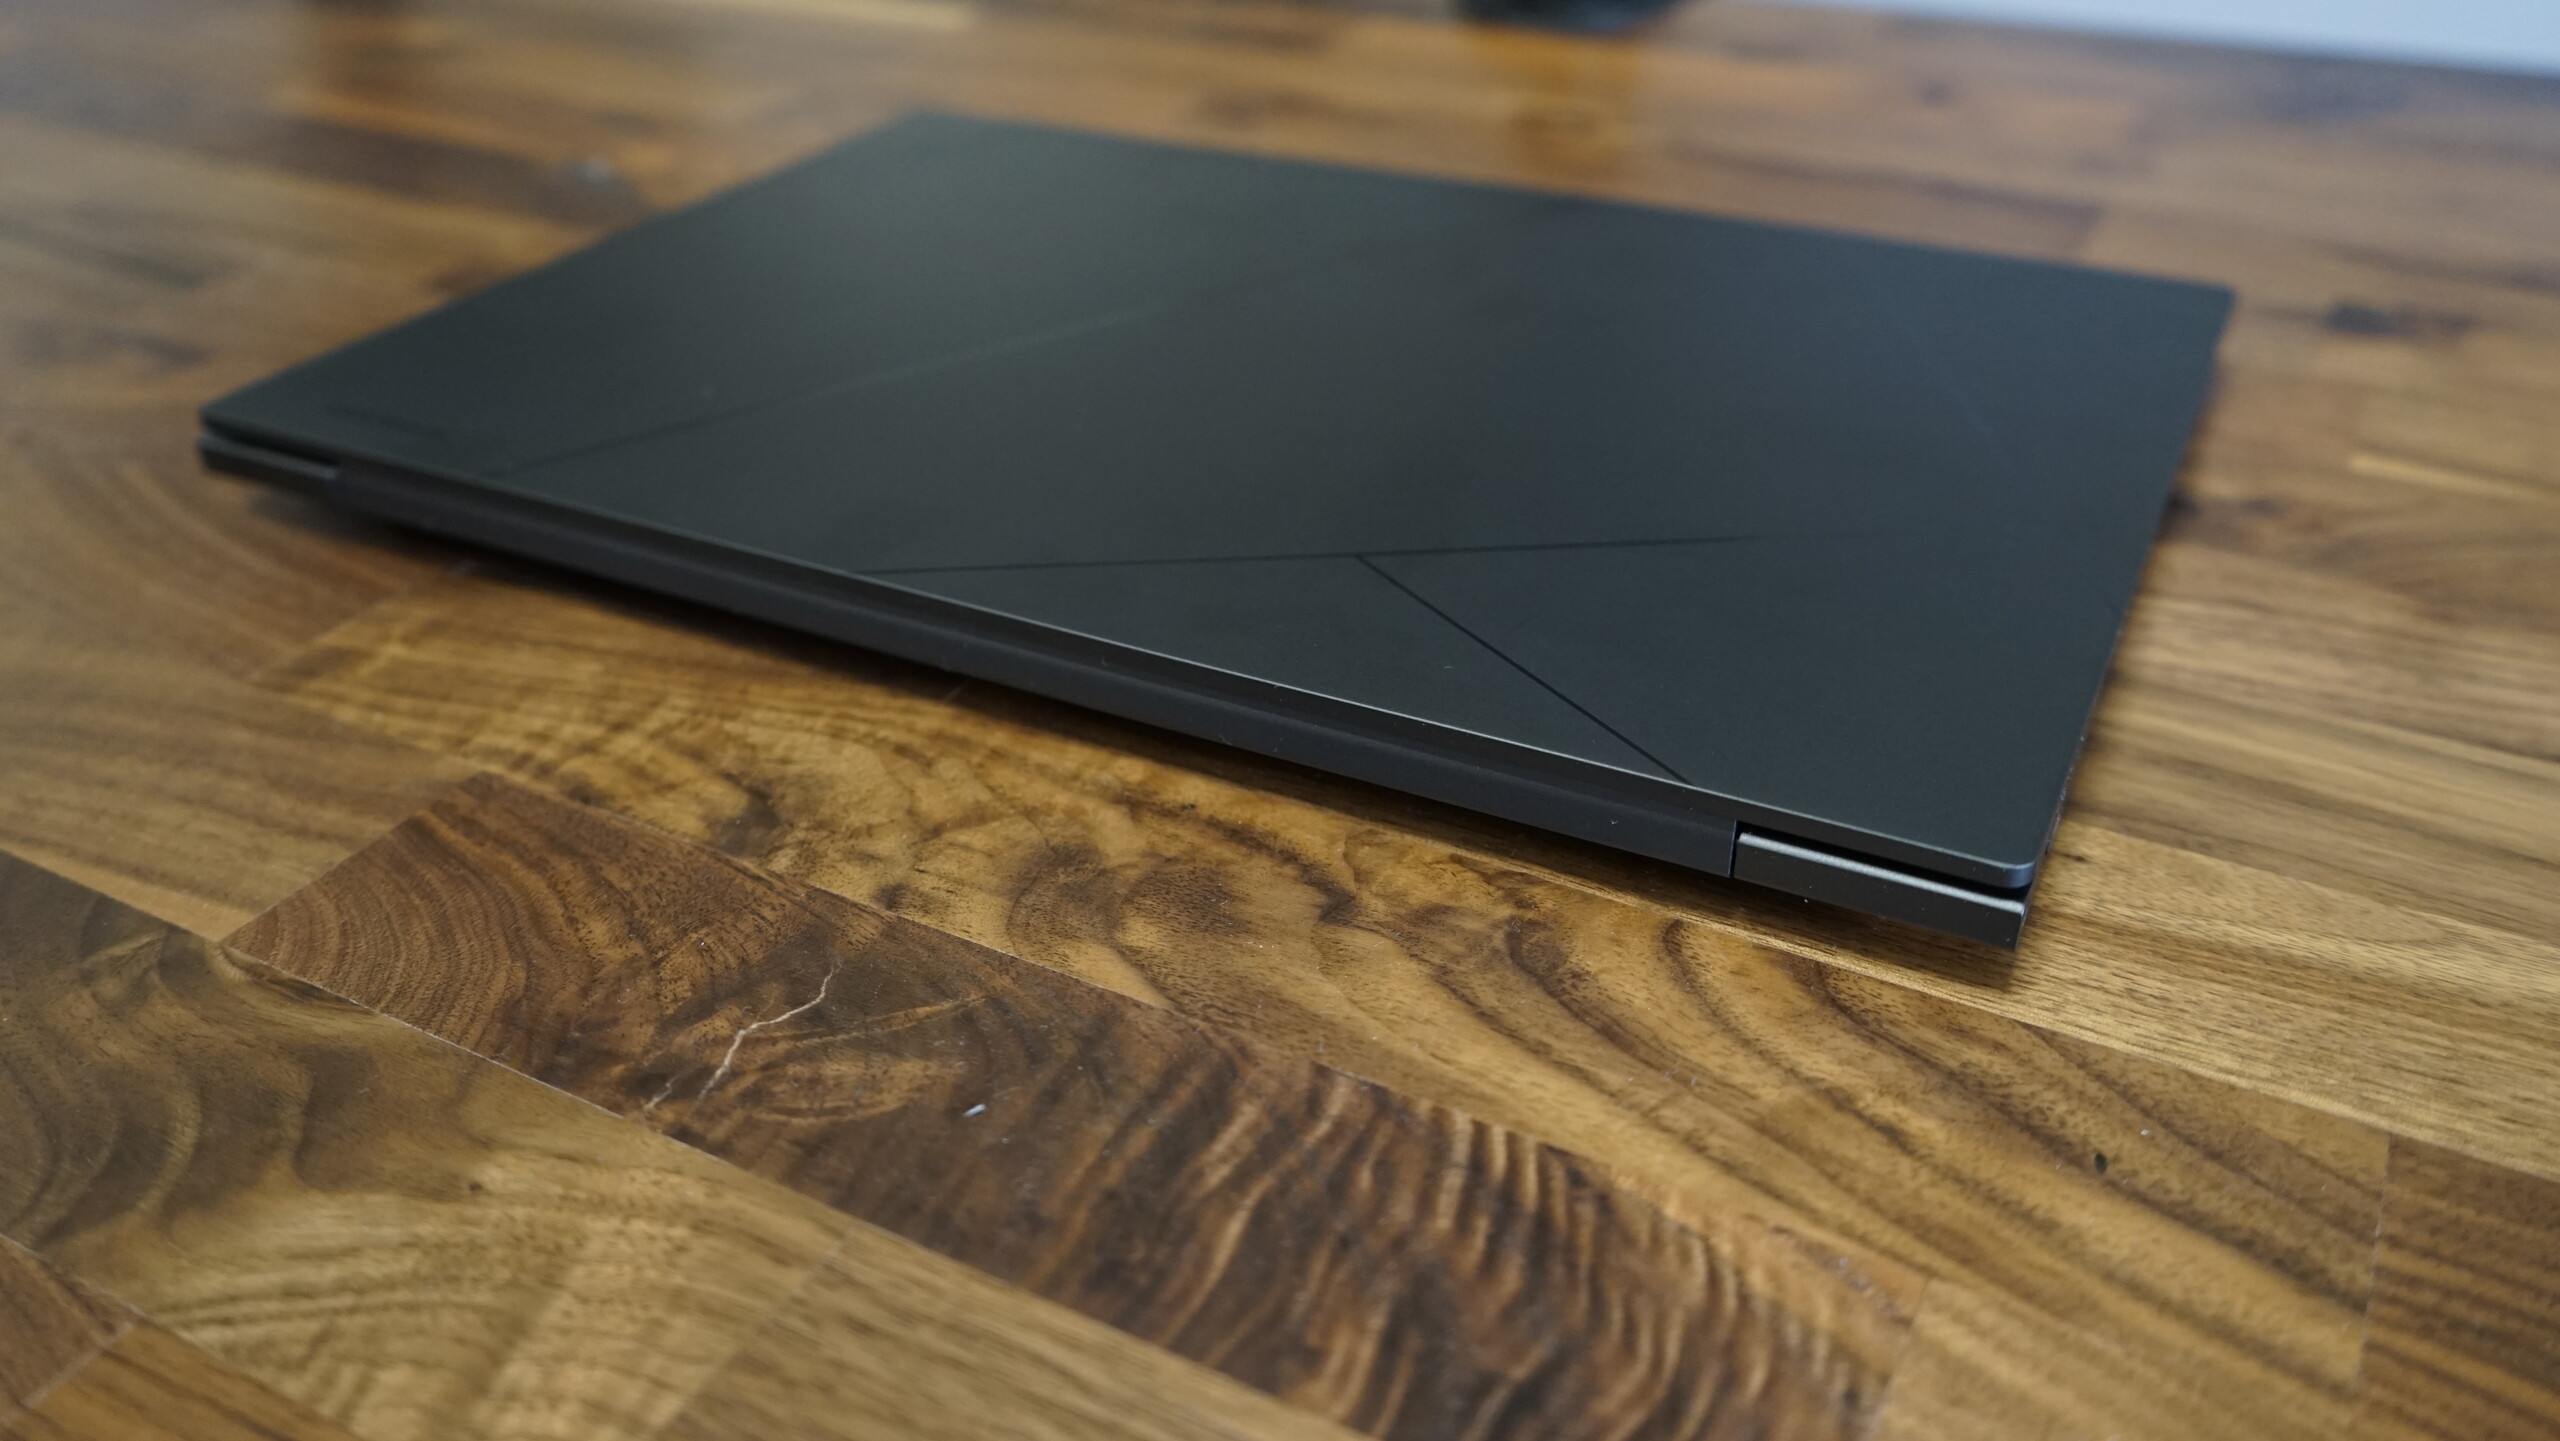
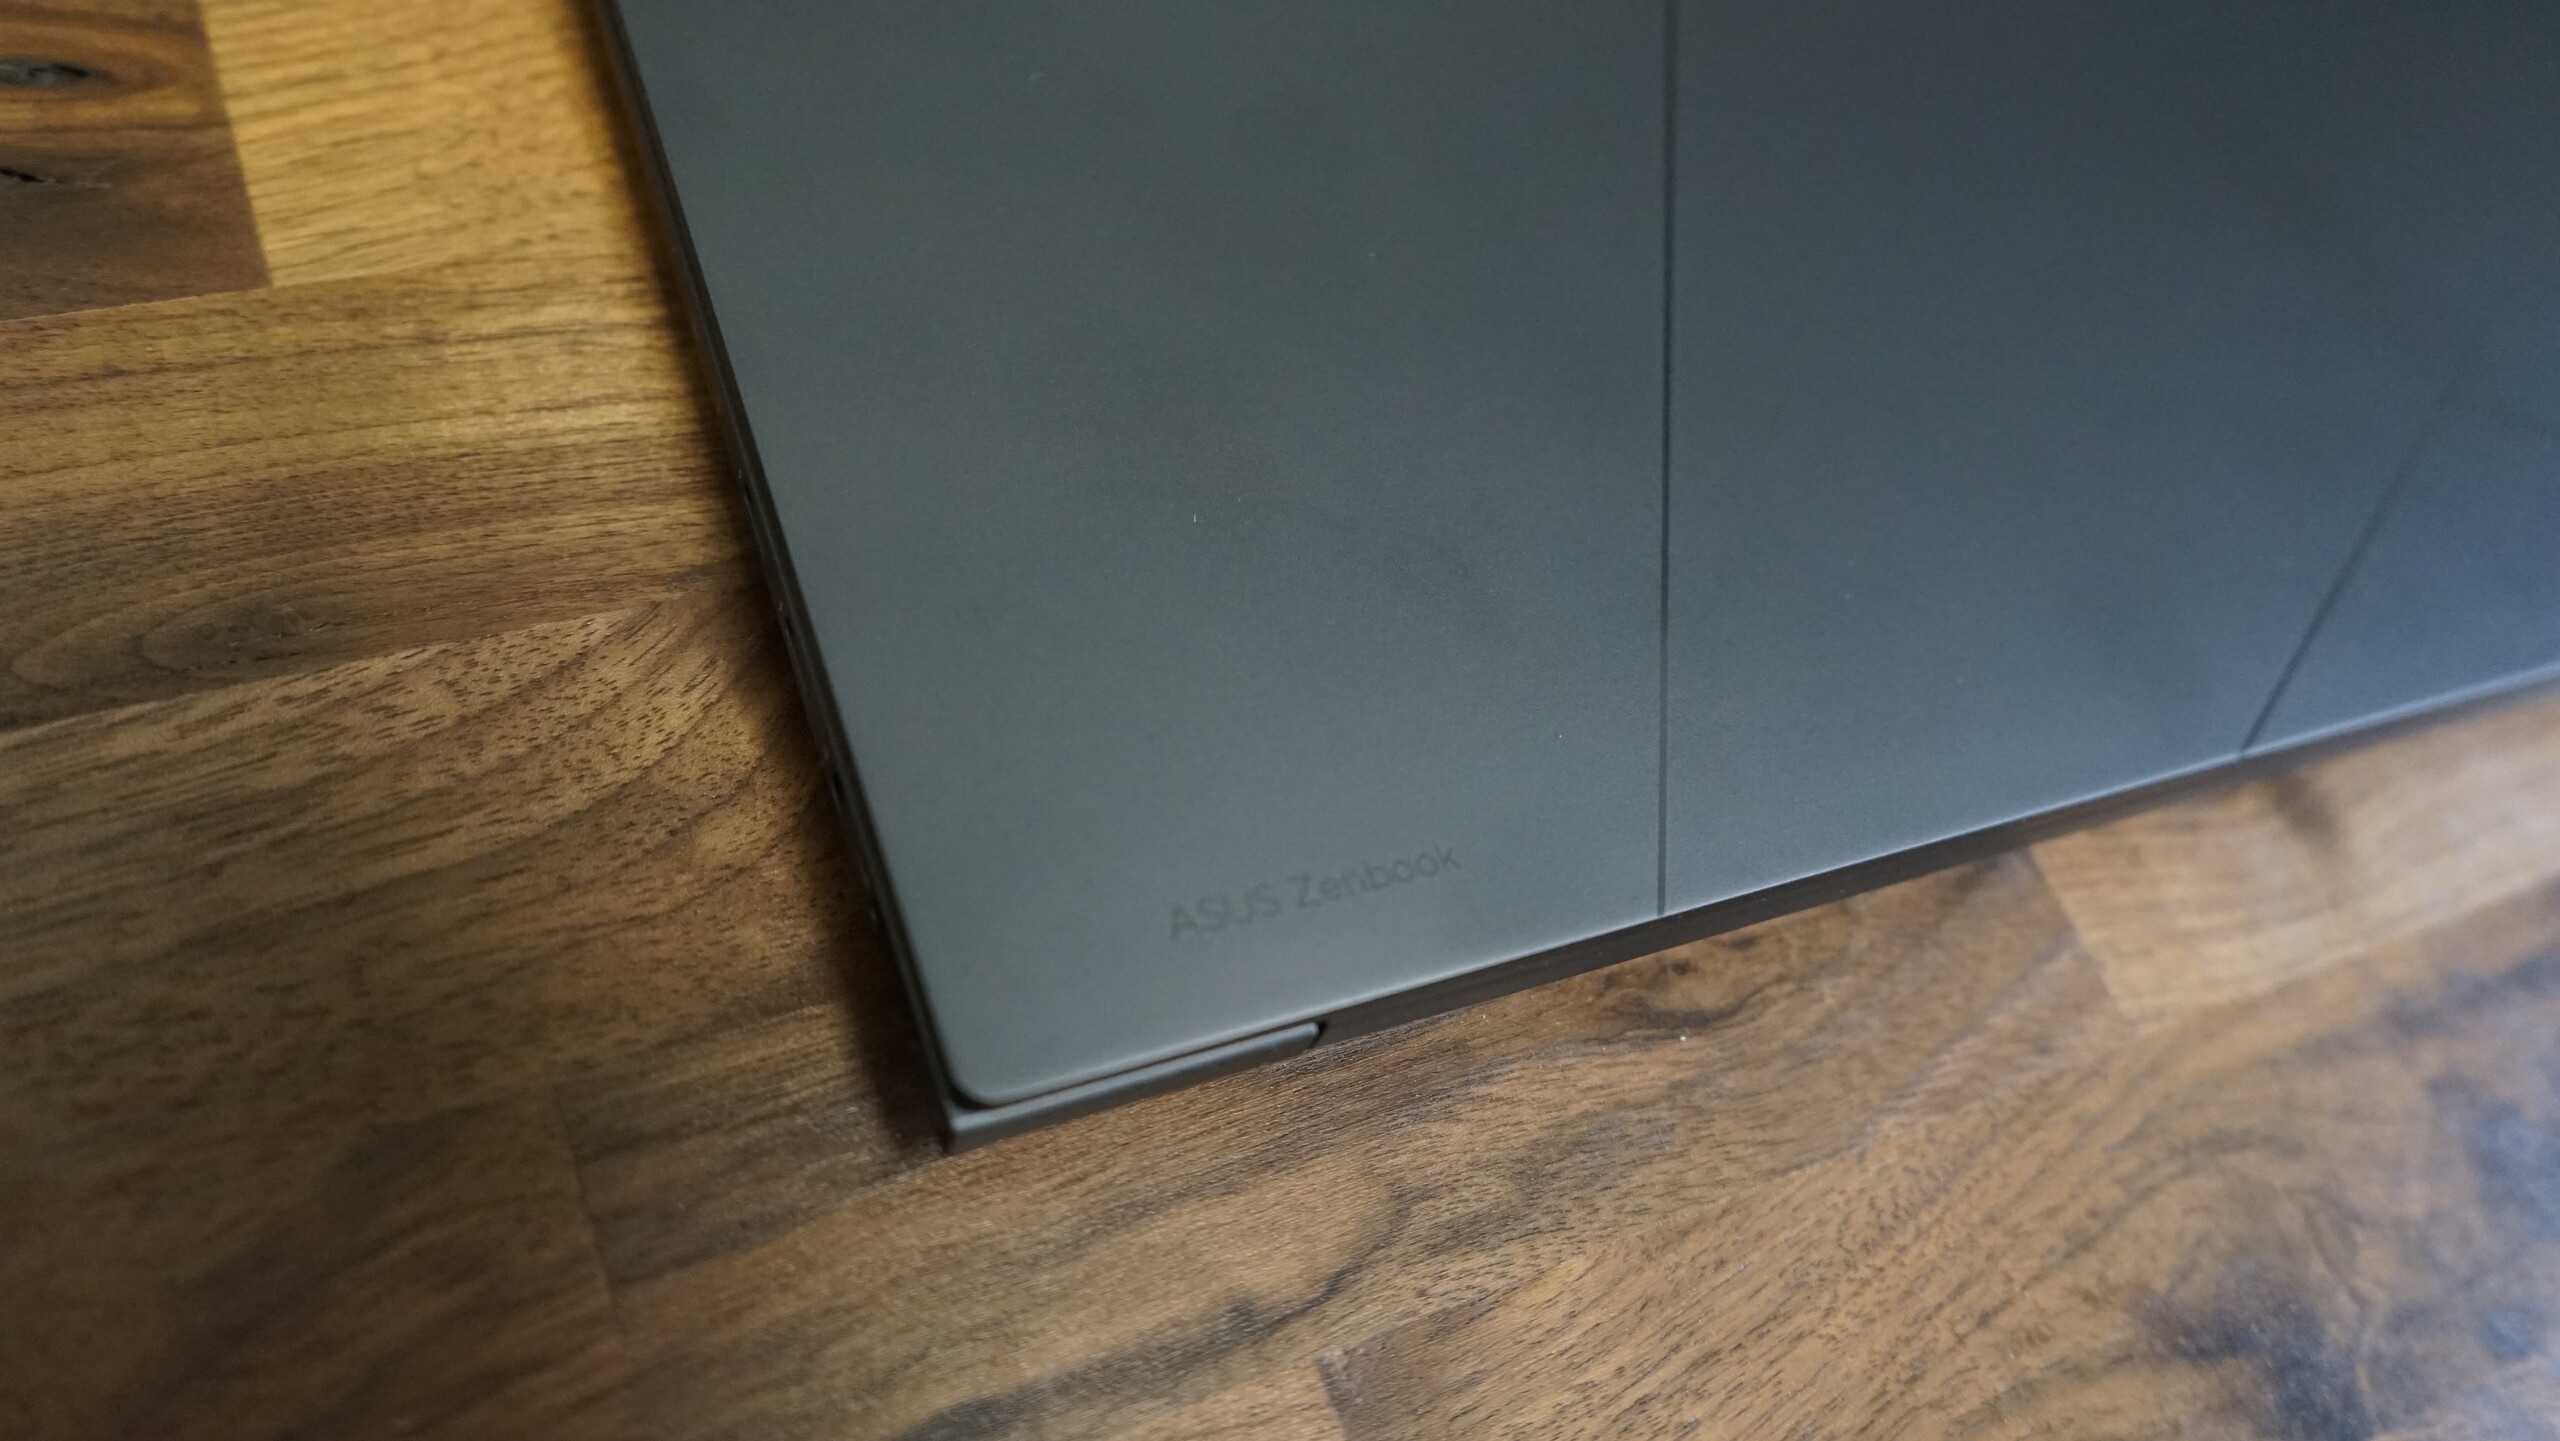
La carcasa del nuevo Asus ZenBook 14X se parece en gran medida a la de su predecesor, pero sigue siendo ligeramente diferente en diseño. Todo el chasis es de aluminio, por lo que es particularmente robusto y resistente a la torsión, lo que también se refleja en el mayor peso. La tapa no se puede deformar sin fuerza y lleva el mismo logo ProArt que el ZenBook S 13 2023. El nuevo ZenBook está disponible en Beige Sandstone o Gris Inkwell. La variante gris de nuestro análisis parece de gran calidad y elegante, pero las huellas se ven rápidamente
Cuando está cerrado, la tapa se sujeta magnéticamente a la base. Las bisagras, como el resto de la carcasa, son de alta calidad y ajustadas. No obstante, es posible abrir el portátil con una sola mano. A pesar de lo ajustado de las bisagras, la pantalla no se balancea de un lado a otro al escribir, ya que la base es lo suficientemente pesada y estable.
El diseño robusto también se extiende a la zona del teclado. Aquí, también, el ZenBook es extremadamente resistente y el área del teclado no cede en ninguna parte.
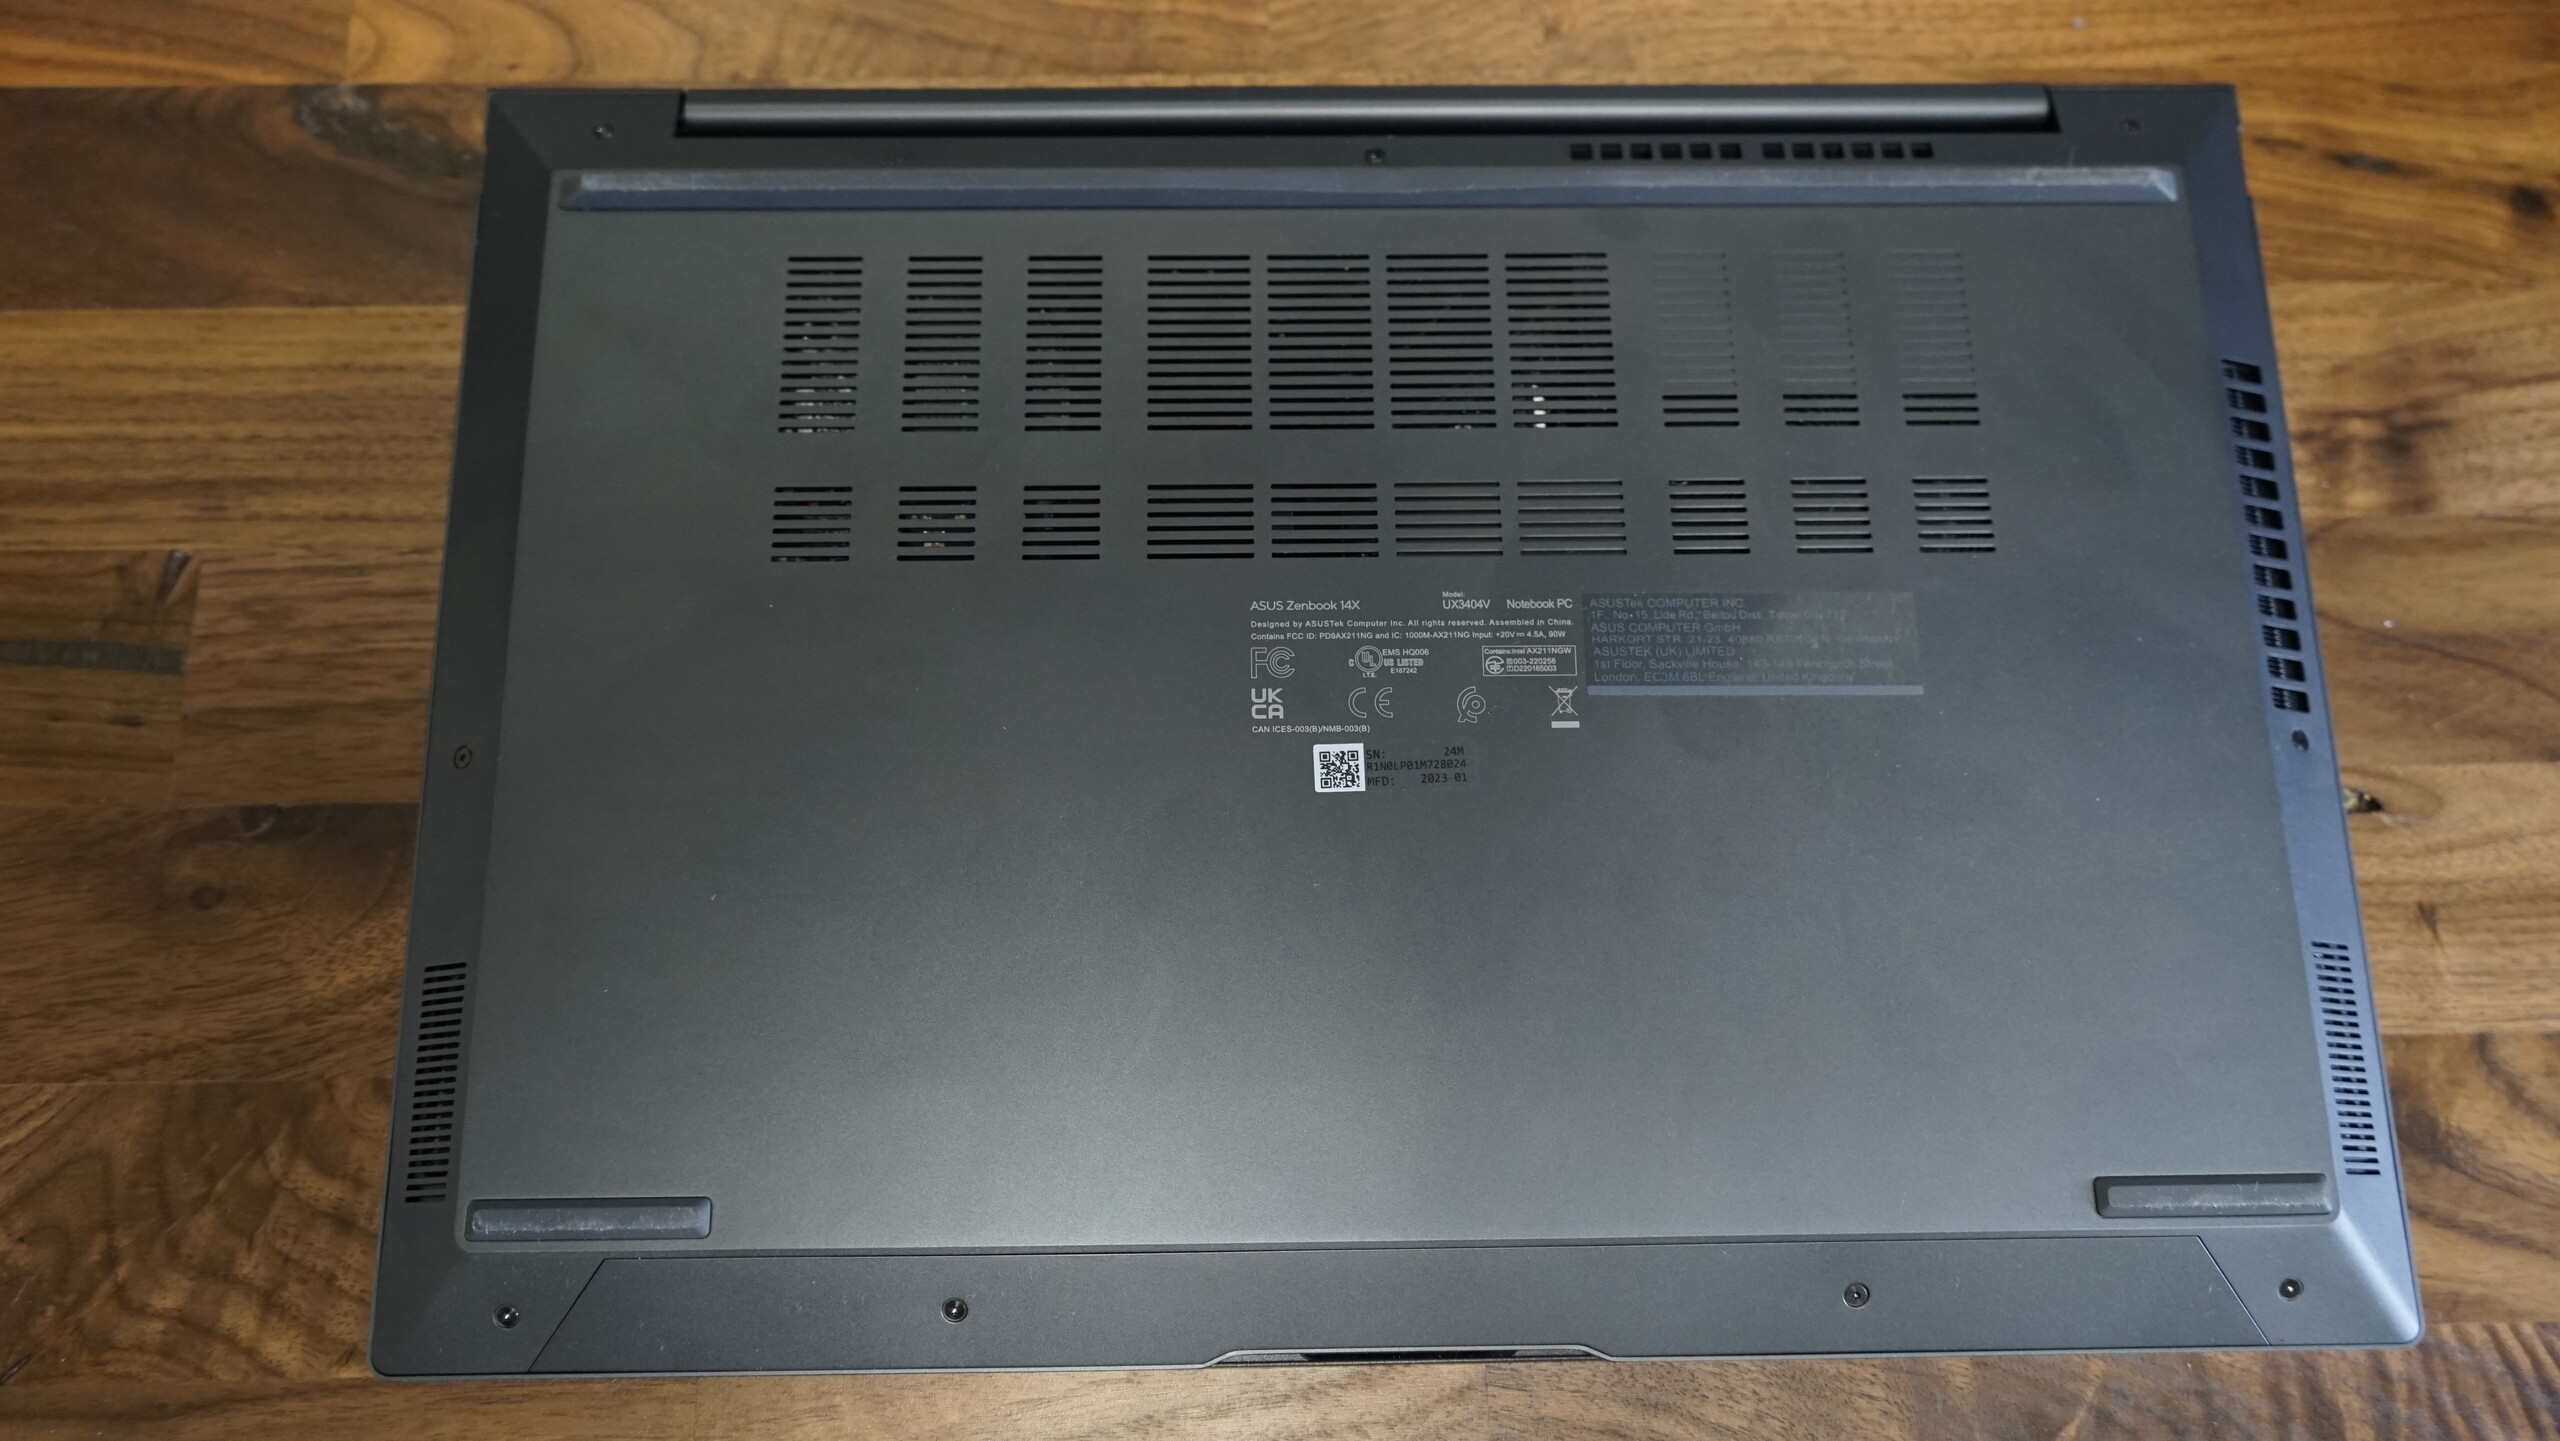
A diferencia del ZenBook S 13 de 2023, el nuevo ZenBook 14X no usa el mecanismo ErgoLift, sino que vuelve al diseño clásico. Los pies comparativamente grandes de la base ofrecen espacio suficiente para que los ventiladores trabajen sin restricciones.
La versión anterior del ZenBook 14X pesaba más que muchos otros subportátiles, 1,406 kg. El ZenBook 14X 2023 sube un peldaño y ahora pesa 1.56 kg. En el campo de la comparación, el Lenovo Slim Pro 7 14ARP8 y el Dell Inspiron 14 Plus 7420están aún más arriba, y el Asus ROG Flow Z13 GZ301Vcon el mismo procesador Intel Core i9 pesa casi exactamente lo mismo, 1,551 kg. Con 16.9 mm, el ZenBook 14X cae en el medio campo y no está tan por encima de la media en términos de profundidad.
Equipamiento
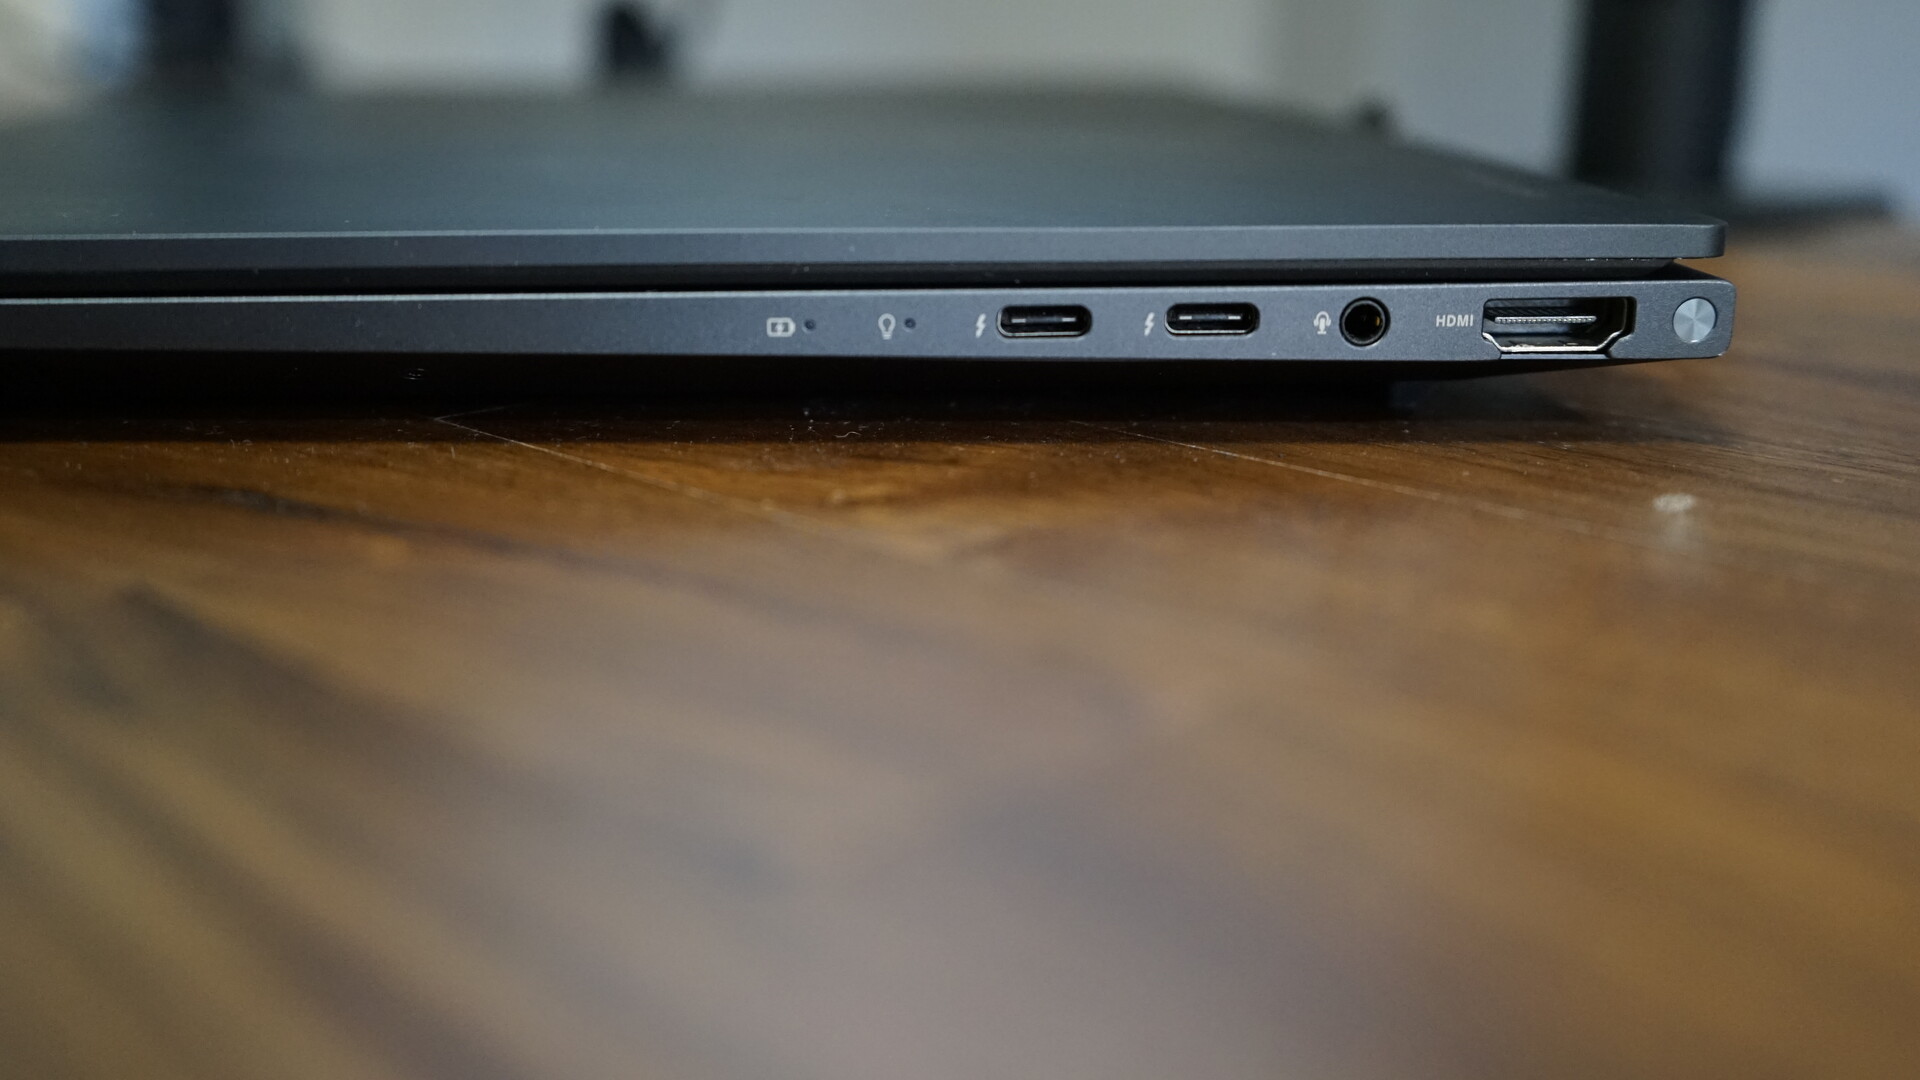
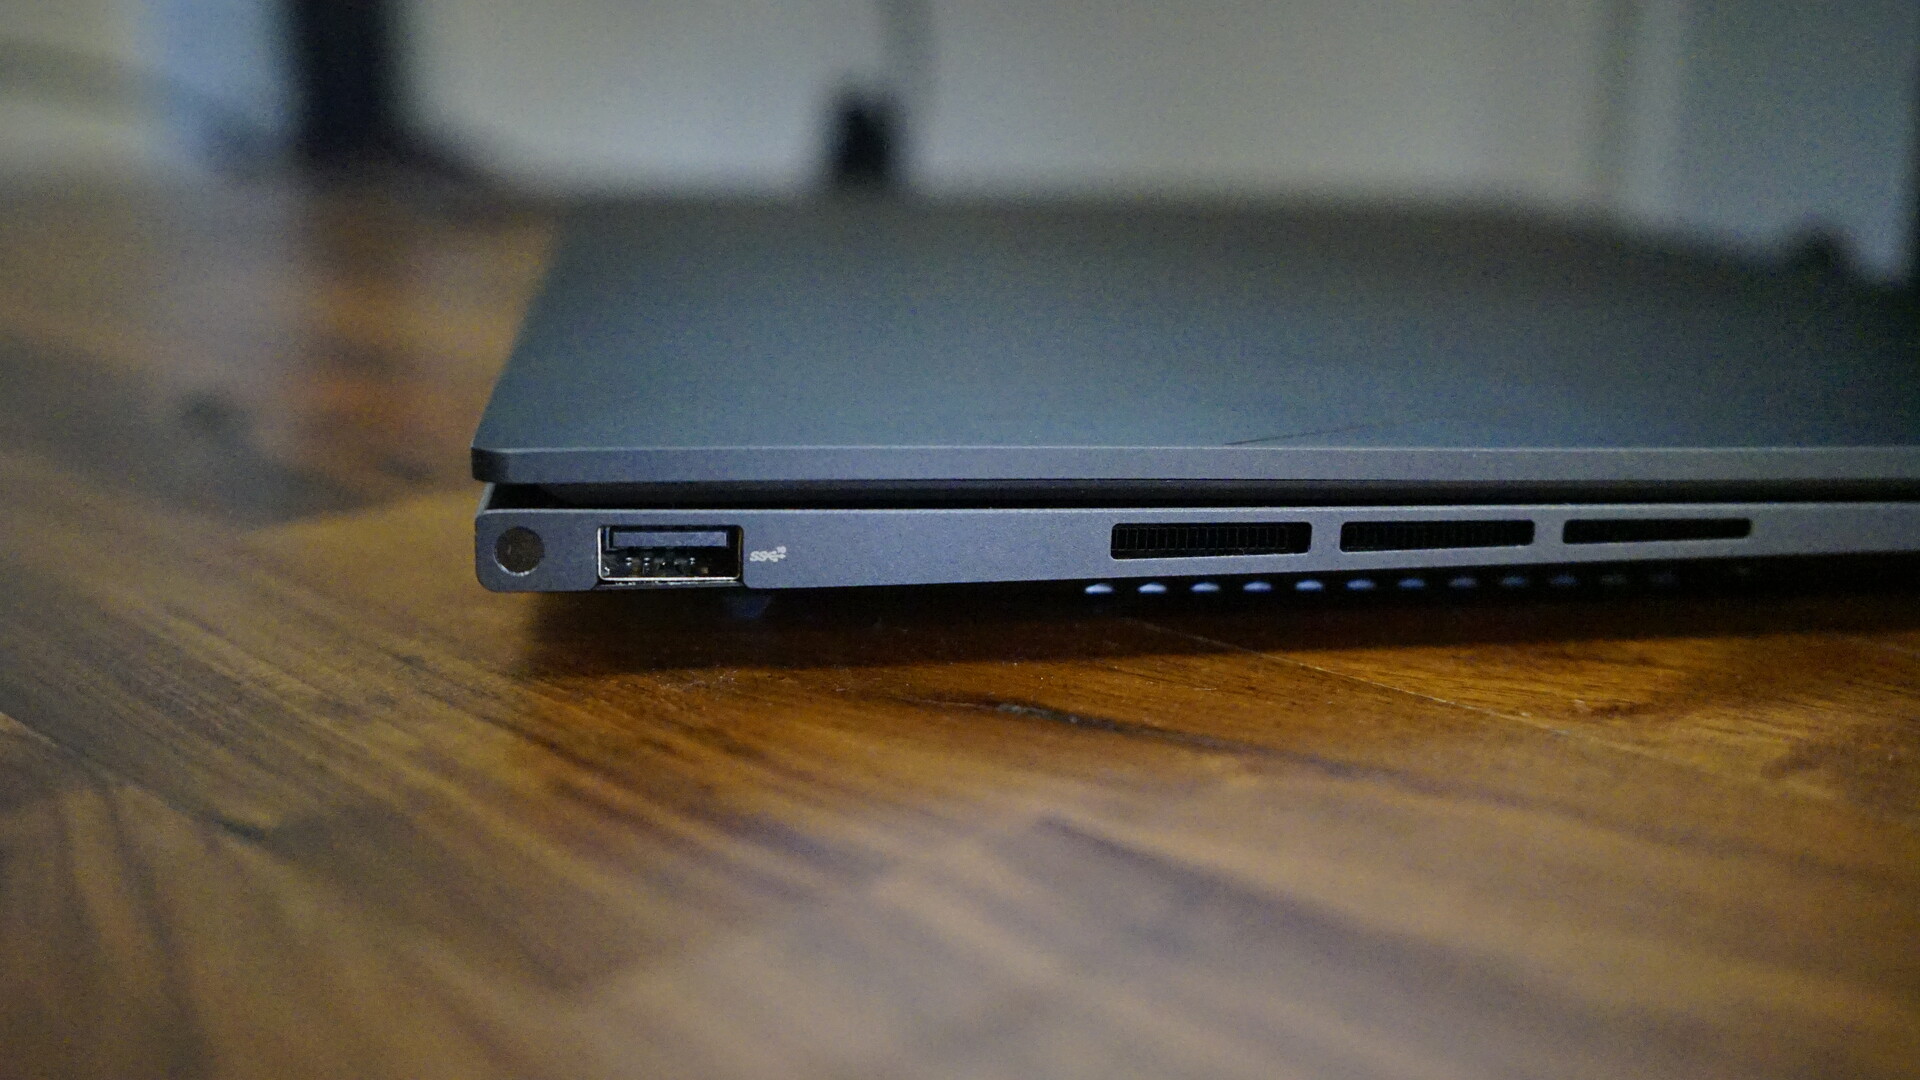
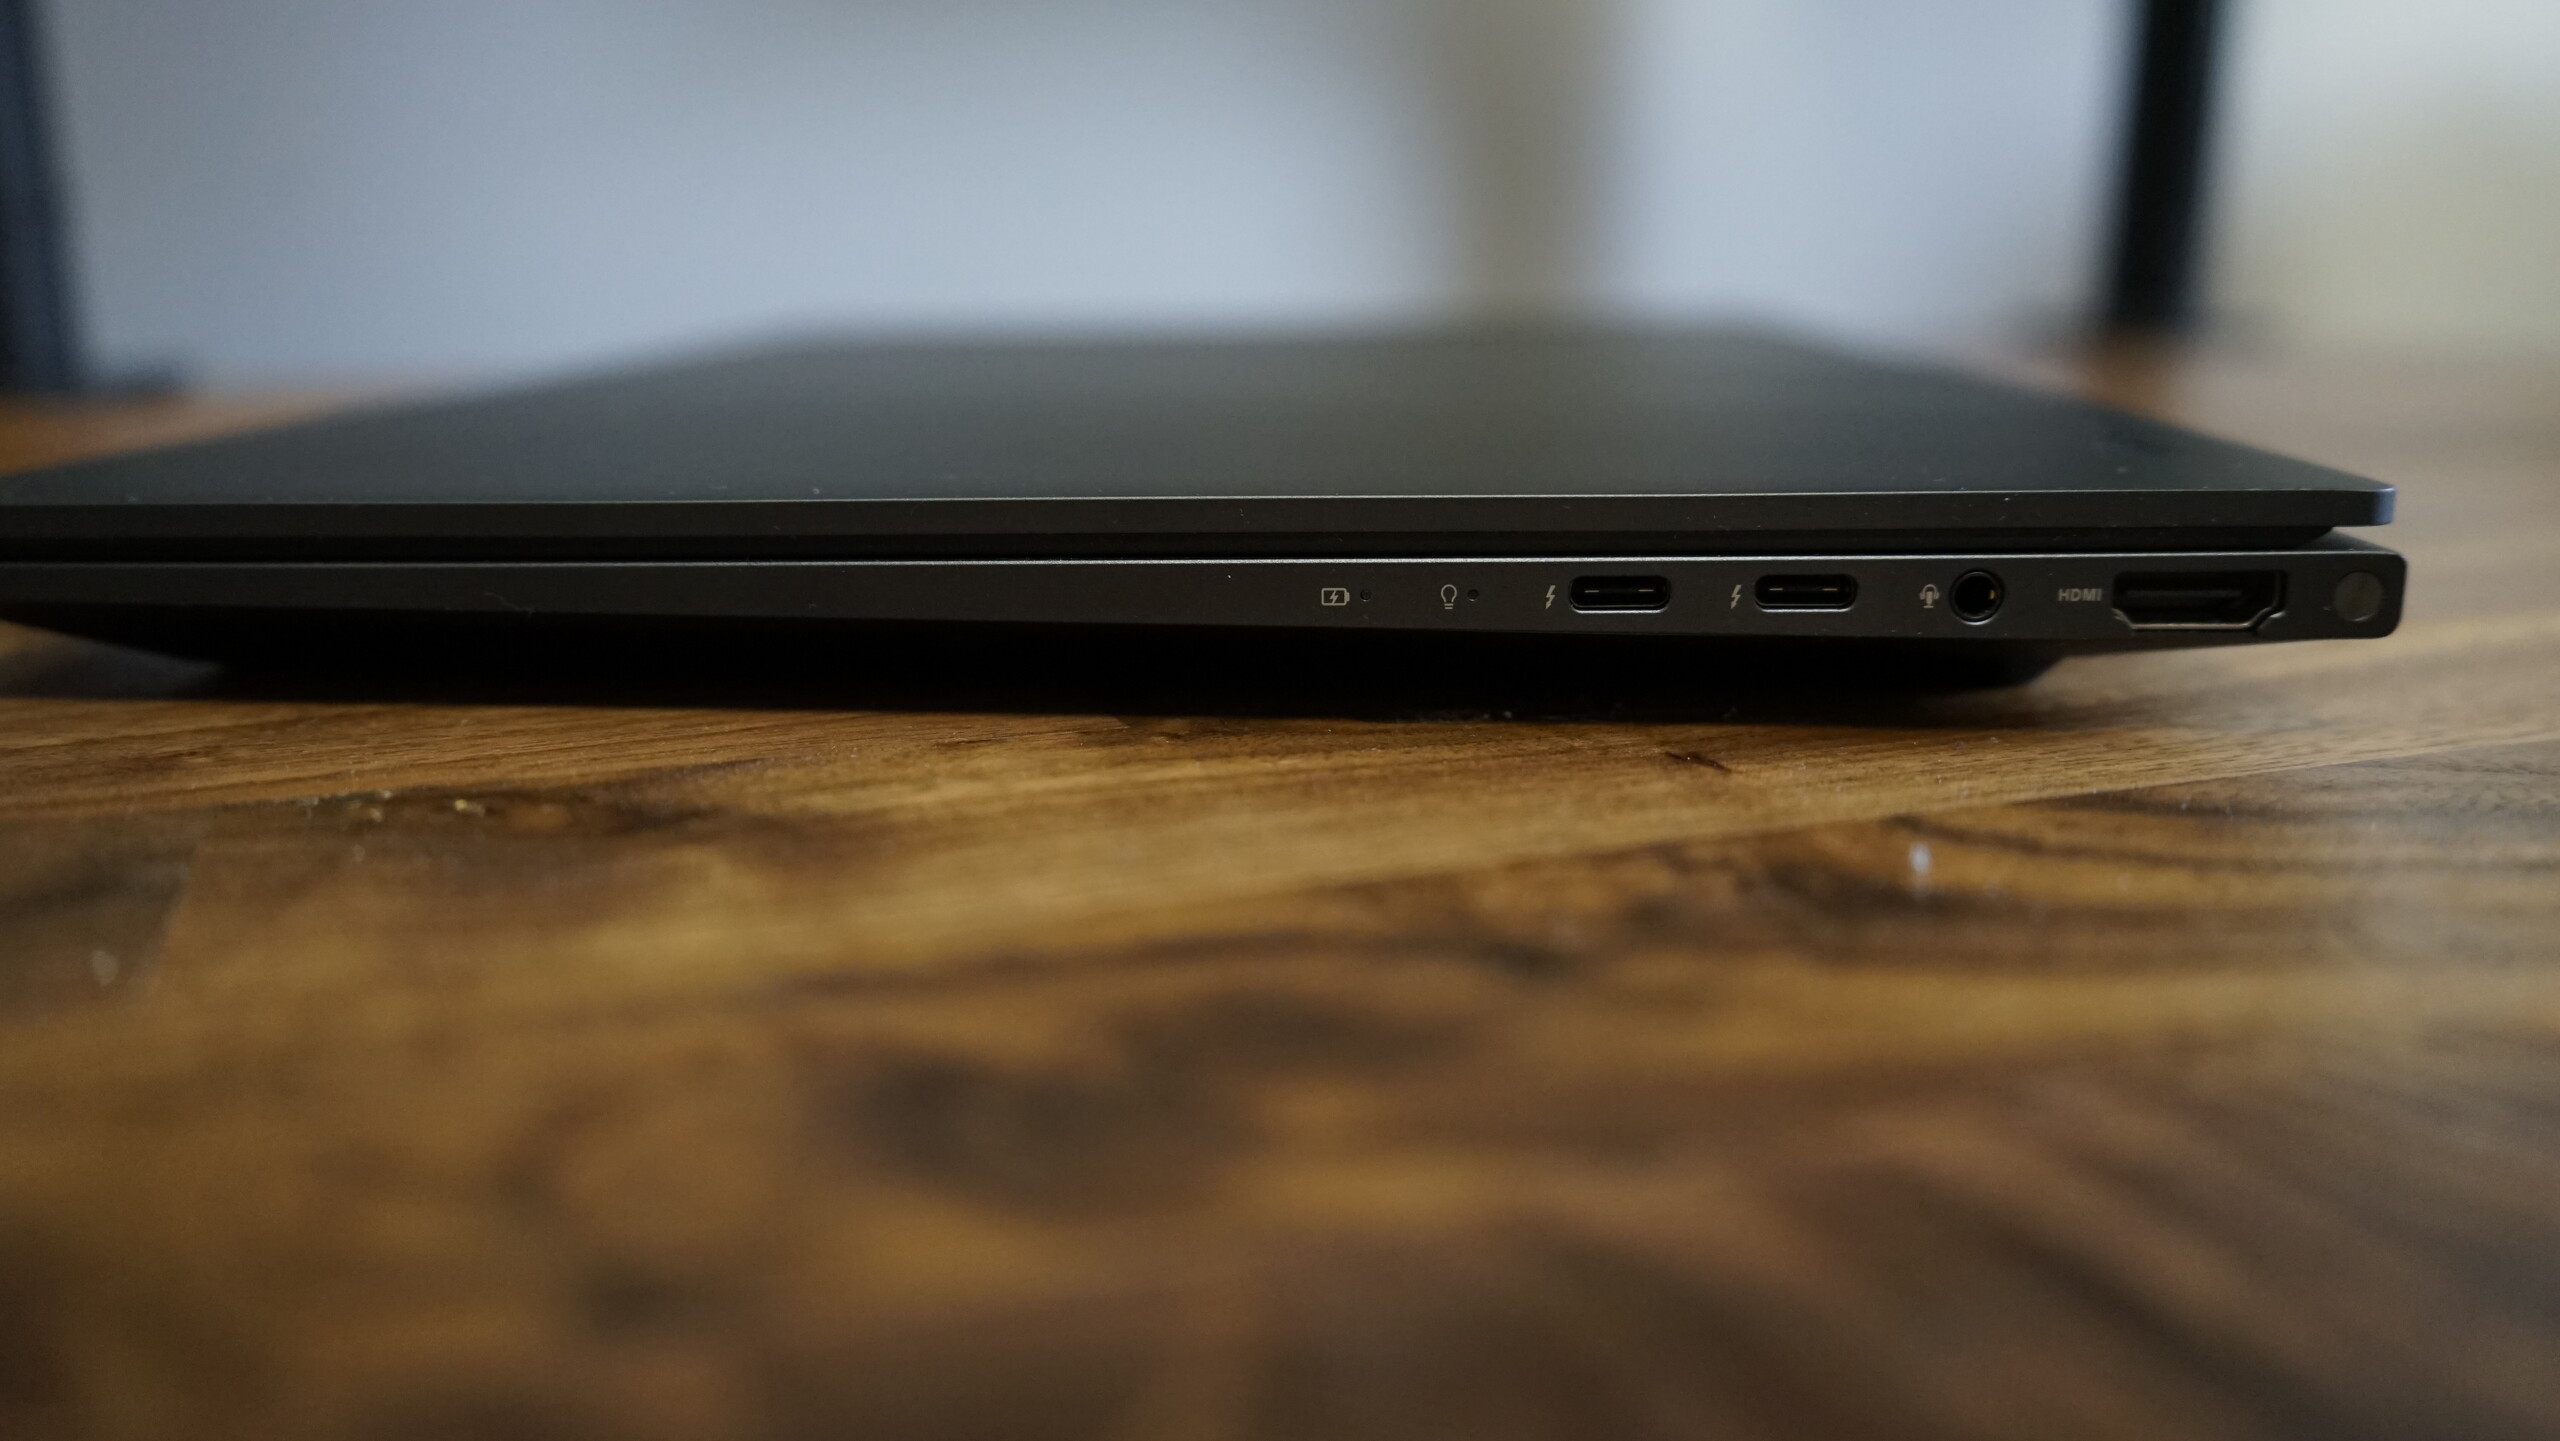
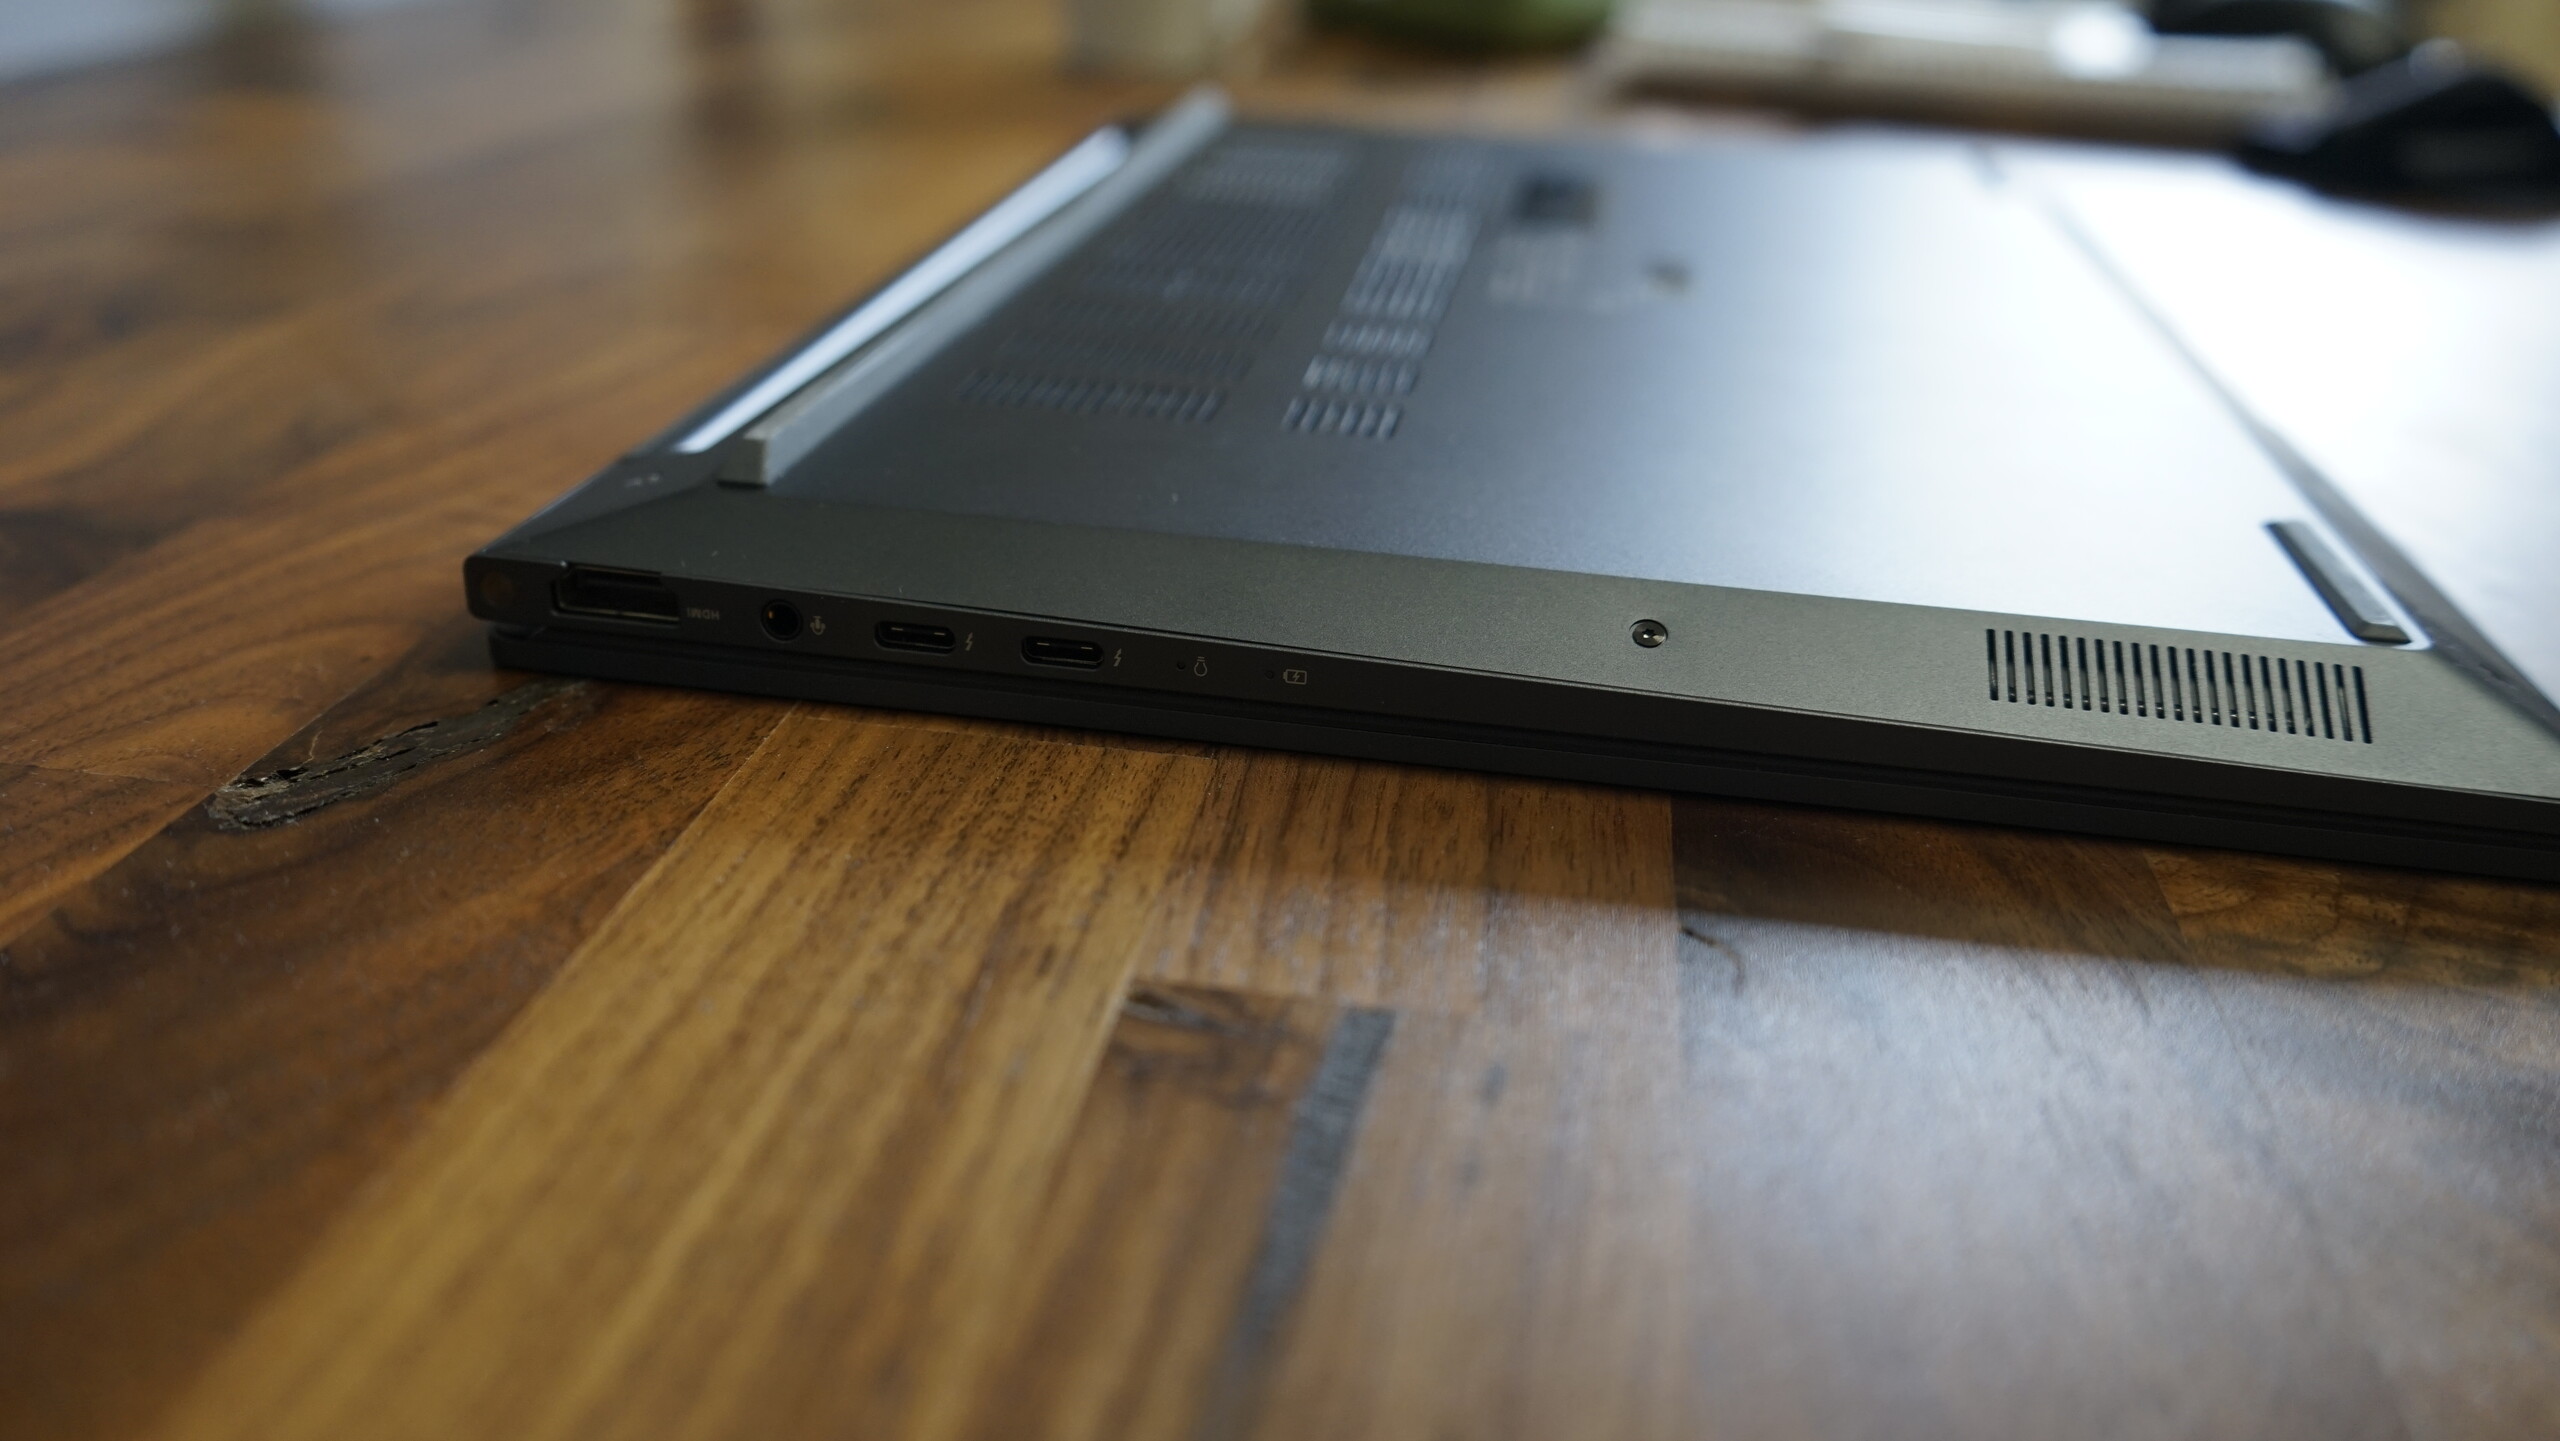
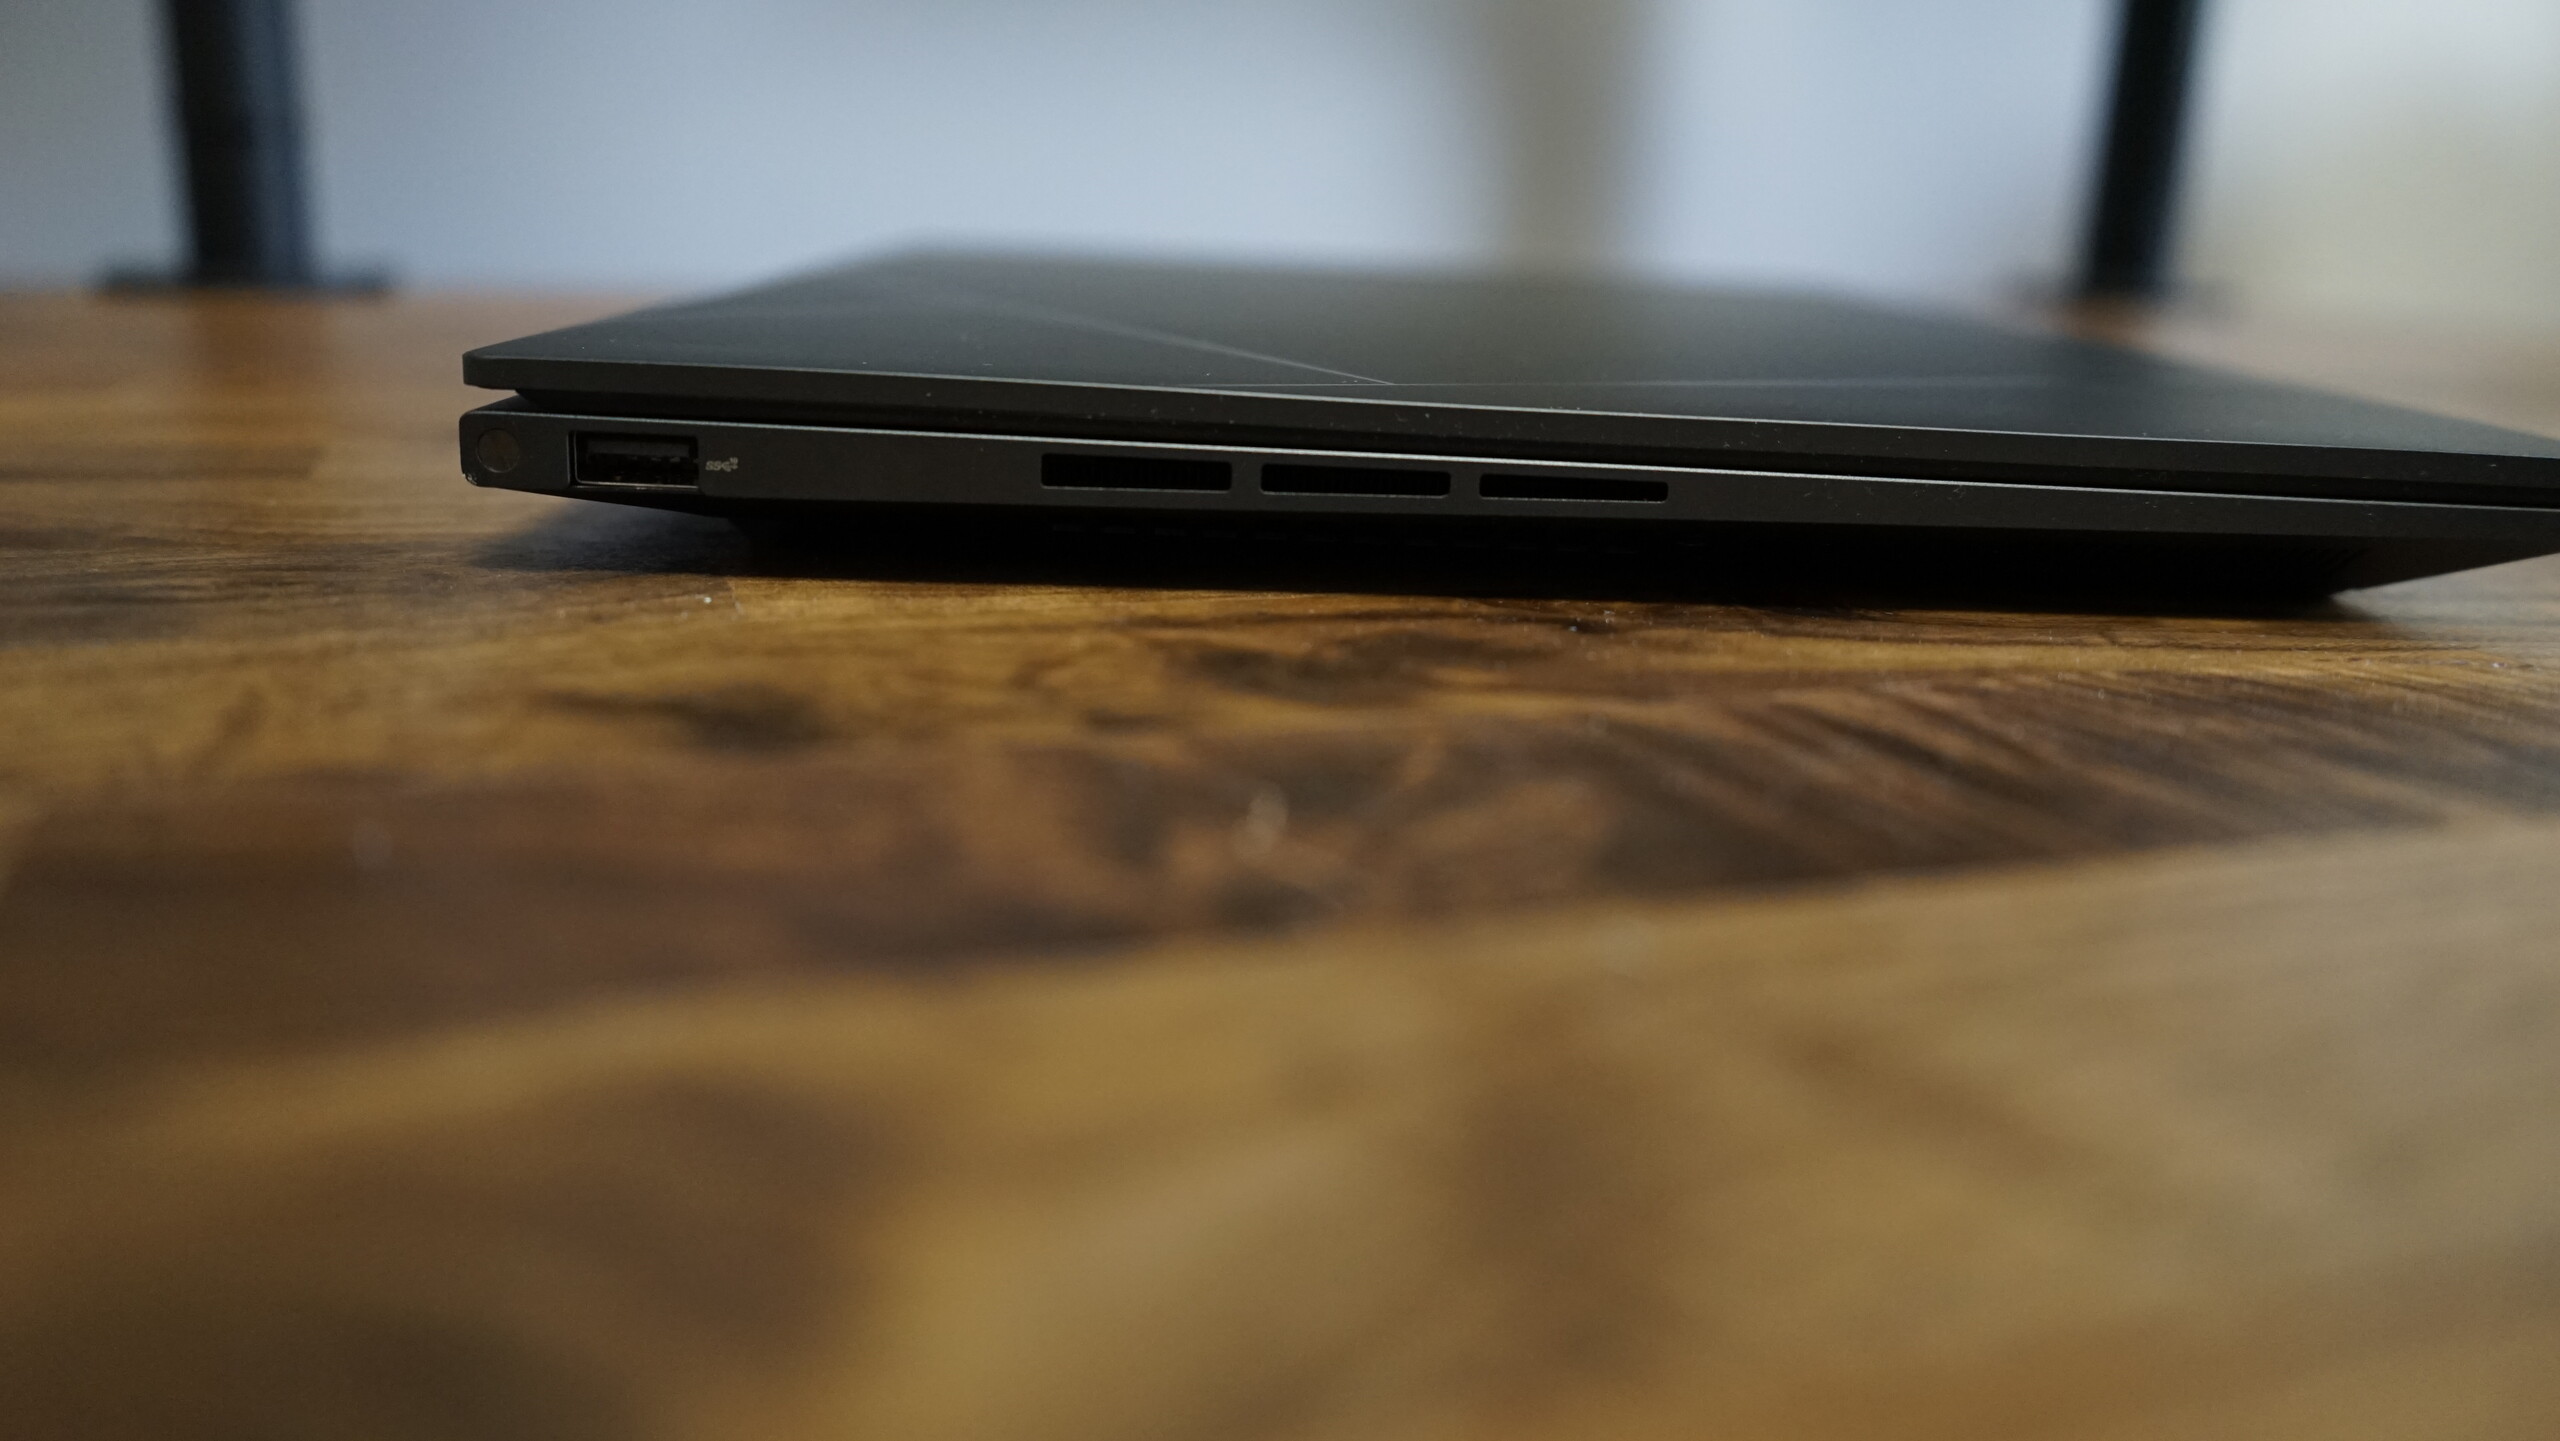
En comparación con el predecesor, el lector microSD lamentablemente ya no está disponible. La posición de los demás puertos también ha cambiado. En el lado izquierdo ahora sólo hay un puerto USB 3.2 Gen 2 Tipo-A. Todos los demás puertos, es decir, dos puertos Thunderbolt, un puerto HDMI 2.1 y el puerto combo de audio están ahora a la derecha. Ambos puertos Thunderbolt pueden usarse para cargar, por lo que habríamos preferido uno en ambos lados.
Comunicación
El módulo Intel Wi-Fi 6E-AX211 instalado es reemplazable y ofrece resultados sólidos sin problemas de conectividad. Los resultados de la tarjeta están por encima de la media para este modelo. El módulo no sólo soporta el último estándar WLAN Wi-Fi 6E, sino también Bluetooth 5.2.
Cámara web
Asus ha mejorado la webcam respecto al modelo anterior y ahora ofrece Full HD en lugar de 720p. Windows Hello es posible gracias al sensor IR integrado para el reconocimiento facial. Comparado con el año pasado, la calidad de imagen es bastante mejor, pero los resultados dependen mucho de las condiciones de iluminación.


Accesorios
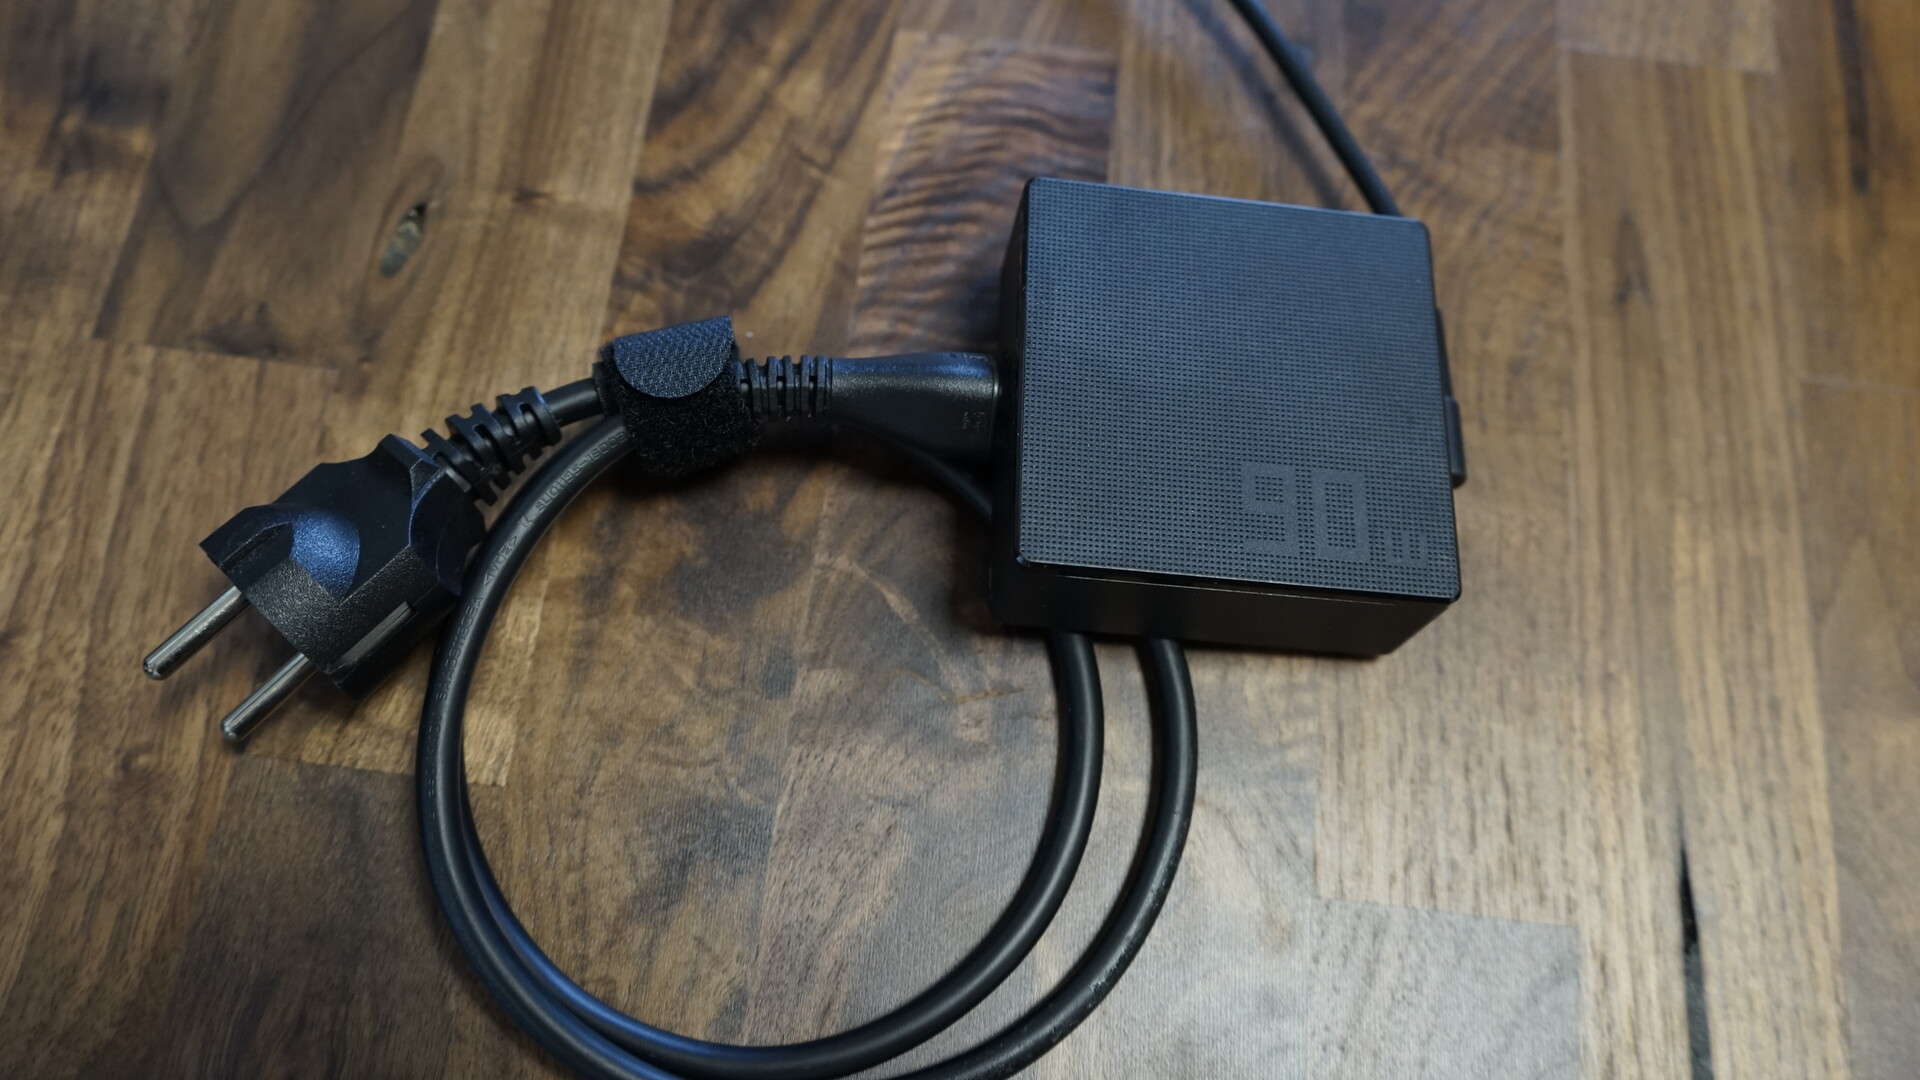
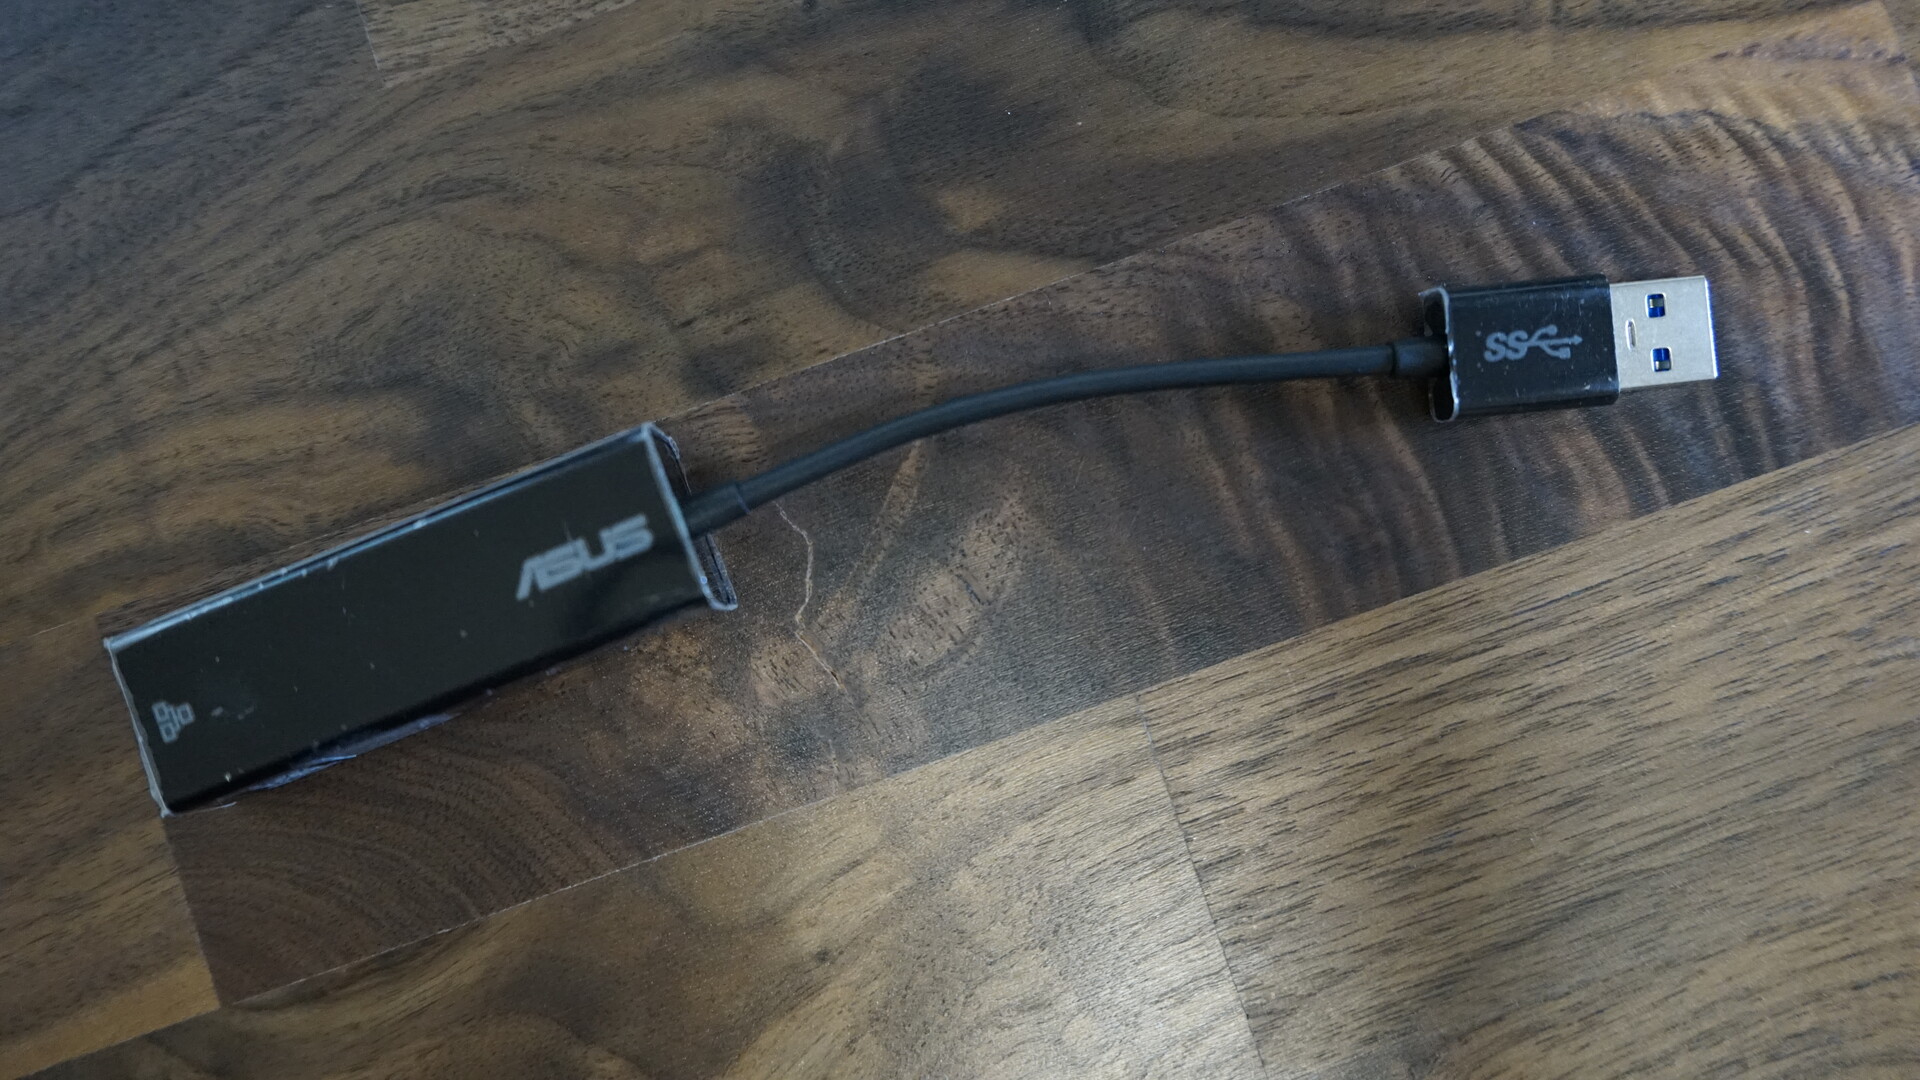
Los accesorios del Asus ZenBook 14X consisten en una compacta fuente de alimentación de 90 vatios, un adaptador Ethernet USB Tipo-A y una práctica funda protectora. La funda protectora es de plástico con un forro interior suave al tacto.

Mantenimiento
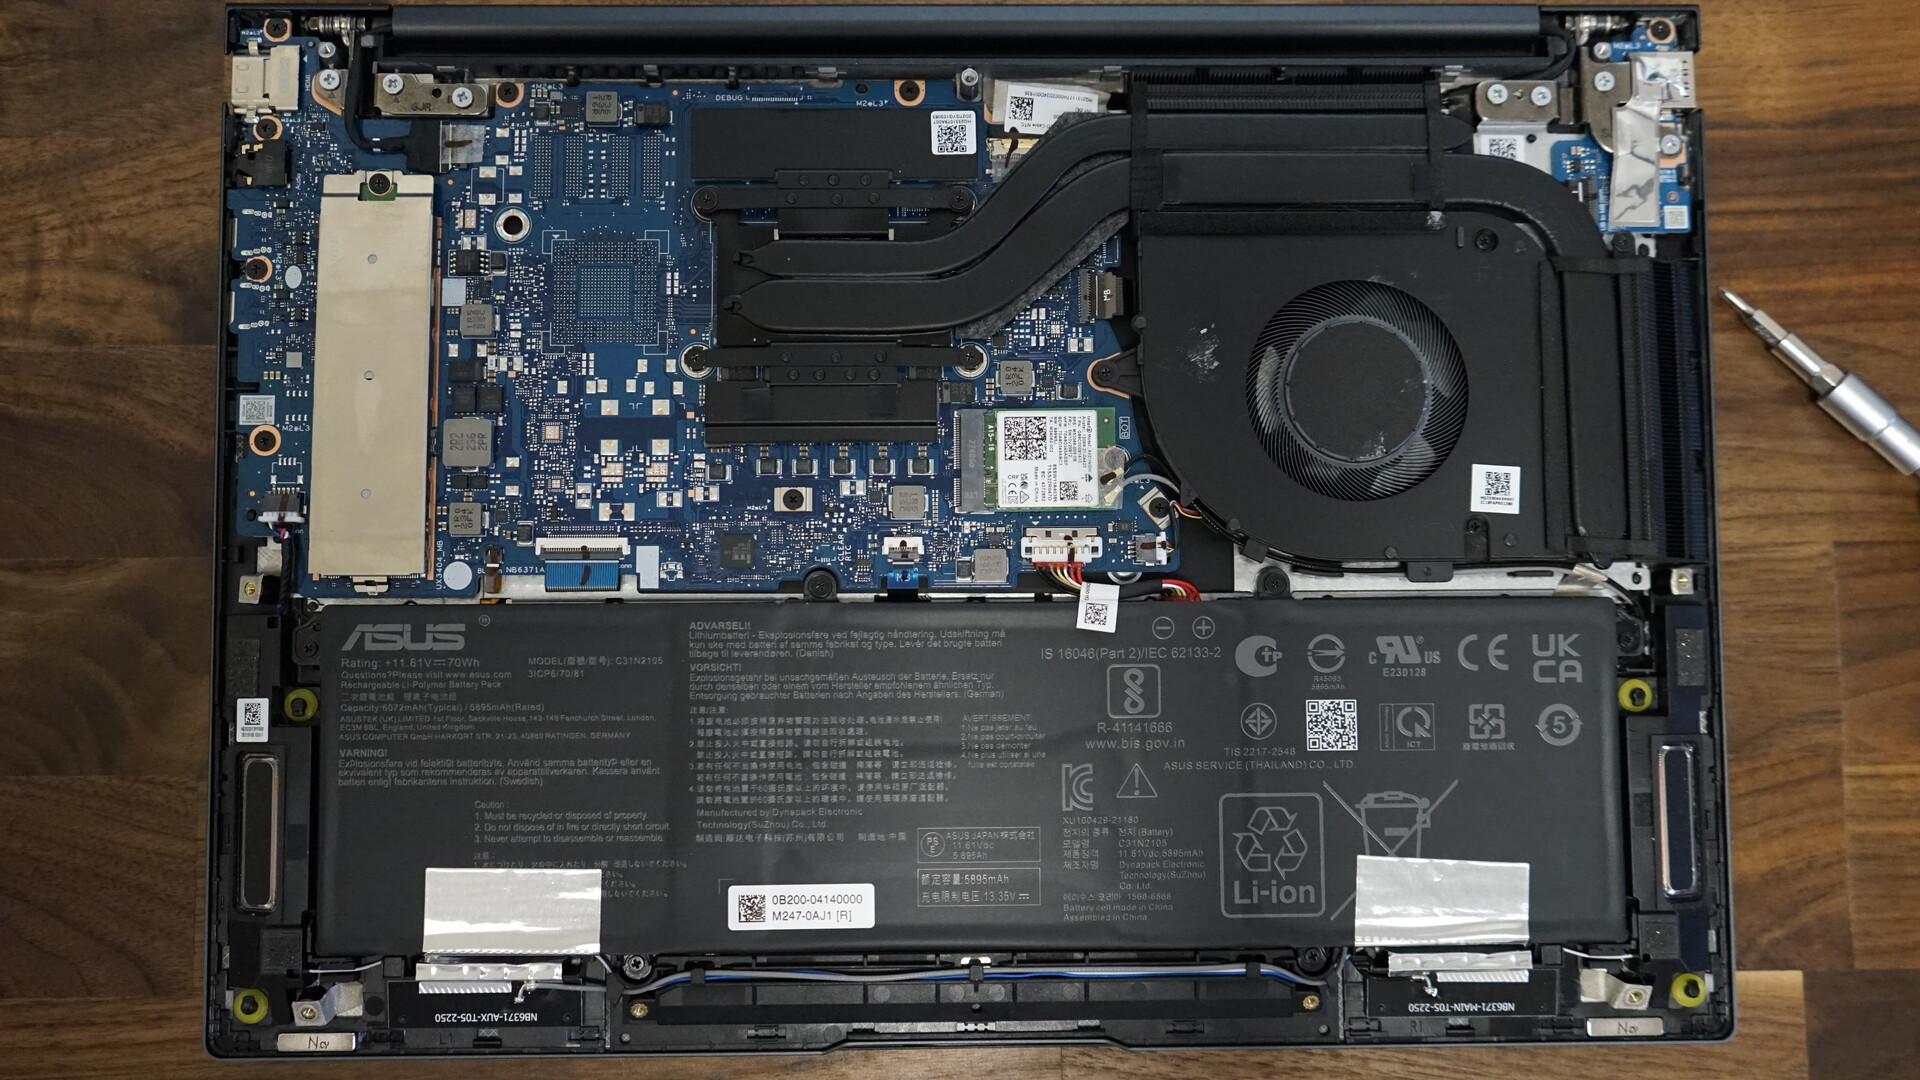
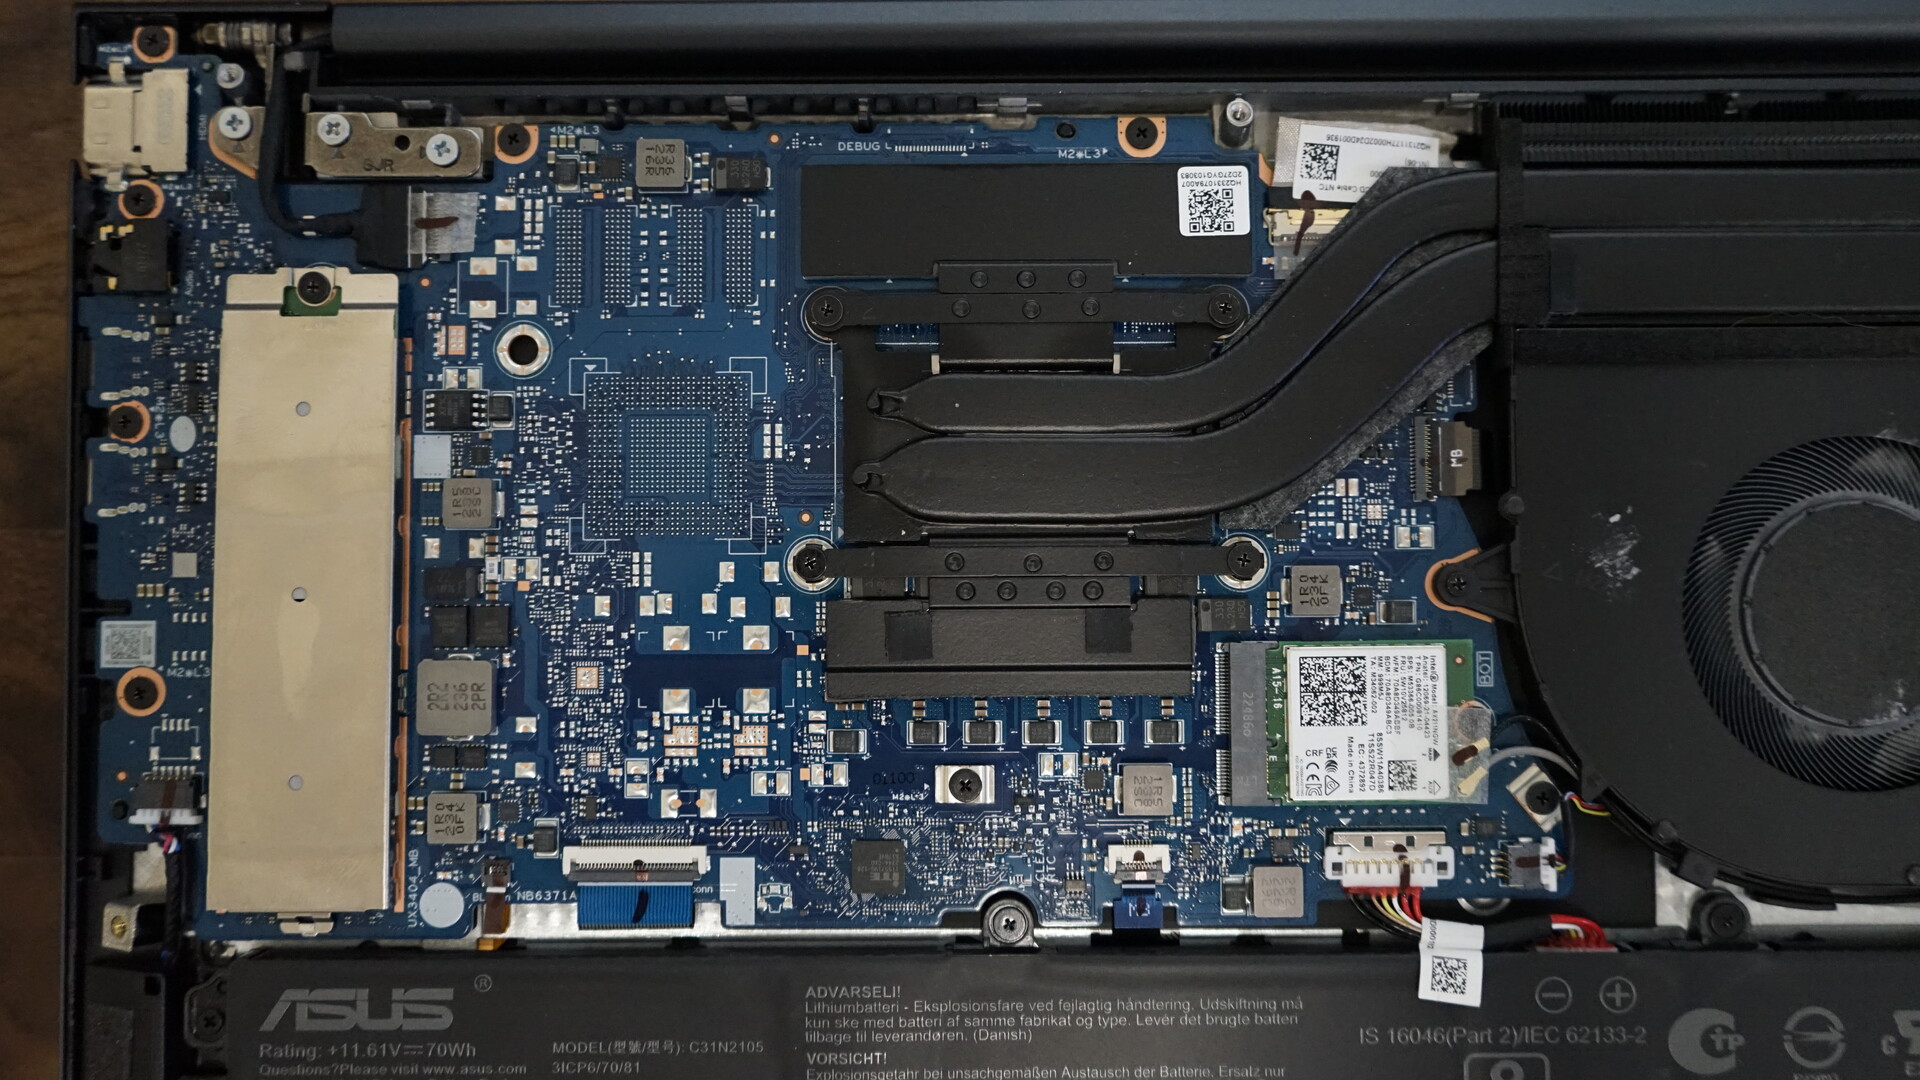
Abrir el ZenBook es comparativamente fácil y sólo hay que sacar nueve tornillos fácilmente accesibles de la parte inferior. El módulo Wi-Fi, la batería y el SSD son reemplazables, mientras que la RAM está soldada. La estructura interna también revela la diferencia de ventilación respecto al predecesor, ya que sólo hay un ventilador instalado en el modelo 2023.
Garantía
Asus ofrece una garantía de recogida y devolución de dos años en Alemania. Esto puede variar en otros países, por lo que los compradores interesados deben comprobarlo antes de comprar.
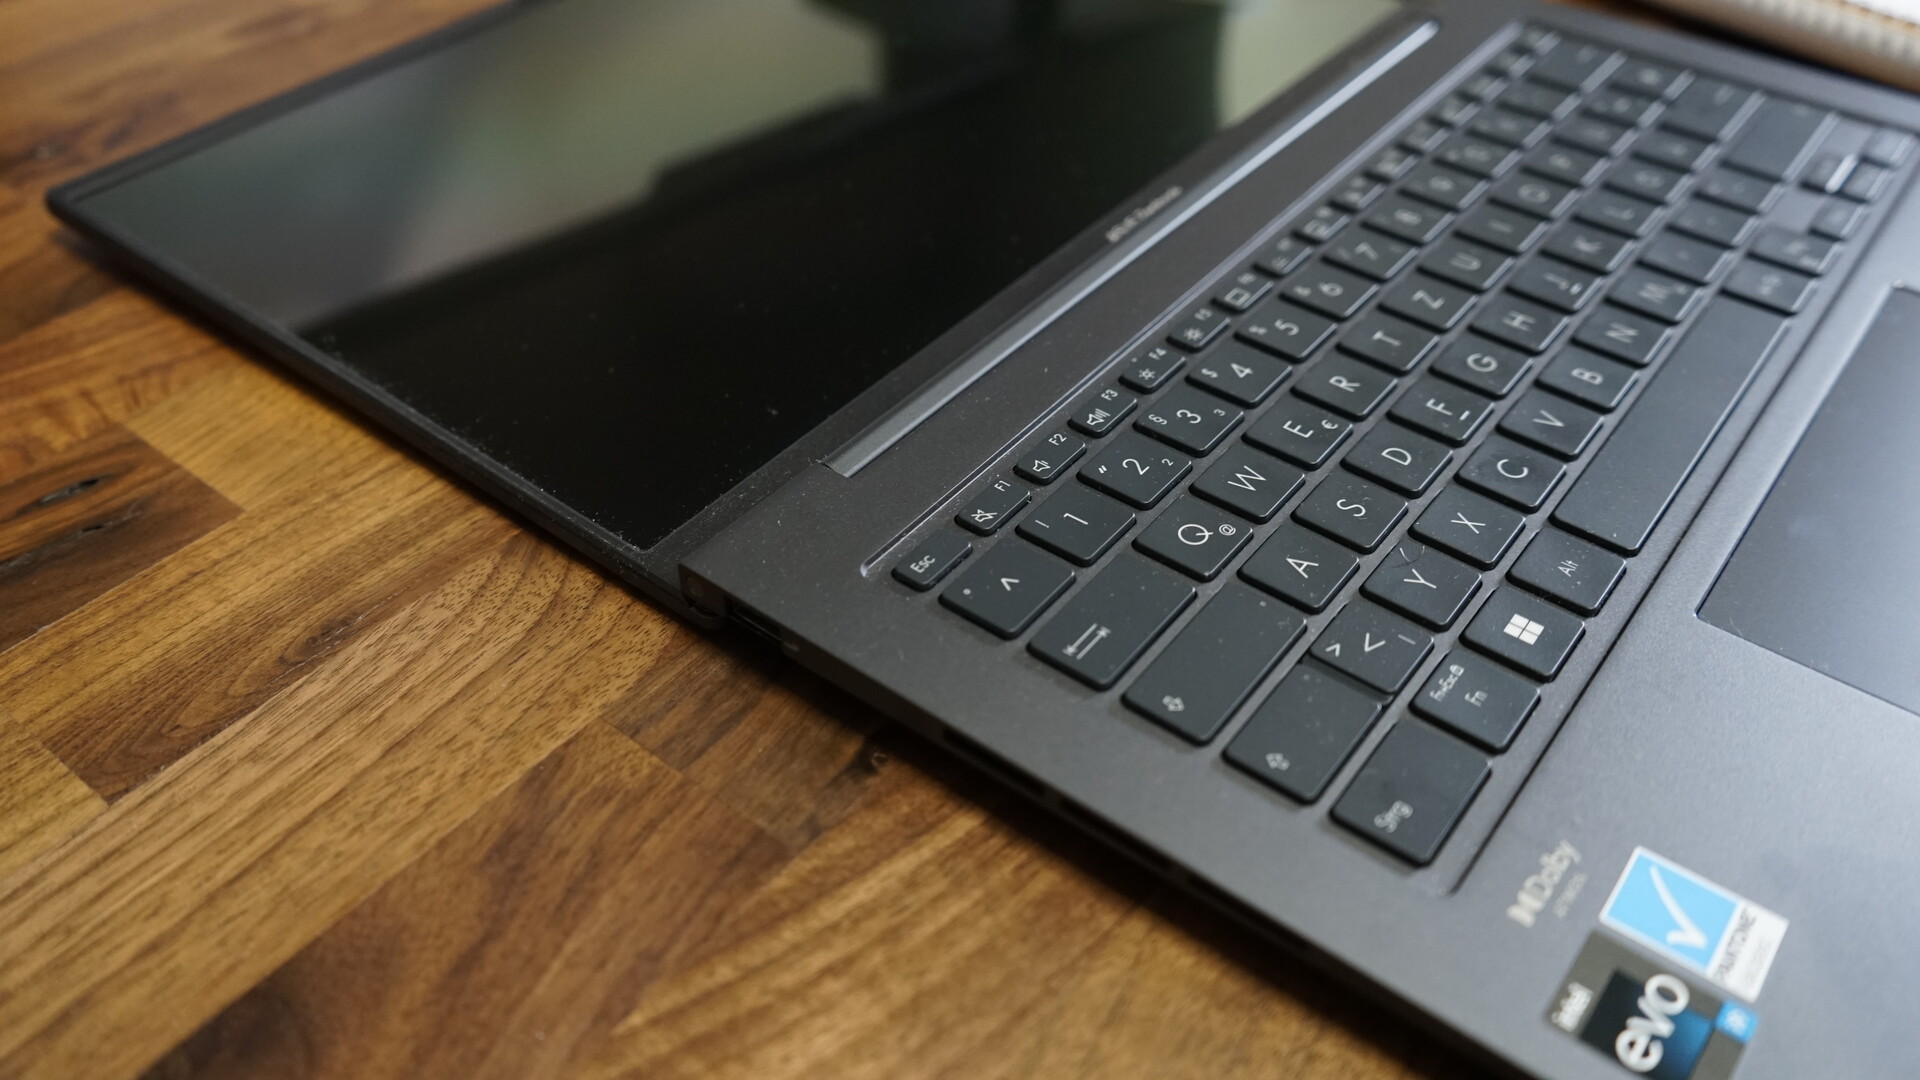
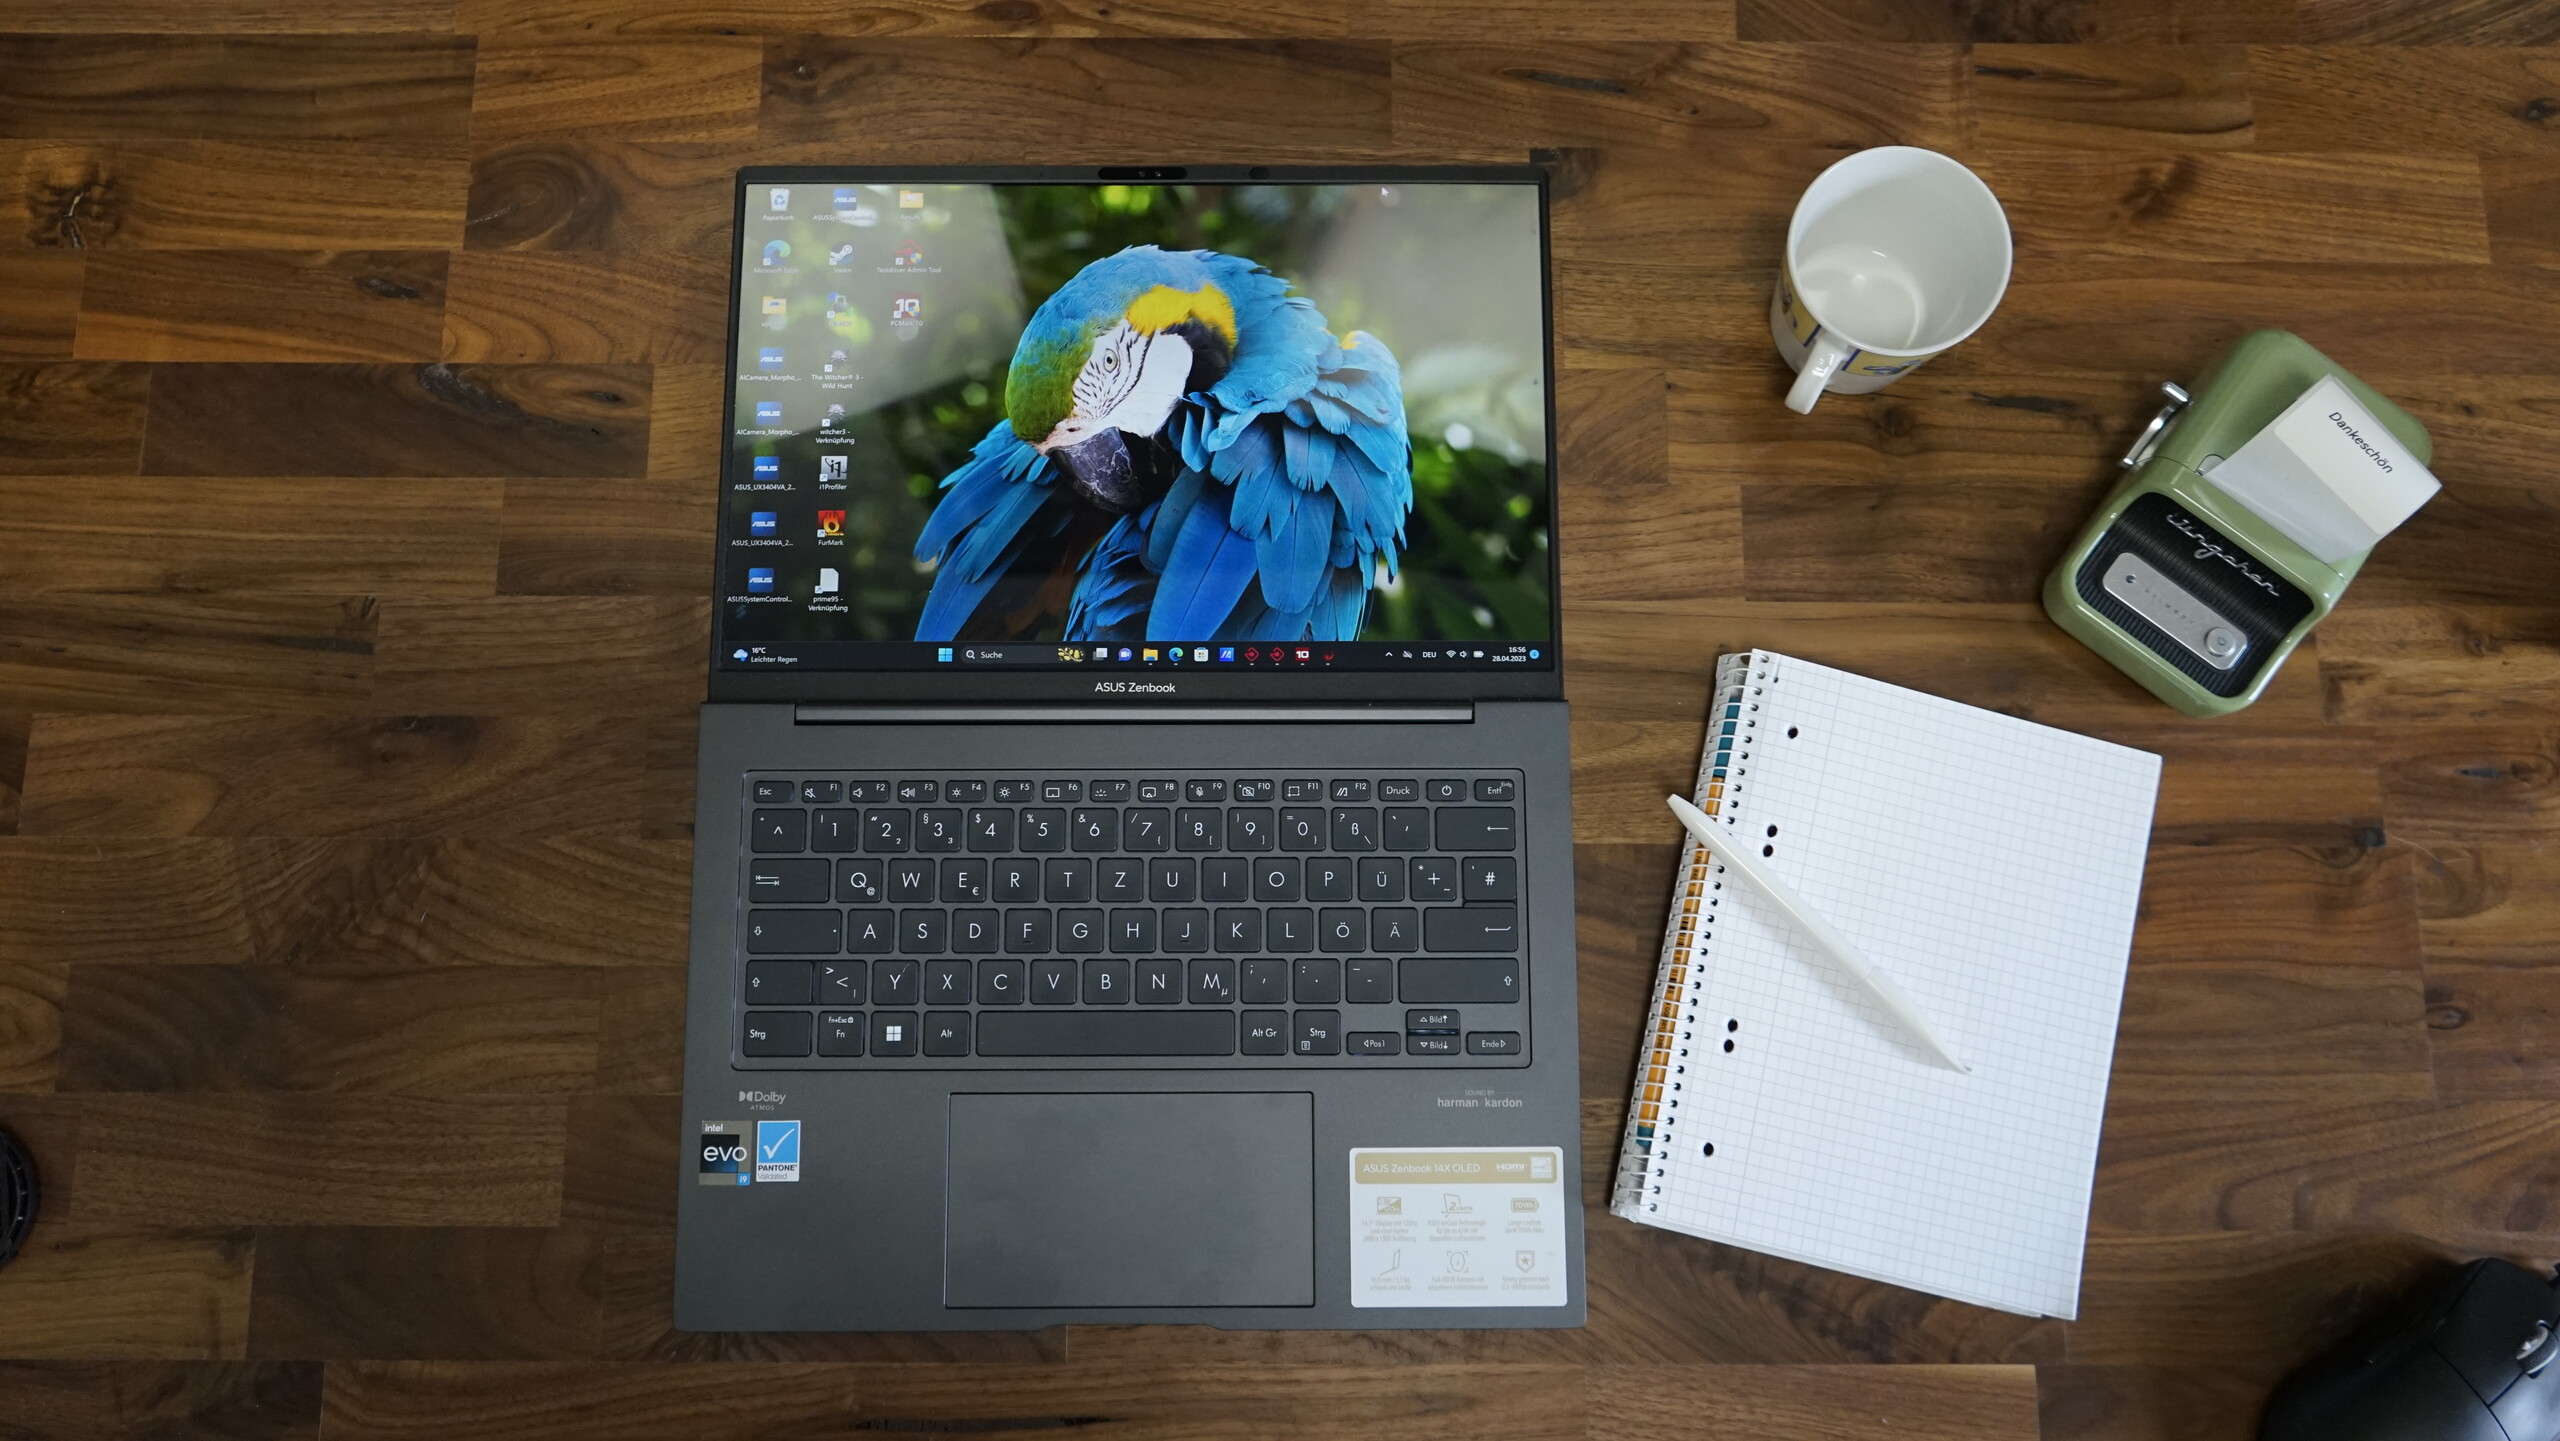
Dispositivos de entrada
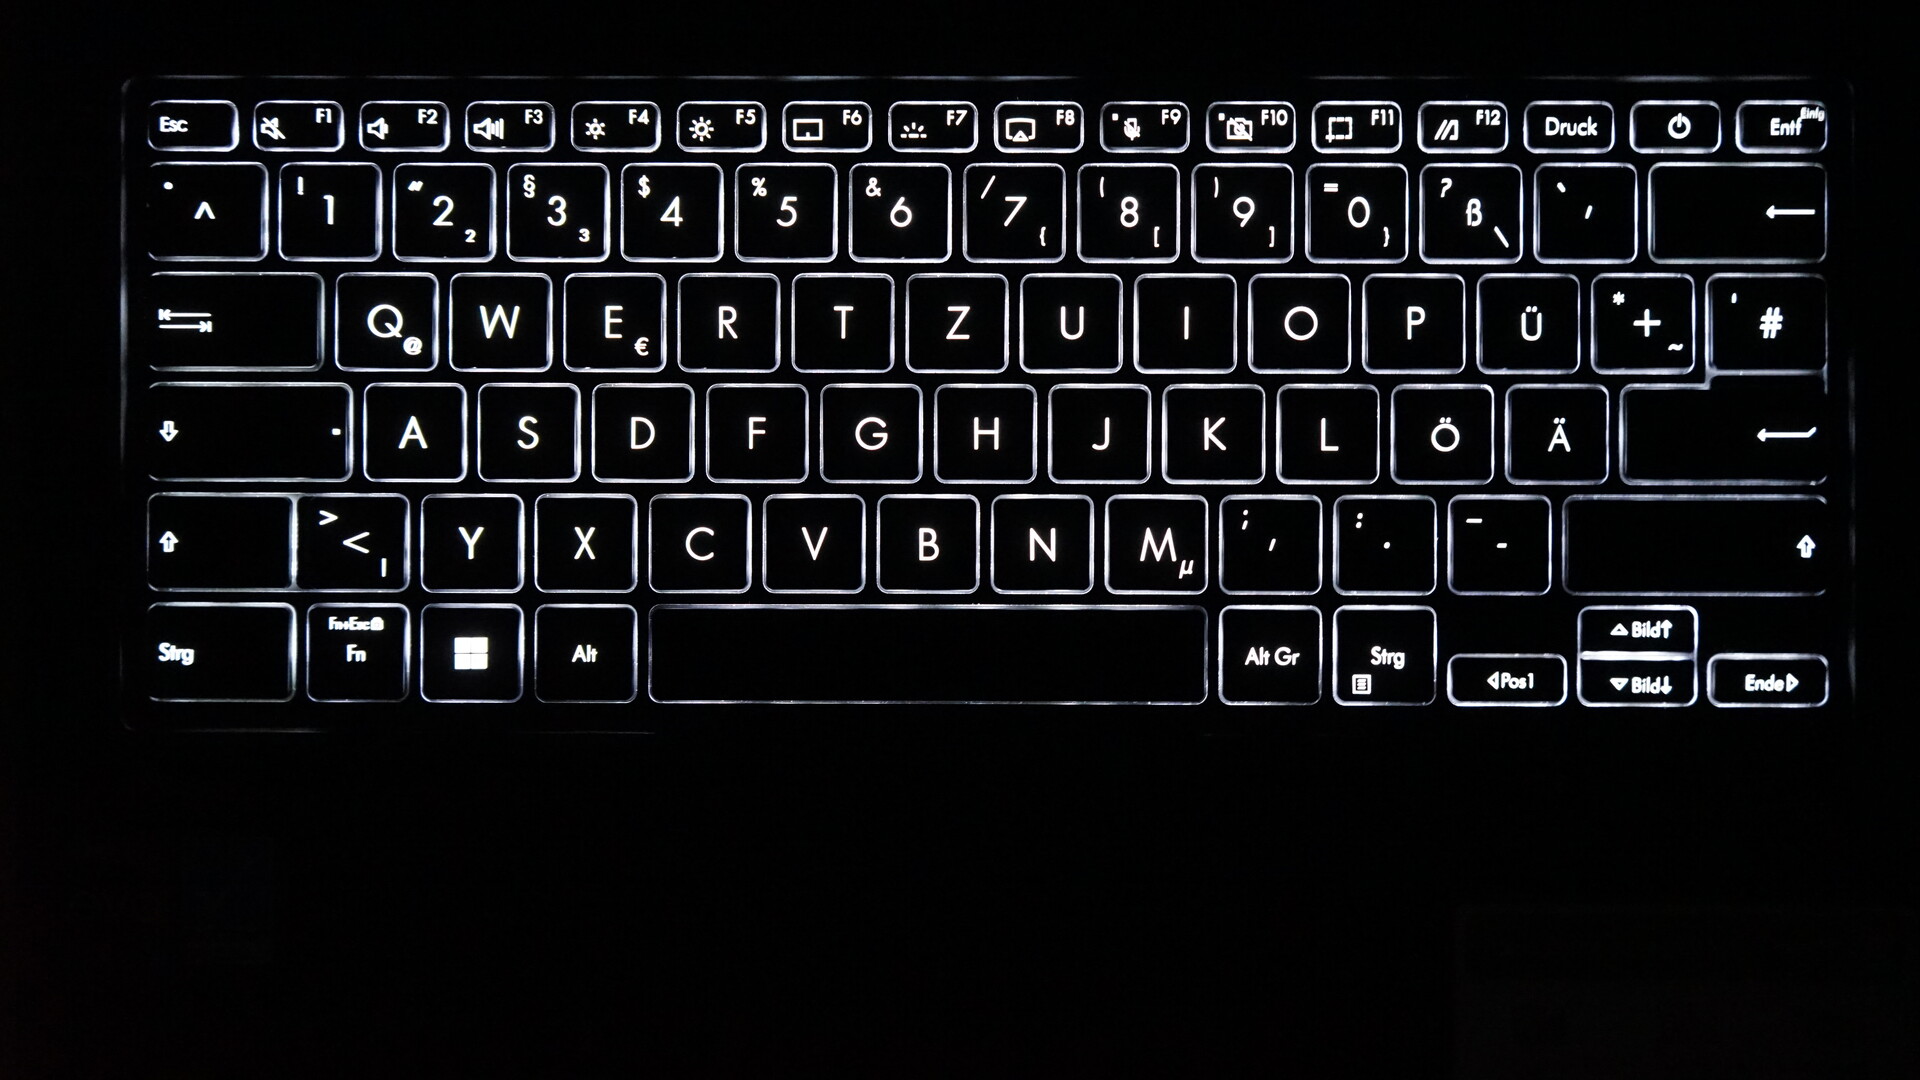
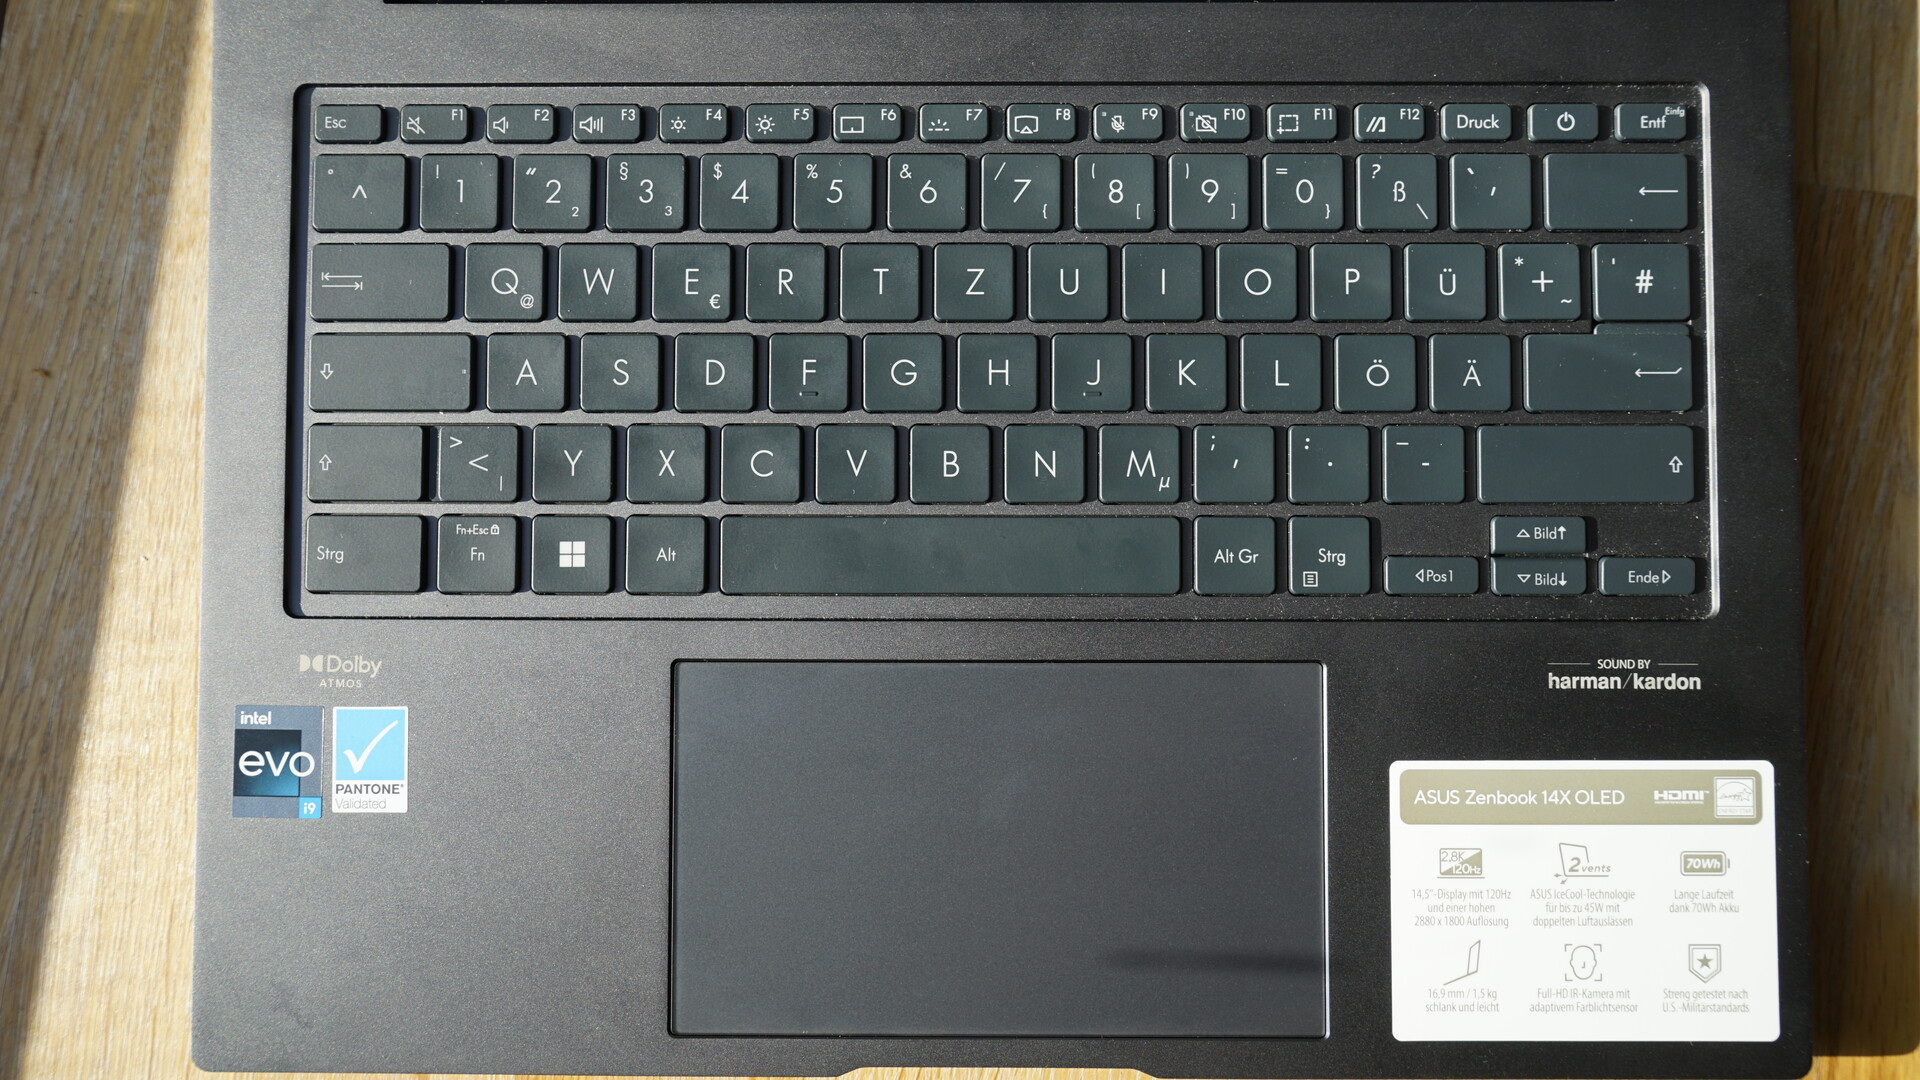
El teclado del modelo 2023 prescinde de las teclas de imagen dedicadas y de la tecla de fin. En su lugar, éstas se encuentran como función secundaria en las teclas de dirección. Las teclas en sí son mate y antideslizantes, con un punto de presión muy claro, un desplazamiento sólido y un golpe firme. Describiríamos la sensación de tecleo como muy nítida y el ruido de tecleo es de moderado a silencioso. La retroiluminación blanca tiene tres niveles y la luz se distribuye de forma muy uniforme, por lo que trabajar en entornos oscuros no es un problema. El espaciado entre teclas es de 2,5 mm, como en el modelo predecesor, lo que ofrece una agradable sensación de tecleo sin limitaciones. La robusta base del ZenBook también se nota a la hora de teclear, ya que ofrece una superficie estable e inflexible
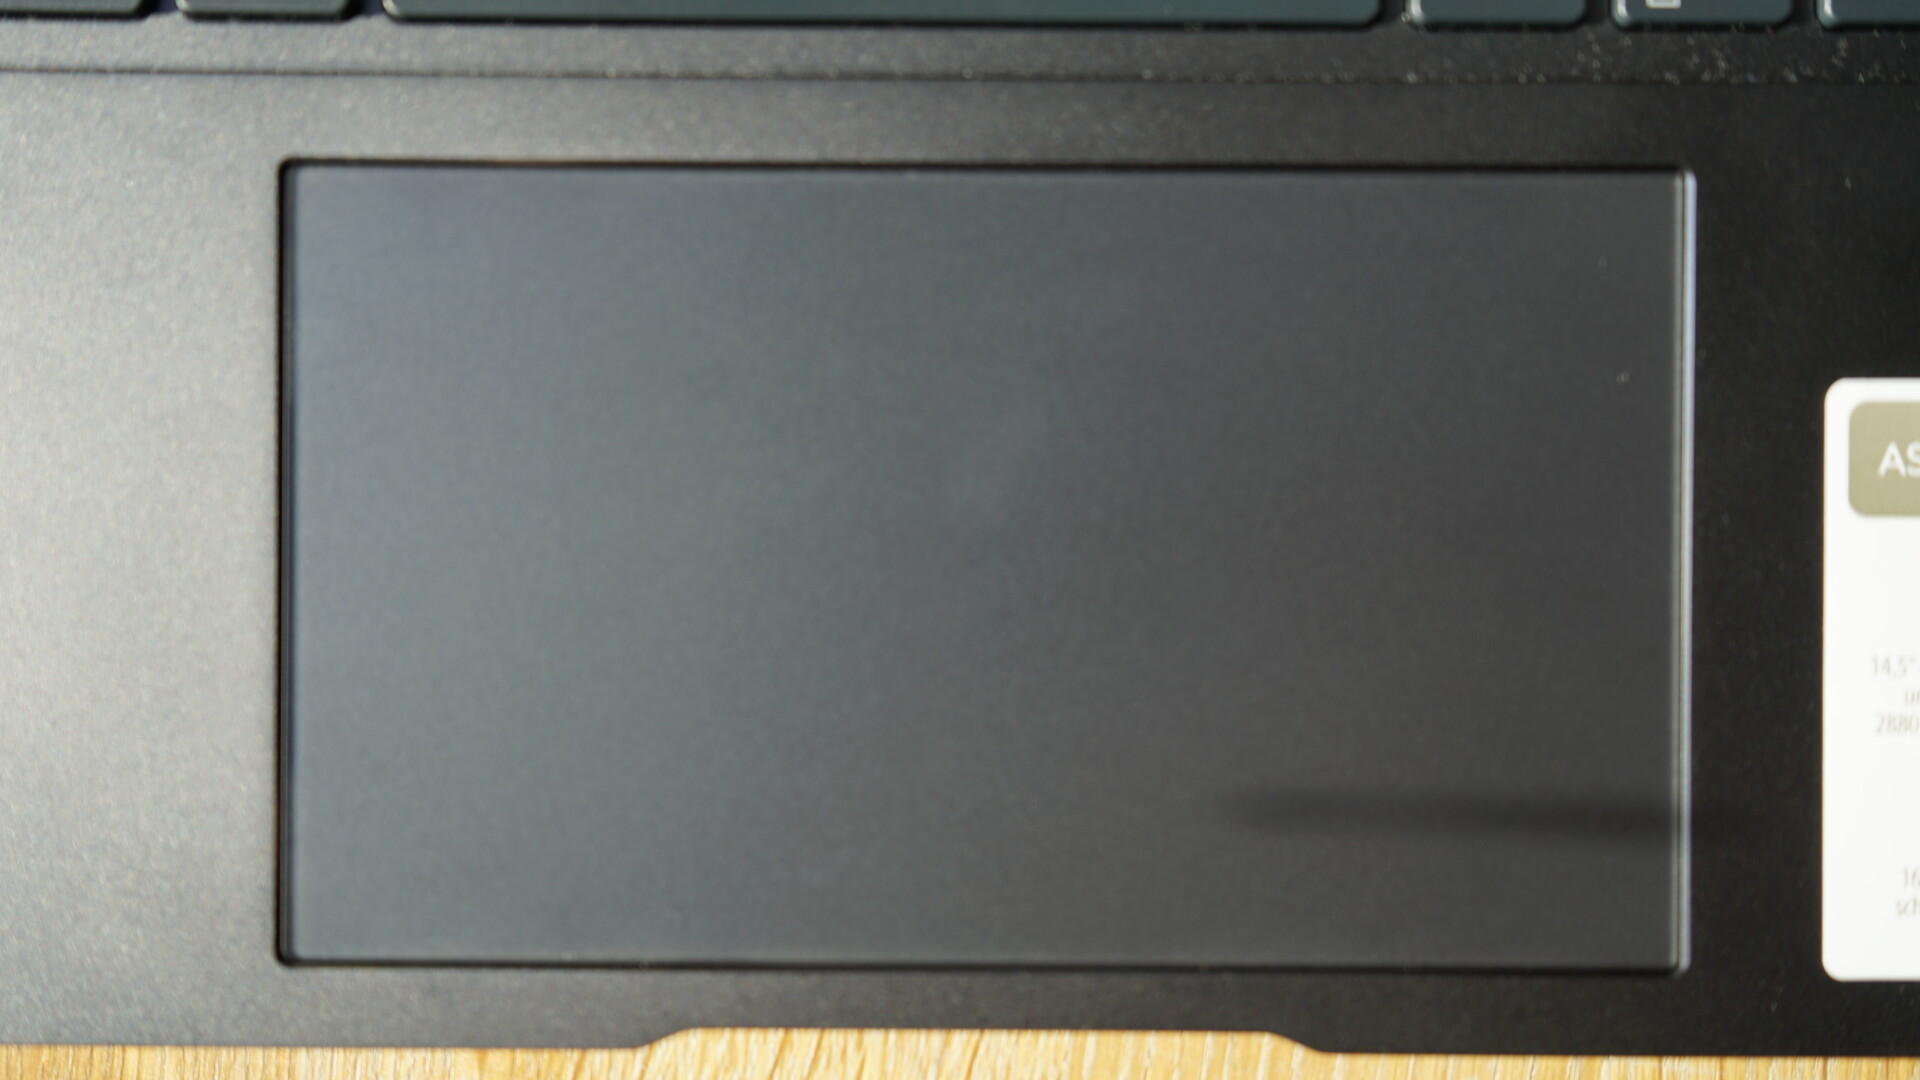
El clickpad mide 13 x 7,6 cm, por lo que es lo bastante grande para movimientos de puntero y gestos con hasta cuatro dedos. Las propiedades de deslizamiento son muy buenas y los clics a ambos lados se sienten estables y de alta calidad, con un sólido sonido de clic. El teclado numérico, integrado en el touchpad del dispositivo del año pasado, ya no está disponible como tal en nuestro dispositivo de pruebas.
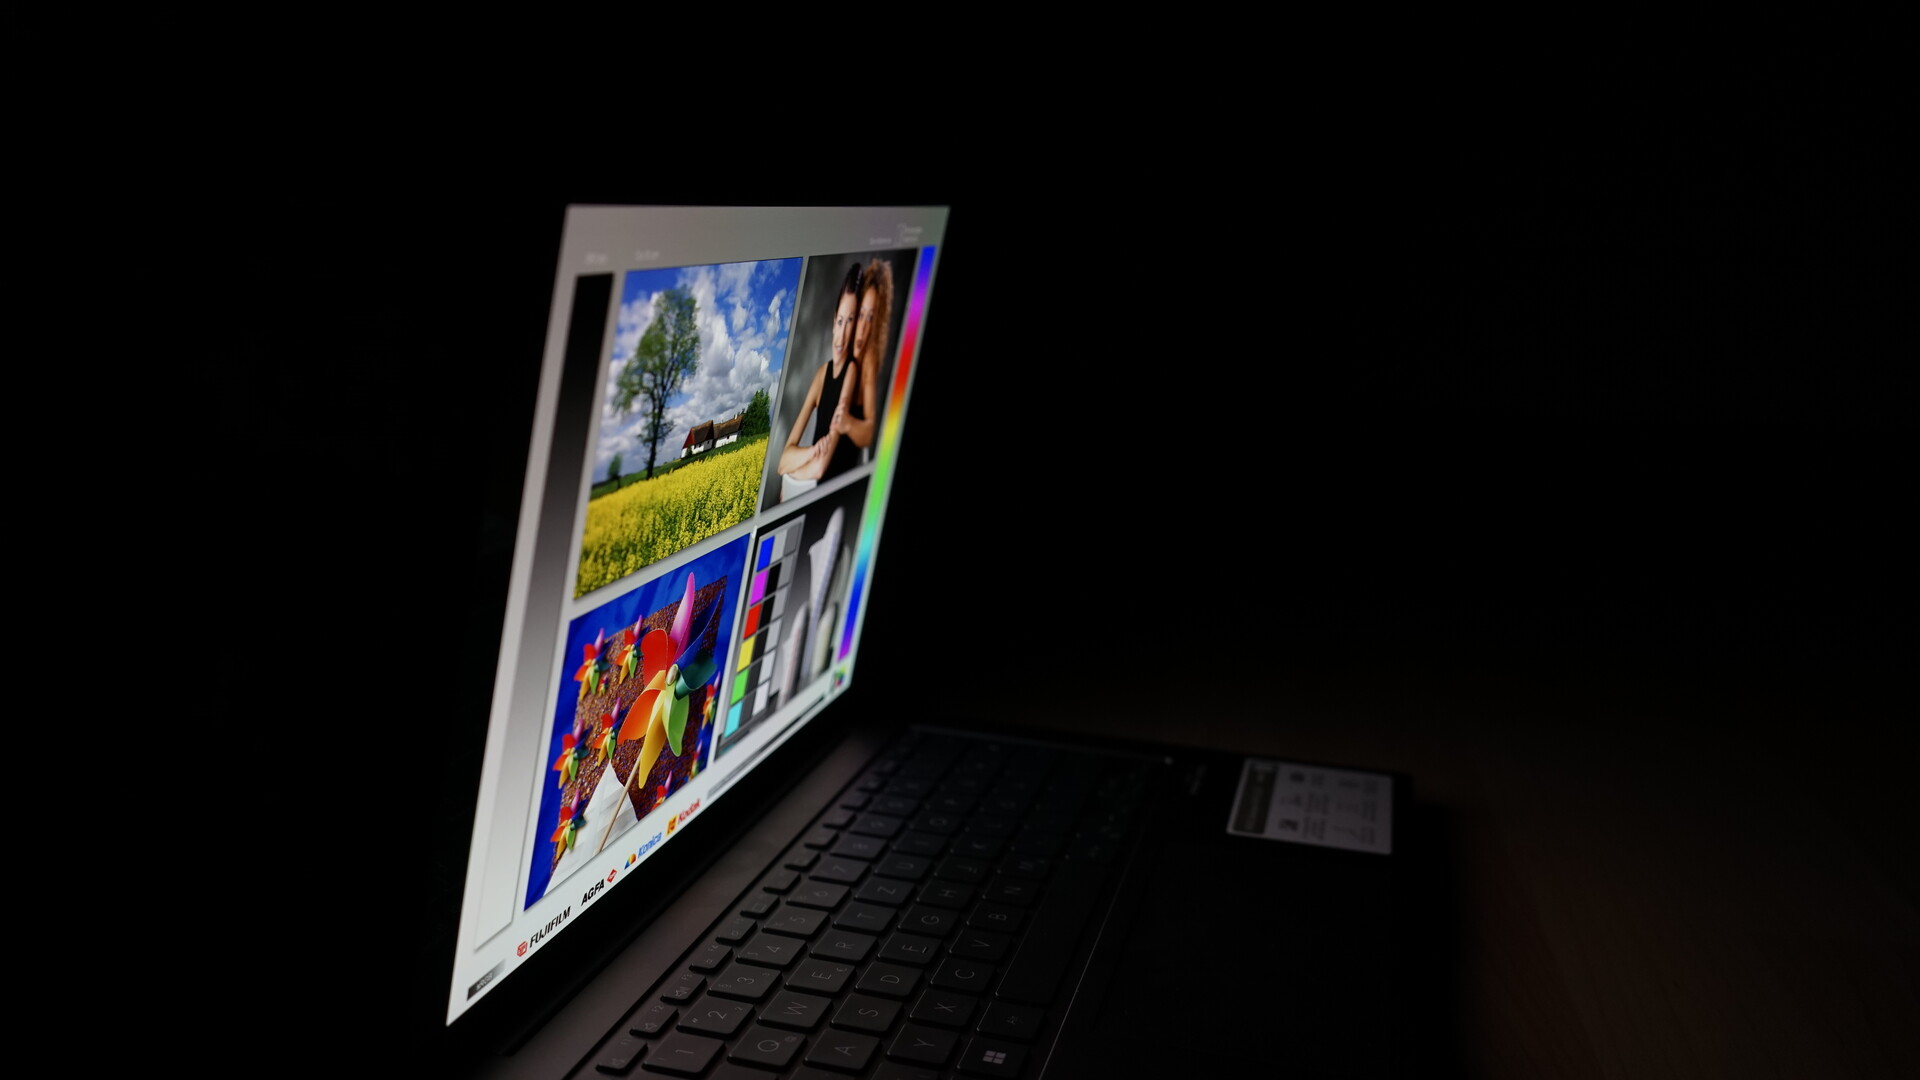
Pantalla: 2,8K y 120 Hz
La estrella del Asus ZenBook 14X es el panel OLED de 14 pulgadas. El lustroso display ofrece una resolución de 2,880x1,800 en formato 16:10, una tasa de refresco de 120 Hz y un tiempo de respuesta de apenas 2 milisegundos. La variante que probamos es la no táctil. Como alternativa, Asus también ofrece la pantalla con la función táctil
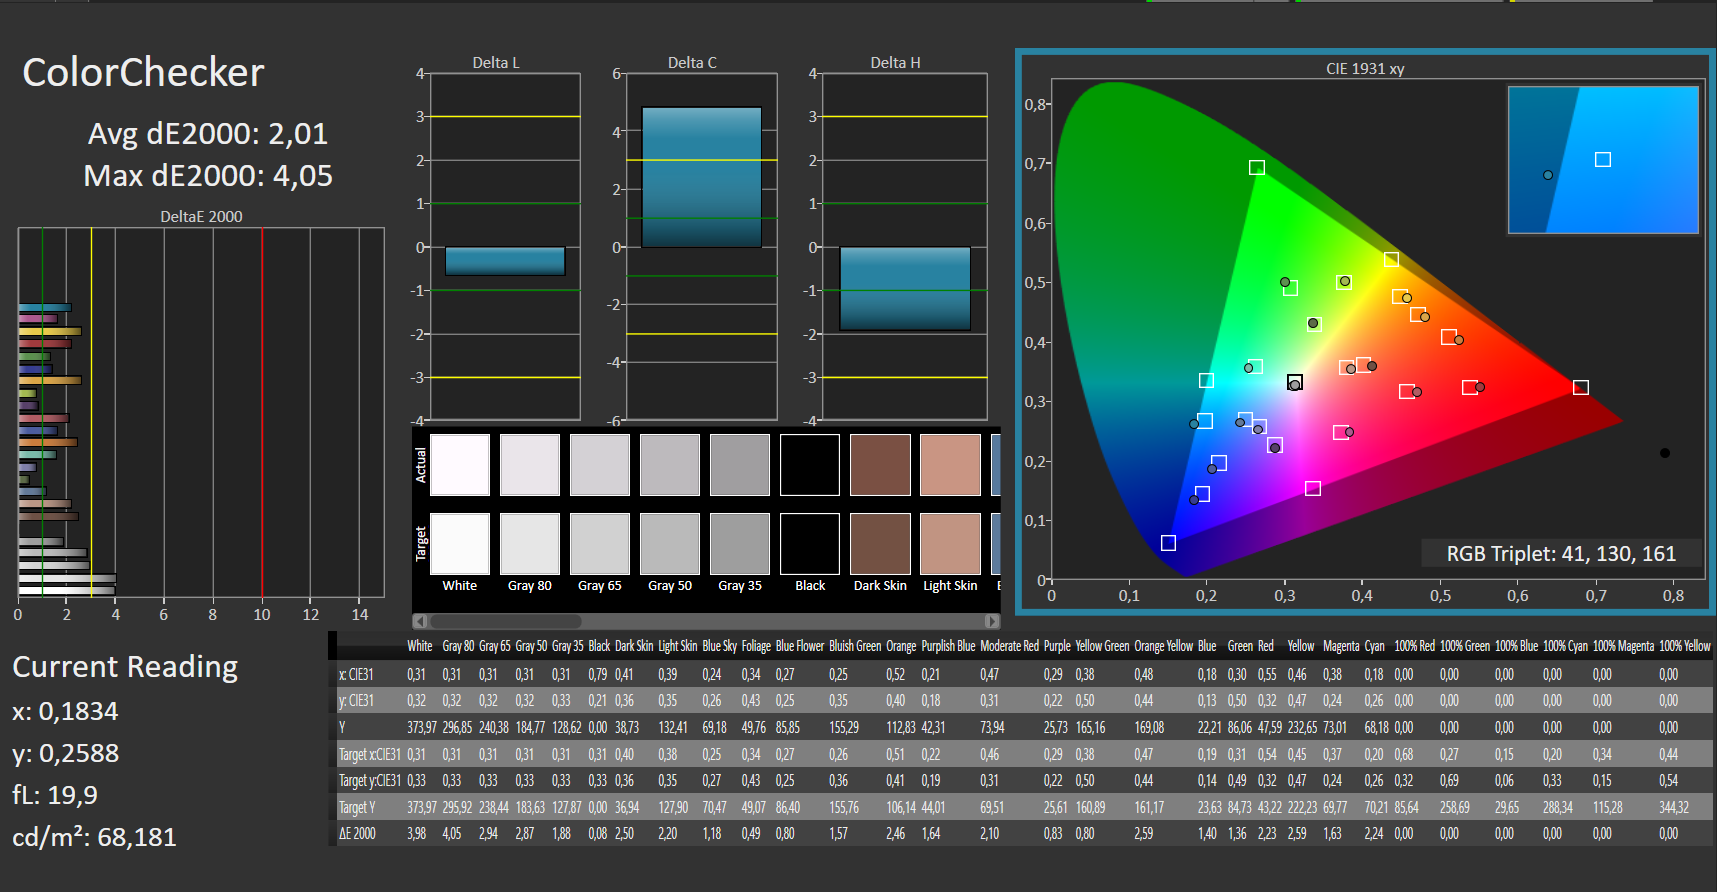
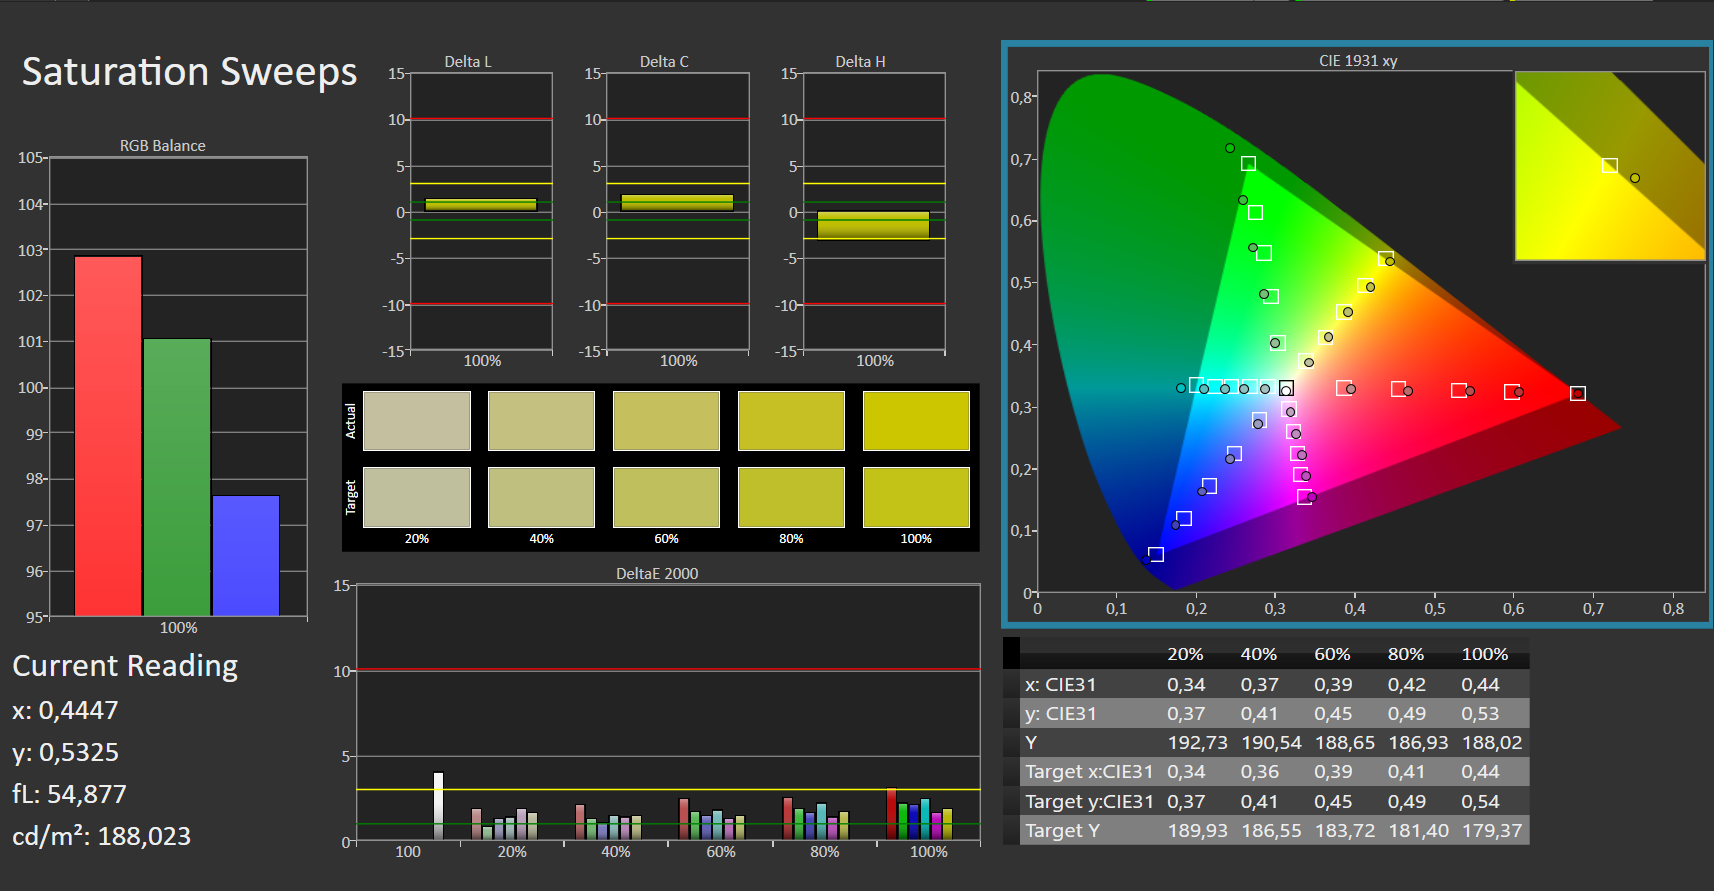
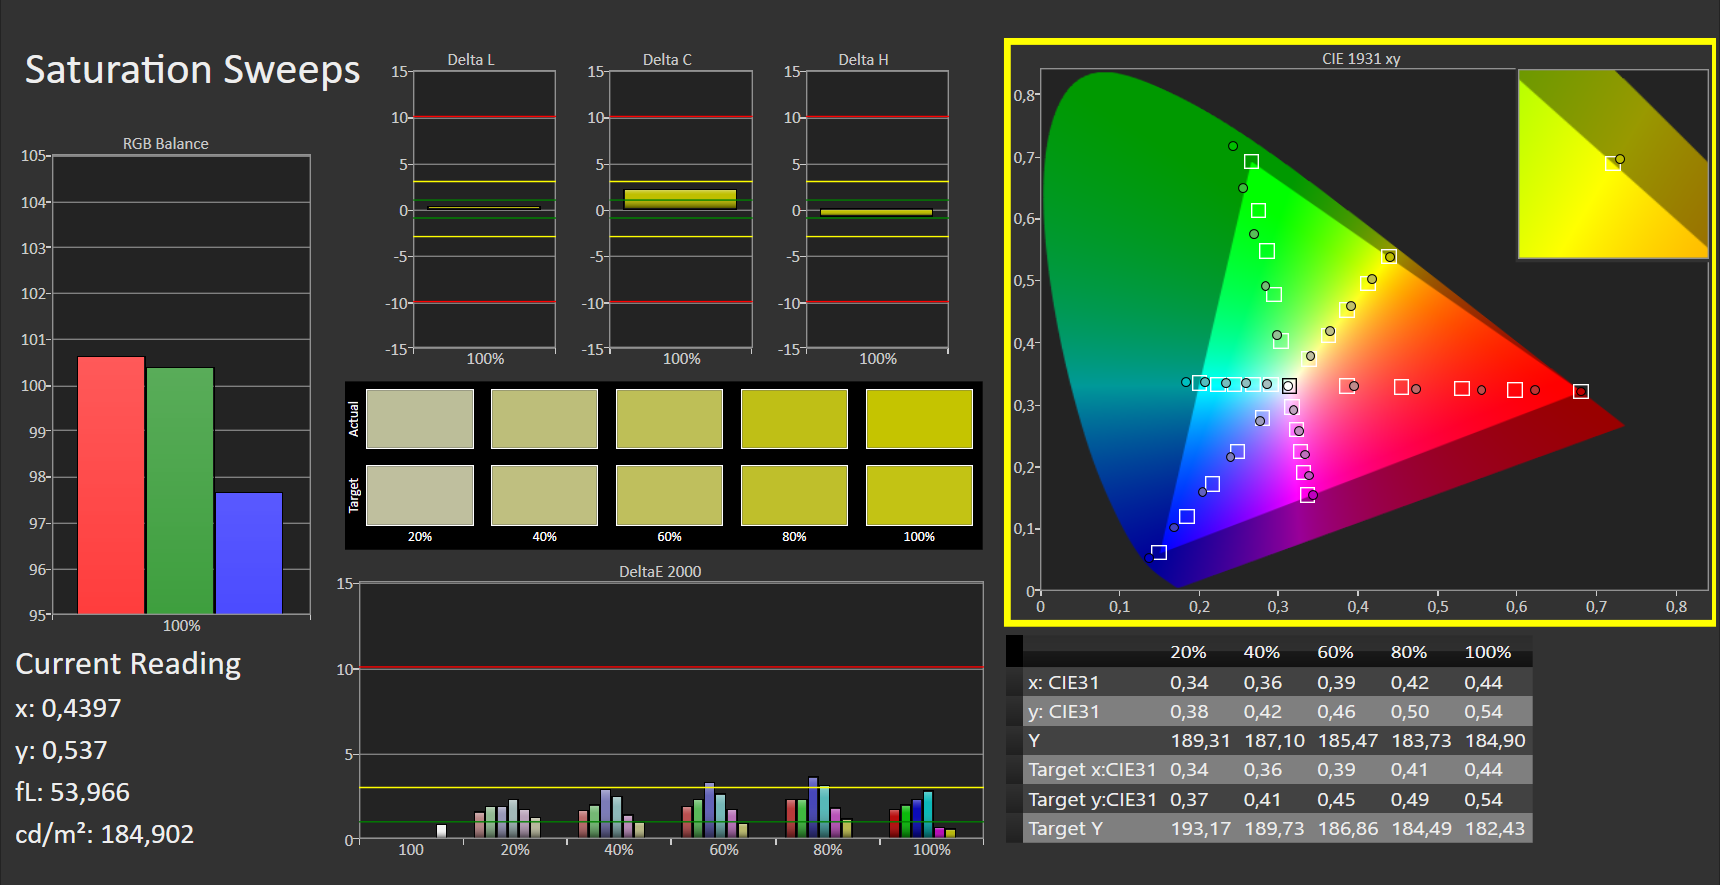
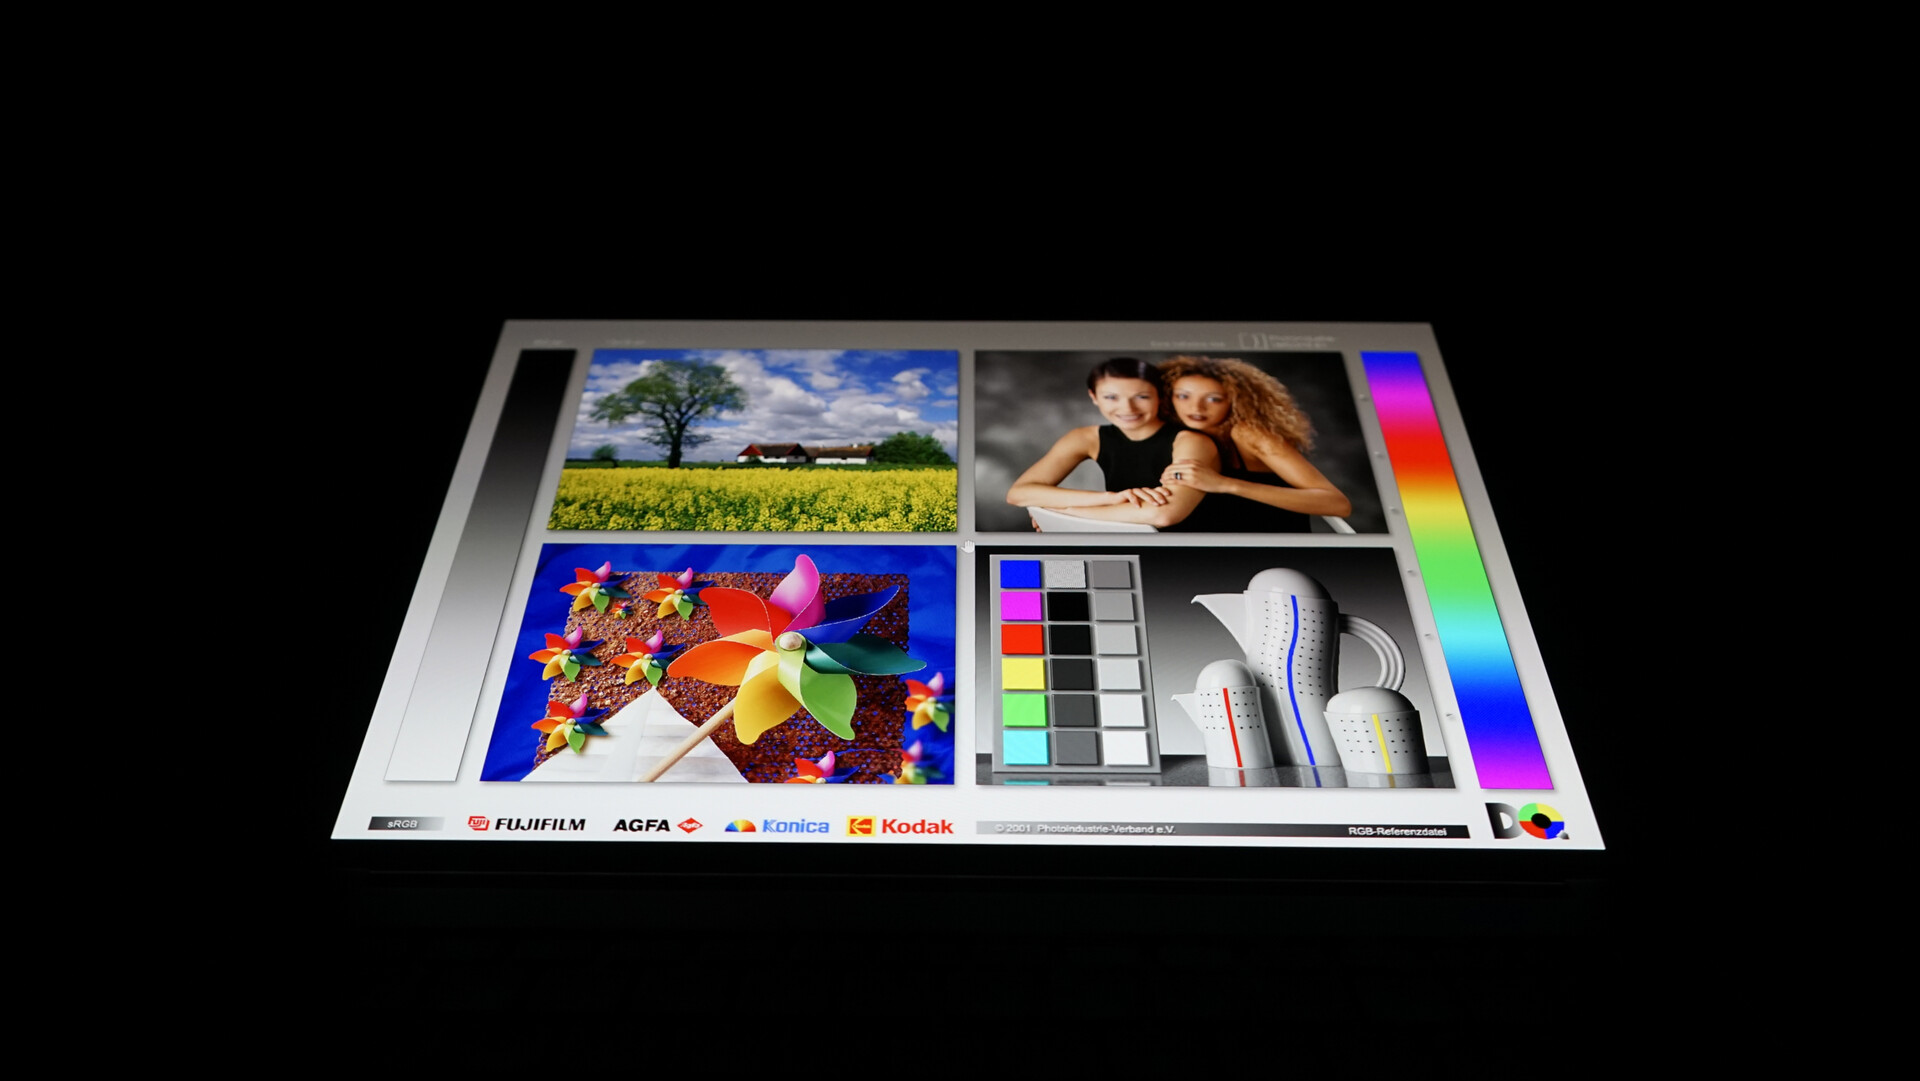
Según Asus, el 100% de la gama de color DCI-P3 es un hecho, pero nuestras mediciones dieron como resultado "sólo" el 99%. El espacio de color sRGB, por otro lado, alcanza el 100% de cobertura y el espacio de color AdobeRGB el 95%. Según el fabricante, el brillo de la pantalla se estima en una media de 400 nits. Medimos una media de 376 cd/m2 y un máximo de 381 cd/m2, por lo que no podemos confirmar completamente la afirmación de Asus. Como es habitual en los paneles OLED, la iluminación se distribuye homogéneamente en un 98%.
Los ajustes de brillo más bajos reducen el riesgo de quemado en las pantallas OLED, y la función de desplazamiento de píxel se activa por defecto a través de la app MyAsus. Así, todos los píxeles están siempre mínimamente en movimiento, por lo que se evitan las imágenes estáticas. El ajuste se puede desactivar a través de la app, pero no notamos que la función estuviera activada durante nuestras pruebas.
| |||||||||||||||||||||||||
iluminación: 98 %
Brillo con batería: 376 cd/m²
Contraste: 37200:1 (Negro: 0.01 cd/m²)
ΔE ColorChecker Calman: 2.01 | ∀{0.5-29.43 Ø4.71}
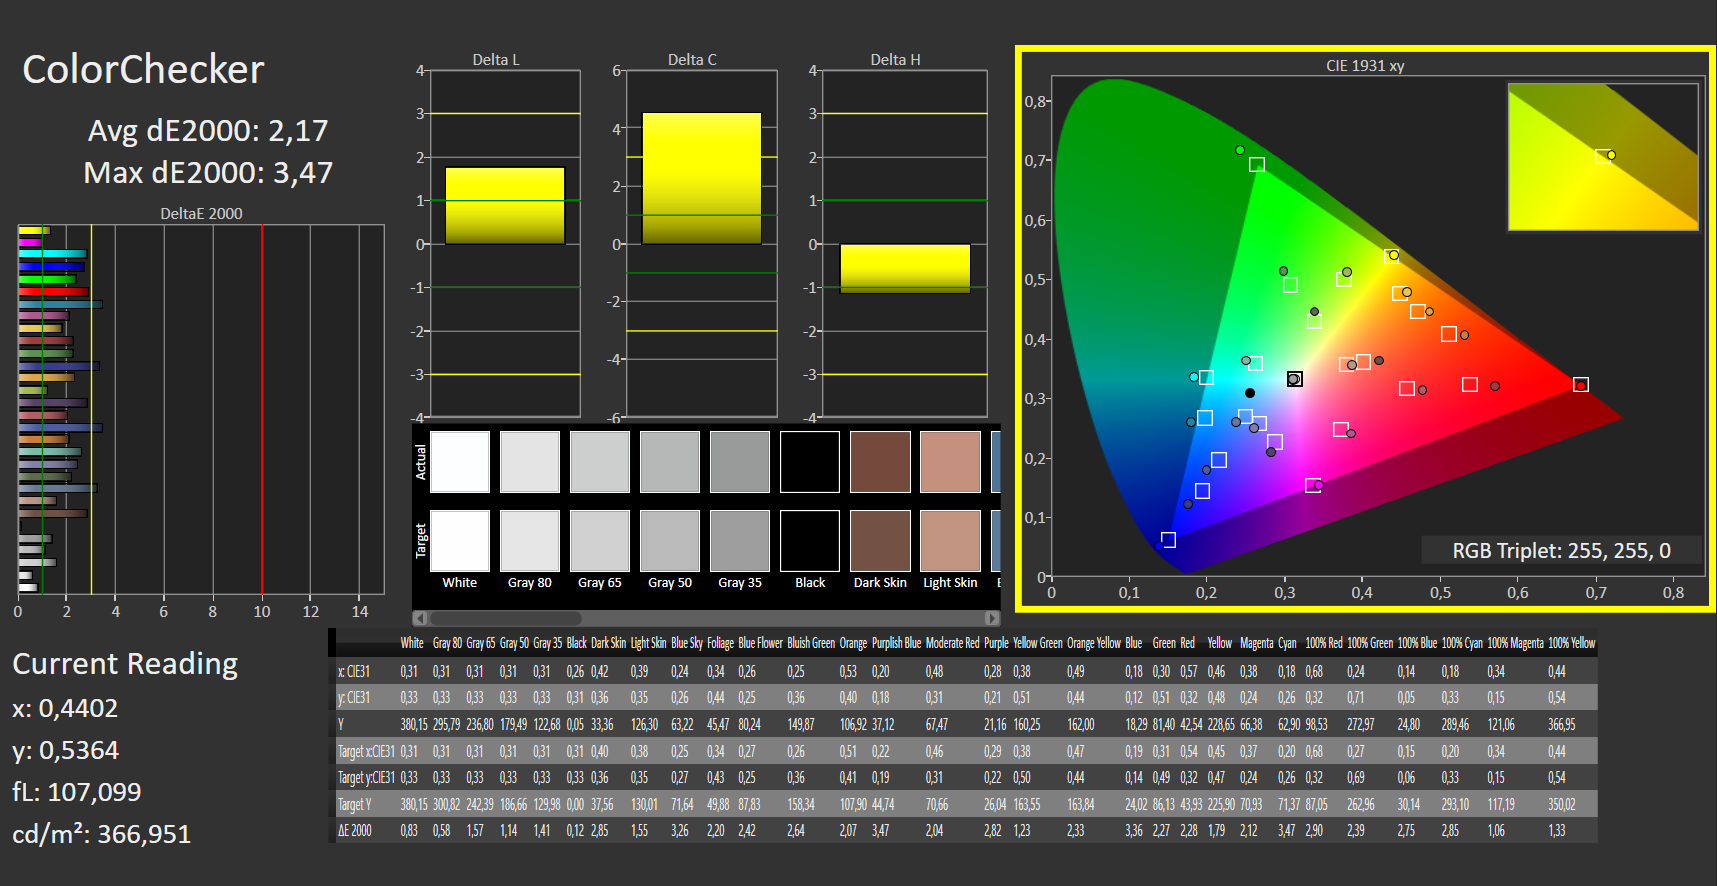
calibrated: 2.17
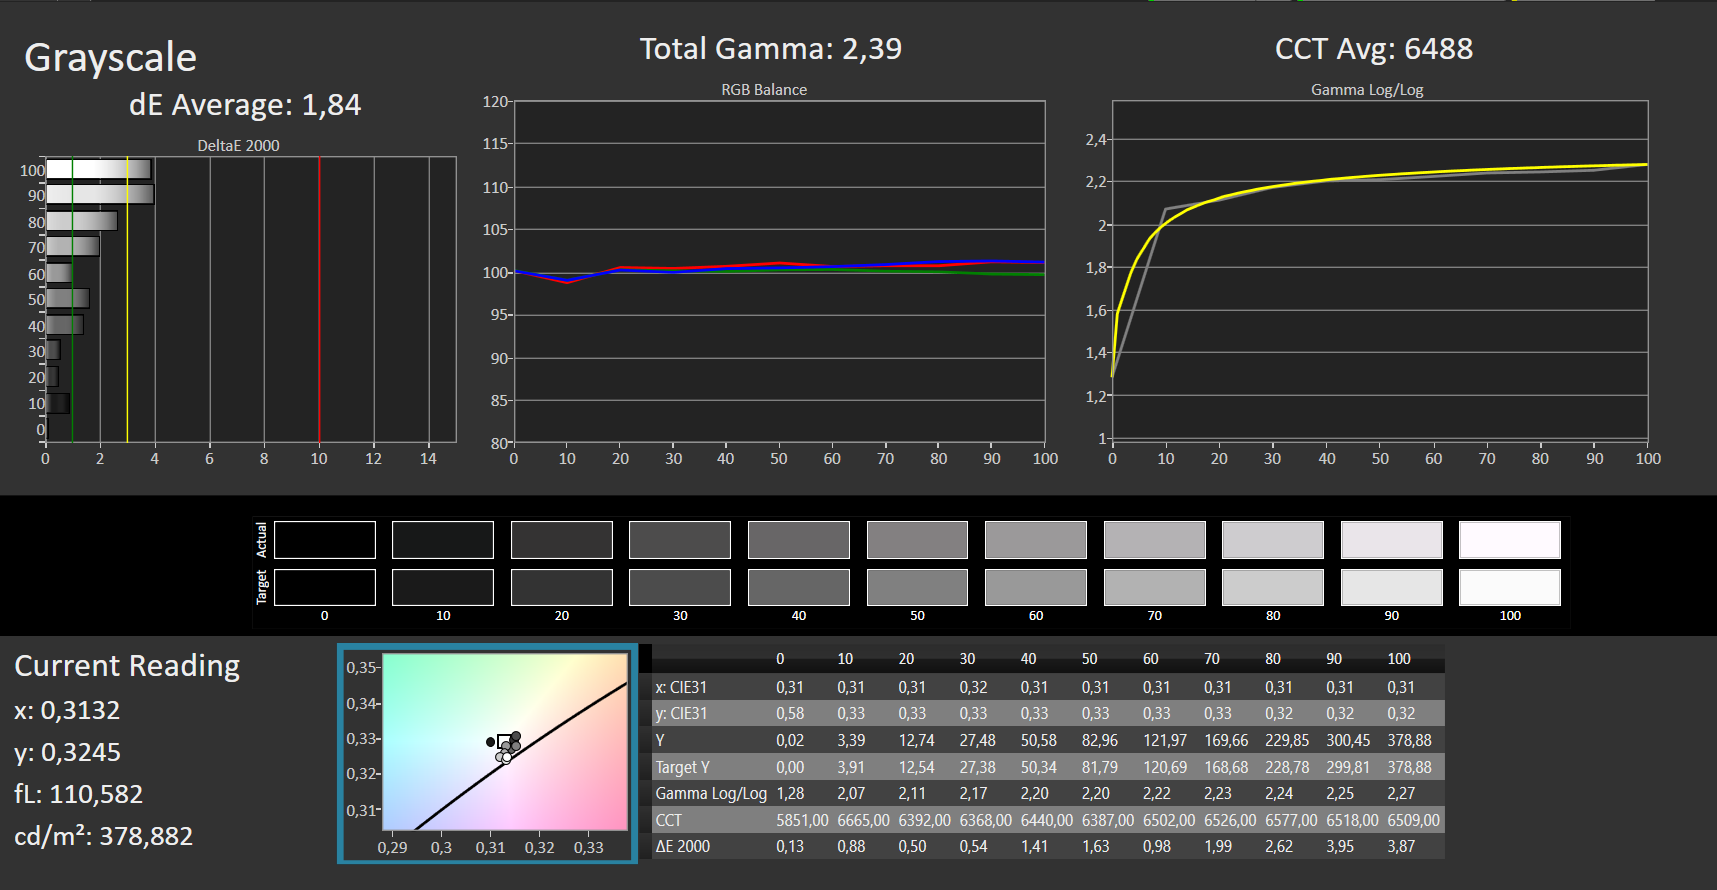
ΔE Greyscale Calman: 1.84 | ∀{0.09-98 Ø4.96}
95% AdobeRGB 1998 (Argyll 3D)
100% sRGB (Argyll 3D)
99% Display P3 (Argyll 3D)
Gamma: 2.39
CCT: 6488 K
| Asus ZenBook 14X UX3404VC Samsung, OLED, 2880x1800, 14.5" | Apple MacBook Pro 13 2022 M2 IPS, 2560x1600, 13.3" | Dell XPS 13 Plus 9320 i7-1280P OLED Samsung 134XK04, OLED, 3456x2160, 13.4" | Lenovo Slim Pro 7 14ARP8 LEN89C1, IPS, 2560x1600, 14.5" | LG Gram 14Z90Q LG LP140WU1-SPF1, IPS, 1920x1200, 14" | Dell Inspiron 14 Plus 7420 InfoVision 140NWHE, IPS, 2240x1400, 14" | Asus ROG Flow Z13 GZ301V TL134ADXP01-0, IPS, 2560x1600, 13.4" | |
|---|---|---|---|---|---|---|---|
| Display | -2% | 2% | -16% | -4% | -20% | -4% | |
| Display P3 Coverage (%) | 99 | 98.8 0% | 99.5 1% | 72.9 -26% | 98.4 -1% | 68.8 -31% | 97 -2% |
| sRGB Coverage (%) | 100 | 100 0% | 100 0% | 98.2 -2% | 99.9 0% | 99.3 -1% | 99.9 0% |
| AdobeRGB 1998 Coverage (%) | 95 | 87.9 -7% | 98.4 4% | 74.6 -21% | 85.9 -10% | 69.5 -27% | 85.3 -10% |
| Response Times | -1645% | -18% | -1178% | -1700% | -1290% | -225% | |
| Response Time Grey 50% / Grey 80% * (ms) | 2 ? | 42 ? -2000% | 2.6 ? -30% | 31.8 ? -1490% | 47.5 ? -2275% | 32.8 ? -1540% | 6.5 ? -225% |
| Response Time Black / White * (ms) | 2 ? | 27.8 ? -1290% | 2.1 ? -5% | 19.3 ? -865% | 24.5 ? -1125% | 22.8 ? -1040% | 6.5 ? -225% |
| PWM Frequency (Hz) | 250 ? | 117780 ? | 59.5 | ||||
| Screen | -319% | -13% | -368% | -324% | -334% | -482% | |
| Brightness middle (cd/m²) | 372 | 514 38% | 371.8 0% | 344.7 -7% | 341 -8% | 331.1 -11% | 537 44% |
| Brightness (cd/m²) | 376 | 497 32% | 374 -1% | 334 -11% | 305 -19% | 326 -13% | 511 36% |
| Brightness Distribution (%) | 98 | 93 -5% | 98 0% | 92 -6% | 87 -11% | 85 -13% | 88 -10% |
| Black Level * (cd/m²) | 0.01 | 0.31 -3000% | 0.31 -3000% | 0.26 -2500% | 0.29 -2800% | 0.45 -4400% | |
| Contrast (:1) | 37200 | 1658 -96% | 1112 -97% | 1312 -96% | 1142 -97% | 1193 -97% | |
| Colorchecker dE 2000 * | 2.01 | 1.1 45% | 2.37 -18% | 3.01 -50% | 3.11 -55% | 2.23 -11% | 1.49 26% |
| Colorchecker dE 2000 max. * | 4.05 | 2.3 43% | 6.1 -51% | 6.3 -56% | 8.29 -105% | 5.44 -34% | 3.68 9% |
| Colorchecker dE 2000 calibrated * | 2.17 | 0.6 72% | 0.83 62% | 0.83 62% | 0.63 71% | 1.12 48% | |
| Greyscale dE 2000 * | 1.84 | 1.8 2% | 2 -9% | 4.6 -150% | 5.3 -188% | 3.6 -96% | 1.66 10% |
| Gamma | 2.39 92% | 2.23 99% | 2.29 96% | 2.28 96% | 2.037 108% | 2.21 100% | 2.43 91% |
| CCT | 6488 100% | 6764 96% | 6261 104% | 6420 101% | 7571 86% | 6022 108% | 6772 96% |
| Media total (Programa/Opciones) | -655% /
-440% | -10% /
-10% | -521% /
-409% | -676% /
-452% | -548% /
-403% | -237% /
-343% |
* ... más pequeño es mejor
Como es habitual en las pantallas OLED, el contraste es excelente. El ZenBook 14X tiene un negro intenso y los colores son vibrantes. El display OLED también es claramente superior a los displays IPS de dispositivos comparables en términos de tiempos de respuesta. Los ajustes de imagen y display pueden ajustarse individualmente a través del software MyAsus.

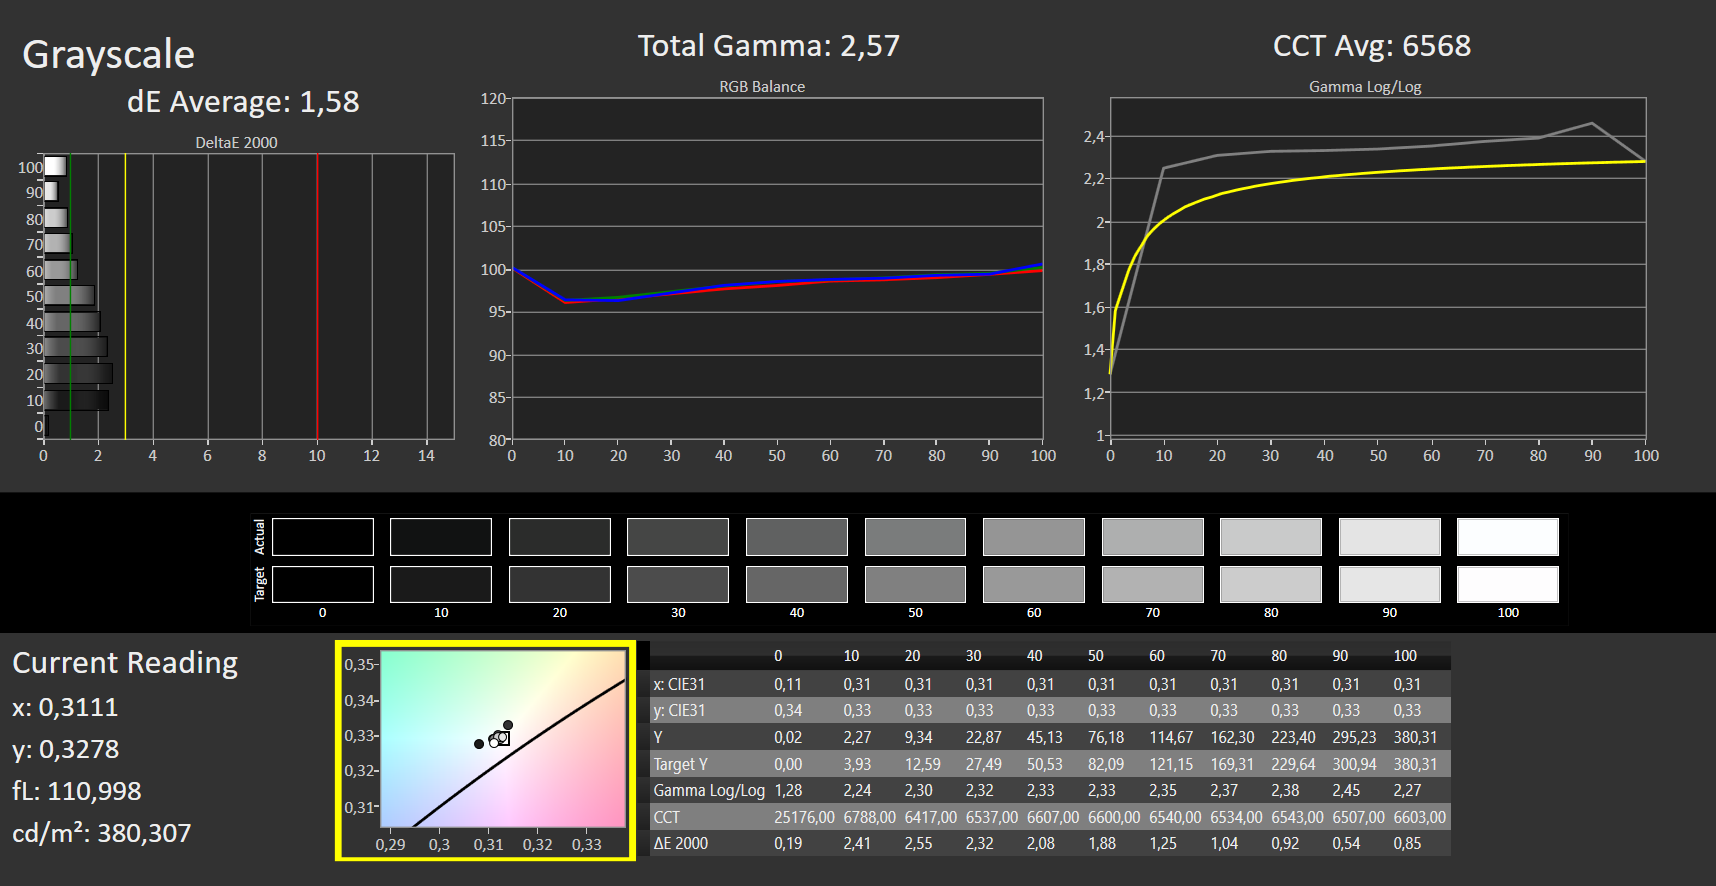
Nuestras mediciones del DeltaE de la escala de grises y los colores arrojaron valores muy buenos, entre 1,8 y 2,0, antes de la calibración. La calibración mejoró el DeltaE de la escala de grises hasta 1,6, mientras que el DeltaE de los colores se deterioró hasta 2,2. Estos resultados sugieren que la pantalla ya está calibrada y que las calibraciones adicionales no ofrecen ningún valor añadido en este caso.
Tiempos de respuesta del display
| ↔ Tiempo de respuesta de Negro a Blanco | ||
|---|---|---|
| 2 ms ... subida ↗ y bajada ↘ combinada | ↗ 1 ms subida |  |
| ↘ 1 ms bajada | ||
| La pantalla mostró tiempos de respuesta muy rápidos en nuestros tests y debería ser adecuada para juegos frenéticos. En comparación, todos los dispositivos de prueba van de ##min### (mínimo) a 240 (máximo) ms. » 11 % de todos los dispositivos son mejores. Esto quiere decir que el tiempo de respuesta medido es mejor que la media (19.8 ms) de todos los dispositivos testados. | ||
| ↔ Tiempo de respuesta 50% Gris a 80% Gris | ||
| 2 ms ... subida ↗ y bajada ↘ combinada | ↗ 1 ms subida |  |
| ↘ 1 ms bajada | ||
| La pantalla mostró tiempos de respuesta muy rápidos en nuestros tests y debería ser adecuada para juegos frenéticos. En comparación, todos los dispositivos de prueba van de ##min### (mínimo) a 636 (máximo) ms. » 10 % de todos los dispositivos son mejores. Esto quiere decir que el tiempo de respuesta medido es mejor que la media (31 ms) de todos los dispositivos testados. | ||
Parpadeo de Pantalla / PWM (Pulse-Width Modulation)
| Parpadeo de Pantalla / PWM detectado | 250 Hz | ≤ 70 % de brillo |  |
La retroiluminación del display parpadea a 250 Hz (seguramente usa PWM - Pulse-Width Modulation) a un brillo del 70 % e inferior. Sobre este nivel de brillo no debería darse parpadeo / PWM. La frecuencia de 250 Hz es relativamente baja, por lo que la gente sensible debería ver parpadeos y padecer fatiga visual por la pantalla (usado al brillo indicado a continuación). Comparación: 52 % de todos los dispositivos testados no usaron PWM para atenuar el display. Si se usó, medimos una media de 7751 (mínimo: 5 - máxmo: 343500) Hz. | |||


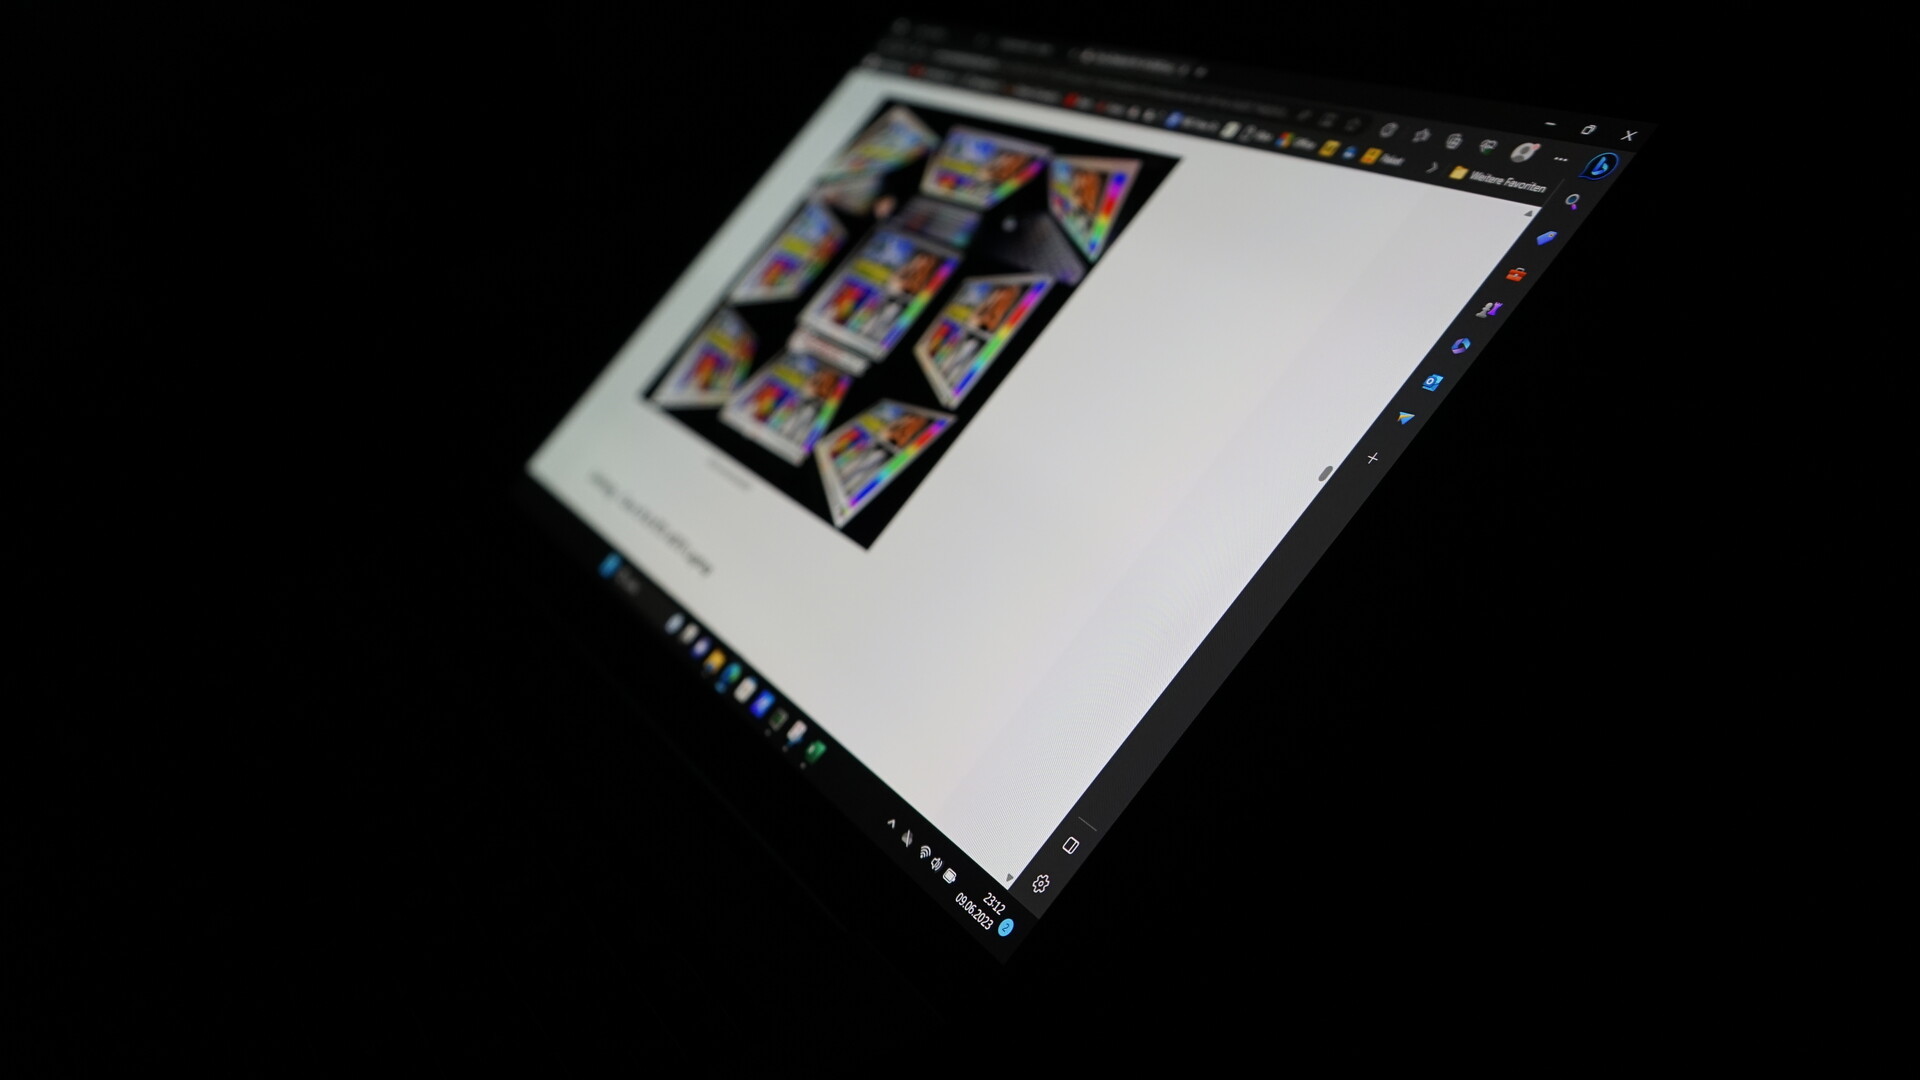
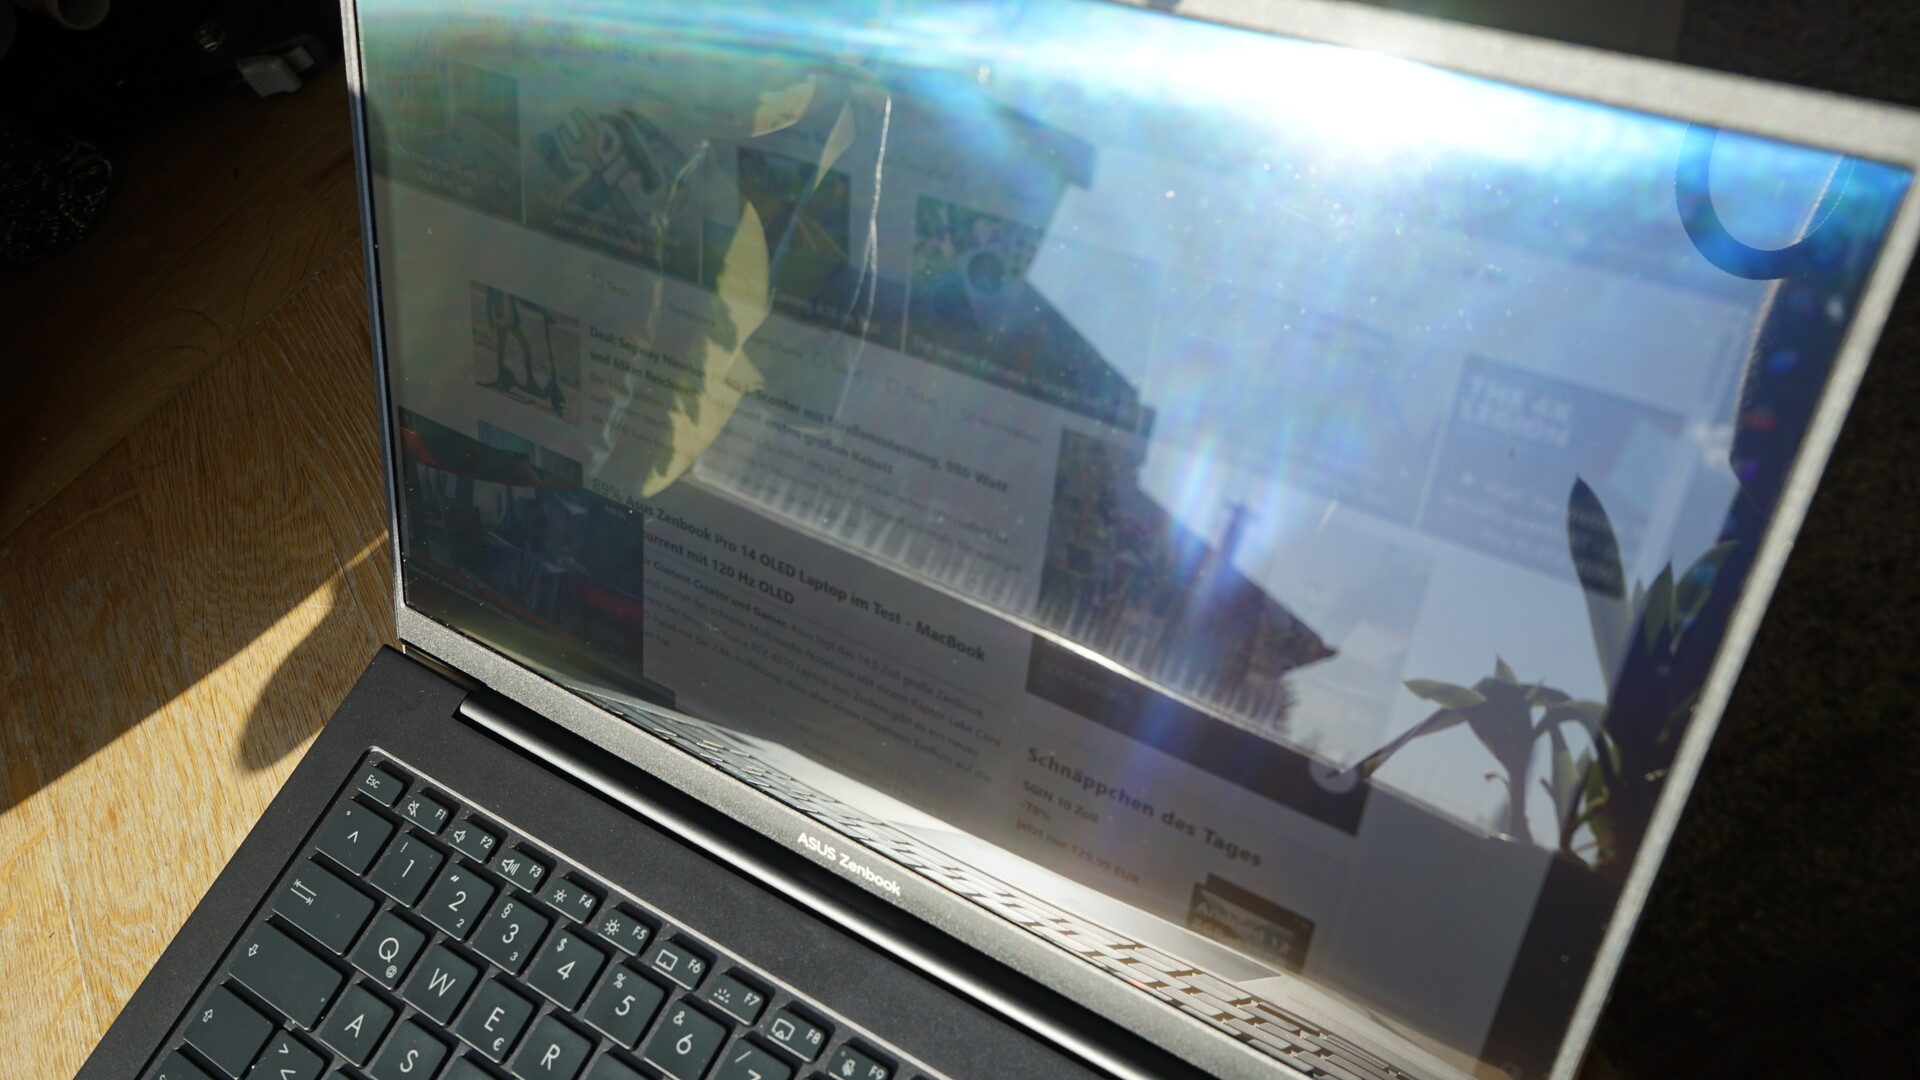
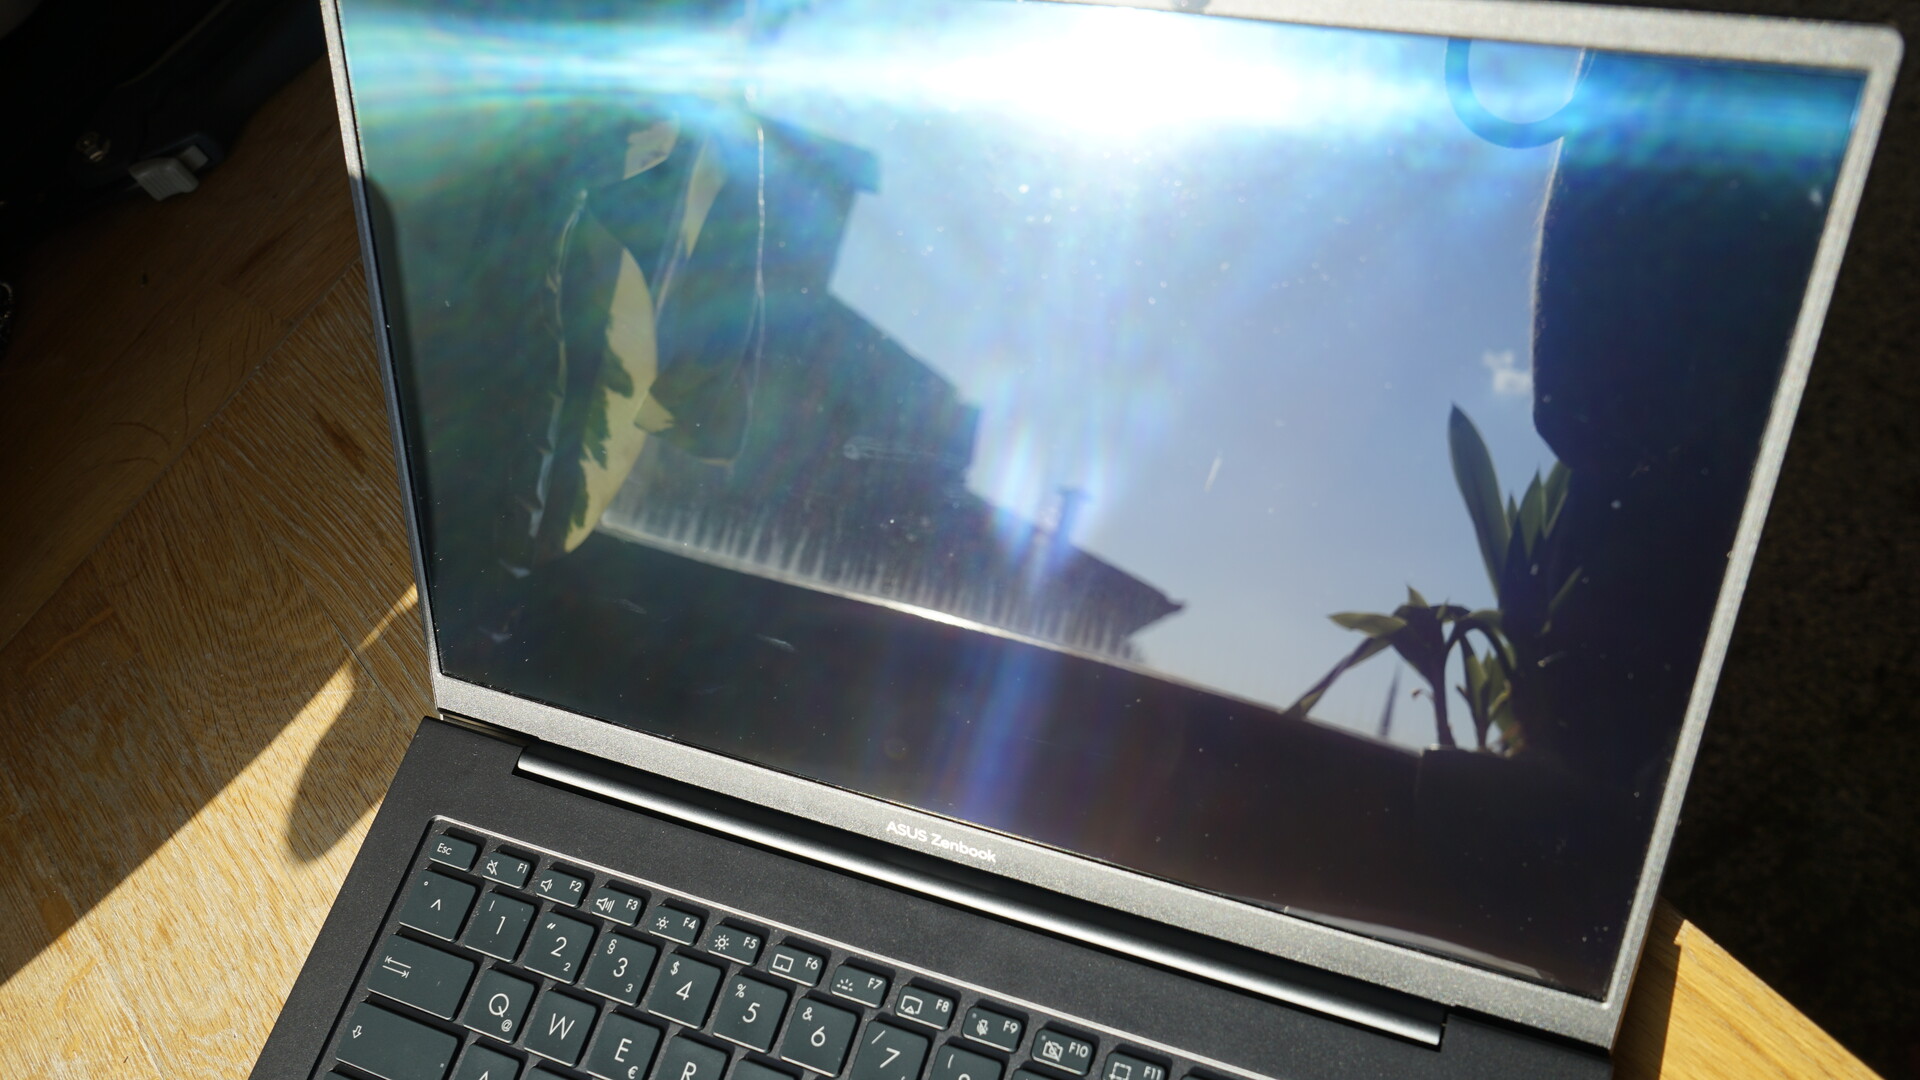
La pantalla OLED del Asus ZenBook 14X tiene problemas bajo luz solar directa. El display deslumbrante apenas puede arreglárselas aquí y ya no es posible ver cómodamente la pantalla. El brillo máximo ligeramente superior comparado con el predecesor tampoco ayuda.
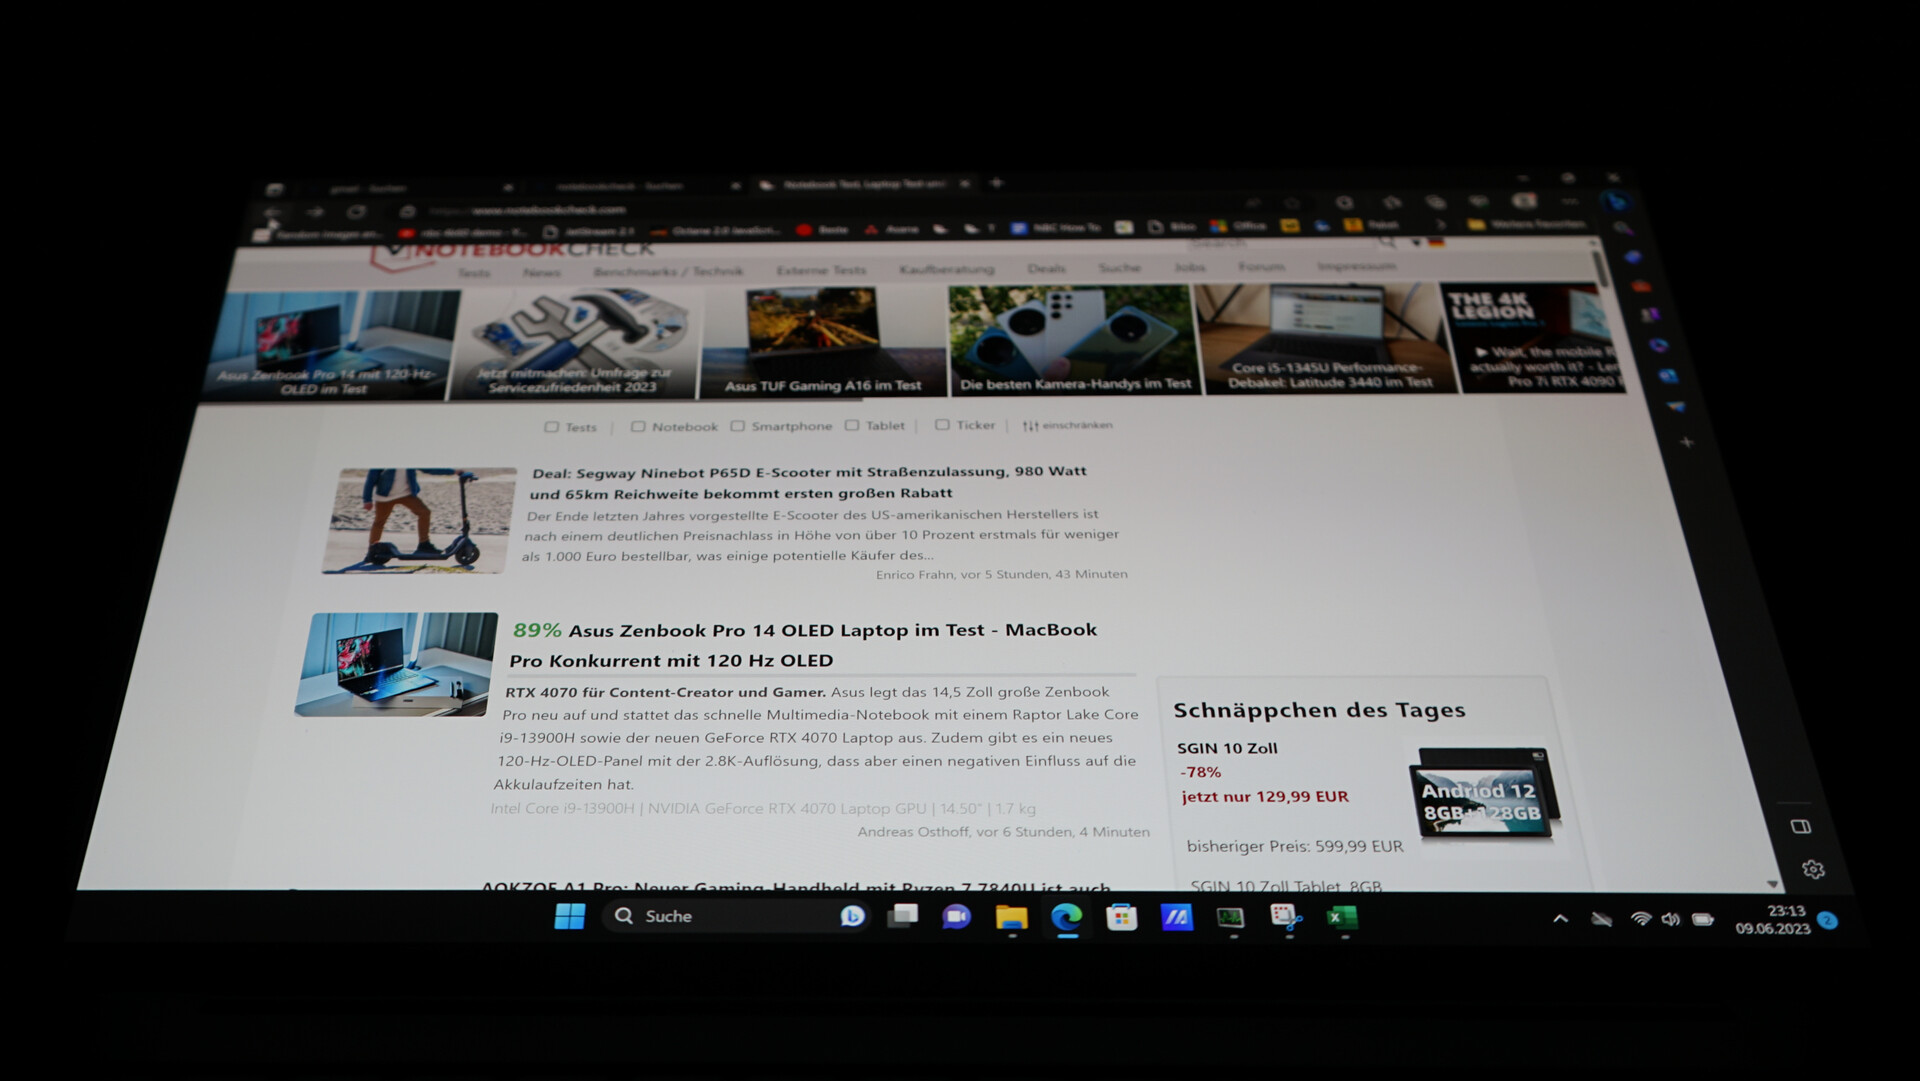
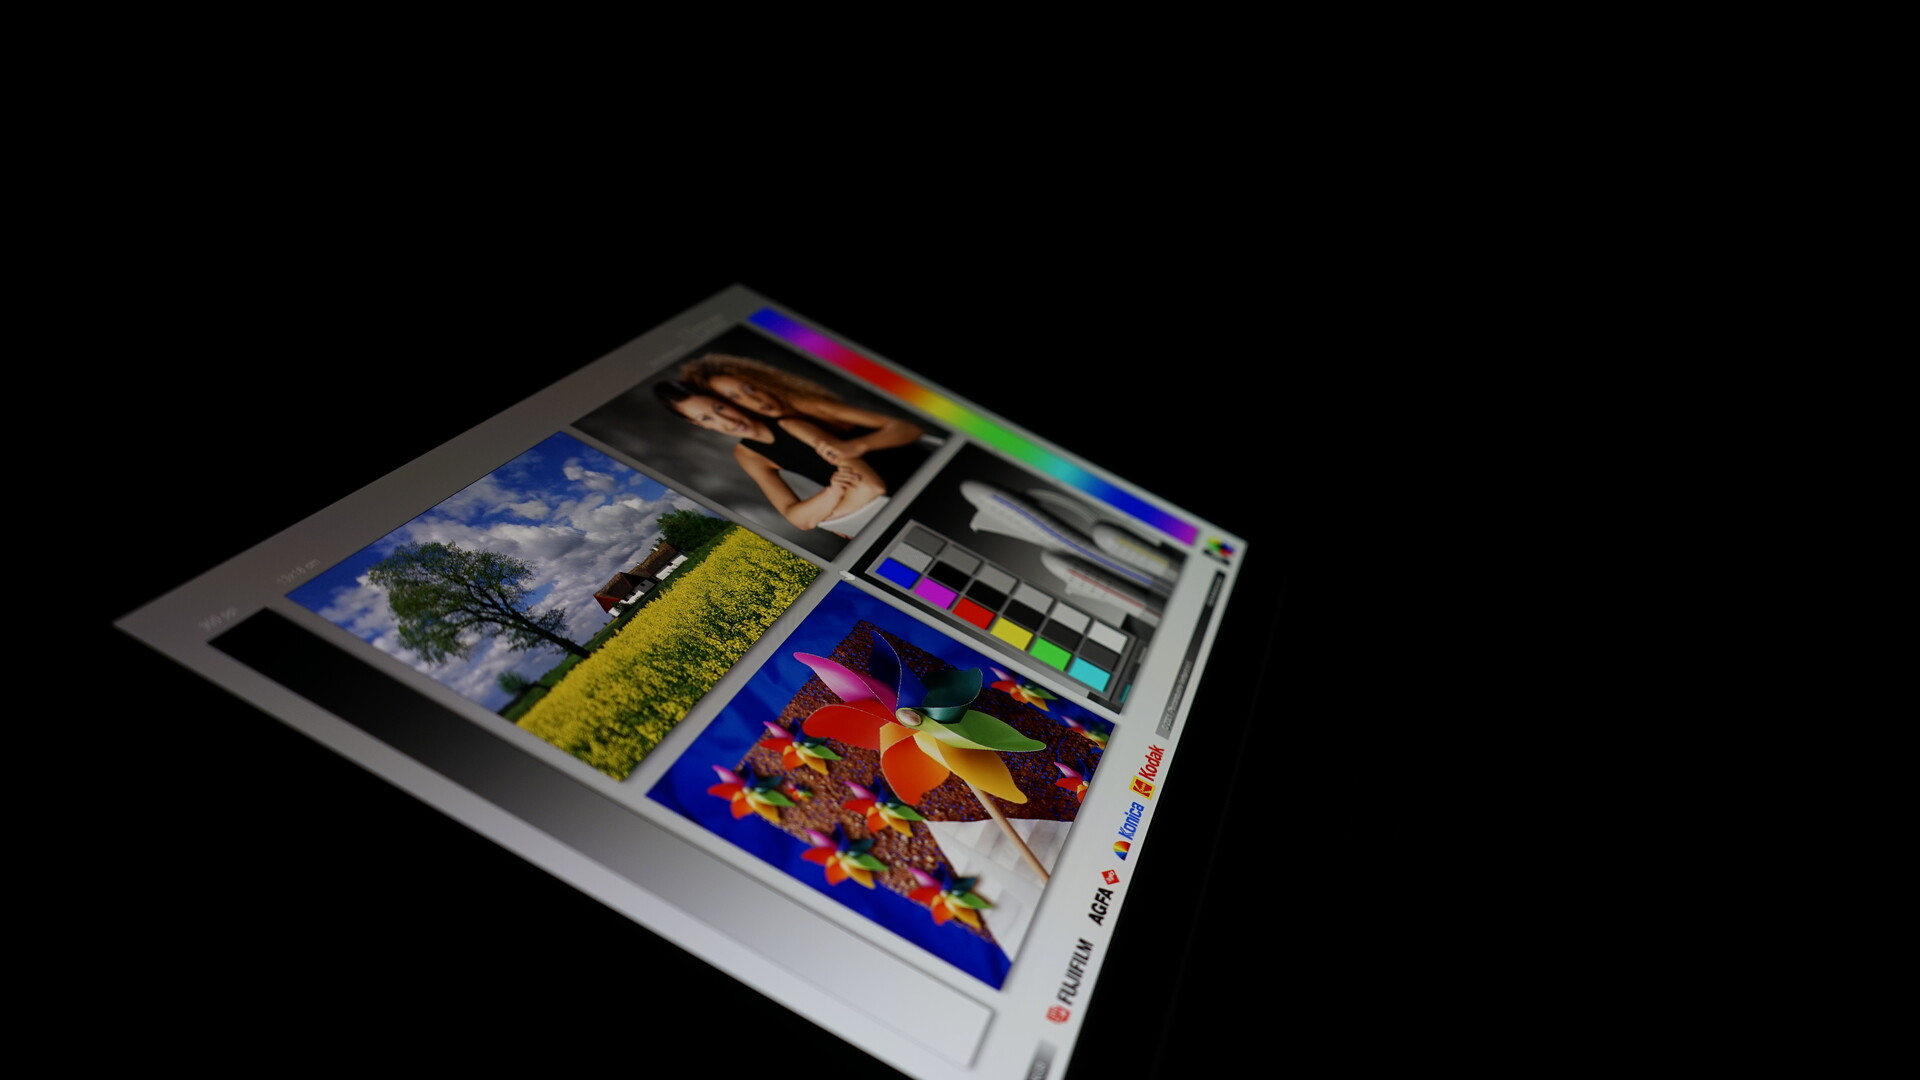
Como es habitual con los paneles OLED, no hay nada que criticar sobre la estabilidad del ángulo de visión. Los colores y el brillo permanecen perfectamente estables, incluso en ángulos muy pronunciados. Como es habitual en los paneles OLED, se aprecia cierto tinte azulado en ángulos muy pronunciados.

Rendimiento - Potente Intel i9-13900H
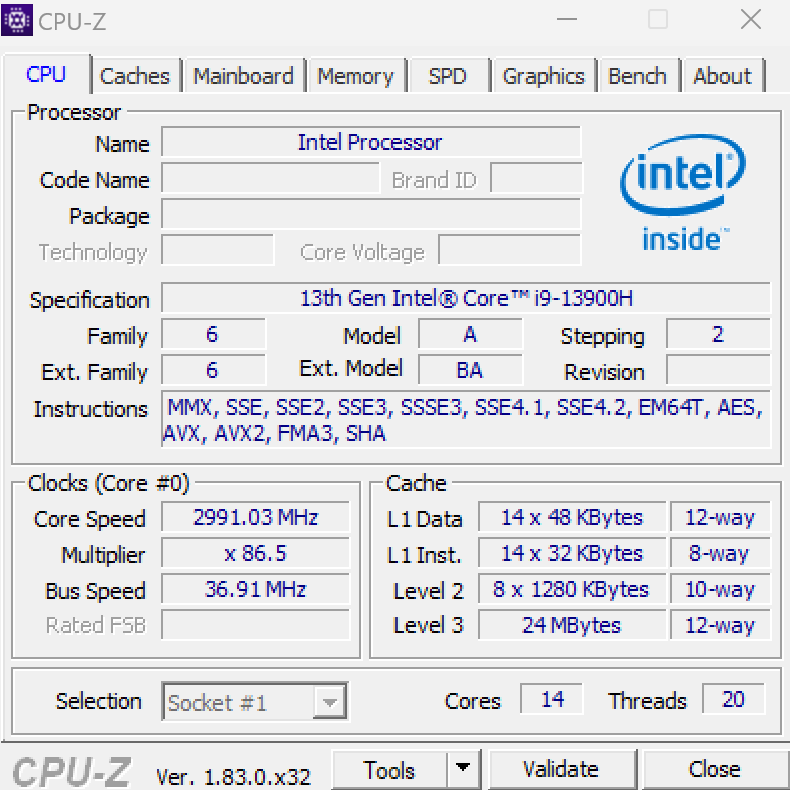
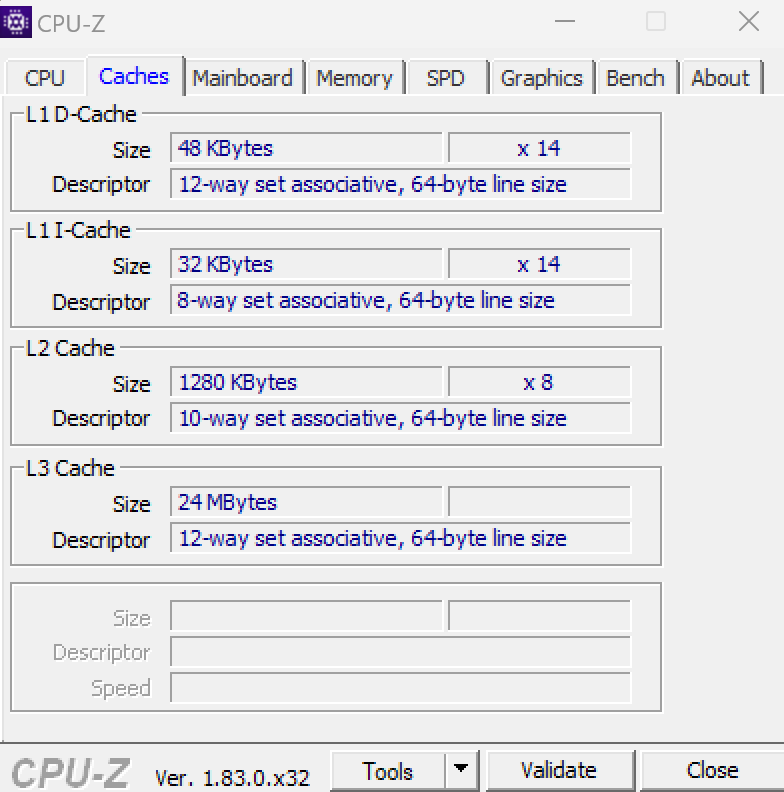
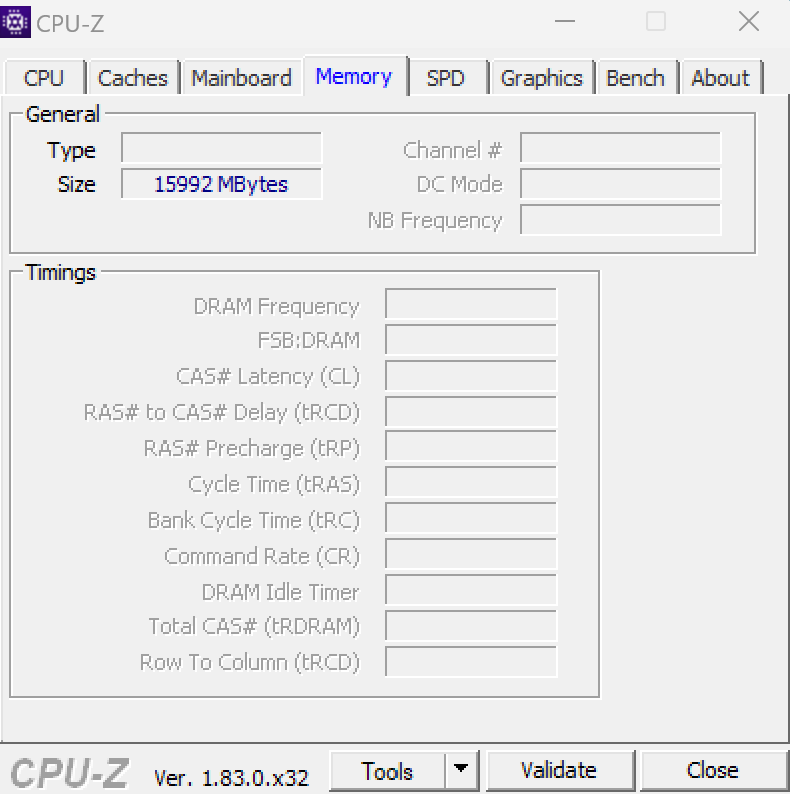
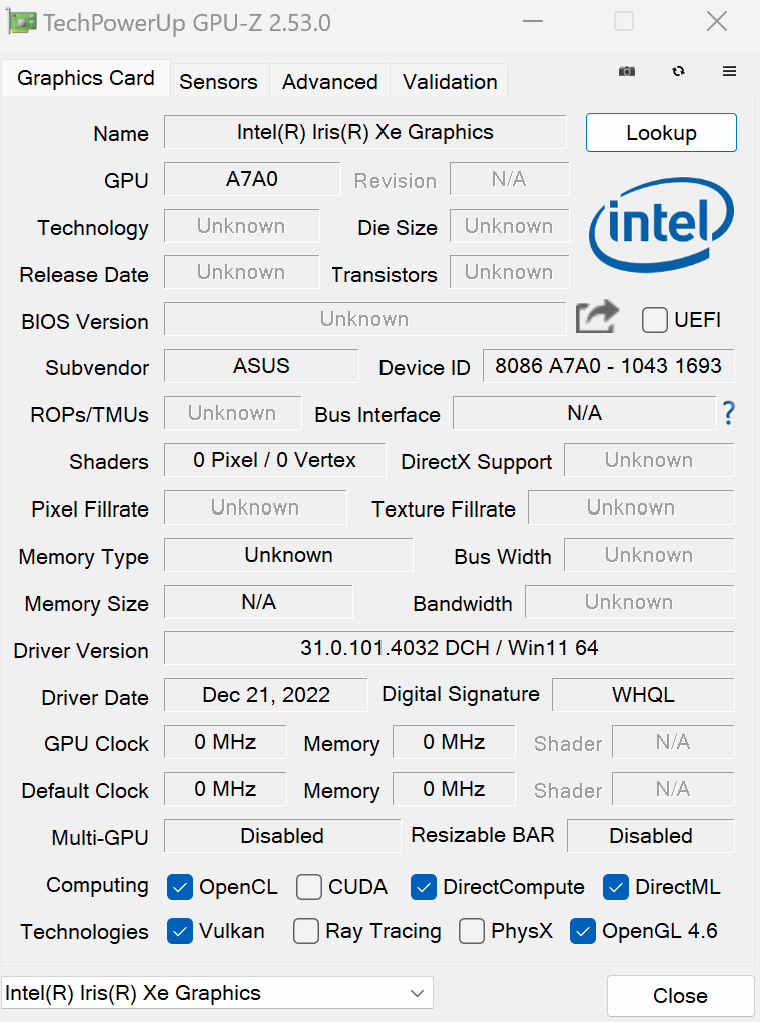
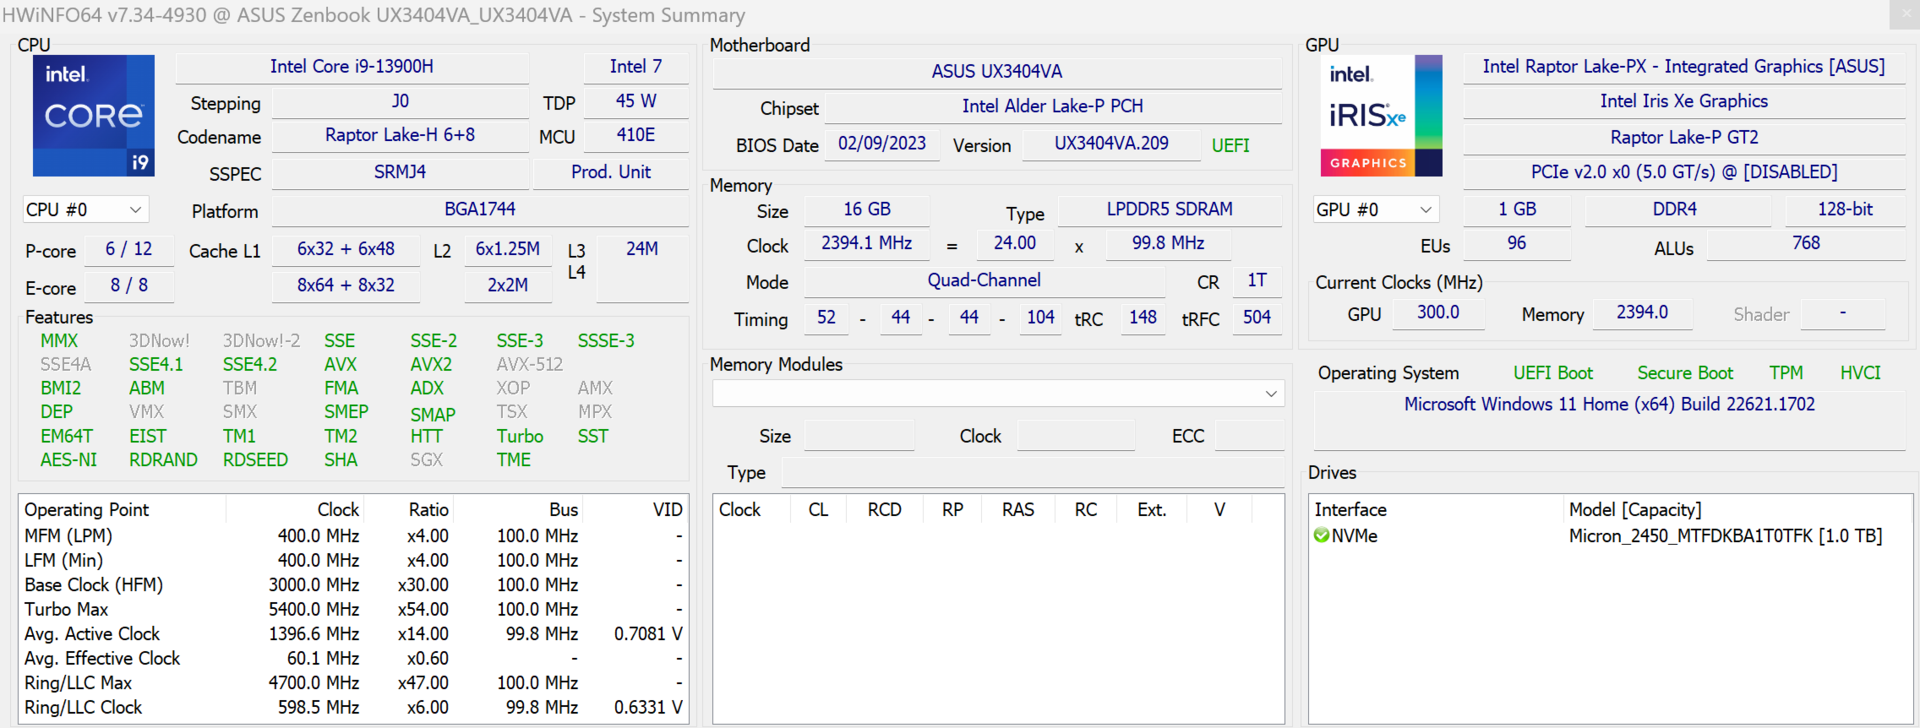
Asus instala el Intel CoreIntel Core i9-13900Hen el nuevo ZenBook 14X, que, a excepción del Asus ROG Flow Z13sólo se encuentra en portátiles más grandes. Nuestro modelo de pruebas es la variante sin tarjeta gráfica dedicada. Por tanto, aquí sólo se usa la gráfica interna Intel Iris X. Otro hardware incluye 16 GB de RAM LPDDR5 (integrada) y un disco duro M.2 NVME PCIe de 1 TB.
Condiciones de ensayo
Se pueden seleccionar tres perfiles de rendimiento diferentes para el ZenBook 14X a través de la app MyAsus: Silencioso, Estándar y Rendimiento. Este último solo puede usarse con la fuente de alimentación enchufada. Los bancos de pruebas se ejecutaron en modo Rendimiento , mientras que las pruebas de aguante de batería se llevaron a cabo en modo Silencioso . El modo Rendimiento se usó para la prueba de consumo de energía máximo, y las emisiones de ruido se comprobaron en los tres modos.
| Modorendimiento | Modo estándar | Modo silencio | |
|---|---|---|---|
| CPU PL1 (HWInfo) | 80 vatios | 80 vatios | 40 vatios |
| CPU PL2 (HWInfo) | 80 vatios | 80 vatios | 80 vatios |
Procesador
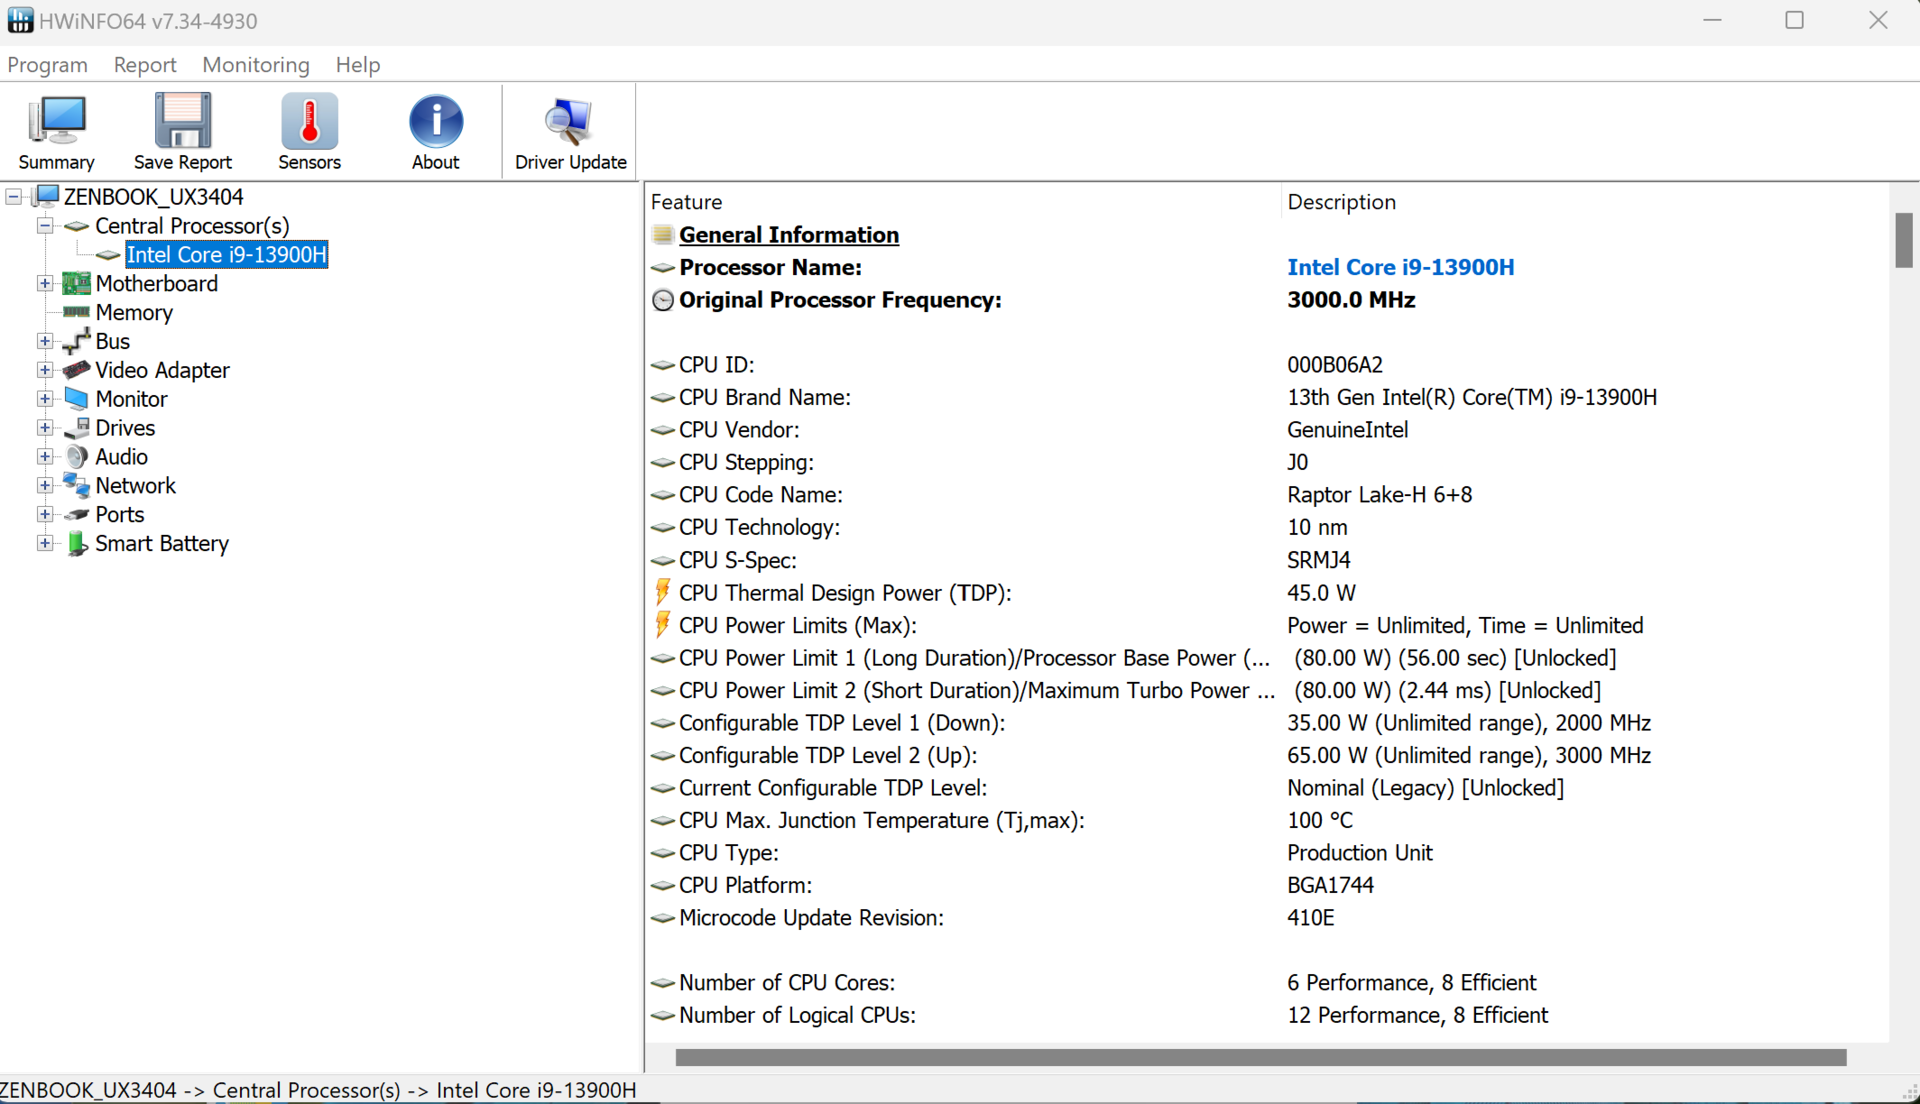
La Intel Core i9-13900H es una CPU móvil de gama alta de la serie Raptor Lake H. La CPU combina 6 núcleos de rendimiento con 8 núcleos de eficiencia. Como los núcleos P admiten hyperthreading, el procesador tiene 20 hilos. Mientras que los núcleos P funcionan entre 2,6 y 5,4 GHz, los núcleos E lo hacen entre 1,9 y 4,1 GHz
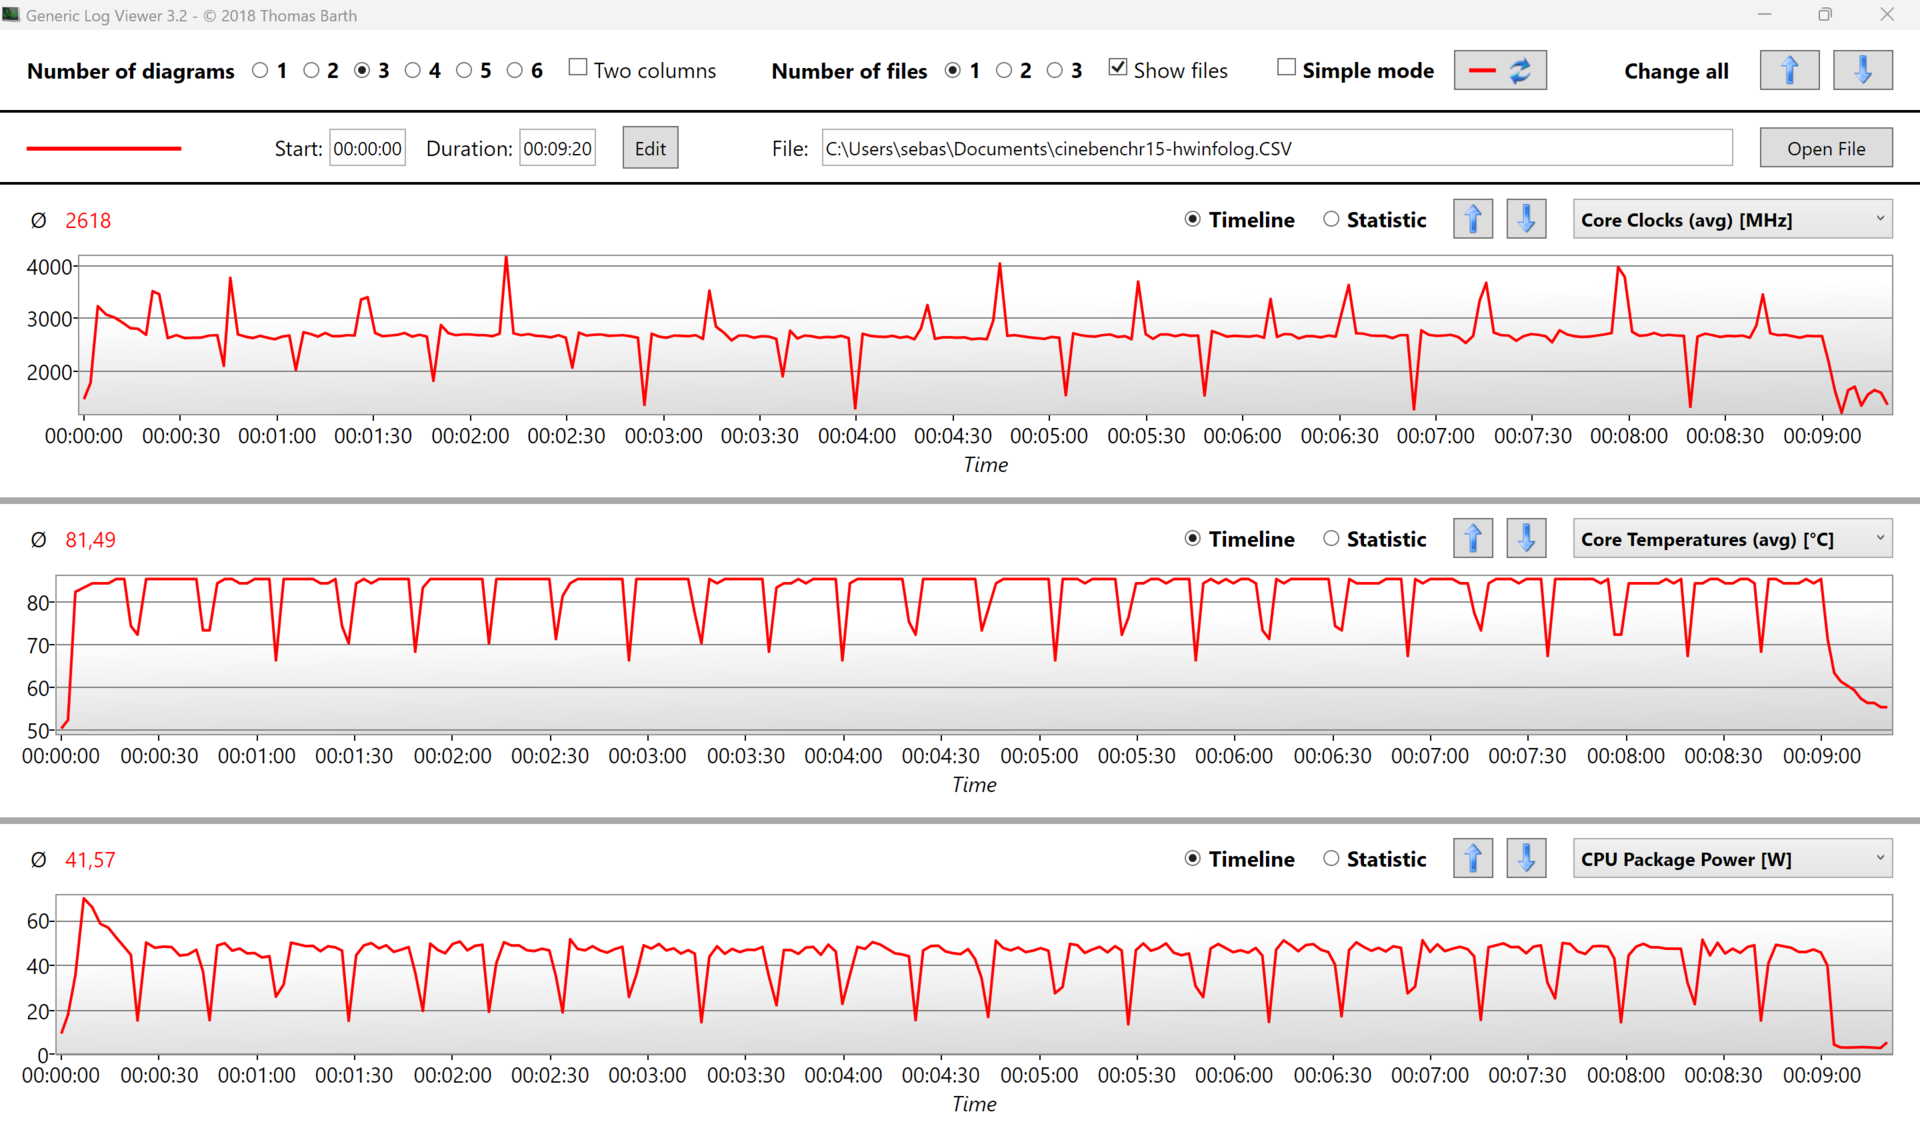
En el bucle Cinebench, se aprecia una caída brusca de la puntuación tras la primera ejecución, que luego se estabiliza brevemente entre 2250 y 2300 puntos, pero vuelve a caer tras la quinta ejecución y luego se asienta en torno a los 2150 puntos. Para el pequeño factor de forma del ZenBook, seguiría siendo un buen resultado si no fuera por el Asus ROG Flow Z13, que rinde mejor como tablet con el mismo procesador. Dado que el procesador alcanza rápidamente los 99°C bajo carga, cabe suponer que la solución de ventilador único limita el rendimiento aquí.
El procesador puede consumir casi 80w durante cortos periodos de tiempo, pero luego promedia unos 40w tras la primera ejecución. Después de unos 10 minutos, sin embargo, el consumo baja a unos 20 vatios. Como resultado, la media es de 36 vatios bajo carga sostenida. El bucle Cinebench muestra que el procesador Intel también es capaz de mantener un alto rendimiento bajo carga sostenida.
Cinebench R15 Multi Sustained Load
Cinebench R23: Multi Core | Single Core
Cinebench R20: CPU (Multi Core) | CPU (Single Core)
Cinebench R15: CPU Multi 64Bit | CPU Single 64Bit
Blender: v2.79 BMW27 CPU
7-Zip 18.03: 7z b 4 | 7z b 4 -mmt1
Geekbench 5.5: Multi-Core | Single-Core
HWBOT x265 Benchmark v2.2: 4k Preset
LibreOffice : 20 Documents To PDF
R Benchmark 2.5: Overall mean
| CPU Performance rating | |
| Asus ROG Flow Z13 GZ301V | |
| Medio Intel Core i9-13900H | |
| Asus ZenBook 14X UX3404VC | |
| Dell Inspiron 14 Plus 7420 | |
| Media de la clase Subnotebook | |
| Dell XPS 13 Plus 9320 i7-1280P OLED | |
| Lenovo Slim Pro 7 14ARP8 | |
| Apple MacBook Pro 13 2022 M2 -5! | |
| LG Gram 14Z90Q | |
| Cinebench R23 / Multi Core | |
| Asus ROG Flow Z13 GZ301V | |
| Medio Intel Core i9-13900H (11997 - 20385, n=28) | |
| Asus ZenBook 14X UX3404VC | |
| Dell Inspiron 14 Plus 7420 | |
| Lenovo Slim Pro 7 14ARP8 | |
| Media de la clase Subnotebook (1555 - 21812, n=60, últimos 2 años) | |
| Dell XPS 13 Plus 9320 i7-1280P OLED | |
| Apple MacBook Pro 13 2022 M2 | |
| LG Gram 14Z90Q | |
| Cinebench R23 / Single Core | |
| Asus ROG Flow Z13 GZ301V | |
| Asus ZenBook 14X UX3404VC | |
| Medio Intel Core i9-13900H (1297 - 2054, n=26) | |
| Dell Inspiron 14 Plus 7420 | |
| Media de la clase Subnotebook (358 - 2213, n=61, últimos 2 años) | |
| Dell XPS 13 Plus 9320 i7-1280P OLED | |
| Apple MacBook Pro 13 2022 M2 | |
| Lenovo Slim Pro 7 14ARP8 | |
| LG Gram 14Z90Q | |
| Cinebench R20 / CPU (Multi Core) | |
| Asus ROG Flow Z13 GZ301V | |
| Medio Intel Core i9-13900H (4935 - 7716, n=25) | |
| Asus ZenBook 14X UX3404VC | |
| Dell Inspiron 14 Plus 7420 | |
| Lenovo Slim Pro 7 14ARP8 | |
| Media de la clase Subnotebook (579 - 8541, n=57, últimos 2 años) | |
| Dell XPS 13 Plus 9320 i7-1280P OLED | |
| Apple MacBook Pro 13 2022 M2 | |
| LG Gram 14Z90Q | |
| Cinebench R20 / CPU (Single Core) | |
| Asus ROG Flow Z13 GZ301V | |
| Asus ZenBook 14X UX3404VC | |
| Medio Intel Core i9-13900H (428 - 792, n=25) | |
| Dell Inspiron 14 Plus 7420 | |
| Media de la clase Subnotebook (128 - 832, n=57, últimos 2 años) | |
| Dell XPS 13 Plus 9320 i7-1280P OLED | |
| Lenovo Slim Pro 7 14ARP8 | |
| LG Gram 14Z90Q | |
| Apple MacBook Pro 13 2022 M2 | |
| Cinebench R15 / CPU Multi 64Bit | |
| Asus ROG Flow Z13 GZ301V | |
| Medio Intel Core i9-13900H (2061 - 3100, n=26) | |
| Asus ZenBook 14X UX3404VC | |
| Dell Inspiron 14 Plus 7420 | |
| Lenovo Slim Pro 7 14ARP8 | |
| Media de la clase Subnotebook (327 - 3345, n=57, últimos 2 años) | |
| Dell XPS 13 Plus 9320 i7-1280P OLED | |
| Apple MacBook Pro 13 2022 M2 | |
| LG Gram 14Z90Q | |
| Cinebench R15 / CPU Single 64Bit | |
| Asus ROG Flow Z13 GZ301V | |
| Medio Intel Core i9-13900H (211 - 297, n=26) | |
| Asus ZenBook 14X UX3404VC | |
| Media de la clase Subnotebook (72.4 - 322, n=57, últimos 2 años) | |
| Dell Inspiron 14 Plus 7420 | |
| Dell XPS 13 Plus 9320 i7-1280P OLED | |
| Apple MacBook Pro 13 2022 M2 | |
| Lenovo Slim Pro 7 14ARP8 | |
| LG Gram 14Z90Q | |
| Blender / v2.79 BMW27 CPU | |
| Apple MacBook Pro 13 2022 M2 | |
| LG Gram 14Z90Q | |
| Media de la clase Subnotebook (159 - 2271, n=58, últimos 2 años) | |
| Dell XPS 13 Plus 9320 i7-1280P OLED | |
| Dell Inspiron 14 Plus 7420 | |
| Lenovo Slim Pro 7 14ARP8 | |
| Asus ZenBook 14X UX3404VC | |
| Medio Intel Core i9-13900H (166 - 268, n=24) | |
| Asus ROG Flow Z13 GZ301V | |
| 7-Zip 18.03 / 7z b 4 | |
| Asus ROG Flow Z13 GZ301V | |
| Medio Intel Core i9-13900H (45045 - 79032, n=25) | |
| Asus ZenBook 14X UX3404VC | |
| Dell Inspiron 14 Plus 7420 | |
| Lenovo Slim Pro 7 14ARP8 | |
| Dell XPS 13 Plus 9320 i7-1280P OLED | |
| Media de la clase Subnotebook (11668 - 77867, n=57, últimos 2 años) | |
| LG Gram 14Z90Q | |
| 7-Zip 18.03 / 7z b 4 -mmt1 | |
| Asus ROG Flow Z13 GZ301V | |
| Asus ZenBook 14X UX3404VC | |
| Medio Intel Core i9-13900H (3665 - 6600, n=25) | |
| Dell Inspiron 14 Plus 7420 | |
| Media de la clase Subnotebook (2643 - 6699, n=59, últimos 2 años) | |
| Dell XPS 13 Plus 9320 i7-1280P OLED | |
| Lenovo Slim Pro 7 14ARP8 | |
| LG Gram 14Z90Q | |
| Geekbench 5.5 / Multi-Core | |
| Asus ROG Flow Z13 GZ301V | |
| Medio Intel Core i9-13900H (9094 - 15410, n=26) | |
| Asus ZenBook 14X UX3404VC | |
| Dell Inspiron 14 Plus 7420 | |
| Dell XPS 13 Plus 9320 i7-1280P OLED | |
| Media de la clase Subnotebook (2557 - 17218, n=49, últimos 2 años) | |
| Lenovo Slim Pro 7 14ARP8 | |
| Apple MacBook Pro 13 2022 M2 | |
| LG Gram 14Z90Q | |
| Geekbench 5.5 / Single-Core | |
| Asus ROG Flow Z13 GZ301V | |
| Asus ZenBook 14X UX3404VC | |
| Apple MacBook Pro 13 2022 M2 | |
| Media de la clase Subnotebook (726 - 2224, n=49, últimos 2 años) | |
| Medio Intel Core i9-13900H (1140 - 2043, n=26) | |
| Dell XPS 13 Plus 9320 i7-1280P OLED | |
| Dell Inspiron 14 Plus 7420 | |
| LG Gram 14Z90Q | |
| Lenovo Slim Pro 7 14ARP8 | |
| HWBOT x265 Benchmark v2.2 / 4k Preset | |
| Asus ROG Flow Z13 GZ301V | |
| Medio Intel Core i9-13900H (14.1 - 22.3, n=25) | |
| Asus ZenBook 14X UX3404VC | |
| Lenovo Slim Pro 7 14ARP8 | |
| Dell Inspiron 14 Plus 7420 | |
| Dell XPS 13 Plus 9320 i7-1280P OLED | |
| Media de la clase Subnotebook (0.97 - 25.1, n=57, últimos 2 años) | |
| LG Gram 14Z90Q | |
| LibreOffice / 20 Documents To PDF | |
| Lenovo Slim Pro 7 14ARP8 | |
| Media de la clase Subnotebook (39.9 - 220, n=56, últimos 2 años) | |
| LG Gram 14Z90Q | |
| Dell XPS 13 Plus 9320 i7-1280P OLED | |
| Dell Inspiron 14 Plus 7420 | |
| Asus ZenBook 14X UX3404VC | |
| Medio Intel Core i9-13900H (34.4 - 82.8, n=25) | |
| Asus ROG Flow Z13 GZ301V | |
| R Benchmark 2.5 / Overall mean | |
| Lenovo Slim Pro 7 14ARP8 | |
| LG Gram 14Z90Q | |
| Media de la clase Subnotebook (0.4024 - 1.456, n=58, últimos 2 años) | |
| Dell XPS 13 Plus 9320 i7-1280P OLED | |
| Dell Inspiron 14 Plus 7420 | |
| Medio Intel Core i9-13900H (0.4052 - 0.723, n=25) | |
| Asus ZenBook 14X UX3404VC | |
| Asus ROG Flow Z13 GZ301V | |
* ... más pequeño es mejor
AIDA64: FP32 Ray-Trace | FPU Julia | CPU SHA3 | CPU Queen | FPU SinJulia | FPU Mandel | CPU AES | CPU ZLib | FP64 Ray-Trace | CPU PhotoWorxx
| Performance rating | |
| Asus ROG Flow Z13 GZ301V | |
| Medio Intel Core i9-13900H | |
| Lenovo Slim Pro 7 14ARP8 | |
| Asus ZenBook 14X UX3404VC | |
| Dell Inspiron 14 Plus 7420 | |
| Media de la clase Subnotebook | |
| Dell XPS 13 Plus 9320 i7-1280P OLED | |
| LG Gram 14Z90Q | |
| AIDA64 / FP32 Ray-Trace | |
| Asus ROG Flow Z13 GZ301V | |
| Lenovo Slim Pro 7 14ARP8 | |
| Medio Intel Core i9-13900H (6788 - 19557, n=25) | |
| Asus ZenBook 14X UX3404VC | |
| Media de la clase Subnotebook (1135 - 32888, n=58, últimos 2 años) | |
| Dell Inspiron 14 Plus 7420 | |
| Dell XPS 13 Plus 9320 i7-1280P OLED | |
| LG Gram 14Z90Q | |
| AIDA64 / FPU Julia | |
| Lenovo Slim Pro 7 14ARP8 | |
| Asus ROG Flow Z13 GZ301V | |
| Medio Intel Core i9-13900H (22551 - 95579, n=25) | |
| Asus ZenBook 14X UX3404VC | |
| Media de la clase Subnotebook (5218 - 123315, n=58, últimos 2 años) | |
| Dell Inspiron 14 Plus 7420 | |
| Dell XPS 13 Plus 9320 i7-1280P OLED | |
| LG Gram 14Z90Q | |
| AIDA64 / CPU SHA3 | |
| Medio Intel Core i9-13900H (2491 - 4270, n=25) | |
| Asus ROG Flow Z13 GZ301V | |
| Asus ZenBook 14X UX3404VC | |
| Lenovo Slim Pro 7 14ARP8 | |
| Media de la clase Subnotebook (444 - 5287, n=58, últimos 2 años) | |
| Dell Inspiron 14 Plus 7420 | |
| Dell XPS 13 Plus 9320 i7-1280P OLED | |
| LG Gram 14Z90Q | |
| AIDA64 / CPU Queen | |
| Asus ROG Flow Z13 GZ301V | |
| Asus ZenBook 14X UX3404VC | |
| Medio Intel Core i9-13900H (65121 - 120936, n=25) | |
| Dell Inspiron 14 Plus 7420 | |
| Dell XPS 13 Plus 9320 i7-1280P OLED | |
| Lenovo Slim Pro 7 14ARP8 | |
| LG Gram 14Z90Q | |
| Media de la clase Subnotebook (10579 - 95002, n=48, últimos 2 años) | |
| AIDA64 / FPU SinJulia | |
| Lenovo Slim Pro 7 14ARP8 | |
| Asus ROG Flow Z13 GZ301V | |
| Medio Intel Core i9-13900H (6108 - 11631, n=25) | |
| Asus ZenBook 14X UX3404VC | |
| Dell Inspiron 14 Plus 7420 | |
| Dell XPS 13 Plus 9320 i7-1280P OLED | |
| Media de la clase Subnotebook (744 - 18418, n=58, últimos 2 años) | |
| LG Gram 14Z90Q | |
| AIDA64 / FPU Mandel | |
| Lenovo Slim Pro 7 14ARP8 | |
| Asus ROG Flow Z13 GZ301V | |
| Medio Intel Core i9-13900H (11283 - 48474, n=25) | |
| Asus ZenBook 14X UX3404VC | |
| Media de la clase Subnotebook (3341 - 65433, n=58, últimos 2 años) | |
| Dell Inspiron 14 Plus 7420 | |
| Dell XPS 13 Plus 9320 i7-1280P OLED | |
| LG Gram 14Z90Q | |
| AIDA64 / CPU AES | |
| Medio Intel Core i9-13900H (3691 - 149377, n=25) | |
| Asus ROG Flow Z13 GZ301V | |
| Asus ZenBook 14X UX3404VC | |
| Dell Inspiron 14 Plus 7420 | |
| Dell XPS 13 Plus 9320 i7-1280P OLED | |
| Media de la clase Subnotebook (638 - 96917, n=58, últimos 2 años) | |
| Lenovo Slim Pro 7 14ARP8 | |
| LG Gram 14Z90Q | |
| AIDA64 / CPU ZLib | |
| Asus ROG Flow Z13 GZ301V | |
| Medio Intel Core i9-13900H (789 - 1254, n=25) | |
| Asus ZenBook 14X UX3404VC | |
| Dell Inspiron 14 Plus 7420 | |
| Lenovo Slim Pro 7 14ARP8 | |
| Media de la clase Subnotebook (164.9 - 1379, n=58, últimos 2 años) | |
| Dell XPS 13 Plus 9320 i7-1280P OLED | |
| LG Gram 14Z90Q | |
| AIDA64 / FP64 Ray-Trace | |
| Asus ROG Flow Z13 GZ301V | |
| Medio Intel Core i9-13900H (3655 - 10716, n=25) | |
| Lenovo Slim Pro 7 14ARP8 | |
| Asus ZenBook 14X UX3404VC | |
| Media de la clase Subnotebook (610 - 17495, n=58, últimos 2 años) | |
| Dell Inspiron 14 Plus 7420 | |
| Dell XPS 13 Plus 9320 i7-1280P OLED | |
| LG Gram 14Z90Q | |
| AIDA64 / CPU PhotoWorxx | |
| Media de la clase Subnotebook (6569 - 85600, n=58, últimos 2 años) | |
| Dell XPS 13 Plus 9320 i7-1280P OLED | |
| Asus ROG Flow Z13 GZ301V | |
| Asus ZenBook 14X UX3404VC | |
| Medio Intel Core i9-13900H (10871 - 50488, n=25) | |
| Dell Inspiron 14 Plus 7420 | |
| Lenovo Slim Pro 7 14ARP8 | |
| LG Gram 14Z90Q | |
Rendimiento del sistema
Nuestra impresión subjetiva del rendimiento del ZenBook 14X es muy buena y no registramos limitaciones ni lags notables en nuestras pruebas. Los resultados en las pruebas sintéticas están en la media, pero comparado con la variante AMD del ZenBook del año pasado, aquí se logra un resultado mucho mejor.
CrossMark: Overall | Productivity | Creativity | Responsiveness
| PCMark 10 / Score | |
| Asus ROG Flow Z13 GZ301V | |
| Media de la clase Subnotebook (4920 - 9939, n=46, últimos 2 años) | |
| Dell Inspiron 14 Plus 7420 | |
| Lenovo Slim Pro 7 14ARP8 | |
| Asus ZenBook 14X UX3404VC | |
| Medio Intel Core i9-13900H, Intel Iris Xe Graphics G7 96EUs (5944 - 6802, n=8) | |
| Dell XPS 13 Plus 9320 i7-1280P OLED | |
| LG Gram 14Z90Q | |
| PCMark 10 / Essentials | |
| Asus ROG Flow Z13 GZ301V | |
| Medio Intel Core i9-13900H, Intel Iris Xe Graphics G7 96EUs (10347 - 12286, n=8) | |
| Asus ZenBook 14X UX3404VC | |
| Dell XPS 13 Plus 9320 i7-1280P OLED | |
| Media de la clase Subnotebook (8552 - 11646, n=46, últimos 2 años) | |
| Dell Inspiron 14 Plus 7420 | |
| Lenovo Slim Pro 7 14ARP8 | |
| LG Gram 14Z90Q | |
| PCMark 10 / Productivity | |
| Asus ROG Flow Z13 GZ301V | |
| Media de la clase Subnotebook (5435 - 16606, n=46, últimos 2 años) | |
| Dell Inspiron 14 Plus 7420 | |
| Lenovo Slim Pro 7 14ARP8 | |
| Asus ZenBook 14X UX3404VC | |
| Medio Intel Core i9-13900H, Intel Iris Xe Graphics G7 96EUs (7319 - 8526, n=8) | |
| Dell XPS 13 Plus 9320 i7-1280P OLED | |
| LG Gram 14Z90Q | |
| PCMark 10 / Digital Content Creation | |
| Asus ROG Flow Z13 GZ301V | |
| Media de la clase Subnotebook (5722 - 13779, n=46, últimos 2 años) | |
| Lenovo Slim Pro 7 14ARP8 | |
| Dell Inspiron 14 Plus 7420 | |
| Medio Intel Core i9-13900H, Intel Iris Xe Graphics G7 96EUs (7527 - 8155, n=8) | |
| Asus ZenBook 14X UX3404VC | |
| Dell XPS 13 Plus 9320 i7-1280P OLED | |
| LG Gram 14Z90Q | |
| CrossMark / Overall | |
| Asus ROG Flow Z13 GZ301V | |
| Medio Intel Core i9-13900H, Intel Iris Xe Graphics G7 96EUs (1766 - 2146, n=7) | |
| Asus ZenBook 14X UX3404VC | |
| Dell XPS 13 Plus 9320 i7-1280P OLED | |
| Dell Inspiron 14 Plus 7420 | |
| Media de la clase Subnotebook (365 - 2356, n=60, últimos 2 años) | |
| Apple MacBook Pro 13 2022 M2 | |
| Lenovo Slim Pro 7 14ARP8 | |
| CrossMark / Productivity | |
| Asus ROG Flow Z13 GZ301V | |
| Medio Intel Core i9-13900H, Intel Iris Xe Graphics G7 96EUs (1684 - 2064, n=7) | |
| Asus ZenBook 14X UX3404VC | |
| Dell XPS 13 Plus 9320 i7-1280P OLED | |
| Dell Inspiron 14 Plus 7420 | |
| Media de la clase Subnotebook (364 - 2277, n=60, últimos 2 años) | |
| Apple MacBook Pro 13 2022 M2 | |
| Lenovo Slim Pro 7 14ARP8 | |
| CrossMark / Creativity | |
| Asus ROG Flow Z13 GZ301V | |
| Asus ZenBook 14X UX3404VC | |
| Medio Intel Core i9-13900H, Intel Iris Xe Graphics G7 96EUs (1789 - 2224, n=7) | |
| Dell XPS 13 Plus 9320 i7-1280P OLED | |
| Dell Inspiron 14 Plus 7420 | |
| Media de la clase Subnotebook (372 - 2743, n=60, últimos 2 años) | |
| Apple MacBook Pro 13 2022 M2 | |
| Lenovo Slim Pro 7 14ARP8 | |
| CrossMark / Responsiveness | |
| Medio Intel Core i9-13900H, Intel Iris Xe Graphics G7 96EUs (1474 - 2171, n=7) | |
| Asus ROG Flow Z13 GZ301V | |
| Asus ZenBook 14X UX3404VC | |
| Dell XPS 13 Plus 9320 i7-1280P OLED | |
| Dell Inspiron 14 Plus 7420 | |
| Media de la clase Subnotebook (312 - 1854, n=60, últimos 2 años) | |
| Lenovo Slim Pro 7 14ARP8 | |
| Apple MacBook Pro 13 2022 M2 | |
| PCMark 10 Score | 6330 puntos | |
ayuda | ||
| AIDA64 / Memory Copy | |
| Media de la clase Subnotebook (14554 - 131023, n=58, últimos 2 años) | |
| Asus ZenBook 14X UX3404VC | |
| Medio Intel Core i9-13900H (37448 - 74486, n=25) | |
| AIDA64 / Memory Read | |
| Media de la clase Subnotebook (15948 - 127174, n=58, últimos 2 años) | |
| Medio Intel Core i9-13900H (41599 - 75433, n=25) | |
| Asus ZenBook 14X UX3404VC | |
| AIDA64 / Memory Write | |
| Media de la clase Subnotebook (15709 - 135141, n=58, últimos 2 años) | |
| Asus ZenBook 14X UX3404VC | |
| Medio Intel Core i9-13900H (36152 - 88505, n=25) | |
| AIDA64 / Memory Latency | |
| Media de la clase Subnotebook (6.1 - 159.9, n=56, últimos 2 años) | |
| Asus ZenBook 14X UX3404VC | |
| Medio Intel Core i9-13900H (75.8 - 102.3, n=25) | |
* ... más pequeño es mejor
Latencia del CPD
Nuestra prueba de latencia estandarizada (navegación web, reproducción 4K de YouTube, carga de la CPU) reveló anomalías. Por tanto, el sistema no es adecuado para la edición de vídeo y audio en tiempo real sin limitaciones. Esto puede cambiar con las próximas versiones de BIOS y drivers de dispositivo.

| DPC Latencies / LatencyMon - interrupt to process latency (max), Web, Youtube, Prime95 | |
| Asus ROG Flow Z13 GZ301V | |
| Asus ZenBook 14X UX3404VC | |
| Lenovo Slim Pro 7 14ARP8 | |
| LG Gram 14Z90Q | |
| Dell Inspiron 14 Plus 7420 | |
| Dell XPS 13 Plus 9320 i7-1280P OLED | |
* ... más pequeño es mejor
Dispositivos de almacenamiento
Asus instala un SSD Micron 2450 PCIe 4.0 con una capacidad de almacenamiento de 1 TB en el ZenBook 14X. hay 862 GB disponibles cuando se enciende por primera vez. El SSD rinde bien en comparación con la media de subportátiles, pero nuestra tabla de pruebas muestra claras desventajas comparado con dispositivos comparables.

* ... más pequeño es mejor
Sustained Read Performance: DiskSpd Read Loop, Queue Depth 8
Tarjeta gráfica
El Asus ZenBook 14X usa la conocida gráfica integrada Iris XE Graphics G7 de Intel en la versión más rápida con 96 EUs y una velocidad máxima de reloj de 1,300 MHz. La iGPU basta fácilmente para las tareas diarias, pero hay que hacer claros sacrificios para servicios más exigentes como los juegos. El predecesor basado en AMD rinde mejor aquí gracias a la AMD Radeon RX Vega 8.
Merece la pena notar, empero, que la iGPU del nuevo Asus ZenBook 14X rinde un sólido 14% mejor que la media Intel Iris Xe Graphics G7.
| 3DMark Cloud Gate Standard Score | 22427 puntos | |
| 3DMark Fire Strike Score | 5160 puntos | |
ayuda | ||
| Blender - v3.3 Classroom CPU | |
| Medio Intel Iris Xe Graphics G7 96EUs (336 - 1259, n=109) | |
| Media de la clase Subnotebook (241 - 861, n=60, últimos 2 años) | |
| Asus ZenBook 14X UX3404VC | |
* ... más pequeño es mejor
Rendimiento en juegos
Como ya se ha mencionado, el rendimiento de la iGPU de Intel en juegos sigue siendo mediocre. AMD lleva claramente la delantera con laRadeon 680M y la 780Mlos juegos más antiguos son jugables a resoluciones más bajas y configuraciones gráficas más bajas, pero el potencial de la pantalla de 120 Hz del Asus ZenBook 14X no se agota aquí. Si quieres más rendimiento, puedes equipar el ZenBook con una tarjeta dedicada Nvidia GeForce RTX 3050, que hace jugables la mayoría de juegos, al menos con ajustes gráficos bajos.
| The Witcher 3 - 1920x1080 Ultra Graphics & Postprocessing (HBAO+) | |
| Asus ROG Flow Z13 GZ301V | |
| Lenovo Slim Pro 7 14ARP8 | |
| Dell Inspiron 14 Plus 7420 | |
| Media de la clase Subnotebook (13.9 - 34.6, n=12, últimos 2 años) | |
| Asus ZenBook 14X UX3404VC | |
| Dell XPS 13 Plus 9320 i7-1280P OLED | |
| LG Gram 14Z90Q | |
| GTA V - 1920x1080 Highest AA:4xMSAA + FX AF:16x | |
| Asus ROG Flow Z13 GZ301V | |
| Lenovo Slim Pro 7 14ARP8 | |
| Dell Inspiron 14 Plus 7420 | |
| Media de la clase Subnotebook (10.7 - 43.7, n=56, últimos 2 años) | |
| Dell XPS 13 Plus 9320 i7-1280P OLED | |
| Asus ZenBook 14X UX3404VC | |
| Final Fantasy XV Benchmark - 1920x1080 High Quality | |
| Asus ROG Flow Z13 GZ301V | |
| Lenovo Slim Pro 7 14ARP8 | |
| Dell Inspiron 14 Plus 7420 | |
| Media de la clase Subnotebook (11.6 - 54.5, n=54, últimos 2 años) | |
| Dell XPS 13 Plus 9320 i7-1280P OLED | |
| LG Gram 14Z90Q | |
| Strange Brigade - 1920x1080 ultra AA:ultra AF:16 | |
| Asus ROG Flow Z13 GZ301V | |
| Dell Inspiron 14 Plus 7420 | |
| Media de la clase Subnotebook (19 - 101.3, n=50, últimos 2 años) | |
| Dell XPS 13 Plus 9320 i7-1280P OLED | |
| Asus ZenBook 14X UX3404VC | |
| Asus ZenBook 14X UX3404VC | |
| Dota 2 Reborn - 1920x1080 ultra (3/3) best looking | |
| Asus ROG Flow Z13 GZ301V | |
| Dell Inspiron 14 Plus 7420 | |
| Lenovo Slim Pro 7 14ARP8 | |
| Media de la clase Subnotebook (13 - 97, n=61, últimos 2 años) | |
| Asus ZenBook 14X UX3404VC | |
| Dell XPS 13 Plus 9320 i7-1280P OLED | |
| LG Gram 14Z90Q | |
La iGPU del ZenBook 14X funciona de forma estable en la prueba Witcher. Ejecutando Witcher 3 (en bucle) con ajustes Ultra y resolución FHD resultó en una media de 17 fps.
Witcher 3 FPS chart
| bajo | medio | alto | ultra | QHD | |
|---|---|---|---|---|---|
| GTA V (2015) | 116.7 | 103.9 | 25.2 | 10.6 | 6.79 |
| The Witcher 3 (2015) | 87 | 59 | 33 | 17 | |
| Dota 2 Reborn (2015) | 126.5 | 94.1 | 74.9 | 68.3 | |
| X-Plane 11.11 (2018) | 50.8 | 41.8 | 34.5 | ||
| Far Cry 5 (2018) | 55 | 30 | 28 | 26 | 17 |
| Strange Brigade (2018) | 99.7 | 42.5 | 34 | 27.2 | 19.6 |
| F1 22 (2022) | 52.8 | 48.7 | 34.1 | 26.1 | 18.7 |
Emisiones
Ruido: discretamente silencioso
Con un máximo de 45,5 dB(A), el ZenBook 14X es definitivamente uno de los subportátiles más silenciosos del mercado. Los ventiladores apenas se oyen en el uso diario y el dispositivo se mantiene por debajo de los 40 dB(A) de media, incluso bajo carga. Sin embargo, como sólo hay un ventilador instalado (comparado con el modelo del año pasado), el sistema de refrigeración es algo más débil, lo que limita el Intel Core i9-13900H. En modo Rendimiento , el ventilador también gira con más frecuencia durante las tareas ofimáticas normales y tampoco permanece nunca completamente silencioso en modo Estándar
Por otro lado, el modo Silencioso puede activarse para una pequeña caída en el rendimiento, por lo que el subportátil es apenas audible.
Ruido
| Ocioso |
| 25.2 / 25.2 / 26.5 dB(A) |
| Carga |
| 39.8 / 45.5 dB(A) |
 | ||
30 dB silencioso 40 dB(A) audible 50 dB(A) ruidosamente alto |
||
min: | ||
| Asus ZenBook 14X UX3404VC Iris Xe G7 96EUs, i9-13900H, Micron 2450 1TB MTFDKBA1T0TFK | Apple MacBook Pro 13 2022 M2 M2 10-Core GPU, M2, Apple SSD AP1024Z | Dell XPS 13 Plus 9320 i7-1280P OLED Iris Xe G7 96EUs, i7-1280P, WDC PC SN810 512GB | Lenovo Slim Pro 7 14ARP8 GeForce RTX 3050 6GB Laptop GPU, R7 7735HS, SK hynix PC801 HFS512GEJ9X115N | LG Gram 14Z90Q Iris Xe G7 80EUs, i5-1240P, Samsung PM9A1 MZVL2512HCJQ | Dell Inspiron 14 Plus 7420 GeForce RTX 3050 4GB Laptop GPU, i7-12700H, SK Hynix BC711 512GB HFM512GD3GX013N | Asus ROG Flow Z13 GZ301V GeForce RTX 4060 Laptop GPU, i9-13900H, WD PC SN740 SDDPTQD-1T00 | |
|---|---|---|---|---|---|---|---|
| Noise | 10% | 10% | 5% | 3% | 1% | 5% | |
| apagado / medio ambiente * (dB) | 25.2 | 23.9 5% | 23.4 7% | 22.7 10% | 25 1% | 23.2 8% | 24 5% |
| Idle Minimum * (dB) | 25.2 | 23.9 5% | 23.4 7% | 22.8 10% | 26 -3% | 23.2 8% | 24 5% |
| Idle Average * (dB) | 25.2 | 23.9 5% | 23.4 7% | 22.8 10% | 27 -7% | 23.2 8% | 24 5% |
| Idle Maximum * (dB) | 26.5 | 23.9 10% | 23.4 12% | 22.8 14% | 28 -6% | 23.2 12% | 24 9% |
| Load Average * (dB) | 39.8 | 23.9 40% | 35 12% | 43.8 -10% | 35 12% | 47.5 -19% | 38.61 3% |
| Load Maximum * (dB) | 45.5 | 49 -8% | 39.9 12% | 47.1 -4% | 36 21% | 51.7 -14% | 43.59 4% |
| Witcher 3 ultra * (dB) | 34.6 | 41.6 | 43.8 | 36 | 51.7 | 41.24 |
* ... más pequeño es mejor
Temperatura
En el uso diario (oficina, internet), las temperaturas se mantienen dentro de un rango discreto y sólo la zona central por encima del teclado se calienta un poco bajo carga. El único ventilador extrae aire de la parte inferior y expulsa el calor residual por el lado izquierdo y la parte trasera. En consecuencia, el reposamanos siempre se mantiene fresco, mientras que el teclado ronda los 31 °C, lo que no resultó molesto.
(+) La temperatura máxima en la parte superior es de 38.9 °C / 102 F, frente a la media de 35.9 °C / 97 F, que oscila entre 21.4 y 59 °C para la clase Subnotebook.
(±) El fondo se calienta hasta un máximo de 43.4 °C / 110 F, frente a la media de 39.2 °C / 103 F
(+) En reposo, la temperatura media de la parte superior es de 31.1 °C / 88# F, frente a la media del dispositivo de 30.8 °C / 87 F.
(±) Jugando a The Witcher 3, la temperatura media de la parte superior es de 32.7 °C / 91 F, frente a la media del dispositivo de 30.8 °C / 87 F.
(+) Los reposamanos y el panel táctil alcanzan como máximo la temperatura de la piel (33.9 °C / 93 F) y, por tanto, no están calientes.
(-) La temperatura media de la zona del reposamanos de dispositivos similares fue de 28.2 °C / 82.8 F (-5.7 °C / -10.2 F).
| Asus ZenBook 14X UX3404VC Intel Core i9-13900H, Intel Iris Xe Graphics G7 96EUs | Apple MacBook Pro 13 2022 M2 Apple M2, Apple M2 10-Core GPU | Lenovo Slim Pro 7 14ARP8 AMD Ryzen 7 7735HS, NVIDIA GeForce RTX 3050 6GB Laptop GPU | LG Gram 14Z90Q Intel Core i5-1240P, Intel Iris Xe Graphics G7 80EUs | Dell Inspiron 14 Plus 7420 Intel Core i7-12700H, NVIDIA GeForce RTX 3050 4GB Laptop GPU | Asus ROG Flow Z13 GZ301V Intel Core i9-13900H, NVIDIA GeForce RTX 4060 Laptop GPU | |
|---|---|---|---|---|---|---|
| Heat | 10% | 9% | 6% | 12% | 5% | |
| Maximum Upper Side * (°C) | 38.9 | 45.1 -16% | 42.2 -8% | 43 -11% | 40 -3% | 42 -8% |
| Maximum Bottom * (°C) | 43.4 | 43 1% | 49 -13% | 45 -4% | 36.4 16% | 47 -8% |
| Idle Upper Side * (°C) | 33.5 | 25.2 25% | 24.4 27% | 27 19% | 27 19% | 27 19% |
| Idle Bottom * (°C) | 35.3 | 25.4 28% | 25.2 29% | 28 21% | 29.2 17% | 30 15% |
* ... más pequeño es mejor
Prueba de esfuerzo - Frecuencia de reloj demasiado baja
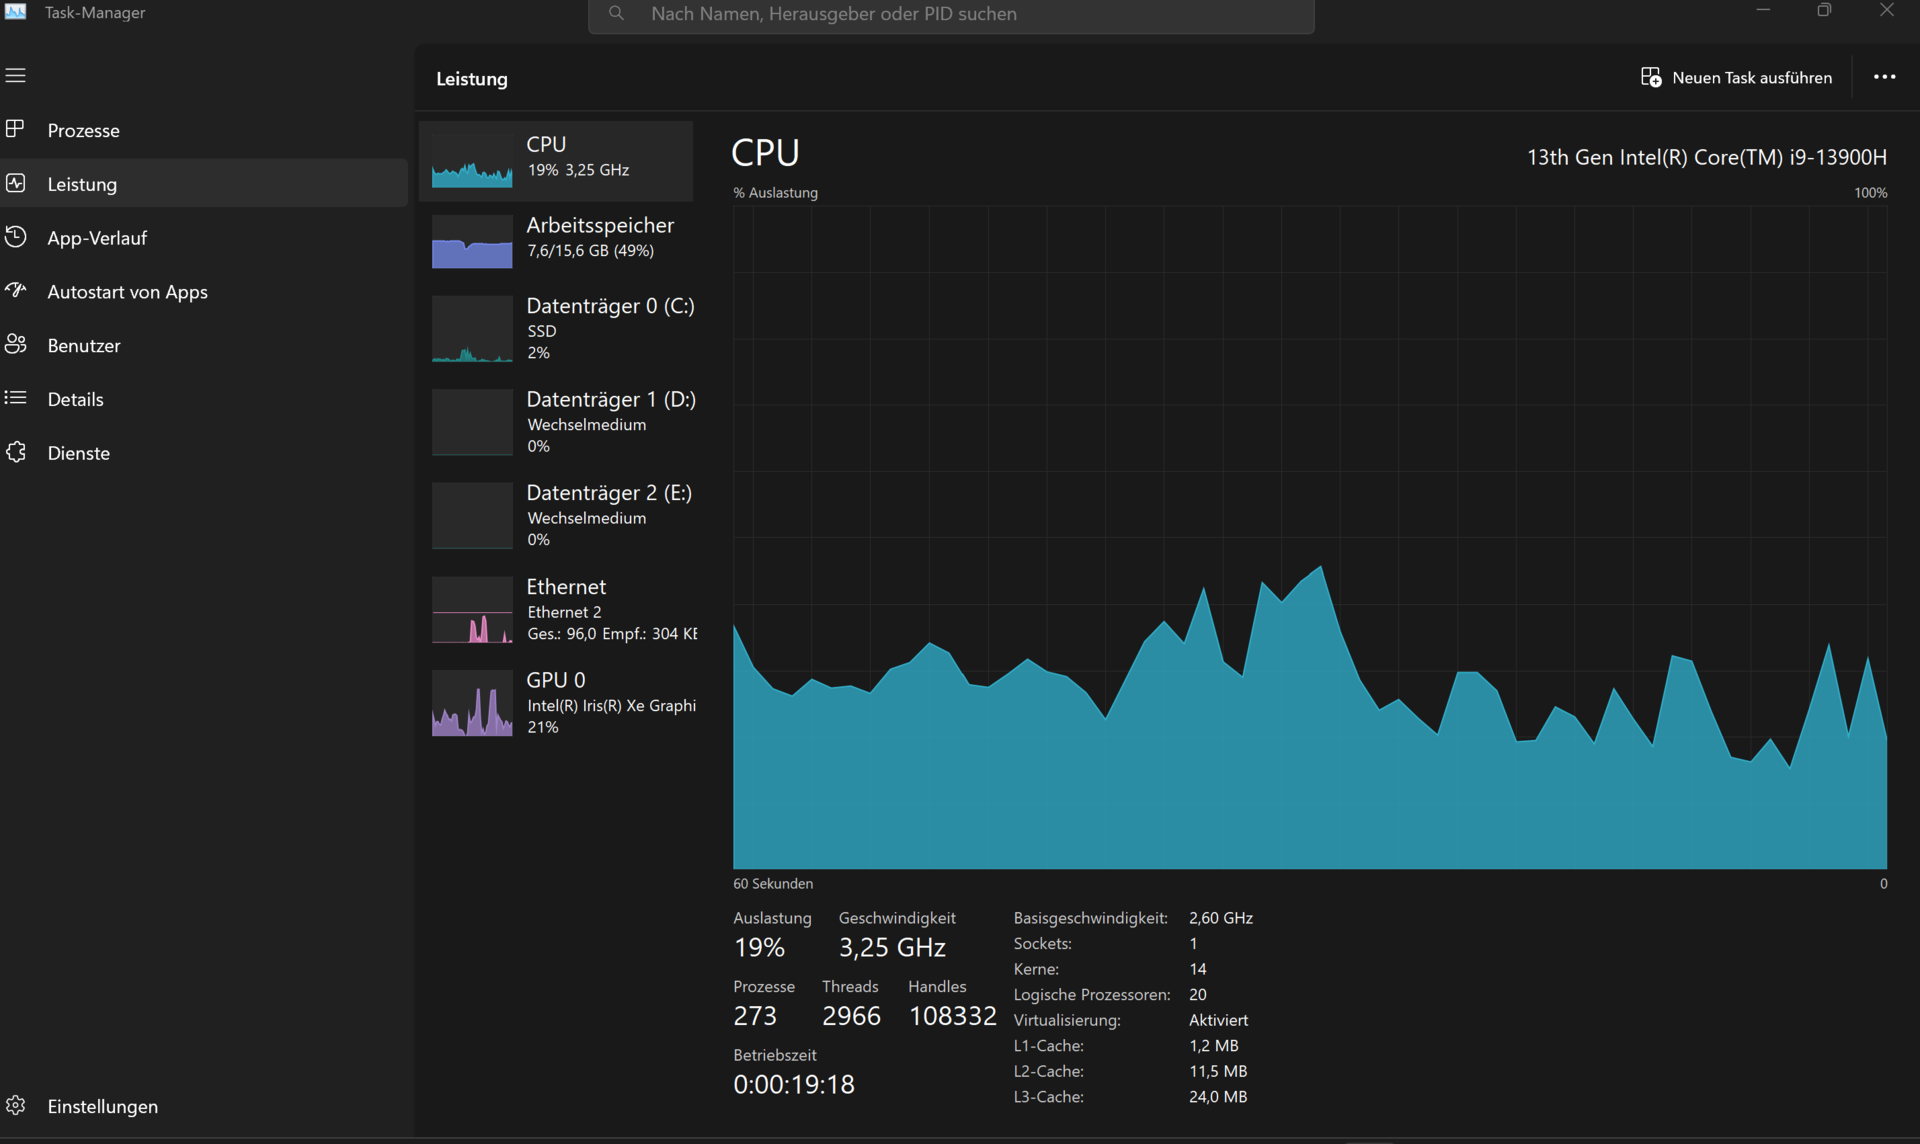
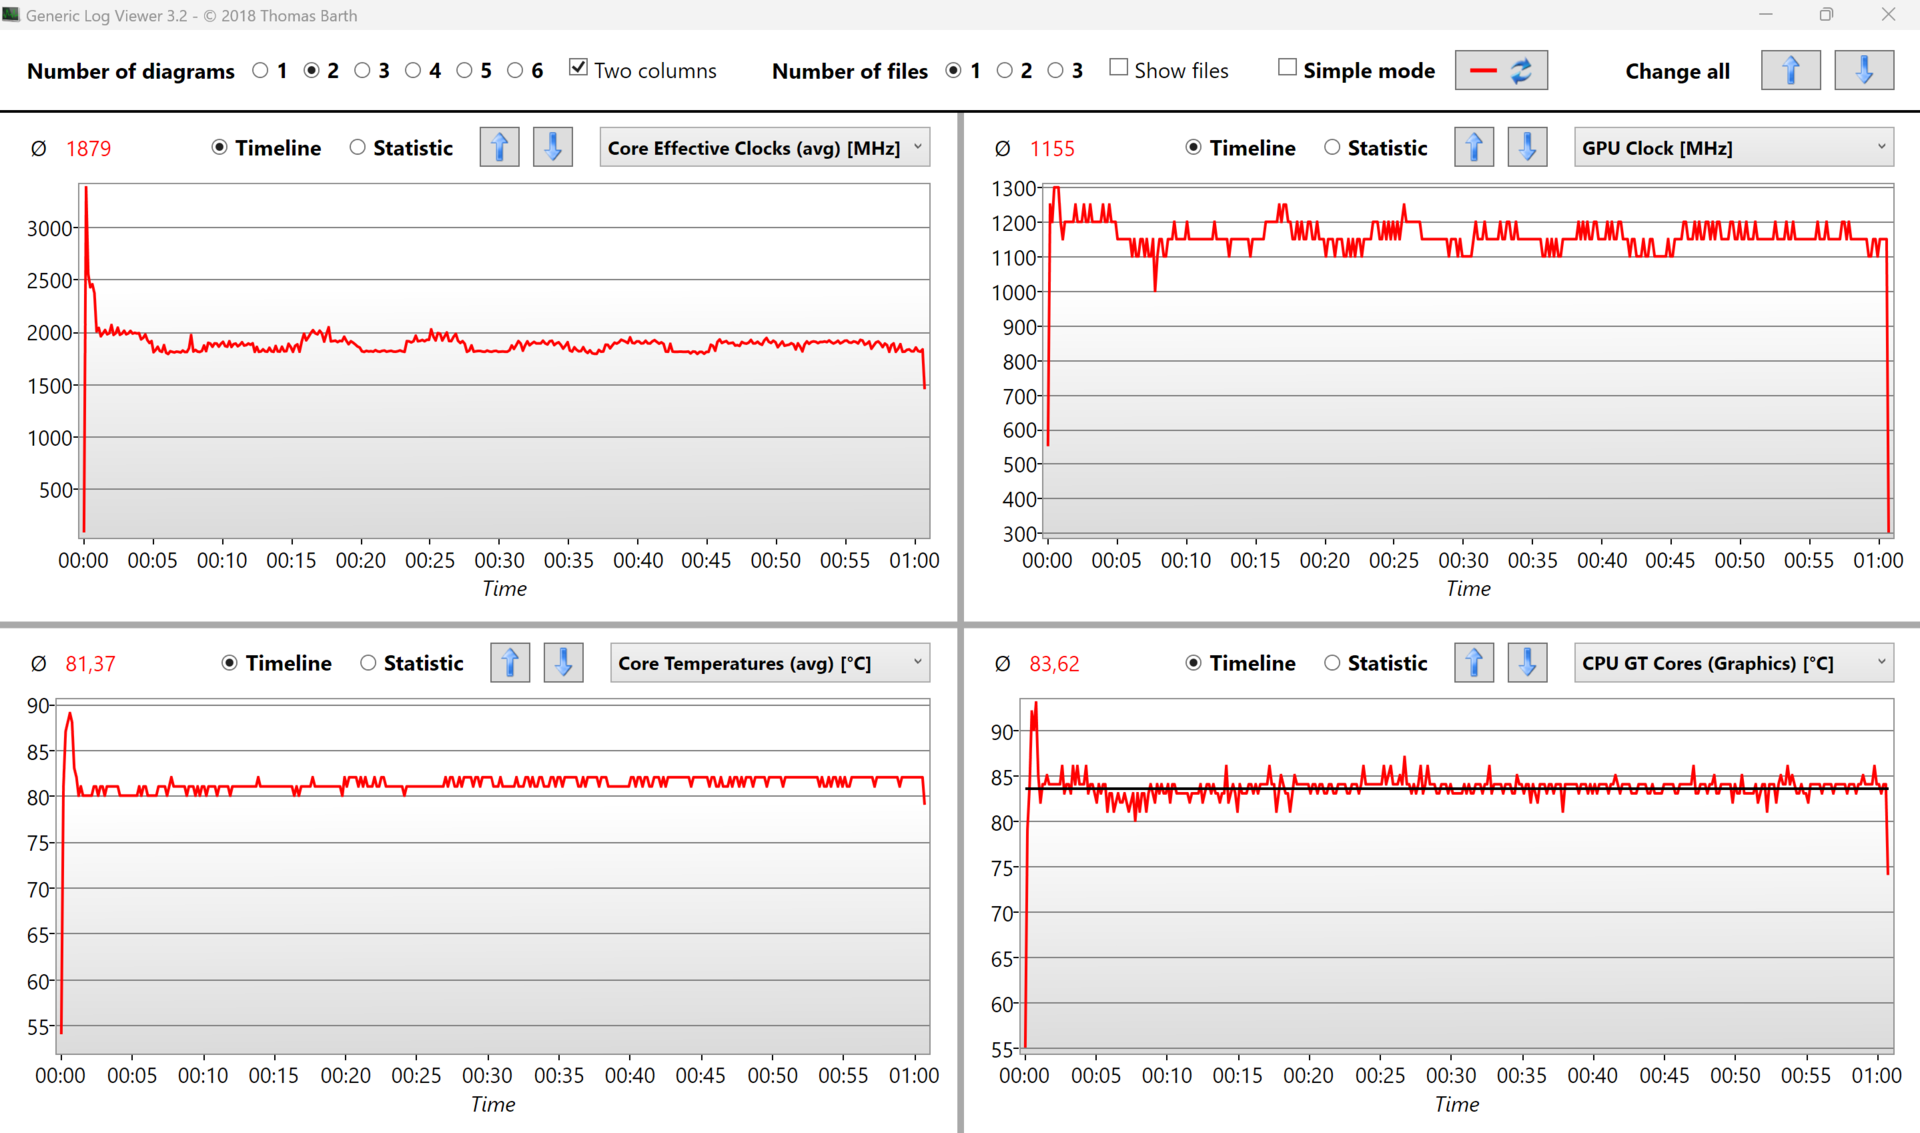
Al principio de la prueba de estrés (Prime95 y Furmark), la CPU funciona brevemente a 3,5 GHz y la iGPU a 1,3 GHz. Sin embargo, las frecuencias de reloj descienden inmediatamente después, de modo que la CPU se sitúa en 1,9 GHz y la iGPU en 1,2 GHz. La prueba de estrés representa un escenario extremo en el que comprobamos si el sistema puede mantenerse estable a plena carga.
Altavoces
Para ser un portátil Windows, los altavoces rinden bien: los graves y los bajos son incluso perceptibles. Los altavoces están situados bajo el reposamanos y disparan hacia abajo, utilizando la superficie como reflector. Si el portátil se coloca sobre tela o una alfombrilla de ratón, por ejemplo, la calidad del sonido se deteriora notablemente.
El micrófono de doble array funciona bien y graba las voces sin ruido, por lo que la calidad es suficiente para videollamadas y conferencias. El ruido de escritura del teclado es audible durante las grabaciones de audio, pero no resulta molesto.
Asus ZenBook 14X UX3404VC análisis de audio
(+) | los altavoces pueden reproducir a un volumen relativamente alto (#86.4 dB)
Graves 100 - 315 Hz
(-) | casi sin bajos - de media 16.3% inferior a la mediana
(-) | los graves no son lineales (15.8% delta a la frecuencia anterior)
Medios 400 - 2000 Hz
(+) | medios equilibrados - a sólo 1.2% de la mediana
(+) | los medios son lineales (3.1% delta a la frecuencia anterior)
Altos 2 - 16 kHz
(+) | máximos equilibrados - a sólo 4.1% de la mediana
(+) | los máximos son lineales (3.4% delta a la frecuencia anterior)
Total 100 - 16.000 Hz
(+) | el sonido global es lineal (11.3% de diferencia con la mediana)
En comparación con la misma clase
» 12% de todos los dispositivos probados de esta clase eran mejores, 2% similares, 86% peores
» El mejor tuvo un delta de 5%, la media fue 18%, el peor fue ###max##%
En comparación con todos los dispositivos probados
» 7% de todos los dispositivos probados eran mejores, 2% similares, 91% peores
» El mejor tuvo un delta de 4%, la media fue 23%, el peor fue ###max##%
Apple MacBook Pro 16 2021 M1 Pro análisis de audio
(+) | los altavoces pueden reproducir a un volumen relativamente alto (#84.7 dB)
Graves 100 - 315 Hz
(+) | buen bajo - sólo 3.8% lejos de la mediana
(+) | el bajo es lineal (5.2% delta a la frecuencia anterior)
Medios 400 - 2000 Hz
(+) | medios equilibrados - a sólo 1.3% de la mediana
(+) | los medios son lineales (2.1% delta a la frecuencia anterior)
Altos 2 - 16 kHz
(+) | máximos equilibrados - a sólo 1.9% de la mediana
(+) | los máximos son lineales (2.7% delta a la frecuencia anterior)
Total 100 - 16.000 Hz
(+) | el sonido global es lineal (4.6% de diferencia con la mediana)
En comparación con la misma clase
» 0% de todos los dispositivos probados de esta clase eran mejores, 0% similares, 100% peores
» El mejor tuvo un delta de 5%, la media fue 17%, el peor fue ###max##%
En comparación con todos los dispositivos probados
» 0% de todos los dispositivos probados eran mejores, 0% similares, 100% peores
» El mejor tuvo un delta de 4%, la media fue 23%, el peor fue ###max##%
Gestión de la energía
Consumo de energía
En reposo, el nuevo modelo es tan económico como el predecesor de AMD; el consumo máximo en reposo es de algo menos de 12 vatios. Esto entra dentro de los límites de los modelos con pantalla OLED, pero el consumo de vatios aumenta en presencia de contenidos de imagen más brillantes.
Bajo carga máxima de juego con Witcher 3 Ultra, medimos algo menos de 43 vatios, 6 vatios menos que el comparable Dell XPS 13 Plus 9320 OLED con la misma iGPU. Sin embargo, el test de estrés de Prime95 y Furmark muestra que la fuente de alimentación de 90w está demasiado ajustada, ya que medimos brevemente 95w al principio. Aún así, esta fase no dura mucho y el consumo de energía se estabiliza en 65 vatios y luego en 45 vatios, por lo que la fuente de alimentación más débil no debería ser demasiado problema. No obstante, la fuente de alimentación de 100 vatios del modelo anterior habría sido la mejor opción en este caso.
| Off / Standby | |
| Ocioso | |
| Carga |
|
Clave:
min: | |
| Asus ZenBook 14X UX3404VC i9-13900H, Iris Xe G7 96EUs, Micron 2450 1TB MTFDKBA1T0TFK, OLED, 2880x1800, 14.5" | Apple MacBook Pro 13 2022 M2 M2, M2 10-Core GPU, Apple SSD AP1024Z, IPS, 2560x1600, 13.3" | Lenovo Slim Pro 7 14ARP8 R7 7735HS, GeForce RTX 3050 6GB Laptop GPU, SK hynix PC801 HFS512GEJ9X115N, IPS, 2560x1600, 14.5" | Asus ROG Flow Z13 GZ301V i9-13900H, GeForce RTX 4060 Laptop GPU, WD PC SN740 SDDPTQD-1T00, IPS, 2560x1600, 13.4" | Dell XPS 13 Plus 9320 i7-1280P OLED i7-1280P, Iris Xe G7 96EUs, WDC PC SN810 512GB, OLED, 3456x2160, 13.4" | Dell Inspiron 14 Plus 7420 i7-12700H, GeForce RTX 3050 4GB Laptop GPU, SK Hynix BC711 512GB HFM512GD3GX013N, IPS, 2240x1400, 14" | LG Gram 14Z90Q i5-1240P, Iris Xe G7 80EUs, Samsung PM9A1 MZVL2512HCJQ, IPS, 1920x1200, 14" | Medio Intel Iris Xe Graphics G7 96EUs | Media de la clase Subnotebook | |
|---|---|---|---|---|---|---|---|---|---|
| Power Consumption | 33% | -56% | -65% | -7% | -72% | 20% | 3% | 23% | |
| Idle Minimum * (Watt) | 6 | 1.77 70% | 7.6 -27% | 8.5 -42% | 6.5 -8% | 6.3 -5% | 3 50% | 5.51 ? 8% | 3.71 ? 38% |
| Idle Average * (Watt) | 7 | 6.7 4% | 12.2 -74% | 12.4 -77% | 7.8 -11% | 10.3 -47% | 6 14% | 8.66 ? -24% | 6.54 ? 7% |
| Idle Maximum * (Watt) | 11.8 | 6.9 42% | 12.8 -8% | 13.3 -13% | 13 -10% | 20 -69% | 12 -2% | 10.9 ? 8% | 7.89 ? 33% |
| Load Average * (Watt) | 44 | 30.9 30% | 76.5 -74% | 93 -111% | 56.6 -29% | 106.2 -141% | 40 9% | 45.6 ? -4% | 42.1 ? 4% |
| Witcher 3 ultra * (Watt) | 42.6 | 38.9 9% | 89.5 -110% | 87.8 -106% | 49.2 -15% | 96.1 -126% | 36.5 14% | ||
| Load Maximum * (Watt) | 95 | 56 41% | 135.7 -43% | 135 -42% | 63 34% | 136.5 -44% | 63 34% | 67.8 ? 29% | 65.1 ? 31% |
* ... más pequeño es mejor
Power consumption Witcher 3 / Stress test
Power consumption with an external monitor
Akkulaufzeit
La duración de batería del Asus ZenBook 14X es realmente fuerte, considerando el procesador Intel Core i9 de gama alta. En nuestro test WLAN, el 14 pulgadas logró una duración de exactamente 10 horas. Este test usa un script para medir la carga al acceder a webs
El Apple MacBook Pro 13 2022 M2, el Lenovo Slim Pro 7 14ARP8 y el LG Gram 14Z90Q rinden mejor en nuestra tabla de pruebas, pero no tienen pantallas OLED. Comparado con el Dell XPS 13 Plus 9320 con su pantalla OLED, el buen rendimiento de la batería del ZenBook se nota claramente, ya que el modelo Dell sólo dura unas 5:30 horas.
| Asus ZenBook 14X UX3404VC i9-13900H, Iris Xe G7 96EUs, 70 Wh | Apple MacBook Pro 13 2022 M2 M2, M2 10-Core GPU, 58.2 Wh | Dell XPS 13 Plus 9320 i7-1280P OLED i7-1280P, Iris Xe G7 96EUs, 55 Wh | Lenovo Slim Pro 7 14ARP8 R7 7735HS, GeForce RTX 3050 6GB Laptop GPU, 73 Wh | LG Gram 14Z90Q i5-1240P, Iris Xe G7 80EUs, 72 Wh | Dell Inspiron 14 Plus 7420 i7-12700H, GeForce RTX 3050 4GB Laptop GPU, 64 Wh | Asus ROG Flow Z13 GZ301V i9-13900H, GeForce RTX 4060 Laptop GPU, 56 Wh | Media de la clase Subnotebook | |
|---|---|---|---|---|---|---|---|---|
| Duración de Batería | 91% | -42% | 5% | 49% | -36% | -46% | 41% | |
| Reader / Idle (h) | 17.6 | 28.9 64% | 11.9 -32% | 28.6 ? 63% | ||||
| WiFi v1.3 (h) | 10 | 19.1 91% | 5.8 -42% | 10.5 5% | 11.9 19% | 7.2 -28% | 5 -50% | 14.1 ? 41% |
| Load (h) | 1.7 | 2.8 65% | 0.9 -47% | 1 -41% | 1.998 ? 18% | |||
| H.264 (h) | 19.2 | 4.7 | 15.3 ? | |||||
| Witcher 3 ultra (h) | 0.8 |
Pro
Contra
Veredicto - El nuevo procesador es incapaz de desplegar plenamente sus alas
El ZenBook 14X es un portátil muy sólido en general, que sólo se ve estropeado por el rendimiento algo decepcionante del procesador. Definitivamente se habría beneficiado de un ventilador adicional, como en modelo del año pasado. Por otro lado, la pantalla OLED de 120 Hz, los rápidos tiempos de respuesta y la duración de batería por encima de la media son puntos muy positivos. A pesar del Intel Core i9-13900H instalado, medimos exactamente 10 horas en nuestro test WLAN. Los valores DeltaE de la pantalla están por debajo de 3, por lo que el subportátil es adecuado para la edición de fotos y vídeo.
La calidad del chasis de aluminio también es excelente y asegura una estabilidad superior a la media, lo que también se nota al teclear. La variedad de puertos es sólida, pero inferior a la del predecesor ya que se ha omitido el lector microSD. La posición de los puertos tampoco es la ideal.
El nuevo ZenBook 14X de Asus es un todoterreno robusto con muy buena duración de batería, un display OLED sobresaliente y un rendimiento sólido.
El ruido del ventilador es moderado y el dispositivo sigue siendo prácticamente inaudible durante las tareas ofimáticas normales gracias a la opción de un modo silencioso en la app MyAsus.
El precio de la configuración básica ha aumentado respecto al predecesor tanto en la versión AMD como en la Intel. Nuestra variante analizada, sin tarjeta gráfica dedicada, cuesta 1.699 euros. Si quieres la Nvidia GeForce RTX 3050, tendrás que desembolsar 400 euros más.
Si la pantalla OLED no juega un papel importante en la elección del portátil, hay dos dispositivos de 14 pulgadas más baratos, el Lenovo Slim Pro 7 14ARP8 y el Dell Inspiron 14 Plus 7420, que ofrecen mejor rendimiento gráfico gracias a AMD Radeon 680M en el Lenovo o RTX 3050 en el Dell.
Precio y disponibilidad
En EE.UU., la configuración básica del Asus Zenbook 14X UX3404 tiene un precio de $1,799.00 en la tienda web de Asus.
Asus ZenBook 14X UX3404VC
- 06/01/2023 v7 (old)
Philip Macdonald
Transparencia
La selección de los dispositivos que se van a reseñar corre a cargo de nuestro equipo editorial. La muestra de prueba fue proporcionada al autor en calidad de préstamo por el fabricante o el minorista a los efectos de esta reseña. El prestamista no tuvo ninguna influencia en esta reseña, ni el fabricante recibió una copia de la misma antes de su publicación. No había ninguna obligación de publicar esta reseña. Como empresa de medios independiente, Notebookcheck no está sujeta a la autoridad de fabricantes, minoristas o editores.
Así es como prueba Notebookcheck
Cada año, Notebookcheck revisa de forma independiente cientos de portátiles y smartphones utilizando procedimientos estandarizados para asegurar que todos los resultados son comparables. Hemos desarrollado continuamente nuestros métodos de prueba durante unos 20 años y hemos establecido los estándares de la industria en el proceso. En nuestros laboratorios de pruebas, técnicos y editores experimentados utilizan equipos de medición de alta calidad. Estas pruebas implican un proceso de validación en varias fases. Nuestro complejo sistema de clasificación se basa en cientos de mediciones y puntos de referencia bien fundamentados, lo que mantiene la objetividad.Price comparison

