Revisión de los tres modelos Dell XPS 13 Plus 9320: ¿Core i5-1240P, i7-1260P o i7-1280P OLED?
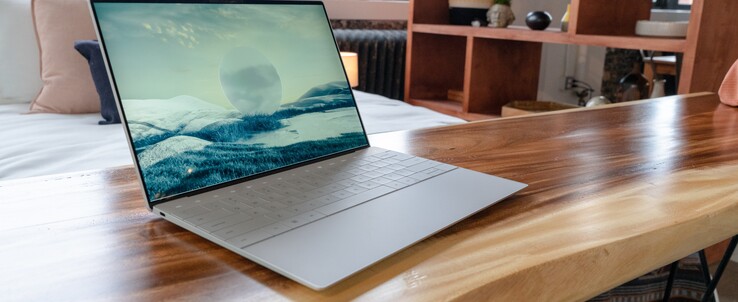
Tras su presentación inicial en el CES 2022, el XPS 13 Plus de 2022 se comercializa ahora con tres opciones de procesador a elegir (Core i5-1240P, Core i7-1260P y Core i7-1280P) junto con tres resoluciones de pantalla diferentes (1920 x 1200 IPS, 3456 x 2160 OLED y 3840 x 2400 IPS). Ya hemos probado las configuraciones i5-1240P, i7-1260P, 1200p IPS y 2400p IPS, por lo que sólo queda la SKU i7-1280P 2160p OLED
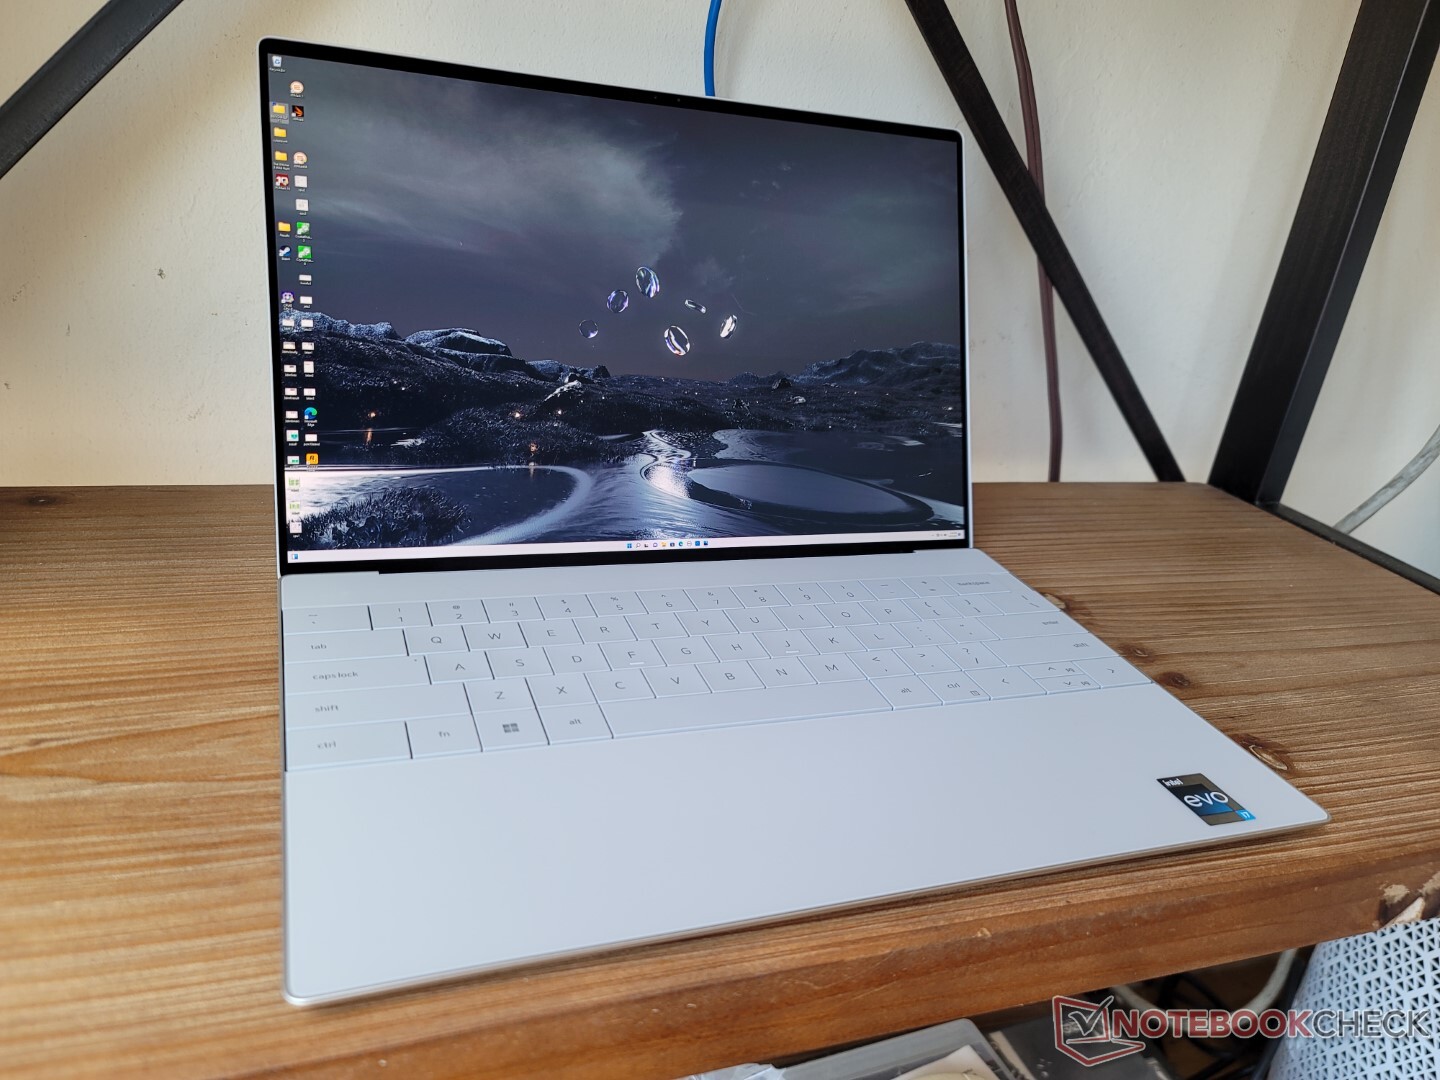
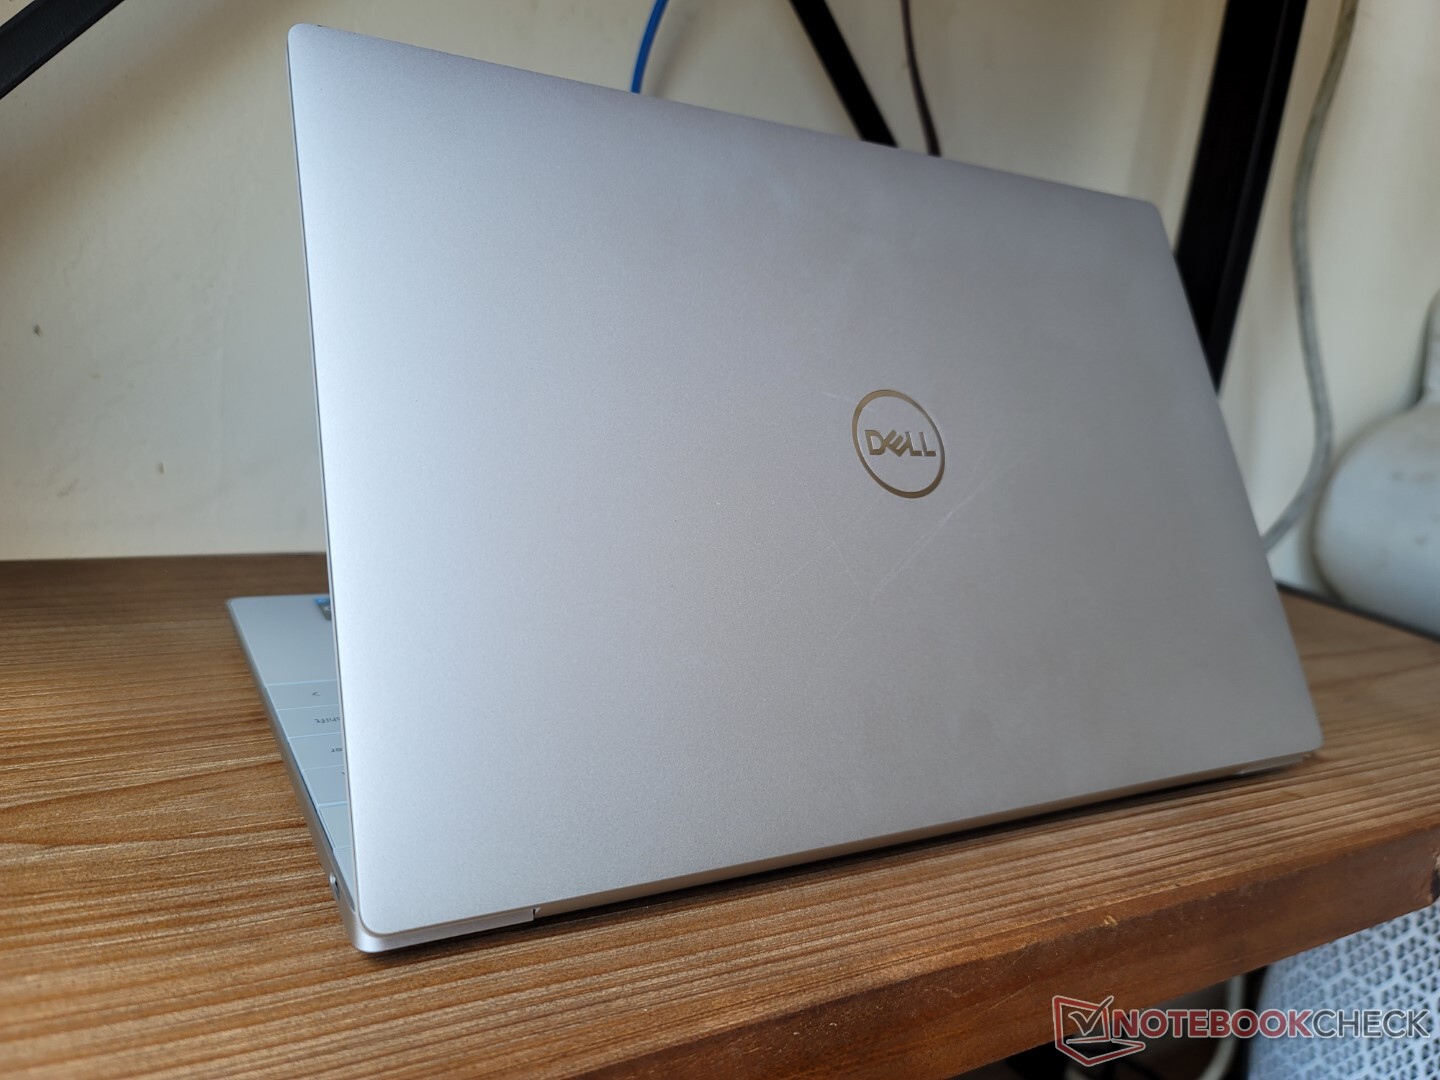
Este análisis se centra en la configuración i7-1280P y 2160p OLED y las diferencias que los usuarios pueden esperar entre ella y las otras opciones del XPS 13 Plus. Tal como está configurada, la unidad se vende actualmente por 1750 dólares. Recomendamos consultar nuestro existente dos análisis sobre el XPS 13 Plus para saber más sobre las características físicas del modelo
Más análisis de Dell
Posibles contendientes en la comparación
Valoración | Fecha | Modelo | Peso | Altura | Tamaño | Resolución | Precio |
|---|---|---|---|---|---|---|---|
| 87.3 % v7 (old) | 09/2022 | Dell XPS 13 Plus 9320 i7-1280P OLED i7-1280P, Iris Xe G7 96EUs | 1.3 kg | 15.28 mm | 13.40" | 3456x2160 | |
| 86.1 % v7 (old) | 08/2022 | Dell XPS 13 Plus 9320 i5-1240p i5-1240P, Iris Xe G7 80EUs | 1.2 kg | 15.3 mm | 13.40" | 1920x1200 | |
| 88.2 % v7 (old) | 08/2022 | Dell XPS 13 9315, i5-1230U i5-1230U, Iris Xe G7 80EUs | 1.2 kg | 14 mm | 13.40" | 1920x1200 | |
| 86.9 % v7 (old) | 07/2022 | Dell XPS 13 Plus 9320 4K i7-1260P, Iris Xe G7 96EUs | 1.2 kg | 15.3 mm | 13.40" | 3840x2400 | |
| 86.7 % v7 (old) | 10/2021 | Dell XPS 13 9310 2-in-1 i7-1165G7, Iris Xe G7 96EUs | 1.3 kg | 14.35 mm | 13.40" | 1920x1200 | |
| 88.3 % v7 (old) | 06/2021 | Dell XPS 13 9310 OLED i7-1185G7, Iris Xe G7 96EUs | 1.2 kg | 14.8 mm | 13.40" | 3456x2160 |
Caso
Mostrar
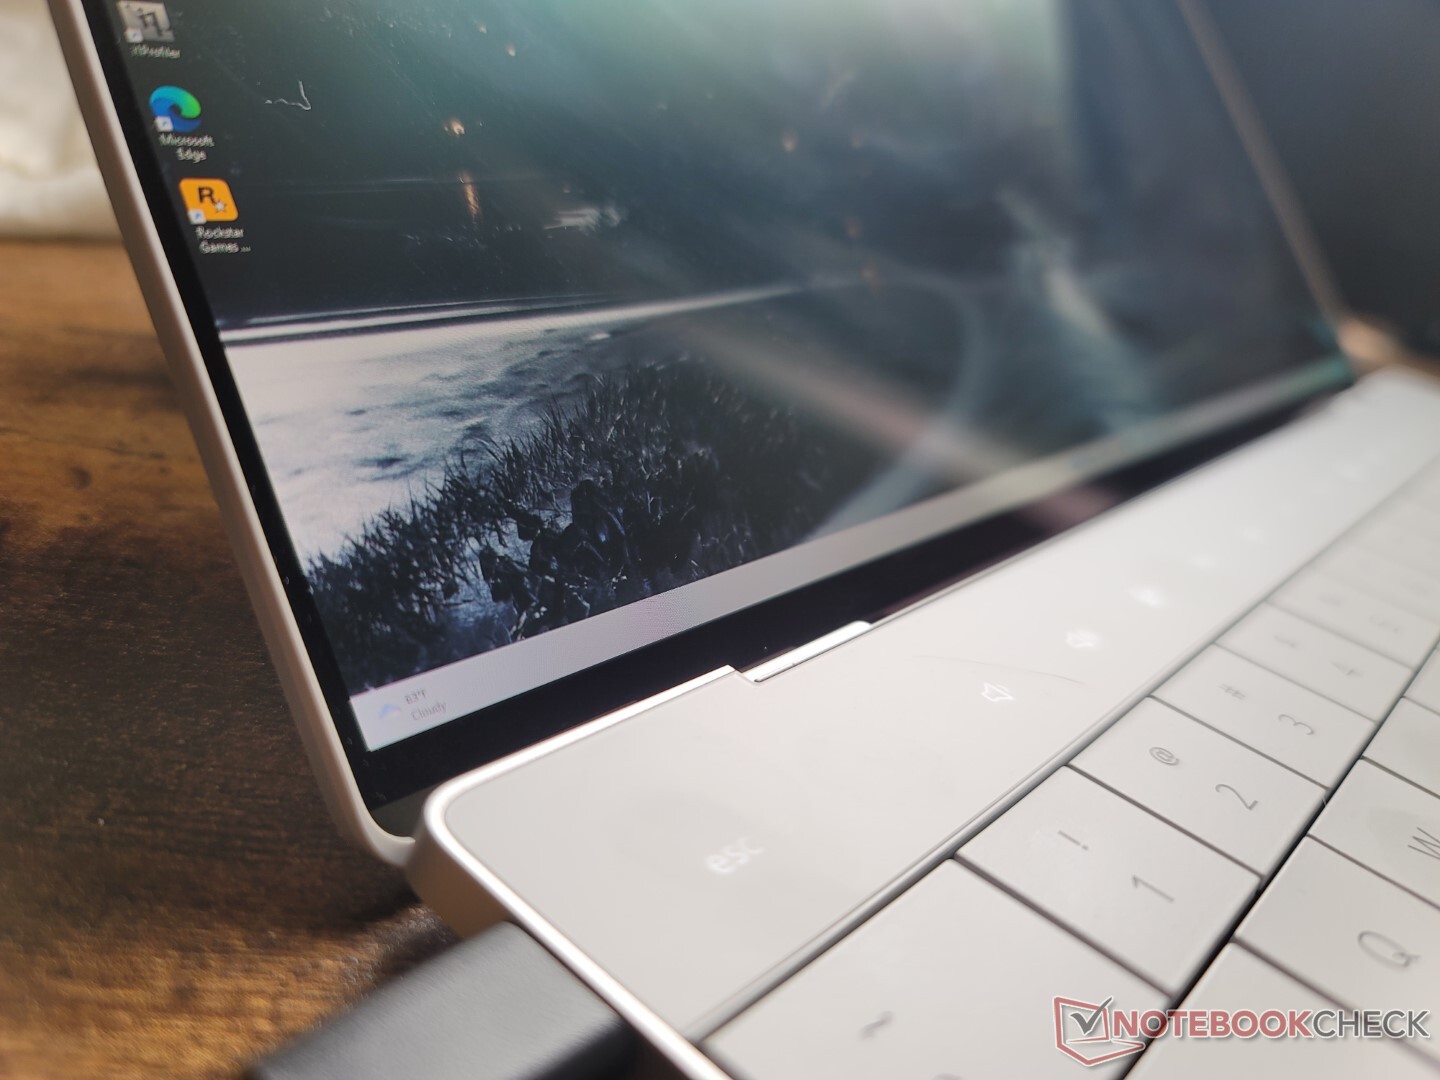
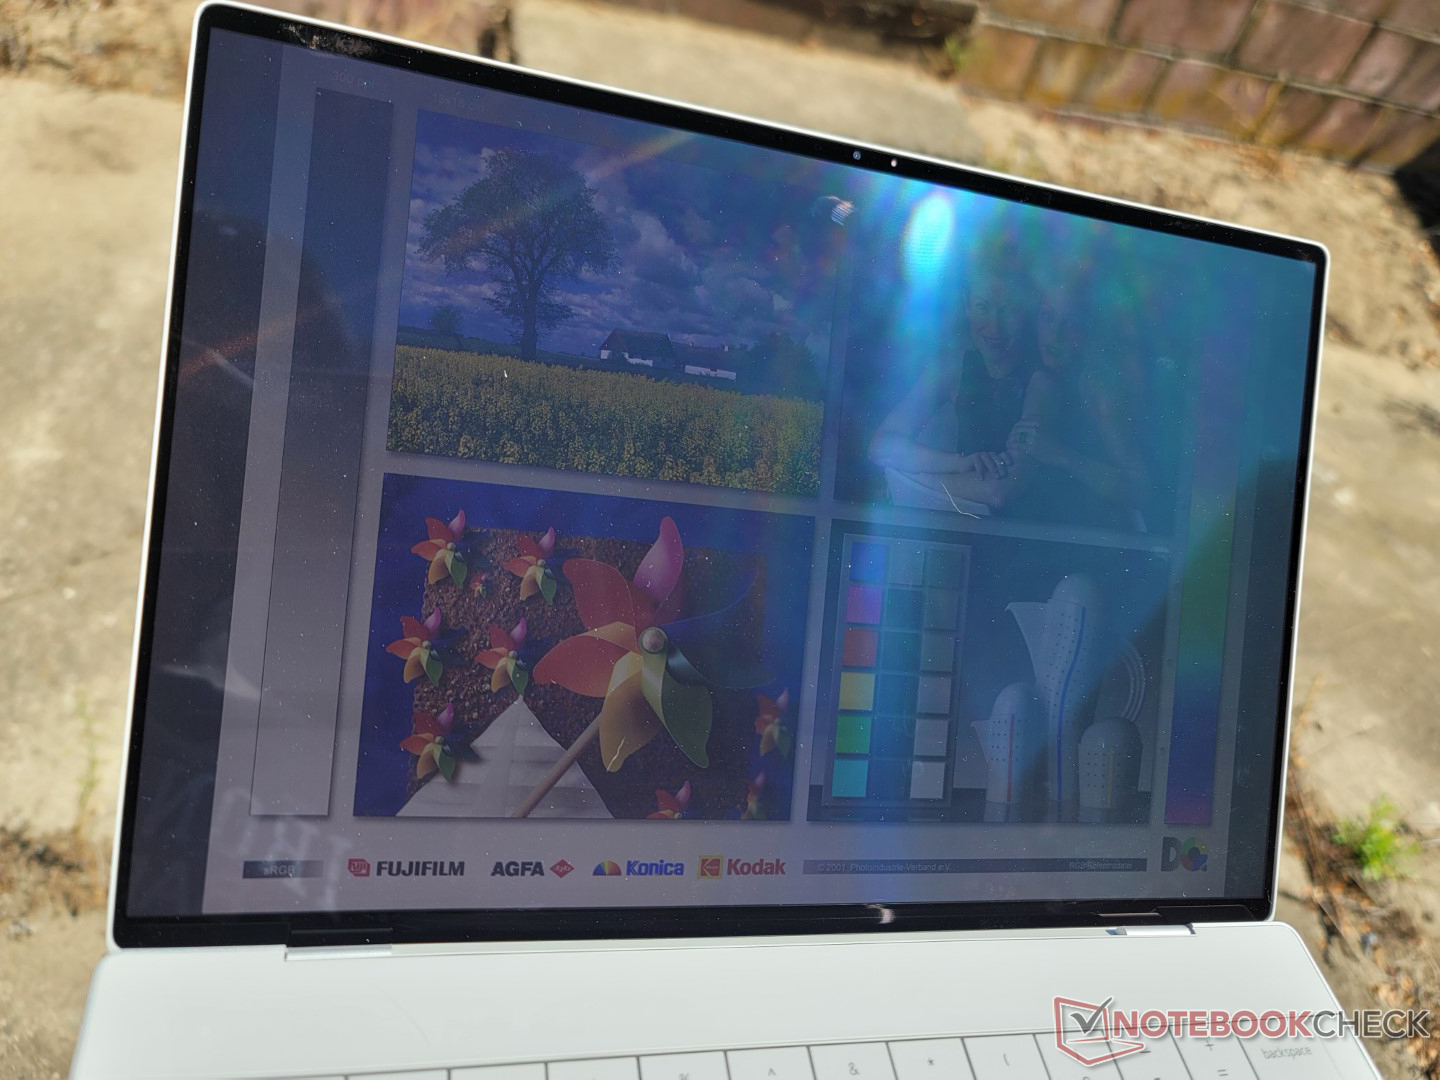
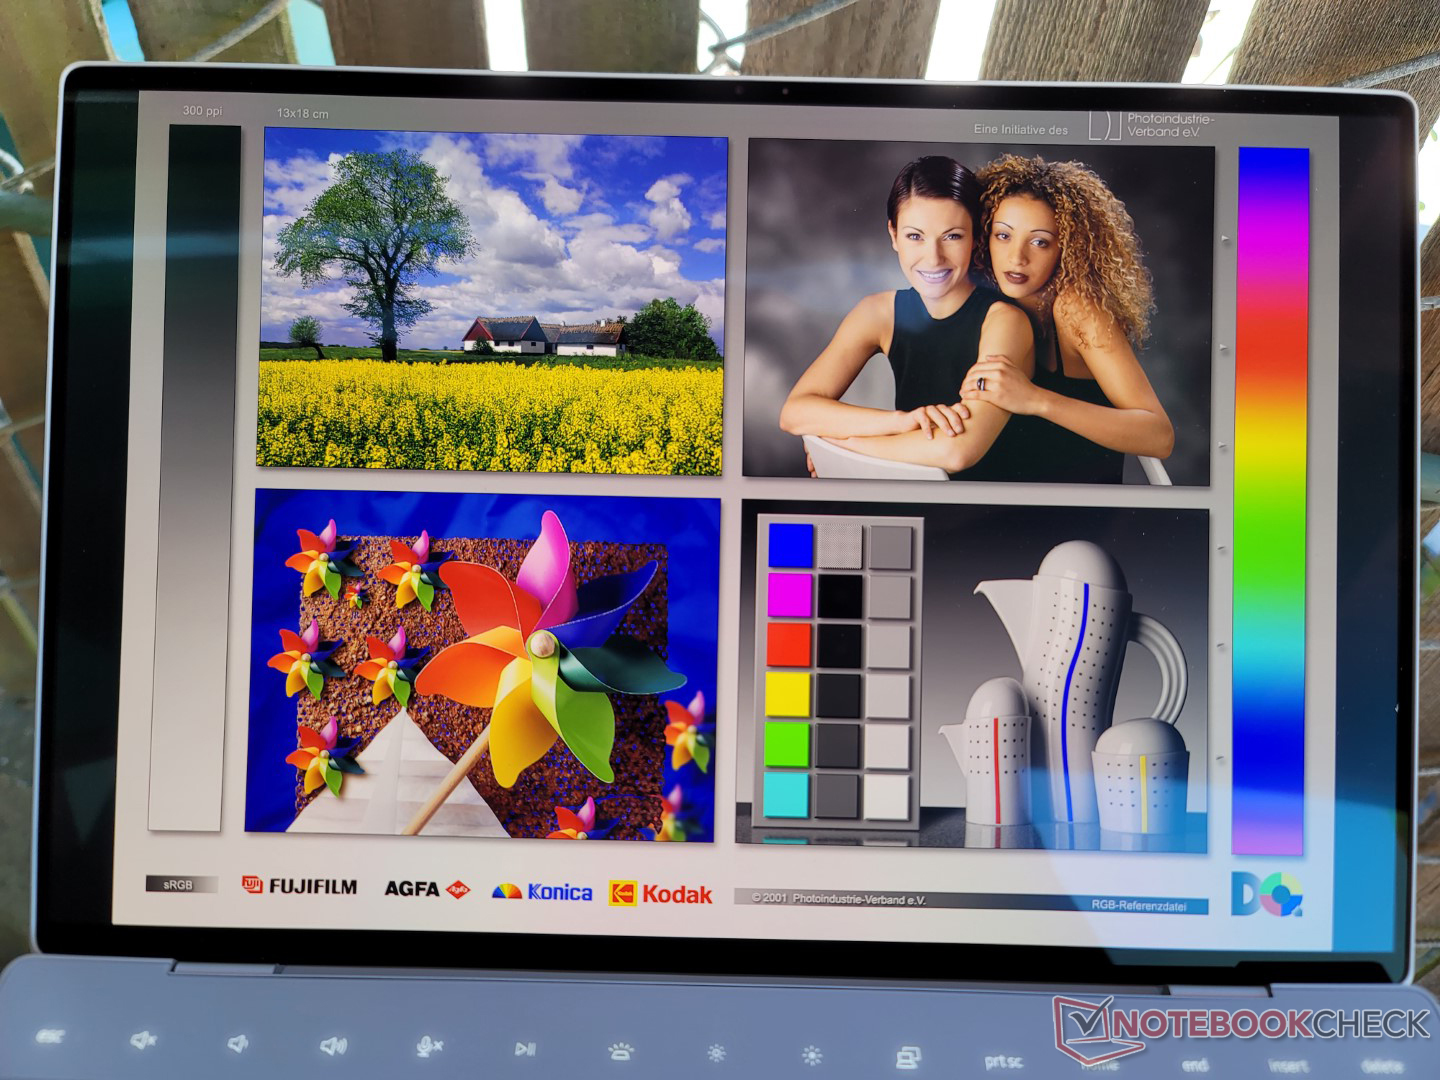
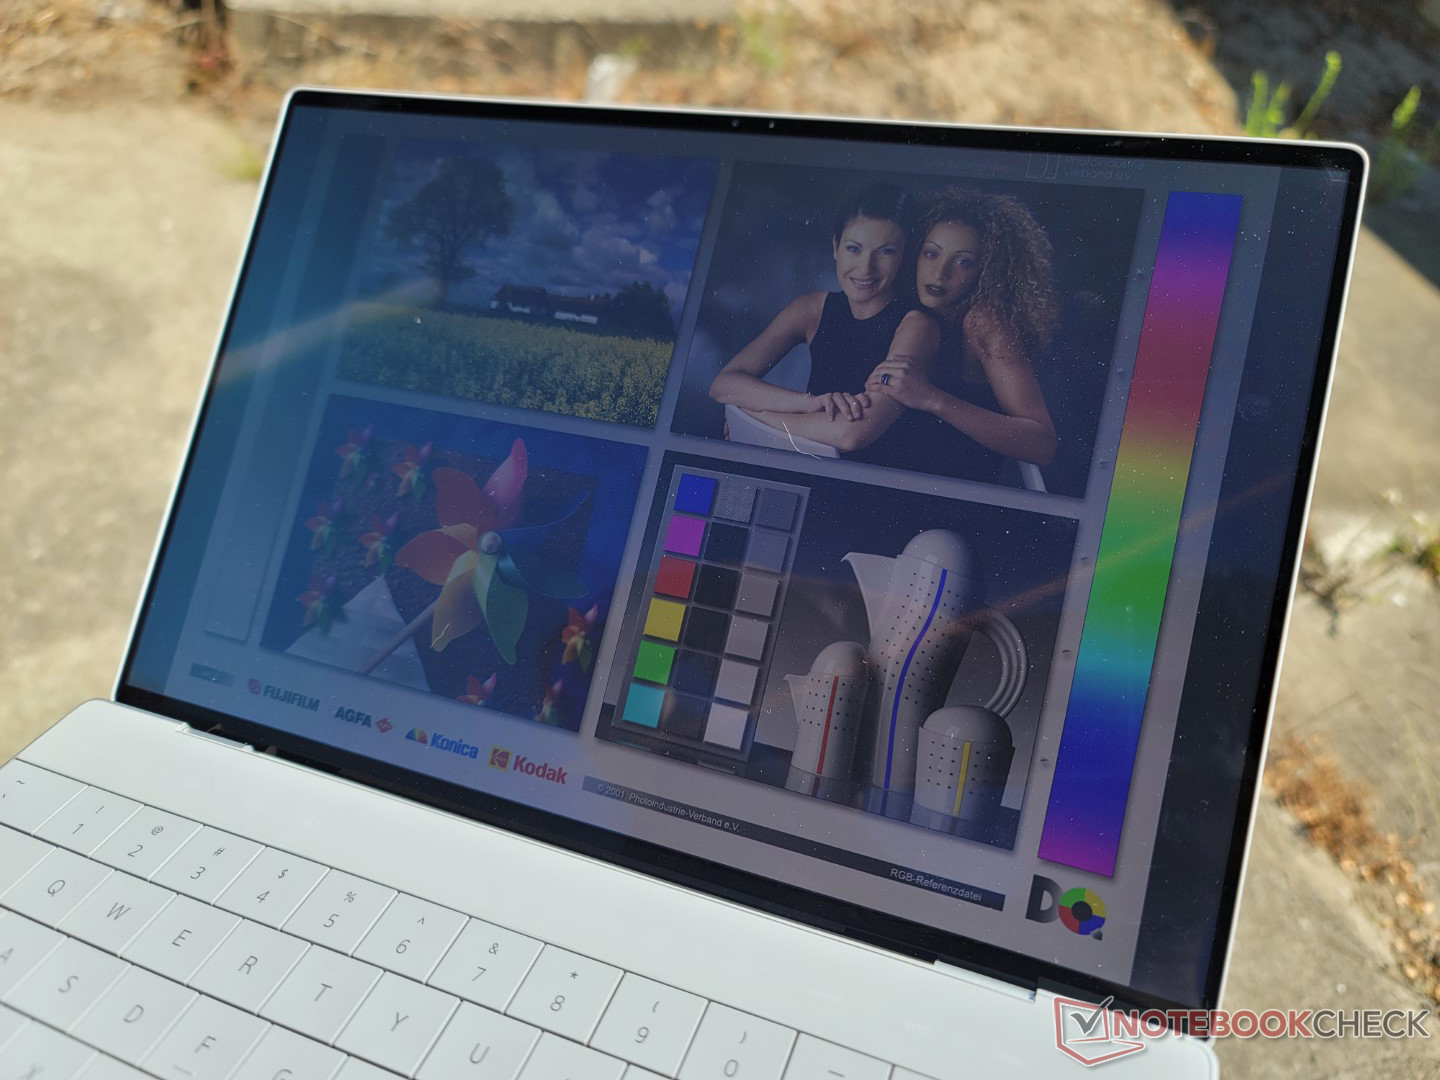
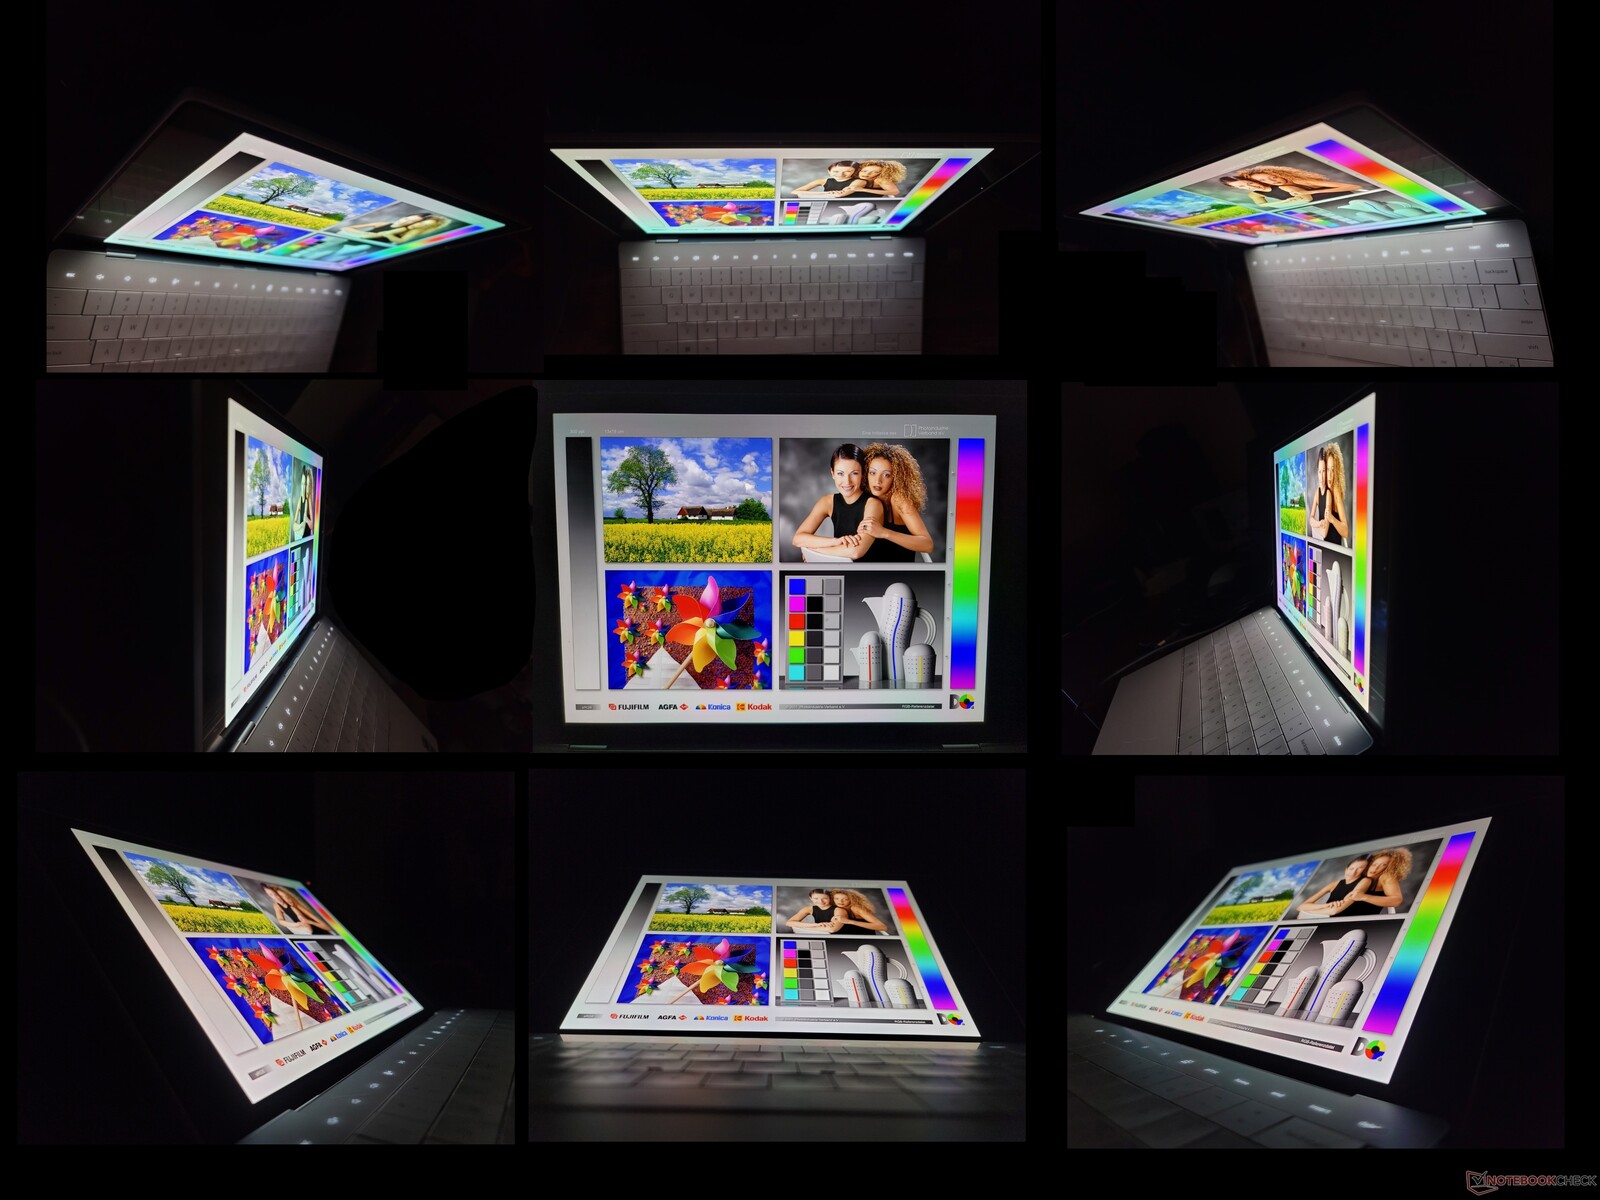
El panel OLED no es la opción definitiva, ya que presenta ventajas y desventajas con respecto al IPS. Las ventajas incluyen una mejor uniformidad del brillo, niveles de negro más profundos, cobertura P3 completa y tiempos de respuesta blanco-negro y gris-gris significativamente más rápidos. Las desventajas son el parpadeo de la pantalla y un brillo máximo de 100 nits menos. La diferencia de brillo no debería ser un problema si se trabaja en interiores, pero los paneles IPS son un poco más fáciles de ver si se trabaja en exteriores.
Hay que tener en cuenta que el panel OLED aquí es casi exactamente el mismo que el utilizado en la última generación XPS 13 9310 (Samsung 134XK04 frente a Samsung 134XK01). Si has visto el XPS 13 9310 OLED antes, entonces sabrás exactamente qué esperar del XPS 13 Plus 9320 OLED.
| |||||||||||||||||||||||||
iluminación: 98 %
Brillo con batería: 371.8 cd/m²
Contraste: ∞:1 (Negro: 0 cd/m²)
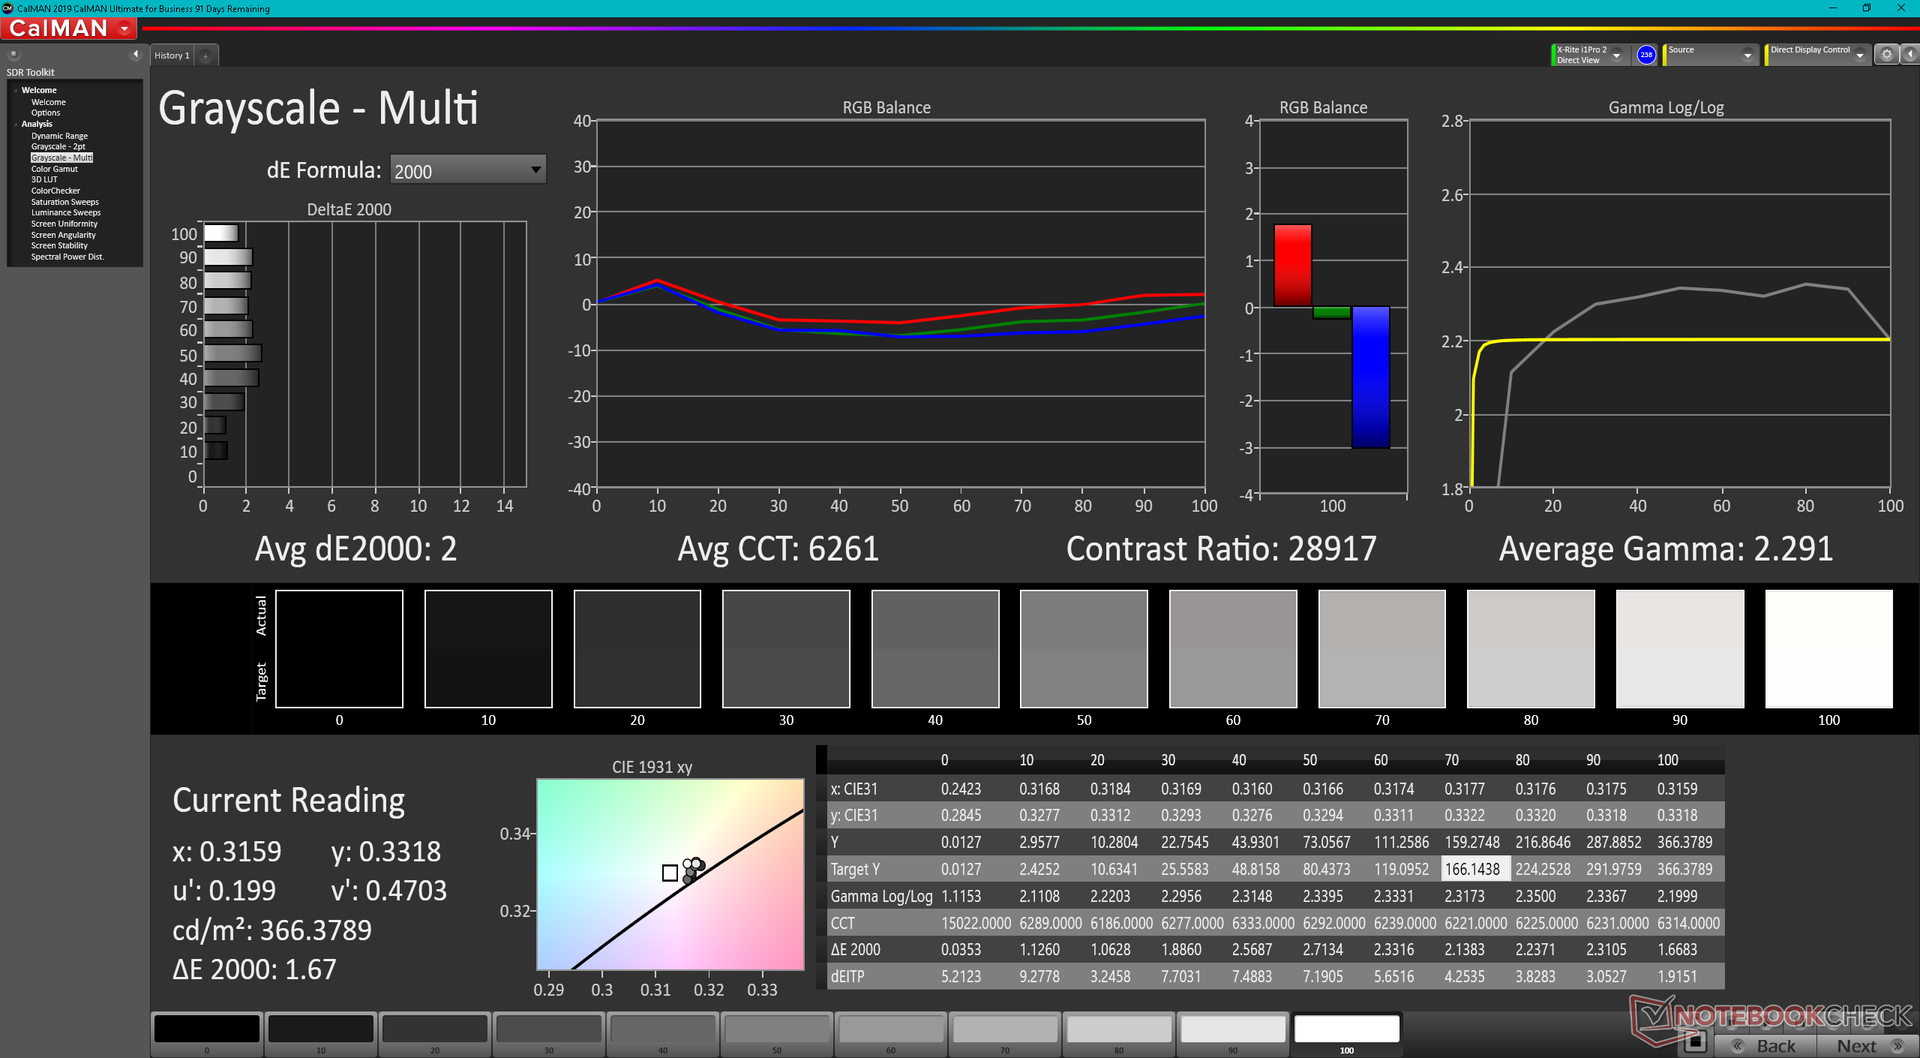
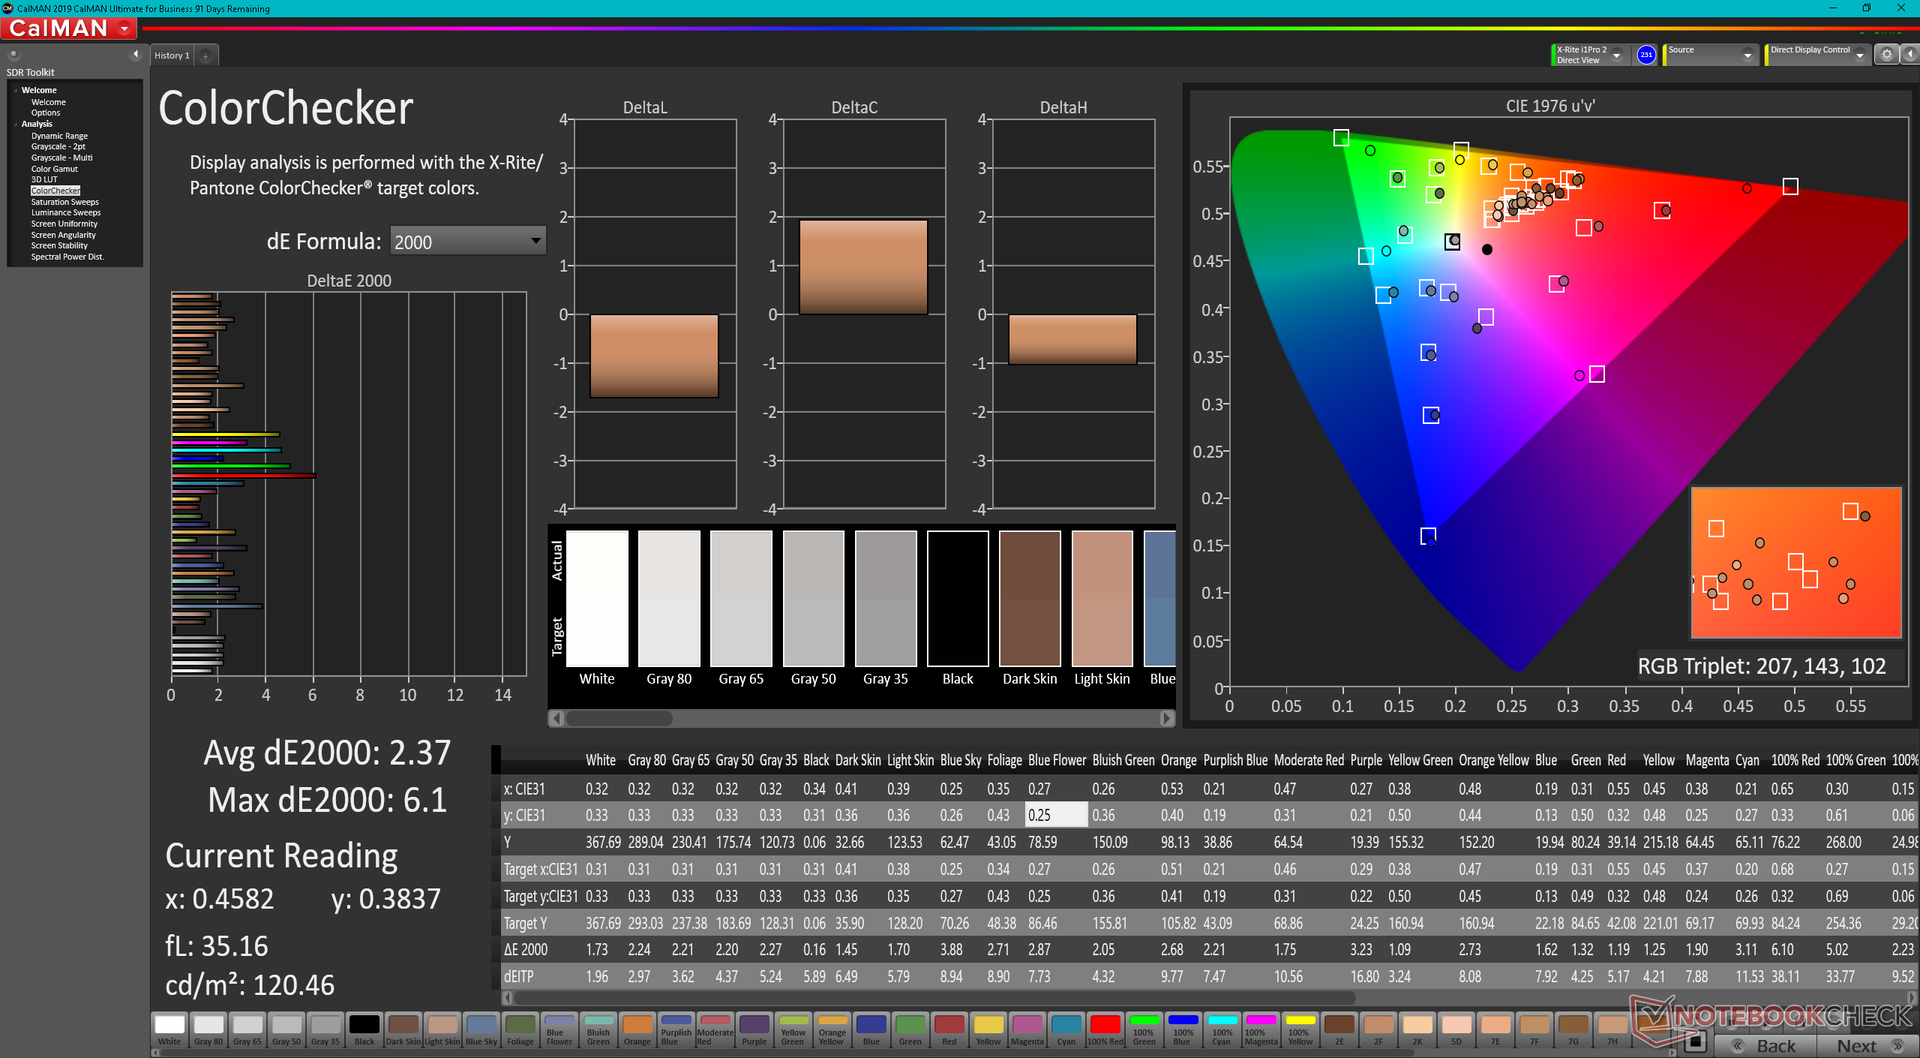
ΔE ColorChecker Calman: 2.37 | ∀{0.5-29.43 Ø4.71}
ΔE Greyscale Calman: 2 | ∀{0.09-98 Ø4.96}
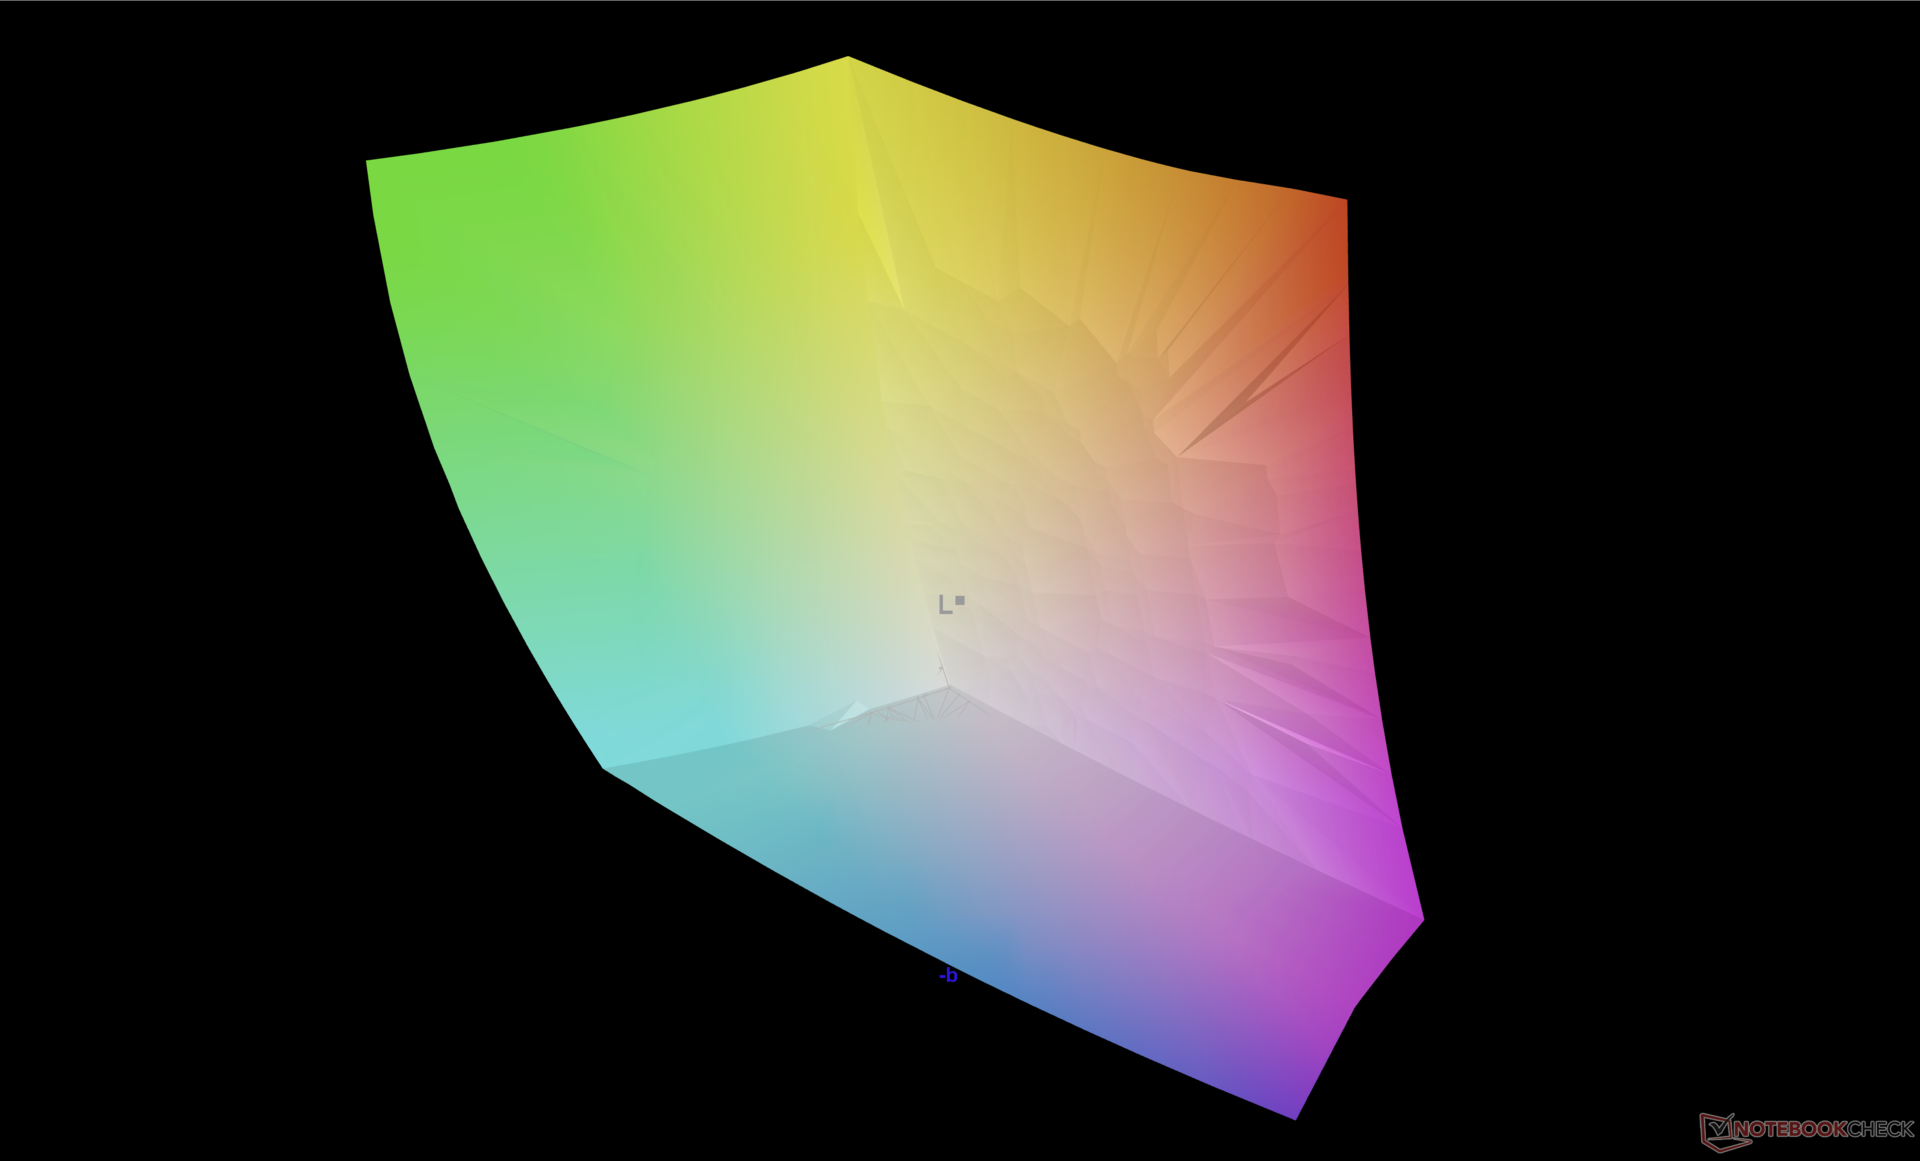
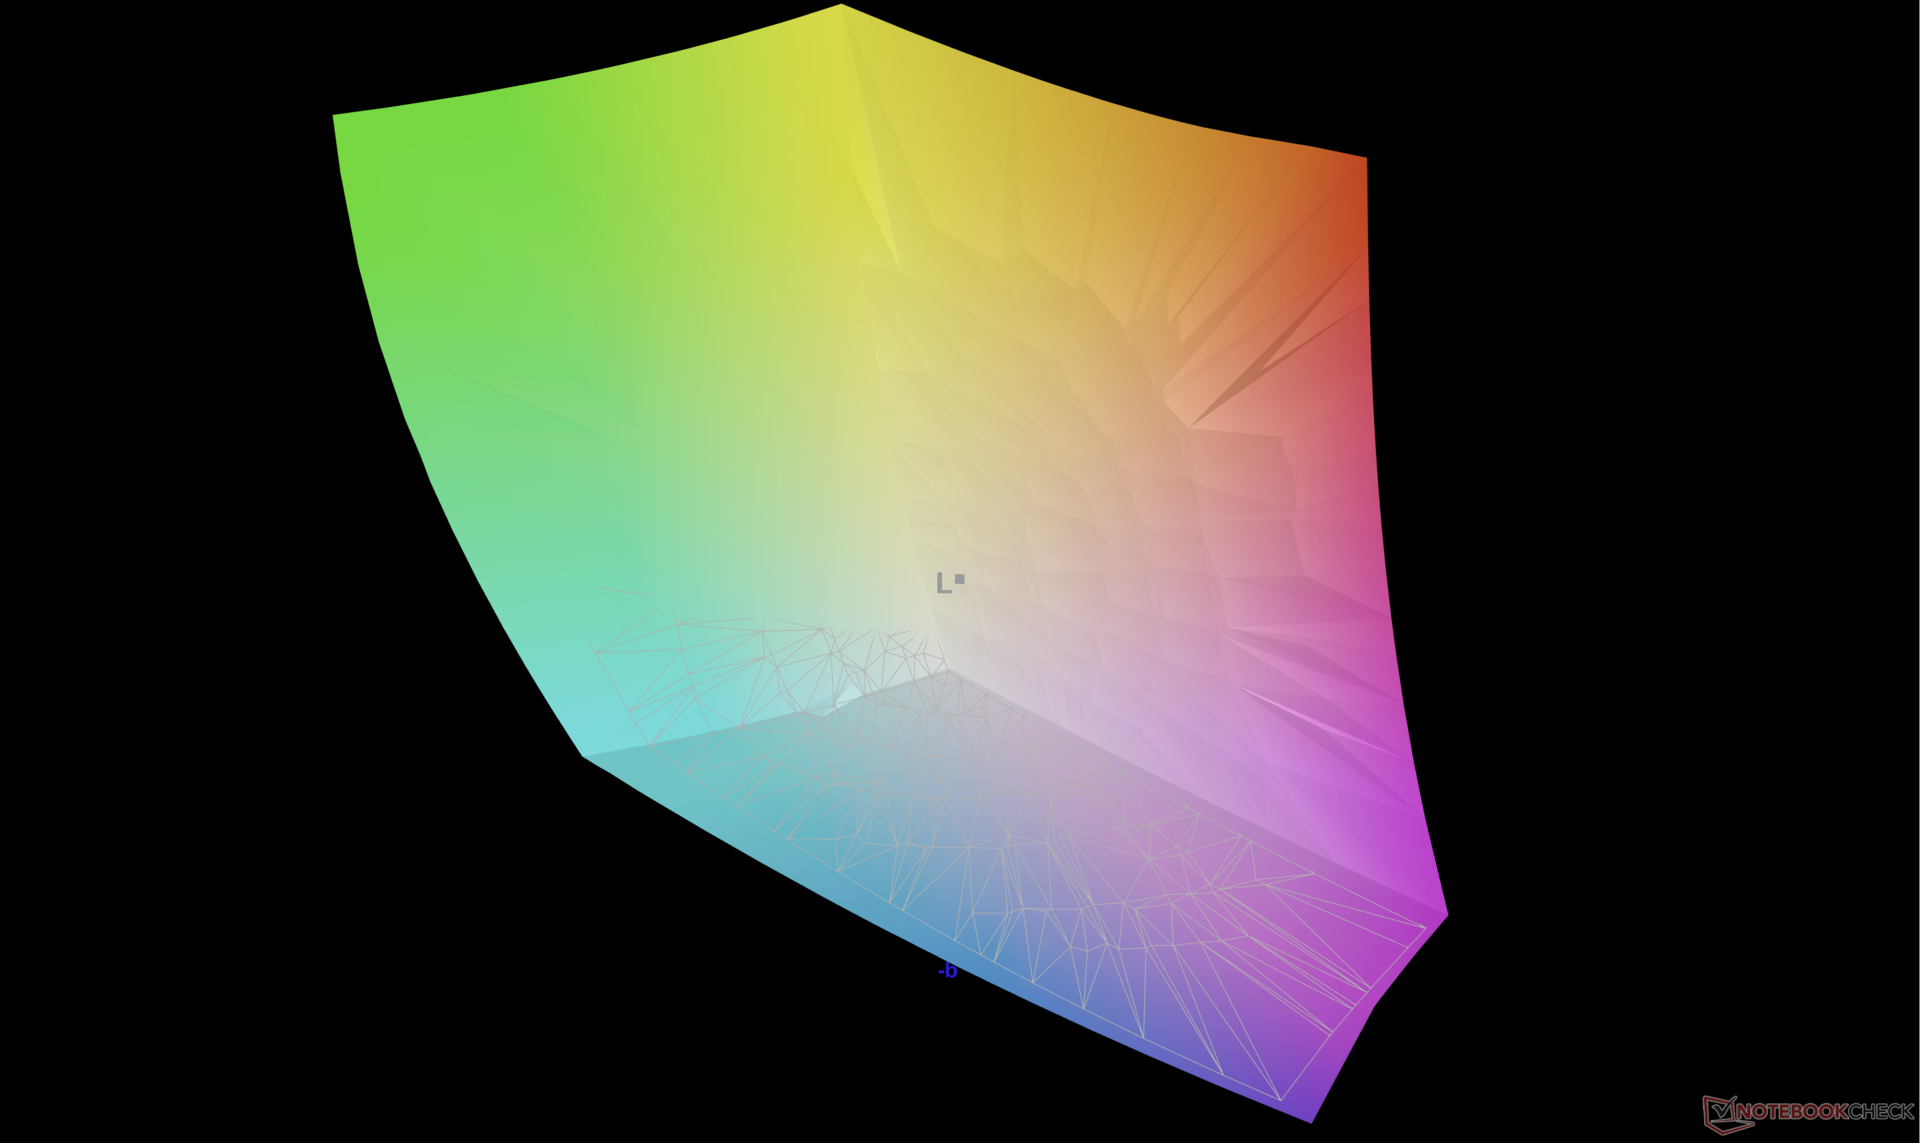
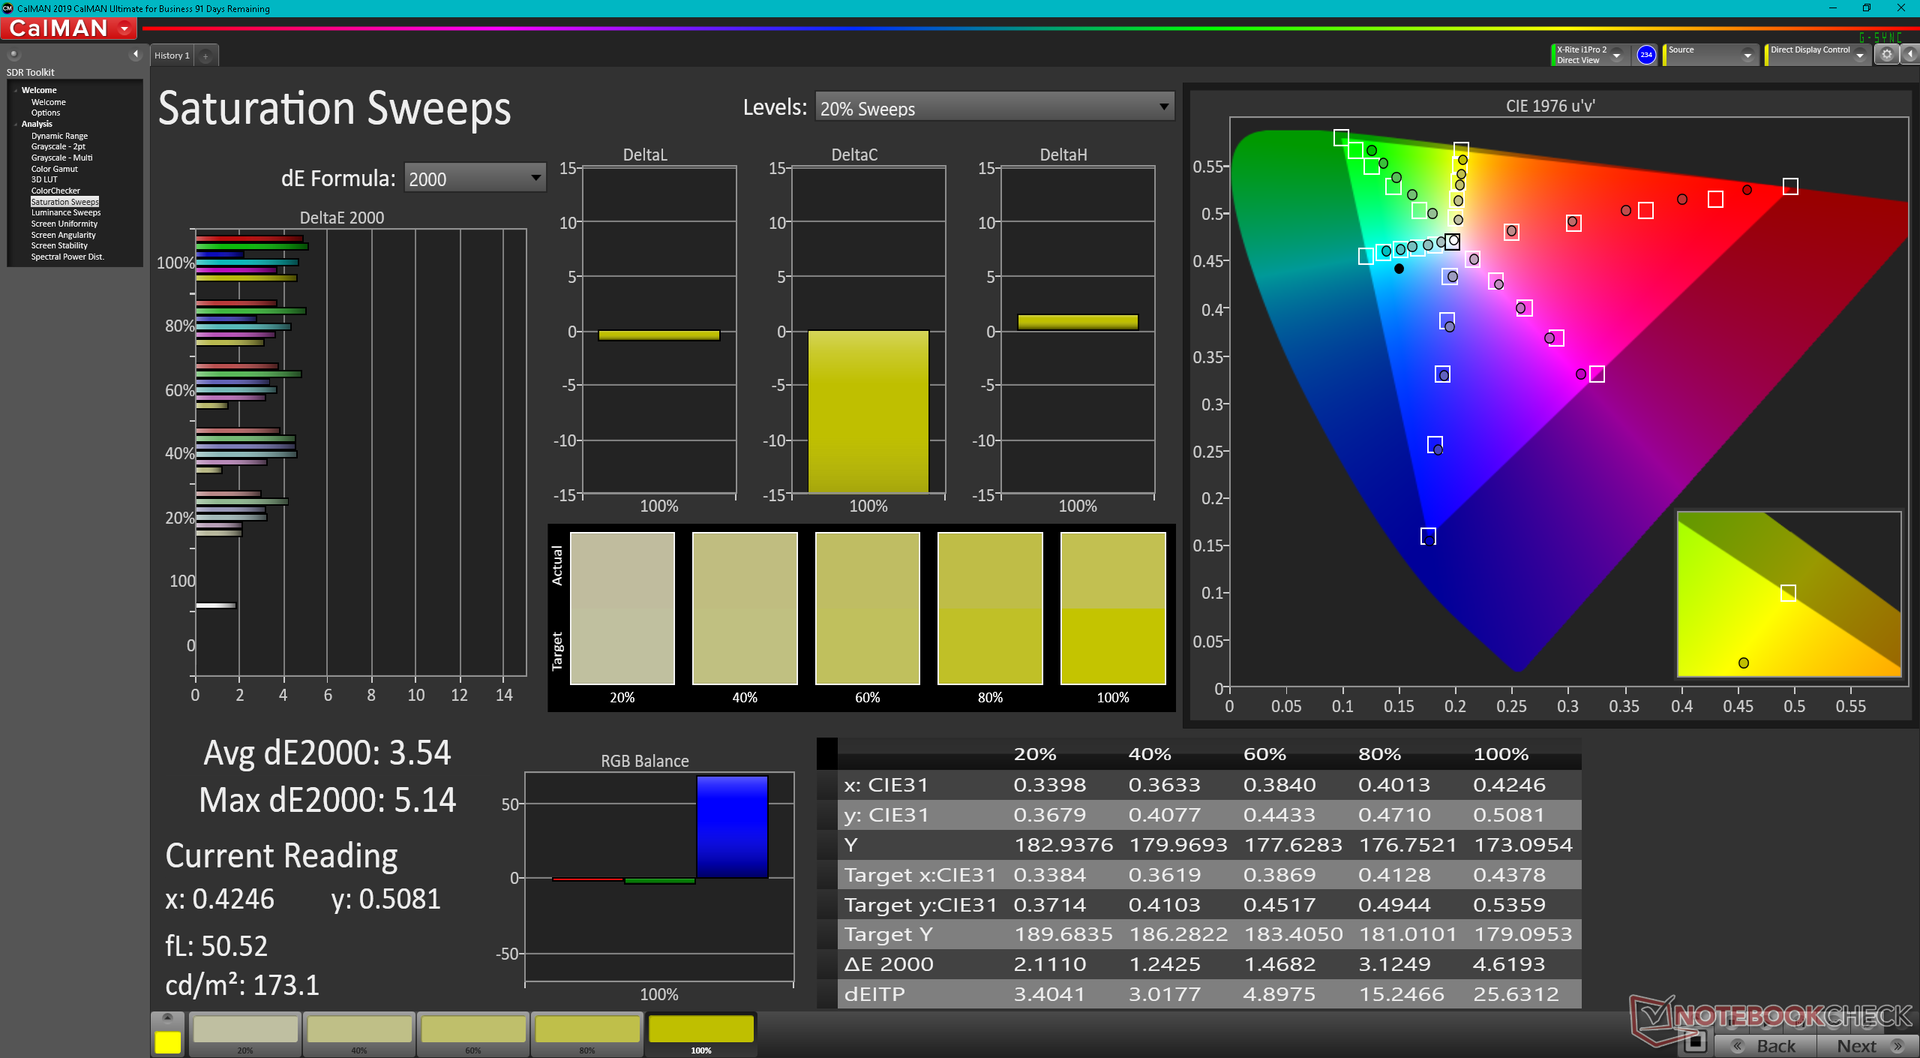
98.4% AdobeRGB 1998 (Argyll 3D)
100% sRGB (Argyll 3D)
99.5% Display P3 (Argyll 3D)
Gamma: 2.29
CCT: 6261 K
| Dell XPS 13 Plus 9320 i7-1280P OLED Samsung 134XK04, OLED, 3456x2160, 13.4" | Dell XPS 13 Plus 9320 i5-1240p Sharp SHP1548 LQ134N1, IPS, 1920x1200, 13.4" | Dell XPS 13 9315, i5-1230U Sharp SHP1548 LQ134N1, IPS, 1920x1200, 13.4" | Dell XPS 13 Plus 9320 4K LQ134R1, IPS, 3840x2400, 13.4" | Dell XPS 13 9310 2-in-1 Sharp LQ134N1, IPS, 1920x1200, 13.4" | Dell XPS 13 9310 OLED Samsung 134XK01, OLED, 3456x2160, 13.4" | |
|---|---|---|---|---|---|---|
| Display | -20% | -20% | -15% | -19% | -0% | |
| Display P3 Coverage (%) | 99.5 | 69 -31% | 69 -31% | 76.5 -23% | 69.7 -30% | 99.7 0% |
| sRGB Coverage (%) | 100 | 99 -1% | 100 0% | 100 0% | 99 -1% | 100 0% |
| AdobeRGB 1998 Coverage (%) | 98.4 | 71 -28% | 71 -28% | 76 -23% | 71.7 -27% | 97.7 -1% |
| Response Times | -1266% | -1193% | -1170% | -1931% | 5% | |
| Response Time Grey 50% / Grey 80% * (ms) | 2.6 ? | 45 ? -1631% | 40 ? -1438% | 38.9 ? -1396% | 55.6 ? -2038% | 2.2 ? 15% |
| Response Time Black / White * (ms) | 2.1 ? | 21 ? -900% | 22 ? -948% | 21.9 ? -943% | 40.4 ? -1824% | 2.2 ? -5% |
| PWM Frequency (Hz) | 59.5 | 2500 ? | 240.4 ? | |||
| Screen | -23% | -10% | -2% | -44% | -14% | |
| Brightness middle (cd/m²) | 371.8 | 498 34% | 466 25% | 494 33% | 555.7 49% | 384 3% |
| Brightness (cd/m²) | 374 | 460 23% | 442 18% | 474 27% | 528 41% | 387 3% |
| Brightness Distribution (%) | 98 | 85 -13% | 89 -9% | 89 -9% | 90 -8% | 97 -1% |
| Black Level * (cd/m²) | 0.53 | 0.4 | 0.28 | 0.35 | ||
| Colorchecker dE 2000 * | 2.37 | 3.65 -54% | 3.03 -28% | 3.1 -31% | 4.83 -104% | 4.56 -92% |
| Colorchecker dE 2000 max. * | 6.1 | 7.11 -17% | 6.68 -10% | 4.2 31% | 8.46 -39% | 7.27 -19% |
| Greyscale dE 2000 * | 2 | 4.25 -113% | 3.12 -56% | 3.2 -60% | 6.1 -205% | 1.5 25% |
| Gamma | 2.29 96% | 2.45 90% | 2.41 91% | 2.41 91% | 1.98 111% | 2.26 97% |
| CCT | 6261 104% | 6690 97% | 6418 101% | 6189 105% | 6686 97% | 6219 105% |
| Contrast (:1) | 940 | 1165 | 1764 | 1588 | ||
| Colorchecker dE 2000 calibrated * | 2.16 | 2.34 | 1.5 | 0.76 | 4.52 | |
| Color Space (Percent of AdobeRGB 1998) (%) | 87.1 | |||||
| Color Space (Percent of sRGB) (%) | 100 | |||||
| Media total (Programa/Opciones) | -436% /
-248% | -408% /
-228% | -396% /
-218% | -665% /
-381% | -3% /
-7% |
* ... más pequeño es mejor
Tiempos de respuesta del display
| ↔ Tiempo de respuesta de Negro a Blanco | ||
|---|---|---|
| 2.1 ms ... subida ↗ y bajada ↘ combinada | ↗ 0.8 ms subida | 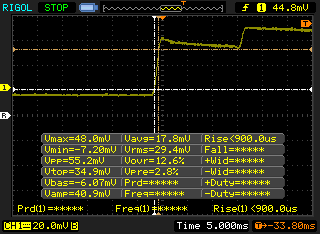 |
| ↘ 1.3 ms bajada | ||
| La pantalla mostró tiempos de respuesta muy rápidos en nuestros tests y debería ser adecuada para juegos frenéticos. En comparación, todos los dispositivos de prueba van de ##min### (mínimo) a 240 (máximo) ms. » 12 % de todos los dispositivos son mejores. Esto quiere decir que el tiempo de respuesta medido es mejor que la media (19.8 ms) de todos los dispositivos testados. | ||
| ↔ Tiempo de respuesta 50% Gris a 80% Gris | ||
| 2.6 ms ... subida ↗ y bajada ↘ combinada | ↗ 1.3 ms subida | 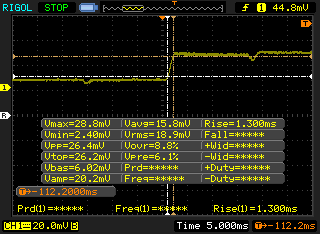 |
| ↘ 1.3 ms bajada | ||
| La pantalla mostró tiempos de respuesta muy rápidos en nuestros tests y debería ser adecuada para juegos frenéticos. En comparación, todos los dispositivos de prueba van de ##min### (mínimo) a 636 (máximo) ms. » 12 % de todos los dispositivos son mejores. Esto quiere decir que el tiempo de respuesta medido es mejor que la media (31 ms) de todos los dispositivos testados. | ||
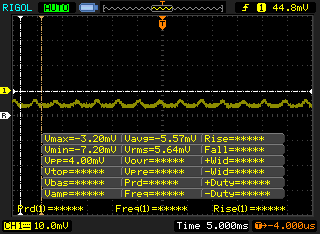
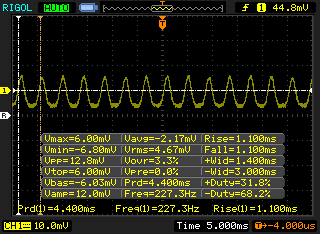
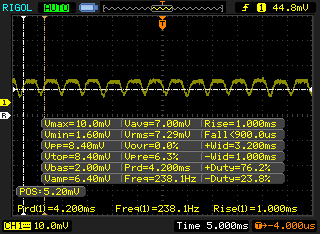
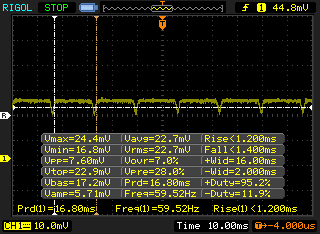
Parpadeo de Pantalla / PWM (Pulse-Width Modulation)
| Parpadeo de Pantalla / PWM detectado | 59.5 Hz | 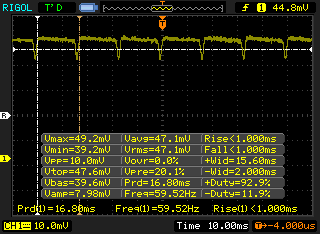 | |
La retroiluminación del display parpadea a 59.5 Hz (seguramente usa PWM - Pulse-Width Modulation) . La frecuencia de 59.5 Hz es bajísima, por lo que el parpadeo puede causar fatiga visual y cefaleas cuando se usa mucho tiempo. Comparación: 52 % de todos los dispositivos testados no usaron PWM para atenuar el display. Si se usó, medimos una media de 7754 (mínimo: 5 - máxmo: 343500) Hz. | |||
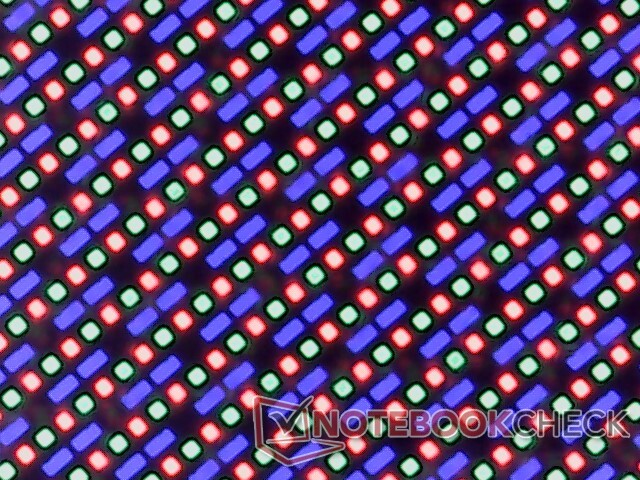
Como casi todos los portátiles con panel OLED, el panel aquí muestra parpadeo o modulación de ancho de pulso. La frecuencia se establece en 227.3 Hz de 0 a 52% de brillo antes de cambiar a 59.5 Hz de 53 a 100% de brillo. Si tus ojos son sensibles al parpadeo, quizá quieras considerar las unidades IPS.

Rendimiento
Condiciones de la prueba
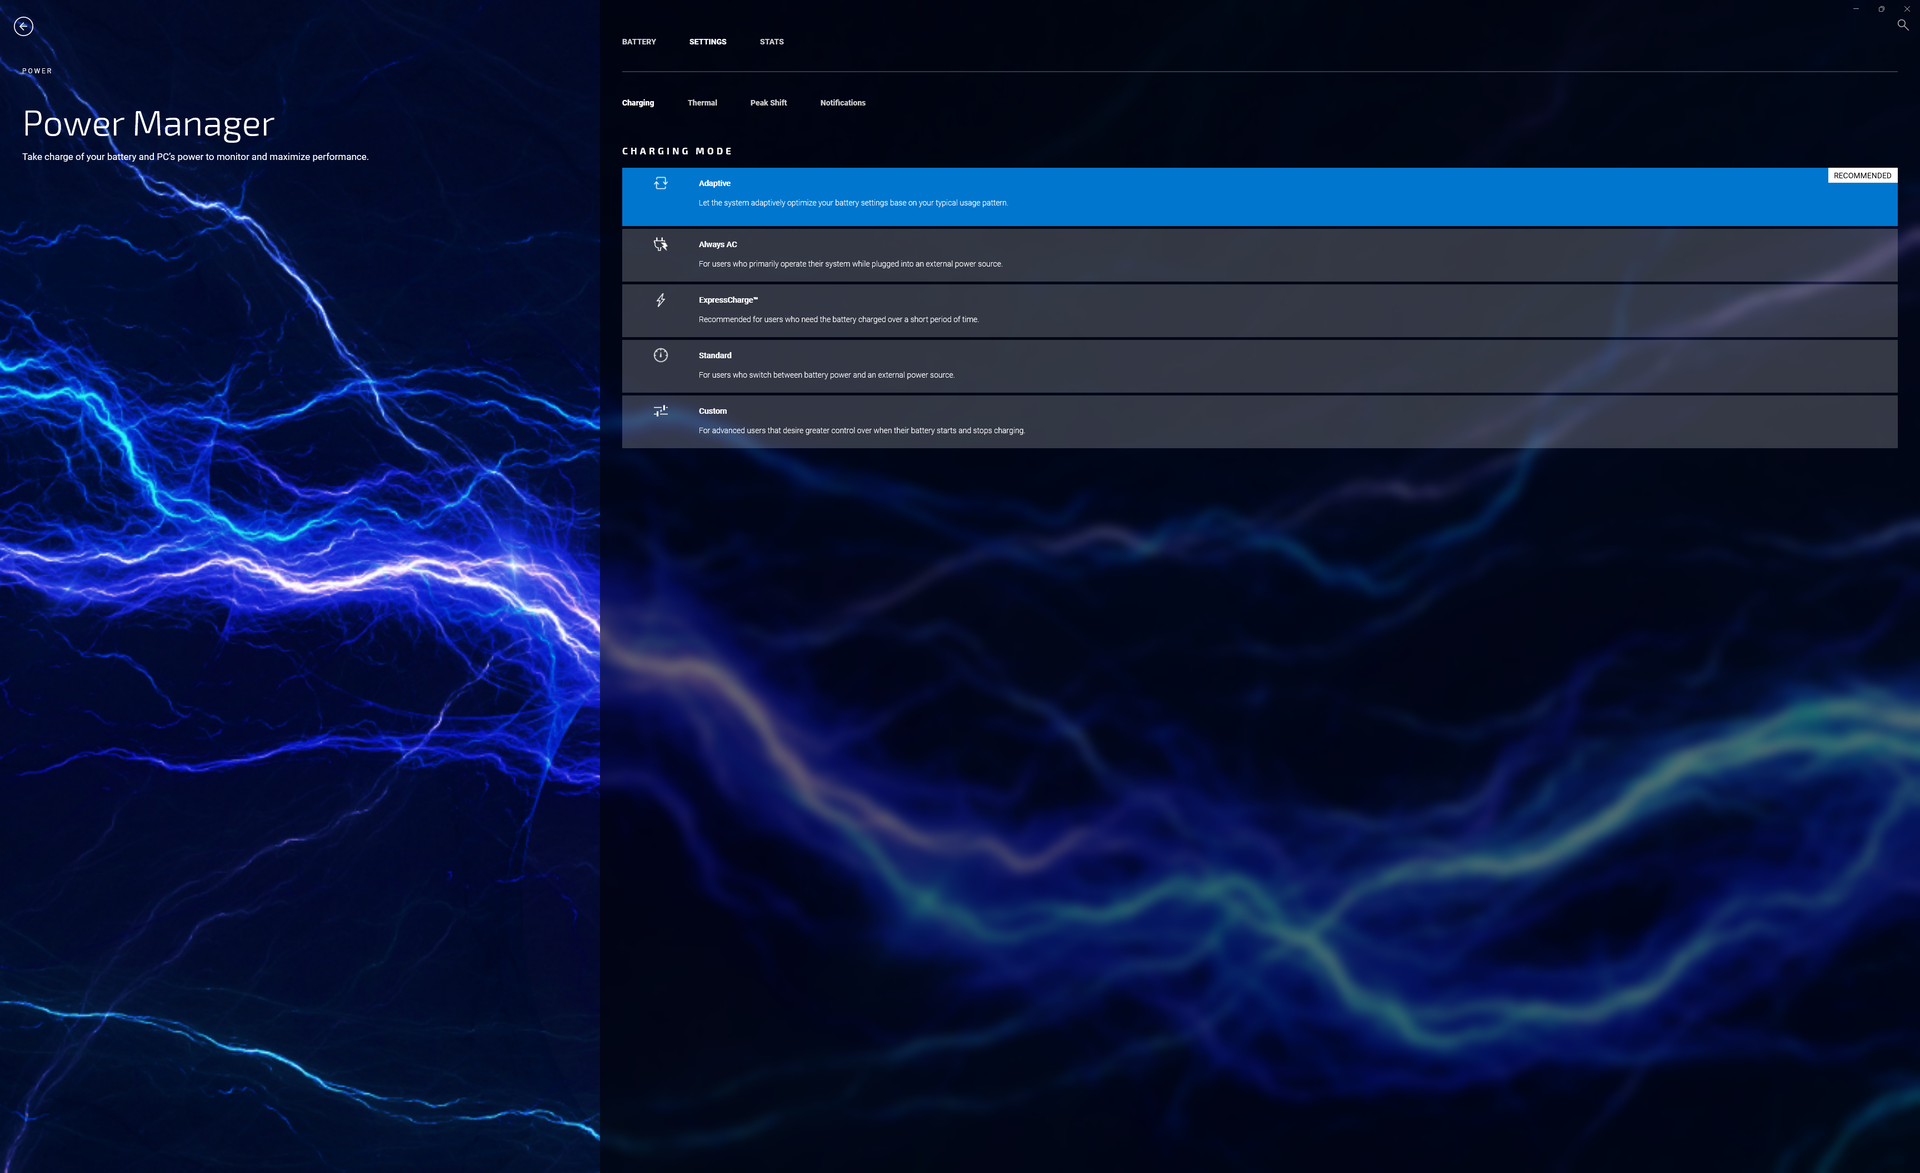
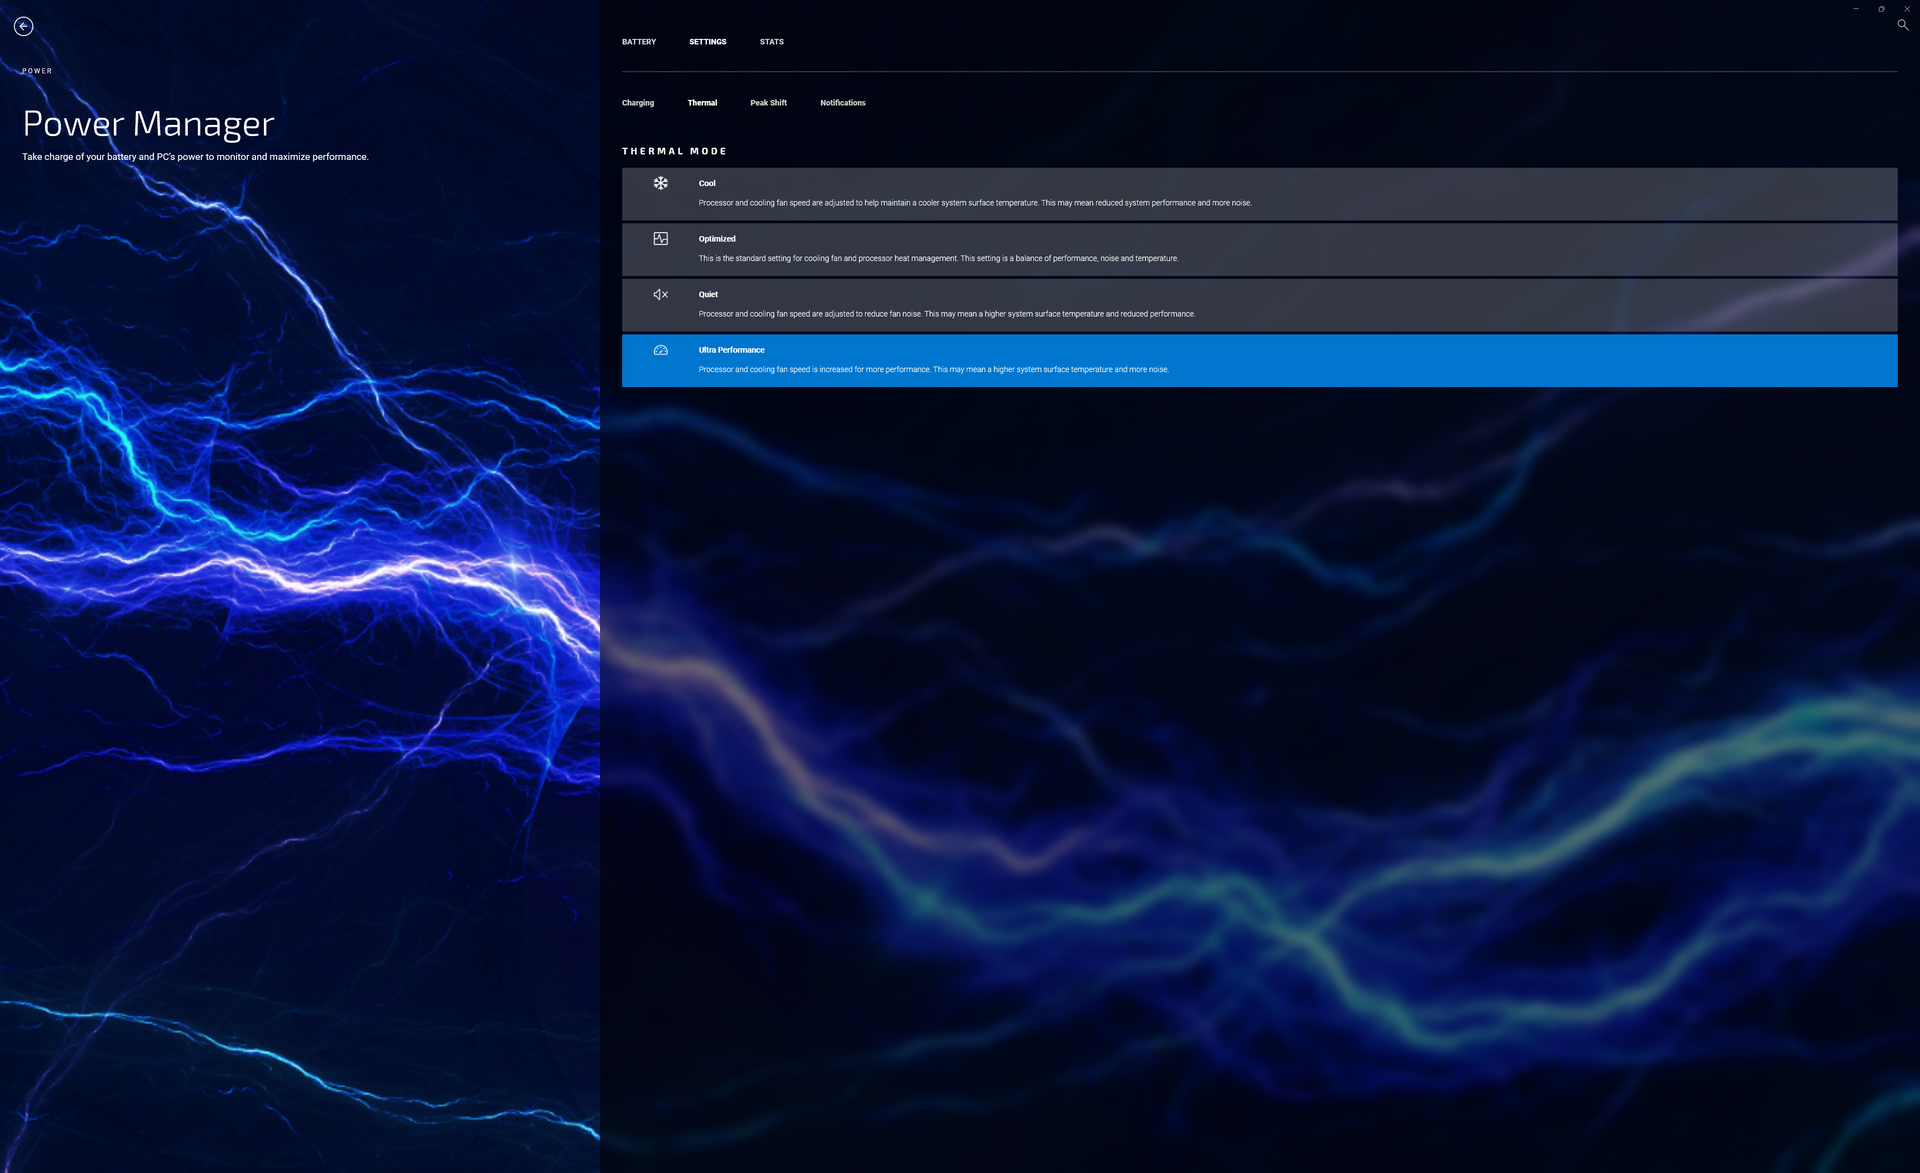
Configuramos nuestra unidad en el modo Rendimiento a través de Windows y en el modo Ultra Rendimiento a través del software My Dell antes de ejecutar cualquier prueba de rendimiento a continuación. Se recomienda que los usuarios se familiaricen con My Dell, ya que es el centro de control del portátil.
Procesador
El rendimiento multihilo es un 15 por ciento más rápido que el Core i7-1260P o entre un 25 y un 30 por ciento más rápido que el Core i5-1240P . Sin embargo, es interesante notar que nuestro Sin embargo, es interesante observar que nuestro Core i7-1280P puede caer por debajo del Core i7-1260P cuando se le somete a pruebas de estrés prolongadas. Los resultados de nuestra prueba de bucle CineBench R15 xT muestran que el i7-1280P supera al i7-1260P durante las primeras ejecuciones antes de ser más lento en casi un 8 por ciento.
Cinebench R15 Multi Loop
Cinebench R23: Multi Core | Single Core
Cinebench R15: CPU Multi 64Bit | CPU Single 64Bit
Blender: v2.79 BMW27 CPU
7-Zip 18.03: 7z b 4 | 7z b 4 -mmt1
Geekbench 5.5: Multi-Core | Single-Core
HWBOT x265 Benchmark v2.2: 4k Preset
LibreOffice : 20 Documents To PDF
R Benchmark 2.5: Overall mean
| Cinebench R20 / CPU (Multi Core) | |
| Medio Intel Core i7-1280P (3283 - 5415, n=8) | |
| Dell XPS 13 Plus 9320 i7-1280P OLED | |
| Dell XPS 13 Plus 9320 4K | |
| Dell XPS 13 Plus 9320 i5-1240p | |
| Dell XPS 13 9310 OLED | |
| Dell XPS 13 9315, i5-1230U | |
| Dell XPS 13 9310 2-in-1 | |
| Cinebench R20 / CPU (Single Core) | |
| Dell XPS 13 Plus 9320 4K | |
| Medio Intel Core i7-1280P (615 - 701, n=8) | |
| Dell XPS 13 Plus 9320 i7-1280P OLED | |
| Dell XPS 13 Plus 9320 i5-1240p | |
| Dell XPS 13 9310 OLED | |
| Dell XPS 13 9310 2-in-1 | |
| Dell XPS 13 9315, i5-1230U | |
| Cinebench R23 / Multi Core | |
| Dell XPS 13 Plus 9320 i7-1280P OLED | |
| Medio Intel Core i7-1280P (8632 - 14803, n=8) | |
| Dell XPS 13 Plus 9320 4K | |
| Dell XPS 13 Plus 9320 i5-1240p | |
| Dell XPS 13 9310 OLED | |
| Dell XPS 13 9310 2-in-1 | |
| Dell XPS 13 9315, i5-1230U | |
| Cinebench R23 / Single Core | |
| Dell XPS 13 Plus 9320 4K | |
| Medio Intel Core i7-1280P (1609 - 1787, n=7) | |
| Dell XPS 13 Plus 9320 i5-1240p | |
| Dell XPS 13 Plus 9320 i7-1280P OLED | |
| Dell XPS 13 9310 OLED | |
| Dell XPS 13 9310 2-in-1 | |
| Dell XPS 13 9315, i5-1230U | |
| Cinebench R15 / CPU Multi 64Bit | |
| Medio Intel Core i7-1280P (1905 - 2332, n=7) | |
| Dell XPS 13 Plus 9320 i7-1280P OLED | |
| Dell XPS 13 Plus 9320 4K | |
| Dell XPS 13 Plus 9320 4K | |
| Dell XPS 13 Plus 9320 i5-1240p | |
| Dell XPS 13 9310 OLED | |
| Dell XPS 13 9310 2-in-1 | |
| Dell XPS 13 9315, i5-1230U | |
| Cinebench R15 / CPU Single 64Bit | |
| Dell XPS 13 Plus 9320 4K | |
| Medio Intel Core i7-1280P (203 - 258, n=7) | |
| Dell XPS 13 Plus 9320 i7-1280P OLED | |
| Dell XPS 13 Plus 9320 i5-1240p | |
| Dell XPS 13 9310 OLED | |
| Dell XPS 13 9315, i5-1230U | |
| Dell XPS 13 9310 2-in-1 | |
| Blender / v2.79 BMW27 CPU | |
| Dell XPS 13 9310 2-in-1 | |
| Dell XPS 13 9310 OLED | |
| Dell XPS 13 Plus 9320 i5-1240p | |
| Dell XPS 13 Plus 9320 4K | |
| Medio Intel Core i7-1280P (259 - 309, n=7) | |
| Dell XPS 13 Plus 9320 i7-1280P OLED | |
| 7-Zip 18.03 / 7z b 4 | |
| Medio Intel Core i7-1280P (45292 - 53710, n=7) | |
| Dell XPS 13 Plus 9320 i7-1280P OLED | |
| Dell XPS 13 Plus 9320 4K | |
| Dell XPS 13 Plus 9320 i5-1240p | |
| Dell XPS 13 9310 2-in-1 | |
| Dell XPS 13 9315, i5-1230U | |
| Dell XPS 13 9310 OLED | |
| 7-Zip 18.03 / 7z b 4 -mmt1 | |
| Medio Intel Core i7-1280P (4995 - 5874, n=7) | |
| Dell XPS 13 Plus 9320 4K | |
| Dell XPS 13 9310 2-in-1 | |
| Dell XPS 13 Plus 9320 i7-1280P OLED | |
| Dell XPS 13 Plus 9320 i5-1240p | |
| Dell XPS 13 9315, i5-1230U | |
| Dell XPS 13 9310 OLED | |
| Geekbench 5.5 / Multi-Core | |
| Dell XPS 13 Plus 9320 i7-1280P OLED | |
| Medio Intel Core i7-1280P (9623 - 11811, n=7) | |
| Dell XPS 13 Plus 9320 4K | |
| Dell XPS 13 9315, i5-1230U | |
| Dell XPS 13 9310 OLED | |
| Dell XPS 13 Plus 9320 i5-1240p | |
| Geekbench 5.5 / Single-Core | |
| Dell XPS 13 Plus 9320 i7-1280P OLED | |
| Dell XPS 13 Plus 9320 4K | |
| Medio Intel Core i7-1280P (1571 - 1802, n=7) | |
| Dell XPS 13 9315, i5-1230U | |
| Dell XPS 13 Plus 9320 i5-1240p | |
| Dell XPS 13 9310 OLED | |
| HWBOT x265 Benchmark v2.2 / 4k Preset | |
| Dell XPS 13 Plus 9320 i7-1280P OLED | |
| Medio Intel Core i7-1280P (9.62 - 14.5, n=5) | |
| Dell XPS 13 Plus 9320 4K | |
| Dell XPS 13 Plus 9320 i5-1240p | |
| Dell XPS 13 9310 OLED | |
| Dell XPS 13 9310 2-in-1 | |
| LibreOffice / 20 Documents To PDF | |
| Dell XPS 13 Plus 9320 i5-1240p | |
| Medio Intel Core i7-1280P (41 - 61.6, n=8) | |
| Dell XPS 13 Plus 9320 i7-1280P OLED | |
| Dell XPS 13 Plus 9320 4K | |
| Dell XPS 13 9310 OLED | |
| R Benchmark 2.5 / Overall mean | |
| Dell XPS 13 9310 2-in-1 | |
| Dell XPS 13 9310 OLED | |
| Dell XPS 13 Plus 9320 i5-1240p | |
| Dell XPS 13 Plus 9320 i7-1280P OLED | |
| Dell XPS 13 Plus 9320 4K | |
| Medio Intel Core i7-1280P (0.4505 - 0.512, n=7) | |
* ... más pequeño es mejor
AIDA64: FP32 Ray-Trace | FPU Julia | CPU SHA3 | CPU Queen | FPU SinJulia | FPU Mandel | CPU AES | CPU ZLib | FP64 Ray-Trace | CPU PhotoWorxx
| Performance rating | |
| Dell XPS 13 Plus 9320 i7-1280P OLED | |
| Medio Intel Core i7-1280P | |
| Dell XPS 13 Plus 9320 4K | |
| Dell XPS 13 Plus 9320 i5-1240p | |
| Dell XPS 13 9310 2-in-1 | |
| Dell XPS 13 9310 OLED | |
| Dell XPS 13 9315, i5-1230U | |
| AIDA64 / FP32 Ray-Trace | |
| Dell XPS 13 Plus 9320 i7-1280P OLED | |
| Medio Intel Core i7-1280P (7466 - 13068, n=6) | |
| Dell XPS 13 9310 2-in-1 | |
| Dell XPS 13 9310 OLED | |
| Dell XPS 13 Plus 9320 4K | |
| Dell XPS 13 Plus 9320 i5-1240p | |
| Dell XPS 13 9315, i5-1230U | |
| AIDA64 / FPU Julia | |
| Dell XPS 13 Plus 9320 i7-1280P OLED | |
| Medio Intel Core i7-1280P (38904 - 66081, n=6) | |
| Dell XPS 13 9310 2-in-1 | |
| Dell XPS 13 Plus 9320 4K | |
| Dell XPS 13 Plus 9320 i5-1240p | |
| Dell XPS 13 9310 OLED | |
| Dell XPS 13 9315, i5-1230U | |
| AIDA64 / CPU SHA3 | |
| Dell XPS 13 Plus 9320 i7-1280P OLED | |
| Medio Intel Core i7-1280P (1826 - 2992, n=6) | |
| Dell XPS 13 9310 2-in-1 | |
| Dell XPS 13 Plus 9320 4K | |
| Dell XPS 13 Plus 9320 i5-1240p | |
| Dell XPS 13 9310 OLED | |
| Dell XPS 13 9315, i5-1230U | |
| AIDA64 / CPU Queen | |
| Medio Intel Core i7-1280P (80180 - 100358, n=6) | |
| Dell XPS 13 Plus 9320 i7-1280P OLED | |
| Dell XPS 13 Plus 9320 4K | |
| Dell XPS 13 Plus 9320 i5-1240p | |
| Dell XPS 13 9315, i5-1230U | |
| Dell XPS 13 9310 2-in-1 | |
| Dell XPS 13 9310 OLED | |
| AIDA64 / FPU SinJulia | |
| Dell XPS 13 Plus 9320 i7-1280P OLED | |
| Medio Intel Core i7-1280P (5880 - 8571, n=6) | |
| Dell XPS 13 Plus 9320 4K | |
| Dell XPS 13 Plus 9320 i5-1240p | |
| Dell XPS 13 9310 2-in-1 | |
| Dell XPS 13 9310 OLED | |
| Dell XPS 13 9315, i5-1230U | |
| AIDA64 / FPU Mandel | |
| Dell XPS 13 Plus 9320 i7-1280P OLED | |
| Medio Intel Core i7-1280P (18907 - 32766, n=6) | |
| Dell XPS 13 9310 2-in-1 | |
| Dell XPS 13 Plus 9320 i5-1240p | |
| Dell XPS 13 Plus 9320 4K | |
| Dell XPS 13 9310 OLED | |
| Dell XPS 13 9315, i5-1230U | |
| AIDA64 / CPU AES | |
| Dell XPS 13 9310 2-in-1 | |
| Medio Intel Core i7-1280P (40691 - 99367, n=6) | |
| Dell XPS 13 Plus 9320 i7-1280P OLED | |
| Dell XPS 13 9310 OLED | |
| Dell XPS 13 Plus 9320 i5-1240p | |
| Dell XPS 13 Plus 9320 4K | |
| Dell XPS 13 9315, i5-1230U | |
| AIDA64 / CPU ZLib | |
| Medio Intel Core i7-1280P (540 - 880, n=6) | |
| Dell XPS 13 Plus 9320 i7-1280P OLED | |
| Dell XPS 13 Plus 9320 4K | |
| Dell XPS 13 Plus 9320 i5-1240p | |
| Dell XPS 13 9310 2-in-1 | |
| Dell XPS 13 9315, i5-1230U | |
| Dell XPS 13 9310 OLED | |
| AIDA64 / FP64 Ray-Trace | |
| Dell XPS 13 Plus 9320 i7-1280P OLED | |
| Medio Intel Core i7-1280P (4006 - 7184, n=6) | |
| Dell XPS 13 9310 2-in-1 | |
| Dell XPS 13 9310 OLED | |
| Dell XPS 13 Plus 9320 4K | |
| Dell XPS 13 Plus 9320 i5-1240p | |
| Dell XPS 13 9315, i5-1230U | |
| AIDA64 / CPU PhotoWorxx | |
| Dell XPS 13 Plus 9320 i7-1280P OLED | |
| Medio Intel Core i7-1280P (36663 - 48416, n=6) | |
| Dell XPS 13 Plus 9320 4K | |
| Dell XPS 13 9310 2-in-1 | |
| Dell XPS 13 Plus 9320 i5-1240p | |
| Dell XPS 13 9310 OLED | |
| Dell XPS 13 9315, i5-1230U | |
Rendimiento del sistema
CrossMark: Overall | Productivity | Creativity | Responsiveness
| PCMark 10 / Score | |
| Media de la clase Subnotebook (4920 - 9939, n=45, últimos 2 años) | |
| Dell XPS 13 Plus 9320 i7-1280P OLED | |
| Medio Intel Core i7-1280P, Intel Iris Xe Graphics G7 96EUs (5410 - 5994, n=4) | |
| Dell XPS 13 Plus 9320 4K | |
| Dell XPS 13 9310 OLED | |
| Dell XPS 13 9310 2-in-1 | |
| Dell XPS 13 Plus 9320 i5-1240p | |
| Dell XPS 13 9315, i5-1230U | |
| PCMark 10 / Essentials | |
| Dell XPS 13 9310 OLED | |
| Dell XPS 13 9310 2-in-1 | |
| Dell XPS 13 Plus 9320 i7-1280P OLED | |
| Media de la clase Subnotebook (8552 - 11646, n=45, últimos 2 años) | |
| Dell XPS 13 Plus 9320 4K | |
| Medio Intel Core i7-1280P, Intel Iris Xe Graphics G7 96EUs (9719 - 10920, n=4) | |
| Dell XPS 13 9315, i5-1230U | |
| Dell XPS 13 Plus 9320 i5-1240p | |
| PCMark 10 / Productivity | |
| Media de la clase Subnotebook (5435 - 16606, n=45, últimos 2 años) | |
| Dell XPS 13 9310 OLED | |
| Dell XPS 13 Plus 9320 4K | |
| Dell XPS 13 9310 2-in-1 | |
| Medio Intel Core i7-1280P, Intel Iris Xe Graphics G7 96EUs (6301 - 7453, n=4) | |
| Dell XPS 13 Plus 9320 i7-1280P OLED | |
| Dell XPS 13 Plus 9320 i5-1240p | |
| Dell XPS 13 9315, i5-1230U | |
| PCMark 10 / Digital Content Creation | |
| Media de la clase Subnotebook (5722 - 13779, n=45, últimos 2 años) | |
| Dell XPS 13 Plus 9320 i7-1280P OLED | |
| Medio Intel Core i7-1280P, Intel Iris Xe Graphics G7 96EUs (6450 - 7180, n=4) | |
| Dell XPS 13 Plus 9320 4K | |
| Dell XPS 13 Plus 9320 i5-1240p | |
| Dell XPS 13 9310 OLED | |
| Dell XPS 13 9310 2-in-1 | |
| Dell XPS 13 9315, i5-1230U | |
| CrossMark / Overall | |
| Dell XPS 13 Plus 9320 i7-1280P OLED | |
| Medio Intel Core i7-1280P, Intel Iris Xe Graphics G7 96EUs (1677 - 1773, n=4) | |
| Dell XPS 13 Plus 9320 4K | |
| Media de la clase Subnotebook (365 - 2356, n=59, últimos 2 años) | |
| Dell XPS 13 Plus 9320 i5-1240p | |
| Dell XPS 13 9315, i5-1230U | |
| CrossMark / Productivity | |
| Dell XPS 13 Plus 9320 i7-1280P OLED | |
| Medio Intel Core i7-1280P, Intel Iris Xe Graphics G7 96EUs (1585 - 1709, n=4) | |
| Media de la clase Subnotebook (364 - 2277, n=59, últimos 2 años) | |
| Dell XPS 13 Plus 9320 4K | |
| Dell XPS 13 Plus 9320 i5-1240p | |
| Dell XPS 13 9315, i5-1230U | |
| CrossMark / Creativity | |
| Dell XPS 13 Plus 9320 i7-1280P OLED | |
| Medio Intel Core i7-1280P, Intel Iris Xe Graphics G7 96EUs (1849 - 1928, n=4) | |
| Media de la clase Subnotebook (372 - 2743, n=59, últimos 2 años) | |
| Dell XPS 13 Plus 9320 4K | |
| Dell XPS 13 Plus 9320 i5-1240p | |
| Dell XPS 13 9315, i5-1230U | |
| CrossMark / Responsiveness | |
| Medio Intel Core i7-1280P, Intel Iris Xe Graphics G7 96EUs (1394 - 1746, n=4) | |
| Dell XPS 13 Plus 9320 i7-1280P OLED | |
| Dell XPS 13 Plus 9320 4K | |
| Media de la clase Subnotebook (312 - 1854, n=59, últimos 2 años) | |
| Dell XPS 13 Plus 9320 i5-1240p | |
| Dell XPS 13 9315, i5-1230U | |
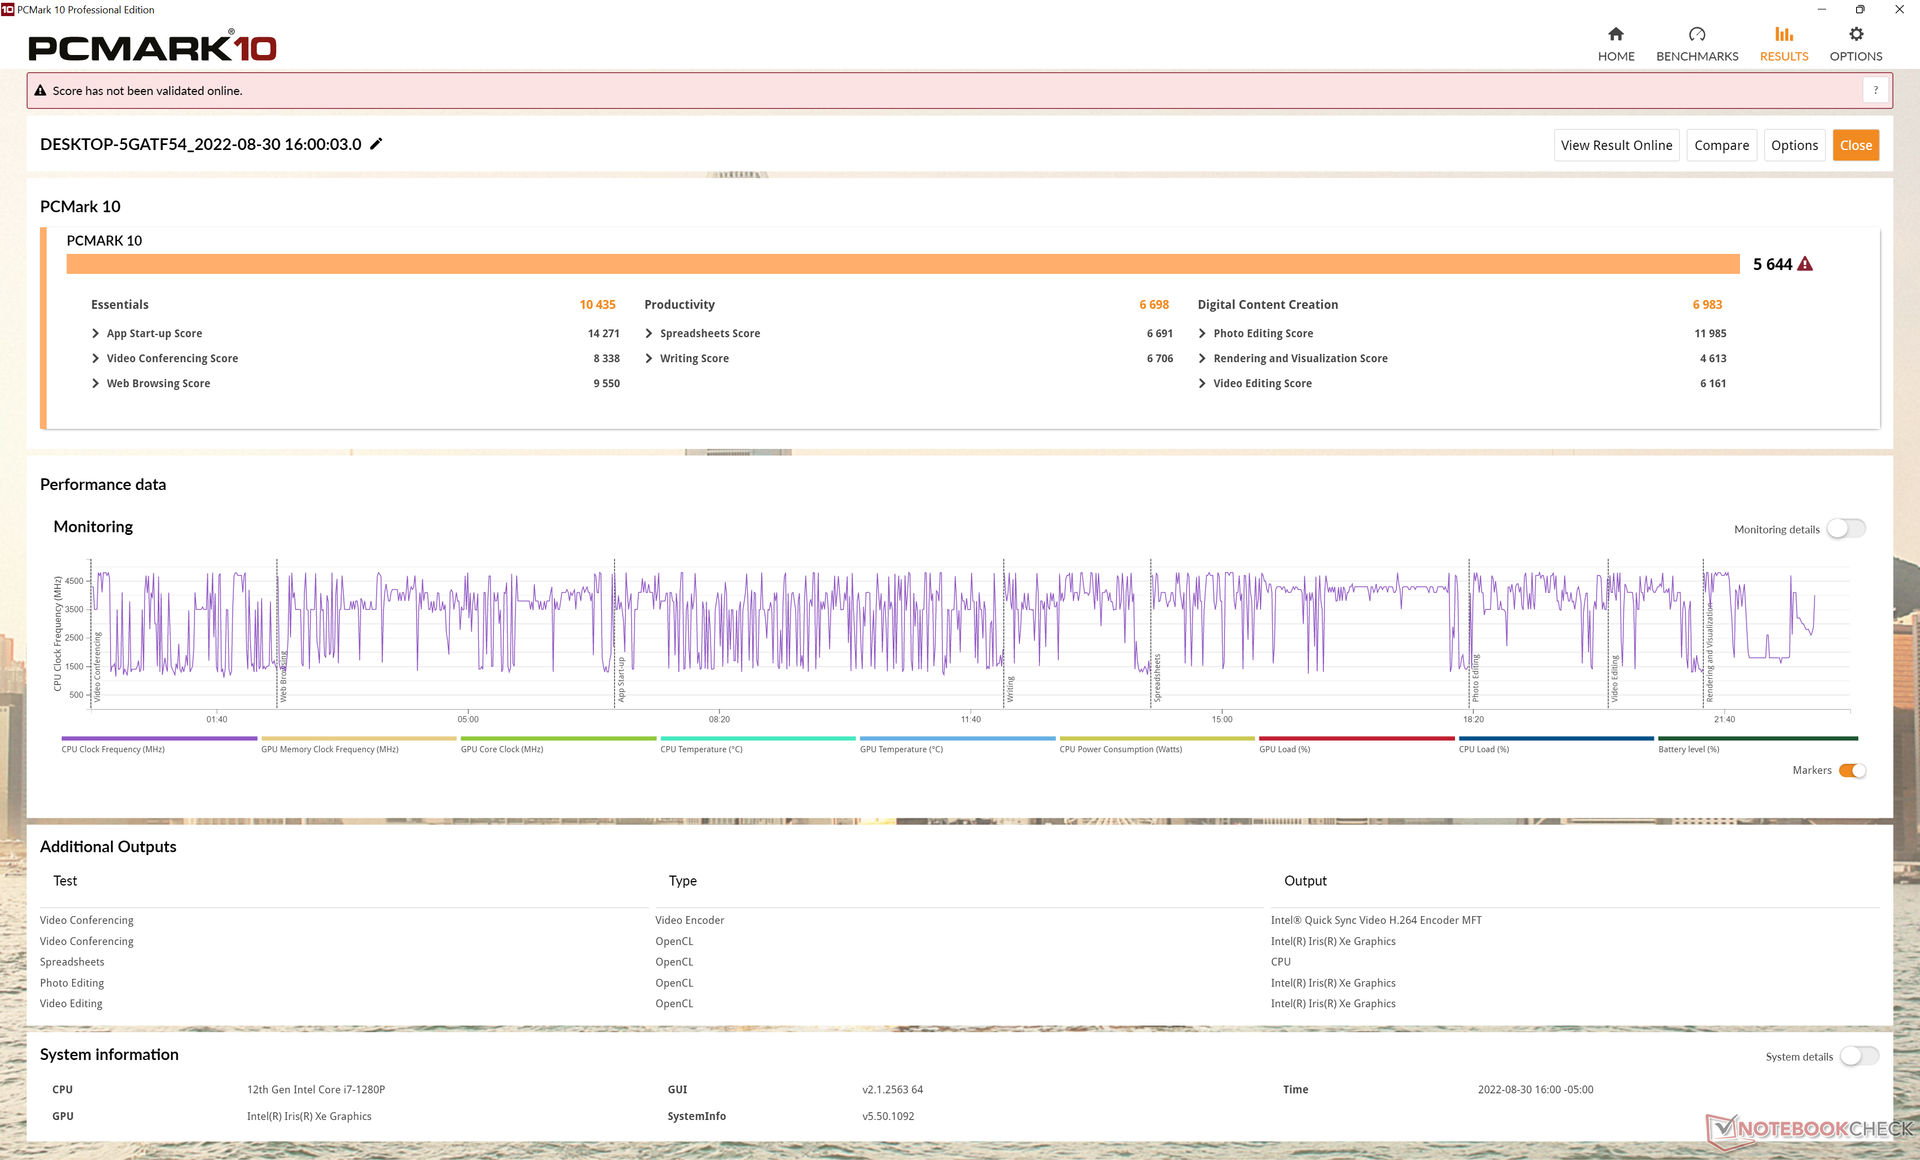
| PCMark 10 Score | 5644 puntos | |
ayuda | ||
| AIDA64 / Memory Copy | |
| Dell XPS 13 Plus 9320 i7-1280P OLED | |
| Dell XPS 13 Plus 9320 4K | |
| Medio Intel Core i7-1280P (56337 - 73486, n=6) | |
| Dell XPS 13 Plus 9320 i5-1240p | |
| Dell XPS 13 9310 2-in-1 | |
| Dell XPS 13 9310 OLED | |
| Dell XPS 13 9315, i5-1230U | |
| AIDA64 / Memory Read | |
| Dell XPS 13 Plus 9320 i7-1280P OLED | |
| Dell XPS 13 Plus 9320 i5-1240p | |
| Medio Intel Core i7-1280P (63221 - 73719, n=6) | |
| Dell XPS 13 Plus 9320 4K | |
| Dell XPS 13 9315, i5-1230U | |
| Dell XPS 13 9310 2-in-1 | |
| Dell XPS 13 9310 OLED | |
| AIDA64 / Memory Write | |
| Dell XPS 13 9310 OLED | |
| Dell XPS 13 9310 2-in-1 | |
| Dell XPS 13 Plus 9320 i7-1280P OLED | |
| Medio Intel Core i7-1280P (58729 - 68247, n=6) | |
| Dell XPS 13 Plus 9320 4K | |
| Dell XPS 13 9315, i5-1230U | |
| Dell XPS 13 Plus 9320 i5-1240p | |
| AIDA64 / Memory Latency | |
| Dell XPS 13 9310 OLED | |
| Medio Intel Core i7-1280P (93.1 - 153.3, n=6) | |
| Dell XPS 13 Plus 9320 i7-1280P OLED | |
| Dell XPS 13 9310 2-in-1 | |
| Dell XPS 13 9315, i5-1230U | |
* ... más pequeño es mejor
Latencia del CPD
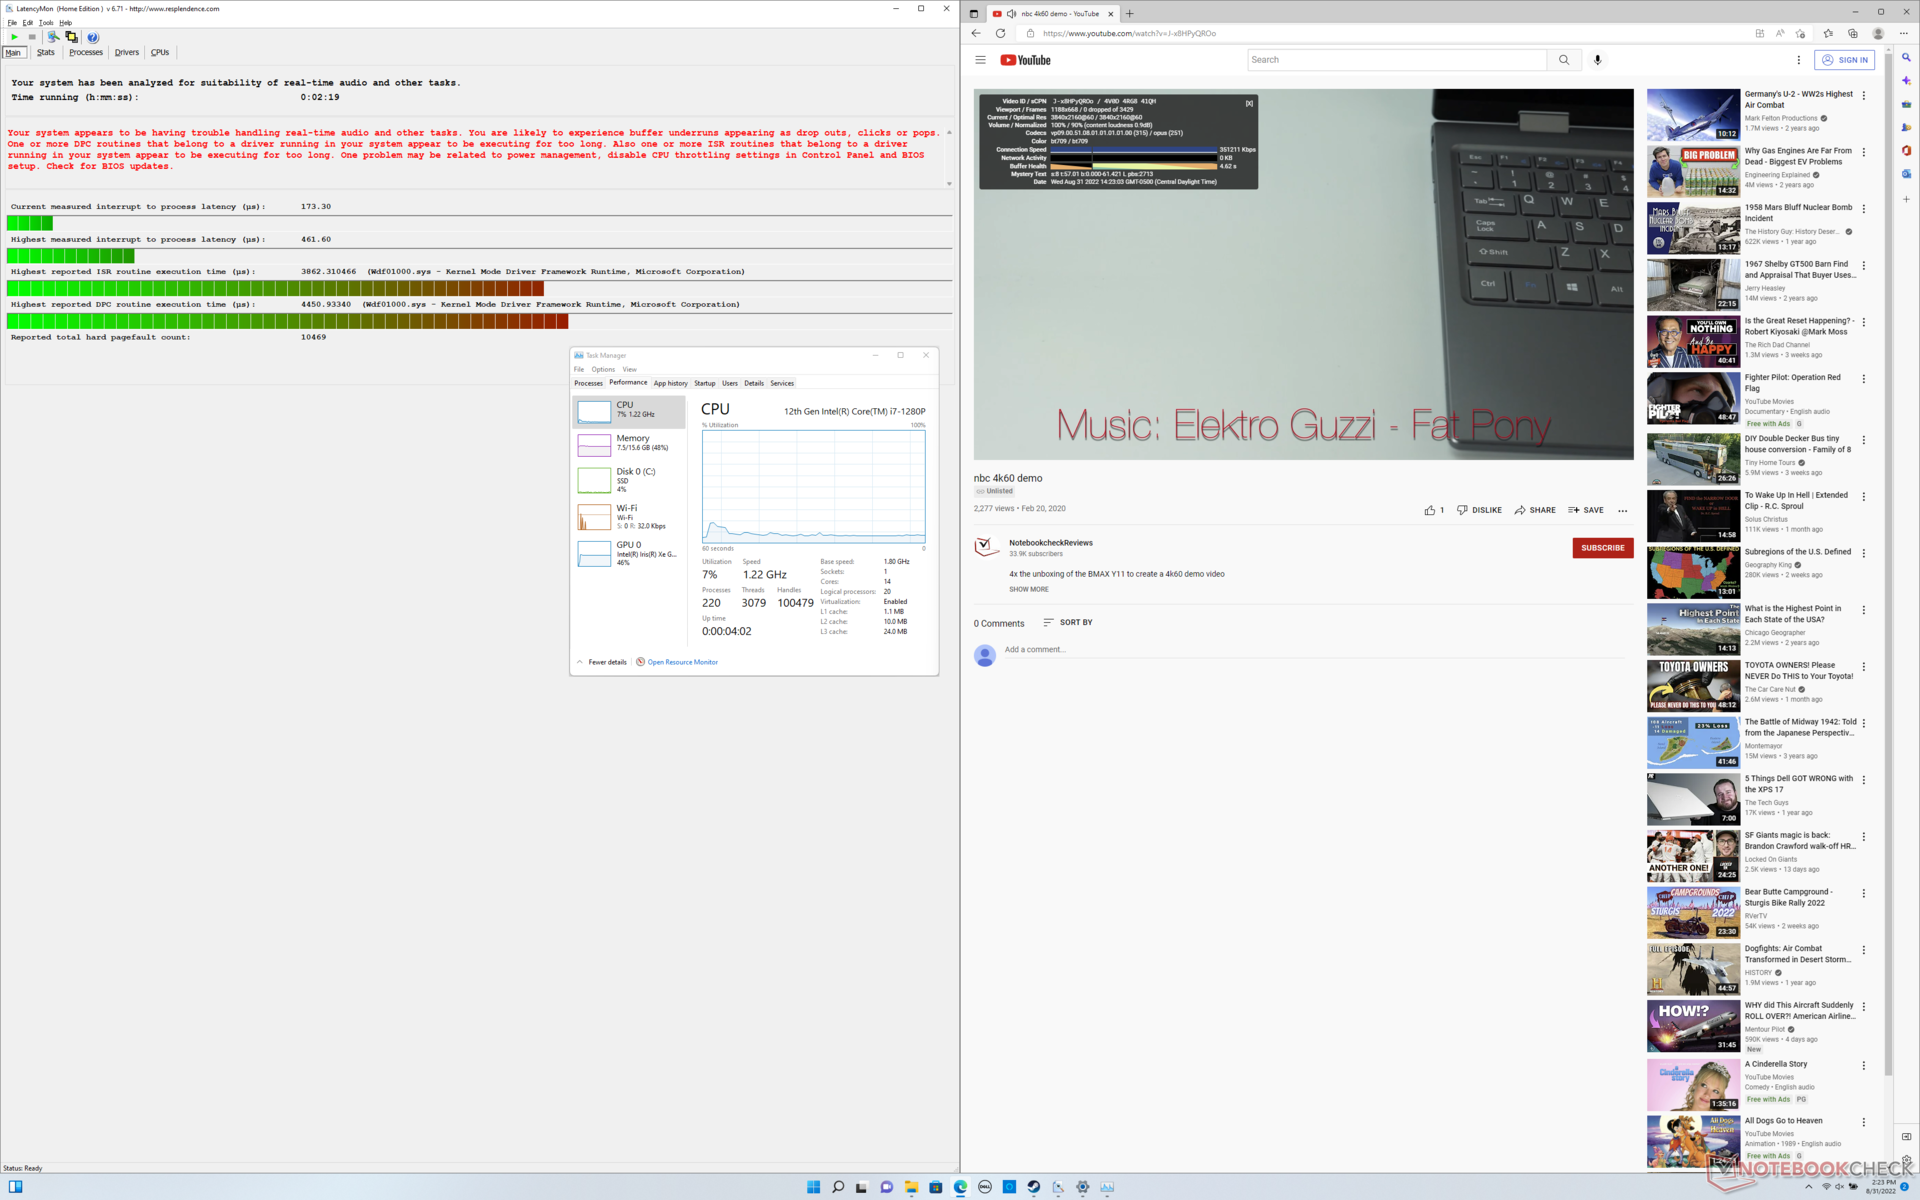
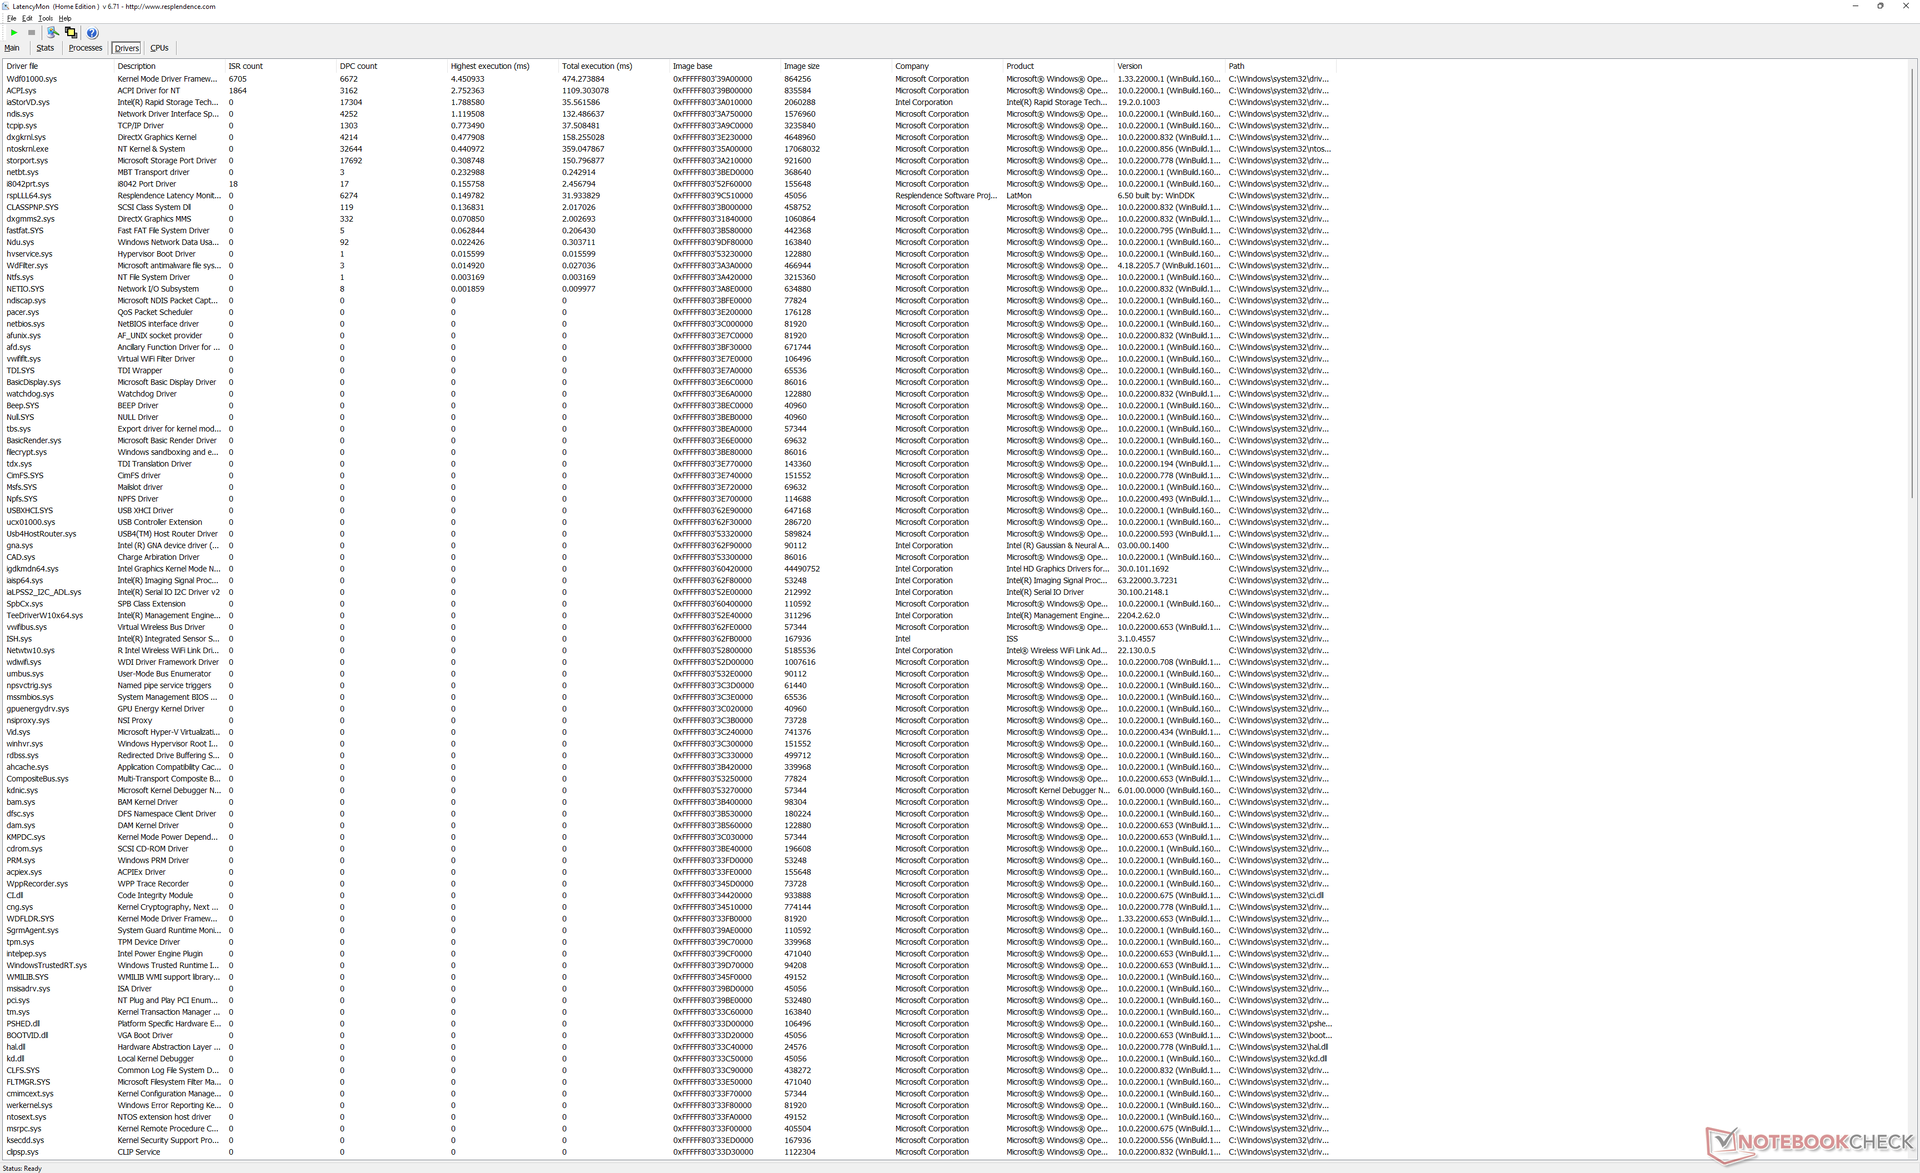
| DPC Latencies / LatencyMon - interrupt to process latency (max), Web, Youtube, Prime95 | |
| Dell XPS 13 9315, i5-1230U | |
| Dell XPS 13 Plus 9320 i5-1240p | |
| Dell XPS 13 9310 OLED | |
| Dell XPS 13 Plus 9320 4K | |
| Dell XPS 13 9310 2-in-1 | |
| Dell XPS 13 Plus 9320 i7-1280P OLED | |
* ... más pequeño es mejor
Dispositivos de almacenamiento
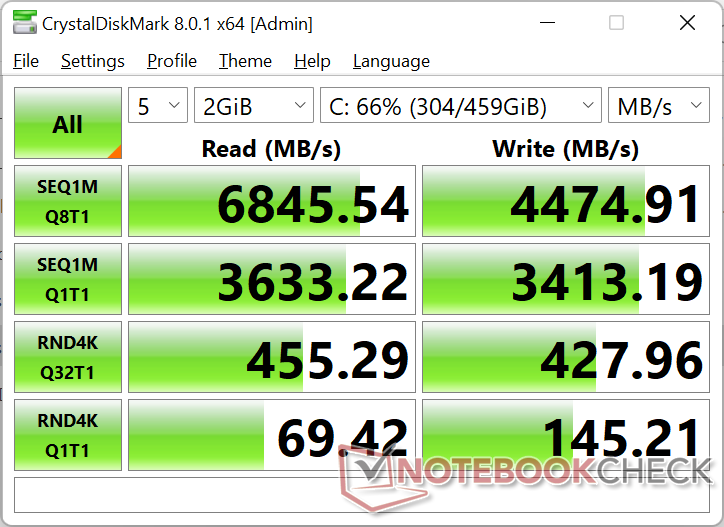
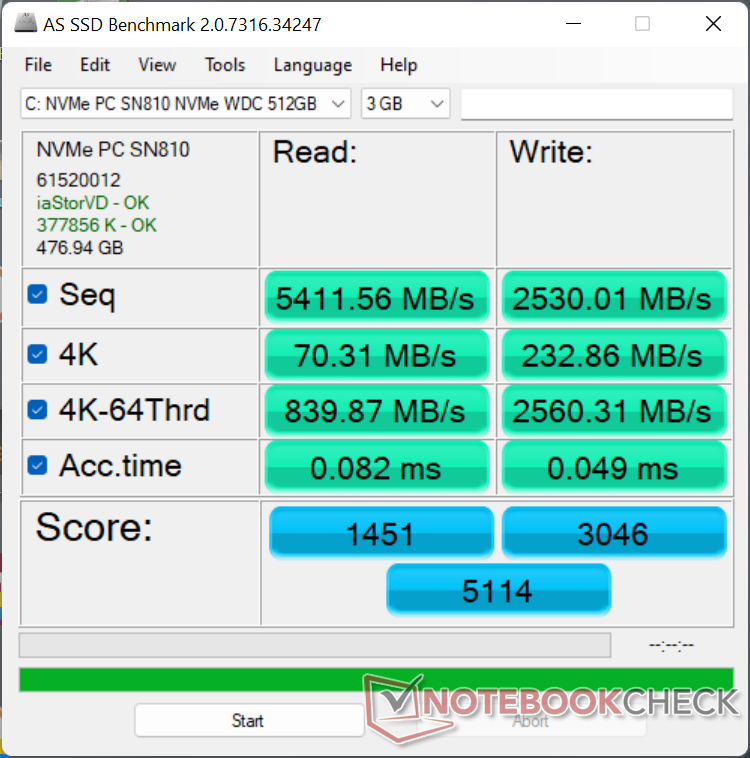
Parece que Dell se abastece de SSDs de varios fabricantes para su serie XPS 13 Plus. Mientras que nuestras dos unidades de prueba anteriores se enviaban con SSDs Micron 3400 o Samsung PM9A1 PCIe4 x4 NVMe, nuestra unidad de prueba i7-1280P se enviaba con el Western Digital SN810 en su lugar. Por desgracia, esta unidad WD parece ser inferior a la Samsung o Micron, ya que el rendimiento se reduce a sólo 3000 MB/s cuando se ejecuta DiskSpd en un bucle, como se muestra en nuestro gráfico a continuación. En comparación, las unidades Samsung o Micron mostrarían tasas de transferencia estables cuando se someten a la misma prueba de estrés.

| Drive Performance rating - Percent | |
| Dell XPS 13 Plus 9320 i7-1280P OLED | |
| Dell XPS 13 Plus 9320 4K | |
| Dell XPS 13 9310 OLED | |
| Dell XPS 13 Plus 9320 i5-1240p | |
| Dell XPS 13 9315, i5-1230U | |
| Dell XPS 13 9310 2-in-1 | |
* ... más pequeño es mejor
Disk Throttling: DiskSpd Read Loop, Queue Depth 8
Rendimiento de la GPU
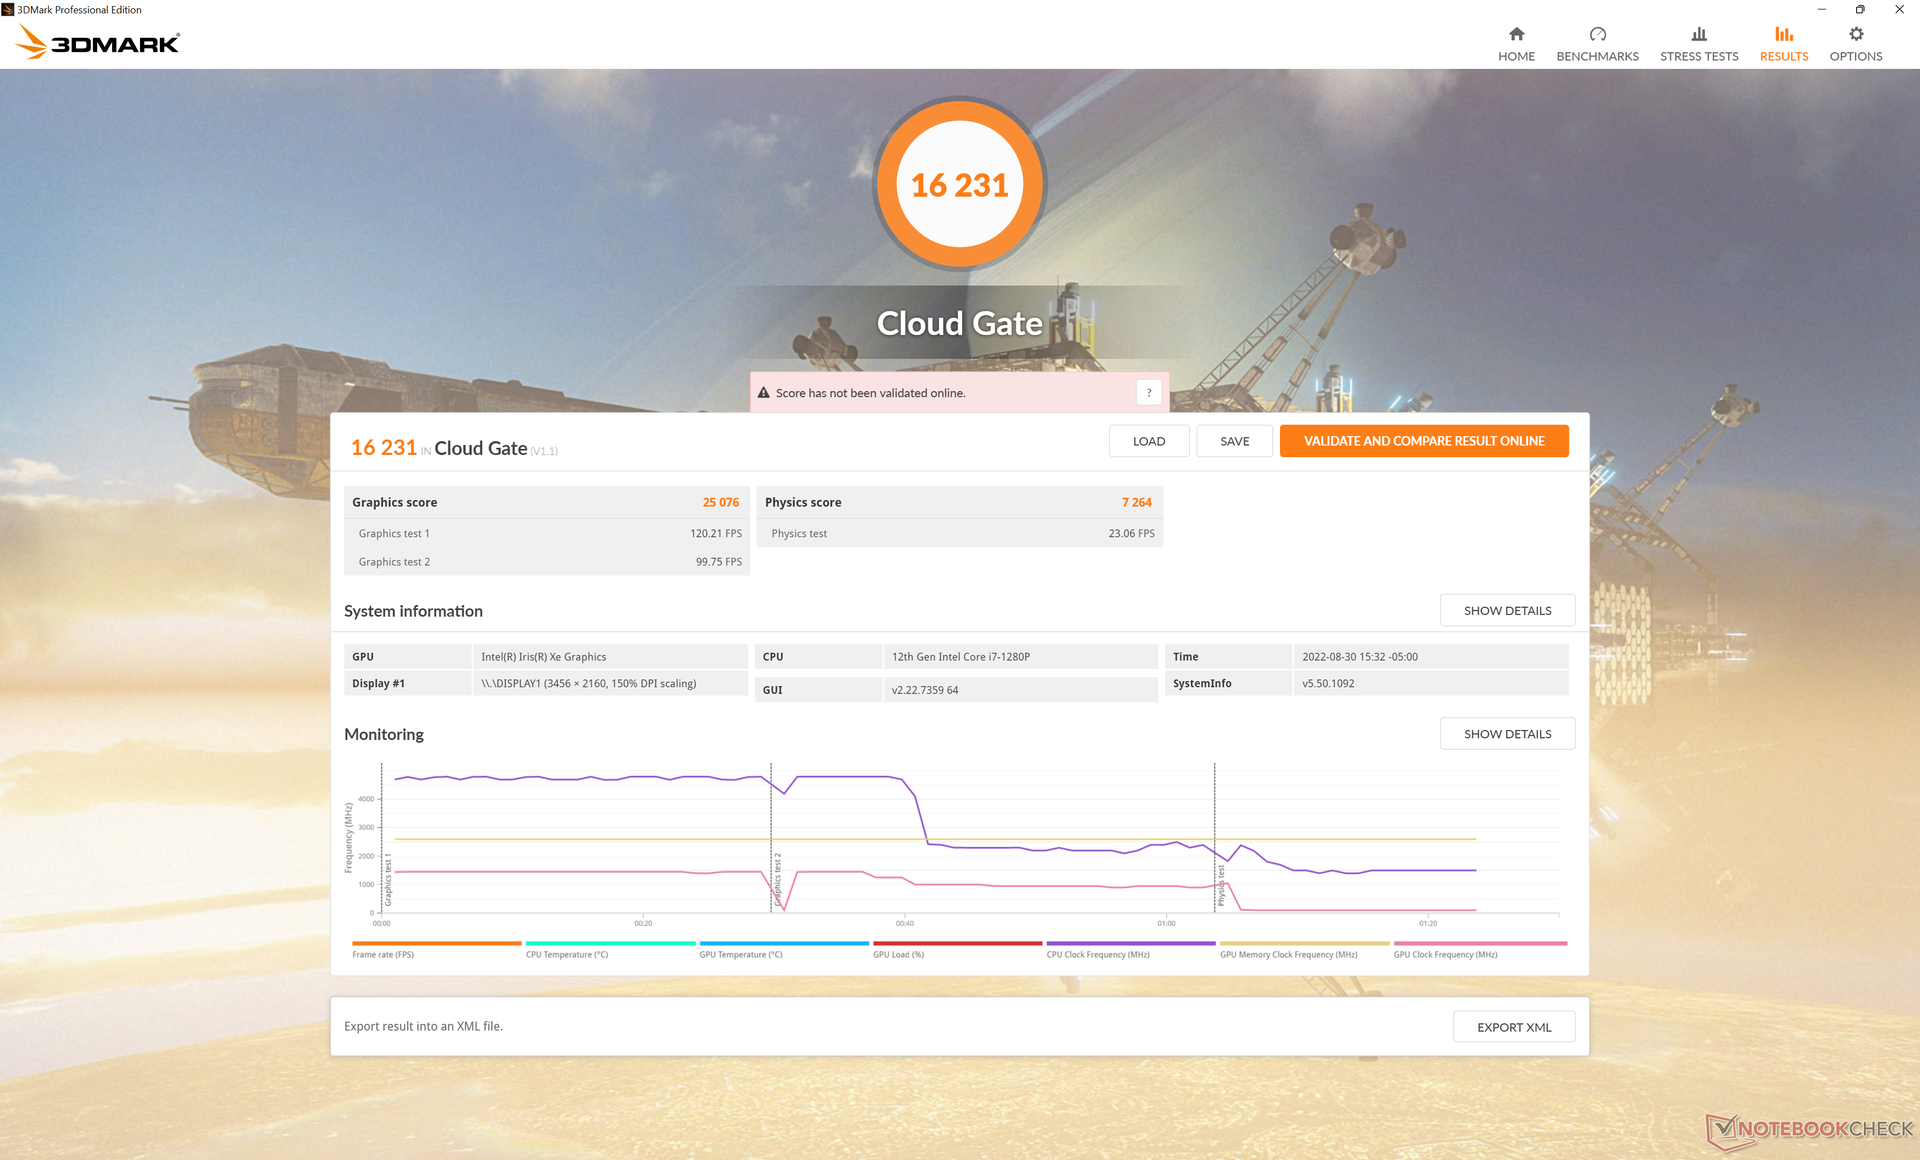
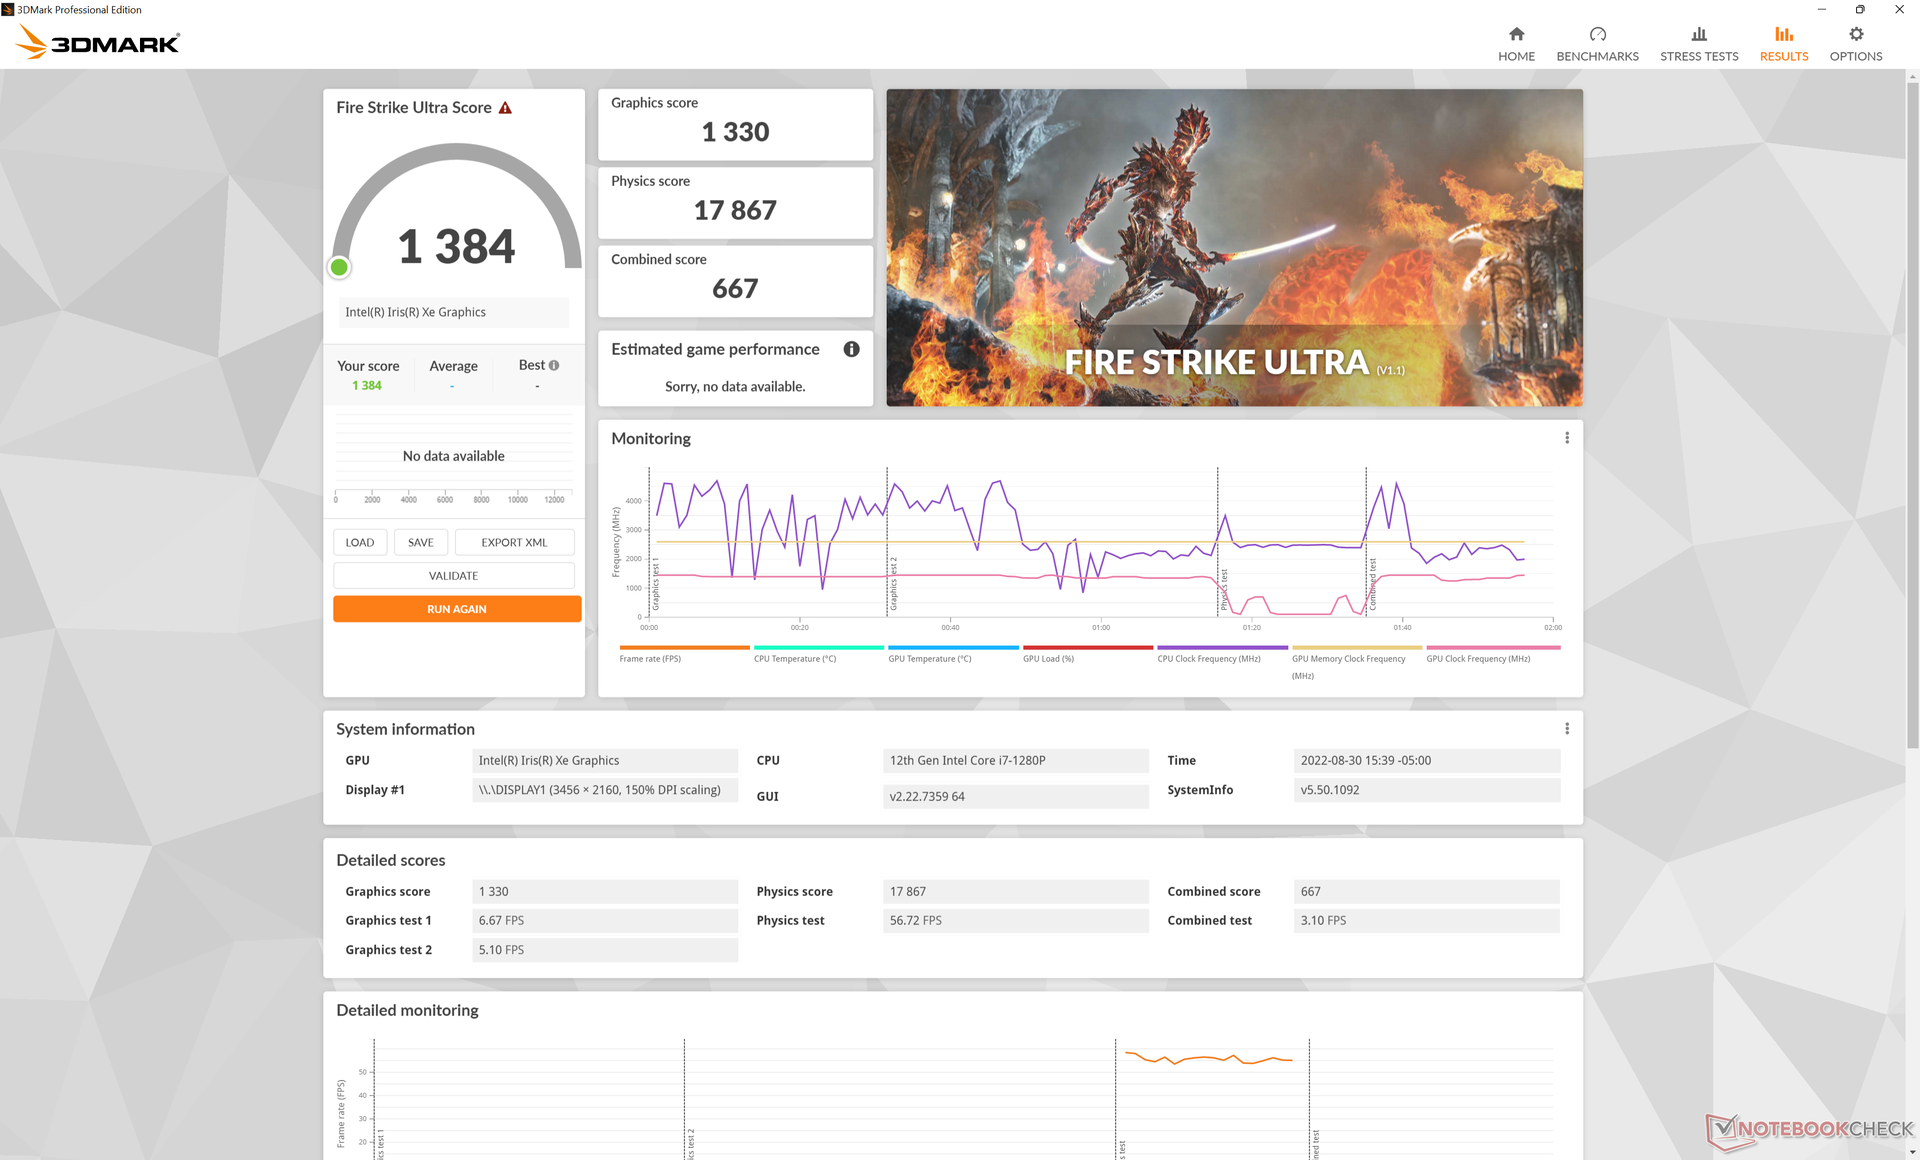
El rendimiento gráfico es esencialmente idéntico al de la configuración Core i7-1260P. Cuando se compara con la opción Core i5-1240P con 8 GB de RAM y Iris Xe 80 UEsin embargo, nuestros Iris Xe 96 EUs es aproximadamente entre un 30 y un 65 por ciento más rápido. Si quieres maximizar el rendimiento de la GPU, deberás configurarla con al menos 16 GB de RAM y una CPU Core i7.
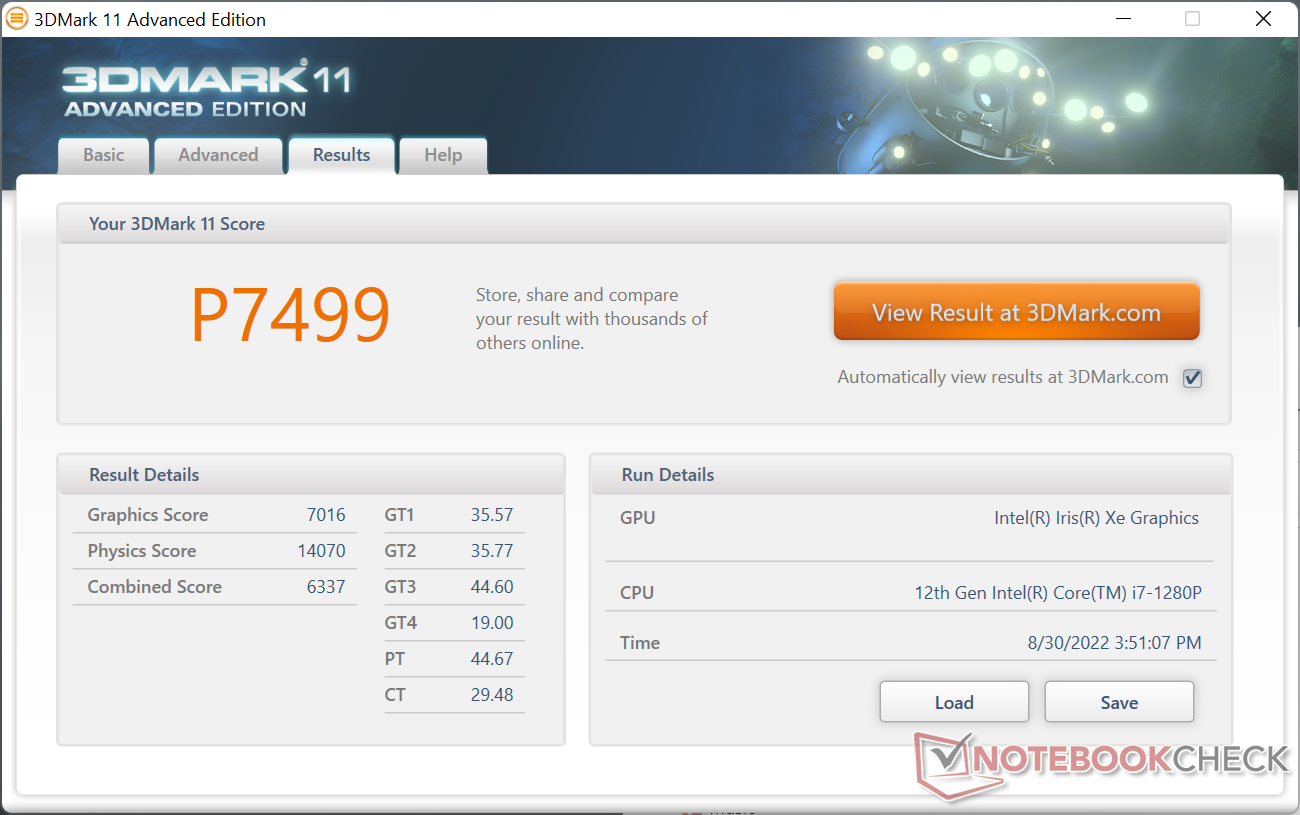
| 3DMark 11 Performance | 7499 puntos | |
| 3DMark Cloud Gate Standard Score | 16231 puntos | |
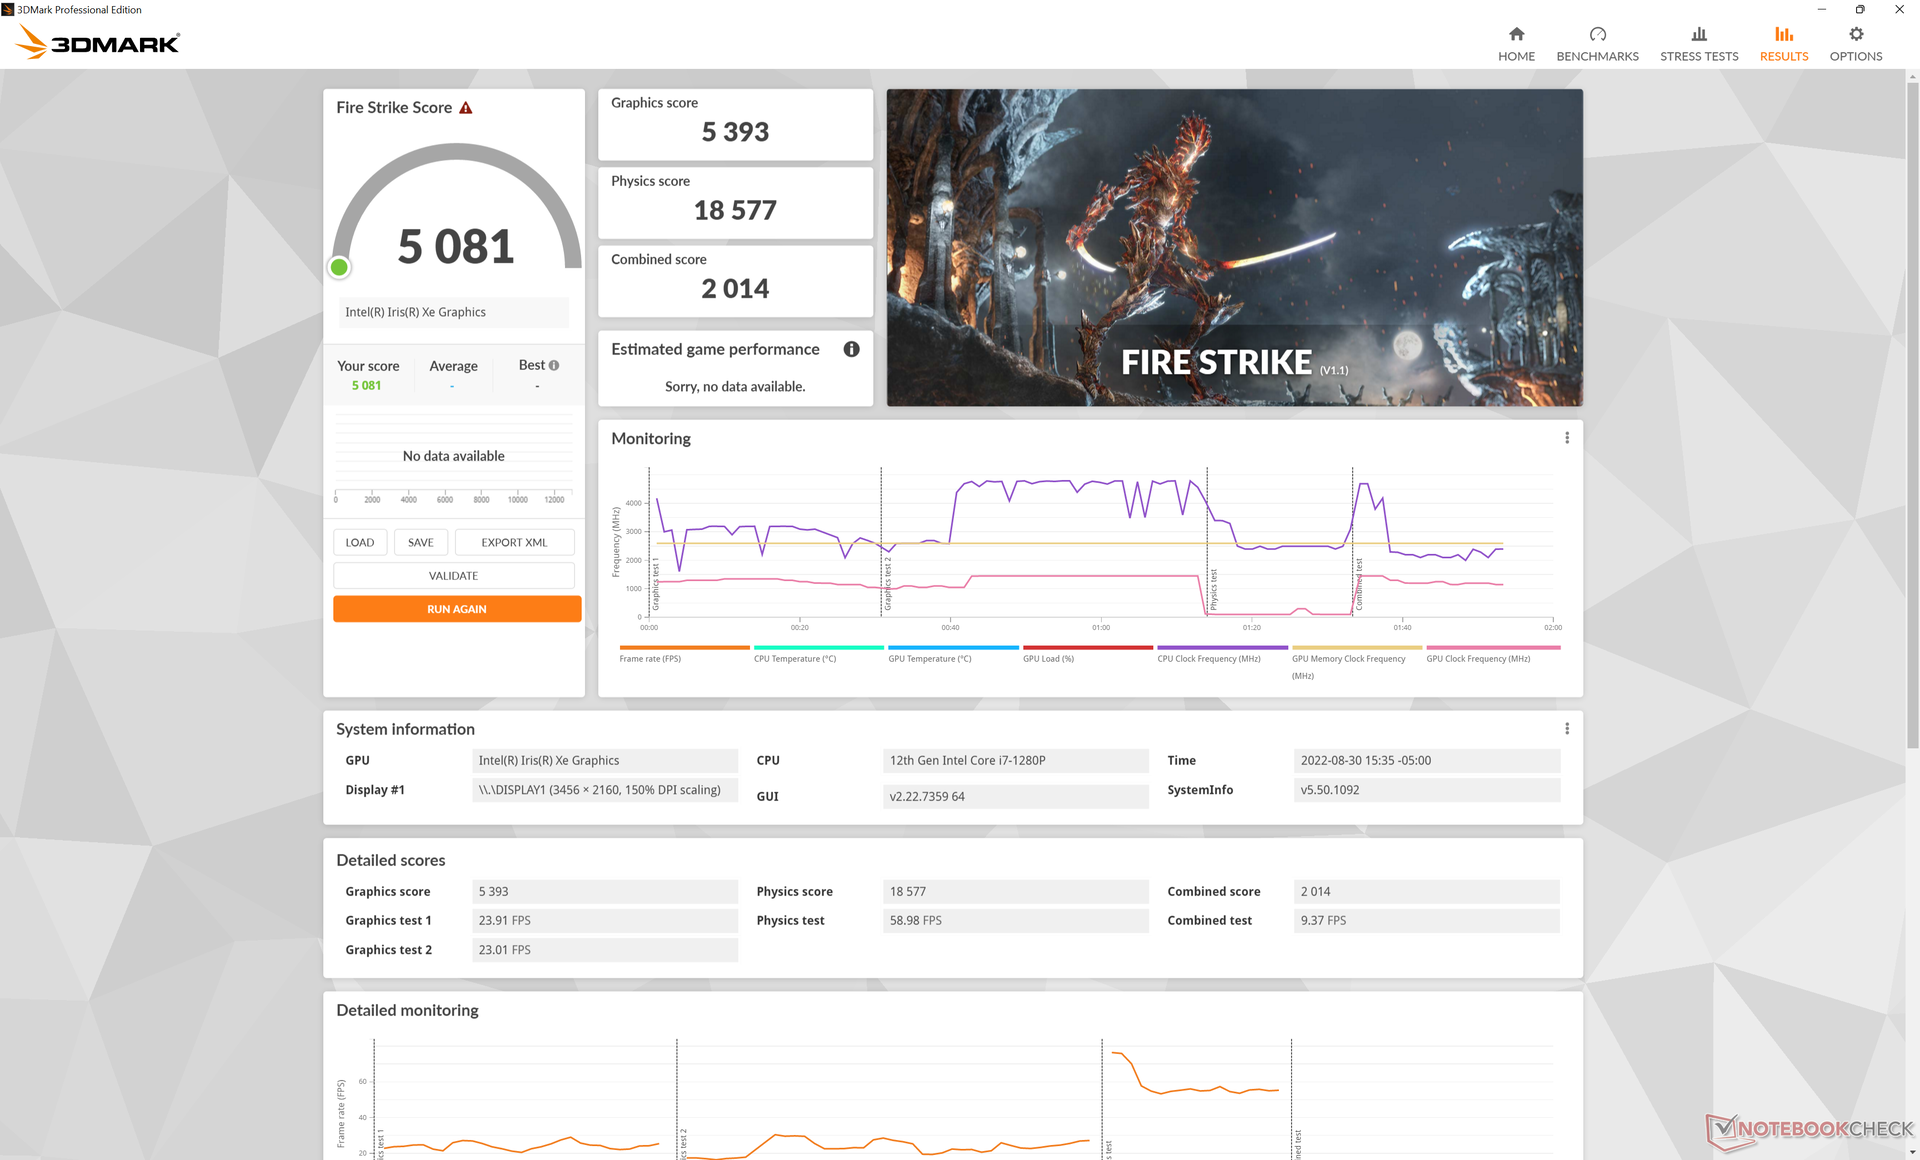
| 3DMark Fire Strike Score | 5081 puntos | |
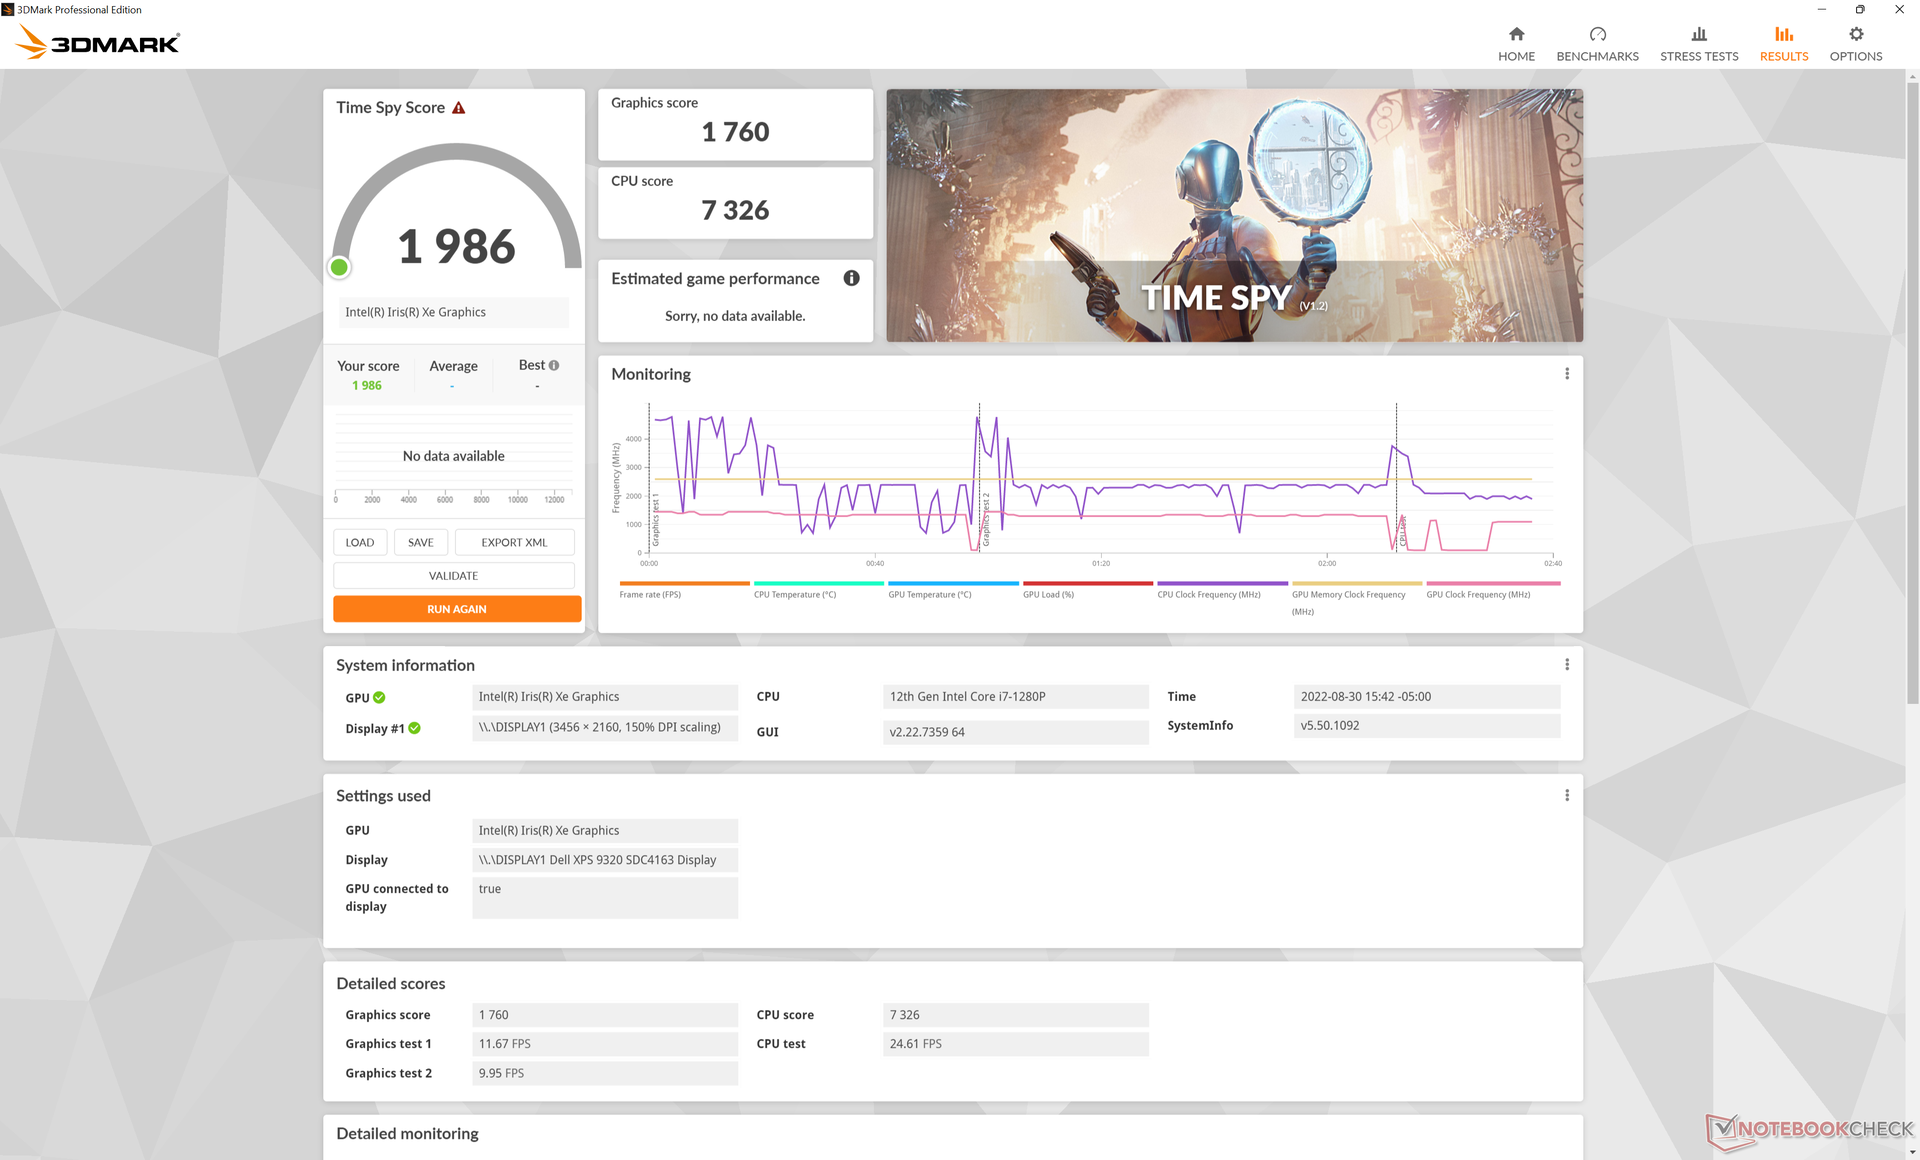
| 3DMark Time Spy Score | 1986 puntos | |
ayuda | ||
| Cyberpunk 2077 1.6 | |
| 1920x1080 Low Preset | |
| Dell XPS 13 Plus 9320 i7-1280P OLED | |
| Medio Intel Iris Xe Graphics G7 96EUs (13 - 25.9, n=42) | |
| 1920x1080 Medium Preset | |
| Dell XPS 13 Plus 9320 i7-1280P OLED | |
| Medio Intel Iris Xe Graphics G7 96EUs (10.8 - 21.7, n=37) | |
| 1920x1080 High Preset | |
| Dell XPS 13 Plus 9320 i7-1280P OLED | |
| Medio Intel Iris Xe Graphics G7 96EUs (9.8 - 16.9, n=34) | |
| 1920x1080 Ultra Preset | |
| Dell XPS 13 Plus 9320 i7-1280P OLED | |
| Medio Intel Iris Xe Graphics G7 96EUs (7.4 - 16.8, n=32) | |
Witcher 3 FPS Chart
| bajo | medio | alto | ultra | |
|---|---|---|---|---|
| GTA V (2015) | 123.7 | 108.7 | 27.6 | 11.5 |
| The Witcher 3 (2015) | 104.8 | 65.7 | 36.9 | 16.4 |
| Dota 2 Reborn (2015) | 110.3 | 86.8 | 68.1 | 58.7 |
| Final Fantasy XV Benchmark (2018) | 46.1 | 25.3 | 17.6 | |
| X-Plane 11.11 (2018) | 55.2 | 40.7 | 37.6 | |
| Strange Brigade (2018) | 100.2 | 45.4 | 36.5 | 29.6 |
| Cyberpunk 2077 1.6 (2022) | 20.9 | 17.9 | 13.9 | 11.2 |
Emisiones
Ruido del sistema
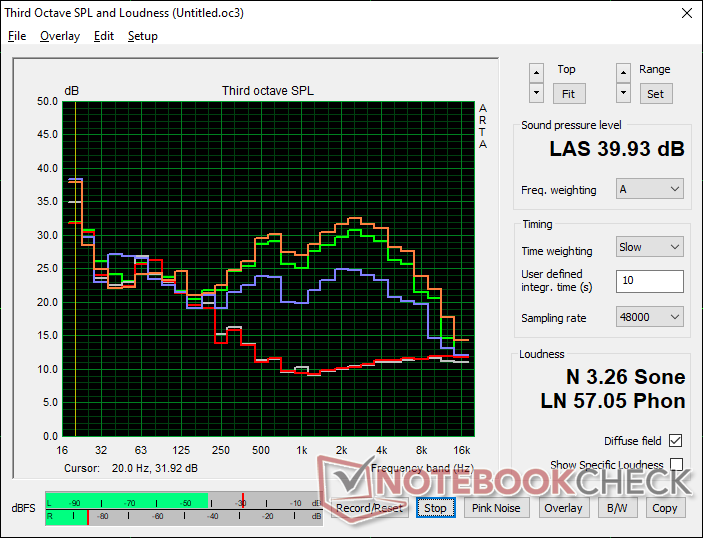
Los dos ventiladores internos son excelentes a la hora de mantenerse silenciosos durante cargas bajas o medias, ya que sólo pudimos medir un ruido de sólo 25,4 dB(A) cuando se navega o se hace streaming de vídeo contra un fondo silencioso de 23,4 dB(A). Las cargas más altas, como los juegos, provocan un ruido de ventilador de entre 35 y 42 dB(A). Extrañamente, no podemos alcanzar el techo de 45.5 dB(A) que registramos en la configuración i7-1260P incluso cuando se pone en modo Ultra Performance. Los resultados generales se acercan más a lo que registramos en el antiguo XPS 13 9310 2-en-1.
Ruido
| Ocioso |
| 23.4 / 23.4 / 23.4 dB(A) |
| Carga |
| 35 / 39.9 dB(A) |
 | ||
30 dB silencioso 40 dB(A) audible 50 dB(A) ruidosamente alto |
||
min: | ||
| Dell XPS 13 Plus 9320 i7-1280P OLED Iris Xe G7 96EUs, i7-1280P, WDC PC SN810 512GB | Dell XPS 13 Plus 9320 i5-1240p Iris Xe G7 80EUs, i5-1240P, Micron 3400 MTFDKBA512TFH 512GB | Dell XPS 13 9315, i5-1230U Iris Xe G7 80EUs, i5-1230U, Micron 3460 256 GB Soldered | Dell XPS 13 Plus 9320 4K Iris Xe G7 96EUs, i7-1260P, Samsung PM9A1 MZVL21T0HCLR | Dell XPS 13 9310 2-in-1 Iris Xe G7 96EUs, i7-1165G7, Toshiba BG4 KBG40ZPZ512G | Dell XPS 13 9310 OLED Iris Xe G7 96EUs, i7-1185G7, Toshiba XG6 KXG60ZNV512G | |
|---|---|---|---|---|---|---|
| Noise | -13% | -8% | -8% | -4% | 4% | |
| apagado / medio ambiente * (dB) | 23.4 | 26 -11% | 26 -11% | 24.4 -4% | 24.3 -4% | 24.8 -6% |
| Idle Minimum * (dB) | 23.4 | 26.2 -12% | 26 -11% | 24.4 -4% | 24.8 -6% | 25 -7% |
| Idle Average * (dB) | 23.4 | 26.2 -12% | 26 -11% | 24.4 -4% | 24.8 -6% | 25 -7% |
| Idle Maximum * (dB) | 23.4 | 26.2 -12% | 27.5 -18% | 25.5 -9% | 24.8 -6% | 25 -7% |
| Load Average * (dB) | 35 | 38.4 -10% | 39.5 -13% | 40.4 -15% | 38 -9% | 25.3 28% |
| Witcher 3 ultra * (dB) | 41.6 | 39.6 5% | 45.5 -9% | 38 9% | 35.8 14% | |
| Load Maximum * (dB) | 39.9 | 47.1 -18% | 39.6 1% | 45.5 -14% | 41.5 -4% | 35.8 10% |
* ... más pequeño es mejor
Prueba de esfuerzo
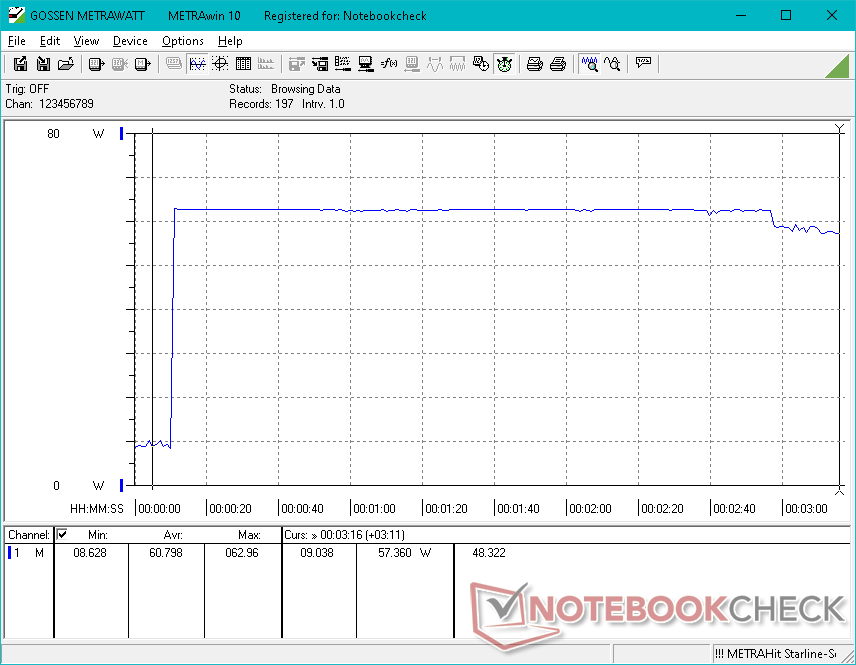
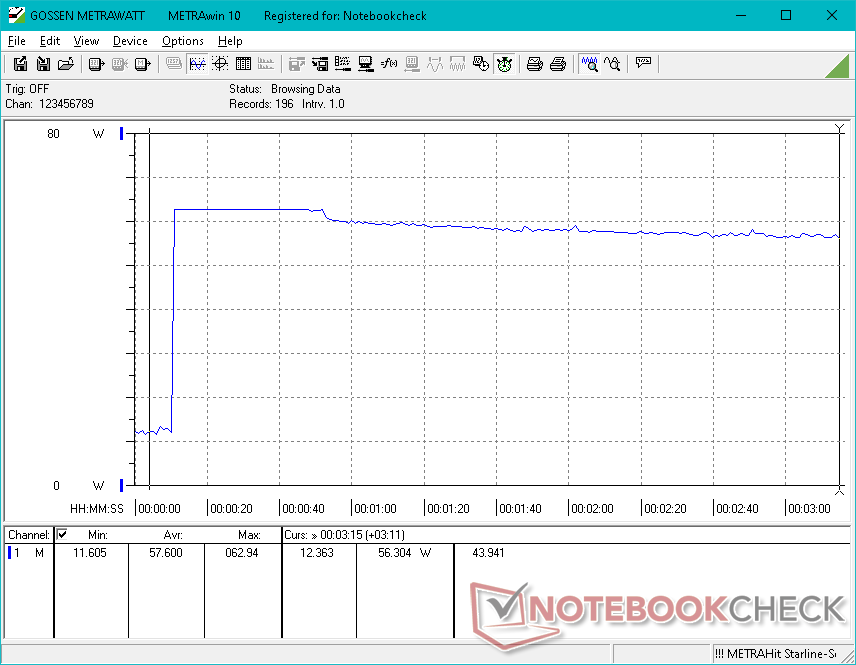
Al iniciar el estrés de Prime95, las velocidades de reloj de la CPU, la temperatura y el consumo de energía de la placa se disparan a 2,9 GHz, 100 C y 64 W, respectivamente, y duran casi 3 minutos. Después, las velocidades de reloj, la temperatura y el consumo de energía de la placa caen y se estabilizan en 1,5 GHz, 85 C y 28 W, respectivamente, como se muestra en la siguiente captura de pantalla. Estos resultados se alinean con nuestra prueba de estrés CineBench R15 xT, en la que la alta puntuación inicial no era sostenible durante largos períodos debido al limitado Turbo Boost del portátil. Curiosamente, el objetivo estable de 28 W es en realidad inferior al objetivo estable de 34 W de la configuración i7-1260P, lo que puede explicar los resultados ligeramente mejores de CineBench R15 xT de nuestra unidad de prueba i7-1260P.
La velocidad de reloj de la GPU y la temperatura se estabilizan en 1147 MHz y 81 C, respectivamente, cuando se ejecutan Witcher 3 para representar cargas gráficas exigentes.
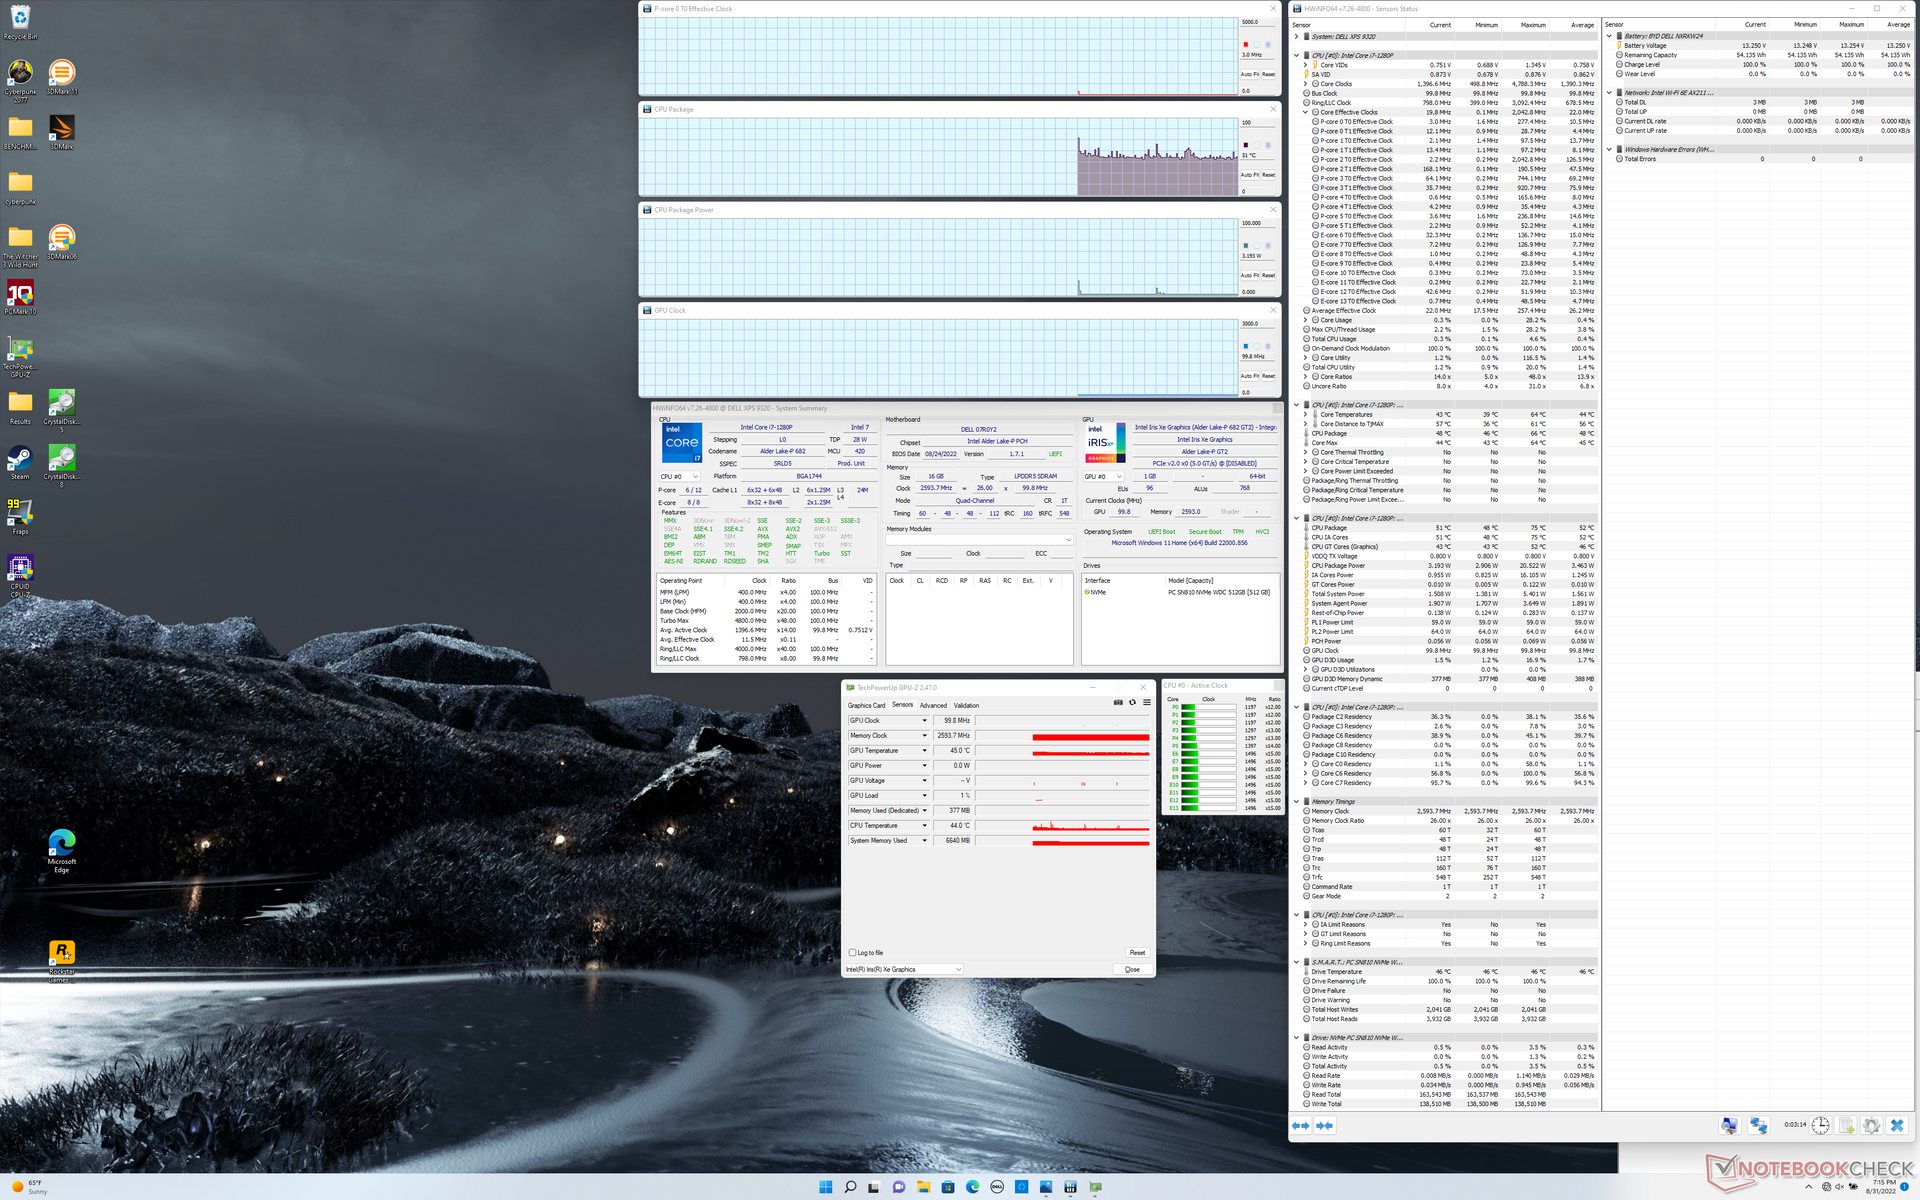
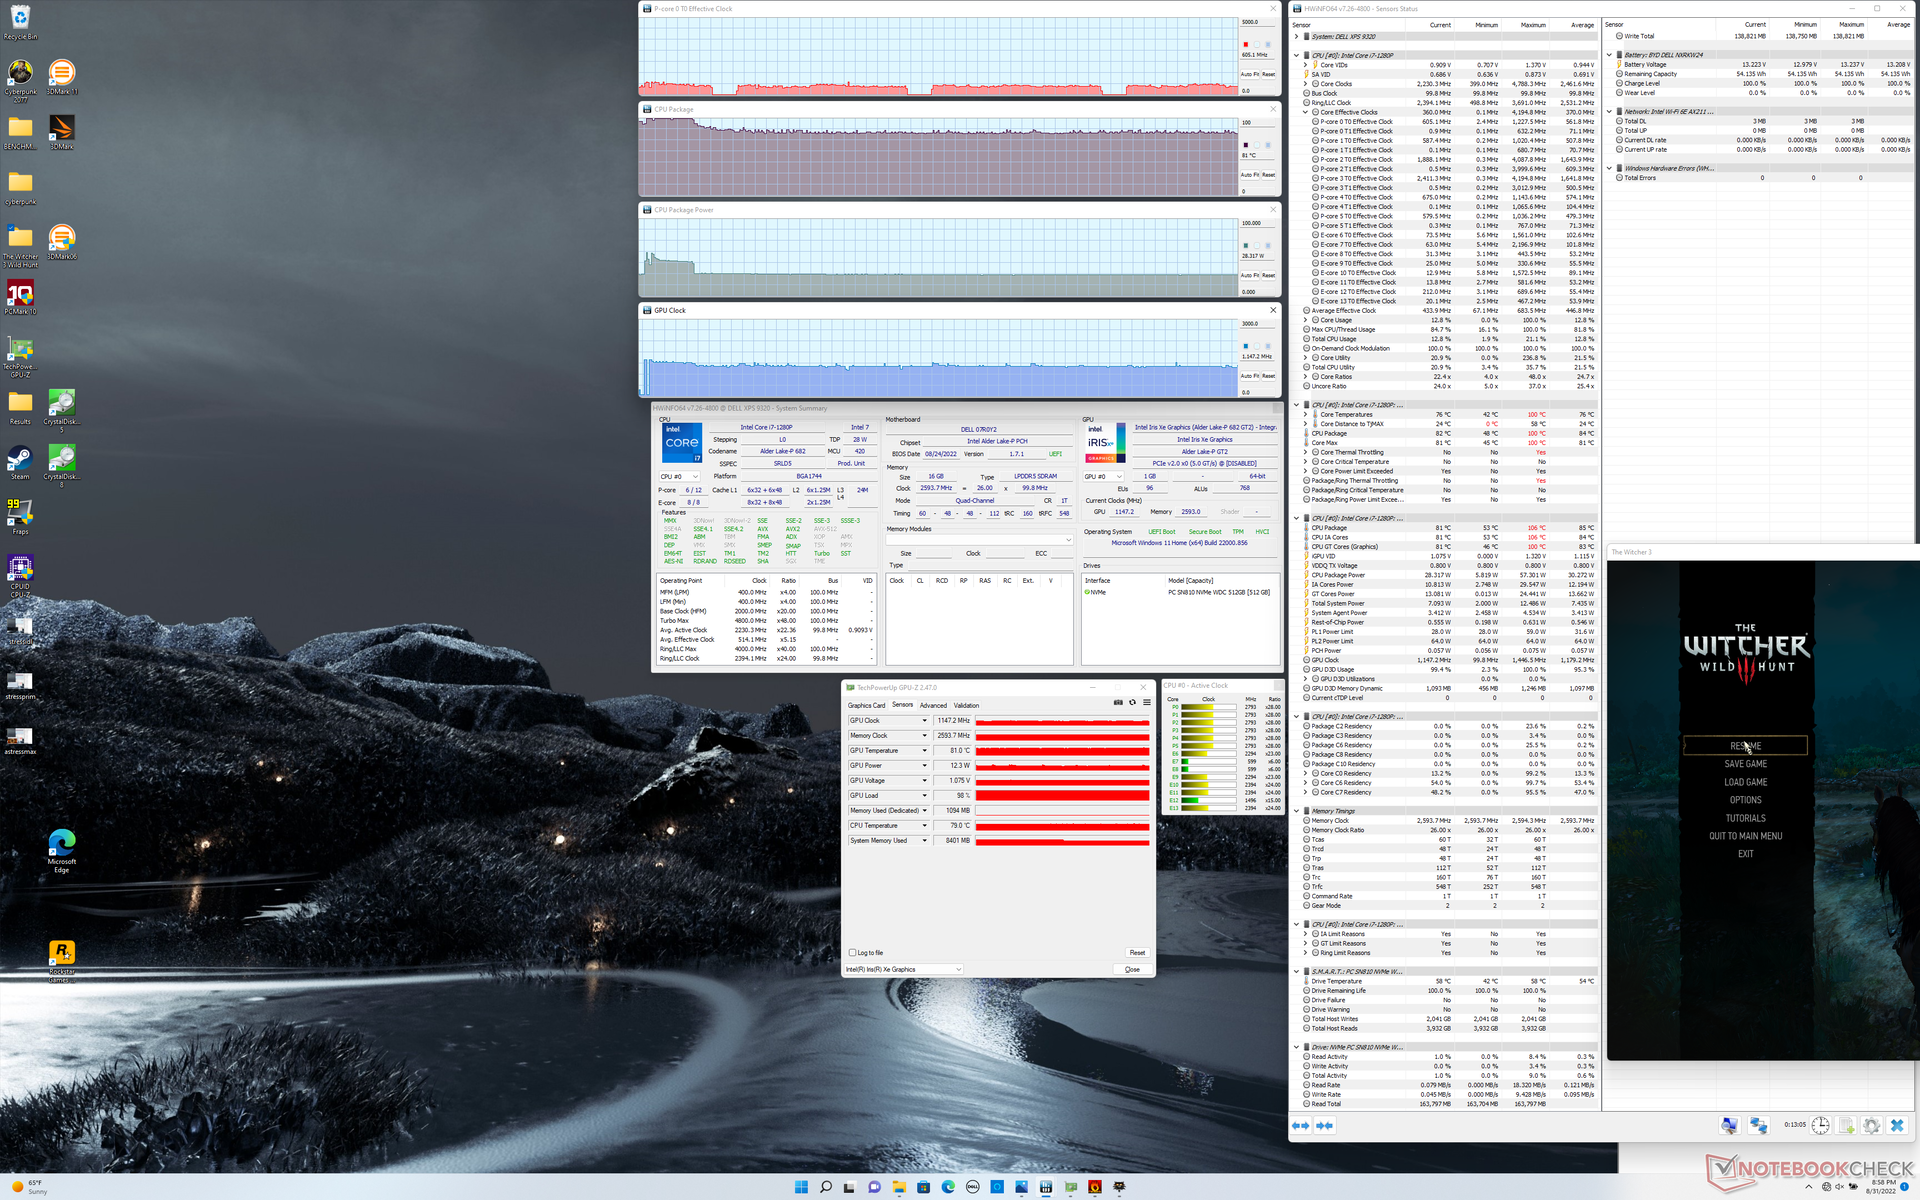
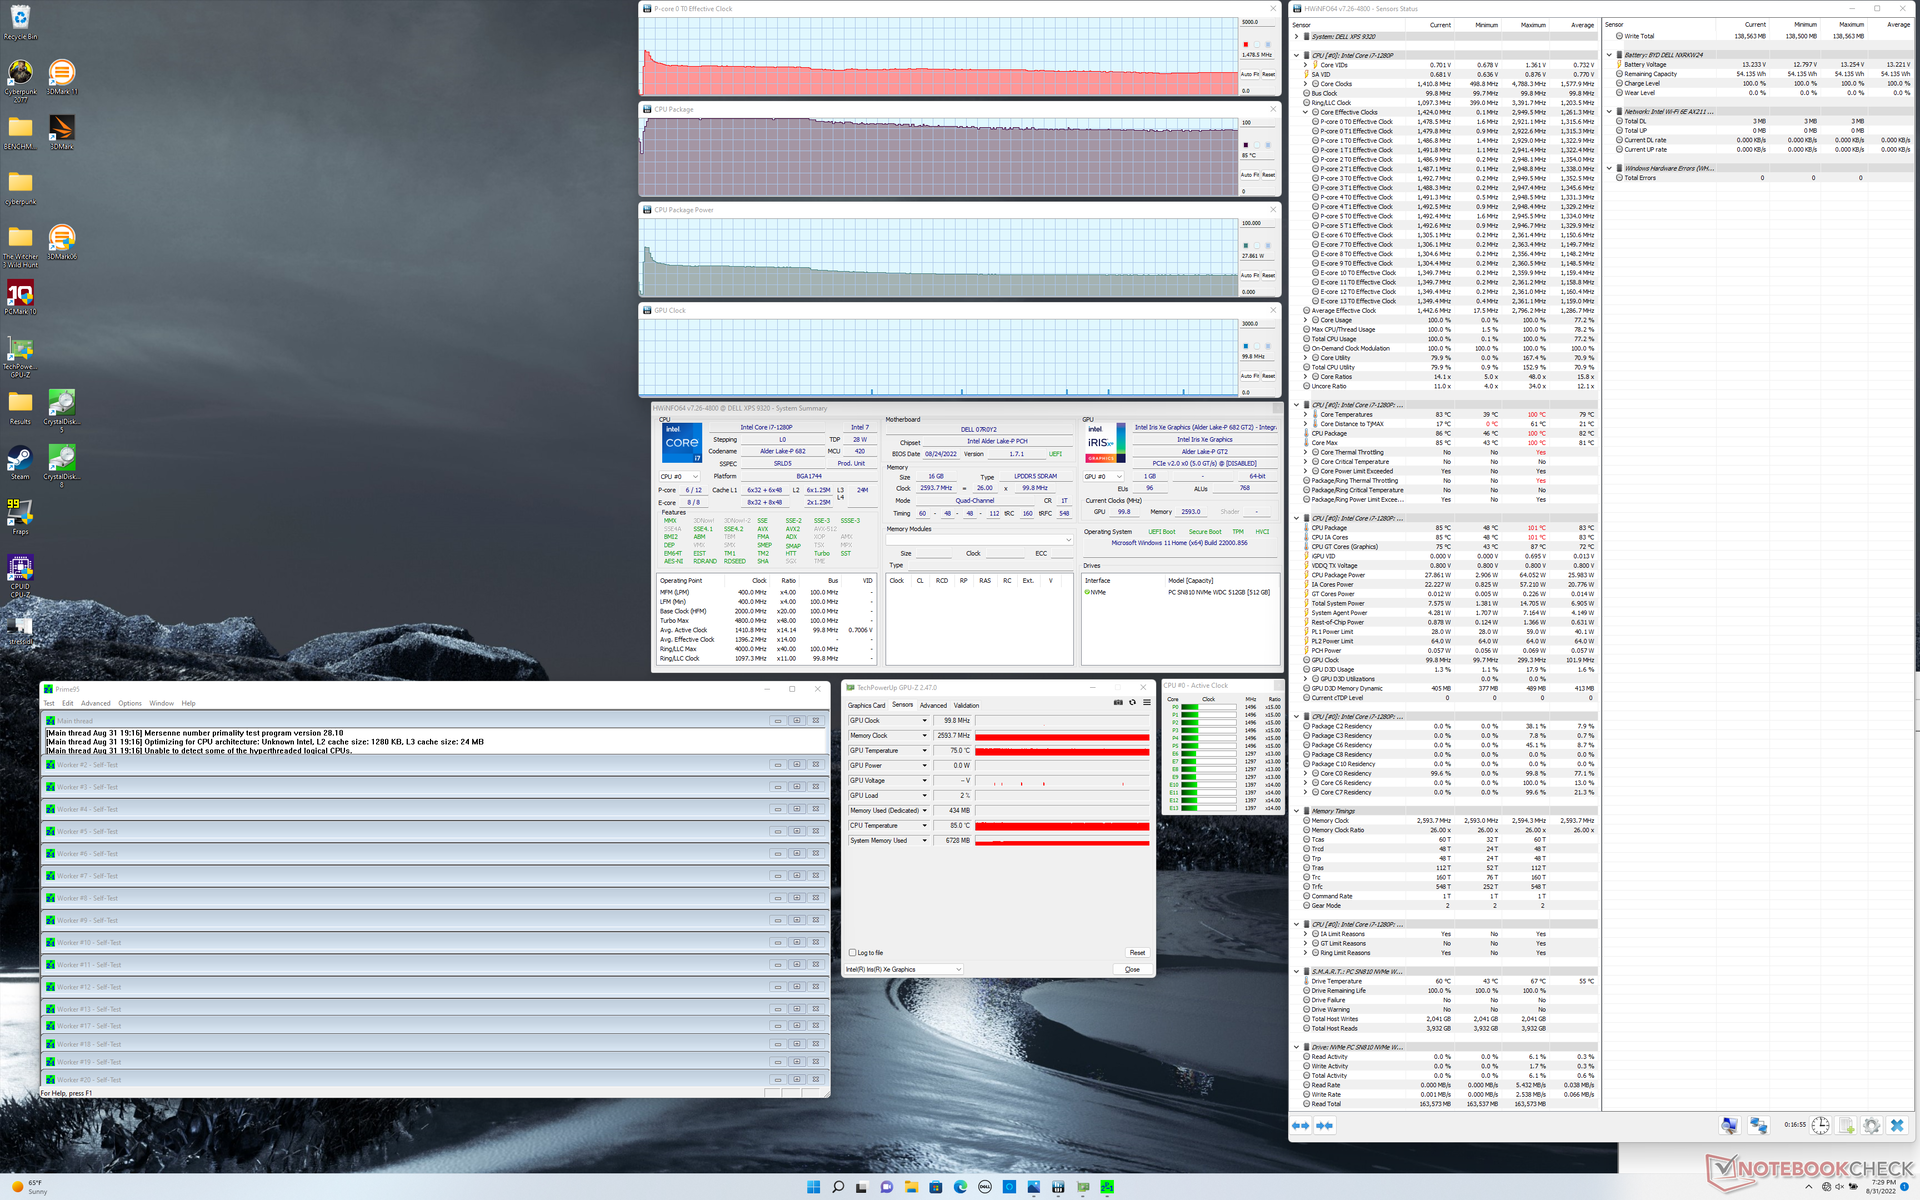
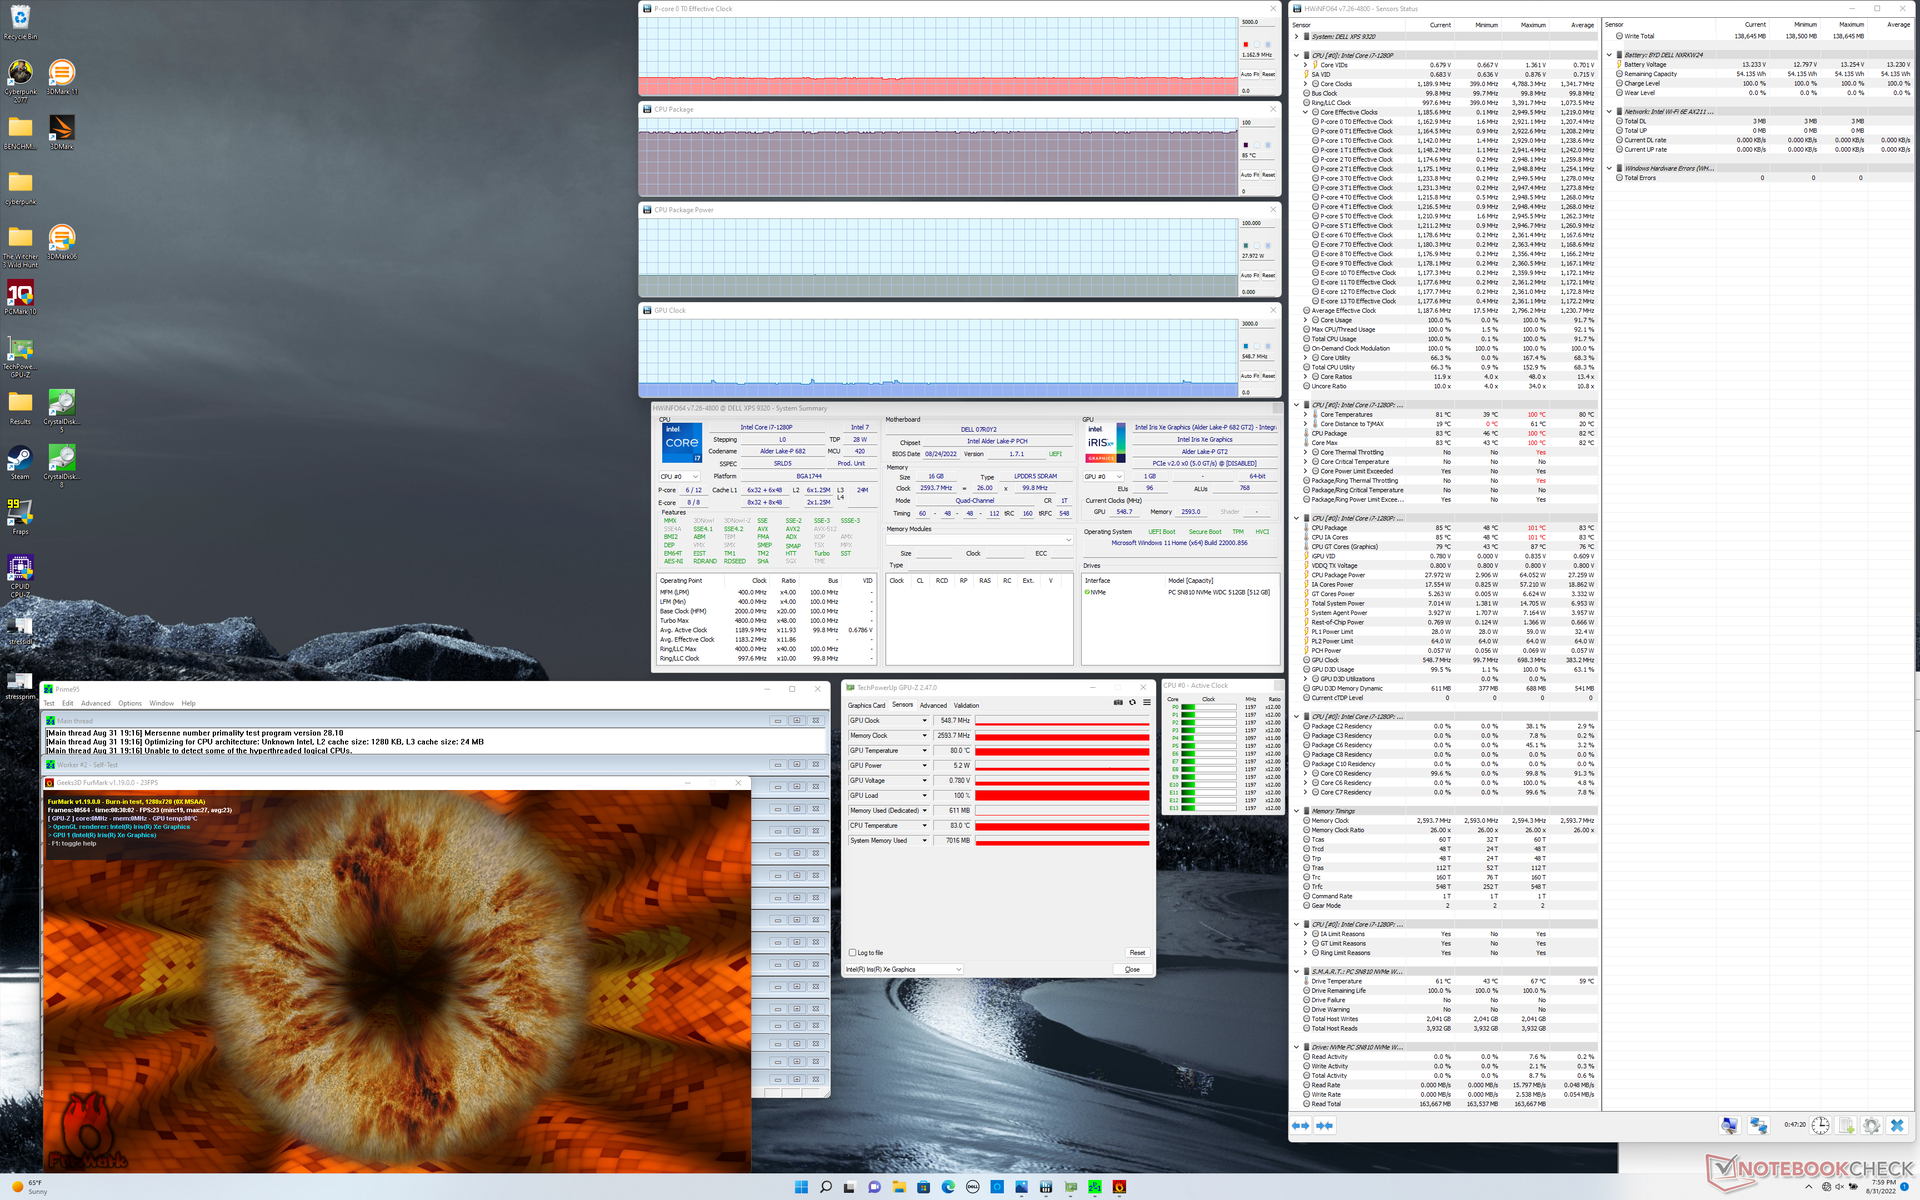
| Reloj dela CPU (GHz) | Reloj de la GPU (MHz) | Temperatura media de la CPU (°C) | |
| Sistema en reposo | -- | -- | 51 |
| Prime95 Stress | 1.5 | -- | 85 |
| Prime95+ FurMark Stress | 1,2 | 549 | 85 |
| Witcher 3 Estrés | ~0,6 | 1147 | 81 |
Gestión de la energía
Consumo de energía
El consumo de energía puede ser tan bajo como 6 W cuando se muestra una imagen en negro intenso o hasta 13 W cuando se muestra una imagen totalmente blanca en el ajuste de brillo máximo. En comparación, los paneles IPS de los otros modelos XPS 13 Plus sólo aumentan de 2 a 4 W entre sus ajustes de brillo mínimo y máximo. Hemos explorado la relación entre el consumo de energía y los paneles OLED en el pasado y la tendencia continúa en estas configuraciones del XPS 13 Plus. En resumen, las opciones IPS van a ser más eficientes en la mayoría de los escenarios, especialmente porque los sitios web, las hojas de cálculo y los programas de procesamiento de textos tienden a ser predominantemente de color blanco.
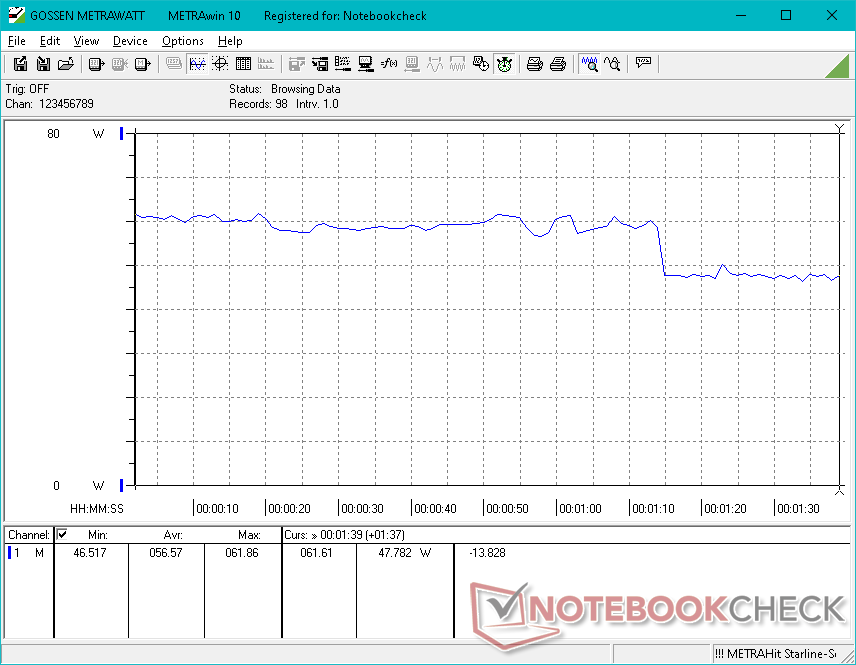
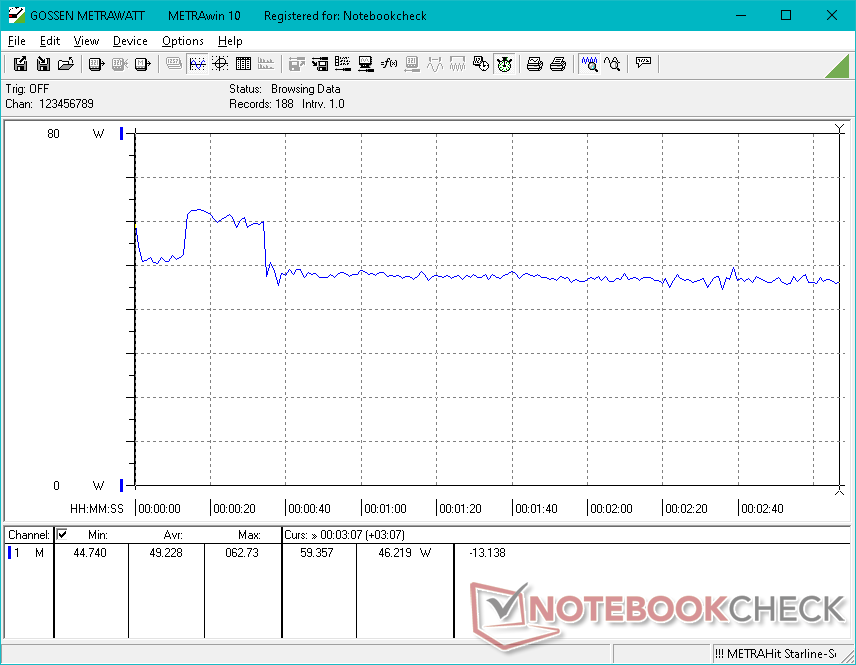
La ejecución de cargas más elevadas, como los juegos, muestra un consumo de energía superior al de la configuración Core i5-1240P de 8 GB, entre un 15 y un 55 por ciento, lo que se corresponde aproximadamente con el mayor rendimiento gráfico de nuestra configuración i7-1280P de 16 GB. Por lo demás, los resultados son muy parecidos a los de la configuración Core i7-1260P, excepto cuando se ejecutan cargas de uso intensivo de la CPU, como Prime95, durante los primeros minutos, como muestra nuestro gráfico siguiente.
| Off / Standby | |
| Ocioso | |
| Carga |
|
Clave:
min: | |
| Dell XPS 13 Plus 9320 i7-1280P OLED i7-1280P, Iris Xe G7 96EUs, WDC PC SN810 512GB, OLED, 3456x2160, 13.4" | Dell XPS 13 Plus 9320 i5-1240p i5-1240P, Iris Xe G7 80EUs, Micron 3400 MTFDKBA512TFH 512GB, IPS, 1920x1200, 13.4" | Dell XPS 13 9315, i5-1230U i5-1230U, Iris Xe G7 80EUs, Micron 3460 256 GB Soldered, IPS, 1920x1200, 13.4" | Dell XPS 13 Plus 9320 4K i7-1260P, Iris Xe G7 96EUs, Samsung PM9A1 MZVL21T0HCLR, IPS, 3840x2400, 13.4" | Dell XPS 13 9310 2-in-1 i7-1165G7, Iris Xe G7 96EUs, Toshiba BG4 KBG40ZPZ512G, IPS, 1920x1200, 13.4" | Dell XPS 13 9310 OLED i7-1185G7, Iris Xe G7 96EUs, Toshiba XG6 KXG60ZNV512G, OLED, 3456x2160, 13.4" | |
|---|---|---|---|---|---|---|
| Power Consumption | -16% | 40% | -7% | 38% | 19% | |
| Idle Minimum * (Watt) | 6.5 | 10 -54% | 3.6 45% | 7 -8% | 2.6 60% | 5.7 12% |
| Idle Average * (Watt) | 7.8 | 12.3 -58% | 6.8 13% | 11 -41% | 6.4 18% | 6 23% |
| Idle Maximum * (Watt) | 13 | 15.5 -19% | 6.8 48% | 11.4 12% | 7.7 41% | 12.3 5% |
| Load Average * (Watt) | 56.6 | 43 24% | 24 58% | 59.7 -5% | 29.9 47% | 44.4 22% |
| Witcher 3 ultra * (Watt) | 49.2 | 43.1 12% | 23.6 52% | 49.4 -0% | 32.2 35% | 36.5 26% |
| Load Maximum * (Watt) | 63 | 62.8 -0% | 47 25% | 63 -0% | 47.5 25% | 47.8 24% |
* ... más pequeño es mejor
Power Consumption Witcher 3 / Stresstest
Power Consumption external Monitor
Duración de la batería
Con sólo 5.5 horas de uso real de WLAN en el perfil de energía equilibrado, la duración es menor que la de cualquier otra configuración del XPS 13 Plus debido en gran parte al panel OLED. Los otros modelos IPS duran entre 1 y 2 horas más.
| Dell XPS 13 Plus 9320 i7-1280P OLED i7-1280P, Iris Xe G7 96EUs, 55 Wh | Dell XPS 13 Plus 9320 i5-1240p i5-1240P, Iris Xe G7 80EUs, 55 Wh | Dell XPS 13 9315, i5-1230U i5-1230U, Iris Xe G7 80EUs, 51 Wh | Dell XPS 13 Plus 9320 4K i7-1260P, Iris Xe G7 96EUs, 55 Wh | Dell XPS 13 9310 2-in-1 i7-1165G7, Iris Xe G7 96EUs, 51 Wh | Dell XPS 13 9310 OLED i7-1185G7, Iris Xe G7 96EUs, 52 Wh | |
|---|---|---|---|---|---|---|
| Duración de Batería | 38% | 155% | 19% | 84% | 12% | |
| WiFi v1.3 (h) | 5.8 | 8 38% | 14.8 155% | 6.9 19% | 10.7 84% | 6.5 12% |
| Load (h) | 1.6 | 2.6 | 1.3 | 3.4 | ||
| H.264 (h) | 11 | |||||
| Reader / Idle (h) | 25.4 |
Pro
Contra
Veredicto - Más rápido, pero no exactamente mejor
La configuración de gama más alta con el Core i7-1280P Y la pantalla OLED está diseñada para un subconjunto muy específico de usuarios. Si tus cargas de trabajo requieren colores P3 y una multitarea intensa entre aplicaciones, entonces el Turbo Boost inicial más rápido de la CPU y el panel OLED puede valer la pena la inversión sobre el menos costoso Core i7-1260P y las opciones IPS menos costosos. Por lo demás, las desventajas que conllevan no compensan necesariamente sus beneficios. El OLED introduce parpadeos que no están presentes en los paneles IPS, además de un menor brillo máximo y una menor duración de la batería. La CPU i7-1280P tampoco garantiza ser más rápida que la i7-1260P cuando el pico inicial de rendimiento de Turbo Boost se reduce inevitablemente.
Otro resultado inesperado tiene que ver con el rendimiento del SSD WD SN810, que se ralentiza en nuestra unidad de pruebas bajo estrés. Si puedes encontrar unidades con el Micron 3400 o el Samsung PM9A1 en su lugar, esas unidades pueden ofrecer un rendimiento más estable.
Para la mayoría de los usuarios, la configuración Core i7-1260P e IPS logra un mejor equilibrio entre rendimiento y precio que la configuración i7-1280P y OLED. Incluso ofrece una mayor duración de la batería y una pantalla más brillante a pesar de su menor precio.
Las diferencias entre los SKUs i7-1260P e i7-1280P son menores que las diferencias entre los SKUs i5-1240P y el i7-1260P en lo que respecta al rendimiento de los gráficos integrados. Recomendamos configurar con al menos 16 GB de RAM sin importar la opción de CPU o de lo contrario el rendimiento gráfico cae en picado.
Precio y disponibilidad
Las configuraciones con el Core i7-1280P aún no están ampliamente disponibles a través de distribuidores como Newegg, Amazon o Best Buy, ya que las unidades con el i7-1260P son mucho más comunes. Sin embargo, las opciones OLED están ampliamente disponibles, aunque con el i7-1260P. Los usuarios pueden comprar directamente de Dell para nuestra configuración exacta de i7-1280P OLED por $1750 USD.
Dell XPS 13 Plus 9320 i7-1280P OLED
- 09/02/2022 v7 (old)
Allen Ngo
Price comparison

