Análisis del portátil Dell Inspiron 14 Plus 7420: Para usuarios avanzados con poco presupuesto
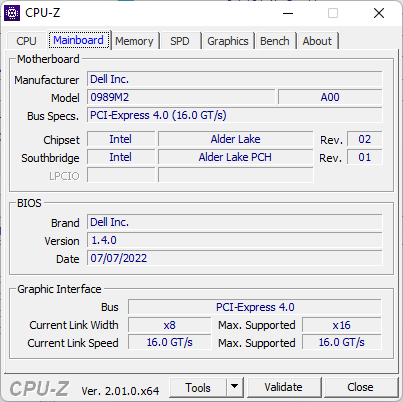
Dell ha presentado tres modelos distintos de Inspiron 14 7420 de 14 pulgadas para 2022: el Inspiron 14 7420 estándar, el Inspiron 14 7420 2-en-1 y el Inspiron 14 7420 Plus. Este análisis se centra en el modelo Plus, que lleva procesadores Core de la serie H mucho más rápidos y gráficos discretos Nvidia GeForce RTX, diseñados para usuarios avanzados insatisfechos con los habituales Ultrabooks de la serie Core-U.
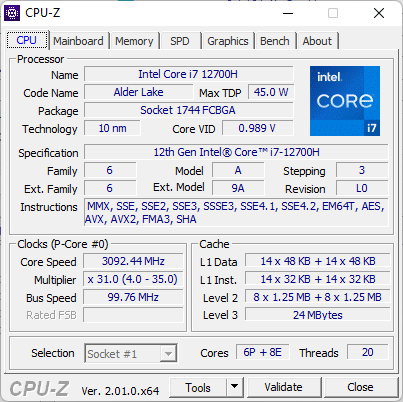
Nuestra unidad de análisis específica viene con la CPU Alder Lake-H Core i7-12700H y la GPU GeForce RTX 3050 por un precio de venta al público de aproximadamente 1400 dólares. Están previstas otras versiones con Core i5-12500H, RTX 3050 Ti o gráficos integrados, y una batería más pequeña de 54 Wh, pero todas las configuraciones vienen con el mismo panel de resolución 2.2K 2240 x 1400.
Entre los competidores se encuentran otros portátiles de 14 pulgadas de alto rendimiento como el Asus VivoBook Pro 14, HP Pavilion 14 Plus, Schenker Vision 14, HP Envy 14, o el Lenovo IdeaPad 5 Pro 14. El Razer Blade 14 y el Asus Zephyrus G14 también pueden considerarse alternativas, pero son bastante más caros.
Más opiniones sobre Dell:
Posibles contendientes en la comparación
Valoración | Fecha | Modelo | Peso | Altura | Tamaño | Resolución | Precio |
|---|---|---|---|---|---|---|---|
| 87.2 % v7 (old) | 09/2022 | Dell Inspiron 14 Plus 7420 i7-12700H, GeForce RTX 3050 4GB Laptop GPU | 1.7 kg | 18.87 mm | 14.00" | 2240x1400 | |
| 86.3 % v7 (old) | 07/2022 | Asus Vivobook Pro 14 M3401QC-KM007T R5 5600H, GeForce RTX 3050 4GB Laptop GPU | 1.5 kg | 19 mm | 14.00" | 2880x1800 | |
| 83.7 % v7 (old) | 06/2022 | Dell Inspiron 14 7420 2-in-1 i7-1255U, Iris Xe G7 96EUs | 1.6 kg | 17.86 mm | 14.00" | 1920x1200 | |
| 87.7 % v7 (old) | 01/2022 | Schenker Vision 14 i7-11370H, GeForce RTX 3050 Ti Laptop GPU | 1.1 kg | 15.6 mm | 14.00" | 2880x1800 | |
v (old) | 10/2021 | Asus Zenbook 14X UX5400E i7-1165G7, GeForce MX450 | 1.4 kg | 16.9 mm | 14.00" | 2880x1800 | |
| 82.3 % v7 (old) | 07/2021 | MSI Summit E14 A11SCS i7-1185G7, GeForce GTX 1650 Ti Max-Q | 1.3 kg | 16 mm | 14.00" | 3840x2160 | |
| 86.5 % v7 (old) | 02/2021 | HP Envy 14-eb0010nr i5-1135G7, GeForce GTX 1650 Ti Max-Q | 1.6 kg | 17.9 mm | 14.00" | 1920x1200 |
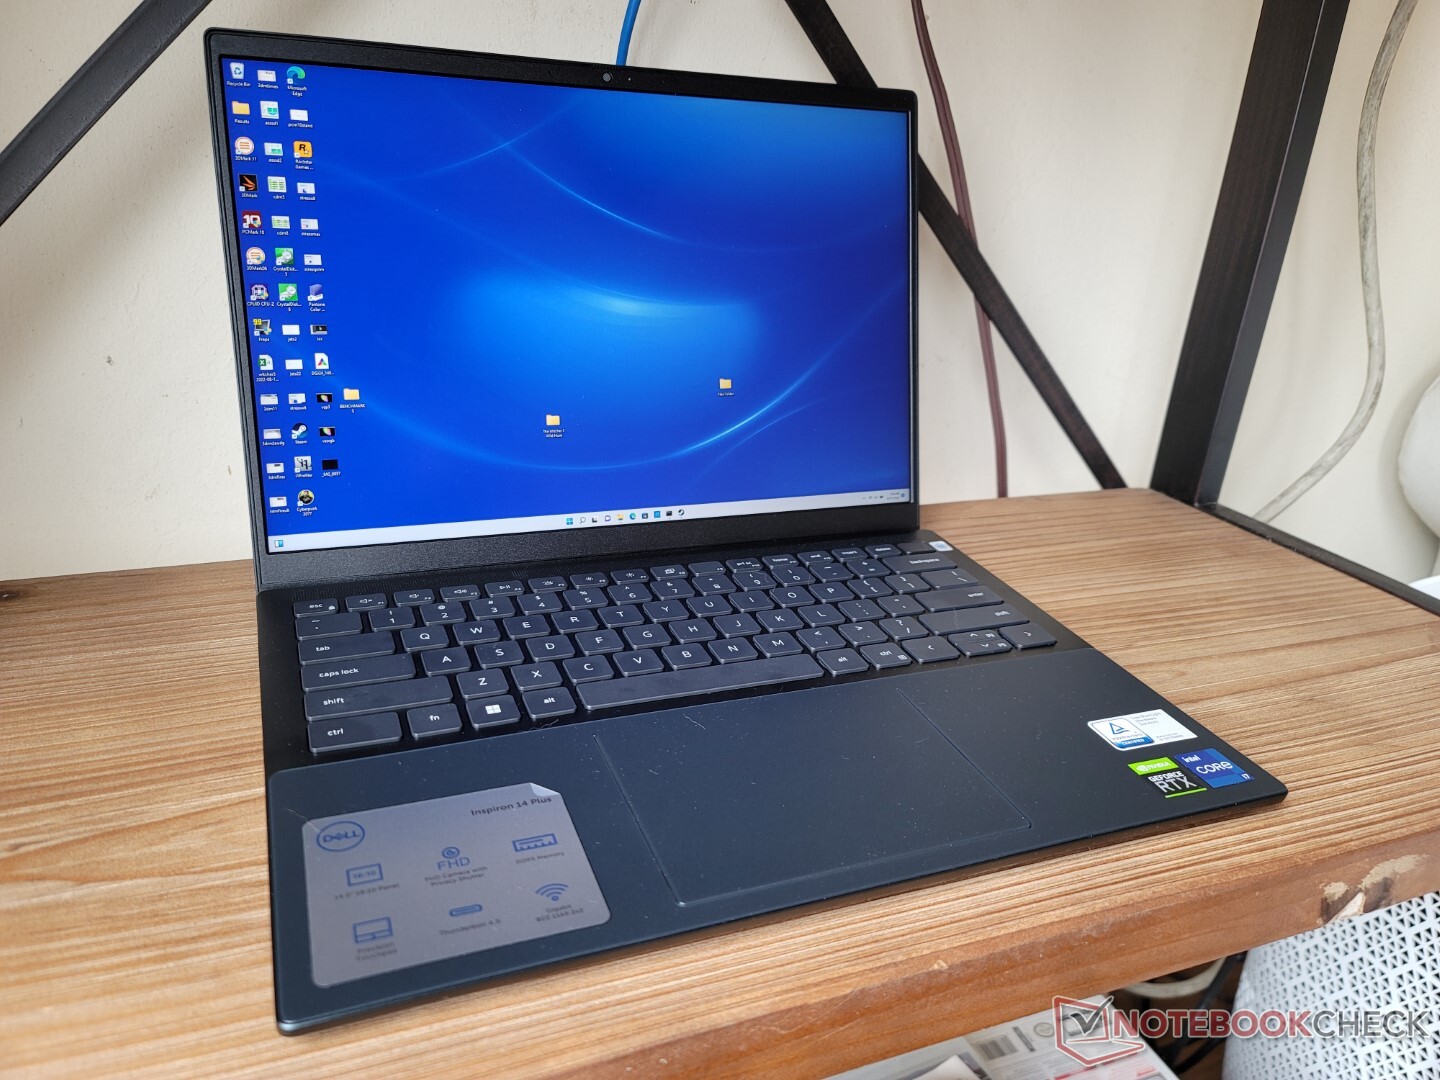
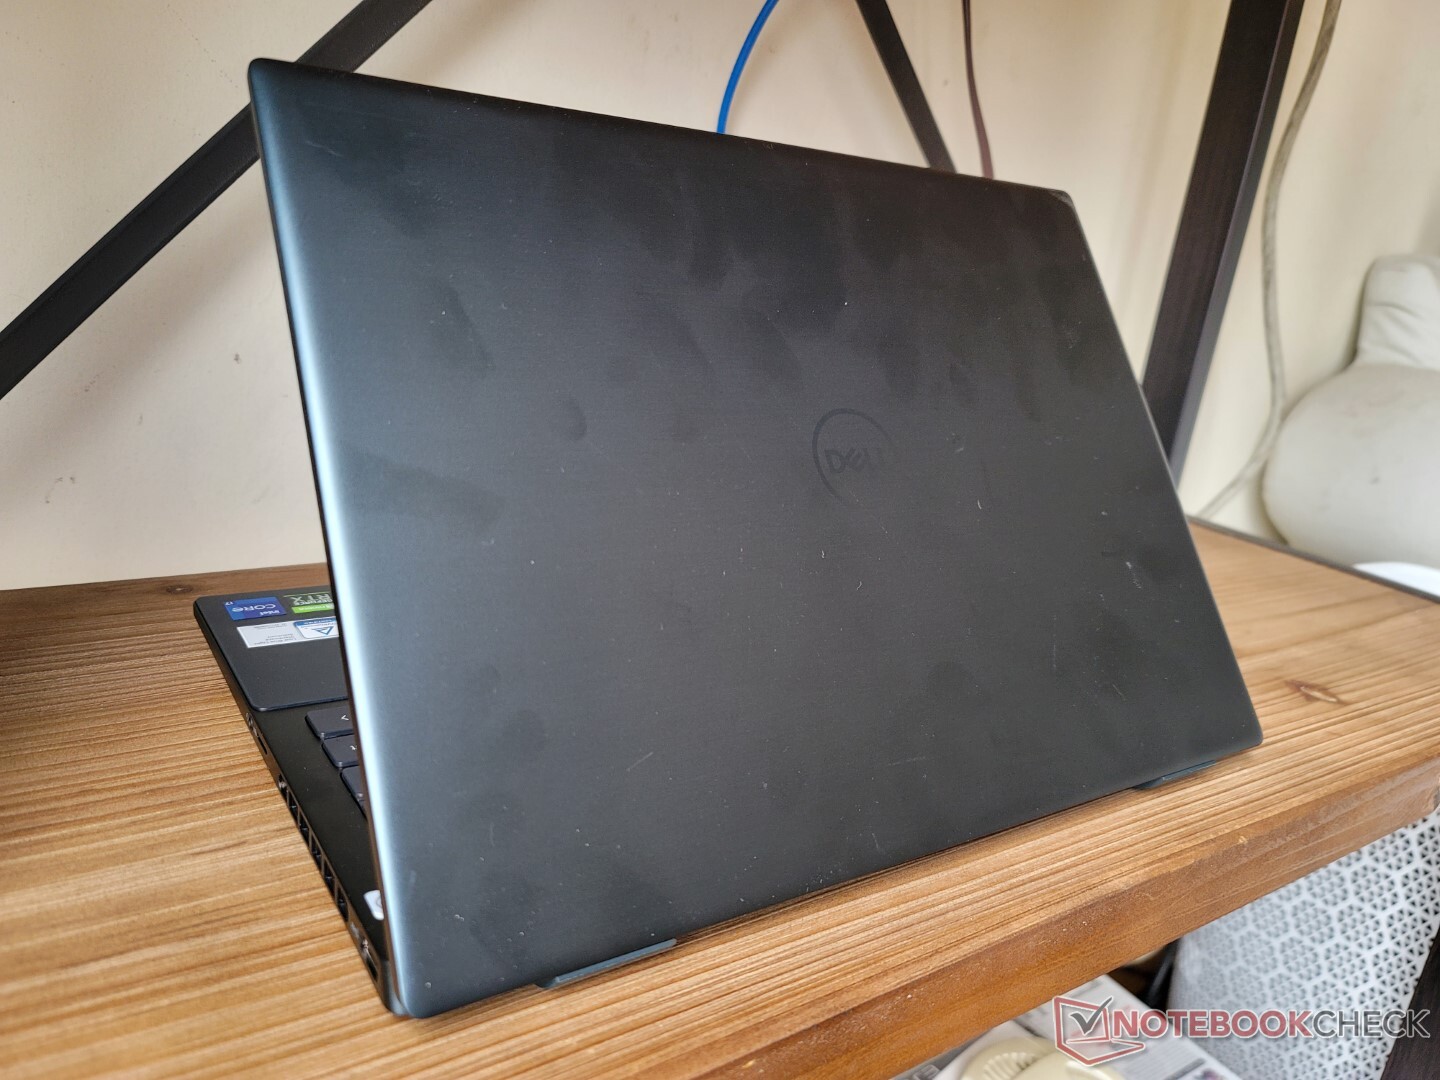
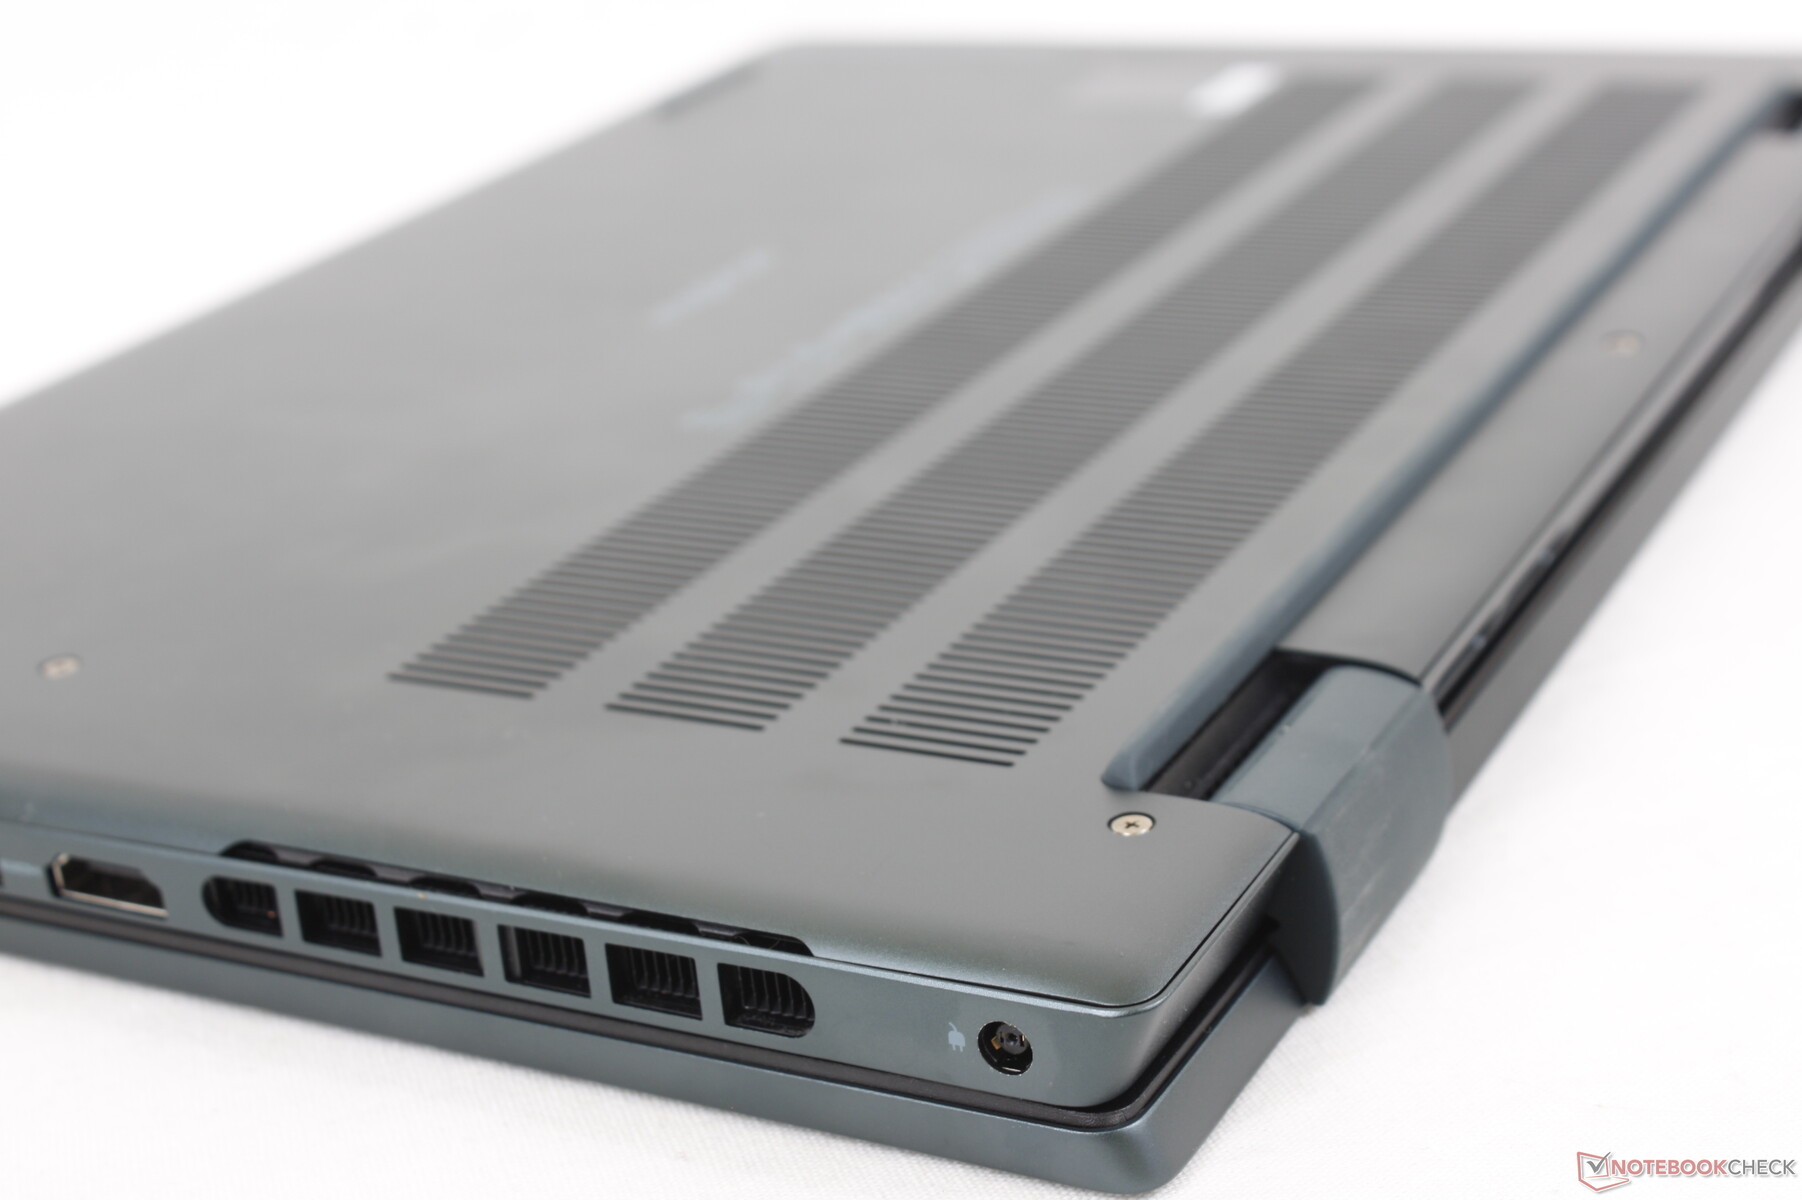
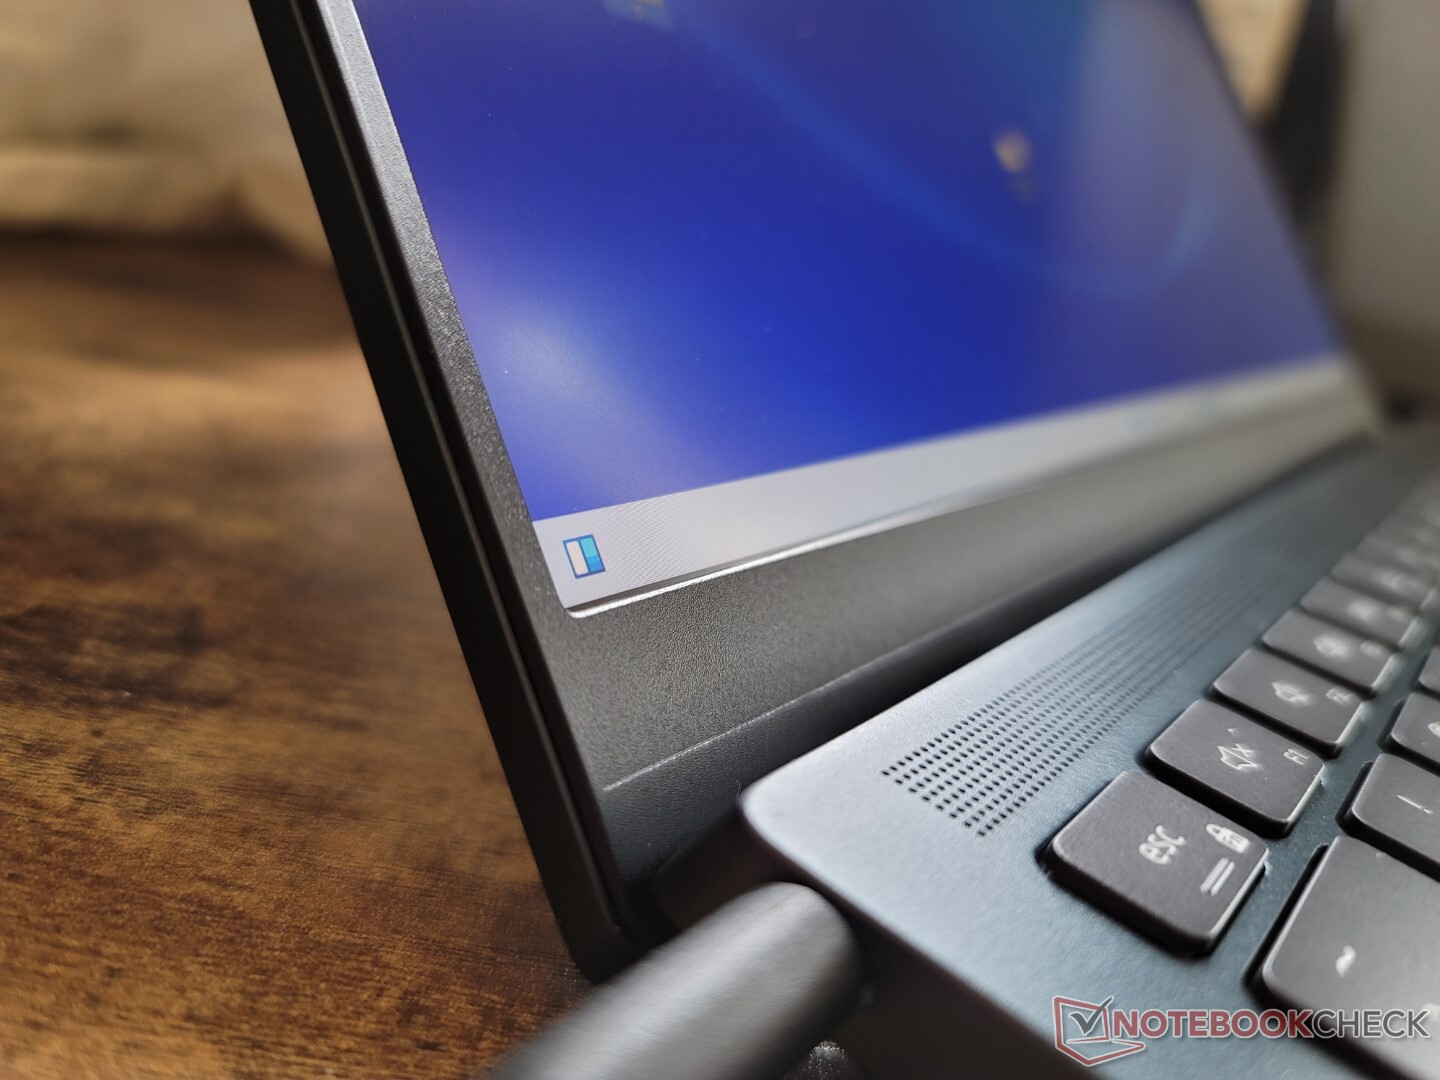
Caja - Un Inspiron 16 7620 en miniatura
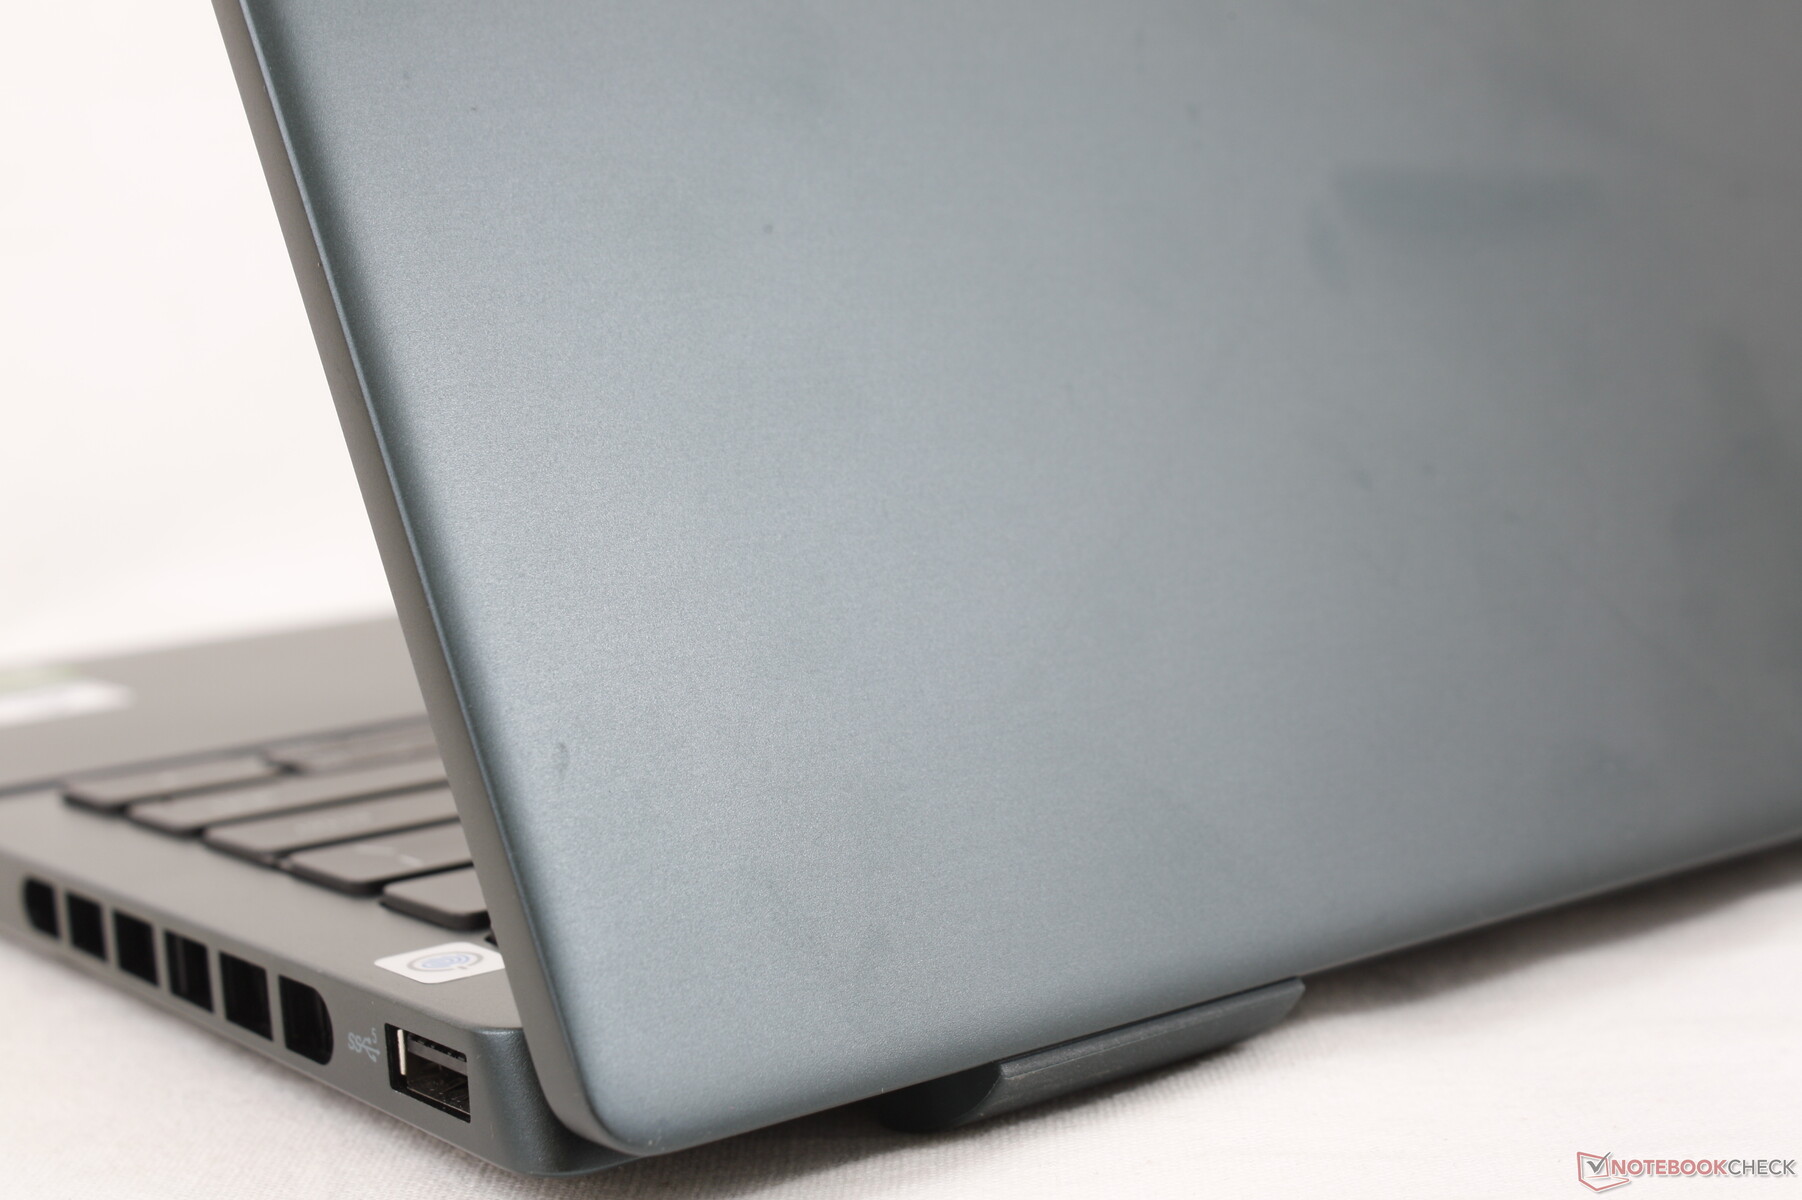
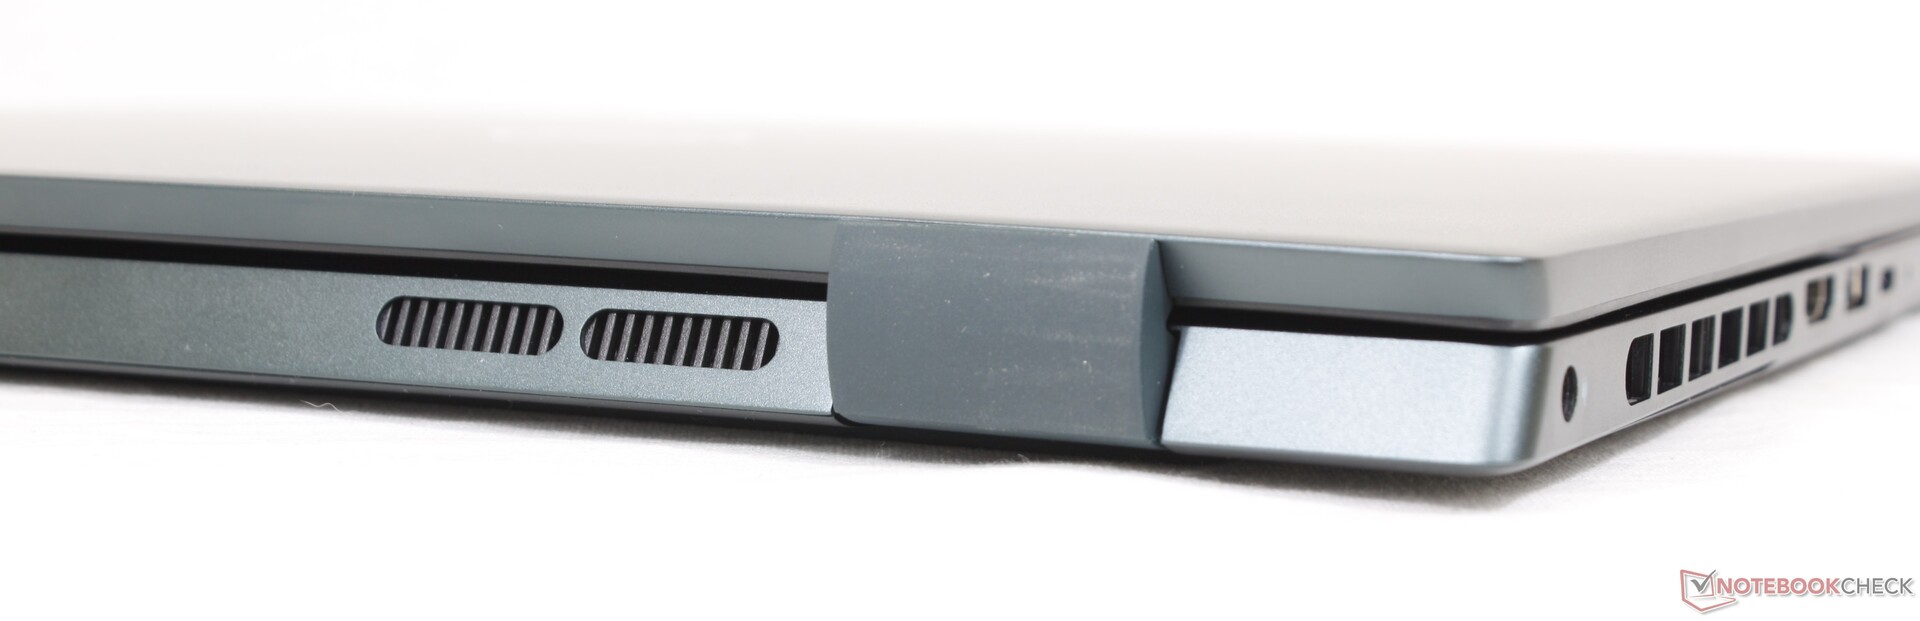
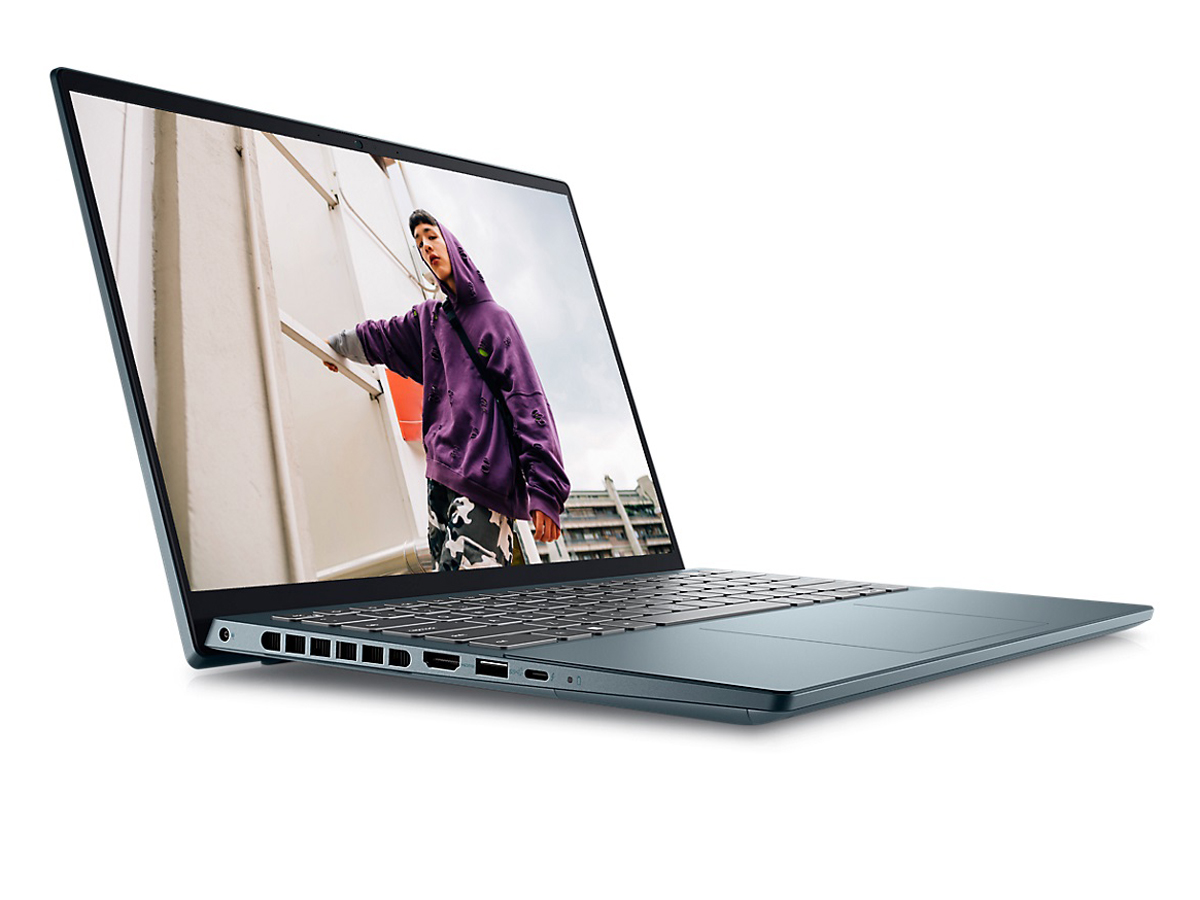
El chasis puede describirse mejor como una versión más pequeña del Inspiron 16 7620 Plus ya que ambos comparten el mismo lenguaje de diseño visual. Los materiales utilizados para el chasis metálico y la capa de Mylar sobre el clickpad y los reposamanos son similares a los del Inspiron más grande. Es una sensación mate suave de arriba a abajo que casi imita la tapa exterior de metal suave de un XPS 15
El aspecto más débil del esqueleto es quizás la tapa, ya que se tuerce con bastante facilidad. Se oyen pequeños crujidos al girar la base y al aplicar presión en el centro del teclado también se deforma ligeramente su superficie. Aunque este modelo se vende por casi lo mismo que un Dell XPS 15, no esperes que esté construido tan fuerte como uno.
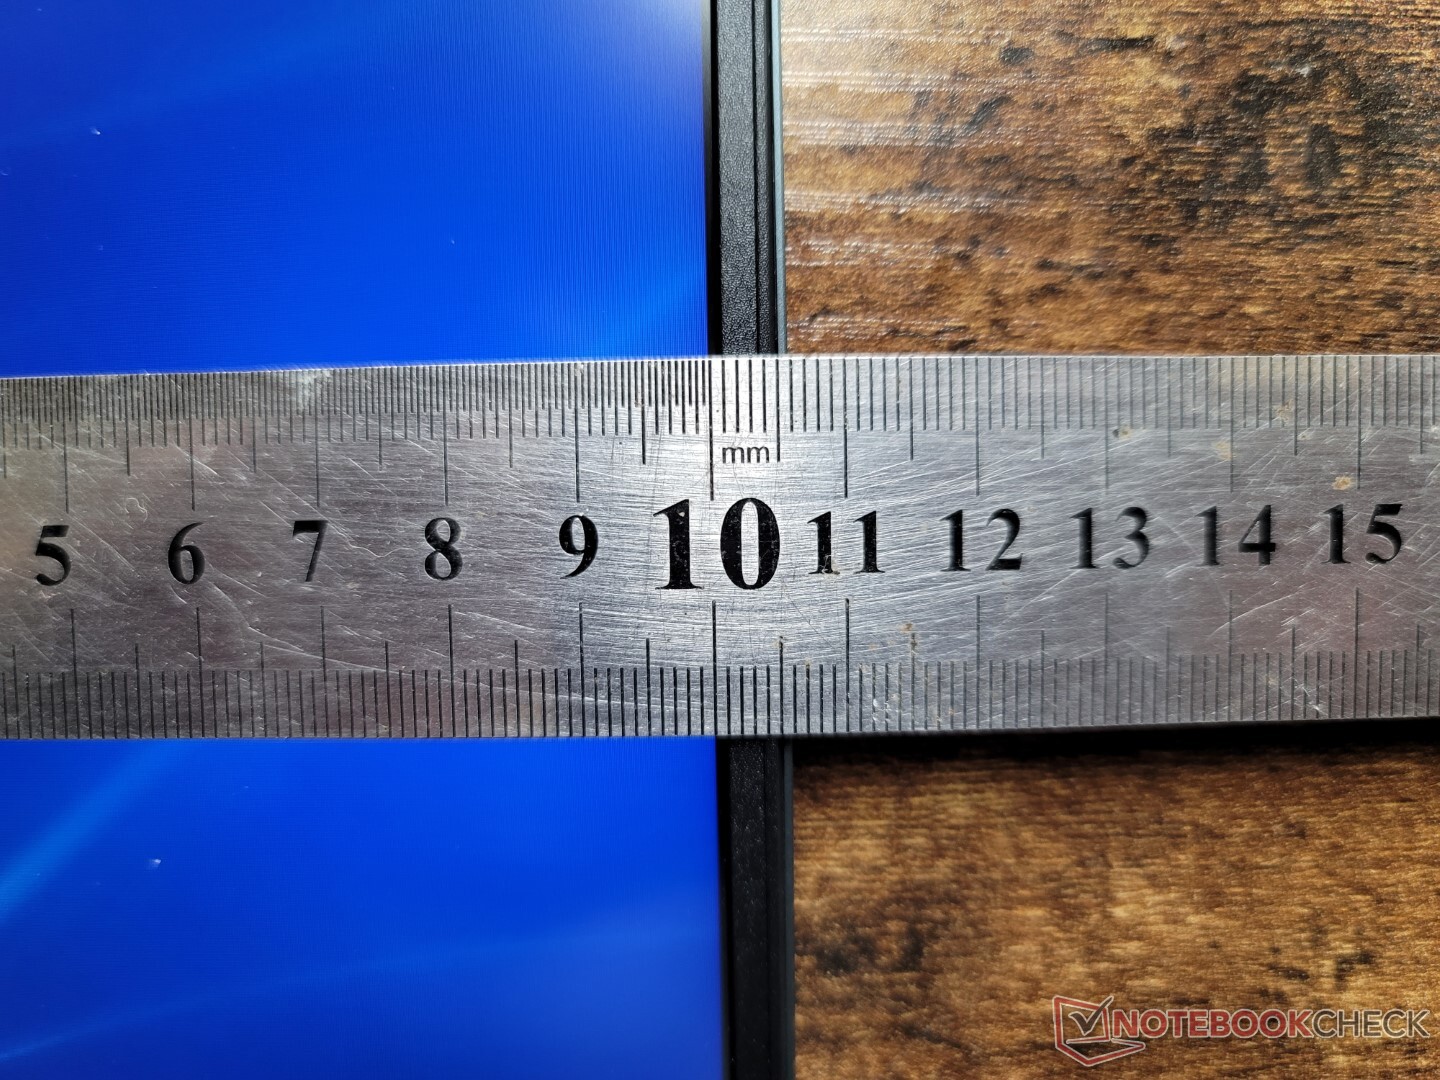
Uno podría esperar que el Inspiron 14 Plus 7620 fuera más grande y pesado que el Inspiron 14 7620 2-en-1, pero ese no es realmente el caso. Su tamaño es idéntico al de la versión 2-en-1, pero es un poco más grueso y pesado a pesar de tener un hardware mucho más potente en su interior. No obstante, sigue siendo más pesado y grande que la mayoría de los portátiles de 14 pulgadas, como el HP Envy 14,Asus Zenbook 14Xo el Schenker Vision 14, todos los cuales también llevan gráficos discretos de Nvidia.
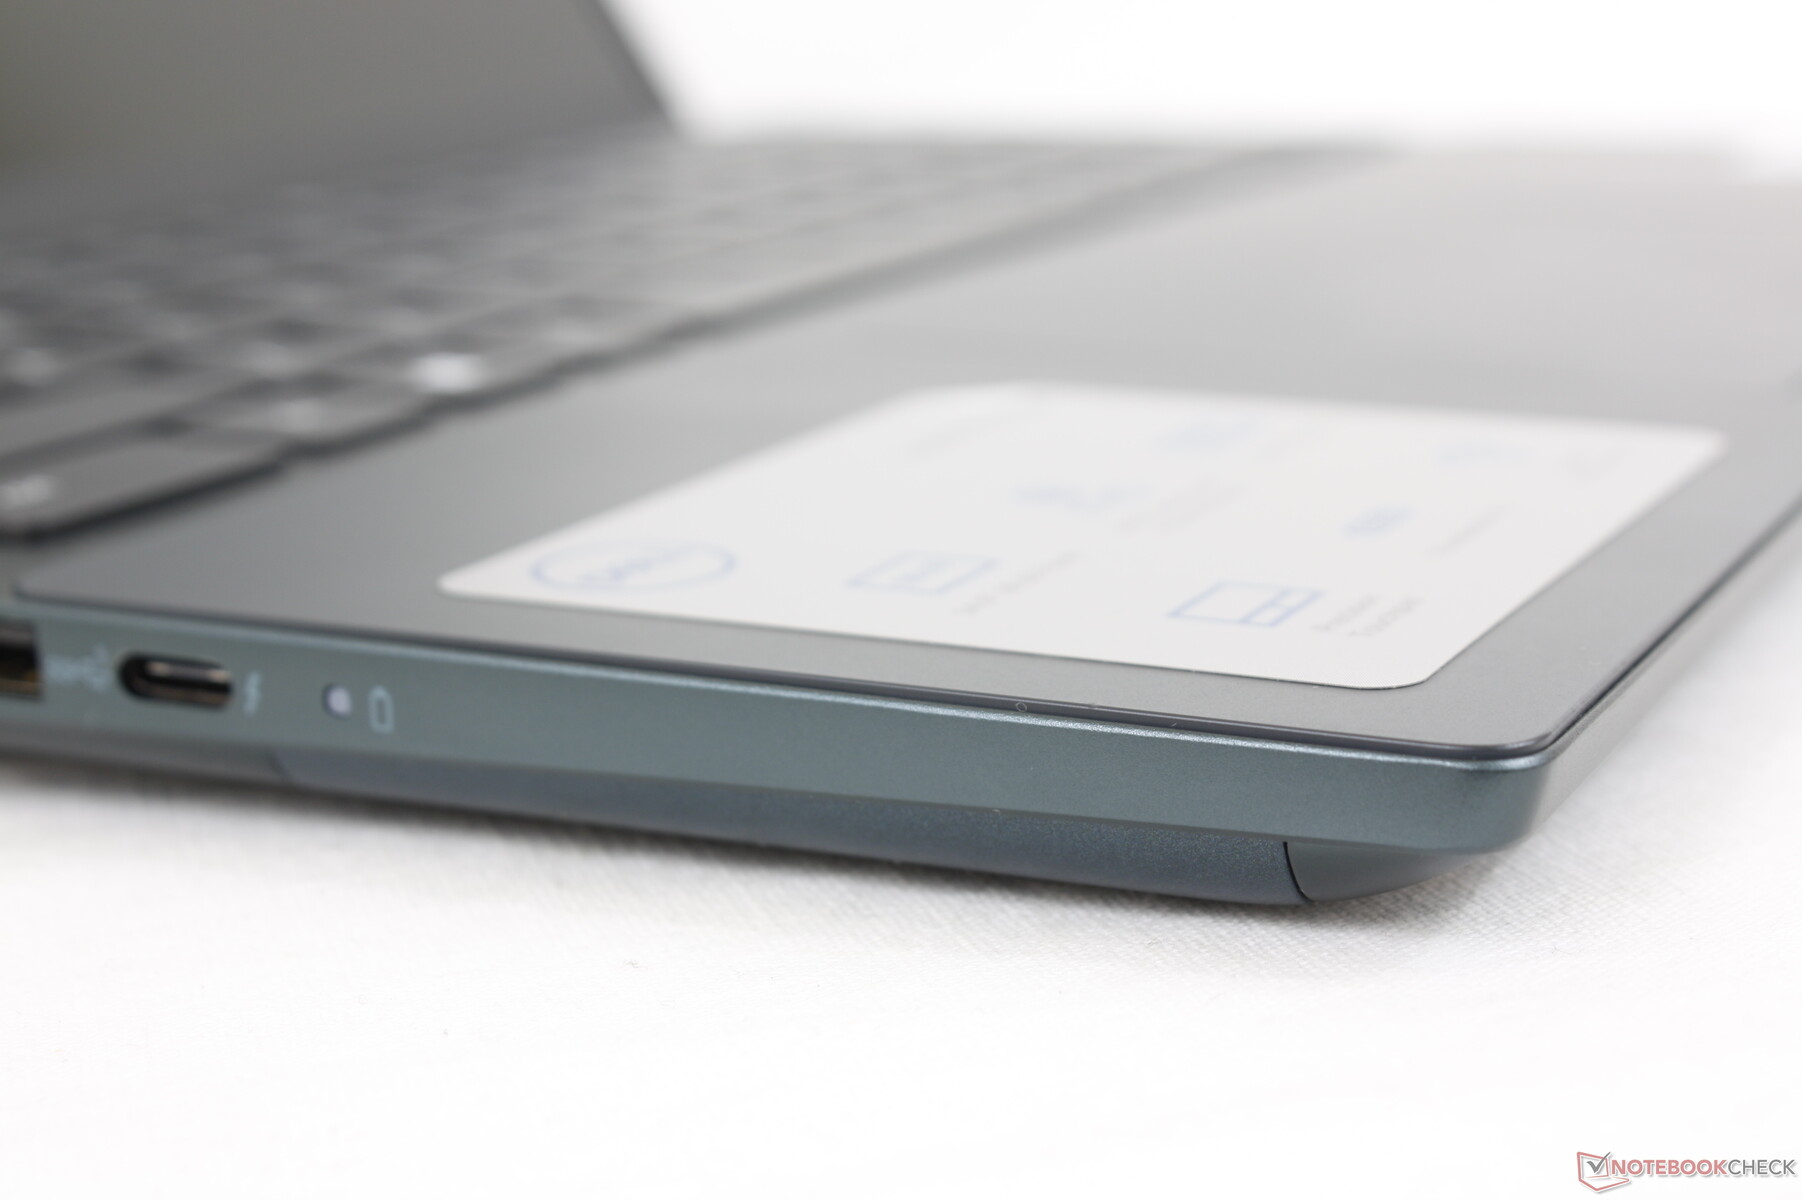
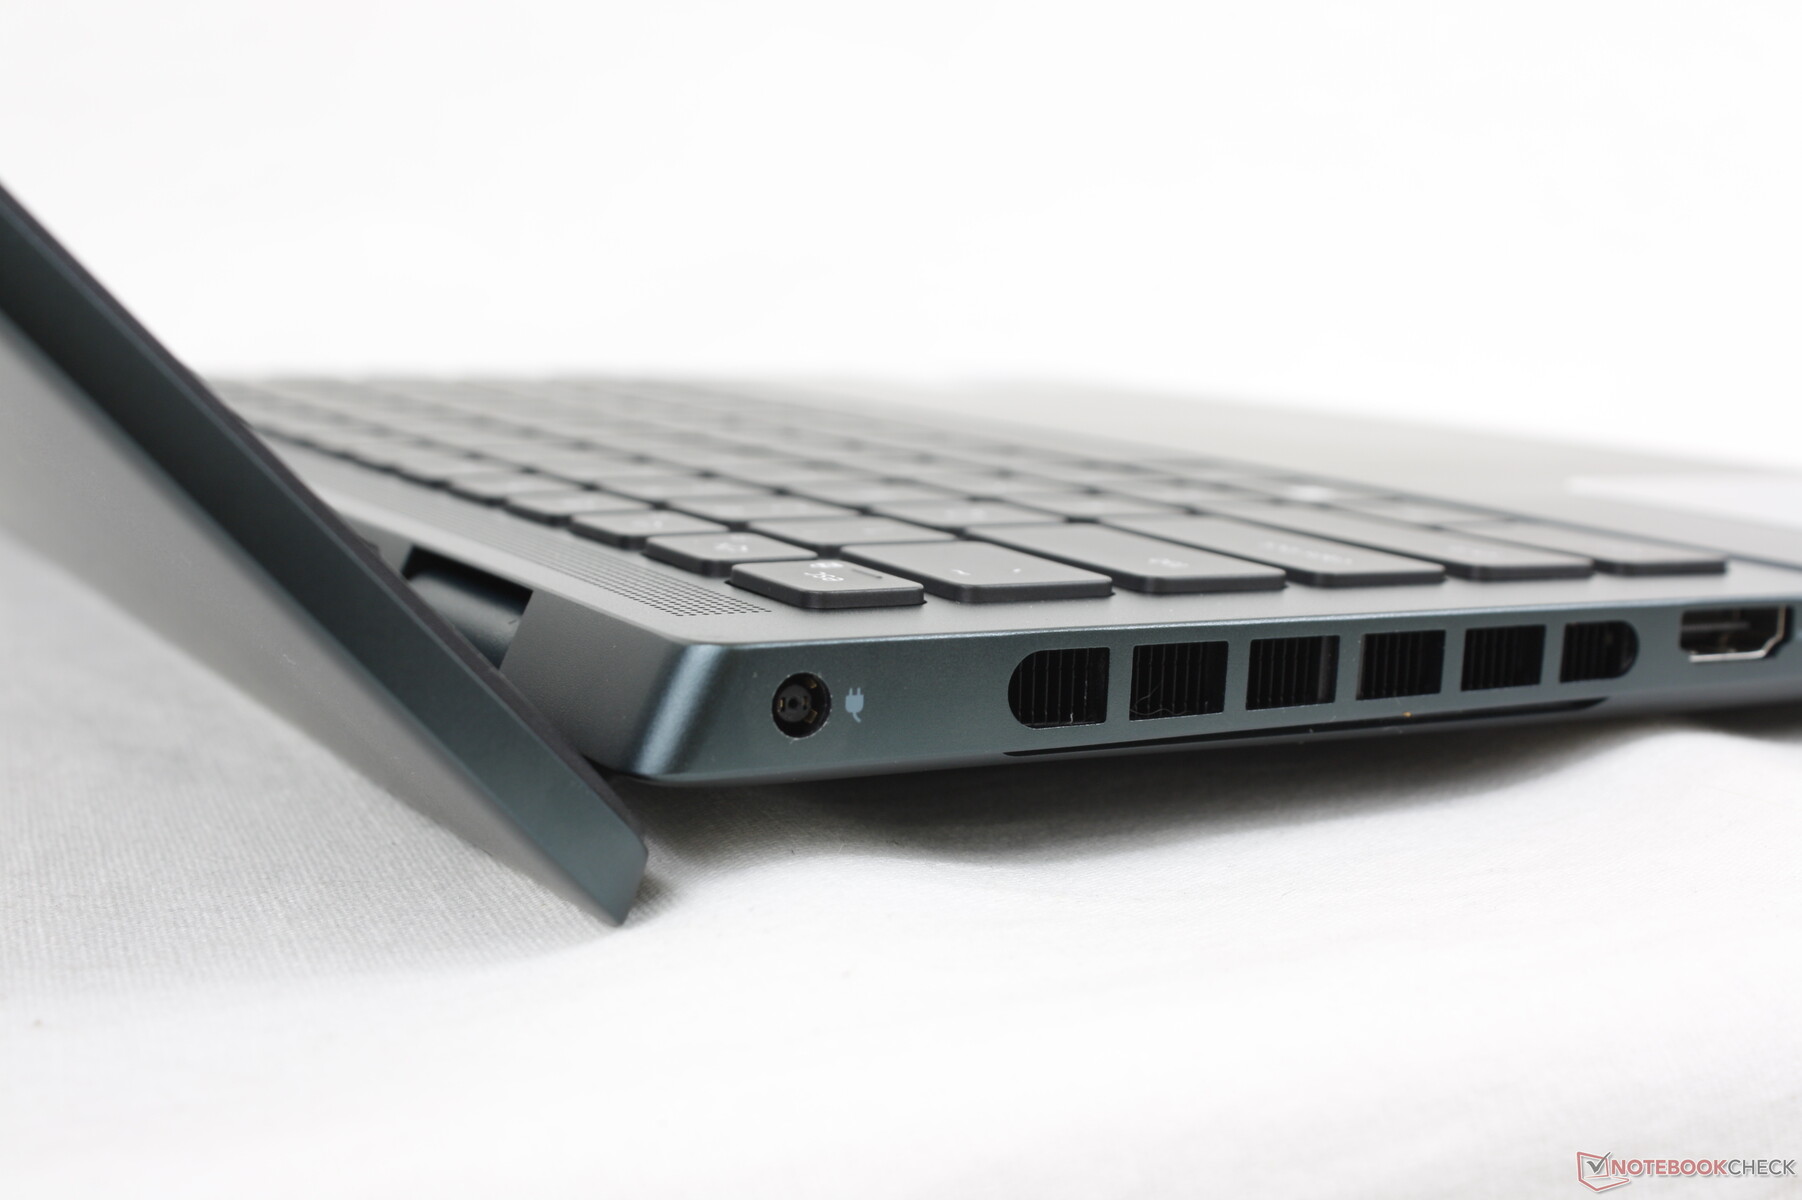
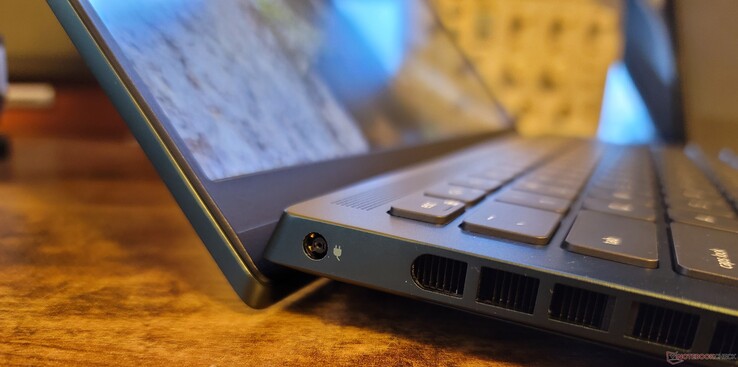
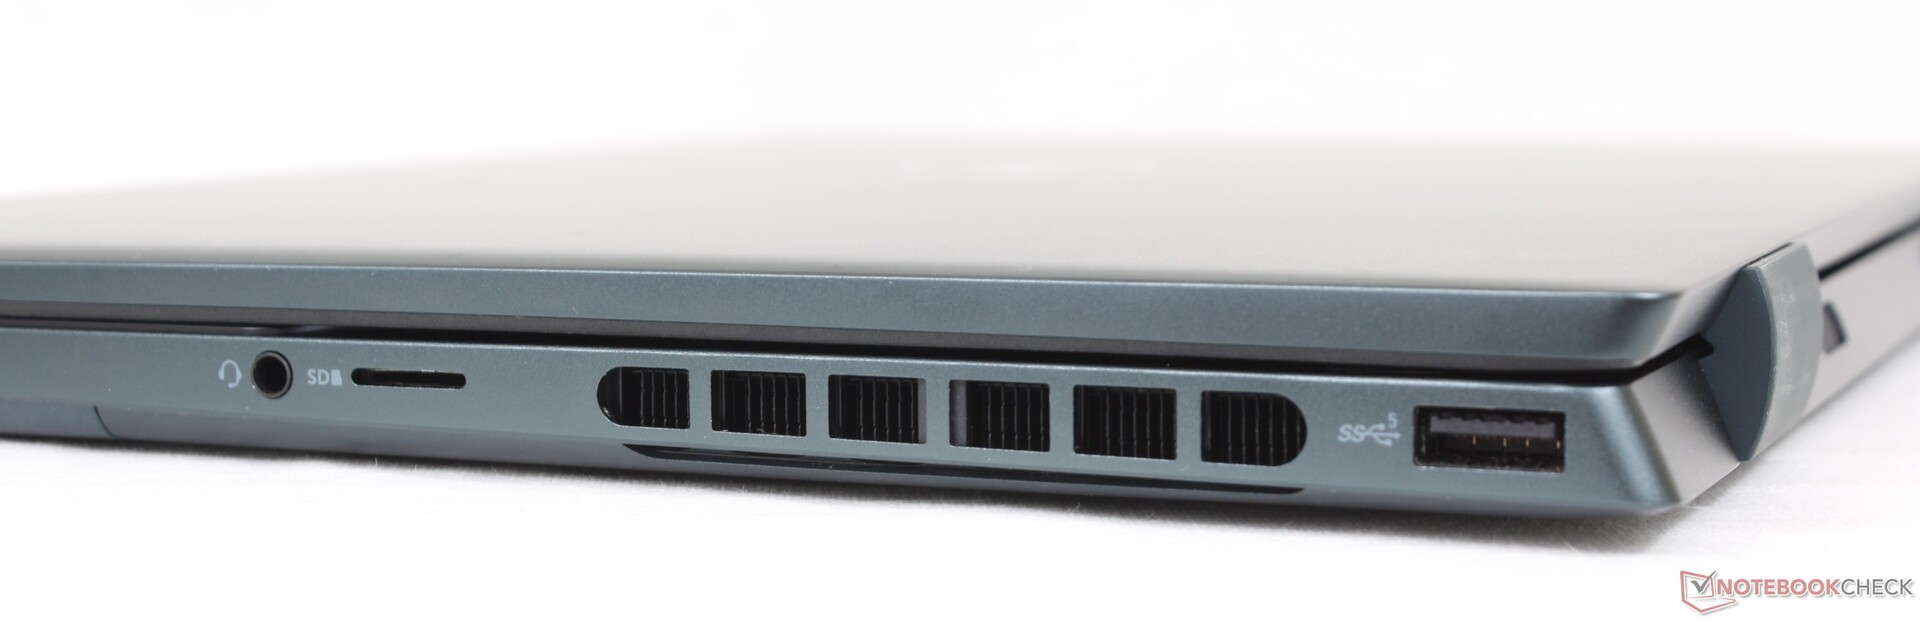
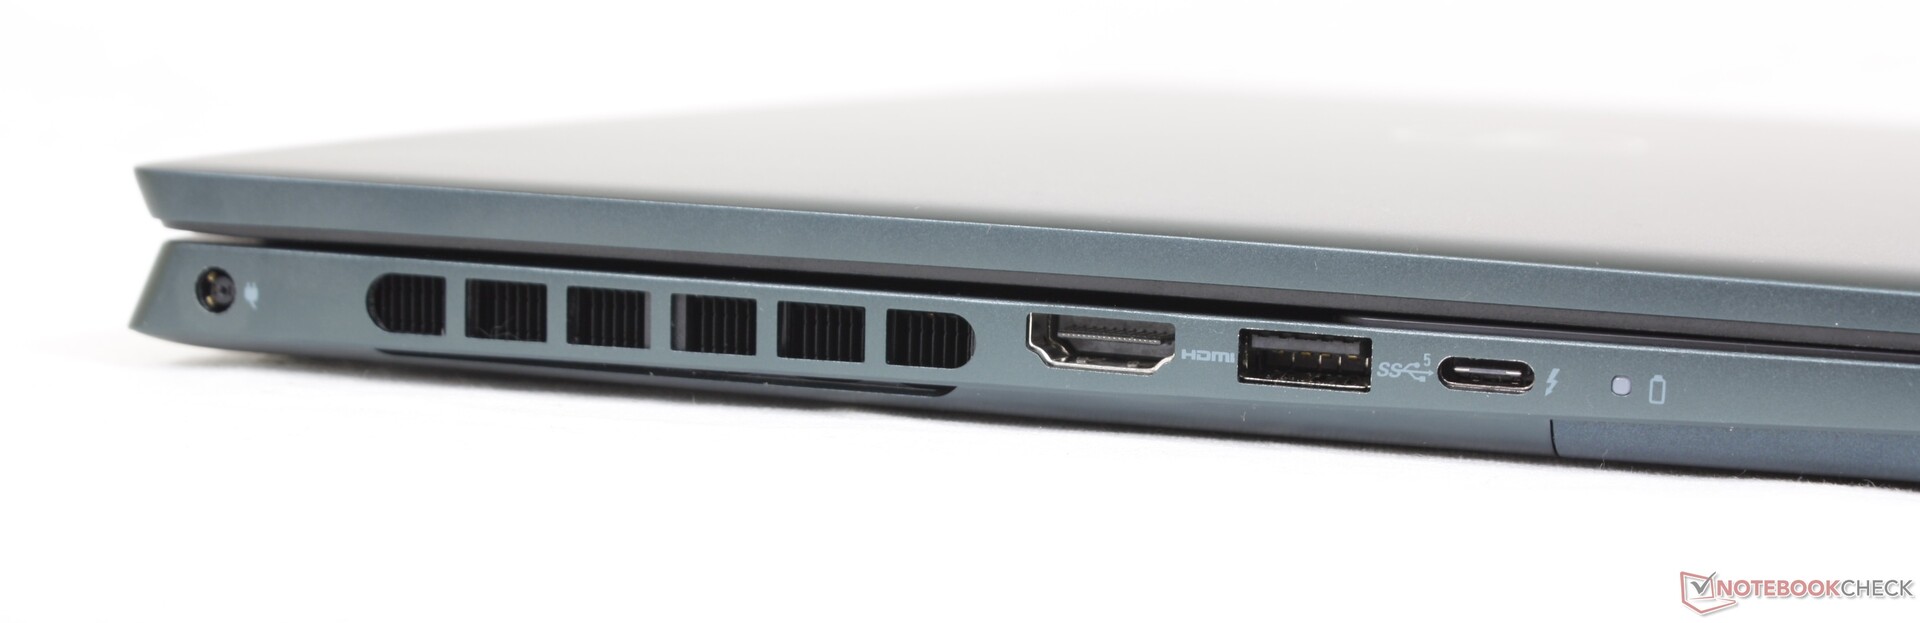
Conectividad - Soporte de Thunderbolt 4
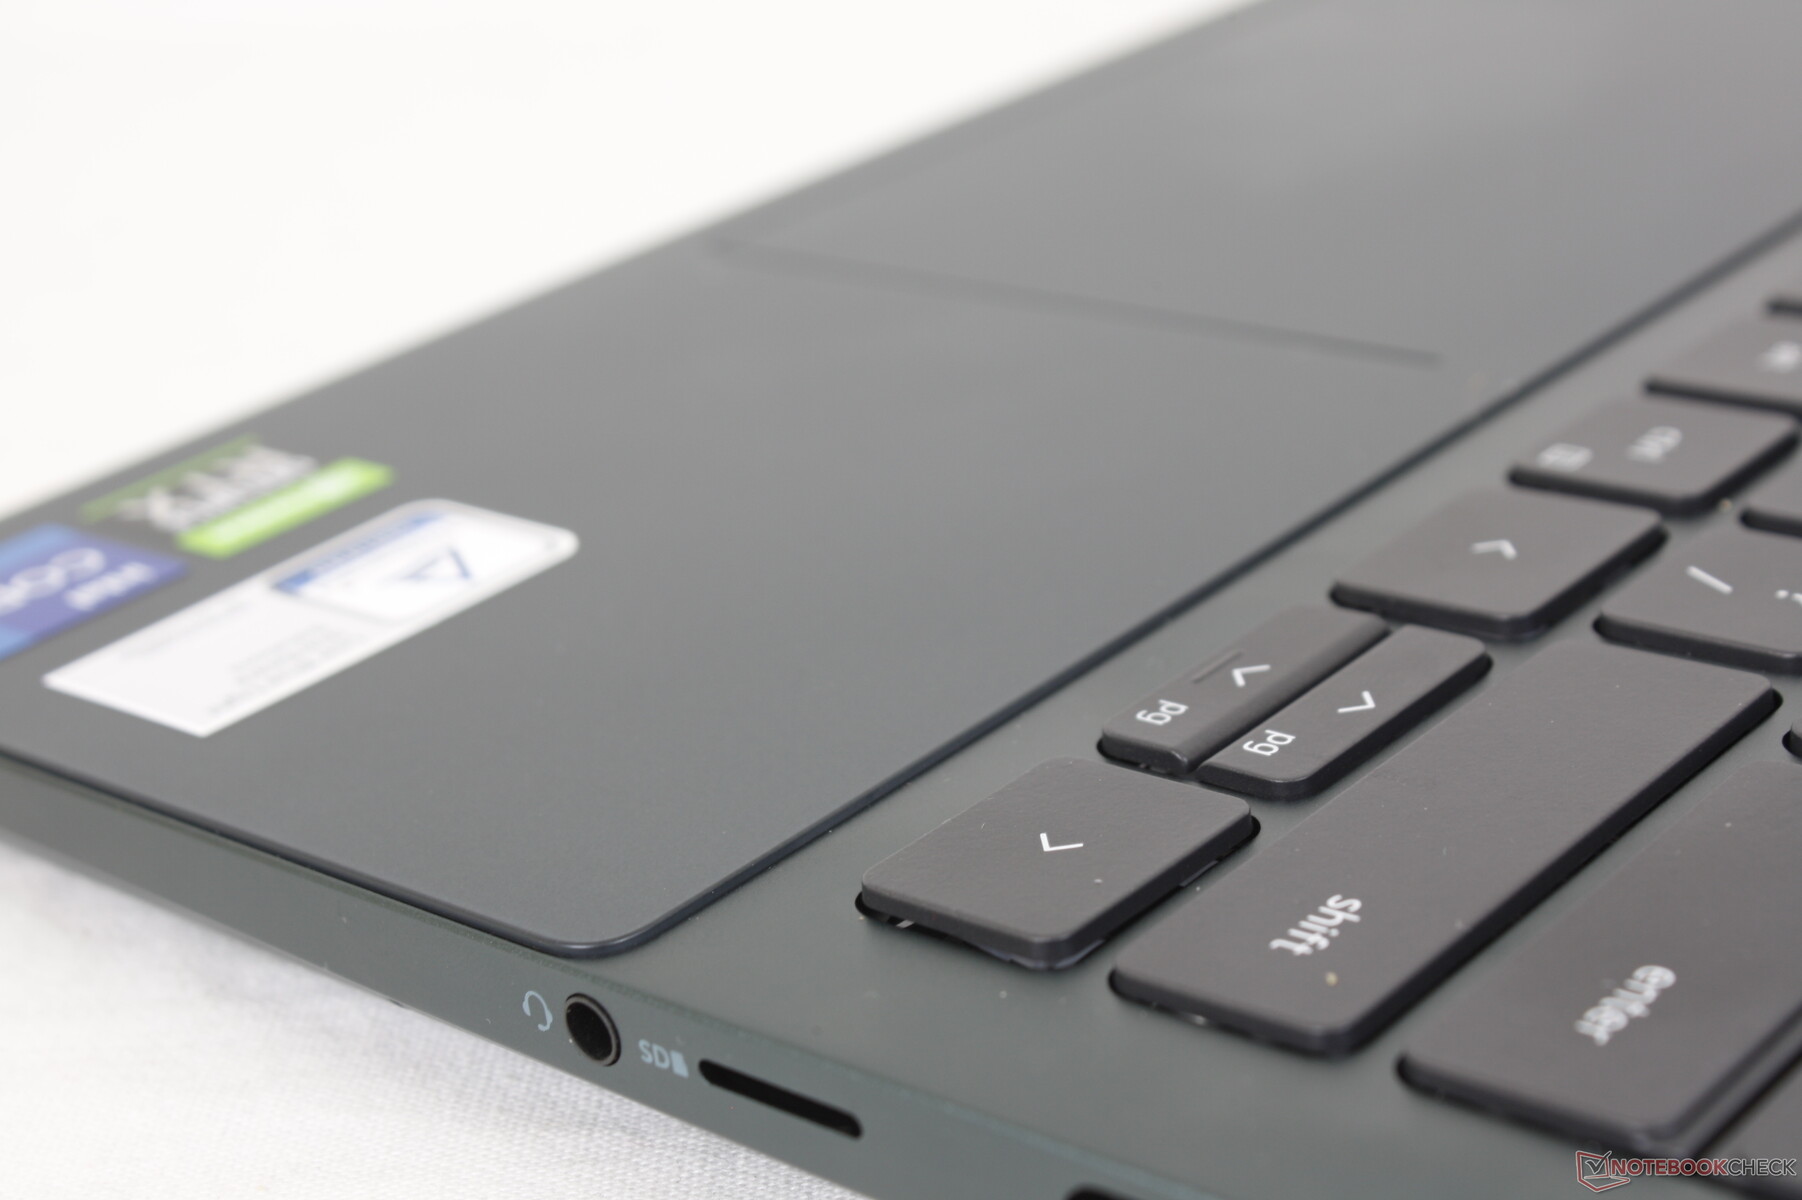
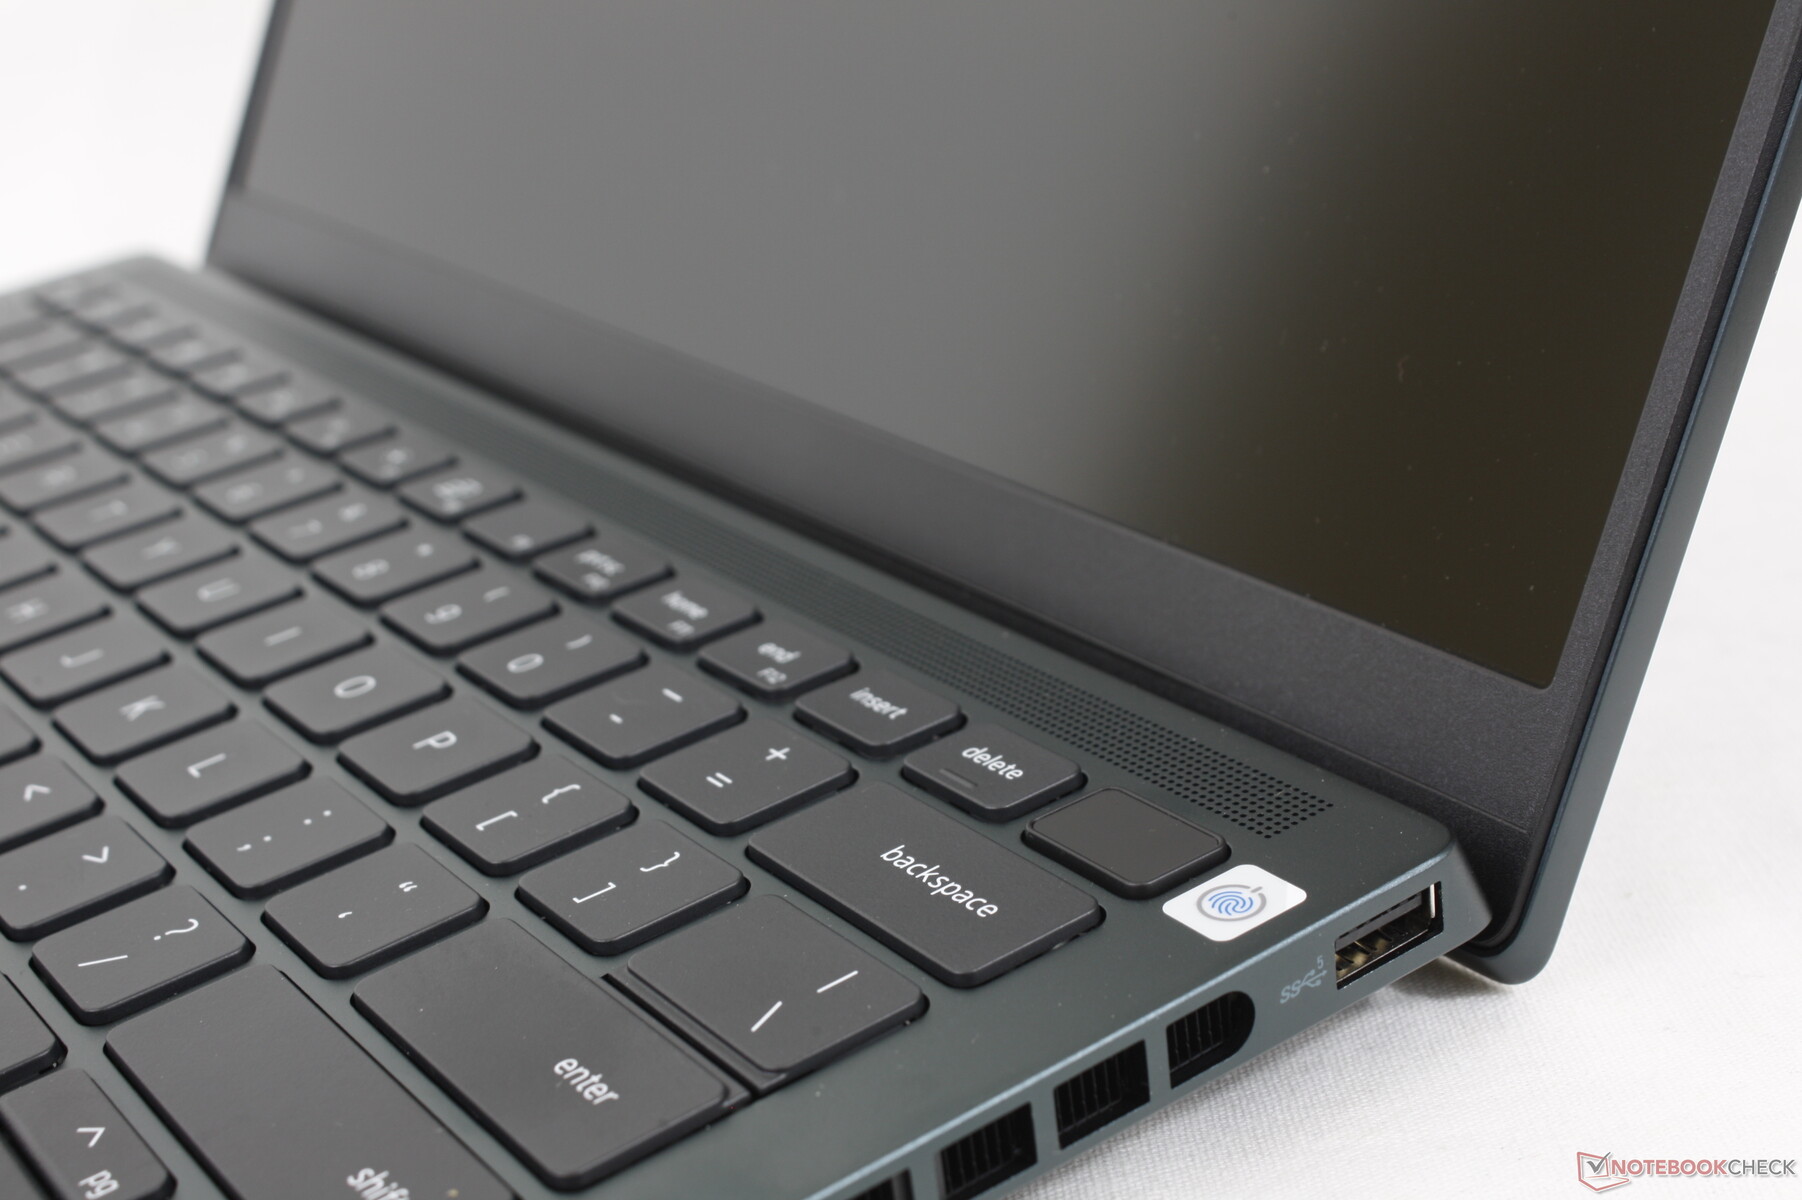
Las opciones de puerto son idénticas a las del Inspiron 16 Plus 7620, aunque el lector SD de tamaño completo se ha cambiado por uno microSD más pequeño. Apreciamos la compatibilidad con Thunderbolt 4, ya que ni el competidor HP Pavilion Plus 14 ni el Asus Vivobook Pro 14 OLED soportan Thunderbolt aunque tengan puertos USB-C.

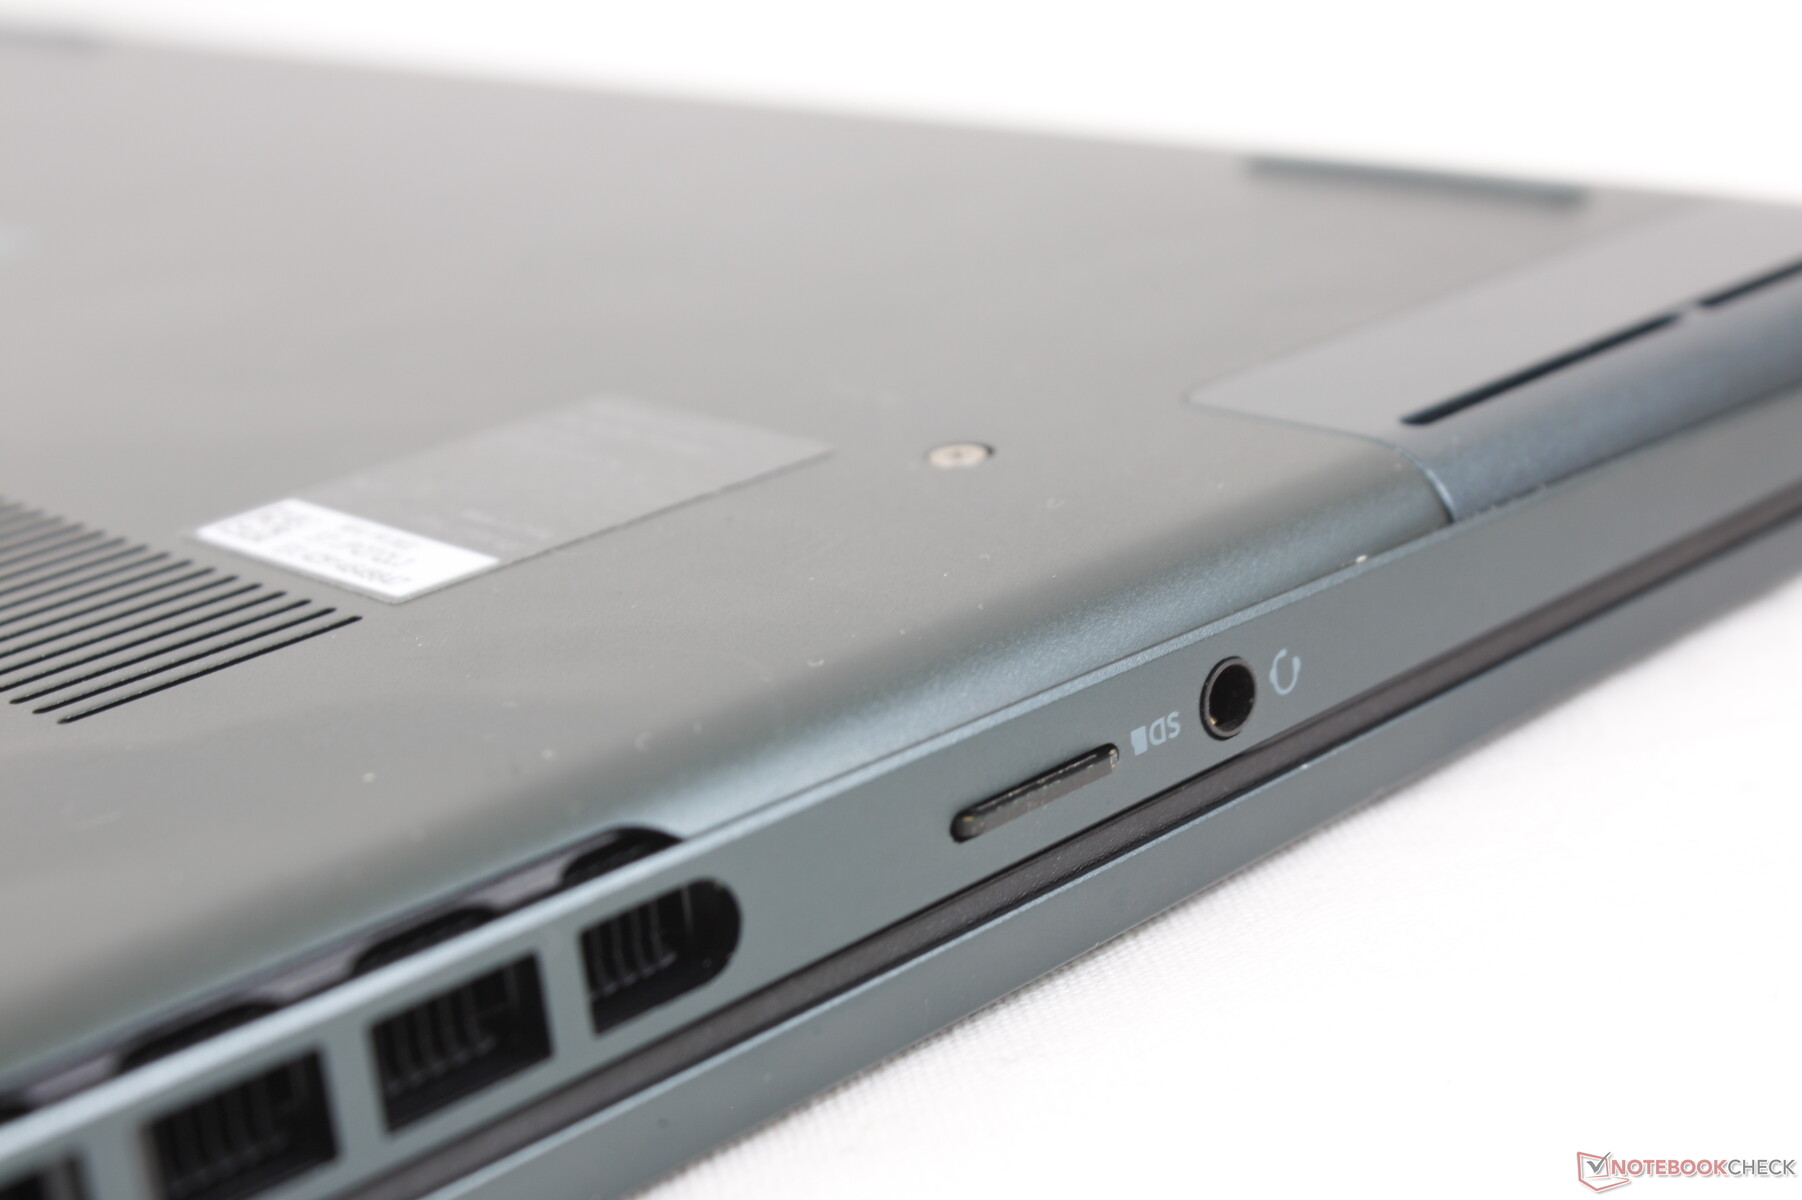
Lector de tarjetas SD
Las velocidades de transferencia del lector MicroSD integrado con resorte son lentas, como las que observamos en el Inspiron 14 7420 2 en 1. Mover 1 GB de fotos desde nuestra tarjeta de prueba UHS-II al escritorio lleva unos 45 segundos.
| SD Card Reader | |
| average JPG Copy Test (av. of 3 runs) | |
| MSI Summit E14 A11SCS (AV Pro V60) | |
| Schenker Vision 14 (Angelbird AV Pro V60) | |
| HP Envy 14-eb0010nr (Toshiba Exceria Pro M501 microSDXC 32GB) | |
| Asus Zenbook 14X UX5400E (AV Pro SD microSD 128 GB V60) | |
| Asus Vivobook Pro 14 M3401QC-KM007T (AV Pro SD microSD 128 GB V60) | |
| Dell Inspiron 14 Plus 7420 (AV PRO microSD 128 GB V60) | |
| Dell Inspiron 14 7420 2-in-1 (Toshiba Exceria Pro SDXC 64 GB UHS-II) | |
| maximum AS SSD Seq Read Test (1GB) | |
| MSI Summit E14 A11SCS (AV Pro V60) | |
| Schenker Vision 14 (Angelbird AV Pro V60) | |
| HP Envy 14-eb0010nr (Toshiba Exceria Pro M501 microSDXC 32GB) | |
| Asus Zenbook 14X UX5400E (AV Pro SD microSD 128 GB V60) | |
| Asus Vivobook Pro 14 M3401QC-KM007T (AV Pro SD microSD 128 GB V60) | |
| Dell Inspiron 14 Plus 7420 (AV PRO microSD 128 GB V60) | |
| Dell Inspiron 14 7420 2-in-1 (Toshiba Exceria Pro SDXC 64 GB UHS-II) | |
Comunicación
Un Intel AX211 viene de serie para la conectividad Wi-Fi 6E y Bluetooth 5.2. Aunque no experimentamos ningún problema al emparejarlo con nuestra red de 6 GHz, las velocidades de transmisión serían ligeramente más inestables que las de recepción, como muestra el gráfico siguiente.
| Networking | |
| iperf3 transmit AX12 | |
| Schenker Vision 14 | |
| HP Envy 14-eb0010nr | |
| MSI Summit E14 A11SCS | |
| Asus Zenbook 14X UX5400E | |
| iperf3 receive AX12 | |
| Schenker Vision 14 | |
| MSI Summit E14 A11SCS | |
| HP Envy 14-eb0010nr | |
| Asus Zenbook 14X UX5400E | |
| iperf3 receive AXE11000 6GHz | |
| Dell Inspiron 14 Plus 7420 | |
| Dell Inspiron 14 7420 2-in-1 | |
| Asus Vivobook Pro 14 M3401QC-KM007T | |
| iperf3 transmit AXE11000 6GHz | |
| Dell Inspiron 14 Plus 7420 | |
| Dell Inspiron 14 7420 2-in-1 | |
| Asus Vivobook Pro 14 M3401QC-KM007T | |
Cámara web
la cámara web de 2 MP ofrece una calidad de imagen similar a la cámara web de 2 MP del Inspiron 14 7420 2 en 1 estándar. Un obturador de privacidad físico viene de serie mientras que Windows Hello e IR no son compatibles.


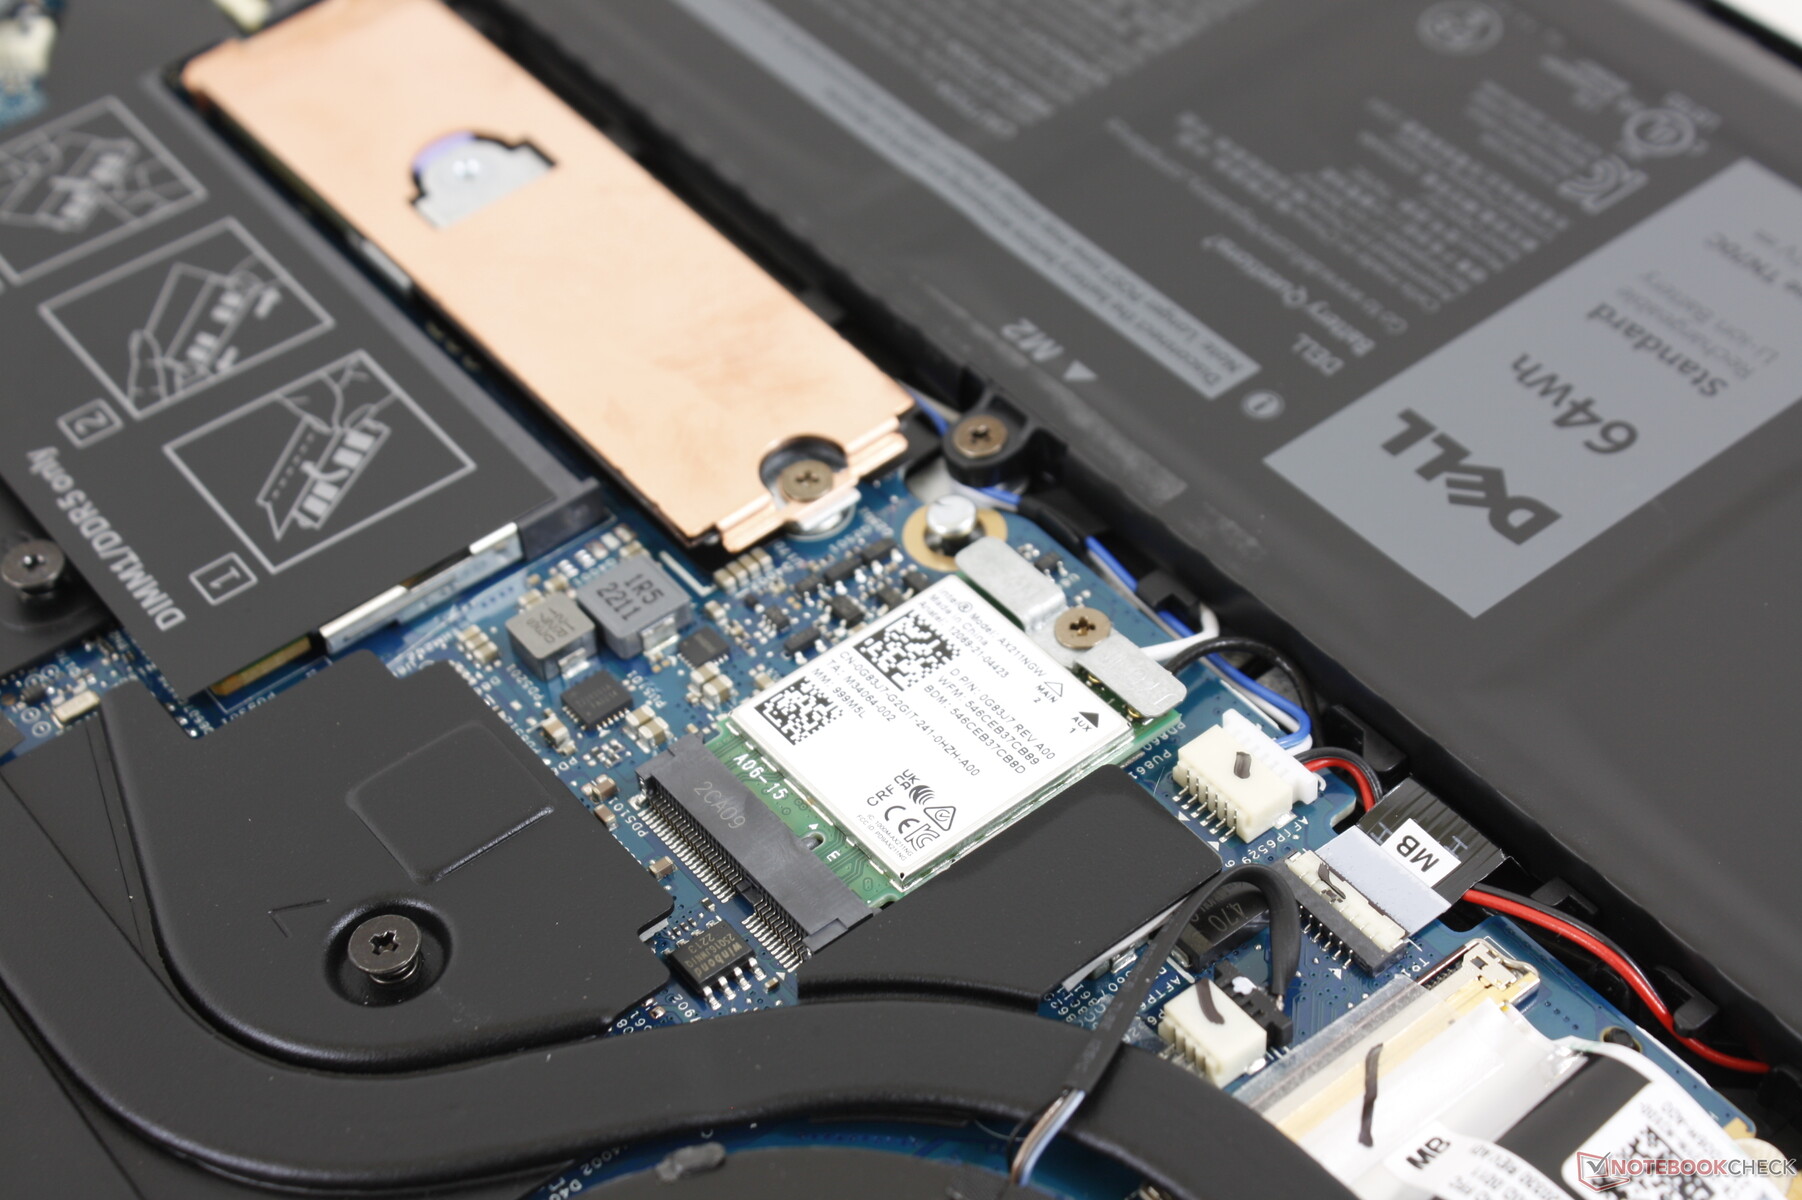
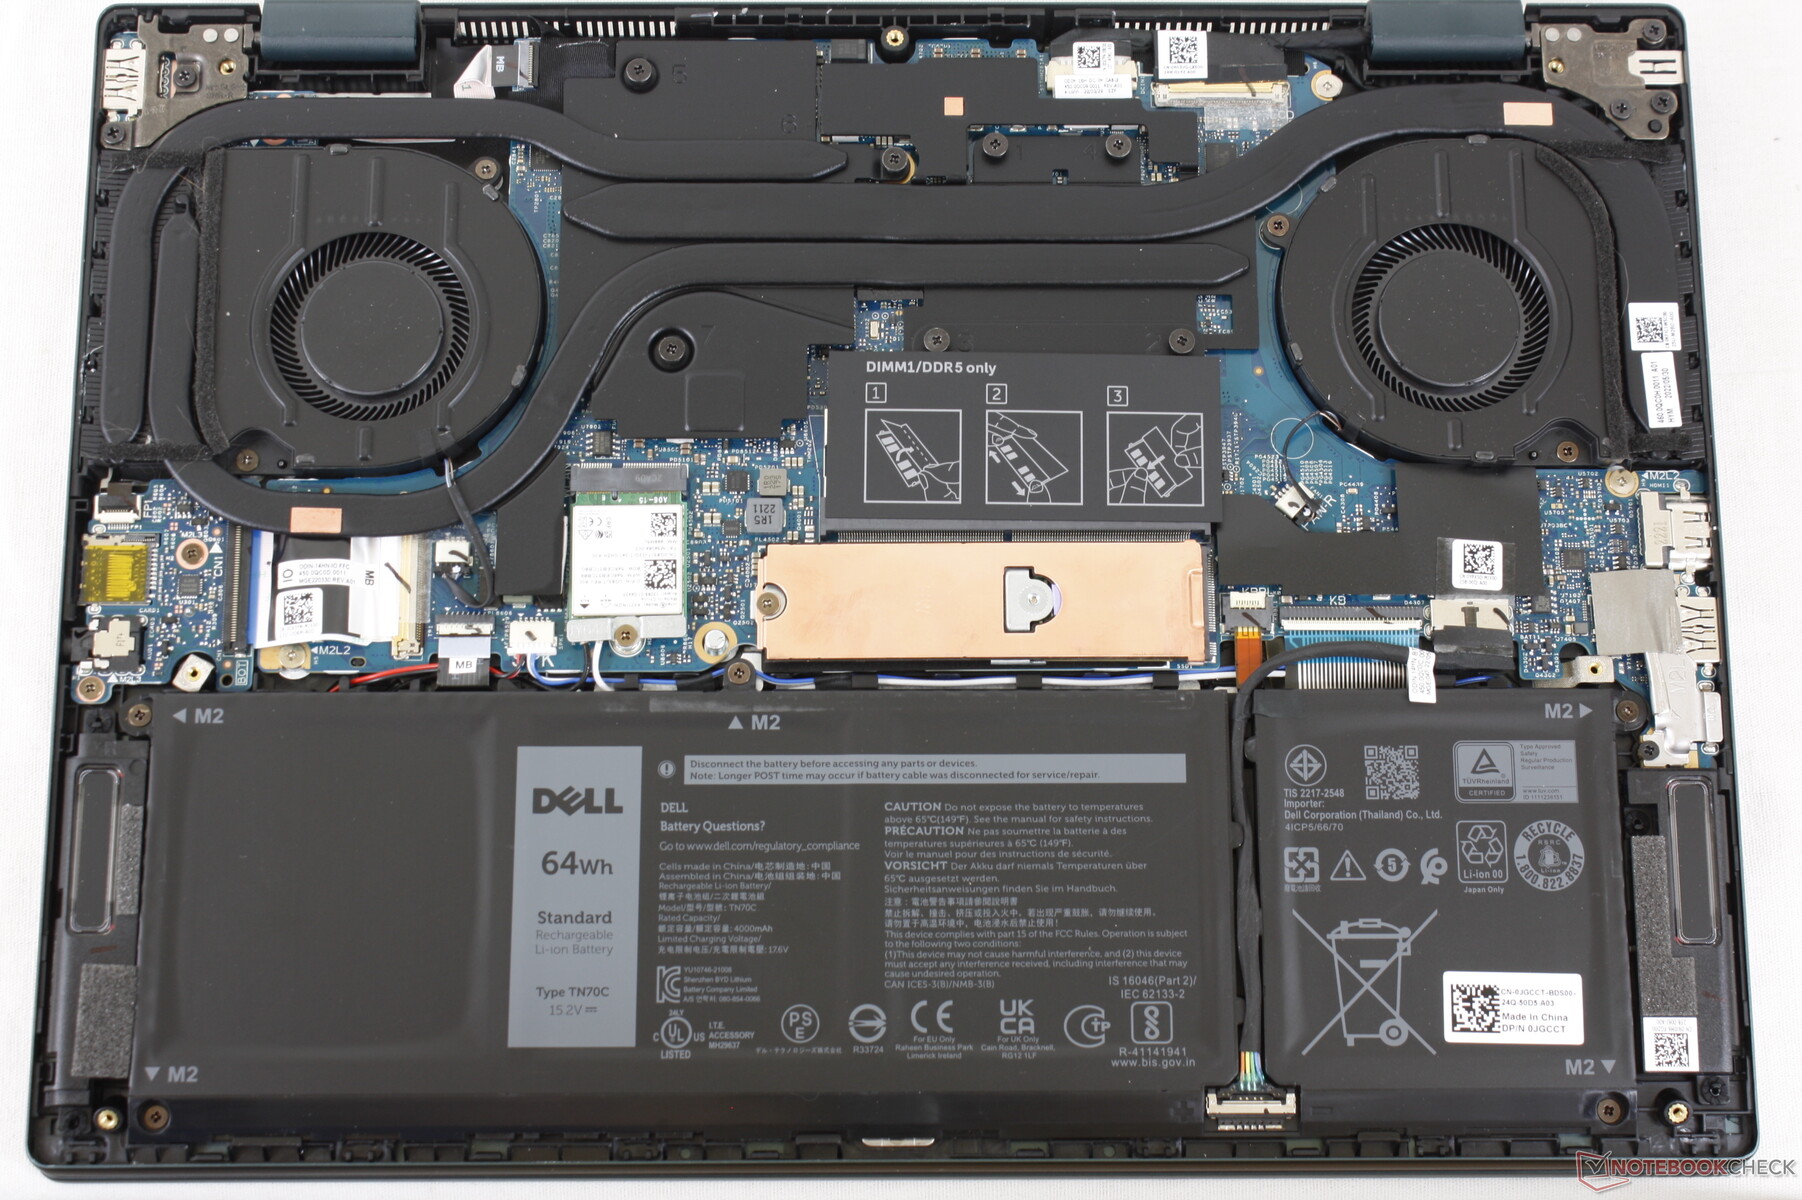
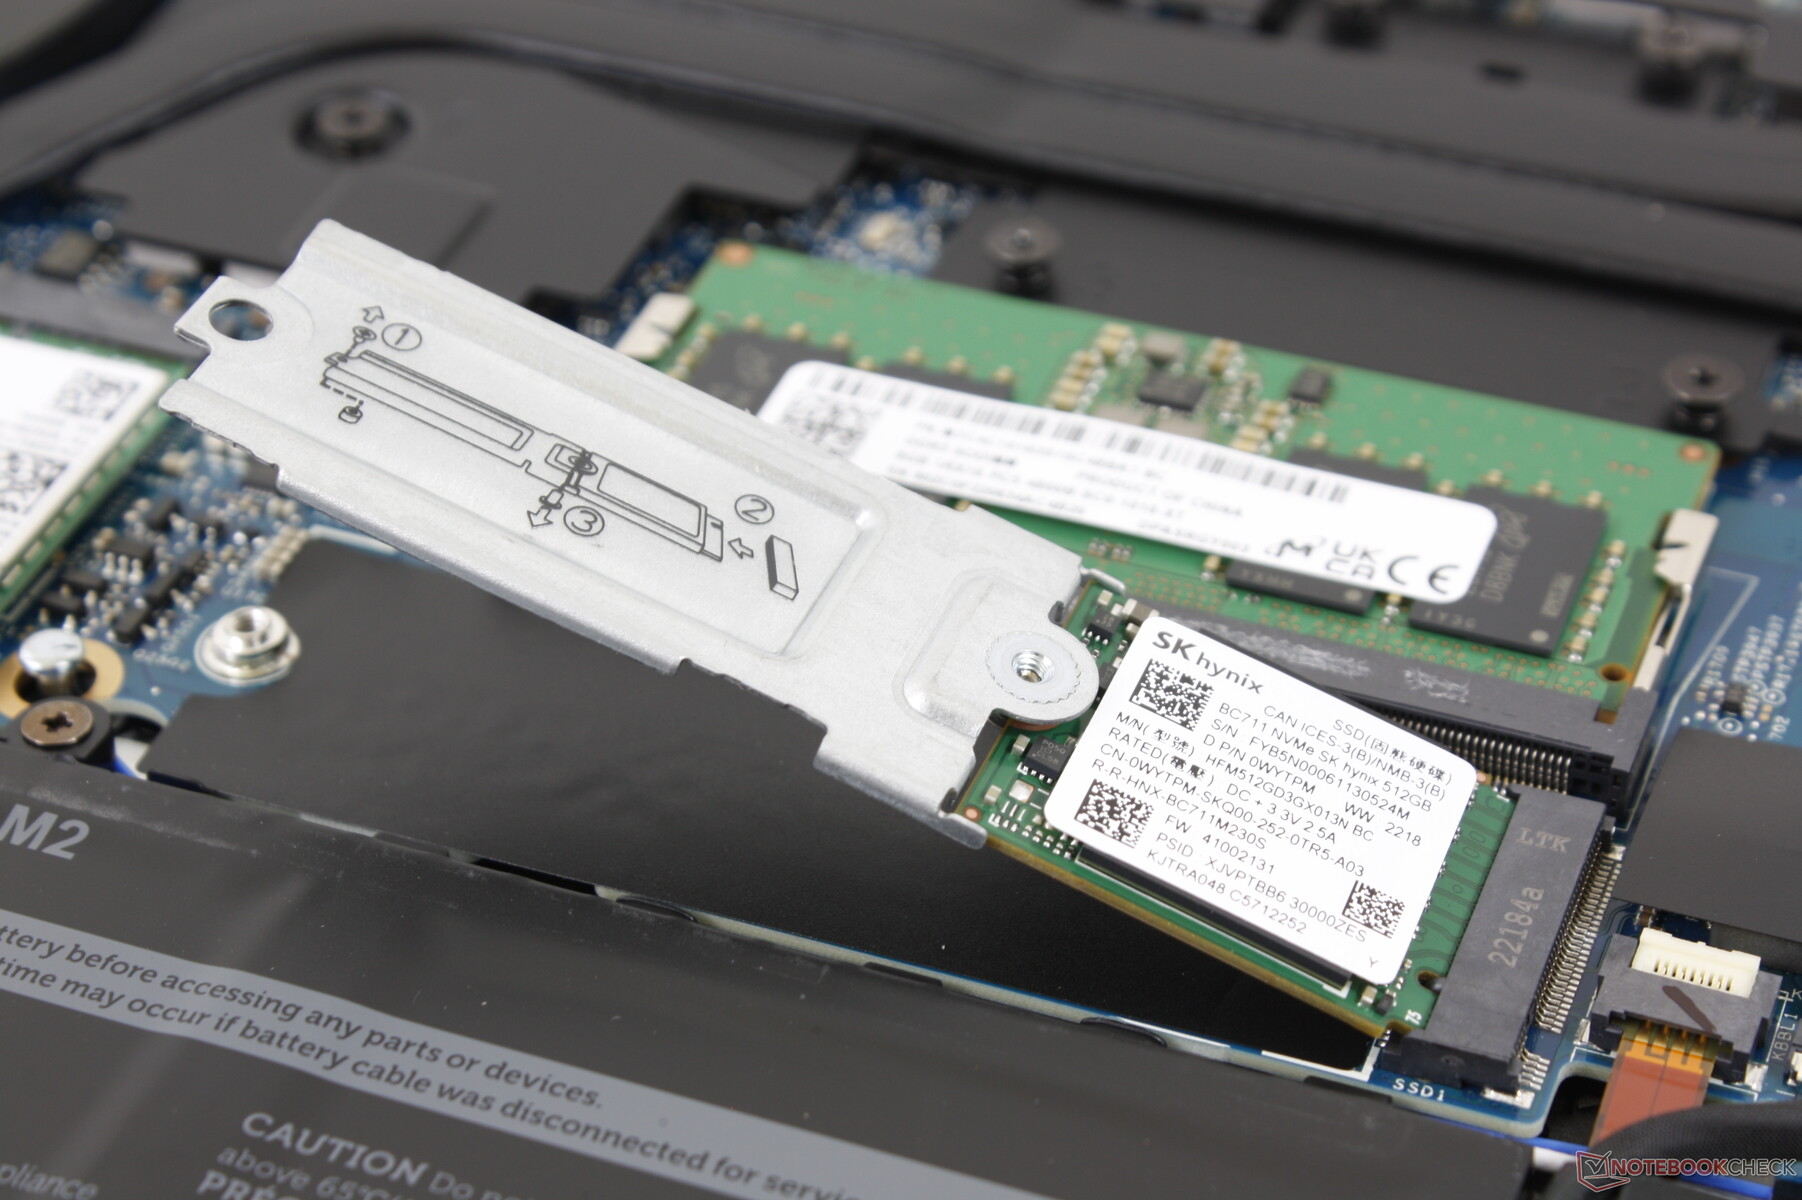
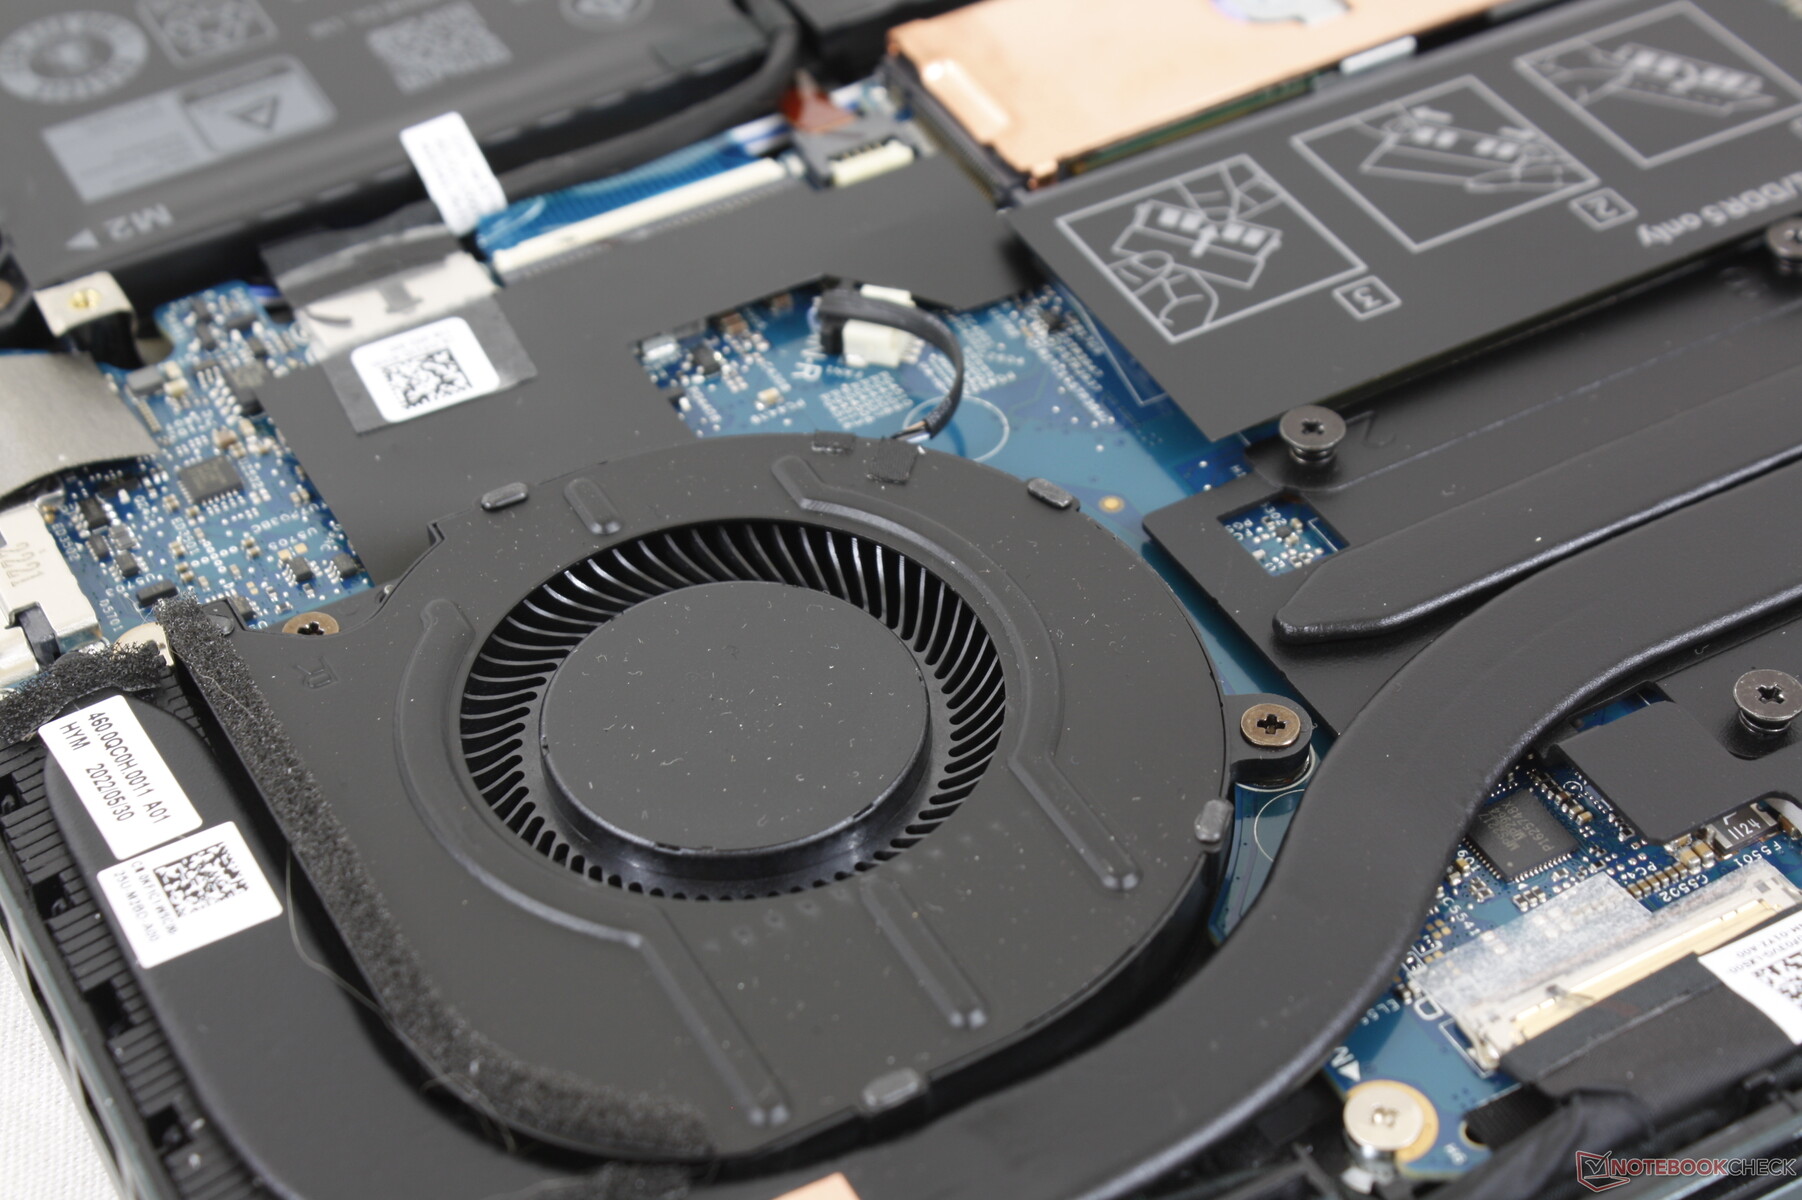
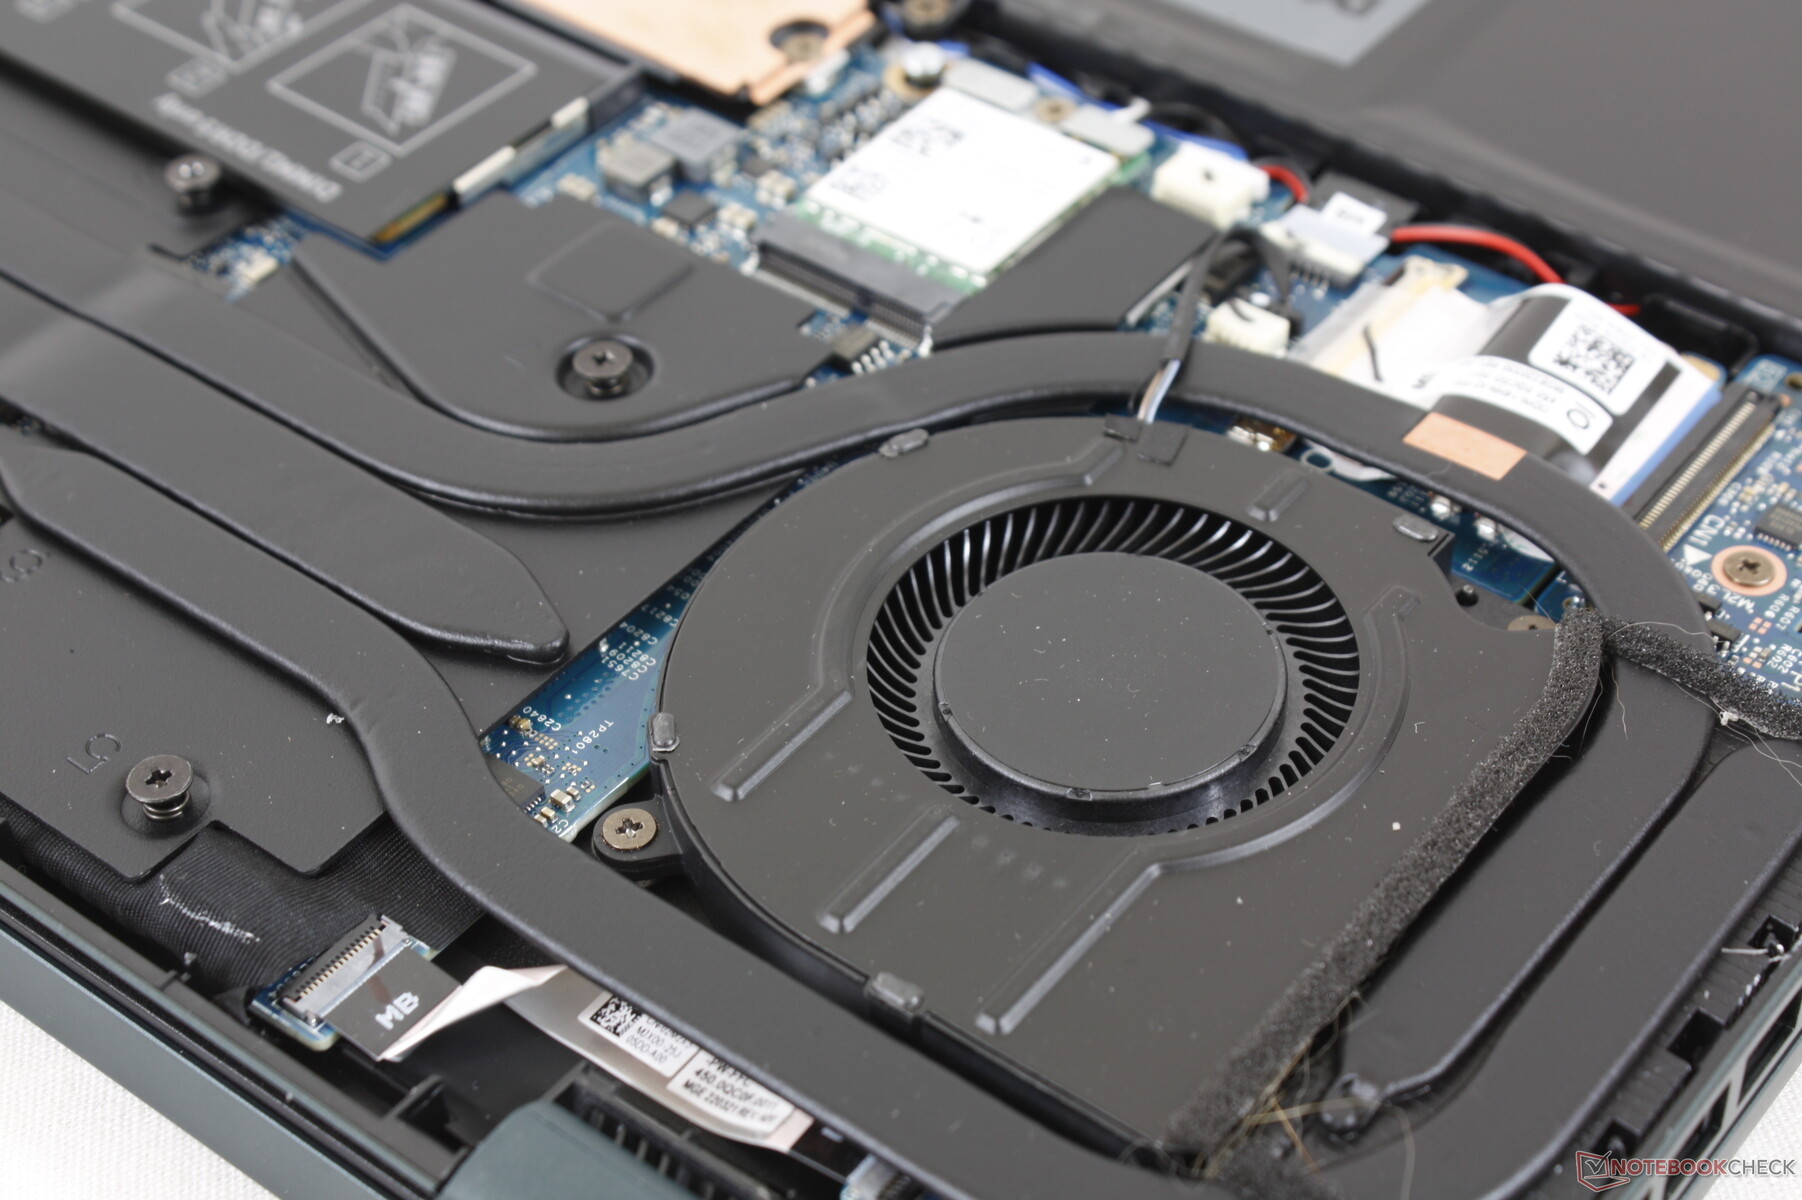
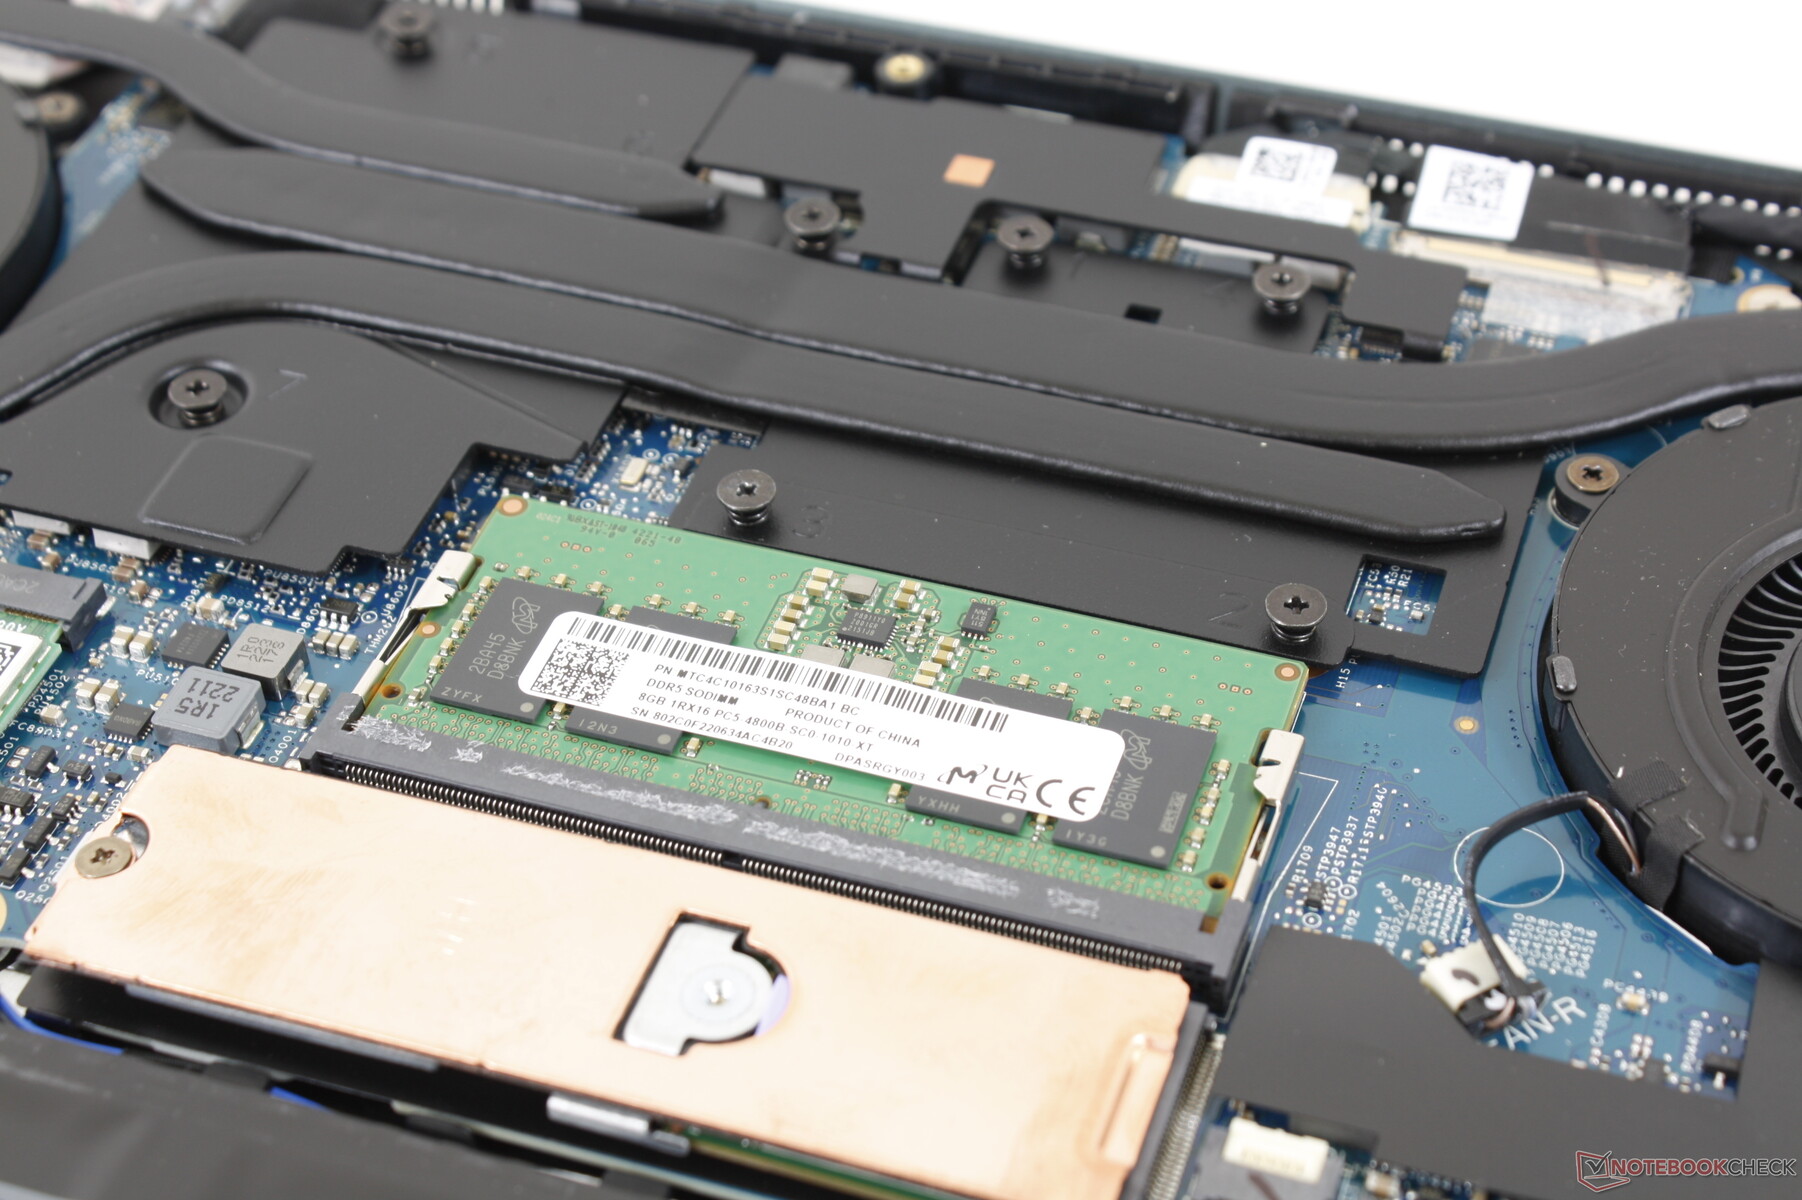
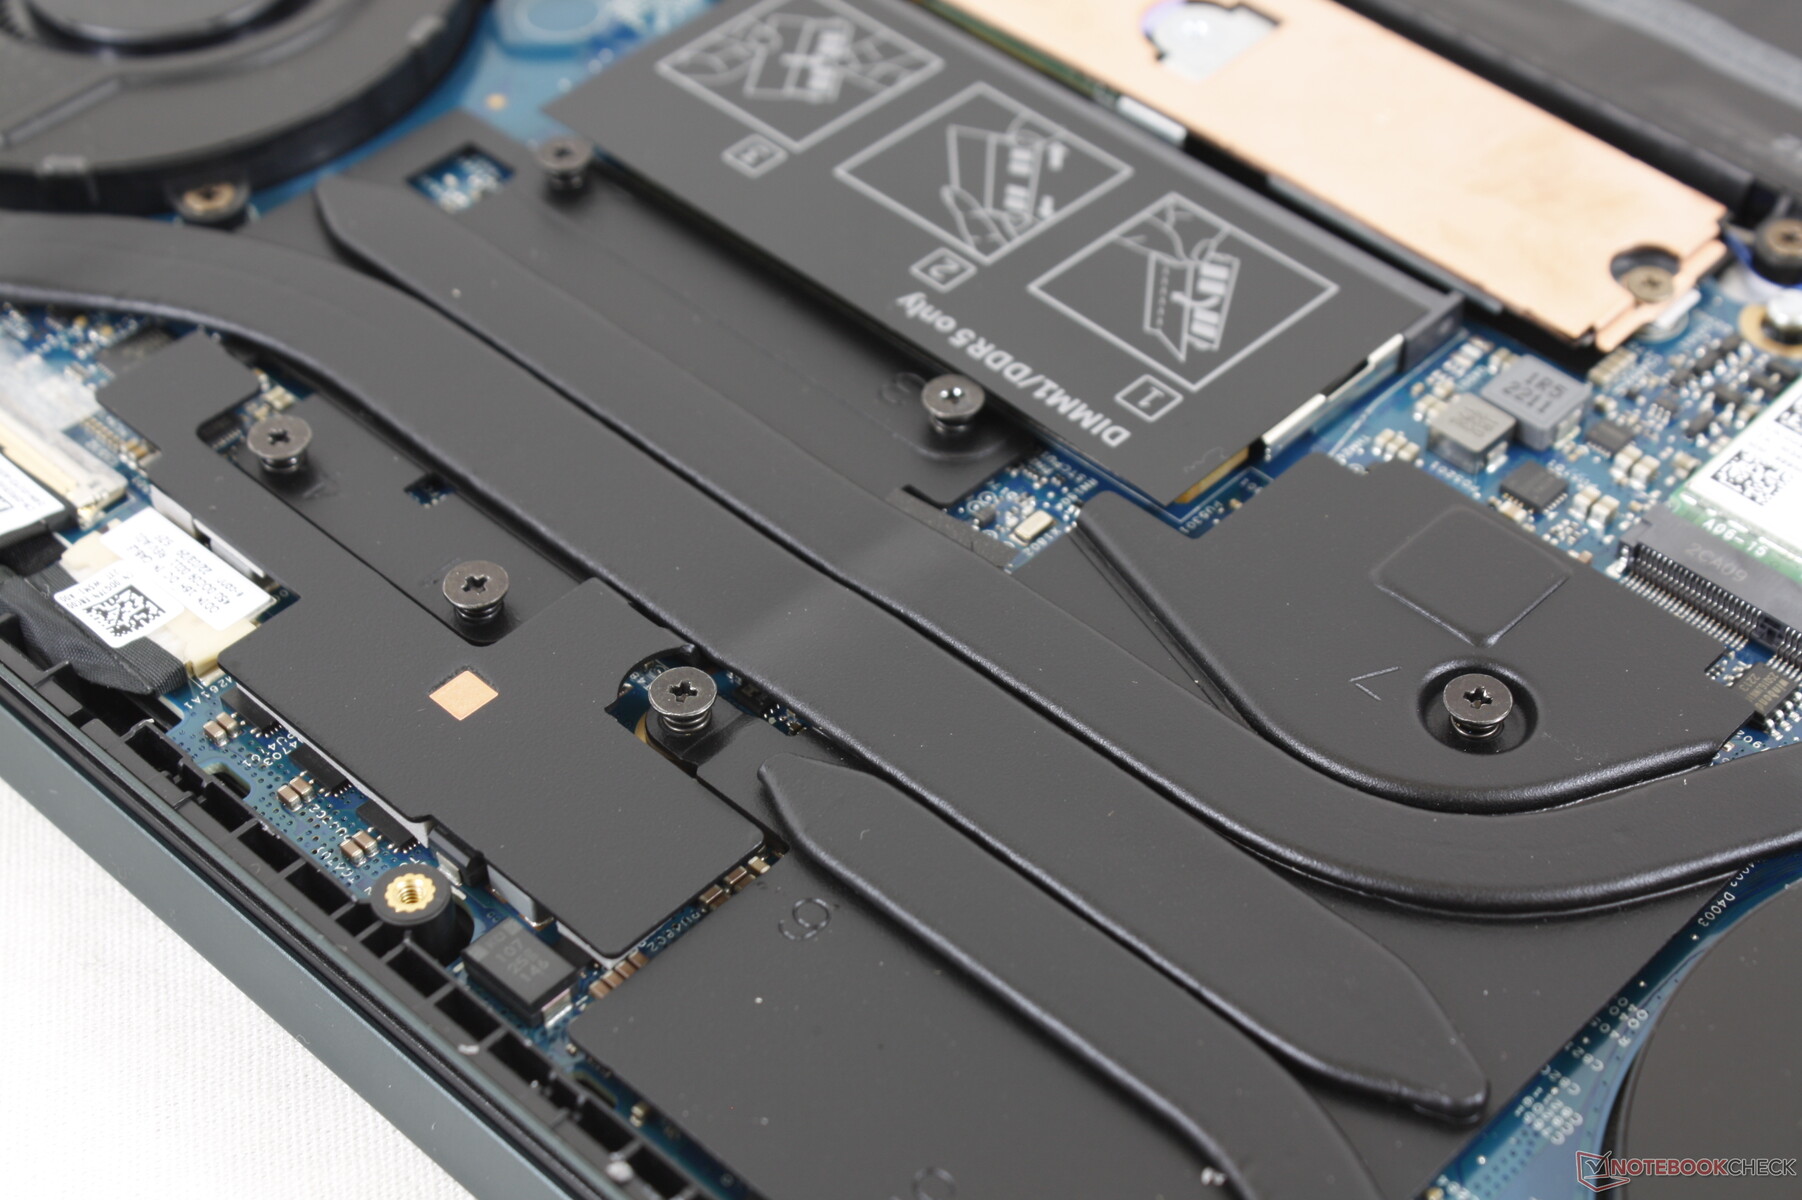
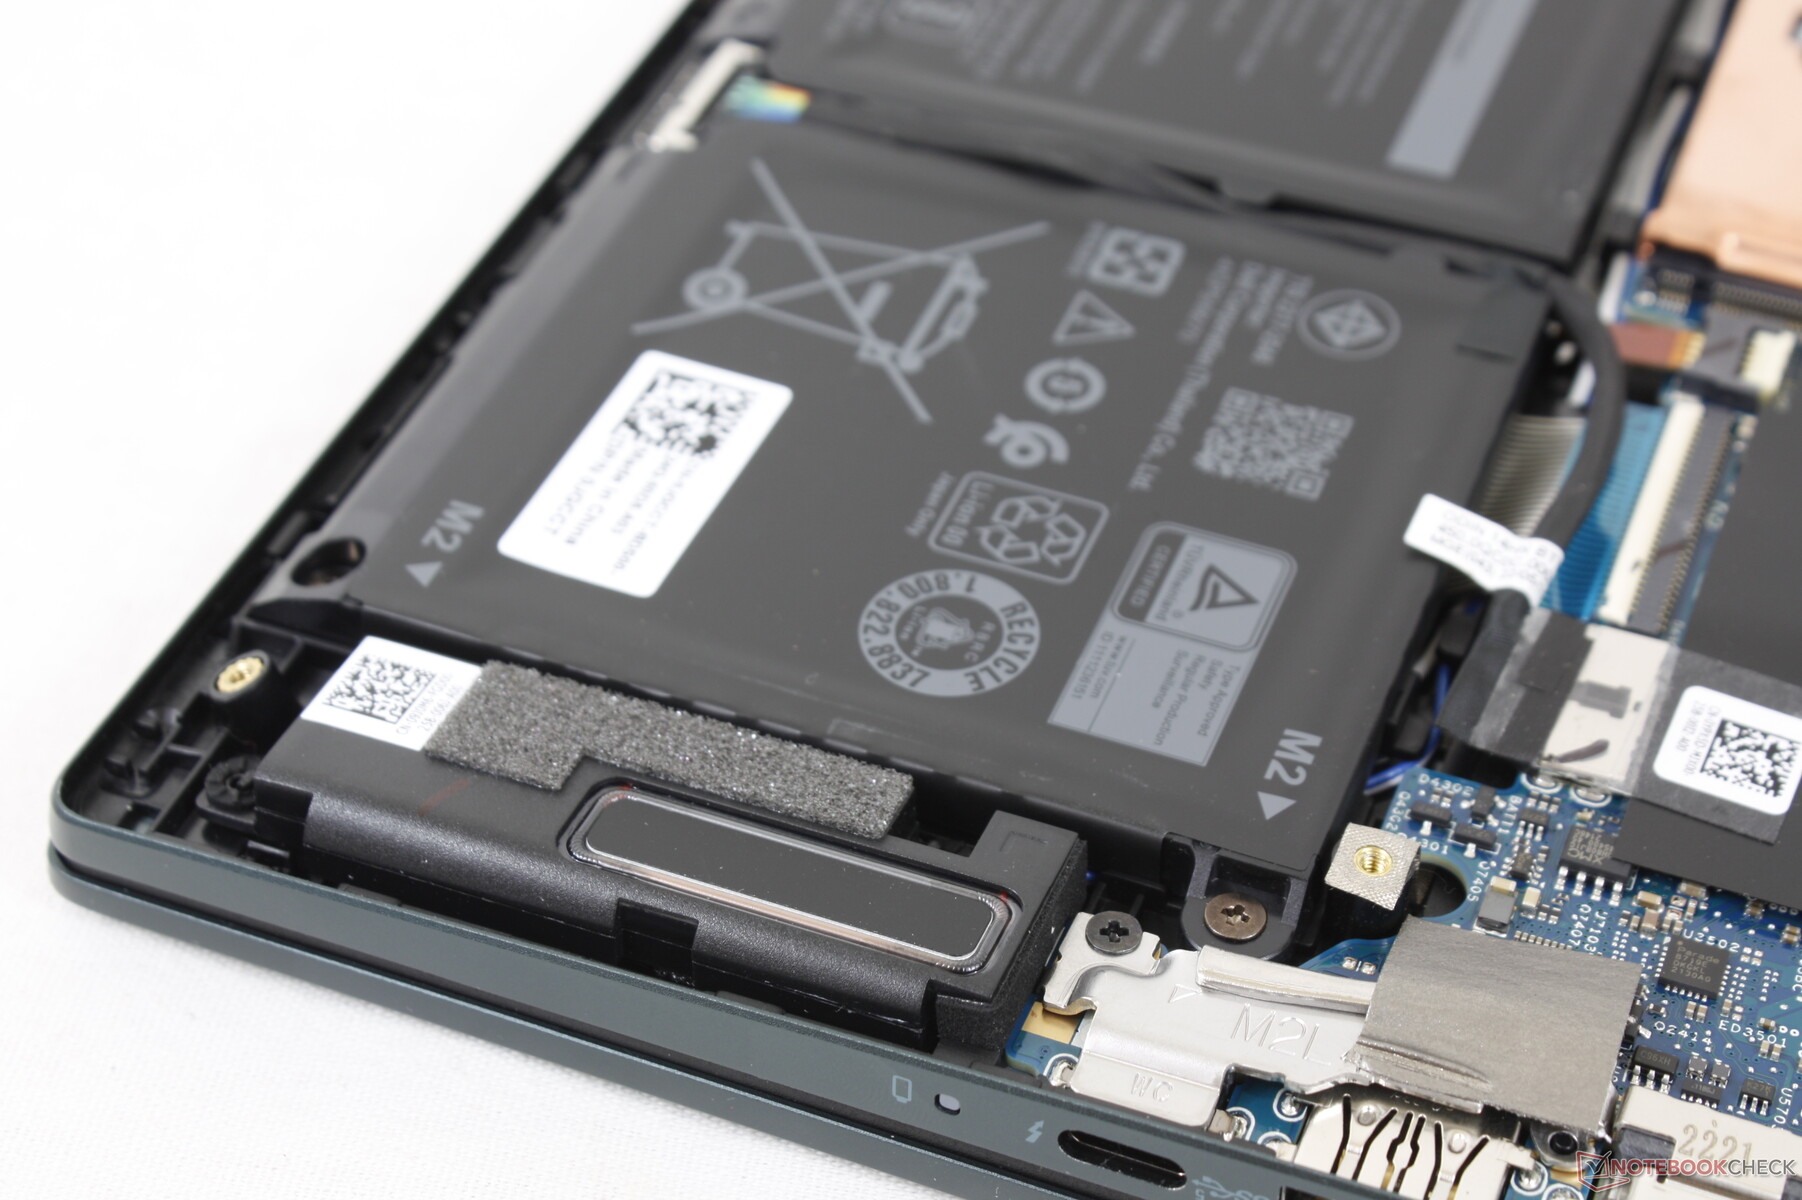
Mantenimiento
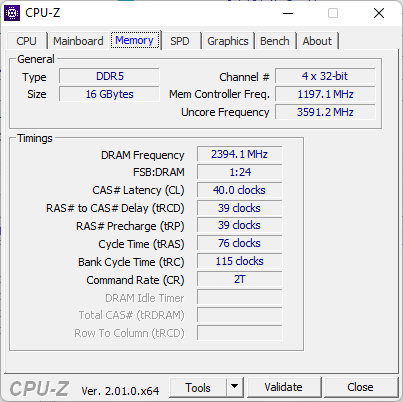
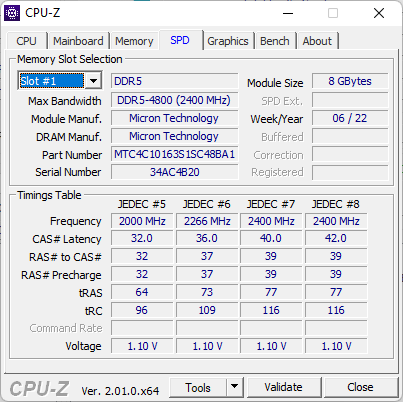
El panel inferior se desprende con bastante facilidad con un destornillador Philips y un borde de plástico afilado. Una vez dentro, los usuarios pueden dar servicio a la batería, una ranura de almacenamiento M.2 2280, una ranura SODIMM DDR5 y un módulo WLAN M.2. Hay que tener en cuenta que 8 GB de RAM vienen soldados en todas las referencias, lo que significa que los usuarios pueden añadir un solo módulo para una capacidad máxima de RAM de 40 GB.
Accesorios y garantía
No hay más extras en la caja que el adaptador de CA y la documentación. Se aplica la habitual garantía limitada de un año si se adquiere en Estados Unidos.
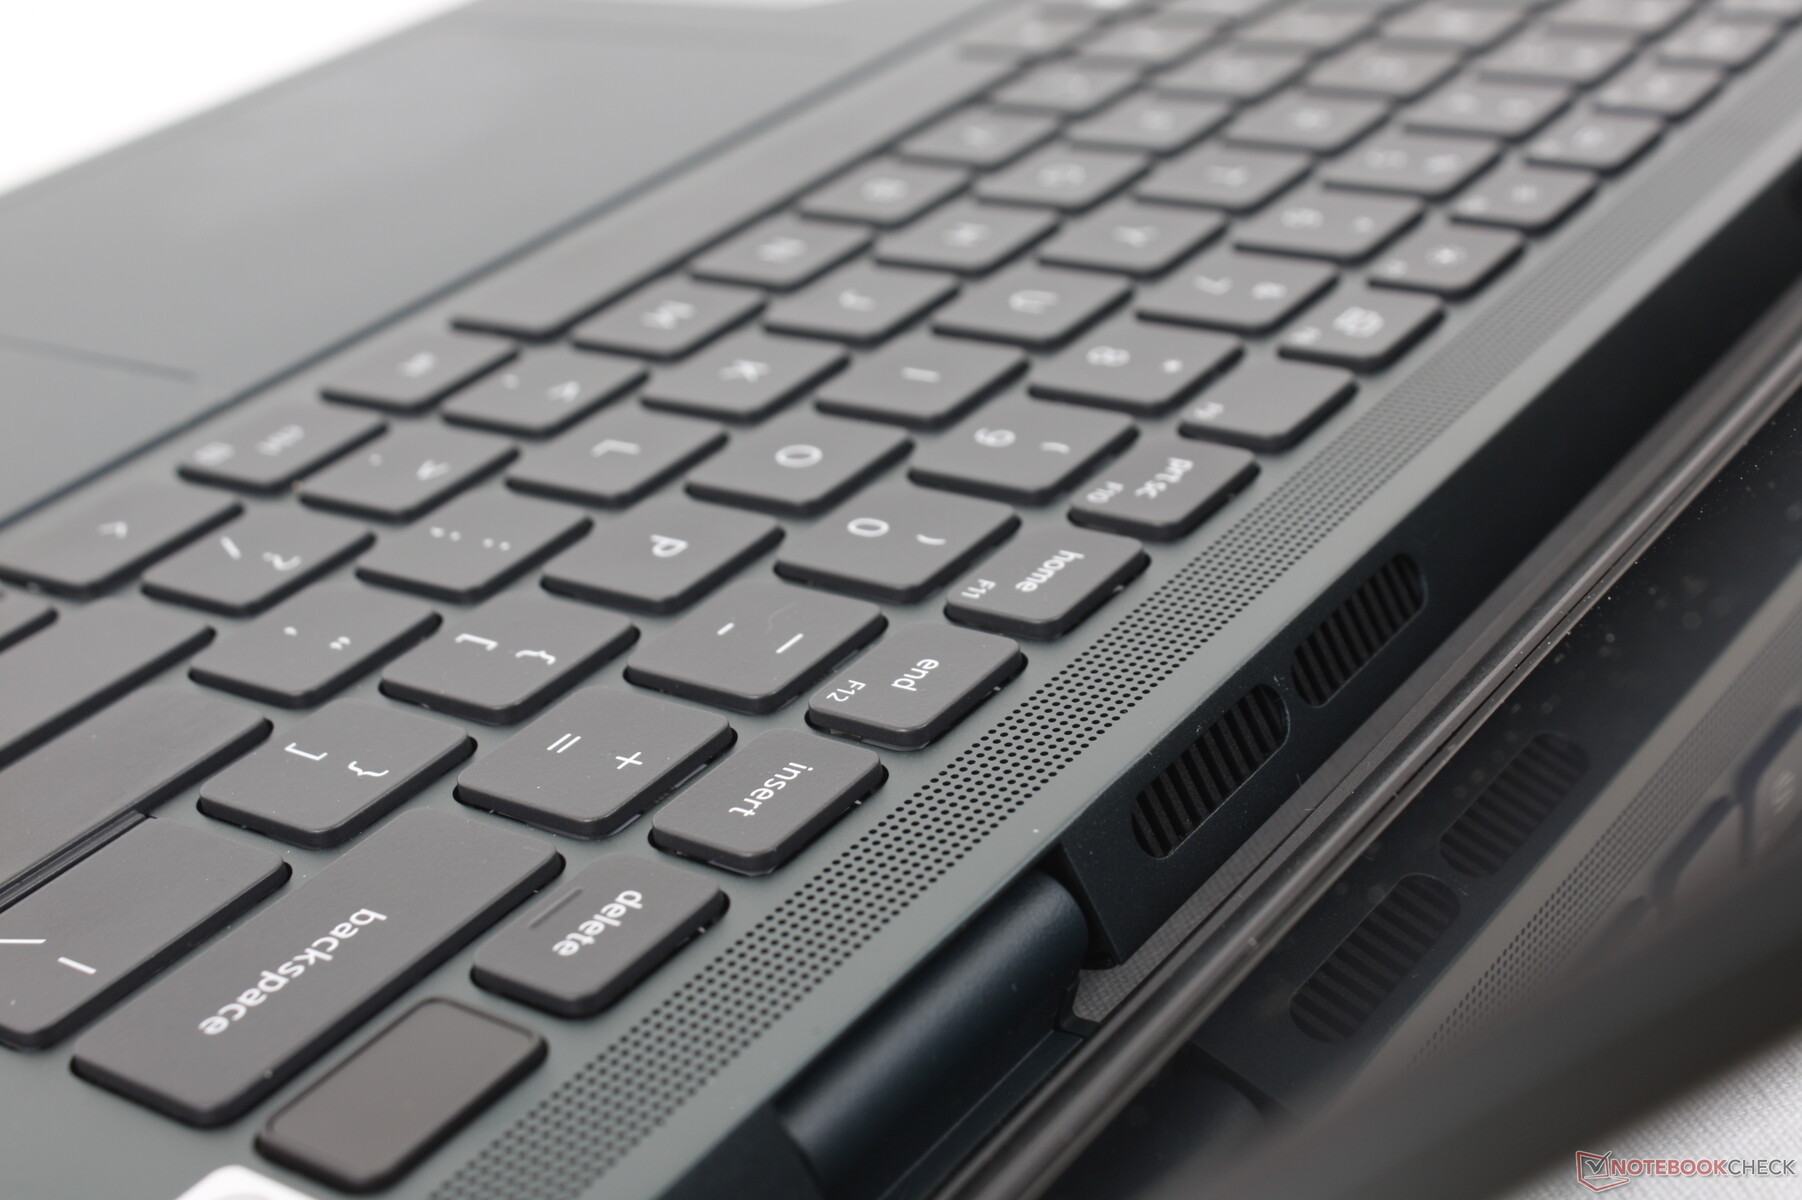
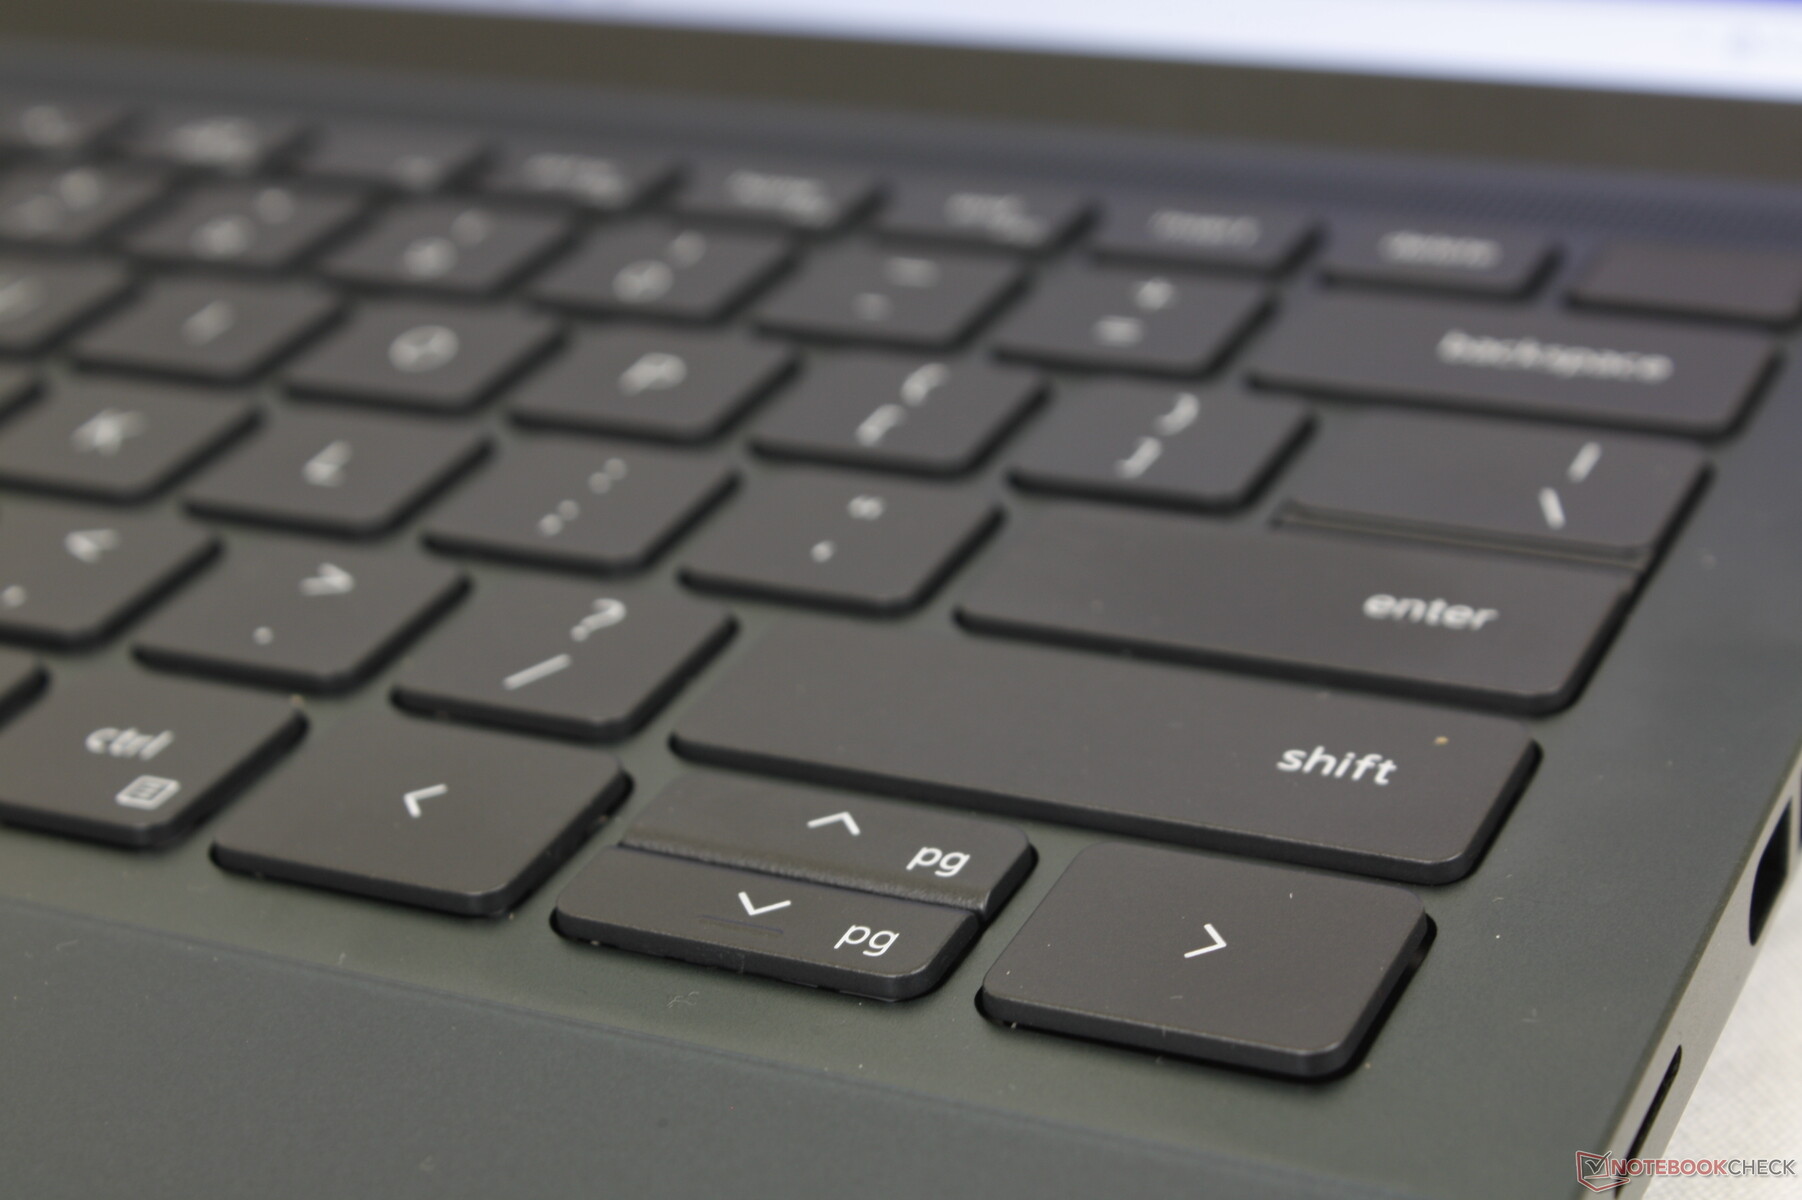
Dispositivos de entrada - He estado aquí, he visto eso
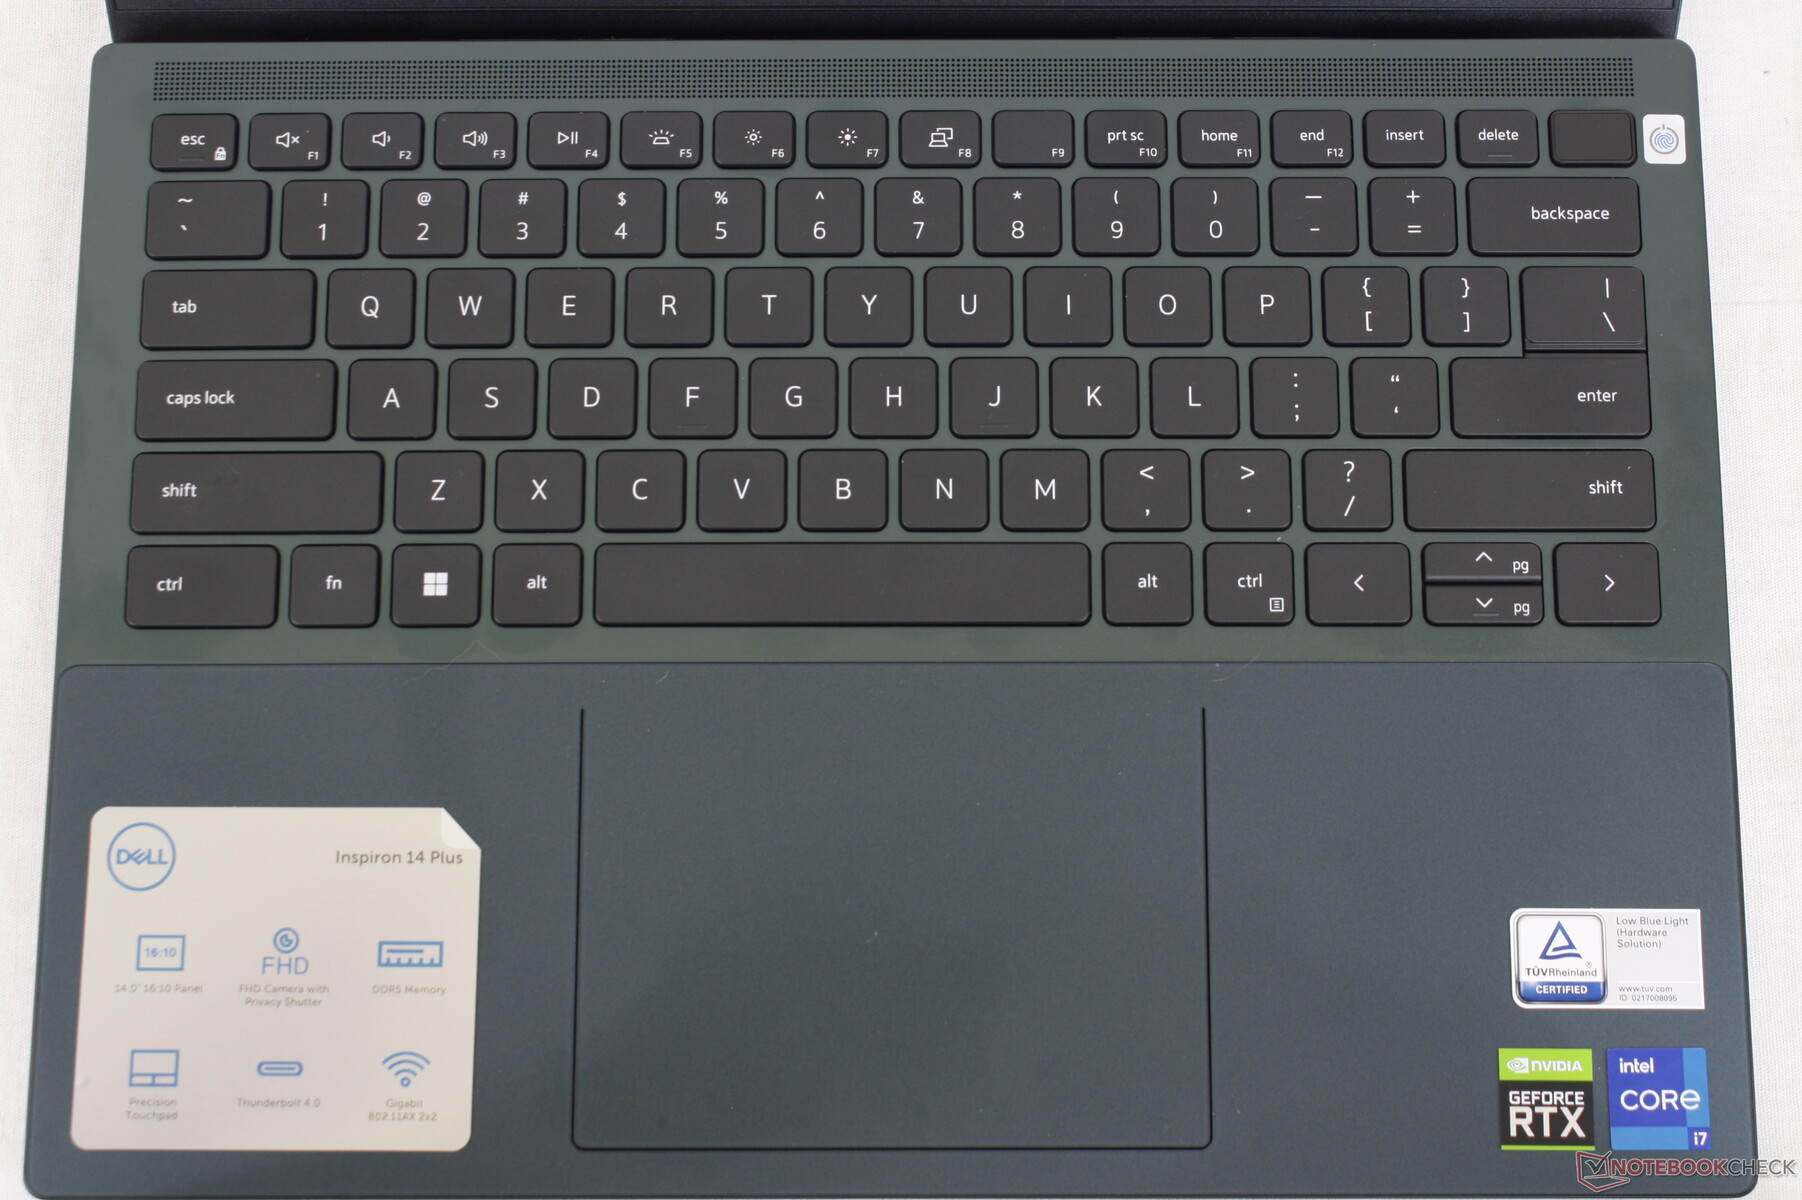
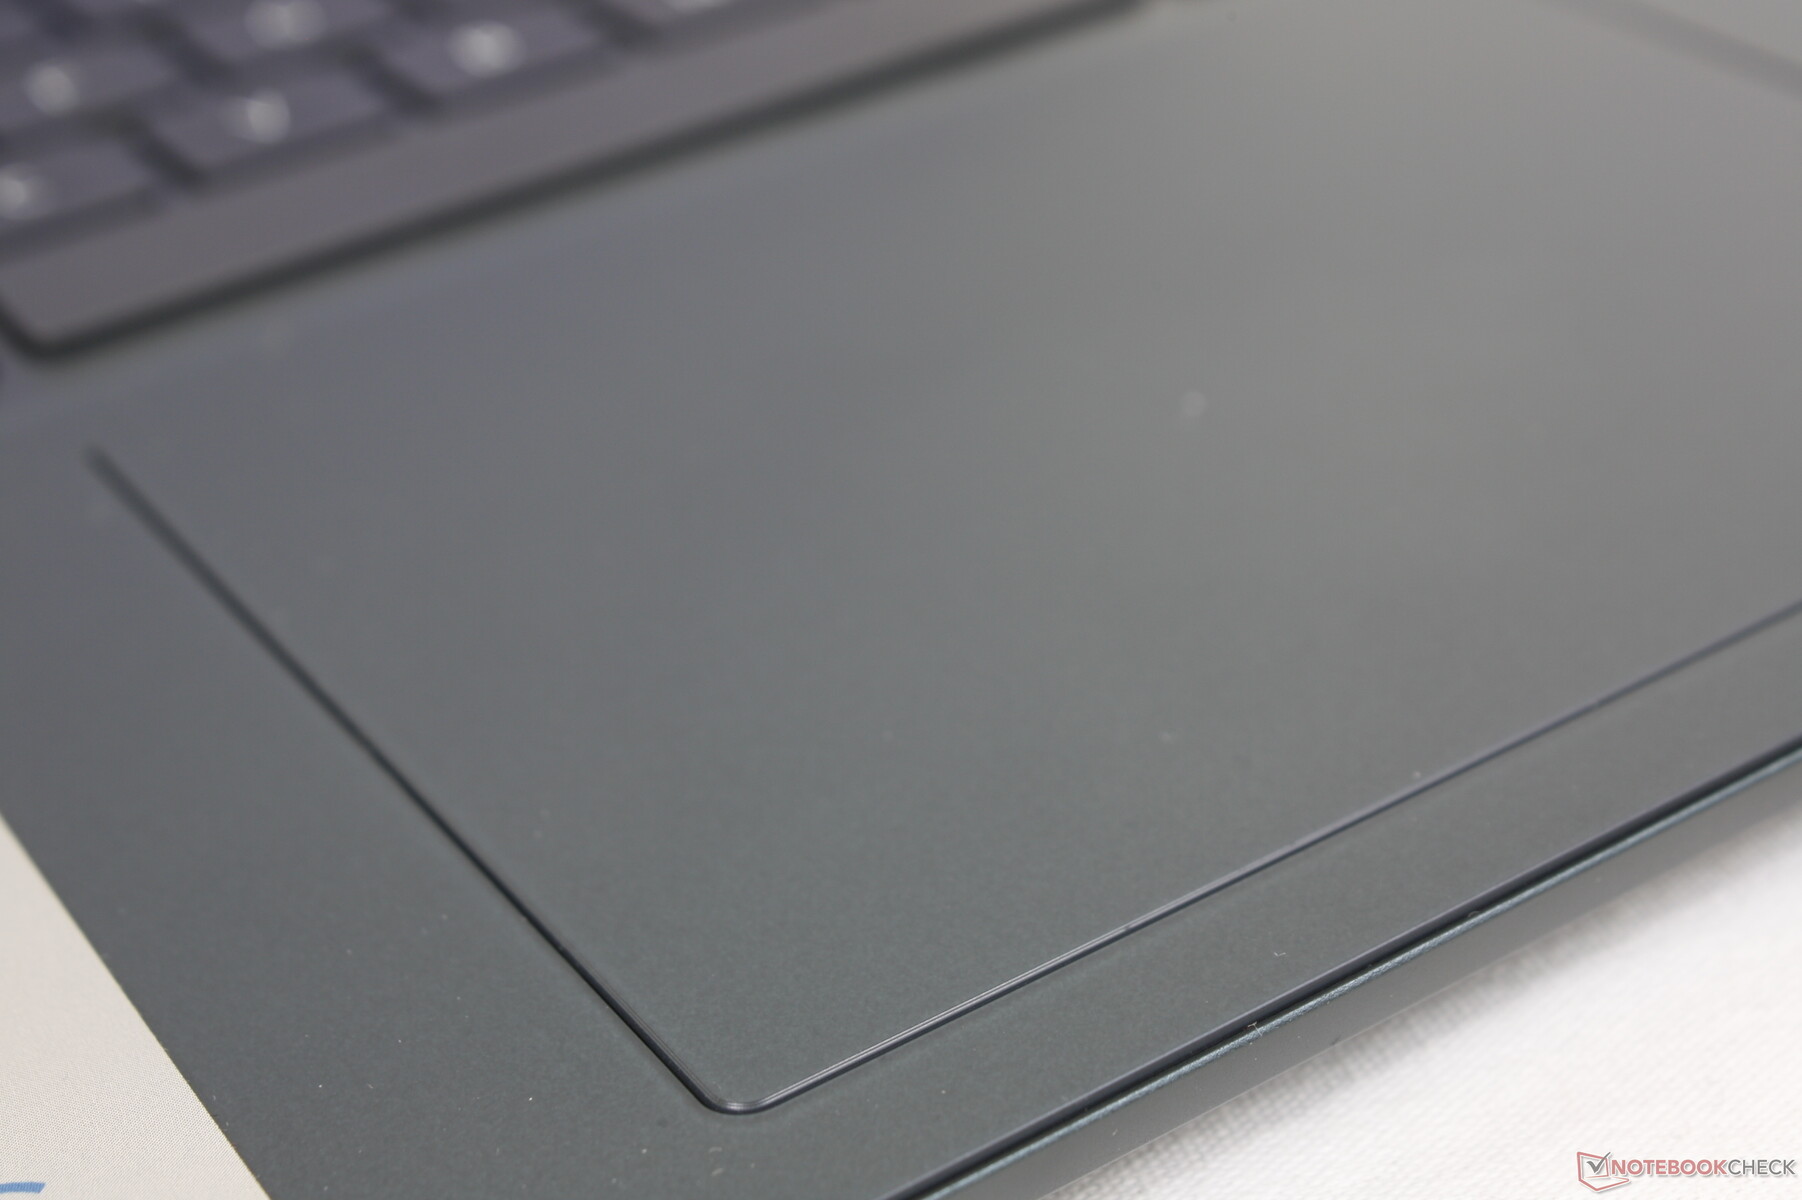
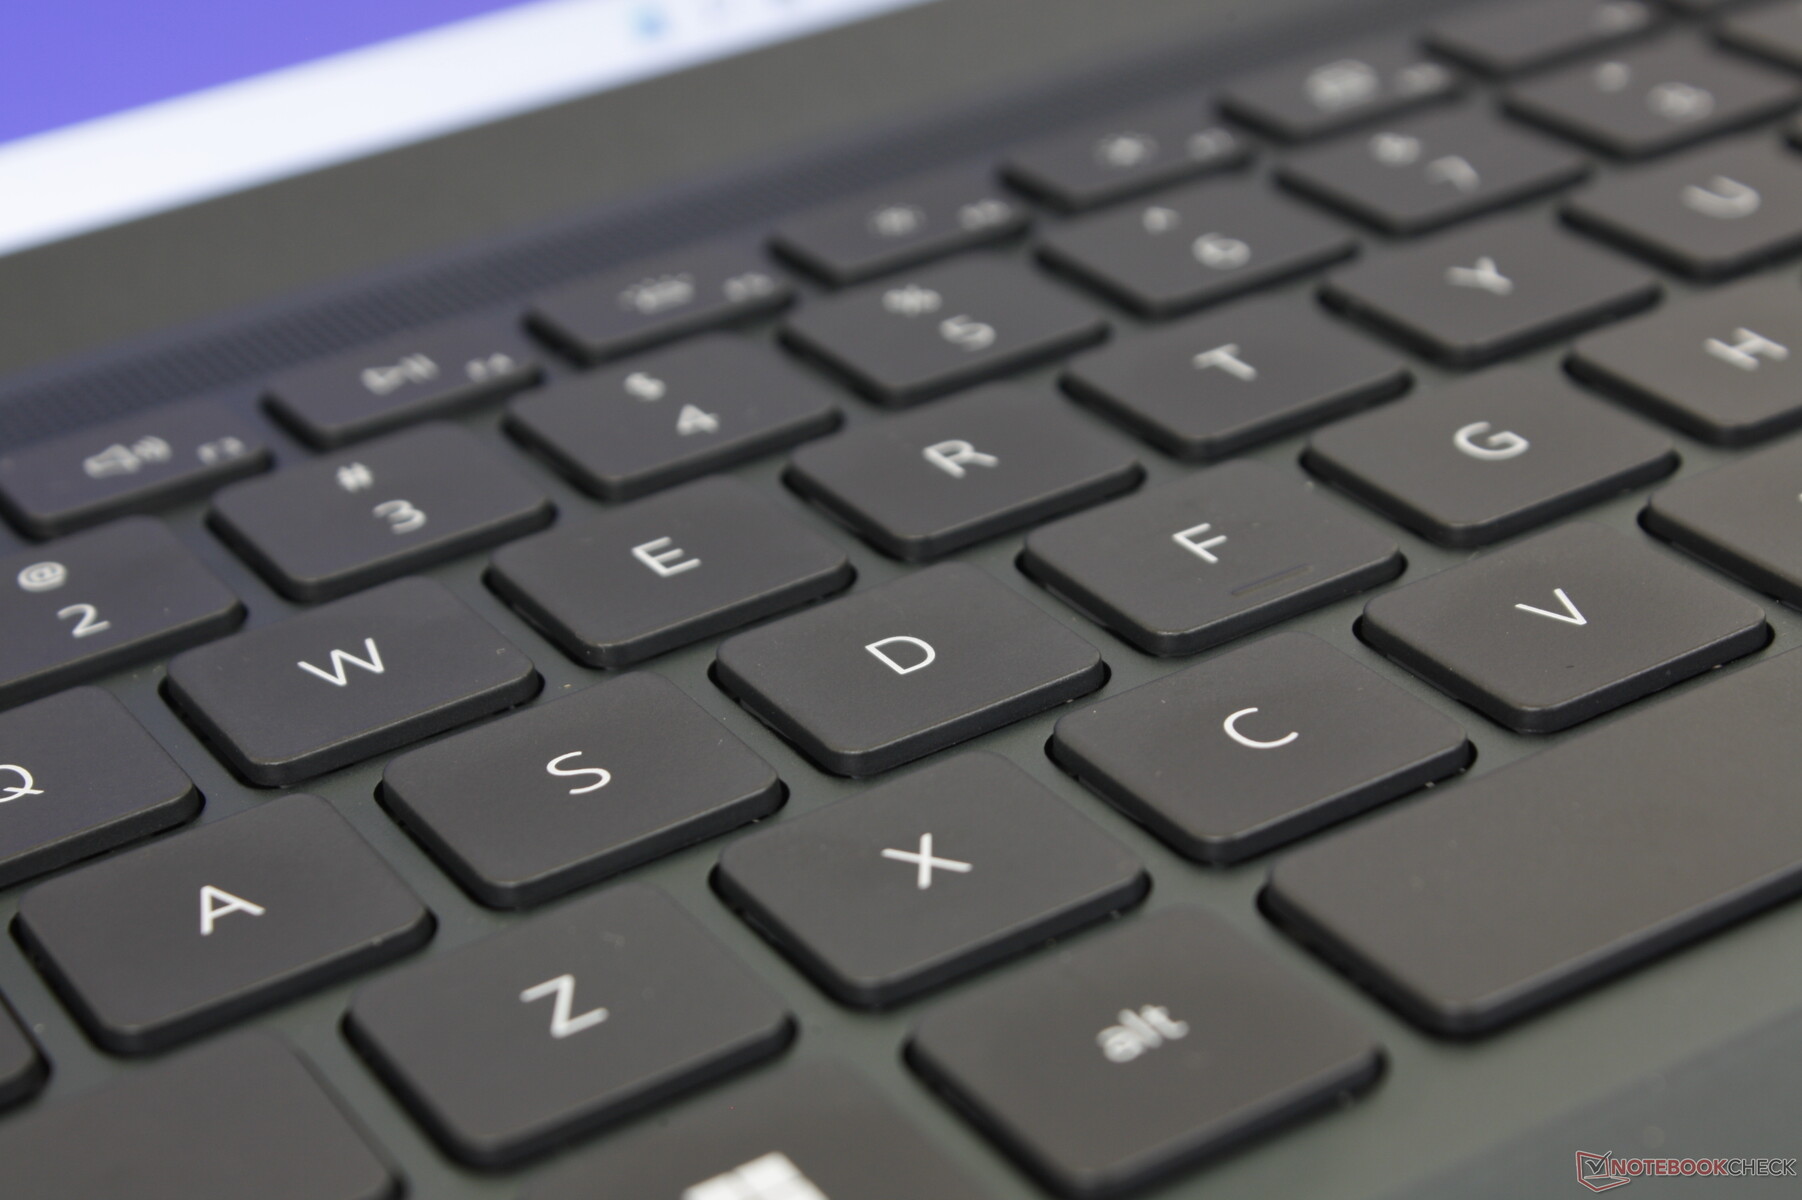
Teclado y panel táctil
La experiencia de escribir es la misma que en el Inspiron 16 Plus 7620,Inspiron 16 7620 2 en 1o el Inspiron 14 7420 2-en-1 ya que los cuatro modelos comparten las mismas teclas del teclado y el clickpad Mylar. Incluso los símbolos de las teclas primarias y secundarias y el tamaño del clickpad (11,5 x 8 cm) son idénticos entre los modelos, independientemente de las diferencias de tamaño de la pantalla. En resumen, las teclas tienen una respuesta adecuada y un ruido moderado, salvo la tecla Espacio, que parece demasiado superficial. Asimismo, la superficie del clickpad funciona de forma fiable para el control estándar del cursor, mientras que sus teclas integradas son demasiado blandas y esponjosas al arrastrar y soltar.
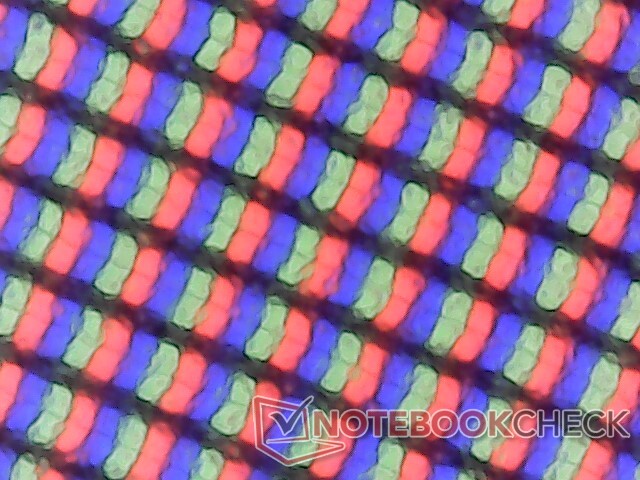
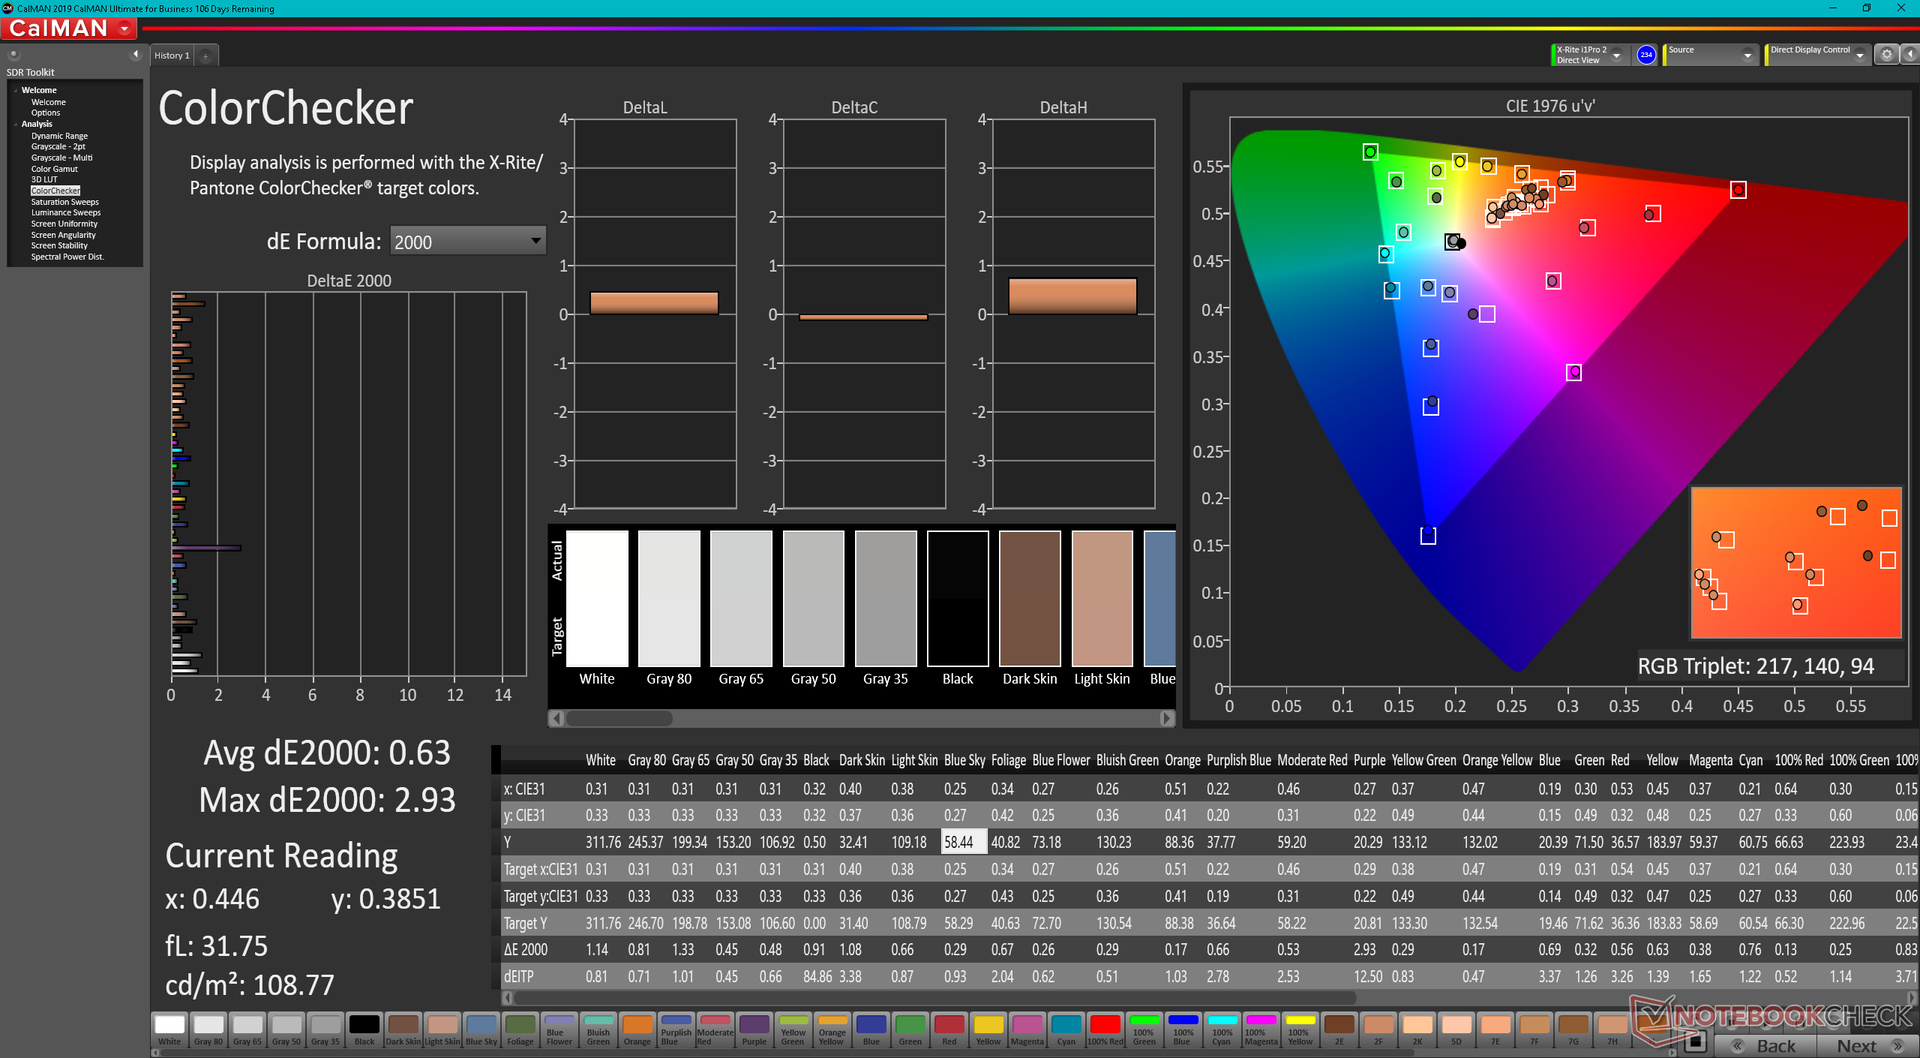
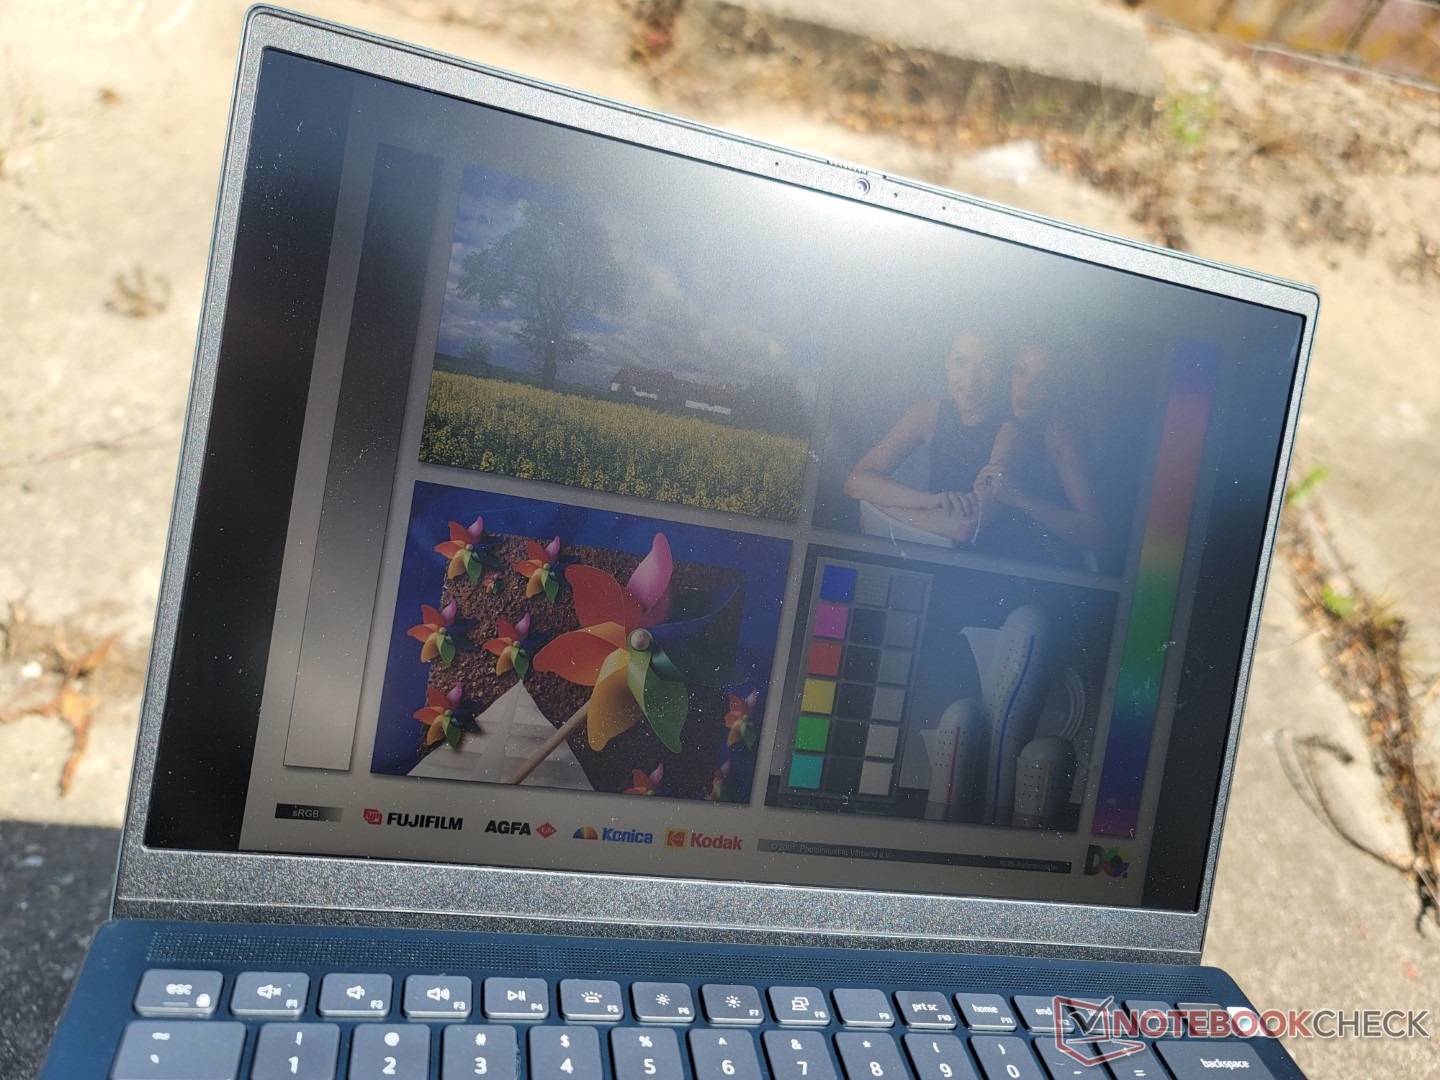
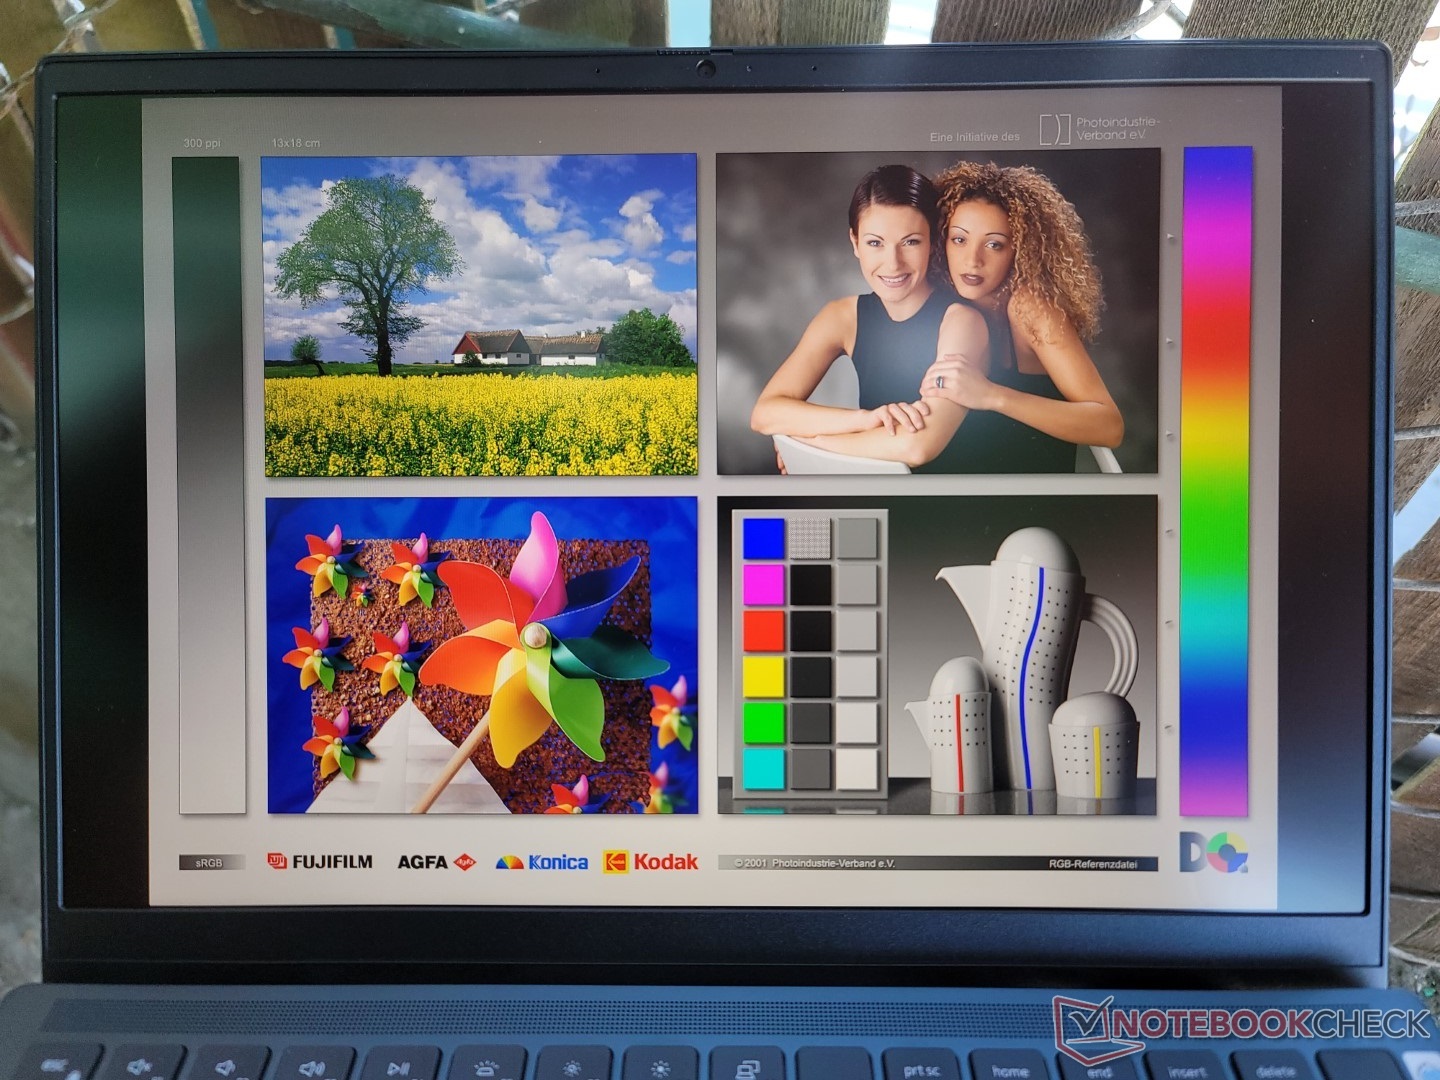
Pantalla - Cobertura completa de sRGB y 60 Hz
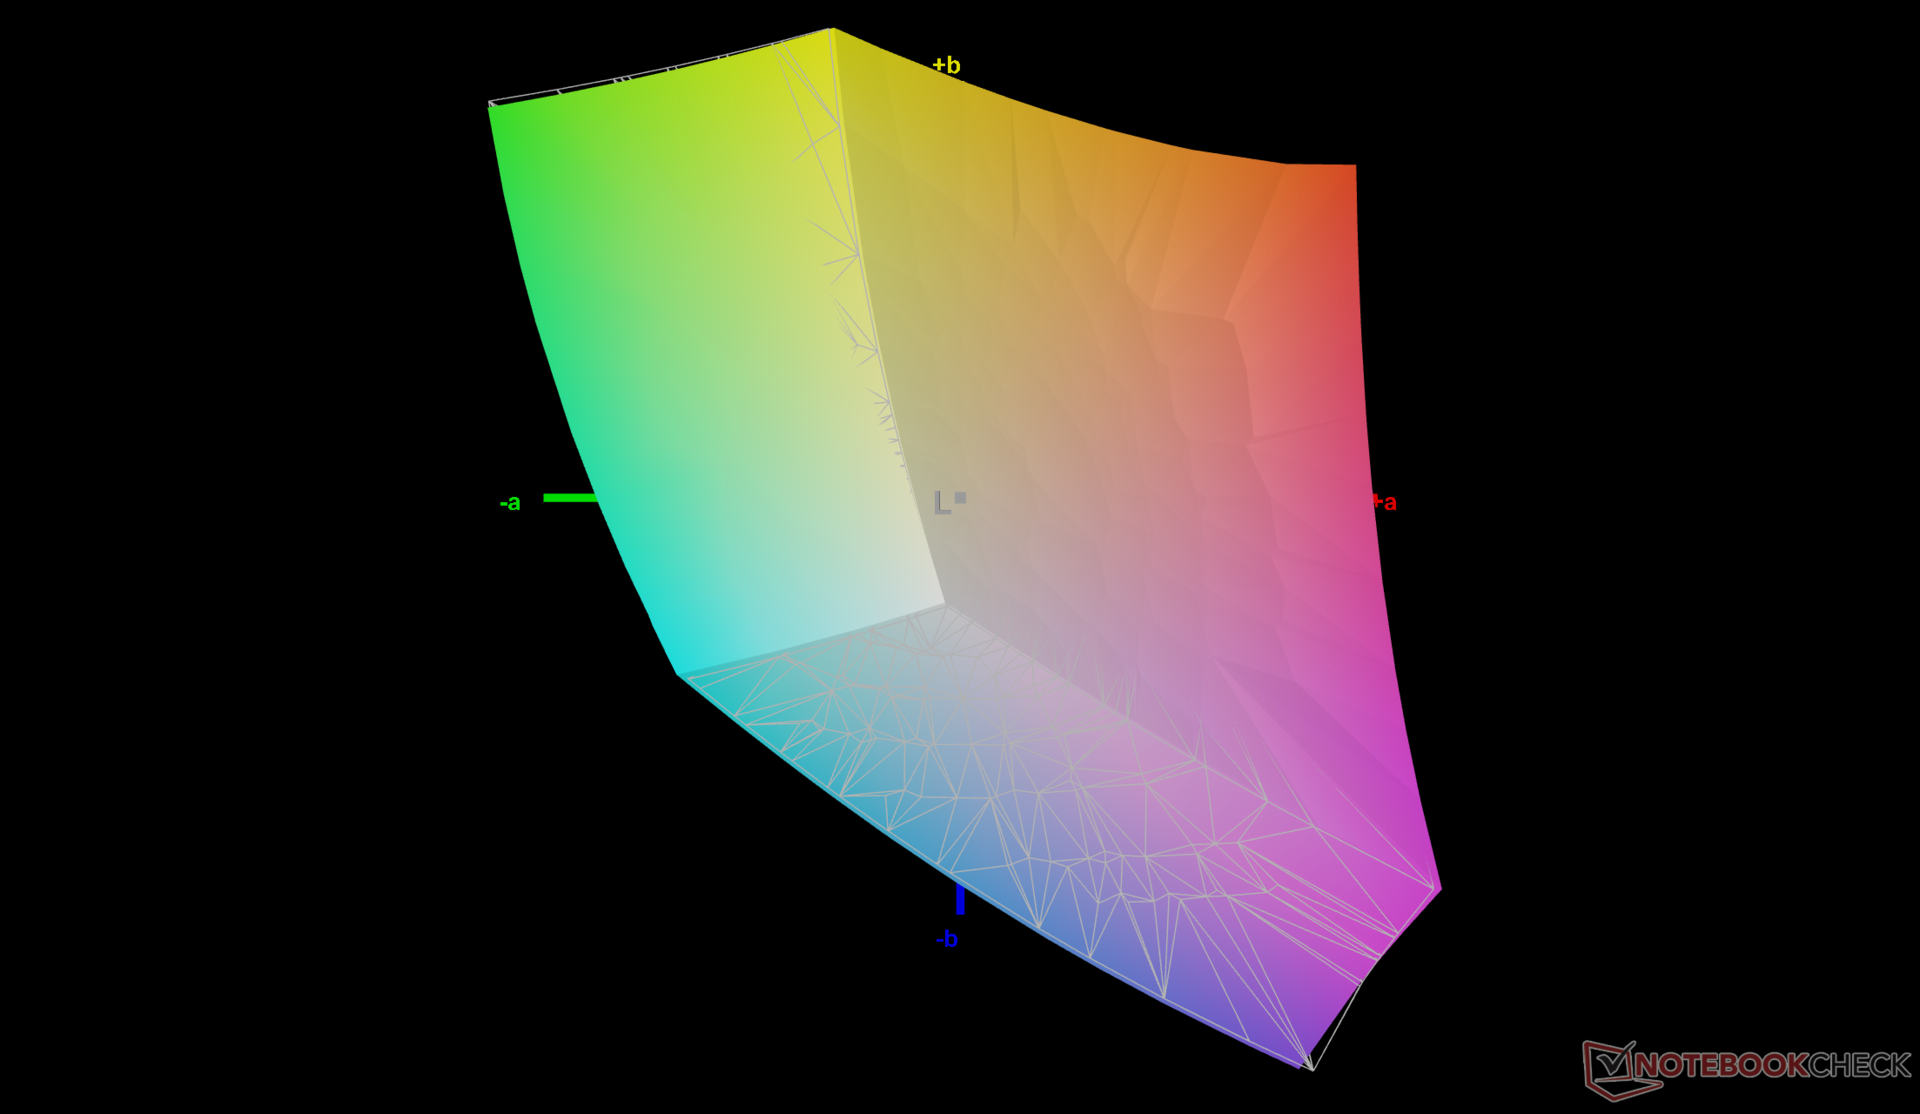
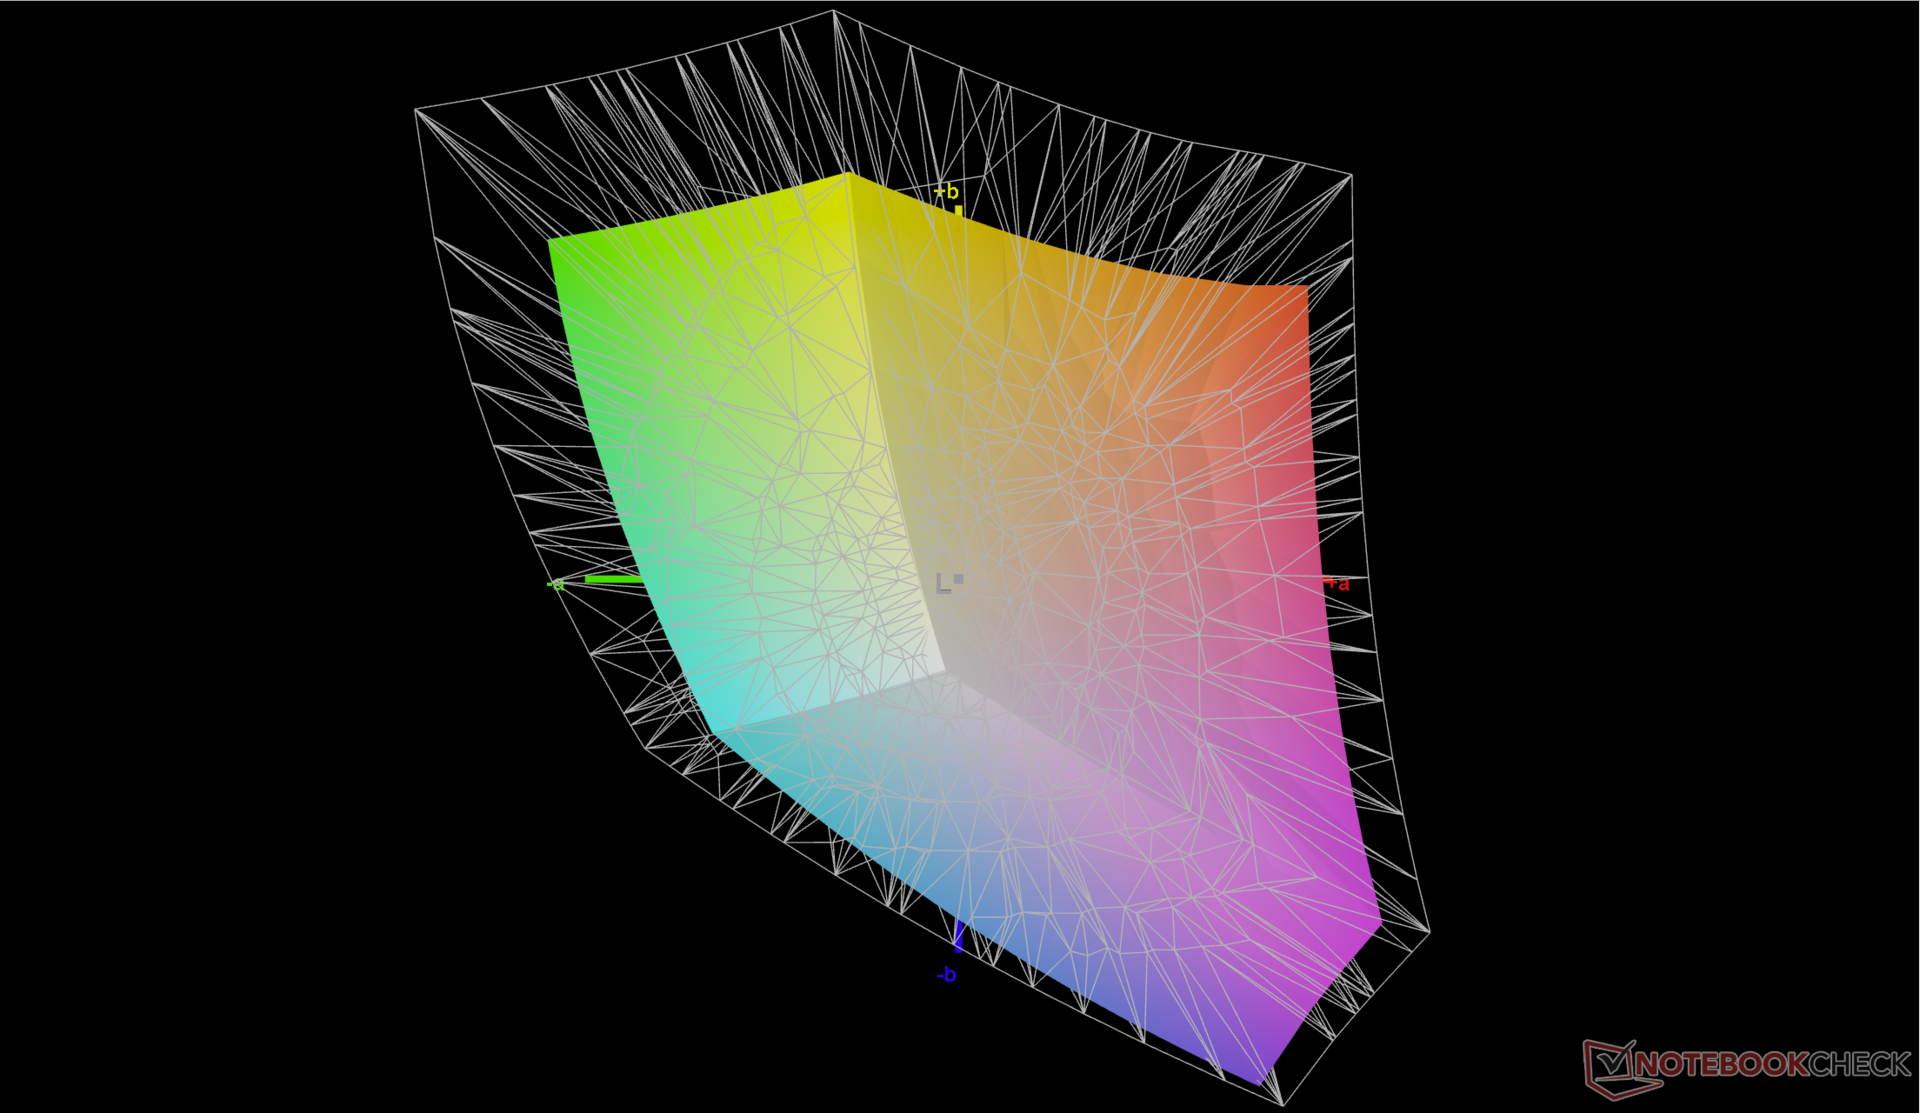
Mientras que otros portátiles de 14 pulgadas suelen apuntar a resoluciones nativas de 1200p, 1800p o 2160p, el Inspiron 14 Plus 7420 viene de serie con un panel relativamente poco común de 2,2K o 2240 x 1400. Los atributos principales son, por lo demás, sólidos, incluyendo la cobertura sRGB completa, la relación de contraste de ~1000:1 y los tiempos de respuesta decentes para su clase de tamaño. Es una pena que las opciones OLED o brillante no estén disponibles para aumentar los colores o la nitidez aún más.
| |||||||||||||||||||||||||
iluminación: 85 %
Brillo con batería: 331.1 cd/m²
Contraste: 1142:1 (Negro: 0.29 cd/m²)
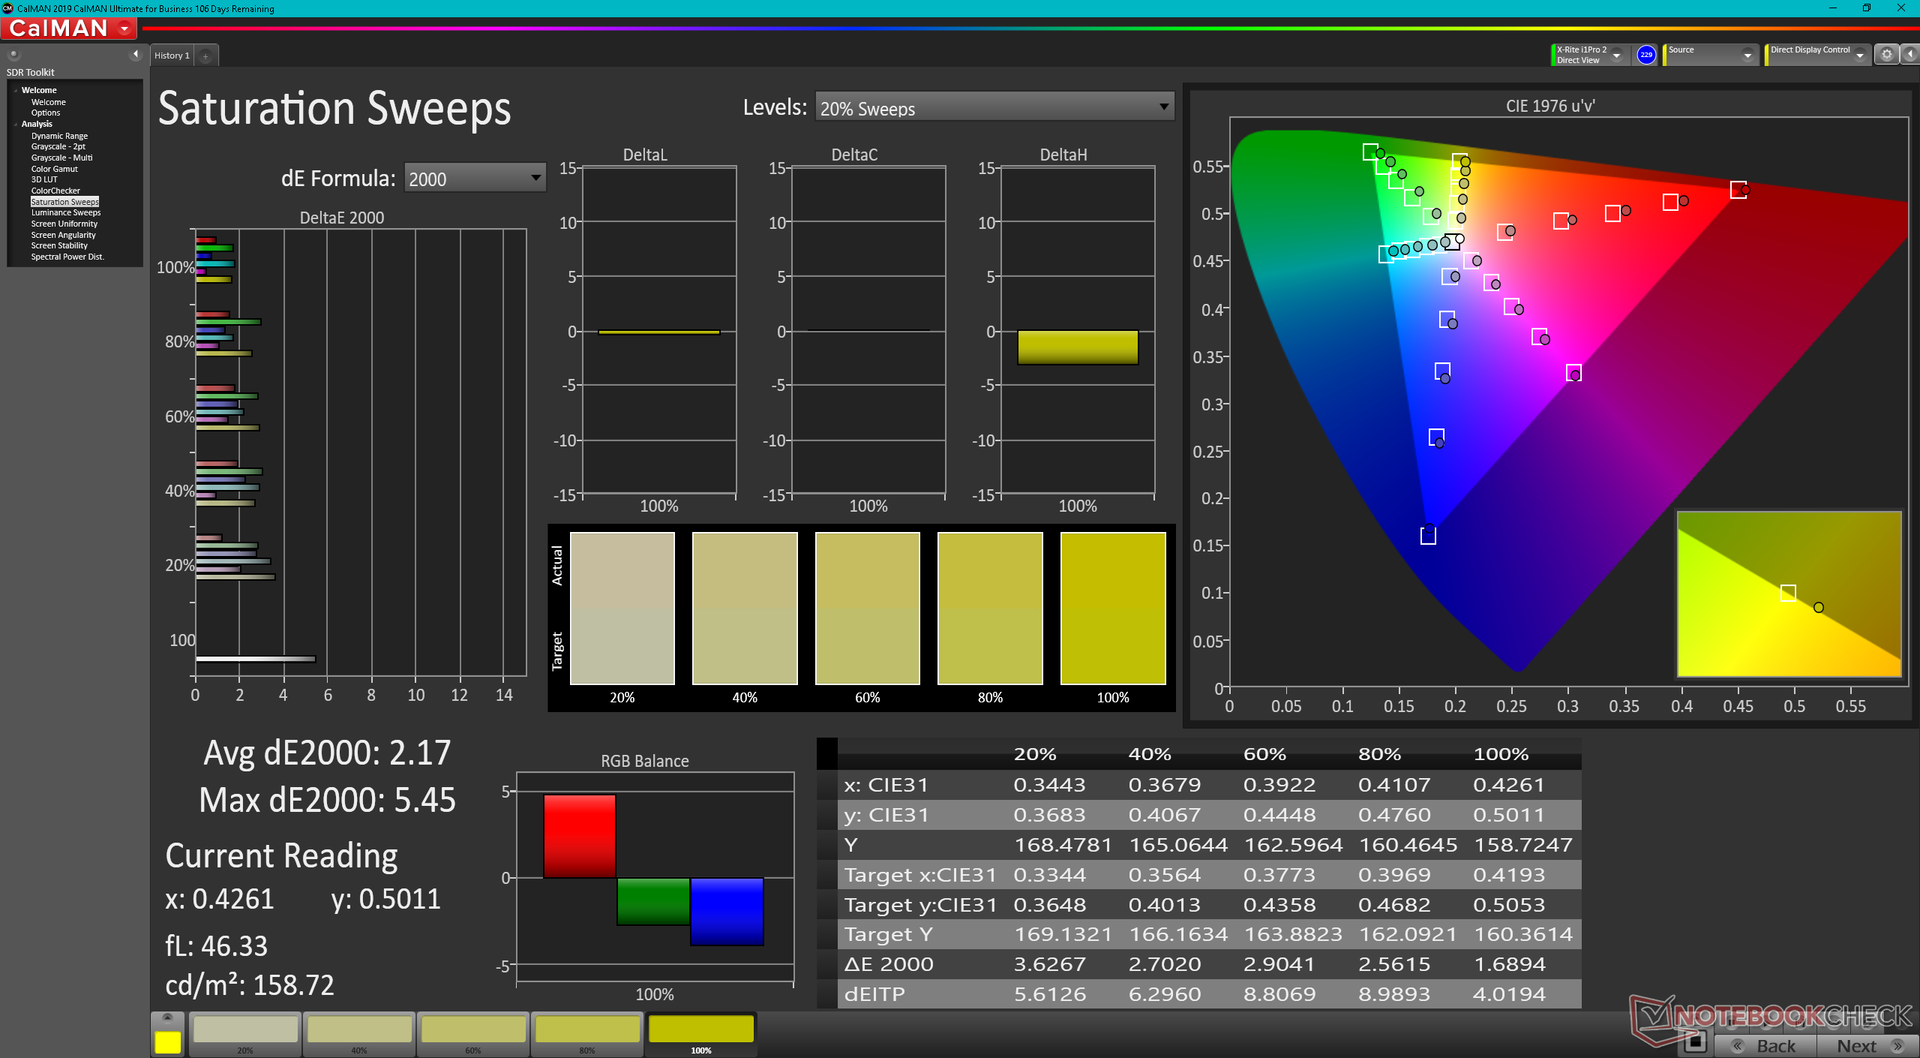
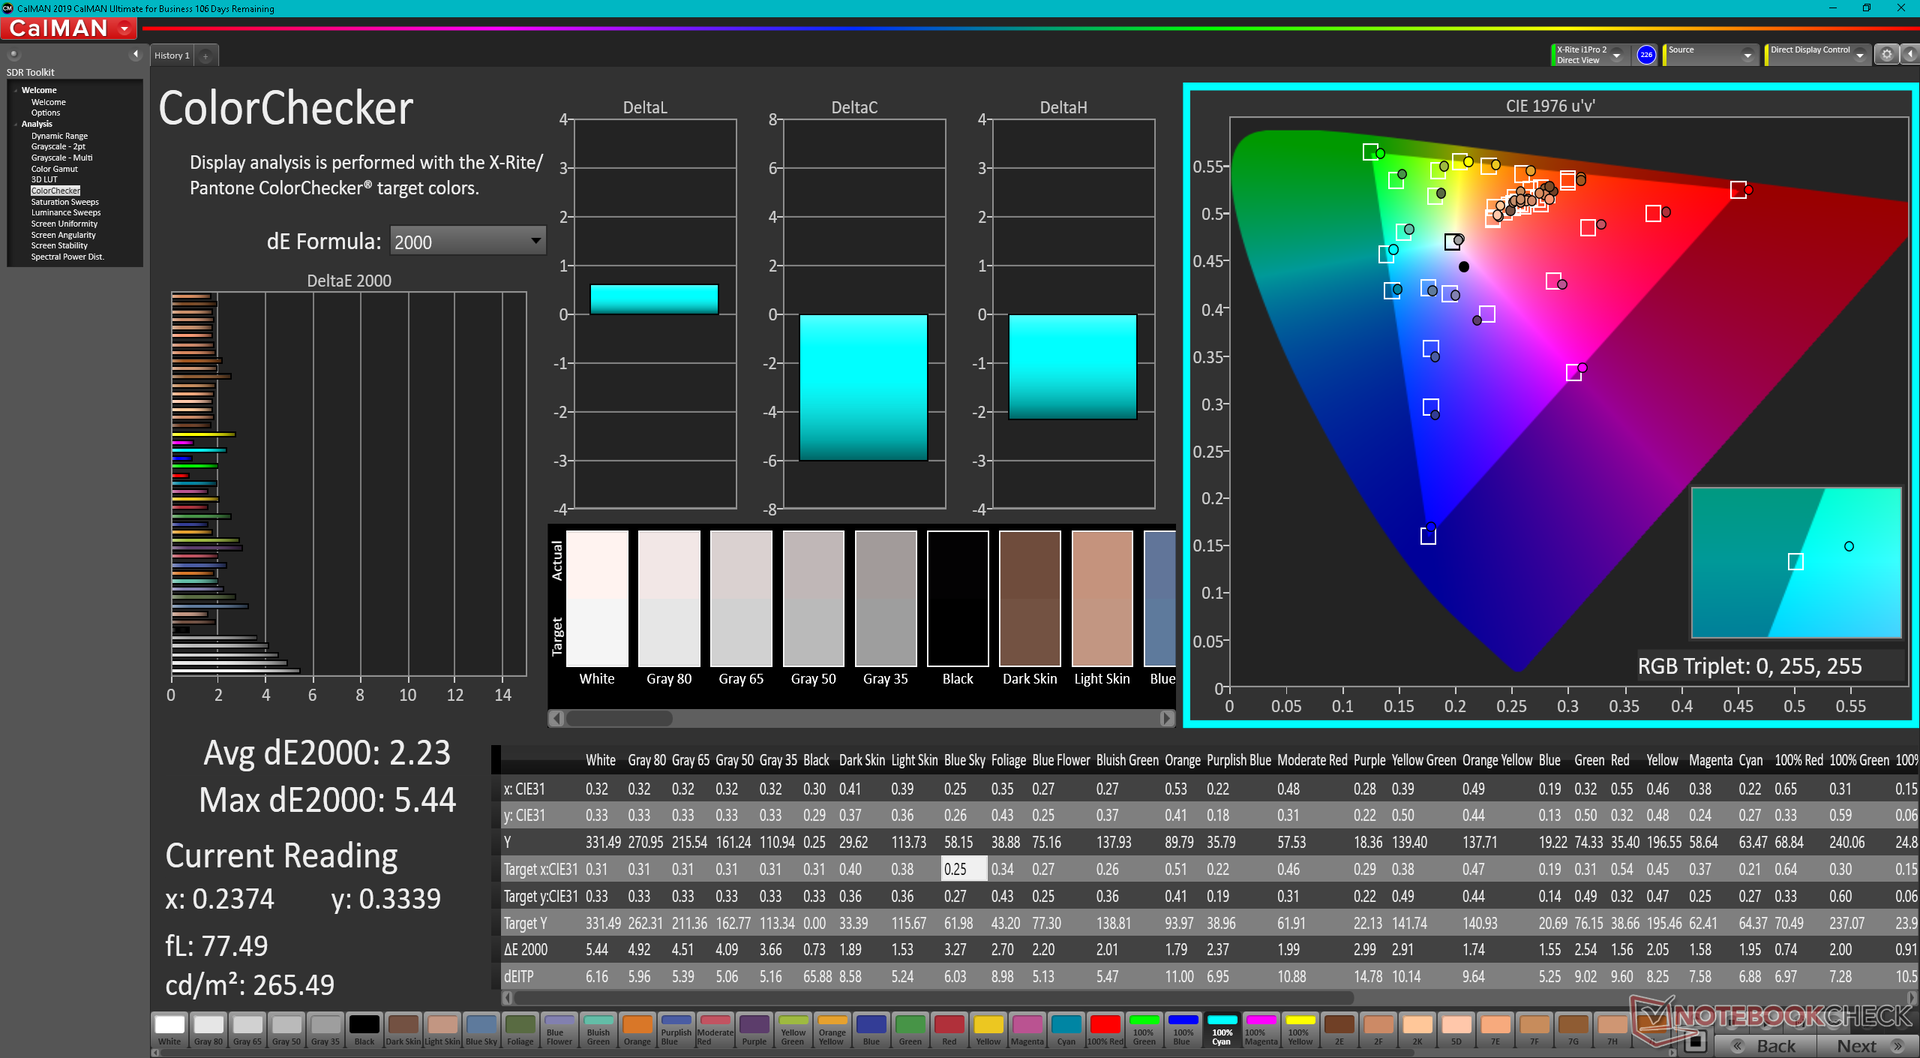
ΔE ColorChecker Calman: 2.23 | ∀{0.5-29.43 Ø4.71}
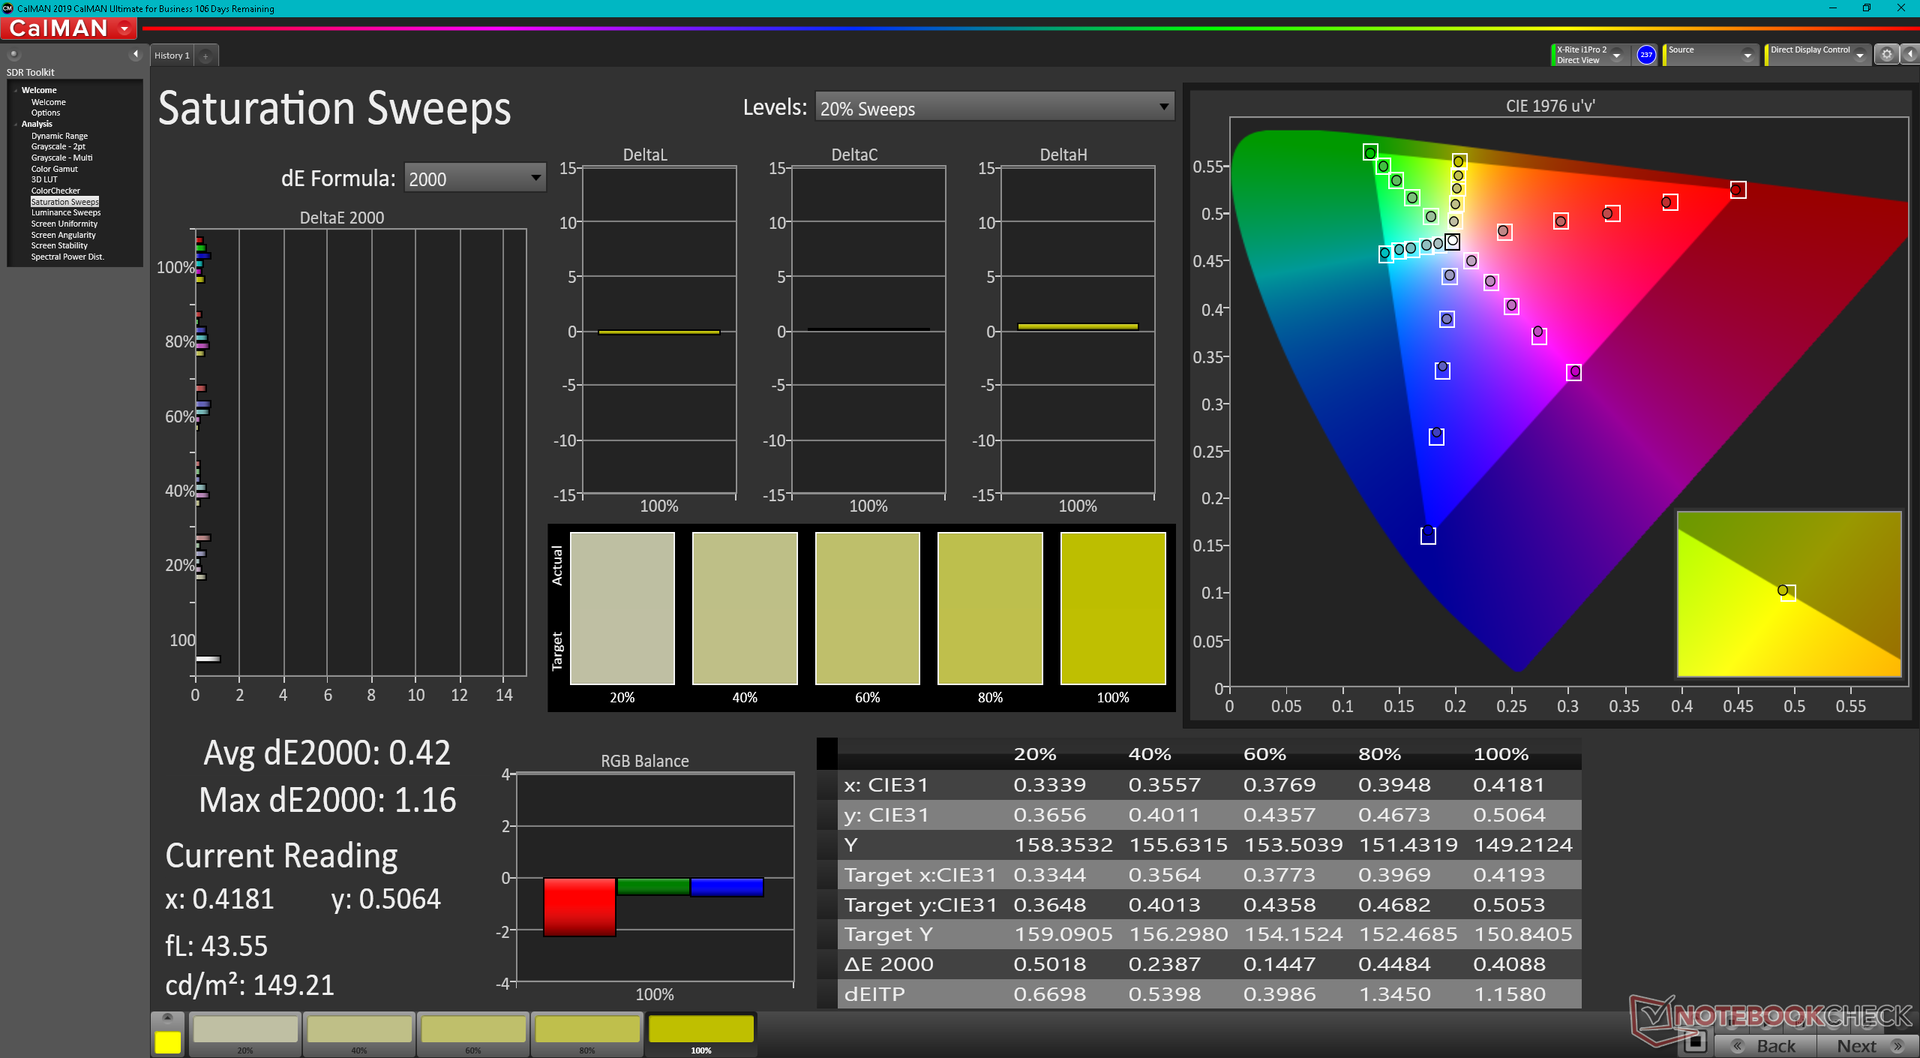
calibrated: 0.63
ΔE Greyscale Calman: 3.6 | ∀{0.09-98 Ø4.96}
69.5% AdobeRGB 1998 (Argyll 3D)
99.3% sRGB (Argyll 3D)
68.8% Display P3 (Argyll 3D)
Gamma: 2.21
CCT: 6022 K
| Dell Inspiron 14 Plus 7420 InfoVision 140NWHE, IPS, 2240x1400, 14" | Asus Vivobook Pro 14 M3401QC-KM007T SAMSUNG: SDC4171, OLED, 2880x1800, 14" | Dell Inspiron 14 7420 2-in-1 BOE NV14N42, IPS, 1920x1200, 14" | Schenker Vision 14 MNE007ZA1, IPS, 2880x1800, 14" | Asus Zenbook 14X UX5400E Samsung SDC4154, OLED, 2880x1800, 14" | MSI Summit E14 A11SCS AU Optronics AUO123B, IPS, 3840x2160, 14" | HP Envy 14-eb0010nr AU Optronics AUOF392, IPS, 1920x1200, 14" | |
|---|---|---|---|---|---|---|---|
| Display | 27% | -43% | 5% | 28% | 24% | 8% | |
| Display P3 Coverage (%) | 68.8 | 99.41 44% | 38.6 -44% | 74.3 8% | 100 45% | 87.5 27% | 77.1 12% |
| sRGB Coverage (%) | 99.3 | 99.94 1% | 56.2 -43% | 97.6 -2% | 100 1% | 100 1% | 99.8 1% |
| AdobeRGB 1998 Coverage (%) | 69.5 | 94.79 36% | 39.9 -43% | 75.7 9% | 96 38% | 99.4 43% | 76.7 10% |
| Response Times | 89% | 13% | -2% | 93% | -47% | -95% | |
| Response Time Grey 50% / Grey 80% * (ms) | 32.8 ? | 3 ? 91% | 27.2 ? 17% | 40.4 ? -23% | 2 ? 94% | 52 ? -59% | 61.2 ? -87% |
| Response Time Black / White * (ms) | 22.8 ? | 3 ? 87% | 20.8 ? 9% | 18.4 ? 19% | 2 ? 91% | 30.8 ? -35% | 46 ? -102% |
| PWM Frequency (Hz) | 360 | ||||||
| Screen | 41% | -113% | -8% | 13% | -70% | -8% | |
| Brightness middle (cd/m²) | 331.1 | 384 16% | 269.4 -19% | 407 23% | 379 14% | 593.3 79% | 412 24% |
| Brightness (cd/m²) | 326 | 385 18% | 260 -20% | 407 25% | 381 17% | 571 75% | 392 20% |
| Brightness Distribution (%) | 85 | 98 15% | 89 5% | 94 11% | 93 9% | 87 2% | 81 -5% |
| Black Level * (cd/m²) | 0.29 | 0.07 76% | 0.41 -41% | 0.25 14% | 0.1 66% | 0.53 -83% | 0.32 -10% |
| Contrast (:1) | 1142 | 5486 380% | 657 -42% | 1628 43% | 3790 232% | 1119 -2% | 1288 13% |
| Colorchecker dE 2000 * | 2.23 | 1.75 22% | 6.53 -193% | 2.6 -17% | 2.3 -3% | 4.42 -98% | 1.88 16% |
| Colorchecker dE 2000 max. * | 5.44 | 3.41 37% | 19.76 -263% | 4.4 19% | 4.16 24% | 7.16 -32% | 3.06 44% |
| Colorchecker dE 2000 calibrated * | 0.63 | 2.32 -268% | 3.13 -397% | 2 -217% | 2.42 -284% | 4.3 -583% | 1.96 -211% |
| Greyscale dE 2000 * | 3.6 | 1.06 71% | 5.4 -50% | 2.7 25% | 2.12 41% | 3.2 11% | 2.2 39% |
| Gamma | 2.21 100% | 2.39 92% | 2.05 107% | 2.18 101% | 2.42 91% | 2.04 108% | 2.1 105% |
| CCT | 6022 108% | 6440 101% | 6007 108% | 6316 103% | 6737 96% | 6650 98% | |
| Color Space (Percent of AdobeRGB 1998) (%) | 68.7 | ||||||
| Color Space (Percent of sRGB) (%) | 99.8 | ||||||
| Media total (Programa/Opciones) | 52% /
45% | -48% /
-80% | -2% /
-5% | 45% /
28% | -31% /
-47% | -32% /
-17% |
* ... más pequeño es mejor
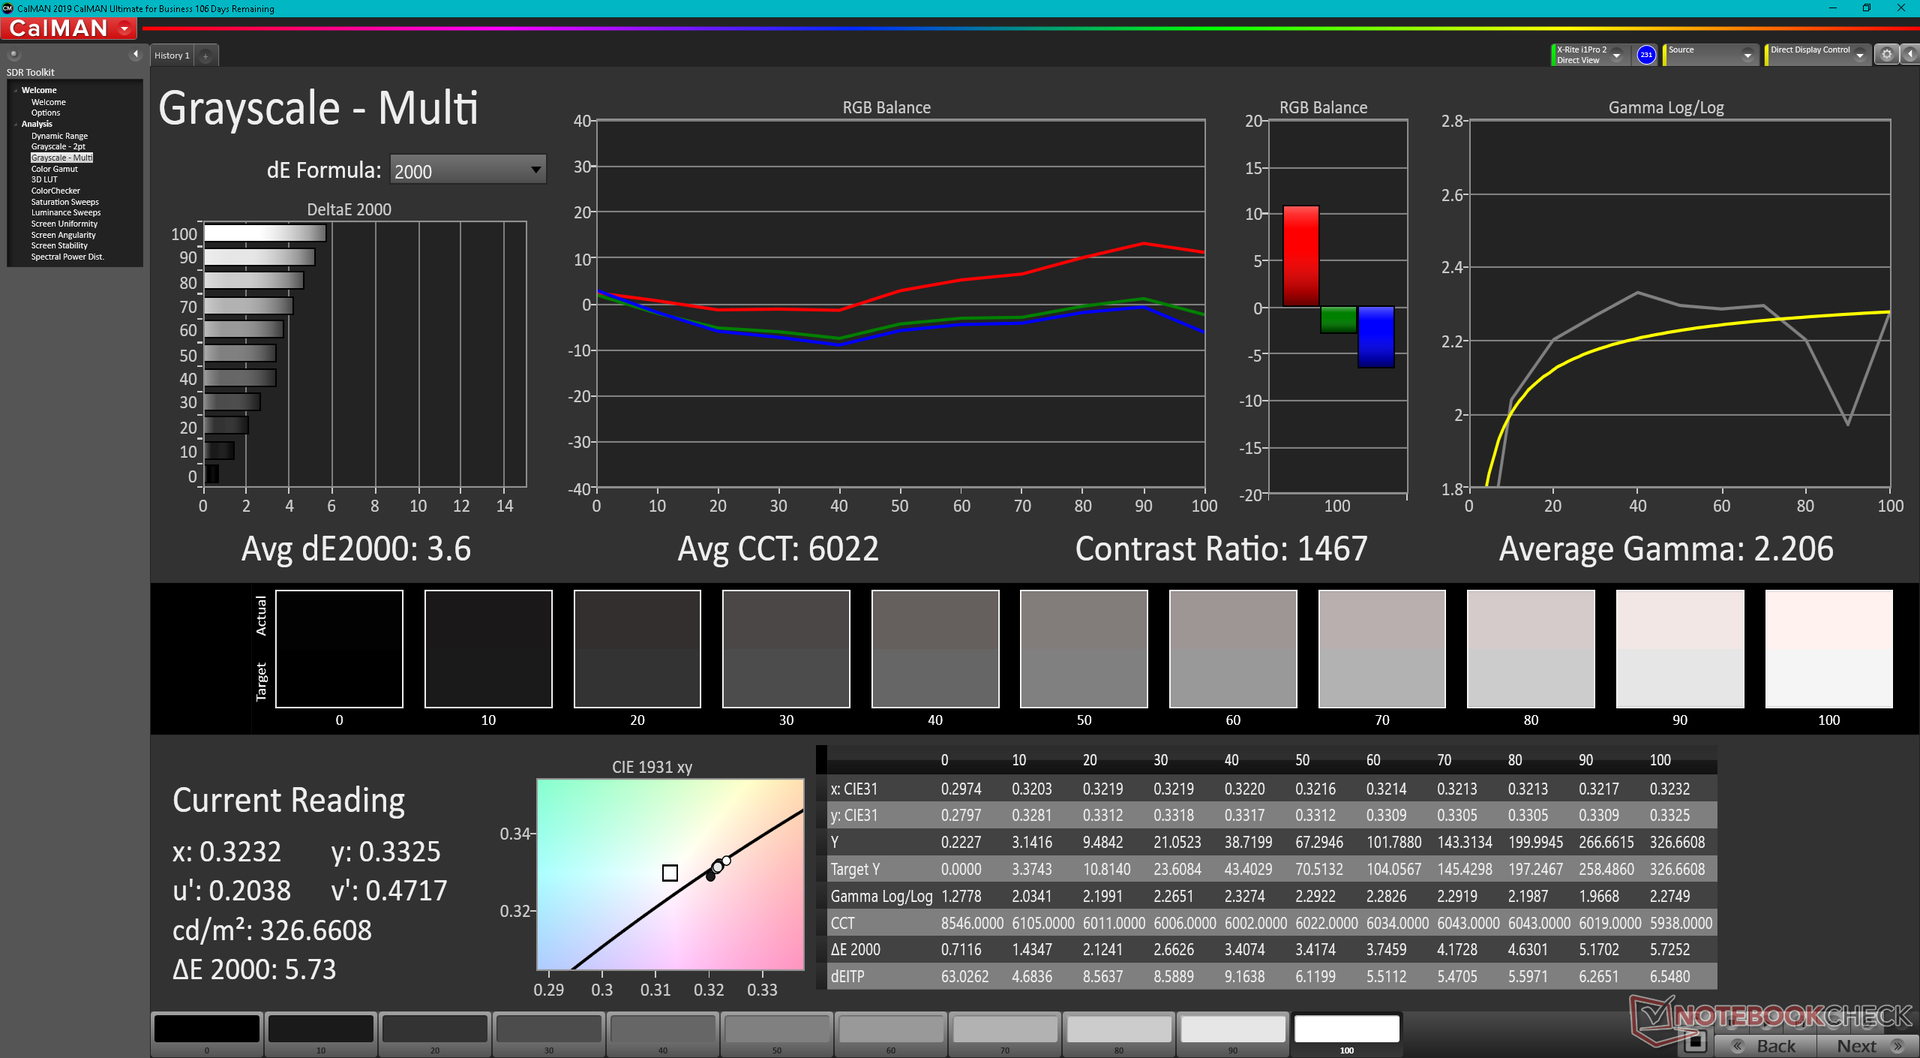
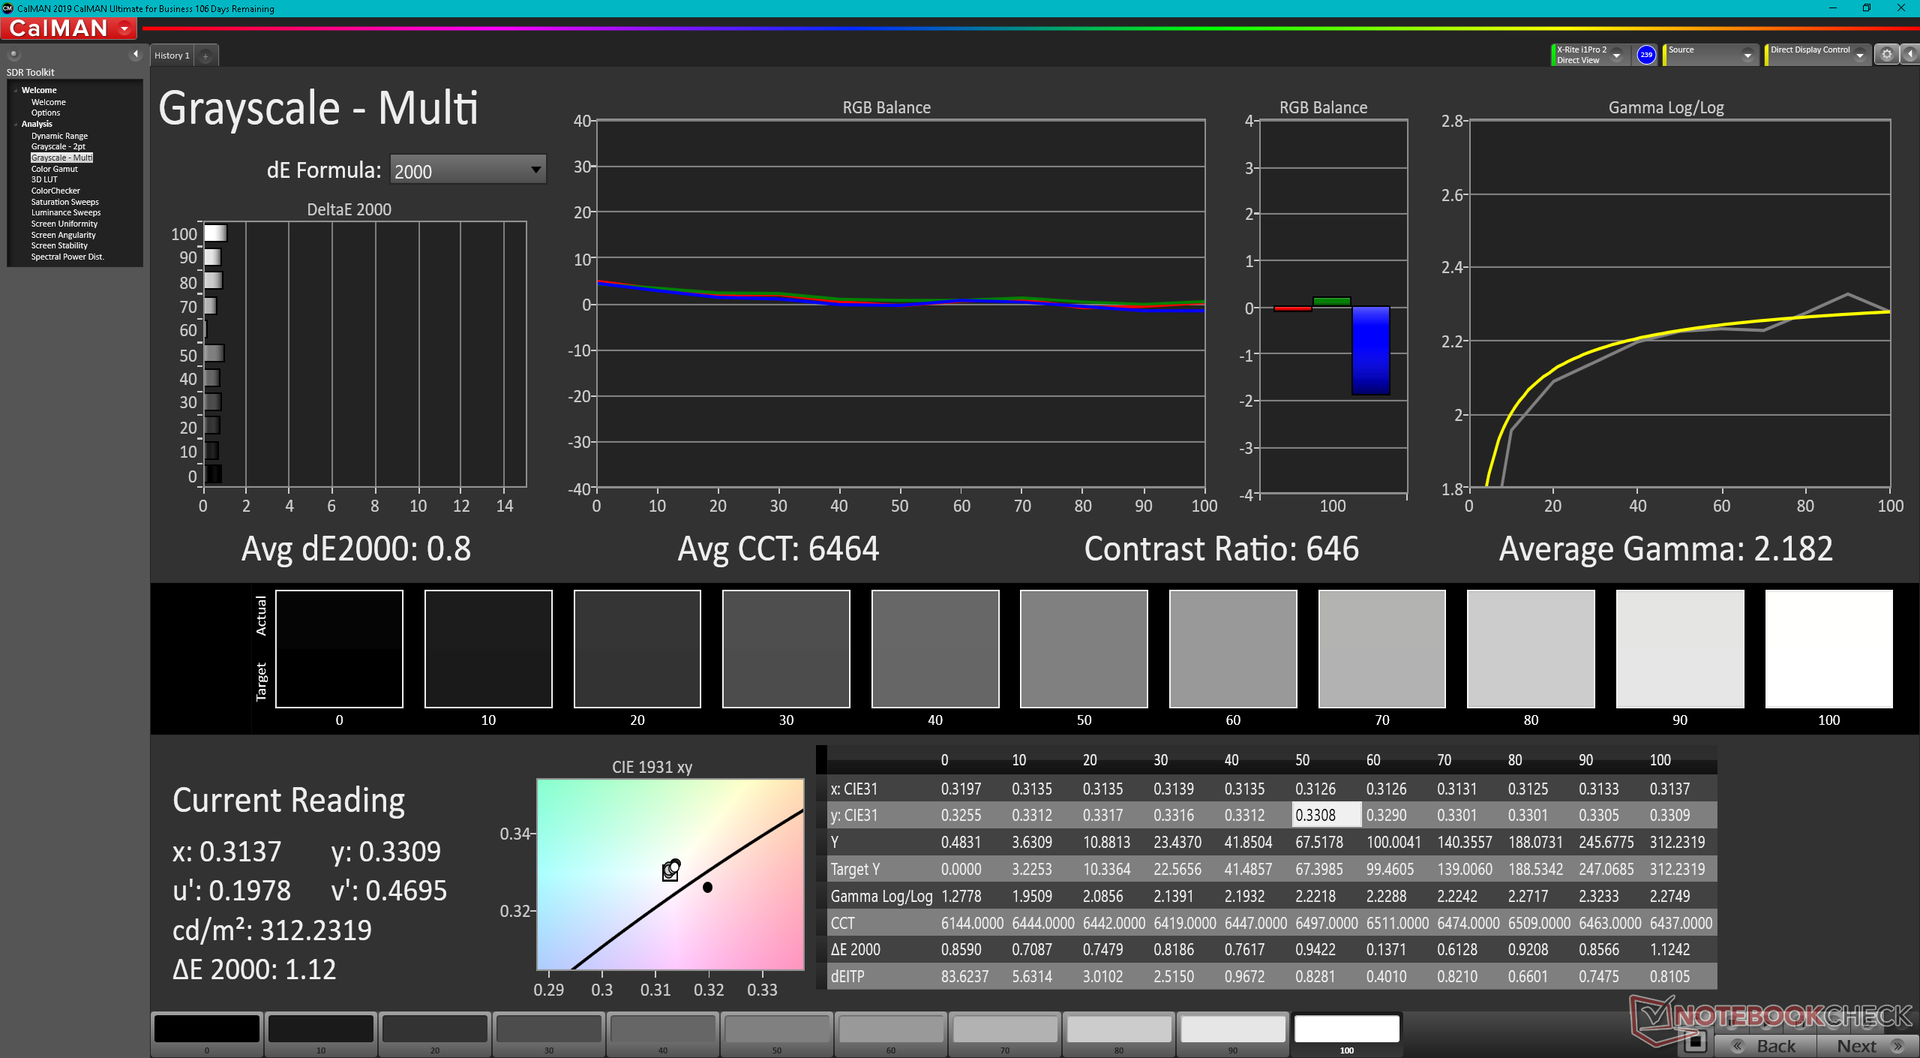
La pantalla no está calibrada de fábrica, por lo que sus colores no son todo lo precisos que podrían ser. La temperatura del color, en particular, es demasiado cálida, en torno a 6000, en comparación con el objetivo de 6500 del estándar sRGB. Tras una calibración adecuada con nuestro colorímetro X-Rite, los valores medios de escala de grises y color DeltaE mejorarían de 3,6 y 2,23 a sólo 0,8 y 0,63, respectivamente. Recomendamos una calibración por parte del usuario final para aprovechar al máximo la cobertura sRGB del 100% del panel.
Tiempos de respuesta del display
| ↔ Tiempo de respuesta de Negro a Blanco | ||
|---|---|---|
| 22.8 ms ... subida ↗ y bajada ↘ combinada | ↗ 12 ms subida | 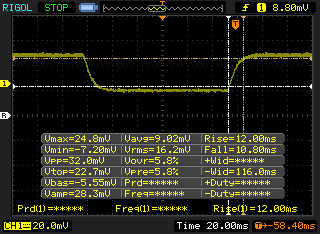 |
| ↘ 10.8 ms bajada | ||
| La pantalla mostró buenos tiempos de respuesta en nuestros tests pero podría ser demasiado lenta para los jugones competitivos. En comparación, todos los dispositivos de prueba van de ##min### (mínimo) a 240 (máximo) ms. » 51 % de todos los dispositivos son mejores. Eso quiere decir que el tiempo de respuesta es peor que la media (19.8 ms) de todos los dispositivos testados. | ||
| ↔ Tiempo de respuesta 50% Gris a 80% Gris | ||
| 32.8 ms ... subida ↗ y bajada ↘ combinada | ↗ 16 ms subida | 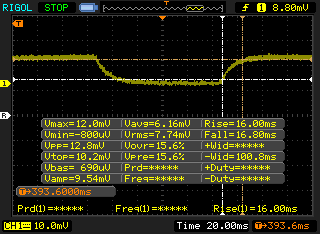 |
| ↘ 16.8 ms bajada | ||
| La pantalla mostró tiempos de respuesta lentos en nuestros tests y podría ser demasiado lenta para los jugones. En comparación, todos los dispositivos de prueba van de ##min### (mínimo) a 636 (máximo) ms. » 45 % de todos los dispositivos son mejores. Eso quiere decir que el tiempo de respuesta es similar al dispositivo testado medio (31 ms). | ||
Parpadeo de Pantalla / PWM (Pulse-Width Modulation)
| Parpadeo de Pantalla / PWM no detectado | 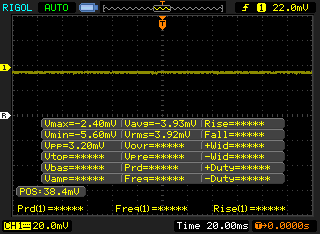 | ||
Comparación: 52 % de todos los dispositivos testados no usaron PWM para atenuar el display. Si se usó, medimos una media de 7757 (mínimo: 5 - máxmo: 343500) Hz. | |||
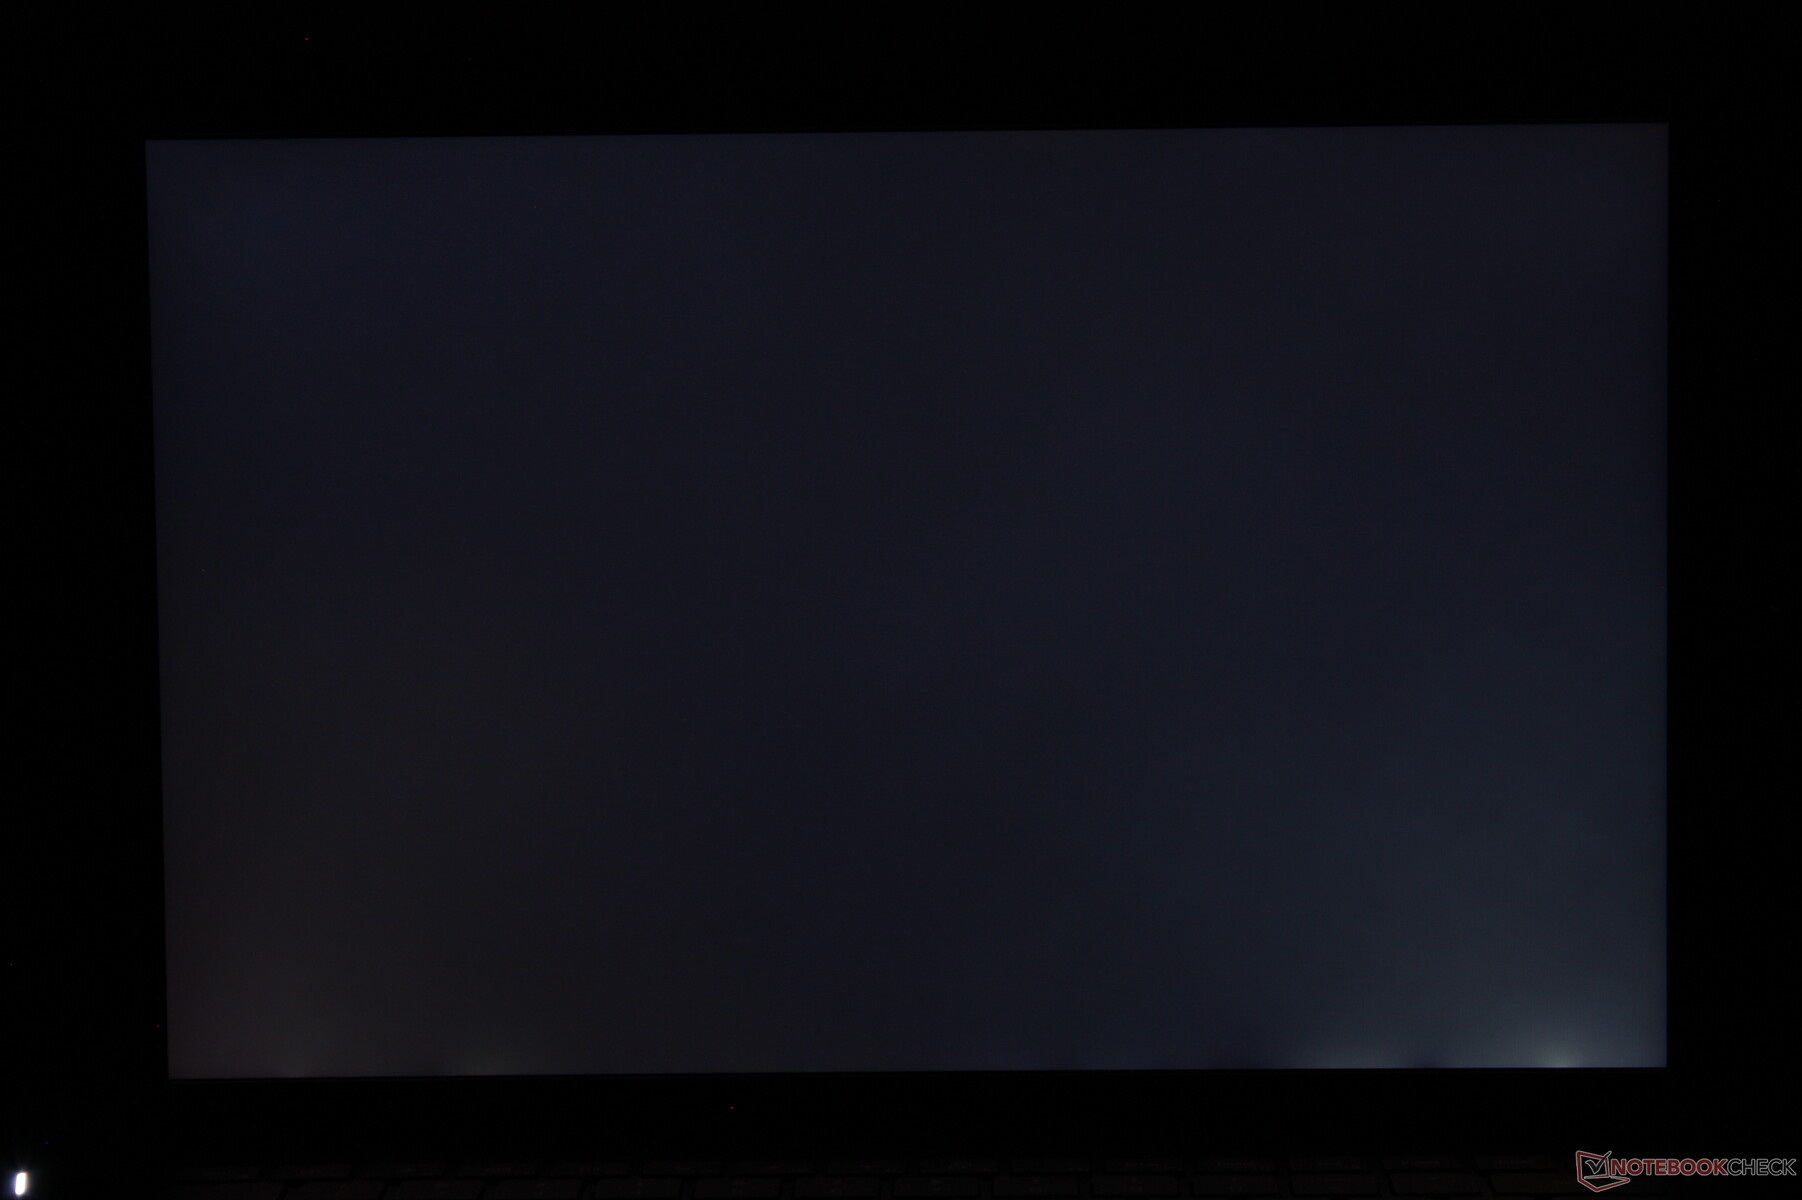
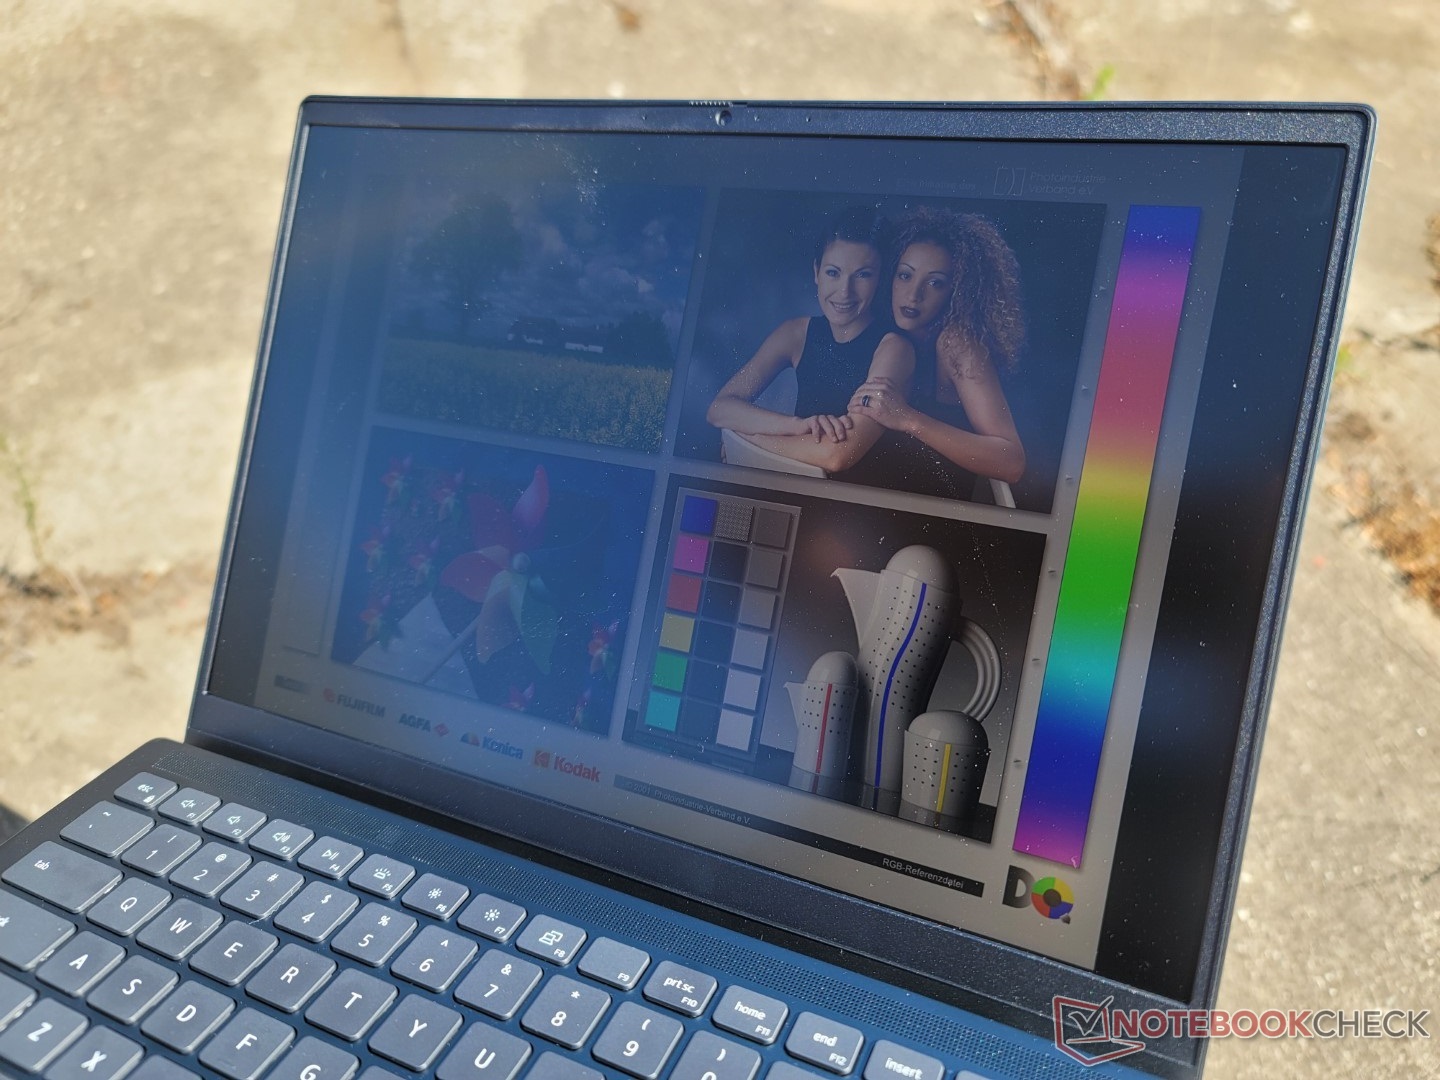
La visibilidad en exteriores es decepcionante, ya que la pantalla tiene una media de sólo 300 nits en su configuración máxima. Es conveniente trabajar a la sombra siempre que sea posible en exteriores, ya que la pantalla se desvanece bajo la luz ambiental más intensa. ElMSI Summit E14 tiene una pantalla significativamente más brillante y ofrece opciones de GPU discreta en comparación.
Rendimiento - Supercarga de 14 pulgadas
Condiciones de la prueba
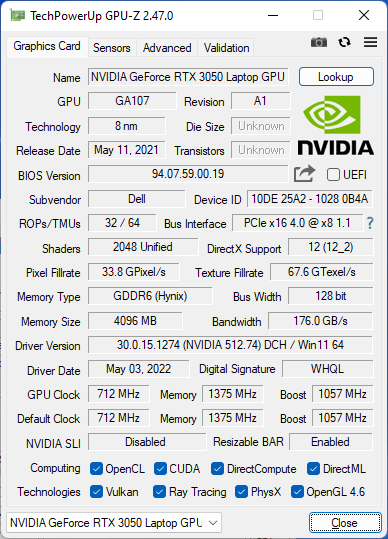
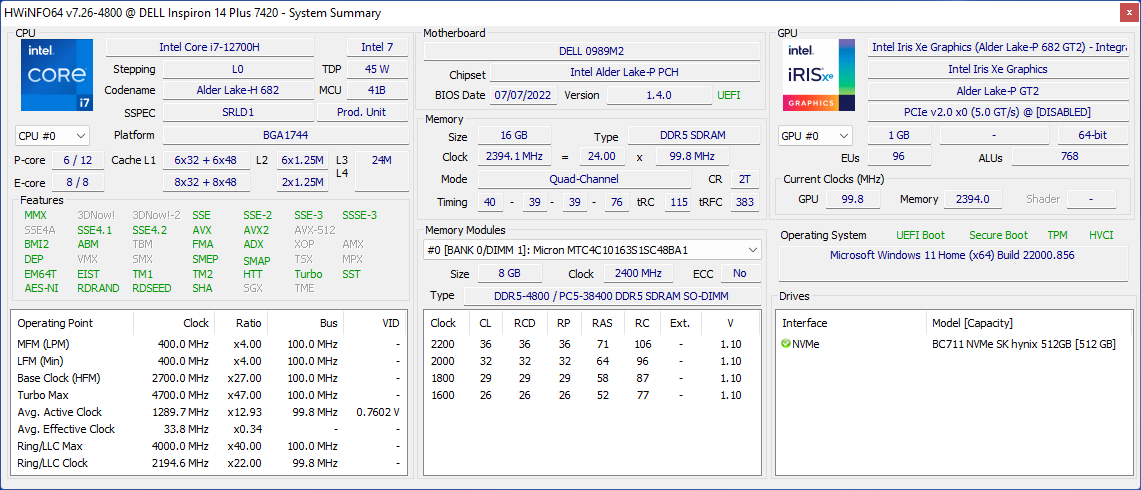
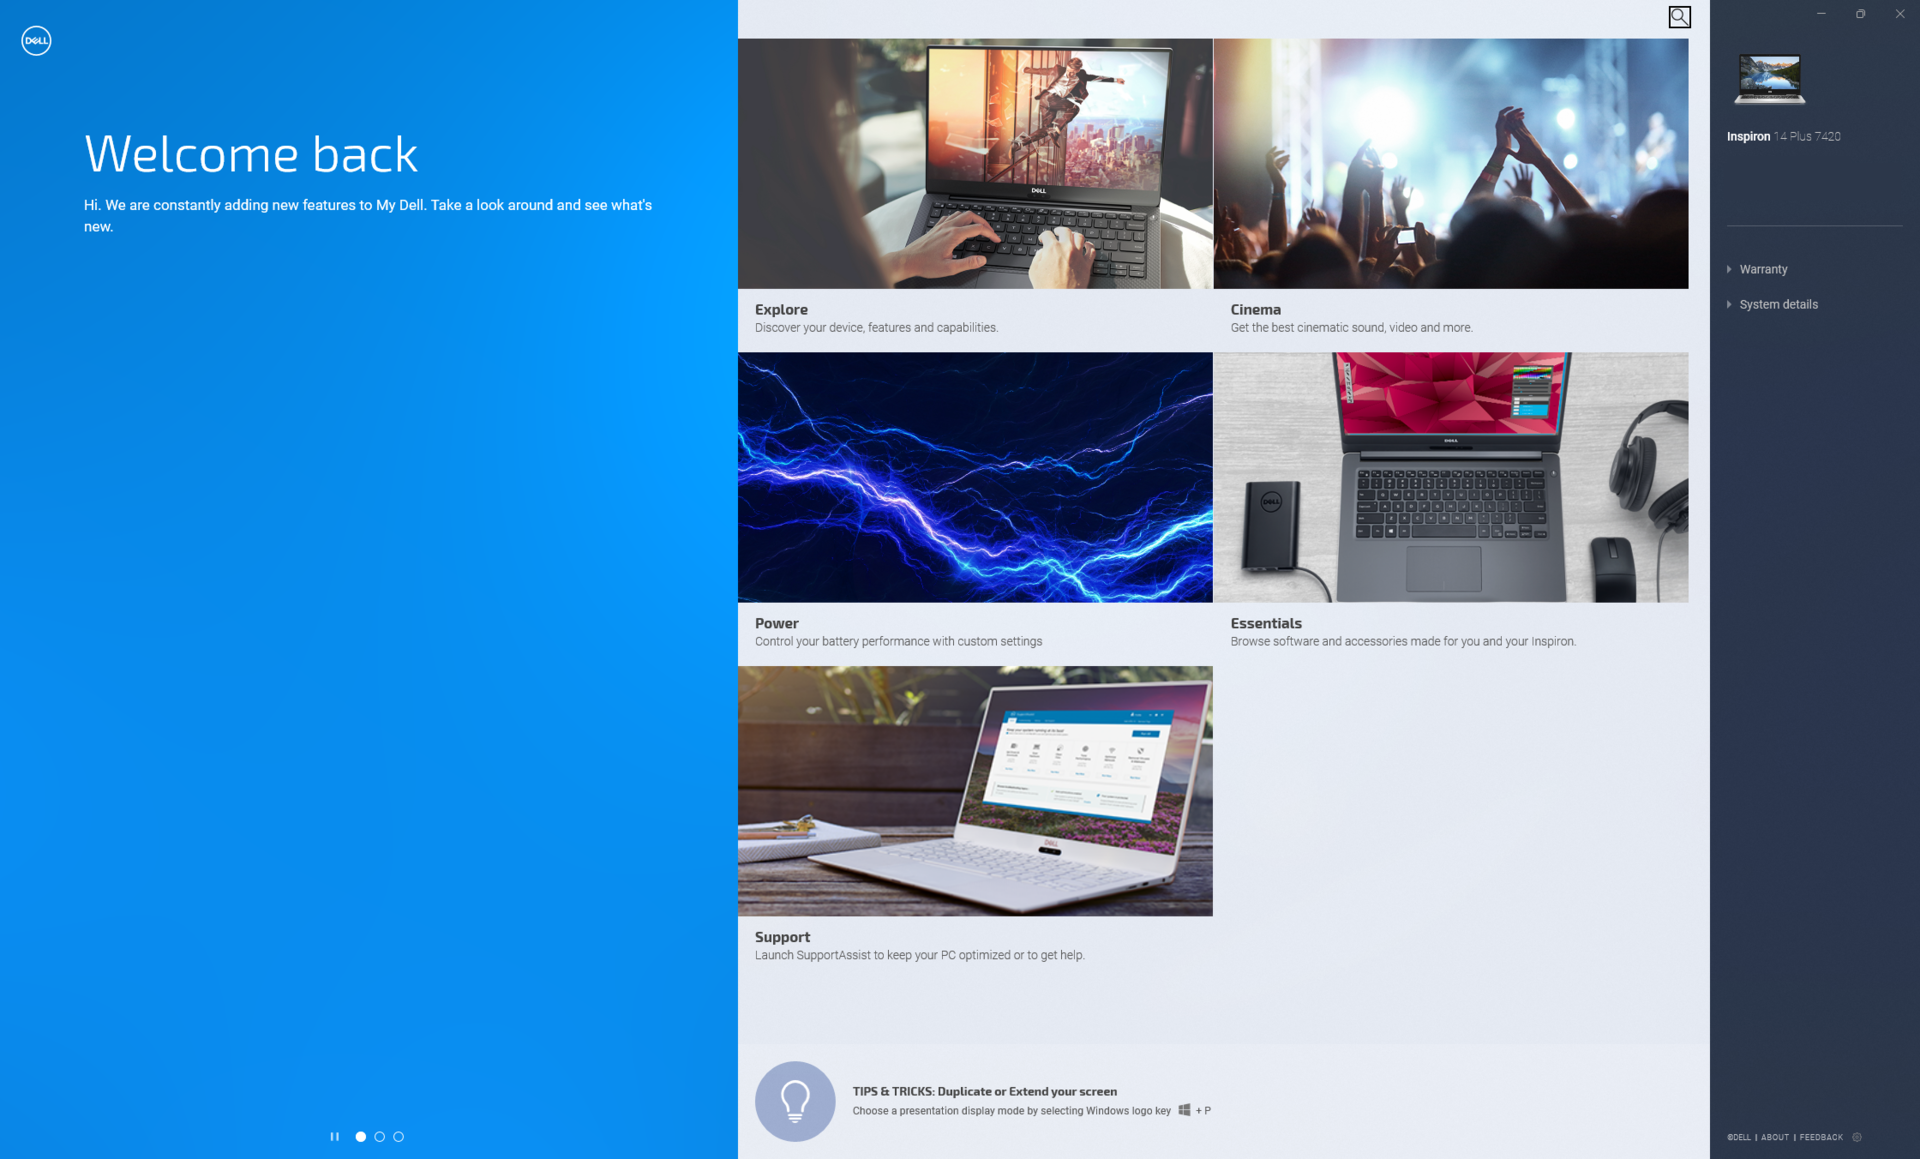
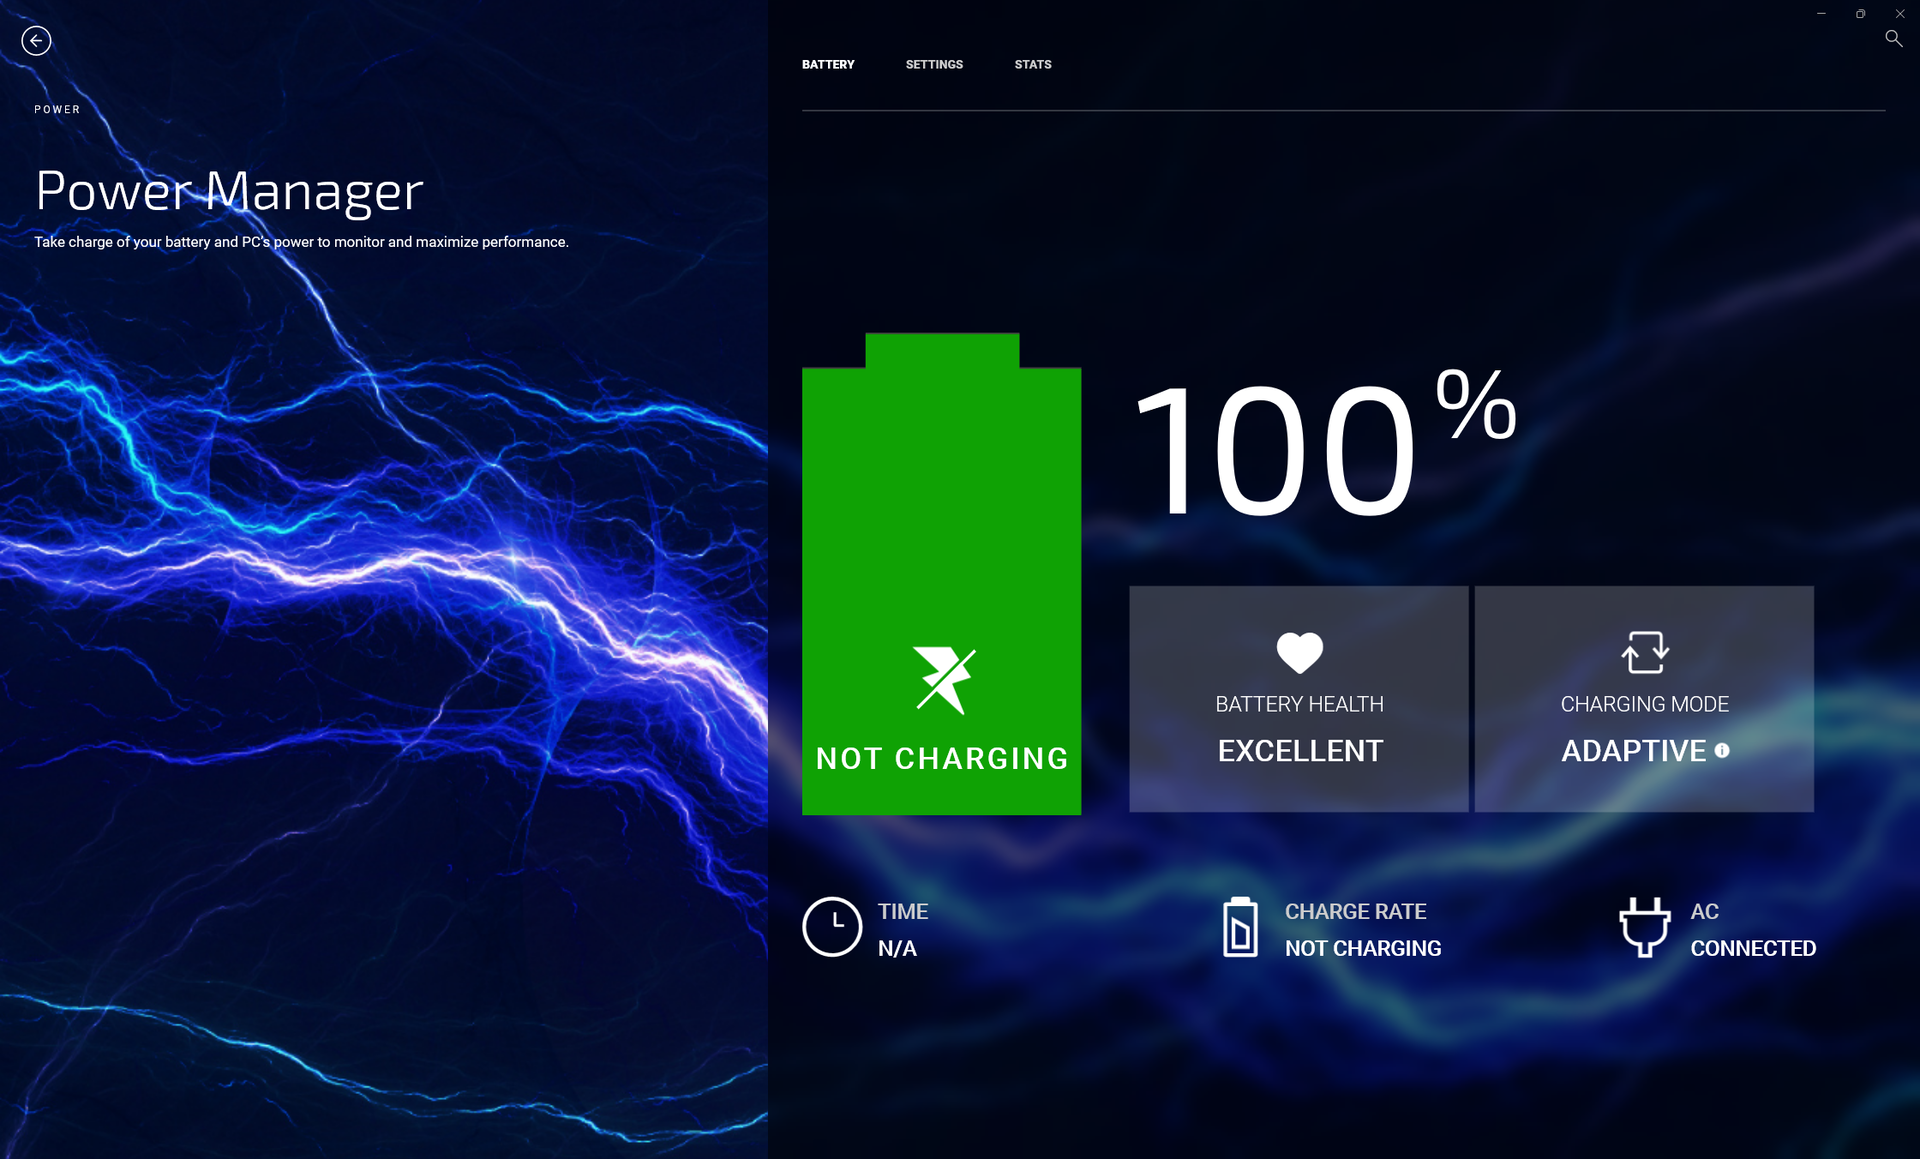
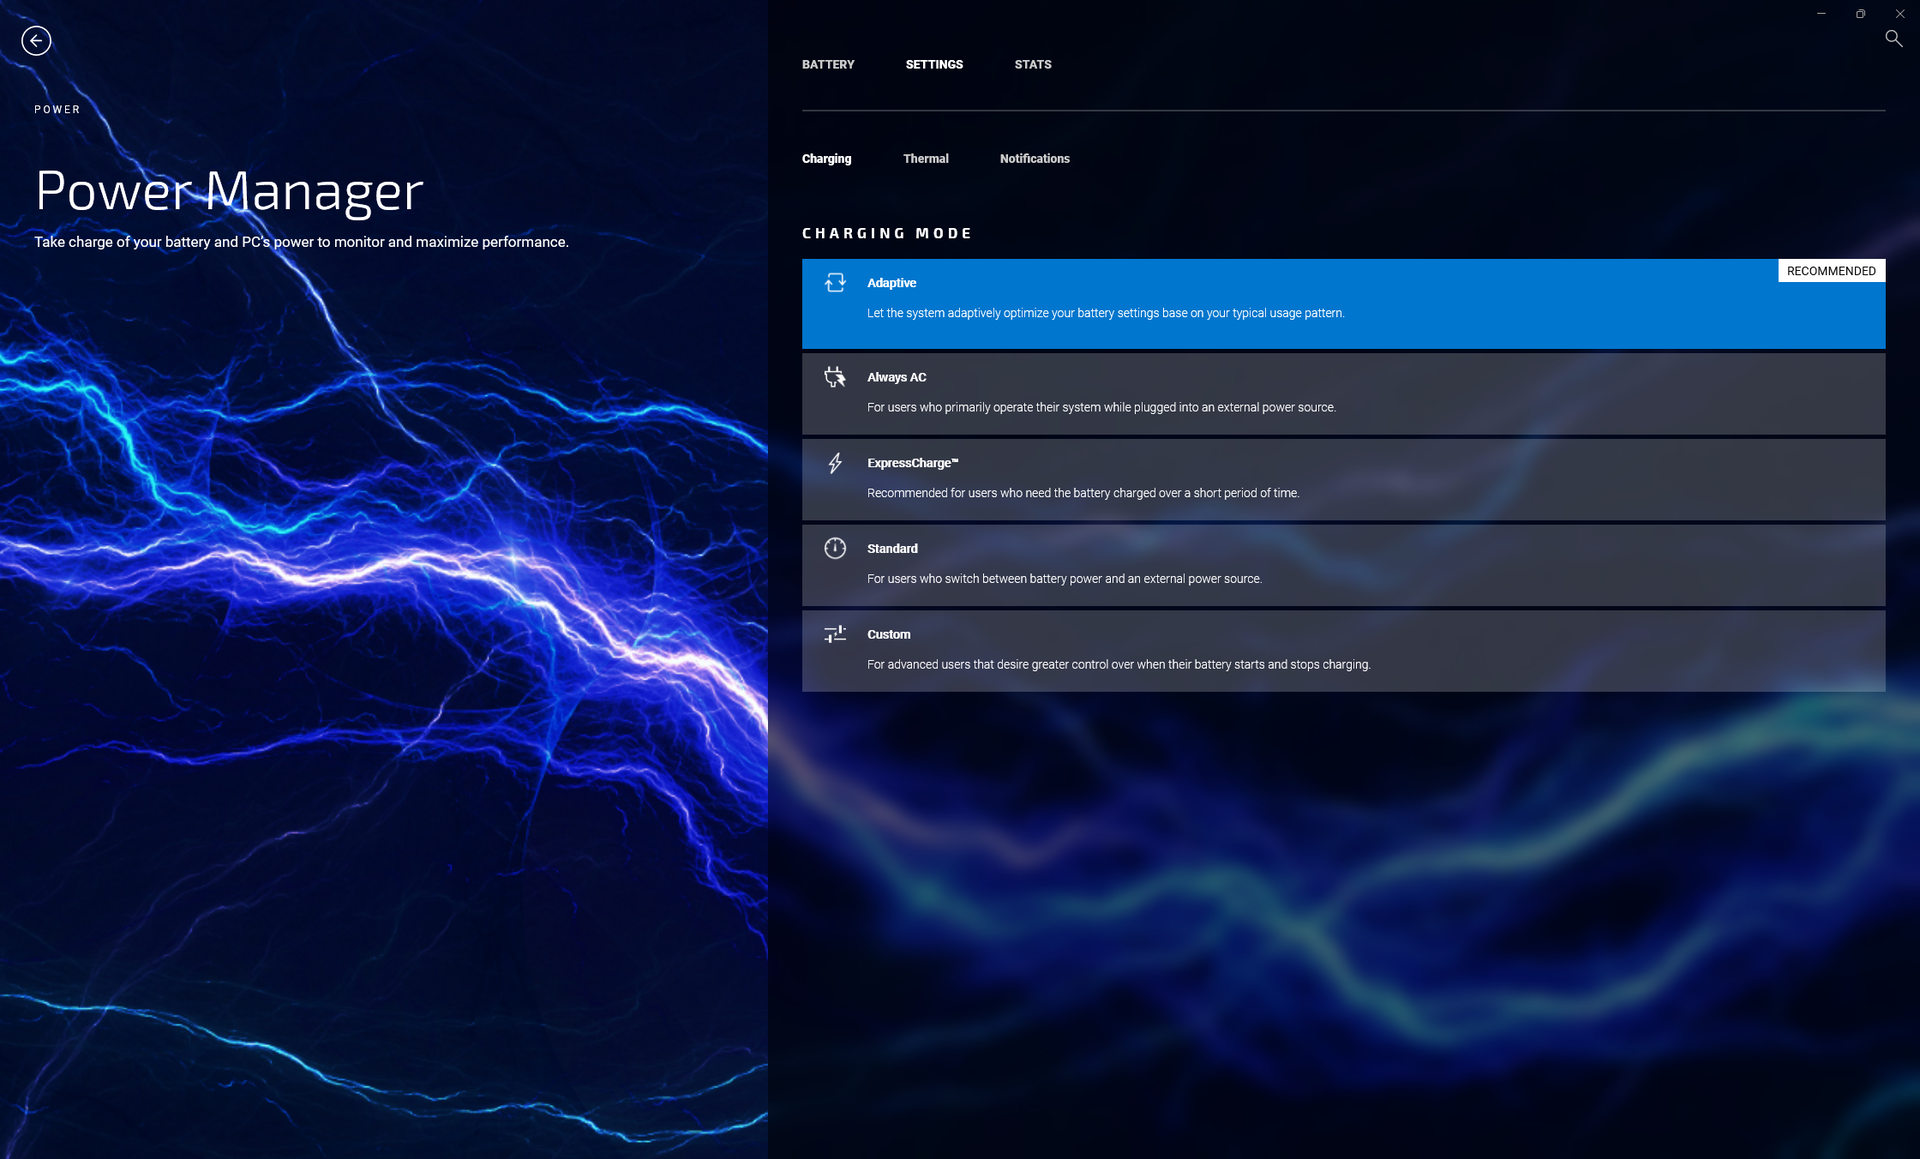
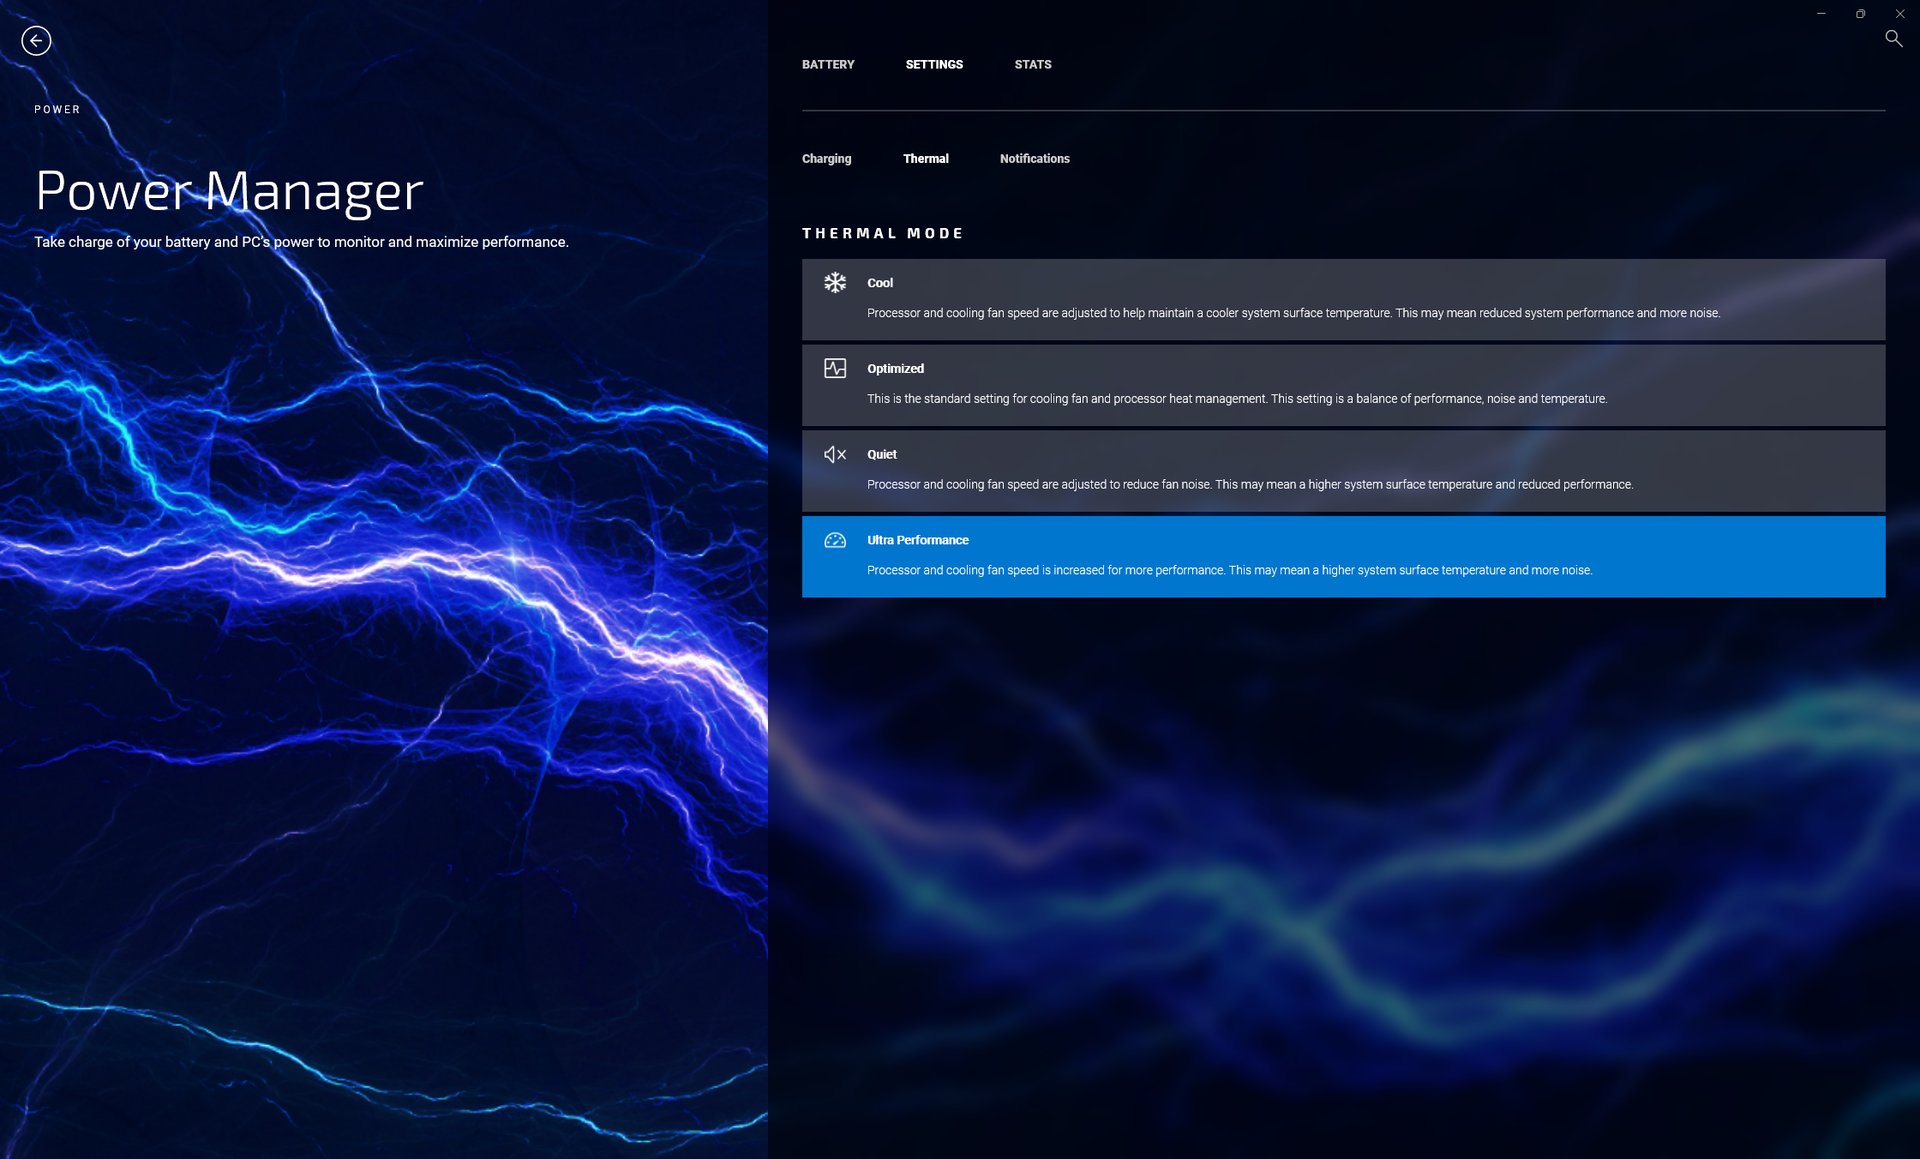
Configuramos nuestra unidad en modo Ultra Performance a través del software My Dell antes de ejecutar cualquier prueba de rendimiento. Se recomienda que los propietarios se familiaricen con My Dell, ya que sirve como portal para el soporte de la garantía, el comportamiento de la carga de la batería, el rendimiento del sistema, y más, como se muestra en las capturas de pantalla a continuación
Optimus estándar permite alternar entre la GPU integrada y la discreta GeForce RTX 3050. Optimus avanzado, MUX y WhisperMode no son compatibles.
Procesador
El rendimiento de la CPU puede analizarse desde la perspectiva del vaso medio lleno o del vaso medio vacío. Desde el punto de vista pesimista, el Core i7-12700H del Dell es algo decepcionante, ya que su rendimiento multihilo es aproximadamente un 10% más lento que el de otros portátiles equipados con el mismo procesador. Desde el punto de vista optimista, el Dell es significativamente más rápido que la mayoría de los otros portátiles de 14 pulgadas en los que las CPU de 15 W, 25 W o 35 W son más comunes. Este es uno de los portátiles más pequeños que puedes conseguir con el Core i7-12700H, pero la otra cara de la moneda es que su rendimiento Turbo Boost es posteriormente más limitado cuando se compara con portátiles más grandes con la misma opción de procesador. Al fin y al cabo, el Core i7-12700H también se encuentra con frecuencia en portátiles para juegos completos. El Lenovo Legion Slim 7 de 16 pulgadas con la misma CPU, por ejemplo, ofrece un rendimiento un 30% más rápido que nuestro Inspiron 14 Plus
El limitado rendimiento Turbo Boost de nuestra CPU puede demostrarse ejecutando CineBench R15 xT en bucle. Como se muestra en el gráfico siguiente, nuestra puntuación inicial de 2410 puntos caería un 21 por ciento en el tercer o cuarto bucle, lo que representa una notable caída de rendimiento.
Cinebench R15 Multi Loop
Cinebench R23: Multi Core | Single Core
Cinebench R15: CPU Multi 64Bit | CPU Single 64Bit
Blender: v2.79 BMW27 CPU
7-Zip 18.03: 7z b 4 | 7z b 4 -mmt1
Geekbench 5.5: Multi-Core | Single-Core
HWBOT x265 Benchmark v2.2: 4k Preset
LibreOffice : 20 Documents To PDF
R Benchmark 2.5: Overall mean
* ... más pequeño es mejor
AIDA64: FP32 Ray-Trace | FPU Julia | CPU SHA3 | CPU Queen | FPU SinJulia | FPU Mandel | CPU AES | CPU ZLib | FP64 Ray-Trace | CPU PhotoWorxx
| Performance rating | |
| Medio Intel Core i7-12700H | |
| Dell Inspiron 14 Plus 7420 | |
| Asus Vivobook Pro 14 M3401QC-KM007T | |
| Schenker Vision 14 | |
| Asus Zenbook 14X UX5400E | |
| MSI Summit E14 A11SCS | |
| Dell Inspiron 14 7420 2-in-1 | |
| AIDA64 / FP32 Ray-Trace | |
| Dell Inspiron 14 Plus 7420 | |
| Medio Intel Core i7-12700H (2585 - 17957, n=64) | |
| Asus Vivobook Pro 14 M3401QC-KM007T | |
| Schenker Vision 14 | |
| Asus Zenbook 14X UX5400E | |
| MSI Summit E14 A11SCS | |
| Dell Inspiron 14 7420 2-in-1 | |
| AIDA64 / FPU Julia | |
| Asus Vivobook Pro 14 M3401QC-KM007T | |
| Dell Inspiron 14 Plus 7420 | |
| Medio Intel Core i7-12700H (12439 - 90760, n=64) | |
| Schenker Vision 14 | |
| Asus Zenbook 14X UX5400E | |
| MSI Summit E14 A11SCS | |
| Dell Inspiron 14 7420 2-in-1 | |
| AIDA64 / CPU SHA3 | |
| Medio Intel Core i7-12700H (833 - 4242, n=64) | |
| Dell Inspiron 14 Plus 7420 | |
| Schenker Vision 14 | |
| Asus Vivobook Pro 14 M3401QC-KM007T | |
| Asus Zenbook 14X UX5400E | |
| MSI Summit E14 A11SCS | |
| Dell Inspiron 14 7420 2-in-1 | |
| AIDA64 / CPU Queen | |
| Medio Intel Core i7-12700H (57923 - 103202, n=63) | |
| Dell Inspiron 14 Plus 7420 | |
| Asus Vivobook Pro 14 M3401QC-KM007T | |
| Dell Inspiron 14 7420 2-in-1 | |
| Schenker Vision 14 | |
| Asus Zenbook 14X UX5400E | |
| MSI Summit E14 A11SCS | |
| AIDA64 / FPU SinJulia | |
| Medio Intel Core i7-12700H (3249 - 9939, n=64) | |
| Asus Vivobook Pro 14 M3401QC-KM007T | |
| Dell Inspiron 14 Plus 7420 | |
| Schenker Vision 14 | |
| Asus Zenbook 14X UX5400E | |
| MSI Summit E14 A11SCS | |
| Dell Inspiron 14 7420 2-in-1 | |
| AIDA64 / FPU Mandel | |
| Asus Vivobook Pro 14 M3401QC-KM007T | |
| Dell Inspiron 14 Plus 7420 | |
| Medio Intel Core i7-12700H (7135 - 44760, n=64) | |
| Schenker Vision 14 | |
| MSI Summit E14 A11SCS | |
| Asus Zenbook 14X UX5400E | |
| Dell Inspiron 14 7420 2-in-1 | |
| AIDA64 / CPU AES | |
| Asus Vivobook Pro 14 M3401QC-KM007T | |
| Medio Intel Core i7-12700H (31839 - 144360, n=64) | |
| Schenker Vision 14 | |
| Asus Zenbook 14X UX5400E | |
| Dell Inspiron 14 Plus 7420 | |
| MSI Summit E14 A11SCS | |
| Dell Inspiron 14 7420 2-in-1 | |
| AIDA64 / CPU ZLib | |
| Medio Intel Core i7-12700H (305 - 1171, n=64) | |
| Dell Inspiron 14 Plus 7420 | |
| Asus Vivobook Pro 14 M3401QC-KM007T | |
| Dell Inspiron 14 7420 2-in-1 | |
| Schenker Vision 14 | |
| Asus Zenbook 14X UX5400E | |
| MSI Summit E14 A11SCS | |
| AIDA64 / FP64 Ray-Trace | |
| Dell Inspiron 14 Plus 7420 | |
| Medio Intel Core i7-12700H (1437 - 9692, n=64) | |
| Asus Vivobook Pro 14 M3401QC-KM007T | |
| Schenker Vision 14 | |
| Asus Zenbook 14X UX5400E | |
| MSI Summit E14 A11SCS | |
| Dell Inspiron 14 7420 2-in-1 | |
| AIDA64 / CPU PhotoWorxx | |
| MSI Summit E14 A11SCS | |
| Dell Inspiron 14 Plus 7420 | |
| Medio Intel Core i7-12700H (12863 - 52207, n=64) | |
| Asus Zenbook 14X UX5400E | |
| Schenker Vision 14 | |
| Dell Inspiron 14 7420 2-in-1 | |
| Asus Vivobook Pro 14 M3401QC-KM007T | |
Rendimiento del sistema
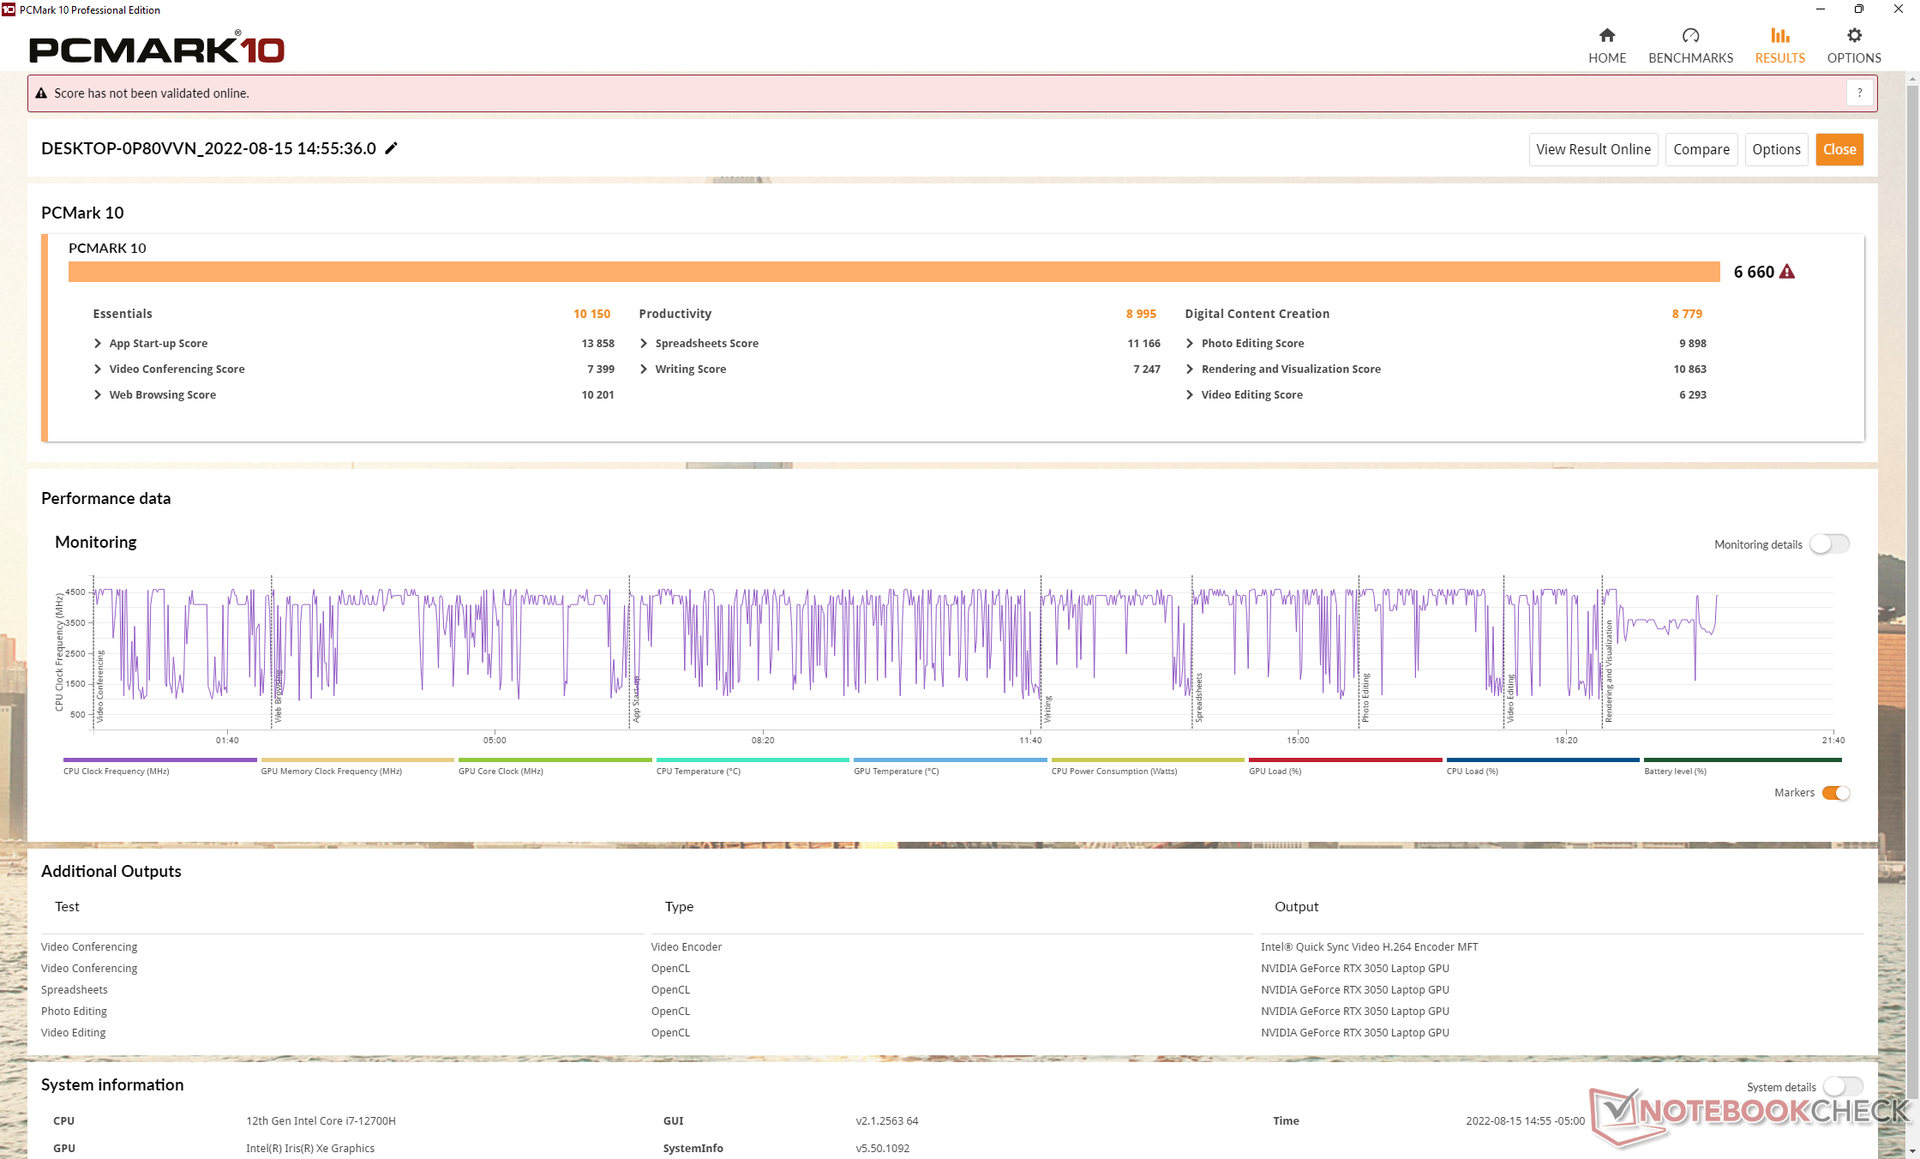
Los resultados de PCMark 10 son excelentes y superiores incluso a los de competidores como el Schenker Vision 14 con gráficos RTX 3050 Ti más rápidos o elAsus Vivobook Pro 14 con la CPU AMD Ryzen 5600H. No cabe duda de que el Core i7-12700H contribuye enormemente a aumentar el rendimiento general del Inspiron 14 Plus 7420 respecto a la mayoría de los demás portátiles multimedia de 14 pulgadas.
CrossMark: Overall | Productivity | Creativity | Responsiveness
| PCMark 10 / Score | |
| Medio Intel Core i7-12700H, NVIDIA GeForce RTX 3050 4GB Laptop GPU (6660 - 6879, n=3) | |
| Dell Inspiron 14 Plus 7420 | |
| Schenker Vision 14 | |
| Asus Vivobook Pro 14 M3401QC-KM007T | |
| HP Envy 14-eb0010nr | |
| MSI Summit E14 A11SCS | |
| Dell Inspiron 14 7420 2-in-1 | |
| Asus Zenbook 14X UX5400E | |
| PCMark 10 / Essentials | |
| Medio Intel Core i7-12700H, NVIDIA GeForce RTX 3050 4GB Laptop GPU (10150 - 10369, n=3) | |
| Dell Inspiron 14 7420 2-in-1 | |
| Dell Inspiron 14 Plus 7420 | |
| Asus Vivobook Pro 14 M3401QC-KM007T | |
| Schenker Vision 14 | |
| HP Envy 14-eb0010nr | |
| MSI Summit E14 A11SCS | |
| Asus Zenbook 14X UX5400E | |
| PCMark 10 / Productivity | |
| Medio Intel Core i7-12700H, NVIDIA GeForce RTX 3050 4GB Laptop GPU (8995 - 9397, n=3) | |
| Dell Inspiron 14 Plus 7420 | |
| Schenker Vision 14 | |
| Asus Zenbook 14X UX5400E | |
| HP Envy 14-eb0010nr | |
| MSI Summit E14 A11SCS | |
| Asus Vivobook Pro 14 M3401QC-KM007T | |
| Dell Inspiron 14 7420 2-in-1 | |
| PCMark 10 / Digital Content Creation | |
| Medio Intel Core i7-12700H, NVIDIA GeForce RTX 3050 4GB Laptop GPU (8779 - 9203, n=3) | |
| Dell Inspiron 14 Plus 7420 | |
| Asus Vivobook Pro 14 M3401QC-KM007T | |
| Schenker Vision 14 | |
| Dell Inspiron 14 7420 2-in-1 | |
| HP Envy 14-eb0010nr | |
| MSI Summit E14 A11SCS | |
| Asus Zenbook 14X UX5400E | |
| CrossMark / Overall | |
| Medio Intel Core i7-12700H, NVIDIA GeForce RTX 3050 4GB Laptop GPU (1717 - 1857, n=3) | |
| Dell Inspiron 14 Plus 7420 | |
| Schenker Vision 14 | |
| Dell Inspiron 14 7420 2-in-1 | |
| Asus Vivobook Pro 14 M3401QC-KM007T | |
| CrossMark / Productivity | |
| Medio Intel Core i7-12700H, NVIDIA GeForce RTX 3050 4GB Laptop GPU (1620 - 1735, n=3) | |
| Dell Inspiron 14 Plus 7420 | |
| Schenker Vision 14 | |
| Dell Inspiron 14 7420 2-in-1 | |
| Asus Vivobook Pro 14 M3401QC-KM007T | |
| CrossMark / Creativity | |
| Medio Intel Core i7-12700H, NVIDIA GeForce RTX 3050 4GB Laptop GPU (1911 - 2067, n=3) | |
| Dell Inspiron 14 Plus 7420 | |
| Dell Inspiron 14 7420 2-in-1 | |
| Schenker Vision 14 | |
| Asus Vivobook Pro 14 M3401QC-KM007T | |
| CrossMark / Responsiveness | |
| Medio Intel Core i7-12700H, NVIDIA GeForce RTX 3050 4GB Laptop GPU (1481 - 1651, n=3) | |
| Schenker Vision 14 | |
| Dell Inspiron 14 Plus 7420 | |
| Dell Inspiron 14 7420 2-in-1 | |
| Asus Vivobook Pro 14 M3401QC-KM007T | |
| PCMark 10 Score | 6660 puntos | |
ayuda | ||
| AIDA64 / Memory Copy | |
| MSI Summit E14 A11SCS | |
| Asus Zenbook 14X UX5400E | |
| Dell Inspiron 14 Plus 7420 | |
| Medio Intel Core i7-12700H (25615 - 80511, n=64) | |
| Schenker Vision 14 | |
| Dell Inspiron 14 7420 2-in-1 | |
| Asus Vivobook Pro 14 M3401QC-KM007T | |
| AIDA64 / Memory Read | |
| Dell Inspiron 14 Plus 7420 | |
| MSI Summit E14 A11SCS | |
| Asus Zenbook 14X UX5400E | |
| Medio Intel Core i7-12700H (25586 - 79442, n=64) | |
| Schenker Vision 14 | |
| Asus Vivobook Pro 14 M3401QC-KM007T | |
| Dell Inspiron 14 7420 2-in-1 | |
| AIDA64 / Memory Write | |
| Asus Zenbook 14X UX5400E | |
| MSI Summit E14 A11SCS | |
| Dell Inspiron 14 Plus 7420 | |
| Medio Intel Core i7-12700H (23679 - 88660, n=64) | |
| Schenker Vision 14 | |
| Dell Inspiron 14 7420 2-in-1 | |
| Asus Vivobook Pro 14 M3401QC-KM007T | |
| AIDA64 / Memory Latency | |
| Dell Inspiron 14 Plus 7420 | |
| Asus Zenbook 14X UX5400E | |
| MSI Summit E14 A11SCS | |
| Asus Vivobook Pro 14 M3401QC-KM007T | |
| Medio Intel Core i7-12700H (76.2 - 133.9, n=62) | |
| Schenker Vision 14 | |
| Dell Inspiron 14 7420 2-in-1 | |
* ... más pequeño es mejor
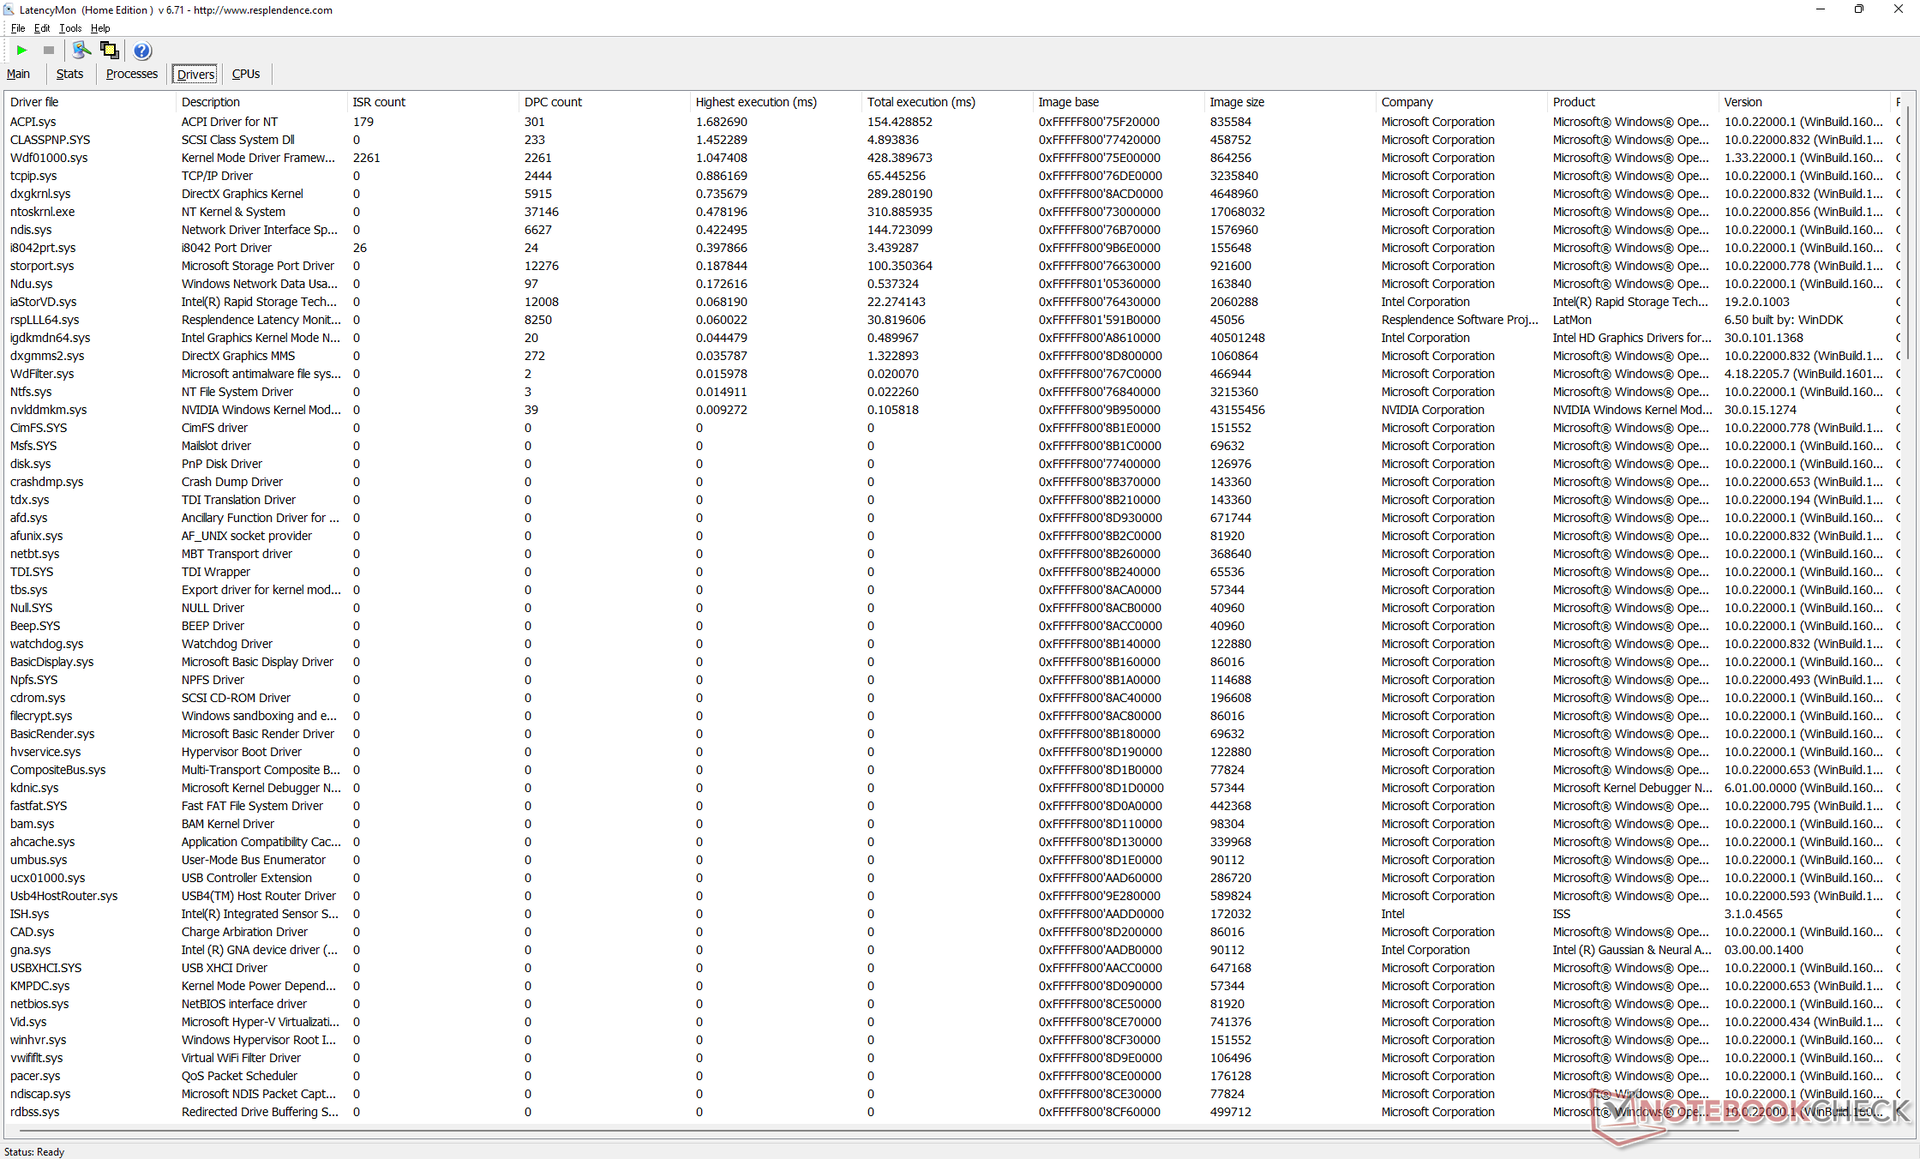
Latencia del CPD
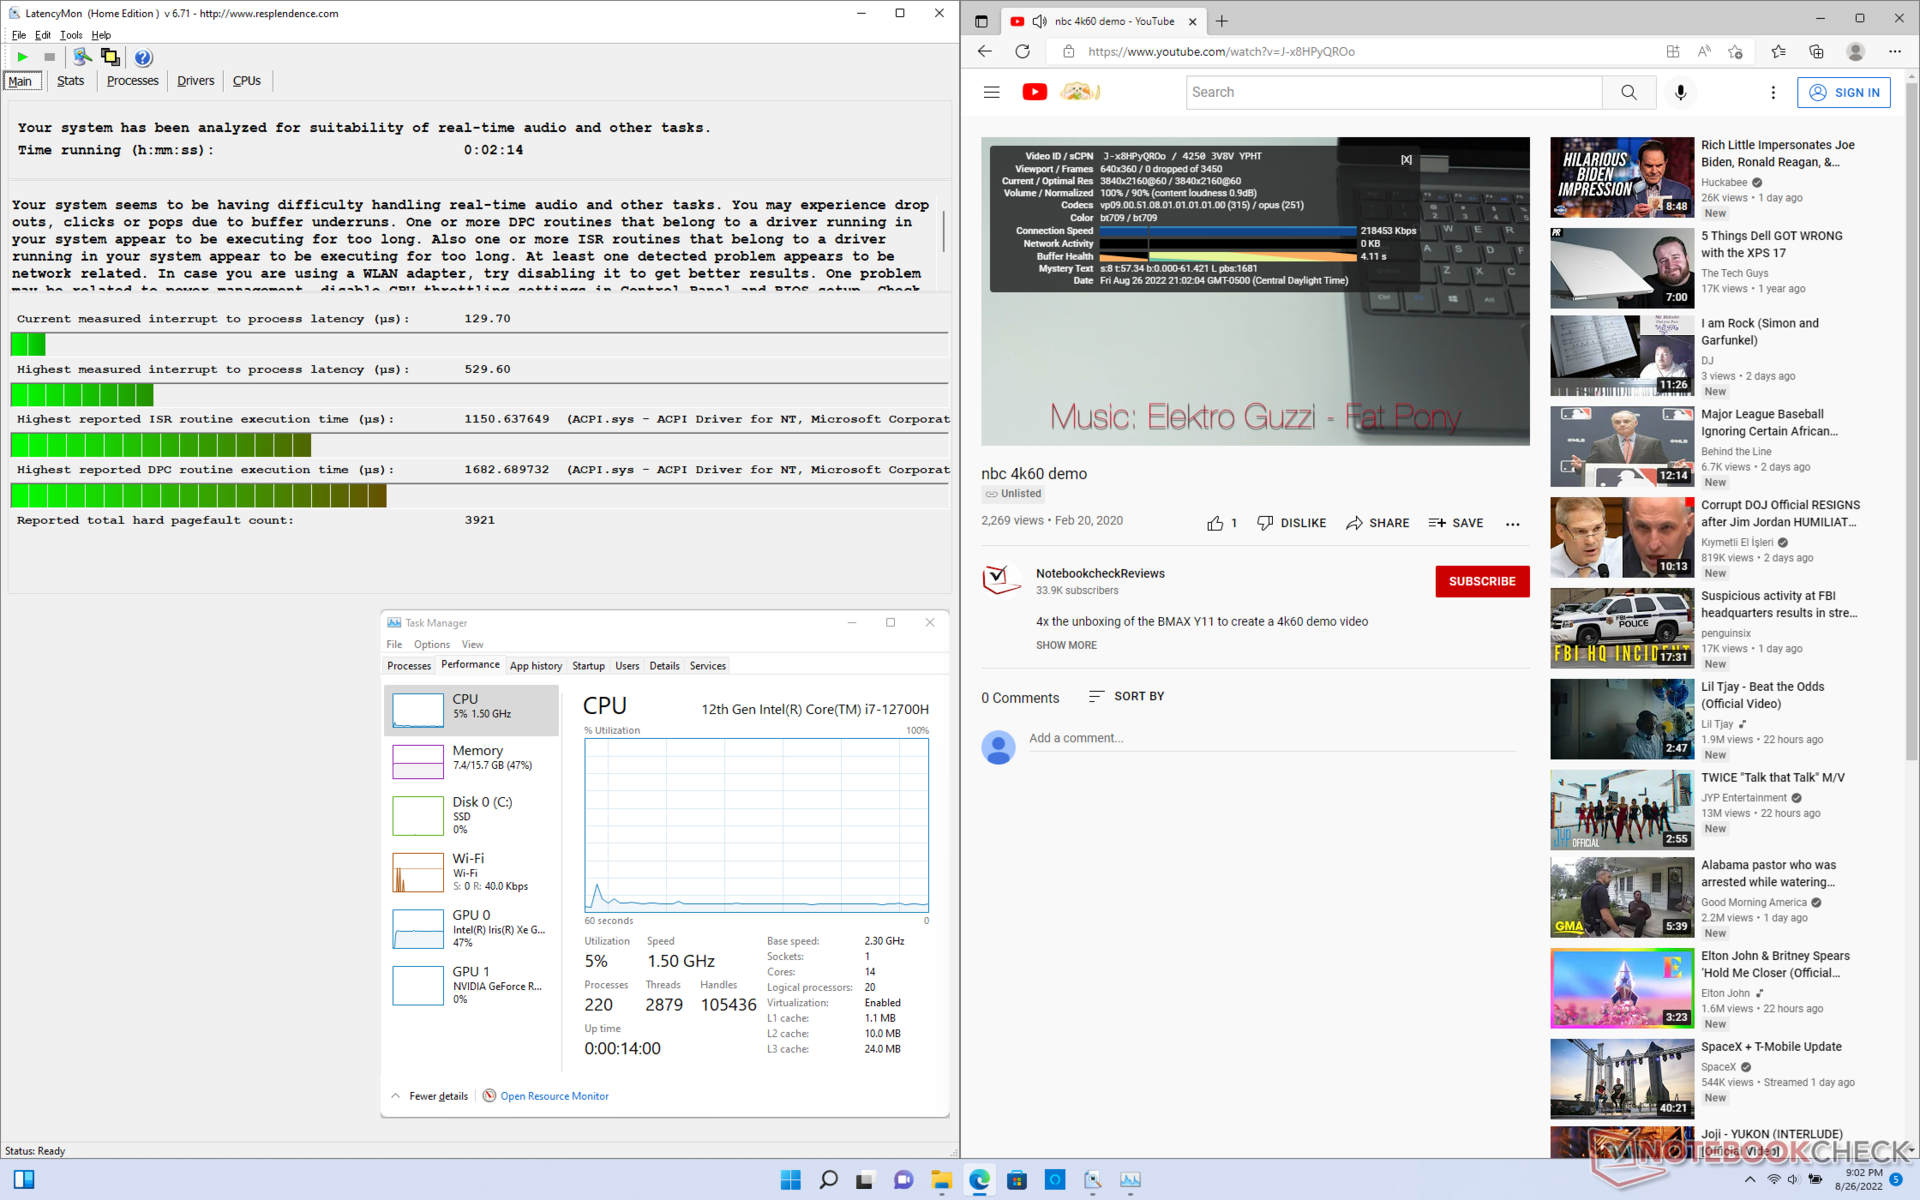
LatencyMon muestra problemas menores de CPD al abrir varias pestañas de nuestra página web. la reproducción de vídeo 4K a 60 FPS es, por lo demás, fluida y sin ninguna pérdida de frames.
| DPC Latencies / LatencyMon - interrupt to process latency (max), Web, Youtube, Prime95 | |
| HP Envy 14-eb0010nr | |
| Schenker Vision 14 | |
| MSI Summit E14 A11SCS | |
| Asus Vivobook Pro 14 M3401QC-KM007T | |
| Asus Zenbook 14X UX5400E | |
| Dell Inspiron 14 7420 2-in-1 | |
| Dell Inspiron 14 Plus 7420 | |
* ... más pequeño es mejor
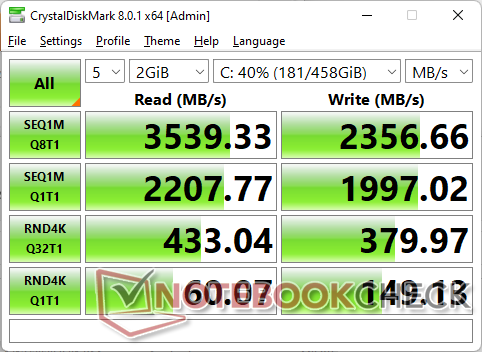
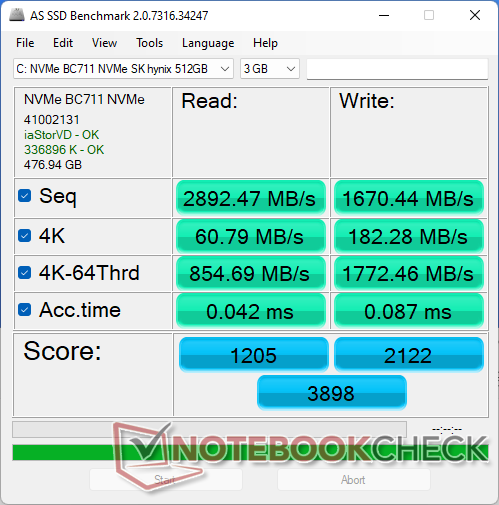
Dispositivos de almacenamiento - Separador de calor incluido
Nuestra unidad se envía con una unidad de 512 GB SK Hynix BC711 PCIe3 NVMe SSD que ofrece velocidades de lectura secuencial de hasta 3600 MB/s. La unidad no presentaría problemas de estrangulamiento del rendimiento al ejecutar DiskSpd en un bucle, ya que viene con su propio disipador de calor preinstalado. En comparación, la mayoría de los fabricantes de equipos originales no incluyen uno con sus modelos de portátiles económicos o incluso de gama media. Sin embargo, habría estado bien ver opciones PCIe4 más rápidas en el Inspiron 14 Plus 7420.

* ... más pequeño es mejor
Disk Throttling: DiskSpd Read Loop, Queue Depth 8
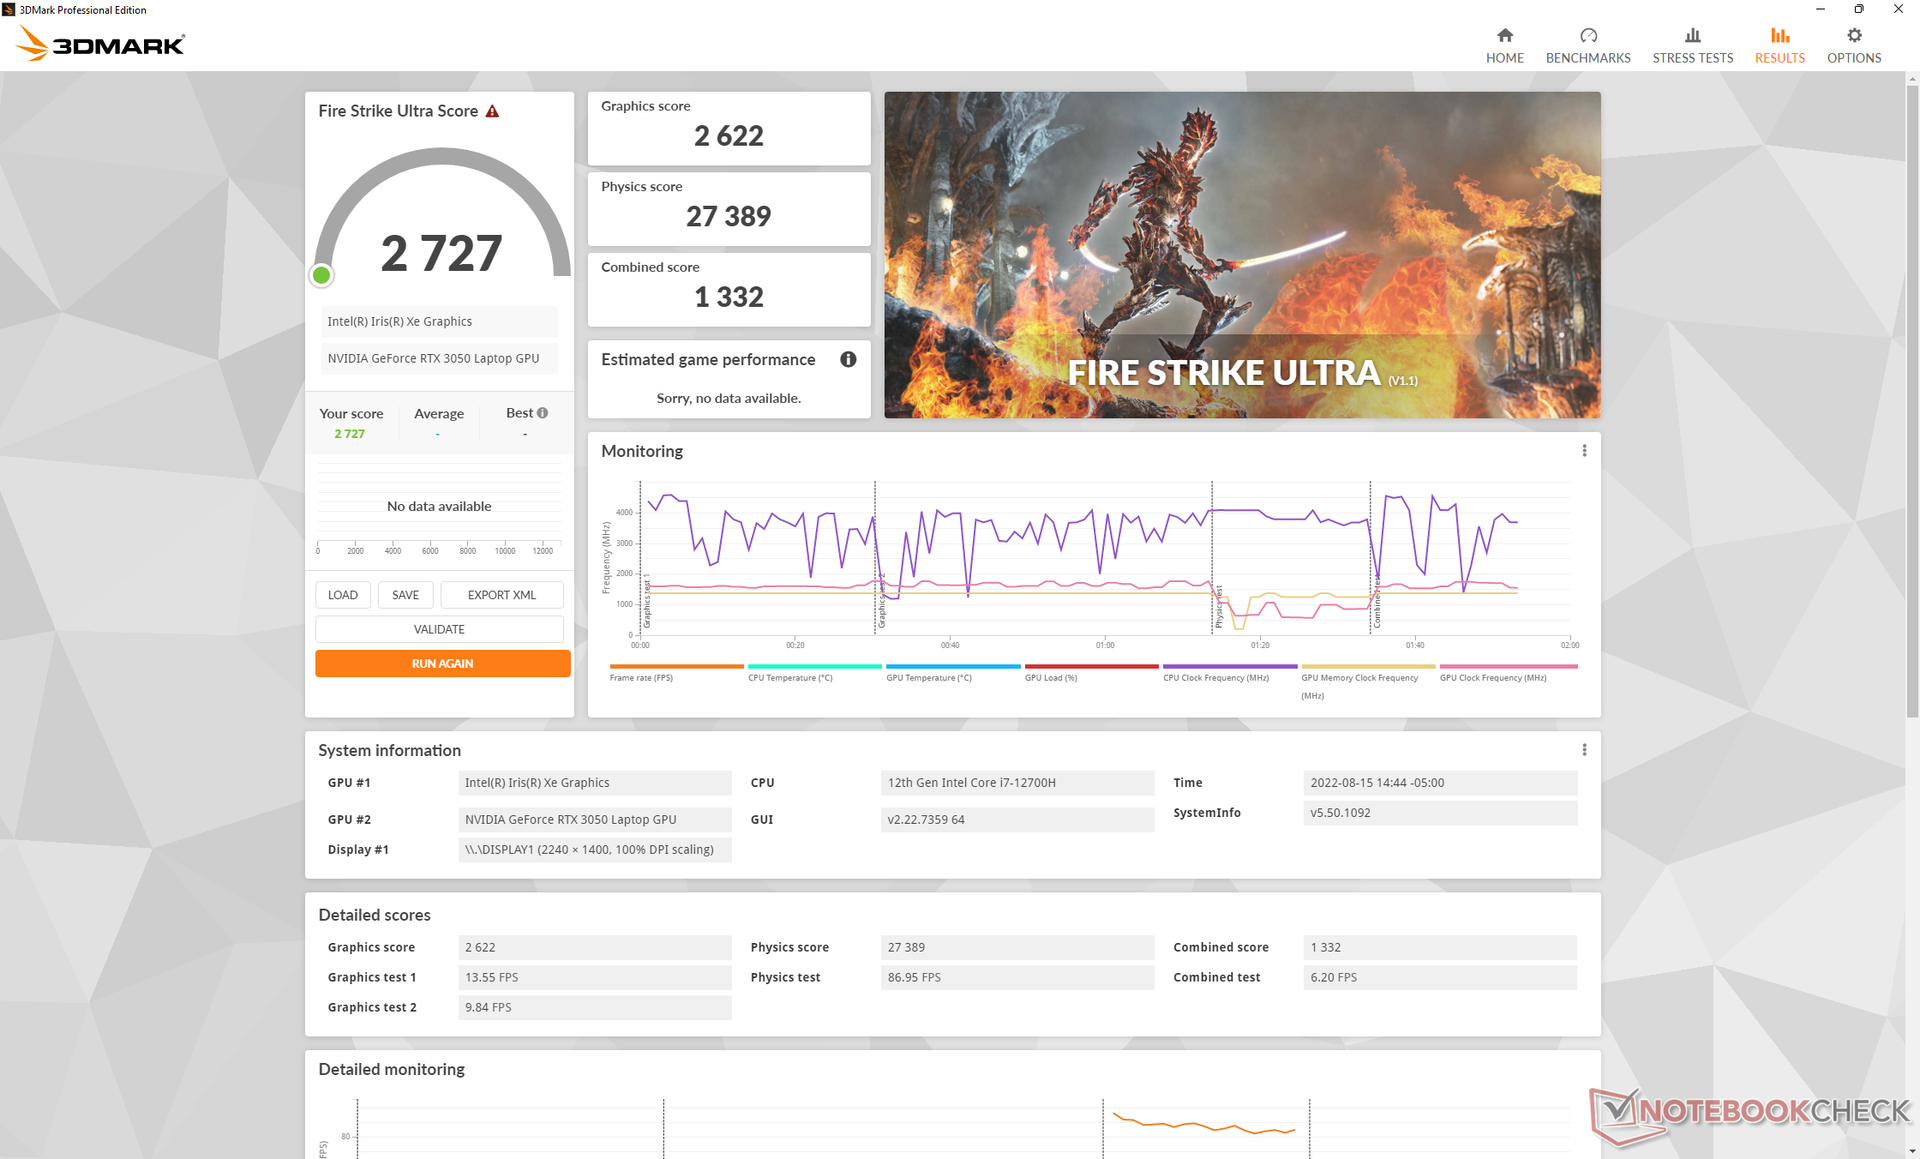
Rendimiento de la GPU: rápida para el tamaño y el precio
El rendimiento gráfico está donde esperamos que esté en relación con otros portátiles con la misma GeForce RTX 3050 GPU. De hecho, los resultados están más o menos a la par con la RTX 3050 Ti que se encuentra en el Schenker Vision 14 o elAsus ROG Flow Z13. Es posible que Dell introduzca modelos con la RTX 3050 Ti en un futuro próximo, pero no lo recomendamos ya que, en el mejor de los casos, sólo será ligeramente más rápida que nuestra RTX 3050 básica.
Los usuarios que se actualicen desde la mucho más antigua GTX 1650 Ti Max-Q verán mejoras significativas de alrededor del 50 por ciento.
Hay que tener en cuenta que el rendimiento gráfico se reduce si se ejecuta en el modo optimizado de Dell en lugar del modo de ultra rendimiento de Dell. Una prueba de Fire Strike en modo optimizado arrojaría una puntuación de gráficos de 10966 puntos en comparación con los 12125 puntos del modo de ultra rendimiento.
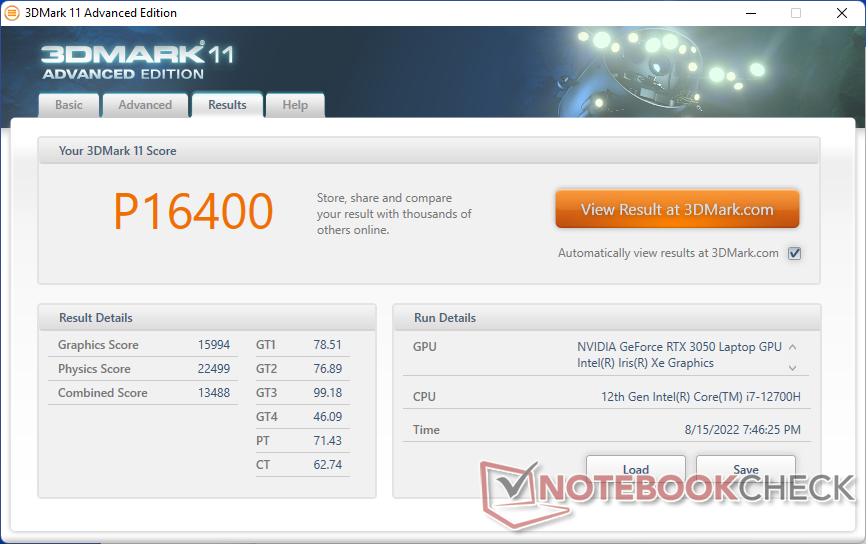
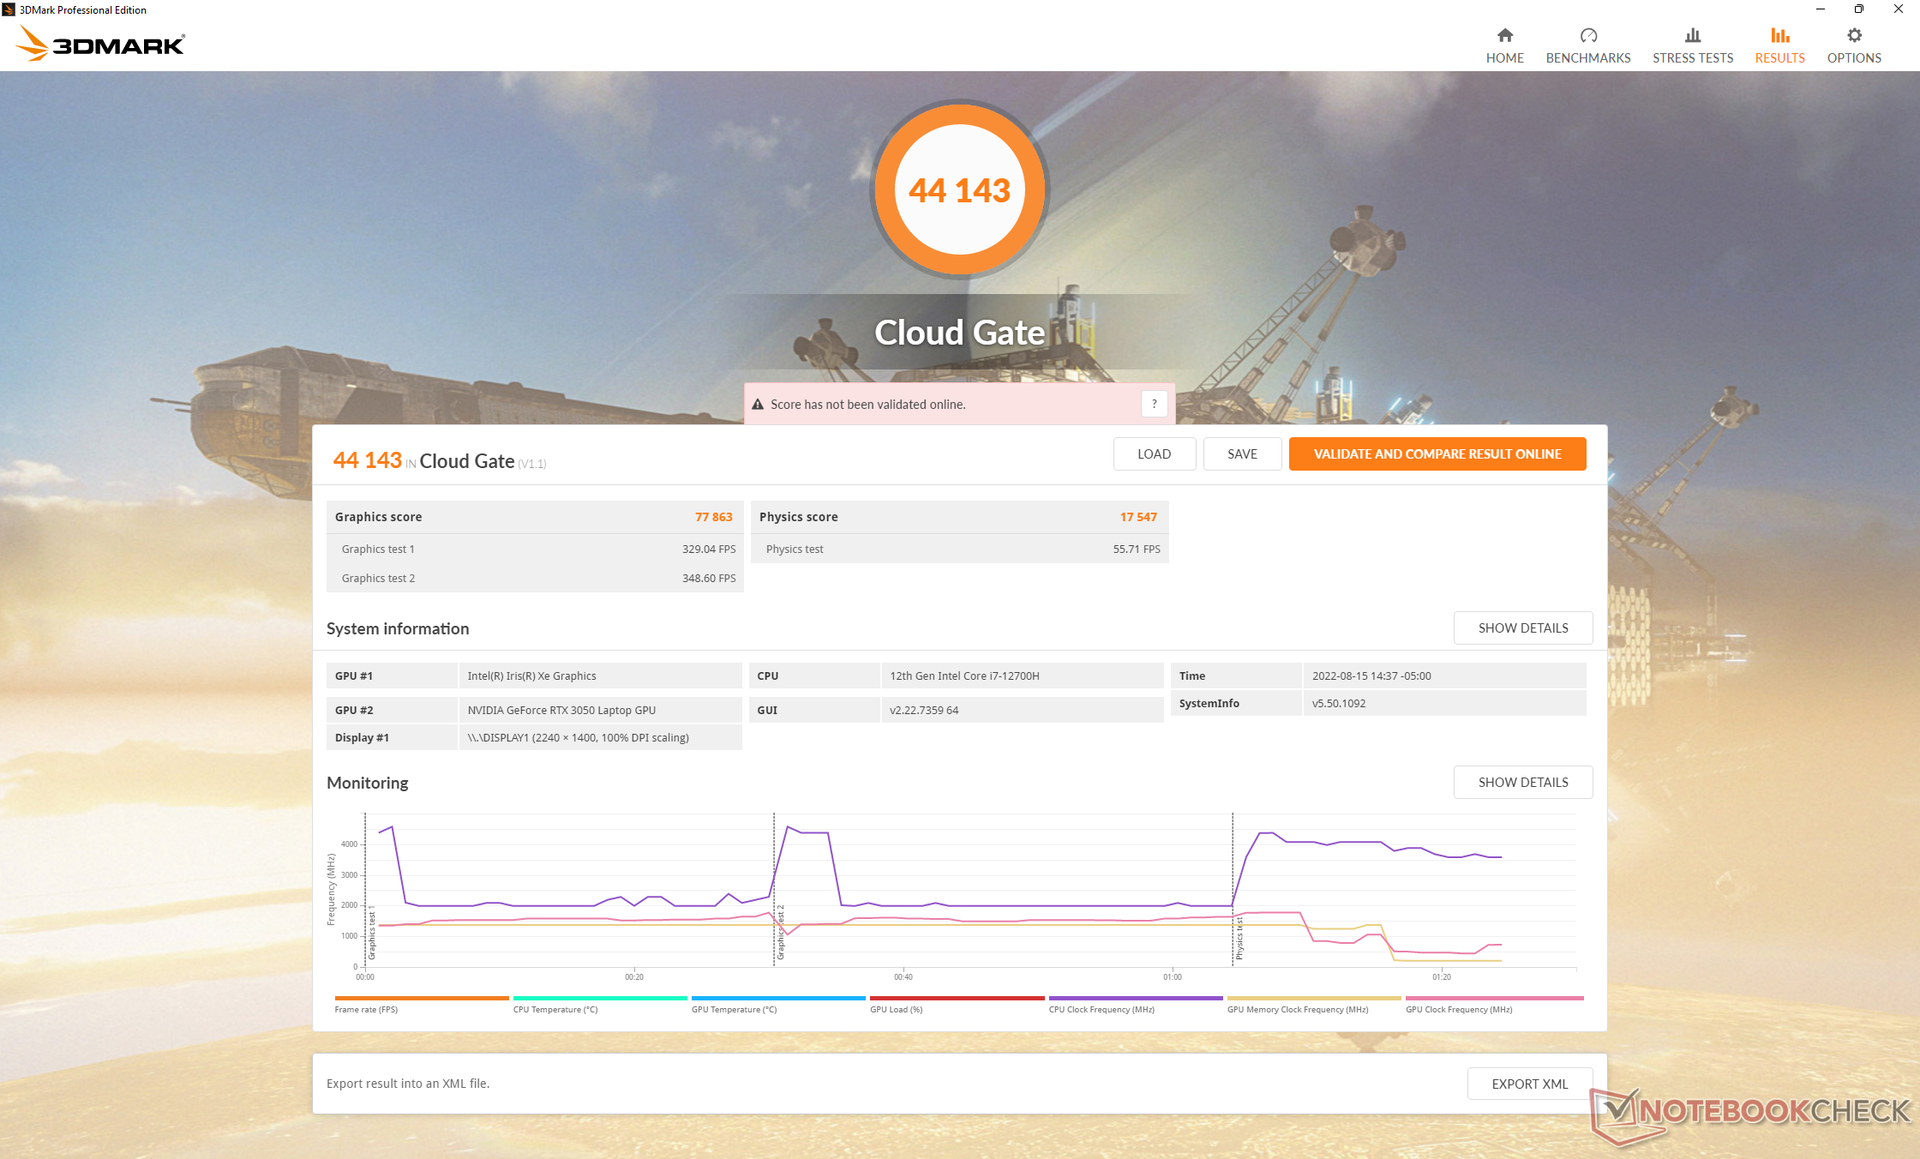
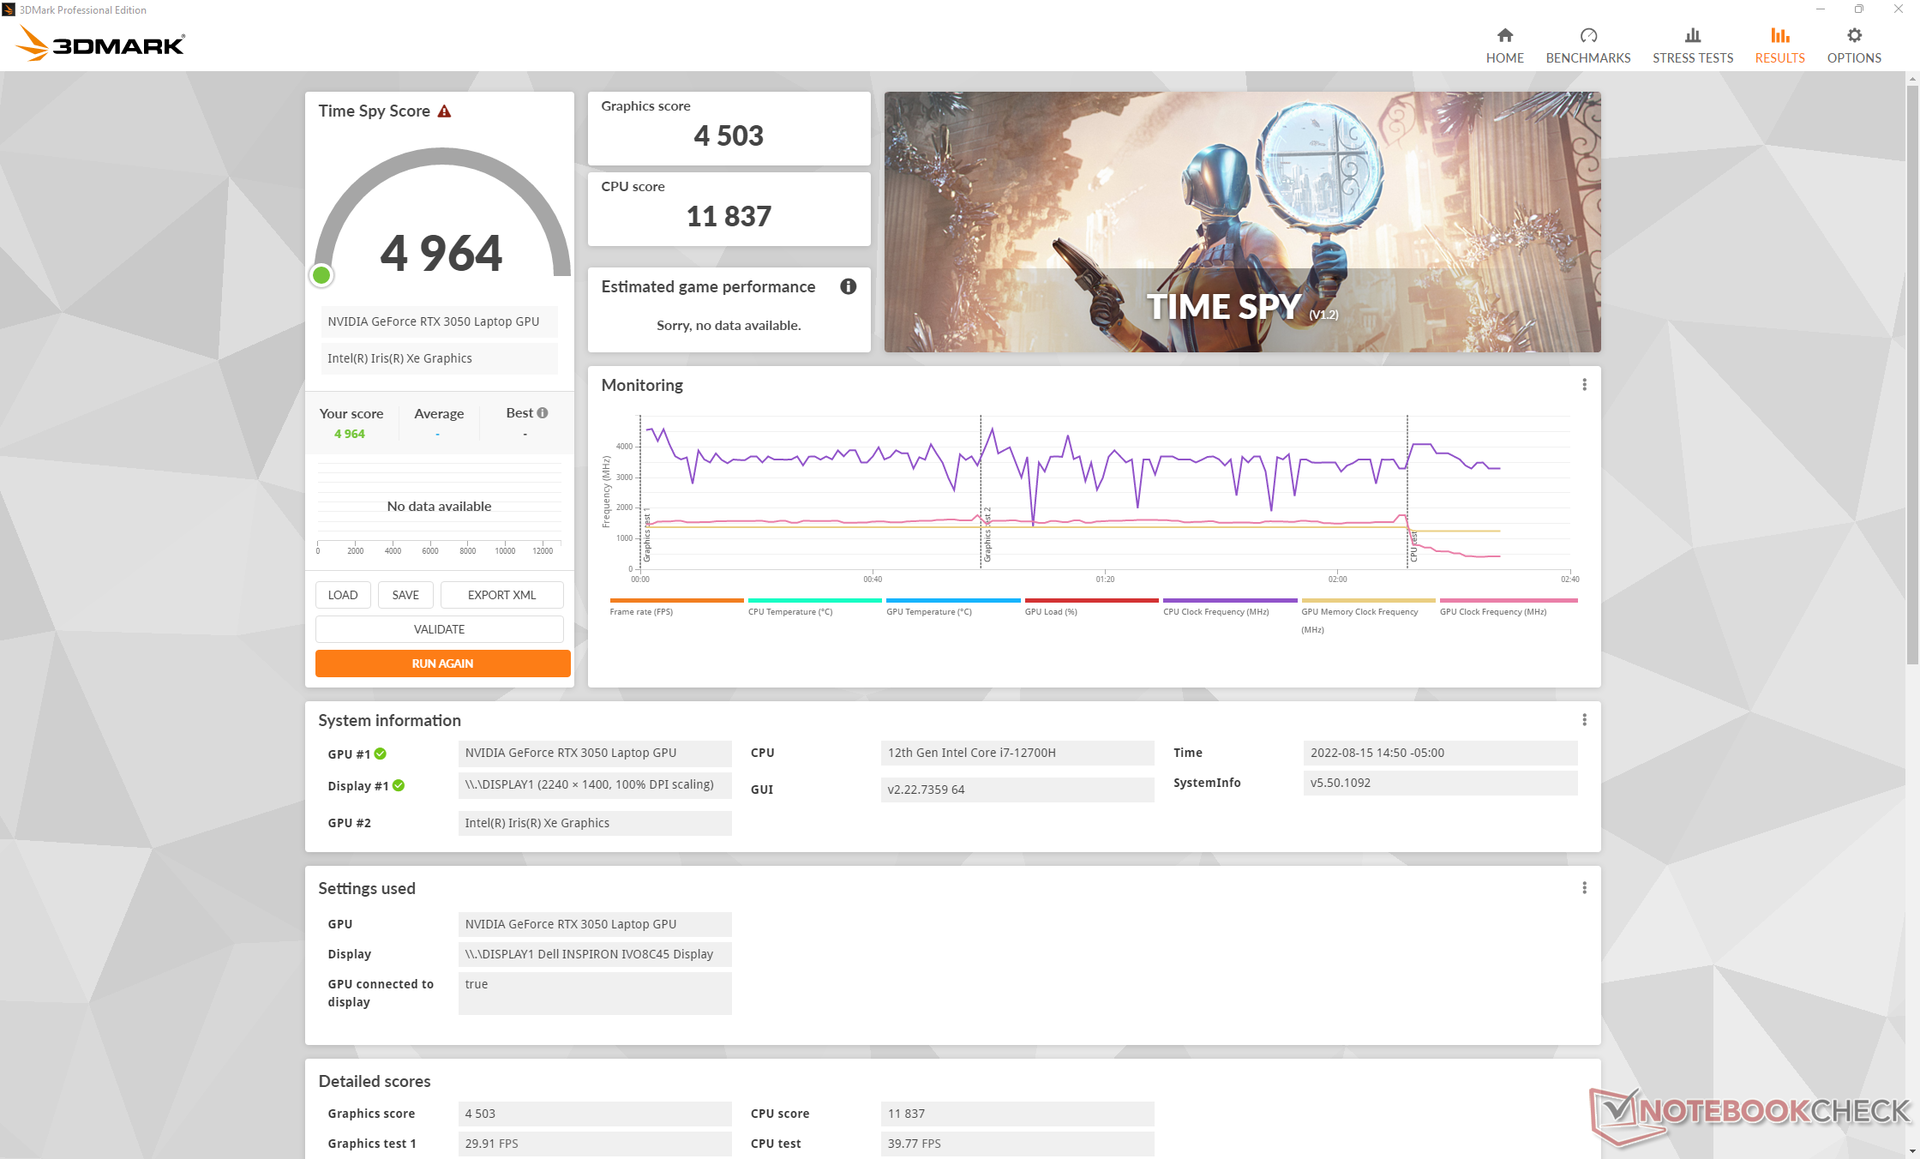

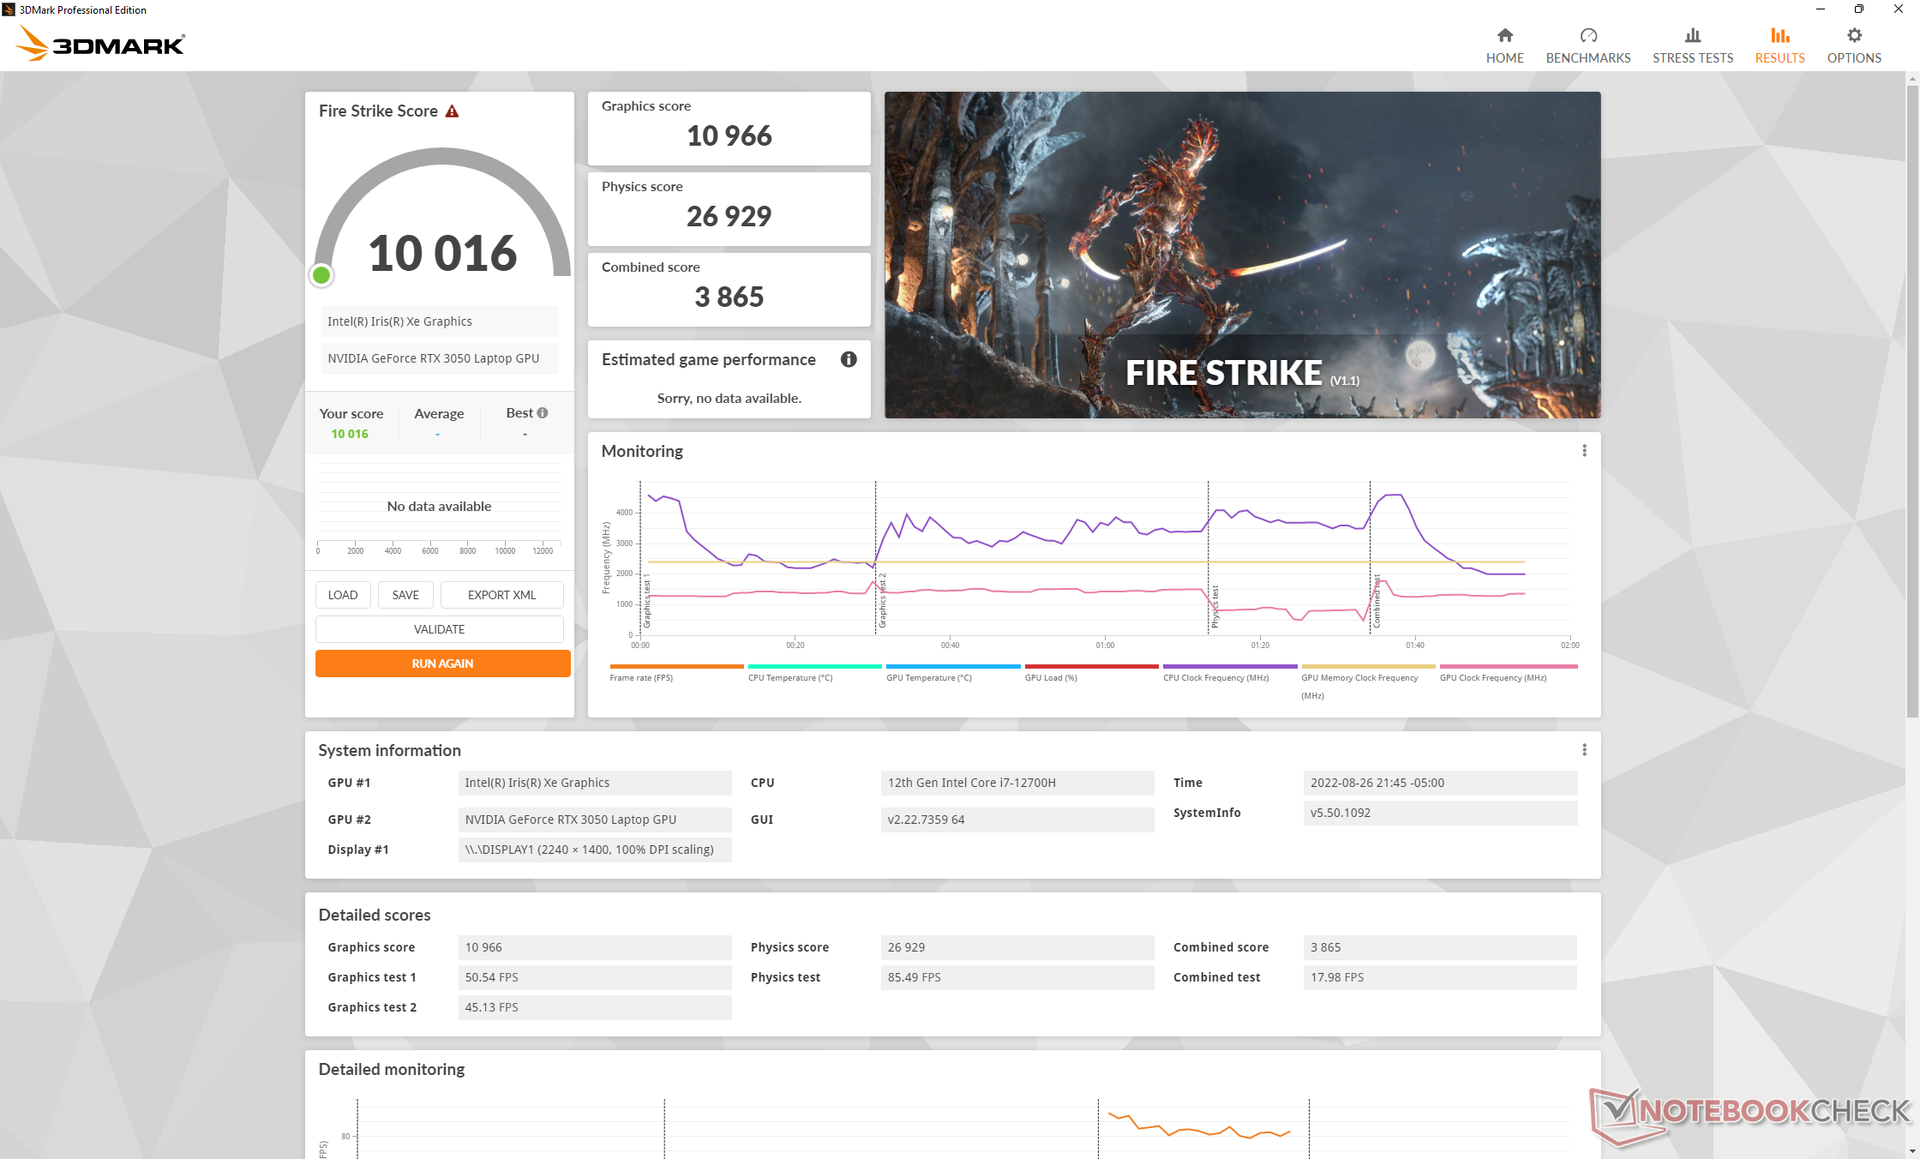
| 3DMark 11 Performance | 16400 puntos | |
| 3DMark Cloud Gate Standard Score | 44143 puntos | |
| 3DMark Fire Strike Score | 11060 puntos | |
| 3DMark Time Spy Score | 4964 puntos | |
ayuda | ||
Witcher 3 FPS Chart
| bajo | medio | alto | ultra | |
|---|---|---|---|---|
| GTA V (2015) | 181.8 | 161.4 | 111.5 | 61.8 |
| The Witcher 3 (2015) | 222.2 | 150.4 | 83.5 | 46 |
| Dota 2 Reborn (2015) | 174.4 | 158.7 | 145 | 134.4 |
| Final Fantasy XV Benchmark (2018) | 113.5 | 66.1 | 47.4 | |
| X-Plane 11.11 (2018) | 137.8 | 117.2 | 94.4 | |
| Strange Brigade (2018) | 263 | 118.2 | 94.7 | 82.4 |
| Cyberpunk 2077 1.6 (2022) | 68.6 | 55 | 41 | 33.8 |
Emisiones - Loud Like A Gamer
Ruido del sistema
Los dos ventiladores del sistema son sensibles a las cargas altas. Al iniciar el 3DMark 06, por ejemplo, el ruido del ventilador aumenta rápidamente antes de estabilizarse en unos 47 dB(A) hacia el final de la primera escena de la prueba, comparado con los 43 dB(A) del Schenker Vision 14 o los 35 dB(A) del HP Envy 14 ambos con gráficos discretos GeForce
Ejecutar los juegos en el modo de Ultra Rendimiento resultaría en un ruido de ventilador de casi 52 dB(A) que es comparable al de muchos portátiles de juego dedicados con gráficos más rápidos. El ruido del ventilador bajaría a 48 dB(A) si se juega en el modo Optimizado de Dell, pero esto conlleva un pequeño recorte en el rendimiento gráfico como ya se ha mencionado. Así, los usuarios deben soportar las RPM máximas de los ventiladores si quieren exprimir toda la potencia de 50 W de la GPU GeForce
Por suerte, los ventiladores son bastante silenciosos, con 26,5 dB(A), frente a un fondo silencioso de 23,2 dB(A) durante las tareas más mundanas, como la navegación por Internet o el streaming de vídeo. Sólo cuando se introducen cargas más altas comienzan a aumentar rápidamente.
Ruido
| Ocioso |
| 23.2 / 23.2 / 23.2 dB(A) |
| Carga |
| 47.5 / 51.7 dB(A) |
 | ||
30 dB silencioso 40 dB(A) audible 50 dB(A) ruidosamente alto |
||
min: | ||
| Dell Inspiron 14 Plus 7420 GeForce RTX 3050 4GB Laptop GPU, i7-12700H, SK Hynix BC711 512GB HFM512GD3GX013N | Asus Vivobook Pro 14 M3401QC-KM007T GeForce RTX 3050 4GB Laptop GPU, R5 5600H, Intel SSD 670p SSDPEKNU512GZ | Dell Inspiron 14 7420 2-in-1 Iris Xe G7 96EUs, i7-1255U, WDC PC SN530 SDBPMPZ-512G | Schenker Vision 14 GeForce RTX 3050 Ti Laptop GPU, i7-11370H, Samsung SSD 980 Pro 1TB MZ-V8P1T0BW | Asus Zenbook 14X UX5400E GeForce MX450, i7-1165G7, SK Hynix HFM001TD3JX013N | HP Envy 14-eb0010nr GeForce GTX 1650 Ti Max-Q, i5-1135G7, Samsung SSD PM981a MZVLB256HBHQ | |
|---|---|---|---|---|---|---|
| Noise | -14% | 7% | 0% | -0% | 3% | |
| apagado / medio ambiente * (dB) | 23.2 | 25.4 -9% | 23.1 -0% | 24.3 -5% | 26 -12% | 25.9 -12% |
| Idle Minimum * (dB) | 23.2 | 25.4 -9% | 24.7 -6% | 24.3 -5% | 26 -12% | 26 -12% |
| Idle Average * (dB) | 23.2 | 25.4 -9% | 24.7 -6% | 24.3 -5% | 26 -12% | 26 -12% |
| Idle Maximum * (dB) | 23.2 | 30.9 -33% | 24.7 -6% | 25.9 -12% | 26.3 -13% | 26 -12% |
| Load Average * (dB) | 47.5 | 56 -18% | 27.7 42% | 43.3 9% | 37.1 22% | 34.9 27% |
| Witcher 3 ultra * (dB) | 51.7 | 45.1 13% | 44.6 14% | 34.5 33% | ||
| Load Maximum * (dB) | 51.7 | 56 -8% | 45.1 13% | 49.5 4% | 38 26% | 48.7 6% |
* ... más pequeño es mejor
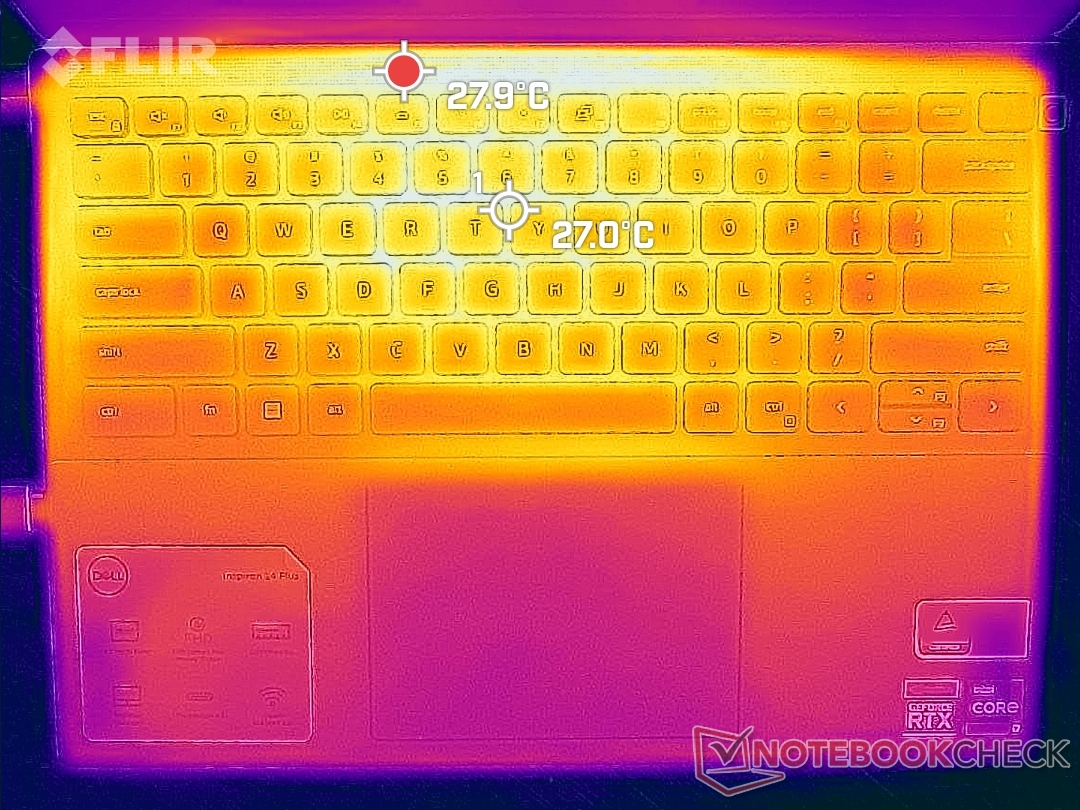
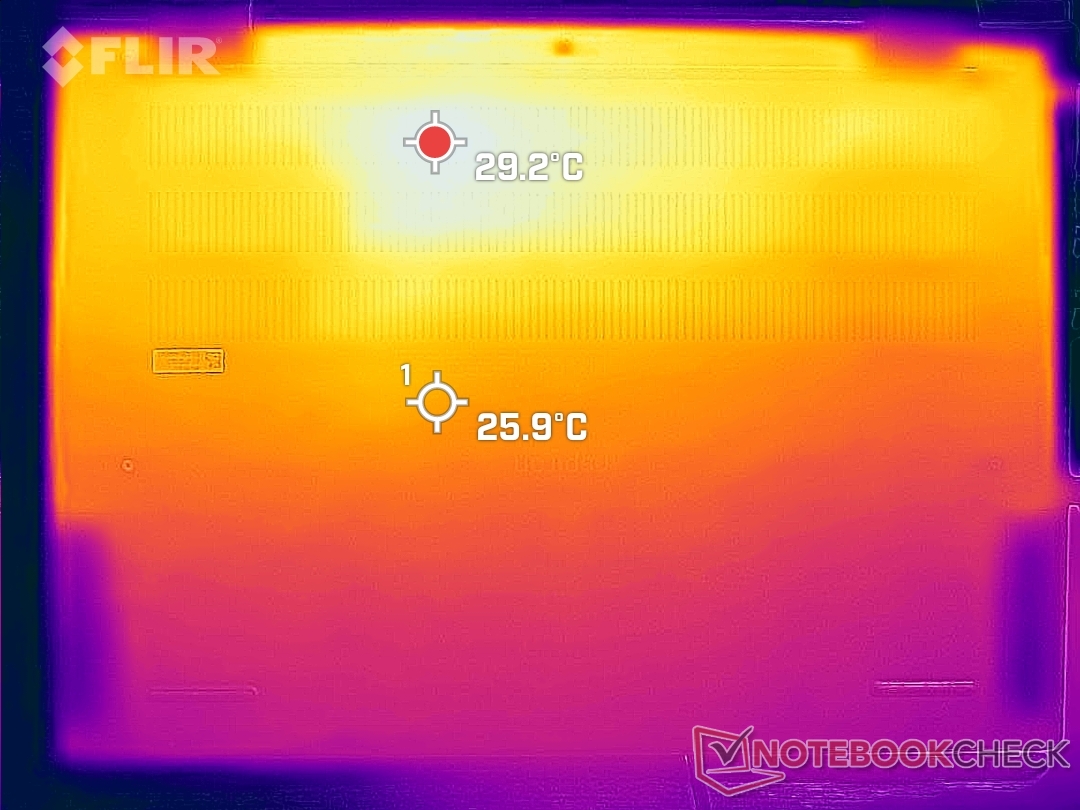
Temperatura
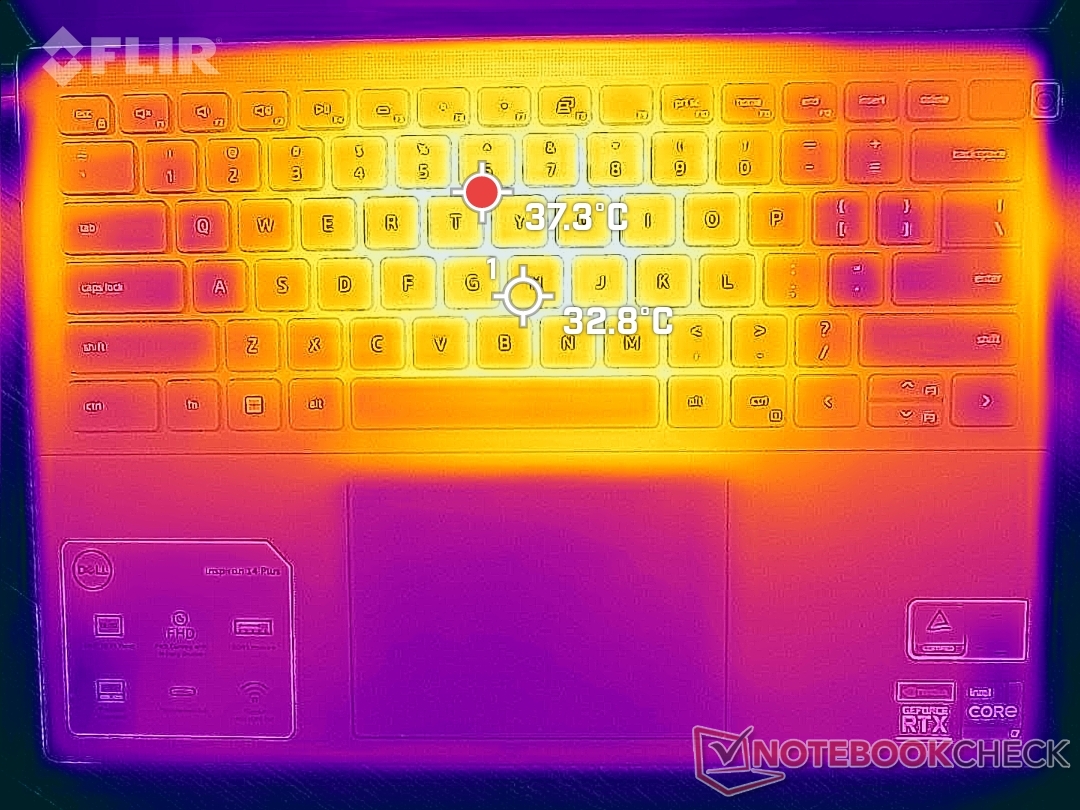
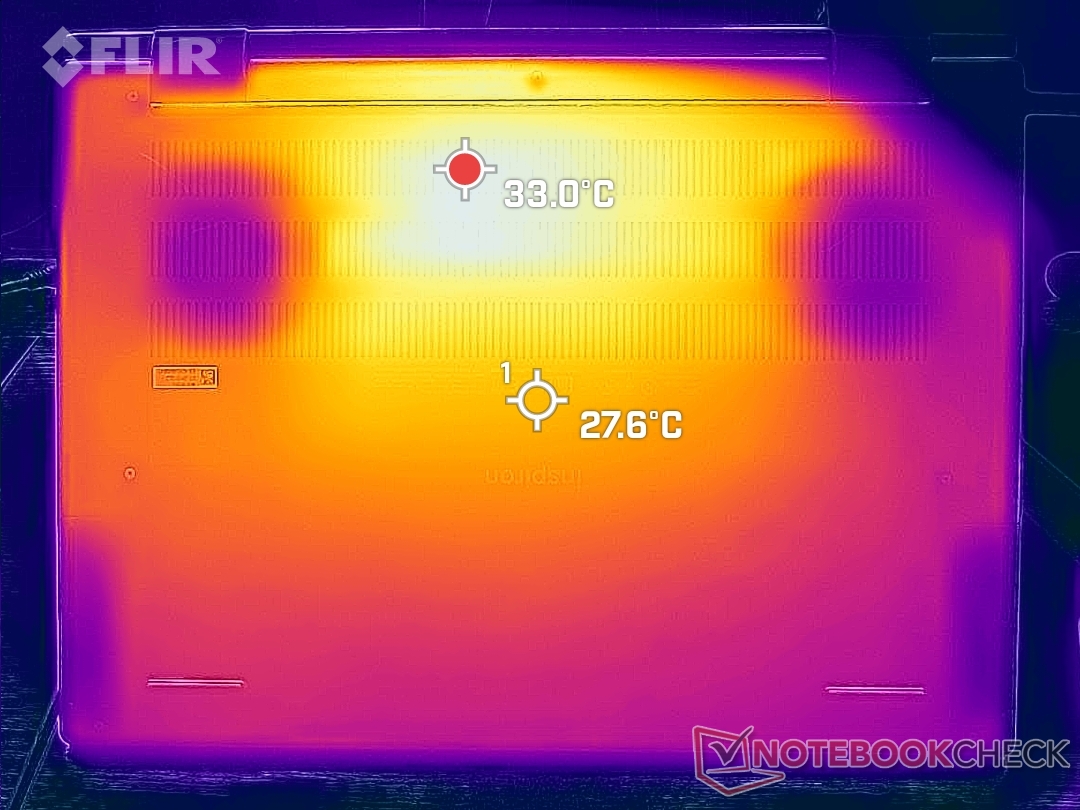
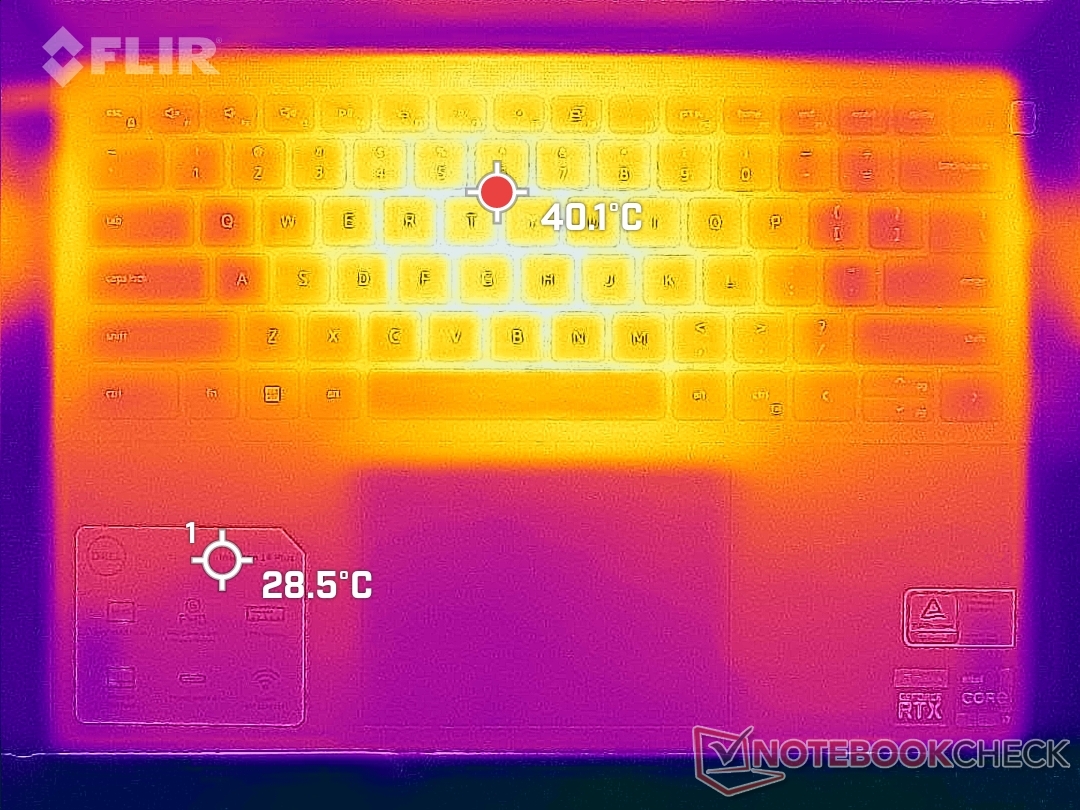
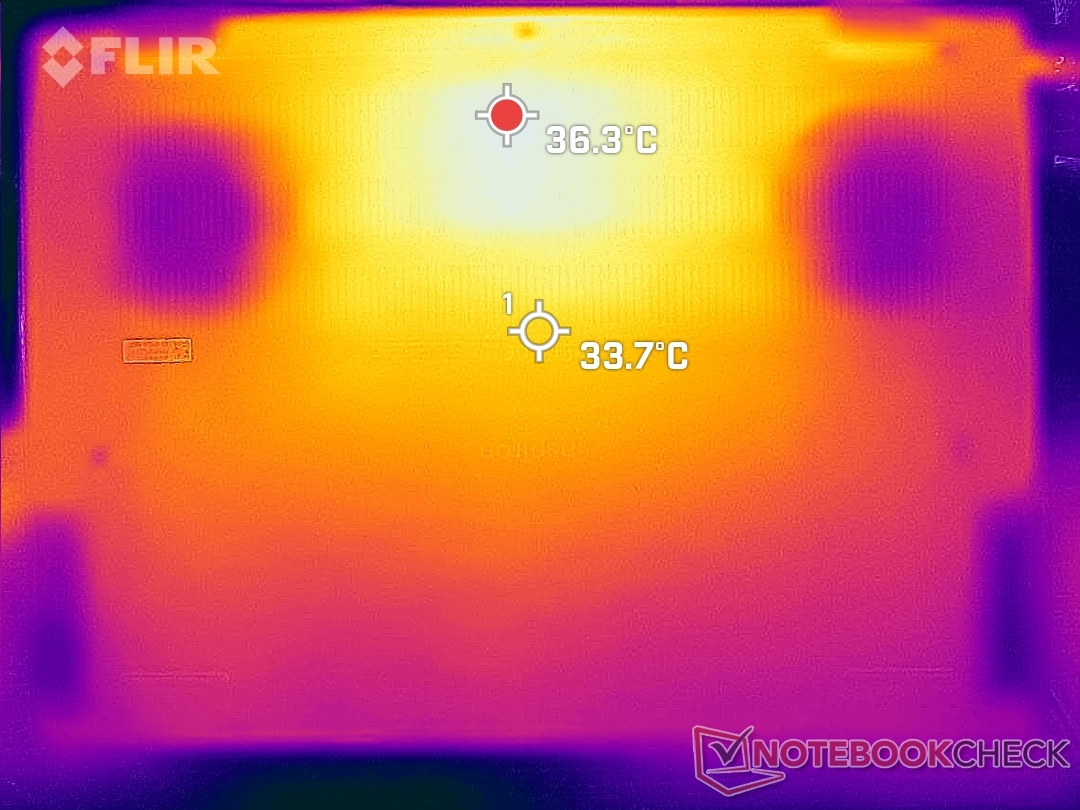
La temperatura de la superficie en reposo es de unos 28 C tanto en la parte superior como en la inferior, lo que es similar a otros portátiles multimedia delgados con gráficos discretos como elAsus Vivobook Pro 14 o el Schenker Vision 14. Cuando se juega, los puntos calientes pueden alcanzar algo más de 40 C cerca del centro del teclado y la parte trasera del chasis, mientras que los reposamanos se mantienen más cómodos en el rango de los 30 C. Los puntos calientes aquí son generalmente más fríos que en los mencionados Asus o Schenker que pueden alcanzar de 45 C a 55 C.
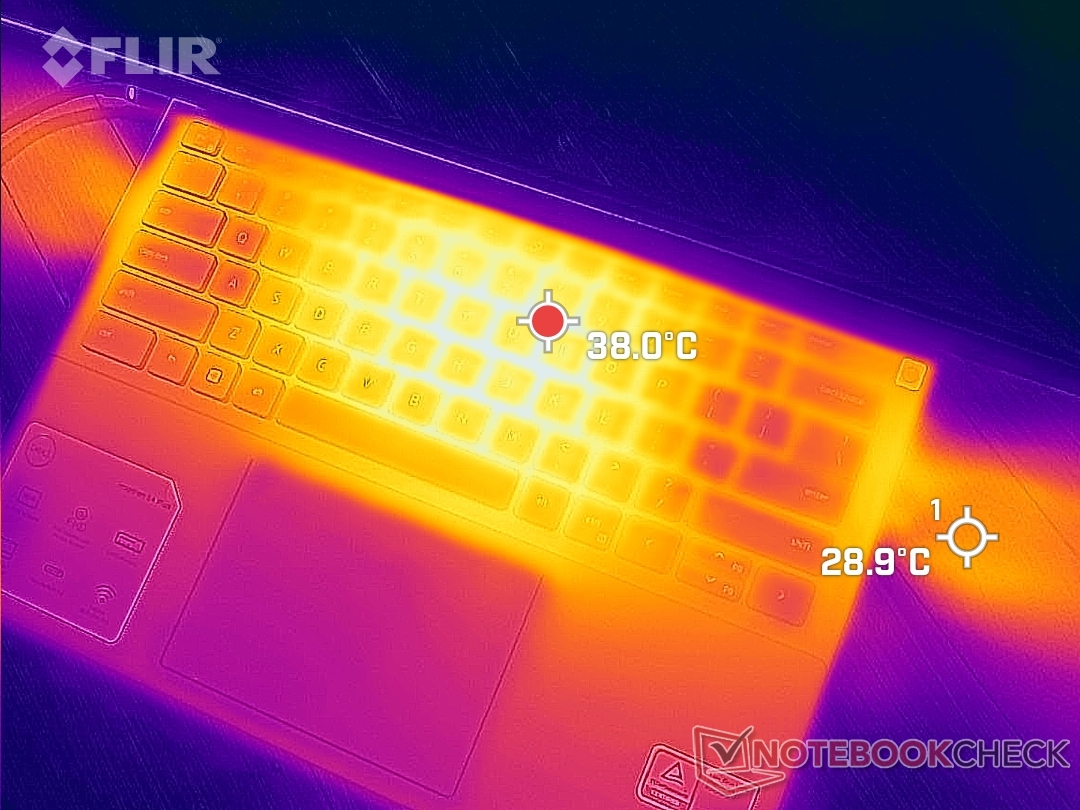
(±) La temperatura máxima en la parte superior es de 40 °C / 104 F, frente a la media de 36.8 °C / 98 F, que oscila entre 21 y 71 °C para la clase Multimedia.
(+) El fondo se calienta hasta un máximo de 36.4 °C / 98 F, frente a la media de 39.1 °C / 102 F
(+) En reposo, la temperatura media de la parte superior es de 24.2 °C / 76# F, frente a la media del dispositivo de 31.3 °C / 88 F.
(+) Jugando a The Witcher 3, la temperatura media de la parte superior es de 28.6 °C / 83 F, frente a la media del dispositivo de 31.3 °C / 88 F.
(+) El reposamanos y el panel táctil están a una temperatura inferior a la de la piel, con un máximo de 29.4 °C / 84.9 F y, por tanto, son fríos al tacto.
(±) La temperatura media de la zona del reposamanos de dispositivos similares fue de 28.7 °C / 83.7 F (-0.7 °C / -1.2 F).
| Dell Inspiron 14 Plus 7420 Intel Core i7-12700H, NVIDIA GeForce RTX 3050 4GB Laptop GPU | Asus Vivobook Pro 14 M3401QC-KM007T AMD Ryzen 5 5600H, NVIDIA GeForce RTX 3050 4GB Laptop GPU | Dell Inspiron 14 7420 2-in-1 Intel Core i7-1255U, Intel Iris Xe Graphics G7 96EUs | Schenker Vision 14 Intel Core i7-11370H, NVIDIA GeForce RTX 3050 Ti Laptop GPU | Asus Zenbook 14X UX5400E Intel Core i7-1165G7, NVIDIA GeForce MX450 | MSI Summit E14 A11SCS Intel Core i7-1185G7, NVIDIA GeForce GTX 1650 Ti Max-Q | HP Envy 14-eb0010nr Intel Core i5-1135G7, NVIDIA GeForce GTX 1650 Ti Max-Q | |
|---|---|---|---|---|---|---|---|
| Heat | -25% | -5% | -23% | -17% | -33% | -19% | |
| Maximum Upper Side * (°C) | 40 | 42.3 -6% | 38.2 4% | 49.7 -24% | 42.4 -6% | 49.4 -23% | 41.2 -3% |
| Maximum Bottom * (°C) | 36.4 | 49.6 -36% | 45.6 -25% | 56 -54% | 47.7 -31% | 60.6 -66% | 45.6 -25% |
| Idle Upper Side * (°C) | 27 | 34.2 -27% | 27.4 -1% | 28.8 -7% | 32.3 -20% | 30.6 -13% | 31.8 -18% |
| Idle Bottom * (°C) | 29.2 | 37.9 -30% | 28.4 3% | 30.6 -5% | 31.9 -9% | 37.4 -28% | 37.8 -29% |
* ... más pequeño es mejor
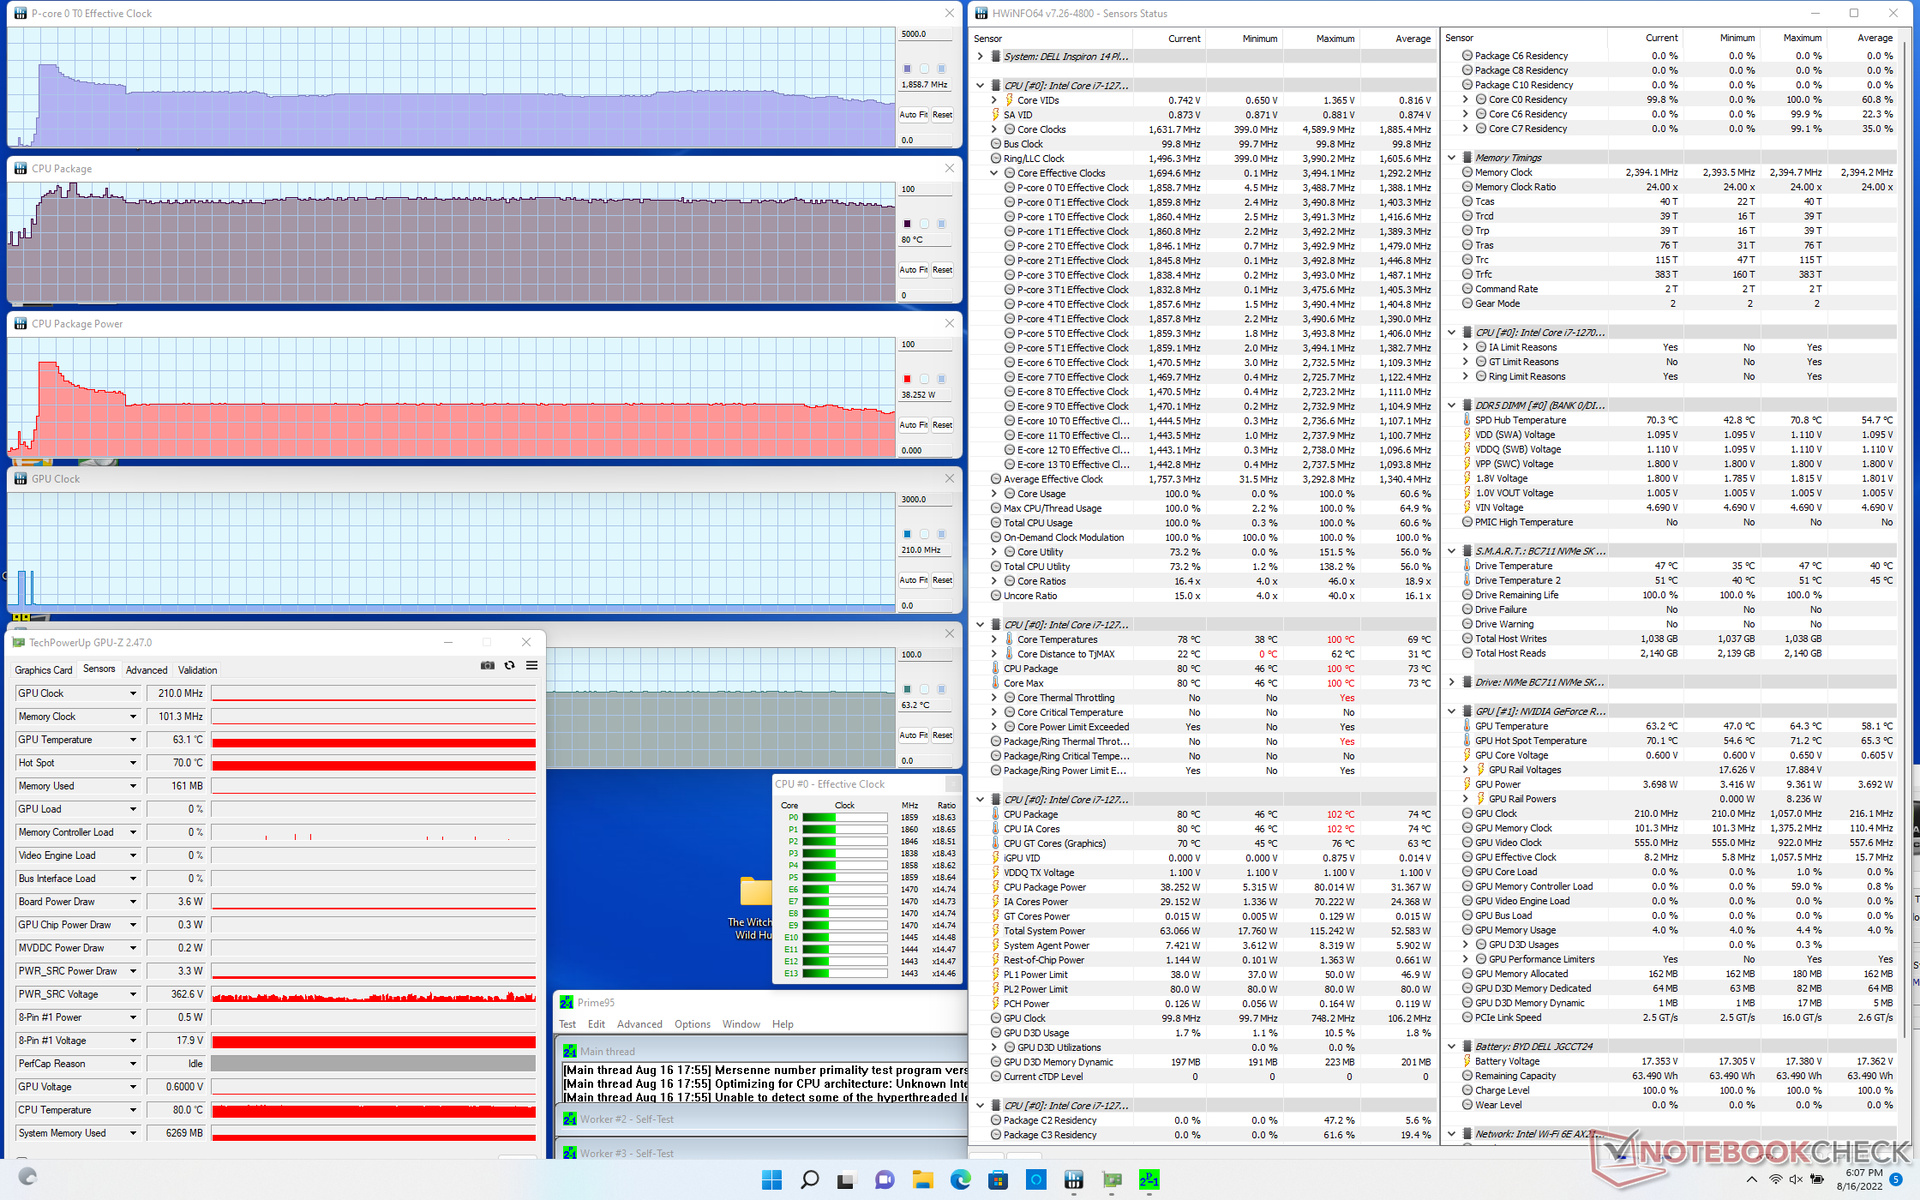
Prueba de esfuerzo
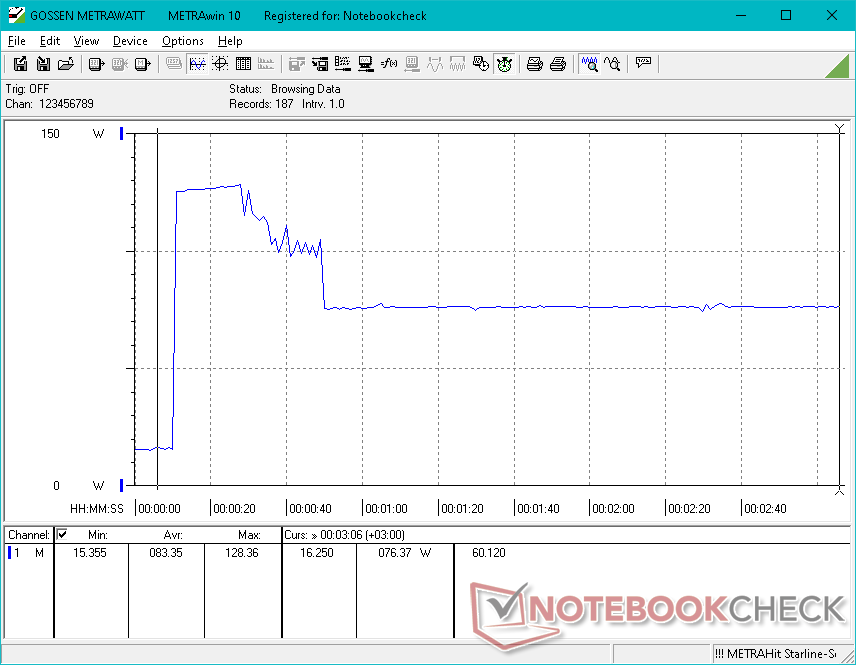
Si se ejecuta Prime95 para estresar la CPU, la velocidad de reloj, la temperatura y el consumo de energía de la placa se disparan a 3,5 GHz, 100 C y 80 W, respectivamente, durante unos 10 segundos. A partir de entonces, las velocidades de reloj, la temperatura y el consumo de energía de la placa disminuyen de forma constante antes de estabilizarse en 1,9 GHz, 80 C y 38 W, respectivamente, para mantener las temperaturas bajo control. La caída del rendimiento es relativamente pronunciada, ya que el HP Pavilion Plus 14 con la misma CPU es capaz de mantener un rango más rápido de 2,2 a 2,9 GHz cuando se somete a la misma prueba.
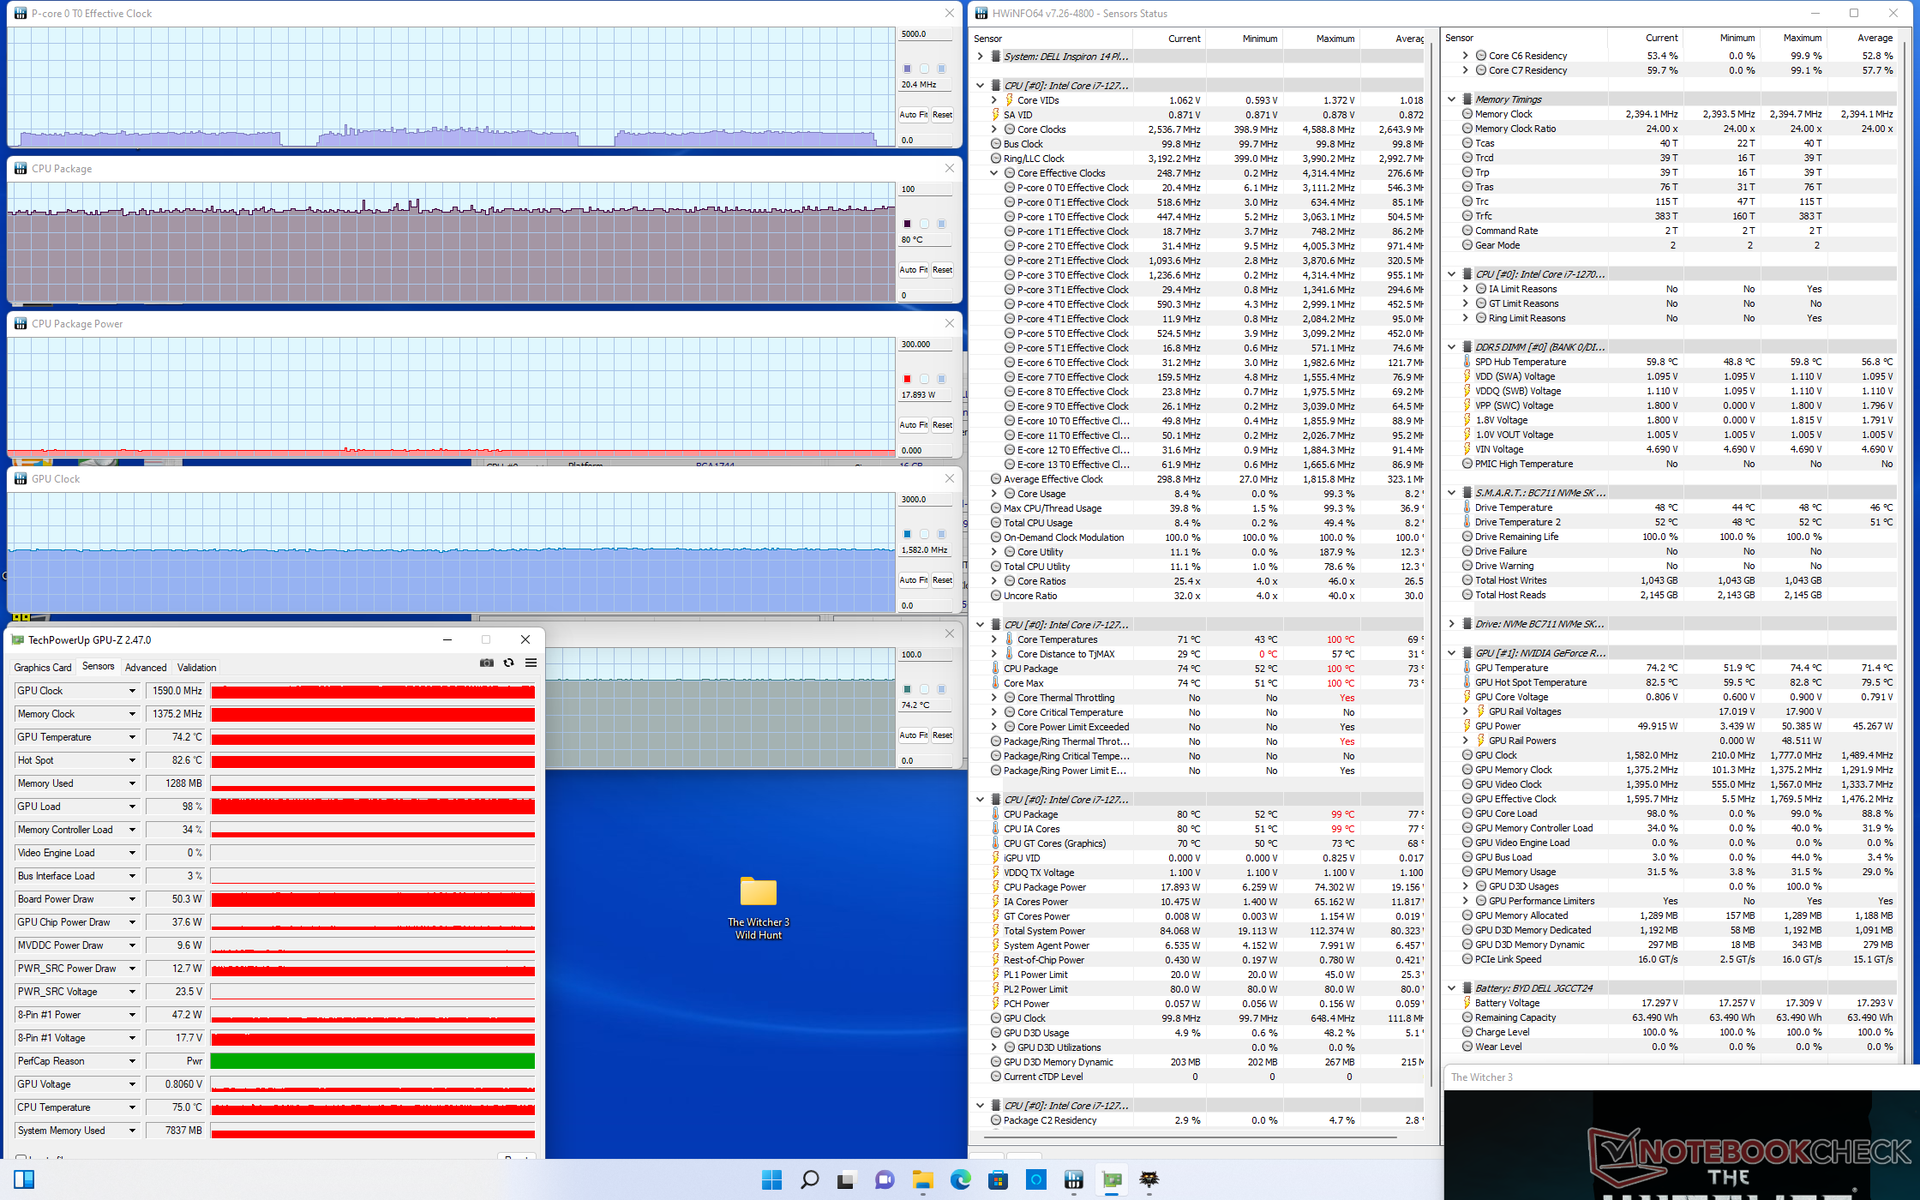
Al ejecutar Witcher 3 muestra que la GPU GeForce se estabiliza a 1590 MHz, 74 C y 50 W. En comparación, la RTX 3050 Ti del Inspiron 16 Plus, de mayor tamaño, se estabilizaría a 1627 MHz, 84 C y 63 W. Las temperaturas del núcleo no son sorprendentemente altas, ya que este es uno de los pocos portátiles de 14 pulgadas que vienen con una CPU de la serie H y una GPU RTX GeForce. Cambiar el perfil de energía de Ultra Performance a Optimized reducirá el consumo de energía de la GPU a unos 45 W o menos.
El uso de la batería limita el rendimiento. Una prueba de Fire Strike con baterías arrojaría unas puntuaciones de Física y Gráficos de sólo 9493 y 7637 puntos, respectivamente, en comparación con los 26940 y 12125 puntos de la red eléctrica.
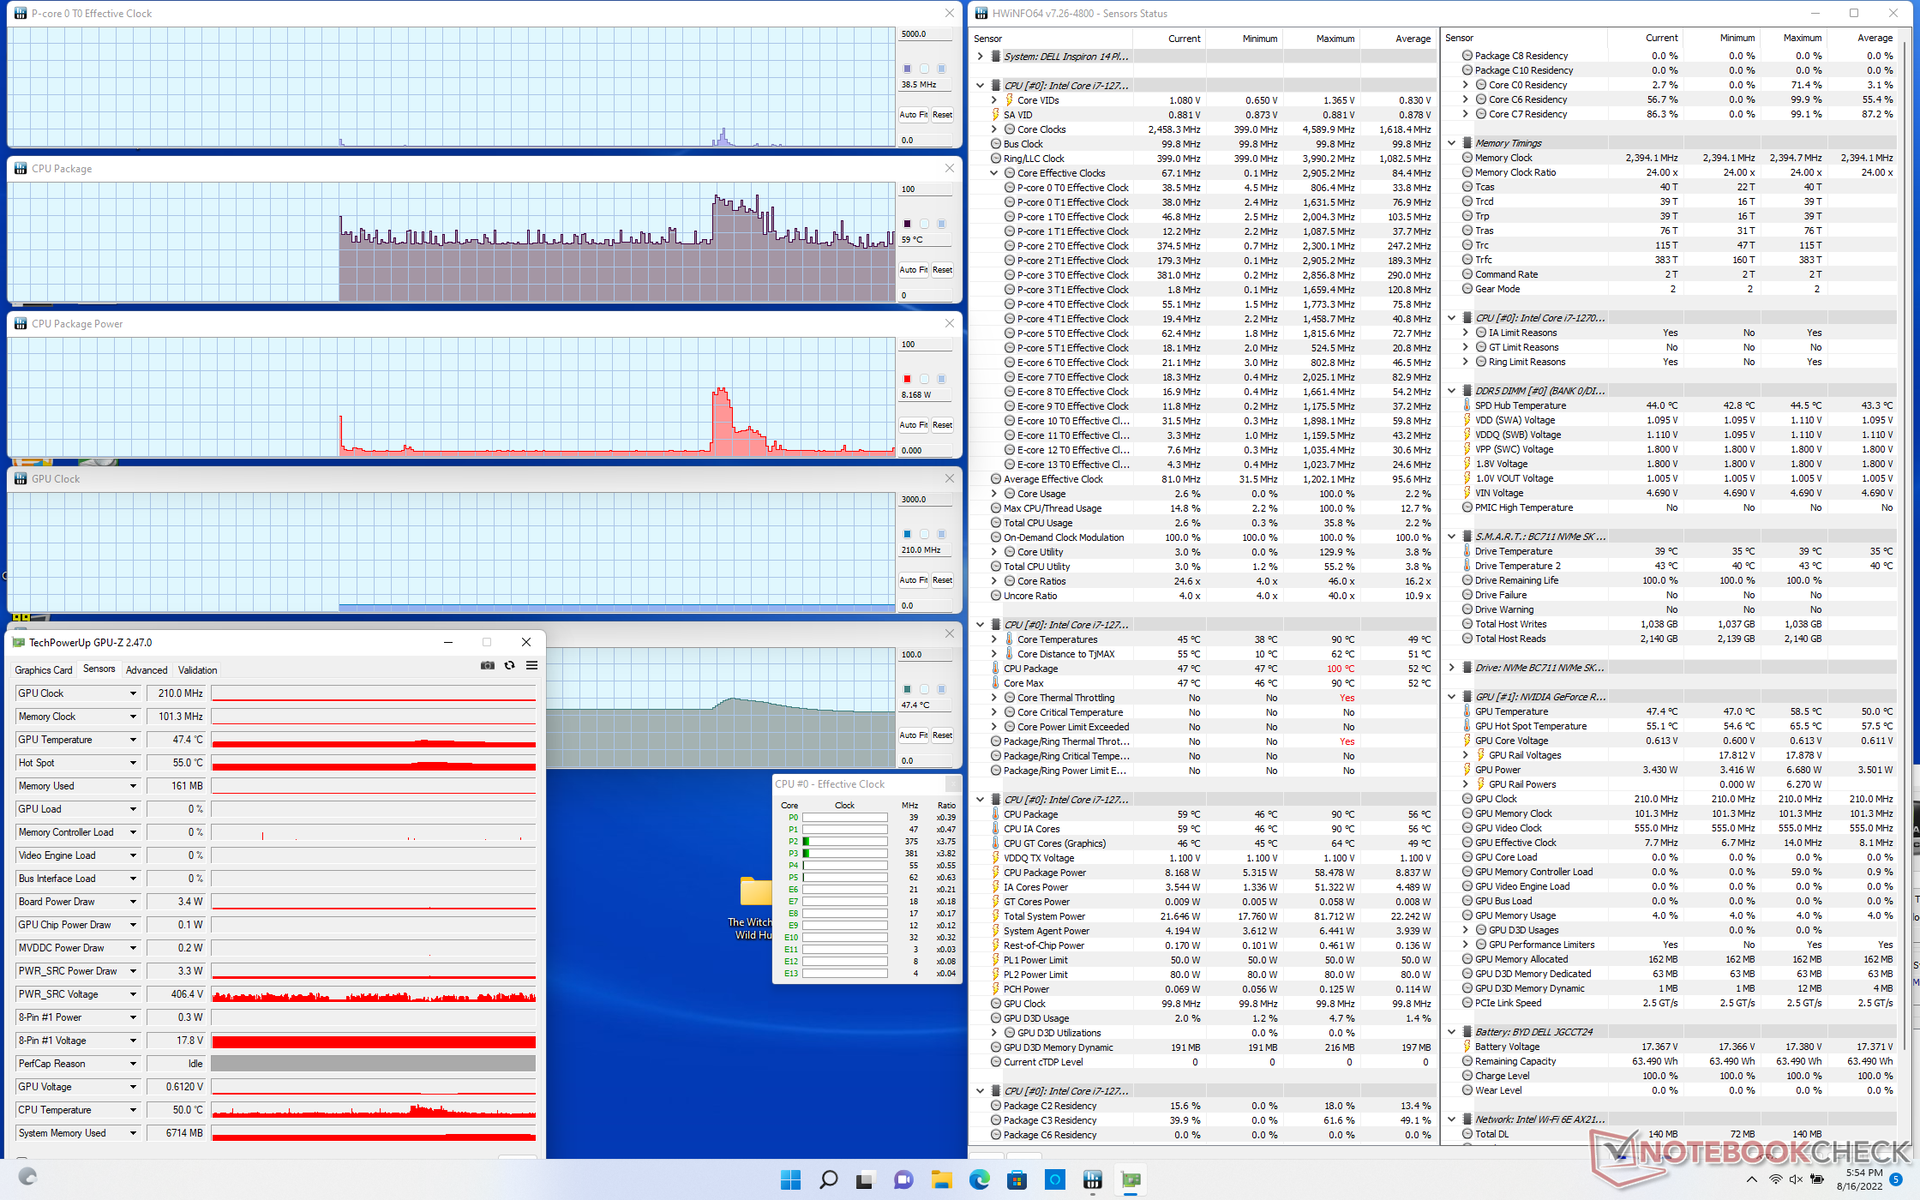
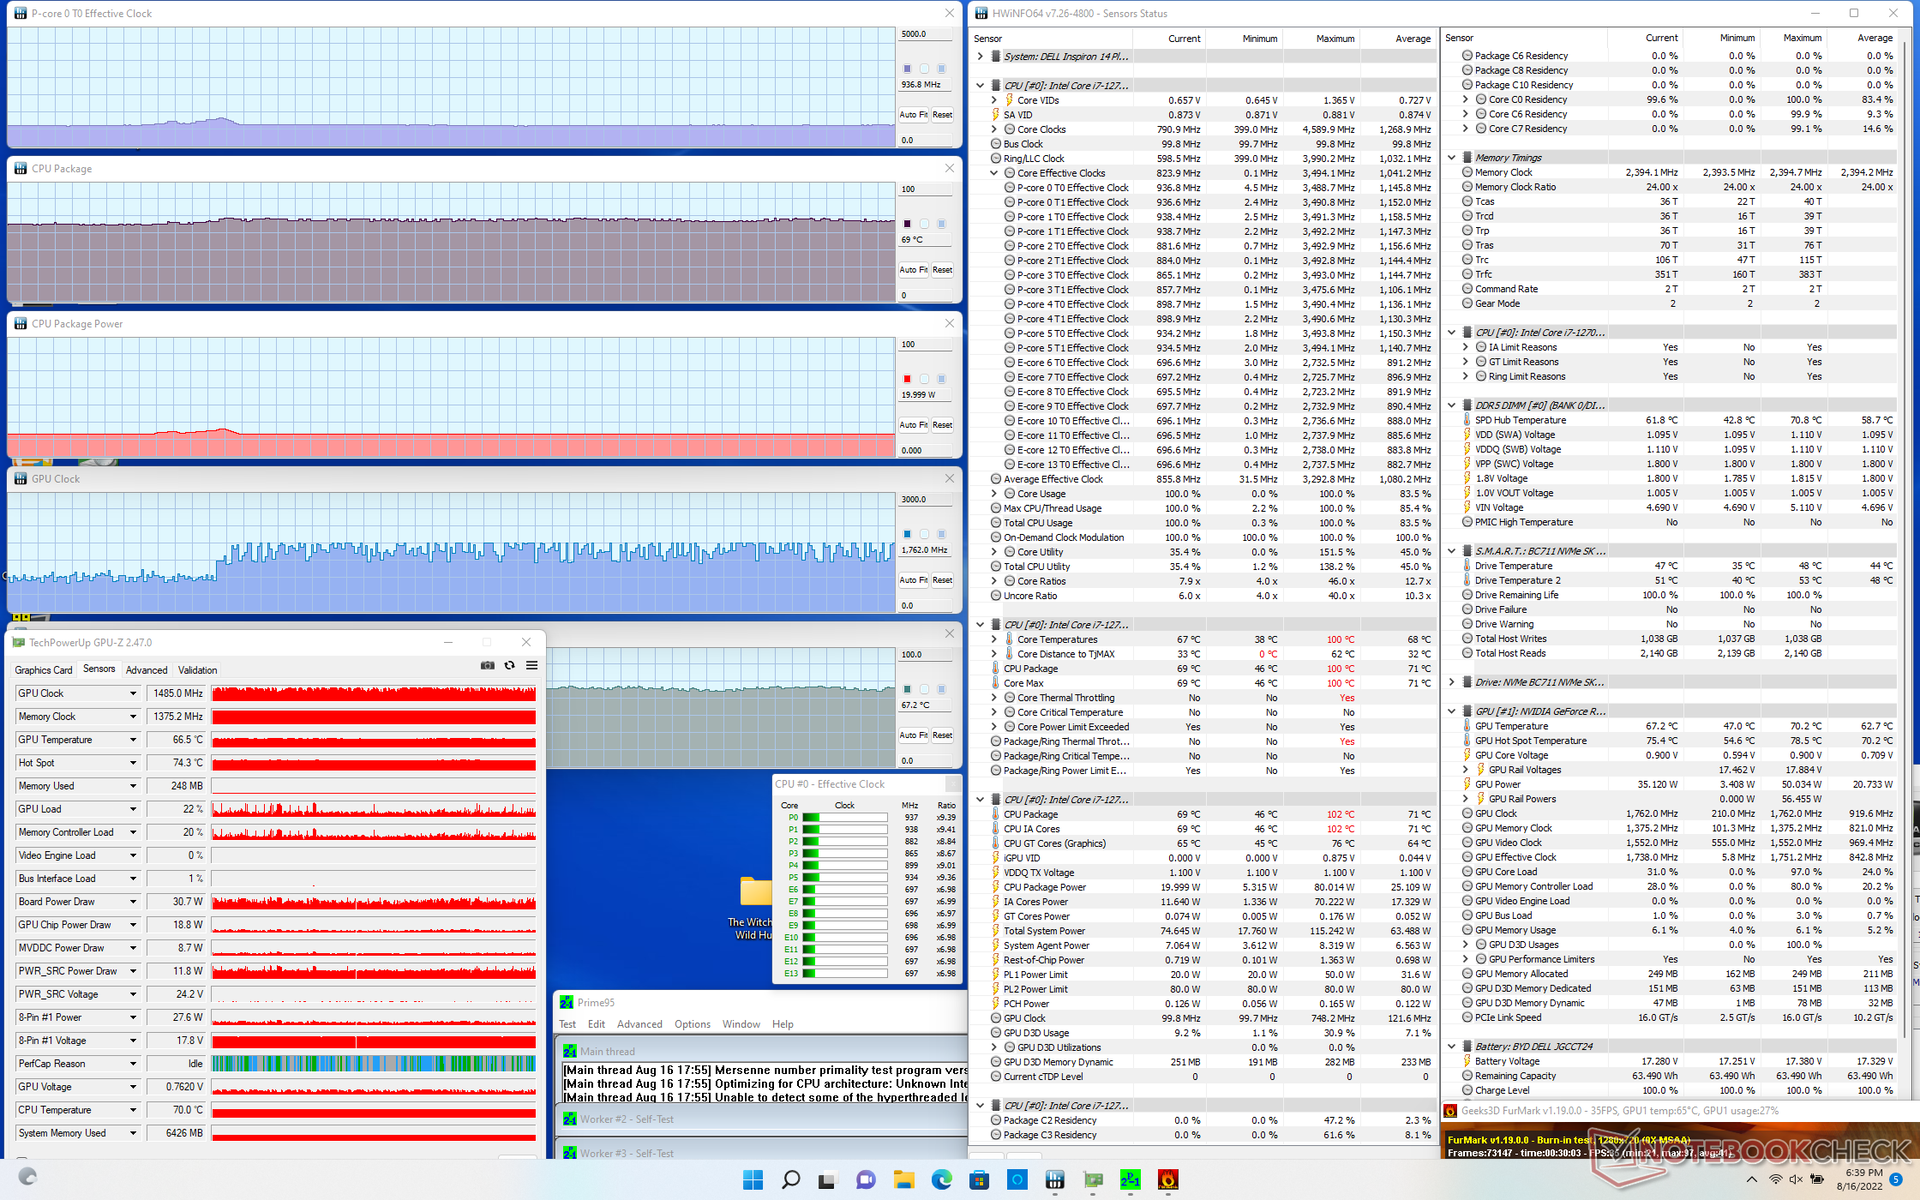
| Reloj dela CPU (GHz) | Reloj de la GPU (MHz) | Temperatura media dela CPU (°C) | Temperatura media de la GPU (°C) | |
| Sistema en reposo | -- | -- | 59 | 47 |
| Prime95Stress | 1.9 | -- | 80 | 63 |
| Prime95+ FurMark Stress | 0,9 | ~1485 | 69 | 67 |
| Witcher 3 Stress | ~1,1 | 1590 | 80 | 74 |
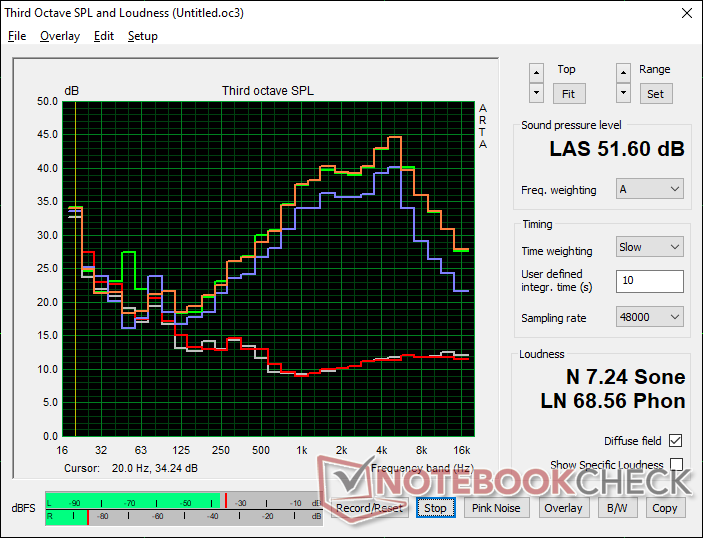
Altavoces
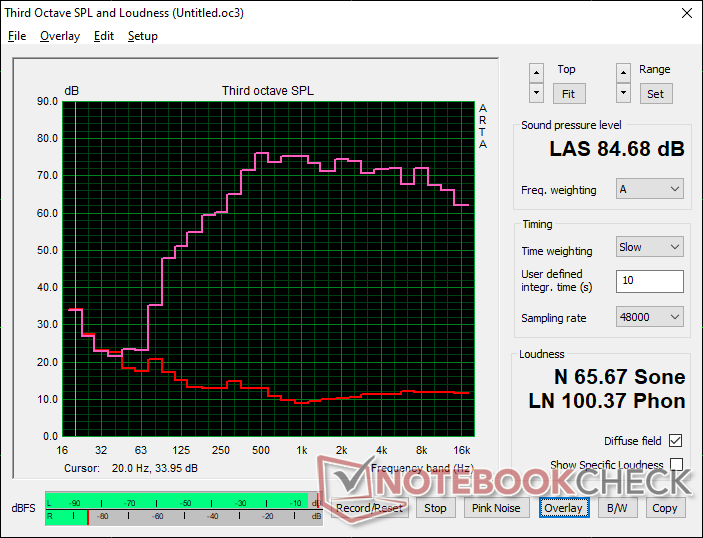
Dell Inspiron 14 Plus 7420 análisis de audio
(+) | los altavoces pueden reproducir a un volumen relativamente alto (#84.7 dB)
Graves 100 - 315 Hz
(±) | lubina reducida - en promedio 14.7% inferior a la mediana
(±) | la linealidad de los graves es media (8.3% delta a frecuencia anterior)
Medios 400 - 2000 Hz
(+) | medios equilibrados - a sólo 2.6% de la mediana
(+) | los medios son lineales (4.8% delta a la frecuencia anterior)
Altos 2 - 16 kHz
(+) | máximos equilibrados - a sólo 1.8% de la mediana
(+) | los máximos son lineales (4.4% delta a la frecuencia anterior)
Total 100 - 16.000 Hz
(+) | el sonido global es lineal (10.4% de diferencia con la mediana)
En comparación con la misma clase
» 15% de todos los dispositivos probados de esta clase eran mejores, 1% similares, 84% peores
» El mejor tuvo un delta de 5%, la media fue 17%, el peor fue ###max##%
En comparación con todos los dispositivos probados
» 5% de todos los dispositivos probados eran mejores, 1% similares, 93% peores
» El mejor tuvo un delta de 4%, la media fue 23%, el peor fue ###max##%
Apple MacBook Pro 16 2021 M1 Pro análisis de audio
(+) | los altavoces pueden reproducir a un volumen relativamente alto (#84.7 dB)
Graves 100 - 315 Hz
(+) | buen bajo - sólo 3.8% lejos de la mediana
(+) | el bajo es lineal (5.2% delta a la frecuencia anterior)
Medios 400 - 2000 Hz
(+) | medios equilibrados - a sólo 1.3% de la mediana
(+) | los medios son lineales (2.1% delta a la frecuencia anterior)
Altos 2 - 16 kHz
(+) | máximos equilibrados - a sólo 1.9% de la mediana
(+) | los máximos son lineales (2.7% delta a la frecuencia anterior)
Total 100 - 16.000 Hz
(+) | el sonido global es lineal (4.6% de diferencia con la mediana)
En comparación con la misma clase
» 0% de todos los dispositivos probados de esta clase eran mejores, 0% similares, 100% peores
» El mejor tuvo un delta de 5%, la media fue 17%, el peor fue ###max##%
En comparación con todos los dispositivos probados
» 0% de todos los dispositivos probados eran mejores, 0% similares, 100% peores
» El mejor tuvo un delta de 4%, la media fue 23%, el peor fue ###max##%
Gestión de la energía - Pequeña máquina exigente
Consumo de energía
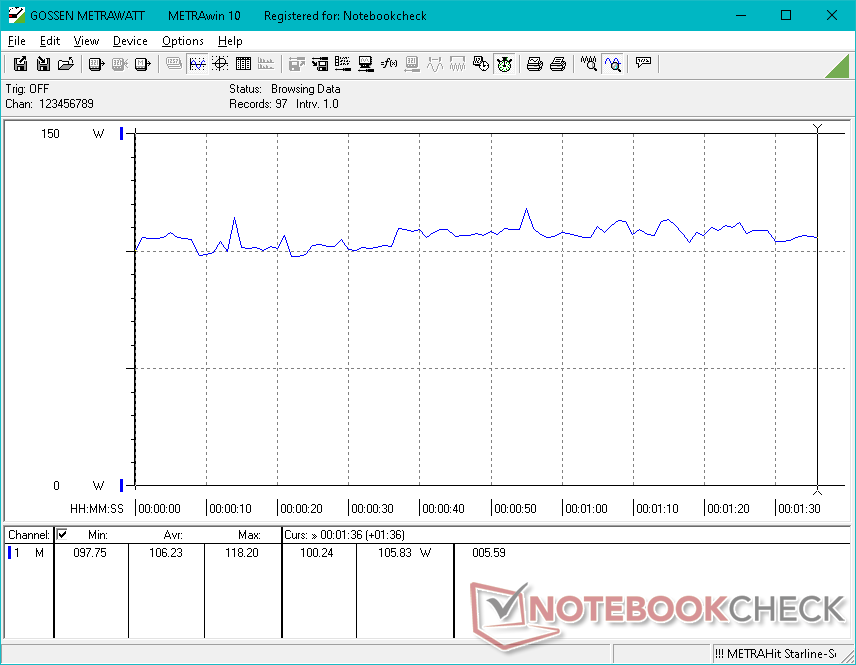
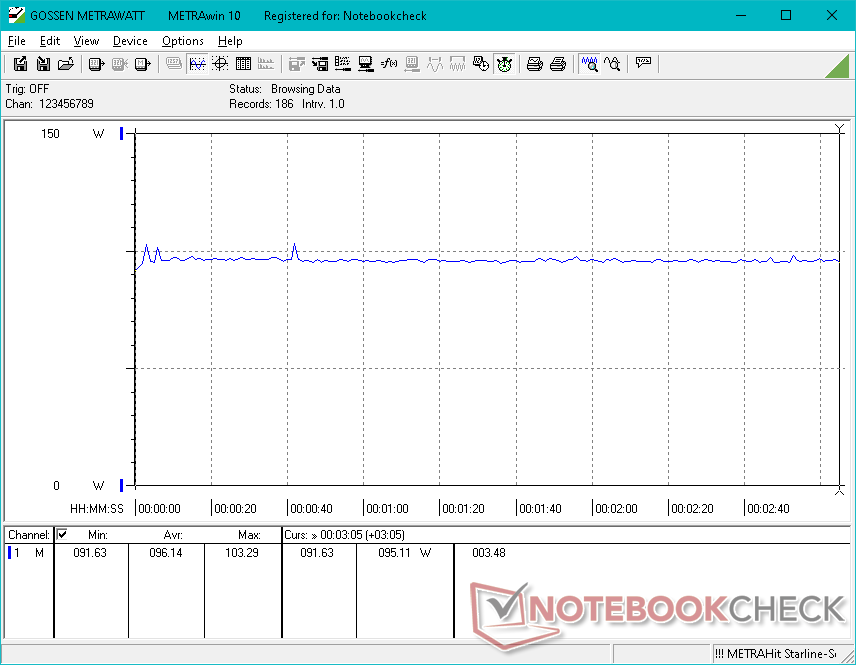
El consumo de energía en el modo de ahorro de energía oscila entre 6 W si está en el ajuste de brillo mínimo y 10 W si está en el ajuste máximo. Si se cambia el perfil de energía al modo de Ultra Rendimiento con la GPU Nvidia activa, el consumo de energía en reposo asciende a 20 W, que es aproximadamente el doble que el de la mayoría de los portátiles de 14 pulgadas más lentos equipados con CPU de la serie U
Los juegos exigen entre 96 y 106 W en comparación con los 40 ó 50 W de las alternativas tradicionales de la serie U. Se sabe que la serie H de Intel de 12ª generación es muy exigente, además de una GPU discreta ya exigente. Por lo tanto, no es de extrañar que el Inspiron 14 Plus funcione a la vez más fuerte y más caliente que la media de los portátiles de 14 pulgadas
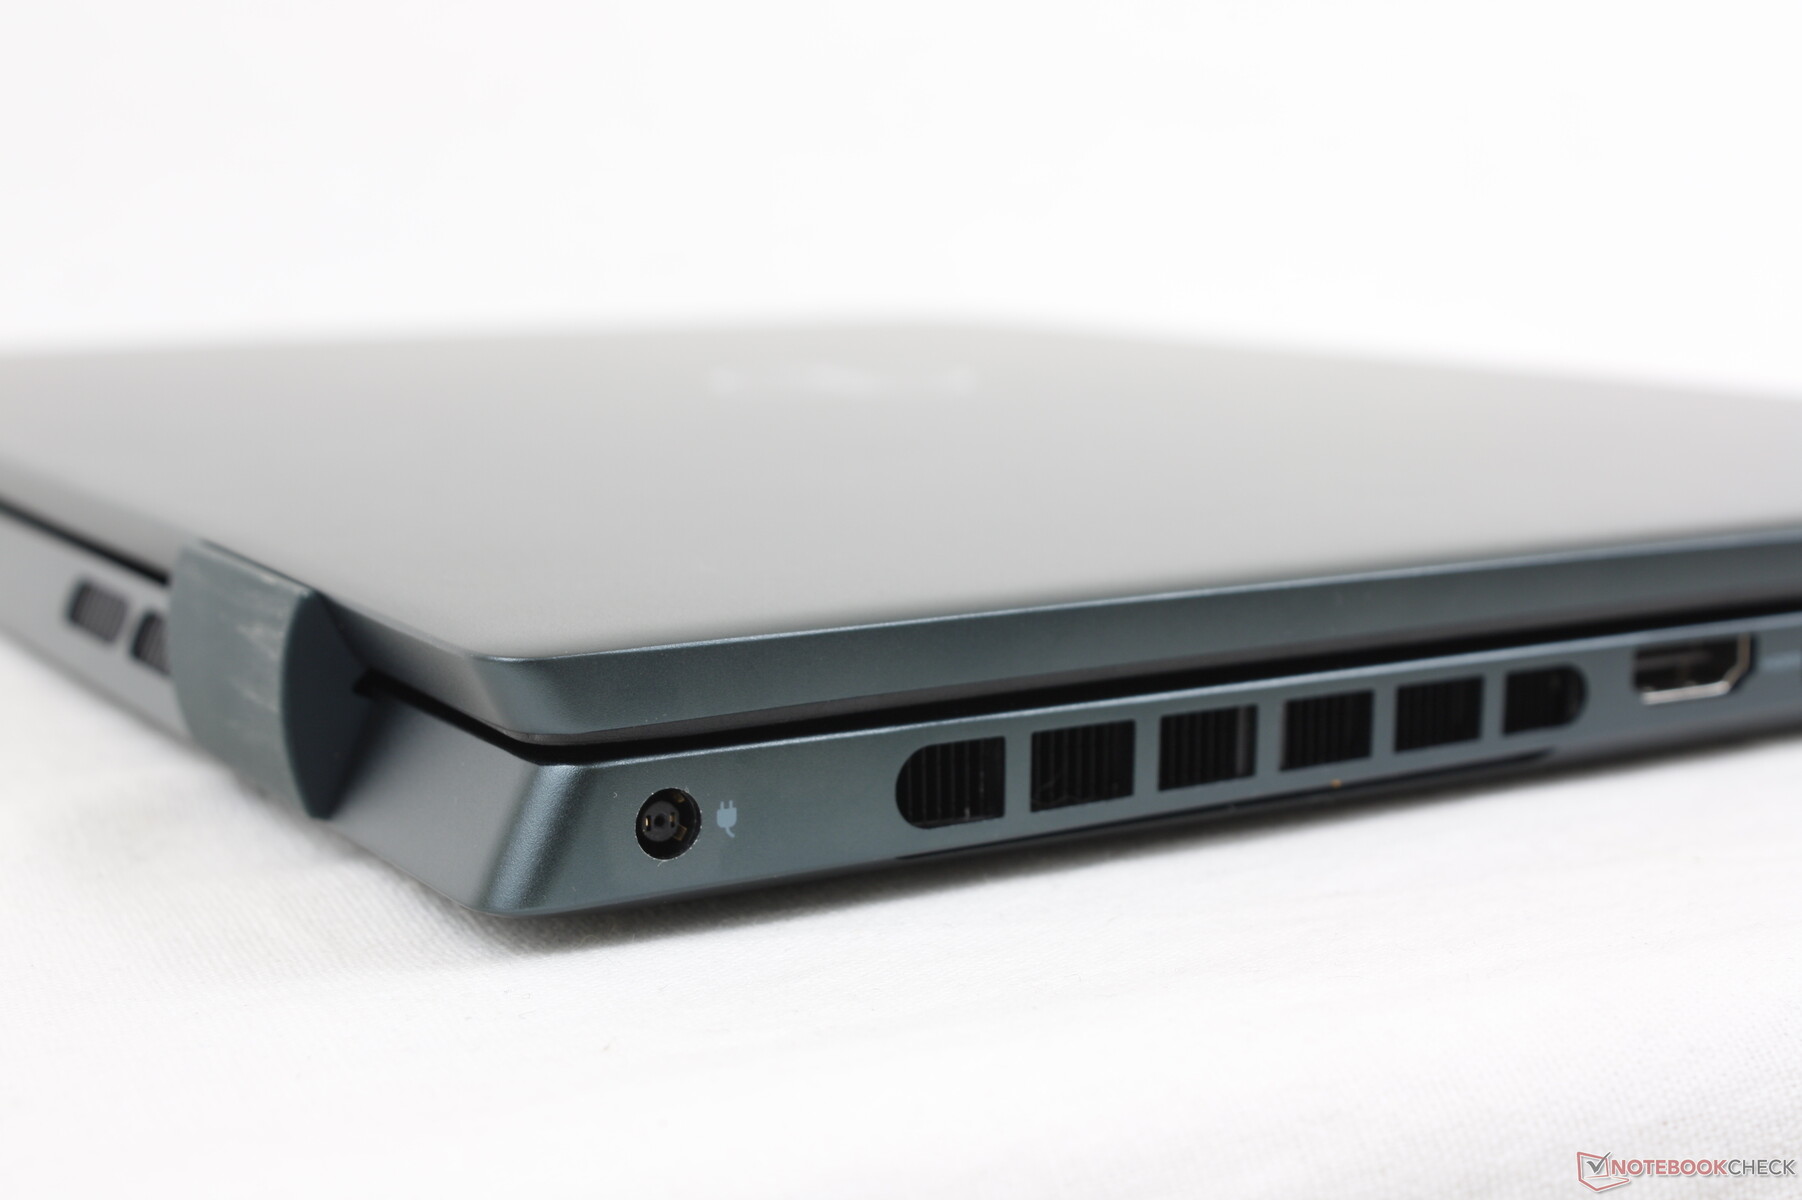
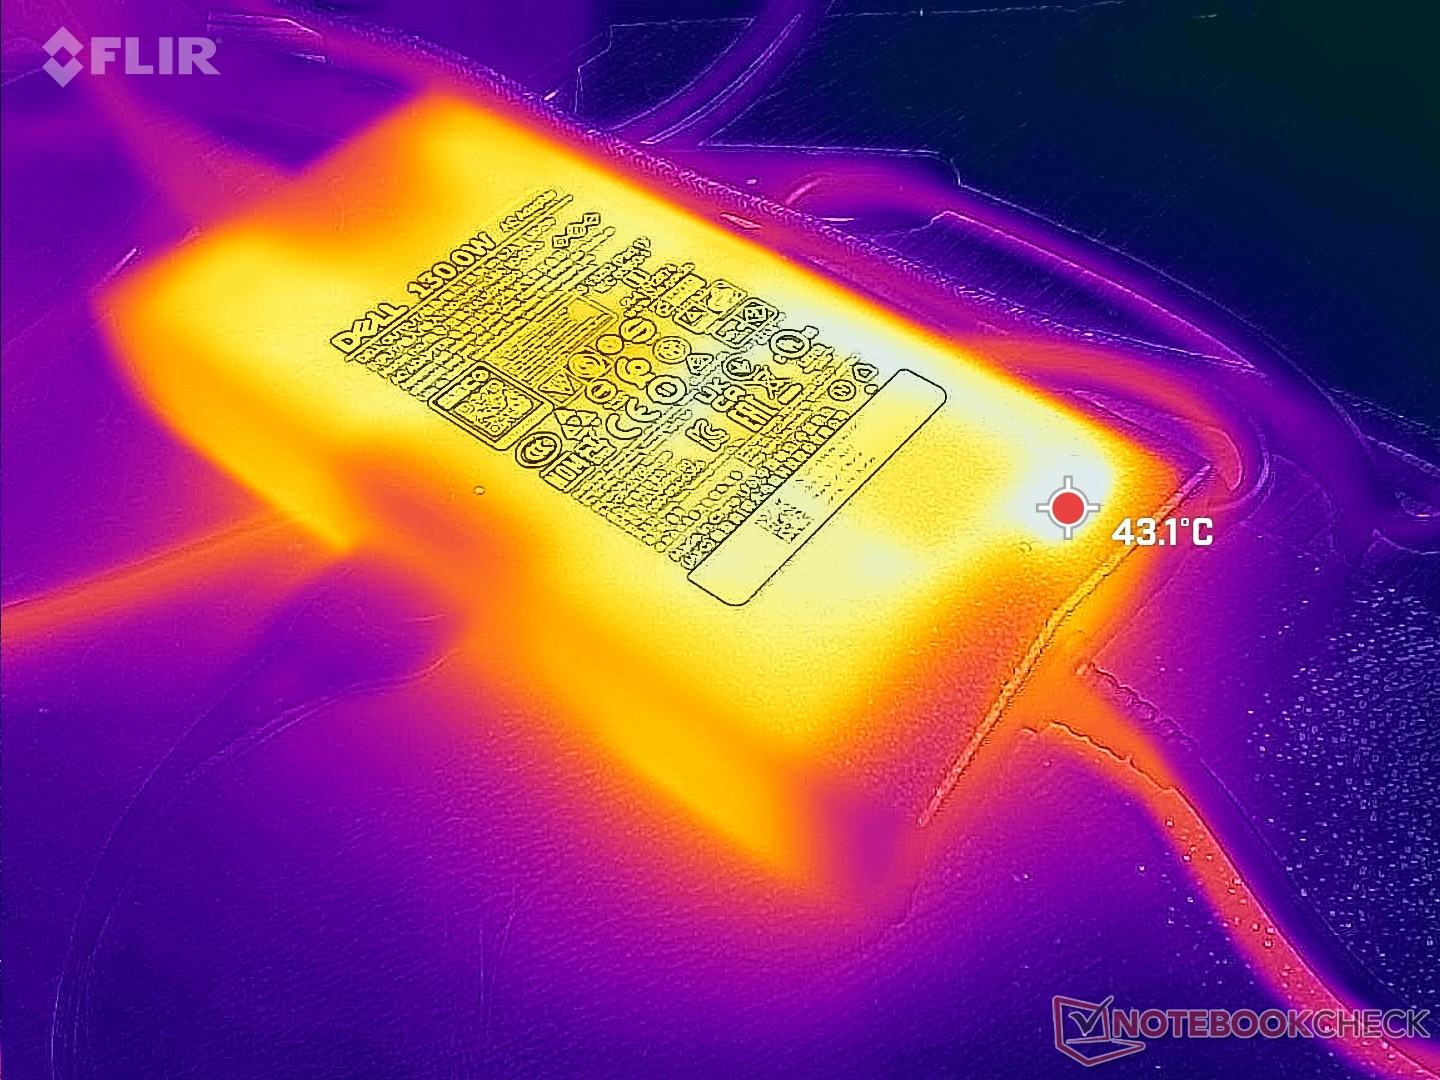
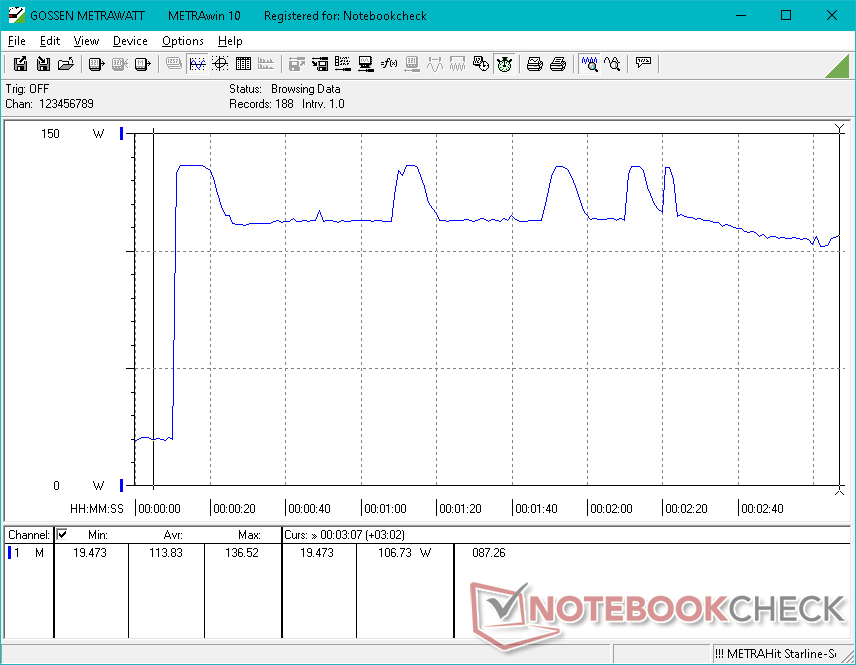
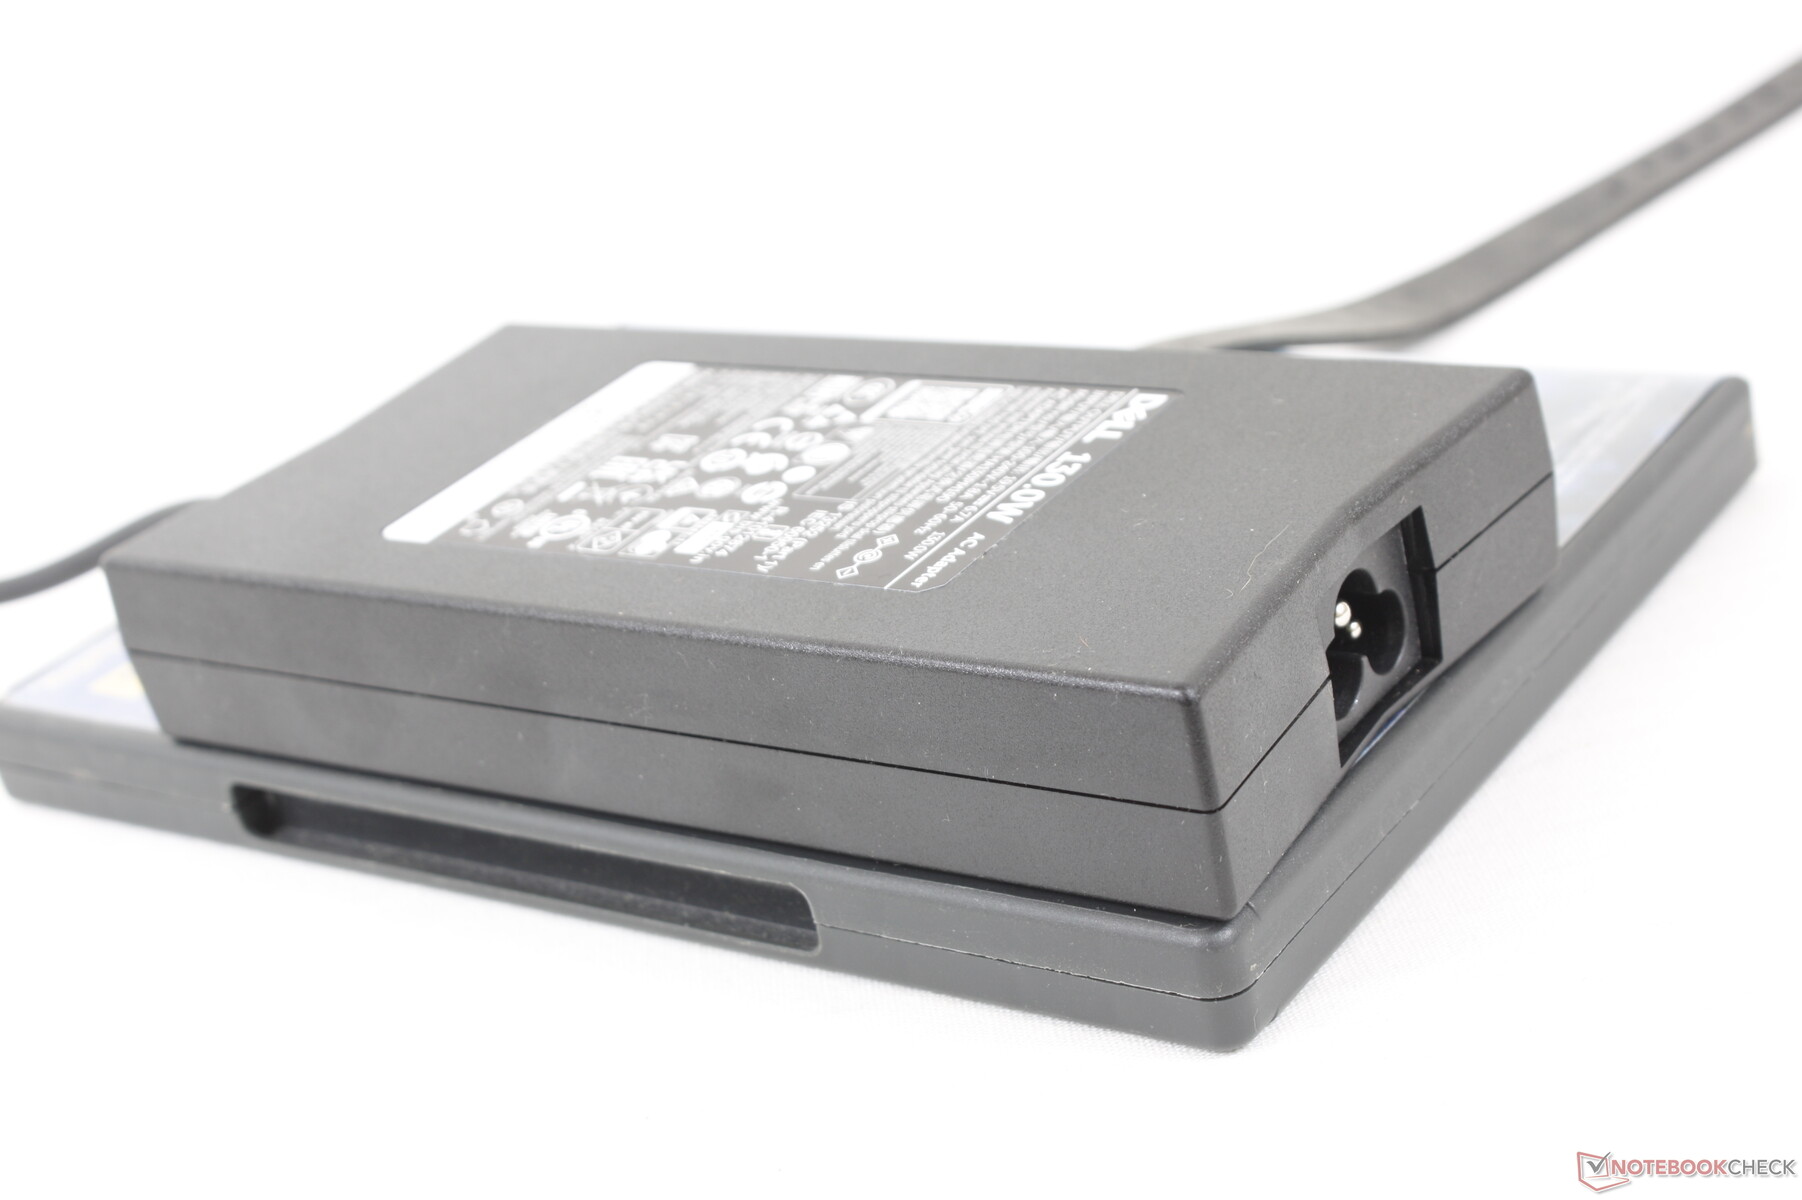
Registramos un consumo máximo de 137 W con el adaptador de CA de 130 W de tamaño medio (~15,3 x 7,5 x 2,6 cm) al ejecutar Prime95 y FurMark simultáneamente. El consumo tiende a oscilar entre 110 W y 137 W, como muestra nuestra captura de pantalla de abajo. Es de esperar que la tasa de carga sea más lenta si se ejecutan cargas tan exigentes.
| Off / Standby | |
| Ocioso | |
| Carga |
|
Clave:
min: | |
| Dell Inspiron 14 Plus 7420 i7-12700H, GeForce RTX 3050 4GB Laptop GPU, SK Hynix BC711 512GB HFM512GD3GX013N, IPS, 2240x1400, 14" | Asus Vivobook Pro 14 M3401QC-KM007T R5 5600H, GeForce RTX 3050 4GB Laptop GPU, Intel SSD 670p SSDPEKNU512GZ, OLED, 2880x1800, 14" | Dell Inspiron 14 7420 2-in-1 i7-1255U, Iris Xe G7 96EUs, WDC PC SN530 SDBPMPZ-512G, IPS, 1920x1200, 14" | Schenker Vision 14 i7-11370H, GeForce RTX 3050 Ti Laptop GPU, Samsung SSD 980 Pro 1TB MZ-V8P1T0BW, IPS, 2880x1800, 14" | Asus Zenbook 14X UX5400E i7-1165G7, GeForce MX450, SK Hynix HFM001TD3JX013N, OLED, 2880x1800, 14" | MSI Summit E14 A11SCS i7-1185G7, GeForce GTX 1650 Ti Max-Q, Phison 1TB SM2801T24GKBB4S-E162, IPS, 3840x2160, 14" | HP Envy 14-eb0010nr i5-1135G7, GeForce GTX 1650 Ti Max-Q, Samsung SSD PM981a MZVLB256HBHQ, IPS, 1920x1200, 14" | |
|---|---|---|---|---|---|---|---|
| Power Consumption | 22% | 44% | 8% | 24% | -10% | 5% | |
| Idle Minimum * (Watt) | 6.3 | 6.6 -5% | 5.2 17% | 6.7 -6% | 7.2 -14% | 9.9 -57% | 4.2 33% |
| Idle Average * (Watt) | 10.3 | 9.6 7% | 8.2 20% | 12.6 -22% | 10.4 -1% | 17.4 -69% | 18.3 -78% |
| Idle Maximum * (Watt) | 20 | 7.3 63% | 9.9 50% | 15.4 23% | 11 45% | 22.5 -13% | 19.2 4% |
| Load Average * (Watt) | 106.2 | 73 31% | 44.4 58% | 85.7 19% | 61.7 42% | 85.6 19% | 72.9 31% |
| Witcher 3 ultra * (Watt) | 96.1 | 74.4 23% | 35 64% | 83 14% | 53.6 44% | 70.9 26% | 61.5 36% |
| Load Maximum * (Watt) | 136.5 | 119 13% | 62.5 54% | 110.9 19% | 96 30% | 91.1 33% | 127.8 6% |
* ... más pequeño es mejor
Power Consumption Witcher 3 / Stresstest
Power Consumption external Monitor
Duración de la batería
Los tiempos de ejecución son mejores de lo esperado, con más de 7 horas de uso real de la WLAN, lo que está muy cerca de lo que registramos en el Inspiron 14 7420 2 en 1, más lento y sin gráficos dedicados. Sin embargo, hay que tener en cuenta que nuestros resultados reflejan sólo la configuración de 64 Wh y no la configuración menor de 54 Wh que debería tener una duración de la batería ligeramente menor.
La carga de vacío a plena capacidad con el adaptador de CA de barril incluido tarda unas 2 horas. Se puede cargar con adaptadores USB-C de terceros.
| Dell Inspiron 14 Plus 7420 i7-12700H, GeForce RTX 3050 4GB Laptop GPU, 64 Wh | Asus Vivobook Pro 14 M3401QC-KM007T R5 5600H, GeForce RTX 3050 4GB Laptop GPU, 63 Wh | Dell Inspiron 14 7420 2-in-1 i7-1255U, Iris Xe G7 96EUs, 54 Wh | Schenker Vision 14 i7-11370H, GeForce RTX 3050 Ti Laptop GPU, 53 Wh | Asus Zenbook 14X UX5400E i7-1165G7, GeForce MX450, 63 Wh | MSI Summit E14 A11SCS i7-1185G7, GeForce GTX 1650 Ti Max-Q, 52 Wh | HP Envy 14-eb0010nr i5-1135G7, GeForce GTX 1650 Ti Max-Q, 63.3 Wh | |
|---|---|---|---|---|---|---|---|
| Duración de Batería | 47% | 58% | 16% | 65% | -24% | 83% | |
| Reader / Idle (h) | 11.9 | 11.5 -3% | 15.9 34% | 34 186% | 6.6 -45% | 27.7 133% | |
| WiFi v1.3 (h) | 7.2 | 9.5 32% | 7.6 6% | 5.5 -24% | 5.4 -25% | 4.5 -37% | 10.8 50% |
| Load (h) | 0.9 | 1.9 111% | 2.1 133% | 1.4 56% | 1.2 33% | 1 11% | 1.5 67% |
| H.264 (h) | 6.8 |
Pro
Contra
Veredicto - Rendimiento de talla grande, peso de talla grande
Si quieres maximizar el rendimiento de la CPU y la GPU en tu próximo portátil de 14 pulgadas, considera el más caro Razer Blade 14 o Asus Zephyrus G14. Si buscas un Ultrabook de 14 pulgadas fino y ligero, el Asus Zenbook 14 o LG Gram 14 pueden ser mejores opciones. Sin embargo, para obtener lo mejor de ambos mundos, el Dell Inspiron 14 Plus 7420 se mueve en una fina línea entre el rendimiento extremo y la portabilidad, manteniendo los precios a niveles razonables. Los viajeros frecuentes que dependen del rendimiento más allá de lo que puede ofrecer la serie Core U y la serie de gráficos integrados encontrarán en el Dell una solución sólida.
Meter tanta potencia en un chasis de 14 pulgadas conlleva los inconvenientes habituales: temperaturas más altas, mayor ruido de los ventiladores, mayor peso y mayor consumo de energía que la mayoría de los portátiles de la categoría de 14 pulgadas. De estas cuatro desventajas, creemos que el peso es el que más podría mejorarse, ya que la competenciaAsus Vivobook Pro 14 viene con CPUs de la serie H de AMD y la misma GPU GeForce RTX 3050 y pesa un par de cientos de gramos menos. Los ventiladores son, al menos, excelentes para permanecer en silencio durante las cargas de procesamiento más bajas, por lo que sólo son ruidosos cuando se ejecutan aplicaciones exigentes.
El Inspiron 14 Plus 7420 puede ser pesado, pero hará el trabajo a mayor velocidad que el típico Ultrabook.
Otros inconvenientes son el esponjoso clickpad y la tapa flexible. Para un portátil de 14 pulgadas tan pesado, se habría agradecido una tapa más rígida. La ventaja de rendimiento sobre la mayoría de portátiles de 14 pulgadas de este rango de precios es, por lo demás, el principal punto fuerte del sistema.
Precio y disponibilidad
El clamshell Inspiron 14 Plus 7420 ya está a la venta en Amazon y Newegg Por 1300 y 1400 dólares, respectivamente. Sin embargo, las configuraciones están actualmente limitadas a los gráficos integrados solamente. Recomendamos comprar directamente a Dell si quieres la SKU GeForce RTX 3050.
Dell Inspiron 14 Plus 7420
- 08/30/2022 v7 (old)
Allen Ngo
Price comparison

