Análisis del portátil Asus ROG Flow X16: 2 en 1 para jugadores con mini-LED
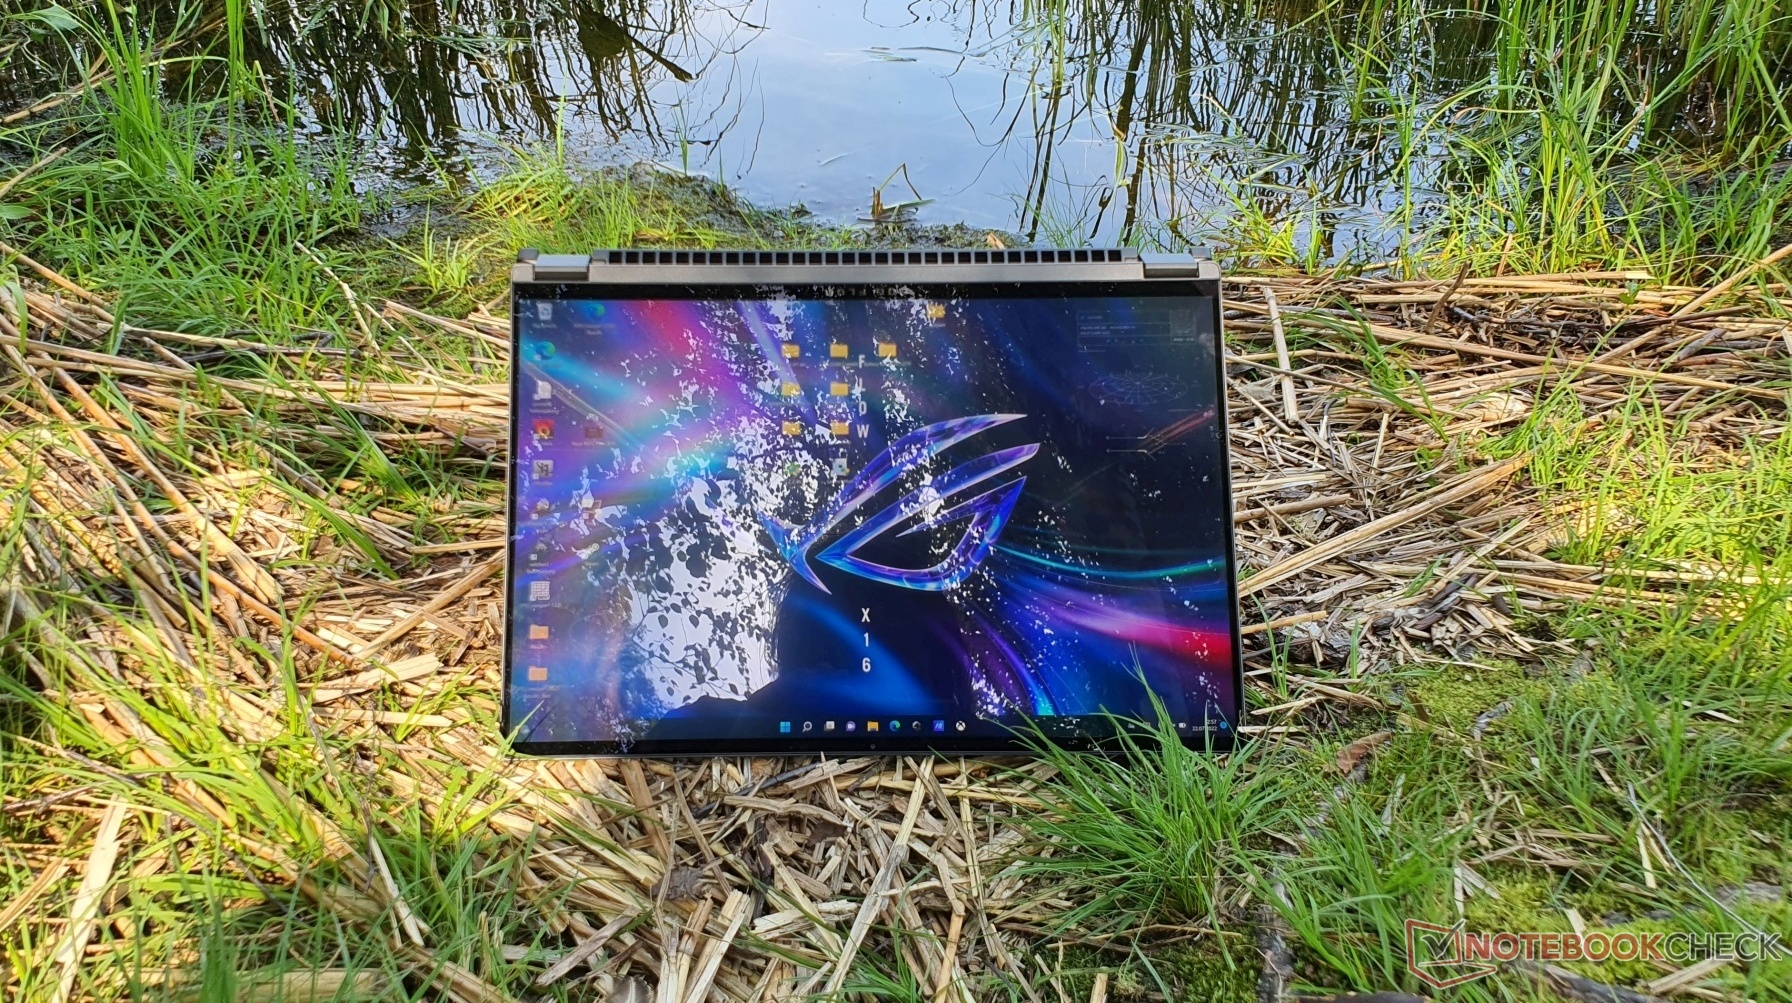
Una pantalla mini-LED de 1.100 nit hace su debut en el Asus ROG Flow X16, que también deriva su singularidad de su diseño convertible. Una RTX 3070 Ti con un TGP de 125 vatios lo convierte en un auténtico portátil para juegos con características multimedia de alta gama muy esperadas por muchos.
Hemos podido examinar a fondo un dispositivo de muestra de preproducción en detalle. Como este modelo de revisión es representativo del modelo de producción (según Asus), nos hemos tomado la libertad de darle una calificación. Se esperan pequeños cambios en el dispositivo hasta la versión final de producción, que se reflejarán en consecuencia en las actualizaciones de este análisis.GeForce También estamos revisando la base gráfica ROG XG Mobile (disponible por separado) con su GPU RTX 3080 Laptop en el Flow X16 (una prueba similar también se llevó a cabo con el ROG Flow X13 el año pasado), y proporcionaremos los resultados como una actualización en esta revisión pronto.
El Asus ROG Flow X16 forma parte de la serie de portátiles para juegos 2 en 1 de Asus junto con su popular y casi igual de único hermano, elROG Flow X13del año pasado, así como el ROG Flow Z13 (tableta 2 en 1)la pantalla QHD de 16 pulgadas en formato 16:10 ofrece un nivel de negro similar al de un OLED gracias al mini-LED y también anuncia la cobertura del espacio de color DCI-P3 para la edición profesional de imágenes. La pantalla táctil con soporte de entrada de lápiz es posiblemente útil para el trabajo creativo, y Ryzen 6900HS de AMD también promete mucho potencial. Si bien todas estas especificaciones son maravillosas sobre el papel, nuestro análisis revela hasta qué punto esta potencia bruta puede aprovecharse al máximo en el compacto convertible de Asus y cuáles pueden ser los inconvenientes
Nuestro modelo de muestra del Asus Rog Flow X16 con una Nvidia GeForce RTX 3070 Ti, 32 GB de RAM y un SSD de 1 TB aún no parece estar disponible. Dependiendo de tu ubicación, puede haber configuraciones idénticas (es decir, hardware idéntico con una distribución de teclado específica de la región) o ligeramente diferentes a distintos precios, que suelen empezar en torno a los 2500 dólares. Para más información, consulte el apartado "Precio y disponibilidad" al final de este artículo.
Los competidores directos del único y compacto convertible de 16 pulgadas para juegos son pocos y distantes. No obstante, el Asus Rog Flow X16 está diseñado principalmente para tareas creativas, multimedia y juegos, por lo que lo comparamos con los siguientes portátiles: Gigabyte Aero 16, MSI Stealth GS66, Lenovo Legion 5 Pro, Lenovo ThinkPad X1 Extreme, MacBook Pro 16 (2021), el Surface Laptop Studio de Microsoft, el compacto XPS 17 de Dell y el propio Zephyrus M16.
Este último es similar al ROG X16 Flow en muchos aspectos, que señalamos en varios puntos de nuestro análisis. La comparación con el más pequeño ROG Flow X13 es ciertamente interesante, así como la comparación con los tradicionales y gruesos colosos de los juegos como ROG Strix Scar 15 de Asus. El convertible HP Spectre 16 con un Intel Core i7-12700H, gráficos Arc de gama media y una pantalla táctil OLED 3K estará disponible a finales de agosto y también podría ser interesante para un grupo objetivo no interesado principalmente en los juegos. Según se informa, el Legion Slim 7i de Lenovo también utilizará mini-LED.
Posibles contendientes en la comparación
Valoración | Fecha | Modelo | Peso | Altura | Tamaño | Resolución | Precio |
|---|---|---|---|---|---|---|---|
| 89.5 % v7 (old) | 08/2022 | Asus ROG Flow X16 GV601RW-M5082W R9 6900HS, GeForce RTX 3070 Ti Laptop GPU | 2.1 kg | 19.4 mm | 16.10" | 2560x1600 | |
| 85.6 % v7 (old) | 07/2021 | Asus ROG Zephyrus M16 GU603H i9-11900H, GeForce RTX 3070 Laptop GPU | 2 kg | 20 mm | 16.00" | 2560x1600 | |
| 86.3 % v7 (old) | 06/2022 | Asus ROG Strix Scar 15 G533ZW-LN106WS i9-12900H, GeForce RTX 3070 Ti Laptop GPU | 2.3 kg | 27.2 mm | 15.60" | 2560x1440 | |
| 84.7 % v7 (old) | 03/2022 | Gigabyte Aero 16 YE5 i9-12900HK, GeForce RTX 3080 Ti Laptop GPU | 2.3 kg | 22.4 mm | 16.00" | 3840x2400 | |
| 88 % v7 (old) | 03/2022 | Lenovo Legion 5 Pro 16 G7 i7 RTX 3070Ti i7-12700H, GeForce RTX 3070 Ti Laptop GPU | 2.6 kg | 26.6 mm | 16.00" | 2560x1600 | |
| 84.5 % v7 (old) | 02/2022 | MSI Stealth GS66 12UGS i7-12700H, GeForce RTX 3070 Ti Laptop GPU | 2.2 kg | 19.8 mm | 15.60" | 2560x1440 | |
| 93.2 % v7 (old) | 11/2021 | Apple MacBook Pro 16 2021 M1 Pro M1 Pro, M1 Pro 16-Core GPU | 2.2 kg | 16.8 mm | 16.20" | 3456x2234 | |
| 88.3 % v7 (old) | 12/2021 | Lenovo ThinkPad X1 Extreme G4-20Y50040GE i9-11950H, GeForce RTX 3080 Laptop GPU | 1.9 kg | 18.2 mm | 16.00" | 3840x2400 | |
| 88.8 % v7 (old) | 06/2022 | Dell XPS 17 9720 RTX 3060 i7-12700H, GeForce RTX 3060 Laptop GPU | 2.5 kg | 19.5 mm | 17.00" | 3840x2400 | |
| 89 % v7 (old) | 03/2022 | Microsoft Surface Laptop Studio i7 RTX 3050 Ti i7-11370H, GeForce RTX 3050 Ti Laptop GPU | 1.8 kg | 19 mm | 14.40" | 2400x1600 | |
| 84.7 % v7 (old) | 02/2021 | Asus ROG Flow X13 GV301QH R9 5980HS, GeForce GTX 1650 Max-Q | 1.4 kg | 15.8 mm | 13.40" | 3840x2400 |
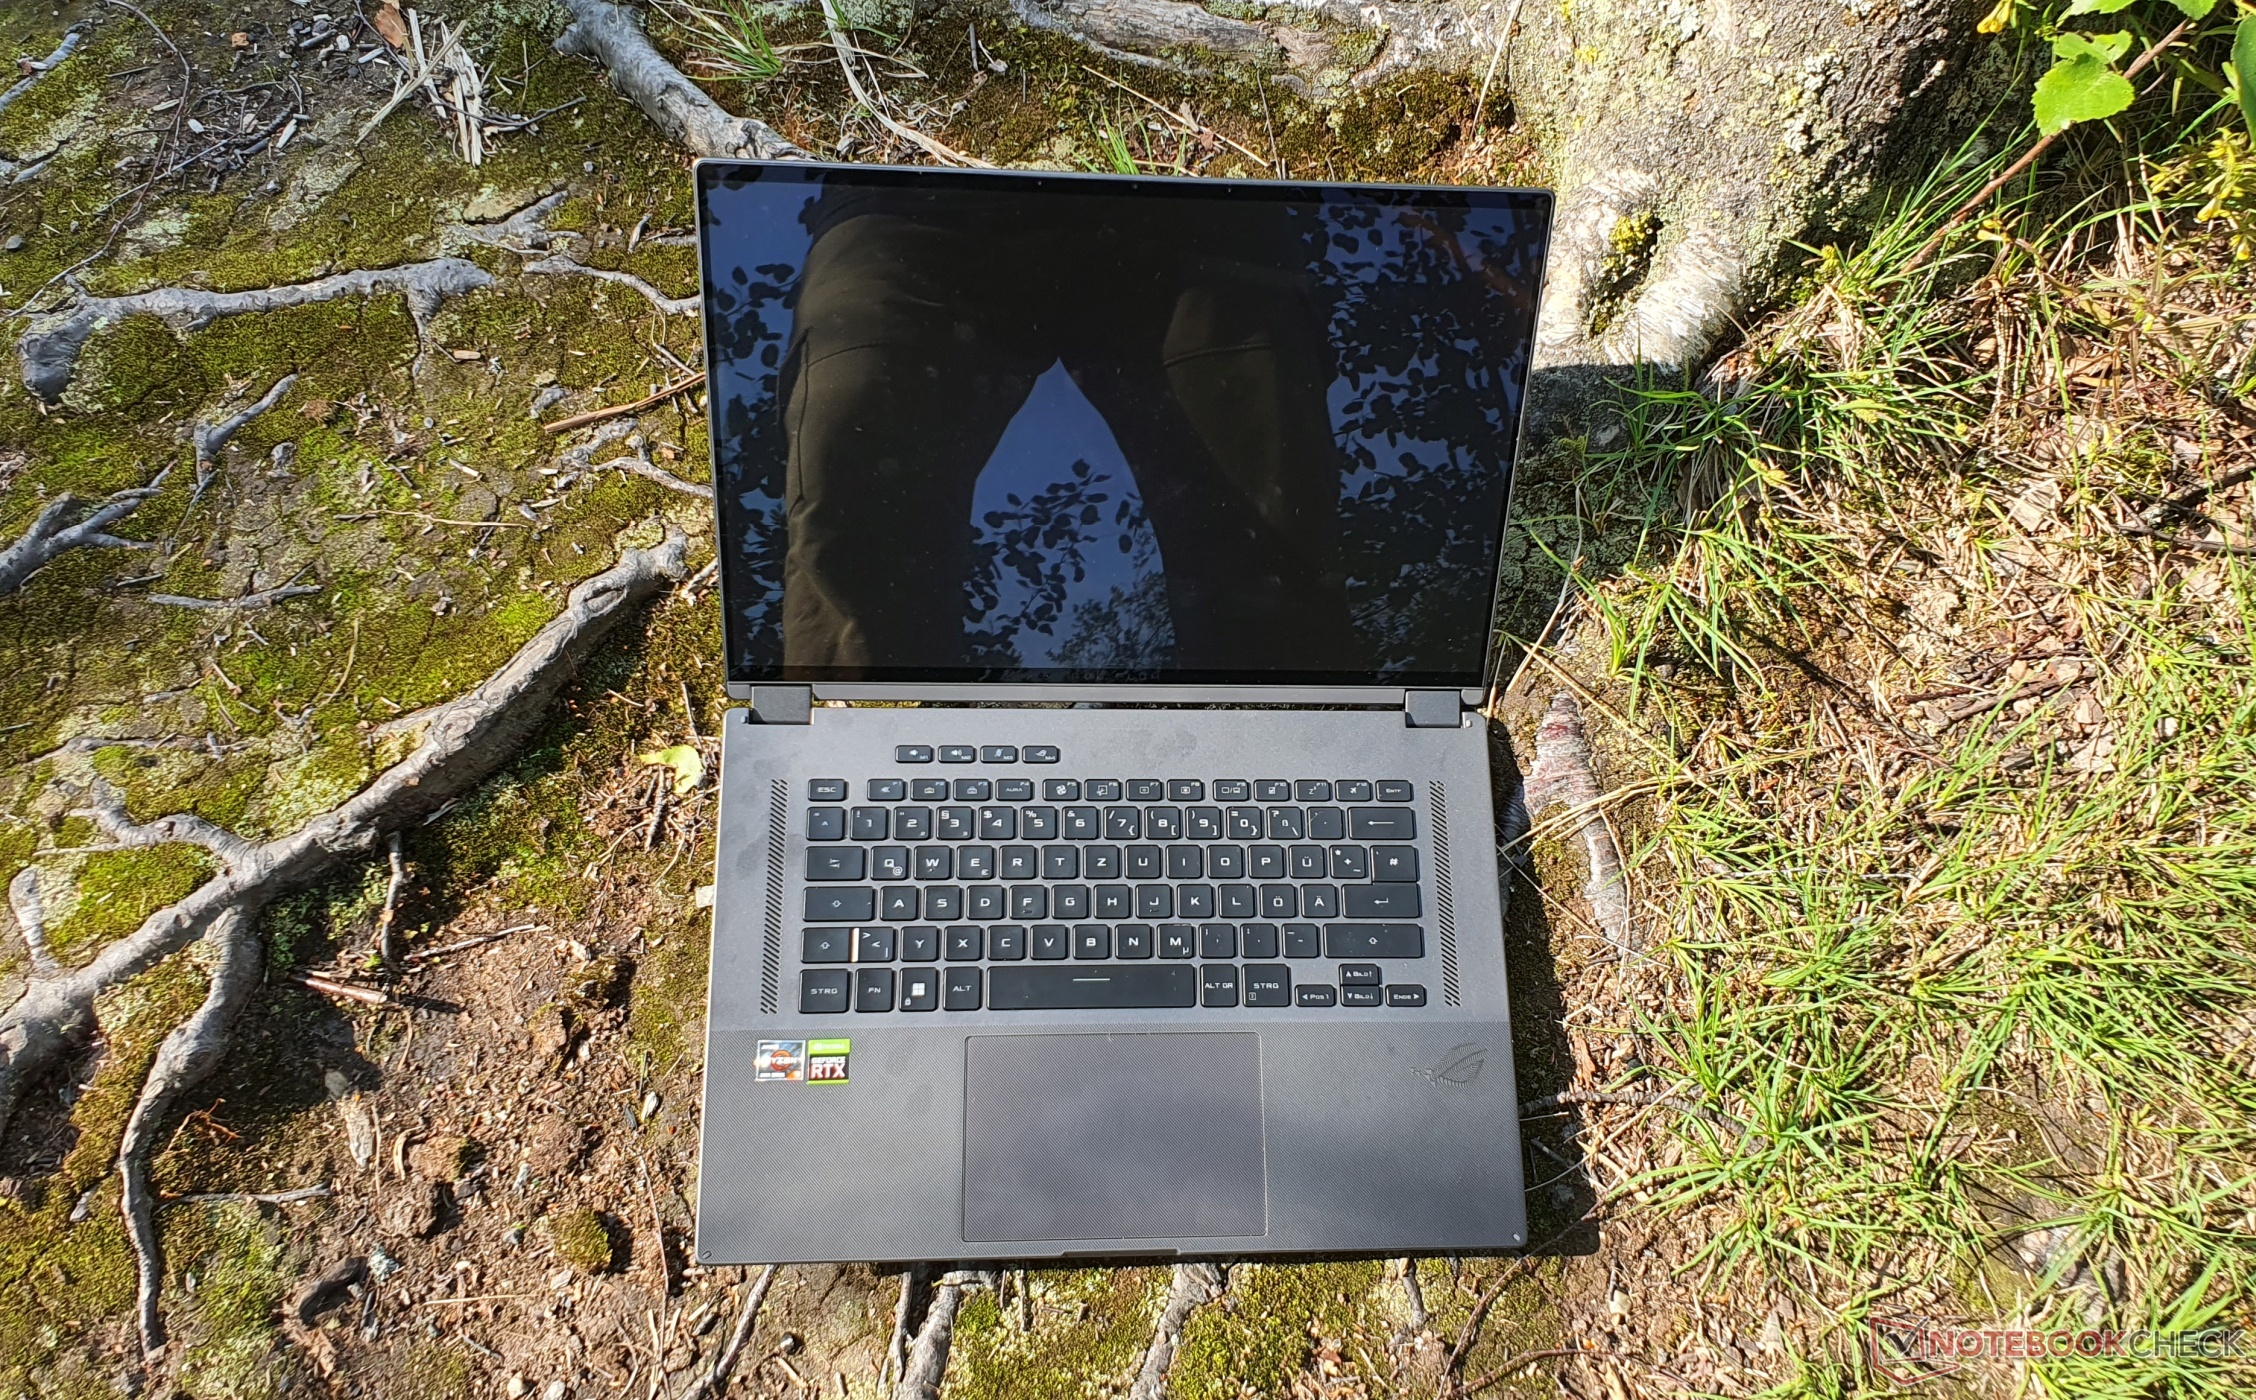
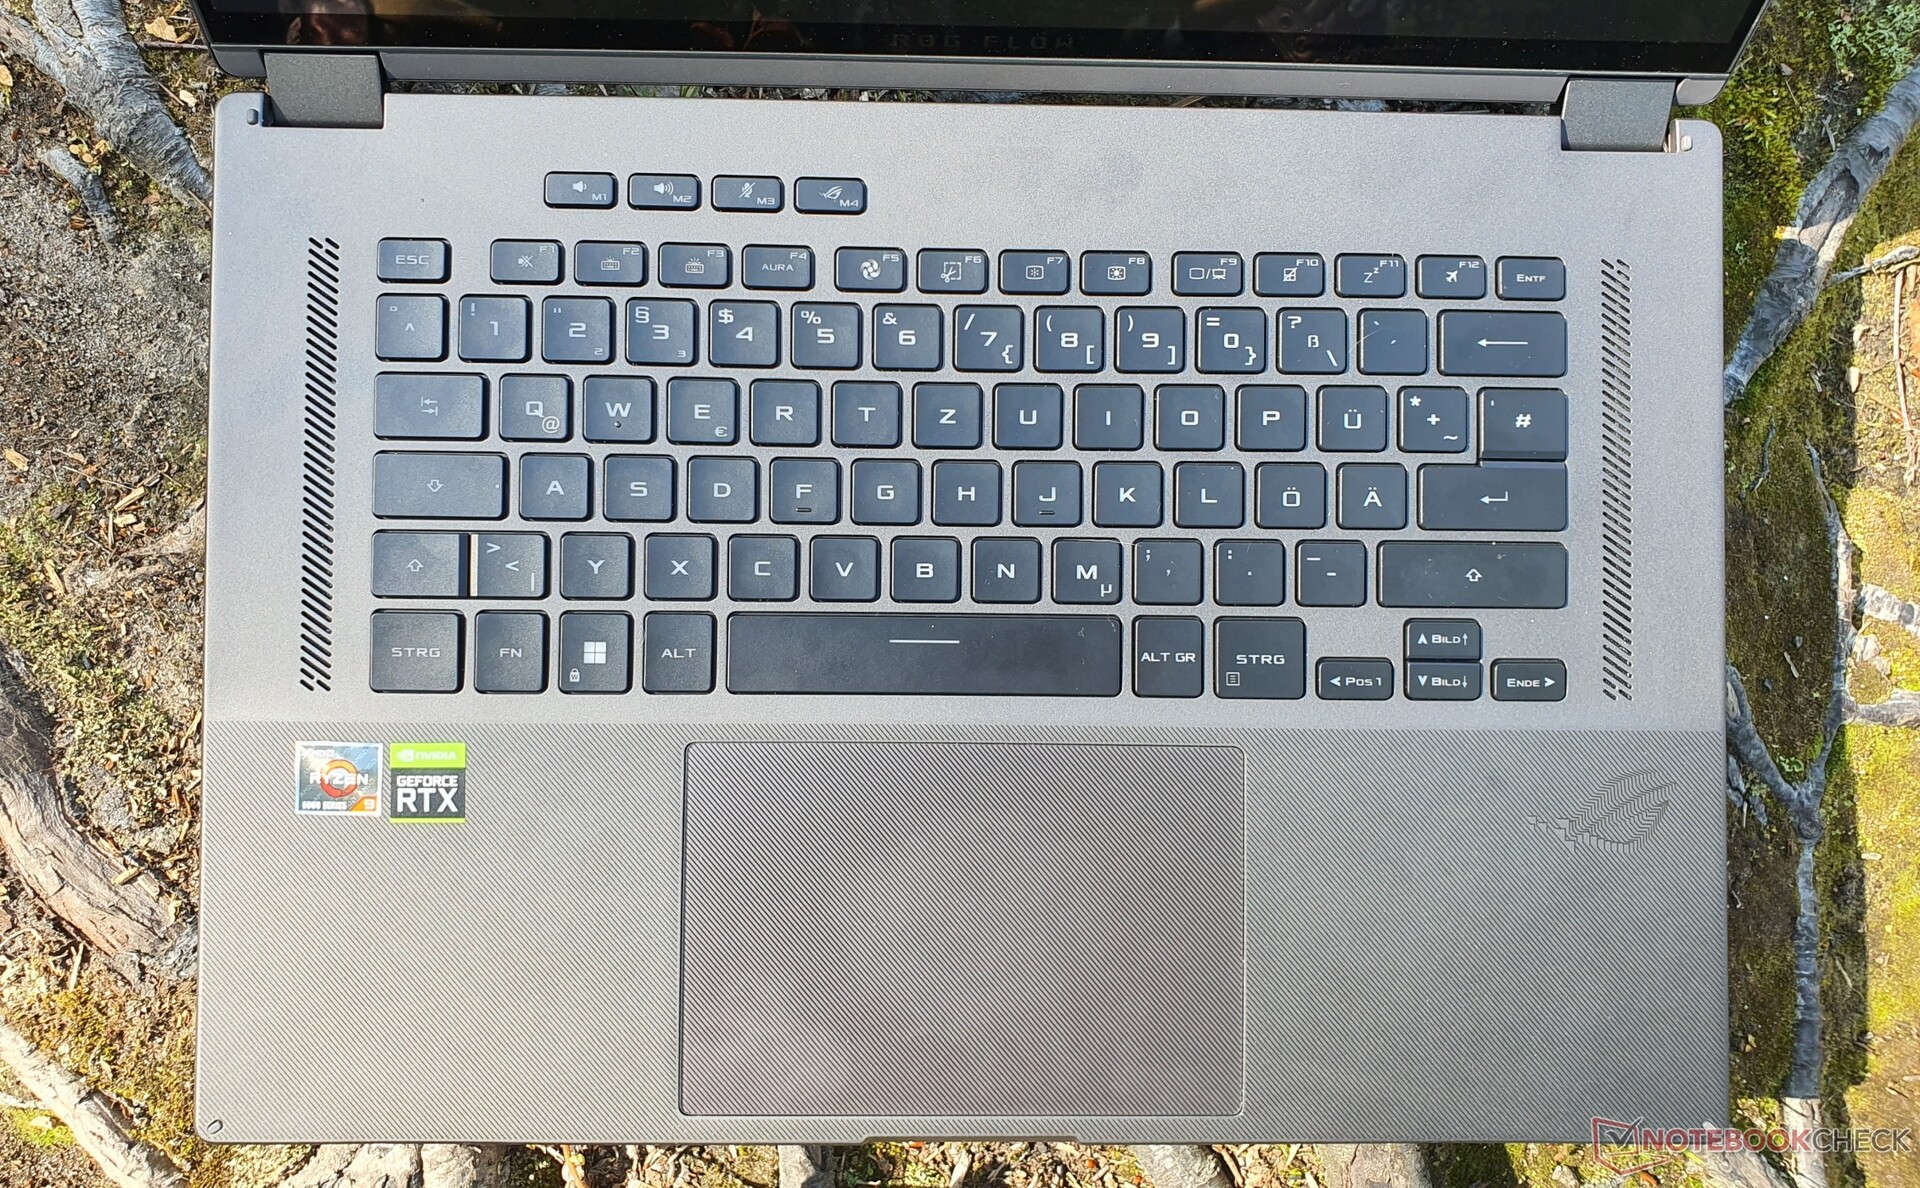
Carcasa - Portátil para juegos estable de Asus
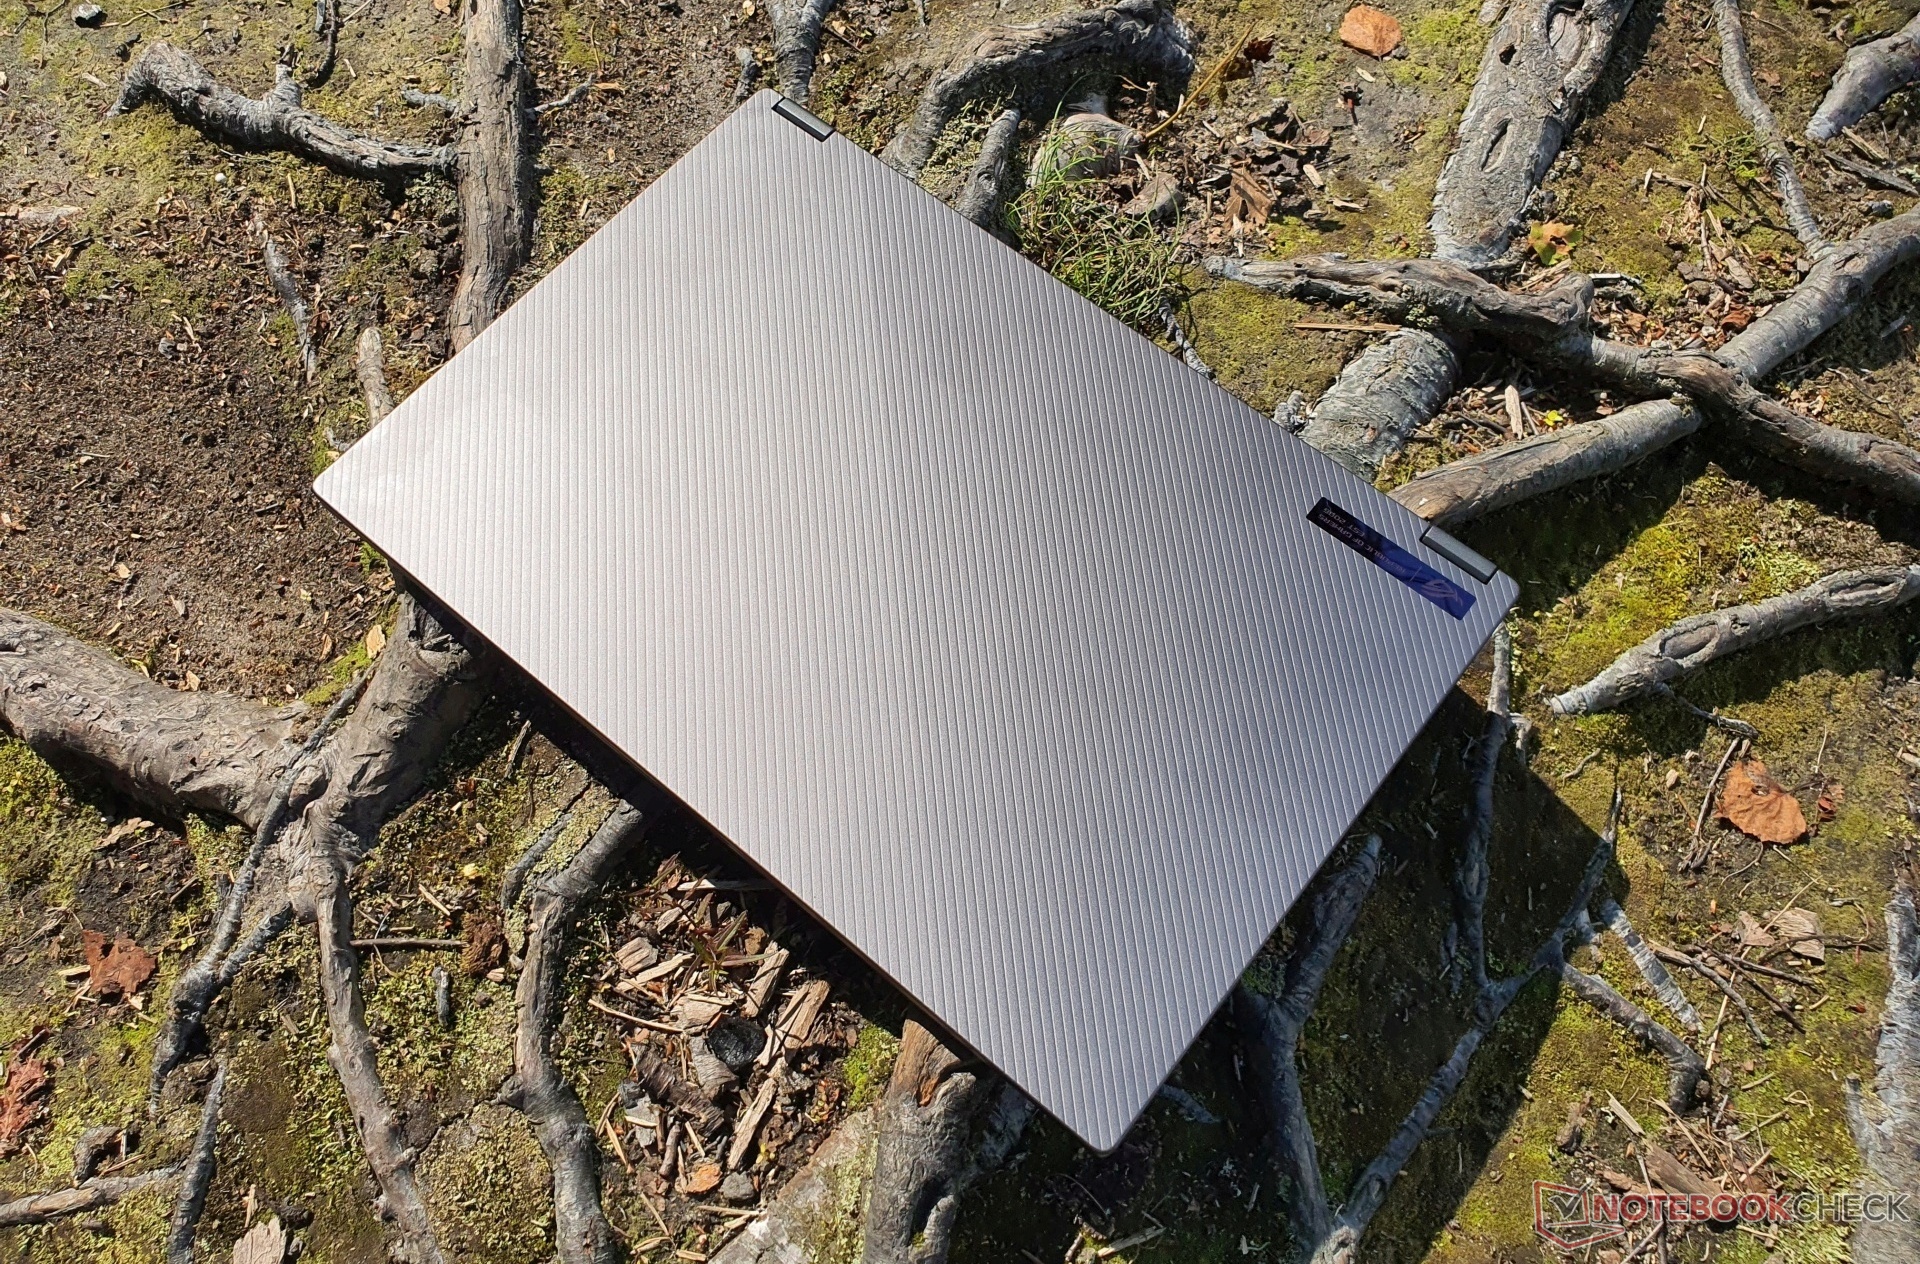
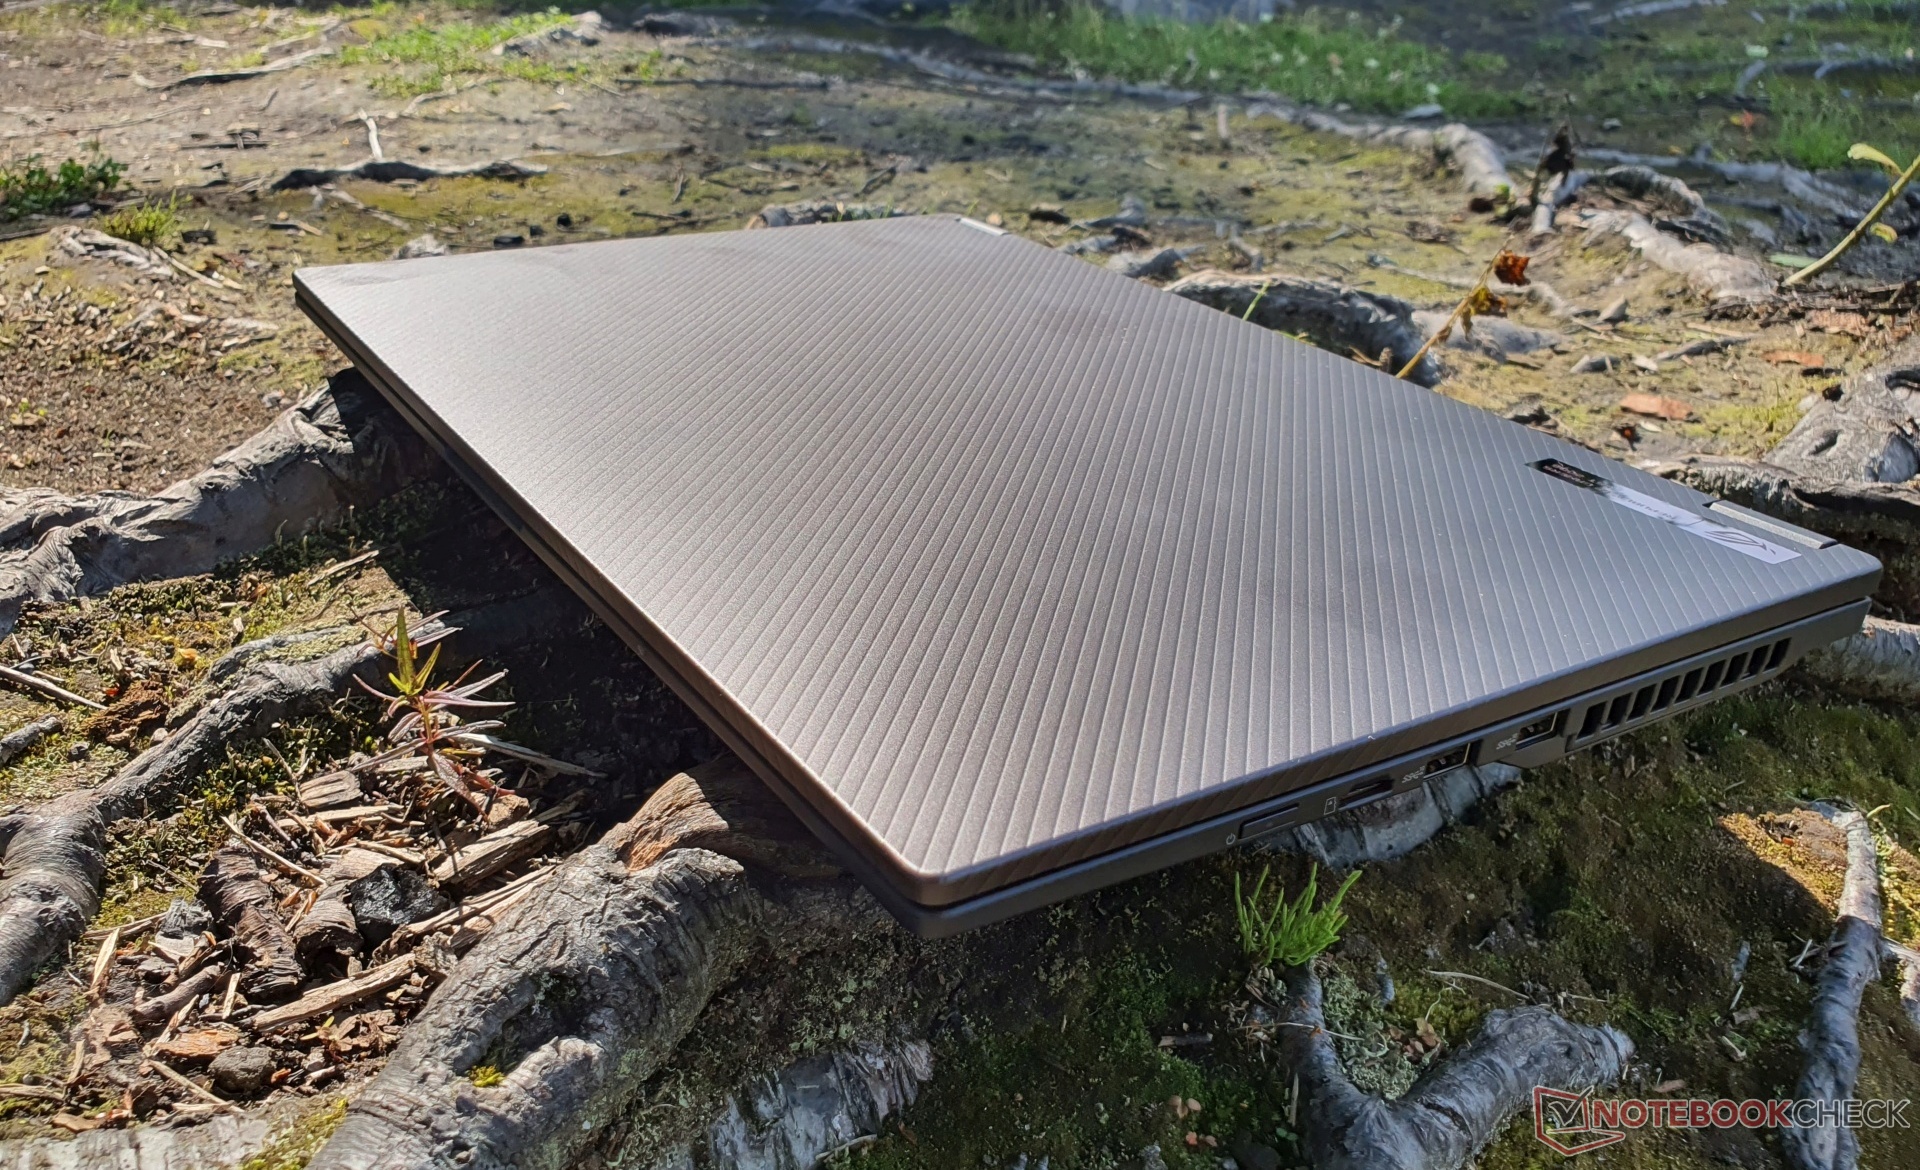
En principio, el ROG Flow X16 es una mezcla del más pequeñoFlow X13 y el Zephyrus M16: Se ha reproducido el estriado distintivo de la tapa de plástico gris hierro del primero, así como la forma y la silueta generales, que sólo están en un tamaño mayor. La unidad base, incluida la placa base, se asemeja a la Zephyrus M16.
Asus utiliza mucho magnesio, por lo que el dispositivo da una sensación de gran calidad en general. Sin embargo, la tapa y la placa base están hechas de plástico blando y son especialmente susceptibles a los arañazos. Esto reduce un poco nuestra impresión inicialmente positiva.
La presión dirigida a la parte posterior de la pantalla no provoca distorsiones de la imagen y la placa base se mantiene en su lugar mediante 13 tornillos. Sin embargo, cuando se separa de la unidad, la placa base resulta ser una pieza de plástico flexible.
La fabricación es de alto nivel, la unidad de base no se puede torcer y la pantalla tampoco deja mucho espacio para la torsión. Desde el punto de vista táctil, las superficies ligeramente rugosas se sienten muy bien. El patrón de la tapa también se replica de forma exclusivamente óptica en el reposamanos, incluyendo el touchpad. Las huellas dactilares son inmediatamente visibles, pero se espera que la versión final del Flow X16 no adopte el patrón ondulado, sino que utilice un recubrimiento especial para mantener las huellas a raya.
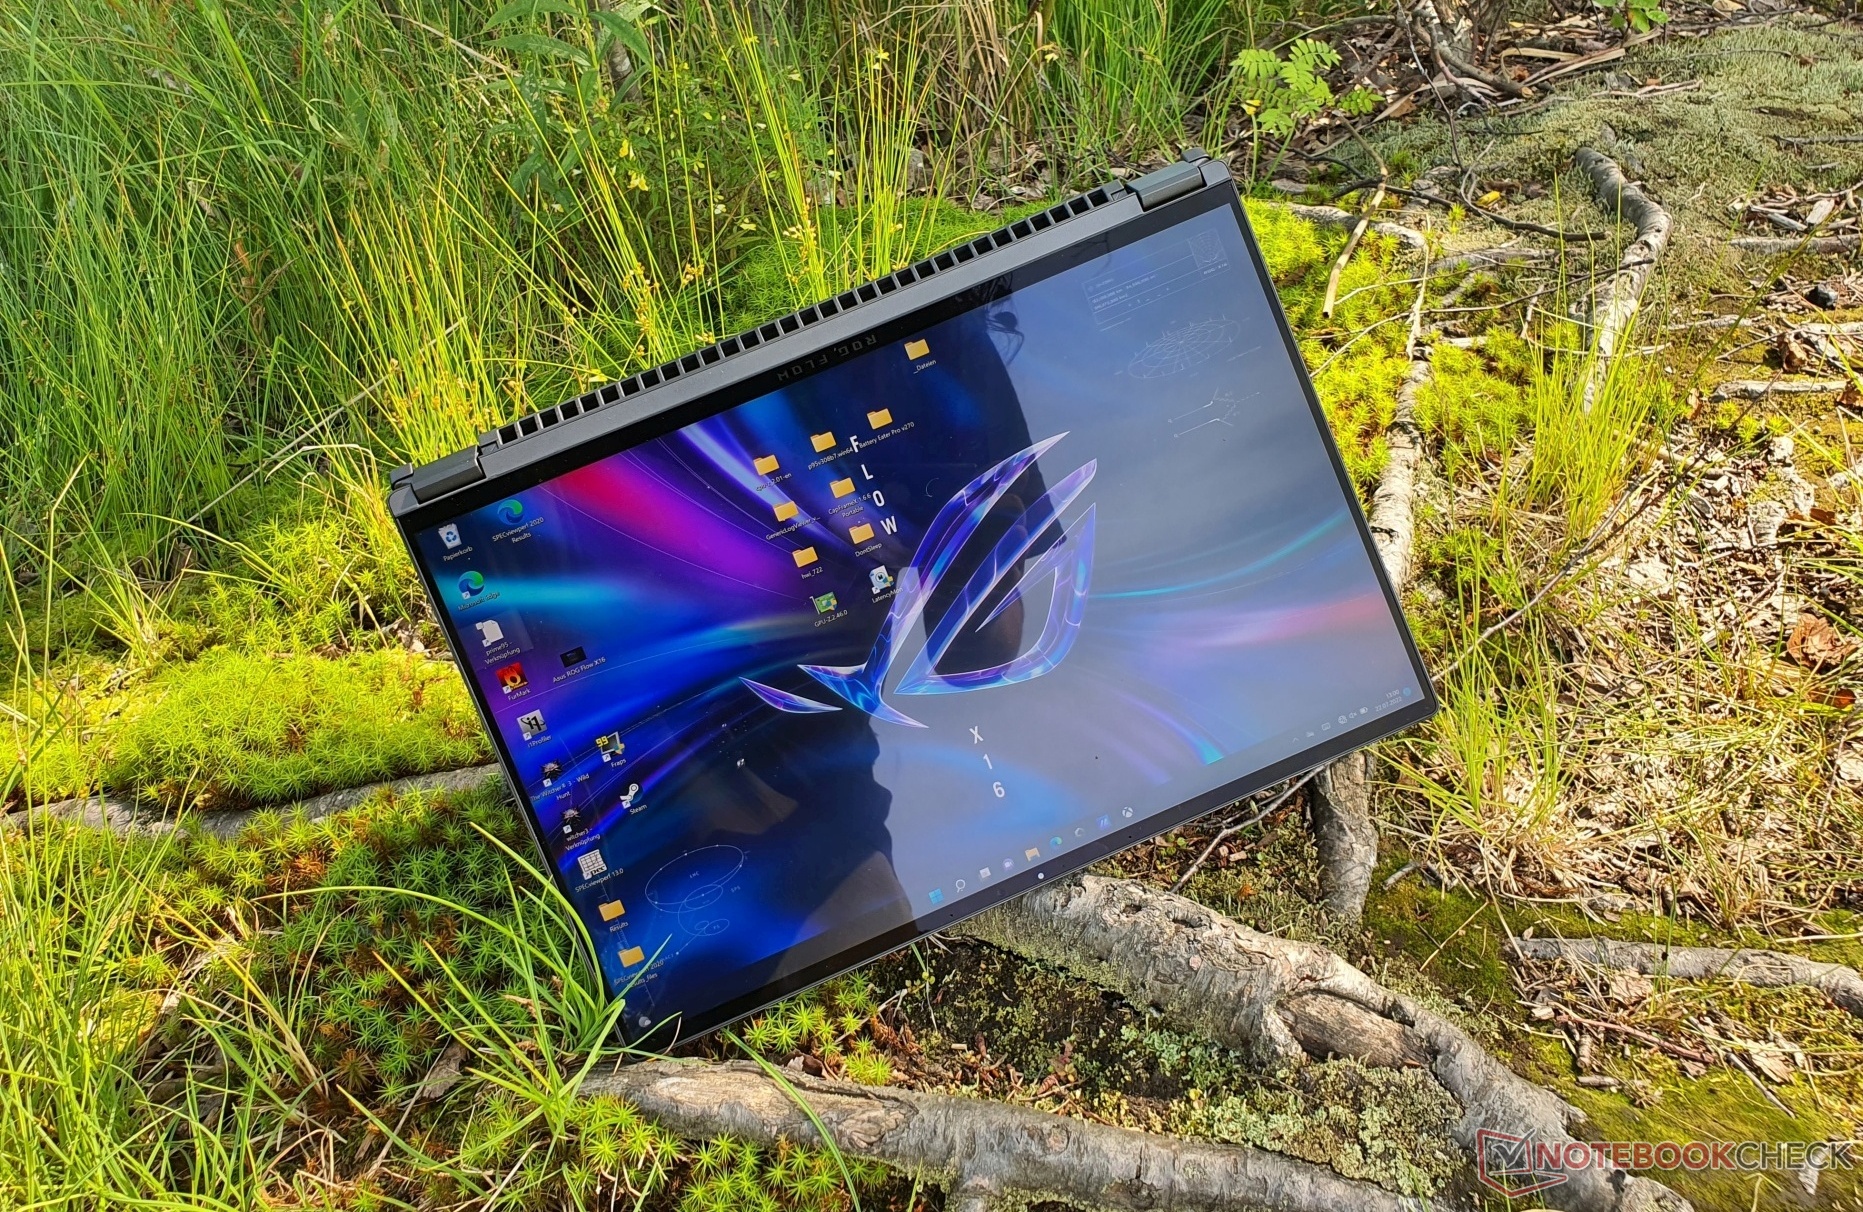
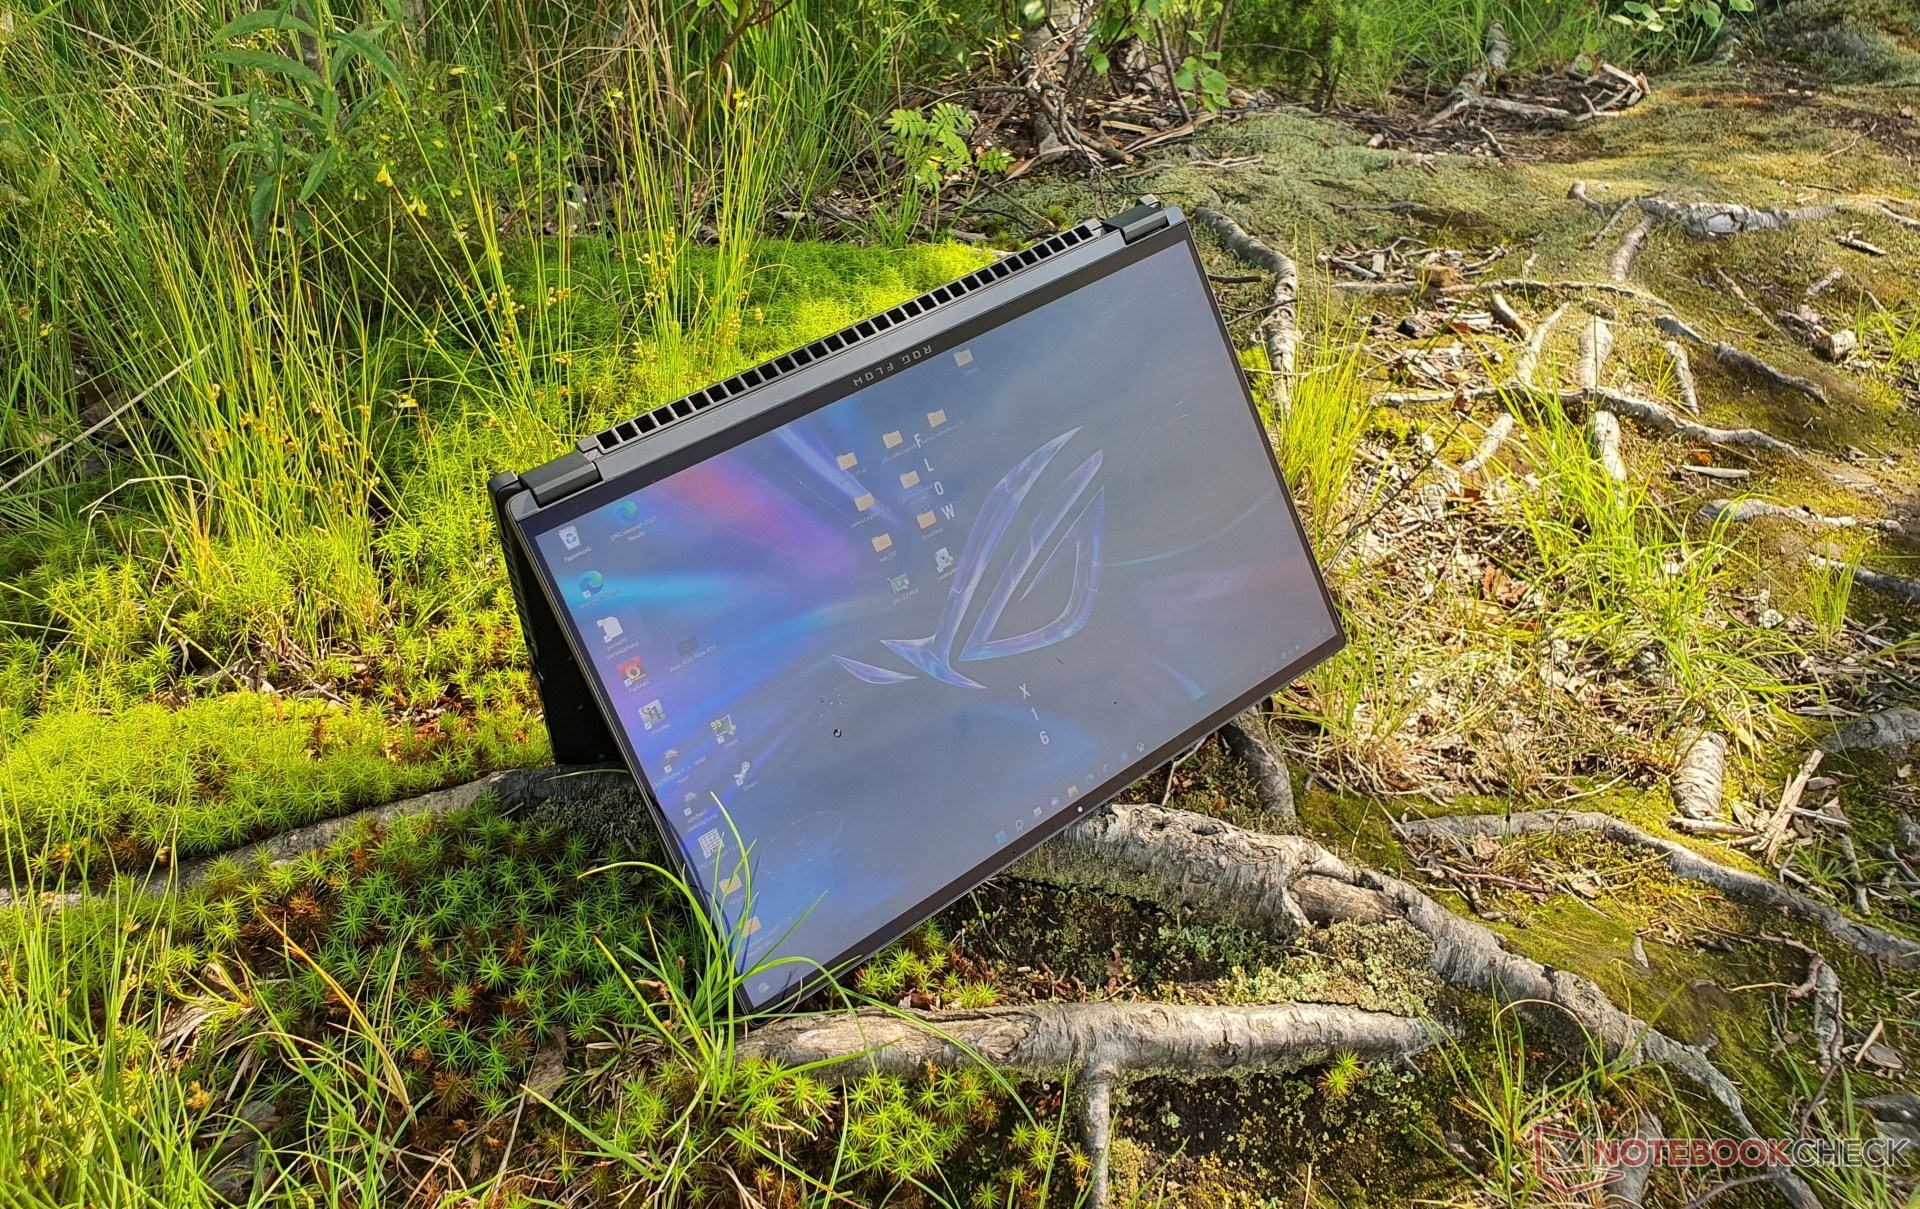
Las dos bisagras del convertible permiten una rotación de 360º de la pantalla y la mantienen firmemente en su posición. El hecho de que la pantalla de un convertible se balancee un poco no siempre se puede evitar del todo. En general, se ha conseguido un buen equilibrio entre suavidad y estabilidad. El ROG Flow X16 también se puede abrir con una mano. Pequeños espaciadores protegen la unidad base en el modo tablet y tienda.


Con el ROG Flow X16, Asus consigue crear un portátil con las dimensiones más reducidas entre los de 16 pulgadas, superando incluso a algunos portátiles de 15 pulgadas de nuestra comparativa, aunque elGigabyte Aero 16 y el MSI Stealth GS66ya son modelos muy compactos. El 14,4 pulgadas Surface Laptop Studio es obviamente más compacto, pero tampoco es un verdadero gamer.
Sólo elThinkPad X1 Extremees superior en términos de peso entre los dispositivos con una potente GPU, pero sus 80 W de TGP requieren una solución de refrigeración menos elaborada. El AsusZephyrus M16está más o menos a la par debido a su carcasa similar.
Equipos - La serie Flow de Asus ofrece una eGPU especial
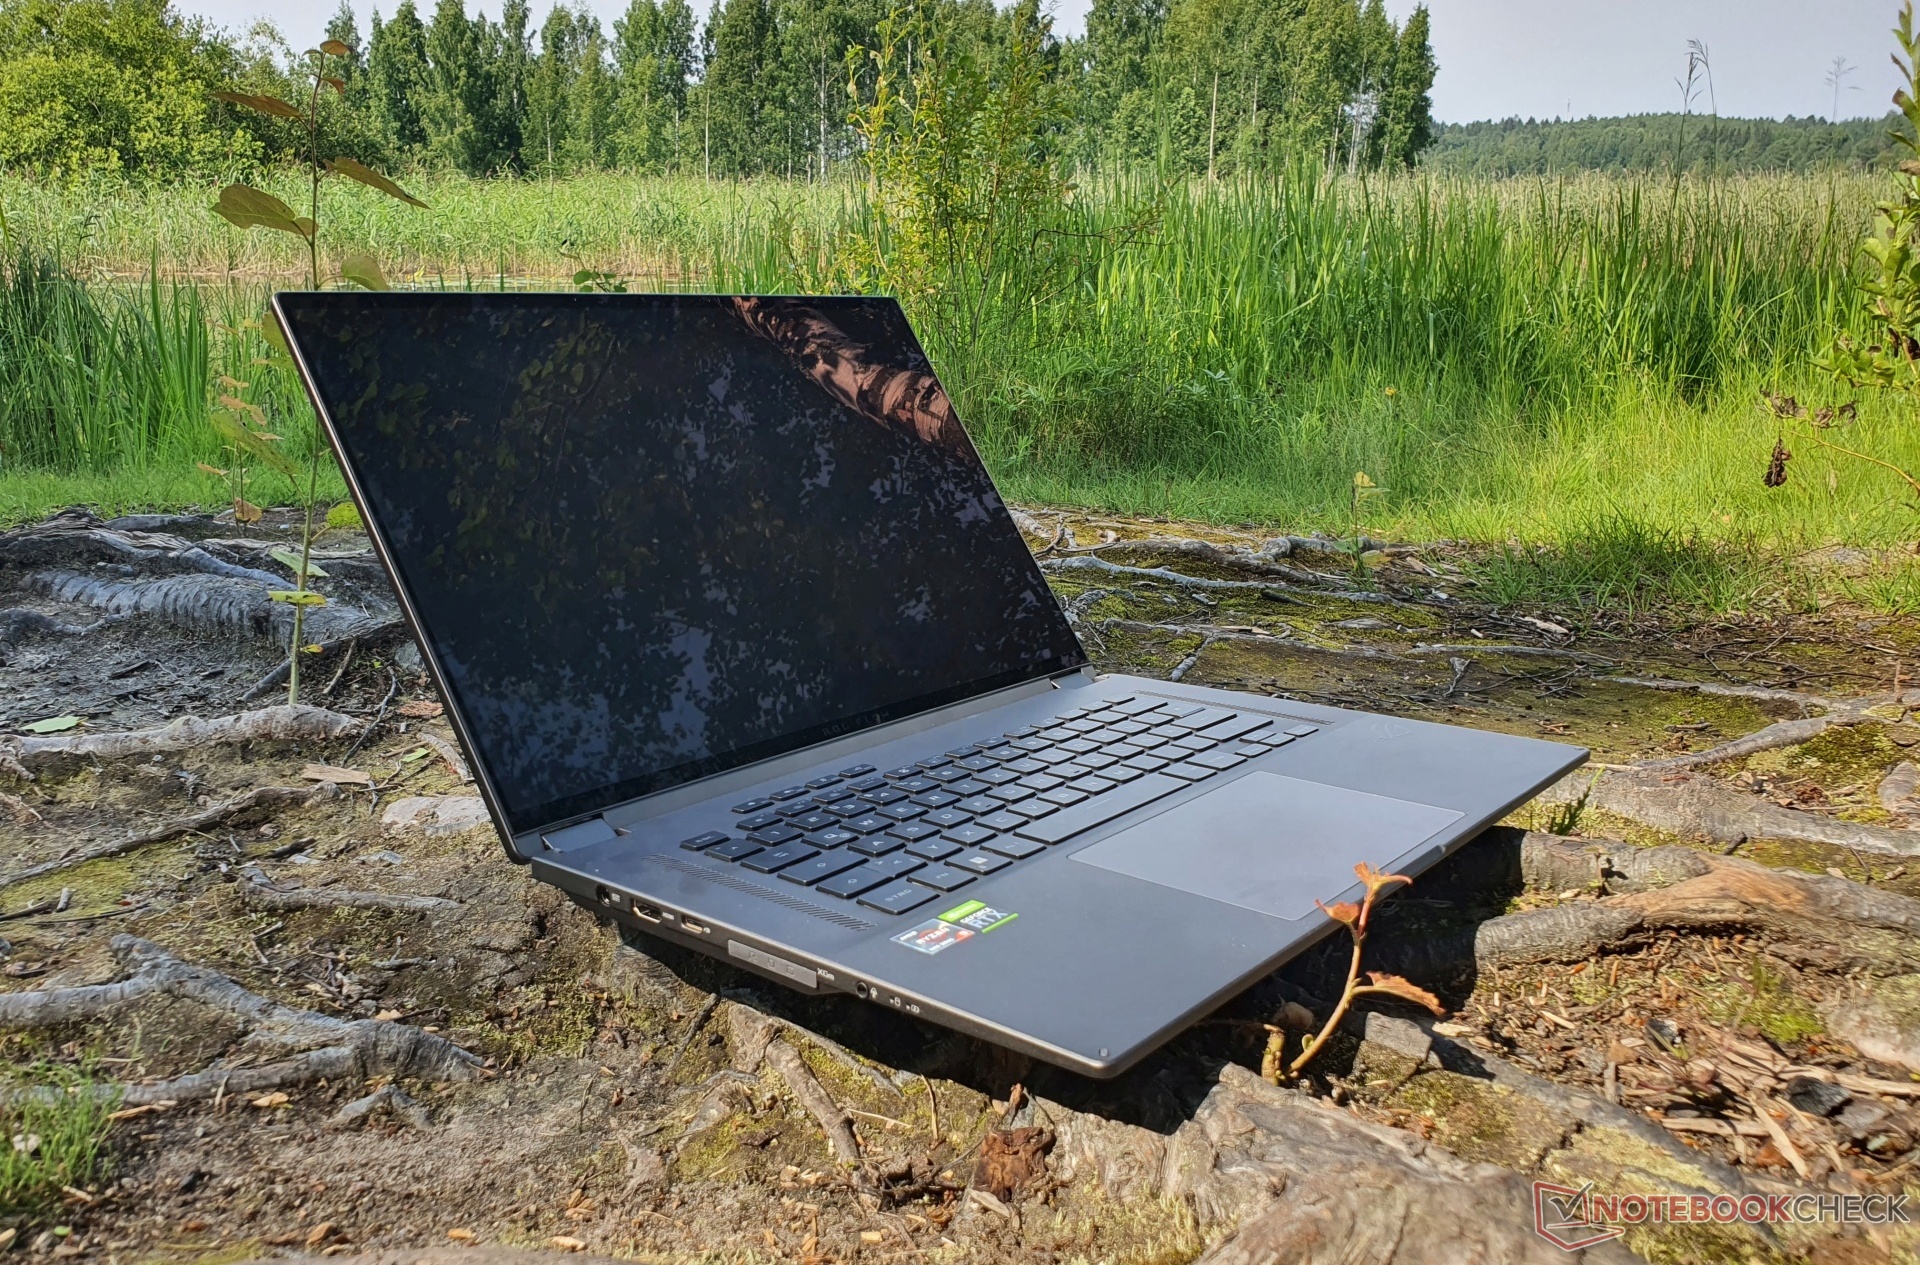
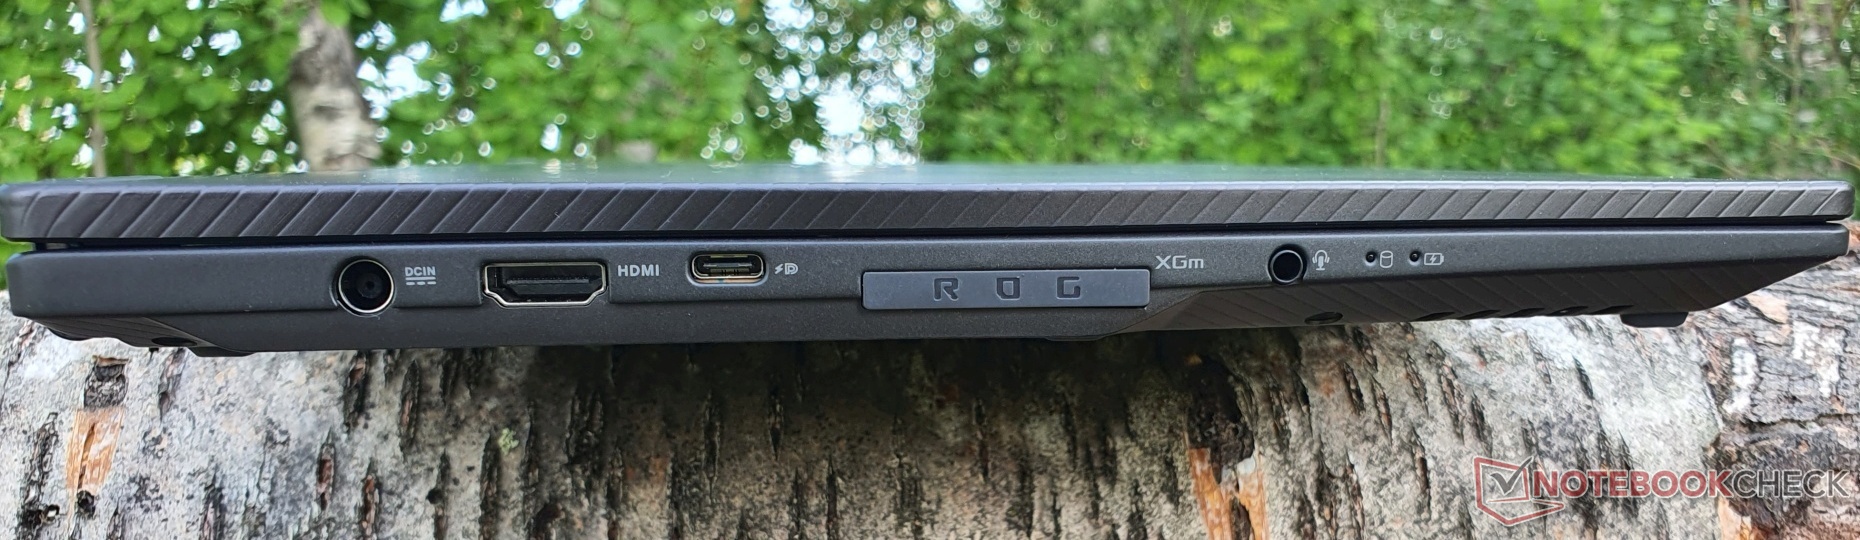
El Asus ROG Flow X16 ofrece cuatro puertos USB 3.2 Gen2, dos de los cuales son de Tipo A, mientras que los otros dos son de Tipo C y ambos soportan DisplayPort y Power Delivery de hasta 100 watts. El DisplayPort del puerto USB-C en el puerto xGM está conectado a la GPU Nvidia dedicada, mientras que el otro puerto USB-C está conectado a la GPU Radeon, al igual que el puerto HDMI 2.0b, que soporta G-Sync. Más adelante, Asus podría ofrecer una actualización de software para USB 4.0.
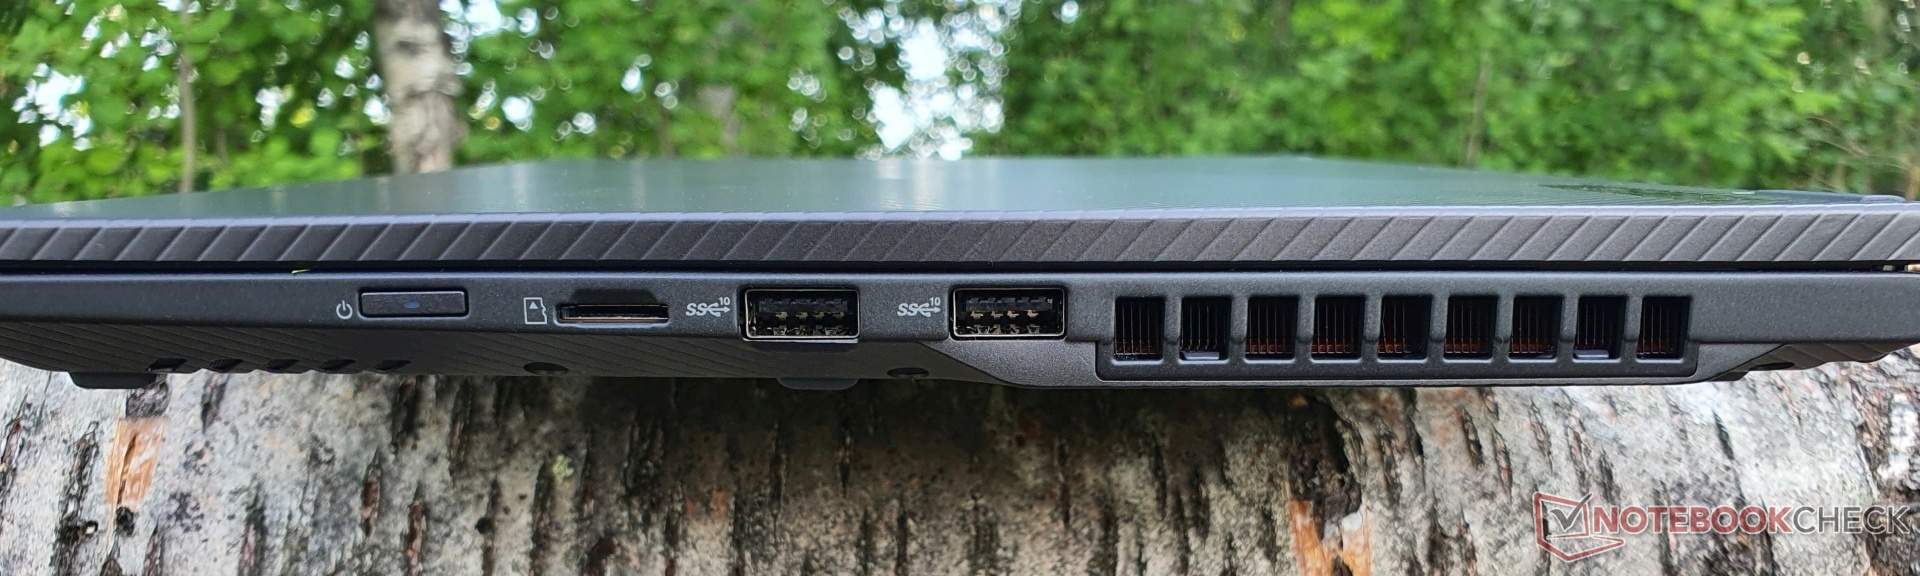
El lector de tarjetas SD sólo está disponible en la versión micro y el puerto LAN está ausente. La serie ROG Flow cuenta con el puerto xGM para un dock gráfico opcional (eGPU) que aloja una GeForce RTX 3080 (GPU de portátil). Esta es la única opción para el dock hasta ahora, es más compacta que las eGPUs convencionales, y se conecta al doble de ancho de banda (64 GBit/s @PCIe 3.0 8x frente a 32 GBit/s @Thunderbolt 3/4).
Por supuesto, es probable que las ganancias de rendimiento sean marginales en nuestro modelo con una RTX 3070 Ti móvil integrada, y sigue sin estar claro si la base recibirá actualizaciones en el futuro. No obstante, mediremos cualquier diferencia e informaremos de ella pronto. Además, el ROG XG Mobile (que hemos analizado previamente) ofrece puertos adicionales, como GBit LAN y un DisplayPort de tamaño completo.
Además, también hay un conector de audio de 3,5 mm, así como la toma de corriente para la fuente de alimentación de 240 vatios. El espacio entre los puertos es adecuado, pero el botón de encendido en el lado derecho queda suelto en la carcasa en nuestra versión de pre-lanzamiento. Se ha omitido el lector de huellas dactilares.
Lector de tarjetas SD
El lector de tarjetas microSD UHS-II alcanza muy buenos resultados de 158 MB/s en el test de copia y ~183 MB/s en lectura secuencial con nuestra tarjeta microSD de referencia (AV PRO microSD 128 GB V60). Especialmente en la copia, el ROG Flow X16 está muy por delante de la competencia. Sólo el XPS 17 de Dell logra tasas de copia más altas (~205 MB/s).
| SD Card Reader | |
| average JPG Copy Test (av. of 3 runs) | |
| Dell XPS 17 9720 RTX 3060 (Toshiba Exceria Pro SDXC 64 GB UHS-II) | |
| Asus ROG Flow X16 GV601RW-M5082W (AV Pro SD microSD 128 GB V60) | |
| Media de la clase Gaming (20.9 - 210, n=54, últimos 2 años) | |
| Apple MacBook Pro 16 2021 M1 Pro (Angelbird AV Pro V60) | |
| Asus ROG Zephyrus M16 GU603H (AV PRO microSD 128 GB V60) | |
| maximum AS SSD Seq Read Test (1GB) | |
| Dell XPS 17 9720 RTX 3060 (Toshiba Exceria Pro SDXC 64 GB UHS-II) | |
| Asus ROG Zephyrus M16 GU603H (AV PRO microSD 128 GB V60) | |
| Asus ROG Flow X16 GV601RW-M5082W (AV Pro SD microSD 128 GB V60) | |
| Media de la clase Gaming (25.5 - 261, n=51, últimos 2 años) | |
Comunicación
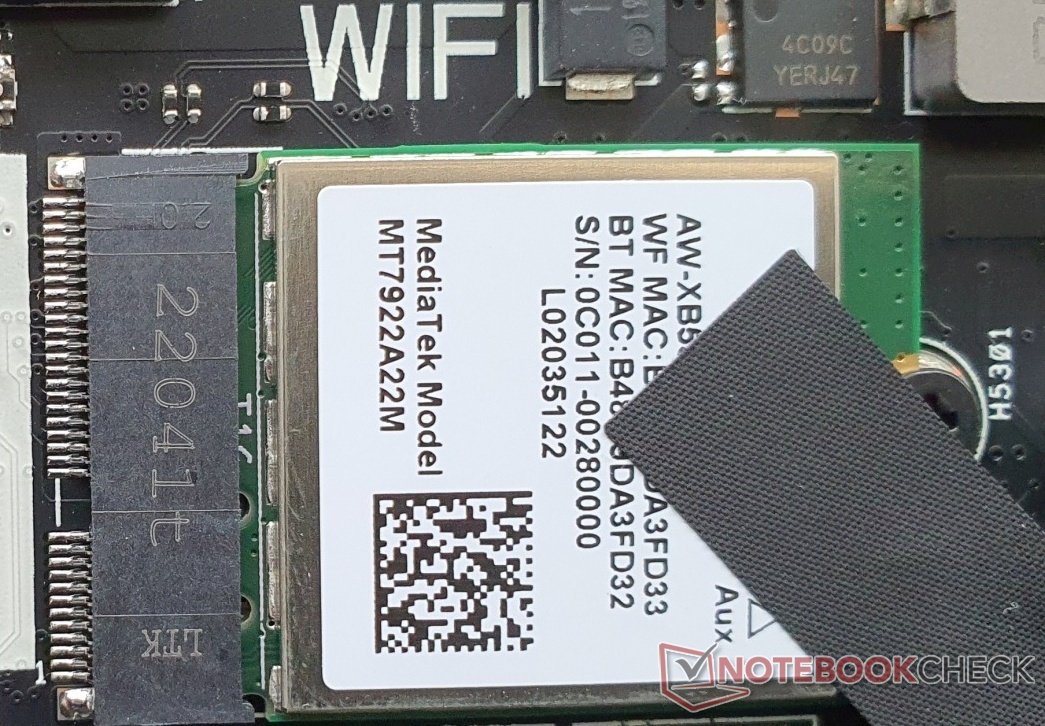
El módulo WiFi 6E instalado viene de MediaTek y ofrece velocidades decentes en ambas direcciones. El MT7922 es, por tanto, el doble de potente que el MT7921 del Zephyrus M16 y el MacBook Pro 16.
Cámara web

Se usa una variante de 720p (1280x720) como webcam, pero ofrece mejor nitidez y menos distorsión de lo habitual. No hay obturador mecánico, pero hay infrarrojos para Windows Hello.


Accesorios
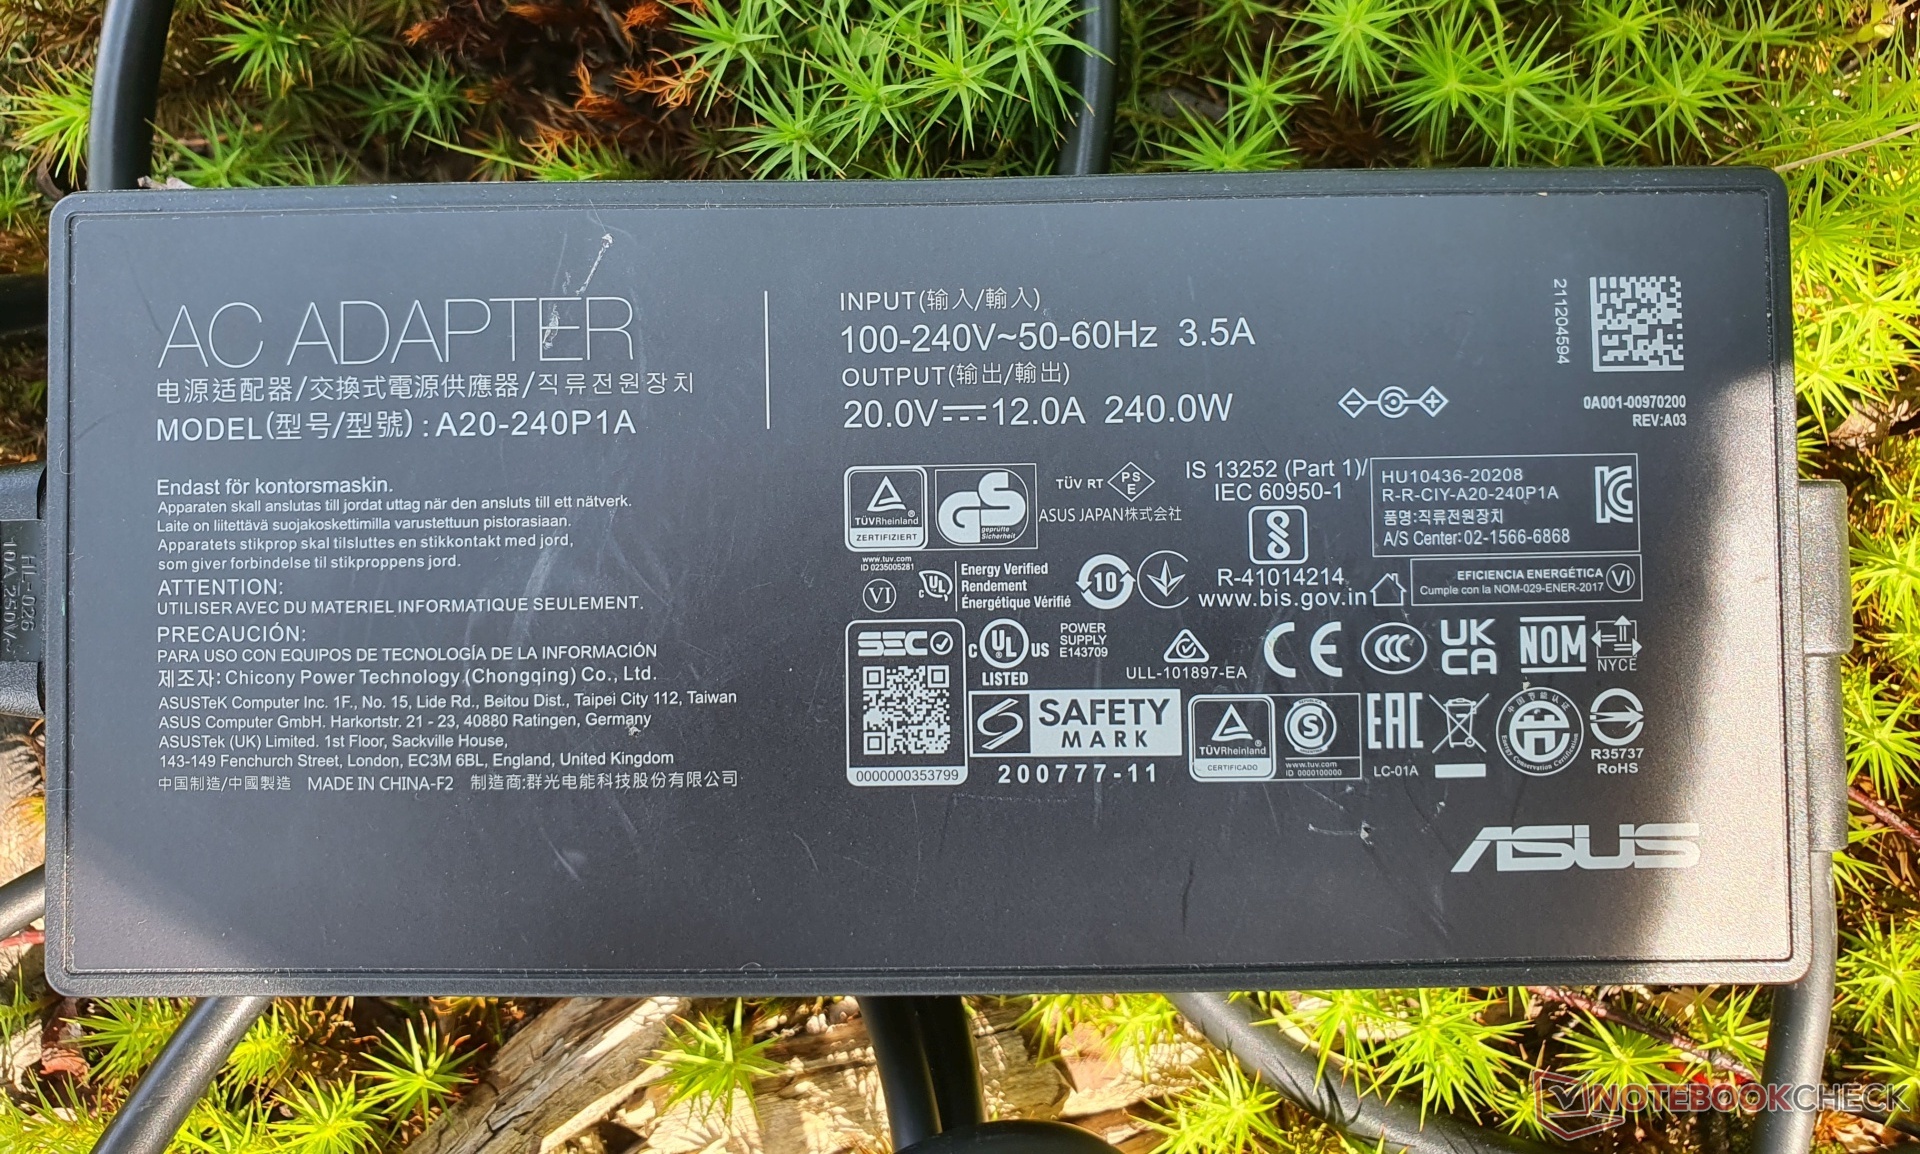
En nuestro paquete de pruebas, Asus proporciona un adaptador de corriente de 240 vatios, así como el lápiz óptico Asus SA201H https://www.asus.com/Accessories/Stylus/All-series/ASUS-PEN-SA201H/para la entrada de la pantalla táctil (incluido en el volumen de suministro). También recibimos una mochila para portátiles ROG BP4071 de https://rog.asus.com/in/apparel-bags-gear/bags/rog-bp4701-gaming-backpack-model/pedimos la base gráfica externa y la fuente de alimentación USB-C de 100 vatios por separado
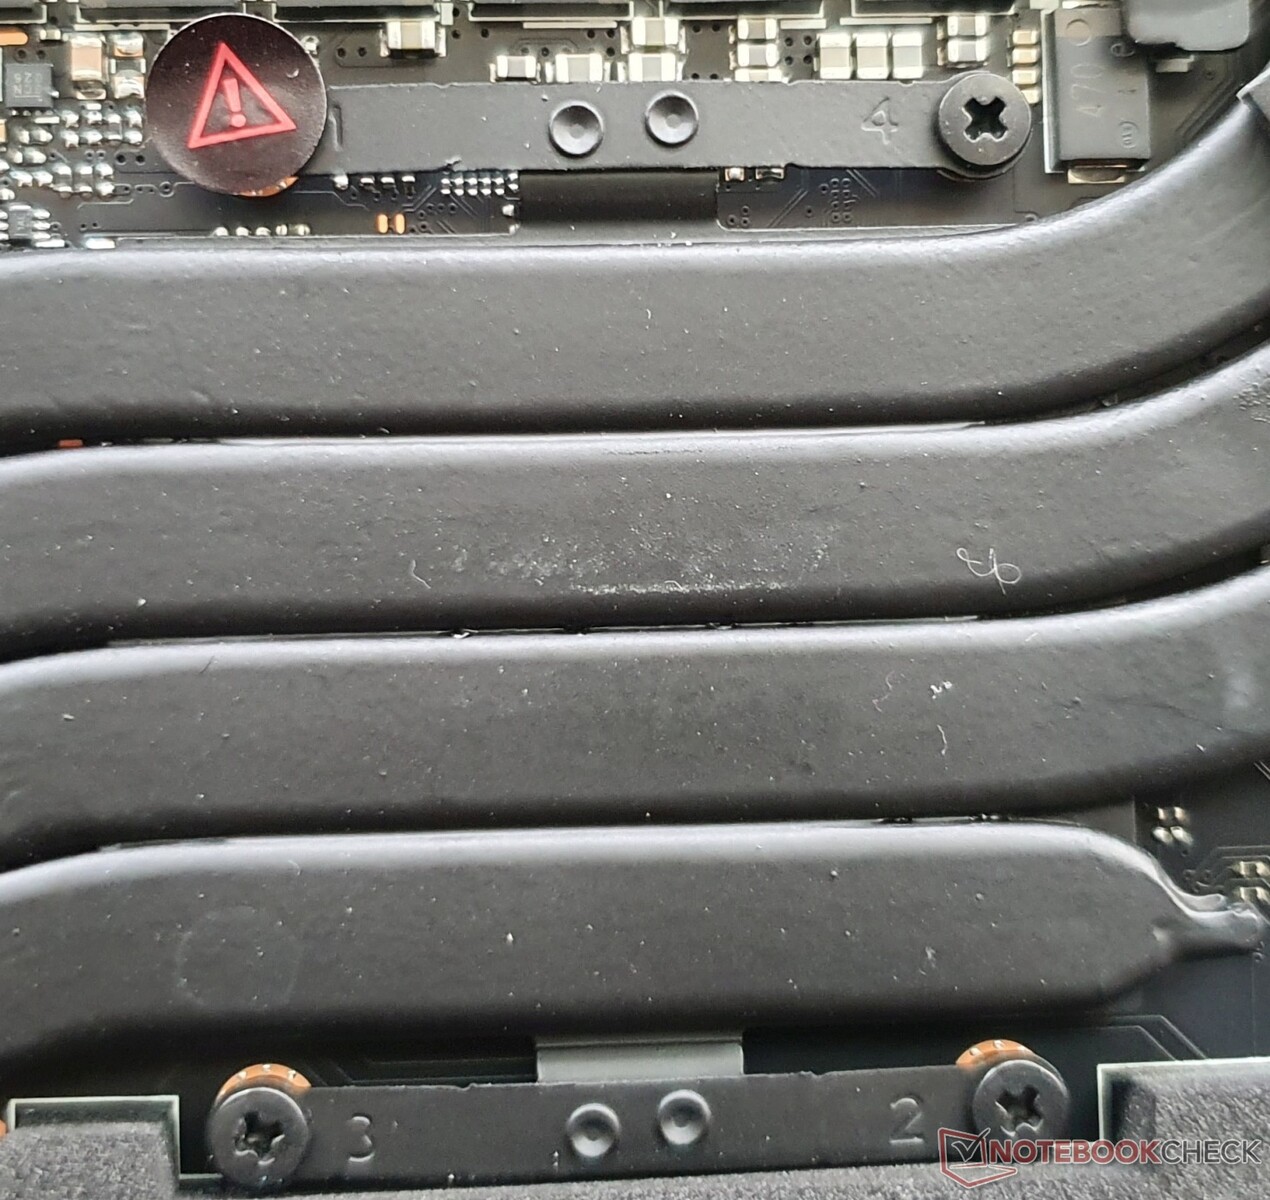
Mantenimiento
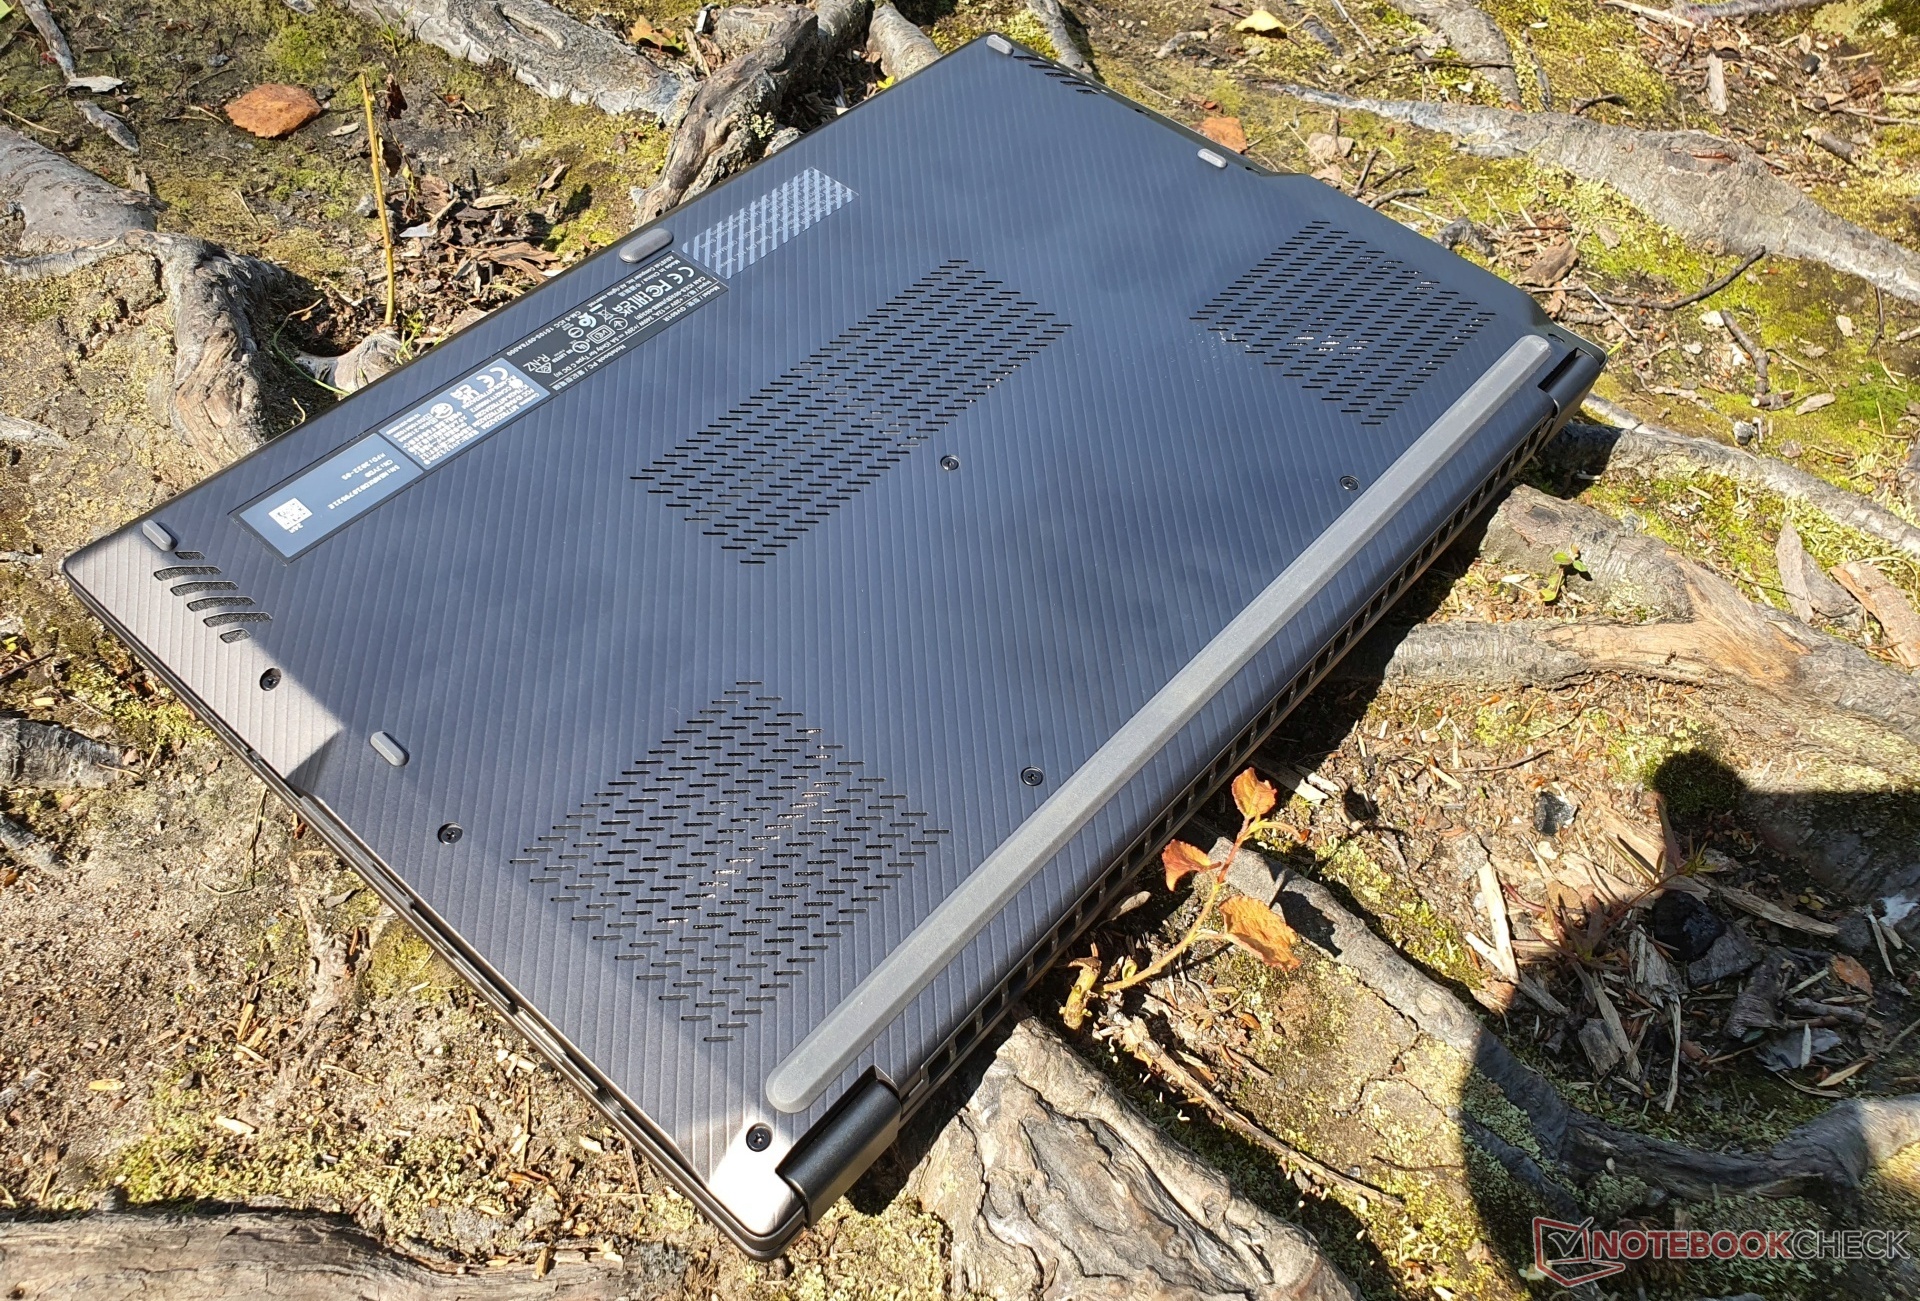
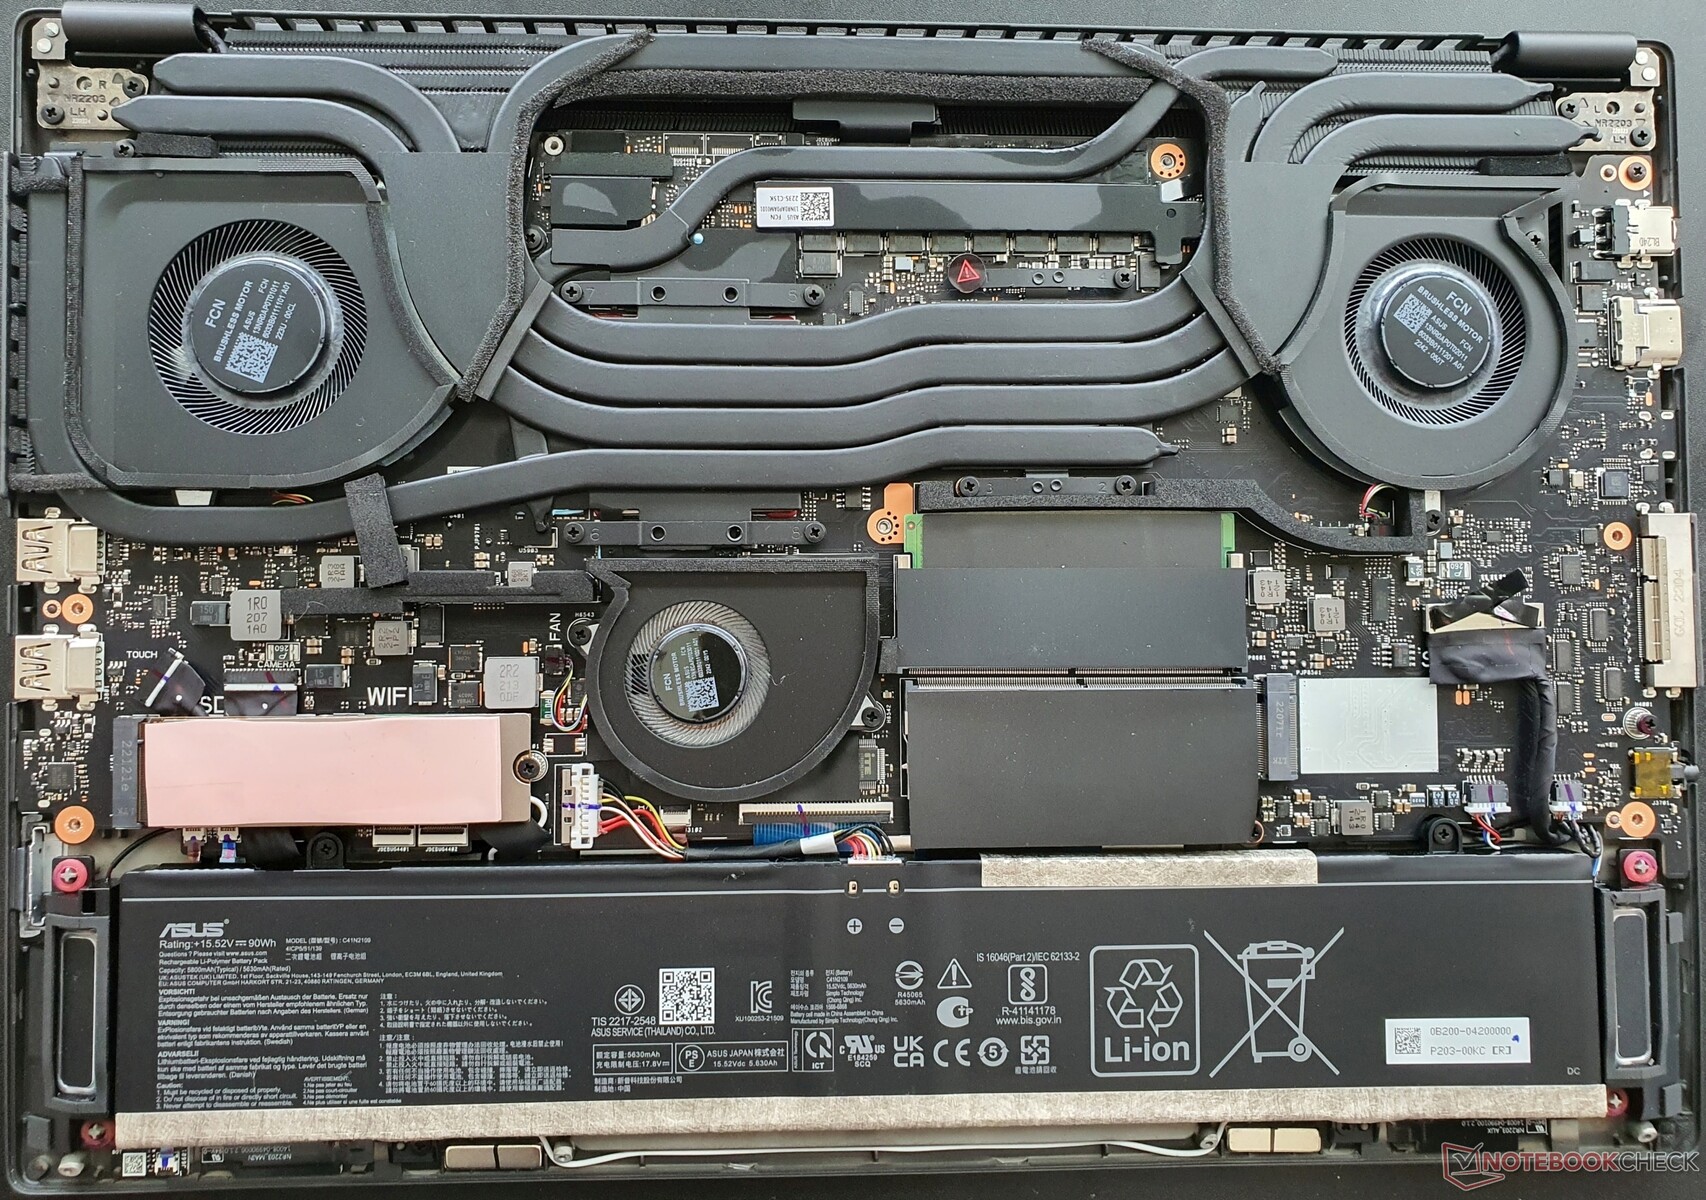
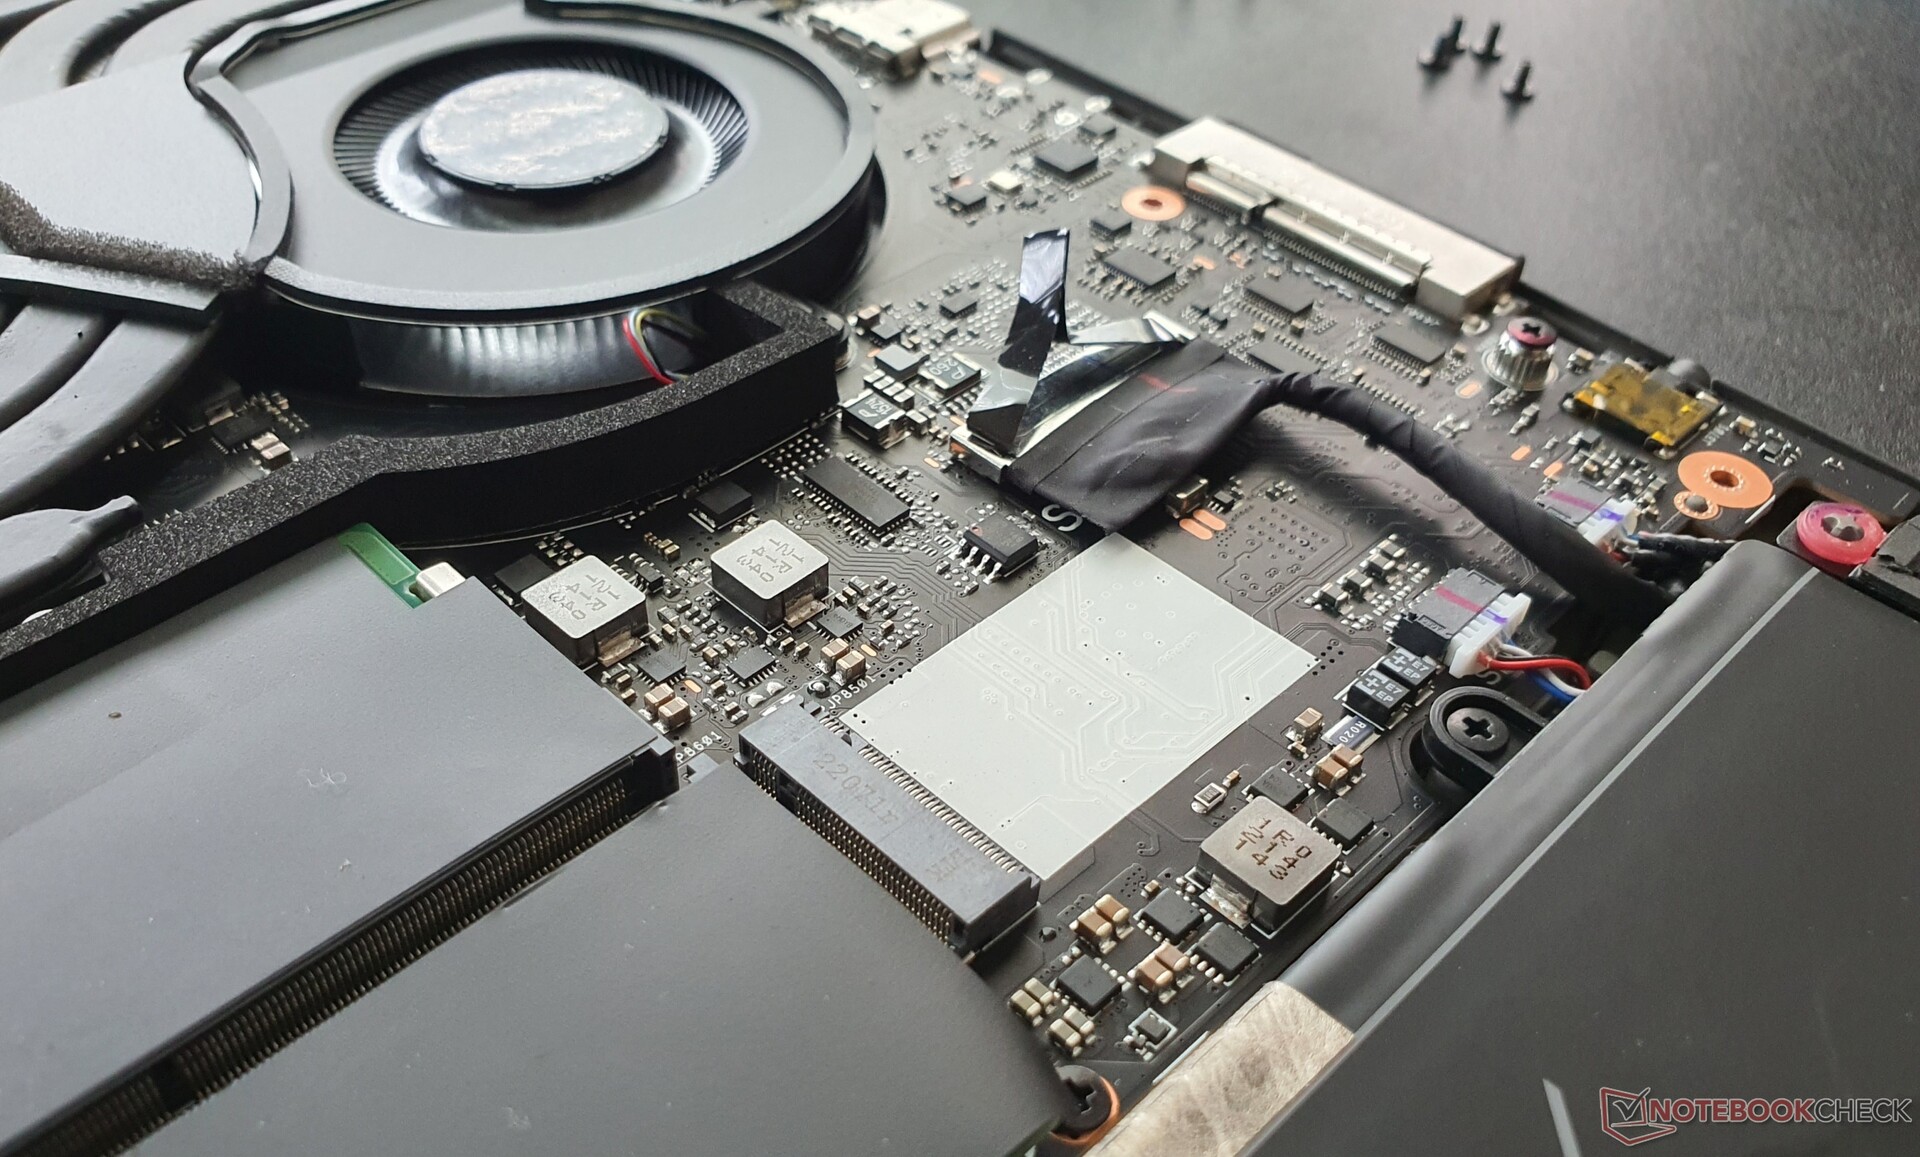
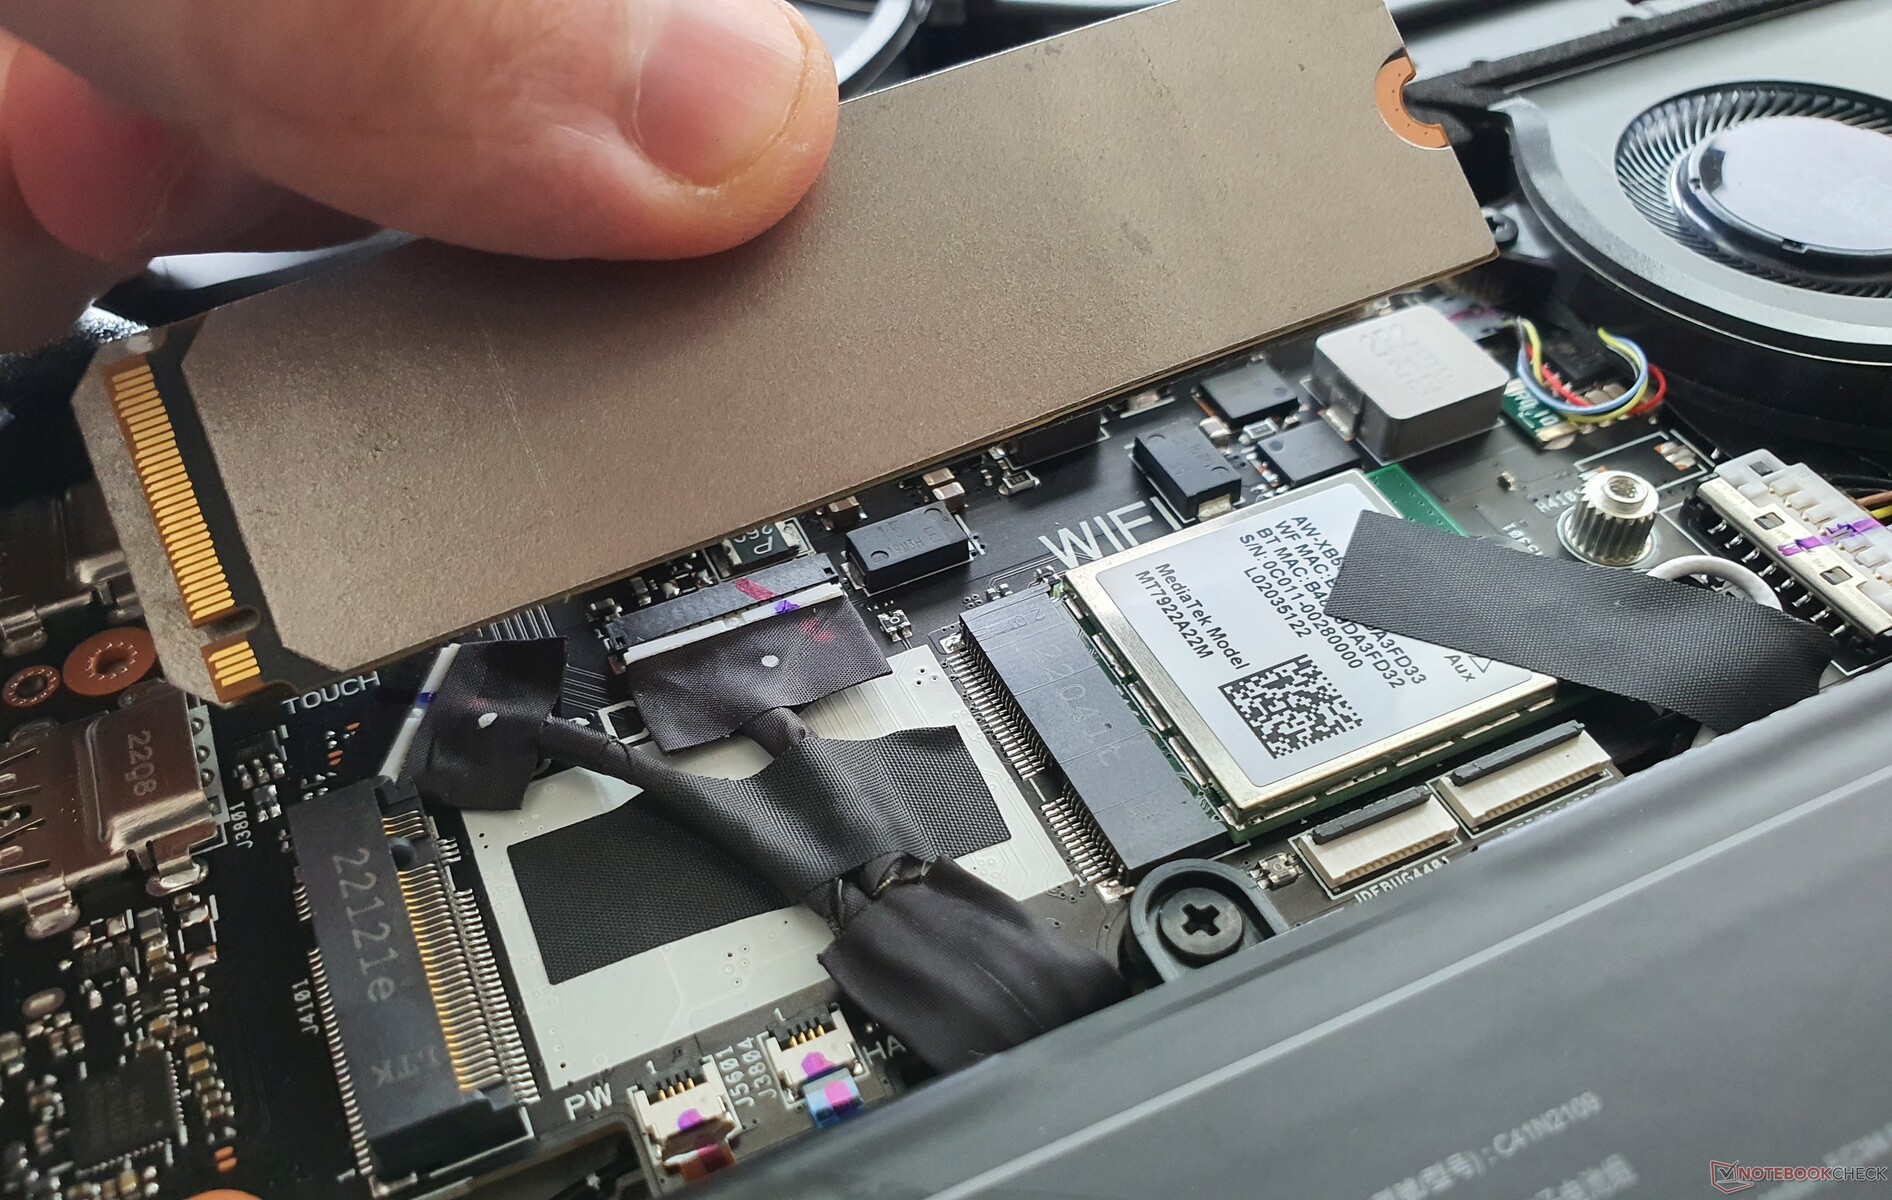
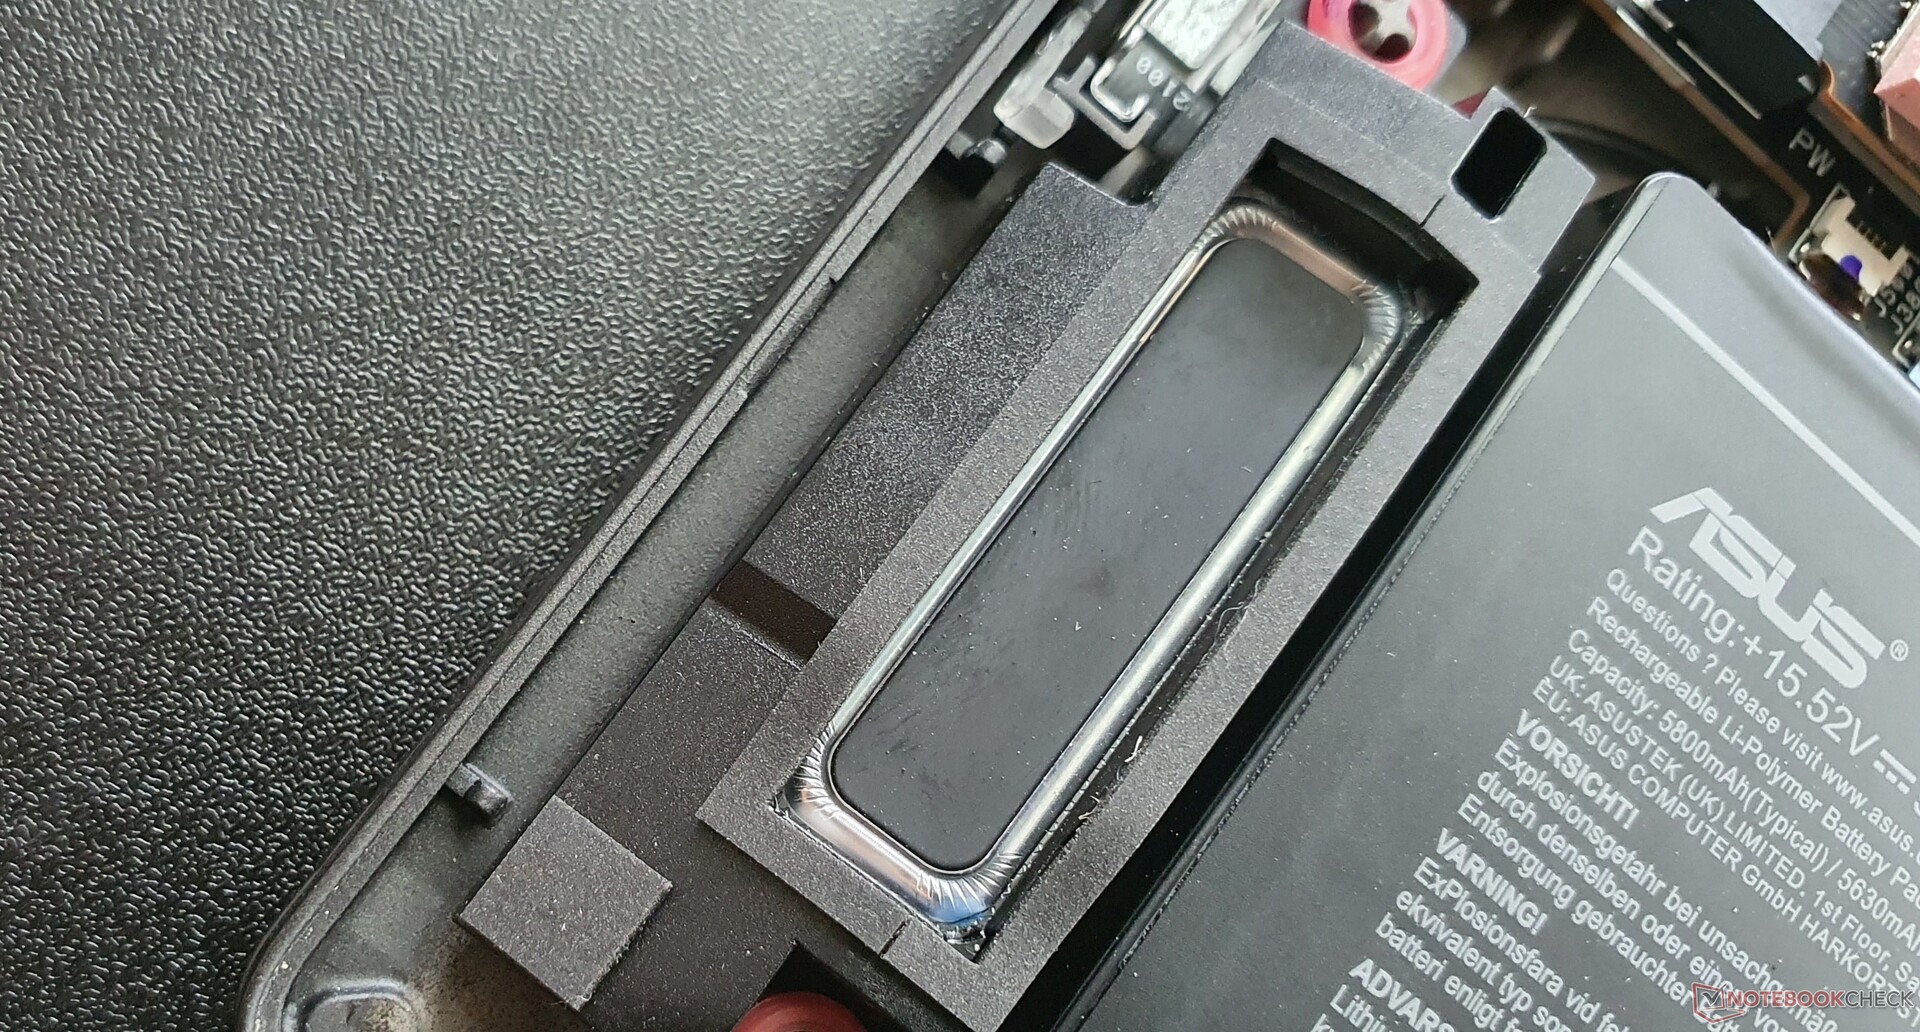
hay que aflojar 13 tornillos Phillips para retirar la placa base de plástico. Además, hay que aflojar algunos clips con una espátula o un pico. En el interior nos esperan tres ventiladores (1 de la CPU, 1 de la GPU y 1 del sistema) que se pueden limpiar. La batería está atornillada y, por lo tanto, puede ser reemplazada.
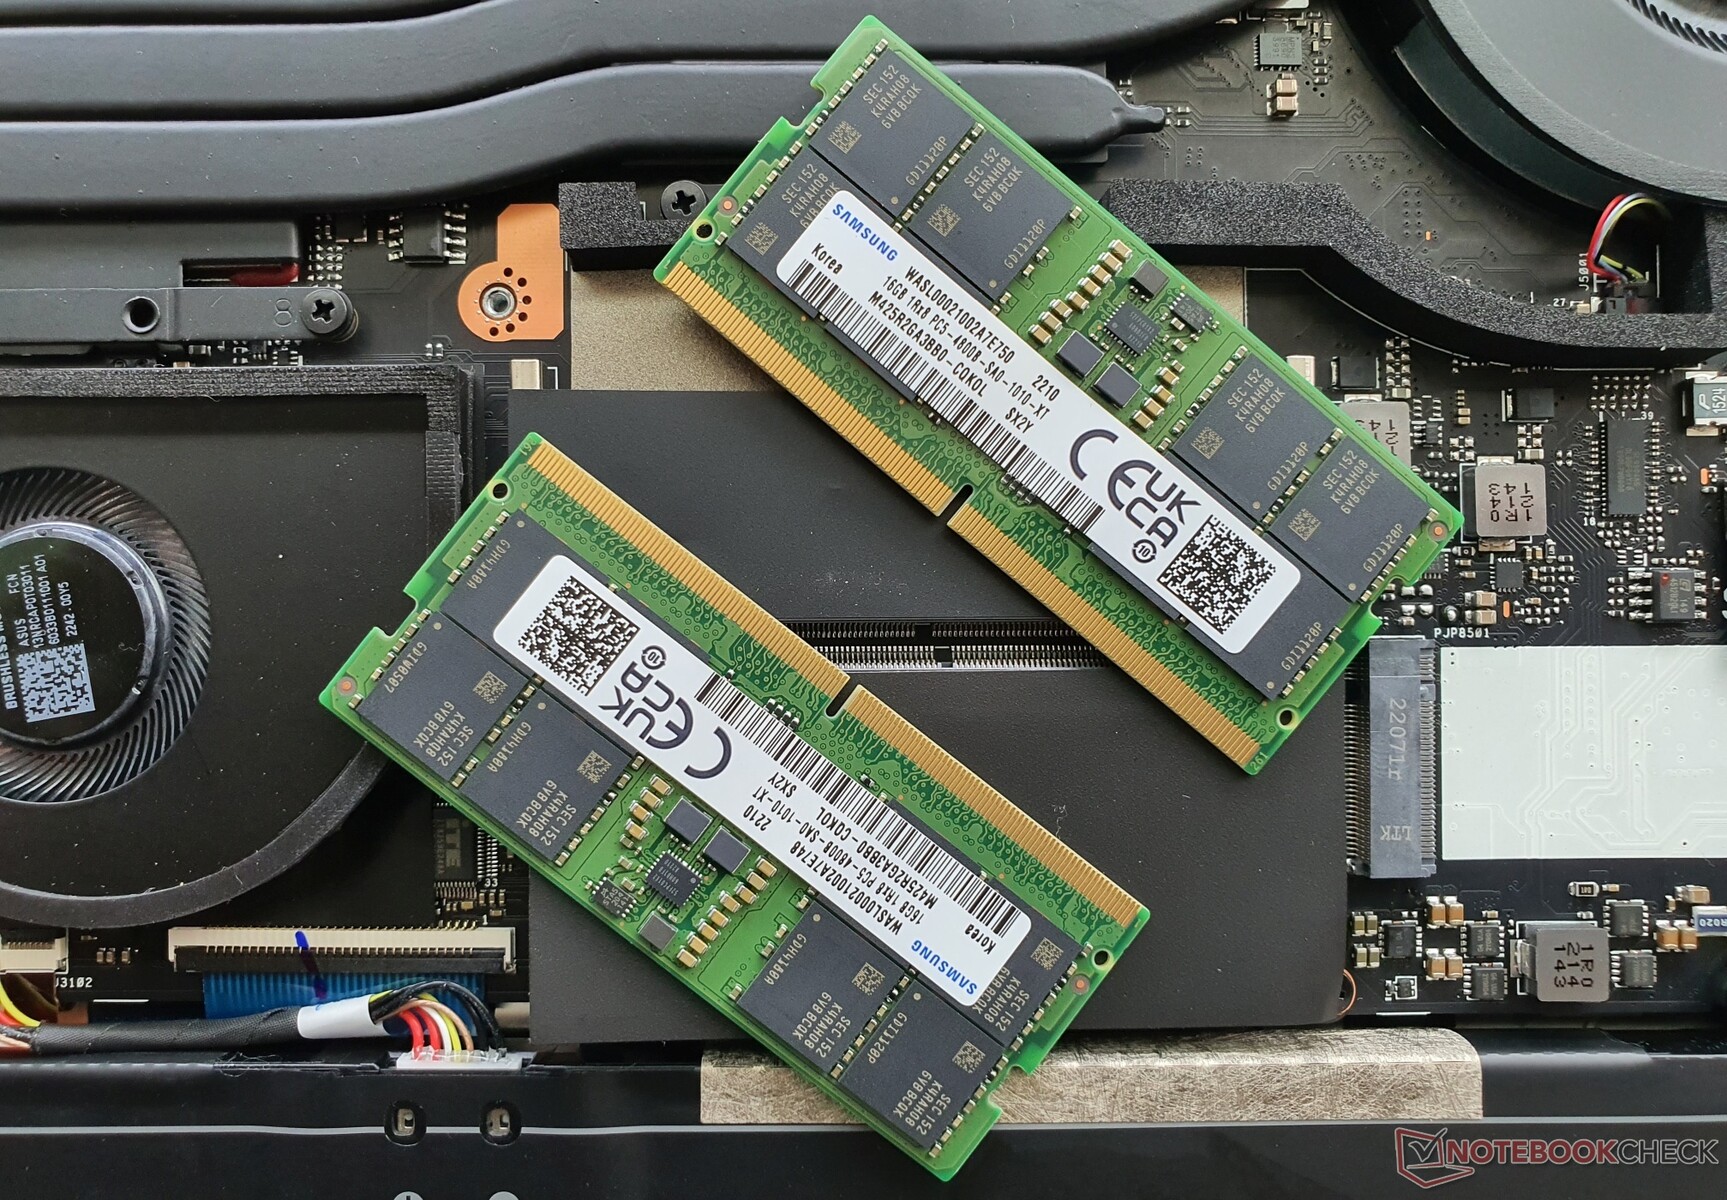
Además, la RAM (dos ranuras) se puede actualizar y se puede usar un SSD más grande en la ranura M.2-2280 (PCIe 4.0). Una ranura M.2-2242 está libre para otro SSD.
Garantía
En Alemania, Asus ofrece una garantía de 24 meses con servicio de recogida y devolución para el ROG Flow X16. Esto puede variar según la ubicación, así que asegúrate de consultar con tu proveedor antes de comprar
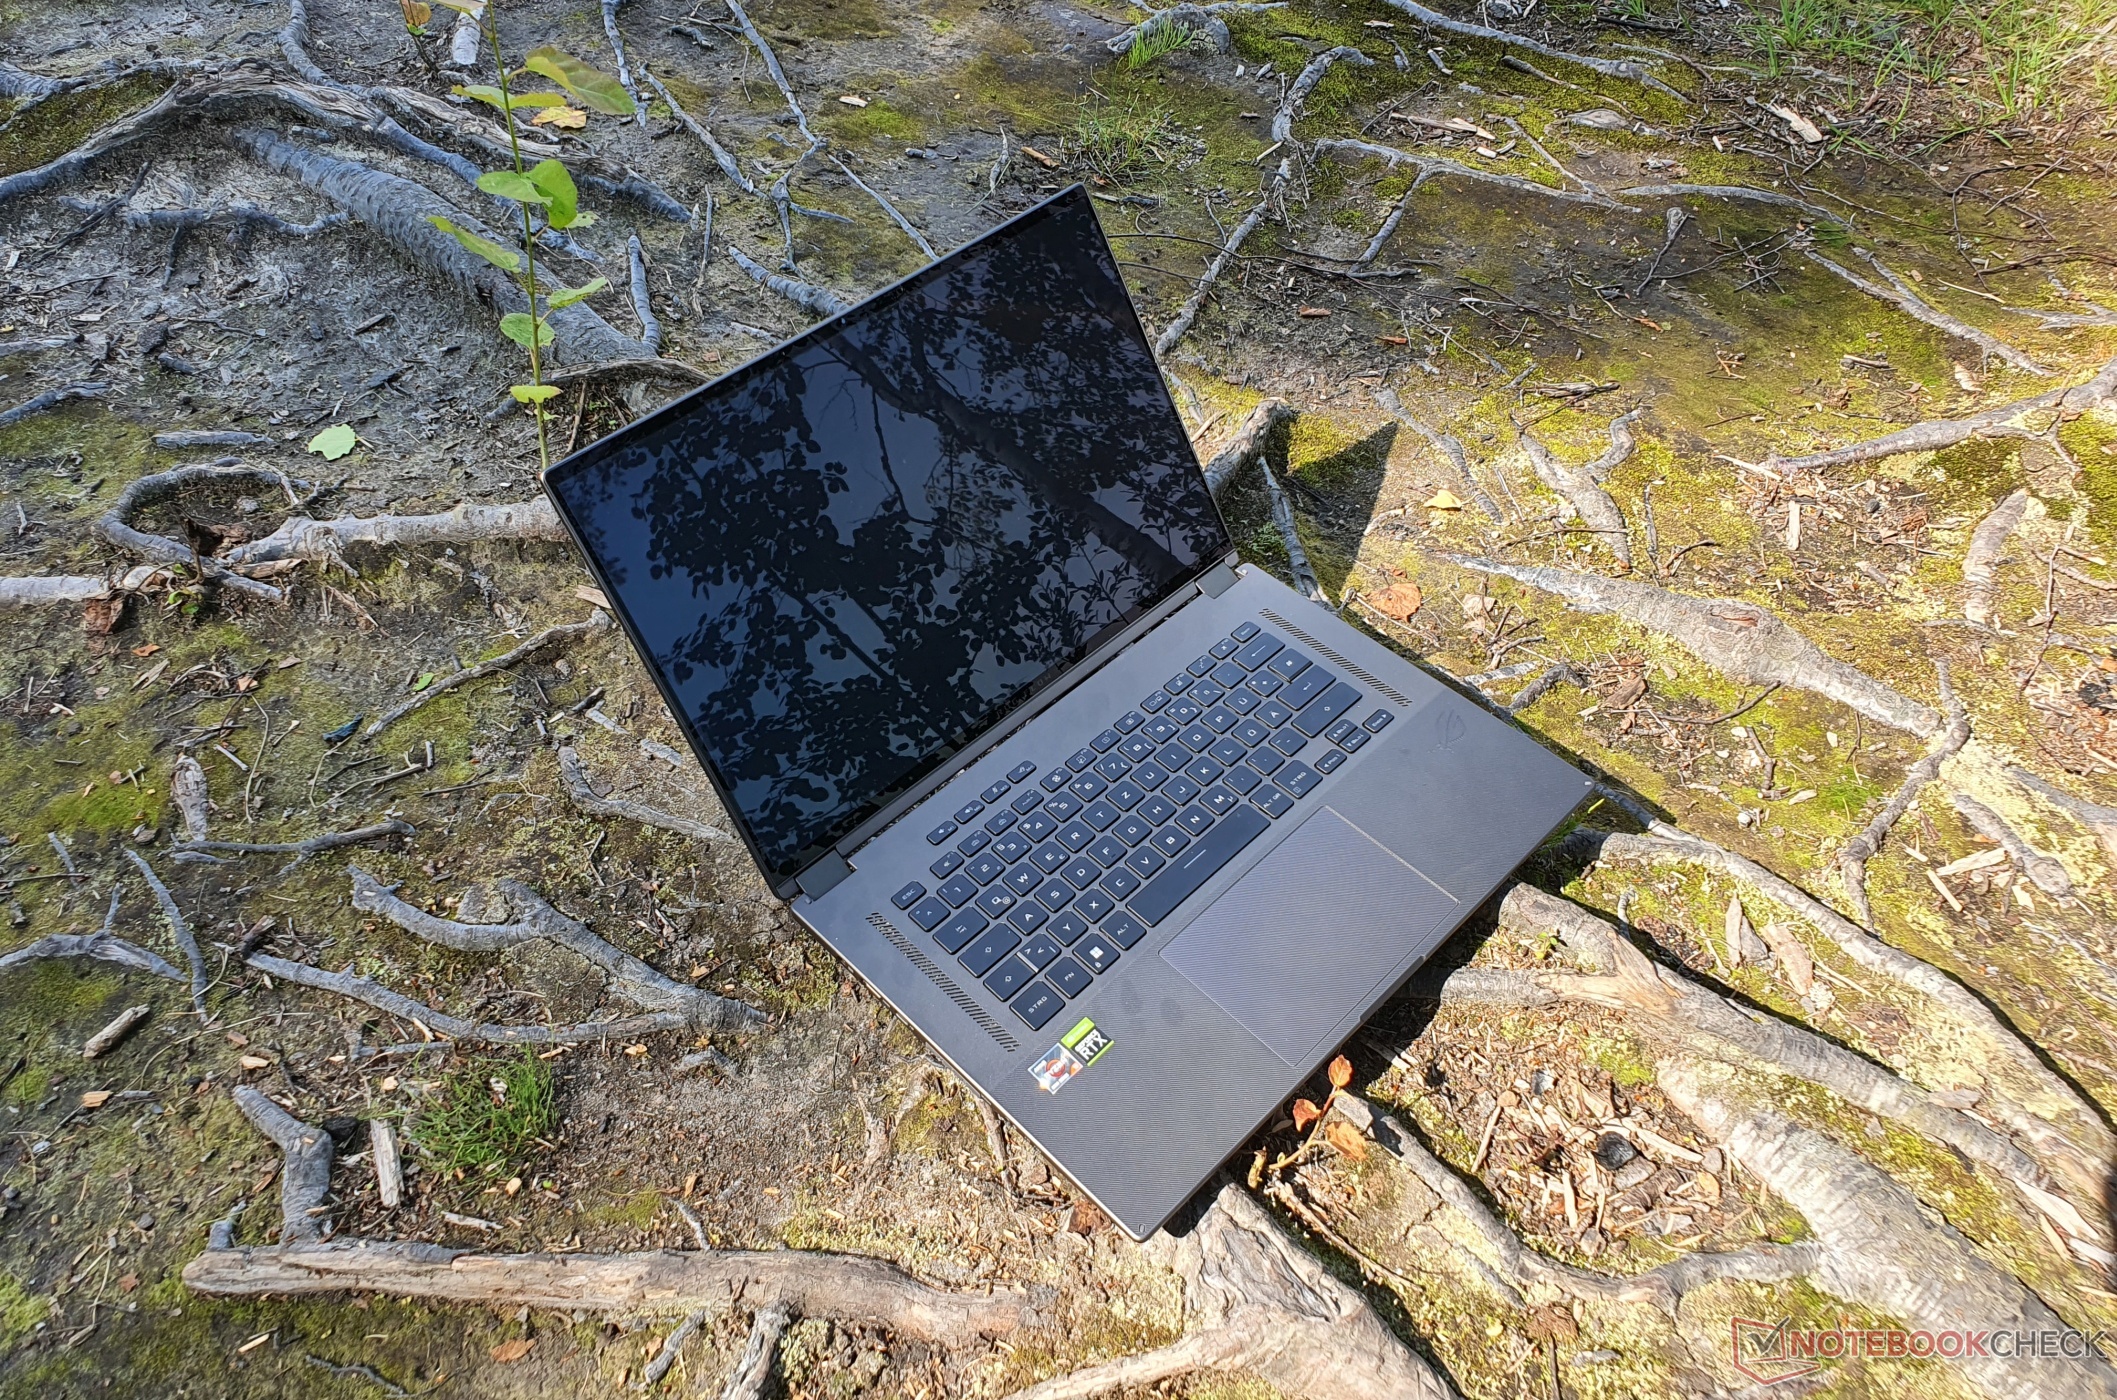
Dispositivos de entrada - Teclado retroiluminado RGB con recorrido de 1,7 mm
Teclado
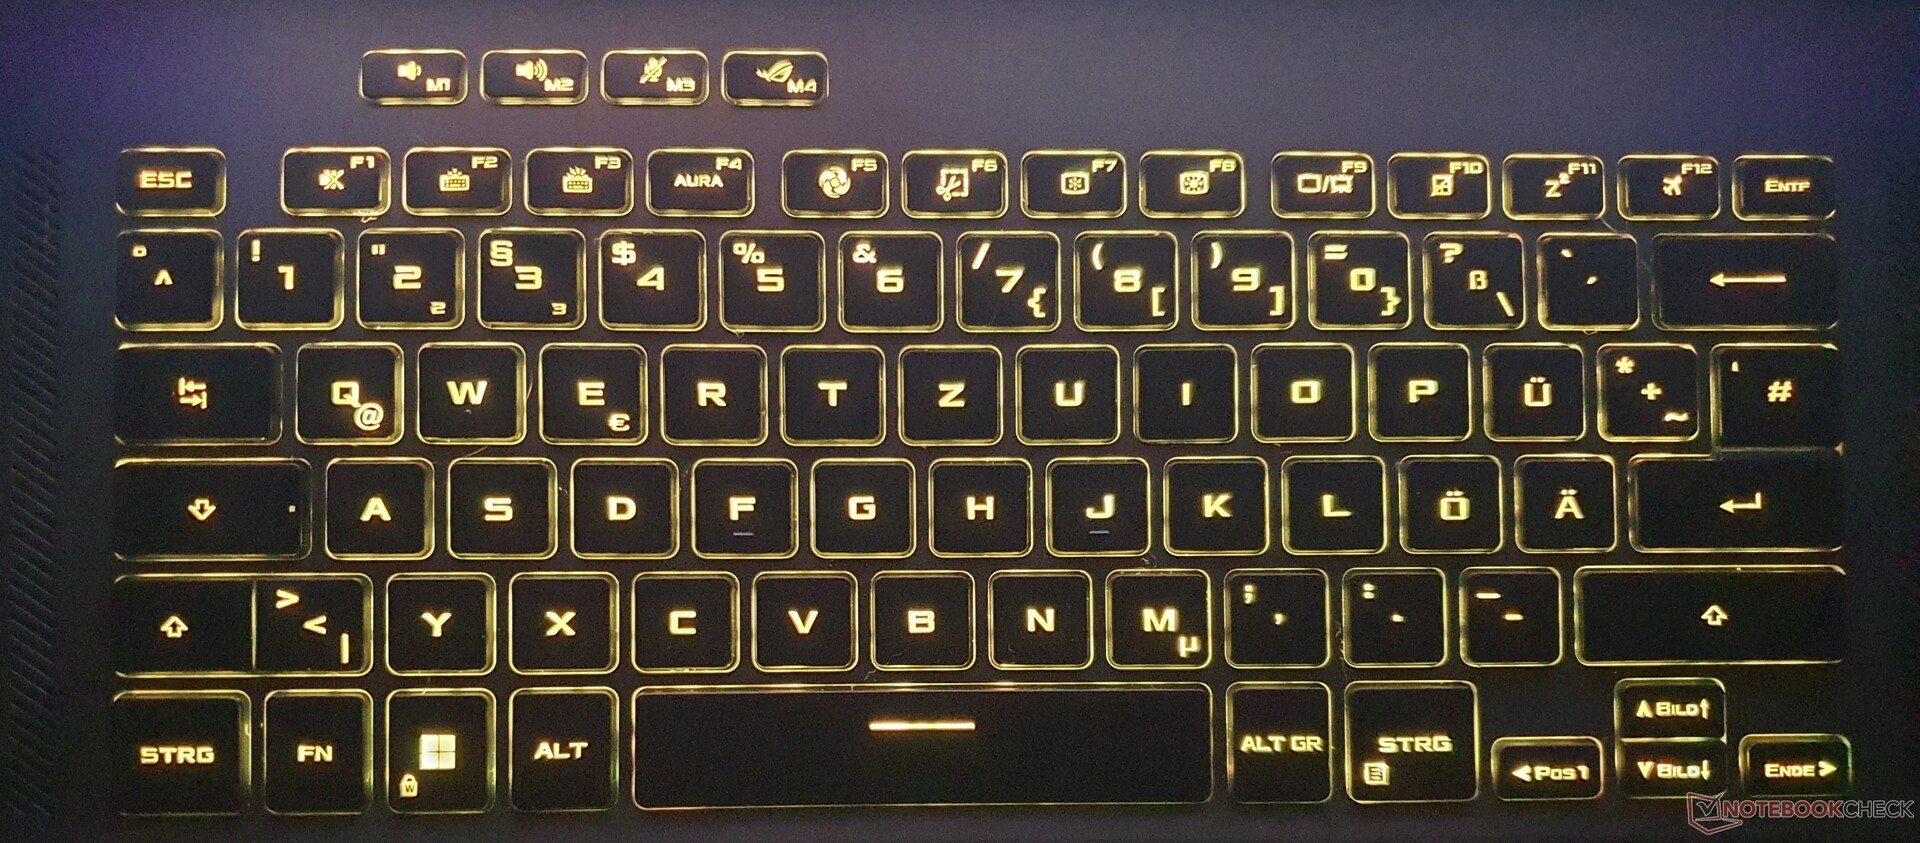
Asus instala un teclado chiclet de 6 filas en el ROG Flow X16, cuyas teclas son algo más pequeñas con 15 x 15 mm. Las letras son aún más grandes y presentan una tipografía especial. Típico portátil para juegos
El recorrido de 1,7 mm es generoso y el punto de presión se nota con golpes claros, pero la resistencia de las teclas puede ser demasiado baja para algunas personas, que subjetivamente se sienten ligeramente esponjosas. Las teclas no son cóncavas, a diferencia de algunos portátiles de negocios, pero nada se interpone en el camino de la escritura rápida después de un corto período de familiarización. Básicamente, se instala el mismo teclado que en el Zephyrus M16. Se admite el rollover de N-teclas para permitir el registro correcto de múltiples pulsaciones de teclas simultáneamente.
La iluminación RGB se puede ajustar en tres niveles de intensidad. Sin embargo, las teclas no se pueden programar individualmente (es decir, por tecla RGB). La distribución es buena y sin sorpresas. Las teclas de dirección tienen la mitad de tamaño, la tecla enter está dividida y se han asignado las asignaciones dobles habituales.
Panel táctil y pantalla táctil
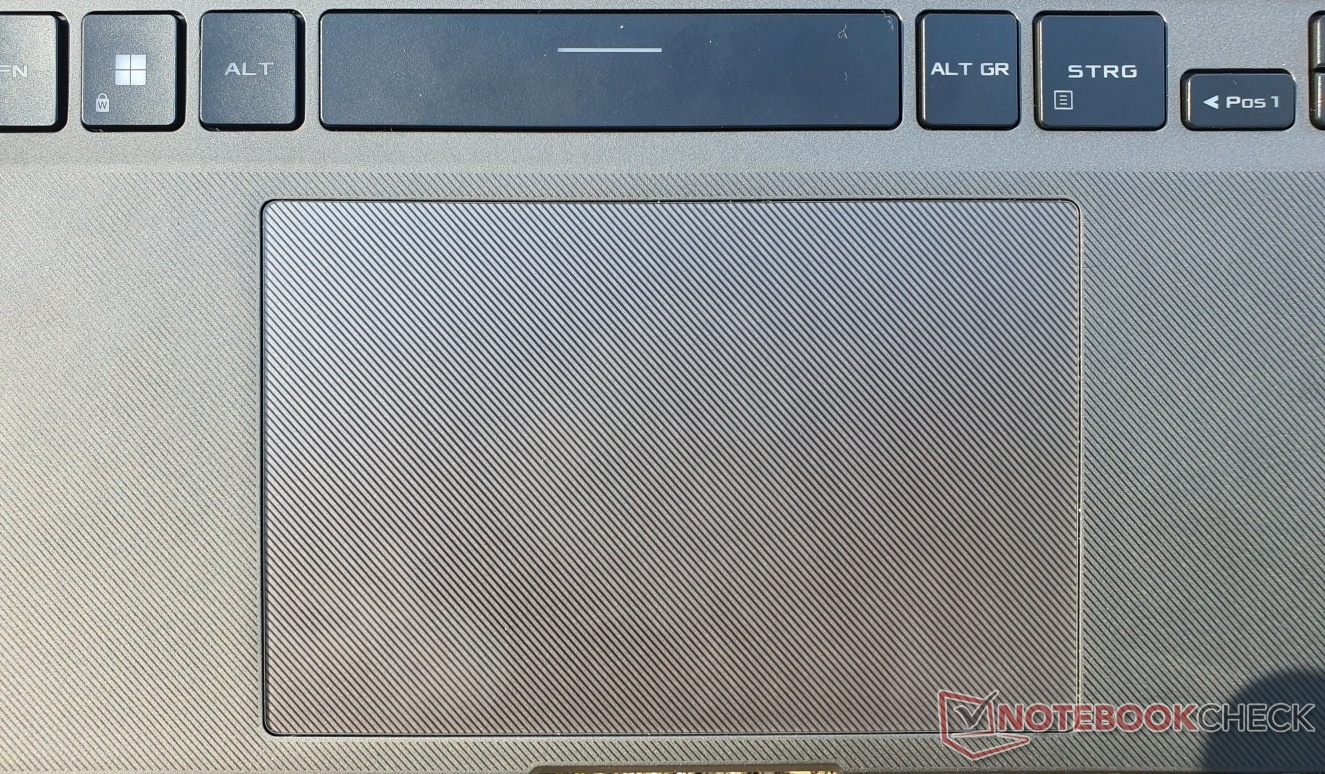
El gran panel táctil de cristal mide 13 x 8,5 cm y ofrece excelentes propiedades de deslizamiento. La respuesta y la precisión son de alto nivel. Los gestos multitáctiles y el desplazamiento funcionan sin problemas
Las teclas integradas hacen un clic silencioso, tienen un recorrido corto y una respuesta satisfactoria. Sin embargo, el touchpad falló después de un corto tiempo y no pudo ser reactivado. Sospechamos que esto se debe a un problema de drivers que sólo se aplica a nuestro modelo de preproducción.
Todos los modelos del ROG X16 Flow vienen con una pantalla táctil. La respuesta y la precisión son buenas - el desplazamiento es especialmente divertido con la tasa de refresco de 165 Hz. El lápiz táctil incluido (Asus SA201H) tiene 4.096 niveles de presión y funciona con una pila AAAA. Se desliza con rapidez y precisión sobre la pantalla táctil y la punta del lápiz ofrece una respuesta adecuada, al igual que los dos botones integrados en la parte inferior.
¿La mejor pantalla para juegos? Mini-LED con HDR 1000

El ROG Flow X16 puede pedirse con o sin retroiluminación mini-LED. Algunas características no cambian: la resolución de 2560x1600 en formato 16:10, una tasa de refresco de 165 Hz y una pantalla táctil brillante con soporte para stylus.
El mini-LED instalado en nuestra variante soporta DisplayHDR 1000 por primera vez en un portátil de juegos, junto con el propio Zephyrus Duo 16 de Asus. Sin embargo, este último modelo también ofrece una variante mate no táctil.
El contenido se ve aún más atractivo con DisplayHDR 1000 activado, en comparación con los portátiles anteriores que sólo soportaban HDR 400 con mejoras de imagen significativamente menores. Los únicos otros portátiles con DisplayHDR 1000 hasta ahora han sido el MSI Creator 17 (2020) y el Apple's MacBook Pro 16 (2021). El Legion Slim 7i de Lenovo con pantalla mini-LED también debería estar disponible a finales de este año
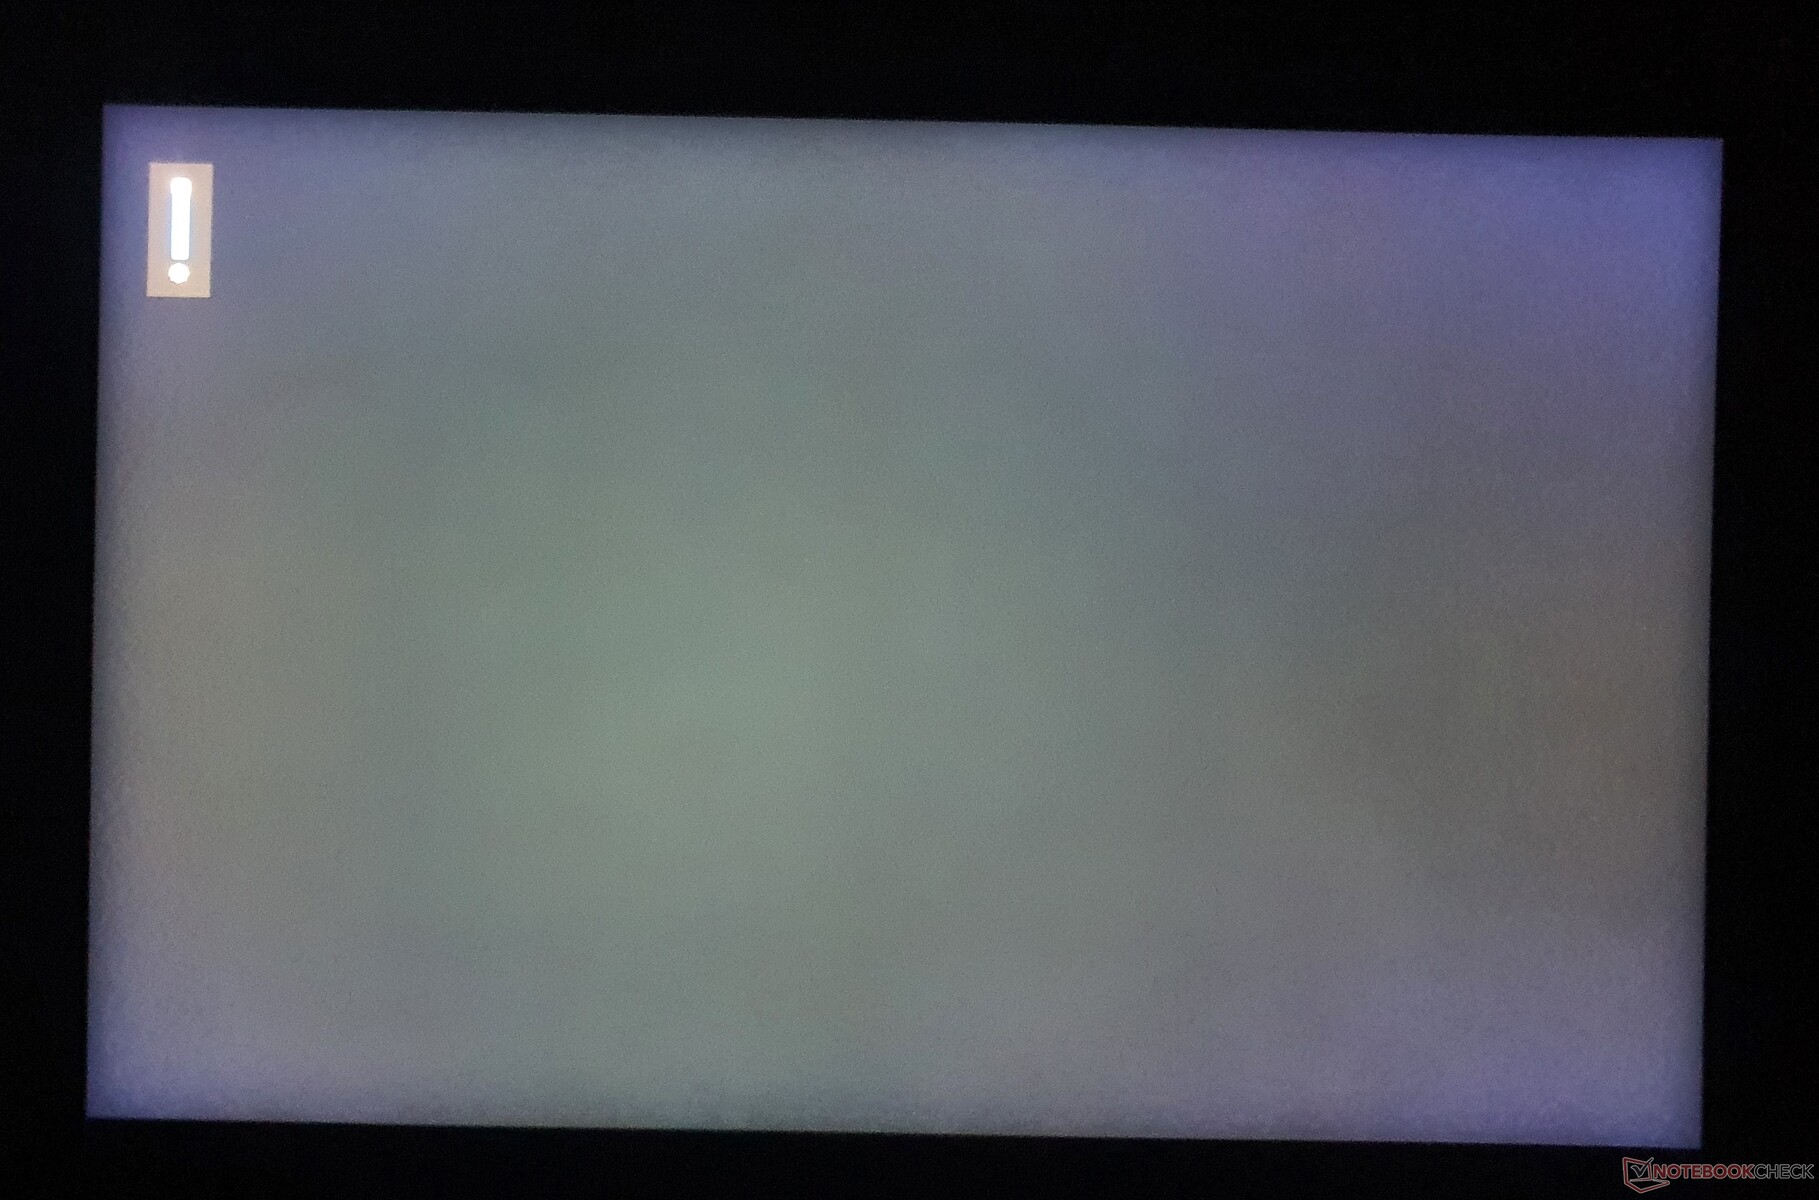
La percepción subjetiva de la imagen es excelente. Los colores se muestran muy bien, el brillo máximo de ~1.100 nits con HDR activado (también funciona en modo de escritorio normal) es sobresaliente, y el nivel de negro de 0,11 nits es casi tan rico como en OLED, mientras que la relación de contraste de 4.527:1 es muy buena, como es típico de los mini-LED. Nuestras mediciones se realizaron en modo SDR. En el modo HDR, la relación de contraste suele ser mucho mayor, sobre todo debido a las 512 zonas de atenuación local activadas de nuestra pantalla: Las zonas de píxeles individuales se apagan completamente en cuanto se muestra el negro, o las zonas brillan mucho con el contenido HDR. No hay halos, lo que también explica la sólida homogeneidad de la iluminación del 95%. El brillo medio del HDR suele estar un 20% por debajo del brillo máximo (no se ha medido).
Junto con una velocidad de fotogramas de 165 Hz y unos buenos tiempos de respuesta de 11 ms cada uno (de gris a gris y de negro a blanco), la pantalla no tiene rival en los juegos HDR. Es compatible con Adaptive Sync. Sólo aquellos que jueguen sobre todo a shooters de ritmo rápido es probable que busquen alternativas con frecuencias de cuadro aún más altas y tiempos de respuesta más bajos, como elMSI Stealth GS66y pueden preferir una resolución Full HD más baja, ya que los FPS máximos y la velocidad tienen prioridad absoluta en los shooters de ritmo rápido. Pero como el ROG X16 Flow también está diseñado para los creadores, no sólo es ideal para el contenido HDR en los juegos, sino también en la edición
En general, sólo Apple's MacBook Pro 16 con su propia pantalla Mini LED se acerca a la calidad de la pantalla. Los paneles OLED, como en Gigabyte Aero 16, no son lo suficientemente brillantes para DisplayHDR 1000. Por otro lado, el mini-LED muestra "blooming" (es decir, la luz de los LEDs brillantes brilla en el contenido circundante, más oscuro, similar al sangrado de retroiluminación, ya que las zonas de atenuación local son más grandes que los píxeles) en nuestro dispositivo de revisión, pero esto es algo menos pronunciado que en el MacBook o el iPad Pro 12.9 con el chip M1. El PWM es algo que siempre hemos observado en las pantallas mini-LED hasta ahora, pero la altísima frecuencia de 7.400 MHz no debería suponer ningún problema, ni siquiera para los usuarios sensibles.
| |||||||||||||||||||||||||
iluminación: 94 %
Brillo con batería: 502 cd/m²
Contraste: 4527:1 (Negro: 0.11 cd/m²)
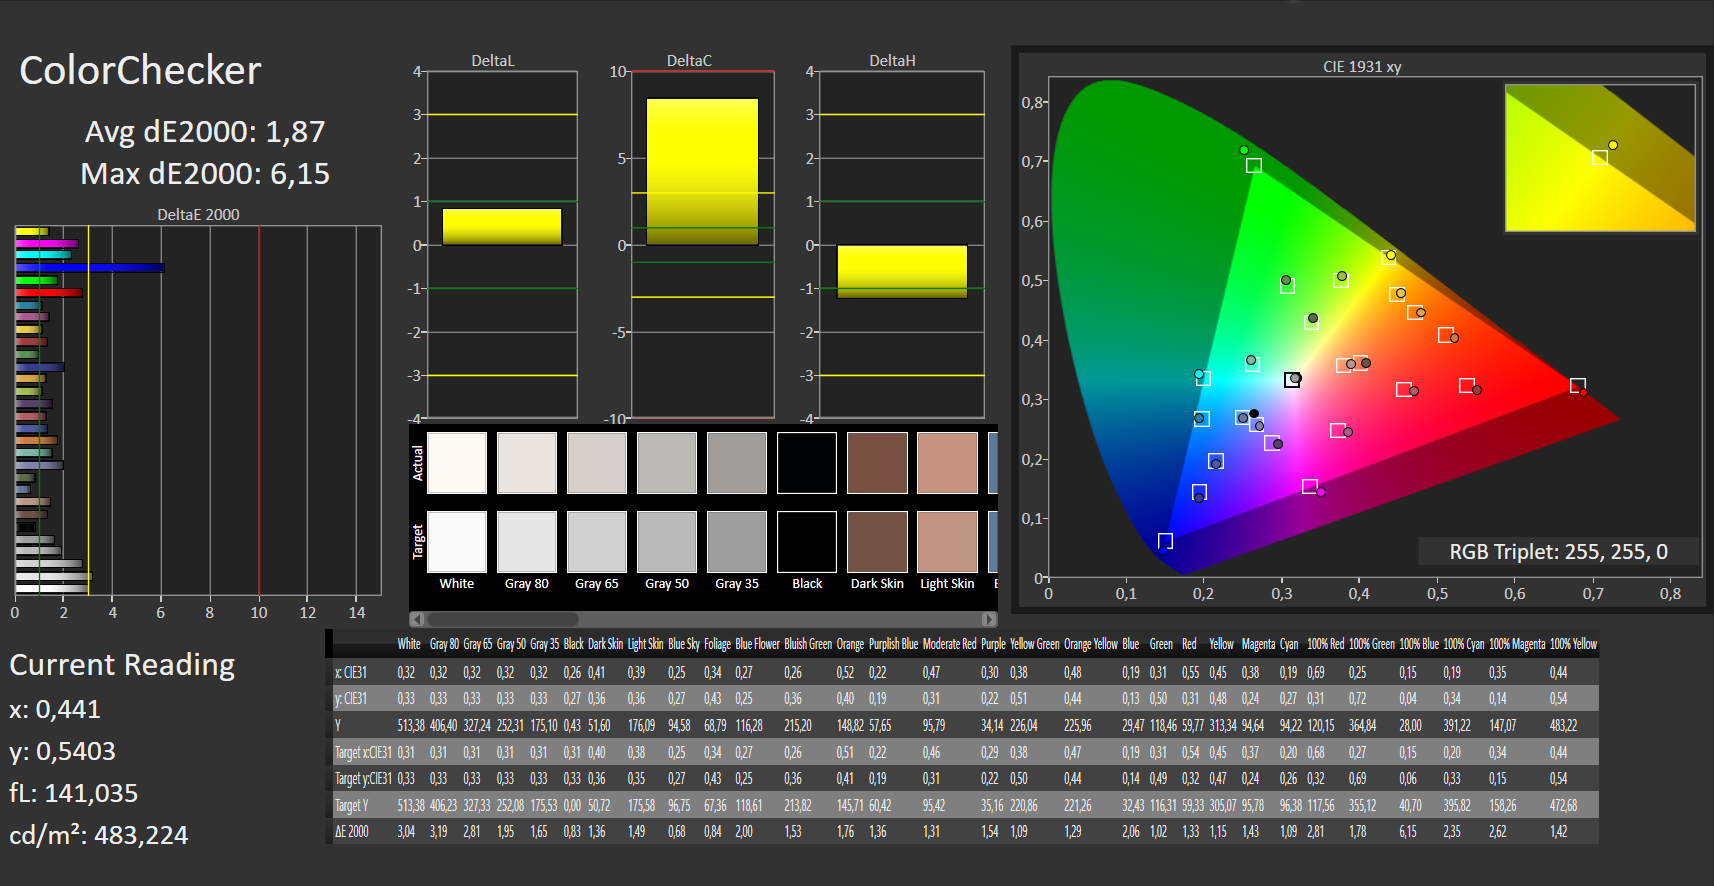
ΔE ColorChecker Calman: 1.87 | ∀{0.5-29.43 Ø4.72}
calibrated: 1.94
ΔE Greyscale Calman: 3.15 | ∀{0.09-98 Ø4.97}
90.21% AdobeRGB 1998 (Argyll 3D)
99.99% sRGB (Argyll 3D)
99.82% Display P3 (Argyll 3D)
Gamma: 330.95
CCT: 7294 K
| Asus ROG Flow X16 GV601RW-M5082W AUO B160QAN02.S, Mini LED, 2560x1600, 16.1" | Asus ROG Zephyrus M16 GU603H AU Optronics AUOC199, IPS, 2560x1600, 16" | Gigabyte Aero 16 YE5 Samsung SDC416B, AMOLED, 3840x2400, 16" | MSI Stealth GS66 12UGS Sharp LQ156T1JW04 (SHP153C), IPS-Level, 2560x1440, 15.6" | Lenovo Legion 5 Pro 16 G7 i7 RTX 3070Ti NE160QDM-NY1, IPS, 2560x1600, 16" | Apple MacBook Pro 16 2021 M1 Pro Liquid Retina XDR, Mini-LED, 3456x2234, 16.2" | Lenovo ThinkPad X1 Extreme G4-20Y5CTO1WW (3050 Ti) LP160UQ1-SPB1, IPS LED, 3840x2400, 16" | Dell XPS 17 9720 RTX 3060 Sharp LQ170R1, IPS, 3840x2400, 17" | Microsoft Surface Laptop Studio i7 RTX 3050 Ti LQ144P1JX01, IPS, 2400x1600, 14.4" | |
|---|---|---|---|---|---|---|---|---|---|
| Display | -3% | -18% | -1% | -3% | -4% | -11% | |||
| Display P3 Coverage (%) | 99.82 | 96.4 -3% | 68.7 -31% | 99.1 -1% | 84.3 -16% | 92.9 -7% | 80.6 -19% | ||
| sRGB Coverage (%) | 99.99 | 99.7 0% | 97.6 -2% | 100 0% | 98.3 -2% | 100 0% | 99.9 0% | ||
| AdobeRGB 1998 Coverage (%) | 90.21 | 85.6 -5% | 70.9 -21% | 88 -2% | 97.8 8% | 85.3 -5% | 78.5 -13% | ||
| Response Times | 51% | 80% | 35% | -15% | -511% | -364% | -293% | -275% | |
| Response Time Grey 50% / Grey 80% * (ms) | 11 ? | 4.8 ? 56% | 2.4 ? 78% | 6 ? 45% | 17.6 ? -60% | 42.8 ? -289% | 60 ? -445% | 51.2 ? -365% | 58.4 ? -431% |
| Response Time Black / White * (ms) | 11 ? | 6 ? 45% | 2 ? 82% | 8.4 ? 24% | 7.6 ? 31% | 91.6 ? -733% | 42 ? -282% | 35.2 ? -220% | 24 ? -118% |
| PWM Frequency (Hz) | 7400 ? | 60 ? | 14880 | 5000 ? | |||||
| Screen | -61% | 104% | -57% | -32% | 82% | -32% | -90% | -5% | |
| Brightness middle (cd/m²) | 498 | 448 -10% | 368 -26% | 272 -45% | 502 1% | 514 3% | 639 28% | 512.7 3% | 497 0% |
| Brightness (cd/m²) | 502 | 446 -11% | 368 -27% | 253 -50% | 491 -2% | 497 -1% | 612 22% | 463 -8% | 491 -2% |
| Brightness Distribution (%) | 94 | 86 -9% | 93 -1% | 87 -7% | 91 -3% | 95 1% | 84 -11% | 85 -10% | 92 -2% |
| Black Level * (cd/m²) | 0.11 | 0.48 -336% | 0.01 91% | 0.25 -127% | 0.37 -236% | 0.02 82% | 0.47 -327% | 0.32 -191% | 0.29 -164% |
| Contrast (:1) | 4527 | 933 -79% | 36800 713% | 1088 -76% | 1357 -70% | 25700 468% | 1360 -70% | 1602 -65% | 1714 -62% |
| Colorchecker dE 2000 * | 1.87 | 2.76 -48% | 2.33 -25% | 3.73 -99% | 2.7 -44% | 1.4 25% | 2.2 -18% | 5.98 -220% | 1.2 36% |
| Colorchecker dE 2000 max. * | 6.15 | 7.09 -15% | 4.34 29% | 9.43 -53% | 4.5 27% | 2.8 54% | 5.3 14% | 12.09 -97% | 2.8 54% |
| Colorchecker dE 2000 calibrated * | 1.94 | 2.86 -47% | 0.98 49% | 1.4 28% | 1.4 28% | 0.8 59% | |||
| Greyscale dE 2000 * | 3.15 | 3.1 2% | 0.8 75% | 6.5 -106% | 2.7 14% | 2.3 27% | 1.7 46% | 7.2 -129% | 1.9 40% |
| Gamma | 330.95 1% | 2.153 102% | 2.119 104% | 2.172 101% | 2.44 90% | 2.27 97% | 2.31 95% | 2.54 87% | 2.14 103% |
| CCT | 7294 89% | 6826 95% | 6569 99% | 6485 100% | 6326 103% | 6792 96% | 6390 102% | 6914 94% | 6821 95% |
| Color Space (Percent of AdobeRGB 1998) (%) | 87 | ||||||||
| Color Space (Percent of sRGB) (%) | 100 | ||||||||
| Media total (Programa/Opciones) | -5% /
-41% | 92% /
99% | -8% /
-32% | -22% /
-26% | -143% /
-28% | -133% /
-73% | -129% /
-101% | -97% /
-44% |
* ... más pequeño es mejor
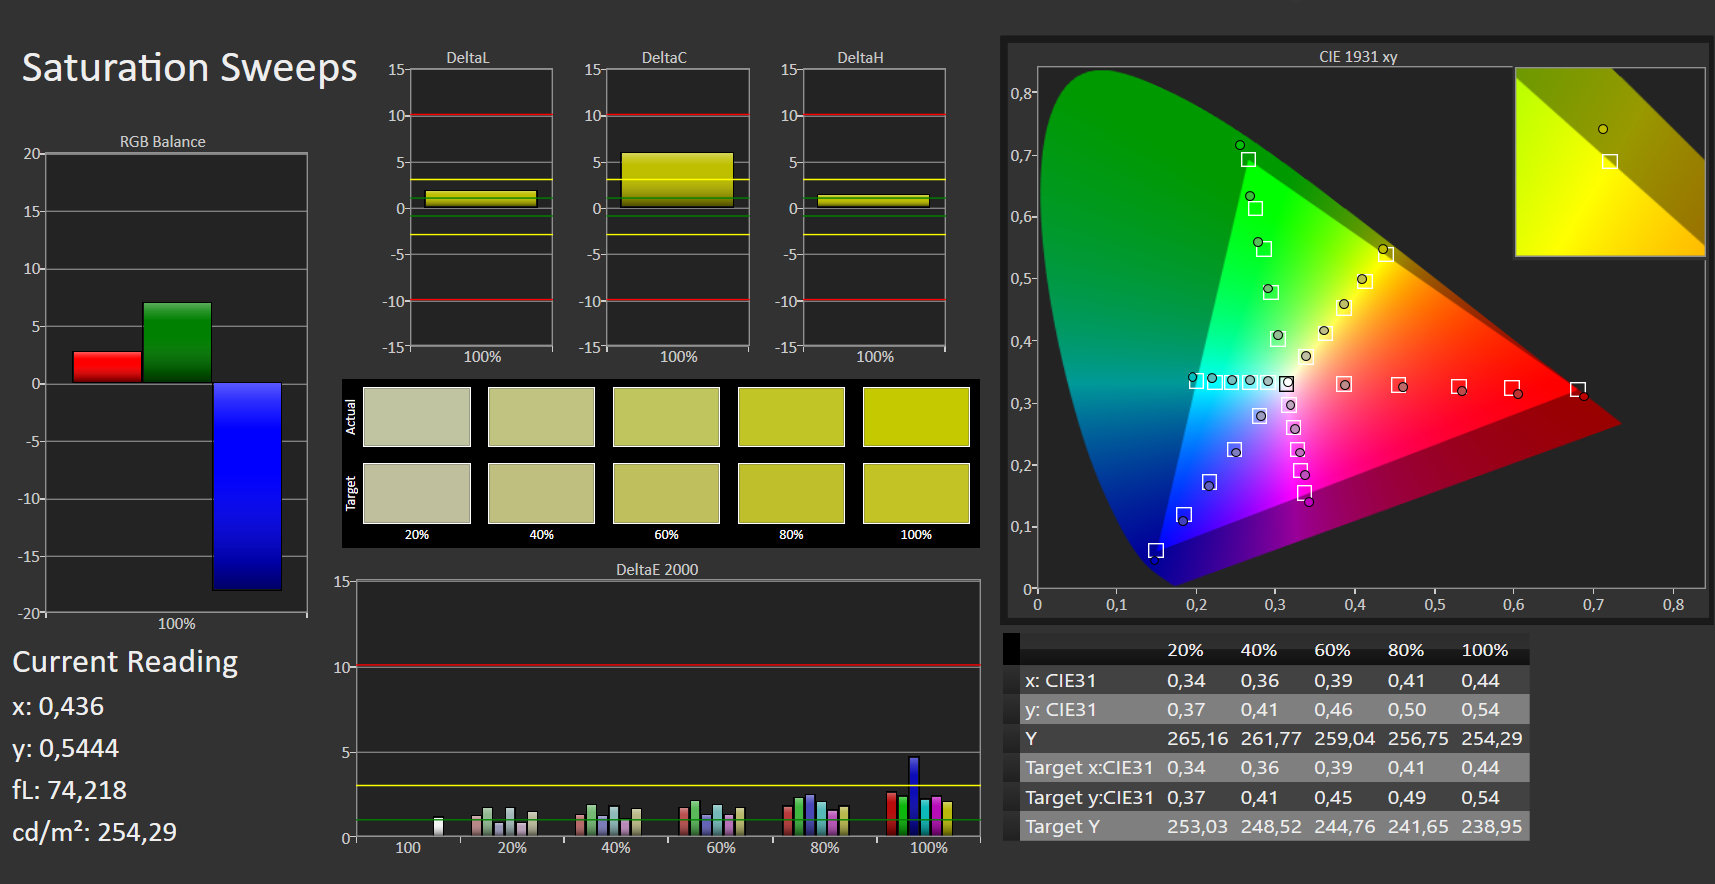
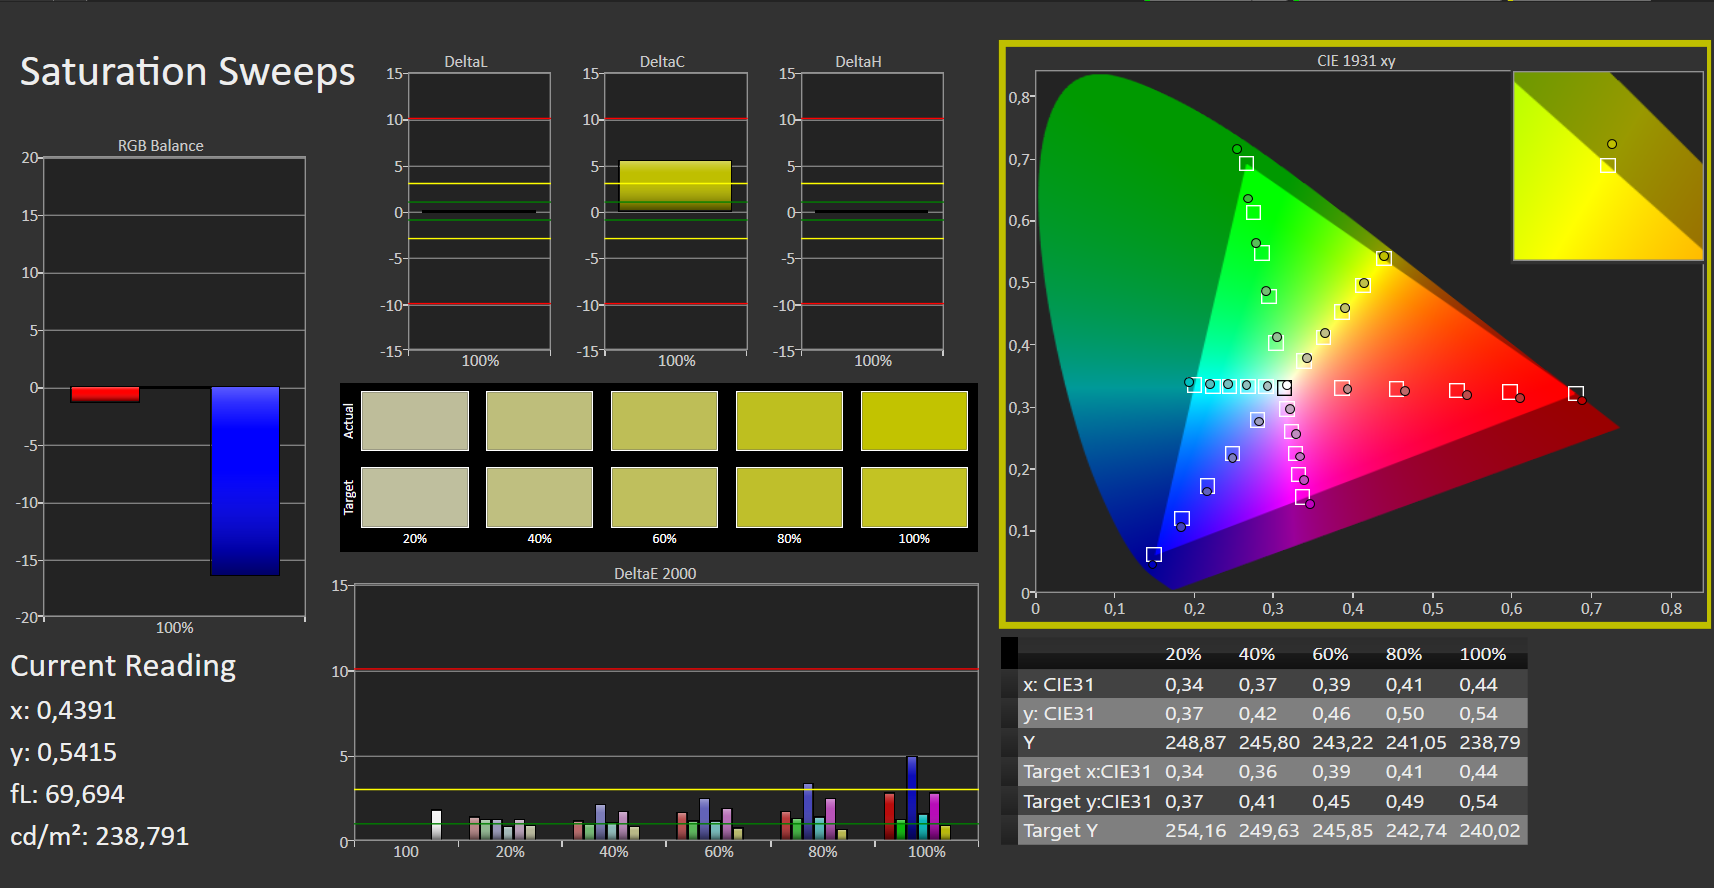
En nuestro campo de pruebas, el ROG Flow X16 es el único portátil que cubre más del 90% del espacio de color Adobe RGB (90,2%). sRGB y DCI-P3 se cubren hasta ~100%. Por tanto, nada se interpone en el camino de la exigente edición de imagen y vídeo.
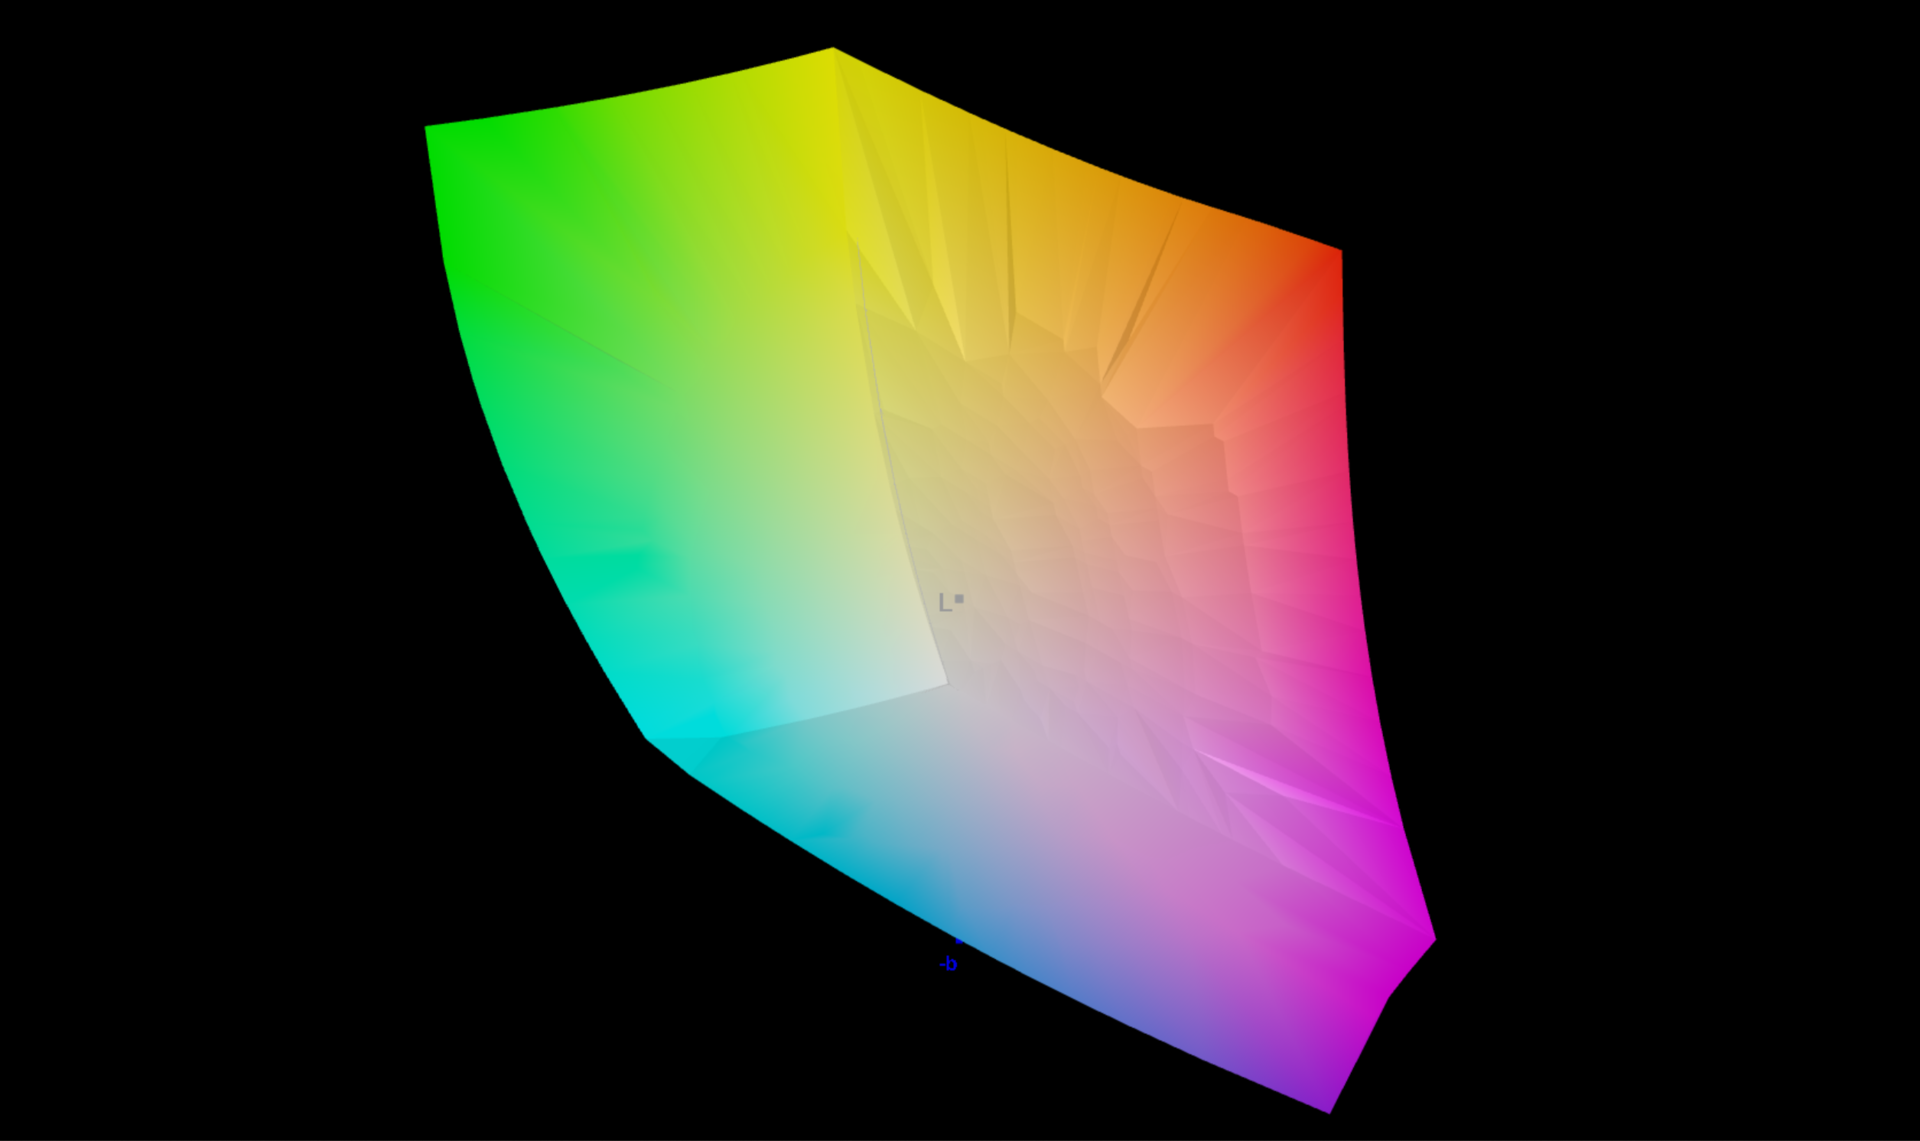
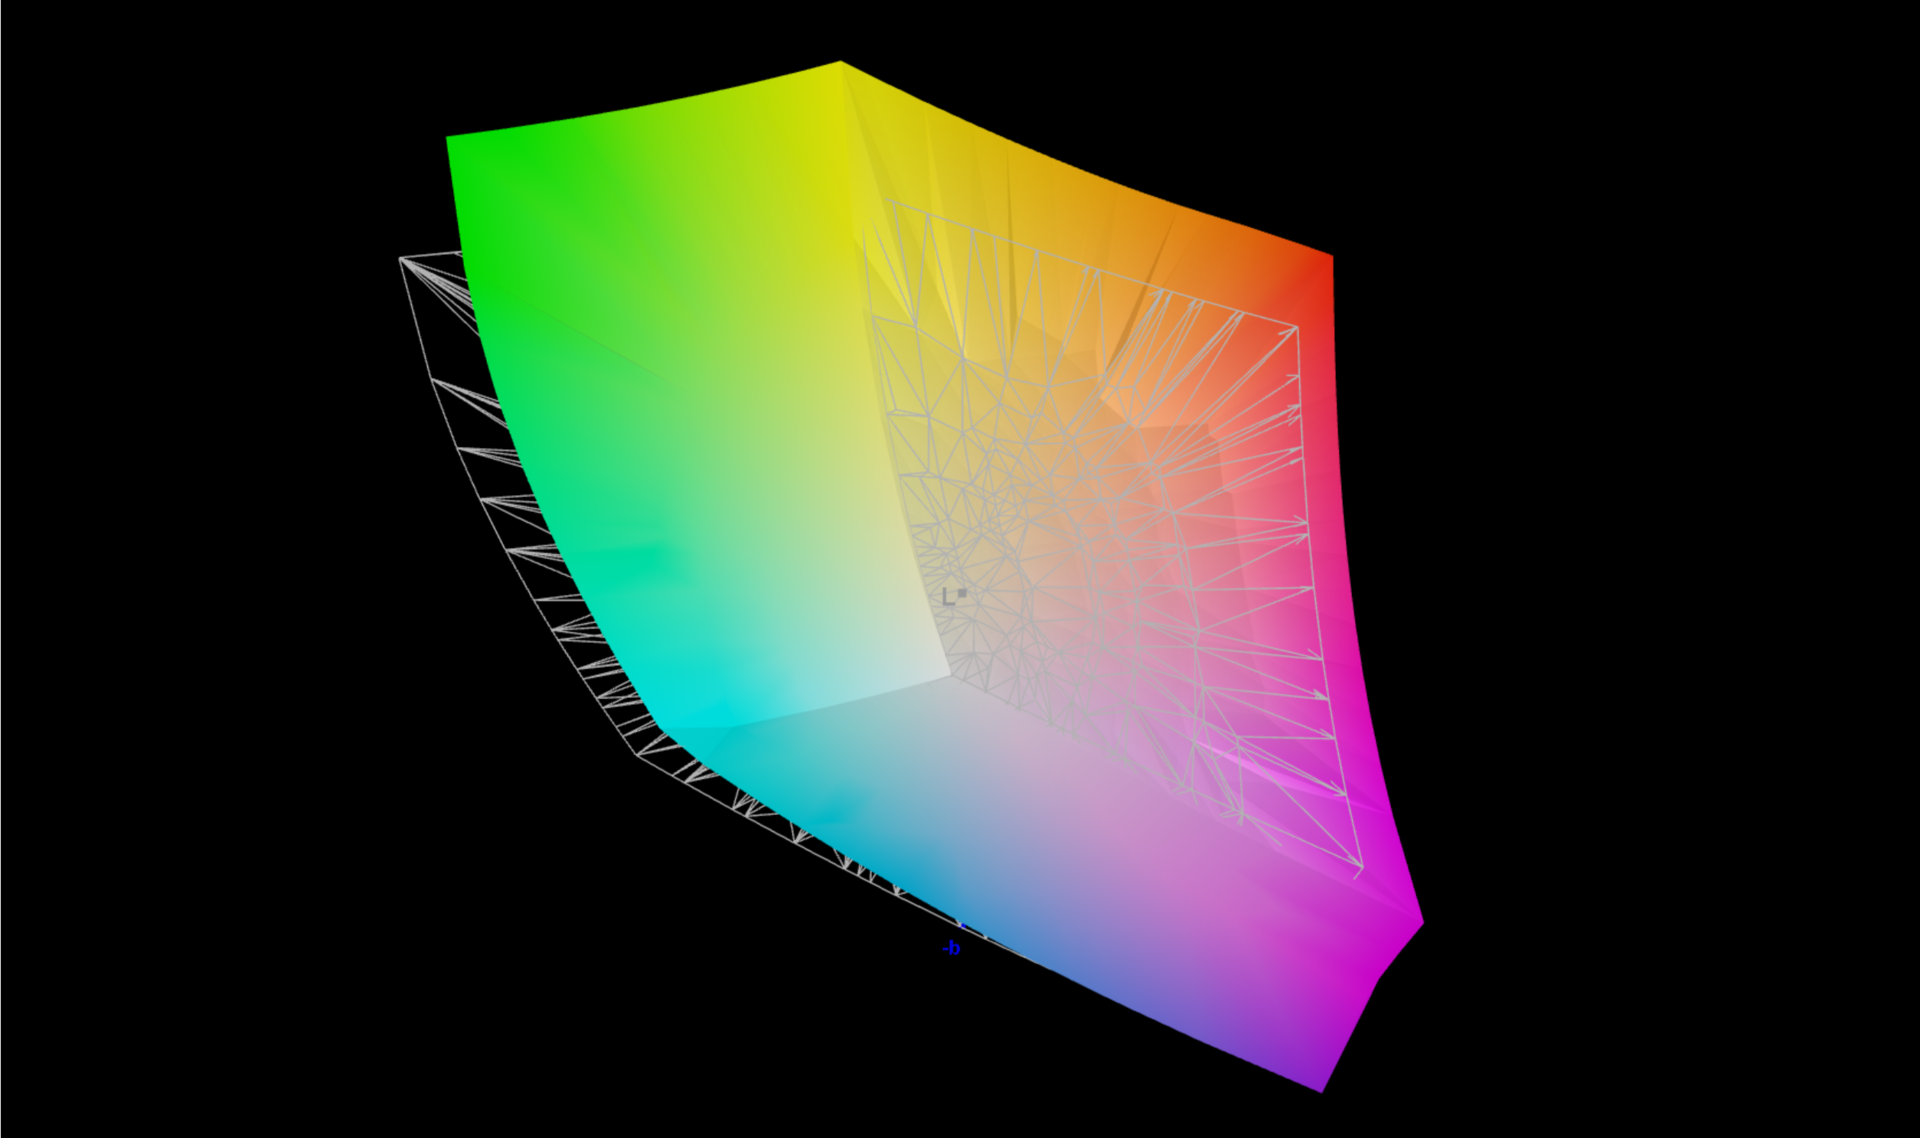
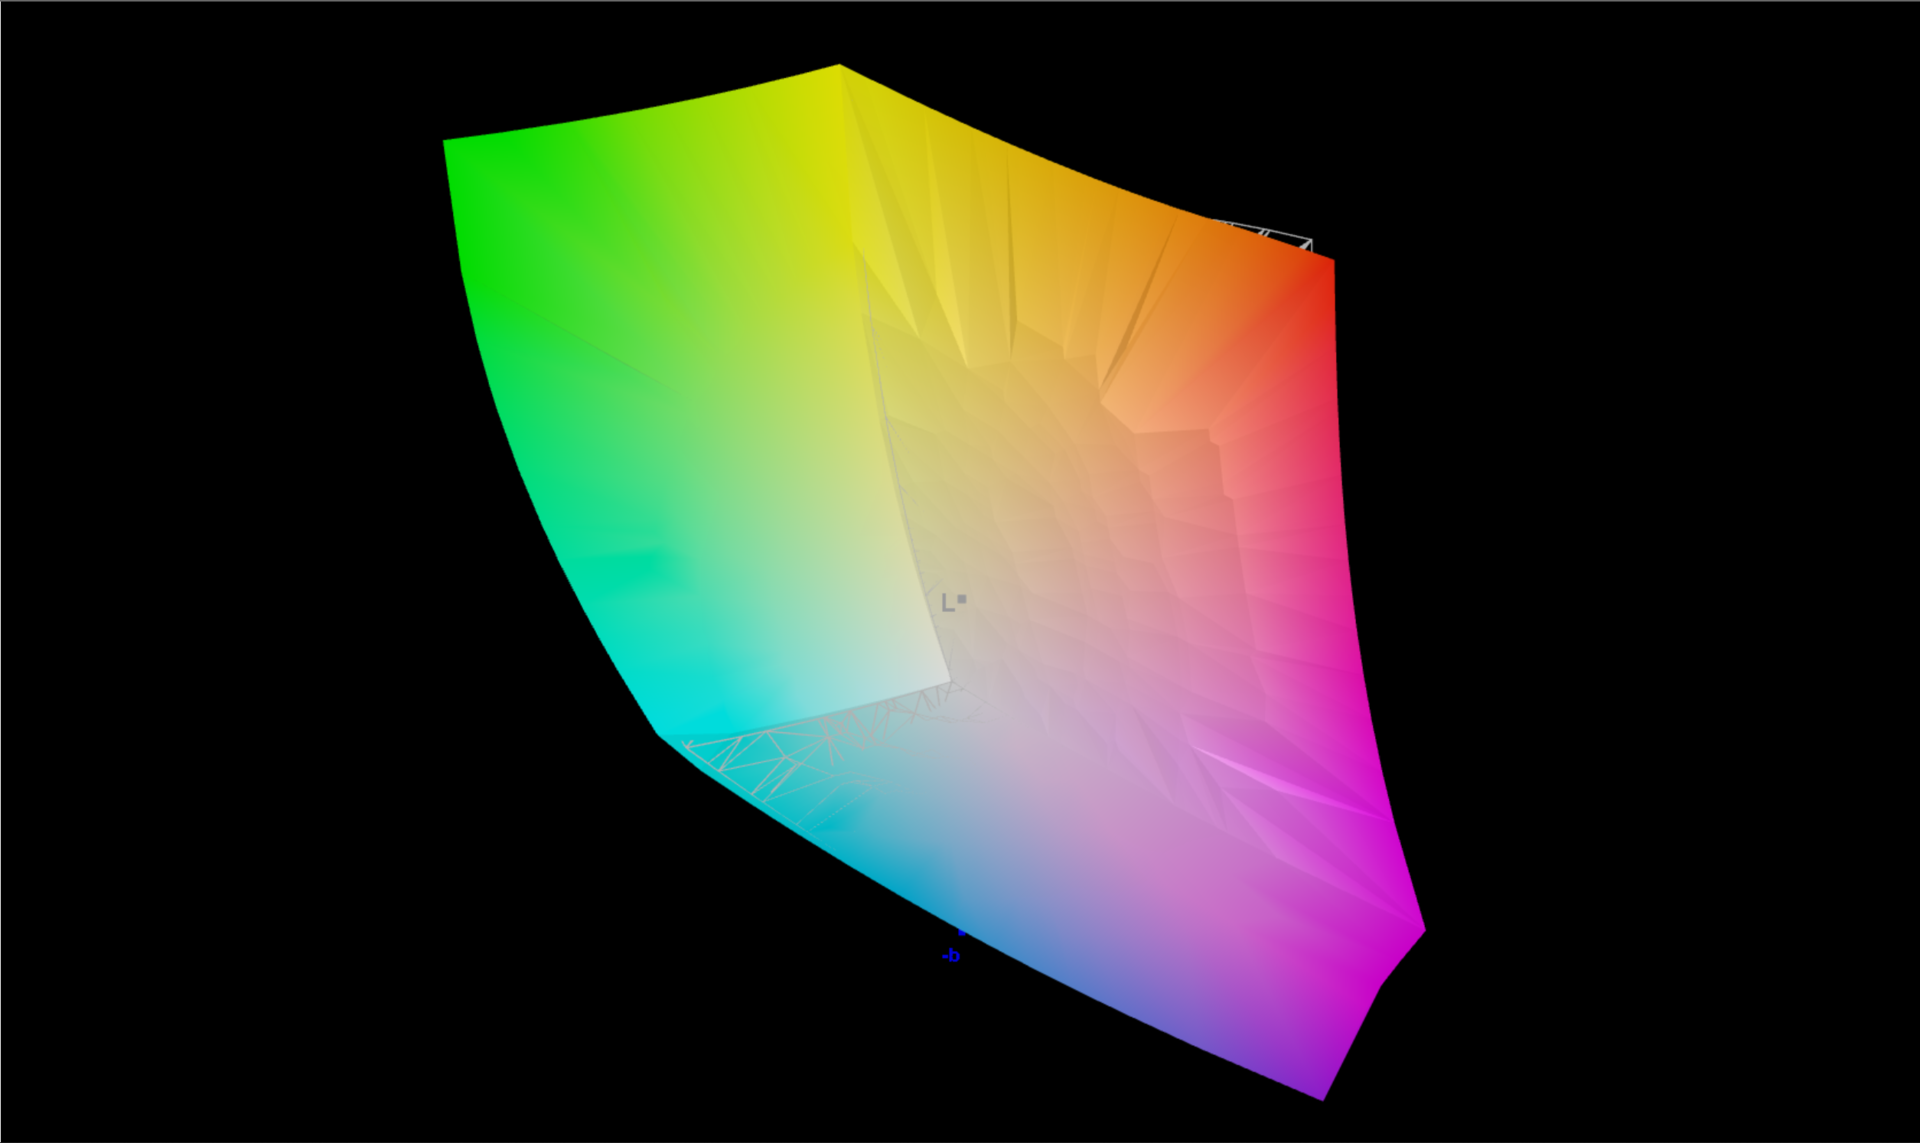
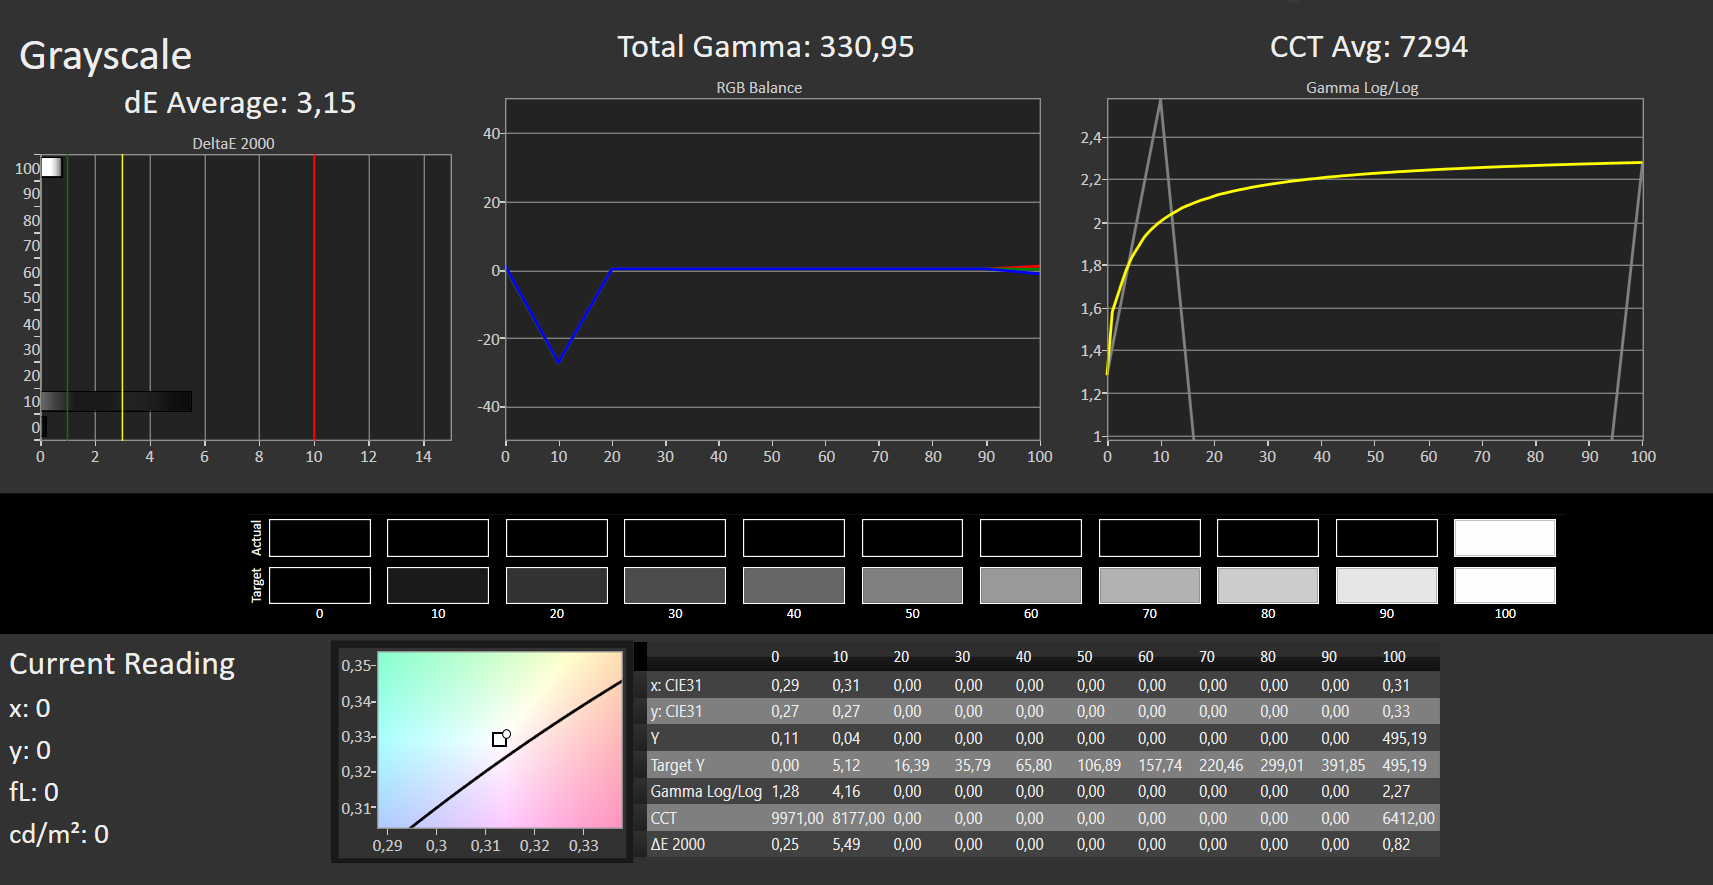
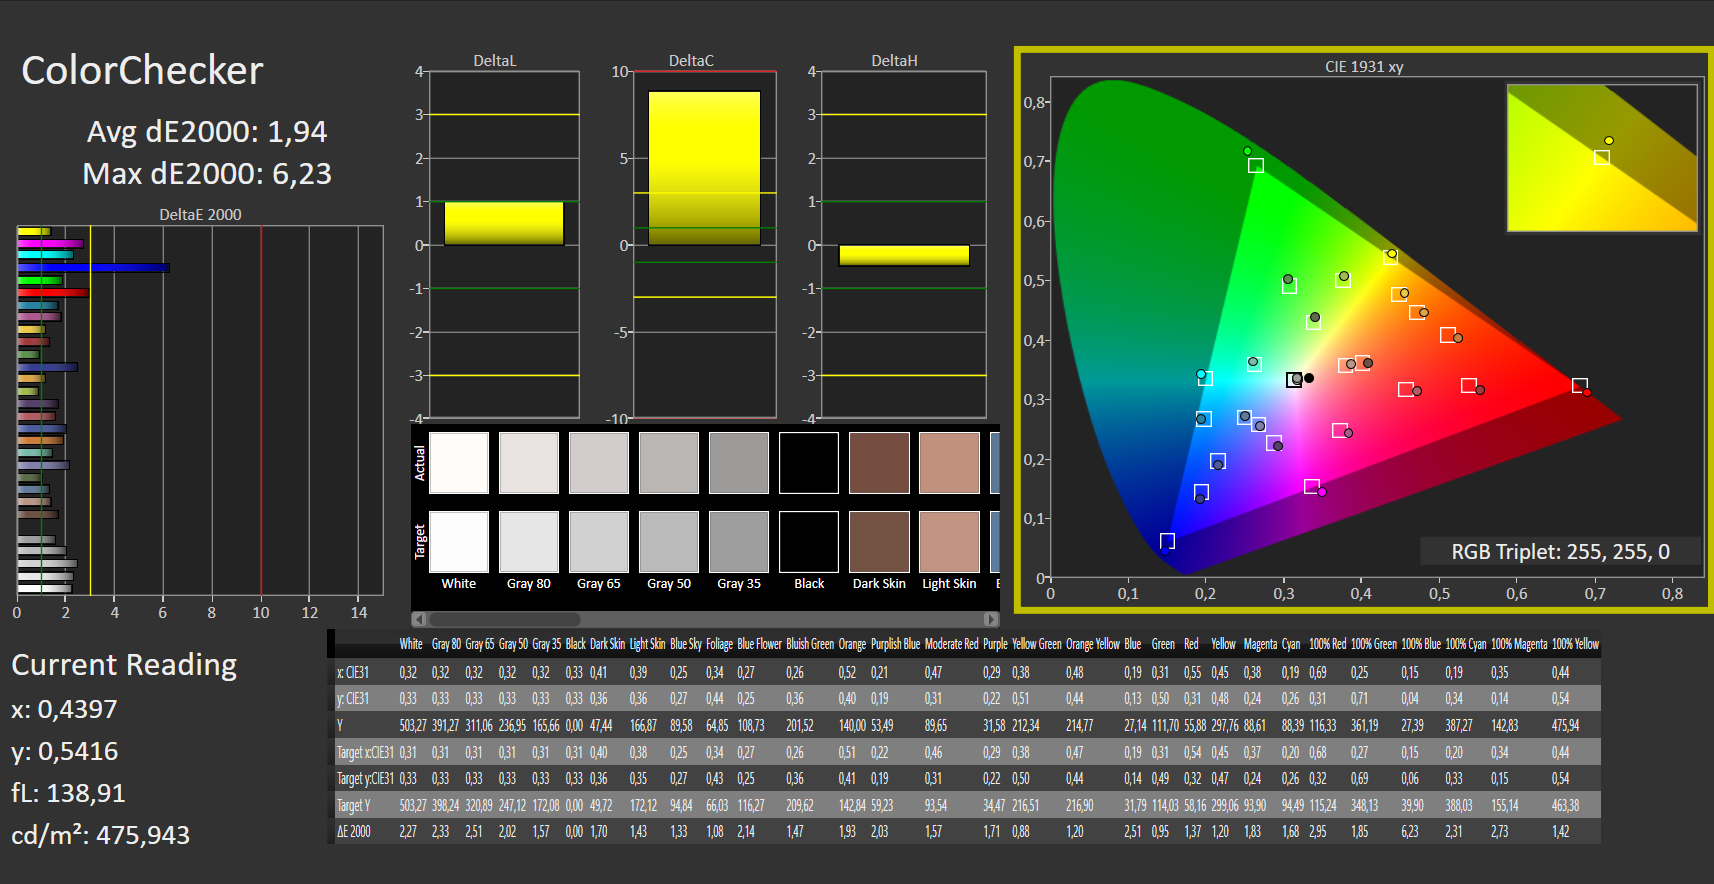
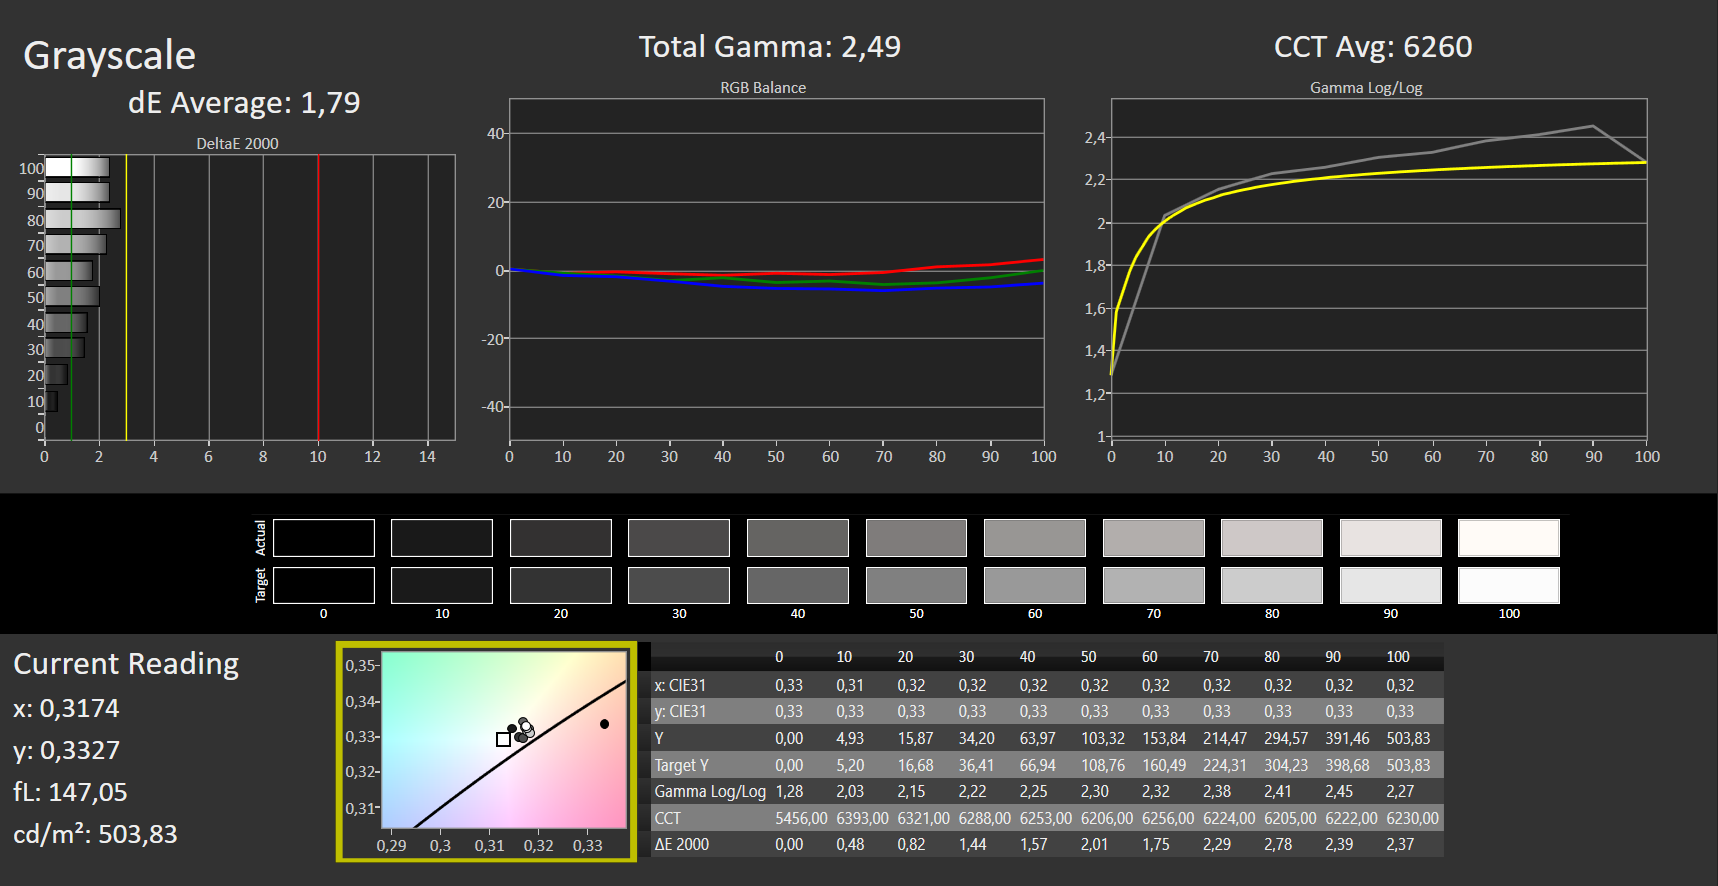
Los valores DeltaE-2000 de la pantalla mini-LED calibrada en fábrica (certificación Pantone) están por debajo del umbral de 3 para los colores y para la escala de grises. Sin embargo, el azul se desvía con un valor de 6,15, que no pudimos mejorar mediante calibración. El equilibrio de rojo, verde y azul puede describirse como perfecto. Por lo tanto, no hay absolutamente ningún tinte de color.
Como siempre, el perfil de color calibrado está disponible para su descarga junto al gráfico de iluminación.
Tiempos de respuesta del display
| ↔ Tiempo de respuesta de Negro a Blanco | ||
|---|---|---|
| 11 ms ... subida ↗ y bajada ↘ combinada | ↗ 1 ms subida |  |
| ↘ 10 ms bajada | ||
| La pantalla mostró buenos tiempos de respuesta en nuestros tests pero podría ser demasiado lenta para los jugones competitivos. En comparación, todos los dispositivos de prueba van de ##min### (mínimo) a 240 (máximo) ms. » 30 % de todos los dispositivos son mejores. Esto quiere decir que el tiempo de respuesta medido es mejor que la media (19.8 ms) de todos los dispositivos testados. | ||
| ↔ Tiempo de respuesta 50% Gris a 80% Gris | ||
| 11 ms ... subida ↗ y bajada ↘ combinada | ↗ 1 ms subida |   |
| ↘ 10 ms bajada | ||
| La pantalla mostró buenos tiempos de respuesta en nuestros tests pero podría ser demasiado lenta para los jugones competitivos. En comparación, todos los dispositivos de prueba van de ##min### (mínimo) a 636 (máximo) ms. » 25 % de todos los dispositivos son mejores. Esto quiere decir que el tiempo de respuesta medido es mejor que la media (31 ms) de todos los dispositivos testados. | ||
Parpadeo de Pantalla / PWM (Pulse-Width Modulation)
| Parpadeo de Pantalla / PWM detectado | 7400 Hz | ≤ 100 % de brillo |    |
La retroiluminación del display parpadea a 7400 Hz (seguramente usa PWM - Pulse-Width Modulation) a un brillo del 100 % e inferior. Sobre este nivel de brillo no debería darse parpadeo / PWM. La frecuencia de 7400 Hz es bastante alta, por lo que la mayoría de gente sensible al parpadeo no debería ver parpadeo o tener fatiga visual. Comparación: 52 % de todos los dispositivos testados no usaron PWM para atenuar el display. Si se usó, medimos una media de 7769 (mínimo: 5 - máxmo: 343500) Hz. | |||
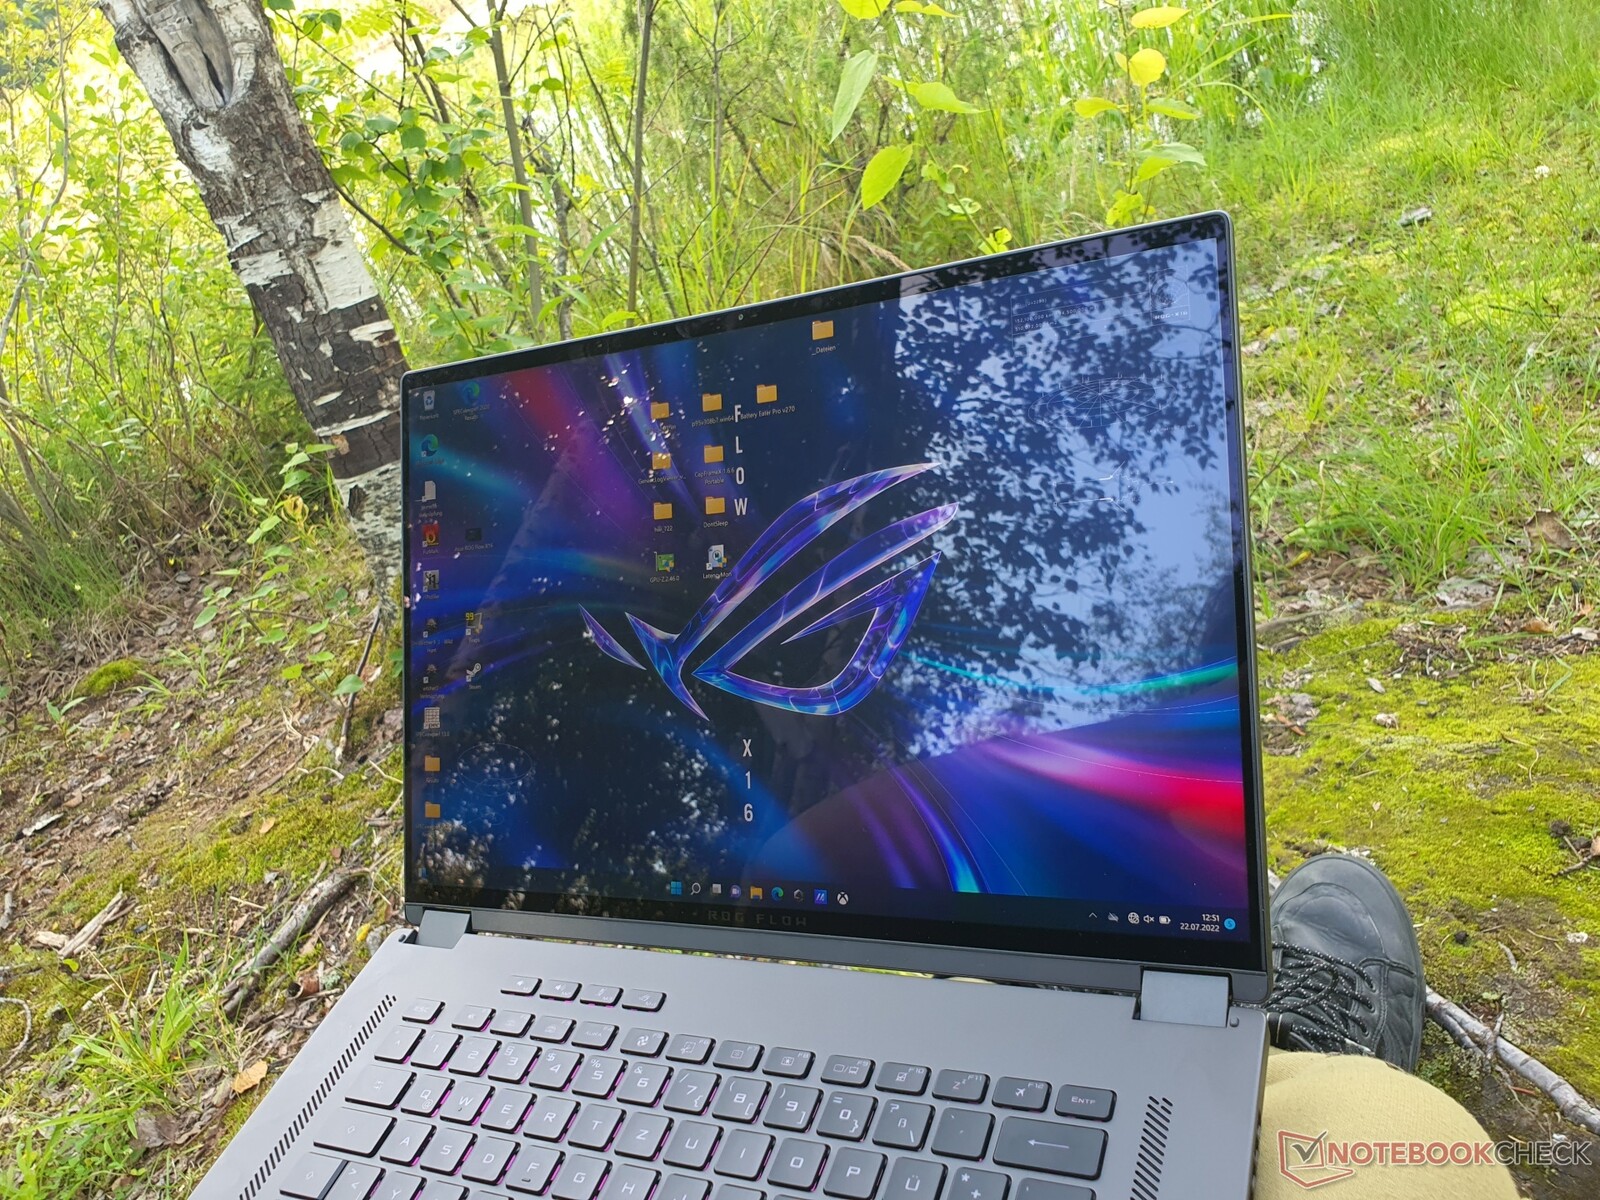
La pantalla refleja muy fuertemente, por lo que incluso 500 nits de brillo son necesarios para su uso en sombra (parcial). El uso de HDR con un brillo máximo de hasta 1.100 nits permaneció desactivado en el modo de batería para ahorrar energía.

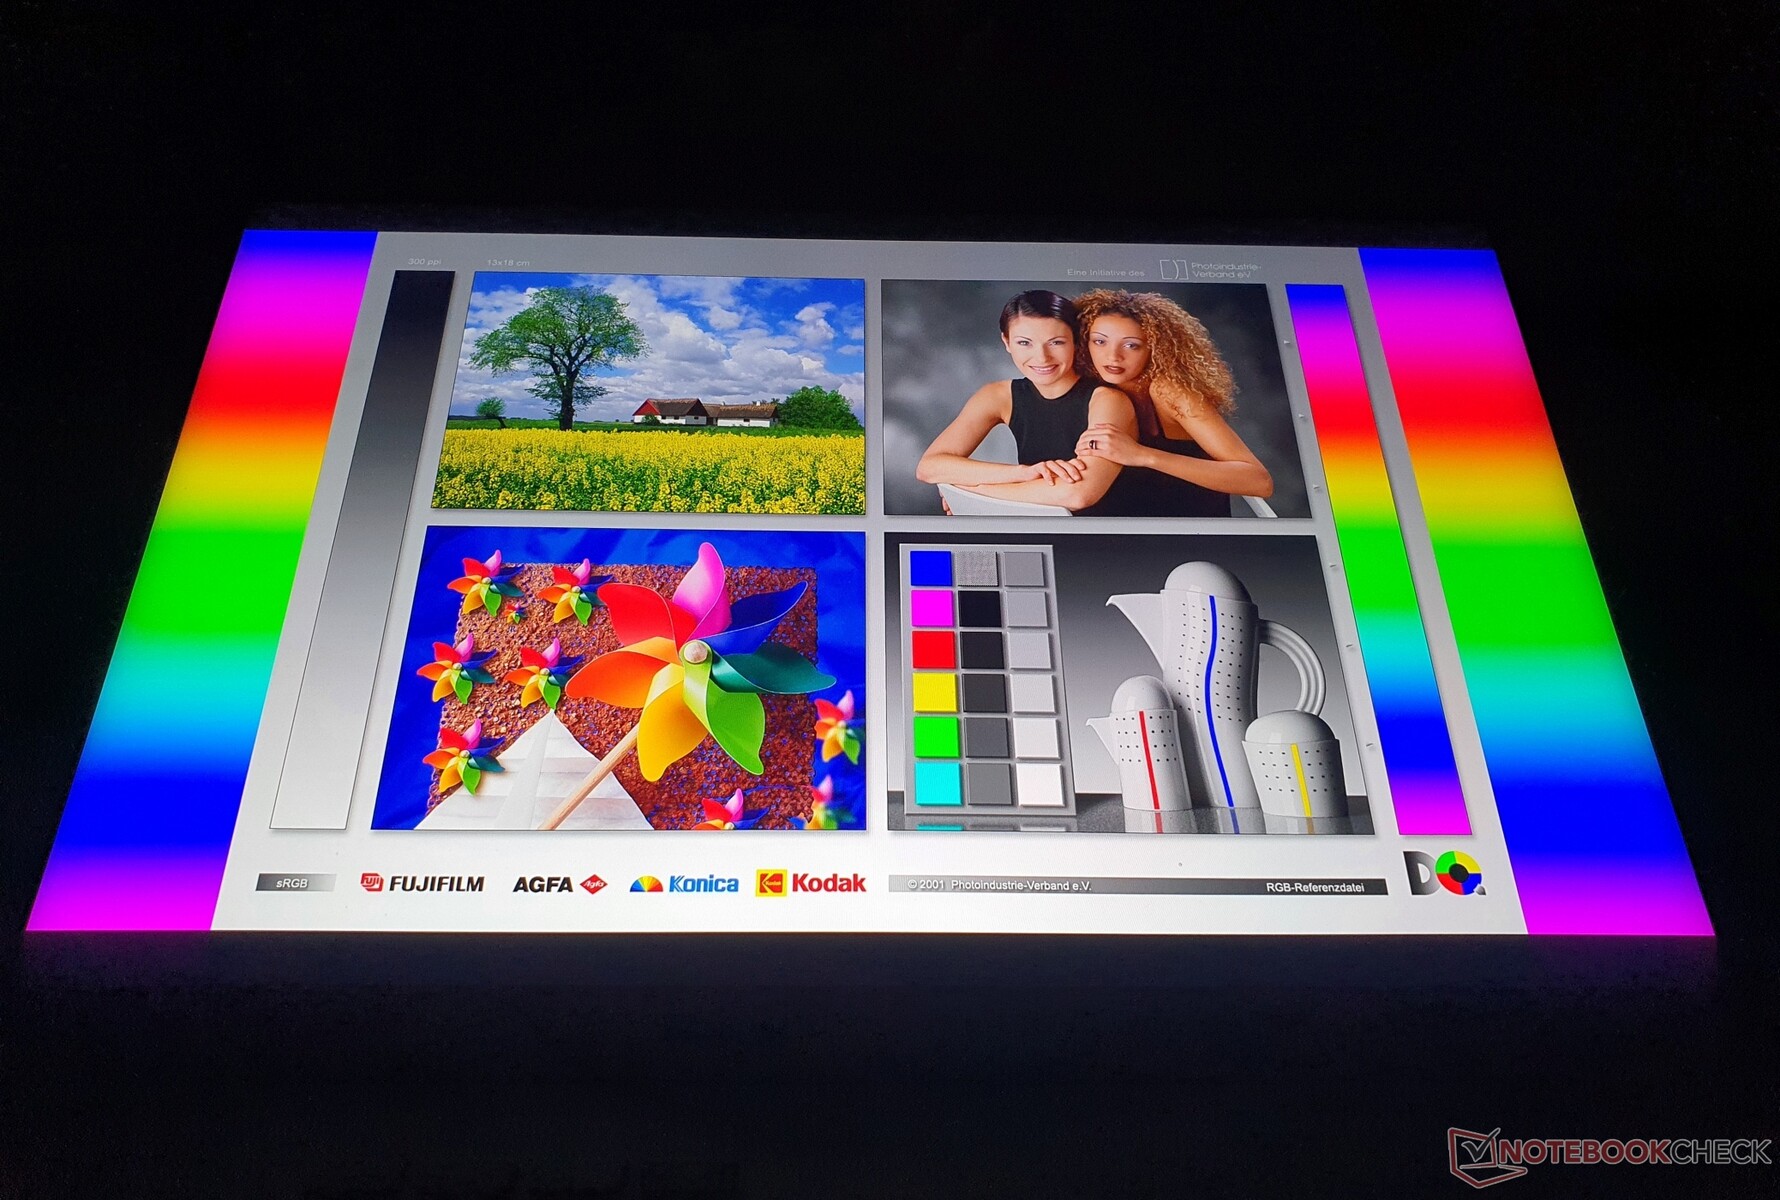
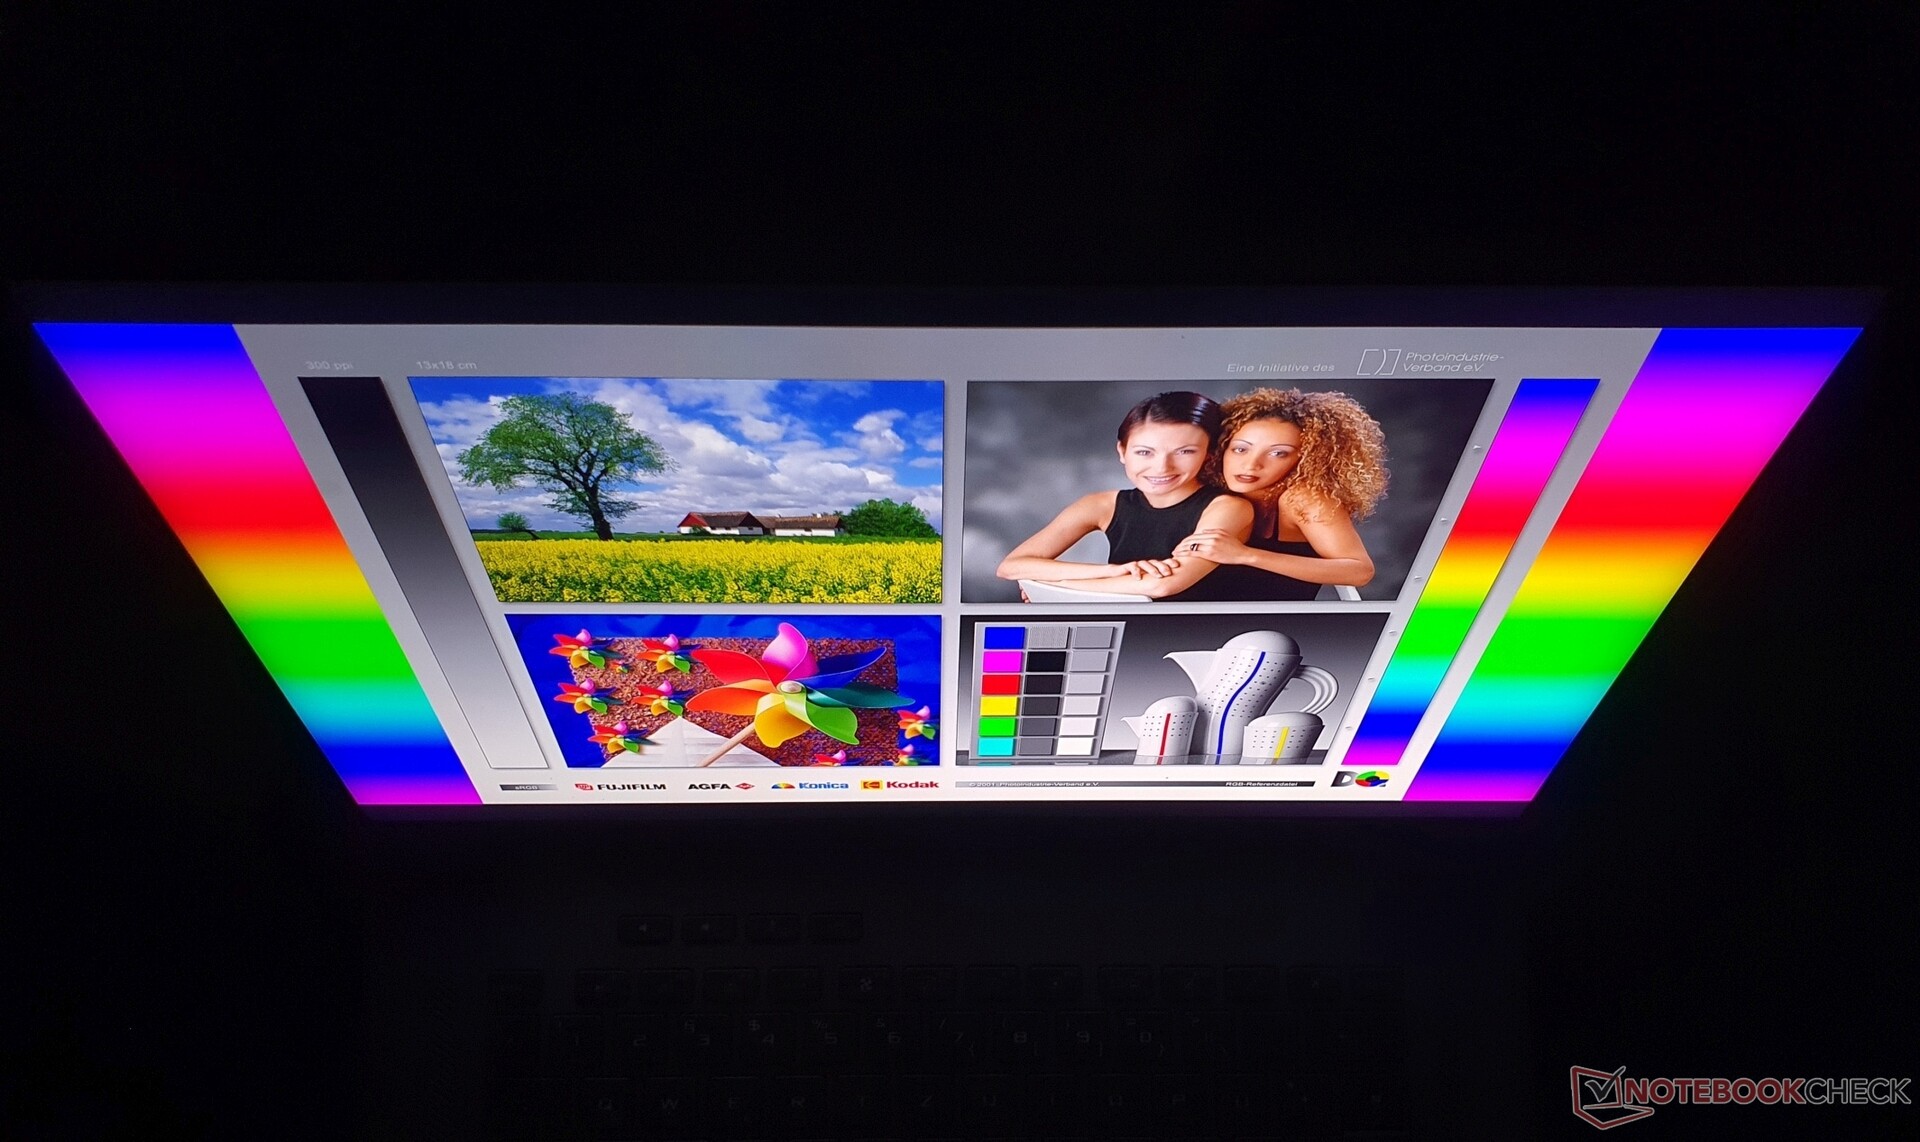
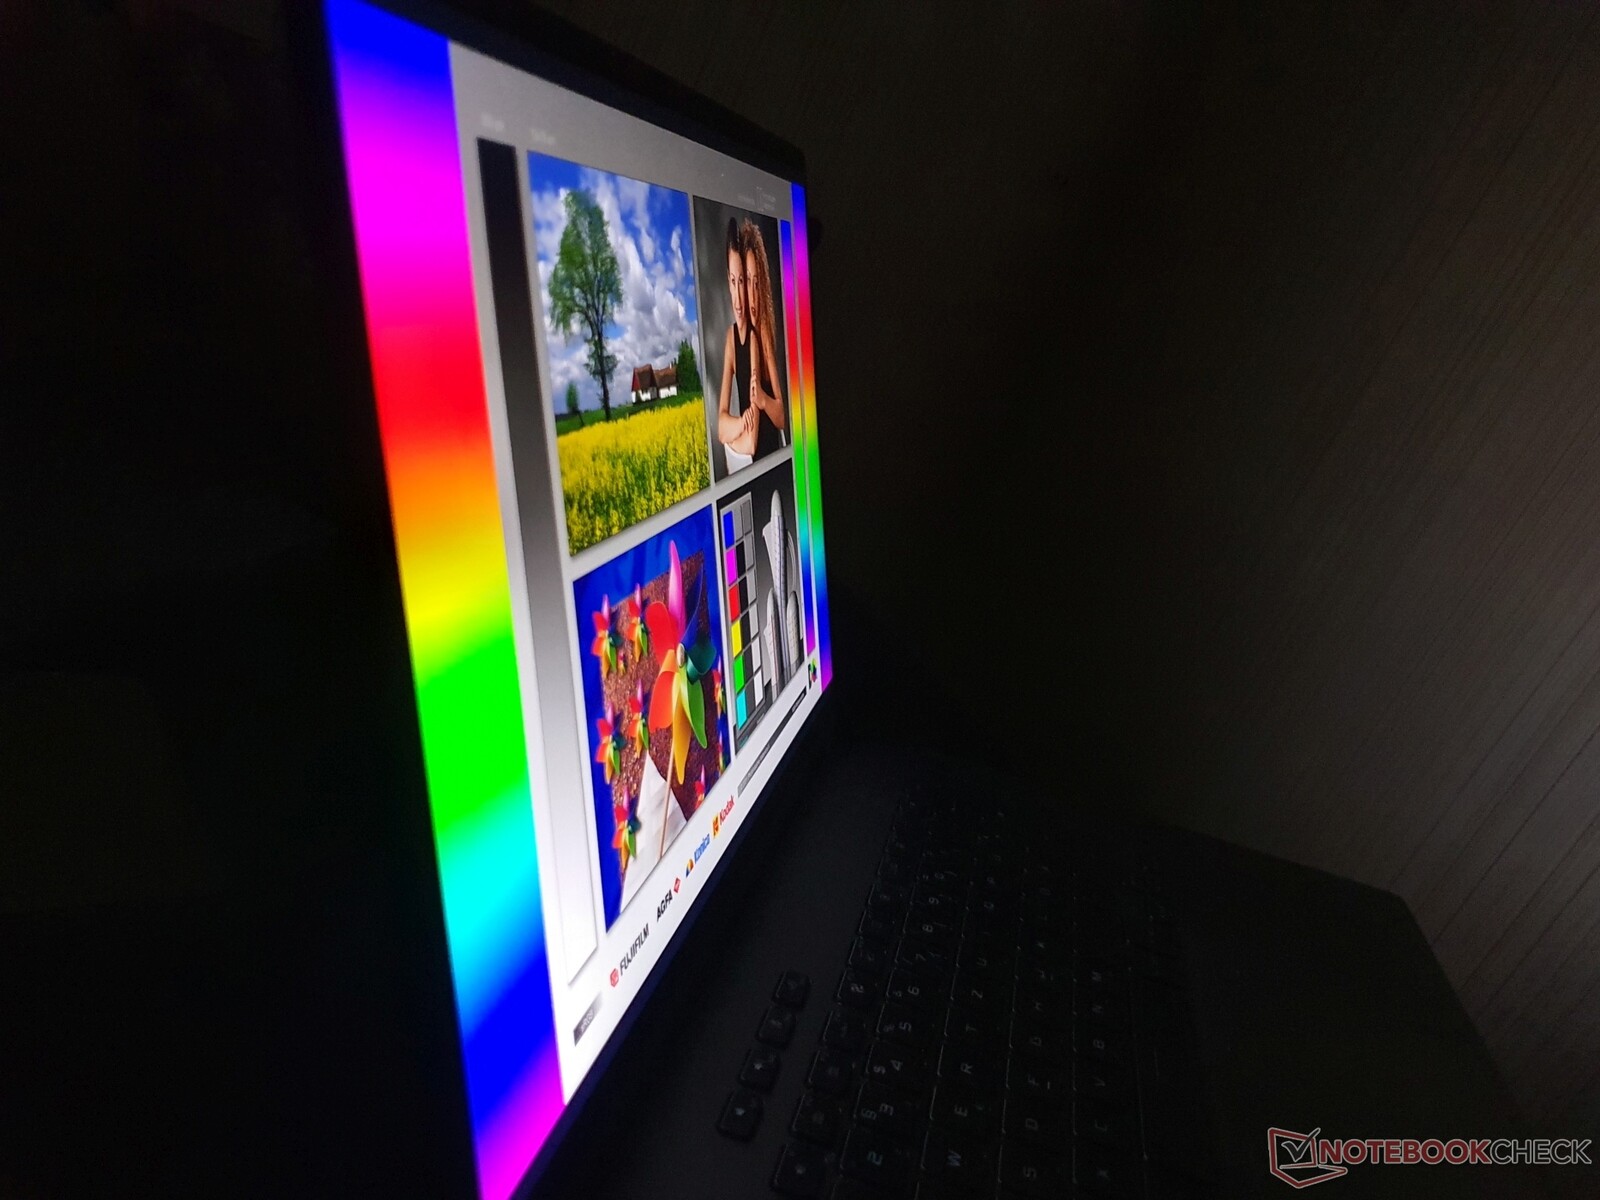
Las pantallas OLED siguen teniendo una ligera ventaja en la estabilidad de los ángulos de visión, pero como es típico de las IPS, la pantalla del Asus ROG Flow X16 está en un nivel alto
Rendimiento - RTX 3070 Ti con 125 W en un portátil de juegos compacto
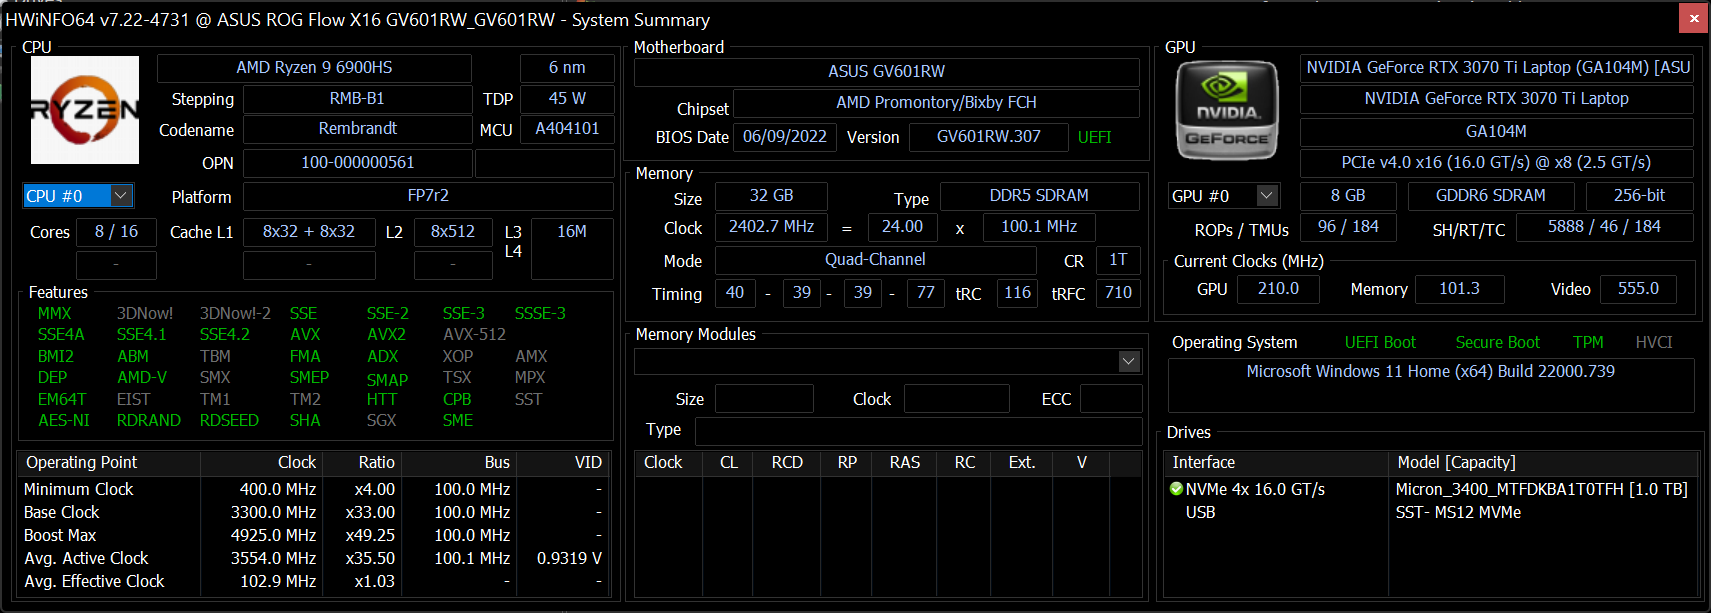
Nuestra configuración está equipada con un AMD Ryzen 9 6900HS octa-core y un procesador Nvidia GeForce RTX 3070 Ti con 125 vatios de TGP (incluyendo Dynamic Boost). También se ha integrado un interruptor MUX.
Los modelos más baratos cuentan con unaRTX 3060 o una RTX 3050 Tiesta última siempre viene acompañada de un Ryzen 7 6800HS(200 MHz menos de reloj).
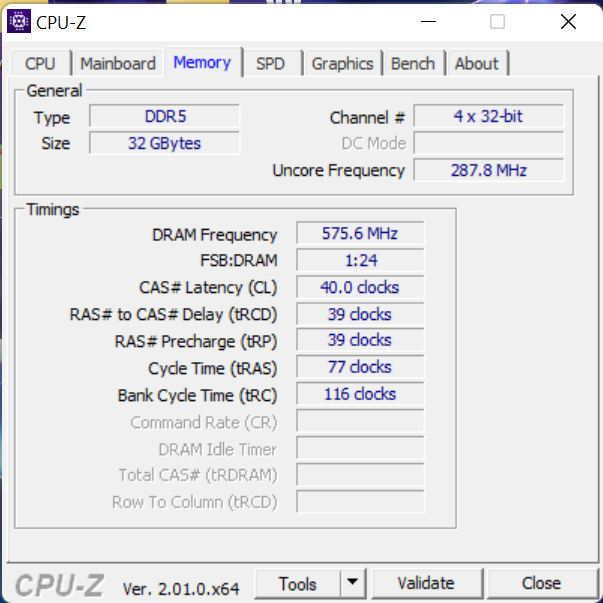
El ROG Flow X16 se entrega con 8 a 32 GB de RAM DDR5-4800. Nuestra unidad de análisis tiene 32 GB de RAM (2 módulos de 16 GB en modo de doble canal) y alberga un SSD de 1 TB, que es la capacidad mínima ofrecida. Se puede pedir un máximo de 2 TB y se pueden utilizar hasta dos SSD PCIe 4.0.


Condiciones de la prueba
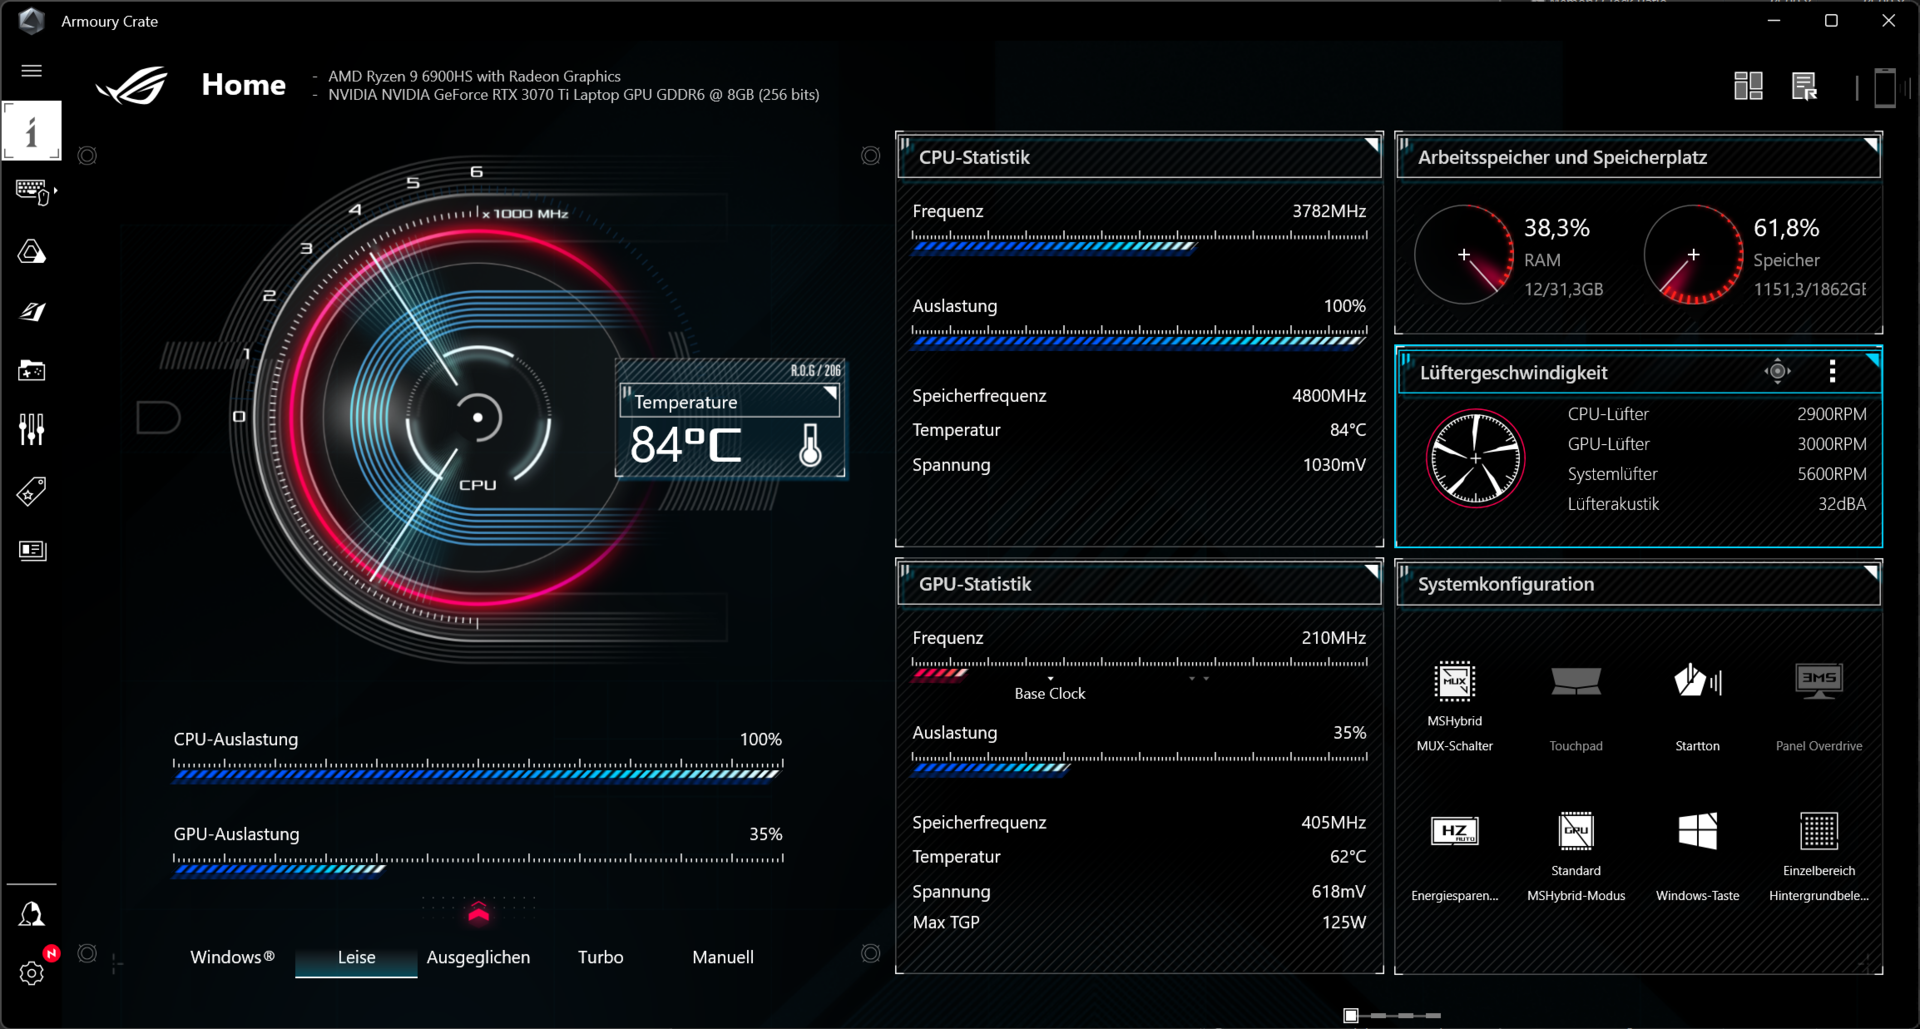
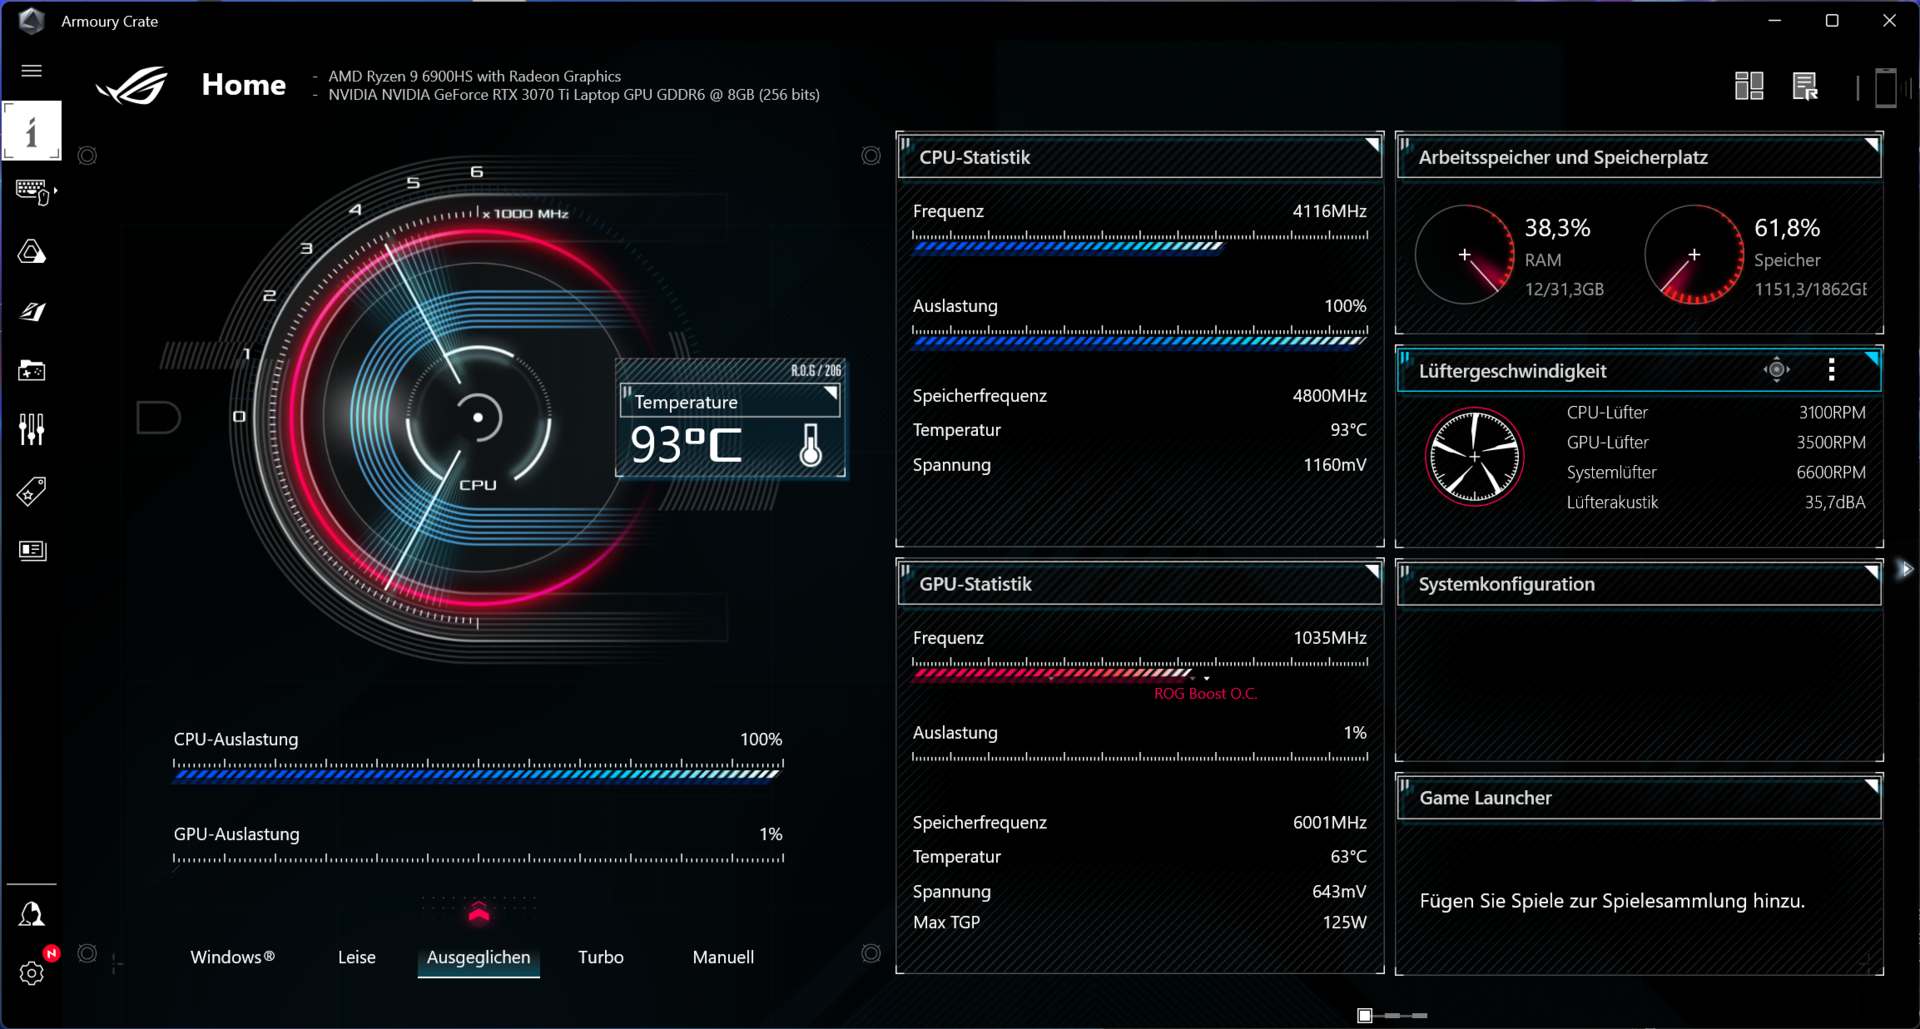
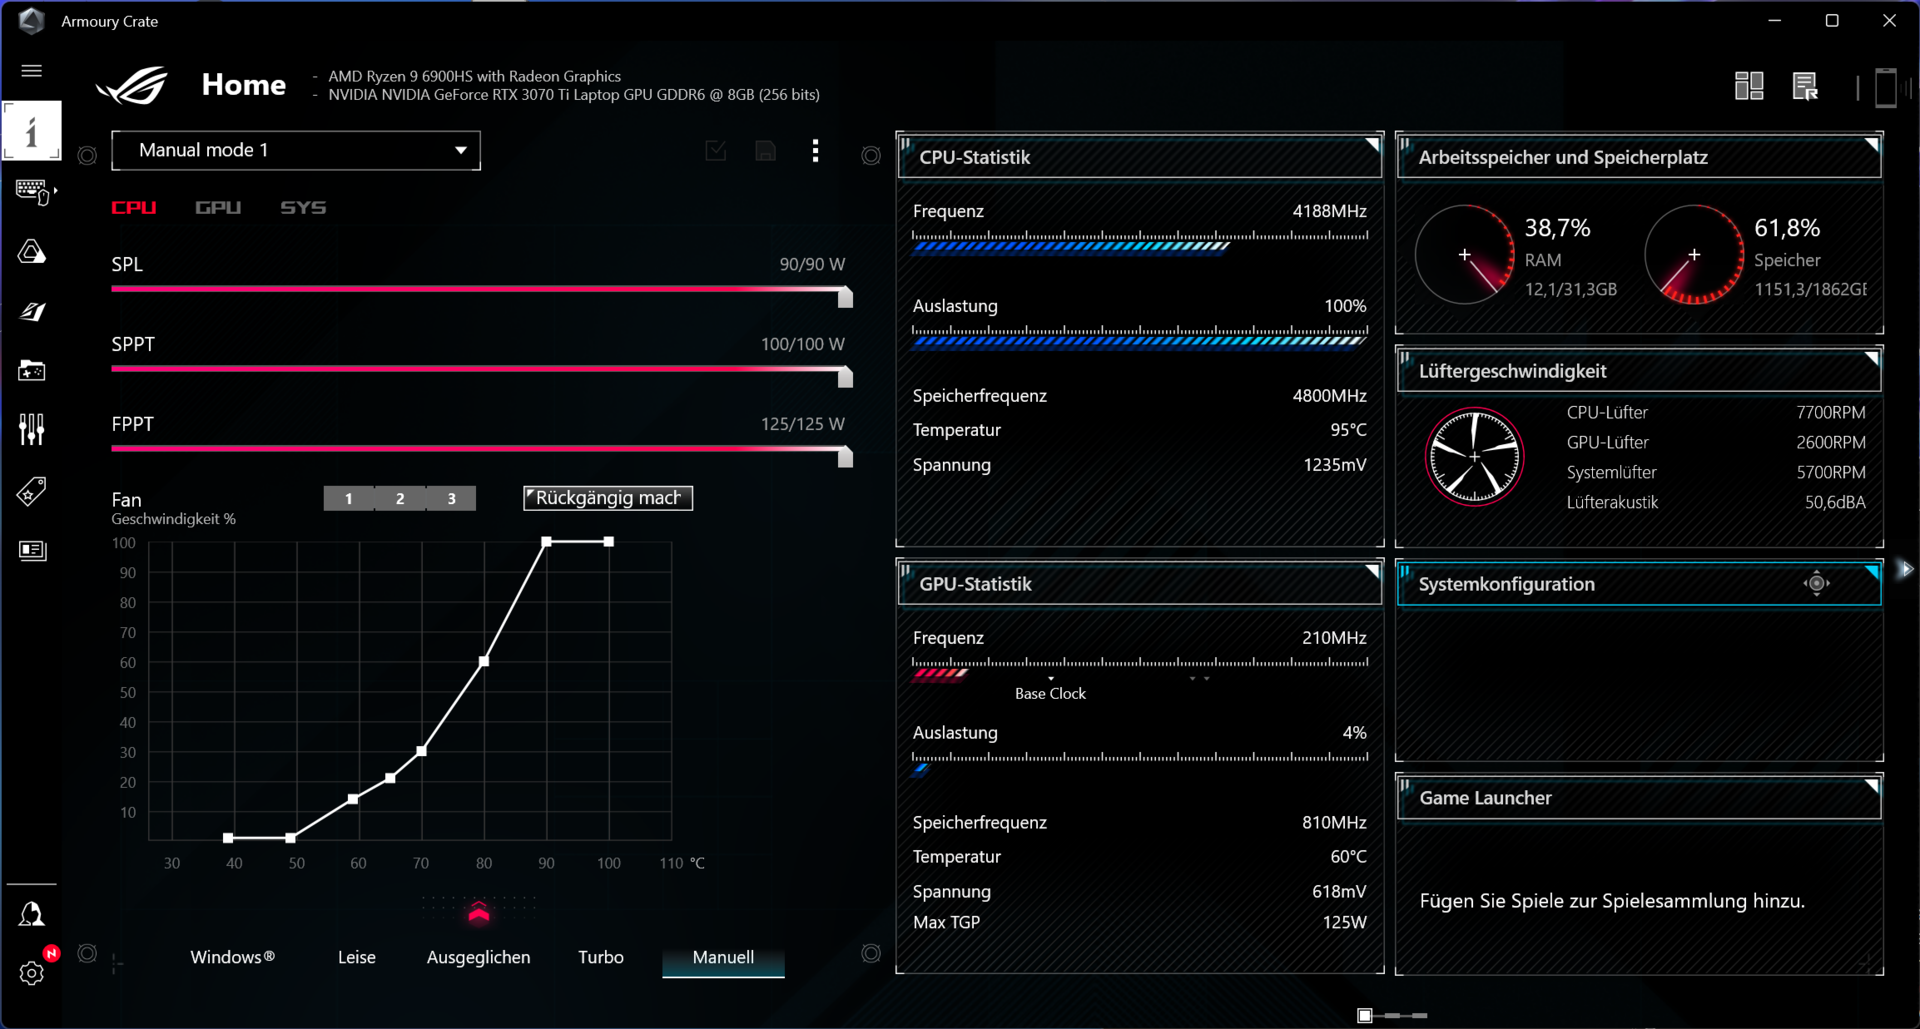
El software Armoury Crate de Asus ofrece cuatro modos de rendimiento diferentes: Silencioso, Equilibrado ( "Rendimiento" desde la versión 5.2.12), Turbo y Manual, de los cuales Manual te permite establecer tus propias curvas de ventilador y ajustar la configuración del TDP, así como overclockear la dGPU.
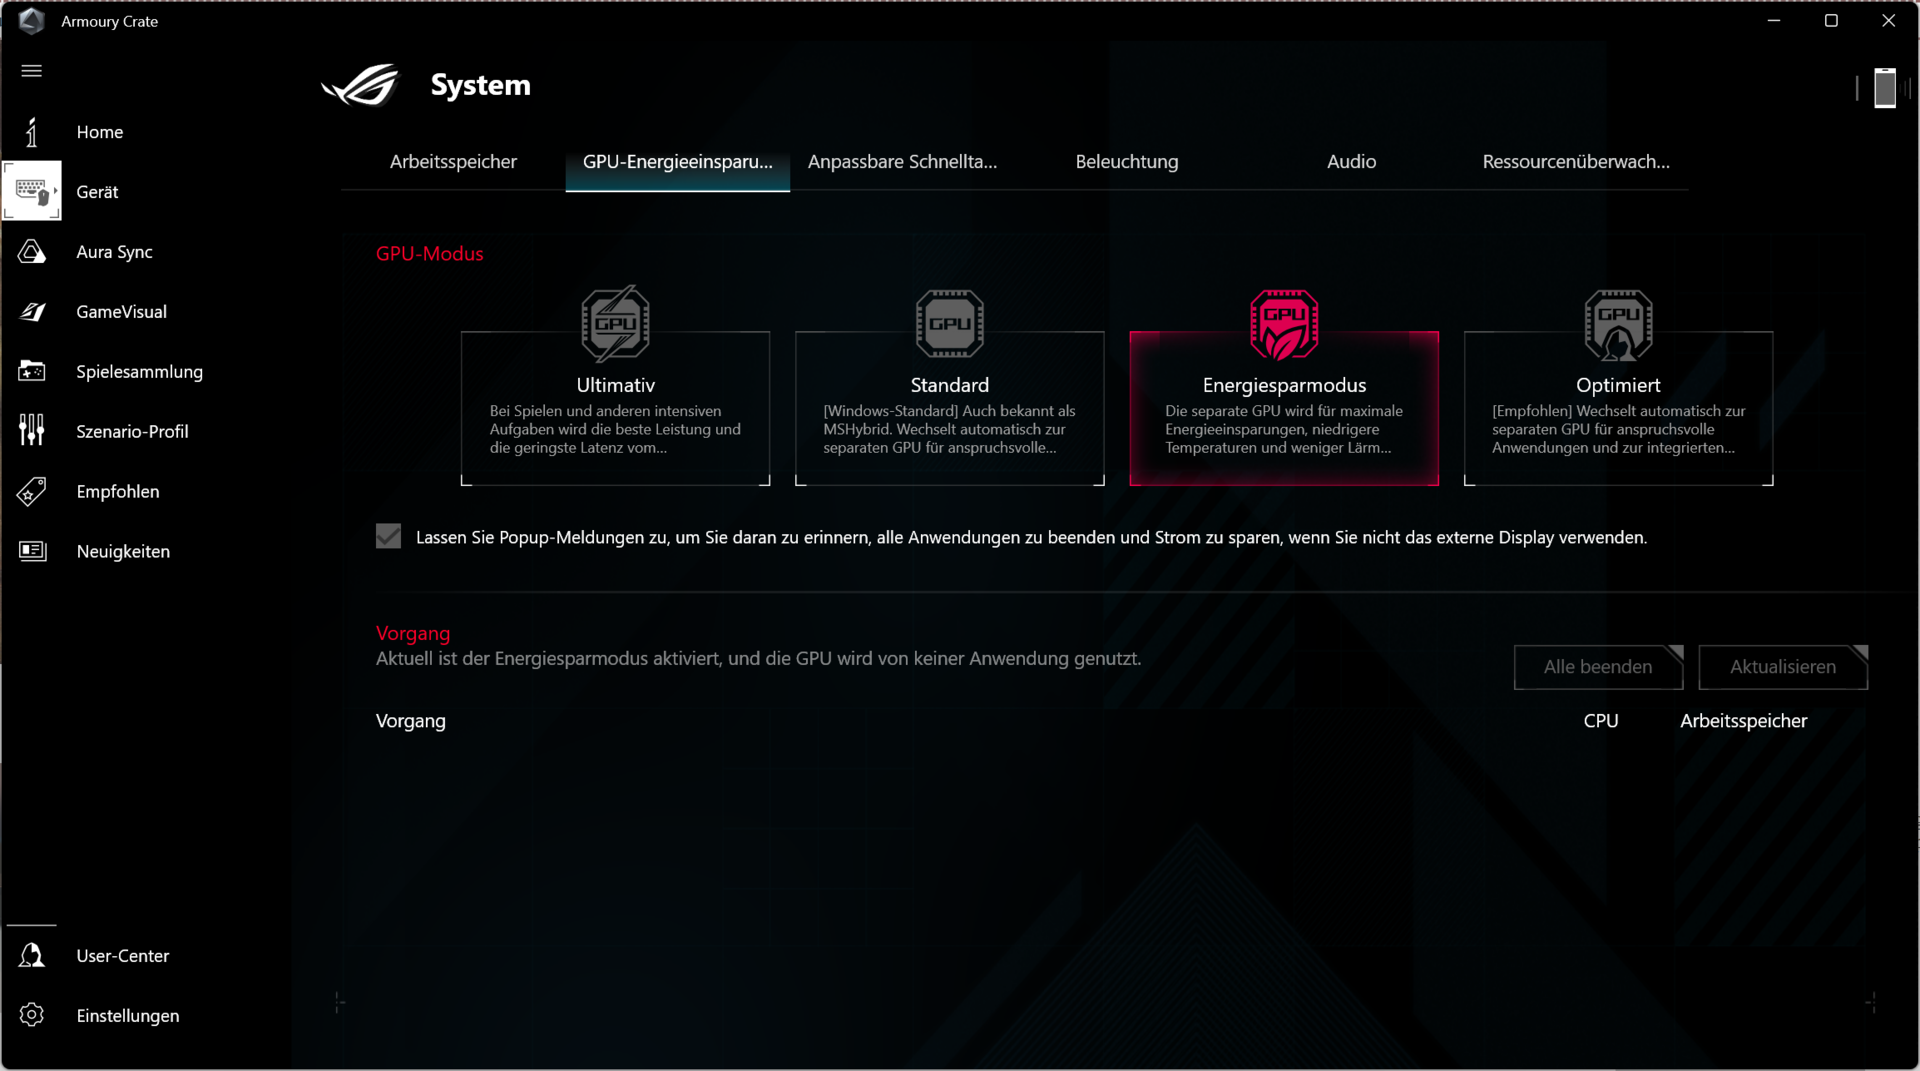
También hay cuatro modos de GPU: Ultimate, Standard, Energy Saving y Optimized. "Ultimate" activa el interruptor MUX, que mantiene laRTX 3070 Ti como la GPU activa en todo momento y la conecta directamente a la pantalla interna en lugar de desviarse a través de la Radeon iGPU. Activarlo requiere un reinicio (no hay Optimus Avanzado). En el modo Estándar , se puede cambiar entre la unidad gráfica integrada y la dedicada según sea necesario (Optimus / "MSHybrid"), mientras que en el modo de Ahorro de Energía se desactiva la GPU Nvidia (también en funcionamiento de red) y se usa la iGPU. El modo optimizado se corresponde con el modo estándar, con la diferencia de que la GPU Nvidia está completamente desactivada en el modo de batería.
Los efectos de los diferentes modos sobre el TDP/TGP, las velocidades de reloj, las temperaturas y el comportamiento de los ventiladores se comentan en las secciones correspondientes "Procesador", "Tarjeta gráfica" y "Emisiones". Hemos realizado nuestras pruebas de rendimiento en modo Turbo y en modo Estándar para la GPU. Las pruebas de los otros modos se discuten a lo largo del análisis. La duración de la batería en el modo WLAN se determinó en modo equilibrado y con el modo de ahorro de energía de la GPU activado.
Se podría hacer mucho para mejorar Amoury Crate, los valores de rendimiento y la duración de la batería hasta el lanzamiento. Nuestro dispositivo de análisis funciona con la versión 5.1.8(Actualización: Para que Armoury Crate siga siendo utilizable, se ha tenido que instalar una actualización a la versión 5.2.12), la versión 307 de la BIOS y el controlador 512.78 de GeForce.

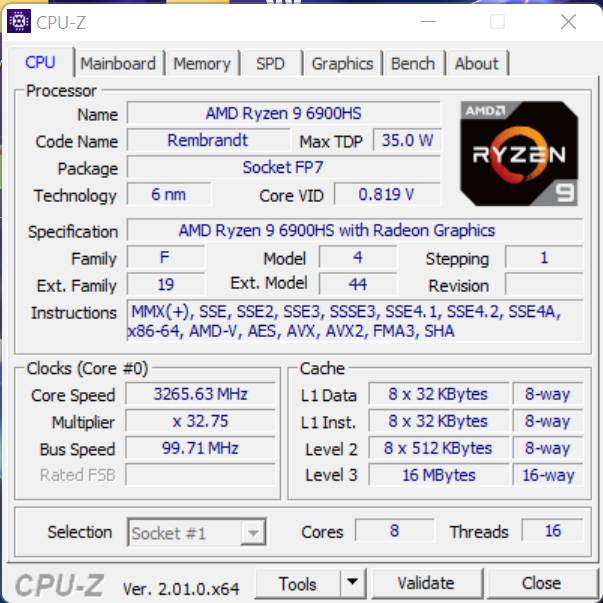
Procesador
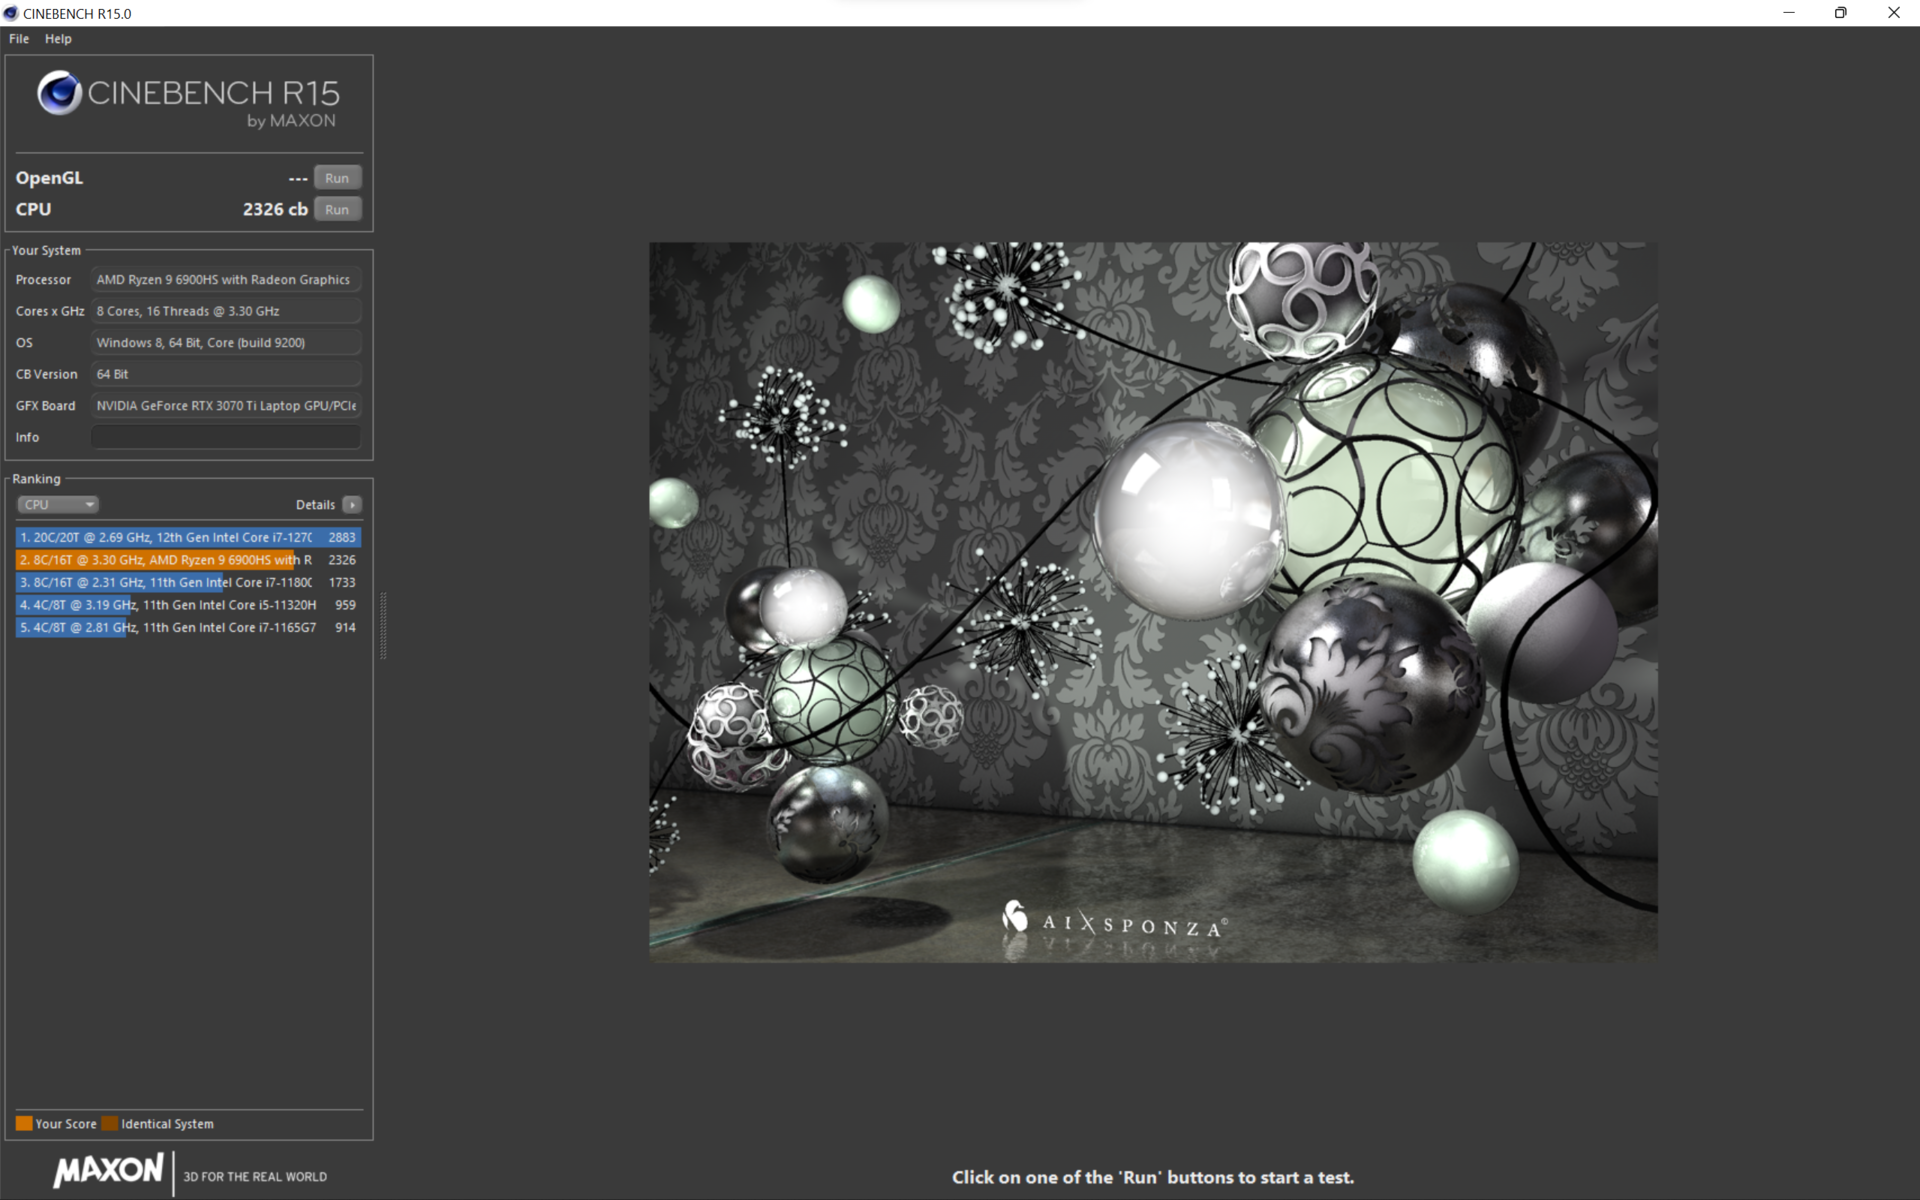
El AMD Ryzen 6900HS es una CPU octa-core con un reloj base de 8x 3,3 GHz, así como un Turbo de 4,9 GHz en 1 núcleo y una medida de 4,36 GHz en 8 núcleos. De estos, 4,26 GHz se mantienen permanentemente en modo Turbo mientras la CPU consume continuamente 74 vatios y se calienta hasta 91 °C
Por tanto, la CPU de 35 W está muy bien aprovechada. El consumo inicial es de unos 90 vatios a 4,36 GHz. Por tanto, no se alcanza el límite de potencia a corto plazo "SPPT" (llamado "PL2" por Intel), fijado en 100 vatios, ni el límite de potencia a largo plazo "SPL" (PL1) de 90 vatios. AMD aún tiene fijado el FPPT (Fast Package Power Tracking) con 125 vatios.
En el modo equilibrado
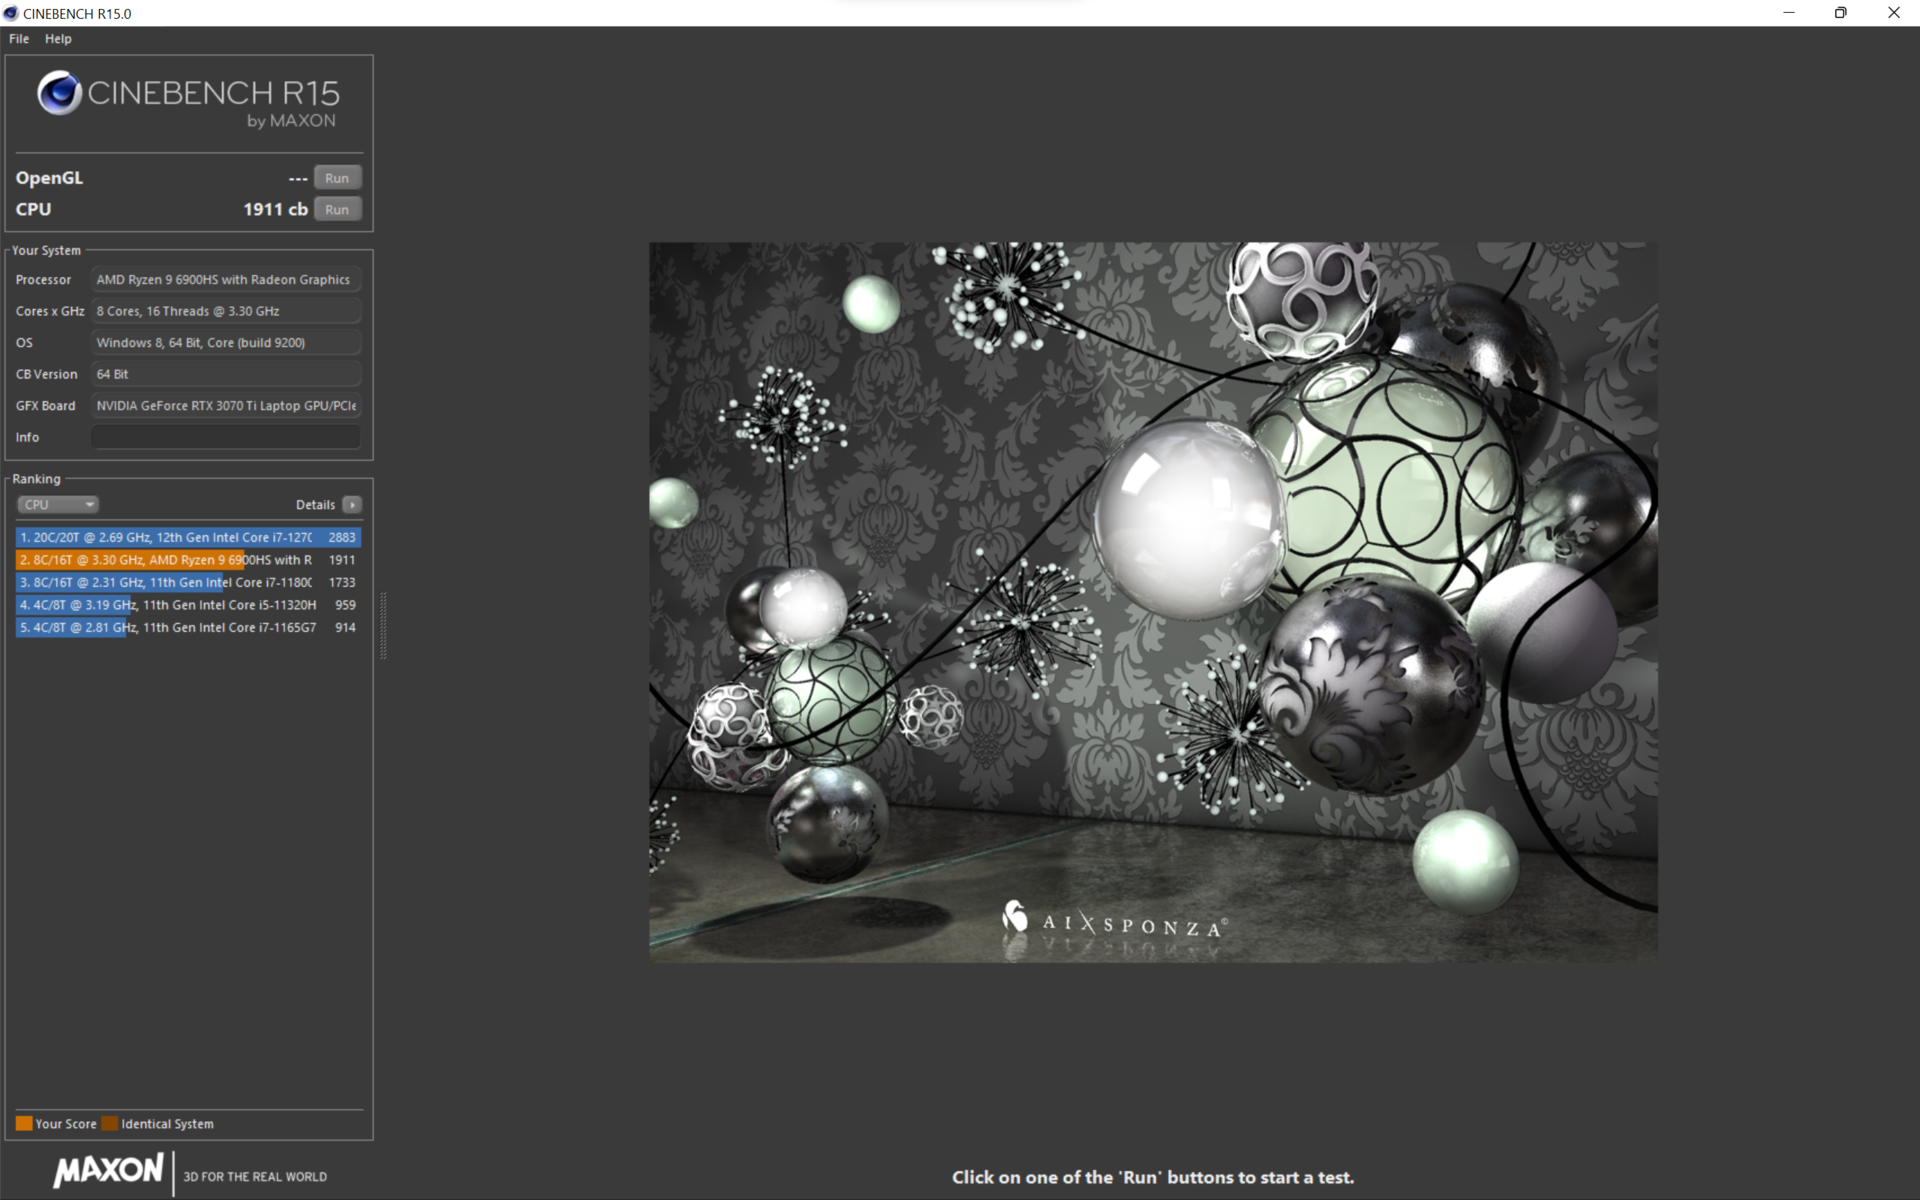
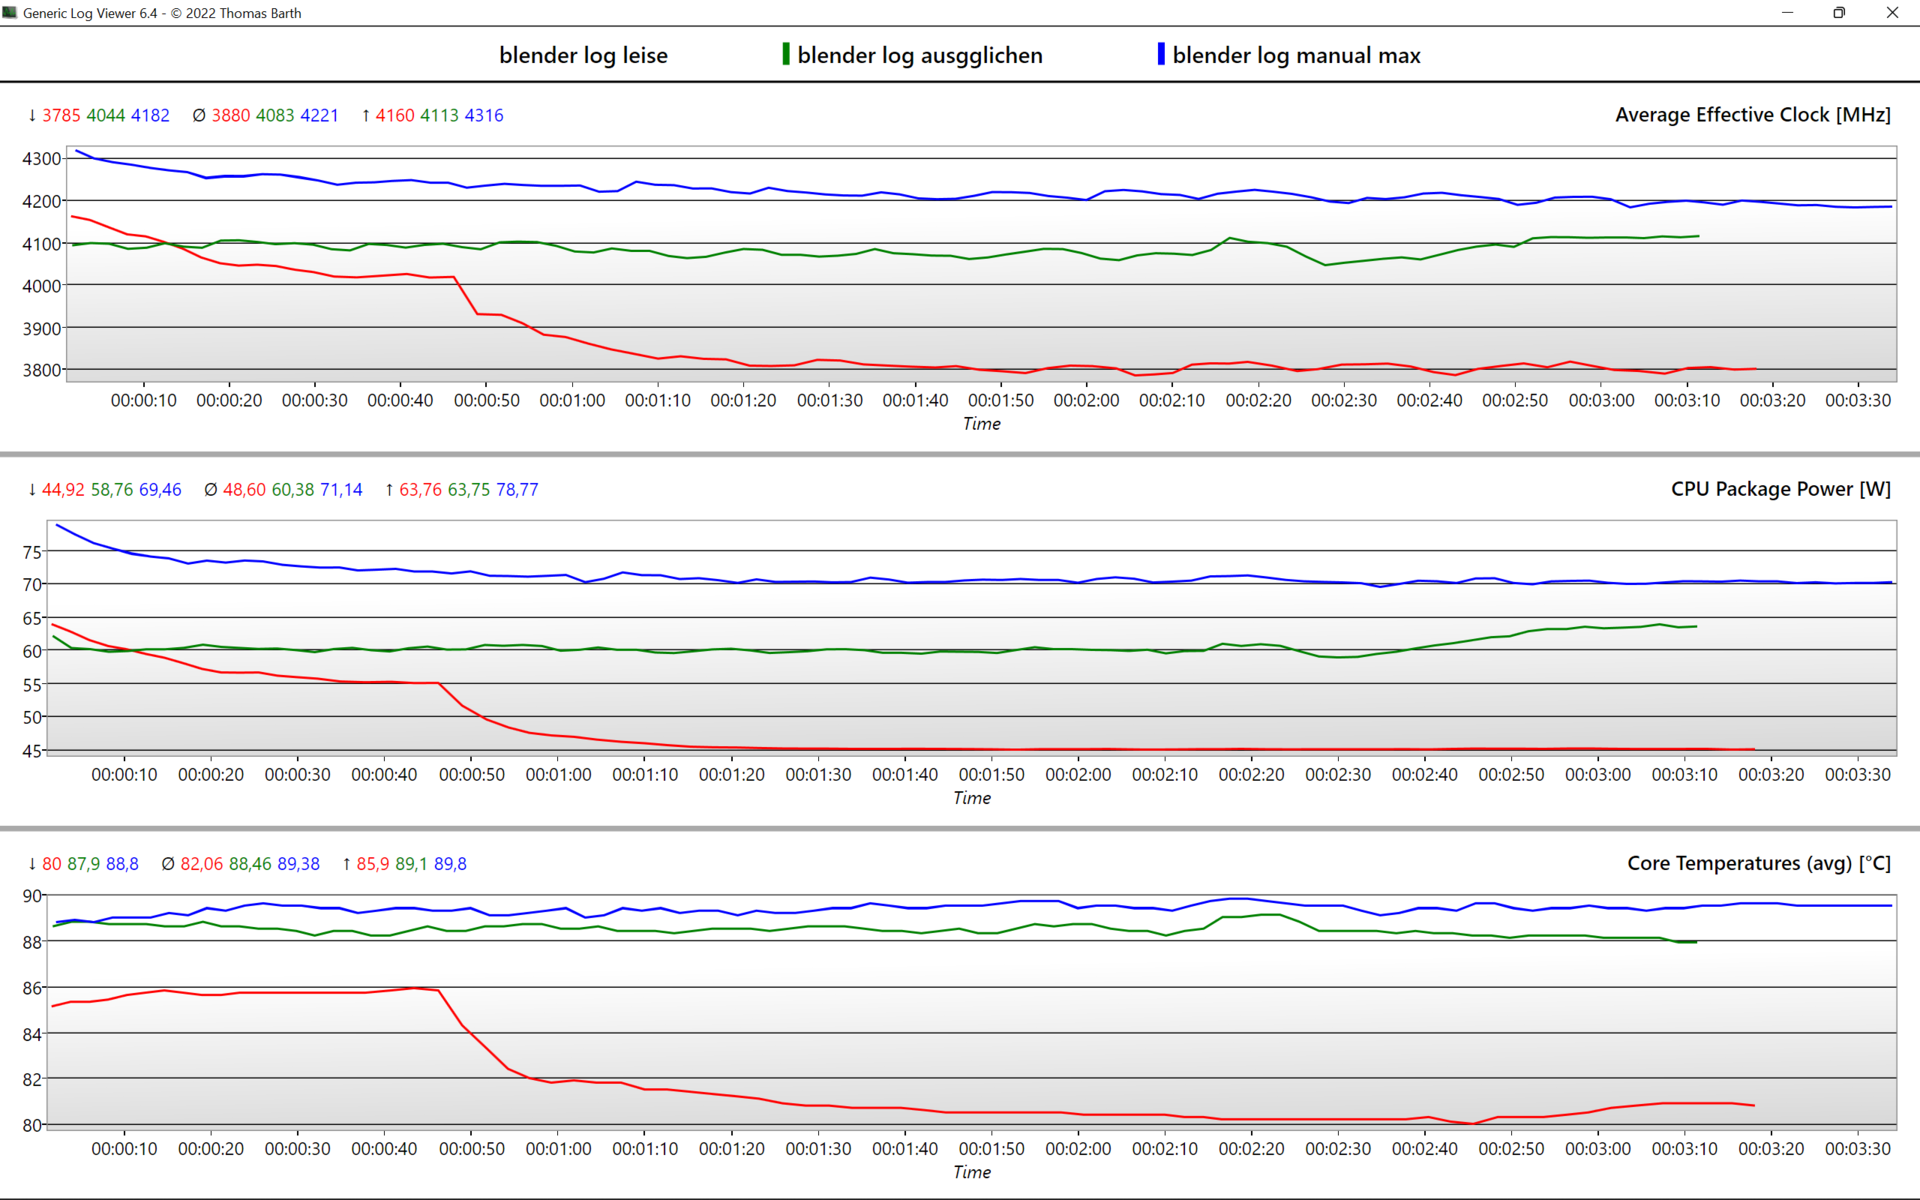
, el reloj de la CPU cae ligeramente a 4,1 GHz, lo que reduce el rendimiento en sólo un 3%, pero mejora el ruido del ventilador notablemente: 35.7 db(A) frente a 45,1 db(A). El límite de potencia se reduce en 10 vatios a 65 vatios y la CPU se mantiene alrededor de 2 °C más fría.En modo silencioso
, el reloj baja a 8x 3,8 GHz después de 50 segundos y el consumo de energía cae de los 65 a 45 vatios iniciales. Los ventiladores se vuelven entonces muy agradables con 32 db(A) y la temperatura de la CPU se enfría significativamente a 80 °C. El rendimiento a largo plazo es alrededor de un 15 por ciento inferior.En el modo de batería, no hay ningún impulso y todos los límites de potencia se restringen a 35 vatios, lo que lleva a una reducción del rendimiento de alrededor del 20%. Los homólogos de Intel suelen ver una caída mucho más significativa del rendimiento en modo batería, especialmente con un límite de 35 vatios (50% y más). Los ventiladores son aún más silenciosos bajo carga.
En CBR15, el Ryzen 9 puede así vencer a los rivales Alder Lake, como el Dell XPS 17 más grande. Los delgados Stealth GS66 y Aero 16 son un 20% más rápidos, ya que Alder Lake se beneficia mucho del alto consumo de energía. Los portátiles de juego más gruesos como el Scar 15 o el Legion 5 Pro son aún más
rápidos.En la clasificación general, nuestro dispositivo de pruebas queda en el medio. El Apple M1 Pro es un 36% más rápido en Geekbench 5.4
.


| Modo de alimentación | Reloj de la CPU (GHz) | Temperatura de la CPU (°C) | Consumo de energía de la CPU (W) | Sonoridad en db(A) @Blender |
|---|---|---|---|---|
| Manual (Max) | 4,2 | 89 | 70 | 50,6 |
| Turbo | 4,26 | 91 | 75 | 45,1 |
| Equilibrado / Rendimiento | 4,1 | 89 | 60 | 36 |
| Silencioso | 3,8 | 80 | 45 | 32 |
| Batería | 3,5 | 72 | 35 | 26,7 - 30,7 |
Cinebench R15 Multi Sustained Load
Cinebench R23: Multi Core | Single Core
Cinebench R20: CPU (Multi Core) | CPU (Single Core)
Cinebench R15: CPU Multi 64Bit | CPU Single 64Bit
Blender: v2.79 BMW27 CPU | v3.3 Classroom CPU | v3.3 Classroom CUDA
7-Zip 18.03: 7z b 4 | 7z b 4 -mmt1
Geekbench 5.5: Multi-Core | Single-Core | OpenCL Score
HWBOT x265 Benchmark v2.2: 4k Preset
LibreOffice : 20 Documents To PDF
R Benchmark 2.5: Overall mean
V-Ray 5 Benchmark: CPU | GPU CUDA | GPU RTX
V-Ray Benchmark Next 4.10: CPU | GPU
Mozilla Kraken 1.1: Total
WebXPRT 3: Overall
WebXPRT 4: Overall
Octane V2: Total Score
Jetstream 2: 2.0 Total
Sunspider: 1.0 Total Score
Speedometer 2.0: Result 2.0
| CPU Performance rating | |
| Media de la clase Gaming -1! | |
| Asus ROG Strix Scar 15 G533ZW-LN106WS -11! | |
| Lenovo Legion 5 Pro 16 G7 i7 RTX 3070Ti -7! | |
| MSI Stealth GS66 12UGS -10! | |
| Gigabyte Aero 16 YE5 -3! | |
| Dell XPS 17 9720 RTX 3060 -10! | |
| Asus ROG Zephyrus M16 GU603H -12! | |
| Asus ROG Flow X16 GV601RW-M5082W | |
| Lenovo ThinkPad X1 Extreme G4-20Y50040GE -9! | |
| Apple MacBook Pro 16 2021 M1 Pro -11! | |
| Asus ROG Flow X13 GV301QH -5! | |
| Medio AMD Ryzen 9 6900HS | |
| Microsoft Surface Laptop Studio i7 RTX 3050 Ti -7! | |
| Blender / v3.3 Classroom CPU | |
| Medio AMD Ryzen 9 6900HS (378 - 469, n=3) | |
| Asus ROG Flow X16 GV601RW-M5082W | |
| Media de la clase Gaming (122 - 565, n=105, últimos 2 años) | |
| Blender / v3.3 Classroom CUDA | |
| Medio AMD Ryzen 9 6900HS (42 - 116, n=2) | |
| Asus ROG Flow X16 GV601RW-M5082W | |
| Media de la clase Gaming (15 - 233, n=110, últimos 2 años) | |
| 7-Zip 18.03 / 7z b 4 -mmt1 | |
| Media de la clase Gaming (4199 - 7436, n=108, últimos 2 años) | |
| Gigabyte Aero 16 YE5 | |
| Asus ROG Strix Scar 15 G533ZW-LN106WS | |
| Lenovo Legion 5 Pro 16 G7 i7 RTX 3070Ti | |
| MSI Stealth GS66 12UGS | |
| Medio AMD Ryzen 9 6900HS (5538 - 5958, n=5) | |
| Asus ROG Flow X16 GV601RW-M5082W | |
| Dell XPS 17 9720 RTX 3060 | |
| Asus ROG Flow X13 GV301QH | |
| Asus ROG Zephyrus M16 GU603H | |
| Microsoft Surface Laptop Studio i7 RTX 3050 Ti | |
| HWBOT x265 Benchmark v2.2 / 4k Preset | |
| Media de la clase Gaming (11.5 - 44.3, n=108, últimos 2 años) | |
| Lenovo Legion 5 Pro 16 G7 i7 RTX 3070Ti | |
| Asus ROG Strix Scar 15 G533ZW-LN106WS | |
| MSI Stealth GS66 12UGS | |
| Gigabyte Aero 16 YE5 | |
| Asus ROG Flow X16 GV601RW-M5082W | |
| Medio AMD Ryzen 9 6900HS (14.2 - 17.9, n=5) | |
| Dell XPS 17 9720 RTX 3060 | |
| Asus ROG Flow X13 GV301QH | |
| Asus ROG Zephyrus M16 GU603H | |
| Lenovo ThinkPad X1 Extreme G4-20Y50040GE | |
| Microsoft Surface Laptop Studio i7 RTX 3050 Ti | |
| V-Ray 5 Benchmark / CPU | |
| Media de la clase Gaming (5864 - 30302, n=33, últimos 2 años) | |
| Dell XPS 17 9720 RTX 3060 | |
| Gigabyte Aero 16 YE5 | |
| Asus ROG Flow X16 GV601RW-M5082W | |
| Lenovo ThinkPad X1 Extreme G4-20Y50040GE | |
| Medio AMD Ryzen 9 6900HS (8067 - 9648, n=3) | |
| Apple MacBook Pro 16 2021 M1 Pro | |
| Asus ROG Flow X13 GV301QH | |
| V-Ray 5 Benchmark / GPU CUDA | |
| Media de la clase Gaming (887 - 3288, n=34, últimos 2 años) | |
| Gigabyte Aero 16 YE5 | |
| Asus ROG Flow X16 GV601RW-M5082W | |
| Lenovo ThinkPad X1 Extreme G4-20Y50040GE | |
| Medio AMD Ryzen 9 6900HS (210 - 1224, n=3) | |
| Apple MacBook Pro 16 2021 M1 Pro | |
| Asus ROG Flow X13 GV301QH | |
| V-Ray 5 Benchmark / GPU RTX | |
| Media de la clase Gaming (1146 - 4363, n=34, últimos 2 años) | |
| Asus ROG Flow X13 GV301QH | |
| Lenovo ThinkPad X1 Extreme G4-20Y50040GE | |
| Gigabyte Aero 16 YE5 | |
| Asus ROG Flow X16 GV601RW-M5082W | |
| Medio AMD Ryzen 9 6900HS (538 - 1510, n=2) | |
| V-Ray Benchmark Next 4.10 / CPU | |
| Media de la clase Gaming (10048 - 45327, n=101, últimos 2 años) | |
| Lenovo Legion 5 Pro 16 G7 i7 RTX 3070Ti | |
| Asus ROG Strix Scar 15 G533ZW-LN106WS | |
| MSI Stealth GS66 12UGS | |
| Gigabyte Aero 16 YE5 | |
| Asus ROG Zephyrus M16 GU603H | |
| Medio AMD Ryzen 9 6900HS (13527 - 15533, n=4) | |
| Asus ROG Flow X16 GV601RW-M5082W | |
| Asus ROG Flow X13 GV301QH | |
| Microsoft Surface Laptop Studio i7 RTX 3050 Ti | |
| V-Ray Benchmark Next 4.10 / GPU | |
| Media de la clase Gaming (427 - 1627, n=103, últimos 2 años) | |
| Lenovo Legion 5 Pro 16 G7 i7 RTX 3070Ti | |
| Gigabyte Aero 16 YE5 | |
| MSI Stealth GS66 12UGS | |
| Asus ROG Flow X16 GV601RW-M5082W | |
| Asus ROG Zephyrus M16 GU603H | |
| Asus ROG Strix Scar 15 G533ZW-LN106WS | |
| Microsoft Surface Laptop Studio i7 RTX 3050 Ti | |
| Medio AMD Ryzen 9 6900HS (75 - 427, n=4) | |
| Asus ROG Flow X13 GV301QH | |
| WebXPRT 4 / Overall | |
| Media de la clase Gaming (165 - 354, n=101, últimos 2 años) | |
| Asus ROG Flow X16 GV601RW-M5082W | |
| Medio AMD Ryzen 9 6900HS (184.4 - 225, n=3) | |
| Octane V2 / Total Score | |
| Media de la clase Gaming (93292 - 139447, n=27, últimos 2 años) | |
| Gigabyte Aero 16 YE5 | |
| Lenovo Legion 5 Pro 16 G7 i7 RTX 3070Ti | |
| Lenovo ThinkPad X1 Extreme G4-20Y50040GE | |
| Asus ROG Flow X16 GV601RW-M5082W | |
| Medio AMD Ryzen 9 6900HS (n=1) | |
| Asus ROG Flow X13 GV301QH | |
| Apple MacBook Pro 16 2021 M1 Pro | |
| Microsoft Surface Laptop Studio i7 RTX 3050 Ti | |
| Jetstream 2 / 2.0 Total | |
| Media de la clase Gaming (306 - 516, n=28, últimos 2 años) | |
| Gigabyte Aero 16 YE5 | |
| Lenovo Legion 5 Pro 16 G7 i7 RTX 3070Ti | |
| Dell XPS 17 9720 RTX 3060 | |
| Asus ROG Flow X16 GV601RW-M5082W | |
| Medio AMD Ryzen 9 6900HS (223 - 236, n=2) | |
| Lenovo ThinkPad X1 Extreme G4-20Y50040GE | |
| Apple MacBook Pro 16 2021 M1 Pro | |
| Microsoft Surface Laptop Studio i7 RTX 3050 Ti | |
| Asus ROG Flow X13 GV301QH | |
| Sunspider / 1.0 Total Score | |
| Medio AMD Ryzen 9 6900HS (94 - 119.2, n=2) | |
| Gigabyte Aero 16 YE5 | |
| Asus ROG Flow X16 GV601RW-M5082W | |
| Apple MacBook Pro 16 2021 M1 Pro | |
| Speedometer 2.0 / Result 2.0 | |
| Media de la clase Gaming (29 - 686, n=27, últimos 2 años) | |
| Apple MacBook Pro 16 2021 M1 Pro | |
| Gigabyte Aero 16 YE5 | |
| Lenovo Legion 5 Pro 16 G7 i7 RTX 3070Ti | |
| Medio AMD Ryzen 9 6900HS (n=1) | |
| Asus ROG Flow X16 GV601RW-M5082W | |
| Lenovo ThinkPad X1 Extreme G4-20Y50040GE | |
| Microsoft Surface Laptop Studio i7 RTX 3050 Ti | |
* ... más pequeño es mejor
AIDA64: FP32 Ray-Trace | FPU Julia | CPU SHA3 | CPU Queen | FPU SinJulia | FPU Mandel | CPU AES | CPU ZLib | FP64 Ray-Trace | CPU PhotoWorxx
| AIDA64 / FP64 Ray-Trace | |
| Media de la clase Gaming (5509 - 45446, n=107, últimos 2 años) | |
| Asus ROG Flow X16 GV601RW-M5082W | |
| Lenovo ThinkPad X1 Extreme G4-20Y50040GE | |
| Medio AMD Ryzen 9 6900HS (7530 - 8981, n=5) | |
| Lenovo Legion 5 Pro 16 G7 i7 RTX 3070Ti | |
| Asus ROG Strix Scar 15 G533ZW-LN106WS | |
| MSI Stealth GS66 12UGS | |
| Gigabyte Aero 16 YE5 | |
| Dell XPS 17 9720 RTX 3060 | |
| Microsoft Surface Laptop Studio i7 RTX 3050 Ti | |
Rendimiento del sistema
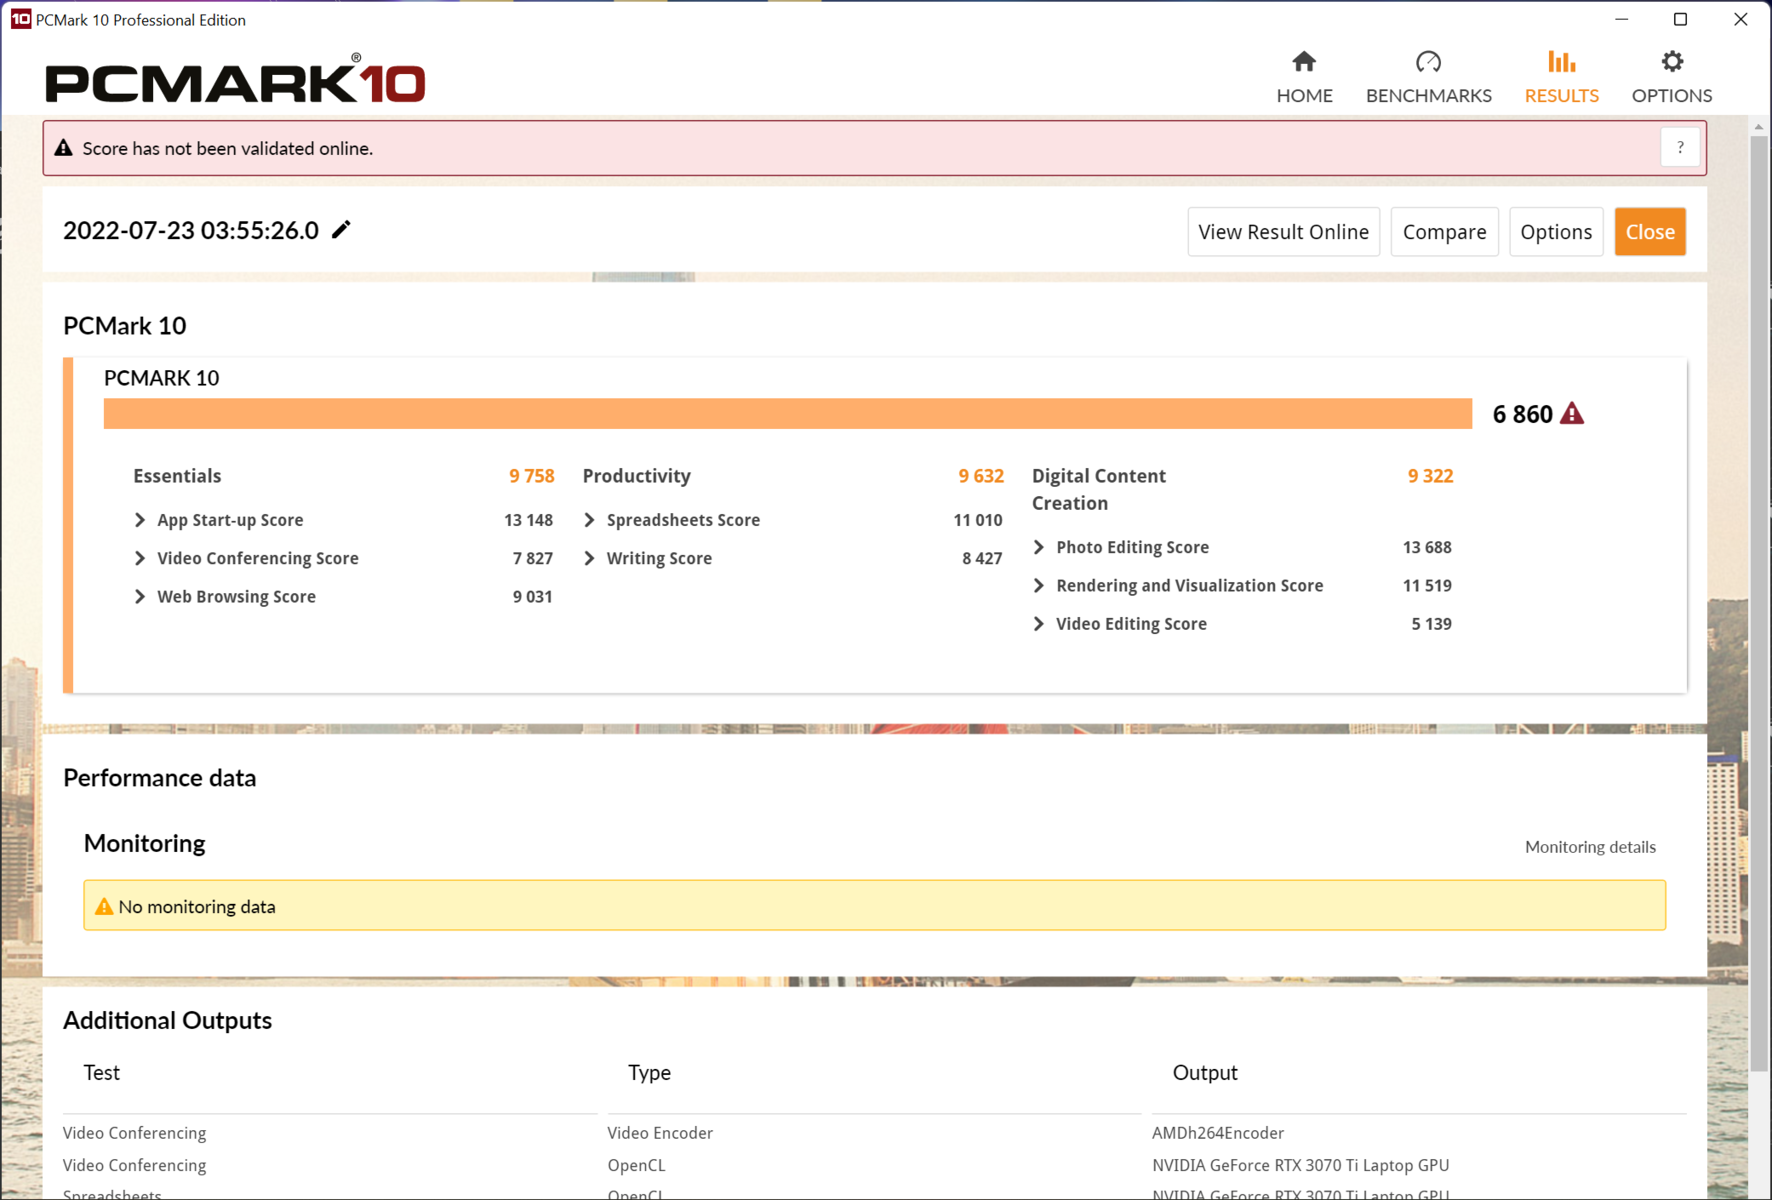
PCMark 10: El ROG Flow X16 está en el centro del campo. El rendimiento subjetivo del sistema es muy bueno y completamente libre de lag. Cualquier entrada no podría ser más rápida bajo MS Windows. La navegación intensiva con múltiples pestañas mientras se reproduce un vídeo 4K de YouTube no es un problema para el portátil AMD. Incluso hay suficiente potencia para el streaming de juegos.
CrossMark: Overall | Productivity | Creativity | Responsiveness
| PCMark 10 / Score | |
| Media de la clase Gaming (5828 - 11574, n=95, últimos 2 años) | |
| Asus ROG Strix Scar 15 G533ZW-LN106WS | |
| Gigabyte Aero 16 YE5 | |
| MSI Stealth GS66 12UGS | |
| Lenovo Legion 5 Pro 16 G7 i7 RTX 3070Ti | |
| Dell XPS 17 9720 RTX 3060 | |
| Asus ROG Zephyrus M16 GU603H | |
| Lenovo ThinkPad X1 Extreme G4-20Y50040GE | |
| Asus ROG Flow X16 GV601RW-M5082W | |
| Medio AMD Ryzen 9 6900HS, NVIDIA GeForce RTX 3070 Ti Laptop GPU (n=1) | |
| Asus ROG Flow X13 GV301QH | |
| Microsoft Surface Laptop Studio i7 RTX 3050 Ti | |
| PCMark 10 / Essentials | |
| Gigabyte Aero 16 YE5 | |
| MSI Stealth GS66 12UGS | |
| Dell XPS 17 9720 RTX 3060 | |
| Asus ROG Strix Scar 15 G533ZW-LN106WS | |
| Media de la clase Gaming (8810 - 12600, n=99, últimos 2 años) | |
| Asus ROG Zephyrus M16 GU603H | |
| Lenovo ThinkPad X1 Extreme G4-20Y50040GE | |
| Lenovo Legion 5 Pro 16 G7 i7 RTX 3070Ti | |
| Asus ROG Flow X13 GV301QH | |
| Asus ROG Flow X16 GV601RW-M5082W | |
| Medio AMD Ryzen 9 6900HS, NVIDIA GeForce RTX 3070 Ti Laptop GPU (n=1) | |
| Microsoft Surface Laptop Studio i7 RTX 3050 Ti | |
| PCMark 10 / Productivity | |
| Media de la clase Gaming (6845 - 21327, n=97, últimos 2 años) | |
| Asus ROG Strix Scar 15 G533ZW-LN106WS | |
| Gigabyte Aero 16 YE5 | |
| Lenovo Legion 5 Pro 16 G7 i7 RTX 3070Ti | |
| Asus ROG Flow X16 GV601RW-M5082W | |
| Medio AMD Ryzen 9 6900HS, NVIDIA GeForce RTX 3070 Ti Laptop GPU (n=1) | |
| MSI Stealth GS66 12UGS | |
| Dell XPS 17 9720 RTX 3060 | |
| Asus ROG Zephyrus M16 GU603H | |
| Lenovo ThinkPad X1 Extreme G4-20Y50040GE | |
| Asus ROG Flow X13 GV301QH | |
| Microsoft Surface Laptop Studio i7 RTX 3050 Ti | |
| PCMark 10 / Digital Content Creation | |
| Media de la clase Gaming (7602 - 19657, n=97, últimos 2 años) | |
| Asus ROG Strix Scar 15 G533ZW-LN106WS | |
| Lenovo Legion 5 Pro 16 G7 i7 RTX 3070Ti | |
| Gigabyte Aero 16 YE5 | |
| MSI Stealth GS66 12UGS | |
| Dell XPS 17 9720 RTX 3060 | |
| Asus ROG Zephyrus M16 GU603H | |
| Lenovo ThinkPad X1 Extreme G4-20Y50040GE | |
| Asus ROG Flow X16 GV601RW-M5082W | |
| Medio AMD Ryzen 9 6900HS, NVIDIA GeForce RTX 3070 Ti Laptop GPU (n=1) | |
| Asus ROG Flow X13 GV301QH | |
| Microsoft Surface Laptop Studio i7 RTX 3050 Ti | |
| CrossMark / Overall | |
| Gigabyte Aero 16 YE5 | |
| Asus ROG Strix Scar 15 G533ZW-LN106WS | |
| Media de la clase Gaming (1366 - 2409, n=95, últimos 2 años) | |
| Lenovo Legion 5 Pro 16 G7 i7 RTX 3070Ti | |
| Dell XPS 17 9720 RTX 3060 | |
| Asus ROG Flow X16 GV601RW-M5082W | |
| Medio AMD Ryzen 9 6900HS, NVIDIA GeForce RTX 3070 Ti Laptop GPU (n=1) | |
| Lenovo ThinkPad X1 Extreme G4-20Y50040GE | |
| Apple MacBook Pro 16 2021 M1 Pro | |
| Microsoft Surface Laptop Studio i7 RTX 3050 Ti | |
| CrossMark / Productivity | |
| Gigabyte Aero 16 YE5 | |
| Asus ROG Strix Scar 15 G533ZW-LN106WS | |
| Lenovo Legion 5 Pro 16 G7 i7 RTX 3070Ti | |
| Media de la clase Gaming (1386 - 2254, n=95, últimos 2 años) | |
| Dell XPS 17 9720 RTX 3060 | |
| Lenovo ThinkPad X1 Extreme G4-20Y50040GE | |
| Asus ROG Flow X16 GV601RW-M5082W | |
| Medio AMD Ryzen 9 6900HS, NVIDIA GeForce RTX 3070 Ti Laptop GPU (n=1) | |
| Microsoft Surface Laptop Studio i7 RTX 3050 Ti | |
| Apple MacBook Pro 16 2021 M1 Pro | |
| CrossMark / Creativity | |
| Media de la clase Gaming (1343 - 2729, n=95, últimos 2 años) | |
| Gigabyte Aero 16 YE5 | |
| Asus ROG Strix Scar 15 G533ZW-LN106WS | |
| Dell XPS 17 9720 RTX 3060 | |
| Apple MacBook Pro 16 2021 M1 Pro | |
| Lenovo Legion 5 Pro 16 G7 i7 RTX 3070Ti | |
| Asus ROG Flow X16 GV601RW-M5082W | |
| Medio AMD Ryzen 9 6900HS, NVIDIA GeForce RTX 3070 Ti Laptop GPU (n=1) | |
| Lenovo ThinkPad X1 Extreme G4-20Y50040GE | |
| Microsoft Surface Laptop Studio i7 RTX 3050 Ti | |
| CrossMark / Responsiveness | |
| Gigabyte Aero 16 YE5 | |
| Asus ROG Strix Scar 15 G533ZW-LN106WS | |
| Lenovo Legion 5 Pro 16 G7 i7 RTX 3070Ti | |
| Media de la clase Gaming (1226 - 2334, n=95, últimos 2 años) | |
| Dell XPS 17 9720 RTX 3060 | |
| Lenovo ThinkPad X1 Extreme G4-20Y50040GE | |
| Asus ROG Flow X16 GV601RW-M5082W | |
| Medio AMD Ryzen 9 6900HS, NVIDIA GeForce RTX 3070 Ti Laptop GPU (n=1) | |
| Microsoft Surface Laptop Studio i7 RTX 3050 Ti | |
| Apple MacBook Pro 16 2021 M1 Pro | |
| PCMark 10 Score | 6860 puntos | |
ayuda | ||
| AIDA64 / Memory Latency | |
| Media de la clase Gaming (75.3 - 259, n=107, últimos 2 años) | |
| Microsoft Surface Laptop Studio i7 RTX 3050 Ti | |
| Asus ROG Strix Scar 15 G533ZW-LN106WS | |
| Lenovo Legion 5 Pro 16 G7 i7 RTX 3070Ti | |
| MSI Stealth GS66 12UGS | |
| Asus ROG Flow X16 GV601RW-M5082W | |
| Dell XPS 17 9720 RTX 3060 | |
| Medio AMD Ryzen 9 6900HS (79.2 - 110.9, n=5) | |
| Gigabyte Aero 16 YE5 | |
| Lenovo ThinkPad X1 Extreme G4-20Y50040GE | |
* ... más pequeño es mejor
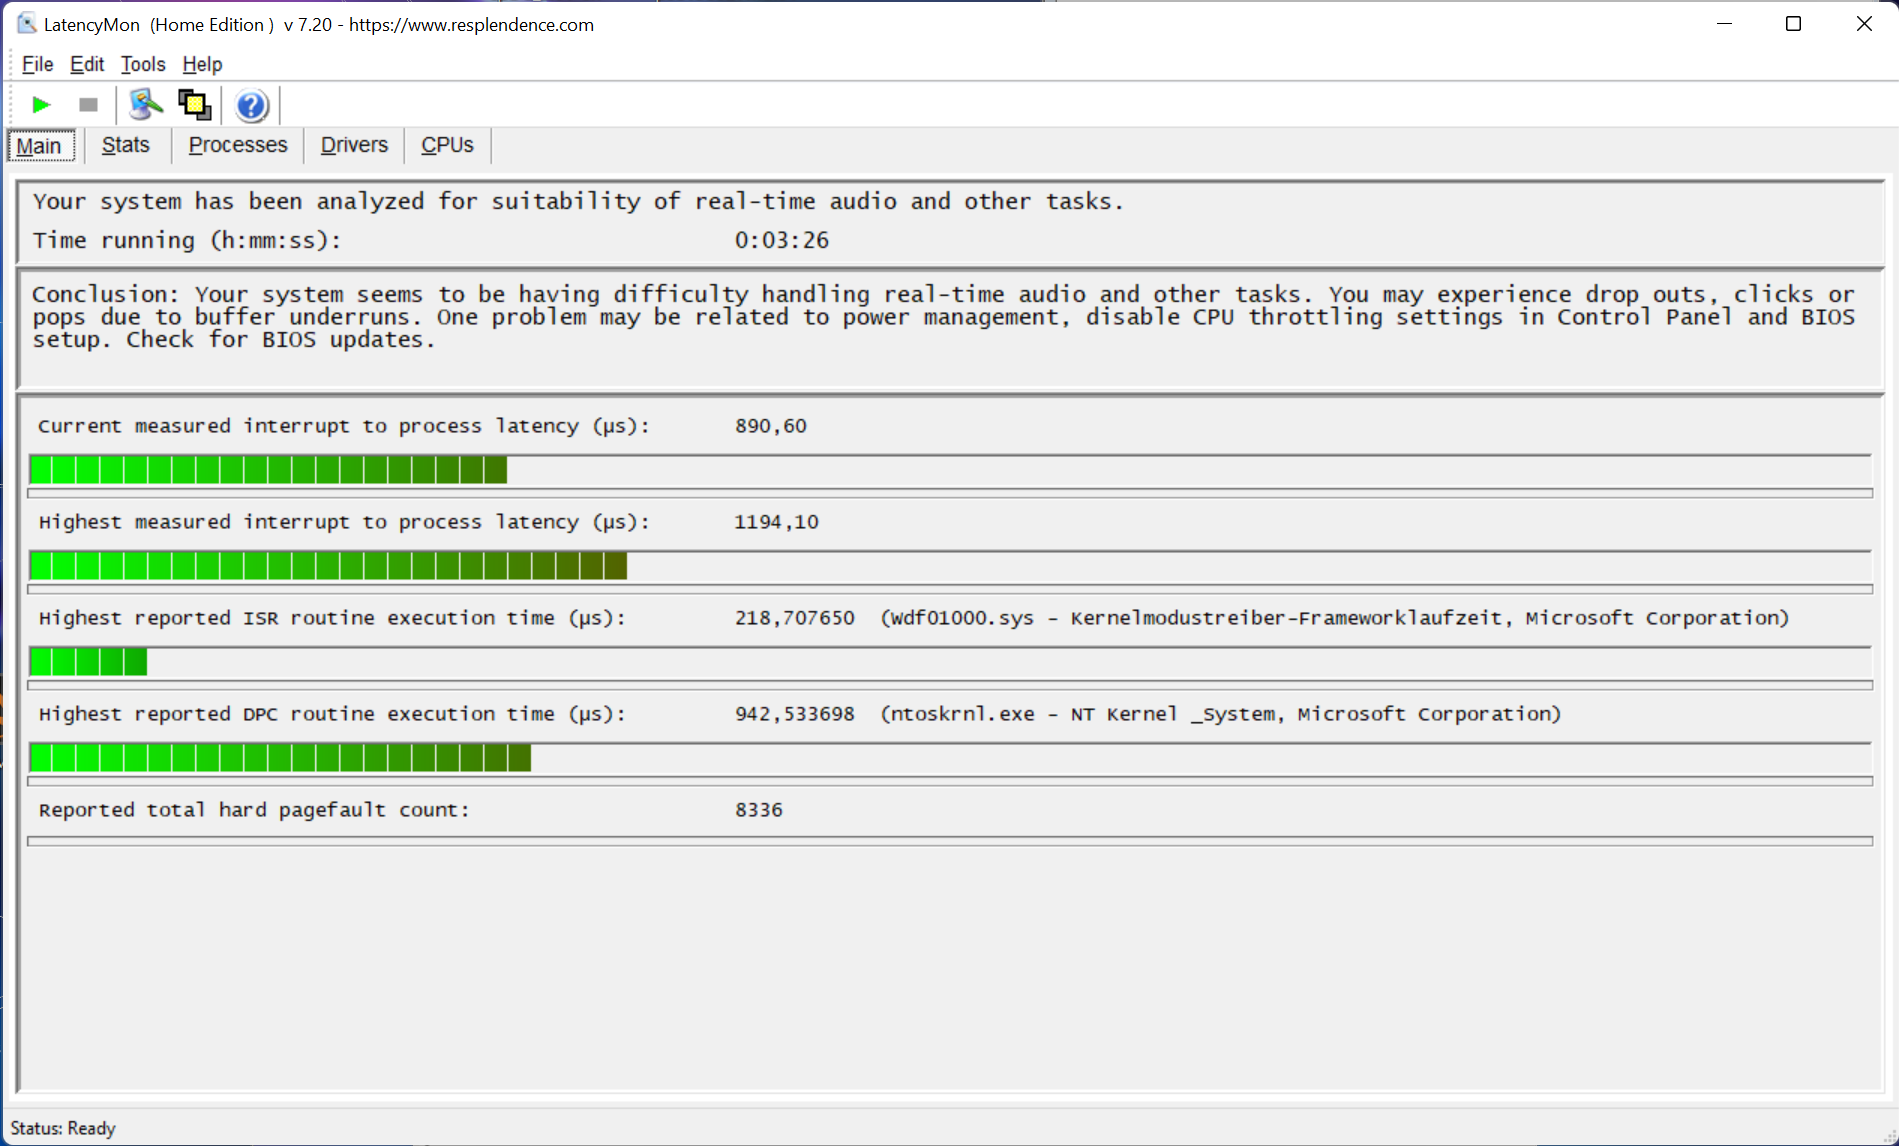
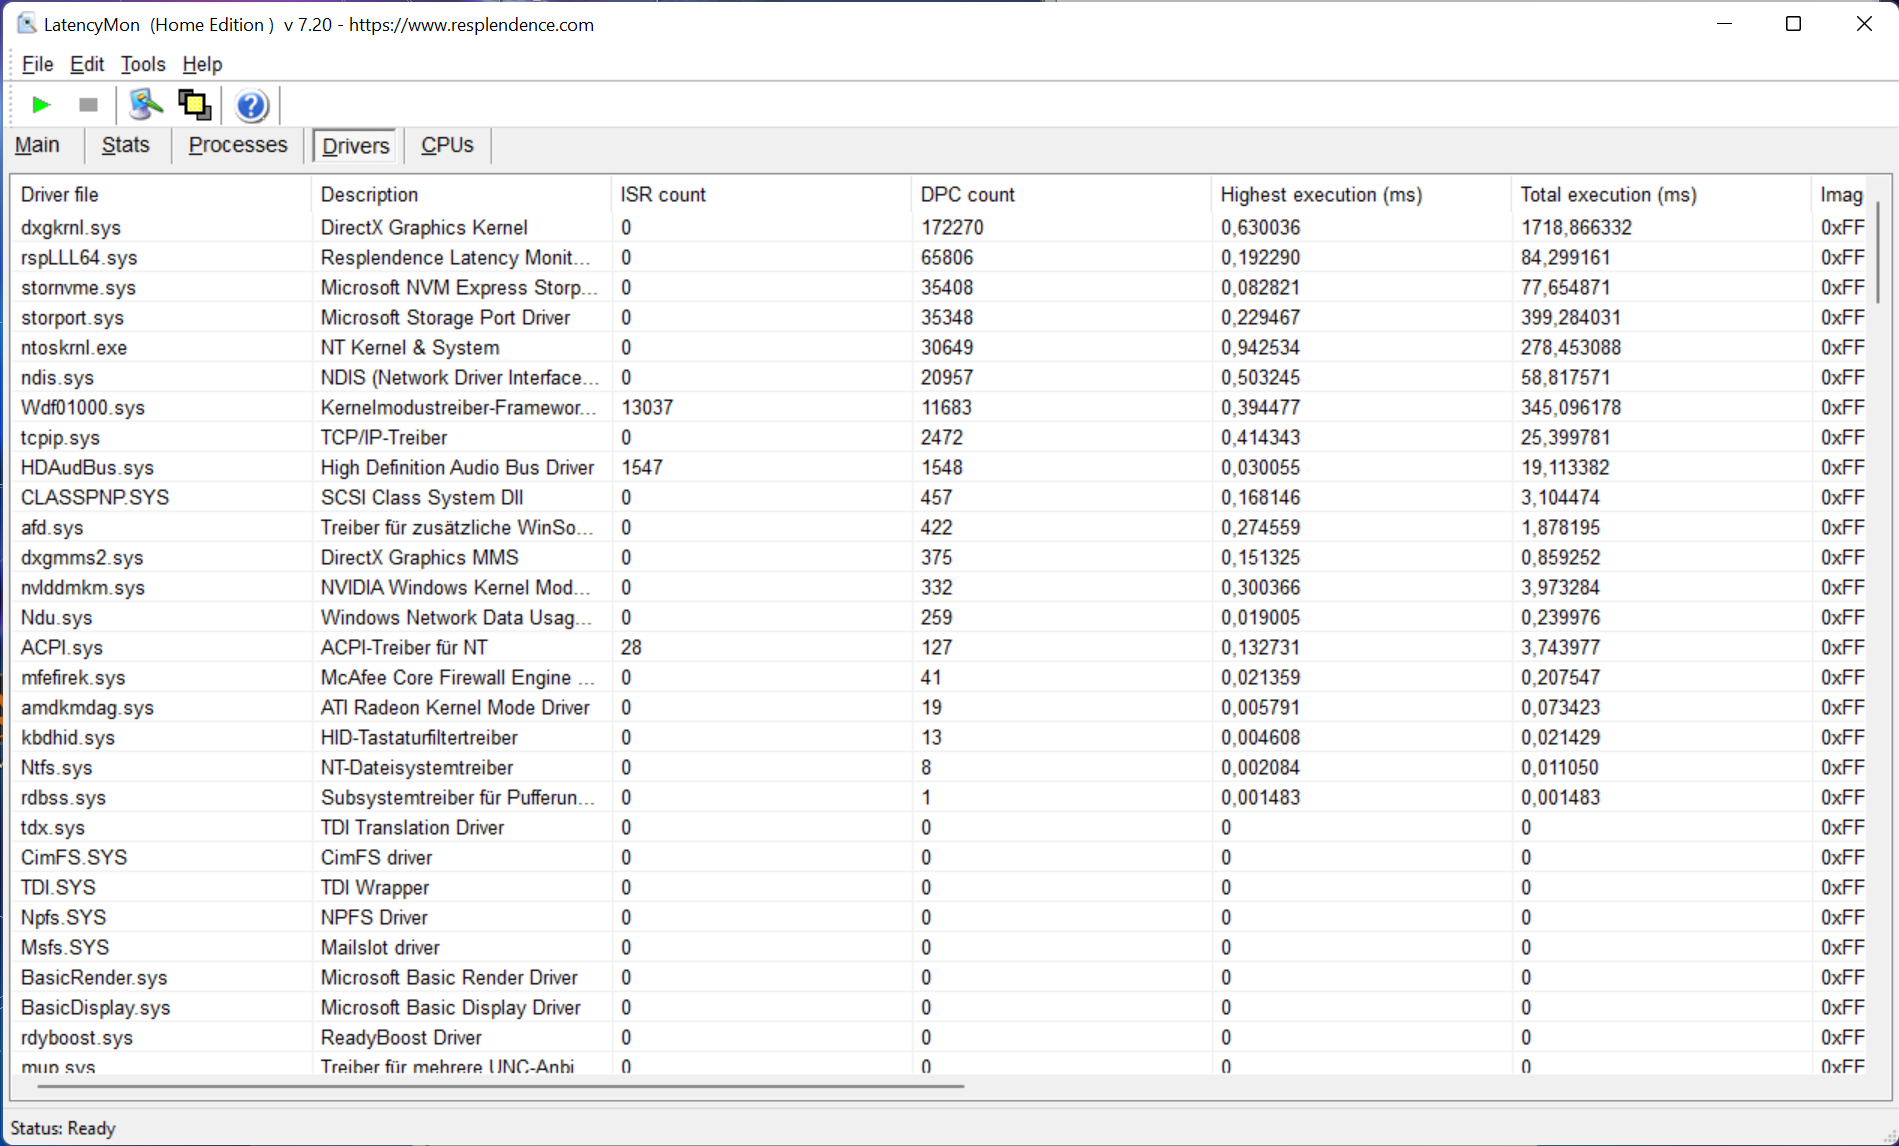
Latencia del CPD
El ROG Flow X16, concretamente nuestro modelo de análisis, parece tener problemas para gestionar la edición de audio y vídeo en tiempo real. El núcleo de gráficos DirectX es el principal responsable aquí. Futuras actualizaciones de la BIOS podrían mejorar esto.
la reproducción 4K de YouTube causa una carga de CPU del 4% y ~20% en la Radeon iGPU. No se registraron fotogramas saltados.
| DPC Latencies / LatencyMon - interrupt to process latency (max), Web, Youtube, Prime95 | |
| Asus ROG Flow X13 GV301QH | |
| MSI Stealth GS66 12UGS | |
| Lenovo ThinkPad X1 Extreme G4-20Y50040GE | |
| Asus ROG Flow X16 GV601RW-M5082W | |
| Asus ROG Zephyrus M16 GU603H | |
| Asus ROG Strix Scar 15 G533ZW-LN106WS | |
| Microsoft Surface Laptop Studio i7 RTX 3050 Ti | |
| Lenovo Legion 5 Pro 16 G7 i7 RTX 3070Ti | |
| Gigabyte Aero 16 YE5 | |
| Dell XPS 17 9720 RTX 3060 | |
* ... más pequeño es mejor
Dispositivos de almacenamiento
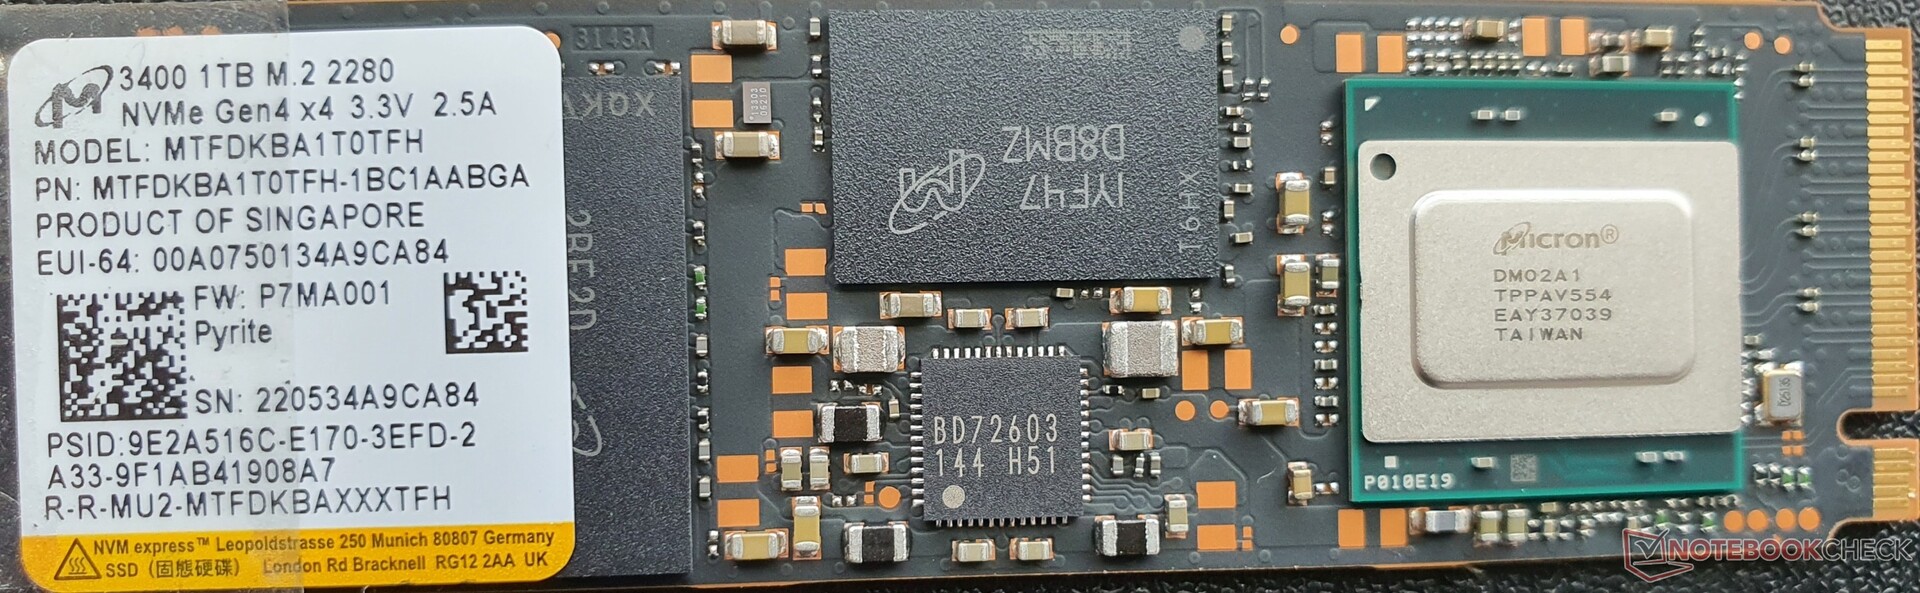
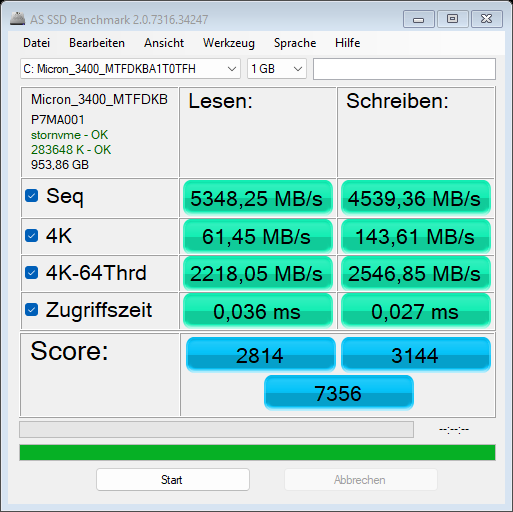
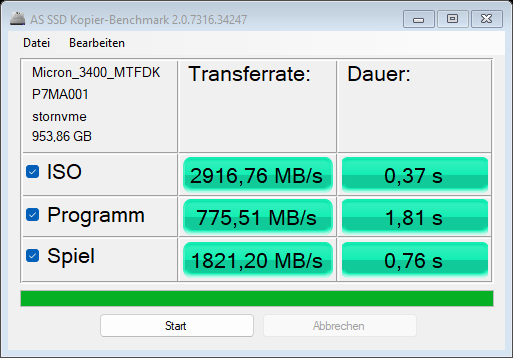
El 1 terabyteMicron 3400 se conecta a través de PCIe 4.0 y es capaz de funcionar a altas velocidades. Nuestra prueba de resistencia del rendimiento de lectura no muestra ninguna caída. Sin embargo, los valores 4K quedan un poco por detrás de la competencia.
| Asus ROG Flow X16 GV601RW-M5082W GeForce RTX 3070 Ti Laptop GPU, R9 6900HS, Micron 3400 1TB MTFDKBA1T0TFH | Asus ROG Zephyrus M16 GU603H GeForce RTX 3070 Laptop GPU, i9-11900H, Samsung PM9A1 MZVL22T0HBLB | Asus ROG Strix Scar 15 G533ZW-LN106WS GeForce RTX 3070 Ti Laptop GPU, i9-12900H, Samsung PM9A1 MZVL22T0HBLB | Gigabyte Aero 16 YE5 GeForce RTX 3080 Ti Laptop GPU, i9-12900HK, Phison ESR01TBMFCT | Lenovo Legion 5 Pro 16 G7 i7 RTX 3070Ti GeForce RTX 3070 Ti Laptop GPU, i7-12700H, Samsung PM9A1 MZVL21T0HCLR | Lenovo ThinkPad X1 Extreme G4-20Y50040GE GeForce RTX 3080 Laptop GPU, i9-11950H, Kioxia XG7 KXG7AZNV1T02 | Dell XPS 17 9720 RTX 3060 GeForce RTX 3060 Laptop GPU, i7-12700H, Samsung PM9A1 MZVL21T0HCLR | Microsoft Surface Laptop Studio i7 RTX 3050 Ti GeForce RTX 3050 Ti Laptop GPU, i7-11370H, SK Hynix PC711 1TB HFS001TDE9X084N | |
|---|---|---|---|---|---|---|---|---|
| AS SSD | 9% | 15% | 26% | 24% | -4% | -14% | -21% | |
| Seq Read (MB/s) | 5348.25 | 5615 5% | 5563.48 4% | 5588 4% | 5036 -6% | 5386 1% | 5241.84 -2% | 2768 -48% |
| Seq Write (MB/s) | 4539.36 | 4297 -5% | 4045.87 -11% | 3267 -28% | 3784 -17% | 4218 -7% | 2208.41 -51% | 1683 -63% |
| 4K Read (MB/s) | 61.45 | 55.3 -10% | 81.3 32% | 109.4 78% | 88.1 43% | 65.9 7% | 79.6 30% | 63.7 4% |
| 4K Write (MB/s) | 143.61 | 170.5 19% | 248.96 73% | 321.6 124% | 240.4 67% | 223.2 55% | 221.57 54% | 191.1 33% |
| 4K-64 Read (MB/s) | 2218.05 | 2591 17% | 2740.24 24% | 2966 34% | 2788 26% | 2757 24% | 1264.16 -43% | 917 -59% |
| 4K-64 Write (MB/s) | 2546.85 | 3190 25% | 3345.62 31% | 3342 31% | 3424 34% | 1736 -32% | 3070.83 21% | 1983 -22% |
| Access Time Read * (ms) | 0.036 | 0.04 -11% | 0.022 39% | 0.056 -56% | 0.02 44% | 0.049 -36% | 0.031 14% | 0.024 33% |
| Access Time Write * (ms) | 0.027 | 0.025 7% | 0.017 37% | 0.012 56% | 0.018 33% | 0.02 26% | 0.056 -107% | 0.019 30% |
| Score Read (Points) | 2814 | 3208 14% | 3378 20% | 3634 29% | 3380 20% | 3361 19% | 1868 -34% | 1257 -55% |
| Score Write (Points) | 3144 | 3790 21% | 3999 27% | 3991 27% | 4043 29% | 2381 -24% | 3513 12% | 2343 -25% |
| Score Total (Points) | 7356 | 8563 16% | 9031 23% | 9380 28% | 9094 24% | 7397 1% | 6203 -16% | 4206 -43% |
| Copy ISO MB/s (MB/s) | 2916.76 | 2358.18 -19% | 2352 -19% | 3221 10% | 2598 -11% | 2874.04 -1% | 1991 -32% | |
| Copy Program MB/s (MB/s) | 775.51 | 466.47 -40% | 1031 33% | 939 21% | 434.7 -44% | 447.82 -42% | 606 -22% | |
| Copy Game MB/s (MB/s) | 1821.2 | 1211.65 -33% | 2188 20% | 1995 10% | 1230 -32% | 1327.42 -27% | 1435 -21% |
* ... más pequeño es mejor
* ... más pequeño es mejor
Sustained Performance Read: DiskSpd Read Loop, Queue Depth 8
Tarjeta gráfica
Nvidia GeForce RTX 3070 Ti se usa como unidad gráfica dedicada, que tiene acceso a 8 GB de VRAM GDDR6. El rendimiento está a un alto nivel gracias a la variante más potente (125 vatios TGP, incluyendo Dynamic Boost), que no es necesariamente lo que se espera de un convertible de 16 pulgadas compacto y ligero
Incluso elMSI Stealth GS66tiene que reconocer su derrota como portátil de juego puro debido a su menor TGP de 105 vatios, y el Gigabyte Aero 16 con su RTX 3080 Ti queda un 10% por detrás, ya que sólo refrigera 90 vatios a pesar de una construcción similar. Sólo los portátiles de juego más gruesos, como el Legion 5 Pro y el ROG Strix Scar 15 son capaces de hacer funcionar la RTX 3070 Ti con un TGP aún más alto de 150 vatios (125 W + 25 W Dynamic Boost) y están por tanto entre un 10 y un 15 por ciento por encima del ROG Flow X16 en las pruebas 3DMark
Usando la iGPU Radeon 680M, el Flow X16 dura casi el doble mientras juega con batería que con la RTX 3070 Ti activada (2:06 h frente a 0:56 h). El rendimiento de la dGPU sigue siendo el doble que el de la iGPU y sigue estando disponible al menos el 50% del rendimiento original de la dGPU. En comparación, elXMG Neo 15 limita su rendimiento gráfico en un 90% en modo batería. Con una fuente de alimentación USB-C de 100 vatios, solo está disponible la mitad del rendimiento de la dGPU
Aunque la RTX 3070 Ti no es una GPU de estación de trabajo profesional, el rendimiento correspondiente, como en las pruebas SpecViewPerf, es impresionante y las pruebas CUDA también están a gran nivel. No obstante, el ROG Flow X16 no está diseñado como un portátil de estación de trabajo, para el que faltan drivers especiales.
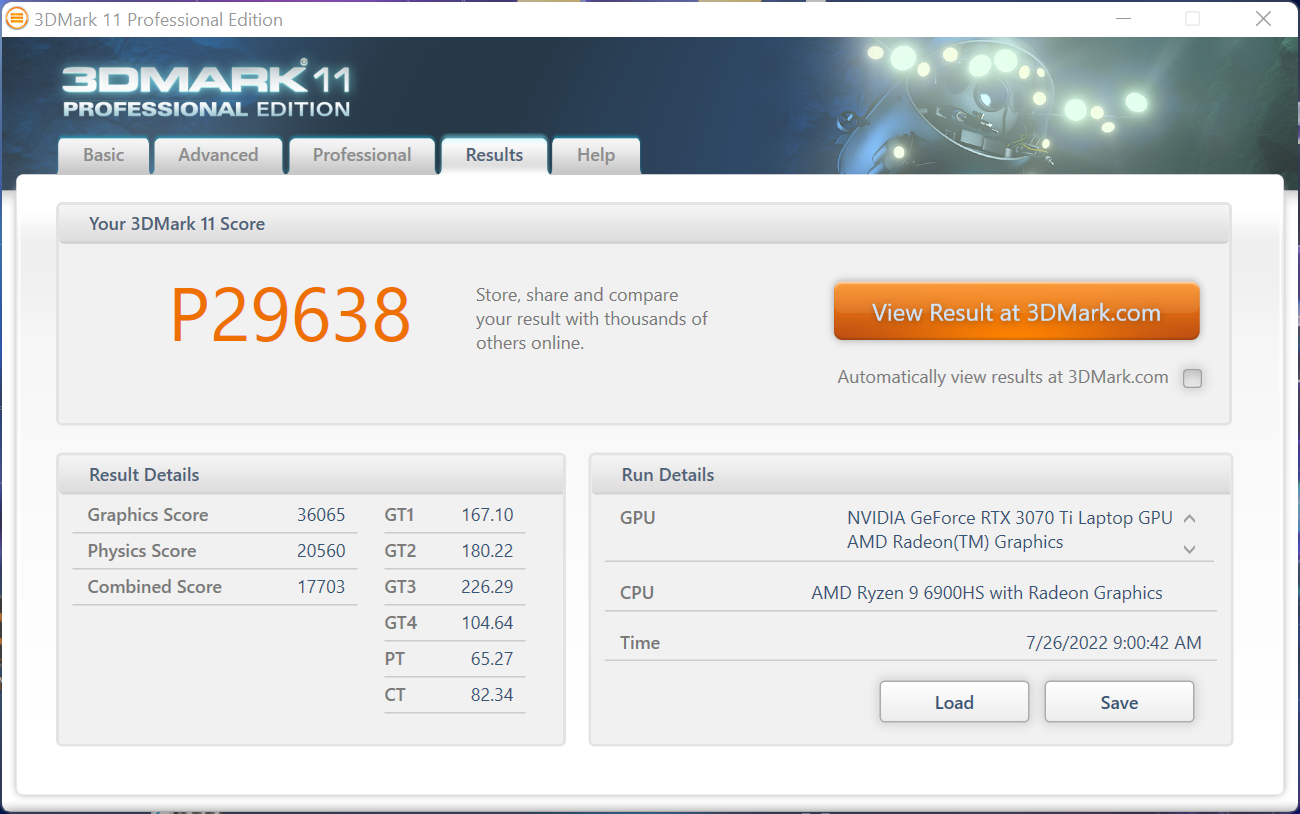
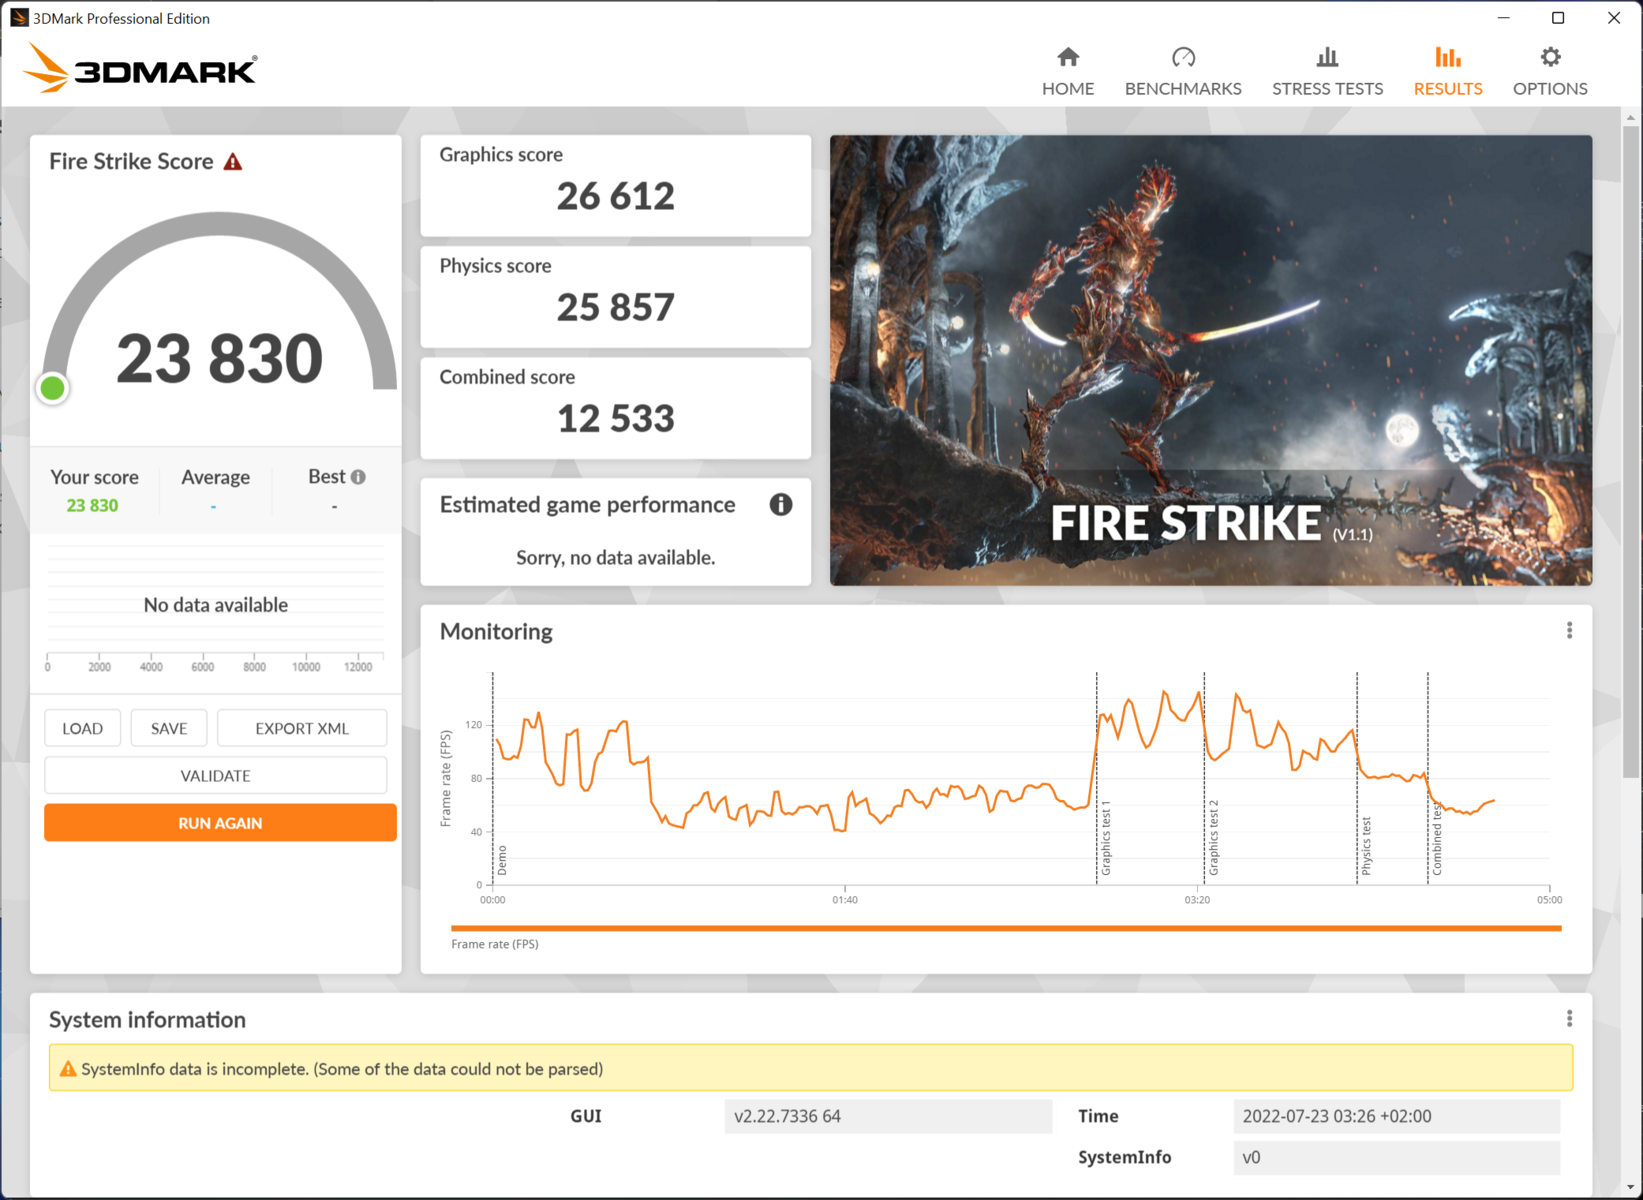

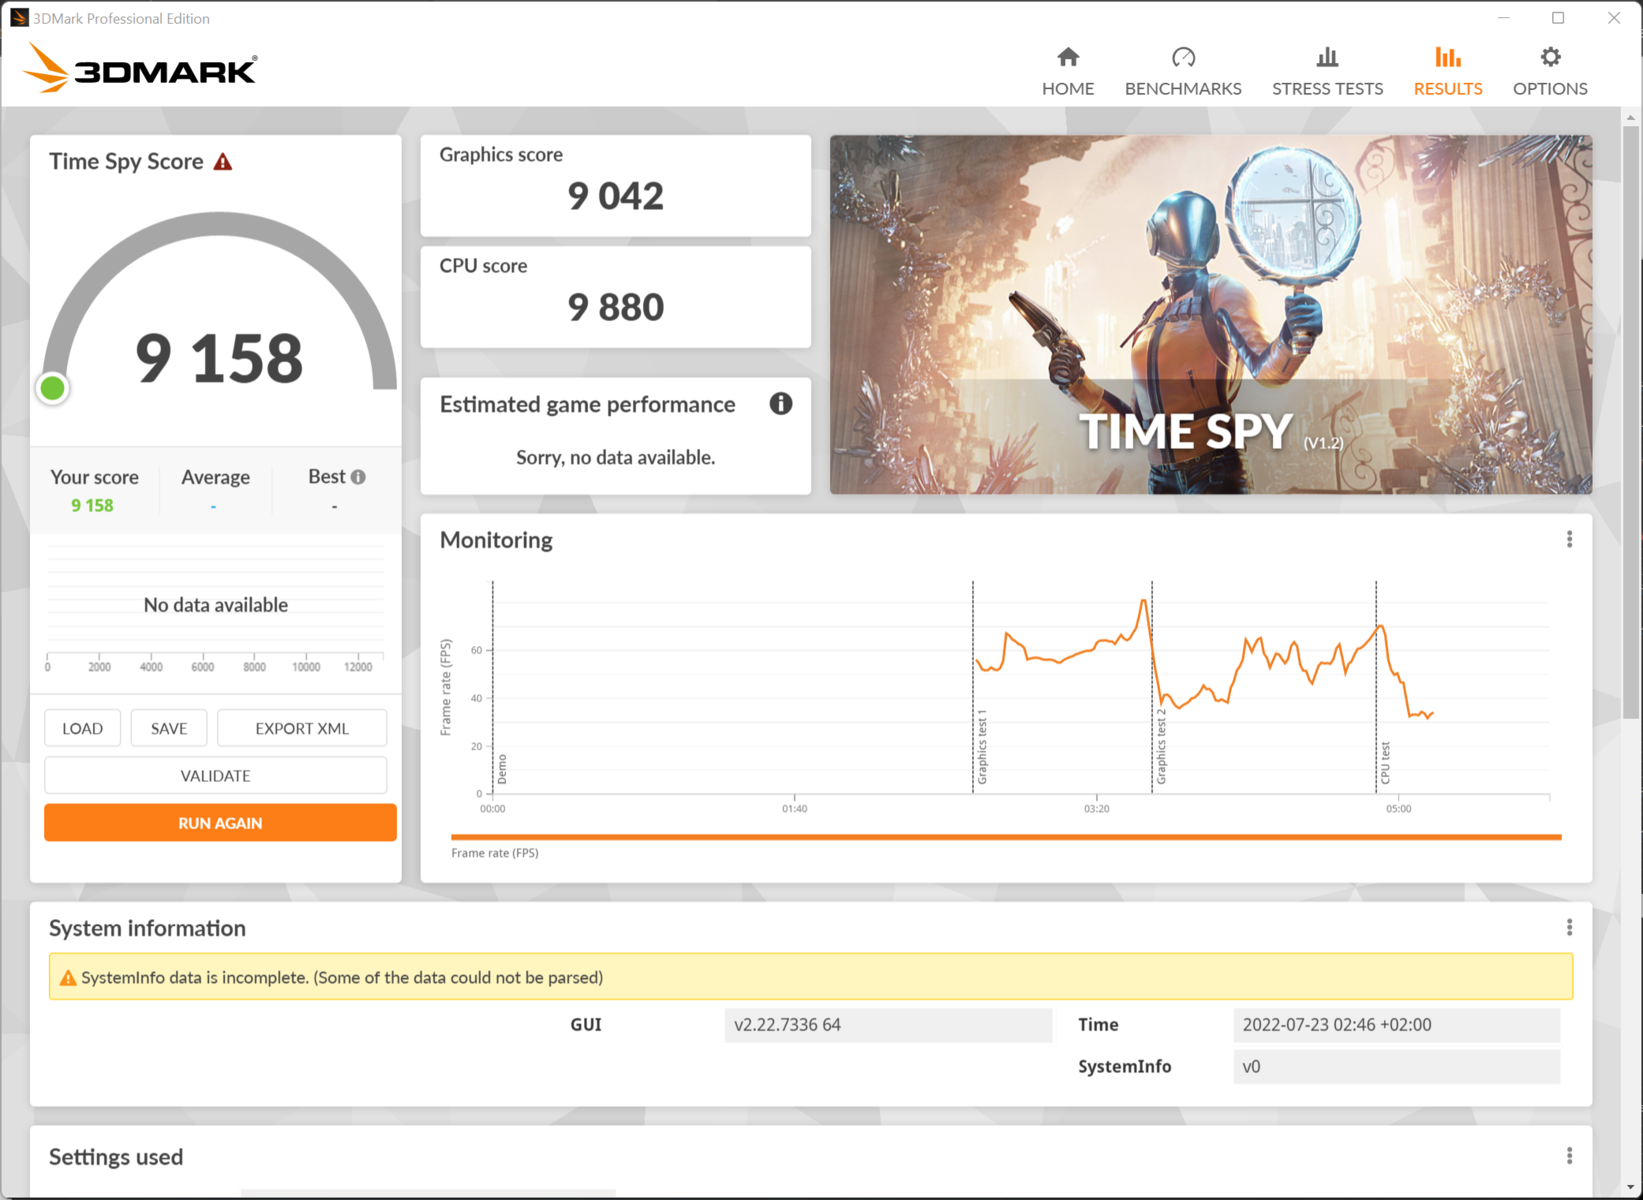


| 3DMark 11 Performance | 29638 puntos | |
| 3DMark Cloud Gate Standard Score | 51280 puntos | |
| 3DMark Fire Strike Score | 23830 puntos | |
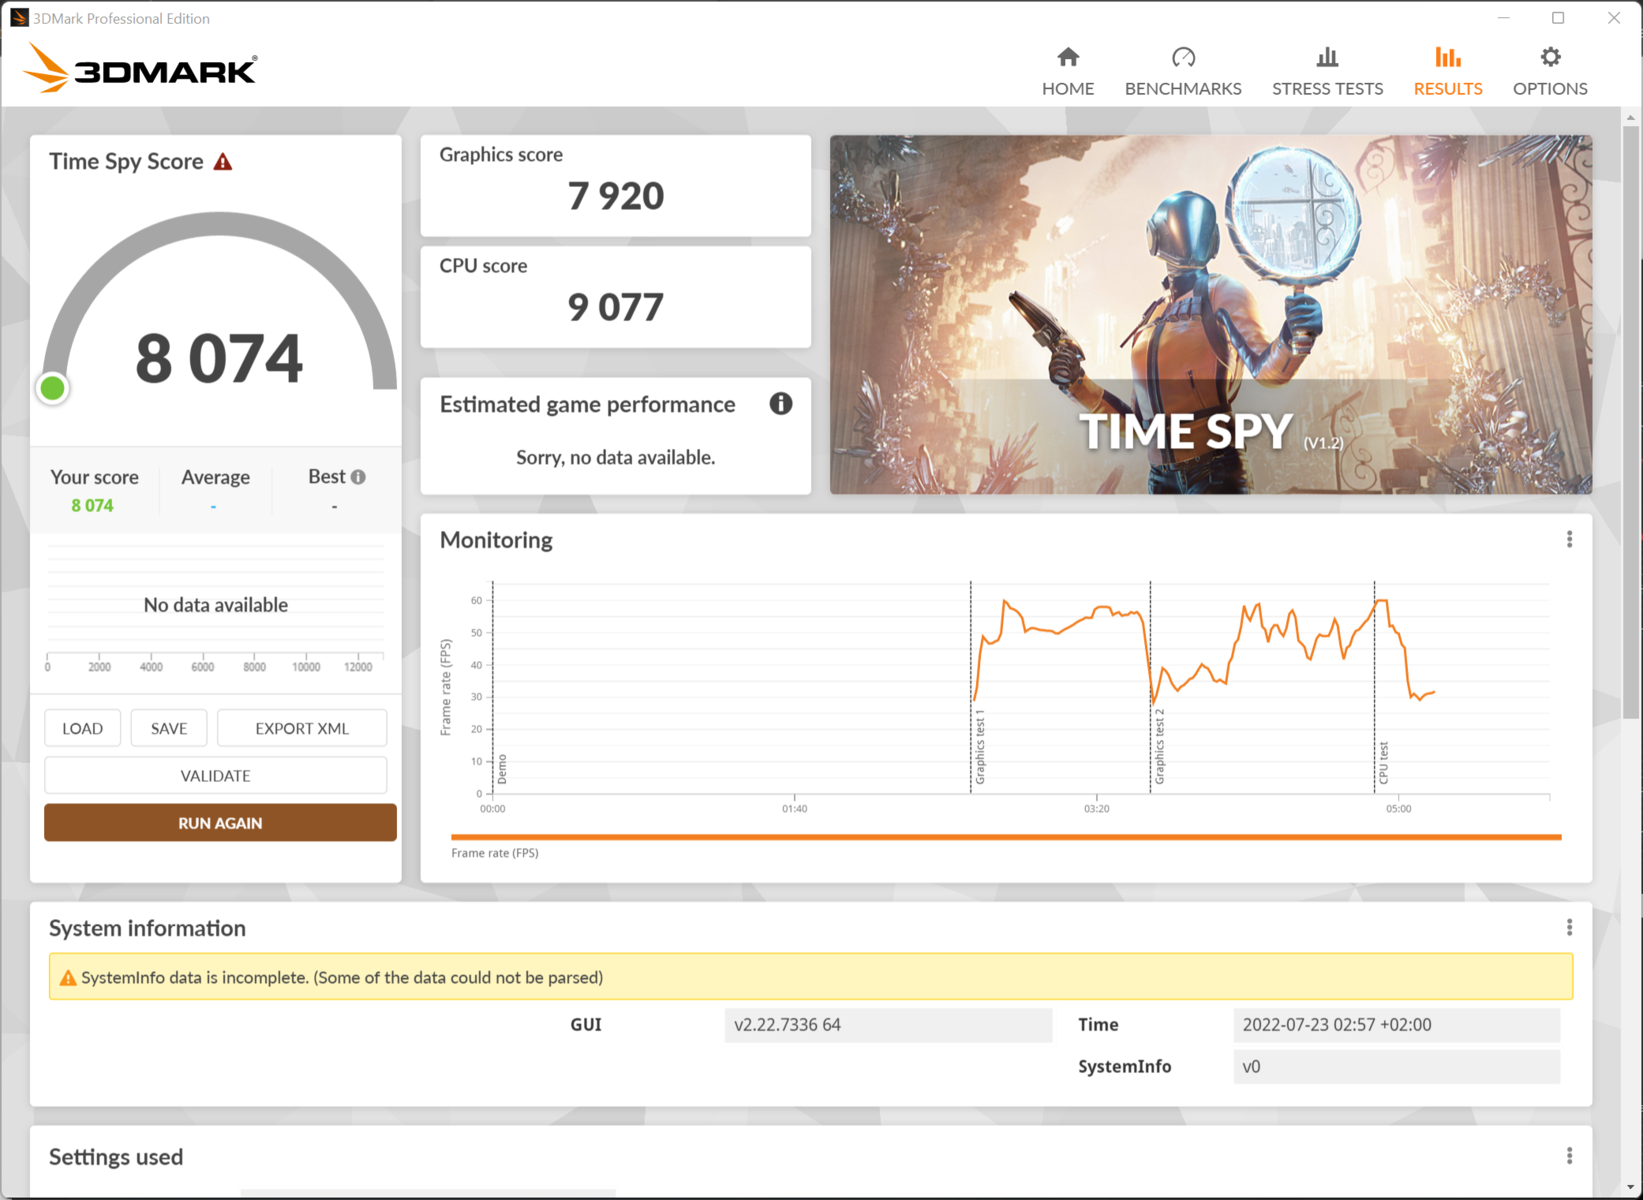
| 3DMark Time Spy Score | 10352 puntos | |
ayuda | ||
| Blender - v3.3 Classroom CUDA | |
| Asus ROG Flow X16 GV601RW-M5082W | |
| MSI Raider GE77 HX 12UHS | |
* ... más pequeño es mejor
Rendimiento de los juegos
Los dispositivos de la competencia sólo son entre un 5 y un 10 por ciento más rápidos de media en altas resoluciones con la GeForce RTX 3070 Ti (ROG Strix Scar 15, Legion 5 Pro, Acer Predator Triton 500 SE), y la diferencia con el Legion 5 Pro en The Witcher 3 incluso se reduce cuando hacemos overclocking de la GPU a través del Armoury Crate de Asus o activamos el interruptor MUX.
Un RTX 3080 Ti con 105 W de TGP, como en la MSI Steath GS77es sólo un 10% más rápida. En el más delgado Aero 16funciona incluso más lentamente que en nuestro ROG Flow X16 ya que el Aero 16 sólo puede refrigerar ~90 vatios.
Con unos 150 W de TGP (XMG Pro 17, Razer Blade 17, Medion Erazer Beast X30), la RTX 3080 Ti es entre un 15 y un 20 por ciento más rápida. Los mejores resultados en nuestra base de datos para GPUs móviles son alrededor de un 30% más altos que nuestro dispositivo de análisis, conseguidos por los pocos portátiles de juego puro que tienen de 165 a 175 W de TGP debido a un mayor espacio para sistemas de refrigeración más potentes (MSI Raider GE77 HX, Alienware x17 R2). En general, es un resultado muy bueno para un convertible compacto de 16 pulgadas que puede ejecutar fácilmente los juegos más recientes en resolución QHD. Los juegos Full HD con altos detalles siguen siendo posibles con la energía de la batería.
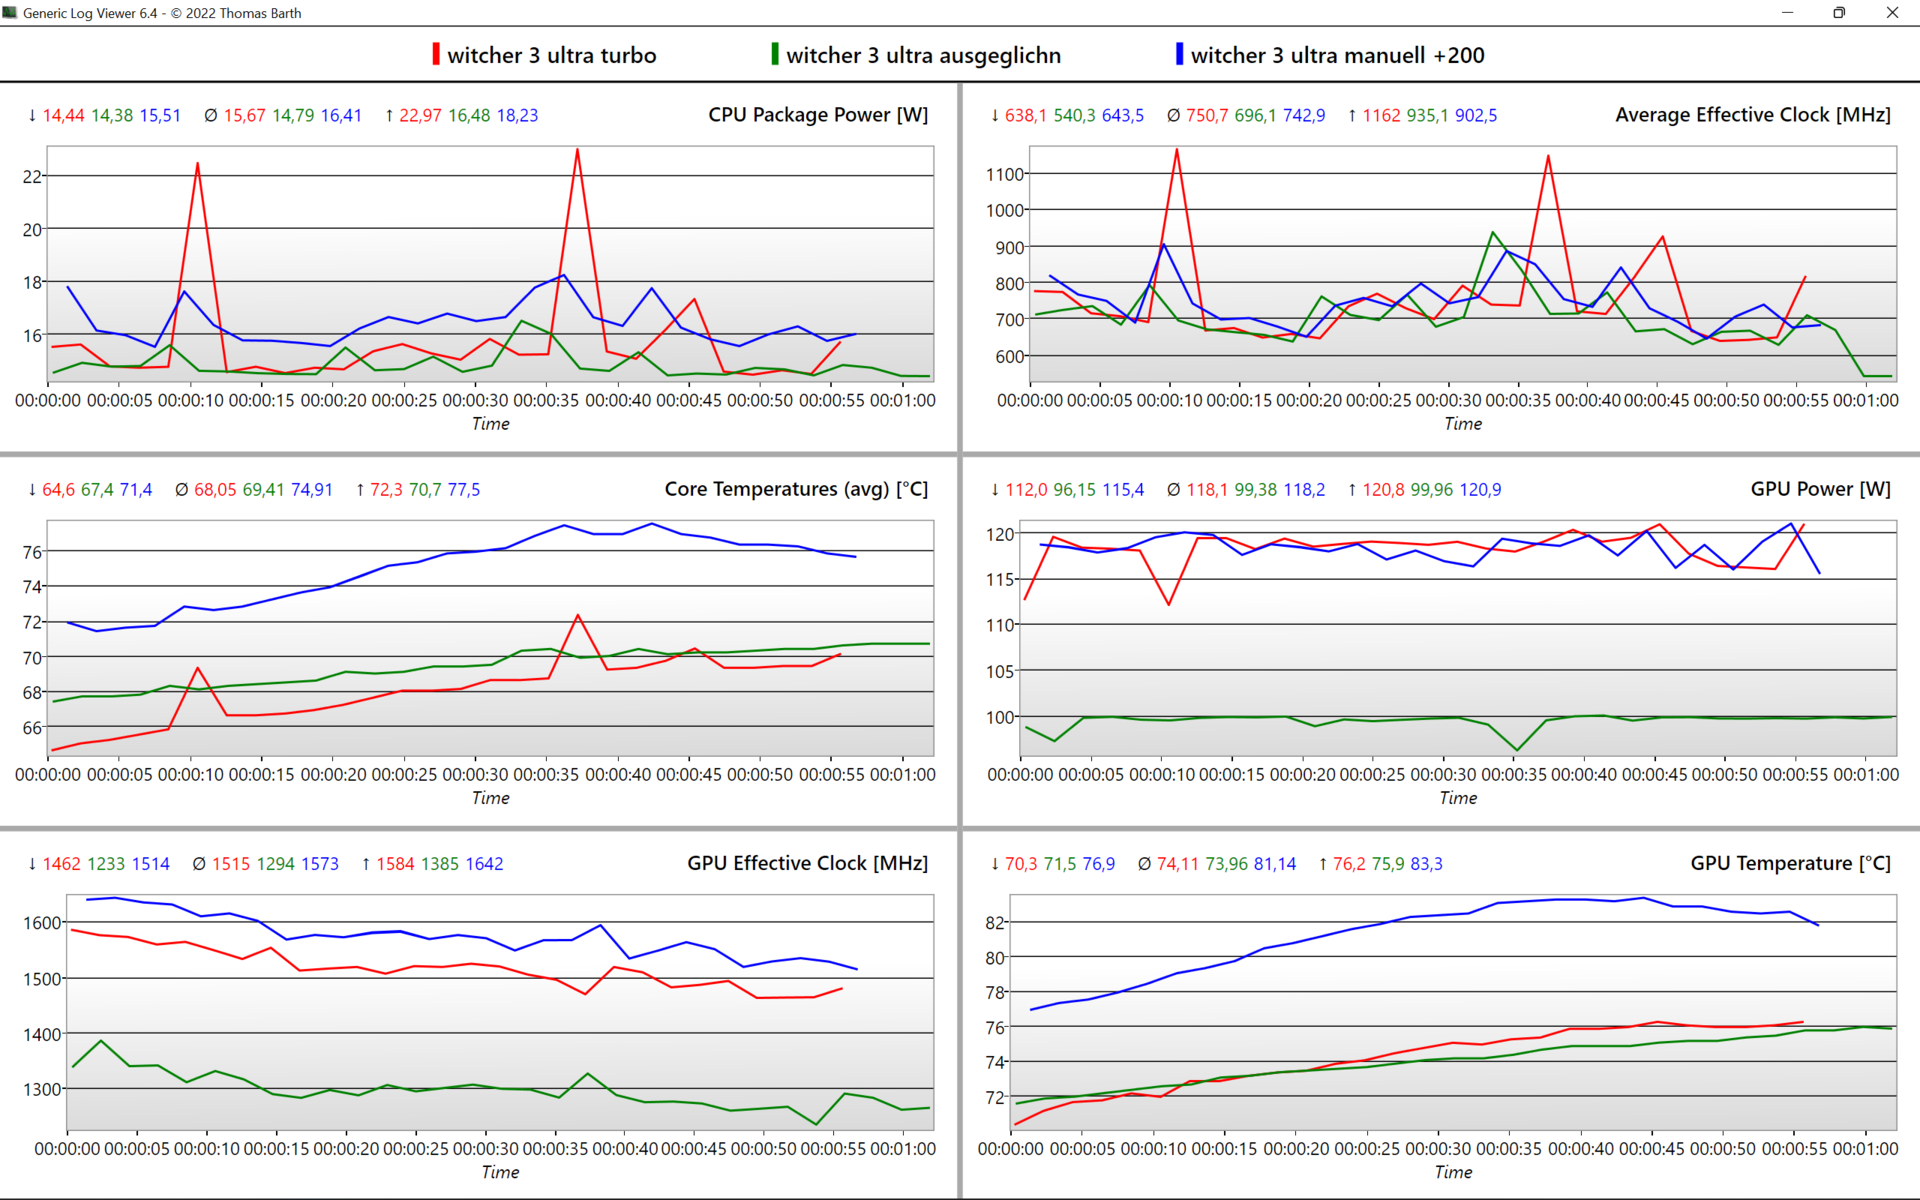
El rendimiento en juegos es entre un 6 y un 7 por ciento mayor al activar el MUX Switch, y el overclocking en "Modo Manual" consigue un aumento similar. Sin embargo, la combinación de ambos no aumenta más el rendimiento. Todos los efectos de los diferentes modos se pueden ver en la siguiente tabla. El interruptor MUX sin overclocking ofrece el mejor resultado, que además mantiene el sistema más silencioso con 45,4 db(A). En el modo silencioso , se pierde un 30% del rendimiento de la GPU a cambio de un silencio de 35,5 db(A).
| Modos de alimentación | Witcher 3 Ultra (FPS) | Reloj de la GPU (MHz) | Temperatura de la GPU (°C) | Consumo de energía de la GPU (W) | Sonoridad en db(A) |
|---|---|---|---|---|---|
| MUX +200MHz | 104,4 | 1.550 | 75 | 116 | 51,2 |
| MUX @Turbo | 104,9 | 1.500 | 71 | 116 | 45,4 |
| Manual +200MHz | 102,3 | 1.550 | 75 | 116 | 51,2 |
| Turbo | 97,8 | 1.500 | 71 | 116 | 45,4 |
| Equilibrado / Rendimiento | 89,3 | 1.270 | 72 | 100 | 42,4 |
| Silencioso | 59,9 | 1.000 | 69 | 65 | 35,5 |
| Batería @Silent | 48,4 | 600 | 64 | 55 | 32 |
| Radeon 680M iGPU | 25,6 | 2.200 | 65 | 35 | 25,8 |
| Shadow of the Tomb Raider | |
| 1920x1080 Highest Preset AA:T | |
| Medio NVIDIA GeForce RTX 3070 Ti Laptop GPU (119 - 129, n=2) | |
| Asus ROG Flow X16 GV601RW-M5082W | |
| Media de la clase Gaming (96 - 116, n=2, últimos 2 años) | |
| Apple MacBook Pro 16 2021 M1 Max | |
| Apple MacBook Pro 16 2021 M1 Pro | |
| 2560x1440 Highest Preset AA:T | |
| Asus ROG Flow X16 GV601RW-M5082W | |
| Medio NVIDIA GeForce RTX 3070 Ti Laptop GPU (n=1) | |
| Dying Light 2 | |
| 1920x1080 High Quality | |
| Medio NVIDIA GeForce RTX 3070 Ti Laptop GPU (66 - 85.5, n=7) | |
| Asus ROG Flow X16 GV601RW-M5082W | |
| MSI Stealth GS66 12UGS | |
| Gigabyte Aero 16 YE5 | |
| 1920x1080 High Quality Raytracing | |
| Asus ROG Flow X16 GV601RW-M5082W | |
| Medio NVIDIA GeForce RTX 3070 Ti Laptop GPU (28.7 - 54.9, n=6) | |
| Gigabyte Aero 16 YE5 | |
| MSI Stealth GS66 12UGS | |
| 2560x1440 High Quality | |
| Medio NVIDIA GeForce RTX 3070 Ti Laptop GPU (46.7 - 60, n=7) | |
| MSI Stealth GS66 12UGS | |
| Gigabyte Aero 16 YE5 | |
| Asus ROG Flow X16 GV601RW-M5082W | |
| Ghostwire Tokyo | |
| 1920x1080 Highest Settings | |
| Medio NVIDIA GeForce RTX 3070 Ti Laptop GPU (115.4 - 145.1, n=4) | |
| Asus ROG Flow X16 GV601RW-M5082W | |
| 2560x1440 Highest Settings | |
| Medio NVIDIA GeForce RTX 3070 Ti Laptop GPU (83.9 - 93.1, n=2) | |
| Asus ROG Flow X16 GV601RW-M5082W | |
| 1920x1080 Highest Settings + Maximum Ray Tracing | |
| Asus ROG Flow X16 GV601RW-M5082W | |
| Medio NVIDIA GeForce RTX 3070 Ti Laptop GPU (48.9 - 59.9, n=3) | |
| Tiny Tina's Wonderlands | |
| 1920x1080 High Preset (DX12) | |
| Media de la clase Gaming (72.1 - 203, n=5, últimos 2 años) | |
| Medio NVIDIA GeForce RTX 3070 Ti Laptop GPU (115 - 118.3, n=3) | |
| Asus ROG Flow X16 GV601RW-M5082W | |
| 1920x1080 Badass Preset (DX12) | |
| Media de la clase Gaming (55 - 159.4, n=5, últimos 2 años) | |
| Medio NVIDIA GeForce RTX 3070 Ti Laptop GPU (89.8 - 93.7, n=4) | |
| Asus ROG Flow X16 GV601RW-M5082W | |
| 2560x1440 Badass Preset (DX12) | |
| Media de la clase Gaming (58.9 - 111.2, n=3, últimos 2 años) | |
| Medio NVIDIA GeForce RTX 3070 Ti Laptop GPU (59.3 - 63.9, n=3) | |
| Asus ROG Flow X16 GV601RW-M5082W | |
| God of War | |
| 1920x1080 High Preset | |
| Medio NVIDIA GeForce RTX 3070 Ti Laptop GPU (76.6 - 92, n=5) | |
| Asus ROG Flow X16 GV601RW-M5082W | |
| MSI Stealth GS66 12UGS | |
| 1920x1080 Ultra Preset | |
| Medio NVIDIA GeForce RTX 3070 Ti Laptop GPU (55.1 - 64.3, n=5) | |
| Asus ROG Flow X16 GV601RW-M5082W | |
| MSI Stealth GS66 12UGS | |
| 2560x1440 Ultra Preset | |
| MSI Stealth GS66 12UGS | |
| Medio NVIDIA GeForce RTX 3070 Ti Laptop GPU (44.7 - 45.2, n=2) | |
| Asus ROG Flow X16 GV601RW-M5082W | |
| Borderlands 3 | |
| 1920x1080 High Overall Quality (DX11) | |
| Asus ROG Flow X16 GV601RW-M5082W | |
| Medio NVIDIA GeForce RTX 3070 Ti Laptop GPU (n=1) | |
| Apple MacBook Pro 16 2021 M1 Max | |
| Apple MacBook Pro 16 2021 M1 Pro | |
| 1920x1080 Badass Overall Quality (DX11) | |
| Asus ROG Flow X16 GV601RW-M5082W | |
| Medio NVIDIA GeForce RTX 3070 Ti Laptop GPU (n=1) | |
| Apple MacBook Pro 16 2021 M1 Max | |
| Apple MacBook Pro 16 2021 M1 Pro | |
| 2560x1440 Badass Overall Quality (DX11) | |
| Asus ROG Flow X16 GV601RW-M5082W | |
| Medio NVIDIA GeForce RTX 3070 Ti Laptop GPU (n=1) | |
| Assassin´s Creed Valhalla | |
| 1920x1080 High Preset | |
| Asus ROG Strix Scar 15 G533ZW-LN106WS | |
| Medio NVIDIA GeForce RTX 3070 Ti Laptop GPU (85 - 94, n=4) | |
| Asus ROG Flow X16 GV601RW-M5082W | |
| MSI Stealth GS66 12UGS | |
| 1920x1080 Ultra High Preset | |
| Asus ROG Strix Scar 15 G533ZW-LN106WS | |
| Asus ROG Flow X16 GV601RW-M5082W | |
| Medio NVIDIA GeForce RTX 3070 Ti Laptop GPU (73 - 80, n=4) | |
| MSI Stealth GS66 12UGS | |
| 2560x1440 Ultra High Preset | |
| Asus ROG Strix Scar 15 G533ZW-LN106WS | |
| Asus ROG Flow X16 GV601RW-M5082W | |
| Medio NVIDIA GeForce RTX 3070 Ti Laptop GPU (56 - 62, n=3) | |
| MSI Stealth GS66 12UGS | |
| Metro Exodus | |
| 1920x1080 Ultra Quality AF:16x | |
| Medio NVIDIA GeForce RTX 3070 Ti Laptop GPU (71 - 77.2, n=2) | |
| Asus ROG Flow X16 GV601RW-M5082W | |
| 1920x1080 Ultra Quality DXR AF:16x | |
| Medio NVIDIA GeForce RTX 3070 Ti Laptop GPU (61.3 - 65.1, n=2) | |
| Asus ROG Flow X16 GV601RW-M5082W | |
| 2560x1440 Ultra Quality AF:16x | |
| Asus ROG Flow X16 GV601RW-M5082W | |
| Medio NVIDIA GeForce RTX 3070 Ti Laptop GPU (n=1) | |
| Hunt Showdown | |
| 1920x1080 High Preset | |
| Asus ROG Flow X16 GV601RW-M5082W | |
| Medio NVIDIA GeForce RTX 3070 Ti Laptop GPU (116 - 125.9, n=2) | |
| MSI Stealth GS66 12UGS | |
| 2560x1440 High Preset | |
| Asus ROG Flow X16 GV601RW-M5082W | |
| Medio NVIDIA GeForce RTX 3070 Ti Laptop GPU (75.1 - 82.5, n=2) | |
| MSI Stealth GS66 12UGS | |
Nuestra prueba de una hora de duración en Witcher 3 muestra una velocidad de fotogramas estable y sin caídas.
Witcher 3 FPS Chart
| bajo | medio | alto | ultra | QHD | |
|---|---|---|---|---|---|
| GTA V (2015) | 179.3 | 156.3 | 94.6 | 83.7 | |
| The Witcher 3 (2015) | 264 | 189 | 97.8 | ||
| Dota 2 Reborn (2015) | 135.4 | 128.9 | 116 | 112.1 | |
| Final Fantasy XV Benchmark (2018) | 170.6 | 123.5 | 94.9 | 75.5 | |
| X-Plane 11.11 (2018) | 97.4 | 87.9 | 70.8 | ||
| Far Cry 5 (2018) | 113 | 109 | 88 | ||
| Strange Brigade (2018) | 304 | 214 | 184 | 167.2 | |
| Shadow of the Tomb Raider (2018) | 124 | 119 | 83 | ||
| Metro Exodus (2019) | 149.2 | 114.3 | 88.3 | 71 | 52.7 |
| Borderlands 3 (2019) | 104.2 | 92.4 | 80.9 | 58.7 | |
| Hunt Showdown (2020) | 125.9 | 82.5 | |||
| Assassin´s Creed Valhalla (2020) | 88 | 79 | 61 | ||
| God of War (2022) | 83.6 | 59.8 | 44.7 | ||
| Dying Light 2 (2022) | 119.6 | 80.7 | 71.1 | 48.7 | |
| Cyberpunk 2077 1.6 (2022) | 108.8 | 89.2 | 75.6 | 43.1 | |
| Ghostwire Tokyo (2022) | 131 | 130.2 | 83.9 | ||
| Tiny Tina's Wonderlands (2022) | 115.2 | 90.7 | 59.3 |
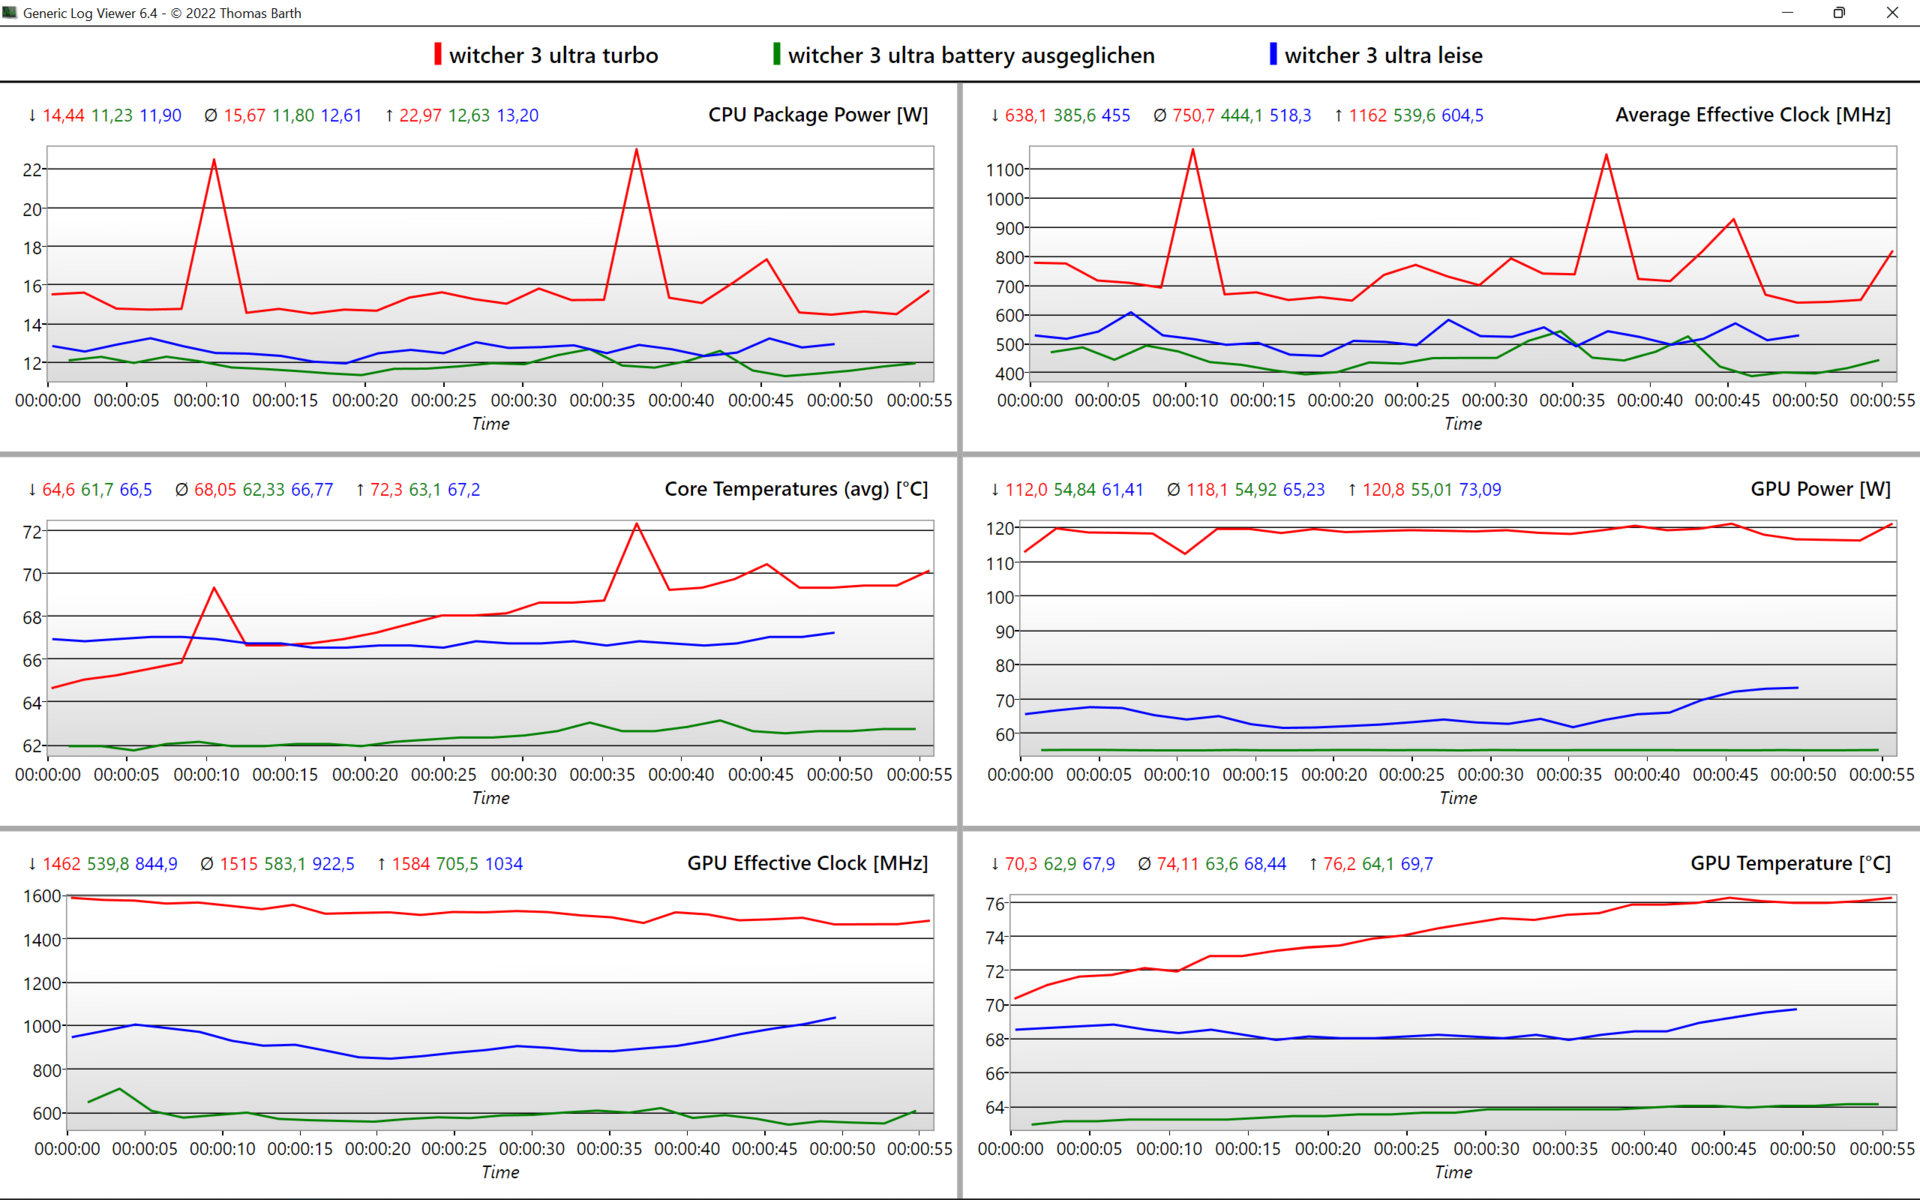
Emisiones - Jugador silencioso gracias a la solución de triple ventilador de Asus
Ruido del sistema
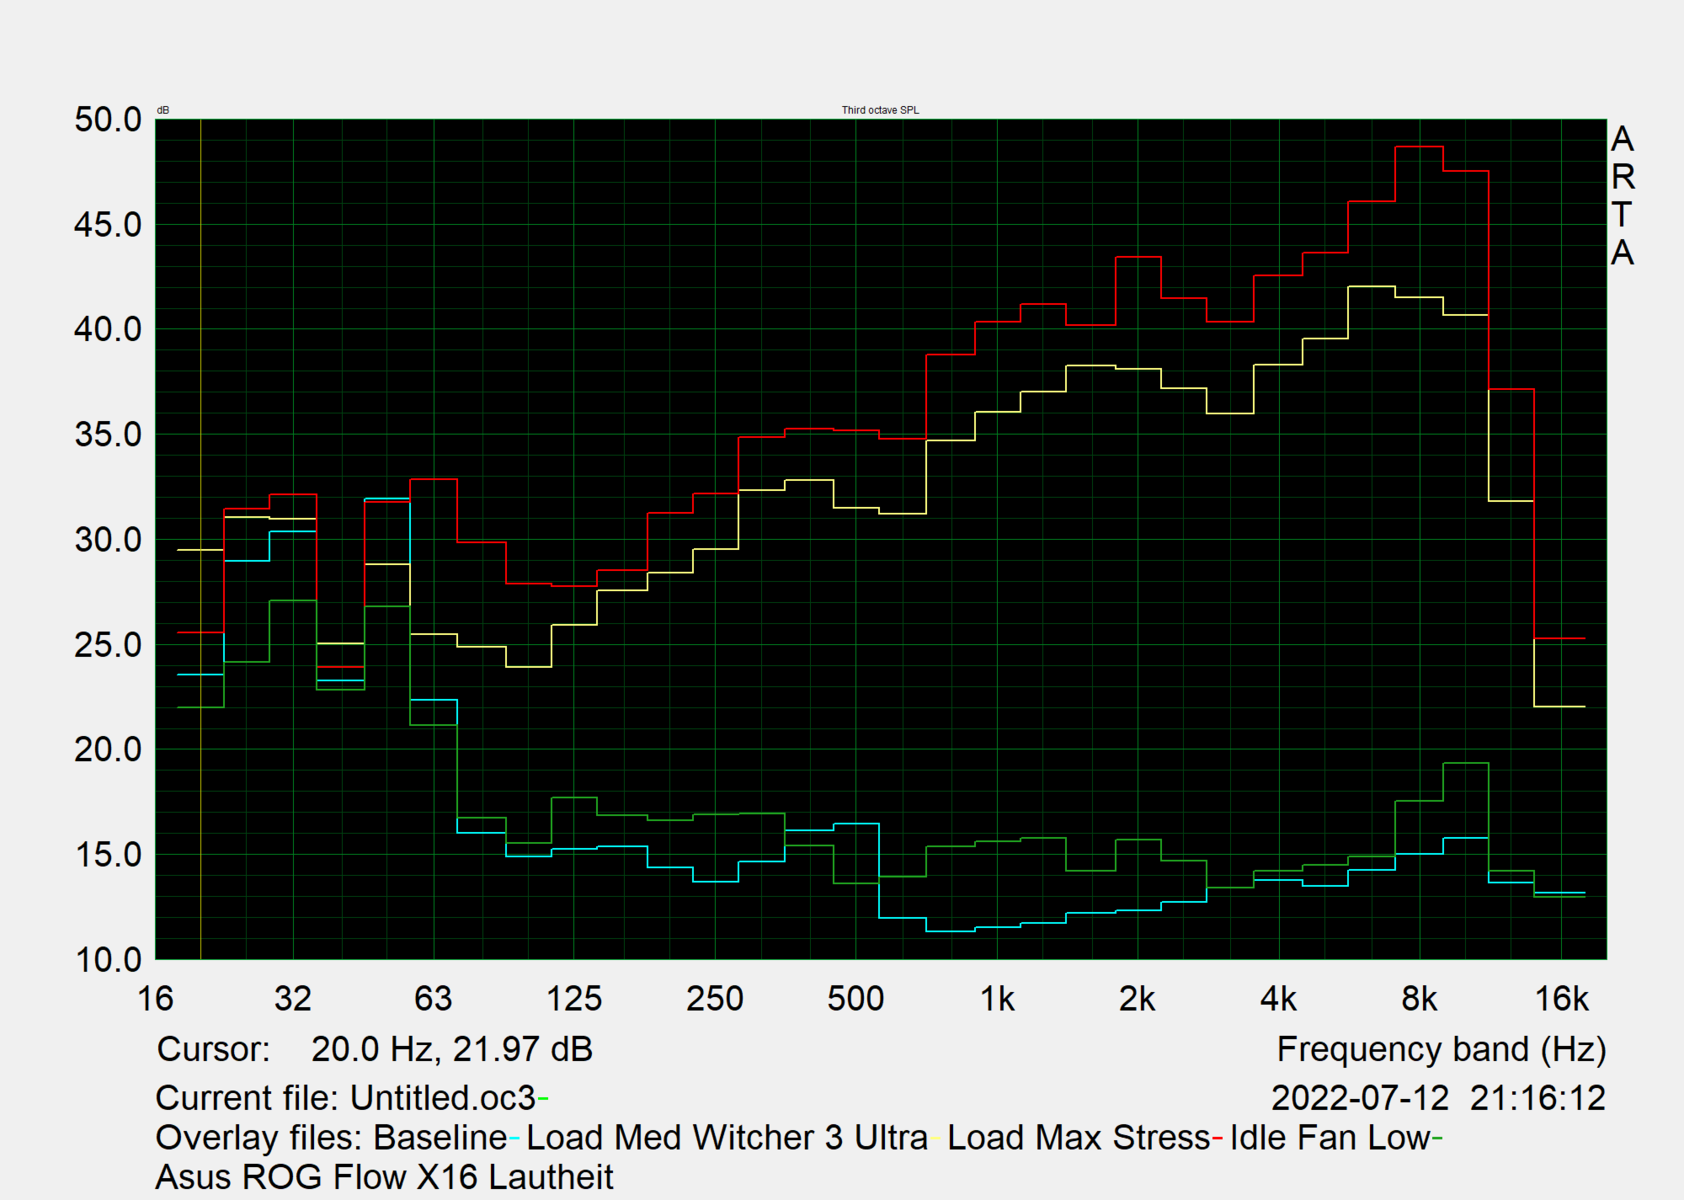
En reposo, nos encontramos con un portátil silencioso. Los ventiladores permanecen quietos. Sólo bajo carga multinúcleo saltan de vez en cuando, pero incluso entonces se contienen, como cuando se navega con múltiples pestañas.
Bajo carga permanente en modo Rendimiento , el ruido de los ventiladores, dependiendo del escenario, ronda los 36 db(A) (@Blender CPU benchmark) o 42,4 db(A) en juegos. En modo Turbo , el portátil emite 45 db(A) de media en ambos escenarios, pero puede aumentar hasta algo menos de 50db(A) bajo carga combinada alta. Esto incluso llega a 55 db(A) en el test de estrés (Prime95 + FurMark). Al menos los ventiladores no emiten ningún ruido a altas frecuencias. Tampoco se detectó ningún gemido de la bobina.
Los valores comparativamente buenos se deben a una combinación de varios factores: cinco heatpipes, tres ventiladores, pasta térmica de metal líquido, una salida de ventilador de borde a borde en la parte trasera del dispositivo y elementos de espuma en el interior que concentran y dirigen el flujo de aire. Este sistema consigue refrigerar 140 vatios (15-40 W para la CPU y 100-125 W para la GPU), lo que está muy bien para un convertible compacto de 16 pulgadas.
Los portátiles para juegos puros de nuestra comparativa tampoco tienen ventiladores que permanezcan quietos en reposo y generan volúmenes similares bajo carga. El representante más silencioso con diferencia es el MacBook Pro 16gracias a su eficiente procesador ARM Apple M1.
Ruido
| Ocioso |
| 25.5 / 25.5 / 27.4 dB(A) |
| Carga |
| 49.9 / 55 dB(A) |
 | ||
30 dB silencioso 40 dB(A) audible 50 dB(A) ruidosamente alto |
||
min: | ||
| Asus ROG Flow X16 GV601RW-M5082W GeForce RTX 3070 Ti Laptop GPU, R9 6900HS, Micron 3400 1TB MTFDKBA1T0TFH | Asus ROG Zephyrus M16 GU603H GeForce RTX 3070 Laptop GPU, i9-11900H, Samsung PM9A1 MZVL22T0HBLB | Asus ROG Strix Scar 15 G533ZW-LN106WS GeForce RTX 3070 Ti Laptop GPU, i9-12900H, Samsung PM9A1 MZVL22T0HBLB | Gigabyte Aero 16 YE5 GeForce RTX 3080 Ti Laptop GPU, i9-12900HK, Phison ESR01TBMFCT | Lenovo Legion 5 Pro 16 G7 i7 RTX 3070Ti GeForce RTX 3070 Ti Laptop GPU, i7-12700H, Samsung PM9A1 MZVL21T0HCLR | MSI Stealth GS66 12UGS GeForce RTX 3070 Ti Laptop GPU, i7-12700H, WDC PC SN810 1TB | Apple MacBook Pro 16 2021 M1 Pro M1 Pro 16-Core GPU, M1 Pro, Apple SSD AP1024R | Lenovo ThinkPad X1 Extreme G4-20Y50040GE GeForce RTX 3080 Laptop GPU, i9-11950H, Kioxia XG7 KXG7AZNV1T02 | Dell XPS 17 9720 RTX 3060 GeForce RTX 3060 Laptop GPU, i7-12700H, Samsung PM9A1 MZVL21T0HCLR | |
|---|---|---|---|---|---|---|---|---|---|
| Noise | -12% | -27% | -8% | -3% | -9% | 17% | 4% | 9% | |
| apagado / medio ambiente * (dB) | 25.5 | 25 2% | 26.86 -5% | 25 2% | 24.6 4% | 24 6% | 24.7 3% | 24.7 3% | 23.8 7% |
| Idle Minimum * (dB) | 25.5 | 25 2% | 39.07 -53% | 30 -18% | 28.4 -11% | 31 -22% | 24.7 3% | 24.7 3% | 24.1 5% |
| Idle Average * (dB) | 25.5 | 31 -22% | 39.07 -53% | 32 -25% | 28.4 -11% | 32 -25% | 24.7 3% | 24.7 3% | 24.1 5% |
| Idle Maximum * (dB) | 27.4 | 42 -53% | 39.07 -43% | 33 -20% | 28.4 -4% | 35 -28% | 24.7 10% | 28.1 -3% | 24.1 12% |
| Load Average * (dB) | 49.9 | 48 4% | 53.34 -7% | 45 10% | 49.4 1% | 48 4% | 26.1 48% | 42.5 15% | 43.2 13% |
| Load Maximum * (dB) | 55 | 56 -2% | 56.6 -3% | 52 5% | 54.7 1% | 48 13% | 37.4 32% | 52.1 5% | 48 13% |
| Witcher 3 ultra * (dB) | 52 | 56.6 | 50 | 49.4 | 43 | 46.4 | 48 |
* ... más pequeño es mejor
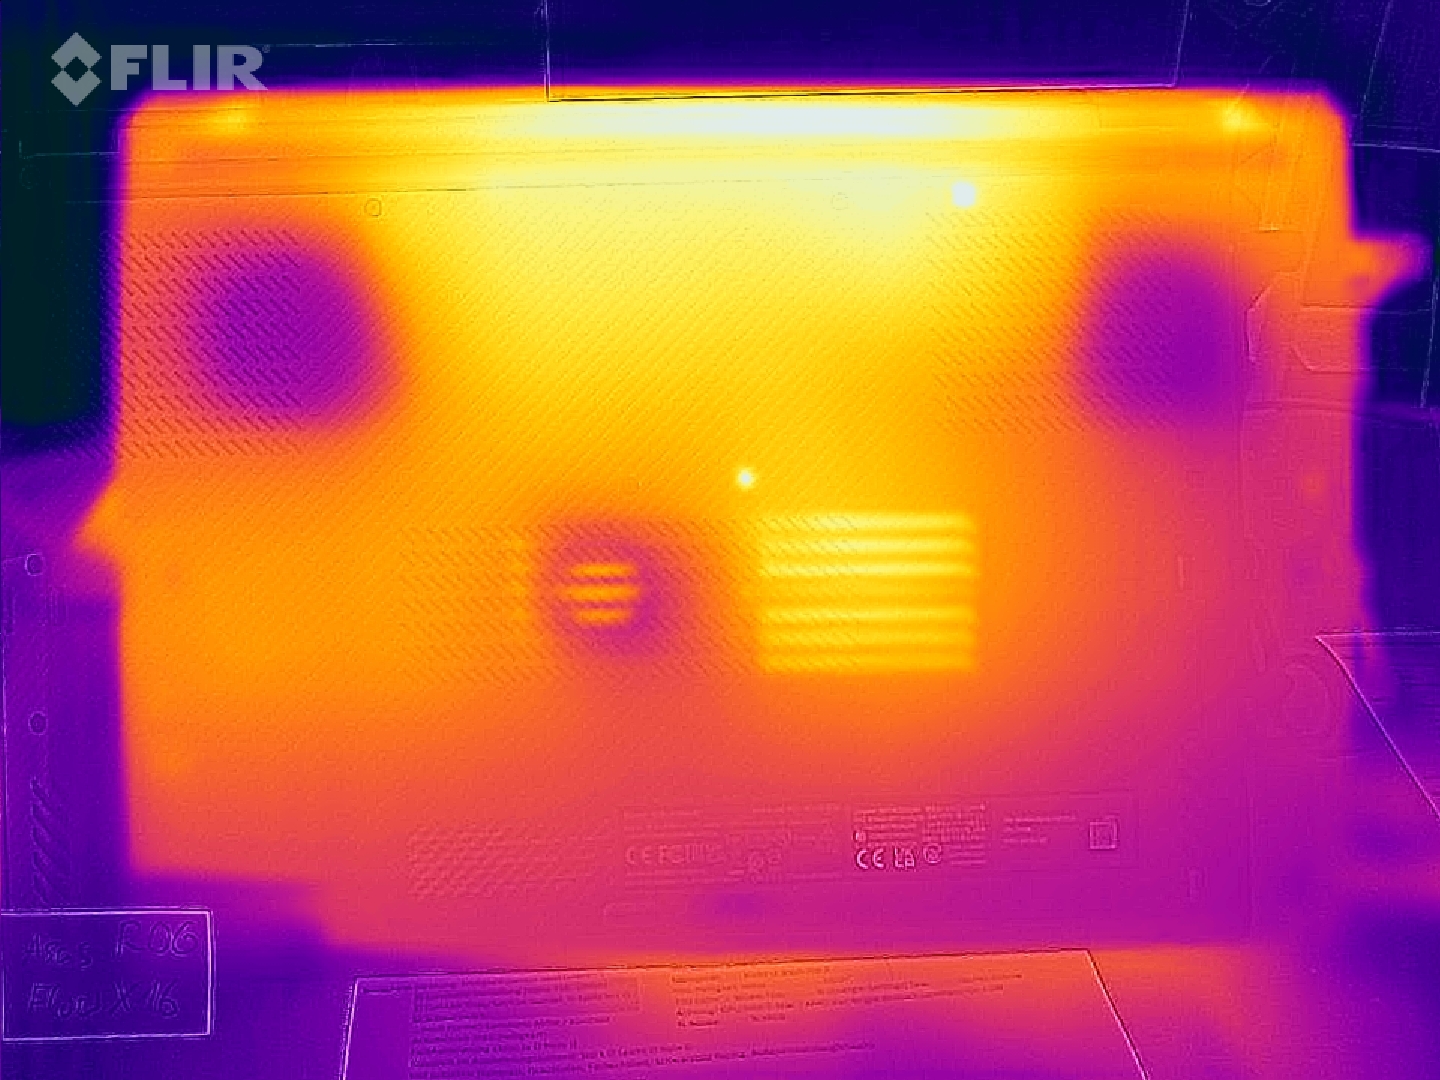
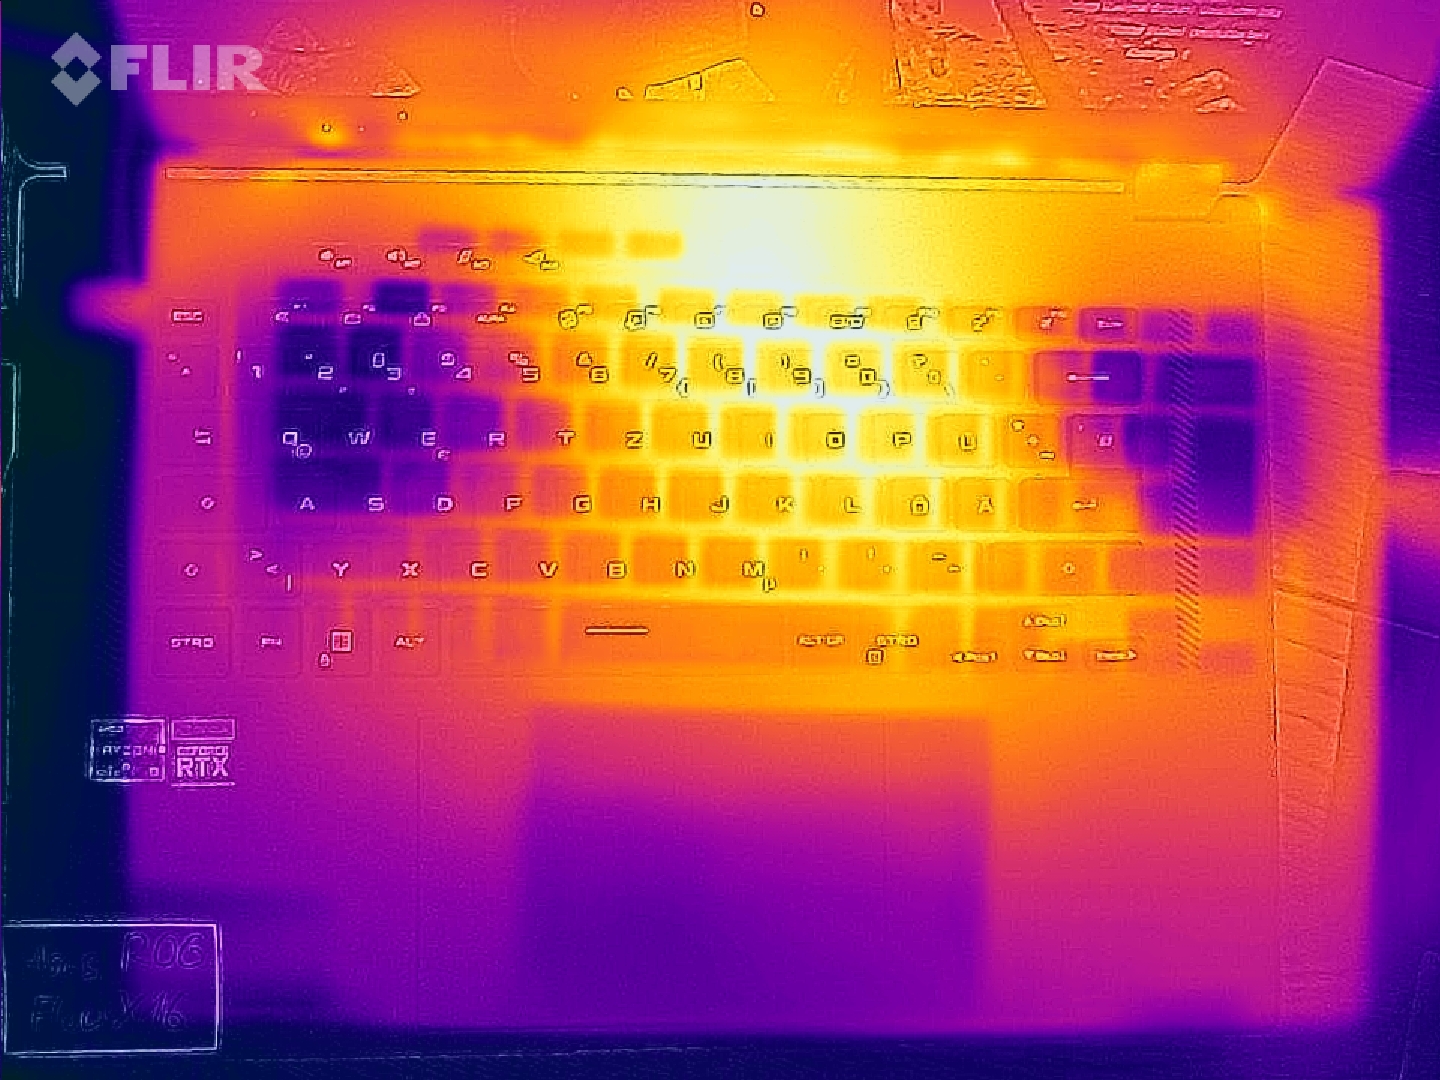
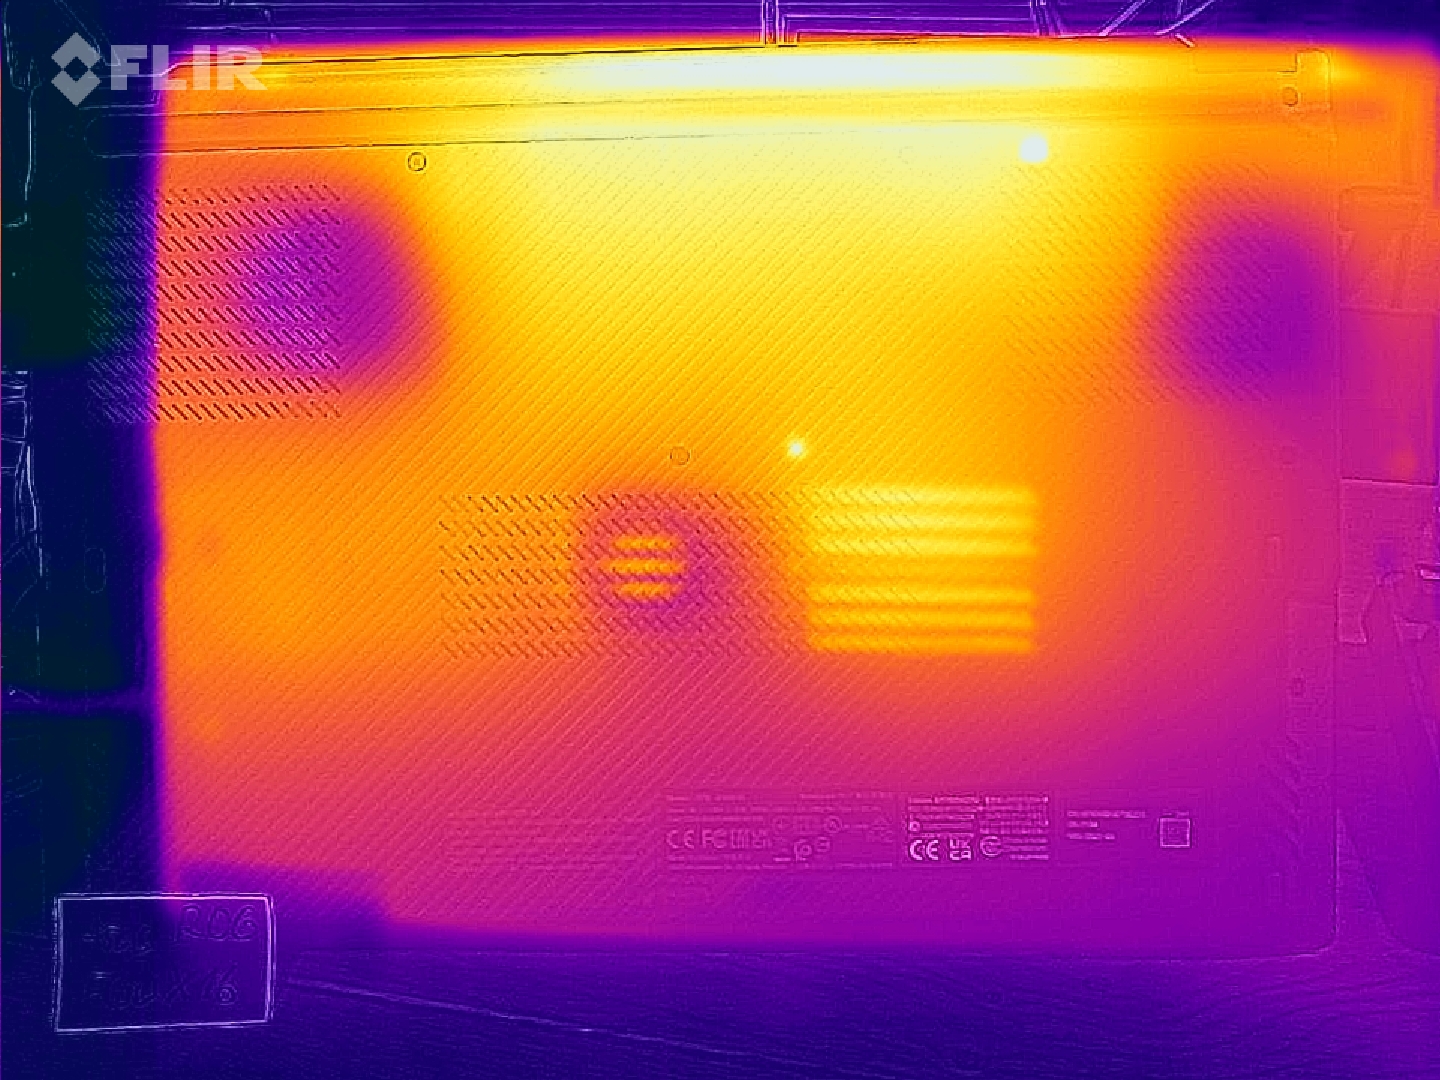
Temperatura
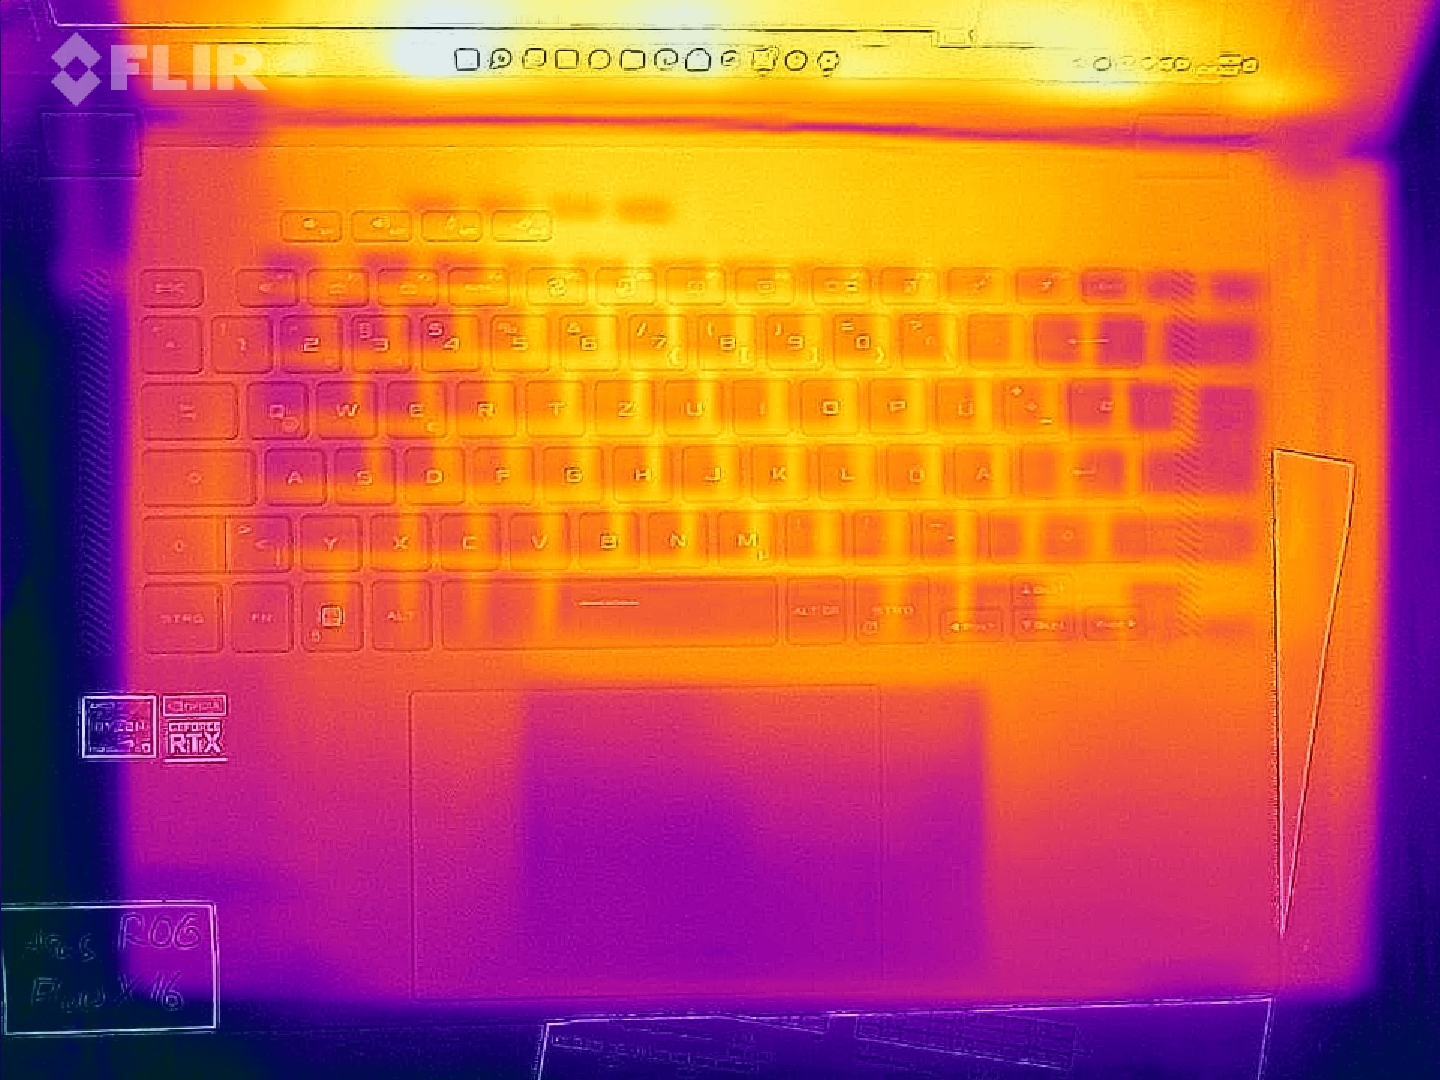
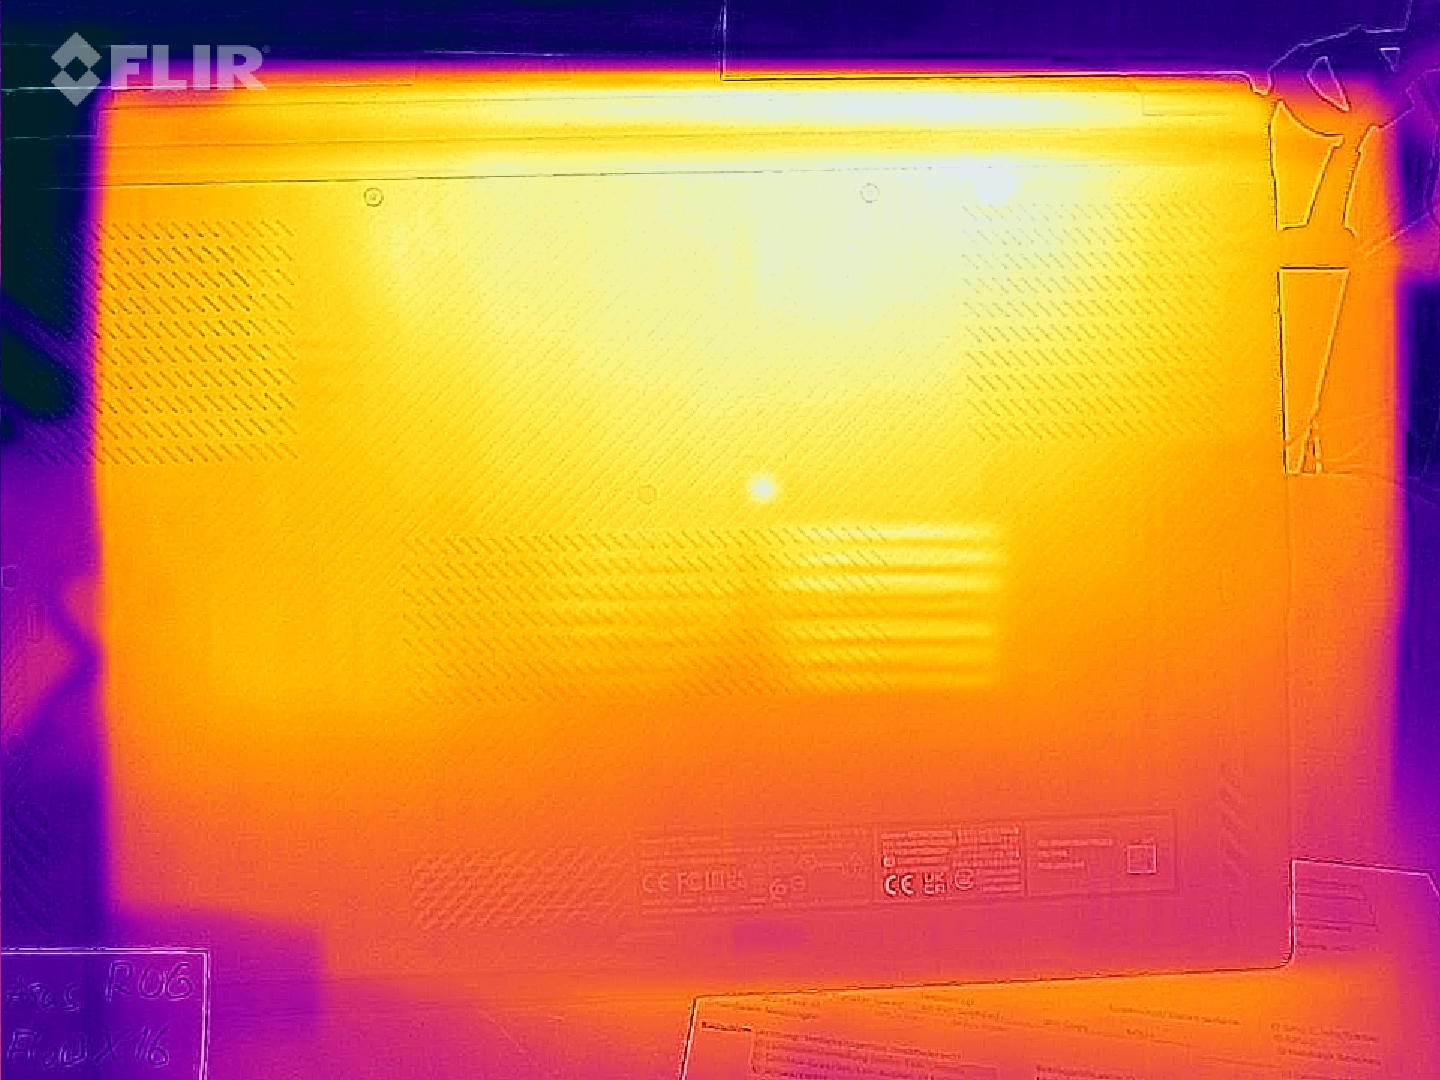
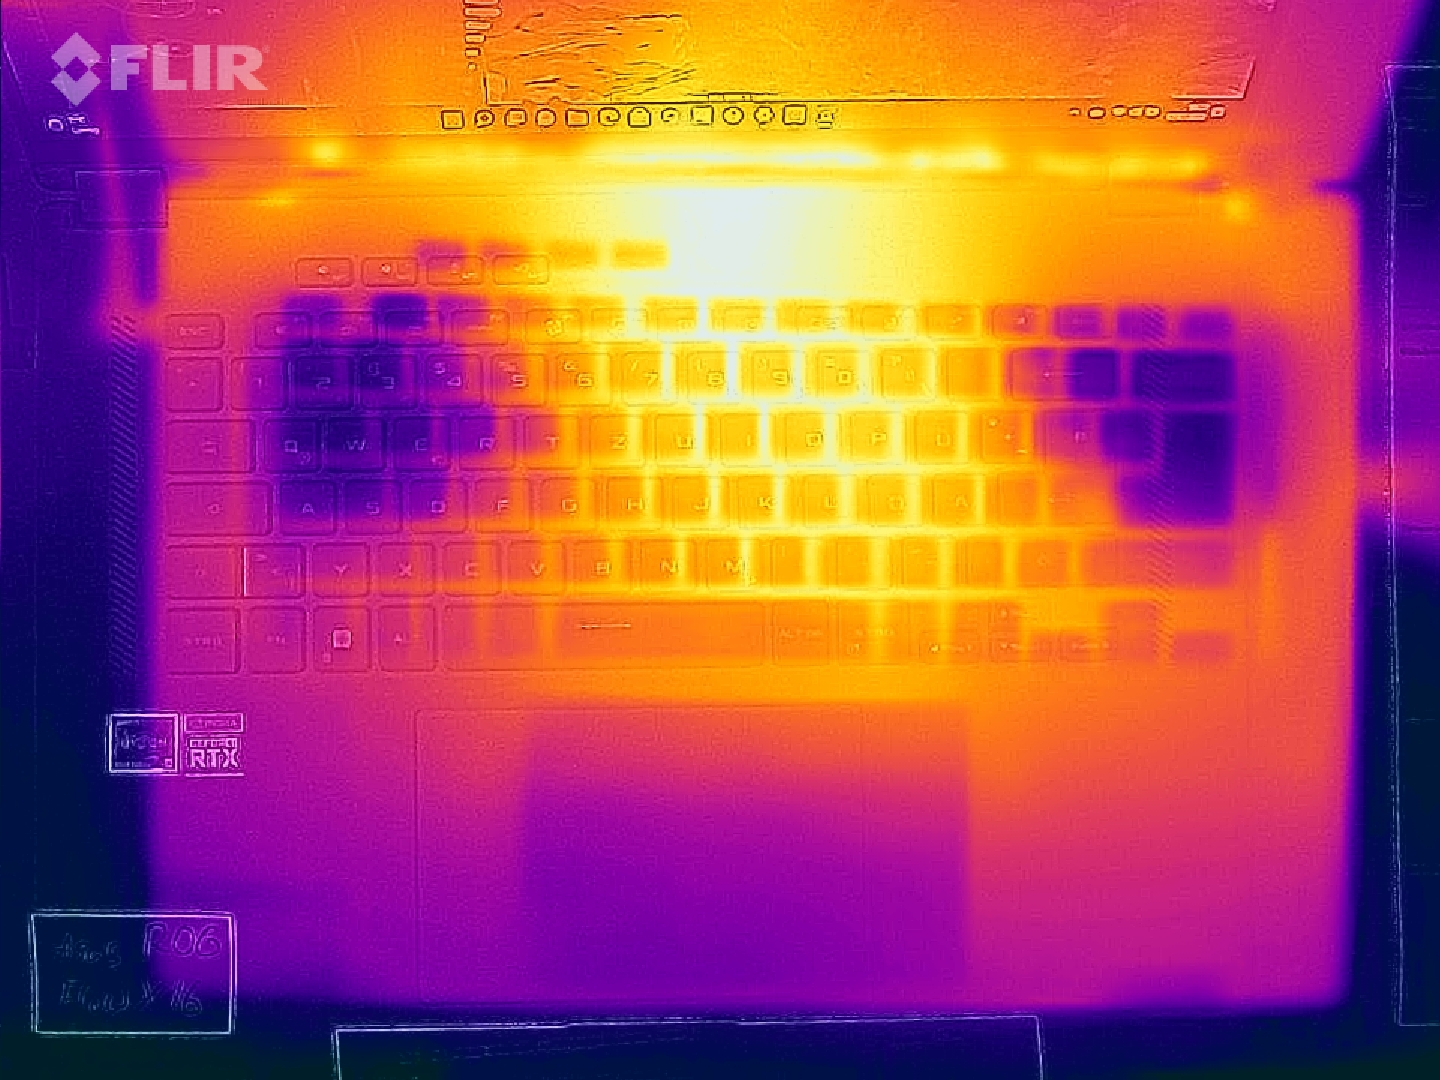
Las temperaturas de la superficie pueden calentarse bastante en el centro por encima del teclado. Medimos 55 °C a máxima carga y 52.8 °C durante el juego. Estos puntos calientes se mantienen notablemente más frescos cuando el convertible se apoya en la parte trasera para que los ventiladores de la parte inferior tengan un mejor suministro de aire. Otros portátiles delgados con hardware potente se calientan de forma similar bajo carga (Stealth GS66, Aero 16 y ThinkPad X1 Extreme).
La pantalla también puede calentarse durante largos periodos de visualización de contenido HDR a máximo brillo (debido al alto consumo de energía), pero no a un grado que sea molesto.
(-) La temperatura máxima en la parte superior es de 55.1 °C / 131 F, frente a la media de 40.4 °C / 105 F, que oscila entre 21.2 y 68.8 °C para la clase Gaming.
(-) El fondo se calienta hasta un máximo de 50.3 °C / 123 F, frente a la media de 43.2 °C / 110 F
(±) En reposo, la temperatura media de la parte superior es de 32.8 °C / 91# F, frente a la media del dispositivo de 33.9 °C / 93 F.
(-) Jugando a The Witcher 3, la temperatura media de la parte superior es de 40.5 °C / 105 F, frente a la media del dispositivo de 33.9 °C / 93 F.
(-) El reposamanos y el touchpad pueden calentarse mucho al tacto con un máximo de 40.8 °C / 105.4 F.
(-) La temperatura media de la zona del reposamanos de dispositivos similares fue de 28.8 °C / 83.8 F (-12 °C / -21.6 F).
| Asus ROG Flow X16 GV601RW-M5082W AMD Ryzen 9 6900HS, NVIDIA GeForce RTX 3070 Ti Laptop GPU | Asus ROG Strix Scar 15 G533ZW-LN106WS Intel Core i9-12900H, NVIDIA GeForce RTX 3070 Ti Laptop GPU | Gigabyte Aero 16 YE5 Intel Core i9-12900HK, NVIDIA GeForce RTX 3080 Ti Laptop GPU | Lenovo Legion 5 Pro 16 G7 i7 RTX 3070Ti Intel Core i7-12700H, NVIDIA GeForce RTX 3070 Ti Laptop GPU | MSI Stealth GS66 12UGS Intel Core i7-12700H, NVIDIA GeForce RTX 3070 Ti Laptop GPU | Apple MacBook Pro 16 2021 M1 Pro Apple M1 Pro, Apple M1 Pro 16-Core GPU | Lenovo ThinkPad X1 Extreme G4-20Y50040GE Intel Core i9-11950H, NVIDIA GeForce RTX 3080 Laptop GPU | Dell XPS 17 9720 RTX 3060 Intel Core i7-12700H, NVIDIA GeForce RTX 3060 Laptop GPU | Microsoft Surface Laptop Studio i7 RTX 3050 Ti Intel Core i7-11370H, NVIDIA GeForce RTX 3050 Ti Laptop GPU | |
|---|---|---|---|---|---|---|---|---|---|
| Heat | 3% | 5% | 7% | 9% | 29% | 10% | 7% | 29% | |
| Maximum Upper Side * (°C) | 55.1 | 42.6 23% | 49 11% | 45.3 18% | 54 2% | 41 26% | 51.4 7% | 51.8 6% | 42.3 23% |
| Maximum Bottom * (°C) | 50.3 | 50.2 -0% | 55 -9% | 61.2 -22% | 59 -17% | 39 22% | 55.9 -11% | 44.2 12% | 38.2 24% |
| Idle Upper Side * (°C) | 35.5 | 36.2 -2% | 33 7% | 28.6 19% | 26 27% | 24 32% | 27.2 23% | 34.8 2% | 23.4 34% |
| Idle Bottom * (°C) | 36.1 | 40.2 -11% | 33 9% | 31.4 13% | 27 25% | 24 34% | 28.8 20% | 33.2 8% | 23.5 35% |
* ... más pequeño es mejor
Prueba de esfuerzo
Bajo el estrés de la CPU, elRyzen 9 6900HSsigue funcionando a 3,9 GHz y la temperatura se mantiene en torno a los 90 °C. Bajo estrés combinado (Prime95 + FurMark), el reloj se mantiene a 3 GHz, 300 MHz por debajo del reloj base. La GPU alterna entre 800 MHz y 1,4 GHz, mientras que la RTX 3070 Ti funciona a 1,5 GHz en la prueba de estrés de Witcher 3. Su temperatura está muy por debajo de los 90 °C en todos los escenarios.
| Reloj dela CPU (GHz) | Reloj de la GPU (MHz) | Temperatura de la CPU (°C) | Temperatura de la GPU (°C) | Consumo de energía de la CPU (W) | Consumo de energía de la GPU (W) | Consumo de energía combinado (W) | |
| Sistema en reposo | 0,07 | 0,2 | 43 | 39 | 7,5 | 13 | 20,5 |
| Prime95 Stress | 3,9 | - | 87 | -- | 75 | - | 75 |
| Prime95+ FurMark Stress | 3 | 800 - 1.400 | 87 | 81 | 40 | 100 | 140 |
| FurMark Stress | 0,2 | 1.150 | 75 | 83 | 20 | 120 | 140 |
| Witcher 3 Stress | 0,75 | 1.500 | 70 | 74 | 15 | 125 | 140 |
Altavoces
Asus utiliza básicamente el mismo sistema de sonido que en elZephyrus M16 y el ROG Strix G15lo que significa que hay cuatro woofers, pero faltan los dos tweeters adicionales. Los altavoces producen una presión sonora máxima de 80.7 db(A), que es decente para un portátil, pero no suficiente para jugar con ventiladores fuertes.
Los graves sólo faltan un poco, los medios están muy equilibrados y los agudos se sobrepasan un poco. Subjetivamente, no hay muchos portátiles que den mejor calidad de sonido; según nuestra base de datos, sólo el 6% de todos los dispositivos revisados lo hacen mejor.
Asus ROG Flow X16 GV601RW-M5082W análisis de audio
(±) | la sonoridad del altavoz es media pero buena (80.7 dB)
Graves 100 - 315 Hz
(±) | lubina reducida - en promedio 12.7% inferior a la mediana
(±) | la linealidad de los graves es media (13.8% delta a frecuencia anterior)
Medios 400 - 2000 Hz
(+) | medios equilibrados - a sólo 1.3% de la mediana
(+) | los medios son lineales (4.7% delta a la frecuencia anterior)
Altos 2 - 16 kHz
(±) | máximos más altos - de media 6.4% más altos que la mediana
(+) | los máximos son lineales (6.8% delta a la frecuencia anterior)
Total 100 - 16.000 Hz
(+) | el sonido global es lineal (12.9% de diferencia con la mediana)
En comparación con la misma clase
» 17% de todos los dispositivos probados de esta clase eran mejores, 4% similares, 79% peores
» El mejor tuvo un delta de 6%, la media fue 18%, el peor fue ###max##%
En comparación con todos los dispositivos probados
» 12% de todos los dispositivos probados eran mejores, 3% similares, 85% peores
» El mejor tuvo un delta de 4%, la media fue 24%, el peor fue ###max##%
Apple MacBook Pro 16 2021 M1 Pro análisis de audio
(+) | los altavoces pueden reproducir a un volumen relativamente alto (#84.7 dB)
Graves 100 - 315 Hz
(+) | buen bajo - sólo 3.8% lejos de la mediana
(+) | el bajo es lineal (5.2% delta a la frecuencia anterior)
Medios 400 - 2000 Hz
(+) | medios equilibrados - a sólo 1.3% de la mediana
(+) | los medios son lineales (2.1% delta a la frecuencia anterior)
Altos 2 - 16 kHz
(+) | máximos equilibrados - a sólo 1.9% de la mediana
(+) | los máximos son lineales (2.7% delta a la frecuencia anterior)
Total 100 - 16.000 Hz
(+) | el sonido global es lineal (4.6% de diferencia con la mediana)
En comparación con la misma clase
» 0% de todos los dispositivos probados de esta clase eran mejores, 0% similares, 100% peores
» El mejor tuvo un delta de 5%, la media fue 17%, el peor fue ###max##%
En comparación con todos los dispositivos probados
» 0% de todos los dispositivos probados eran mejores, 0% similares, 100% peores
» El mejor tuvo un delta de 4%, la media fue 24%, el peor fue ###max##%
Gestión de la energía - Valores de inactividad inusualmente elevados
Consumo de energía
En reposo, se necesitan 12,2 vatios en el modo Silencioso + Ahorro de energía de la GPU. En el modo Silencioso + GPU Equilibrado , el sistema necesita 25,5 vatios y algo menos de 30 vatios en el modo Turbo . Son valores inusualmente elevados, incluso para un portátil de juegos, lo que puede deberse en parte a la pantalla mini-LED.
El Scar 15, Legion 5 Pro y MSI Stealth GS66 requieren bastante menos energía en reposo. Los portátiles OLED, por otro lado, comparten los altos valores en reposo del ROG Flow X16.
Dado que la CPU y la GPU juntas requieren unos 140 vatios en
Witcher 3
, esto deja 43 vatios restantes para el resto del sistema. El test de estrés máximo exige inicialmente 253 vatios del adaptador de corriente de 240 vatios. Sin embargo, el valor cae bruscamente después de unos pocos segundos y se establece en unos aceptables 217 vatios después de un minuto.| Off / Standby | |
| Ocioso | |
| Carga |
|
Clave:
min: | |
| Asus ROG Flow X16 GV601RW-M5082W R9 6900HS, GeForce RTX 3070 Ti Laptop GPU, Micron 3400 1TB MTFDKBA1T0TFH, Mini LED, 2560x1600, 16.1" | Asus ROG Zephyrus M16 GU603H i9-11900H, GeForce RTX 3070 Laptop GPU, Samsung PM9A1 MZVL22T0HBLB, IPS, 2560x1600, 16" | Asus ROG Strix Scar 15 G533ZW-LN106WS i9-12900H, GeForce RTX 3070 Ti Laptop GPU, Samsung PM9A1 MZVL22T0HBLB, IPS-level, 2560x1440, 15.6" | Gigabyte Aero 16 YE5 i9-12900HK, GeForce RTX 3080 Ti Laptop GPU, Phison ESR01TBMFCT, AMOLED, 3840x2400, 16" | Lenovo Legion 5 Pro 16 G7 i7 RTX 3070Ti i7-12700H, GeForce RTX 3070 Ti Laptop GPU, Samsung PM9A1 MZVL21T0HCLR, IPS, 2560x1600, 16" | MSI Stealth GS66 12UGS i7-12700H, GeForce RTX 3070 Ti Laptop GPU, WDC PC SN810 1TB, IPS-Level, 2560x1440, 15.6" | Apple MacBook Pro 16 2021 M1 Pro M1 Pro, M1 Pro 16-Core GPU, Apple SSD AP1024R, Mini-LED, 3456x2234, 16.2" | Lenovo ThinkPad X1 Extreme G4-20Y50040GE i9-11950H, GeForce RTX 3080 Laptop GPU, Kioxia XG7 KXG7AZNV1T02, IPS, 3840x2400, 16" | Dell XPS 17 9720 RTX 3060 i7-12700H, GeForce RTX 3060 Laptop GPU, Samsung PM9A1 MZVL21T0HCLR, IPS, 3840x2400, 17" | Medio NVIDIA GeForce RTX 3070 Ti Laptop GPU | Media de la clase Gaming | |
|---|---|---|---|---|---|---|---|---|---|---|---|
| Power Consumption | 18% | 24% | -19% | 17% | 23% | 56% | 27% | 37% | 10% | 15% | |
| Idle Minimum * (Watt) | 12.2 | 11 10% | 7.56 38% | 26 -113% | 8.6 30% | 11 10% | 5 59% | 12.3 -1% | 5.9 52% | 14.2 ? -16% | 13.2 ? -8% |
| Idle Average * (Watt) | 25.5 | 20 22% | 13.5 47% | 30 -18% | 17.6 31% | 16 37% | 15.1 41% | 22.8 11% | 15.8 38% | 19.9 ? 22% | 18.9 ? 26% |
| Idle Maximum * (Watt) | 29.8 | 30 -1% | 16.87 43% | 37 -24% | 18.5 38% | 23 23% | 15.5 48% | 13.9 53% | 26.7 10% | 26.2 ? 12% | 24.5 ? 18% |
| Load Average * (Watt) | 183 | 111 39% | 128.9 30% | 127 31% | 110 40% | 110 40% | 54 70% | 95.4 48% | 117.4 36% | 125.8 ? 31% | 108.8 ? 41% |
| Witcher 3 ultra * (Watt) | 183.6 | 156 15% | 196.2 -7% | 176 4% | 227 -24% | 151 18% | 154 16% | 114.8 37% | |||
| Load Maximum * (Watt) | 253 | 197 22% | 274.86 -9% | 236 7% | 294.6 -16% | 230 9% | 90 64% | 170.7 33% | 136.6 46% | 248 ? 2% | 254 ? -0% |
* ... más pequeño es mejor
Power consumption Witcher 3 / Stress test
Power consumption with an external monitor
Duración de la batería
Medimos la duración de la batería WLAN con el HDR desactivado y en el modo equilibrado de Armoury Crate y en el modo de ahorro de energía de la GPU (dGPU desactivada). La tasa de fotogramas se ajusta automáticamente a 60 Hz en modo batería (esta característica puede desactivarse), mientras que el brillo fue de 173 nits durante la prueba. Después ejecutamos un script estandarizado que llama a las páginas web en diferentes intervalos, se desplaza por ellas cuando es necesario, hace clic en los enlaces, mira las imágenes y las animaciones y todo lo que la gente hace en los sitios web.
El resultado es mediocre: sería interesante una comparación con un modelo idéntico sin pantalla mini-LED. Poco más de 5:39 h es nuestro resultado (1 hora menos a 165 Hz). A pleno brillo SDR de 500 nits, perdemos casi otras 2 horas (3:45 h), mientras que los juegos con batería se acaban tras unos 50 minutos.
El modelo casi idénticoZephyrus M16con el mismo tamaño de batería y un procesador Intel más potente consigue más de 7 horas y media. Sin embargo, hay muchos portátiles para juegos entre la competencia que no duran 6 horas en la prueba WLAN, lo que no es inusual para esta clase de portátiles. Las actualizaciones de firmware y BIOS pueden mejorar la duración de la batería del Flow X16. Una recarga completa de la batería de 90 Wh tarda una hora y media.
Apple's MacBook Pro 16 destaca con casi 17 horas de duración de la batería, lo que es aún más impresionante si se tiene en cuenta que también lleva una pantalla mini-LED.
| Asus ROG Flow X16 GV601RW-M5082W R9 6900HS, GeForce RTX 3070 Ti Laptop GPU, 90 Wh | Asus ROG Zephyrus M16 GU603H i9-11900H, GeForce RTX 3070 Laptop GPU, 90 Wh | Asus ROG Strix Scar 15 G533ZW-LN106WS i9-12900H, GeForce RTX 3070 Ti Laptop GPU, 90 Wh | Gigabyte Aero 16 YE5 i9-12900HK, GeForce RTX 3080 Ti Laptop GPU, 99 Wh | Lenovo Legion 5 Pro 16 G7 i7 RTX 3070Ti i7-12700H, GeForce RTX 3070 Ti Laptop GPU, 80 Wh | MSI Stealth GS66 12UGS i7-12700H, GeForce RTX 3070 Ti Laptop GPU, 99.9 Wh | Apple MacBook Pro 16 2021 M1 Pro M1 Pro, M1 Pro 16-Core GPU, 99.6 Wh | Lenovo ThinkPad X1 Extreme G4-20Y50040GE i9-11950H, GeForce RTX 3080 Laptop GPU, 90 Wh | Dell XPS 17 9720 RTX 3060 i7-12700H, GeForce RTX 3060 Laptop GPU, 97 Wh | Asus ROG Flow X13 GV301QH R9 5980HS, GeForce GTX 1650 Max-Q, 62 Wh | Media de la clase Gaming | |
|---|---|---|---|---|---|---|---|---|---|---|---|
| Duración de Batería | 57% | 27% | 45% | -19% | 37% | 196% | 21% | 32% | 51% | 43% | |
| WiFi v1.3 (h) | 5.7 | 7.7 35% | 8.4 47% | 6.4 12% | 5.4 -5% | 5.4 -5% | 16.9 196% | 6.8 19% | 8.7 53% | 5.8 2% | 6.96 ? 22% |
| Witcher 3 ultra (h) | 0.9 | 1.2 33% | |||||||||
| Load (h) | 0.9 | 1.6 78% | 0.9 0% | 1.6 78% | 0.6 -33% | 1.6 78% | 1.1 22% | 1 11% | 1.8 100% | 1.47 ? 63% | |
| Reader / Idle (h) | 13.3 | 8.9 | 7.8 | 10.4 | 8.71 ? | ||||||
| H.264 (h) | 8.5 | 7.5 | 6.3 | 17.5 | 6.9 | 6.9 | 8.28 ? |
Pro
Contra
Veredicto - Asus ROG Flow X16: Un exitoso convertible para juegos

Asus consigue crear un híbrido completo de portátil para juegos y convertible multimedia en la forma del ROG Flow X16. Las temperaturas y los niveles de ruido se mantienen dentro de los límites a pesar del diseño compacto gracias a un diseño especial de refrigeración. Esto también permite el uso de una GeForce RTX 3070 Ti con 125 W de TGP, mientras que muchos portátiles multimedia de la clase superior, como el Dell XPS 17 o el Gigabyte Aero 16tienen que conformarse con 80 a 105 vatios.
En consecuencia, el rendimiento del Flow X16 es bueno, a lo que contribuye el conmutador MUX existente. El frugal AMD Ryzen 9 6900HS también ofrece suficiente potencia, que sigue siendo muy accesible incluso en modo batería, a diferencia de muchos homólogos de Intel.
Otro factor esencial para los juegos y las tareas creativas es la pantalla, y Asus no podría haberlo hecho mucho mejor aquí, ya que las pantallas mini-LED están entre las mejores de su clase y son superiores a las pantallas OLED de igual contraste en términos de brillo, aunque esto no pueda aprovecharse del todo con la batería. Aun así, el DisplayHDR 1000 hace que el contenido correspondiente (por ejemplo, cuando se juega) sea increíblemente bonito de ver y también mejora el contraste y los valores de negro en el modo de escritorio (se activan 512 zonas de atenuación local). La cobertura de casi el 100% del espacio de color DCI-P3 de un panel QHD bien calibrado en estado de entrega es una bendición garantizada para la edición profesional de imágenes, mientras que el ligero efecto blooming es sólo ligeramente molesto.
Las bisagras de 360º también son ventajosas para situaciones como el juego en modo tienda con un mando o cuando se está de viaje, siempre que no se pretenda hacerlo durante más de varias horas seguidas. A esto hay que añadir los buenos altavoces y las posibilidades de actualizar a 64 GB de RAM DDR5 e instalar un segundo SSD. La fabricación es de alto nivel y los dispositivos de entrada son buenos, aunque algunos preferirían que el silencioso teclado con su generoso recorrido de 1,7 mm fuera más nítido, mientras que a otros les hubiera gustado que la iluminación RGB fuera programable individualmente.
El ROG Flow X16 convence como un único 2 en 1 para jugadores con su alto rendimiento, un sistema de refrigeración bien pensado y la brillante pantalla mini-LED - no sólo en los juegos, sino en todas las tareas multimedia. La duración de la batería es nuestro principal punto de crítica.
Se echa en falta el USB 4, pero el puerto xGM de Asus da esperanzas de que haya eGPUs más potentes en el futuro. También nos habría gustado un puerto LAN, así como un lector de huellas dactilares, un lector de tarjetas SD de tamaño completo y una webcam de 1080p. También hay que vivir con un alto consumo de energía en reposo, que puede reducirse con los perfiles de ahorro de energía de Asus. La duración de la batería no es buena, pero es normal para la clase de dispositivo y podría mejorarse con futuras actualizaciones.
En última instancia, sólo dos aspectos se interponen en la decisión: El precio de algo menos de 3.000 dólares (o 2.000 dólares en la configuración básica sin Mini LED y con una RTX 3050 Ti) y la cuestión de lo que realmente necesitas: ¿Un gamer clásico con el máximo TGP, los mejores tiempos de respuesta y los mayores FPS posibles? Entonces te convendría el MSI Raider GE77 HX. La potente Legion 5 Protambién es considerablemente más barato, con un precio de unos 1.900 dólares, pero es menos compacto y tiene problemas con las emisiones más altas que el ROG Flow X16.
Dicho esto, el rendimiento de la GPU del Flow X16 no está disponible en ningún otro portátil con estas dimensiones compactas, por no mencionar la funcionalidad 2 en 1. Para los que pueden prescindir de Windows y, por tanto, de la mayoría de los juegos, el MacBook Pro 16 con su SoC M1 ofrece numerosas ventajas, como una duración de batería muy larga, un funcionamiento casi silencioso y una muy buena pantalla mini-LED.
Precio y disponibilidad
Nuestro modelo de pruebas (GV601RW-M5082W) con Ryzen 9 6900HS, 32 GB de RAM, 1 TB SSD, RTX 3070 Ti y pantalla mini-LED es un modelo de pre-lanzamiento destinado al mercado de habla alemana, donde aún no está disponible.
En algunos países ya están disponibles otros modelos con distintas configuraciones. Por ejemplo, una configuración casi idéntica (con 16 GB de RAM en lugar de 32) está disponible en USA por 2.699,99 dólares. Una configuración completamente idéntica está disponible en Reino Unido a través de Amazonpero actualmente se encuentra agotada. En la India, ofrece dos modelos con diferentes configuraciones a diferentes precios. Australia, por su parte, ofrece una configuración idéntica a por 4.099 dólares australianos. Los precios y la disponibilidad en el momento de escribir este artículo (04.08.2022) están sujetos a cambios
Los ejemplos mencionados no son exhaustivos: Se aconseja a los usuarios que lo comprueben (en su caso) directamente a través de la página web Republic of Gamers de Asus. Basta con buscar el ROG Flow X 16 en Productos -> Portátiles, y luego hacer clic en Dónde comprar.
Asus ROG Flow X16 GV601RW-M5082W
- 08/03/2022 v7 (old)
Marvin Gollor
Price comparison

