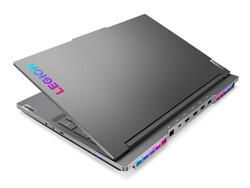
Debut del rendimiento de la Radeon RX 6850M XT: Análisis del portátil Lenovo Legion 7 16ARHA7

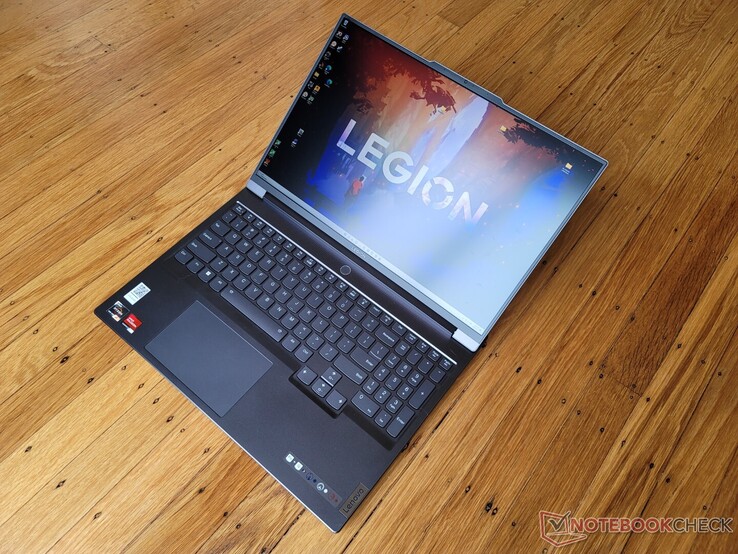
El Legion 7 16 de 16 pulgadas es un portátil para juegos de gama alta de Lenovo que contrasta con la gama media Legion serie 5 o la económica Serie IdeaPad Gaming. Este último modelo 2022 es una actualización completa de la versión 2021 con una revisión interna y un nuevo diseño de chasis
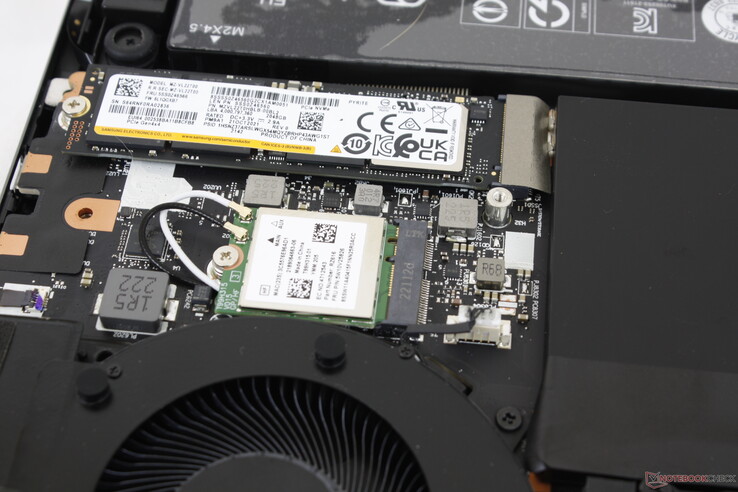
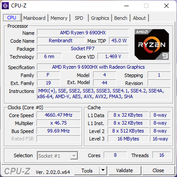
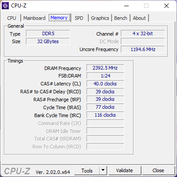
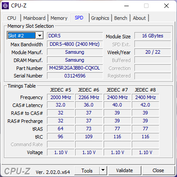
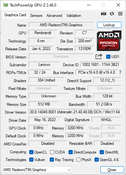
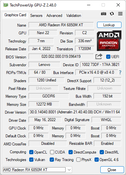
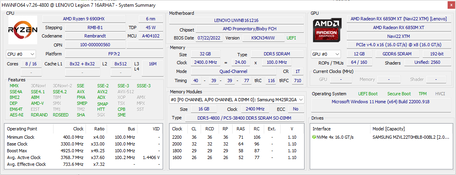
Nuestra configuración de análisis viene con la CPU AMD Zen 3+ Ryzen 9 6900HX, GPU Radeon RX 6850M XT de 140 W, 32 GB de RAM DDR5-4800, y SSD NVMe PCIe4 x4 de 1 TB por unos 2600 dólares al por menor. También hay disponibles SKUs inferiores con el Ryzen 7 6800H o la Radeon RX 6700M, pero por lo demás todas las opciones vienen con la misma pantalla IPS mate de 2560 x 1600 165 Hz únicamente.
Las alternativas al Legion 7 16 incluyen otros portátiles de juego de 16 pulgadas de gama alta como elAsus ROG Zephyrus Duo 16 o HP Omen 16. Sin embargo, los tamaños de pantalla de 15,6 y 17,3 pulgadas son mucho más comunes, por lo que también compararemos el Lenovo con algunos modelos de gama alta de 15,6 pulgadas como el MSI GE66
Más análisis de Lenovo:
Posibles contendientes en la comparación
Valoración | Fecha | Modelo | Peso | Altura | Tamaño | Resolución | Precio |
|---|---|---|---|---|---|---|---|
| 90.8 % v7 (old) | 09/2022 | Lenovo Legion 7 16ARHA7 R9 6900HX, Radeon RX 6850M XT | 2.6 kg | 19.4 mm | 16.00" | 2560x1600 | |
| 87.4 % v7 (old) | 06/2022 | MSI Raider GE66 12UHS i9-12900HK, GeForce RTX 3080 Ti Laptop GPU | 2.4 kg | 23.4 mm | 15.60" | 3840x2160 | |
| 87.9 % v7 (old) | 11/2022 | Lenovo Legion Slim 7-16IAH 82TF004YGE i7-12700H, GeForce RTX 3060 Laptop GPU | 2.2 kg | 16.9 mm | 16.00" | 2560x1600 | |
| 88.2 % v7 (old) | 05/2022 | Asus ROG Zephyrus Duo 16 GX650RX R9 6900HX, GeForce RTX 3080 Ti Laptop GPU | 2.6 kg | 20.5 mm | 16.00" | 3840x2400 | |
| 86 % v7 (old) | 04/2022 | HP Omen 16-c0077ng R7 5800H, Radeon RX 6600M | 2.3 kg | 26 mm | 16.10" | 2560x1440 | |
| 87.4 % v7 (old) | 08/2021 | Lenovo Legion 5 Pro 16ACH6H (82JQ001PGE) R7 5800H, GeForce RTX 3070 Laptop GPU | 2.6 kg | 26.85 mm | 16.00" | 2560x1600 |
Maletín - Aspecto profesional
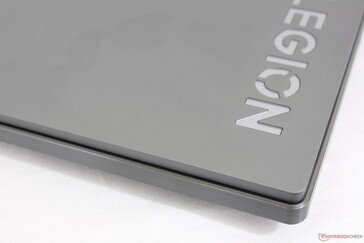
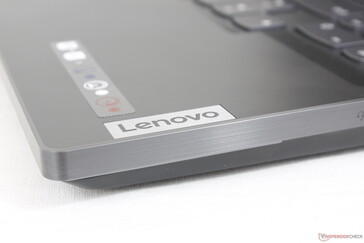
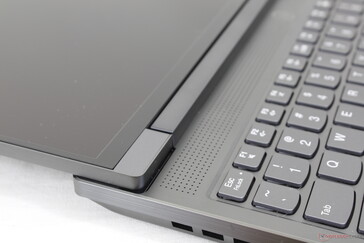
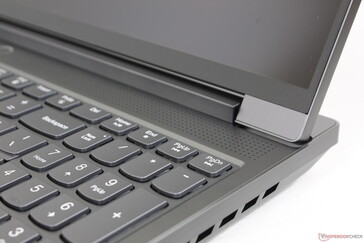
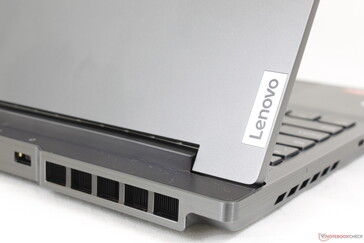
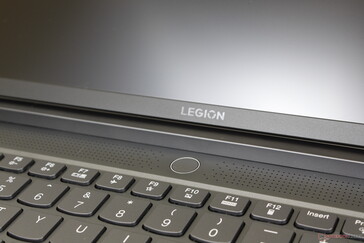
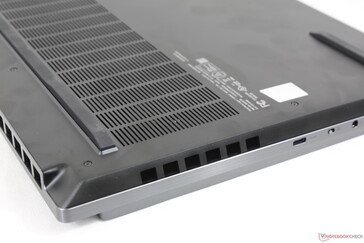
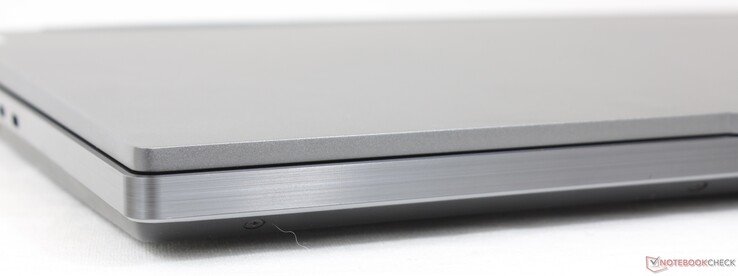
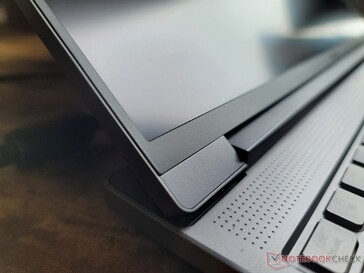
El modelo 2022 mantiene los materiales de aluminio anodizado y los embellecedores metálicos del modelo 2021, pero con algunos cambios notables. Las rejillas de ventilación de los laterales, por ejemplo, están ahora enrasadas en lugar de sobresalir de los bordes para lograr un aspecto más limpio. Por su parte, la parte trasera se ha rediseñado por completo con esquinas más redondeadas y un flujo visual más suave. Los elementos LED del modelo 2021 se mantienen sin cambios, incluida la fina barra de luces a lo largo del borde delantero y los laterales. Cuando las luces están apagadas, el aspecto monótono de color gris oscuro podría pasar fácilmente por una posible estación de trabajo móvil o un modelo Nvidia Studio
En términos de calidad, la base es rígida y muy resistente a cualquier torsión o depresión incluso cuando se aplica presión sobre el centro del teclado. La tapa y las bisagras, sin embargo, son más débiles y más susceptibles de dañarse con el tiempo. La tapa se tuerce más fácilmente que la del Razer Blade 15 mientras que las bisagras tienden a tambalearse al ajustar los ángulos.
Top 10 Análisis
» Top 10 Portátiles Multimedia
» Top 10 Portátiles de Juego
» Top 10 Portátiles de Juego ligeros
» Top 10 Portátiles Asequibles de Oficina/Empresa
» Top 10 Portátiles de Juego Ligeros
» Top 10 Portátiles de Oficina/Empresa Premium
» Top 10 Estaciones de Trabajo
» Top 10 Subportátiles
» Top 10 Ultrabooks
» Top 10 Convertibles
» Top 10 Tablets
» Top 10 Tablets Windows
» Top 10 Tablets de menos de 250 Euros
» Top 10 Phablets (>5.5")
» Top 10 Smartphones
» Top 10 Smartphones (≤5")
» Top 10 Smartphones de menos de 300 Euros
» Top 10 Smartphones de menos de 120 Euros
» Top 10 Portátiles de menos de 1000 Euros
» Top 10 Portátiles de menos de 500 Euros
» Top 10 Portátiles de menos de 300 Euros
» Los Mejores Displays de Portátiles Analizados por Notebookcheck
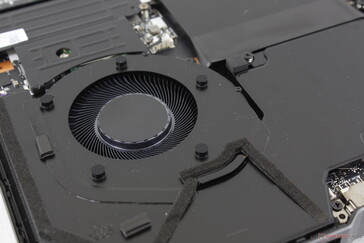
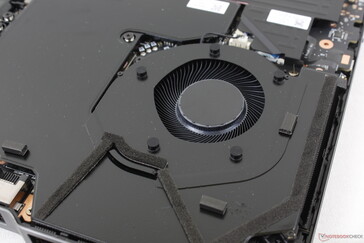
Las dimensiones y el peso totales se acercan mucho al Asus ROG Zephyrus Duo 16 para ser uno de los portátiles para juegos más pesados del mercado a pesar del fino factor de forma de <20 mm. Quizás lo más notable es que el sistema Asus es capaz de integrar una segunda pantalla sin necesidad de ser más pesado o grande que nuestro Lenovo. La sensación de gran densidad de la legión puede atribuirse a su solución de refrigeración por cámara de vapor, que es tradicionalmente más pesada que los habituales tubos de calor de cobre.
Conectividad: muchos puertos USB-C
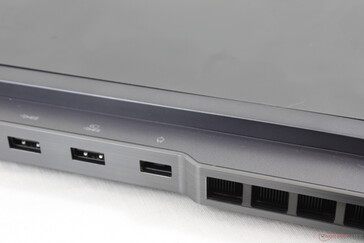
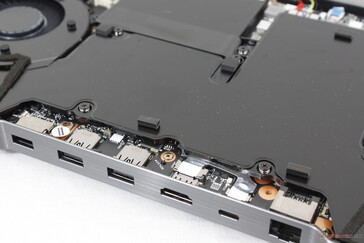
Las opciones de puerto son variadas y en su mayoría a lo largo del borde trasero del chasis en lugar de los lados. Hay cuatro puertos USB-C individuales, lo que es más que en la mayoría de portátiles de juego. Sin embargo, no son iguales, ya que sólo algunos puertos USB-C admiten DisplayPort mientras que otros pueden admitir Power Delivery, como muestran nuestras fotos de abajo.
No hay soporte para Thunderbolt a diferencia de la mayoría de portátiles de juego con tecnología Intel.
Comunicación
El sistema viene con el poco común MediaTek RZ616 para la conectividad Wi-Fi 6E y Bluetooth 5.2 en lugar de la habitual solución Intel AX. Las tasas de transferencia son rápidas y constantes cuando se empareja con nuestra red doméstica de 6 GHz, pero las tasas de recepción son ligeramente más lentas de lo esperado.
| Networking | |
| iperf3 transmit AX12 | |
| Lenovo Legion 5 Pro 16ACH6H (82JQ001PGE) | |
| HP Omen 16-c0077ng | |
| iperf3 receive AX12 | |
| Lenovo Legion 5 Pro 16ACH6H (82JQ001PGE) | |
| HP Omen 16-c0077ng | |
| iperf3 receive AXE11000 6GHz | |
| Lenovo Legion 7 16ARHA7 | |
| iperf3 transmit AXE11000 | |
| Asus ROG Zephyrus Duo 16 GX650RX | |
| Lenovo Legion Slim 7-16IAH 82TF004YGE | |
| MSI Raider GE66 12UHS | |
| iperf3 receive AXE11000 | |
| MSI Raider GE66 12UHS | |
| Lenovo Legion Slim 7-16IAH 82TF004YGE | |
| Asus ROG Zephyrus Duo 16 GX650RX | |
| iperf3 transmit AXE11000 6GHz | |
| Lenovo Legion 7 16ARHA7 | |
Cámara web
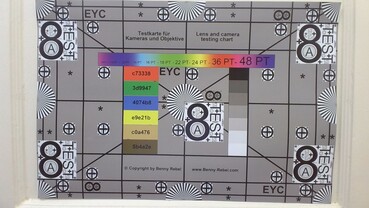
La cámara web de 2 MP ofrece una imagen más nítida que la de la mayoría de los demás portátiles, en los que los 720p siguen siendo habituales. Hay un interruptor de apagado de la cámara a lo largo del borde derecho, pero no hay ningún indicador visual que muestre que la lente de la cámara está bloqueada de alguna manera
No hay sensor IR para el soporte de Hello.
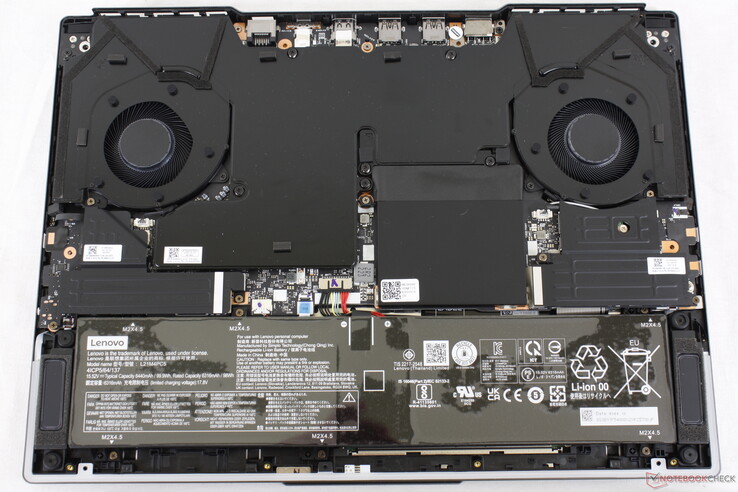
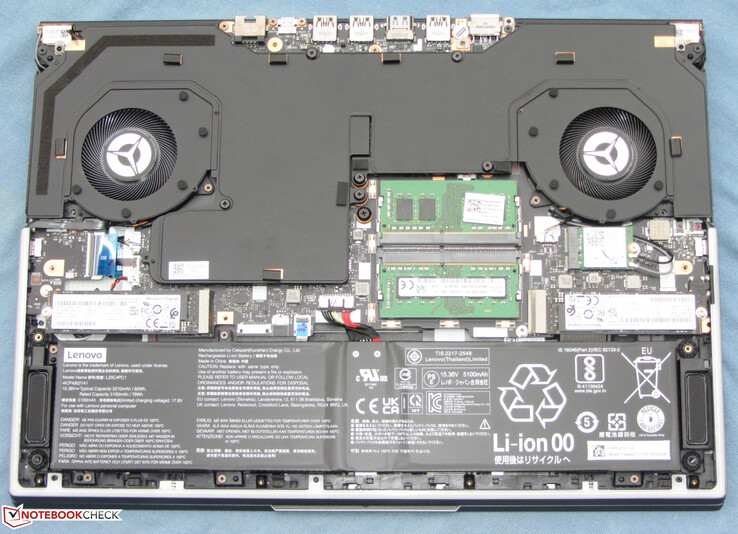
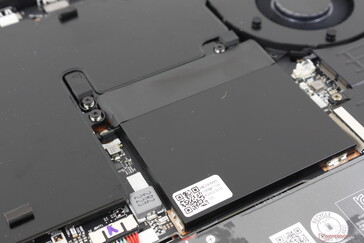
Mantenimiento
Accesorios y garantía
Lenovo incluye una herramienta para extraer las tapas de las teclas para limpiarlas o sustituirlas. Se aplica la garantía limitada estándar de un año si se adquiere en Estados Unidos.
Dispositivos de entrada: mejor que un IdeaPad o un Yoga
Teclado
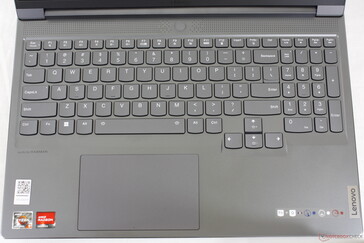
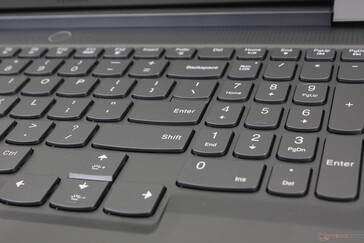
Al principio temíamos que el teclado fuera idéntico al de un IdeaPad más barato, con un recorrido poco profundo y una respuesta suave. Afortunadamente, el teclado del Legion 7 16 es de mayor calidad que los teclados de los modelos IdeaPad y Yoga. El recorrido de las teclas es notablemente más profundo y con una respuesta más firme para una experiencia de escritura más satisfactoria, especialmente en lo que respecta a las teclas Espacio y Enter. No es del todo un ThinkPad, pero el teclado se acerca bastante.
Teclado táctil
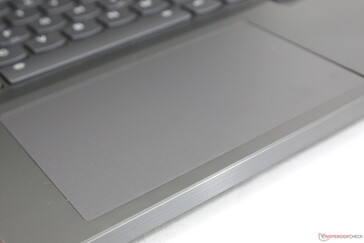
El tamaño del clickpad es casi idéntico al del clickpad delDell Inspiron 16 Plus 7620 Plus (12 x 7,5 cm frente a 11,5 x 8 cm). La tracción es muy suave y sólo un poco pegajosa cuando se desliza a velocidades más lentas para facilitar el arrastre y la caída.
El clic en el clickpad es poco profundo pero con una respuesta decente. Aunque es ligeramente más suave, la respuesta es al menos más firme que en otros portátiles para juegos como el MSI Stealth GS77.
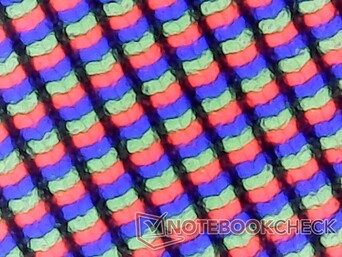
Pantalla - 165 Hz, FreeSync, 100% sRGB estándar
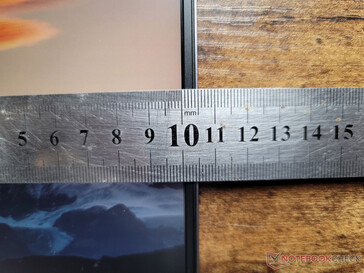
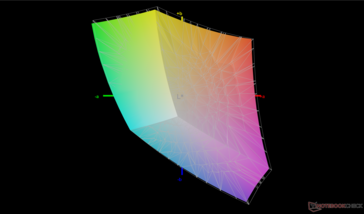
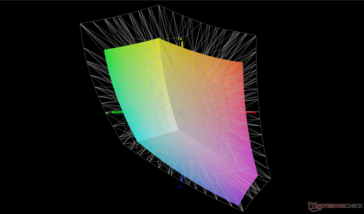
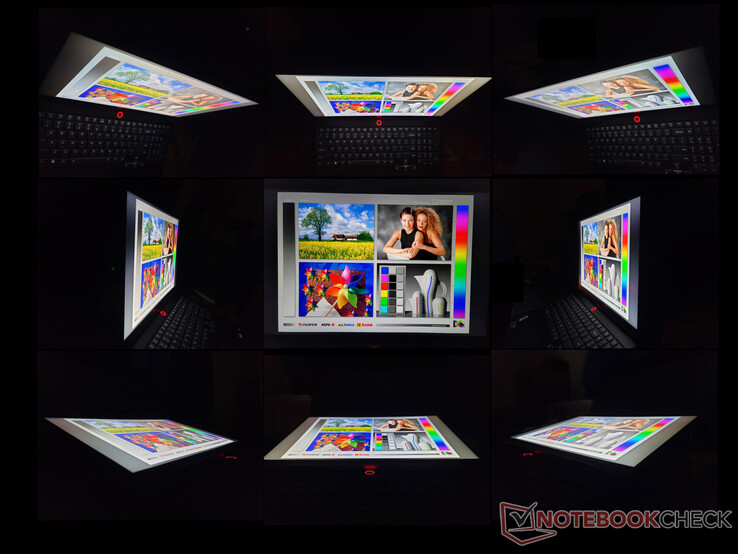
El Legion 7 16 viene con un panel BOE IPS de alta calidad que es casi análogo al panel del Asus ROG Zephyrus Duo 16 (NE160QDM-NY1 vs. NE160QDM-NX1). Ambos paneles comparten características muy similares, como los tiempos de respuesta, los niveles de brillo y la relación de contraste, pero difieren en dos aspectos clave: la tasa de refresco y la cobertura de color. La pantalla del Lenovo tiene como objetivo la cobertura sRGB con una frecuencia de actualización nativa más rápida de 165 Hz en comparación con los colores más amplios del P3, pero con una frecuencia de actualización más lenta de 120 Hz en el Asus. Un panel no es necesariamente mejor que el otro dependiendo de las preferencias del usuario.
| |||||||||||||||||||||||||
iluminación: 90 %
Brillo con batería: 478.8 cd/m²
Contraste: 1113:1 (Negro: 0.43 cd/m²)
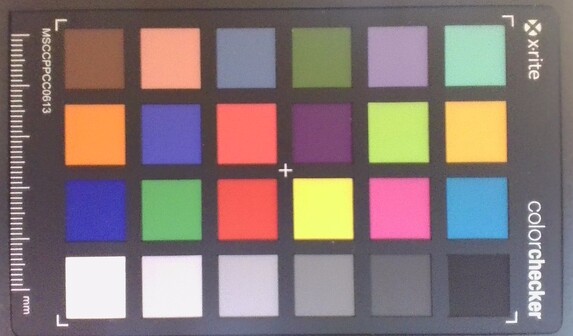
ΔE ColorChecker Calman: 2.24 | ∀{0.5-29.43 Ø4.76}
calibrated: 1.89
ΔE Greyscale Calman: 2.3 | ∀{0.09-98 Ø5}
65.7% AdobeRGB 1998 (Argyll 3D)
95.3% sRGB (Argyll 3D)
63.7% Display P3 (Argyll 3D)
Gamma: 2.25
CCT: 6955 K
| Lenovo Legion 7 16ARHA7 BOE CQ NE160QDM-NY1, IPS, 2560x1600, 16" | MSI Raider GE66 12UHS AUO51EB, IPS, 3840x2160, 15.6" | Lenovo Legion Slim 7-16IAH 82TF004YGE MNG007DA1-G , IPS LED, 2560x1600, 16" | Asus ROG Zephyrus Duo 16 GX650RX BOE NE160QAM-NX1, IPS-Level, 3840x2400, 16" | HP Omen 16-c0077ng BOE09E5, IPS, 2560x1440, 16.1" | Lenovo Legion 5 Pro 16ACH6H (82JQ001PGE) CSOT T3 MNG007DA1-1, IPS, 2560x1600, 16" | |
|---|---|---|---|---|---|---|
| Display | 24% | 9% | 30% | 6% | 8% | |
| Display P3 Coverage (%) | 63.7 | 80.4 26% | 70.5 11% | 98 54% | 68.8 8% | |
| sRGB Coverage (%) | 95.3 | 98.4 3% | 99.1 4% | 99.9 5% | 96.9 2% | 99 4% |
| AdobeRGB 1998 Coverage (%) | 65.7 | 94.7 44% | 72.8 11% | 86.3 31% | 71.1 8% | 73 11% |
| Response Times | -69% | -2% | -9% | -23% | 25% | |
| Response Time Grey 50% / Grey 80% * (ms) | 9.2 ? | 18.8 ? -104% | 12 ? -30% | 14.6 ? -59% | 13 ? -41% | 9.2 ? -0% |
| Response Time Black / White * (ms) | 9.6 ? | 12.8 ? -33% | 7 ? 27% | 5.6 ? 42% | 10 ? -4% | 4.8 50% |
| PWM Frequency (Hz) | ||||||
| Screen | -17% | 2% | -23% | -28% | 9% | |
| Brightness middle (cd/m²) | 478.8 | 351 -27% | 523 9% | 459 -4% | 297 -38% | 551 15% |
| Brightness (cd/m²) | 477 | 347 -27% | 494 4% | 434 -9% | 283 -41% | 523 10% |
| Brightness Distribution (%) | 90 | 90 0% | 90 0% | 88 -2% | 91 1% | 88 -2% |
| Black Level * (cd/m²) | 0.43 | 0.35 19% | 0.4 7% | 0.44 -2% | 0.22 49% | 0.54 -26% |
| Contrast (:1) | 1113 | 1003 -10% | 1308 18% | 1043 -6% | 1350 21% | 1020 -8% |
| Colorchecker dE 2000 * | 2.24 | 2.54 -13% | 2.6 -16% | 2.97 -33% | 3.25 -45% | 1.8 20% |
| Colorchecker dE 2000 max. * | 4.49 | 8.36 -86% | 5 -11% | 8.13 -81% | 6.33 -41% | 2.53 44% |
| Colorchecker dE 2000 calibrated * | 1.89 | 0.67 65% | 1 47% | 1.03 46% | 1.11 41% | 1.66 12% |
| Greyscale dE 2000 * | 2.3 | 4.1 -78% | 3.3 -43% | 4.9 -113% | 6.97 -203% | 1.85 20% |
| Gamma | 2.25 98% | 2.089 105% | 2.17 101% | 2.235 98% | 2.3 96% | 2.3 96% |
| CCT | 6955 93% | 7036 92% | 6013 108% | 6775 96% | 6050 107% | 6338 103% |
| Color Space (Percent of AdobeRGB 1998) (%) | 72.81 | |||||
| Color Space (Percent of sRGB) (%) | 99.41 | |||||
| Media total (Programa/Opciones) | -21% /
-16% | 3% /
3% | -1% /
-9% | -15% /
-20% | 14% /
12% |
* ... más pequeño es mejor
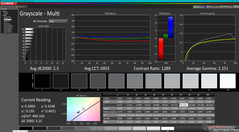
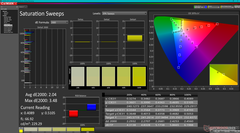
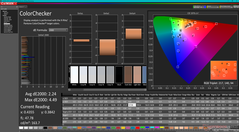
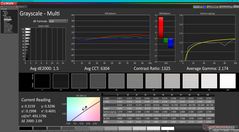
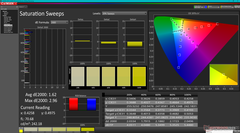
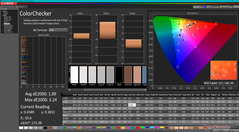
La pantalla está bien calibrada desde el principio, con unos valores DeltaE medios de escala de grises y ColorChecker de sólo 2,3 y 2,24, respectivamente. Calibrando el panel aún más nosotros mismos mejoraríamos los valores DeltaE a sólo 1,5 y 1,8 para aprovechar mejor la cobertura completa de sRGB.
Tiempos de respuesta del display
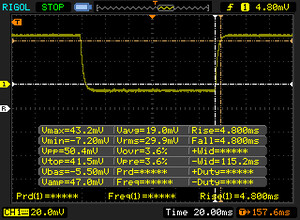
| ↔ Tiempo de respuesta de Negro a Blanco | ||
|---|---|---|
| 9.6 ms ... subida ↗ y bajada ↘ combinada | ↗ 4.8 ms subida | |
| ↘ 4.8 ms bajada | ||
| La pantalla mostró tiempos de respuesta rápidos en nuestros tests y debería ser adecuada para juegos. En comparación, todos los dispositivos de prueba van de ##min### (mínimo) a 240 (máximo) ms. » 25 % de todos los dispositivos son mejores. Esto quiere decir que el tiempo de respuesta medido es mejor que la media (20.1 ms) de todos los dispositivos testados. | ||
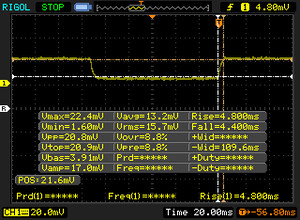
| ↔ Tiempo de respuesta 50% Gris a 80% Gris | ||
| 9.2 ms ... subida ↗ y bajada ↘ combinada | ↗ 4.8 ms subida | |
| ↘ 4.4 ms bajada | ||
| La pantalla mostró tiempos de respuesta rápidos en nuestros tests y debería ser adecuada para juegos. En comparación, todos los dispositivos de prueba van de ##min### (mínimo) a 636 (máximo) ms. » 22 % de todos los dispositivos son mejores. Esto quiere decir que el tiempo de respuesta medido es mejor que la media (31.5 ms) de todos los dispositivos testados. | ||
Parpadeo de Pantalla / PWM (Pulse-Width Modulation)
| Parpadeo de Pantalla / PWM no detectado | |||
Comparación: 53 % de todos los dispositivos testados no usaron PWM para atenuar el display. Si se usó, medimos una media de 8036 (mínimo: 5 - máxmo: 343500) Hz. | |||
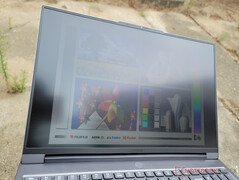
La visibilidad en exteriores es mejor que la de la mayoría de los portátiles para juegos gracias a la brillante pantalla de 500 nits. Sin embargo, es conveniente evitar usar el sistema bajo la luz directa del sol para maximizar la visibilidad. El resplandor es mucho más manejable si se trabaja a la sombra.
Rendimiento
Condiciones de la prueba
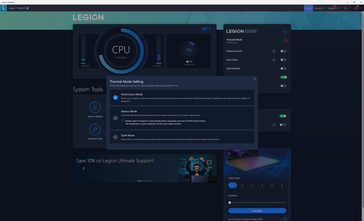
Configuramos nuestra unidad en el modo Rendimiento a través de Lenovo Vantage y en el modo Alto Rendimiento a través de Windows antes de ejecutar cualquier prueba de rendimiento. También nos aseguramos de que el 'Modo Híbrido' estuviera desactivado en Vantage para utilizar mejor la GPU Radeon discreta.
Es muy recomendable que los usuarios se familiaricen con Lenovo Vantage y el software Radeon. El rendimiento del sistema, los efectos LED y las actualizaciones vitales están ligados a estas dos aplicaciones específicas. Nuestra unidad de prueba específica tuvo problemas con la actualización de los controladores gráficos donde la pantalla se quedaba en negro al reiniciar. Tuvimos que reinstalar los controladores por segunda vez antes de que el software Radeon pudiera iniciarse sin problemas.
Procesador - Mejoras marginales de Zen 3+
El rendimiento de la CPU es excelente y casi exactamente donde esperamos que esté en relación con otros portátiles equipados con el mismo Ryzen 9 6900HX que el procesador Ryzen 9 6900HX. No obstante, no esperes mejoras significativas respecto al Ryzen 9 5900HX del año pasado ya que el 6900HX sólo es entre un 5 y un 25 por ciento más rápido en el mejor de los casos, dependiendo del portátil 5900HX. El rendimiento general queda por detrás de las últimas opciones Intel Alder Lake-H de 12ª generación, como elCore i7-12700H o i9-12900HK entre un 15 y un 20 por ciento.
La ejecución de CineBench R15 xT en bucle muestra resultados consistentes que sugieren una excelente sostenibilidad del rendimiento cuando se estresa.
Cinebench R15 Multi Loop
Cinebench R23: Multi Core | Single Core
Cinebench R15: CPU Multi 64Bit | CPU Single 64Bit
Blender: v2.79 BMW27 CPU
7-Zip 18.03: 7z b 4 | 7z b 4 -mmt1
Geekbench 5.5: Multi-Core | Single-Core
HWBOT x265 Benchmark v2.2: 4k Preset
LibreOffice : 20 Documents To PDF
R Benchmark 2.5: Overall mean
| Cinebench R20 / CPU (Multi Core) | |
| MSI GE67 HX 12UGS | |
| Lenovo Legion Slim 7-16IAH 82TF004YGE | |
| MSI Raider GE66 12UHS | |
| Lenovo Legion 7 16ARHA7 | |
| Medio AMD Ryzen 9 6900HX (3742 - 5813, n=19) | |
| Asus ROG Strix G15 G513QY | |
| MSI GS76 Stealth 11UH | |
| Eurocom RX315 NH57AF1 | |
| HP Omen 16-c0077ng | |
| MSI Delta 15 A5EFK | |
| MSI GS66 Stealth 10UG | |
| Cinebench R20 / CPU (Single Core) | |
| MSI Raider GE66 12UHS | |
| MSI GE67 HX 12UGS | |
| Lenovo Legion Slim 7-16IAH 82TF004YGE | |
| Lenovo Legion 7 16ARHA7 | |
| MSI GS76 Stealth 11UH | |
| Medio AMD Ryzen 9 6900HX (595 - 631, n=19) | |
| Asus ROG Strix G15 G513QY | |
| Eurocom RX315 NH57AF1 | |
| MSI Delta 15 A5EFK | |
| HP Omen 16-c0077ng | |
| MSI GS66 Stealth 10UG | |
| Cinebench R15 / CPU Single 64Bit | |
| MSI Raider GE66 12UHS | |
| MSI GE67 HX 12UGS | |
| Lenovo Legion Slim 7-16IAH 82TF004YGE | |
| Lenovo Legion 7 16ARHA7 | |
| Medio AMD Ryzen 9 6900HX (241 - 261, n=19) | |
| Asus ROG Strix G15 G513QY | |
| MSI Delta 15 A5EFK | |
| MSI GS76 Stealth 11UH | |
| HP Omen 16-c0077ng | |
| Eurocom RX315 NH57AF1 | |
| MSI GS66 Stealth 10UG | |
| HWBOT x265 Benchmark v2.2 / 4k Preset | |
| MSI GE67 HX 12UGS | |
| Lenovo Legion Slim 7-16IAH 82TF004YGE | |
| MSI Raider GE66 12UHS | |
| Lenovo Legion 7 16ARHA7 | |
| Medio AMD Ryzen 9 6900HX (12.6 - 18.7, n=20) | |
| MSI Delta 15 A5EFK | |
| Asus ROG Strix G15 G513QY | |
| HP Omen 16-c0077ng | |
| MSI GS76 Stealth 11UH | |
| Eurocom RX315 NH57AF1 | |
| MSI GS66 Stealth 10UG | |
| LibreOffice / 20 Documents To PDF | |
| HP Omen 16-c0077ng | |
| Lenovo Legion 7 16ARHA7 | |
| Medio AMD Ryzen 9 6900HX (44.8 - 81.7, n=20) | |
| MSI Delta 15 A5EFK | |
| Asus ROG Strix G15 G513QY | |
| MSI GS76 Stealth 11UH | |
| Eurocom RX315 NH57AF1 | |
| MSI GS66 Stealth 10UG | |
| MSI GE67 HX 12UGS | |
| Lenovo Legion Slim 7-16IAH 82TF004YGE | |
| MSI Raider GE66 12UHS | |
* ... más pequeño es mejor
AIDA64: FP32 Ray-Trace | FPU Julia | CPU SHA3 | CPU Queen | FPU SinJulia | FPU Mandel | CPU AES | CPU ZLib | FP64 Ray-Trace | CPU PhotoWorxx
| Performance rating | |
| Lenovo Legion 7 16ARHA7 | |
| Asus ROG Zephyrus Duo 16 GX650RX | |
| Lenovo Legion Slim 7-16IAH 82TF004YGE | |
| Medio AMD Ryzen 9 6900HX | |
| HP Omen 16-c0077ng | |
| MSI Alpha 15 B5EEK-008 | |
| MSI Raider GE66 12UHS | |
| AIDA64 / FP32 Ray-Trace | |
| Lenovo Legion 7 16ARHA7 | |
| Asus ROG Zephyrus Duo 16 GX650RX | |
| Lenovo Legion Slim 7-16IAH 82TF004YGE | |
| Medio AMD Ryzen 9 6900HX (10950 - 17963, n=20) | |
| HP Omen 16-c0077ng | |
| MSI Alpha 15 B5EEK-008 | |
| MSI Raider GE66 12UHS | |
| AIDA64 / FPU Julia | |
| Lenovo Legion 7 16ARHA7 | |
| Asus ROG Zephyrus Duo 16 GX650RX | |
| Medio AMD Ryzen 9 6900HX (71414 - 110797, n=20) | |
| HP Omen 16-c0077ng | |
| MSI Alpha 15 B5EEK-008 | |
| Lenovo Legion Slim 7-16IAH 82TF004YGE | |
| MSI Raider GE66 12UHS | |
| AIDA64 / CPU SHA3 | |
| Lenovo Legion Slim 7-16IAH 82TF004YGE | |
| Lenovo Legion 7 16ARHA7 | |
| Asus ROG Zephyrus Duo 16 GX650RX | |
| Medio AMD Ryzen 9 6900HX (2471 - 3804, n=20) | |
| HP Omen 16-c0077ng | |
| MSI Alpha 15 B5EEK-008 | |
| MSI Raider GE66 12UHS | |
| AIDA64 / CPU Queen | |
| Lenovo Legion 7 16ARHA7 | |
| MSI Raider GE66 12UHS | |
| Asus ROG Zephyrus Duo 16 GX650RX | |
| Lenovo Legion Slim 7-16IAH 82TF004YGE | |
| Medio AMD Ryzen 9 6900HX (84185 - 107544, n=20) | |
| HP Omen 16-c0077ng | |
| MSI Alpha 15 B5EEK-008 | |
| AIDA64 / FPU SinJulia | |
| Lenovo Legion 7 16ARHA7 | |
| Asus ROG Zephyrus Duo 16 GX650RX | |
| Medio AMD Ryzen 9 6900HX (10970 - 13205, n=20) | |
| HP Omen 16-c0077ng | |
| MSI Alpha 15 B5EEK-008 | |
| Lenovo Legion Slim 7-16IAH 82TF004YGE | |
| MSI Raider GE66 12UHS | |
| AIDA64 / FPU Mandel | |
| Lenovo Legion 7 16ARHA7 | |
| Asus ROG Zephyrus Duo 16 GX650RX | |
| Medio AMD Ryzen 9 6900HX (39164 - 61370, n=20) | |
| HP Omen 16-c0077ng | |
| MSI Alpha 15 B5EEK-008 | |
| Lenovo Legion Slim 7-16IAH 82TF004YGE | |
| MSI Raider GE66 12UHS | |
| AIDA64 / CPU AES | |
| Lenovo Legion 7 16ARHA7 | |
| Asus ROG Zephyrus Duo 16 GX650RX | |
| Lenovo Legion Slim 7-16IAH 82TF004YGE | |
| HP Omen 16-c0077ng | |
| MSI Alpha 15 B5EEK-008 | |
| Medio AMD Ryzen 9 6900HX (54613 - 142360, n=20) | |
| MSI Raider GE66 12UHS | |
| AIDA64 / CPU ZLib | |
| MSI Raider GE66 12UHS | |
| Lenovo Legion Slim 7-16IAH 82TF004YGE | |
| Lenovo Legion 7 16ARHA7 | |
| Asus ROG Zephyrus Duo 16 GX650RX | |
| HP Omen 16-c0077ng | |
| Medio AMD Ryzen 9 6900HX (578 - 911, n=20) | |
| MSI Alpha 15 B5EEK-008 | |
| AIDA64 / FP64 Ray-Trace | |
| Lenovo Legion 7 16ARHA7 | |
| Asus ROG Zephyrus Duo 16 GX650RX | |
| Lenovo Legion Slim 7-16IAH 82TF004YGE | |
| Medio AMD Ryzen 9 6900HX (5798 - 9540, n=20) | |
| HP Omen 16-c0077ng | |
| MSI Alpha 15 B5EEK-008 | |
| MSI Raider GE66 12UHS | |
| AIDA64 / CPU PhotoWorxx | |
| MSI Raider GE66 12UHS | |
| Lenovo Legion Slim 7-16IAH 82TF004YGE | |
| Lenovo Legion 7 16ARHA7 | |
| Asus ROG Zephyrus Duo 16 GX650RX | |
| Medio AMD Ryzen 9 6900HX (26873 - 30604, n=20) | |
| MSI Alpha 15 B5EEK-008 | |
| HP Omen 16-c0077ng | |
Rendimiento del sistema
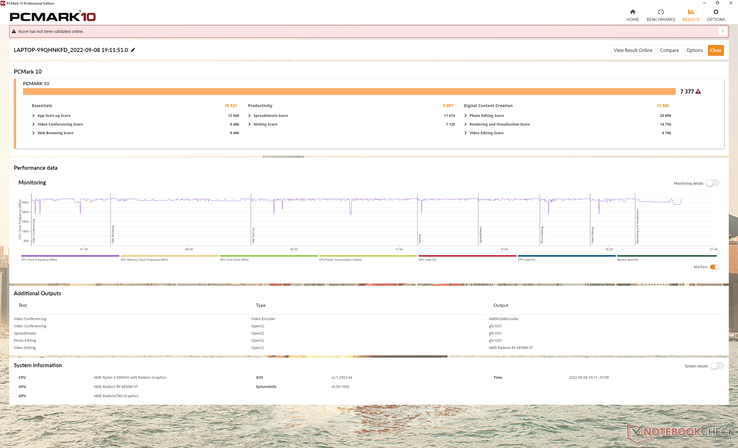
Los resultados de PCMark 10 son excelentes, pero siguen estando por detrás del MSI GE66 con la CPU Intel Core i9 de 12ª generación y la GPU GeForce RTX 3080 Ti
Experimentamos problemas de despertar del sueño al menos una vez en nuestra unidad de pruebas. El sistema no podía despertarse al abrir la tapa, lo que requería un apagado fuerte y un reinicio en frío.
CrossMark: Overall | Productivity | Creativity | Responsiveness
| PCMark 10 / Score | |
| MSI Raider GE66 12UHS | |
| Lenovo Legion Slim 7-16IAH 82TF004YGE | |
| Lenovo Legion 7 16ARHA7 | |
| Medio AMD Ryzen 9 6900HX, AMD Radeon RX 6850M XT (7292 - 7377, n=2) | |
| HP Omen 16-c0077ng | |
| Lenovo Legion 5 Pro 16ACH6H (82JQ001PGE) | |
| Asus ROG Zephyrus Duo 16 GX650RX | |
| PCMark 10 / Essentials | |
| MSI Raider GE66 12UHS | |
| Lenovo Legion Slim 7-16IAH 82TF004YGE | |
| Lenovo Legion 7 16ARHA7 | |
| HP Omen 16-c0077ng | |
| Medio AMD Ryzen 9 6900HX, AMD Radeon RX 6850M XT (10250 - 10521, n=2) | |
| Lenovo Legion 5 Pro 16ACH6H (82JQ001PGE) | |
| Asus ROG Zephyrus Duo 16 GX650RX | |
| PCMark 10 / Productivity | |
| MSI Raider GE66 12UHS | |
| Lenovo Legion Slim 7-16IAH 82TF004YGE | |
| HP Omen 16-c0077ng | |
| Lenovo Legion 7 16ARHA7 | |
| Medio AMD Ryzen 9 6900HX, AMD Radeon RX 6850M XT (9090 - 9097, n=2) | |
| Lenovo Legion 5 Pro 16ACH6H (82JQ001PGE) | |
| Asus ROG Zephyrus Duo 16 GX650RX | |
| PCMark 10 / Digital Content Creation | |
| MSI Raider GE66 12UHS | |
| Lenovo Legion 7 16ARHA7 | |
| Medio AMD Ryzen 9 6900HX, AMD Radeon RX 6850M XT (11296 - 11385, n=2) | |
| Lenovo Legion Slim 7-16IAH 82TF004YGE | |
| HP Omen 16-c0077ng | |
| Lenovo Legion 5 Pro 16ACH6H (82JQ001PGE) | |
| Asus ROG Zephyrus Duo 16 GX650RX | |
| CrossMark / Overall | |
| Lenovo Legion Slim 7-16IAH 82TF004YGE | |
| Asus ROG Zephyrus Duo 16 GX650RX | |
| Medio AMD Ryzen 9 6900HX, AMD Radeon RX 6850M XT (1596 - 1597, n=2) | |
| Lenovo Legion 7 16ARHA7 | |
| CrossMark / Productivity | |
| Lenovo Legion Slim 7-16IAH 82TF004YGE | |
| Asus ROG Zephyrus Duo 16 GX650RX | |
| Medio AMD Ryzen 9 6900HX, AMD Radeon RX 6850M XT (1551 - 1565, n=2) | |
| Lenovo Legion 7 16ARHA7 | |
| CrossMark / Creativity | |
| Lenovo Legion Slim 7-16IAH 82TF004YGE | |
| Lenovo Legion 7 16ARHA7 | |
| Medio AMD Ryzen 9 6900HX, AMD Radeon RX 6850M XT (1738 - 1754, n=2) | |
| Asus ROG Zephyrus Duo 16 GX650RX | |
| CrossMark / Responsiveness | |
| Lenovo Legion Slim 7-16IAH 82TF004YGE | |
| Asus ROG Zephyrus Duo 16 GX650RX | |
| Medio AMD Ryzen 9 6900HX, AMD Radeon RX 6850M XT (1310 - 1315, n=2) | |
| Lenovo Legion 7 16ARHA7 | |
| PCMark 10 Score | 7377 puntos | |
ayuda | ||
| AIDA64 / Memory Copy | |
| MSI Raider GE66 12UHS | |
| Asus ROG Zephyrus Duo 16 GX650RX | |
| Lenovo Legion 7 16ARHA7 | |
| Medio AMD Ryzen 9 6900HX (47938 - 53345, n=20) | |
| Lenovo Legion Slim 7-16IAH 82TF004YGE | |
| Asus ROG Flow X16 GV601RW-M5082W | |
| HP Omen 16-c0077ng | |
| AIDA64 / Memory Read | |
| MSI Raider GE66 12UHS | |
| Lenovo Legion Slim 7-16IAH 82TF004YGE | |
| Asus ROG Zephyrus Duo 16 GX650RX | |
| Lenovo Legion 7 16ARHA7 | |
| Medio AMD Ryzen 9 6900HX (43892 - 53321, n=20) | |
| Asus ROG Flow X16 GV601RW-M5082W | |
| HP Omen 16-c0077ng | |
| AIDA64 / Memory Write | |
| MSI Raider GE66 12UHS | |
| Lenovo Legion Slim 7-16IAH 82TF004YGE | |
| Asus ROG Zephyrus Duo 16 GX650RX | |
| Lenovo Legion 7 16ARHA7 | |
| Medio AMD Ryzen 9 6900HX (51085 - 57202, n=20) | |
| Asus ROG Flow X16 GV601RW-M5082W | |
| HP Omen 16-c0077ng | |
| AIDA64 / Memory Latency | |
| Lenovo Legion Slim 7-16IAH 82TF004YGE | |
| Asus ROG Flow X16 GV601RW-M5082W | |
| MSI Raider GE66 12UHS | |
| Asus ROG Zephyrus Duo 16 GX650RX | |
| Medio AMD Ryzen 9 6900HX (80.7 - 120.6, n=20) | |
| HP Omen 16-c0077ng | |
| Lenovo Legion 7 16ARHA7 | |
* ... más pequeño es mejor
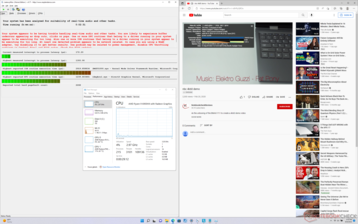
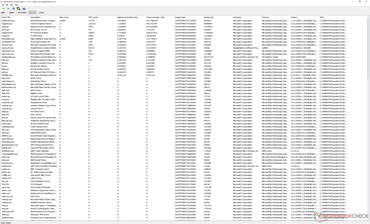
Latencia del CPD
| DPC Latencies / LatencyMon - interrupt to process latency (max), Web, Youtube, Prime95 | |
| MSI Raider GE66 12UHS | |
| HP Omen 16-c0077ng | |
| Lenovo Legion 7 16ARHA7 | |
| Lenovo Legion 5 Pro 16ACH6H (82JQ001PGE) | |
| Lenovo Legion Slim 7-16IAH 82TF004YGE | |
| Asus ROG Zephyrus Duo 16 GX650RX | |
* ... más pequeño es mejor
Dispositivos de almacenamiento: hasta dos SSD PCIe4 x4
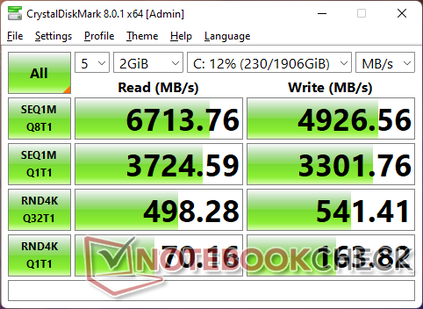
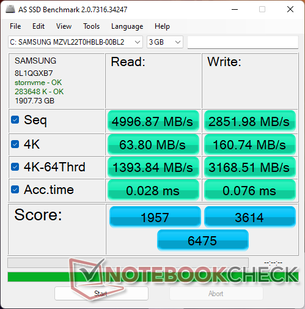
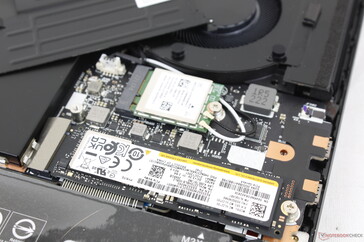
Nuestra unidad de prueba se envía con el mismo Samsung MZVL22T0HBLB PCIe4 x4 NVMe que se encuentra en el MSI GE66 Raider. Sin embargo, el rendimiento parece ser más lento en el Legion que en el MSI en casi todos los casos según múltiples pruebas de SSD. Cuando se ejecuta DiskSpd en un bucle, las tasas de transferencia caen inexplicablemente hasta 3300 MB/s antes de volver a recuperarse, mientras que la misma unidad en el GE66 no muestra este comportamiento.
* ... más pequeño es mejor
Disk Throttling: DiskSpd Read Loop, Queue Depth 8
Rendimiento de la GPU: como una GeForce RTX 3080
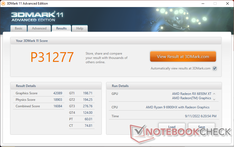
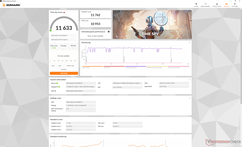
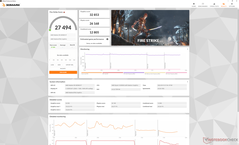
los puntos de referencia de 3DMark clasifican nuestra Radeon RX 6850M XT con un solo dígito de porcentaje respecto a la Radeon RX 6800M que se encuentra en el Asus ROG Strix G15. Por lo tanto, los usuarios no deberían esperar nada más que pequeñas diferencias de rendimiento entre las dos GPUs.
Algunos modelos vienen con la Radeon RX 6700M para un rendimiento gráfico entre un 15 y un 20 por ciento más lento que nuestra 6850M XT. Ambas opciones son más equivalentes a las GeForce RTX 3070 Ti o 3080 que se encuentran en otros portátiles de juego ultradelgados como elMaingear Vector Pro o el Razer Blade 15. ElMSI GS76 es una notable excepción ya que su GPU de baja TGP es más lenta de lo esperado incluso para su categoría de tamaño ultradelgado.
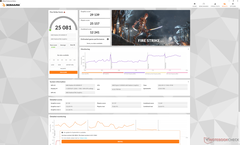
Ejecutar el modo equilibrado en lugar del modo de rendimiento reduce el rendimiento gráfico hasta en un 11 por ciento según 3DMark Fire Strike.
El rendimiento real en juegos está dentro del 10 por ciento del MSI GE66 y su GPU RTX 3080 Ti en la mayoría de los casos. MSI sale ganando en la mayoría de los escenarios, pero las ventajas de la tasa de fotogramas son leves en su mayoría. DOTA 2 es la inusual excepción, ya que el sistema Lenovo parece ser mucho más lento de lo esperado.
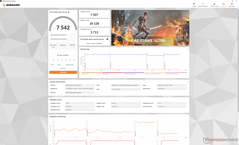
| 3DMark 11 Performance | 31277 puntos | |
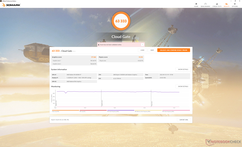
| 3DMark Cloud Gate Standard Score | 63333 puntos | |
| 3DMark Fire Strike Score | 27494 puntos | |
| 3DMark Time Spy Score | 11633 puntos | |
ayuda | ||
| Cyberpunk 2077 1.6 | |
| 1920x1080 Low Preset | |
| Lenovo Legion 7 16ARHA7 | |
| Medio AMD Radeon RX 6850M XT (n=1) | |
| MSI Raider GE66 12UHS | |
| MSI GE67 HX 12UGS | |
| 1920x1080 Medium Preset | |
| MSI Raider GE66 12UHS | |
| Lenovo Legion 7 16ARHA7 | |
| Medio AMD Radeon RX 6850M XT (n=1) | |
| MSI GE67 HX 12UGS | |
| 1920x1080 High Preset | |
| MSI Raider GE66 12UHS | |
| MSI GE67 HX 12UGS | |
| Lenovo Legion 7 16ARHA7 | |
| Medio AMD Radeon RX 6850M XT (n=1) | |
| 1920x1080 Ultra Preset | |
| MSI Raider GE66 12UHS | |
| MSI GE67 HX 12UGS | |
| Lenovo Legion 7 16ARHA7 | |
| Medio AMD Radeon RX 6850M XT (n=1) | |
| 2560x1440 Ultra Preset | |
| MSI Raider GE66 12UHS | |
| MSI GE67 HX 12UGS | |
| Medio AMD Radeon RX 6850M XT (53.6 - 57, n=2) | |
| Lenovo Legion 7 16ARHA7 | |
Witcher 3 FPS Chart
| bajo | medio | alto | ultra | QHD | |
|---|---|---|---|---|---|
| GTA V (2015) | 179.2 | 173.4 | 162.4 | 96.9 | 90 |
| The Witcher 3 (2015) | 384.5 | 251.6 | 208.1 | 118.1 | |
| Dota 2 Reborn (2015) | 147.3 | 110.9 | 113.7 | 95.2 | |
| Final Fantasy XV Benchmark (2018) | 180.6 | 148.5 | 111.9 | 83.8 | |
| X-Plane 11.11 (2018) | 63.3 | 51.2 | 44.1 | ||
| Strange Brigade (2018) | 445 | 303 | 261 | 224 | 161.7 |
| Metro Exodus (2019) | 157.4 | 150.7 | 109.6 | 86.9 | 68.4 |
| Borderlands 3 (2019) | 112.8 | 102.1 | 94.2 | 85.6 | 68.6 |
| Gears Tactics (2020) | 153 | 252.2 | 155.5 | 117.8 | 83.6 |
| Horizon Zero Dawn (2020) | 181 | 159 | 142 | 123 | 100 |
| Watch Dogs Legion (2020) | 120 | 119 | 108 | 83 | 60 |
| Dirt 5 (2020) | 270 | 169.5 | 131.7 | 110.5 | 89.3 |
| Assassin´s Creed Valhalla (2020) | 235 | 159 | 130 | 112 | 82 |
| Hitman 3 (2021) | 211.9 | 192.6 | 192.9 | 191.3 | 136.1 |
| F1 2021 (2021) | 351 | 308 | 297 | 146 | 95 |
| Far Cry 6 (2021) | 123 | 112 | 100 | 99 | 87 |
| Guardians of the Galaxy (2021) | 130 | 131 | 132 | 129 | 103 |
| God of War (2022) | 89 | 95.6 | 94.5 | 78.4 | 64.7 |
| Cyberpunk 2077 1.6 (2022) | 160 | 135.5 | 105.8 | 87.2 | 53.6 |
| F1 22 (2022) | 245 | 241 | 204 | 52 | 31 |
Emisiones
Ruido del sistema - Loud Gamer
Los ventiladores internos son en general muy silenciosos bajo cargas bajas o medias. Cuando se ejecuta 3DMark 06, por ejemplo, el ruido del sistema alcanza un máximo de 26,8 dB(A) al final de la primera escena de 90 segundos del benchmark, contra un fondo silencioso de 22,8 dB(A). Repitiendo esta misma prueba en el MSI GE66 o el Omen 16 resultaría en ventiladores significativamente más ruidosos en el rango de 40 a 50+ dB(A).
El ruido del ventilador se estabiliza en 47,2 dB(A) y 54,3 dB(A) cuando se ejecuta Witcher 3 en los modos Balanceado y Rendimiento, respectivamente. El sistema es, por tanto, significativamente más silencioso cuando se juega en modo equilibrado, por lo que los usuarios pueden considerar sacrificar algo de rendimiento gráfico por ventiladores más silenciosos dependiendo del entorno. El rango de 50 dB(A) es muy ruidoso y desgraciadamente es común entre la mayoría de portátiles para juegos.
Ruido
| Ocioso |
| 23 / 23 / 23 dB(A) |
| Carga |
| 26.8 / 54.2 dB(A) |
 | ||
30 dB silencioso 40 dB(A) audible 50 dB(A) ruidosamente alto |
||
min: | ||
| Lenovo Legion 7 16ARHA7 Radeon RX 6850M XT, R9 6900HX, Samsung PM9A1 MZVL22T0HBLB | MSI Raider GE66 12UHS GeForce RTX 3080 Ti Laptop GPU, i9-12900HK, Samsung PM9A1 MZVL22T0HBLB | Lenovo Legion Slim 7-16IAH 82TF004YGE GeForce RTX 3060 Laptop GPU, i7-12700H, SK Hynix HFS001TEJ9X115N | Asus ROG Zephyrus Duo 16 GX650RX GeForce RTX 3080 Ti Laptop GPU, R9 6900HX, 2x Samsung SSD 980 Pro 2TB MZ-V8P2T0 (RAID 0) | HP Omen 16-c0077ng Radeon RX 6600M, R7 5800H, Samsung PM981a MZVLB1T0HBLR | Lenovo Legion 5 Pro 16ACH6H (82JQ001PGE) GeForce RTX 3070 Laptop GPU, R7 5800H, WDC PC SN730 SDBPNTY-1T00 | |
|---|---|---|---|---|---|---|
| Noise | -24% | -8% | -15% | -35% | -6% | |
| apagado / medio ambiente * (dB) | 22.8 | 26 -14% | 23 -1% | 26 -14% | 25 -10% | 23 -1% |
| Idle Minimum * (dB) | 23 | 27 -17% | 23 -0% | 26 -13% | 25 -9% | 25 -9% |
| Idle Average * (dB) | 23 | 30 -30% | 23 -0% | 27 -17% | 31.2 -36% | 25 -9% |
| Idle Maximum * (dB) | 23 | 39 -70% | 23 -0% | 29 -26% | 33.8 -47% | 25 -9% |
| Load Average * (dB) | 26.8 | 45 -68% | 43.7 -63% | 41 -53% | 55.4 -107% | 35.5 -32% |
| Witcher 3 ultra * (dB) | 54.3 | 45 17% | 51.7 5% | 48 12% | 46.67 14% | |
| Load Maximum * (dB) | 54.2 | 47 13% | 52 4% | 50 8% | 56 -3% | 50.35 7% |
* ... más pequeño es mejor
Temperatura
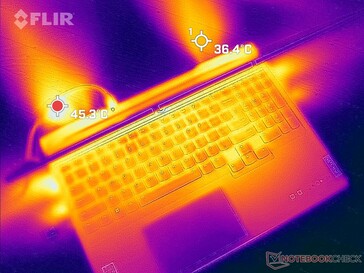
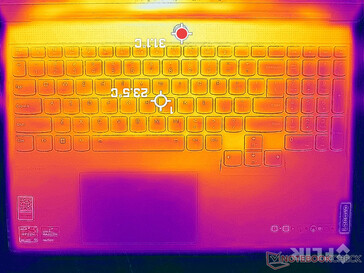
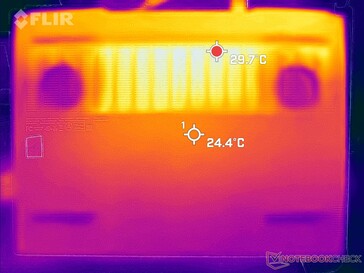
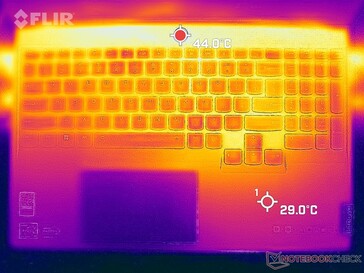
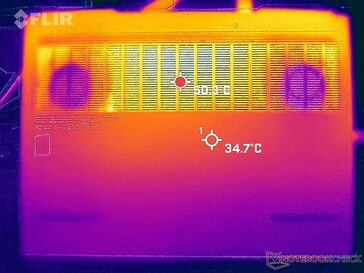
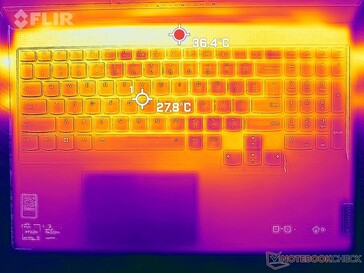
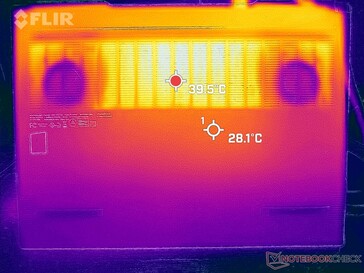
Los puntos calientes de la temperatura de la superficie pueden alcanzar hasta 46 C y 49 C en la parte superior e inferior, respectivamente, cuando se juega durante mucho tiempo. Estos puntos calientes están, afortunadamente, hacia la parte trasera y lejos de las teclas del teclado. En comparación, elMSI Raider GE66 puede alcanzar temperaturas mucho más cálidas de hasta 54 C a 62 C cuando está bajo cargas similares. La gran cantidad de rejillas de ventilación hacen un buen trabajo manteniendo el sistema relativamente fresco a pesar del fino factor de forma.
Tenga en cuenta que el sistema es más caliente cuando se ejecuta Witcher 3 que cuando se ejecuta Prime95 y FurMark simultáneamente. Estos resultados coinciden con nuestras observaciones sobre el consumo de energía, donde Witcher 3 en realidad, exige más energía de la red eléctrica que Prime95 y FurMark.
(+) La temperatura máxima en la parte superior es de 37.2 °C / 99 F, frente a la media de 40.4 °C / 105 F, que oscila entre 21.2 y 68.8 °C para la clase Gaming.
(±) El fondo se calienta hasta un máximo de 43 °C / 109 F, frente a la media de 43.3 °C / 110 F
(+) En reposo, la temperatura media de la parte superior es de 29.7 °C / 85# F, frente a la media del dispositivo de 33.9 °C / 93 F.
(-) Jugando a The Witcher 3, la temperatura media de la parte superior es de 41 °C / 106 F, frente a la media del dispositivo de 33.9 °C / 93 F.
(±) El reposamanos y el touchpad pueden calentarse mucho al tacto con un máximo de 38 °C / 100.4 F.
(-) La temperatura media de la zona del reposamanos de dispositivos similares fue de 28.8 °C / 83.8 F (-9.2 °C / -16.6 F).
| Lenovo Legion 7 16ARHA7 AMD Ryzen 9 6900HX, AMD Radeon RX 6850M XT | MSI Raider GE66 12UHS Intel Core i9-12900HK, NVIDIA GeForce RTX 3080 Ti Laptop GPU | Lenovo Legion Slim 7-16IAH 82TF004YGE Intel Core i7-12700H, NVIDIA GeForce RTX 3060 Laptop GPU | Asus ROG Zephyrus Duo 16 GX650RX AMD Ryzen 9 6900HX, NVIDIA GeForce RTX 3080 Ti Laptop GPU | HP Omen 16-c0077ng AMD Ryzen 7 5800H, AMD Radeon RX 6600M | Lenovo Legion 5 Pro 16ACH6H (82JQ001PGE) AMD Ryzen 7 5800H, NVIDIA GeForce RTX 3070 Laptop GPU | |
|---|---|---|---|---|---|---|
| Heat | -23% | -20% | -9% | 1% | -19% | |
| Maximum Upper Side * (°C) | 37.2 | 54 -45% | 48.3 -30% | 45 -21% | 40.6 -9% | 50 -34% |
| Maximum Bottom * (°C) | 43 | 65 -51% | 55.3 -29% | 50 -16% | 36 16% | 55 -28% |
| Idle Upper Side * (°C) | 34 | 30 12% | 35.7 -5% | 33 3% | 31.3 8% | 34 -0% |
| Idle Bottom * (°C) | 32.8 | 35 -7% | 37.6 -15% | 33 -1% | 36 -10% | 37 -13% |
* ... más pequeño es mejor
Prueba de esfuerzo - GPU TGP de 140 W
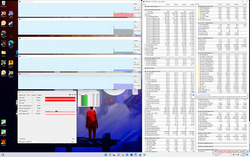
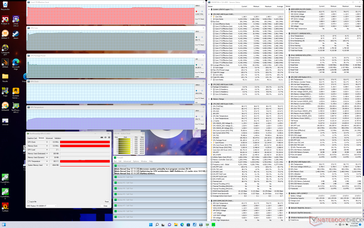
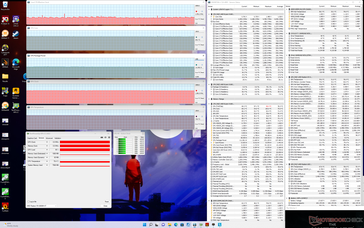
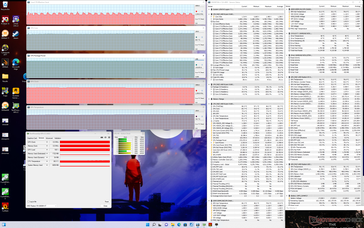
La velocidad de reloj de la CPU, la temperatura y el consumo de energía de la placa aumentan a 3,3 GHz, 86 C y 120 W, respectivamente, al iniciar Prime95. A continuación, el procesador se estabilizaba indefinidamente a 4,2 GHz, 89 C y 99 W después de un par de segundos. En comparación, repitiendo esta misma prueba en el Asus ROG Zephyrus Duo 15 del año pasado con el Ryzen 9 5900HX se vería una velocidad de reloj de la CPU en un rango similar de 4,2 GHz pero una temperatura del núcleo más fría de 75 C.
Si Priem95 y FurMark se ejecutan simultáneamente, el sistema parece acelerar la GPU en favor de mantener un alto rendimiento de la CPU.
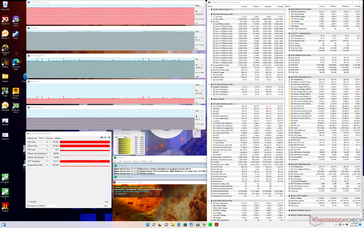
La velocidad de reloj de la GPU, la potencia TGP y la temperatura cuando se ejecuta Witcher 3 en modo Rendimiento se estabilizarían en 2391 MHz, 140 W y 77 C, respectivamente, en comparación con sólo 1982 MHz, 100 W y 70 C en modo Equilibrado. Por lo tanto, los propietarios deben soportar el ruido del ventilador mucho más fuerte del modo Rendimiento si desean explotar la GPU discreta en todo su potencial.
La ejecución con baterías limita el rendimiento, especialmente porque el modo Rendimiento se desactiva automáticamente si no está conectado a la red eléctrica. Una ejecución de Fire Strike con baterías arrojaría unas puntuaciones de Física y Gráficos de 20389 y 12512 puntos, respectivamente, en comparación con los 26168 y 32853 puntos de la red eléctrica.
| Reloj dela CPU (GHz) | Reloj de la GPU (MHz) | Temperatura media dela CPU (°C) | Temperatura media de la GPU (°C) | |
| Sistema en reposo | -- | -- | 39 | 38 |
| Prime95 Stress | 4.1 - 4.2 | -- | 88 | 53 |
| Prime95+ FurMark Stress | 4.2 | 772 | 94 | 60 |
| Witcher 3 Estrés (modoequilibrado) | 1,8 | 1982 | 69 | 70 |
| Witcher 3 Estrés (modorendimiento) | 2,4 - 2,9 | 2391 | 86 | 77 |
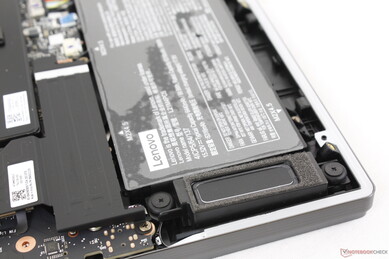
Altavoces
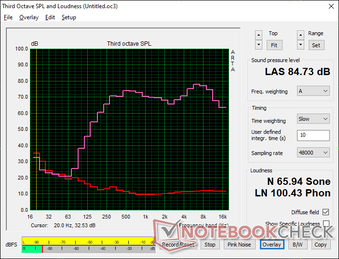
Lenovo Legion 7 16ARHA7 análisis de audio
(+) | los altavoces pueden reproducir a un volumen relativamente alto (#84.7 dB)
Graves 100 - 315 Hz
(±) | lubina reducida - en promedio 14.2% inferior a la mediana
(±) | la linealidad de los graves es media (12.8% delta a frecuencia anterior)
Medios 400 - 2000 Hz
(+) | medios equilibrados - a sólo 1.8% de la mediana
(+) | los medios son lineales (2.1% delta a la frecuencia anterior)
Altos 2 - 16 kHz
(+) | máximos equilibrados - a sólo 4.6% de la mediana
(+) | los máximos son lineales (4.4% delta a la frecuencia anterior)
Total 100 - 16.000 Hz
(+) | el sonido global es lineal (10.9% de diferencia con la mediana)
En comparación con la misma clase
» 7% de todos los dispositivos probados de esta clase eran mejores, 3% similares, 90% peores
» El mejor tuvo un delta de 6%, la media fue 18%, el peor fue ###max##%
En comparación con todos los dispositivos probados
» 6% de todos los dispositivos probados eran mejores, 2% similares, 93% peores
» El mejor tuvo un delta de 4%, la media fue 24%, el peor fue ###max##%
Apple MacBook Pro 16 2021 M1 Pro análisis de audio
(+) | los altavoces pueden reproducir a un volumen relativamente alto (#84.7 dB)
Graves 100 - 315 Hz
(+) | buen bajo - sólo 3.8% lejos de la mediana
(+) | el bajo es lineal (5.2% delta a la frecuencia anterior)
Medios 400 - 2000 Hz
(+) | medios equilibrados - a sólo 1.3% de la mediana
(+) | los medios son lineales (2.1% delta a la frecuencia anterior)
Altos 2 - 16 kHz
(+) | máximos equilibrados - a sólo 1.9% de la mediana
(+) | los máximos son lineales (2.7% delta a la frecuencia anterior)
Total 100 - 16.000 Hz
(+) | el sonido global es lineal (4.6% de diferencia con la mediana)
En comparación con la misma clase
» 0% de todos los dispositivos probados de esta clase eran mejores, 0% similares, 100% peores
» El mejor tuvo un delta de 5%, la media fue 17%, el peor fue ###max##%
En comparación con todos los dispositivos probados
» 0% de todos los dispositivos probados eran mejores, 0% similares, 100% peores
» El mejor tuvo un delta de 4%, la media fue 24%, el peor fue ###max##%
Gestión de la energía
Consumo de energía: más exigente que el de Intel
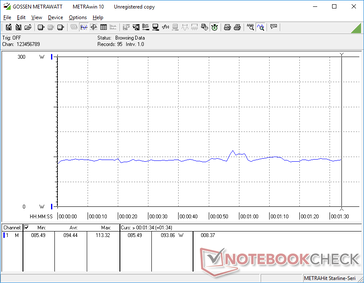
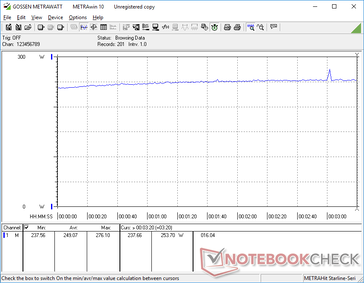
El consumo de energía está en los niveles esperados cuando simplemente está en reposo en el escritorio o cuando ejecuta cargas medias como 3DMark 06. Sin embargo, al jugar, el sistema se vuelve mucho más exigente que la mayoría de los portátiles. Al ejecutar Witcher 3 consumiría 249 W de media frente a los 202 W o 187 W del MSI Raider GE66 o el Asus Zephyrus Duo 16, respectivamente, cada uno con gráficas RTX 3080 y procesadores de la serie H comparables.
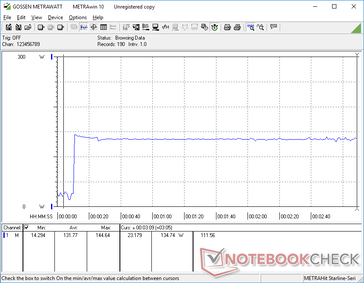
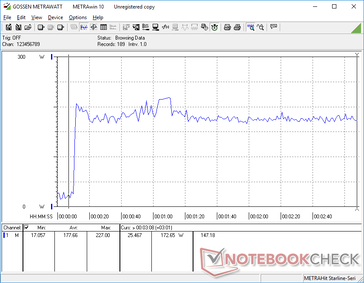
El alto consumo de energía se traslada también al Ryzen 9 6900HX. Al ejecutar Prime95 en un monitor externo, nuestro Lenovo consumía una media de 135 W, frente a los 90 W del MSI Raider con Core i9-12900HK. En otras palabras, el sistema MSI con tecnología Intel exige menos de la toma de corriente mientras sigue proporcionando un rendimiento multihilo entre un 10 y un 15 por ciento más rápido que nuestro Lenovo.
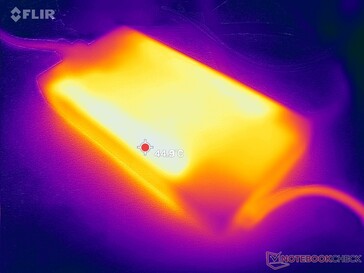
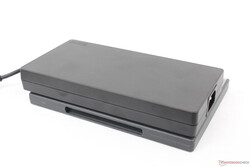
Podemos registrar un consumo máximo temporal de 276 W del adaptador de CA de 300 W de tamaño medio (~20 x 10 x 2.6 cm) cuando se ejecuta Witcher 3 en el modo de rendimiento. El consumo es menor cuando se ejecuta Prime95 y FurMark simultáneamente, como muestran las capturas de pantalla de abajo, debido a la ralentización de la GPU si cada una de ellas está al 100% de utilización.
| Off / Standby | |
| Ocioso | |
| Carga |
|
Clave:
min: | |
| Lenovo Legion 7 16ARHA7 R9 6900HX, Radeon RX 6850M XT, Samsung PM9A1 MZVL22T0HBLB, IPS, 2560x1600, 16" | MSI Raider GE66 12UHS i9-12900HK, GeForce RTX 3080 Ti Laptop GPU, Samsung PM9A1 MZVL22T0HBLB, IPS, 3840x2160, 15.6" | Asus ROG Zephyrus Duo 16 GX650RX R9 6900HX, GeForce RTX 3080 Ti Laptop GPU, 2x Samsung SSD 980 Pro 2TB MZ-V8P2T0 (RAID 0), IPS-Level, 3840x2400, 16" | HP Omen 16-c0077ng R7 5800H, Radeon RX 6600M, Samsung PM981a MZVLB1T0HBLR, IPS, 2560x1440, 16.1" | Lenovo Legion 5 Pro 16ACH6H (82JQ001PGE) R7 5800H, GeForce RTX 3070 Laptop GPU, WDC PC SN730 SDBPNTY-1T00, IPS, 2560x1600, 16" | Aorus 5 KB i7-10750H, GeForce RTX 2060 Mobile, ADATA XPG SX8200 Pro (ASX8200PNP-512GT), IPS, 1920x1080, 15.6" | |
|---|---|---|---|---|---|---|
| Power Consumption | -8% | -19% | -2% | 15% | 17% | |
| Idle Minimum * (Watt) | 9.9 | 16 -62% | 19 -92% | 12 -21% | 10.45 -6% | 8 19% |
| Idle Average * (Watt) | 22 | 19 14% | 24 -9% | 12.8 42% | 14.92 32% | 12 45% |
| Idle Maximum * (Watt) | 23.1 | 26 -13% | 31 -34% | 18.5 20% | 16.02 31% | 21 9% |
| Load Average * (Watt) | 94.4 | 110 -17% | 104 -10% | 190 -101% | 119.65 -27% | 128 -36% |
| Witcher 3 ultra * (Watt) | 249 | 202 19% | 186.5 25% | 194 22% | 174.9 30% | 138 45% |
| Load Maximum * (Watt) | 276 | 242 12% | 256 7% | 200 28% | 187.26 32% | 217 21% |
* ... más pequeño es mejor
Power Consumption Witcher 3 / Stresstest
Power Consumption external Monitor
Duración de la batería - Problemas de ahorro de energía
La duración de la WLAN en el perfil de energía equilibrado es decente y comparable a la del Asus ROG Zephyrus Duo 16 con casi 7,5 horas. La duración de la batería es anormalmente más corta si está en modo de ahorro de energía, lo que creemos que podría ser un error en algunos portátiles AMD Legion
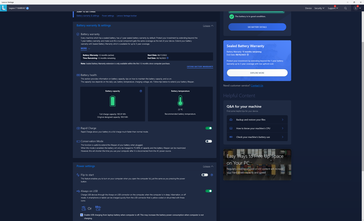
La carga de vacío a lleno es relativamente rápida, de 1 a 1,5 horas si se activa la carga rápida a través del software Lenovo Vantage. El sistema también puede recargarse con adaptadores USB-C de terceros, aunque a un ritmo mucho más lento.
| Lenovo Legion 7 16ARHA7 R9 6900HX, Radeon RX 6850M XT, 99 Wh | MSI Raider GE66 12UHS i9-12900HK, GeForce RTX 3080 Ti Laptop GPU, 99 Wh | Asus ROG Zephyrus Duo 16 GX650RX R9 6900HX, GeForce RTX 3080 Ti Laptop GPU, 90 Wh | HP Omen 16-c0077ng R7 5800H, Radeon RX 6600M, 70 Wh | Lenovo Legion 5 Pro 16ACH6H (82JQ001PGE) R7 5800H, GeForce RTX 3070 Laptop GPU, 80 Wh | Asus ROG Flow X16 GV601RW-M5082W R9 6900HS, GeForce RTX 3070 Ti Laptop GPU, 90 Wh | |
|---|---|---|---|---|---|---|
| Duración de Batería | -14% | 39% | -16% | 7% | -36% | |
| Reader / Idle (h) | 4.9 | 12.5 155% | 9.1 86% | |||
| WiFi v1.3 (h) | 7.3 | 5.7 -22% | 7.8 7% | 6.1 -16% | 7 -4% | 5.7 -22% |
| Load (h) | 1.8 | 1.7 -6% | 1 -44% | 0.7 -61% | 0.9 -50% | |
| H.264 (h) | 7.1 | 9.3 | 7 | |||
| Witcher 3 ultra (h) | 1.4 | 0.9 |
Pro
Contra
Veredicto - Se juega como un jugador, se ve como una estación de trabajo
Ha tardado en llegar, pero Lenovo ha encontrado por fin su lugar en el mercado de los portátiles para juegos con este último modelo 2022 Legion 7. El diseño del chasis se ha perfeccionado hasta el punto de que puede enfrentarse fácilmente a alternativas de juego ultradelgadas más experimentadas como la Serie MSI GS, La serie Zephyrus S de Asuse incluso la serie Serie Razer Blade en muchos aspectos. El aspecto más elegante no sacrifica otras características igualmente importantes, como las opciones de puerto, el teclado numérico, el esqueleto metálico rígido, el rendimiento TDP y TGP, y la facilidad de mantenimiento. Es un poco más pesado de lo que parece, pero la sensación de densidad no tiene por qué disuadir a los jugadores.
El 2022 Legion 7 16 es un homerun para Lenovo en términos de aspecto y diseño. El hardware completamente AMD también se mantiene bien frente a algunos de los portátiles de juego Intel-Nvidia más rápidos que hay actualmente en el mercado.
En cuanto a la CPU Ryzen 9 6900HX y la GPU Radeon RX 6850M XT, sólo son un pelo más rápidas que las 5900HX y 6800M que se encuentran en portátiles mucho más baratos como el Asus ROG Strix G15. El rendimiento general está sólo ligeramente por detrás de la mayoría de los portátiles GeForce RTX 3080 Ti, por lo que sigue siendo una potente máquina de juegos.
El consumo de energía cuando se juega es un contratiempo clave para el sistema todo-AMD Legion ya que es más alto que muchas alternativas Intel-Nvidia actualmente en el mercado. No es una buena imagen para Lenovo ni para AMD que el sistema demande más energía y que funcione más lentamente que la competencia con un menor rendimiento por vatio. Las opciones de pantalla OLED y algunas correcciones de errores OTA en la línea no estarían mal también.
Precio y disponibilidad
El Legion 7 16ARHA7 todavía no está disponible en los canales de terceros en el momento de la publicación. La configuración actual aún no se envía a los clientes. Recomendamos consultar la página oficial de productos de Lenovo https://www.lenovo.com/us/en/p/laptops/legion-laptops/legion-7-series/legion-7-gen-7-(16-inch-amd)/len101g0017 para ver las actualizaciones. La única configuración disponible actualmente es la SKU de Ryzen 7 y Radeon RX 6700M de menor tamaño por $2380 USD.
Lenovo Legion 7 16ARHA7
- 09/14/2022 v7 (old)
Allen Ngo


