Análisis del portátil Gigabyte U4 UD: Ligero con mucho potencial que se desperdicia a veces
Con el U4 UD, Gigabyte presenta un interesante subportátil con pantalla Full HD de 14 pulgadas y Windows 11 en el rango de precios por debajo de los 1.000 euros. Una de sus cualidades únicas es el aún relativamente nuevo Intel Core i7-1195G7que sólo hemos visto en un modelo de pruebas hasta ahora. No hay solución gráfica dedicada, y la tarjeta gráficaIntel Iris Xe Graphics G7 96EUs Se usa en su lugar. Además, el fabricante equipa el dispositivo con 16 GB de RAM DDR4 y una sólida selección de puertos.
Comparamos el Gigabyte U4 UD con el ligeramente más caroMSI Prestige 14 Evo A11MO-026US que tiene la misma combinación de CPU/GPU. Además, elHP Envy 13-ba1475ng con el ligeramente más débili7-1165G7 y el dedicadoGeForce MX450 así como elDell Inspiron 13 5301-0D0XN con la combinación aún más débil i5-1135G7/Iris Xe G7 80EUs, ambos pertenecientes al mismo rango de precios, también se han añadido a la mezcla. En cuanto a la duración de la batería, elLG Gram 14Z90P-G.AA79G con el i7-1165G7 y el Iris Xe G7 96EUs es el competidor más duro.
Possible contenders in comparison
Valoración | Fecha | Modelo | Peso | Altura | Tamaño | Resolución | Precio |
|---|---|---|---|---|---|---|---|
| 84.4 % v7 (old) | 11/2021 | Gigabyte U4 UD i7-1195G7, Iris Xe G7 96EUs | 958 g | 17 mm | 14.00" | 1920x1080 | |
| 85.3 % v7 (old) | 08/2021 | MSI Prestige 14 Evo A11MO-026US i7-1195G7, Iris Xe G7 96EUs | 1.2 kg | 16 mm | 14.00" | 1920x1080 | |
| 83.8 % v7 (old) | 07/2021 | Dell Inspiron 13 5301-0D0XN i5-1135G7, Iris Xe G7 80EUs | 1.1 kg | 16 mm | 13.30" | 1920x1080 | |
| 88.3 % v7 (old) | 05/2021 | LG Gram 14Z90P-G.AA79G i7-1165G7, Iris Xe G7 96EUs | 967 g | 16.8 mm | 14.00" | 1920x1200 | |
| 85.3 % v7 (old) | HP Envy 13-ba1475ng i7-1165G7, GeForce MX450 | 1.3 kg | 17 mm | 13.30" | 1920x1080 |
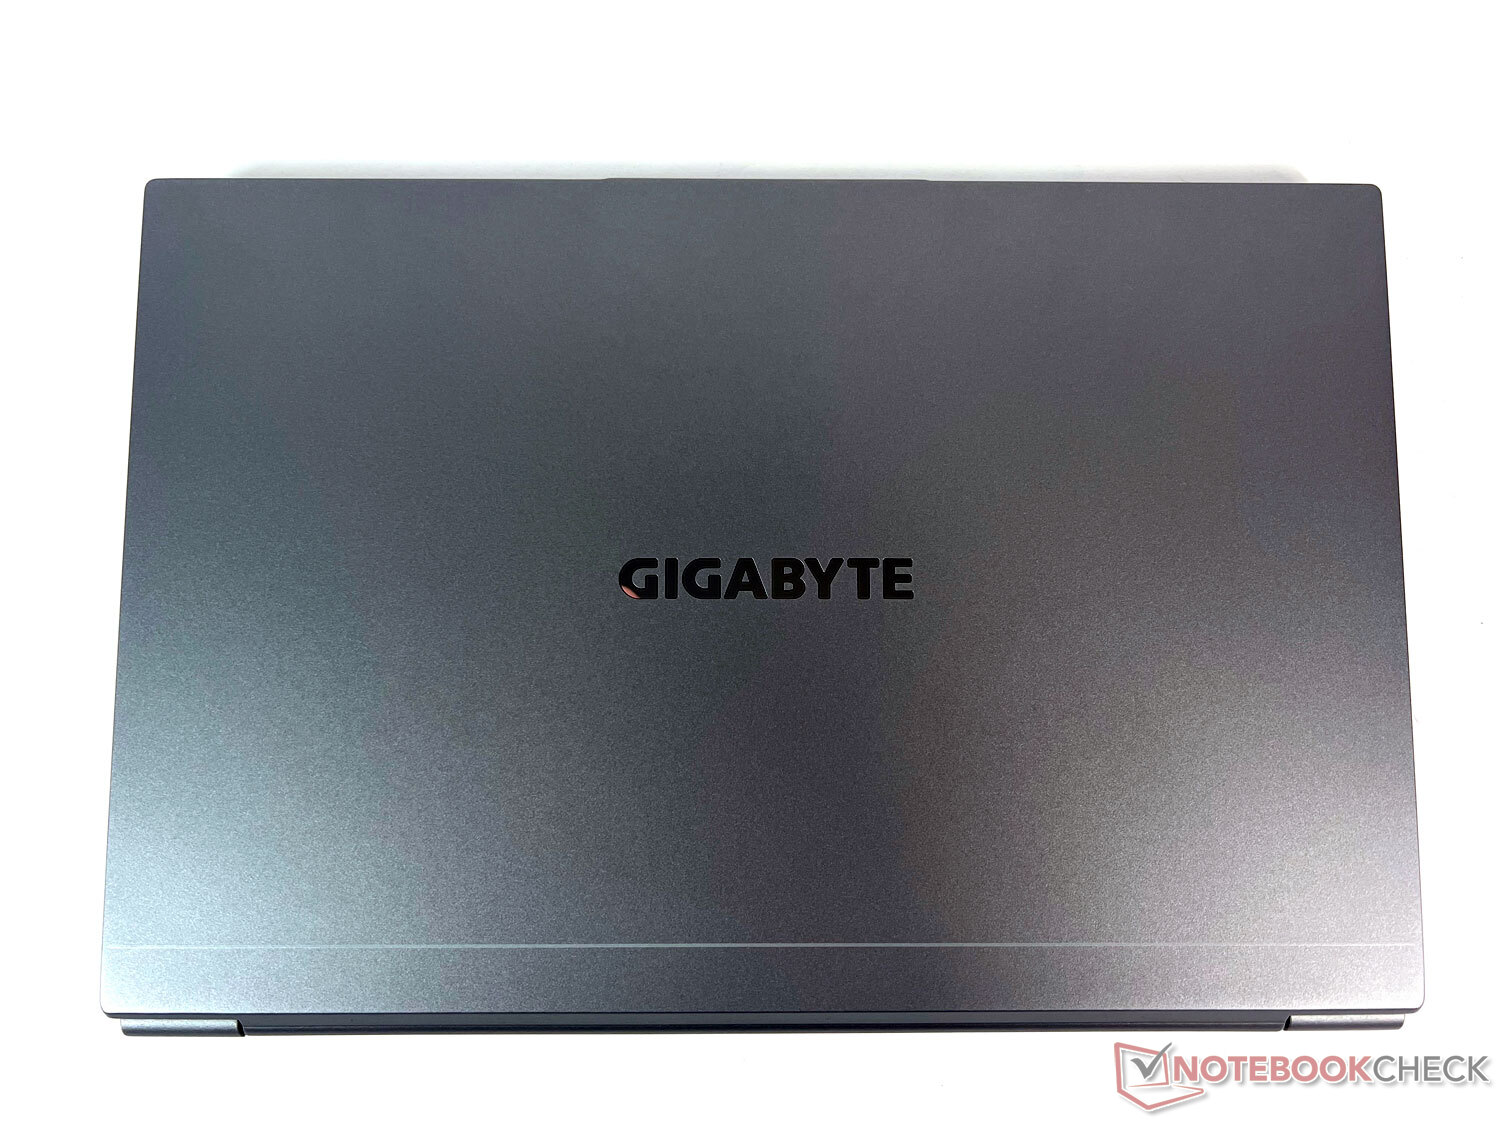
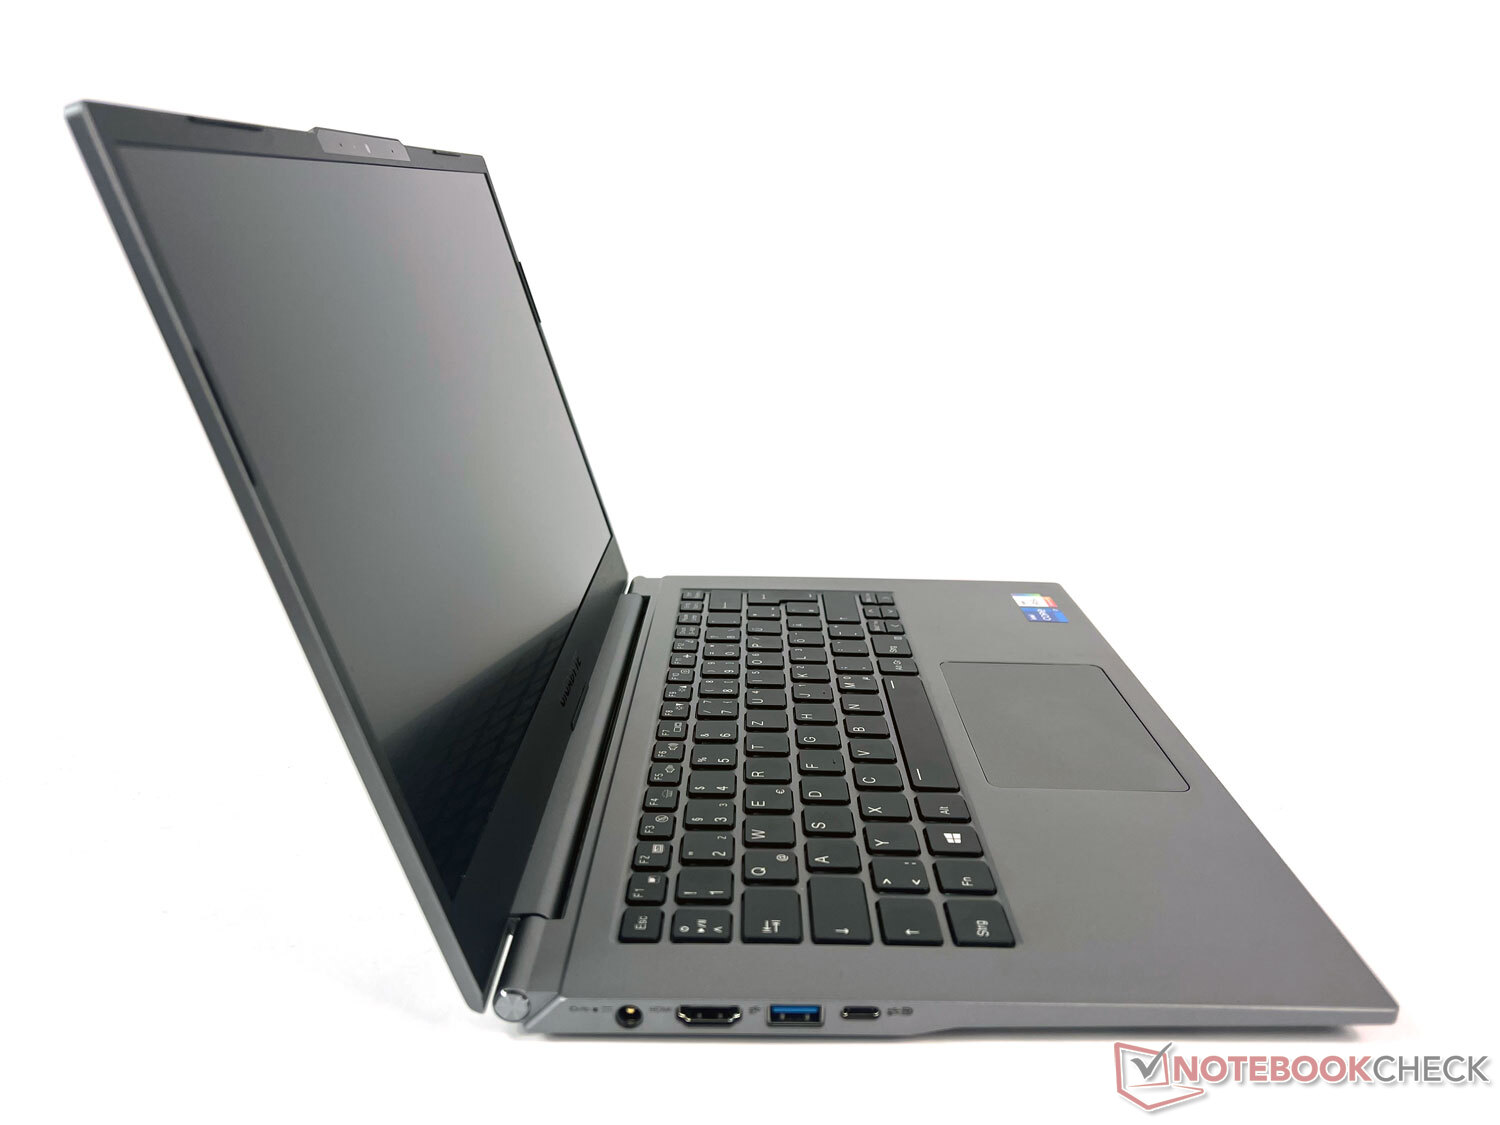
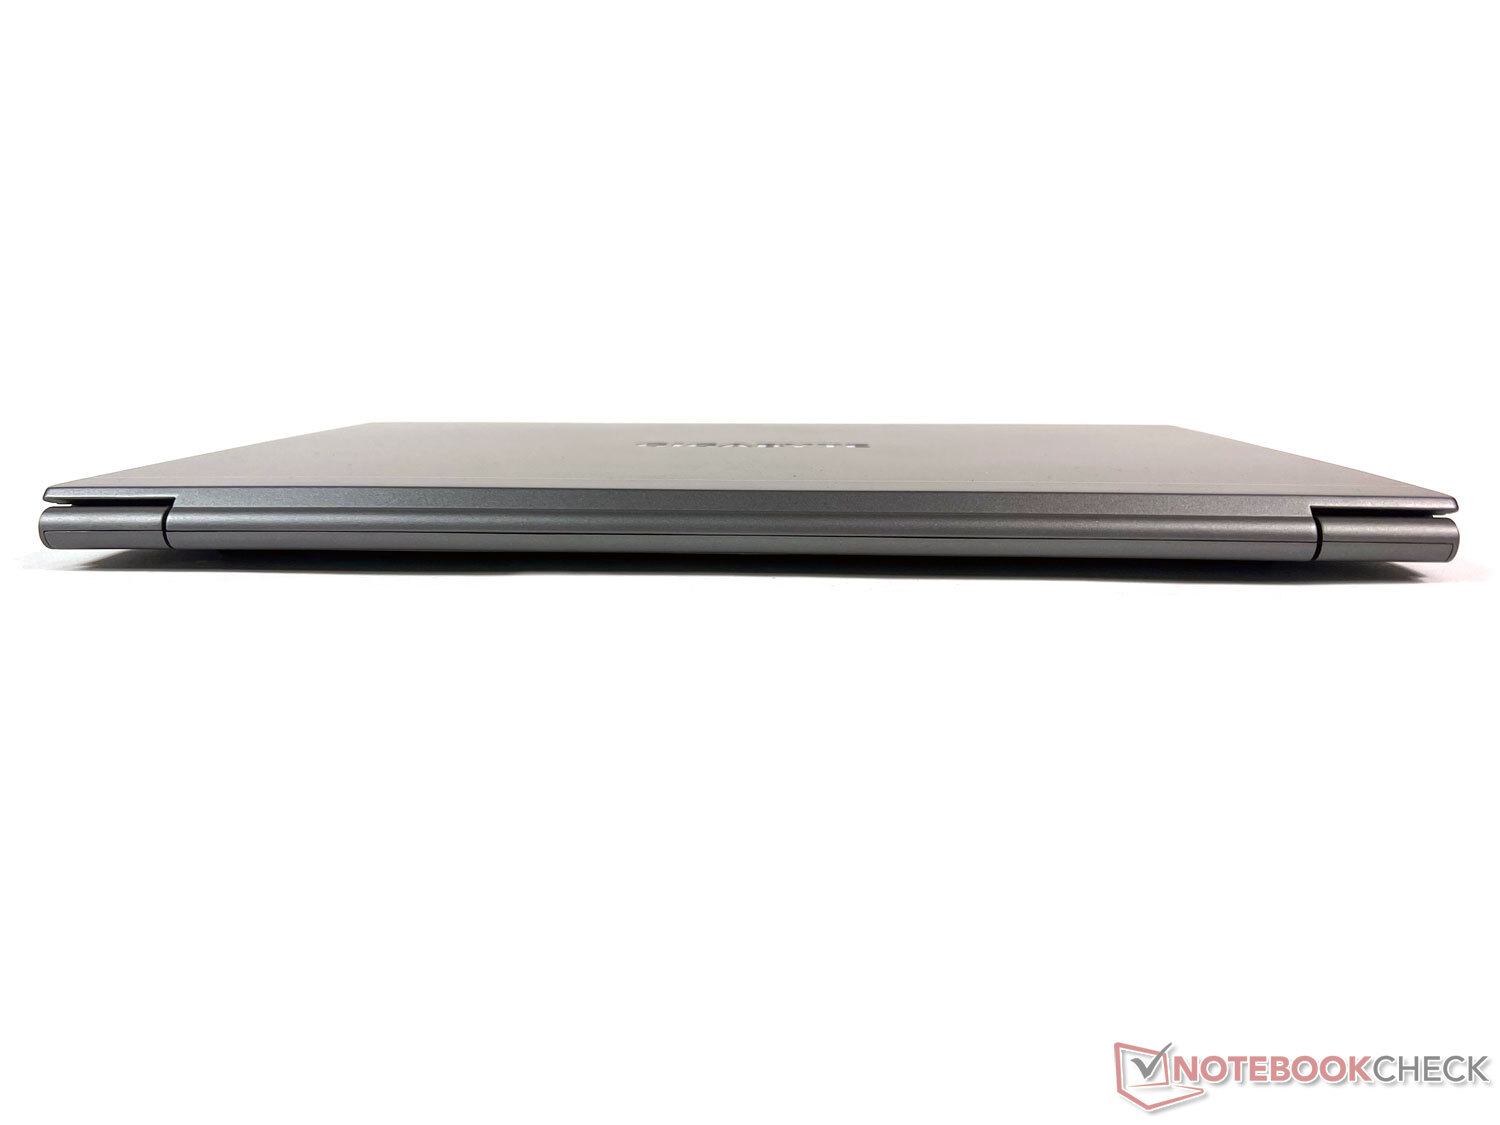
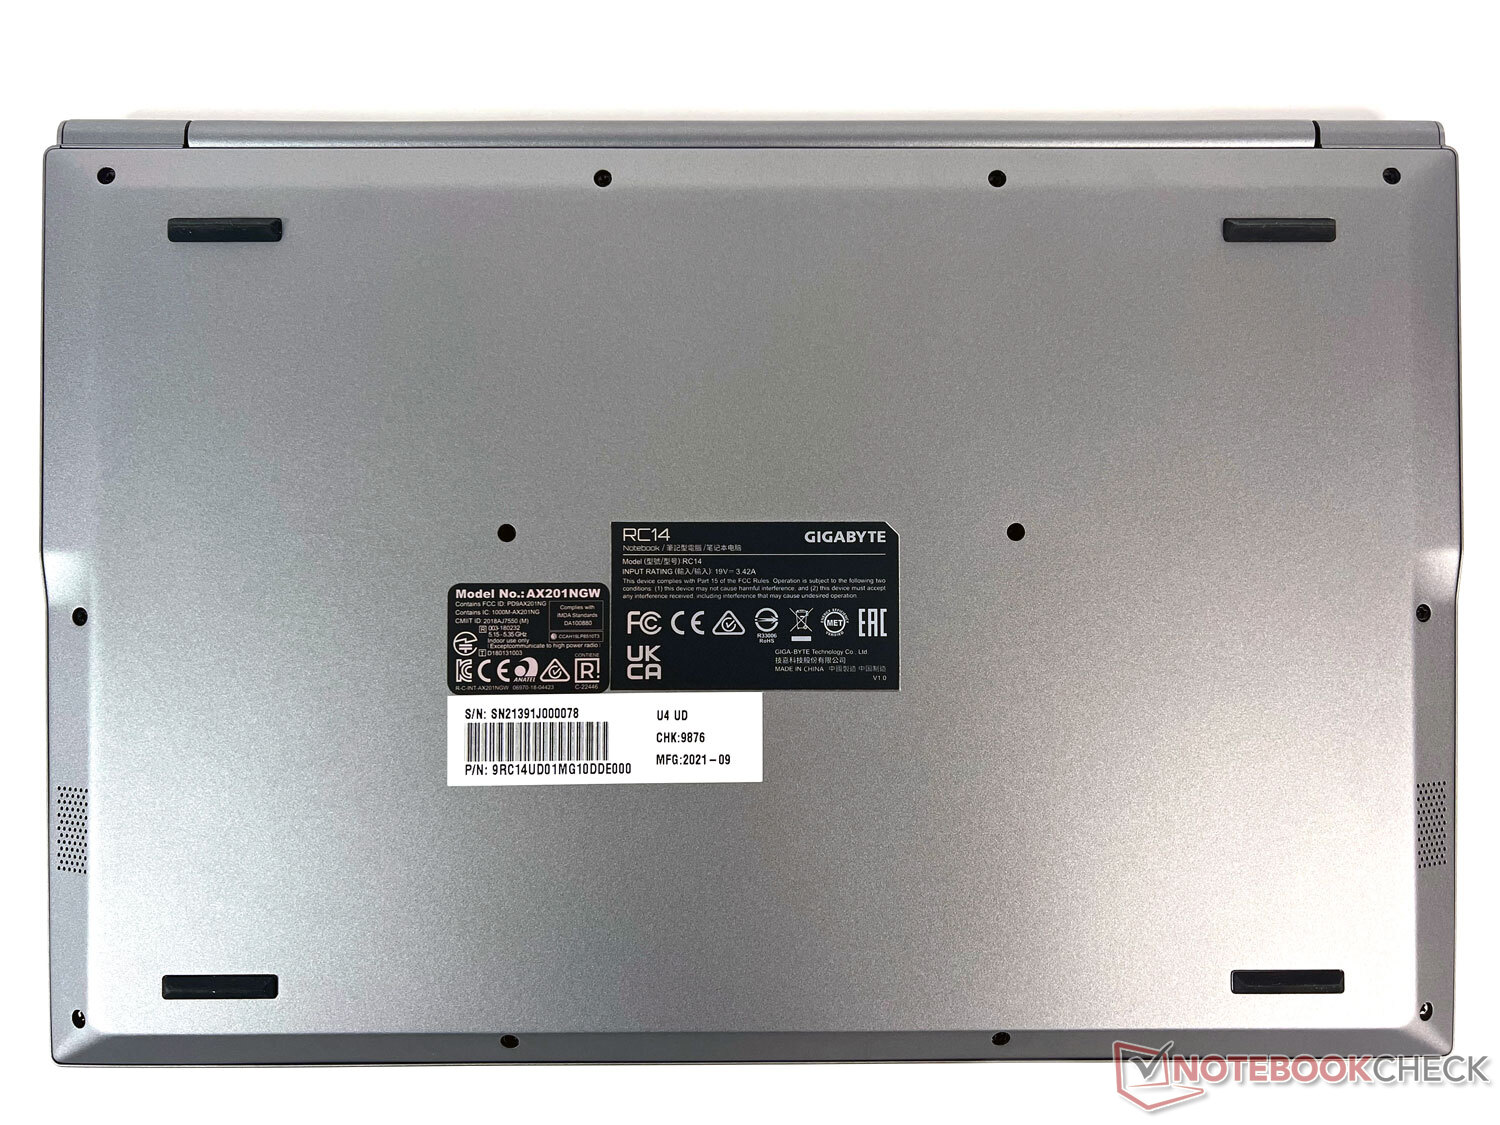
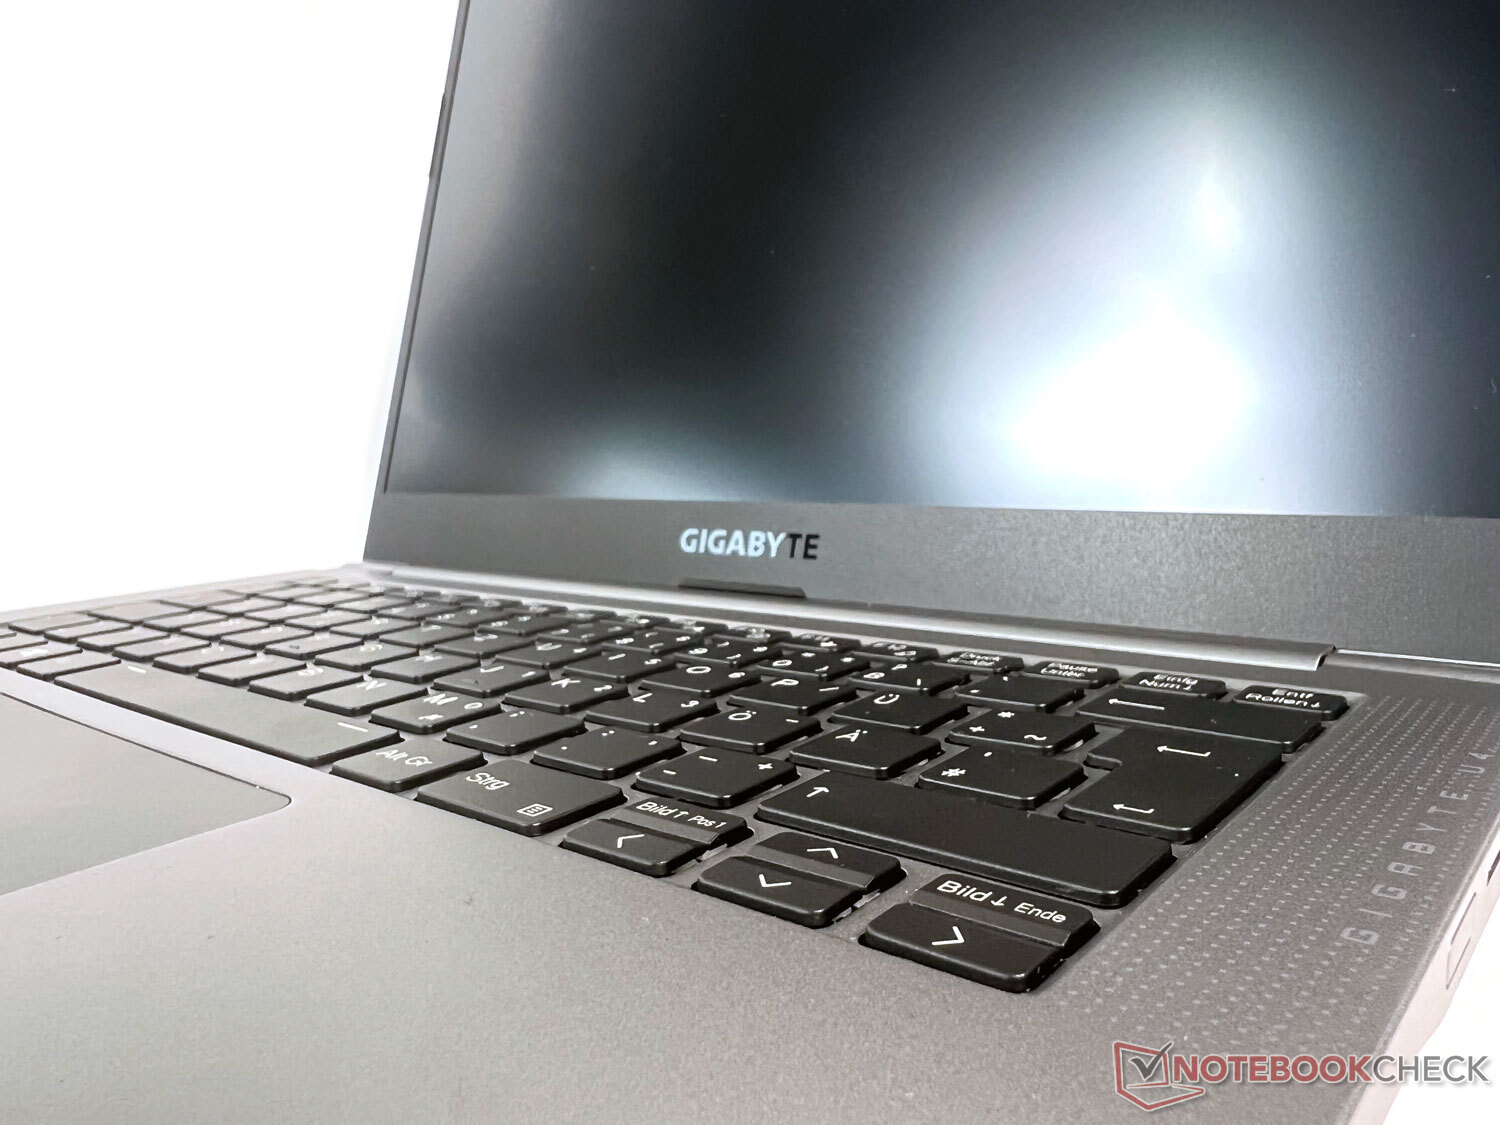
Subportátil muy ligero alojado en una sobria y robusta carcasa de aluminio
El Gigabyte U4 UD está alojado en una carcasa de aluminio de diseño modesto que deja una impresión respetable y de alta calidad. El dispositivo ofrece la suficiente resistencia a la torsión para que pueda ser transportado incluso cuando se sostiene sólo desde una esquina. También cumple la norma militar MIL-STD 810G, lo que significa que el dispositivo está protegido contra las vibraciones, las temperaturas extremas y la humedad.
Las bisagras son tan rígidas que la pantalla abierta apenas experimenta bamboleos o balanceos. Sin embargo, el dispositivo sólo puede abrirse con una mano con mucha habilidad, lo que también se debe al bajo peso
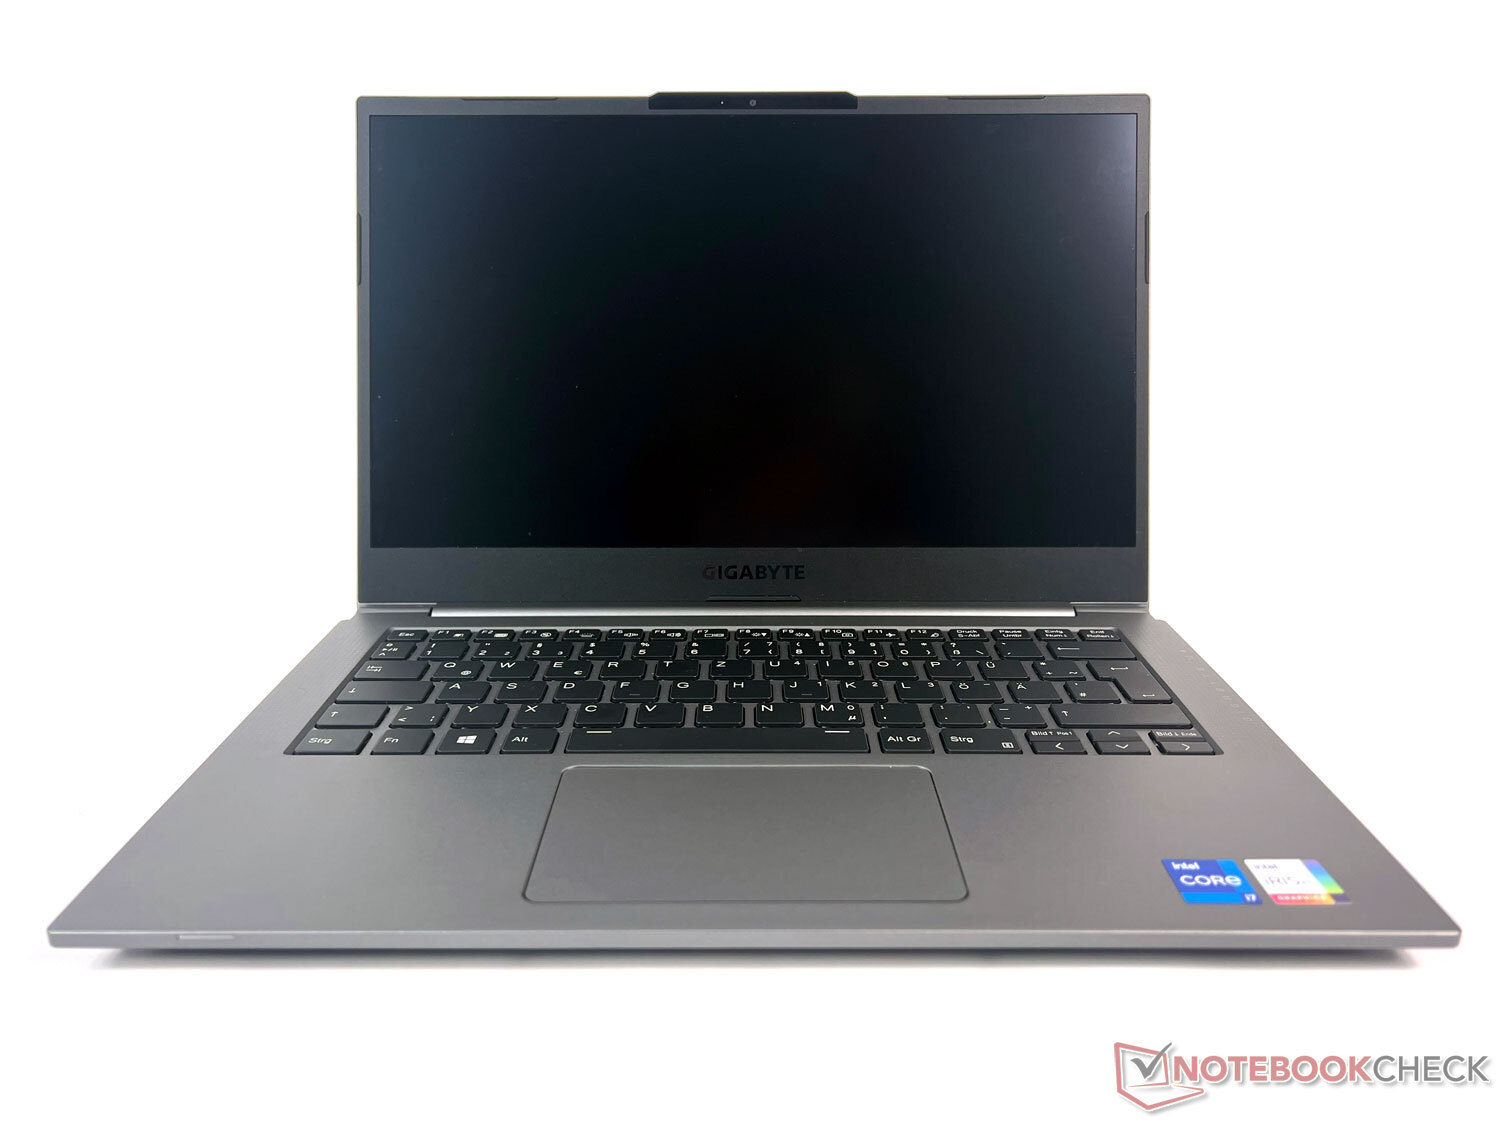
Con algo menos de un kilo, el Gigabyte U4 UD es el portátil más ligero de esta comparativa, justo por delante del LG Gram 14Z90P. Esto es bastante notable, ya que también hay modelos de 13,3 pulgadas. El de 14 pulgadas es el dispositivo más grande en términos de anchura por unos pocos milímetros, pero puede seguir muy bien el ritmo de los otros subportátiles en lo que respecta a la profundidad y el grosor en particular. En general, es un compañero de viaje bastante compacto y, sobre todo, especialmente ligero
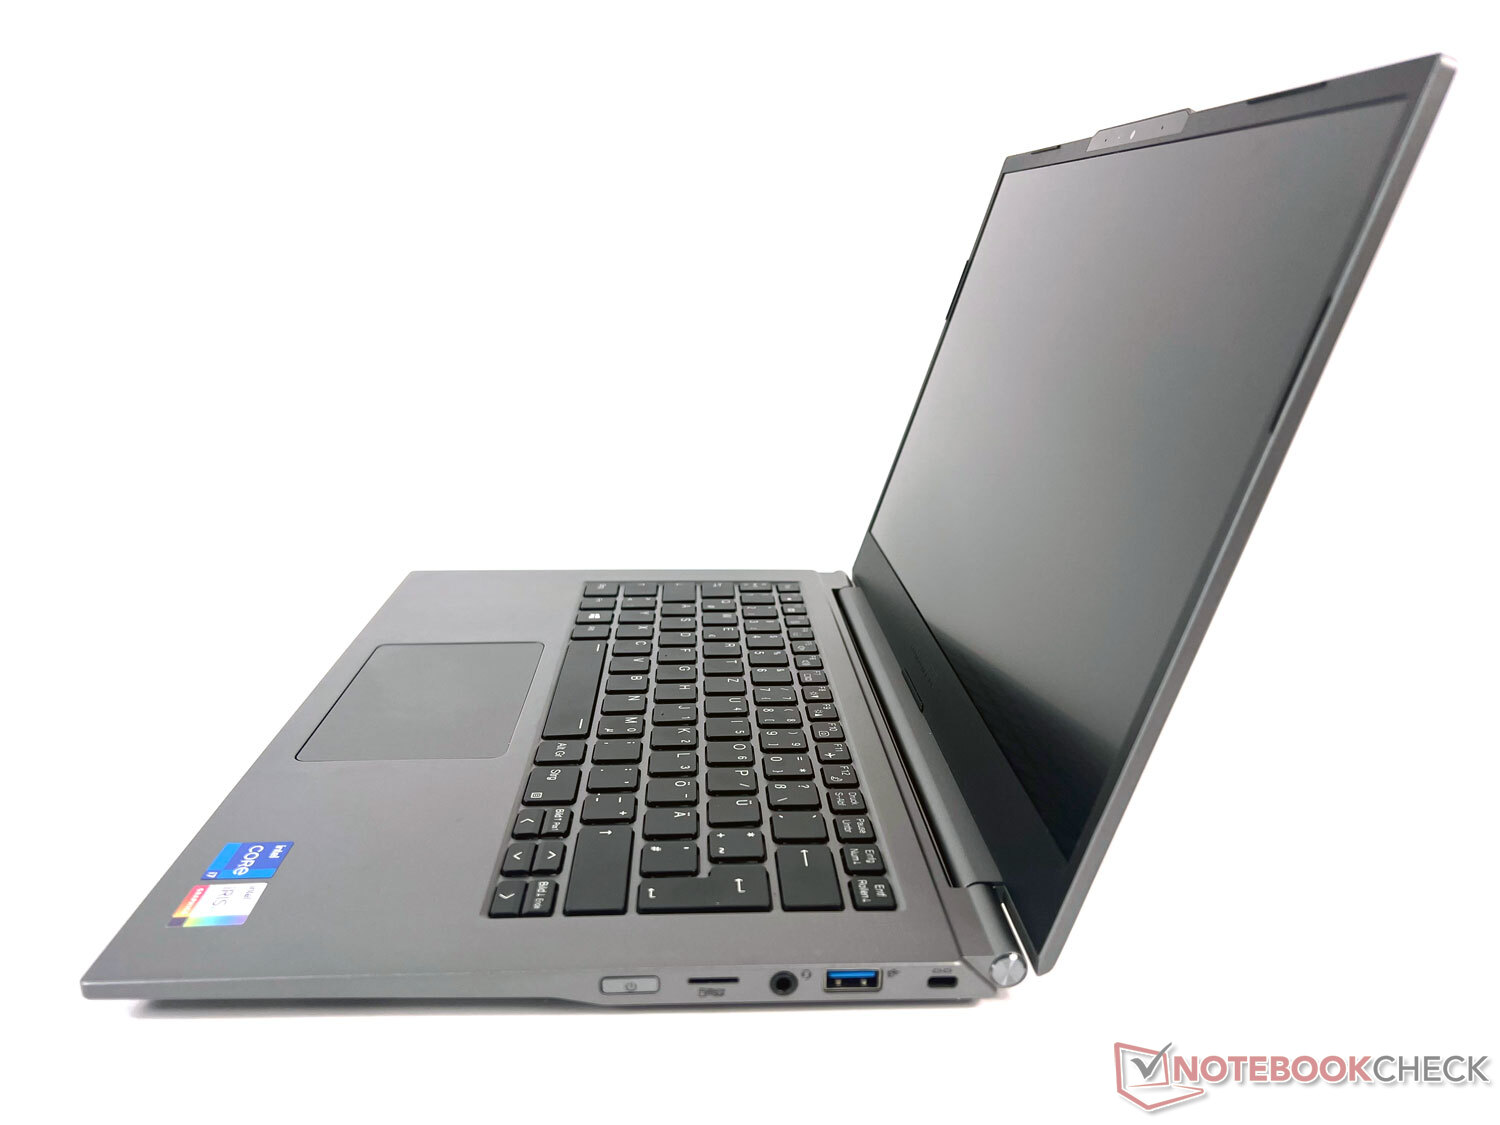
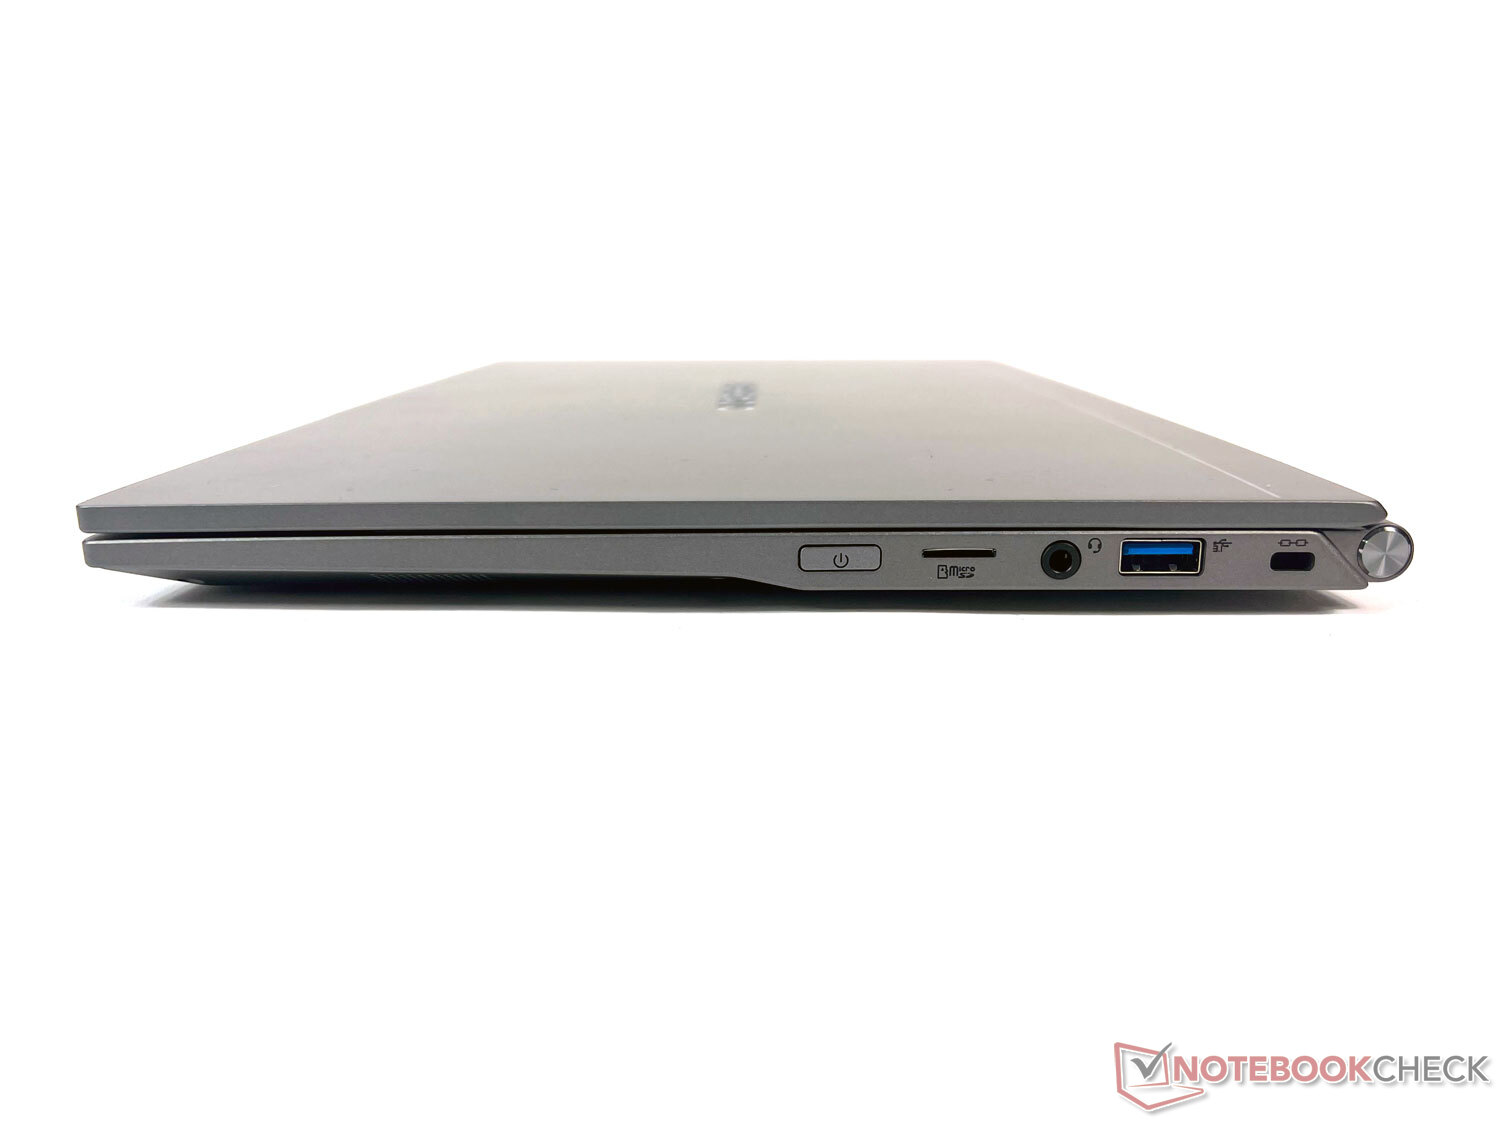
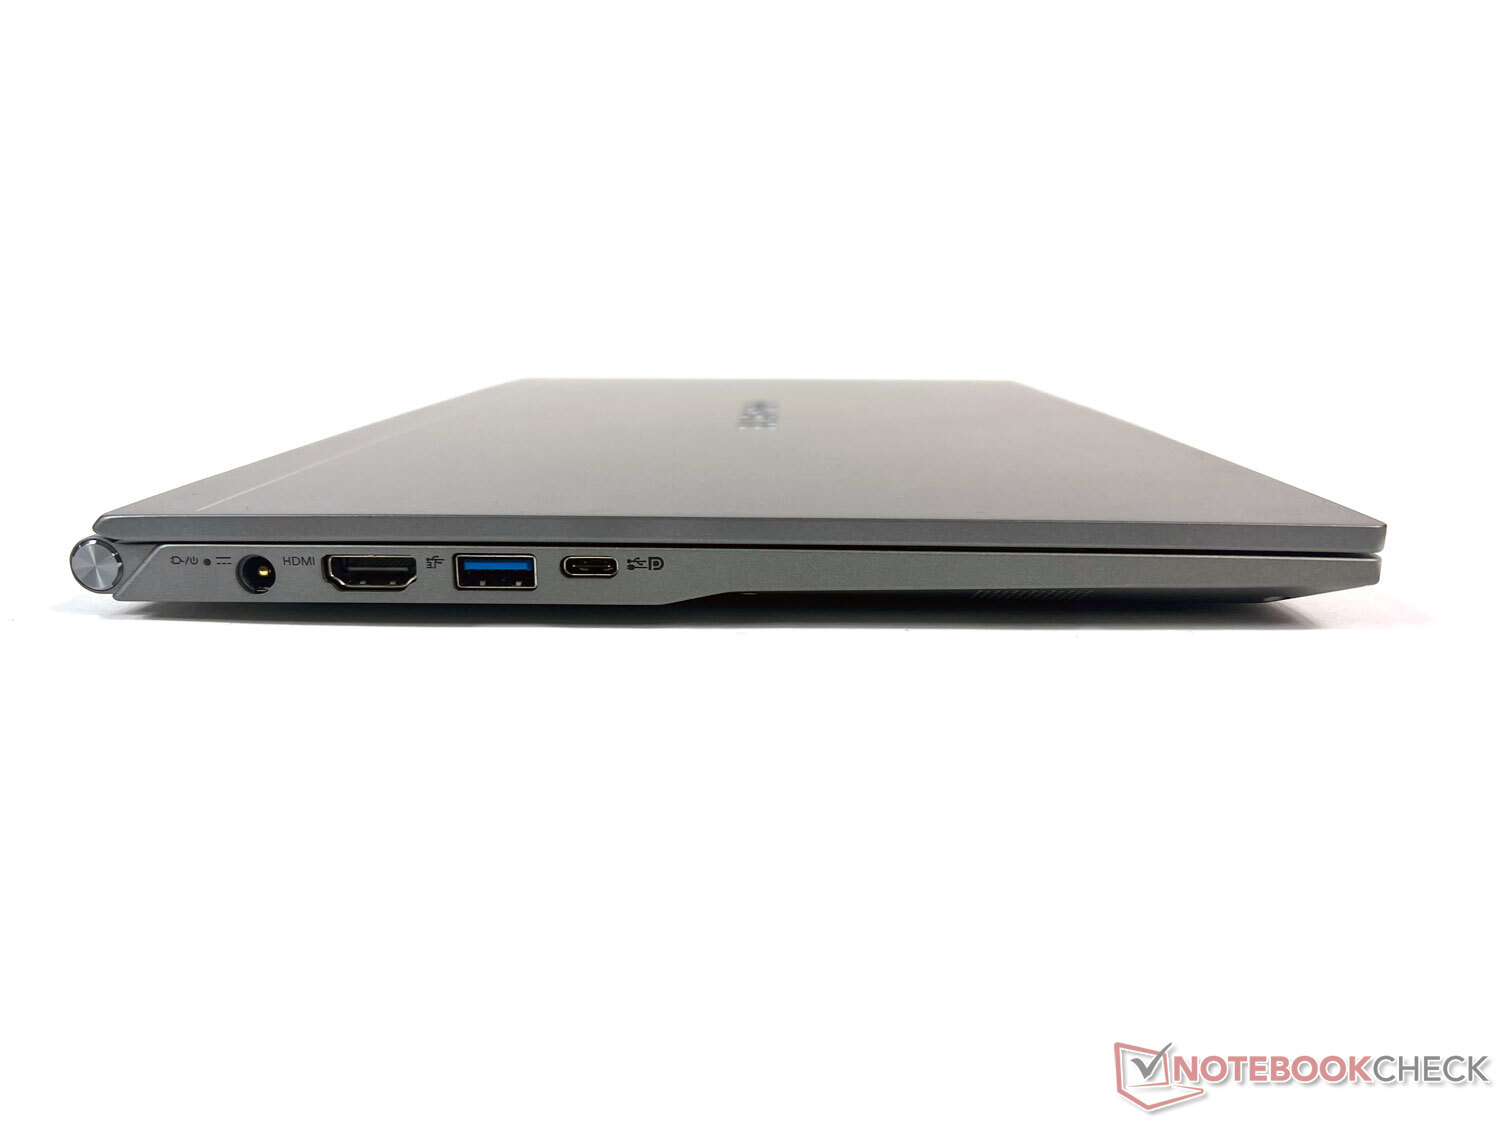
Conectividad: Thunderbolt 4 y altas velocidades de datos
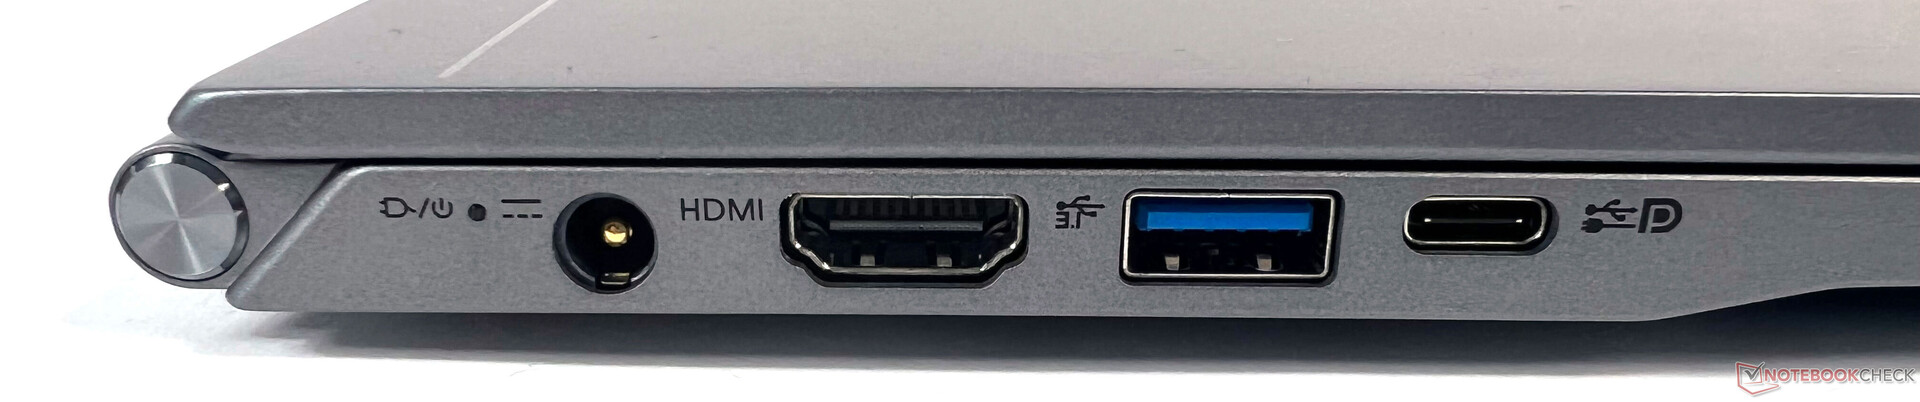
Sin duda, el Gigabyte U4 UD es ante todo un portátil compacto de oficina y multimedia que también queda bien en el escritorio o en el sofá, aparte de cuando se viaja. La configuración de los puertos, que se distribuyen en los lados izquierdo y derecho del dispositivo, está en consonancia con esto también.
Los monitores externos se pueden conectar utilizando los puertos Thunderbolt 4 o HDMI 2.0. Hay un puerto USB-A en cada lado (un puerto USB 3.2 Gen 1 y otro Gen 2), pero por desgracia sólo hay un puerto USB-C en el izquierdo. Además, los puertos están colocados relativamente cerca el uno del otro, por lo que una memoria USB Tipo-A ligeramente más gruesa conectada en el lado izquierdo podría muy bien bloquear el puerto Thunderbolt/USB-C.
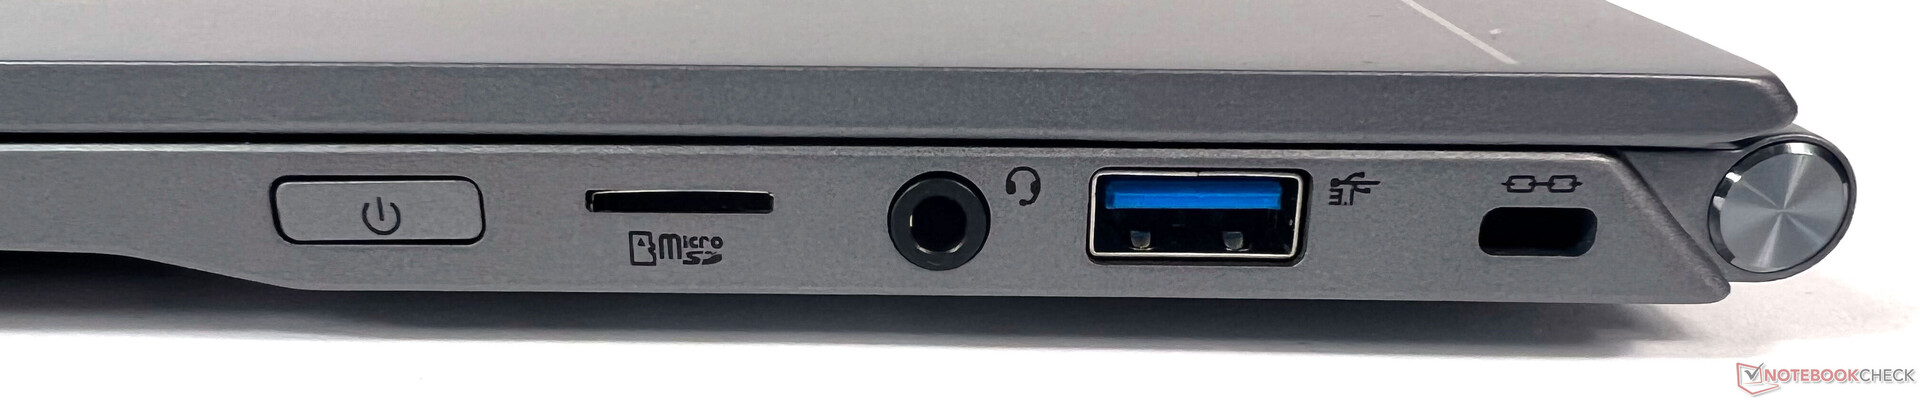
Lector de tarjetas SD
El lector de tarjetas, que por desgracia sólo admite tarjetas microSD y no SD, rinde decentemente en nuestra prueba del Gigabyte U4 UD. Al copiar fotos en formato JPG con una tarjeta de prueba AV PRO microSD V60 de 128 GB, muestra el mejor rendimiento. En la prueba de lectura con un archivo de 1 GB, el lector de tarjetas sigue siendo lo suficientemente rápido para el segundo puesto, justo por detrás del LG Gram, pero también por encima de la media de los subportátiles
| SD Card Reader | |
| average JPG Copy Test (av. of 3 runs) | |
| Gigabyte U4 UD (AV PRO microSD 128 GB V60) | |
| LG Gram 14Z90P-G.AA79G (Toshiba Exceria Pro M501 microSDXC 64GB) | |
| HP Envy 13-ba1475ng (AV Pro V60) | |
| Media de la clase Subnotebook (23.7 - 188, n=9, últimos 2 años) | |
| Dell Inspiron 13 5301-0D0XN (Toshiba Exceria Pro M501 microSDXC 64GB) | |
| maximum AS SSD Seq Read Test (1GB) | |
| Media de la clase Subnotebook (24.9 - 195, n=8, últimos 2 años) | |
| LG Gram 14Z90P-G.AA79G (Toshiba Exceria Pro M501 microSDXC 64GB) | |
| Gigabyte U4 UD (AV PRO microSD 128 GB V60) | |
| HP Envy 13-ba1475ng (AV Pro V60) | |
| Dell Inspiron 13 5301-0D0XN (Toshiba Exceria Pro M501 microSDXC 64GB) | |
Comunicación
El dispositivo también se comporta de forma similar en nuestra prueba Wi-Fi. Lleva una clara ventaja cuando se trata de enviar datos. Sin embargo, sólo consigue el tercer puesto al recibir datos, pero las tasas de datos siguen estando por encima de la media del módulo Wi-Fi AX201
| Networking | |
| iperf3 transmit AX12 | |
| Gigabyte U4 UD | |
| HP Envy 13-ba1475ng | |
| MSI Prestige 14 Evo A11MO-026US | |
| Dell Inspiron 13 5301-0D0XN | |
| Medio Intel Wi-Fi 6 AX201 (49.8 - 1775, n=324) | |
| LG Gram 14Z90P-G.AA79G | |
| iperf3 receive AX12 | |
| HP Envy 13-ba1475ng | |
| MSI Prestige 14 Evo A11MO-026US | |
| Gigabyte U4 UD | |
| Dell Inspiron 13 5301-0D0XN | |
| Medio Intel Wi-Fi 6 AX201 (136 - 1743, n=324) | |
| LG Gram 14Z90P-G.AA79G | |
Cámara web
En cambio, la cámara HD, que por desgracia no puede bloquearse con un obturador mecánico, sólo muestra resultados mediocres. El DeltaE medio de 20 es casi el doble que en el HP Envy 13, lo que significa que la webcam no es muy precisa a la hora de capturar los colores. La imagen es relativamente aburrida en general, pero es suficiente para tareas comunes como las videollamadas - al igual que el micrófono de doble matriz


Seguridad
Además de un puerto de bloqueo Kensington, el Gigabyte U4 UD cuenta con TPM basado en firmware y soporta la tecnología Intel Platform Trust (Intel PTT). Un sensor de huellas dactilares no está disponible, por desgracia
Accesorios
Gigabyte sólo incluye un adaptador de corriente de 65 vatios que pesa unos buenos 200 gramos con el portátil. No se incluye ningún otro accesorio especial para el U4 - y tampoco hay ninguno opcional
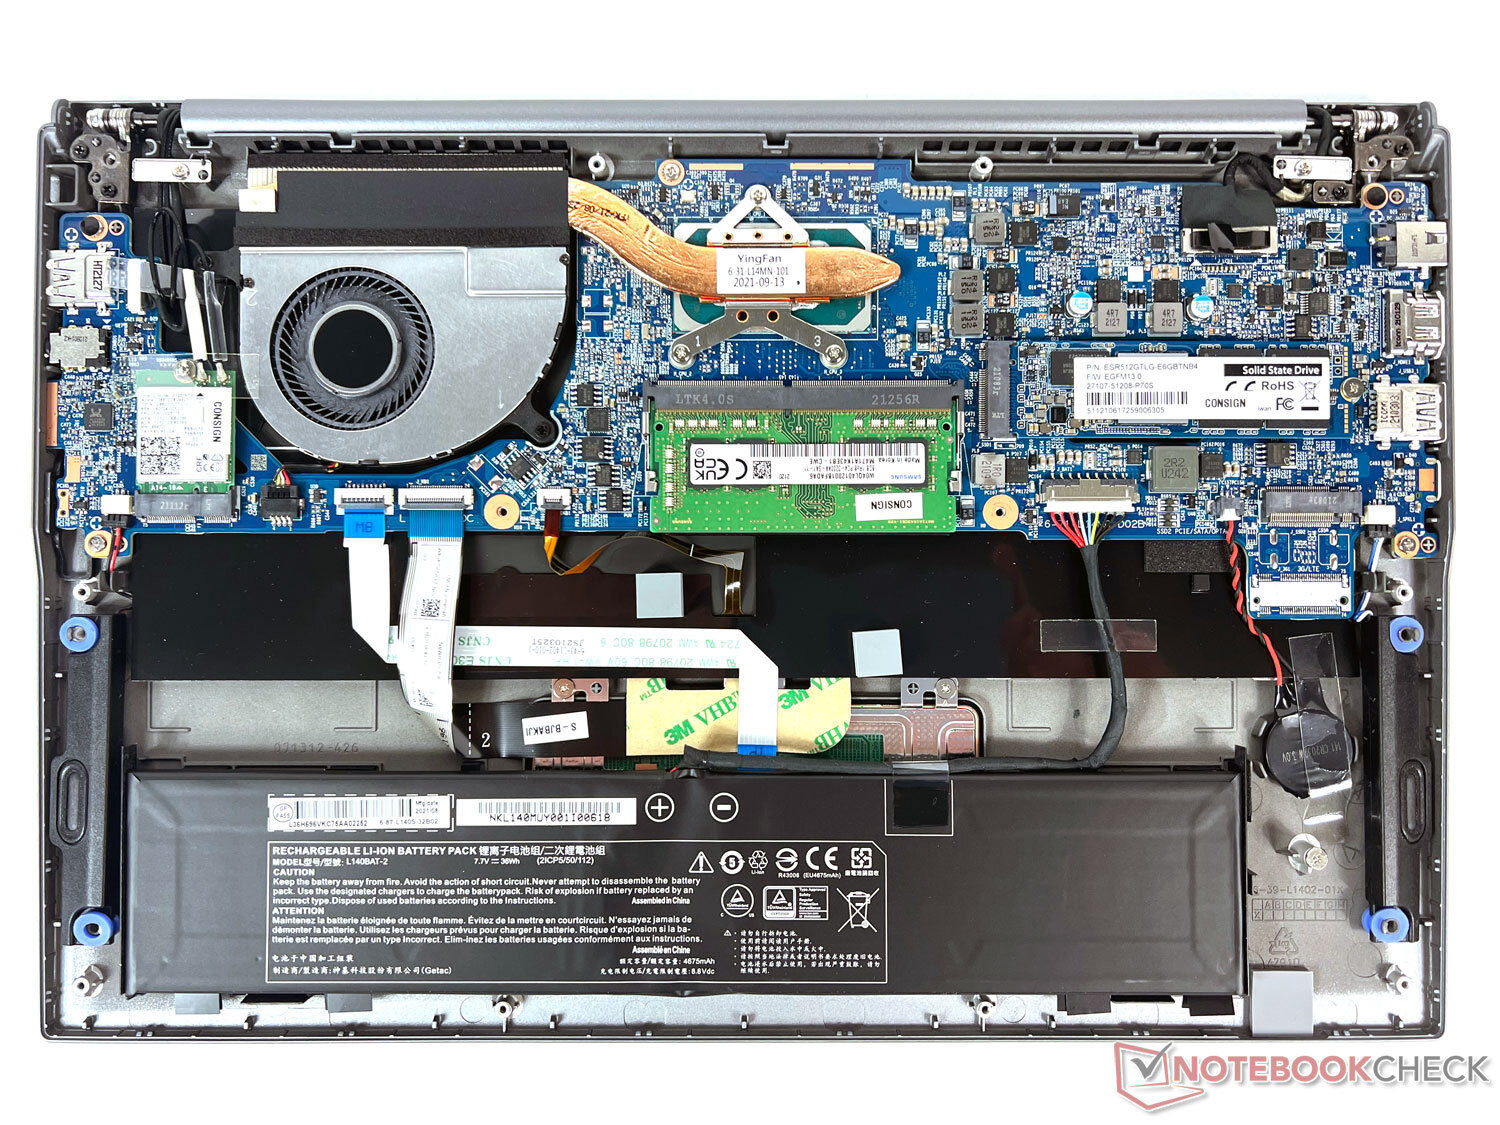
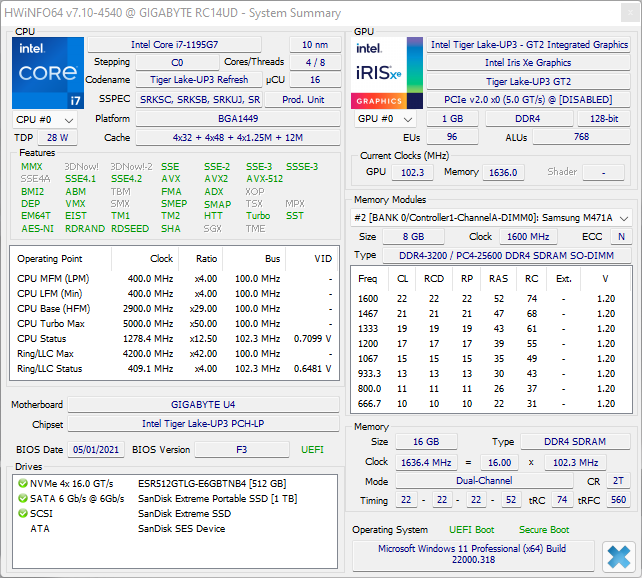
Mantenimiento
Doce pequeños tornillos bloquean el paso al interior. Una vez retirados, se pueden sustituir 8 de los 16 GB de RAM DDR4-3200, pero no se pueden ampliar. Los otros 8 GB de RAM están soldados. Además, hay dos ranuras para SSD M.2 (1x PCIe 4.0, 1x PCIe 3.0), para poder instalar otro SSD M.2
Garantía
La propia Gigabyte ofrece una garantía de 12 meses para la batería. El resto de casos están cubiertos por la garantía del distribuidor, que es de 24 meses en Alemania
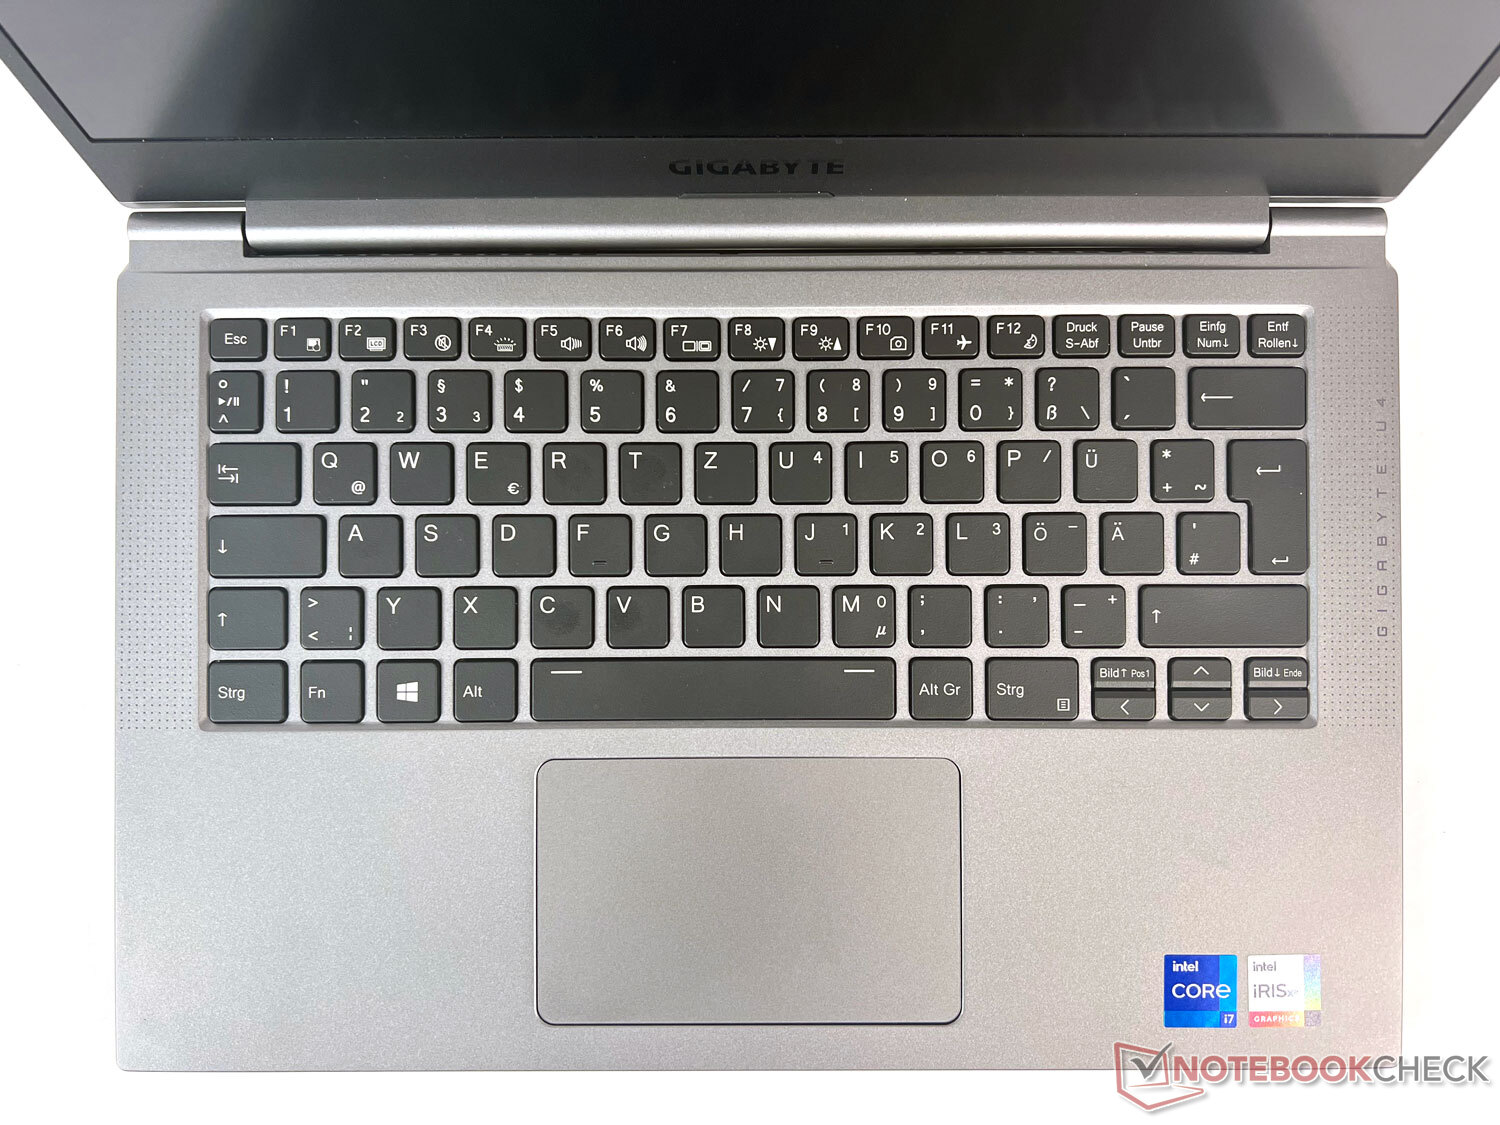
Dispositivos de entrada: El teclado ofrece muchas funciones adicionales entre "F1" y "F12"
Teclado
Como los bordes izquierdo y derecho sólo tienen unos 2 cm de grosor, Gigabyte consigue meter un teclado de tamaño sólido en el U4 a pesar de la compacta carcasa de 14 pulgadas. Las teclas individuales miden alrededor de 1,5 x 1,5 cm, y pueden teclearse fácilmente con manos masculinas de tamaño medio.
Como resultado, se establece con bastante rapidez una velocidad de escritura familiar y rápida, que va acompañada de un ruido de fondo agradablemente silencioso. Sólo la barra espaciadora (como en muchos otros portátiles), que es un poco ruidosa, destaca en términos de ruido, especialmente cuando se escribe rápidamente.
Las teclas individuales también son fáciles de ver en la oscuridad gracias a la retroiluminación que se puede ajustar en 5 niveles en el Centro de Control. El brillo también se puede regular con la tecla "F4" como opción. Muchas otras funciones, como la gestión de los ajustes del monitor externo, la activación o desactivación de la pantalla y la cámara web, etc., pueden controlarse cómodamente con las teclas "F1" a "F12".
Panel táctil
El touchpad de 10,5 x 6,5 cm está centrado debajo del teclado. Tiene un tacto cómodo y suave, y las habituales dos zonas de clic en el borde inferior. Estas no están separadas en términos de háptica, ni son particularmente silenciosas cuando se usan. Sin embargo, el cursor del ratón se puede desplazar por la pantalla de forma suave y sin problemas
La brillante pantalla es un aspecto agradable en nuestro análisis del portátil
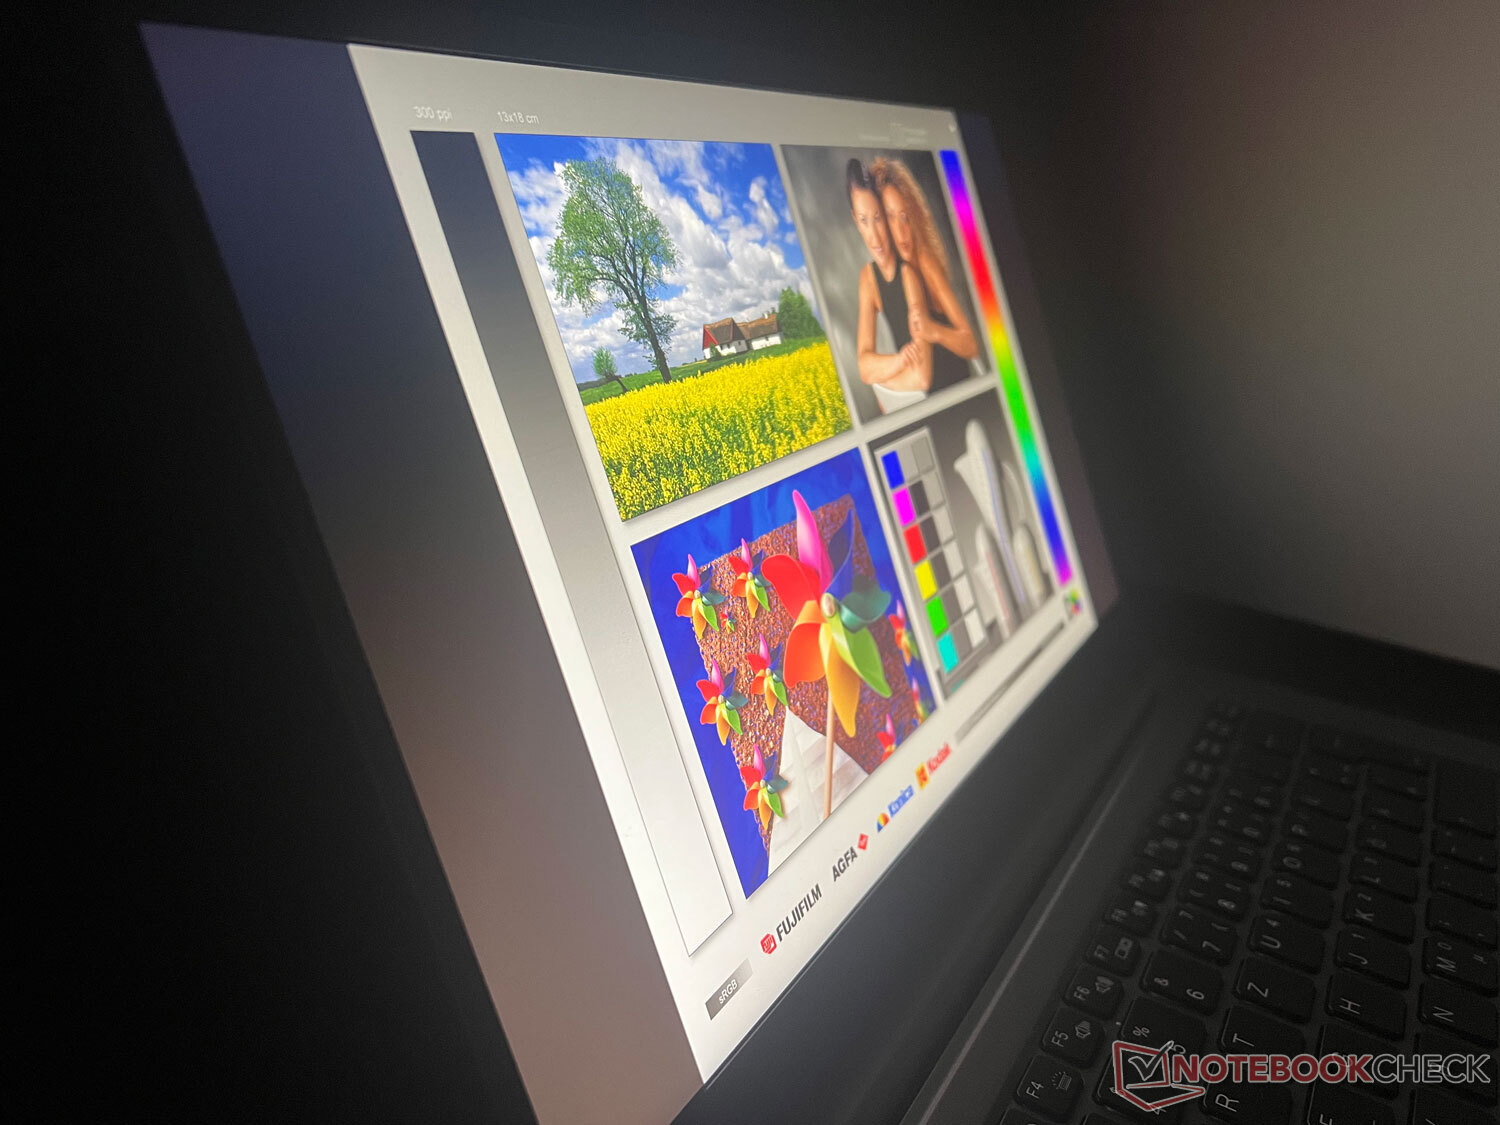
Gigabyte ha instalado una pantalla IPS mate de 14 pulgadas de Chi Mei en el U4. Tiene una resolución de Full HD, que corresponde a 1920x1080 pixeles. La tasa de refresco es la habitual de los dispositivos que no son de juego, es decir, 60 Hz.
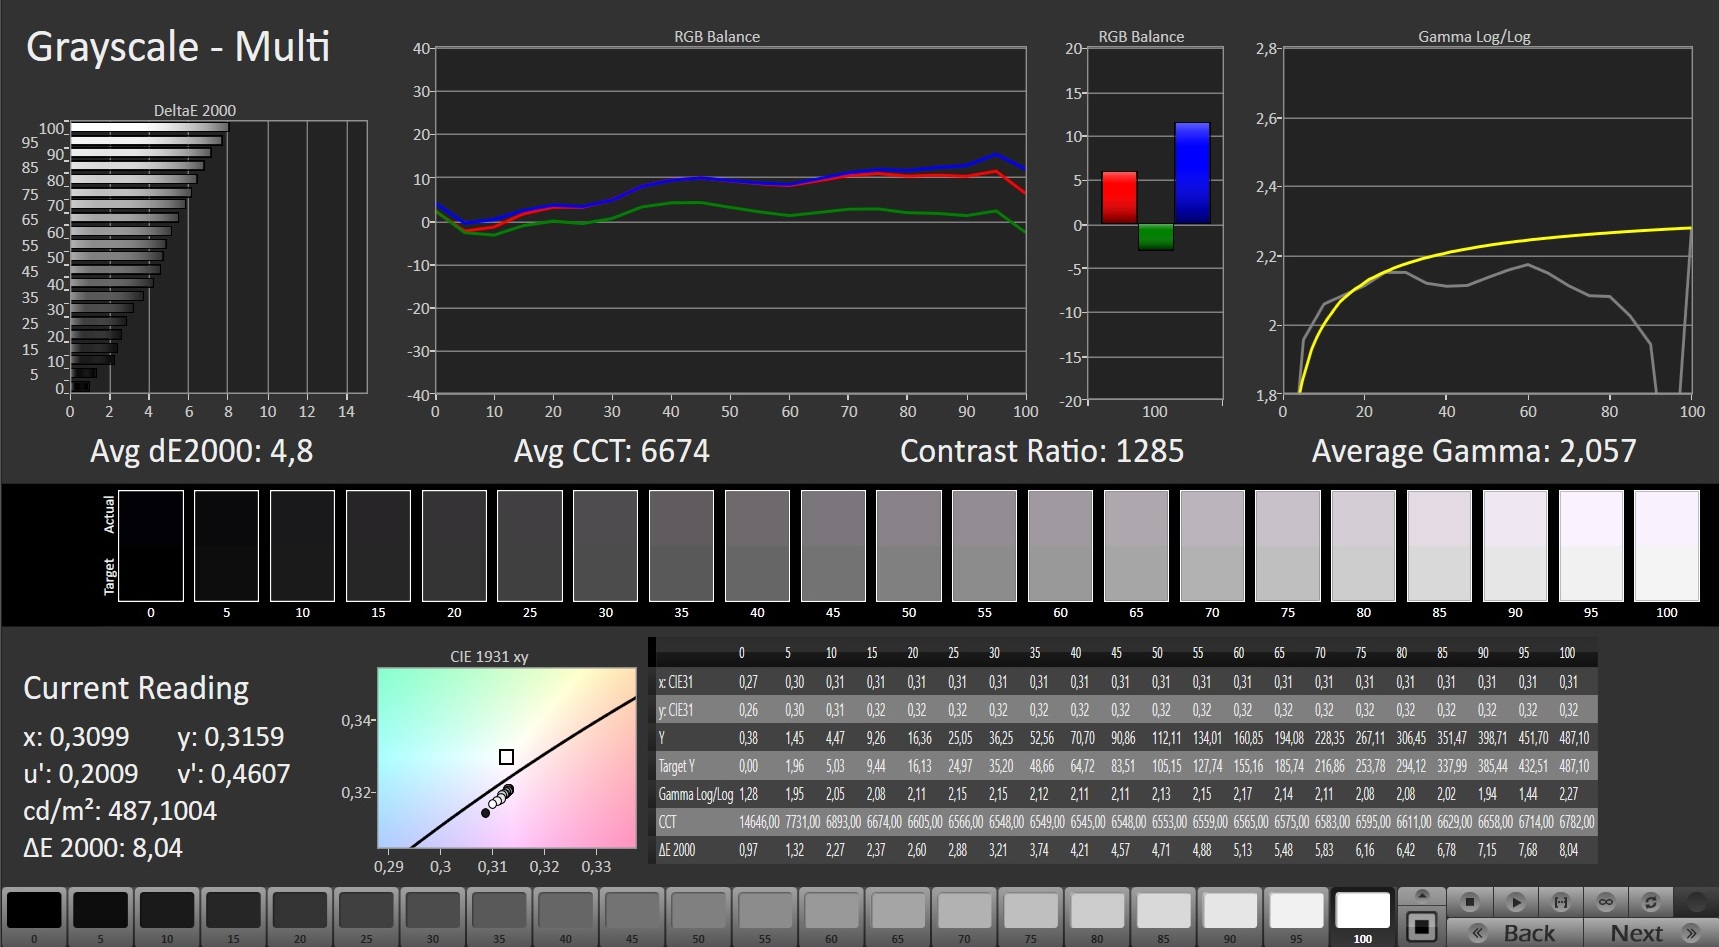
La pantalla puntúa muy bien en muchas mediciones. Entre otros factores, ofrece la imagen más brillante con una media de 426 cd/m². Sin embargo, la distribución del brillo podría ser un poco más uniforme, según las mediciones.
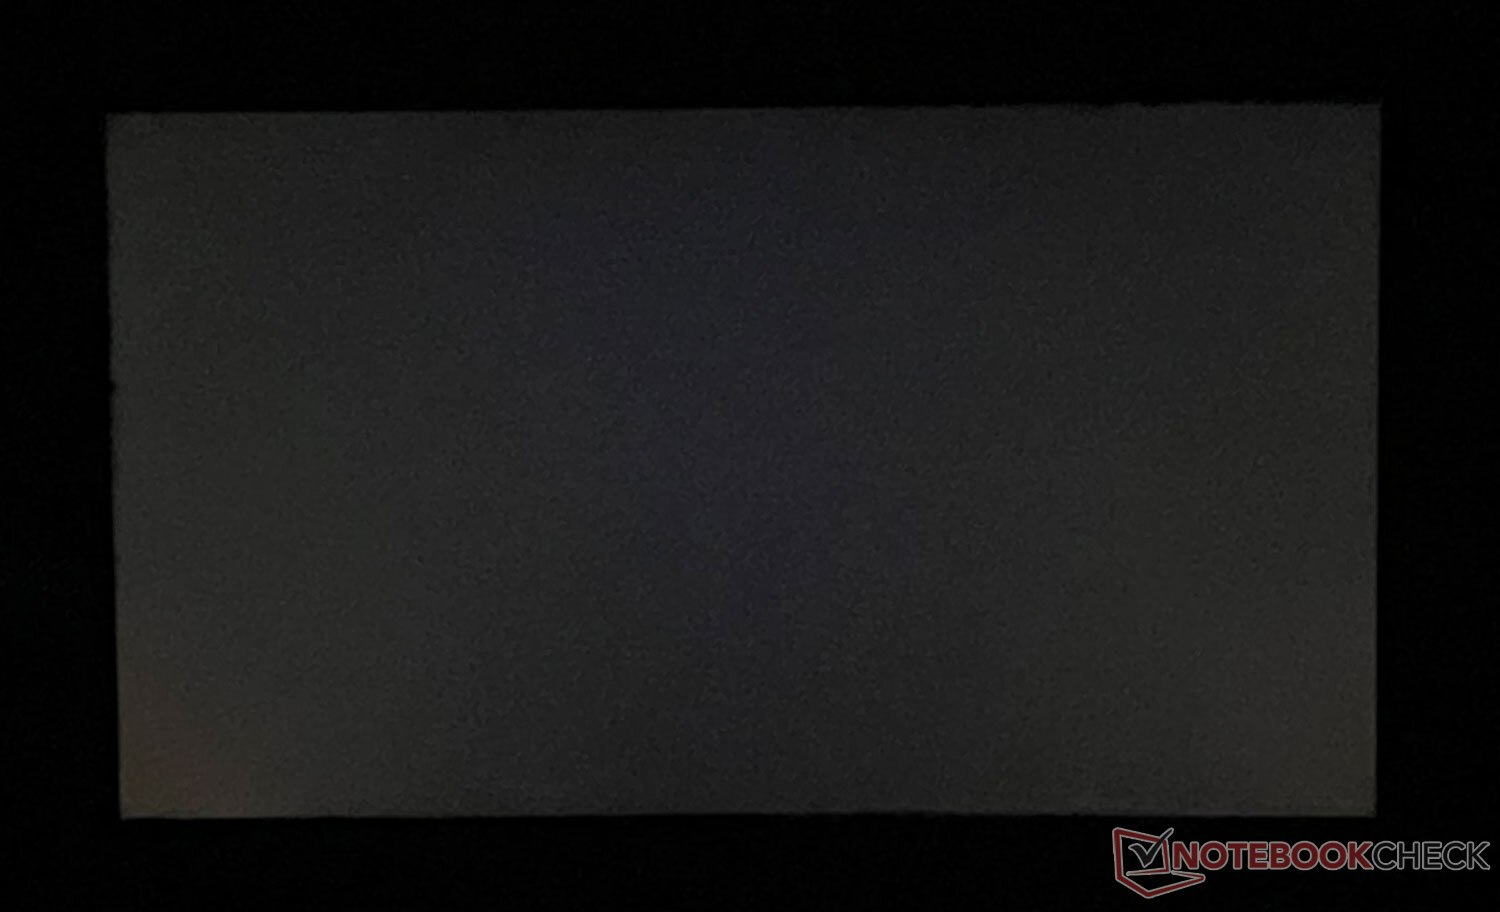
El Gigabyte U4 muestra debilidades cuando se trata de su nivel de negro, y el ratio de contraste también queda ligeramente por detrás del de los competidores. A cambio, el panel ofrece los tiempos de respuesta medios más bajos.
| |||||||||||||||||||||||||
iluminación: 87 %
Brillo con batería: 463 cd/m²
Contraste: 1218:1 (Negro: 0.38 cd/m²)
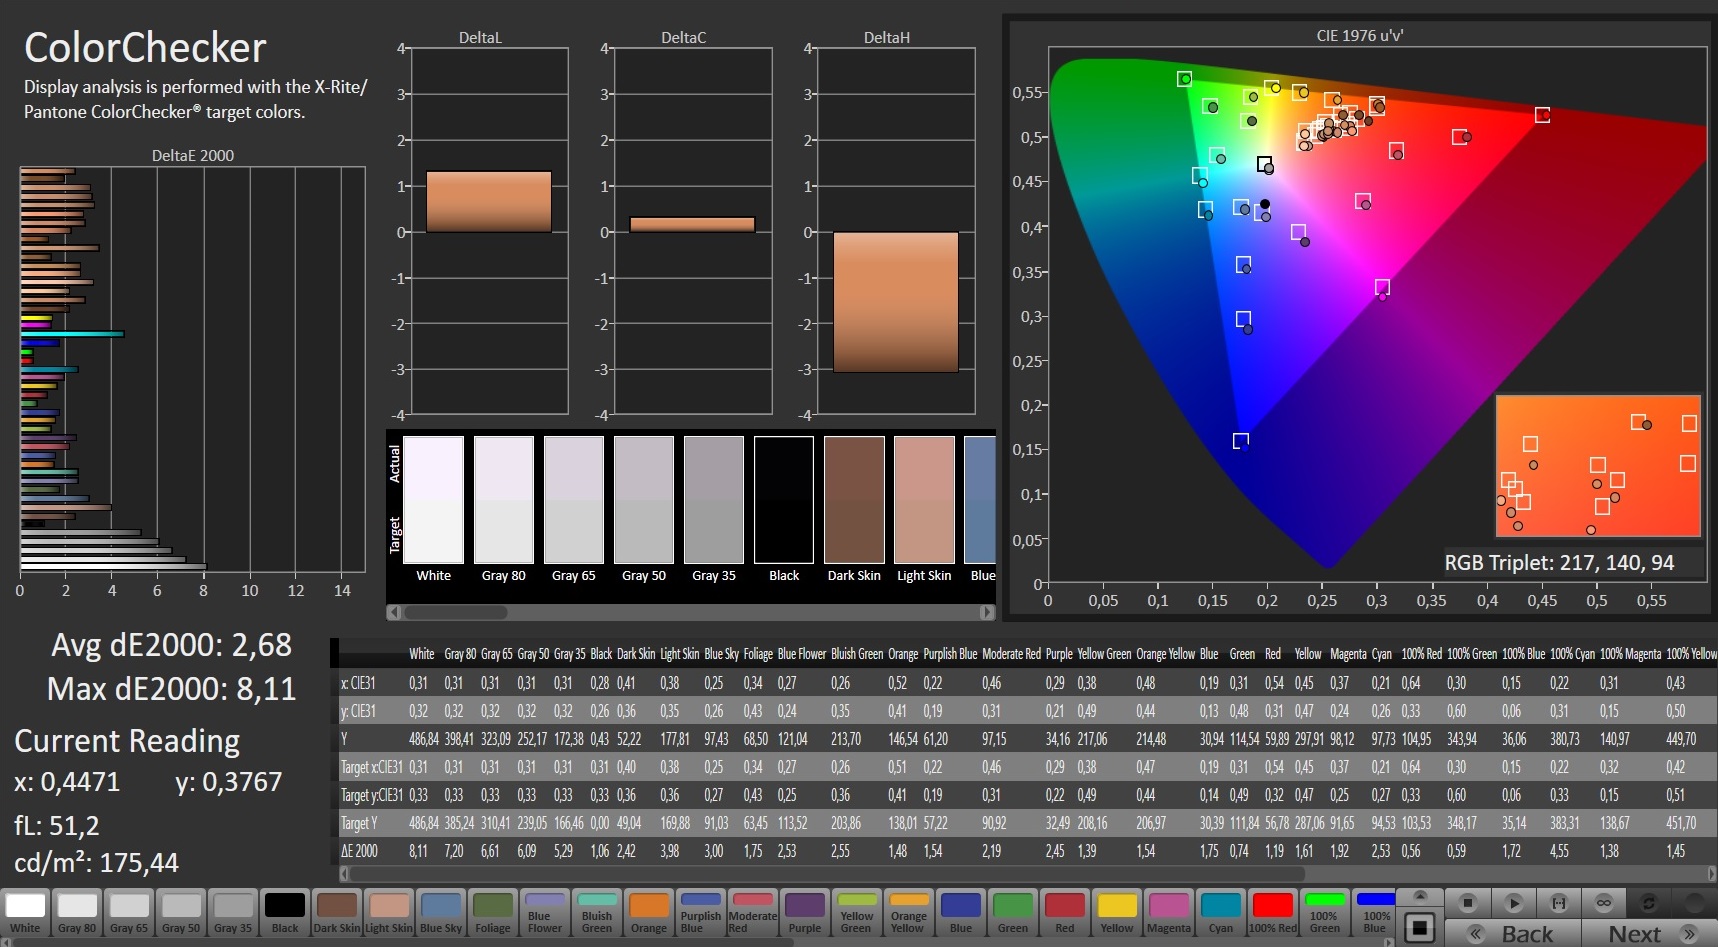
ΔE ColorChecker Calman: 2.68 | ∀{0.5-29.43 Ø4.71}
calibrated: 0.81
ΔE Greyscale Calman: 4.8 | ∀{0.09-98 Ø4.96}
66.9% AdobeRGB 1998 (Argyll 3D)
97.1% sRGB (Argyll 3D)
65.4% Display P3 (Argyll 3D)
Gamma: 2.057
CCT: 6674 K
| Gigabyte U4 UD Chi Mei N140HCE-EN2, IPS, 1920x1080, 14" | MSI Prestige 14 Evo A11MO-026US B140HAN06.2, IPS, 1920x1080, 14" | Dell Inspiron 13 5301-0D0XN InfoVision M133NWF4 R0, IPS, 1920x1080, 13.3" | LG Gram 14Z90P-G.AA79G LG Display LP140WU1-SPA1, IPS, 1920x1200, 14" | HP Envy 13-ba1475ng CMN139D, IPS, 1920x1080, 13.3" | |
|---|---|---|---|---|---|
| Display | 5% | -2% | 27% | 1% | |
| Display P3 Coverage (%) | 65.4 | 70.3 7% | 97.6 49% | 66.4 2% | |
| sRGB Coverage (%) | 97.1 | 99.2 2% | 98.1 1% | 99.9 3% | 97.6 1% |
| AdobeRGB 1998 Coverage (%) | 66.9 | 71.5 7% | 63.4 -5% | 85.3 28% | 67.5 1% |
| Response Times | -84% | -22% | -33% | -81% | |
| Response Time Grey 50% / Grey 80% * (ms) | 35.6 ? | 59.6 ? -67% | 37 ? -4% | 45 ? -26% | 66 ? -85% |
| Response Time Black / White * (ms) | 16.4 ? | 32.8 ? -100% | 23 ? -40% | 23 ? -40% | 28.8 ? -76% |
| PWM Frequency (Hz) | 1000 ? | 26040 ? | |||
| Screen | -0% | 2% | -23% | 7% | |
| Brightness middle (cd/m²) | 463 | 306 -34% | 302 -35% | 352 -24% | 423 -9% |
| Brightness (cd/m²) | 426 | 299 -30% | 289 -32% | 332 -22% | 405 -5% |
| Brightness Distribution (%) | 87 | 92 6% | 88 1% | 91 5% | 83 -5% |
| Black Level * (cd/m²) | 0.38 | 0.18 53% | 0.22 42% | 0.22 42% | 0.23 39% |
| Contrast (:1) | 1218 | 1700 40% | 1373 13% | 1600 31% | 1839 51% |
| Colorchecker dE 2000 * | 2.68 | 2.8 -4% | 3.35 -25% | 2.89 -8% | 3.2 -19% |
| Colorchecker dE 2000 max. * | 8.11 | 6.2 24% | 5.27 35% | 4.66 43% | 5.8 28% |
| Colorchecker dE 2000 calibrated * | 0.81 | 1.3 -60% | 2.7 -233% | 1 -23% | |
| Greyscale dE 2000 * | 4.8 | 4.6 4% | 4.07 15% | 6.9 -44% | 4.7 2% |
| Gamma | 2.057 107% | 2.26 97% | 2.17 101% | 2.34 94% | 1.99 111% |
| CCT | 6674 97% | 6420 101% | 7084 92% | 7904 82% | 6362 102% |
| Color Space (Percent of AdobeRGB 1998) (%) | 63 | 76 | 61.9 | ||
| Color Space (Percent of sRGB) (%) | 98 | 100 | 97.5 | ||
| Media total (Programa/Opciones) | -26% /
-11% | -7% /
-3% | -10% /
-14% | -24% /
-7% |
* ... más pequeño es mejor
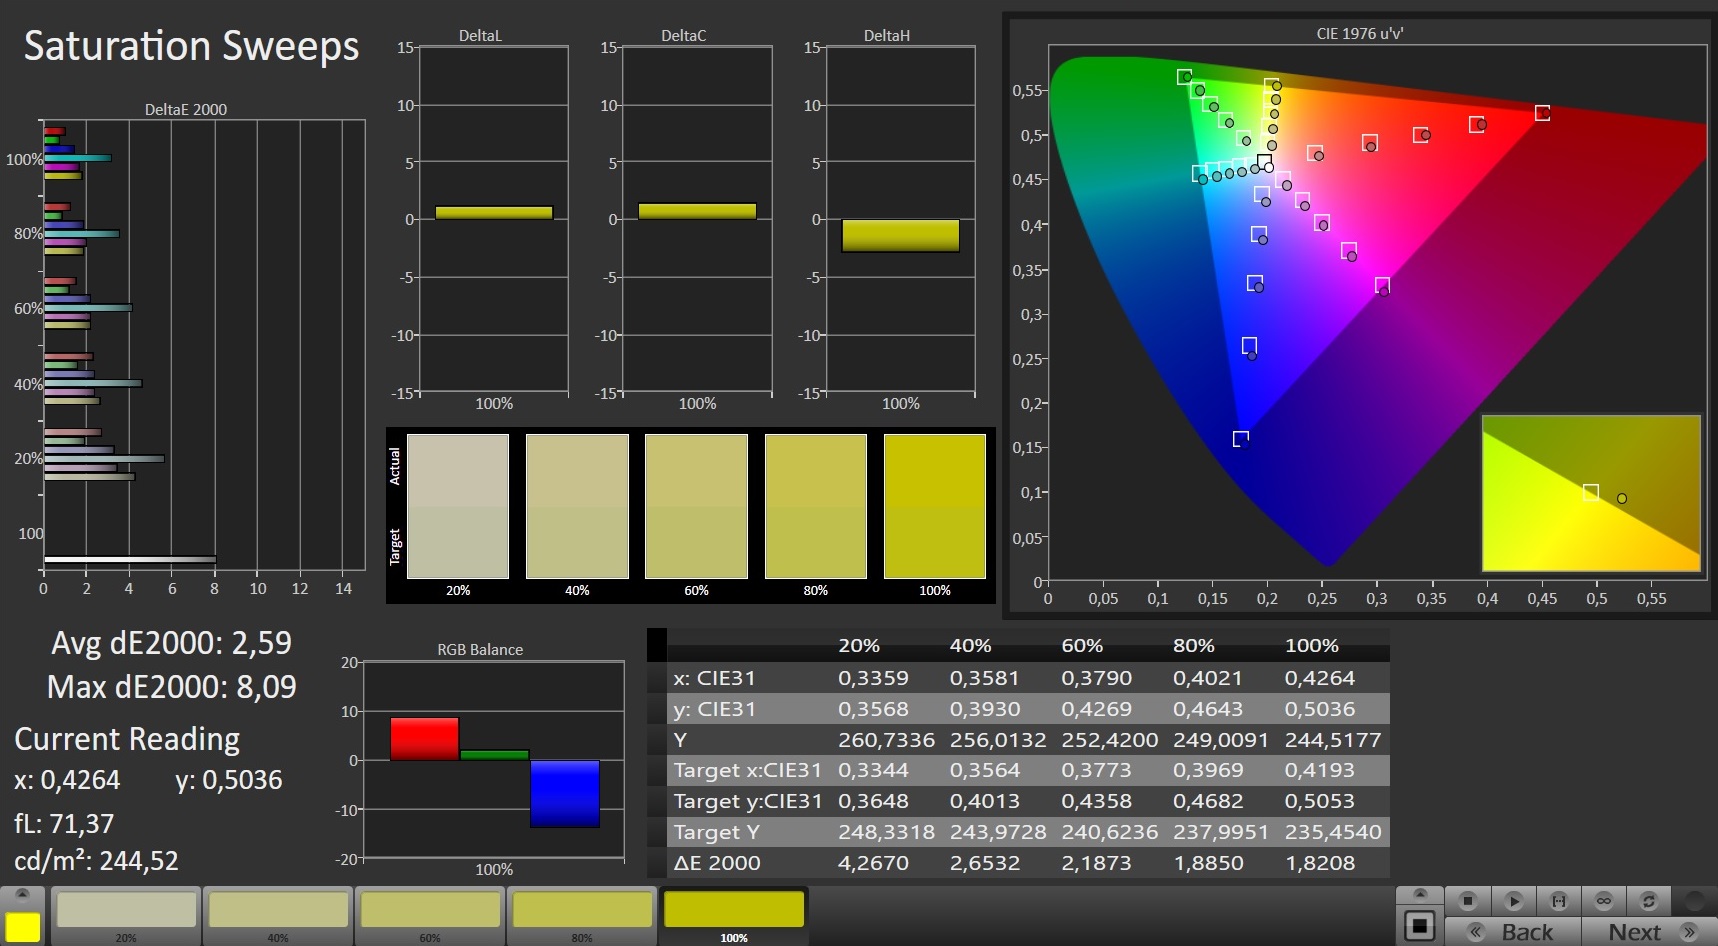
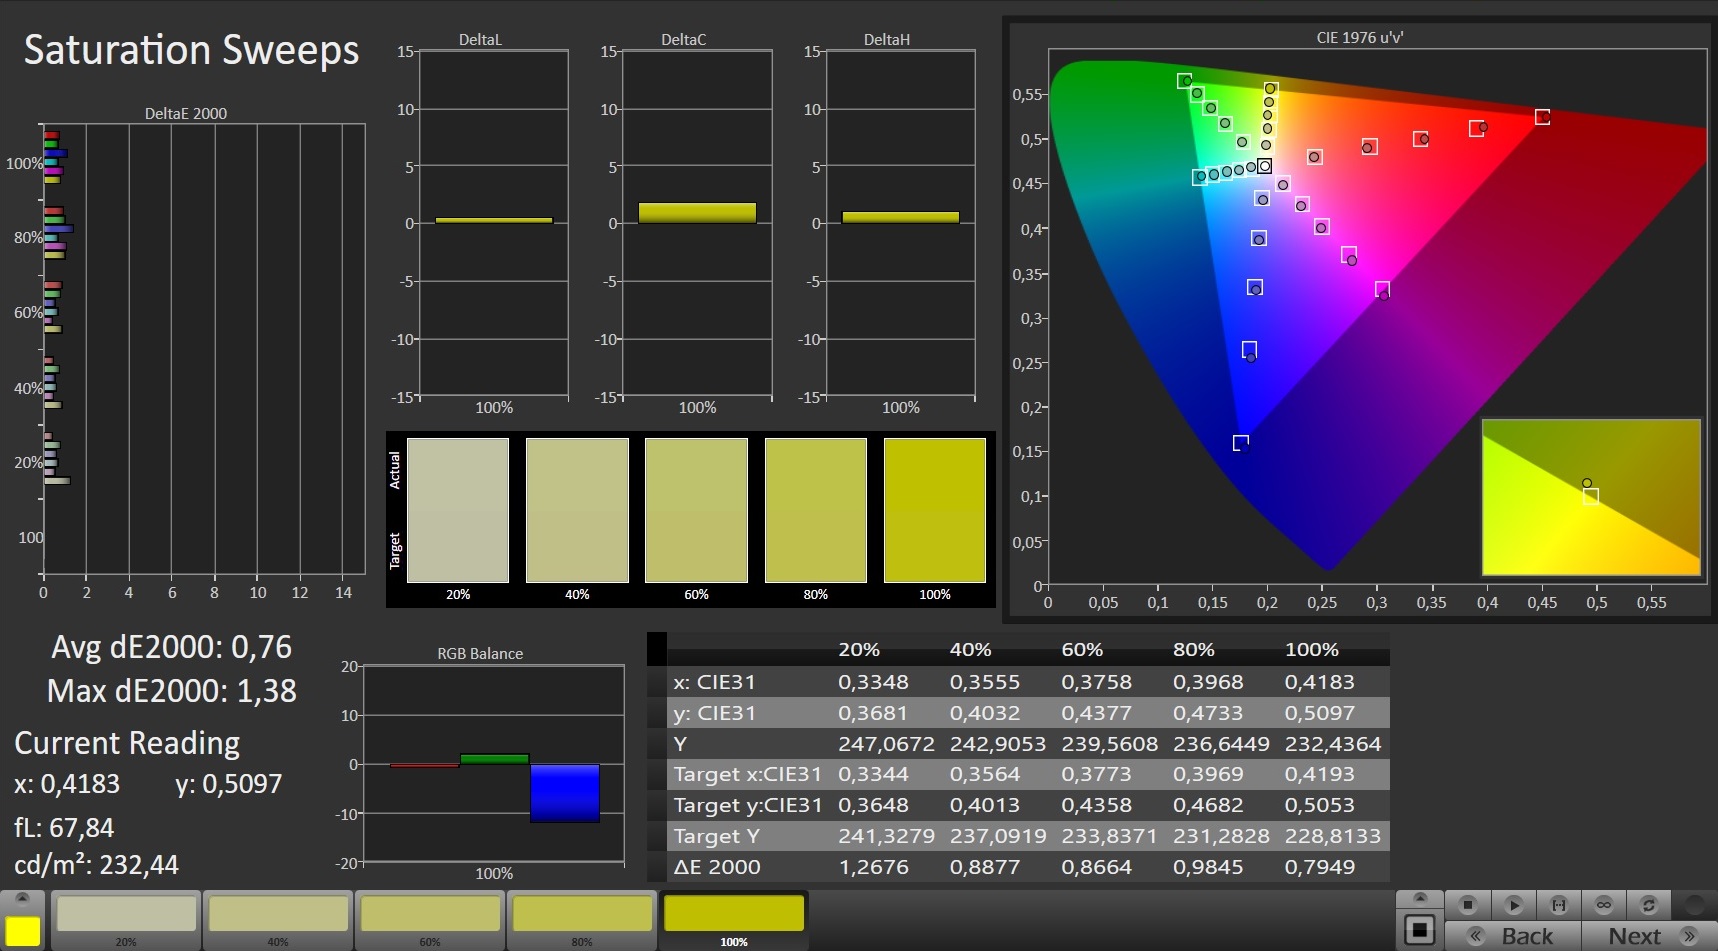
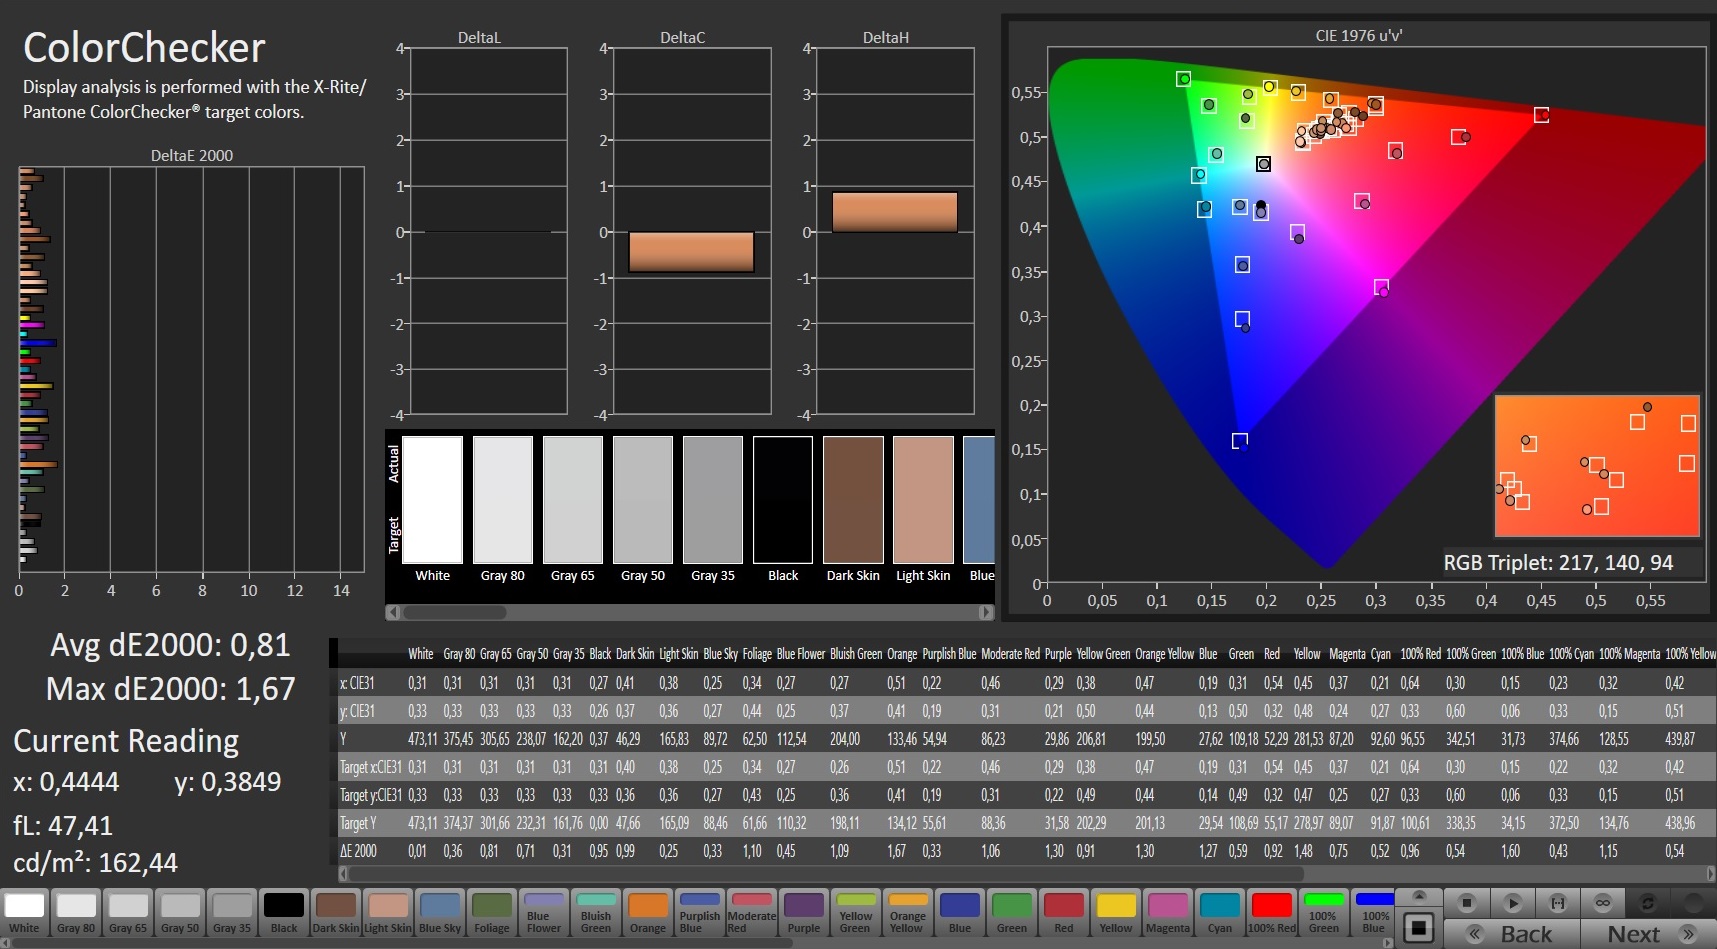
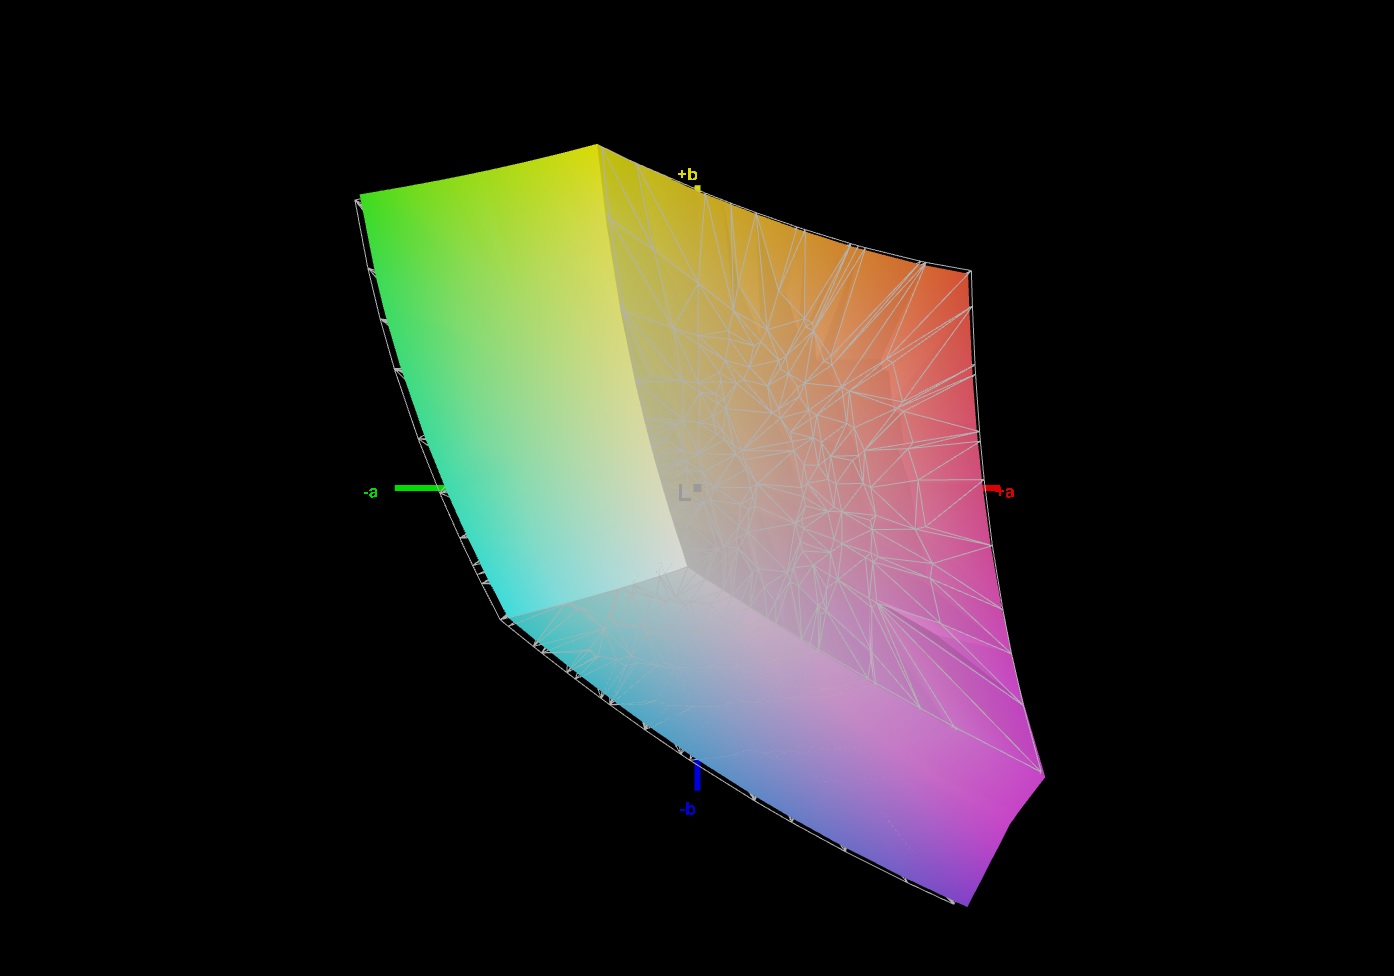
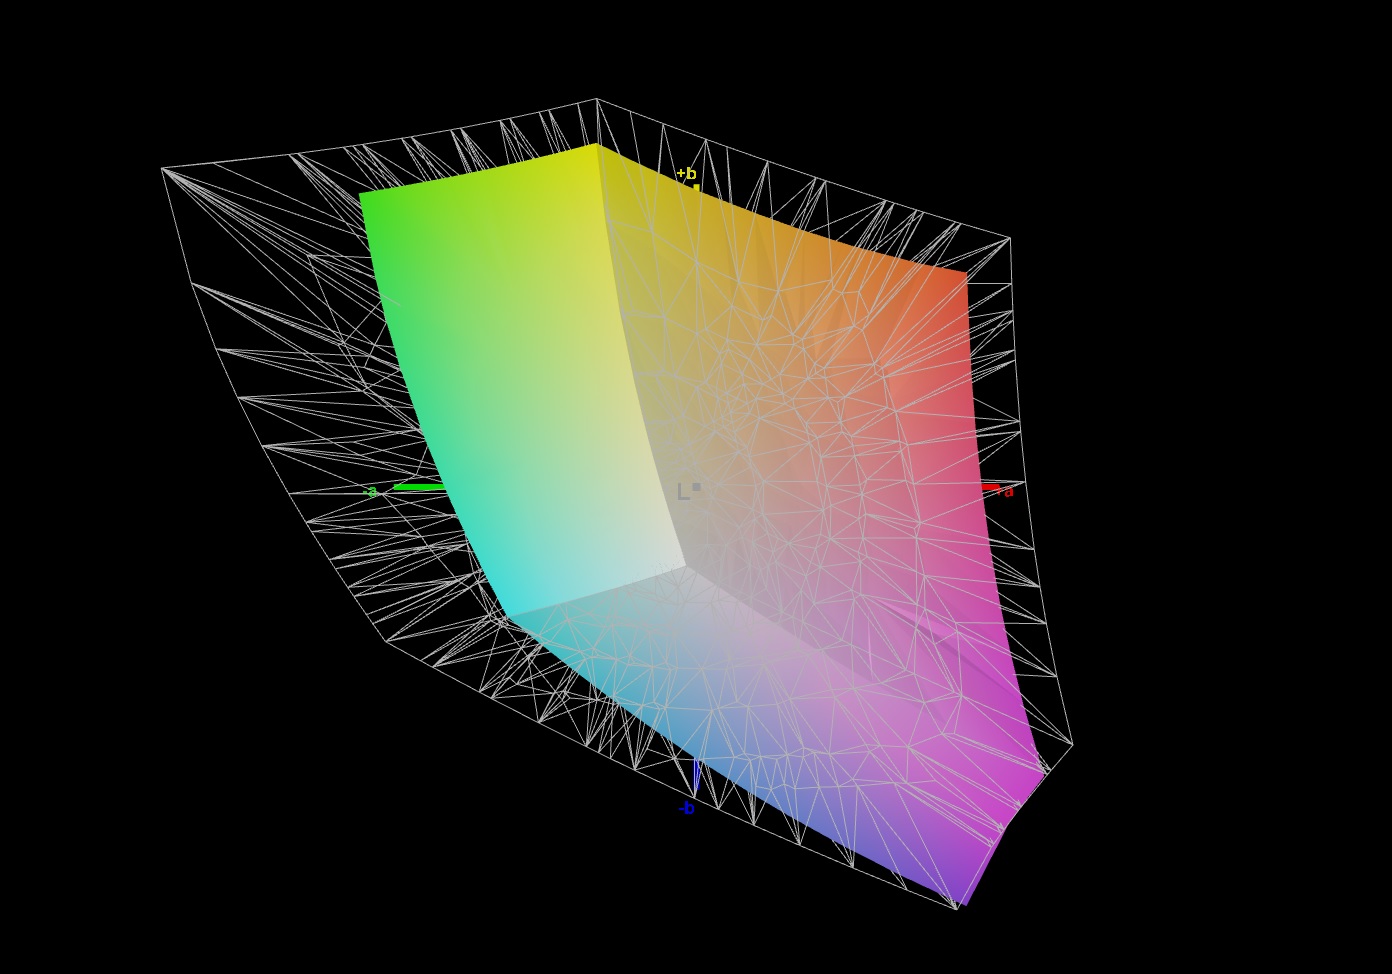
La pantalla cubre el espacio de color sRGB en casi un 100%, pero sólo cubre un 67% del espacio de color AdobeRGB y un 65% del espacio de color P3. Esto hace que el dispositivo sea menos adecuado para la edición gráfica profesional. Sin embargo, esto no suele estar entre los propósitos de aplicación habituales de los subportátiles como éste.
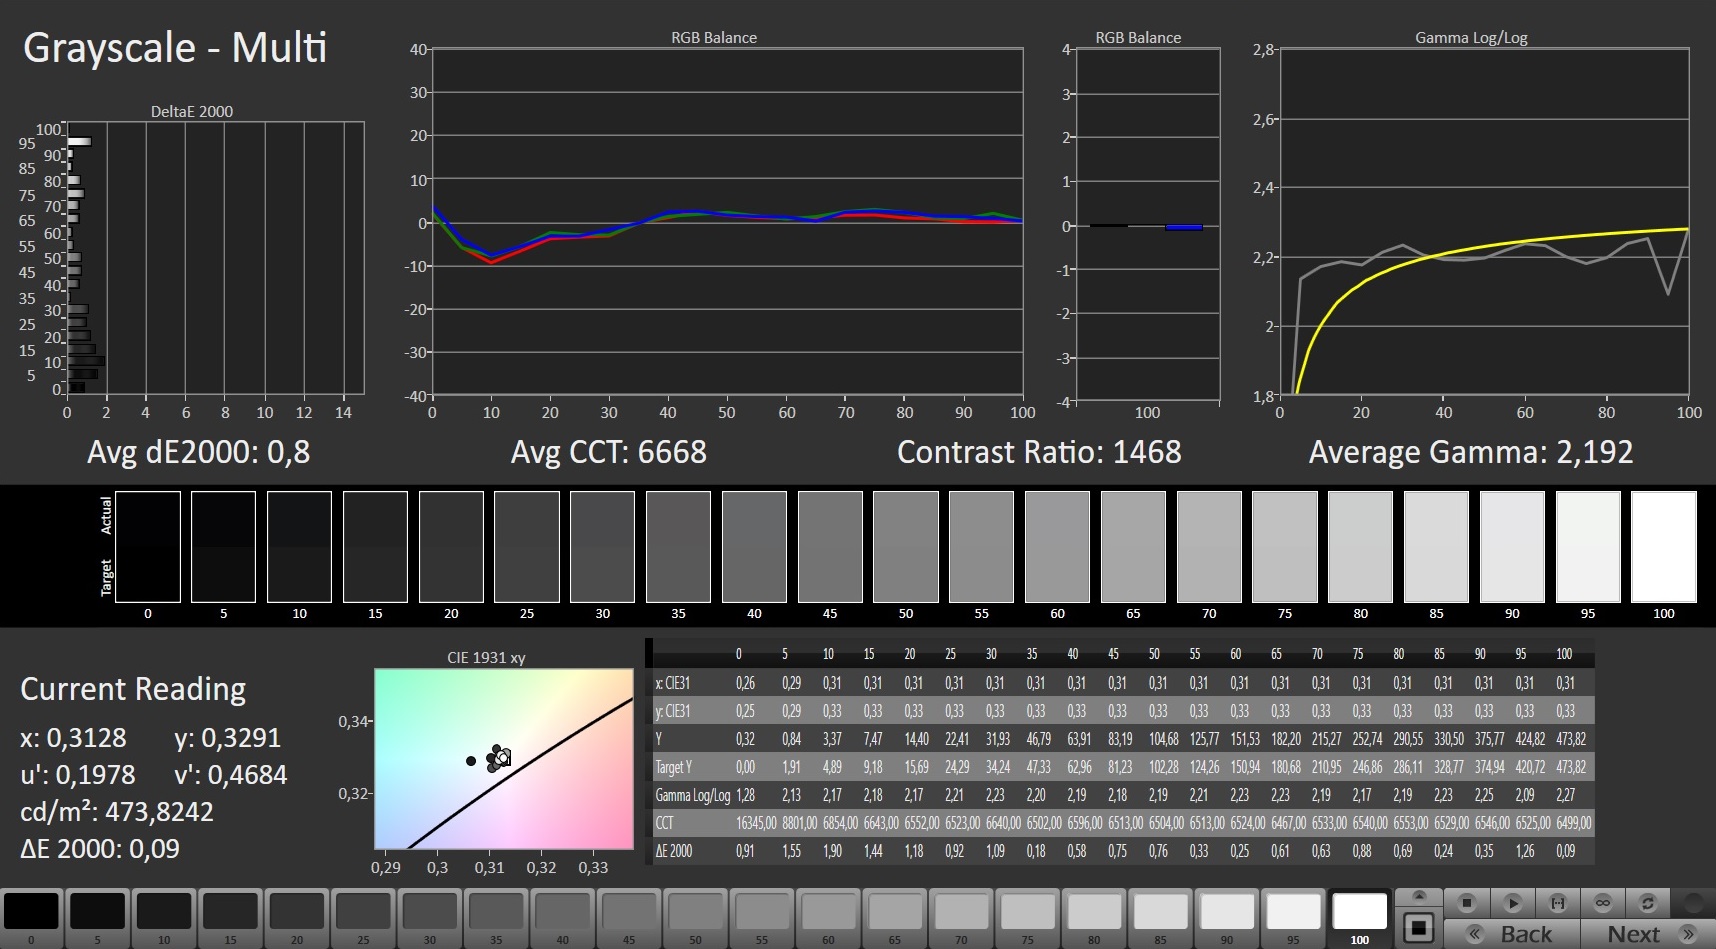
La desviación media del color es buena al sacarlo de la caja, pero puede reducirse considerablemente con la calibración (valores DeltaE de 2,68 y 0,81, respectivamente).
La pantalla mate y muy brillante, así como la gran estabilidad del ángulo de visión de la tecnología IPS, hacen que el Gigabyte U4 UD sea ideal para su uso en exteriores. La legibilidad de la pantalla no se resiente ni siquiera en días soleados
Tiempos de respuesta del display
| ↔ Tiempo de respuesta de Negro a Blanco | ||
|---|---|---|
| 16.4 ms ... subida ↗ y bajada ↘ combinada | ↗ 6.4 ms subida | 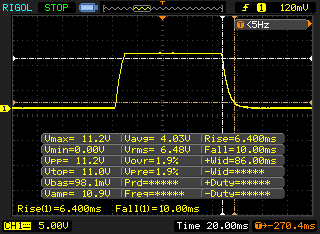 |
| ↘ 10 ms bajada | ||
| La pantalla mostró buenos tiempos de respuesta en nuestros tests pero podría ser demasiado lenta para los jugones competitivos. En comparación, todos los dispositivos de prueba van de ##min### (mínimo) a 240 (máximo) ms. » 38 % de todos los dispositivos son mejores. Esto quiere decir que el tiempo de respuesta medido es mejor que la media (19.8 ms) de todos los dispositivos testados. | ||
| ↔ Tiempo de respuesta 50% Gris a 80% Gris | ||
| 35.6 ms ... subida ↗ y bajada ↘ combinada | ↗ 17.6 ms subida | 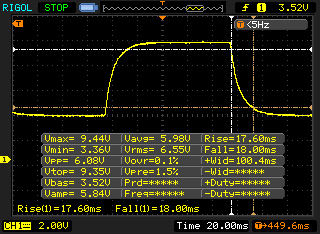 |
| ↘ 18 ms bajada | ||
| La pantalla mostró tiempos de respuesta lentos en nuestros tests y podría ser demasiado lenta para los jugones. En comparación, todos los dispositivos de prueba van de ##min### (mínimo) a 636 (máximo) ms. » 50 % de todos los dispositivos son mejores. Eso quiere decir que el tiempo de respuesta es peor que la media (30.9 ms) de todos los dispositivos testados. | ||
Parpadeo de Pantalla / PWM (Pulse-Width Modulation)
| Parpadeo de Pantalla / PWM no detectado | 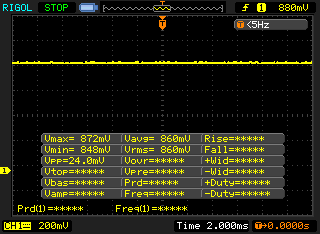 | ||
Comparación: 52 % de todos los dispositivos testados no usaron PWM para atenuar el display. Si se usó, medimos una media de 7748 (mínimo: 5 - máxmo: 343500) Hz. | |||
Rendimiento: El Gigabyte U4 no aprovecha al máximo su potente CPU
Como ya hemos dicho, nuestra unidad de análisis está equipada con el Intel Core i7-1195G7y susIntel Iris Xe Graphics G7 96EUs y 16 GB de RAM DDR4-3200 en modo de doble canal. Gigabyte no ofrece actualmente versiones alternativas del U4 además de la configuración UD.
A diferencia de otras mediciones, realizamos los benchmarks usando el Modo Rendimiento que se encuentra en el software Control Center 3.0. Si se selecciona aquí el Modo Multimedia, el dispositivo sufre importantes pérdidas de velocidad en muchas pruebas de rendimiento
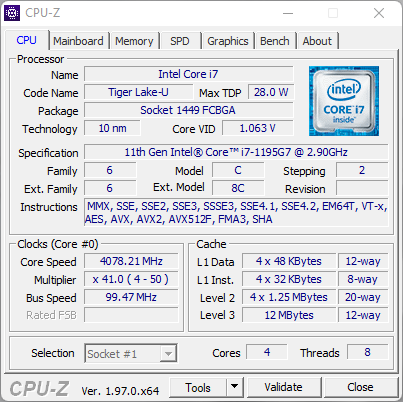
Procesador
El Core i7-1195G7 fue presentado a mediados de este año. Aunque sigue basándose en la ya anticuada arquitectura Tiger Lake, se trata de una actualización. Gracias al proceso de fabricación de 10nm+, es particularmente frugal, pero sigue alcanzando hasta 5 GHz para un núcleo individual en modo Boost.
La velocidad de reloj base máxima es de 3,9 GHz (TDP de 28 vatios). Nuestras mediciones a largo plazo revelaron que Gigabyte suministra a la CPU entre 13 vatios (PL1) y 46 vatios (PL2). Esto es considerablemente menos comparado con los 36 a 64 vatios con los que MSI suministra el Prestige 14 Evo.
Esto también se refleja en los índices de rendimiento en los diferentes benchmarks. El U4 no puede seguir el ritmo de su competidor equipado con la misma CPU ni de lejos. En algunas mediciones, ni siquiera alcanza los valores del menos potente Intel Core i7-1165G7que se encuentra en elHP Envy 13. En la mayoría de los casos, sin embargo, al menos puede mantener su posición frente a los competidores con los procesadores más lentos. El rendimiento en la prueba de resistencia Cinebench R15 Multi se mantiene constante, aunque no muy alto. Cuando el adaptador de corriente no está enchufado, el rendimiento de la CPU cae entre un 15% y un 20%.
Cinebench R15 Multi endurance test
| CPU Performance rating - Percent | |
| Media de la clase Subnotebook | |
| MSI Prestige 14 Evo A11MO-026US | |
| Medio Intel Core i7-1195G7 | |
| Gigabyte U4 UD | |
| HP Envy 13-ba1475ng | |
| LG Gram 14Z90P-G.AA79G | |
| Dell Inspiron 13 5301-0D0XN | |
| Cinebench R20 | |
| CPU (Multi Core) | |
| Media de la clase Subnotebook (579 - 8541, n=57, últimos 2 años) | |
| MSI Prestige 14 Evo A11MO-026US | |
| Medio Intel Core i7-1195G7 (1212 - 2590, n=9) | |
| HP Envy 13-ba1475ng | |
| Gigabyte U4 UD | |
| LG Gram 14Z90P-G.AA79G | |
| Dell Inspiron 13 5301-0D0XN | |
| CPU (Single Core) | |
| Media de la clase Subnotebook (128 - 832, n=57, últimos 2 años) | |
| MSI Prestige 14 Evo A11MO-026US | |
| Medio Intel Core i7-1195G7 (498 - 620, n=9) | |
| Gigabyte U4 UD | |
| HP Envy 13-ba1475ng | |
| Dell Inspiron 13 5301-0D0XN | |
| LG Gram 14Z90P-G.AA79G | |
| HWBOT x265 Benchmark v2.2 - 4k Preset | |
| Media de la clase Subnotebook (0.97 - 25.1, n=57, últimos 2 años) | |
| MSI Prestige 14 Evo A11MO-026US | |
| Medio Intel Core i7-1195G7 (4.23 - 8.8, n=9) | |
| HP Envy 13-ba1475ng | |
| Gigabyte U4 UD | |
| LG Gram 14Z90P-G.AA79G | |
| Dell Inspiron 13 5301-0D0XN | |
| LibreOffice - 20 Documents To PDF | |
| Media de la clase Subnotebook (39.9 - 220, n=56, últimos 2 años) | |
| HP Envy 13-ba1475ng | |
| Dell Inspiron 13 5301-0D0XN | |
| Medio Intel Core i7-1195G7 (39.2 - 83.9, n=9) | |
| MSI Prestige 14 Evo A11MO-026US | |
| LG Gram 14Z90P-G.AA79G | |
| Gigabyte U4 UD | |
| R Benchmark 2.5 - Overall mean | |
| LG Gram 14Z90P-G.AA79G | |
| Dell Inspiron 13 5301-0D0XN | |
| HP Envy 13-ba1475ng | |
| MSI Prestige 14 Evo A11MO-026US | |
| Gigabyte U4 UD | |
| Medio Intel Core i7-1195G7 (0.53 - 0.611, n=9) | |
| Media de la clase Subnotebook (0.4024 - 1.456, n=58, últimos 2 años) | |
* ... más pequeño es mejor
AIDA64: FP32 Ray-Trace | FPU Julia | CPU SHA3 | CPU Queen | FPU SinJulia | FPU Mandel | CPU AES | CPU ZLib | FP64 Ray-Trace | CPU PhotoWorxx
| Performance rating | |
| Media de la clase Subnotebook | |
| Gigabyte U4 UD | |
| Medio Intel Core i7-1195G7 | |
| LG Gram 14Z90P-G.AA79G | |
| Dell Inspiron 13 5301-0D0XN | |
| HP Envy 13-ba1475ng | |
| MSI Prestige 14 Evo A11MO-026US -9! | |
| AIDA64 / FP32 Ray-Trace | |
| Media de la clase Subnotebook (1135 - 32888, n=58, últimos 2 años) | |
| Gigabyte U4 UD | |
| Medio Intel Core i7-1195G7 (4378 - 7361, n=9) | |
| HP Envy 13-ba1475ng | |
| Dell Inspiron 13 5301-0D0XN | |
| LG Gram 14Z90P-G.AA79G | |
| AIDA64 / FPU Julia | |
| Media de la clase Subnotebook (5218 - 123315, n=58, últimos 2 años) | |
| Medio Intel Core i7-1195G7 (20576 - 30422, n=9) | |
| Gigabyte U4 UD | |
| HP Envy 13-ba1475ng | |
| Dell Inspiron 13 5301-0D0XN | |
| LG Gram 14Z90P-G.AA79G | |
| AIDA64 / CPU SHA3 | |
| Media de la clase Subnotebook (444 - 5287, n=58, últimos 2 años) | |
| Gigabyte U4 UD | |
| Medio Intel Core i7-1195G7 (1310 - 2026, n=9) | |
| HP Envy 13-ba1475ng | |
| LG Gram 14Z90P-G.AA79G | |
| Dell Inspiron 13 5301-0D0XN | |
| AIDA64 / CPU Queen | |
| Media de la clase Subnotebook (10579 - 95002, n=48, últimos 2 años) | |
| Gigabyte U4 UD | |
| HP Envy 13-ba1475ng | |
| Medio Intel Core i7-1195G7 (38530 - 56262, n=9) | |
| LG Gram 14Z90P-G.AA79G | |
| Dell Inspiron 13 5301-0D0XN | |
| AIDA64 / FPU SinJulia | |
| Media de la clase Subnotebook (744 - 18418, n=58, últimos 2 años) | |
| Medio Intel Core i7-1195G7 (3209 - 4937, n=9) | |
| Gigabyte U4 UD | |
| Dell Inspiron 13 5301-0D0XN | |
| LG Gram 14Z90P-G.AA79G | |
| HP Envy 13-ba1475ng | |
| AIDA64 / FPU Mandel | |
| Media de la clase Subnotebook (3341 - 65433, n=58, últimos 2 años) | |
| Gigabyte U4 UD | |
| Medio Intel Core i7-1195G7 (12142 - 18123, n=9) | |
| HP Envy 13-ba1475ng | |
| Dell Inspiron 13 5301-0D0XN | |
| LG Gram 14Z90P-G.AA79G | |
| AIDA64 / CPU AES | |
| Gigabyte U4 UD | |
| Medio Intel Core i7-1195G7 (30854 - 70936, n=9) | |
| HP Envy 13-ba1475ng | |
| Dell Inspiron 13 5301-0D0XN | |
| LG Gram 14Z90P-G.AA79G | |
| Media de la clase Subnotebook (638 - 96917, n=58, últimos 2 años) | |
| AIDA64 / CPU ZLib | |
| Media de la clase Subnotebook (164.9 - 1379, n=58, últimos 2 años) | |
| Gigabyte U4 UD | |
| Medio Intel Core i7-1195G7 (231 - 399, n=10) | |
| HP Envy 13-ba1475ng | |
| Dell Inspiron 13 5301-0D0XN | |
| LG Gram 14Z90P-G.AA79G | |
| MSI Prestige 14 Evo A11MO-026US | |
| AIDA64 / FP64 Ray-Trace | |
| Media de la clase Subnotebook (610 - 17495, n=58, últimos 2 años) | |
| Gigabyte U4 UD | |
| Medio Intel Core i7-1195G7 (2300 - 3949, n=9) | |
| HP Envy 13-ba1475ng | |
| Dell Inspiron 13 5301-0D0XN | |
| LG Gram 14Z90P-G.AA79G | |
| AIDA64 / CPU PhotoWorxx | |
| Media de la clase Subnotebook (6569 - 85600, n=58, últimos 2 años) | |
| LG Gram 14Z90P-G.AA79G | |
| Dell Inspiron 13 5301-0D0XN | |
| HP Envy 13-ba1475ng | |
| Medio Intel Core i7-1195G7 (13455 - 35235, n=9) | |
| Gigabyte U4 UD | |
Rendimiento del sistema
Basado en los benchmarks de la CPU, el dispositivo no es capaz de utilizar completamente el rendimiento del procesador cuando se trata del rendimiento del sistema, tampoco. Sin embargo, dado que la CPU es inherentemente potente comparada con la media de los subportátiles y los dispositivos de la comparación, sigue siendo suficiente para una clasificación de medio campo y un rendimiento de sistema fluido que es perfectamente adecuado para el uso diario
| PCMark 10 / Score | |
| Media de la clase Subnotebook (4920 - 9939, n=46, últimos 2 años) | |
| MSI Prestige 14 Evo A11MO-026US | |
| Medio Intel Core i7-1195G7, Intel Iris Xe Graphics G7 96EUs (5067 - 5406, n=6) | |
| HP Envy 13-ba1475ng | |
| Gigabyte U4 UD | |
| LG Gram 14Z90P-G.AA79G | |
| Dell Inspiron 13 5301-0D0XN | |
| PCMark 10 / Essentials | |
| MSI Prestige 14 Evo A11MO-026US | |
| Medio Intel Core i7-1195G7, Intel Iris Xe Graphics G7 96EUs (10156 - 10614, n=6) | |
| Media de la clase Subnotebook (8552 - 11646, n=46, últimos 2 años) | |
| LG Gram 14Z90P-G.AA79G | |
| Gigabyte U4 UD | |
| Dell Inspiron 13 5301-0D0XN | |
| HP Envy 13-ba1475ng | |
| PCMark 10 / Productivity | |
| Media de la clase Subnotebook (5435 - 16606, n=46, últimos 2 años) | |
| HP Envy 13-ba1475ng | |
| Medio Intel Core i7-1195G7, Intel Iris Xe Graphics G7 96EUs (6637 - 7390, n=6) | |
| LG Gram 14Z90P-G.AA79G | |
| MSI Prestige 14 Evo A11MO-026US | |
| Gigabyte U4 UD | |
| Dell Inspiron 13 5301-0D0XN | |
| PCMark 10 / Digital Content Creation | |
| Media de la clase Subnotebook (5722 - 13779, n=46, últimos 2 años) | |
| MSI Prestige 14 Evo A11MO-026US | |
| Gigabyte U4 UD | |
| Medio Intel Core i7-1195G7, Intel Iris Xe Graphics G7 96EUs (4737 - 5941, n=6) | |
| HP Envy 13-ba1475ng | |
| LG Gram 14Z90P-G.AA79G | |
| Dell Inspiron 13 5301-0D0XN | |
| PCMark 8 Home Score Accelerated v2 | 5215 puntos | |
| PCMark 8 Creative Score Accelerated v2 | 7150 puntos | |
| PCMark 8 Work Score Accelerated v2 | 3269 puntos | |
| PCMark 10 Score | 5086 puntos | |
ayuda | ||
| AIDA64 / Memory Copy | |
| Media de la clase Subnotebook (14554 - 131023, n=58, últimos 2 años) | |
| LG Gram 14Z90P-G.AA79G | |
| Dell Inspiron 13 5301-0D0XN | |
| MSI Prestige 14 Evo A11MO-026US | |
| Medio Intel Core i7-1195G7 (23332 - 57053, n=10) | |
| Gigabyte U4 UD | |
| HP Envy 13-ba1475ng | |
| AIDA64 / Memory Read | |
| Media de la clase Subnotebook (15948 - 127174, n=58, últimos 2 años) | |
| LG Gram 14Z90P-G.AA79G | |
| Dell Inspiron 13 5301-0D0XN | |
| MSI Prestige 14 Evo A11MO-026US | |
| HP Envy 13-ba1475ng | |
| Gigabyte U4 UD | |
| Medio Intel Core i7-1195G7 (24068 - 53332, n=10) | |
| AIDA64 / Memory Write | |
| Media de la clase Subnotebook (15709 - 135141, n=58, últimos 2 años) | |
| LG Gram 14Z90P-G.AA79G | |
| Dell Inspiron 13 5301-0D0XN | |
| MSI Prestige 14 Evo A11MO-026US | |
| Gigabyte U4 UD | |
| Medio Intel Core i7-1195G7 (22151 - 59019, n=10) | |
| HP Envy 13-ba1475ng | |
| AIDA64 / Memory Latency | |
| MSI Prestige 14 Evo A11MO-026US | |
| Media de la clase Subnotebook (6.1 - 159.9, n=56, últimos 2 años) | |
| Medio Intel Core i7-1195G7 (69.8 - 114.4, n=10) | |
| LG Gram 14Z90P-G.AA79G | |
| Dell Inspiron 13 5301-0D0XN | |
| HP Envy 13-ba1475ng | |
| Gigabyte U4 UD | |
* ... más pequeño es mejor
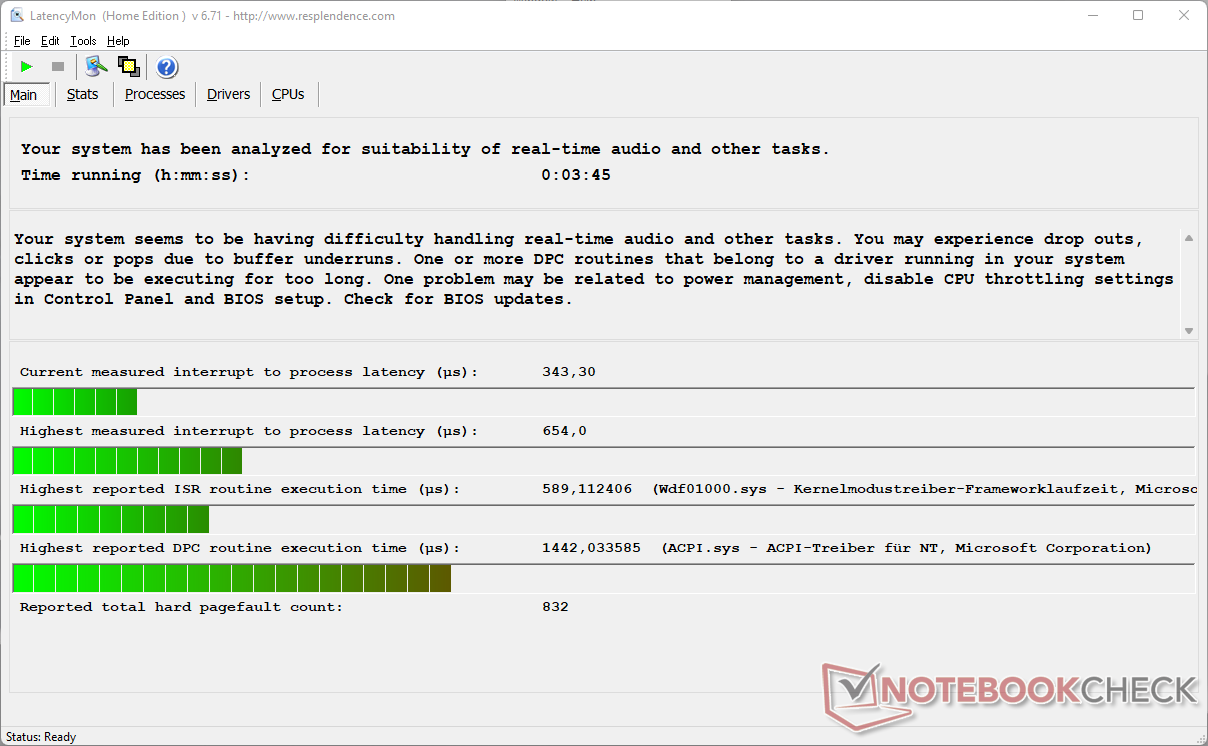
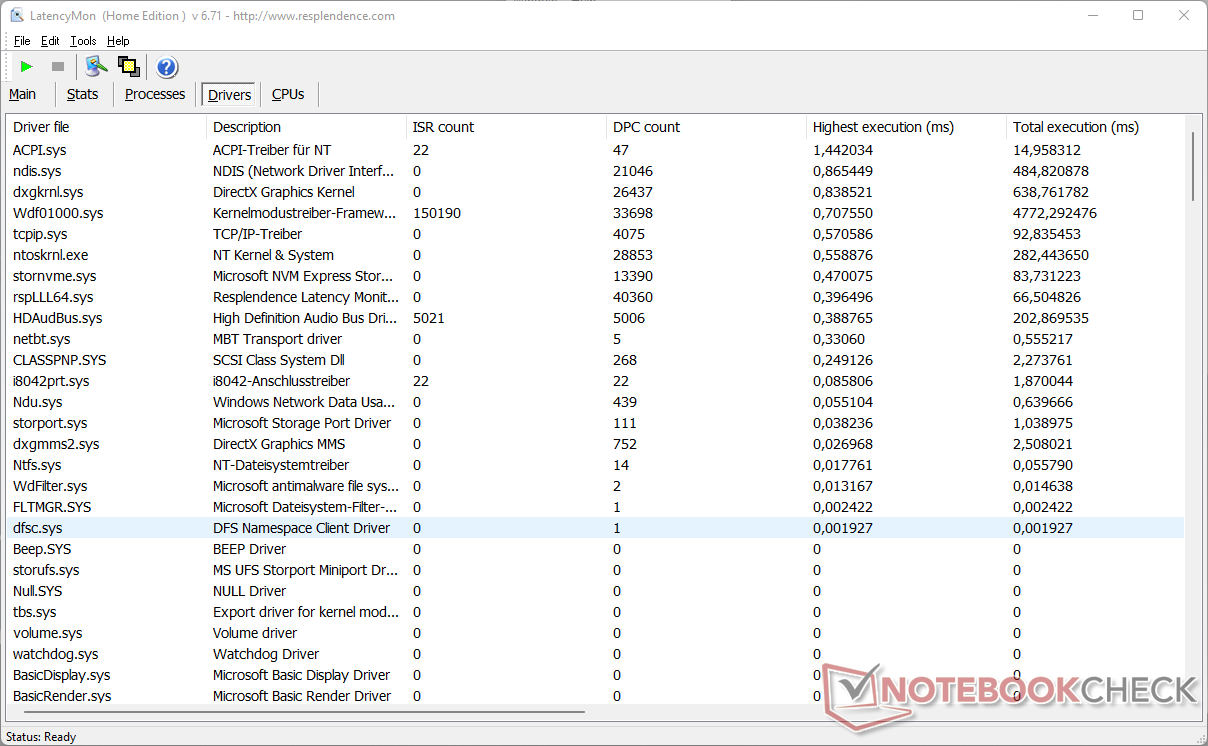
Latencias del CPD
Se encontraron irregularidades en nuestro procedimiento de prueba estandarizado para las latencias del CPD. Aunque el resultado es decente, la herramienta LatencyMon afirma que el audio en tiempo real y las aplicaciones similares podrían seguir experimentando problemas
| DPC Latencies / LatencyMon - interrupt to process latency (max), Web, Youtube, Prime95 | |
| MSI Prestige 14 Evo A11MO-026US | |
| LG Gram 14Z90P-G.AA79G | |
| HP Envy 13-ba1475ng | |
| Gigabyte U4 UD | |
| Dell Inspiron 13 5301-0D0XN | |
* ... más pequeño es mejor
Almacenamiento
Mientras que la CPU queda por debajo de las expectativas en ocasiones, el SSD integrado con 512 GB de espacio de almacenamiento rinde bien. Gracias a la rápida conexión PCIe 4.0, suele situarse entre los tres primeros puestos de nuestra comparativa
| Drive Performance rating - Percent | |
| MSI Prestige 14 Evo A11MO-026US | |
| Gigabyte U4 UD | |
| Media de la clase Subnotebook | |
| LG Gram 14Z90P-G.AA79G | |
| Global Average -3 | |
| Dell Inspiron 13 5301-0D0XN | |
| HP Envy 13-ba1475ng | |
* ... más pequeño es mejor

Continuous load read: DiskSpd Read Loop, Queue Depth 8
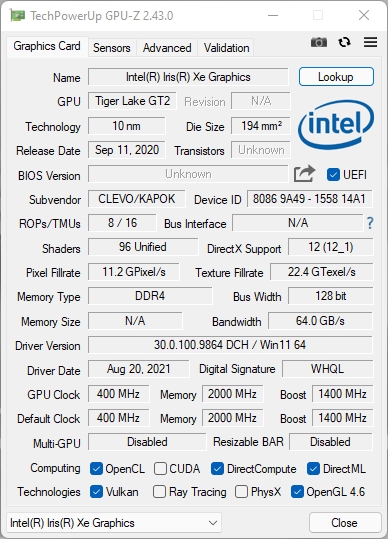
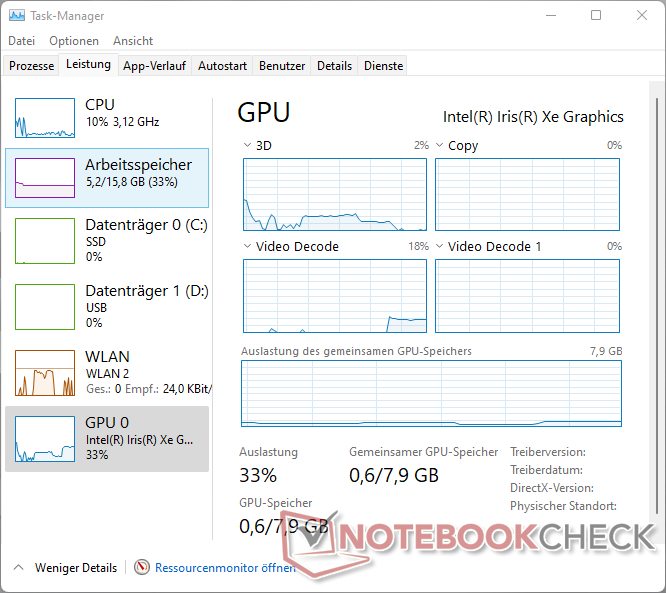
Rendimiento de la GPU
En lugar de una solución gráfica dedicada, Gigabyte opta por la tecnología Intel Iris Xe Graphics G7 de Intel. Aquí se instala la versión más potente de la gráfica integrada con 96 UE. Garantiza una velocidad de reloj mínima de 400 MHz con un pico de hasta 1.400 MHz.
Gigabyte también mantiene la GPU a raya aquí, lo que resulta en un rendimiento gráfico medio que está por debajo del rendimiento medio de esta solución gráfica en los distintos benchmarks. Además, el U4 queda superado por la mayoría de los modelos de la comparación, algunos de los cuales sólo están equipados con la Intel Iris Xe Graphics G7 con 80 EUs. No obstante, el rendimiento sigue siendo suficiente para las tareas cotidianas como el streaming de vídeos de alta resolución. El rendimiento cae alrededor de un 15% con la batería.
| 3DMark Performance rating - Percent | |
| Media de la clase Subnotebook | |
| MSI Prestige 14 Evo A11MO-026US | |
| LG Gram 14Z90P-G.AA79G | |
| Medio Intel Iris Xe Graphics G7 96EUs | |
| HP Envy 13-ba1475ng -3! | |
| Dell Inspiron 13 5301-0D0XN | |
| Gigabyte U4 UD | |
| 3DMark 11 Performance | 5977 puntos | |
| 3DMark Cloud Gate Standard Score | 16356 puntos | |
| 3DMark Fire Strike Score | 3618 puntos | |
| 3DMark Time Spy Score | 1522 puntos | |
ayuda | ||
Rendimiento de los juegos
Dado que el Gigabyte U4 no aprovecha el máximo potencial de la GPU, el rendimiento en juegos también queda por debajo de lo que podría ser posible, es decir, la media de la GPU. El dispositivo tiene un duelo con el Dell Inspiron 13 por los últimos puestos en términos de frame rates en The Witcher 3
.Sin embargo, esto suena peor de lo que es al final. Casi todos los juegos probados funcionaron sin problemas al menos en el nivel gráfico más bajo, muchos incluso en niveles medios. El Gigabyte U4 es suficiente para una sesión de juego ocasional, lo que debería ser suficiente para un subportátil. No obstante, habría sido posible un mejor rendimiento.
Las tasas de fotogramas en The Witcher 3 usando el nivel de gráficos Ultra no sólo son increíblemente bajas, sino que también fluctúan significativamente. Aunque la diferencia con el MSI Prestige 14 Evo, idénticamente equipado, en términos de CPU y GPU es de "sólo" unos 5 fps, se trata de un aumento considerable del 50%
The Witcher 3 FPS diagram
| bajo | medio | alto | ultra | |
|---|---|---|---|---|
| GTA V (2015) | 82.6 | 65.8 | 17.7 | 6.75 |
| The Witcher 3 (2015) | 70.1 | 44.4 | 21.5 | 10.2 |
| Dota 2 Reborn (2015) | 110 | 71.4 | 43.4 | 41.8 |
| Rise of the Tomb Raider (2016) | 46 | 35.1 | 19.9 | 17.3 |
| X-Plane 11.11 (2018) | 26.8 | 32.9 | 29.6 | |
| Far Cry 5 (2018) | 36 | 18 | 17 | 16 |
| Strange Brigade (2018) | 69.4 | 28 | 23.8 | 19.2 |
| Monster Hunter Stories 2 (2021) | 62.9 | 35.4 | 28.8 |
Emisiones: Ruido inesperado del ventilador, pero temperaturas agradablemente bajas
Ruido del ventilador
El Gigabyte U4 UD es realmente silencioso en reposo. Sin embargo, es un poco más ruidoso que el resto de dispositivos de la comparación bajo carga, ya que alcanza hasta 45 decibelios.
Lo que encontramos aún más significativo en la prueba es que el ventilador a menudo se acelera incluso cuando el dispositivo no está siendo utilizado, sino que simplemente está en reposo en el escritorio. Esto es algo molesto. Se puede reducir seleccionando el Modo Silencioso en el Centro de Control 3.0, pero esto resulta en pérdidas de rendimiento. Por otro lado, es bueno que no hayamos experimentado ningún otro ruido, como el de la bobina.
| Gigabyte U4 UD Iris Xe G7 96EUs, i7-1195G7 | MSI Prestige 14 Evo A11MO-026US Iris Xe G7 96EUs, i7-1195G7, Samsung PM9A1 MZVL2512HCJQ | Dell Inspiron 13 5301-0D0XN Iris Xe G7 80EUs, i5-1135G7 | LG Gram 14Z90P-G.AA79G Iris Xe G7 96EUs, i7-1165G7, SK Hynix PC601 1TB HFS001TD9TNG | HP Envy 13-ba1475ng GeForce MX450, i7-1165G7, Intel SSD 660p SSDPEKNW512G8 | |
|---|---|---|---|---|---|
| Noise | 4% | -5% | 11% | 2% | |
| apagado / medio ambiente * (dB) | 24 | 24.3 -1% | 26 -8% | 26 -8% | 24.6 -3% |
| Idle Minimum * (dB) | 24 | 24.3 -1% | 26 -8% | 26 -8% | 24.6 -3% |
| Idle Average * (dB) | 32 | 26.9 16% | 27.5 14% | 26 19% | 24.6 23% |
| Idle Maximum * (dB) | 33 | 28.8 13% | 36.4 -10% | 26 21% | 30.2 8% |
| Load Average * (dB) | 34 | 36.8 -8% | 41.6 -22% | 30.5 10% | 39.9 -17% |
| Witcher 3 ultra * (dB) | 42 | ||||
| Load Maximum * (dB) | 45 | 43.7 3% | 41.8 7% | 30.5 32% | 43.4 4% |
* ... más pequeño es mejor
Ruido
| Ocioso |
| 24 / 32 / 33 dB(A) |
| Carga |
| 34 / 45 dB(A) |
 | ||
30 dB silencioso 40 dB(A) audible 50 dB(A) ruidosamente alto |
||
min: | ||
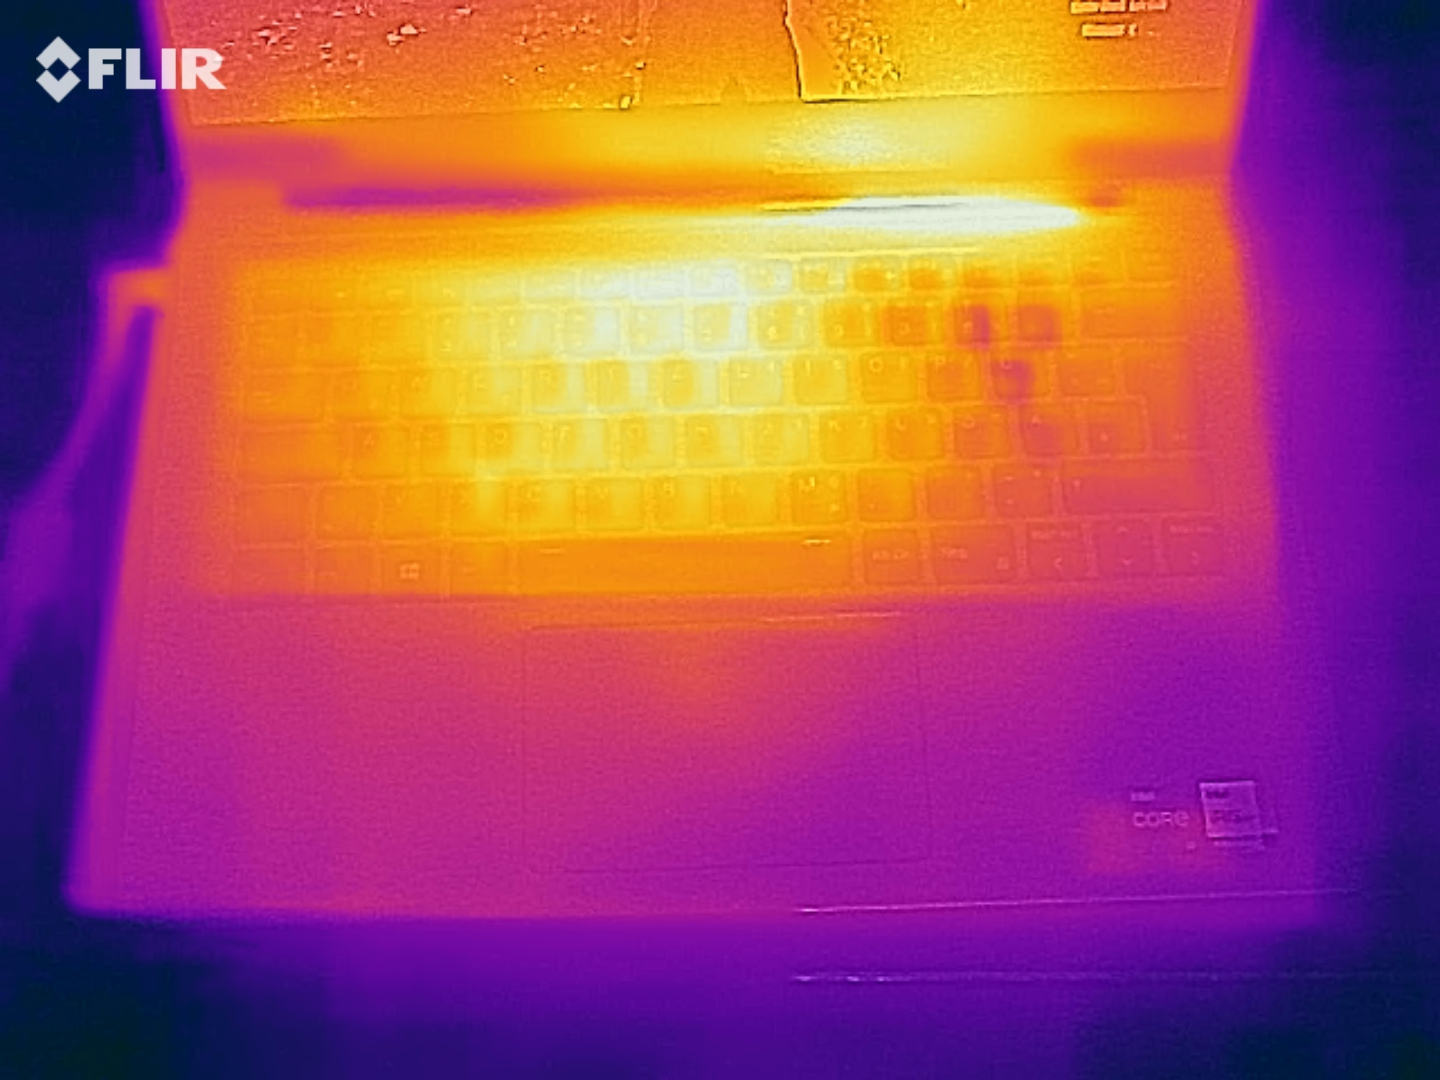
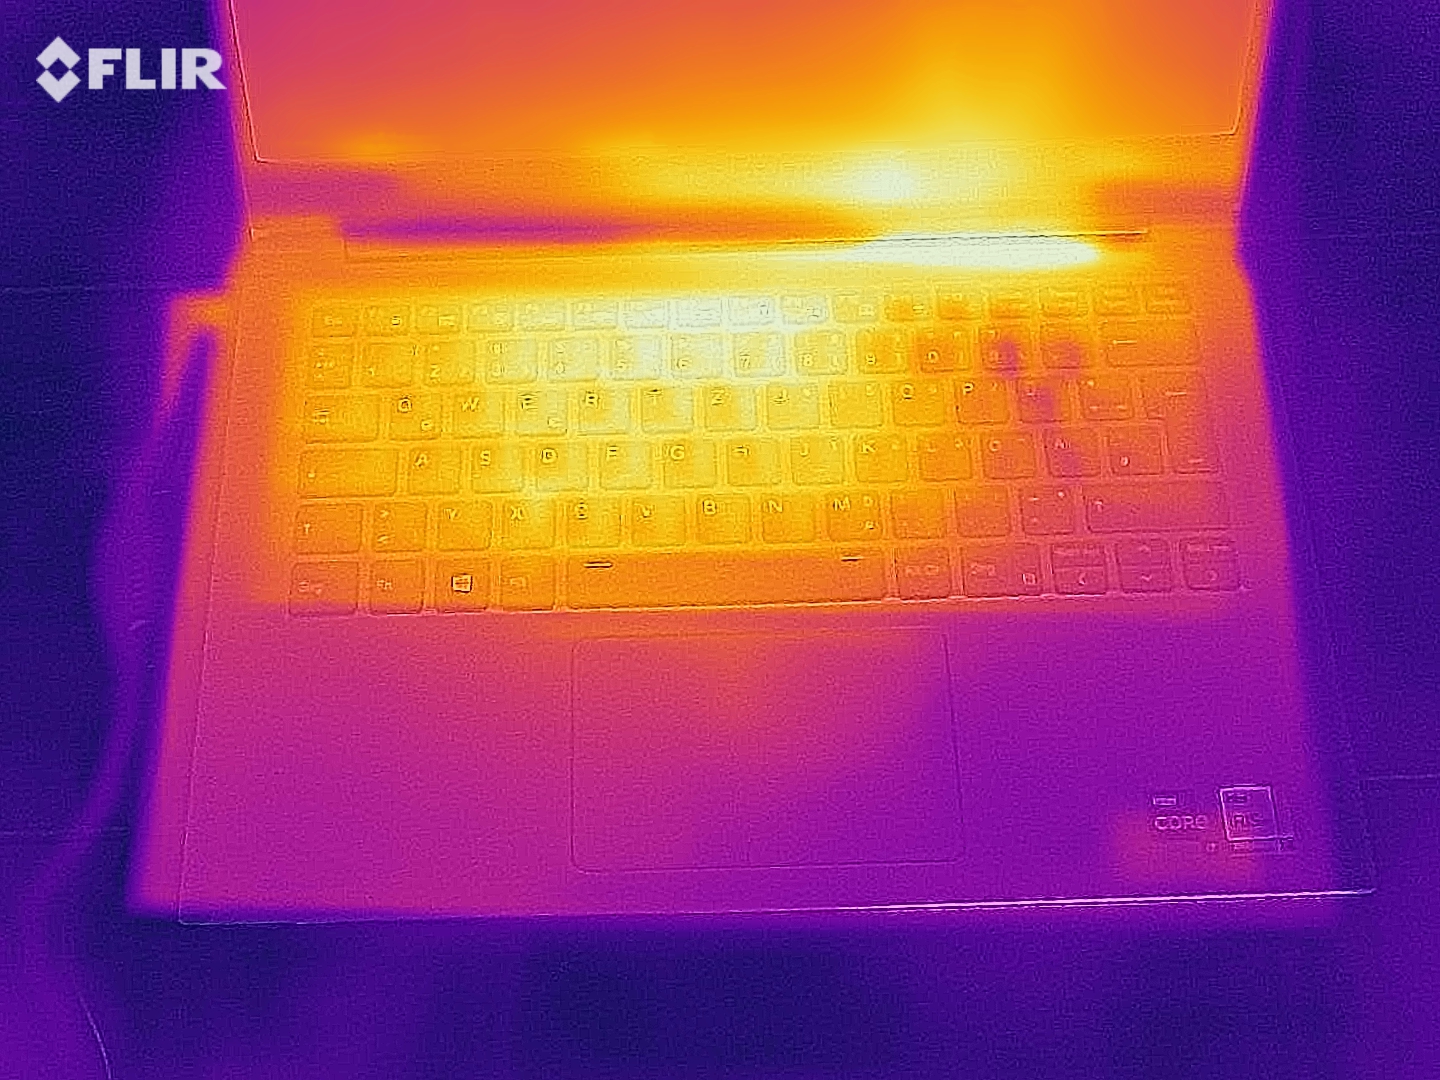
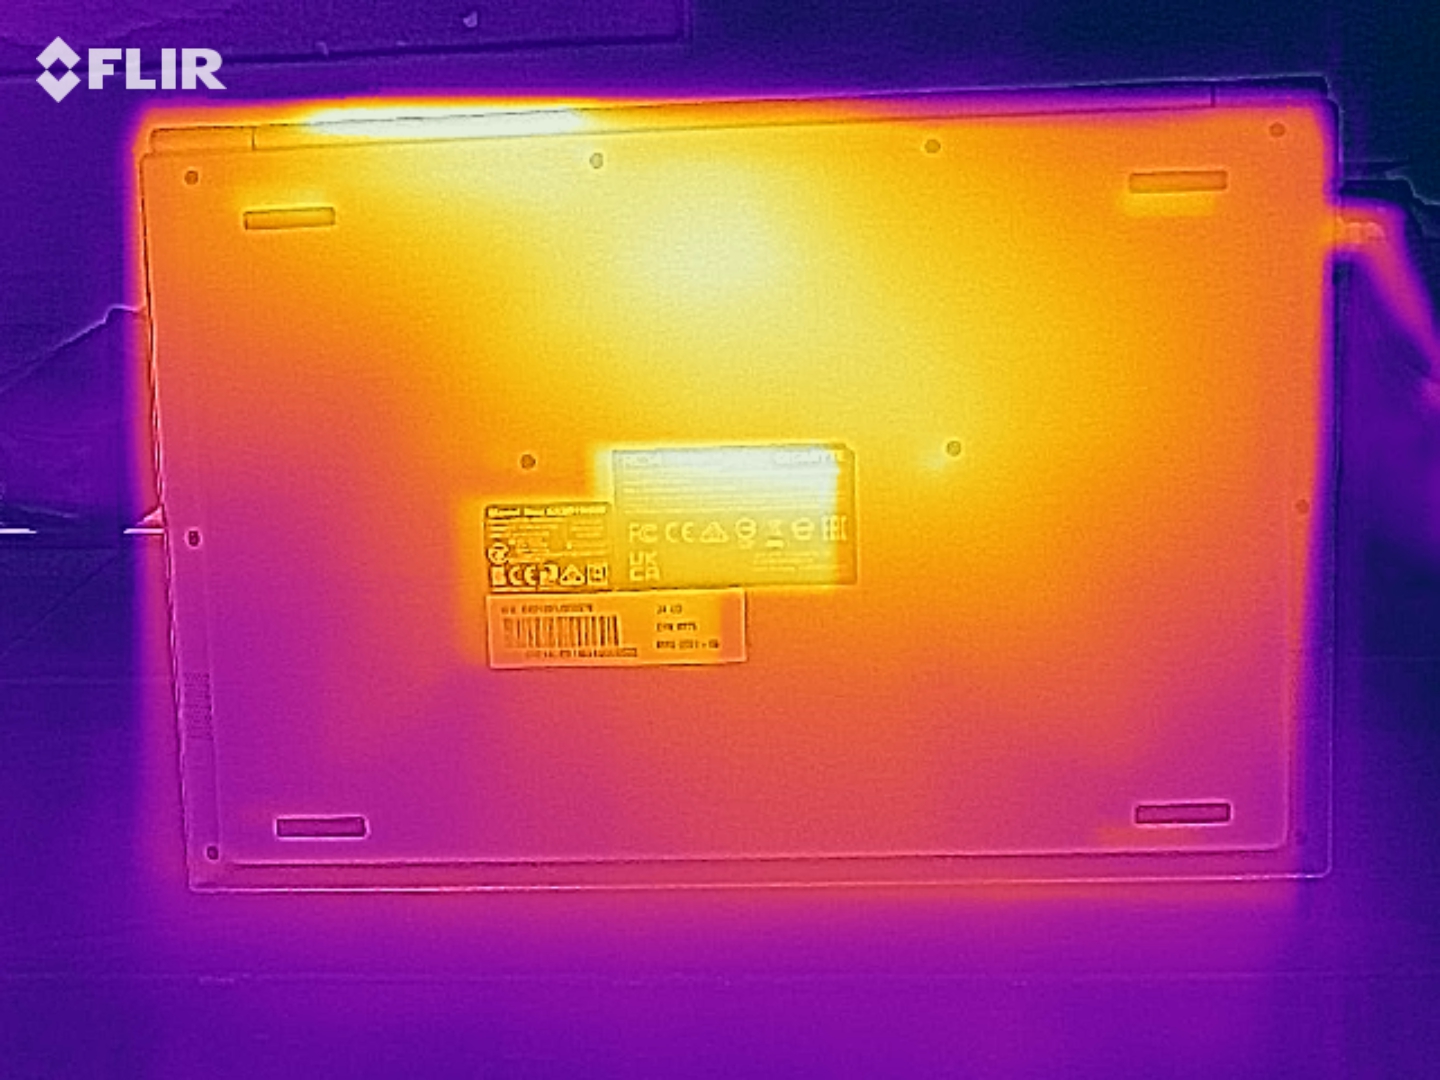
Temperatura
La temperatura del dispositivo se mantiene constantemente por debajo de los 30 °C en reposo. La zona de reposo de la palma de la mano apenas está más caliente que la temperatura ambiente. Bajo carga, los valores aumentan un máximo de 10 °C, por lo que sólo se alcanzan valores máximos de 37 °C. En resumen: el Gigabyte U4 UD se mantiene agradablemente fresco
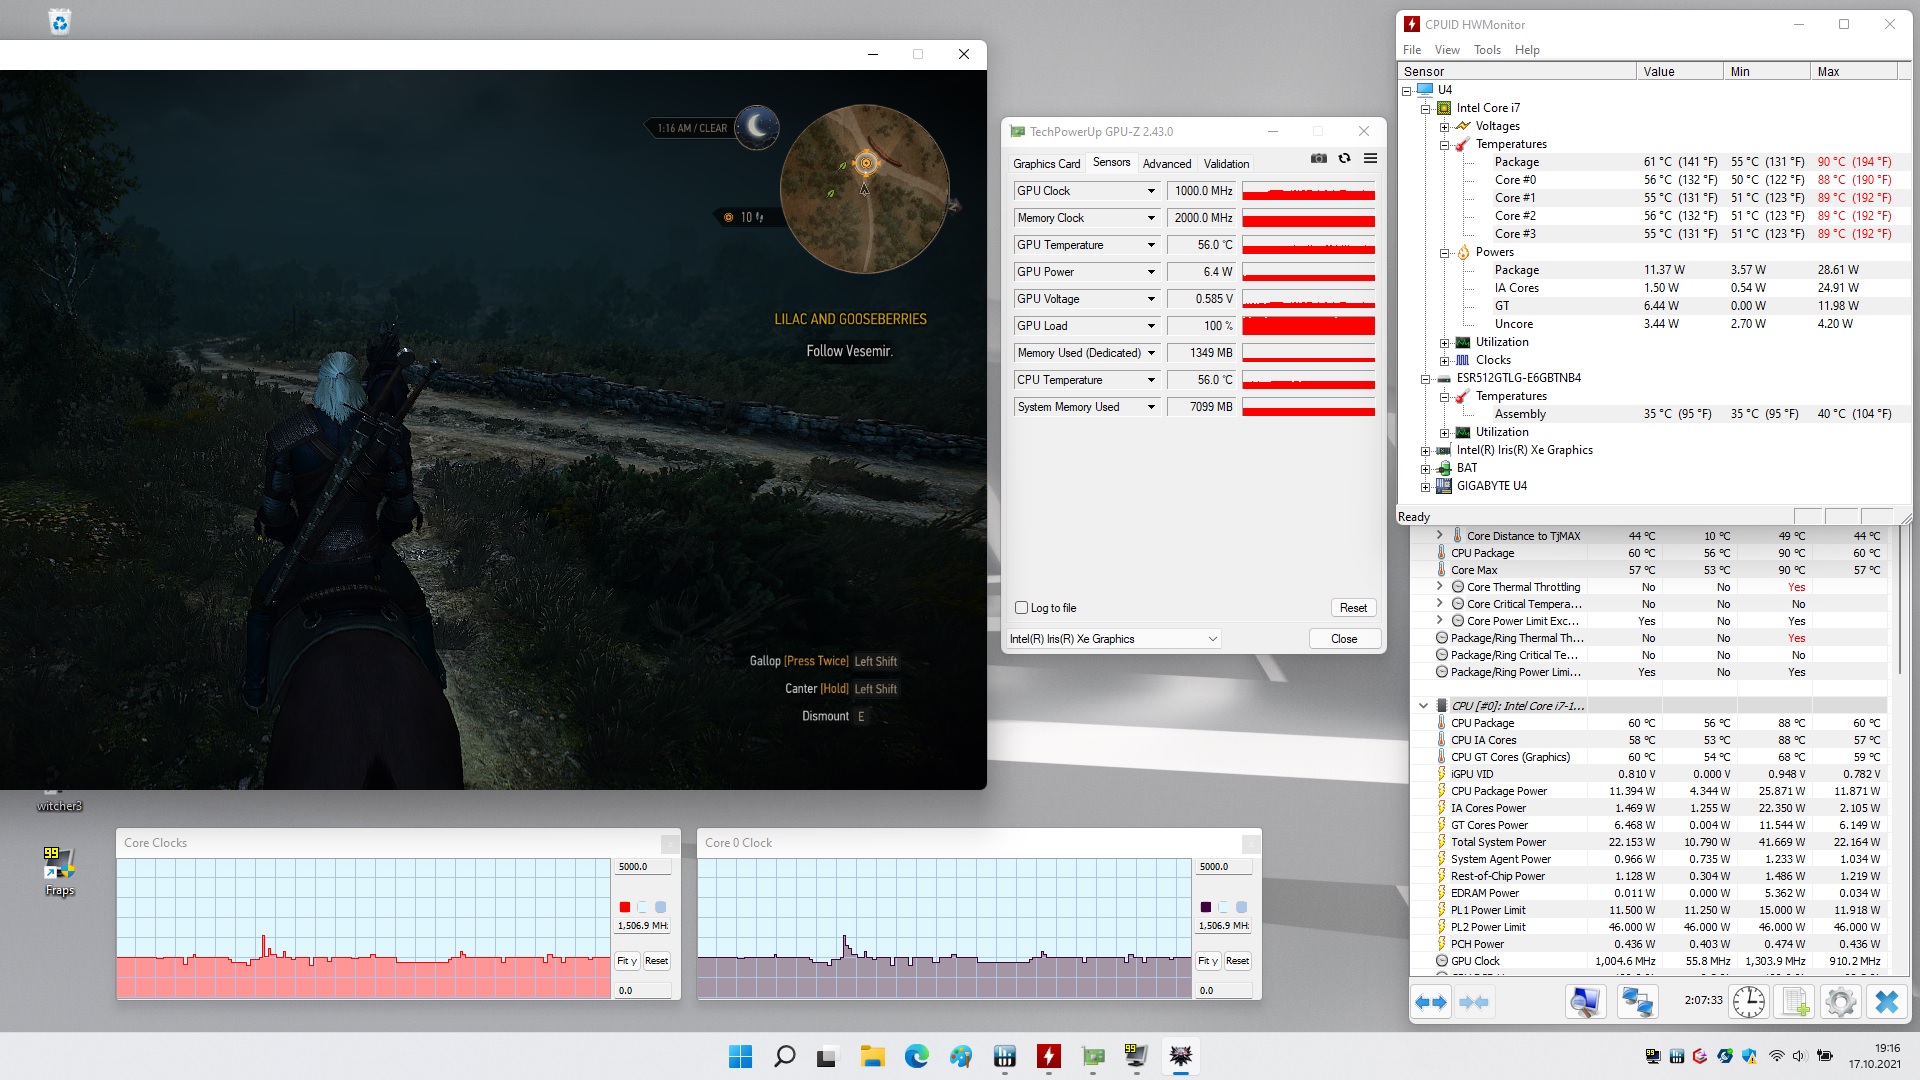
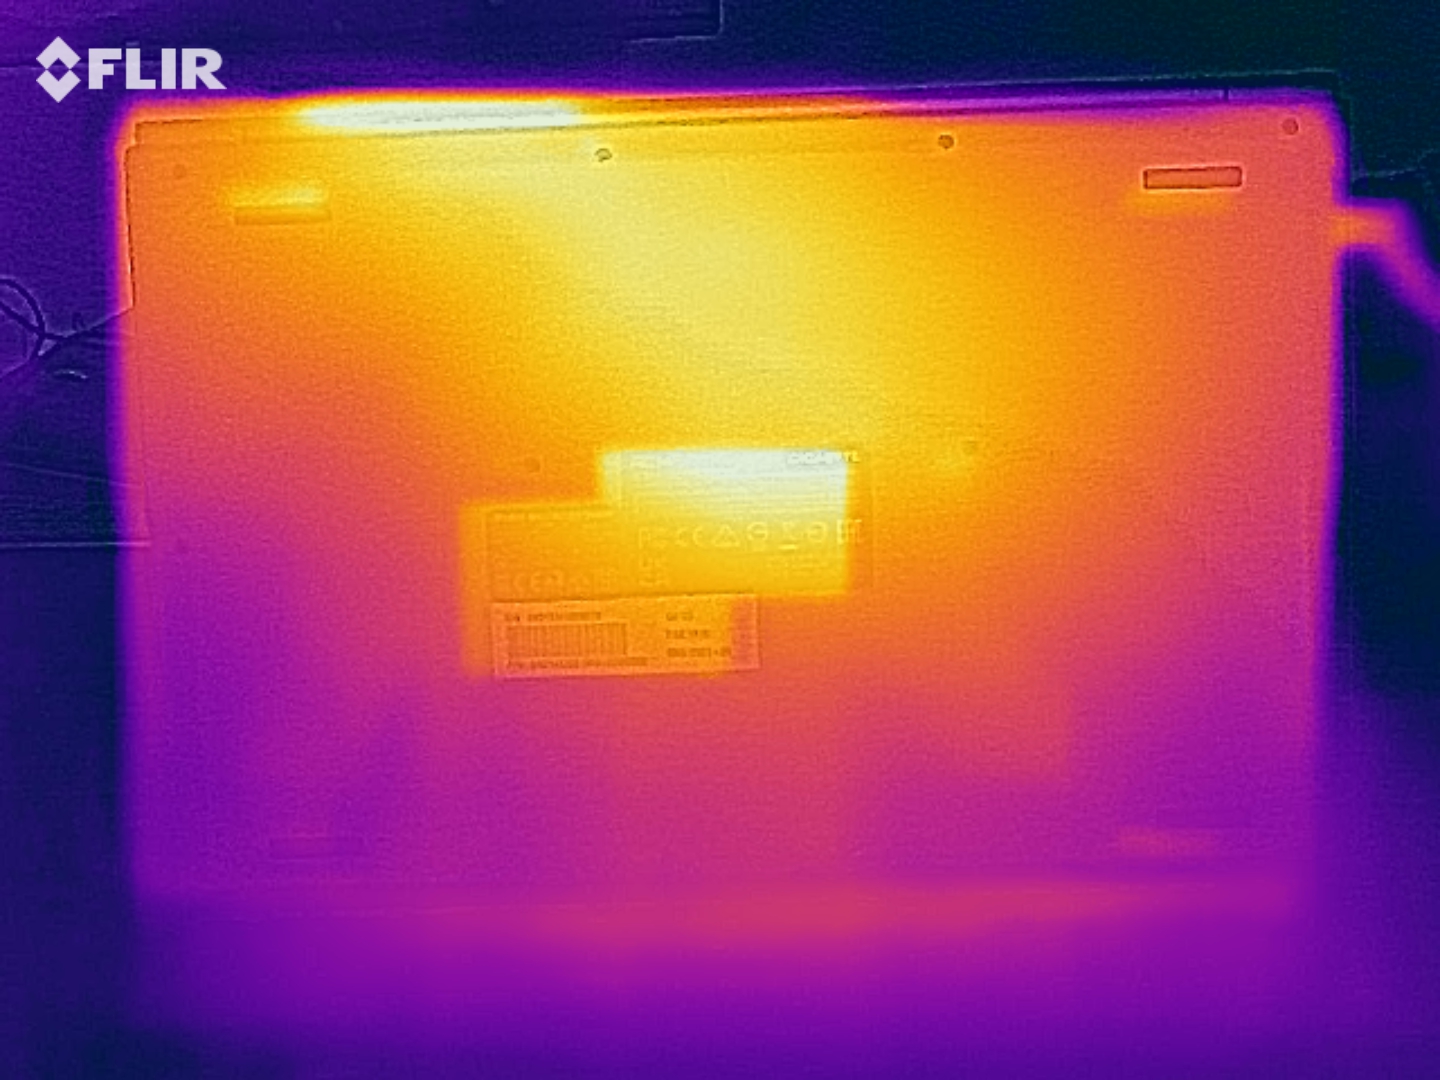
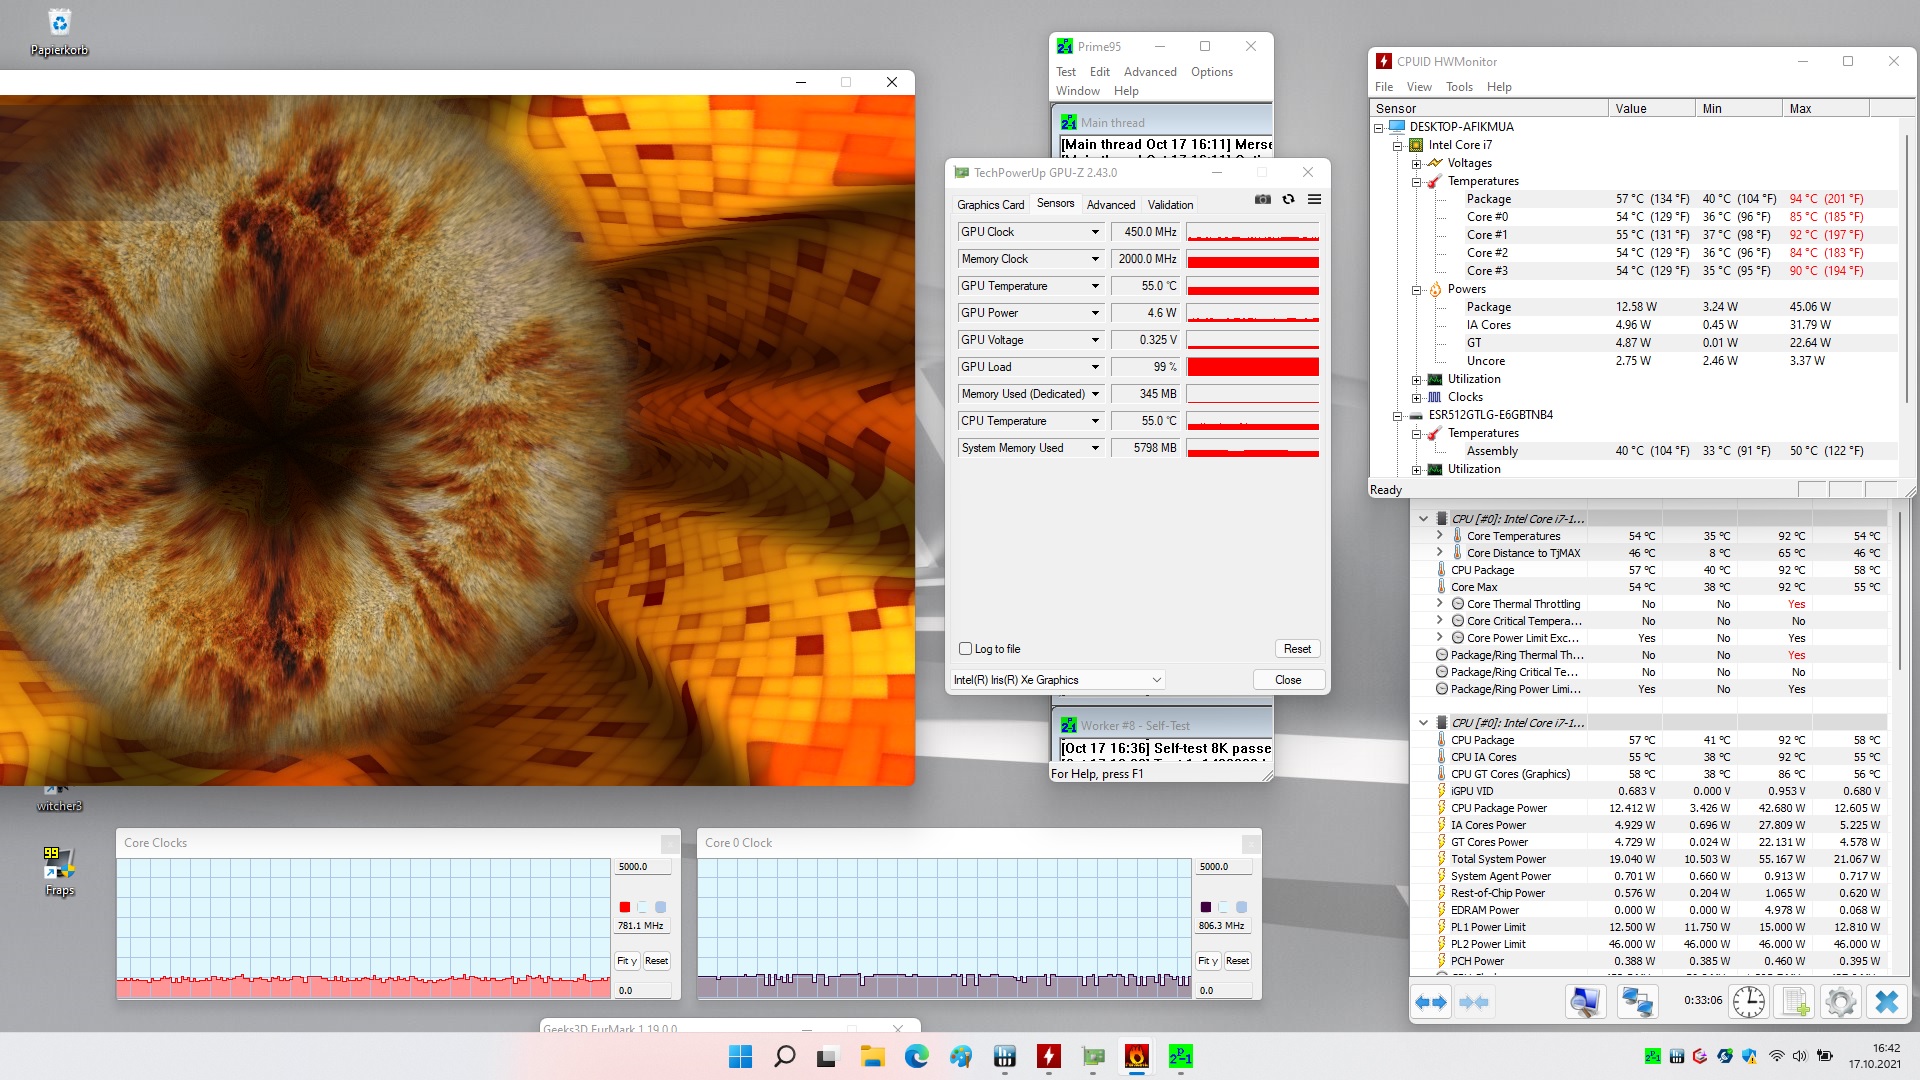
Prueba de esfuerzo
El U4 muestra ralentización con el tiempo en nuestra prueba de estrés estandarizada. Tras un breve pico, las velocidades de reloj en particular caen a un nivel muy bajo. A largo plazo, la CPU se asienta en torno a los 800 MHz (por debajo de la velocidad base) y la GPU en 450 MHz (en torno a la velocidad mínima). Sin embargo, esto sigue provocando temperaturas moderadas de alrededor de 55 °C (~131 °F). Esto también explica las frescas temperaturas externas del dispositivo
(+) La temperatura máxima en la parte superior es de 37 °C / 99 F, frente a la media de 35.9 °C / 97 F, que oscila entre 21.4 y 59 °C para la clase Subnotebook.
(+) El fondo se calienta hasta un máximo de 37 °C / 99 F, frente a la media de 39.2 °C / 103 F
(+) En reposo, la temperatura media de la parte superior es de 26.4 °C / 80# F, frente a la media del dispositivo de 30.8 °C / 87 F.
(+) Jugando a The Witcher 3, la temperatura media de la parte superior es de 31.6 °C / 89 F, frente a la media del dispositivo de 30.8 °C / 87 F.
(+) El reposamanos y el panel táctil están a una temperatura inferior a la de la piel, con un máximo de 28 °C / 82.4 F y, por tanto, son fríos al tacto.
(±) La temperatura media de la zona del reposamanos de dispositivos similares fue de 28.2 °C / 82.8 F (+0.2 °C / 0.4 F).
Altavoces
Los dos altavoces estéreo del Gigabyte U4 UD no son nada del otro mundo. Aparte de los bajos casi inexistentes, en realidad carecen de cualquier debilidad importante. Sin embargo, la música en particular no suena muy bien debido a la falta de graves; suena bastante estridente. Esta valoración está respaldada por el hecho de que el 80% de los portátiles que hemos analizado hasta ahora y el 85% de todos los subportátiles han sonado mejor que este candidato
Gigabyte U4 UD análisis de audio
(±) | la sonoridad del altavoz es media pero buena (75 dB)
Graves 100 - 315 Hz
(-) | casi sin bajos - de media 26.7% inferior a la mediana
(±) | la linealidad de los graves es media (10.4% delta a frecuencia anterior)
Medios 400 - 2000 Hz
(±) | medias más altas - de media 8.1% más altas que la mediana
(±) | la linealidad de los medios es media (13.7% delta respecto a la frecuencia anterior)
Altos 2 - 16 kHz
(+) | máximos equilibrados - a sólo 2% de la mediana
(±) | la linealidad de los máximos es media (8% delta a frecuencia anterior)
Total 100 - 16.000 Hz
(±) | la linealidad del sonido global es media (28.3% de diferencia con la mediana)
En comparación con la misma clase
» 90% de todos los dispositivos probados de esta clase eran mejores, 2% similares, 8% peores
» El mejor tuvo un delta de 5%, la media fue 18%, el peor fue ###max##%
En comparación con todos los dispositivos probados
» 86% de todos los dispositivos probados eran mejores, 3% similares, 12% peores
» El mejor tuvo un delta de 4%, la media fue 23%, el peor fue ###max##%
Apple MacBook 12 (Early 2016) 1.1 GHz análisis de audio
(+) | los altavoces pueden reproducir a un volumen relativamente alto (#83.6 dB)
Graves 100 - 315 Hz
(±) | lubina reducida - en promedio 11.3% inferior a la mediana
(±) | la linealidad de los graves es media (14.2% delta a frecuencia anterior)
Medios 400 - 2000 Hz
(+) | medios equilibrados - a sólo 2.4% de la mediana
(+) | los medios son lineales (5.5% delta a la frecuencia anterior)
Altos 2 - 16 kHz
(+) | máximos equilibrados - a sólo 2% de la mediana
(+) | los máximos son lineales (4.5% delta a la frecuencia anterior)
Total 100 - 16.000 Hz
(+) | el sonido global es lineal (10.2% de diferencia con la mediana)
En comparación con la misma clase
» 7% de todos los dispositivos probados de esta clase eran mejores, 2% similares, 90% peores
» El mejor tuvo un delta de 5%, la media fue 18%, el peor fue ###max##%
En comparación con todos los dispositivos probados
» 5% de todos los dispositivos probados eran mejores, 1% similares, 94% peores
» El mejor tuvo un delta de 4%, la media fue 23%, el peor fue ###max##%
Consumo de energía subóptimo + batería pequeña = corta duración de la batería
El Gigabyte U4 UD queda un poco por detrás de nuestros competidores elegidos en términos de consumo medio de energía. Con un consumo en inactivo de 10 vatios, el dispositivo no puede seguir el ritmo de la competencia. Lo mismo ocurre con el MSI Prestige 14 equipado con la misma CPU. Una razón podría ser la pantalla muy brillante. La capacidad del adaptador de corriente de 65 vatios es suficiente, ya que medimos un consumo máximo de 62 vatios
| Off / Standby | |
| Ocioso | |
| Carga |
|
Clave:
min: | |
| Gigabyte U4 UD i7-1195G7, Iris Xe G7 96EUs, , IPS, 1920x1080, 14" | MSI Prestige 14 Evo A11MO-026US i7-1195G7, Iris Xe G7 96EUs, Samsung PM9A1 MZVL2512HCJQ, IPS, 1920x1080, 14" | Dell Inspiron 13 5301-0D0XN i5-1135G7, Iris Xe G7 80EUs, , IPS, 1920x1080, 13.3" | LG Gram 14Z90P-G.AA79G i7-1165G7, Iris Xe G7 96EUs, SK Hynix PC601 1TB HFS001TD9TNG, IPS, 1920x1200, 14" | HP Envy 13-ba1475ng i7-1165G7, GeForce MX450, Intel SSD 660p SSDPEKNW512G8, IPS, 1920x1080, 13.3" | Media de la clase Subnotebook | |
|---|---|---|---|---|---|---|
| Power Consumption | 8% | 10% | 38% | 26% | 17% | |
| Idle Minimum * (Watt) | 6 | 3.4 43% | 4.4 27% | 2.5 58% | 3.4 43% | 3.71 ? 38% |
| Idle Average * (Watt) | 10 | 5.2 48% | 9.1 9% | 5.3 47% | 4.9 51% | 6.54 ? 35% |
| Idle Maximum * (Watt) | 14 | 5.8 59% | 11 21% | 9.5 32% | 5.7 59% | 7.89 ? 44% |
| Load Average * (Watt) | 33 | 52.8 -60% | 37.1 -12% | 26.2 21% | 39.6 -20% | 42.1 ? -28% |
| Witcher 3 ultra * (Watt) | 30.2 | 40.5 -34% | 36.8 -22% | |||
| Load Maximum * (Watt) | 62 | 65.6 -6% | 39 37% | 42.8 31% | 64.4 -4% | 65.1 ? -5% |
* ... más pequeño es mejor
Energy consumption during The Witcher 3
Duración de la batería
Debido al consumo mencionado anteriormente y a la batería de 36,7 Wh, que es la más pequeña de nuestra comparativa, la duración de la batería no dejará a nadie boquiabierto. El dispositivo dura algo menos de 2 horas bajo carga, alrededor de 4:30 horas cuando navega con brillo reducido, y alrededor de 5:30 horas cuando ve vídeos con una sola carga de batería. Esto no es suficiente para intimidar a la competencia, y también está muy por detrás de la media de los subportátiles.
Usar el bajo peso como excusa no es aplicable en este caso. El LG Gram pesa igual de poco, pero tiene una batería que es el doble de grande, y se las arregla para sacarle mucho más partido. Eso sí, también es considerablemente más caro.
| Gigabyte U4 UD i7-1195G7, Iris Xe G7 96EUs, 36.7 Wh | MSI Prestige 14 Evo A11MO-026US i7-1195G7, Iris Xe G7 96EUs, 52 Wh | Dell Inspiron 13 5301-0D0XN i5-1135G7, Iris Xe G7 80EUs, 40 Wh | LG Gram 14Z90P-G.AA79G i7-1165G7, Iris Xe G7 96EUs, 72 Wh | HP Envy 13-ba1475ng i7-1165G7, GeForce MX450, 51 Wh | Media de la clase Subnotebook | |
|---|---|---|---|---|---|---|
| Duración de Batería | 89% | -0% | 186% | 131% | 132% | |
| H.264 (h) | 5.4 | 4.4 -19% | 19.2 256% | 15.3 ? 183% | ||
| WiFi v1.3 (h) | 4.5 | 8.5 89% | 6 33% | 14.2 216% | 10.4 131% | 14.1 ? 213% |
| Load (h) | 2 | 1.7 -15% | 3.7 85% | 1.998 ? 0% | ||
| Reader / Idle (h) | 11.7 | 48.8 | 28.6 ? |
Pro
Contra
Veredicto: El Gigabyte U4 UD desperdicia su potencial en la prueba
Con el U4 UD, Gigabyte ofrece un subportátil compacto que resulta especialmente atractivo por su peso inferior a 1 kg. Su fabricación es de alta calidad, y su diseño es sobrio.
La CPU integrada promete mucho rendimiento desde el principio, pero Gigabyte no la explota del todo. Como resultado, el dispositivo suele aguantar frente a los modelos de comparación con CPUs más lentas, pero se queda corto respecto a las expectativas.
Esto también se aplica a la GPU y, en consecuencia, al rendimiento de juego. No obstante, es suficiente para una ronda de juegos en los dos niveles gráficos más bajos - no se puede esperar más de la mayoría de los subportátiles.
Mientras que la configuración de puertos está bien, el Gigabyte U4 UD tiene que aguantar las críticas cuando se trata de otros aspectos importantes, como la duración de la batería. Por un lado, esto se debe a las tasas de consumo relativamente altas, y por otro, al hecho de que el dispositivo tiene la batería más pequeña del campo de pruebas.
En general, el Gigabyte U4 UD ofrece un rendimiento sólido en nuestra prueba, pero también se pierde una calificación aún mejor y una recomendación de compra absoluta debido a algunos puntos de crítica. Por tanto, el dispositivo es adecuado principalmente para posibles compradores que busquen un subportátil particularmente ligero a un precio bajo, pero que no tengan expectativas especialmente altas en términos de aguante.
Si una duración media de unas 4 horas no es suficiente, los usuarios deberían considerar elLG Gram 14Z90P-G.AA79G que, sin embargo, es mucho más caro. Y los que busquen aún más rendimiento estarán satisfechos con el MSI Prestige 14 Evo A11MO-026US que cuenta con la misma combinación de CPU y GPU.
Precio y disponibilidad
En el momento de escribir este artículo, el Gigabyte U4 UD (Intel Core i7-1195G7,Gráficos Intel Iris Xe G7 96EUs, 16 GB de RAM DDR4, 512 GB de SSD) se puede encontrar en Amazon por unos 1.060 dólares.
Gigabyte U4 UD
- 11/22/2021 v7 (old)
Marcus Schwarten
Price comparison

