El GeForce MX450 se queda atrás: Análisis del convertible Asus ZenBook Flip 15 Q508U
AMD Ryzen 7 5700U | NVIDIA GeForce MX450 | 15.60" | 1.9 kg

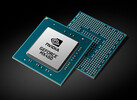
La Nvidia GeForce MX450 (nombre en código N18S-G5, N18S-G5-B, N18S-LP) es una tarjeta gráfica móvil de nivel básico dedicada para portátiles. Utiliza el mismo chip TU117 que la GeForce GTX 1650 pero con un bus de memoria reducido de 64 Bit. Además, la MX450 es la primera GPU móvil con soporte para PCIe Gen 4 x4.
Actualmente hay cuatro versiones diferentes con diferentes especificaciones y rendimiento:
N18S-G5-B: Paquete GBD-128, 1395 - 1575 MHz, GDDR6 5001 MHz, 28,5 W
N18S-G5: Paquete GB2E-64, 1395 - 1575 MHz, GDDR6 5001 MHz, 25 W
N18S-G5: Paquete GB2E-64, 1395 - 1575 MHz, GDDR5 3501 MHz, 25 W
N18S-LP: Paquete GB2E-64, 720 - 930 MHz, GDDR6 5001 MHz, 12 W
Especialmente la variante de baja potencia LP = Low Power es significativamente más lenta que la típica variante de 25 vatios.
La GDDR6 N18S-G5 de 25 vatios debería ser hasta un 20% más rápida que una GeForce GTX 1050 pero, por supuesto, inferior a una GTX 1650 (Max-Q). Por lo tanto, los juegos exigentes como Horizon Zero Dawn deberían tener la configuración más baja. Los juegos menos exigentes como F1 2020 se pueden jugar en configuraciones medias y altas y en Full HD.
El chip TU117 se fabrica en 12nm en TSMC y gracias al relativamente bajo consumo de energía (TGP especificado entre 12 y 28,5 W) el dGPU también es adecuado para portátiles delgados y ligeros. En su mayor parte está pensada como una tarjeta gráfica adicional para portátiles con base en Tiger Lake-U.
GeForce MX300 Serie
| ||||||||||
| Nombre Código | N17S-G5 / GP107-670-A1 | |||||||||
| Arquitectura | Turing | |||||||||
| Pipelines | 896 - unificado | |||||||||
| TMUs | 56 | |||||||||
| ROPs | 16 | |||||||||
| Velocidad del núcleo | 1395 - 1575 (Boost) MHz | |||||||||
| Velocidad de Memoria | 10000 effective = 1250 MHz | |||||||||
| Ancho de Bus de Memoria | 64 Bit | |||||||||
| Tipo de Memoria | GDDR5, GDDR6 | |||||||||
| Max. Cantidad de Memoria | 2048 MB | |||||||||
| Memoria Compartida | no | |||||||||
| Memory Bandwidth | 80 GB/s | |||||||||
| API | DirectX 12_1, OpenGL 4.6 | |||||||||
| Consumo de corriente | 25 Watt (12 - 29 Watt TGP) | |||||||||
| Conteo de Transistores | 4.7 Billion | |||||||||
| Tamaño del troquel | 200 mm² | |||||||||
| tecnología | 12 nm | |||||||||
| PCIe | 4.0 | |||||||||
| Características | Vulkan 1.1, OpenGL 4.6, OpenCL 1.2, GPU Boost 3.0, Multi Monitor, Optimus, PCIe 3.0, GameWorks | |||||||||
| Fecha de Anuncio | 01.08.2020 | |||||||||
Los siguientes benchmarks se derivan de nuestros benchmarks de los portátiles de análisis. El rendimiento depende de la memoria gráfica utilizada, velocidad de reloj, procesador, configuración del sistema, controladores y sistemas operativos. Así que los resultados no tienen que ser representativos de todos los portátiles con esta GPU. Para información más detallada sobre los resultados del benchmark, haga clic en el número de fps.


Para ver más juegos jugables y una lista de todos los juegos y tarjetas gráficas visita nuestroListado de juegos


Dell Inspiron 13 5310-NJ24J: Intel Core i5-11300H, 13.30", 1.3 kg
análise » Análisis del Dell Inspiron 13 5310: Más gráficos, más duración de la batería
Lenovo IdeaPad 5 Pro 16IHU6: Intel Core i5-11300H, 16.00", 1.9 kg
análise » Análisis del Lenovo IdeaPad 5 Pro 16IHU6: Un todoterreno de 16 pulgadas con una buena duración de la batería
HP Envy 17-cg: Intel Core i5-1135G7, 17.30", 2.7 kg
análise » Análisis del HP Envy 17 cg1356ng: Un gran portátil multimedia
MSI Modern 14 B11SB-085: Intel Core i7-1165G7, 14.00", 1.3 kg
análise » Análisis del MSI Modern 14 B11SB: El todoterreno de 14 pulgadas sufre el desarrollo del calor
Xiaomi RedmiBook Pro 15: Intel Core i7-11370H, 15.60", 1.7 kg
análise » Análisis del Xiaomi RedmiBook Pro 15 (2021): Un portátil asequible con sólidas características
HP Pavilion 15-eg: Intel Core i7-1165G7, 15.60", 1.7 kg
análise » Análisis del portátil HP Pavilion 15 (2021): Combo Intel de 11ª generación y GeForce MX450
Lenovo ThinkPad T14 Gen2-20W1S00000: Intel Core i7-1165G7, 14.00", 1.5 kg
análise » Análisis del portátil Lenovo ThinkPad T14 Gen 2: Ventajas conocidas de Intel Tiger Lake
Lenovo ThinkPad T15 Gen2-20W5S00100: Intel Core i7-1165G7, 15.60", 1.9 kg
análise » Análisis del portátil Lenovo ThinkPad T15 Gen2: Negocio combinado con GPU multimedia y Tiger Lake
Lenovo ThinkPad E15 Gen2-20TD002MGE: Intel Core i7-1165G7, 15.60", 1.8 kg
análise » Análisis del Lenovo ThinkPad E15 Gen 2: Tiger Lake portátil con una Nvidia GeForce MX450
Asus Zenbook 14 UX435EG: Intel Core i7-1165G7, 14.00", 1.3 kg
análise » Asus ZenBook 14 UX435EG Review: Un compacto y móvil multimedia allrounder con una pantalla táctil innecesaria
Asus Zenbook Flip 15 UM562UG-AC018WS: AMD Ryzen 7 5700U, 15.60", 1.9 kg
análise externo » Asus Zenbook Flip 15 UM562UG-AC018WS
HP Envy 17-ch1056nf: Intel Core i7-1195G7, 17.30", 2.5 kg
análise externo » HP Envy 17-ch1056nf
Dell Inspiron 15 5510, i7-11390H MX450: Intel Core i7-11390H, 15.60", 1.6 kg
análise externo » Dell Inspiron 15 5510, i7-11390H MX450
Dell Inspiron 15 5518-NP37P: Intel Core i5-11320H, 15.60", 1.8 kg
análise externo » Dell Inspiron 15 5518-NP37P
Lenovo Yoga Slim 7 Pro 14IHU5-82NH002QGE: Intel Core i7-11370H, 14.00", 1.4 kg
análise externo » Lenovo Yoga Slim 7 Pro 14IHU5-82NH002QGE
Acer Aspire 5 A517-52G-59GP: Intel Core i5-1135G7, 17.30", 2.6 kg
análise externo » Acer Aspire 5 A517-52G-59GP
Lenovo Yoga Slim 7 Pro 14 OLED Ryzen 9: AMD Ryzen 9 5900HS, 14.00", 1.4 kg
análise externo » Lenovo Yoga Slim 7 Pro 14 OLED Ryzen 9
Dell Latitude 15 5521, i5-11500H MX450: Intel Core i5-11500H, 15.60", 1.8 kg
análise externo » Dell Latitude 15 5521, i5-11500H MX450
MSI Modern 14 B11SB, i5-1135G7 MX450: Intel Core i5-1135G7, 14.00", 1.3 kg
análise externo » MSI Modern 14 B11SB, i5-1135G7 MX450
Asus Zenbook 14X UX5400EG, i5-1135G7: Intel Core i5-1135G7, 14.00", 1.4 kg
análise externo » Asus Zenbook 14X UX5400EG, i5-1135G7
HP Envy 13-ba1002ns: Intel Core i7-1165G7, 13.30", 1.3 kg
análise externo » HP Envy 13-ba1002ns
Lenovo Yoga Slim 7 Carbon 14ACN6, 5800U: AMD Ryzen 7 5800U, 14.00", 1.1 kg
análise externo » Lenovo Yoga Slim 7 Carbon 14ACN-6, 5800U
Lenovo Yoga Slim 7 Pro 14ARH5-82NK001PSB: AMD Ryzen 9 5900HS, 14.00", 1.3 kg
análise externo » Lenovo Yoga Slim 7 Pro 14ARH5-82NK001PSB
Asus Zenbook 14X UX5400E: Intel Core i7-1165G7, 14.00", 1.4 kg
análise externo » Asus Zenbook 14X UX5400E
HP Envy 13-ba1012ns: Intel Core i7-1165G7, 13.30", 1.3 kg
análise externo » HP Envy 13-ba1012ns
HP Pavilion 15-eg0006ns: Intel Core i7-1165G7, 15.60", 1.8 kg
análise externo » HP Pavilion 15-eg0006ns
HP Pavilion 15-eg0007ns: Intel Core i7-1165G7, 15.60", 1.8 kg
análise externo » HP Pavilion 15-eg0007ns
HP Envy 17-ch0000ns: Intel Core i7-1165G7, 17.30", 2.5 kg
análise externo » HP Envy 17-ch0000ns
MSI Prestige 15 A11SB-449: Intel Core i5-1135G7, 15.60", 1.7 kg
análise externo » MSI Prestige 15 A11SB-449
HP Pavilion 15-eg: Intel Core i7-1165G7, 15.60", 1.7 kg
análise externo » HP Pavilion 15-eg0025cl
MSI Modern 14 B11SB-008ES: Intel Core i7-1165G7, 14.00", 1.3 kg
análise externo » MSI Modern 14 B11SB-008ES
MSI Modern 15 A11SB-011ES: Intel Core i7-1165G7, 15.60", 1.6 kg
análise externo » MSI Modern 15 A11SB-011ES
Xiaomi Mi Notebook Pro 15, i5-11300H MX450: Intel Core i5-11300H, 15.60", 1.8 kg
análise externo » Xiaomi Mi Notebook Pro 15, i5-11300H MX450
HP Envy 17-cg1000ns: Intel Core i7-1165G7, 17.30", 2.7 kg
análise externo » HP Envy 17-cg1000ns
Xiaomi RedmiBook Pro 14 2021, i7-1165G7 MX450: Intel Core i7-1165G7, 14.00", 1.5 kg
análise externo » Xiaomi RedmiBook Pro 14 2021, i7-1165G7 MX450
Xiaomi RedmiBook Pro 15, i5-11300H MX450: Intel Core i5-11300H, 15.60", 1.7 kg
análise externo » Xiaomi RedmiBook Pro 15, i5-11300H MX450
HP Pavilion 14-dv0005ns: Intel Core i7-1165G7, 14.00", 1.4 kg
análise externo » HP Pavilion 14-dv0005ns
Lenovo IdeaPad 5 14ITL05-82FE005QGE: Intel Core i7-1165G7, 14.00"
análise externo » Lenovo IdeaPad 5 14ITL05-82FE005QGE
MSI Modern 14 B11SB-009XES: Intel Core i7-1165G7, 14.00", 1.3 kg
análise externo » MSI Modern 14 B11SB-009XES
HP Envy 13-ba1033tx: Intel Core i7-1165G7, 13.30", 1.3 kg
análise externo » HP Envy 13-ba1033tx
HP Pavilion 14-dv0065tx: Intel Core i5-1135G7, 14.00", 1.4 kg
análise externo » HP Pavilion 14-dv0065tx
HP Pavilion 14-dv0067tx: Intel Core i7-1165G7, 14.00", 1.5 kg
análise externo » HP Pavilion 14-dv0067tx
Lenovo Yoga Slim 7i Pro: Intel Core i7-1165G7, 14.00", 1.5 kg
análise externo » Lenovo Yoga Slim 7i Pro
HP Envy 17-cg1490nd : Intel Core i7-1165G7, 17.30", 2.8 kg
análise externo » HP Envy 17-cg1490nd
Asus Zenbook 14 UX435EG: Intel Core i7-1165G7, 14.00", 1.3 kg
análise externo » Asus Zenbook 14 UX435EG
MSI Modern 15 A11SB-039RU: Intel Core i7-1165G7, 15.60", 1.6 kg
análise externo » MSI Modern 15 A11SB-039RU
HP Envy 17-cg1279ng: Intel Core i7-1165G7, 17.30", 2.7 kg
análise externo » HP Envy 17-cg1279ng
Asus ZenBook Flip 15 Q508U: AMD Ryzen 7 5700U, 15.60", 1.9 kg
» La serie Nvidia GeForce MX lucha contra la AMD Radeon 680M
Lenovo Yoga Slim 7 Pro 14 OLED Ryzen 9: AMD Ryzen 9 5900HS, 14.00", 1.4 kg
» El Alder Lake de Intel es más lento que el Cezanne Zen 3 de AMD con un TDP de 45W
HP Pavilion 15-eg: Intel Core i7-1165G7, 15.60", 1.7 kg
» Nvidia dio a los fabricantes de portátiles una puntuación inútil y exagerada en 3DMark GeForce MX450 que ha resultado imposible de alcanzar
Asus Zenbook 14 UX435EG: Intel Core i7-1165G7, 14.00", 1.3 kg
» 12 Vatios GeForce MX450 le gana a la de 25 Vatios GeForce-MX350 - Probando el Asus ZenBook 14 UX435EG
Posición aproximada del adaptador gráfico
Top 10 Análisis
» Top 10 Portátiles Multimedia
» Top 10 Portátiles de Juego
» Top 10 Portátiles de Juego ligeros
» Top 10 Portátiles Asequibles de Oficina/Empresa
» Top 10 Portátiles de Juego Ligeros
» Top 10 Portátiles de Oficina/Empresa Premium
» Top 10 Estaciones de Trabajo
» Top 10 Subportátiles
» Top 10 Ultrabooks
» Top 10 Convertibles
» Top 10 Tablets
» Top 10 Tablets Windows
» Top 10 Tablets de menos de 250 Euros
» Top 10 Phablets (>5.5")
» Top 10 Smartphones
» Top 10 Smartphones (≤5")
» Top 10 Smartphones de menos de 300 Euros
» Top 10 Smartphones de menos de 120 Euros
» Top 10 Portátiles de menos de 1000 Euros
» Top 10 Portátiles de menos de 500 Euros
» Top 10 Portátiles de menos de 300 Euros
» Los Mejores Displays de Portátiles Analizados por Notebookcheck