Análisis para el Intel Core i7-1195G7 procesador
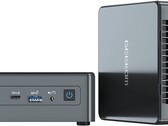
Prueba del PC de sobremesa Geekom Mini IT11 SFF: Sólido y compacto Tiger Lake PC
El Geekom Mini IT11 es un ordenador de sobremesa de formato pequeño y sólido, con muchos puertos y suficiente potencia de la CPU para el trabajo multimedia general. Le cuesta gestionar el calor cuando la iGPU está cargada al máximo. En definitiva, el Mini IT11 es una buena opción por su precio.
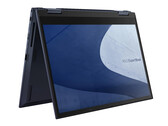
Intel Core i7-1195G7, Iris Xe G7 96EUs, 565 gAnálisis del Asus ExpertBook B7 Flip: portátil 2 en 1 con módem 5G y batería de larga duración
El ExpertBook ofrece un módem 5G, dos puertos Thunderbolt 4 y una pantalla táctil de 14 pulgadas (1920x1200 píxeles) con una relación de aspecto 16:10. La pantalla táctil se puede utilizar tanto mediante la entrada táctil como con el Asus Pen incluido.
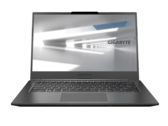
Intel Core i7-1195G7, Iris Xe G7 96EUs, 14", 1.4 kgAnálisis del portátil Gigabyte U4 UD: Ligero con mucho potencial que se desperdicia a veces
Un procesador con una velocidad de hasta 5 GHz combinado con 16 GB de RAM promete un buen rendimiento. Lee nuestro análisis para saber si el compacto de 14 pulgadas Gigabyte U4 UD puede cumplir con estas expectativas, y cómo se comporta en términos de rendimiento gráfico, duración de la batería, etc.
Intel Core i7-1195G7, Iris Xe G7 96EUs, 14", 958 gAnálisis del ultraportátil convertible GPD Pocket 3: Más rápido que muchos portátiles Intel EVO
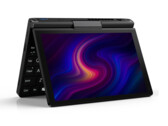
El Pocket 3 de 8 pulgadas incorpora muchas de las características que se encuentran en los portátiles de tamaño completo, incluyendo una CPU Core i7 de 11ª generación, Wi-Fi 6E, SSD PCIe4 NVMe, Thunderbolt 4, y soporte para Windows 11 e incluso RS-232. Sólo encontramos un par de advertencias evidentes que esperamos que las futuras revisiones puedan resolver.
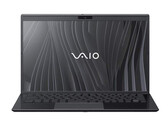
Intel Core i7-1195G7, Iris Xe G7 96EUs, 8", 730 g2021 Análisis del VAIO SX14: El Ultrabook Core i7 de 2500 dólares
Vaio quiere que pagues Apple por un PC con Windows. Mientras que la configuración Core i5 de gama baja tiene un precio decente para lo que se obtiene, nuestra configuración Core i7 de gama alta no ofrece mucho más para justificar su enorme recargo de 700 dólares.
Intel Core i7-1195G7, Iris Xe G7 96EUs, 14", 1.1 kgMSI Prestige 14 Evo A11MO-026US: Intel Iris Xe Graphics G7 96EUs, 14.00", 1.2 kg
análise » Análisis del portátil MSI Prestige 14 Evo: ¿Cuáles son las capacidades del nuevo Core i7-1195G7?
HP 15s-fq4088ns: Intel Iris Xe Graphics G7 96EUs, 15.60", 1.7 kg
análise externo » HP 15s-fq4088ns
Acer Aspire Vero AV15-51-7617: Intel Iris Xe Graphics G7 96EUs, 15.60", 1.8 kg
análise externo » Acer Aspire Vero AV15-51-7617
Infinix Inbook X2 Plus, i7-1195G7: Intel Iris Xe Graphics G7 96EUs, 15.60", 1.7 kg
análise externo » Infinix Inbook X2 Plus, i7-1195G7
HP 15s-fq4009ns: Intel Iris Xe Graphics G7 96EUs, 15.60", 1.7 kg
análise externo » HP 15s-fq4009ns
HP Envy 17-ch1056nf: NVIDIA GeForce MX450, 17.30", 2.5 kg
análise externo » HP Envy 17-ch1056nf
HP 14s-dq4001ns: Intel Iris Xe Graphics G7 96EUs, 14.00", 1.5 kg
análise externo » HP 14s-dq4001ns
MSI Modern 14 B11SBU: Intel Iris Xe Graphics G7 96EUs, 14.00", 1.3 kg
análise externo » MSI Modern 14 B11SBU
MSI Modern 14 B11MO-879XES: Intel Iris Xe Graphics G7 96EUs, 14.00", 1.3 kg
análise externo » MSI Modern 14 B11MO-879XES
HP 15s-fq4086ns: Intel Iris Xe Graphics G7 96EUs, 15.60", 1.7 kg
análise externo » HP 15s-fq4086ns
HP Pavilion x360 14-dy1034ns: Intel Iris Xe Graphics G7 96EUs, 14.00", 1.5 kg
análise externo » HP Pavilion x360 14-dy1034ns
Asus ExpertBook B7 Flip B7402FEA: Intel Iris Xe Graphics G7 96EUs, 14.00", 1.4 kg
análise externo » Asus ExpertBook B7 Flip B7402FEA
Acer TravelMate Vero TMV15-51-728C: Intel Iris Xe Graphics G7 96EUs, 15.60", 1.8 kg
análise externo » Acer TravelMate Vero TMV15-51-728C
HP Pavilion x360 14-dy1004ns: Intel Iris Xe Graphics G7 96EUs, 14.00", 1.5 kg
análise externo » HP Pavilion x360 14-dy1004ns
Huawei MateBook X Pro 2022: Intel Iris Xe Graphics G7 96EUs, 14.20", 1.4 kg
análise externo » Huawei MateBook X Pro 2022
HP 15s-fq4005ns: Intel Iris Xe Graphics G7 96EUs, 15.60", 1.7 kg
análise externo » HP 15s-fq4005ns
Lenovo Yoga 9 14ITL5-82BG009WUS: Intel Iris Xe Graphics G7 96EUs, 14.00", 1.4 kg
análise externo » Lenovo Yoga 9 14ITL5-82BG009WUS
HP Spectre x360 14-ea1013TU: Intel Iris Xe Graphics G7 96EUs, 13.50", 1.3 kg
análise externo » HP Spectre x360 14-ea1013TU
HP Envy x360 15m-es1023dx: Intel Iris Xe Graphics G7 96EUs, 15.60", 1.8 kg
análise externo » HP Envy x360 15m-es1023dx
HP 15s-fq4006ns: Intel Iris Xe Graphics G7 96EUs, 15.60", 1.7 kg
análise externo » HP 15s-fq4006ns
Gigabyte U4 UD: Intel Iris Xe Graphics G7 96EUs, 14.00", 1 kg
análise externo » Gigabyte U4 UD
Asus ExpertBook B7 Flip B7402FEA-LA0413R: Intel Iris Xe Graphics G7 96EUs, 14.00", 1.5 kg
análise externo » Asus ExpertBook B7 Flip B7402FEA-LA0413R
Acer Aspire Vero AV15-51-76PV: Intel Iris Xe Graphics G7 96EUs, 15.60", 1.8 kg
análise externo » Acer Aspire Vero AV15-51-76PV
Acer Aspire Vero AV15-51-78SB: Intel Iris Xe Graphics G7 96EUs, 15.60", 1.8 kg
análise externo » Acer Aspire Vero AV15-51-78SB
Acer Aspire Vero AV15-51-7555: Intel Iris Xe Graphics G7 96EUs, 15.60", 1.8 kg
análise externo » Acer Aspire Vero AV15-51-7555
MSI Summit E16 Flip Evo A11UCT-028: NVIDIA GeForce RTX 3050 4GB Laptop GPU, 16.00", 2 kg
análise externo » MSI Summit E16 Flip Evo A11UCT-028
VAIO SX14 VJS144X0111K: Intel Iris Xe Graphics G7 96EUs, 14.00", 1.1 kg
análise externo » VAIO SX14 VJS144X0111K
Acer Aspire Vero AV15-51-78SE: Intel Iris Xe Graphics G7 96EUs, 15.60", 1.8 kg
análise externo » Acer Aspire Vero AV15-51-78SE
MSI Prestige 14 Evo A11MO-043: Intel Iris Xe Graphics G7 96EUs, 14.00", 1.3 kg
análise externo » MSI Prestige 14 Evo A11MO-043
GPD Pocket 3: Intel Iris Xe Graphics G7 96EUs, 8.00", 0.7 kg
» GPD desvela el precio del Pocket 4: Próximo portátil ultraportátil con tecnología AMD
» Asegúrate de cambiar el nivel de potencia de tu GPD Pocket 3 a través de la BIOS para obtener un aumento significativo del rendimiento