Análisis del portátil Schenker XMG Focus 16: Una máquina de juegos ensamblada en Alemania
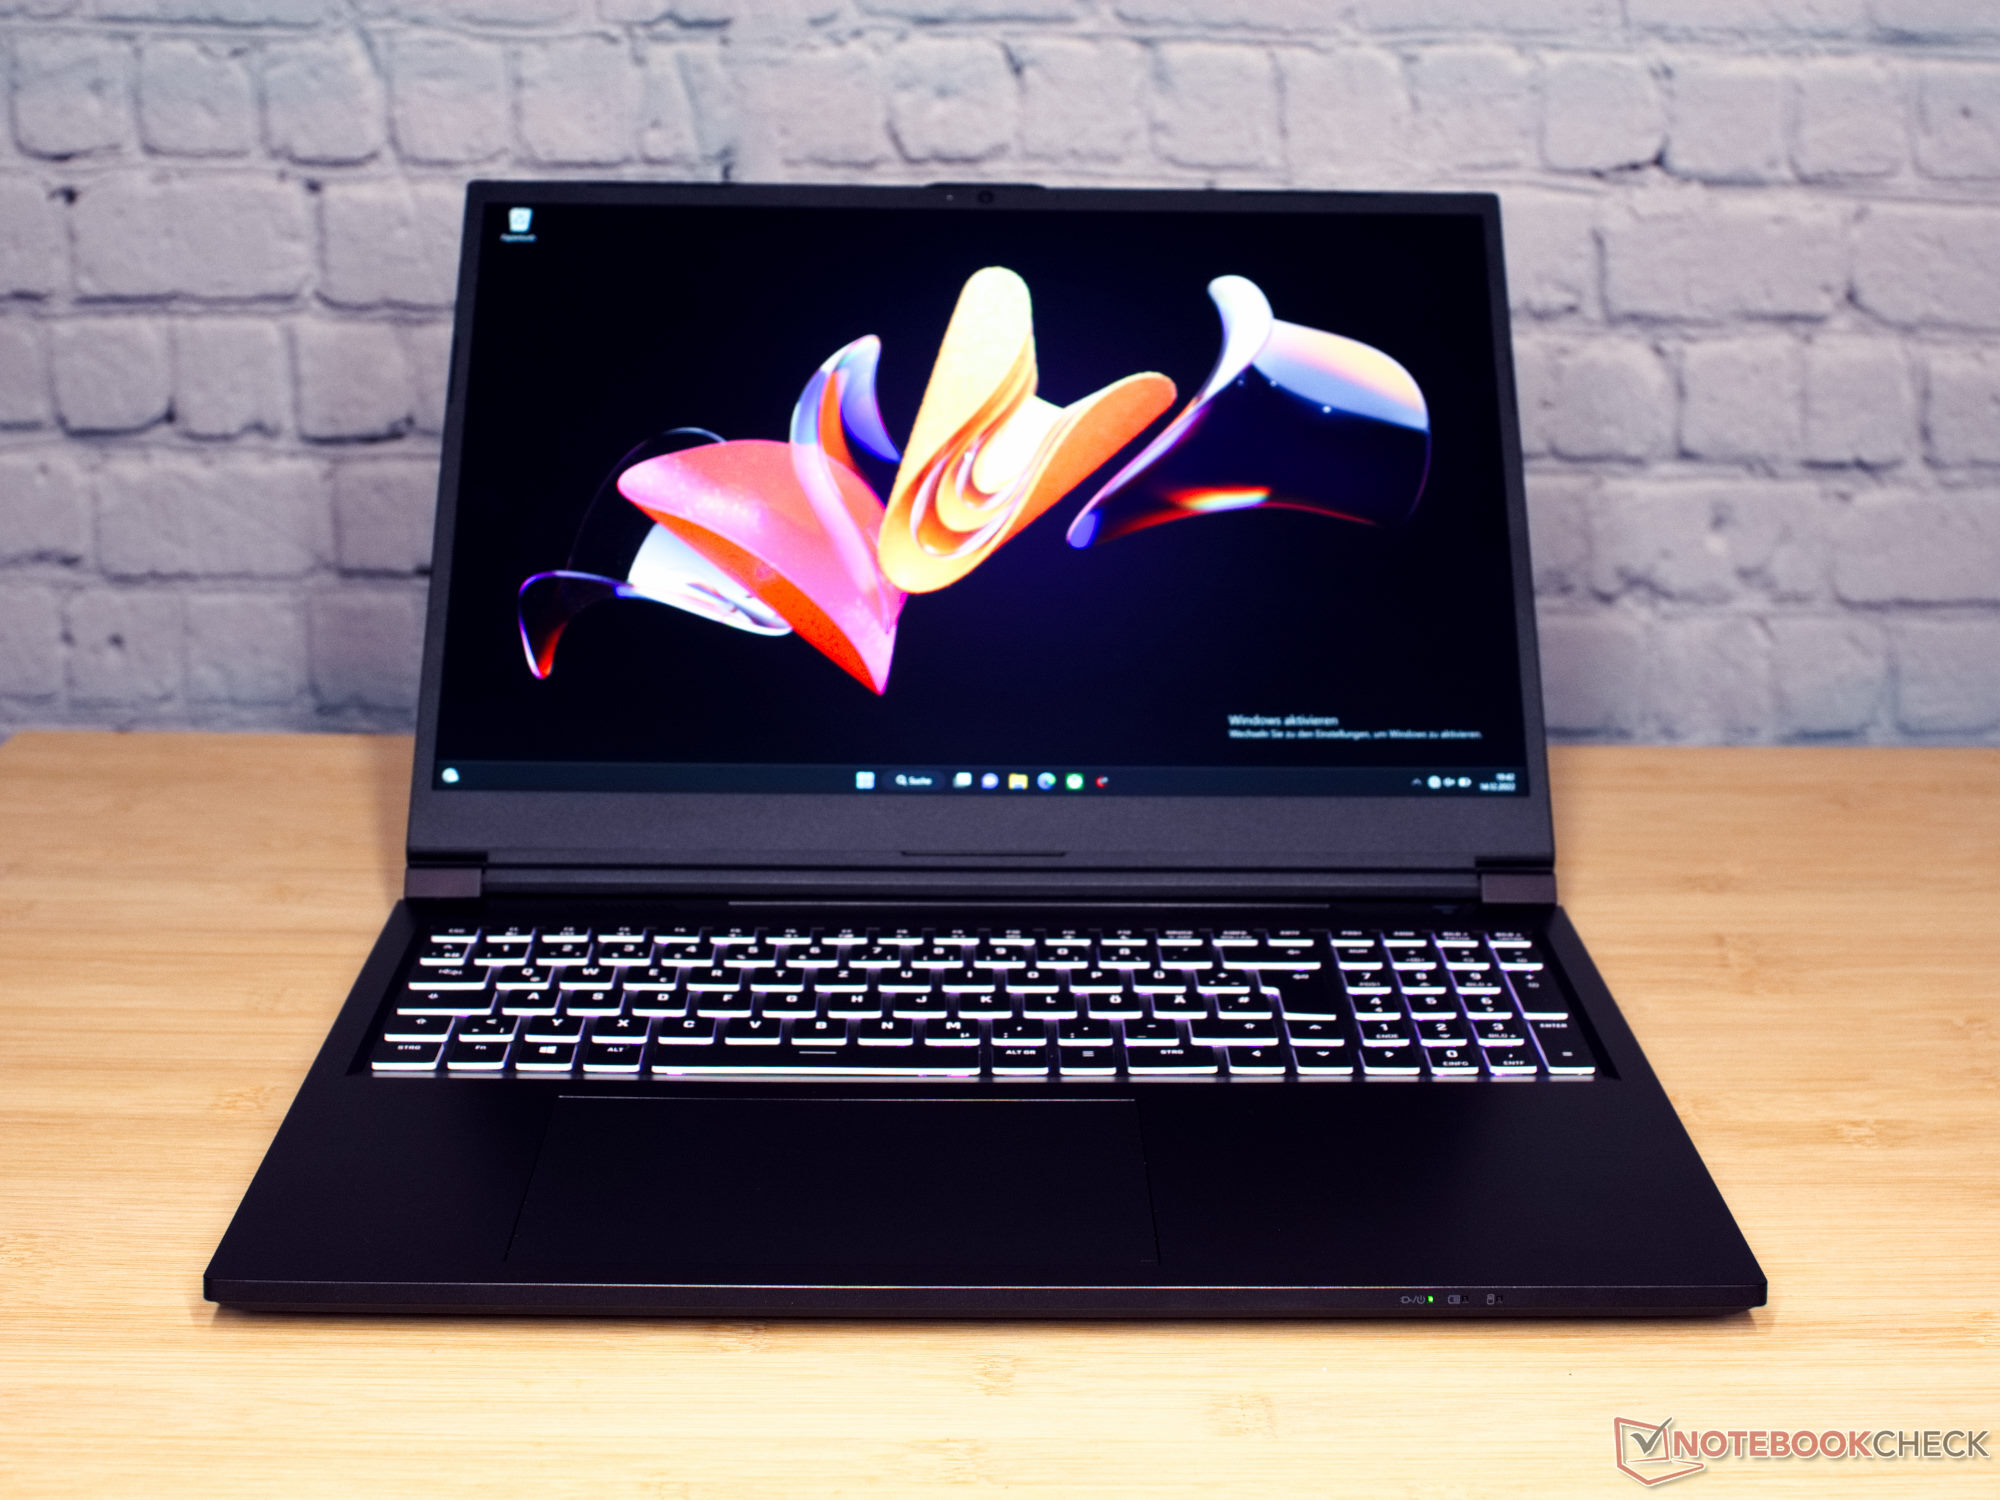
El fabricante alemán de ordenadores Schenker ofrece portátiles de Leipzig. El XMG Focus 16 es un portátil para juegos de gama media con una pantalla de 16 pulgadas. El portátil es fiable, sólido como una roca y posee el diseño característico de Schenker. El dispositivo tiene un aspecto un poco cuadrado y poco convencional, sin ser demasiado llamativo. Schenker ha equipado el XMG Focus 16 con un hardware potente y una pantalla con relación de aspecto 16:10.
Nuestros competidores han sido seleccionados principalmente de la categoría de precios de portátiles para juegos de gama media, como el Dell G16 7620 o elLenovo Legion 5 Pro. Sin embargo, un portátil multimedia delgado con especificaciones similares, elAsus Zenbook Pro 16Xes considerablemente más delgado que los típicos portátiles para juegos, pero ofrece niveles de rendimiento similares.
Posibles contendientes en la comparación
Valoración | Fecha | Modelo | Peso | Altura | Tamaño | Resolución | Precio |
|---|---|---|---|---|---|---|---|
| 87 % v7 (old) | 01/2023 | Schenker XMG Focus 16 (i7-12700H, RTX 3060) i7-12700H, GeForce RTX 3060 Laptop GPU | 2.2 kg | 24.3 mm | 16.00" | 2560x1600 | |
| 88.4 % v7 (old) | 12/2022 | Asus ZenBook Pro 16X OLED UX7602ZM-ME115W i9-12900H, GeForce RTX 3060 Laptop GPU | 2.4 kg | 19.5 mm | 16.00" | 3840x2400 | |
| 86.1 % v7 (old) | 10/2022 | Dell G16 7620 i7-12700H, GeForce RTX 3060 Laptop GPU | 2.6 kg | 26.9 mm | 16.00" | 2560x1600 | |
| 89.5 % v7 (old) | 08/2022 | Asus ROG Flow X16 GV601RW-M5082W R9 6900HS, GeForce RTX 3070 Ti Laptop GPU | 2.1 kg | 19.4 mm | 16.10" | 2560x1600 | |
| 88.7 % v7 (old) | 12/2022 | Lenovo ThinkPad X1 Extreme G5-21DE003RGE i7-12700H, GeForce RTX 3060 Laptop GPU | 2.1 kg | 17.9 mm | 16.00" | 3840x2400 | |
| 87.9 % v7 (old) | 11/2022 | Lenovo Legion Slim 7-16IAH 82TF004YGE i7-12700H, GeForce RTX 3060 Laptop GPU | 2.2 kg | 16.9 mm | 16.00" | 2560x1600 | |
| 86.6 % v7 (old) | 07/2022 | Lenovo Legion 5 Pro 16IAH7H i7-12700H, GeForce RTX 3060 Laptop GPU | 2.6 kg | 27 mm | 16.00" | 2560x1600 |
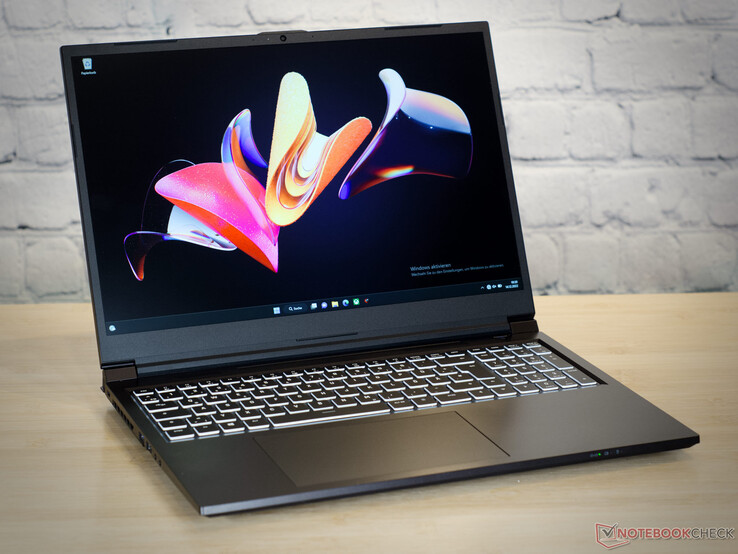
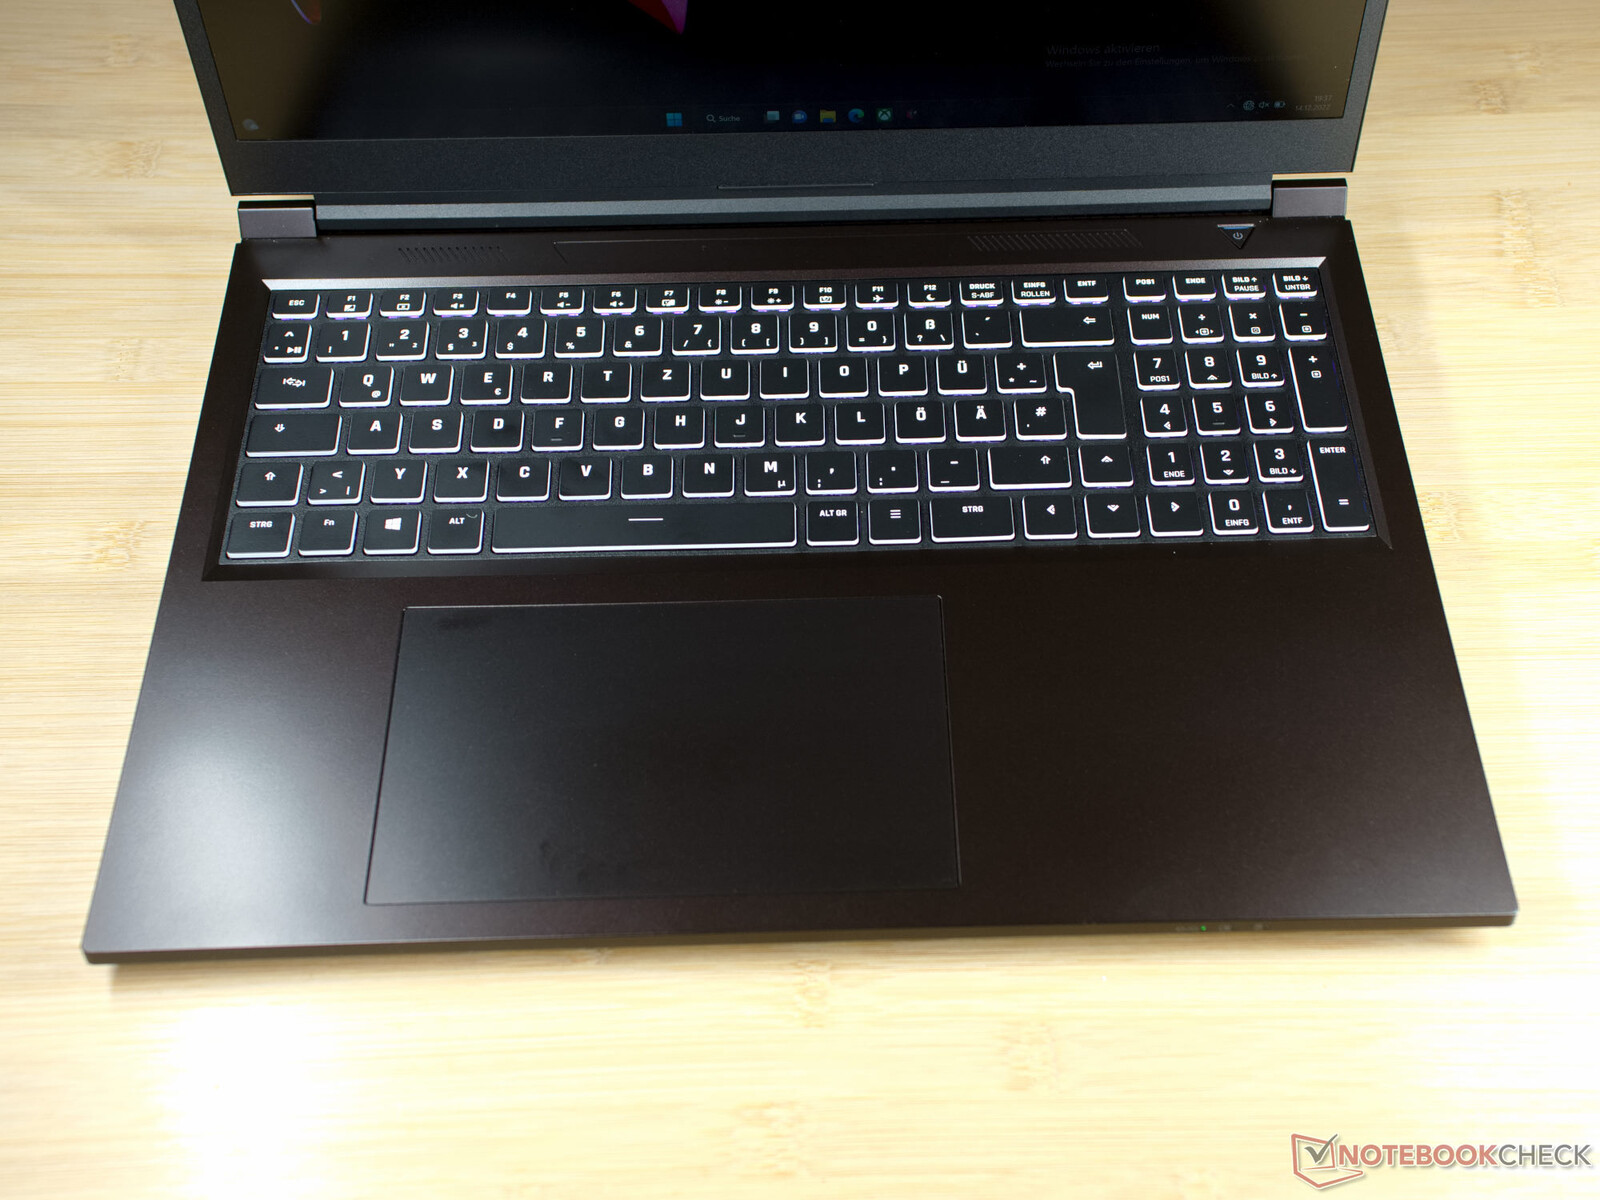
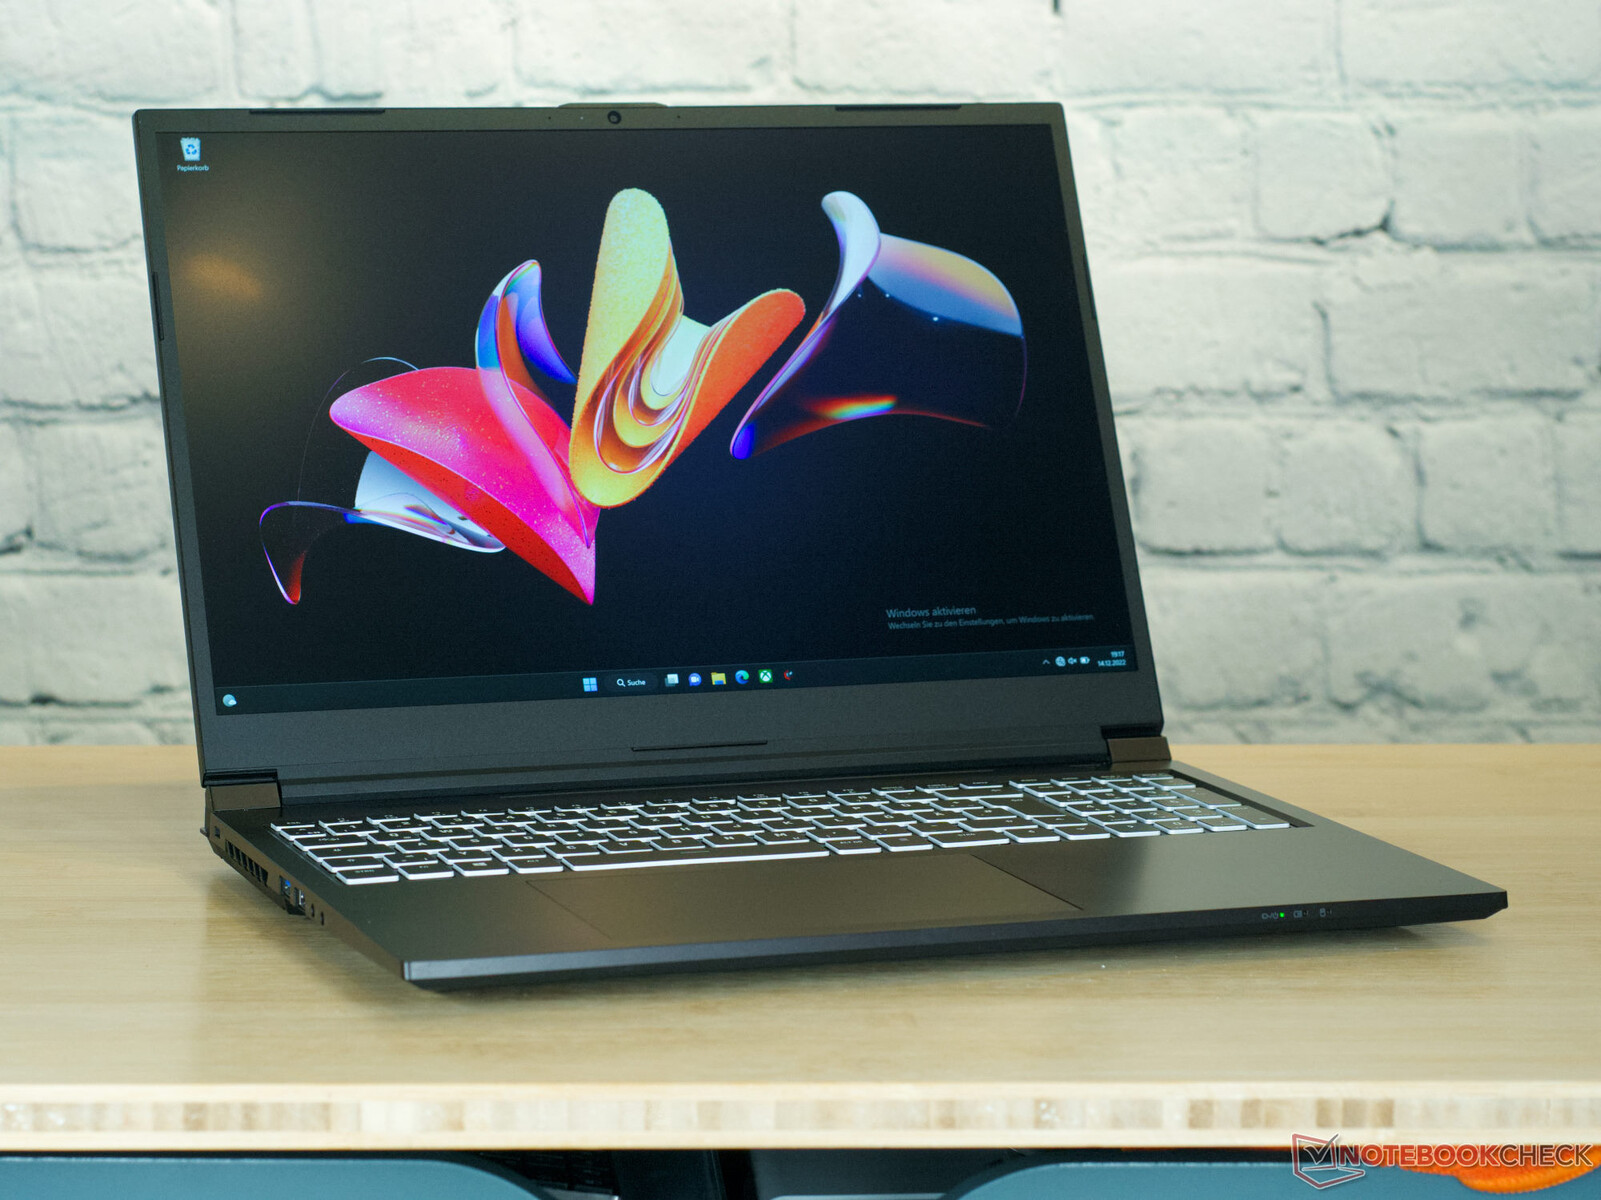
Caja: negra, cuadrada y con mucho aluminio
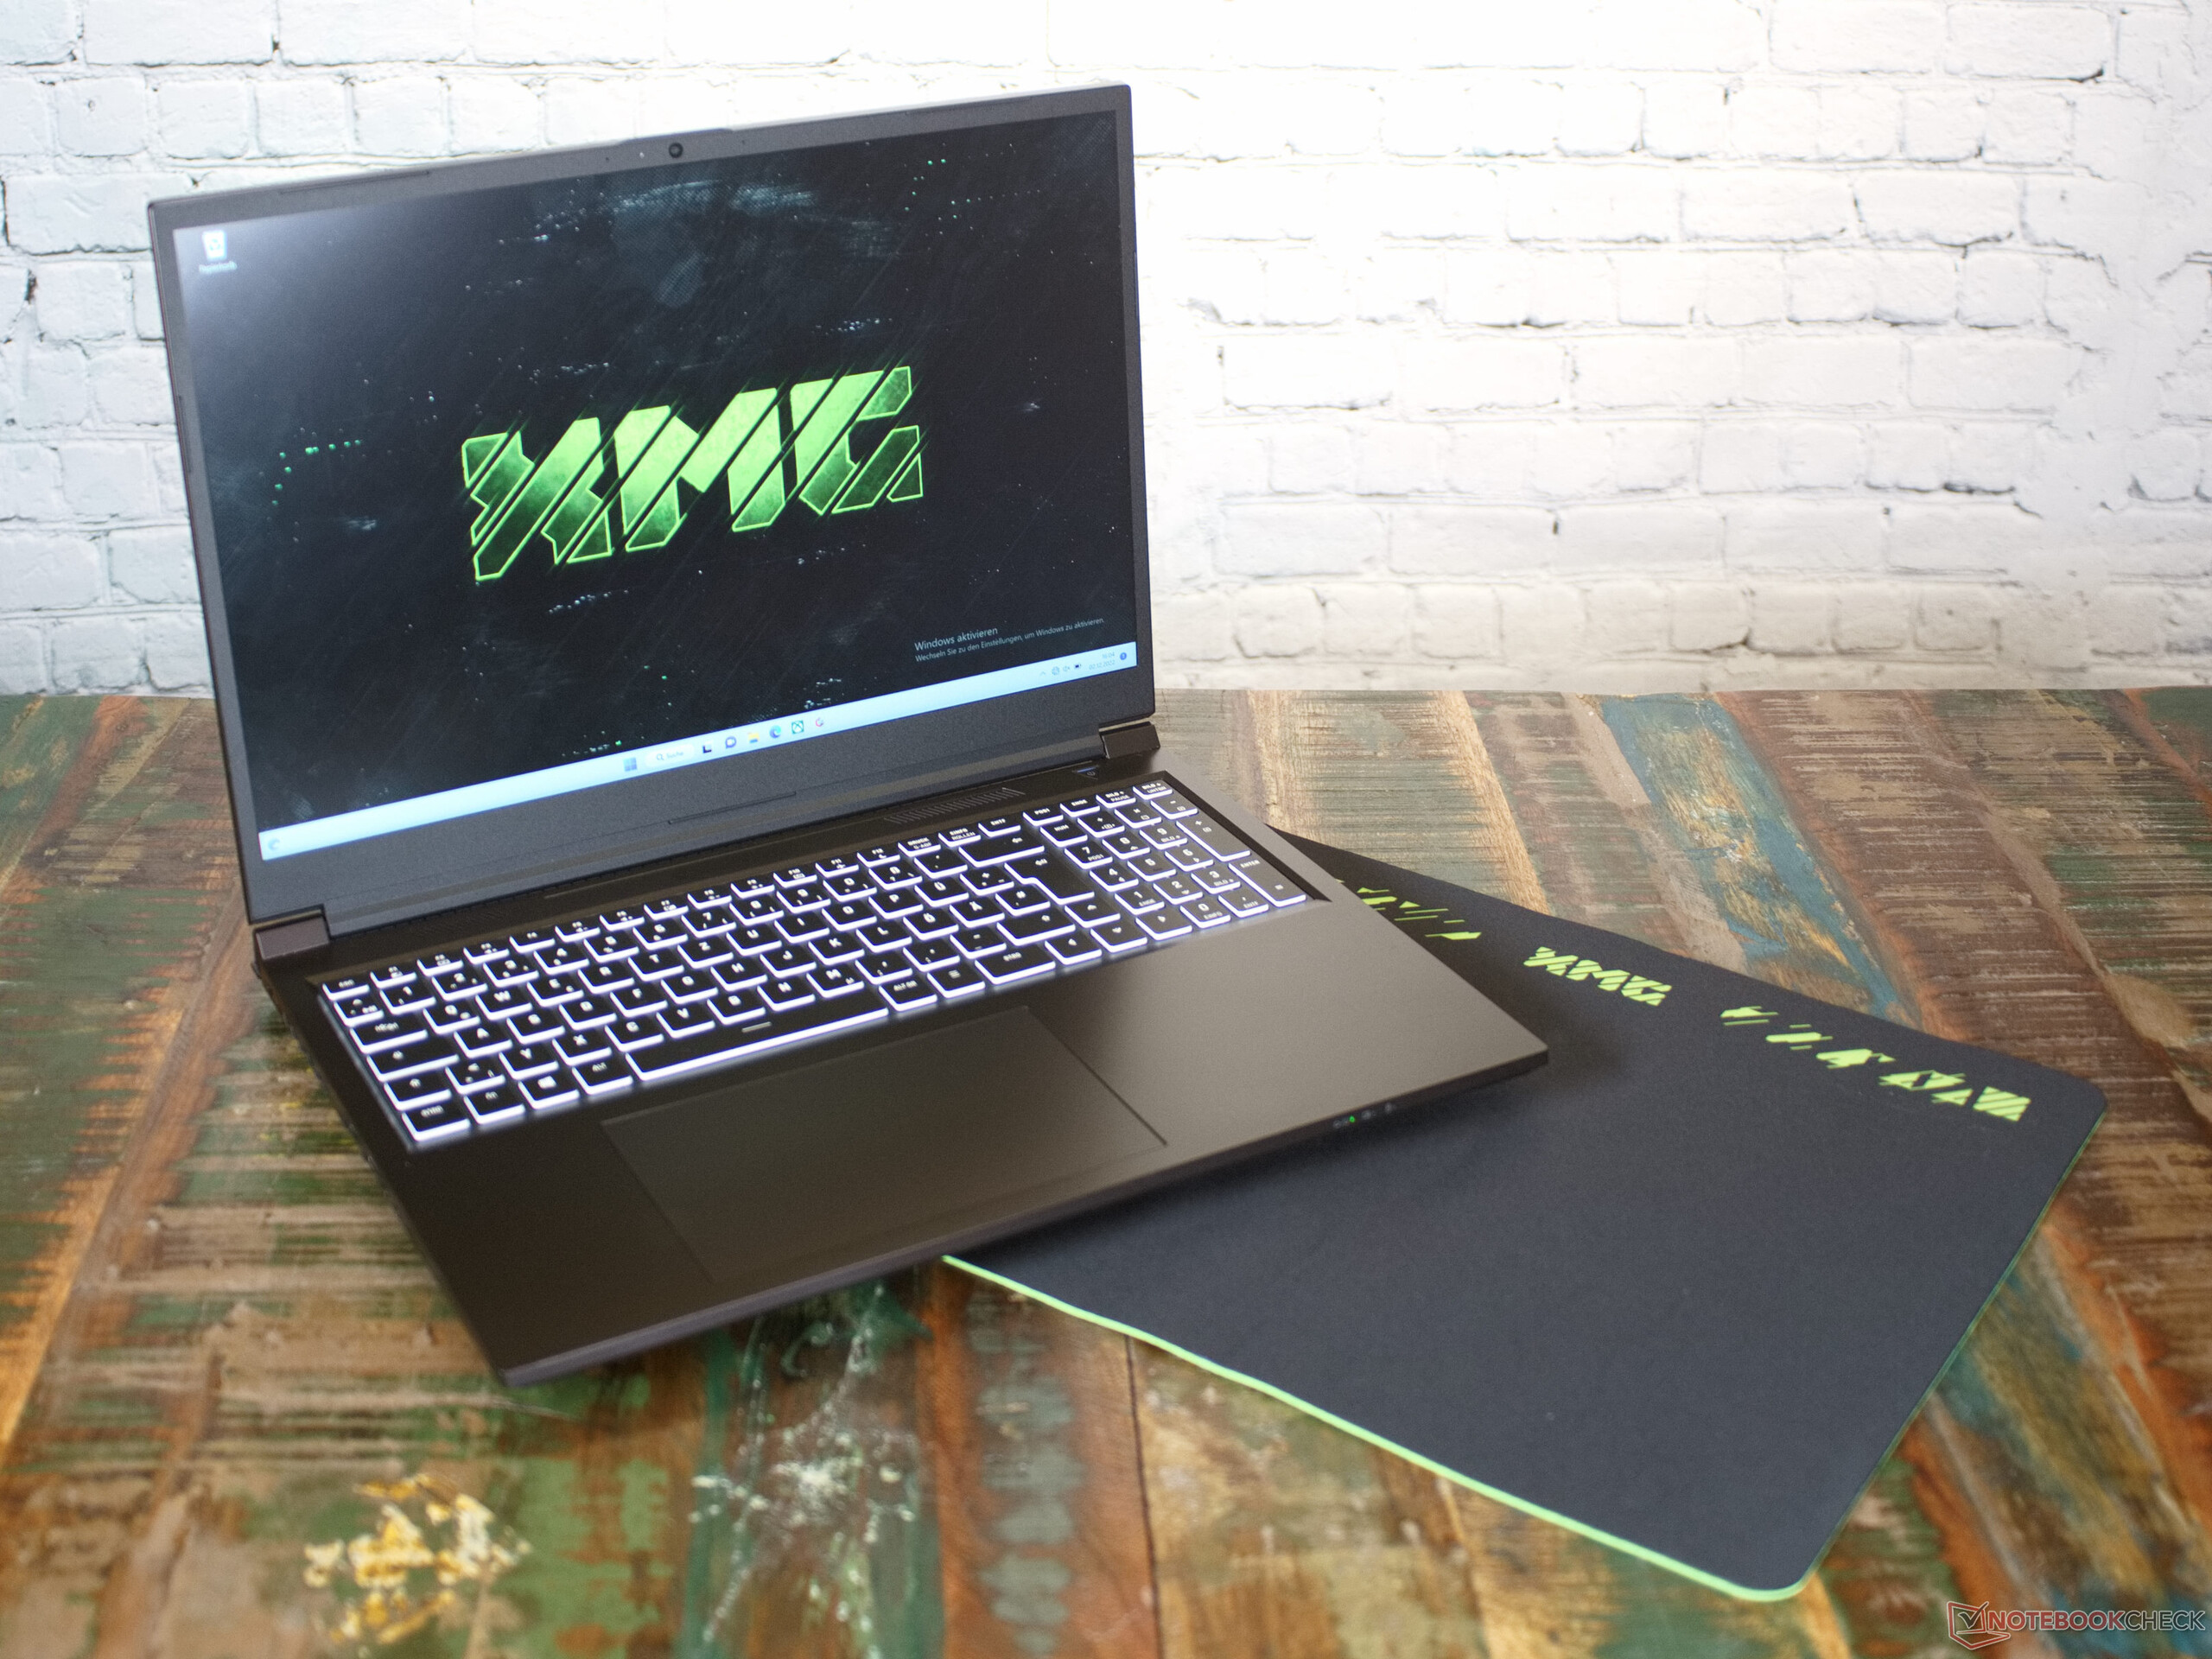
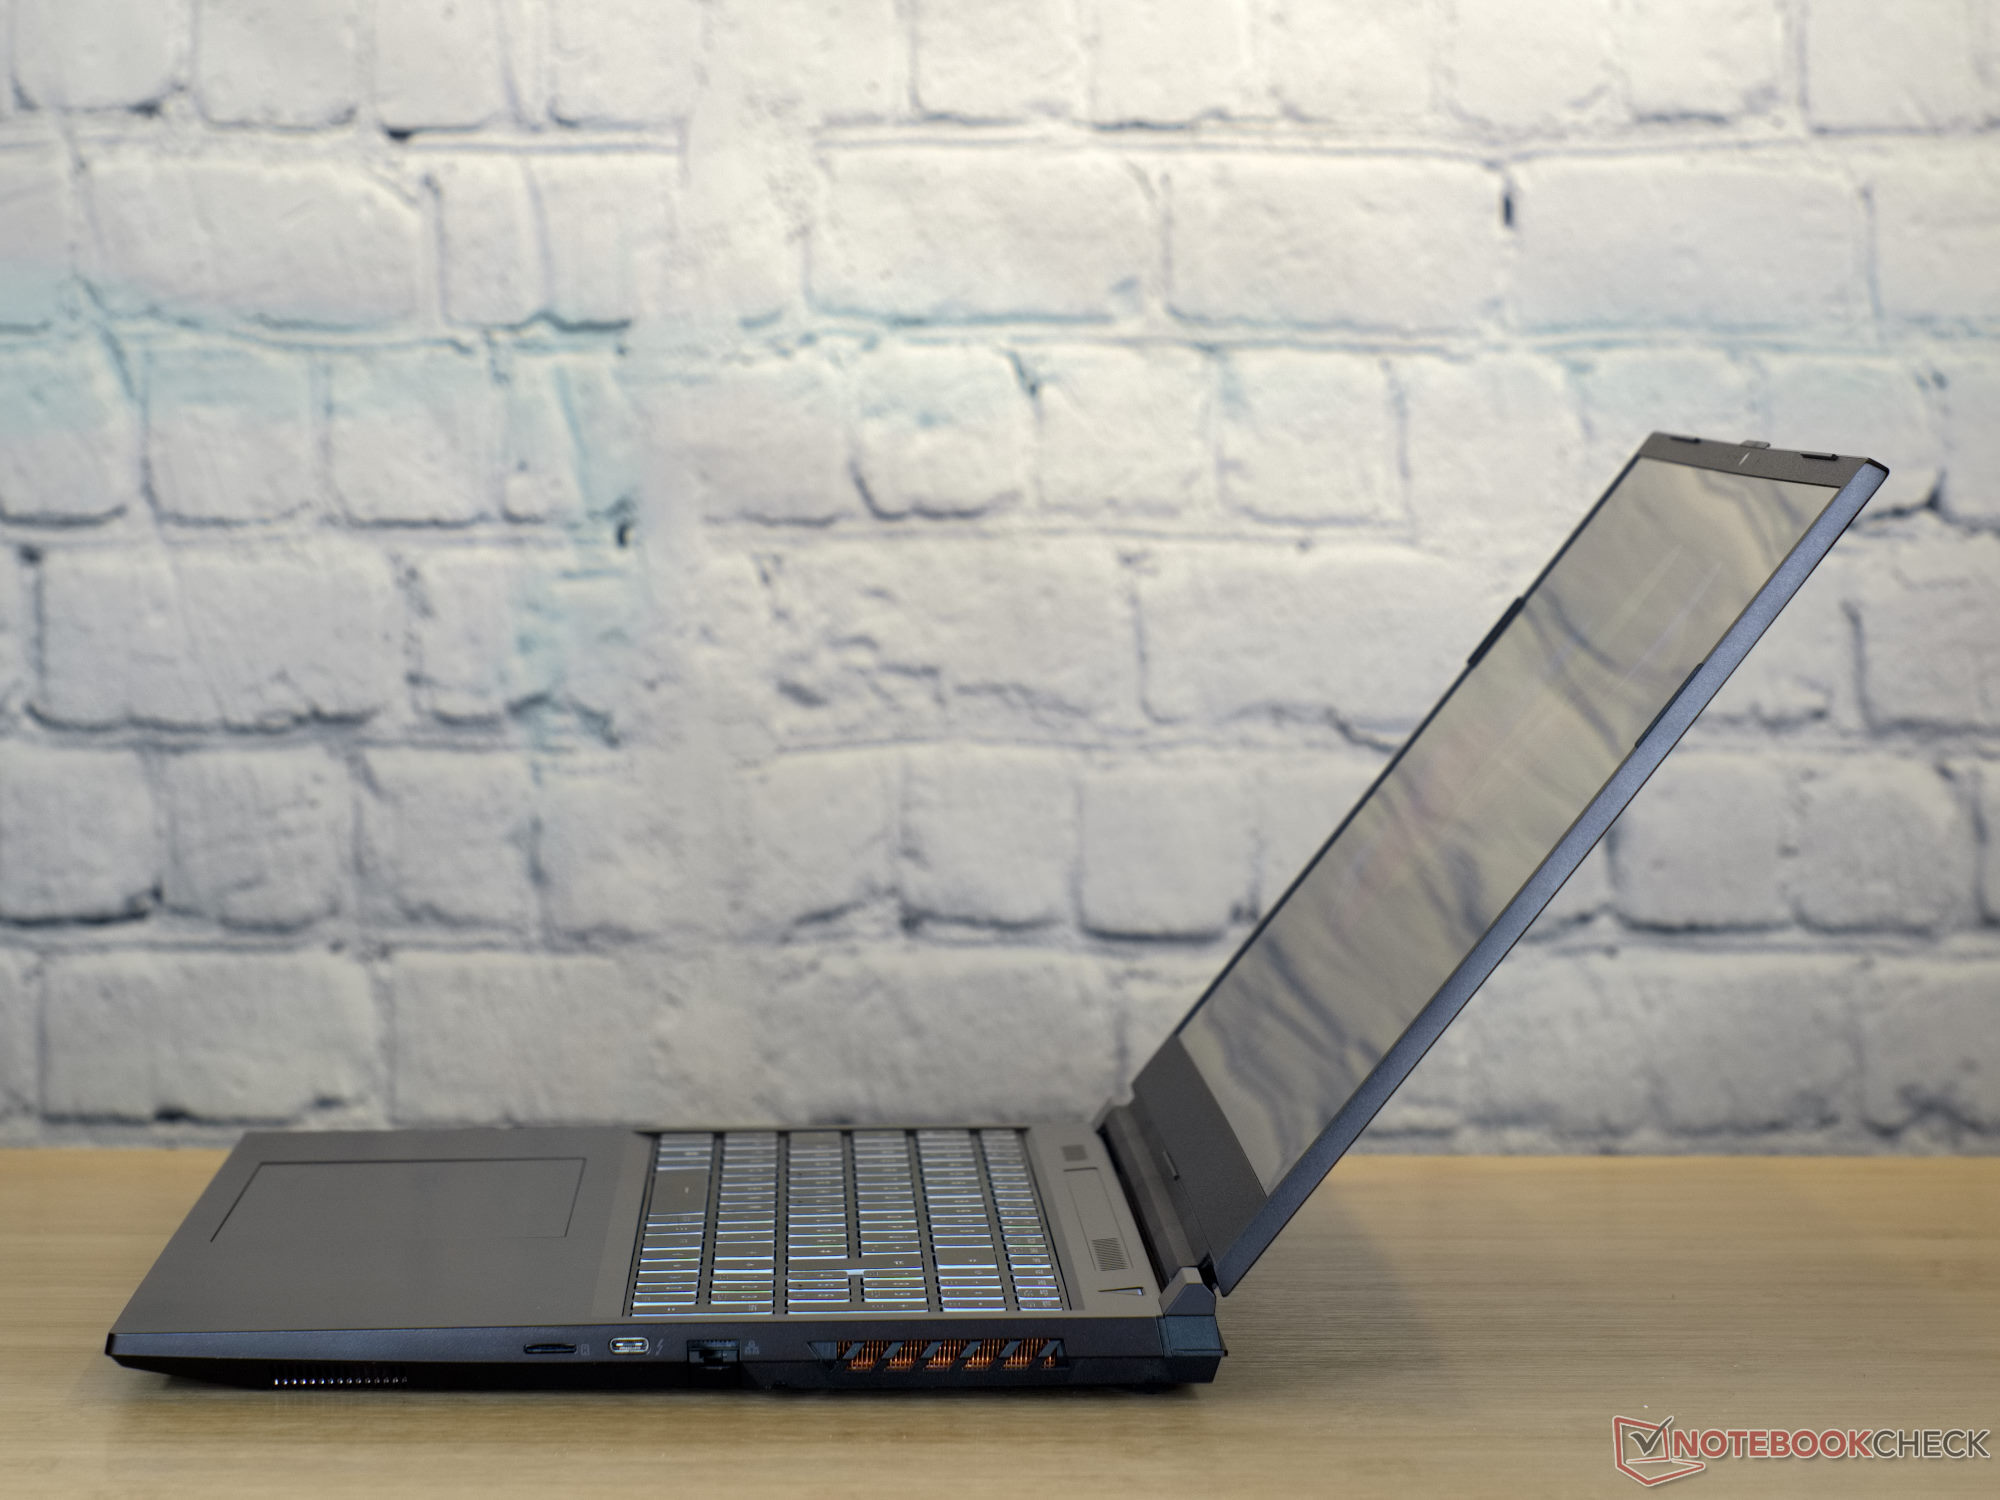
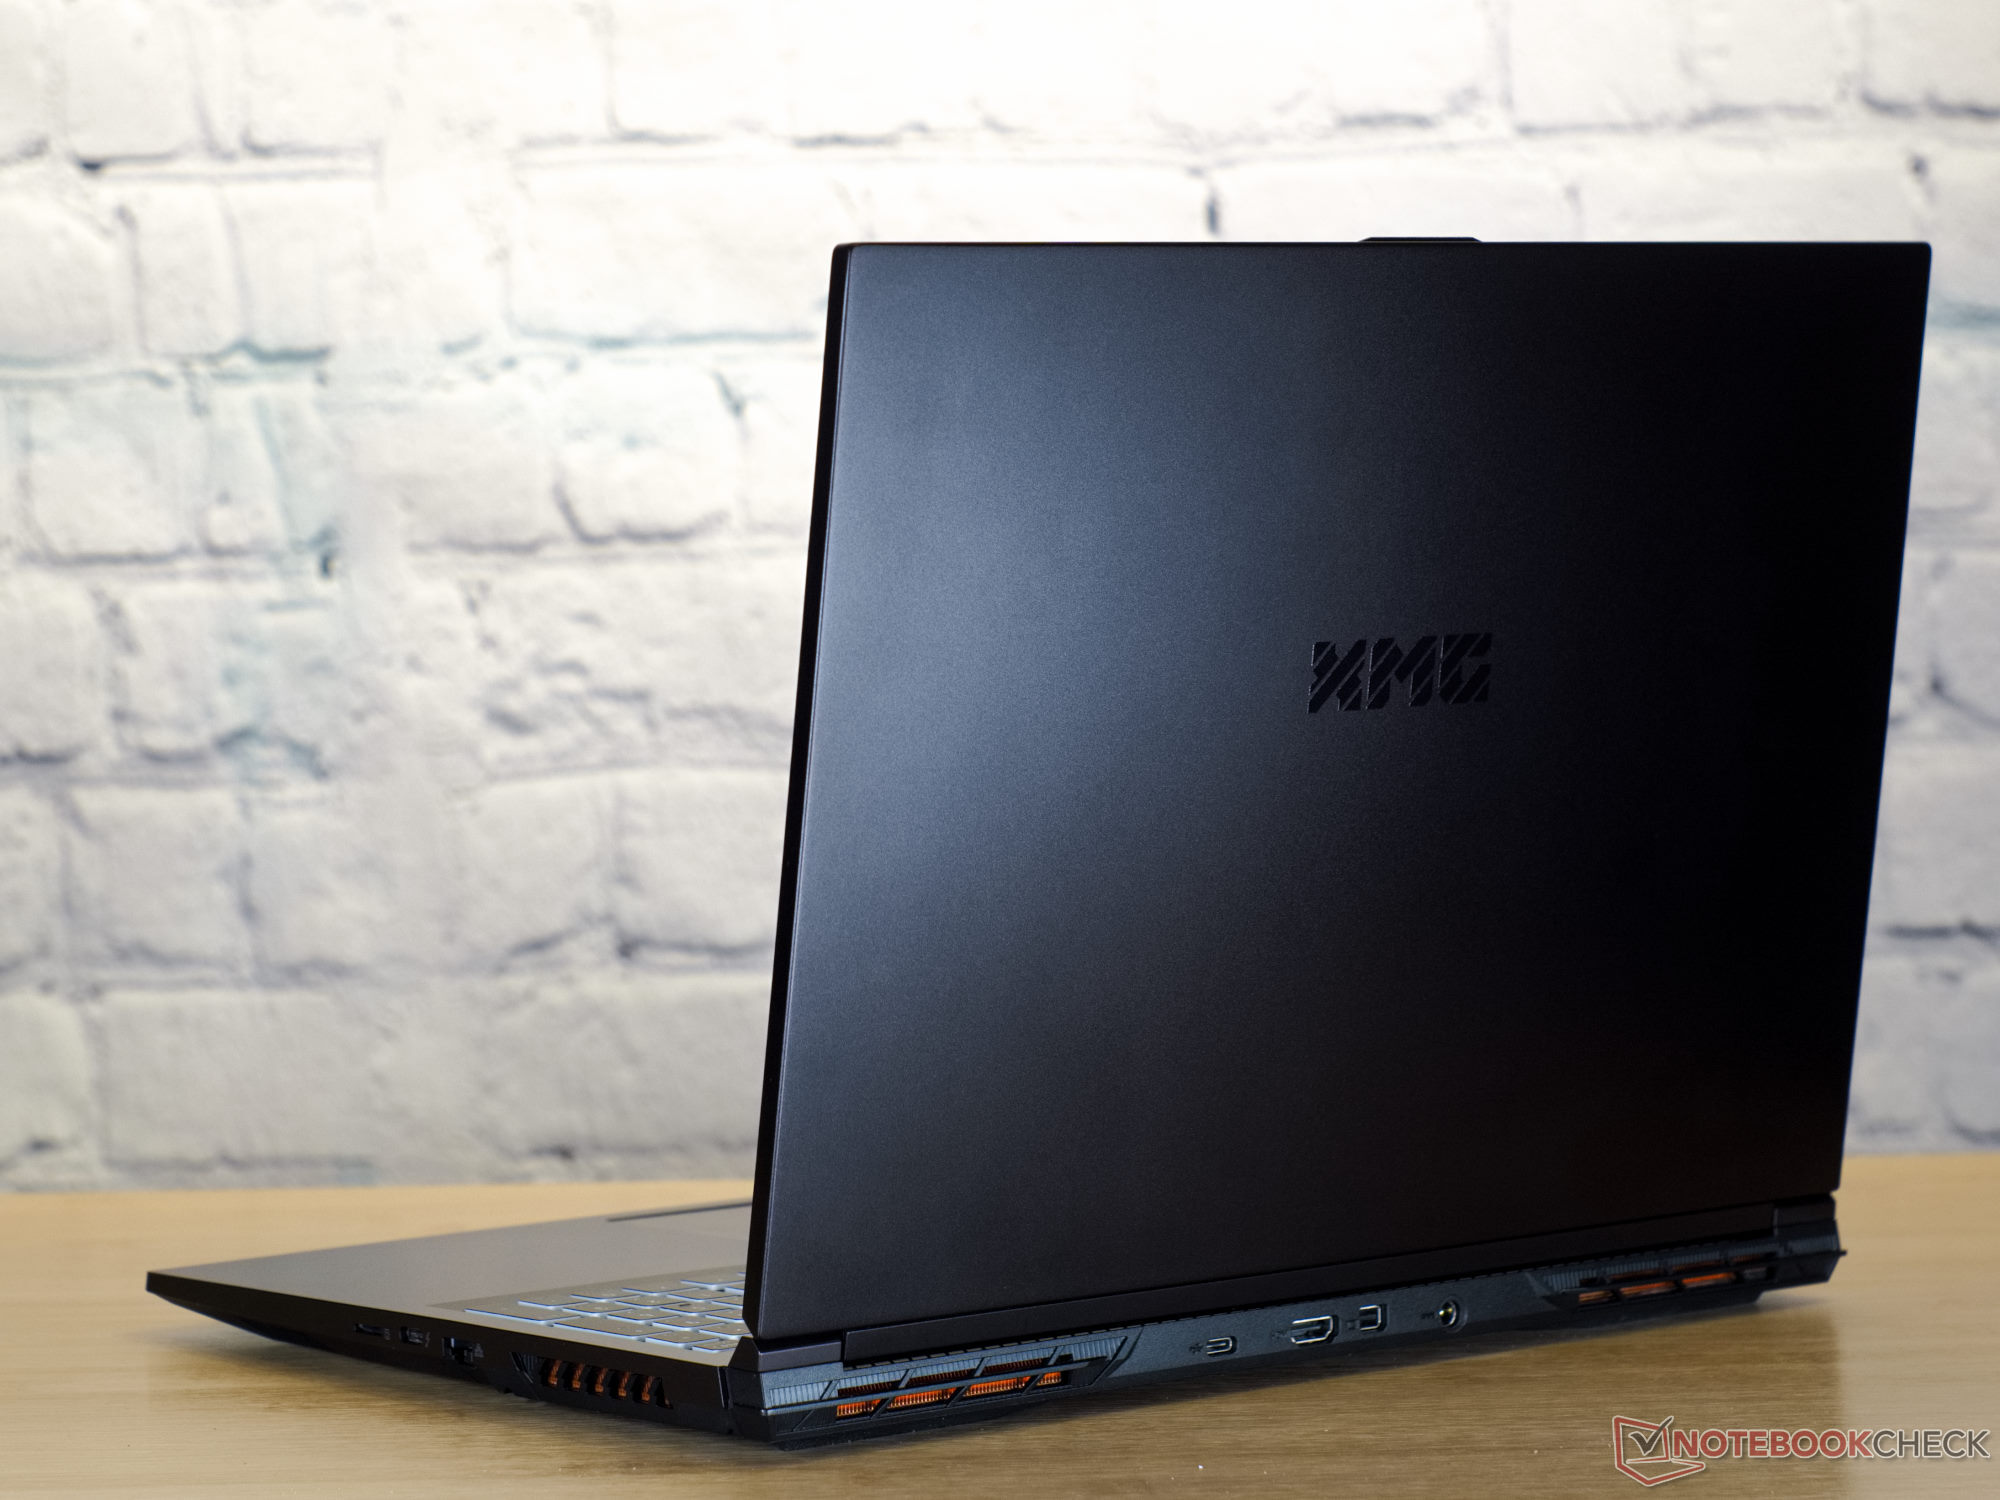
El XMG Schenker Focus 16 es blanco y negro y se basa en un barebone NP60PNP de Clevo. Tanto la tapa de la pantalla - que se puede abrir hasta un ángulo de 130 ° - y la parte superior de la base consisten en aluminio recubierto de negro, a diferencia de la cubierta de la base que está hecha de plástico negro. Al abrir el dispositivo, encontrará el tipo de teclado que suele encontrarse en muchos portátiles Schenker y Clevo. Las teclas individuales tienen bordes blancos y superficies de escritura negras. Como casi todos los portátiles de Schenker, el XMG Focus 16 tiene un diseño bastante cuadrado y básico, pero una buena calidad de construcción. Tenemos un dispositivo cómodo en nuestras manos que no muestra signos de crujido y cuenta con una bisagra estable.
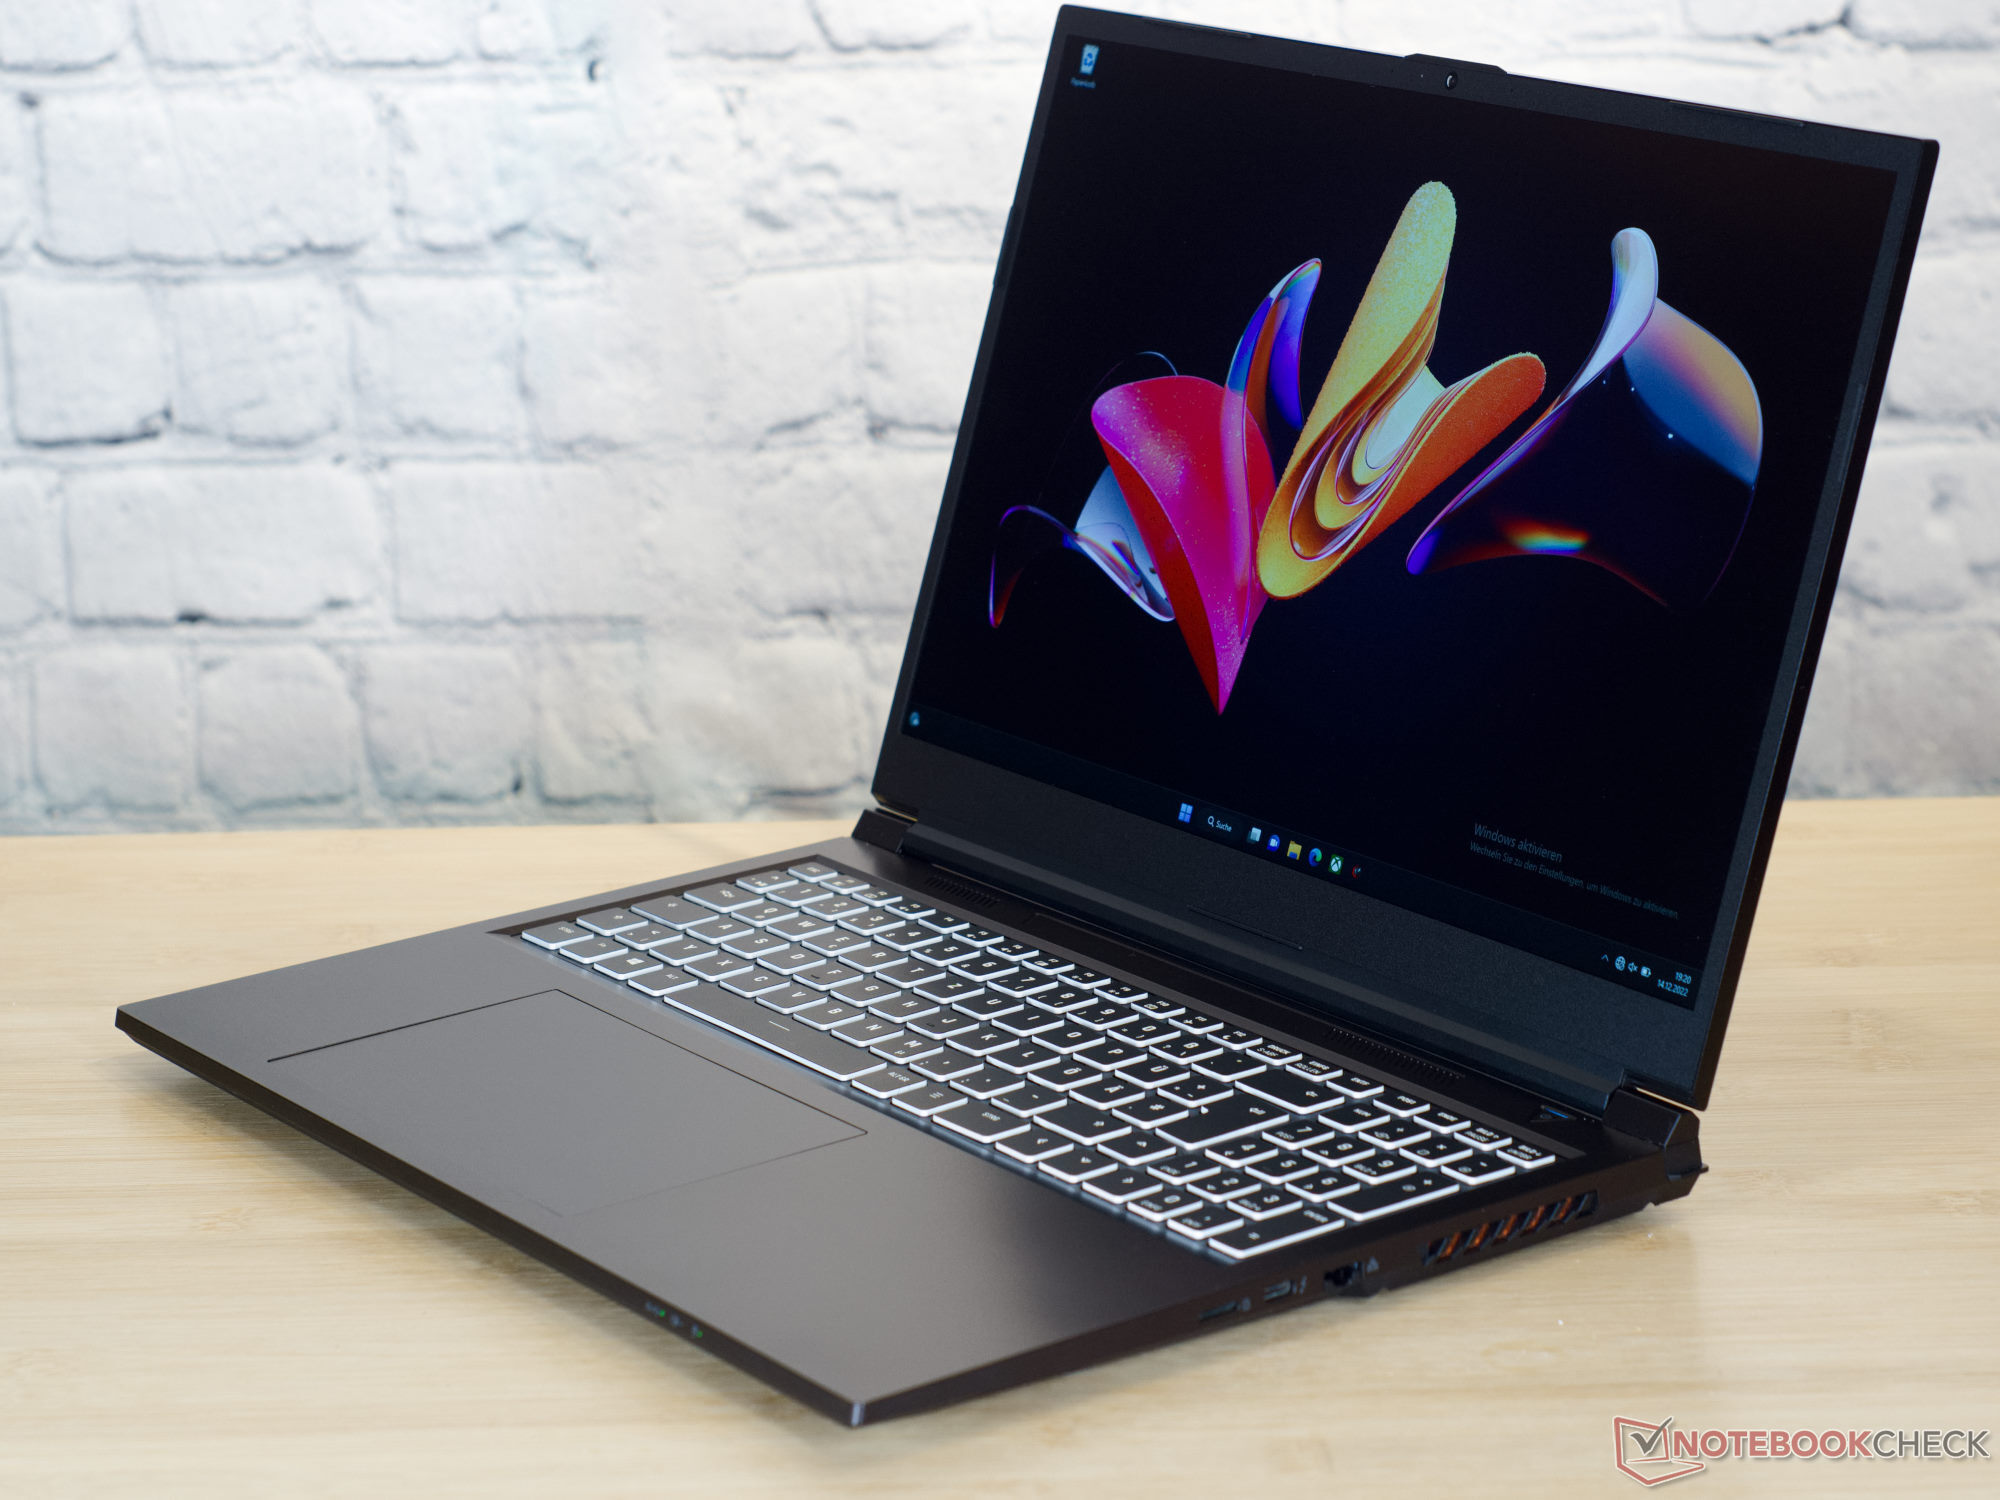
Con 2,3 kg de peso y 2,4 cm de grosor, este portátil para juegos no destaca entre sus competidores directos.
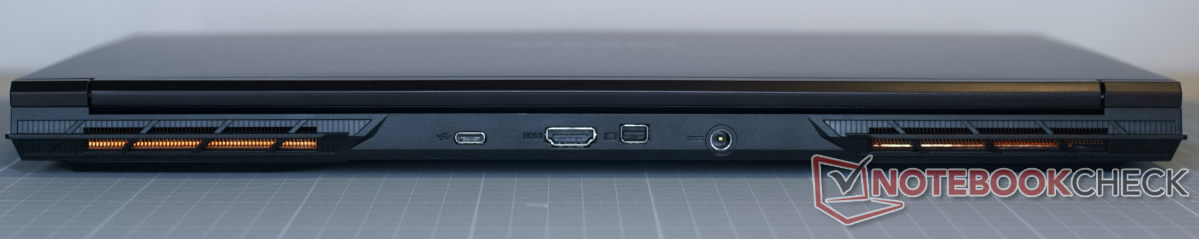
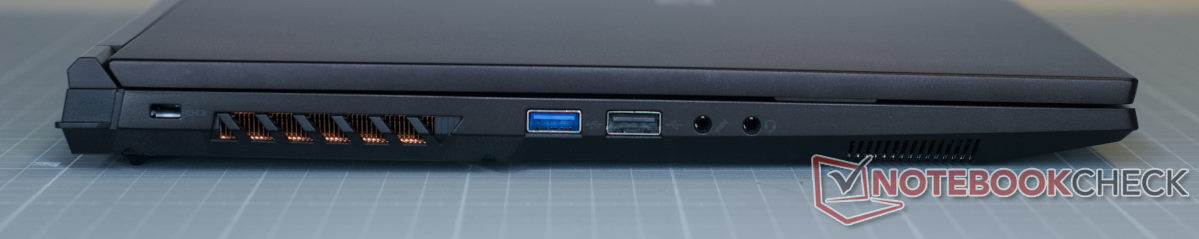
Características: muchos puertos, altas velocidades de transferencia y WiFi 6E
Schenker ha colocado los puertos en varios lugares alrededor del Focus. Los puertos de pantalla, la toma de corriente y un puerto USB-C están en la parte trasera del portátil. De este modo, los cables no estorban cuando se juega.
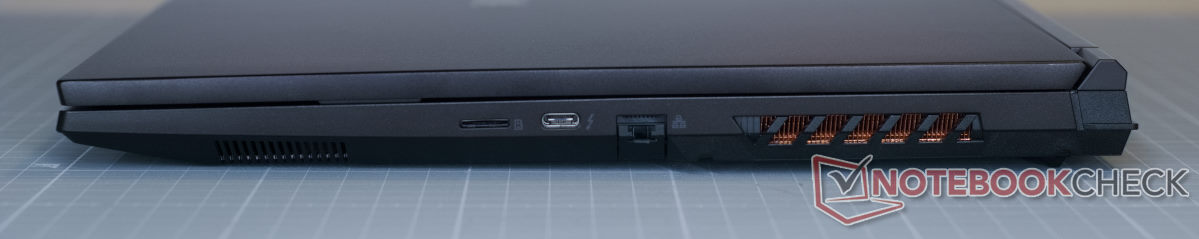
Lector de tarjetas SD
El portátil para juegos viene con un lector de tarjetas microSD.
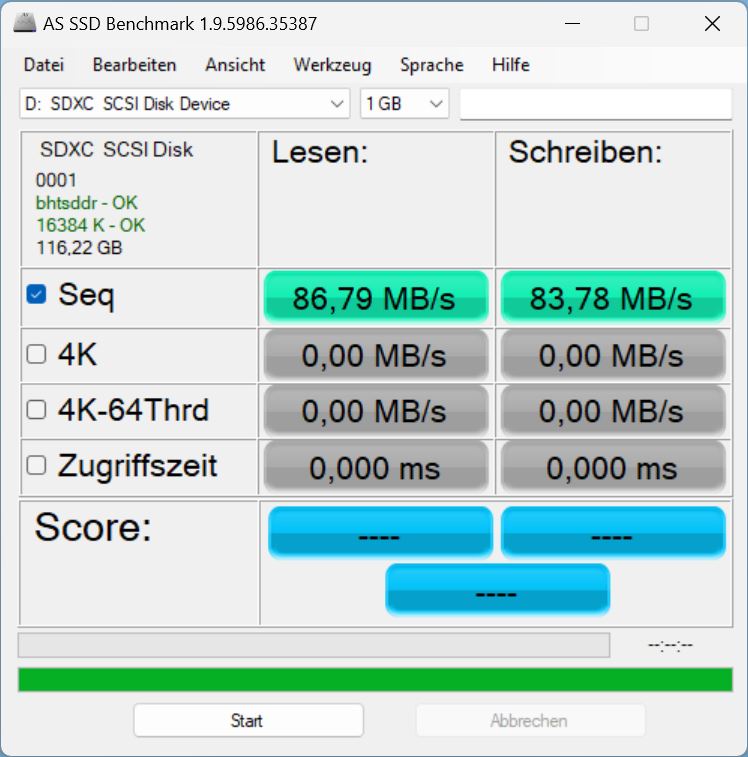
Por término medio, ofrece altas velocidades de transferencia para conexiones USB-3.0 al hardware. La conexión a nuestra AV PRO microSD 128 GB V60podría ser más rápida - algo que demuestra elAsus Rog Flow.
| SD Card Reader | |
| average JPG Copy Test (av. of 3 runs) | |
| Asus ROG Flow X16 GV601RW-M5082W (AV Pro SD microSD 128 GB V60) | |
| Media de la clase Gaming (20.9 - 210, n=54, últimos 2 años) | |
| Schenker XMG Focus 16 (i7-12700H, RTX 3060) (AV Pro SD microSD 128 GB V60) | |
| Asus ZenBook Pro 16X OLED UX7602ZM-ME115W (AV Pro SD microSD 128 GB V60) | |
| Lenovo ThinkPad X1 Extreme G5-21DE003RGE (AV Pro V60) | |
| Lenovo Legion Slim 7-16IAH 82TF004YGE | |
| maximum AS SSD Seq Read Test (1GB) | |
| Asus ROG Flow X16 GV601RW-M5082W (AV Pro SD microSD 128 GB V60) | |
| Media de la clase Gaming (25.5 - 261, n=51, últimos 2 años) | |
| Lenovo Legion Slim 7-16IAH 82TF004YGE | |
| Schenker XMG Focus 16 (i7-12700H, RTX 3060) (AV Pro SD microSD 128 GB V60) | |
| Asus ZenBook Pro 16X OLED UX7602ZM-ME115W (AV Pro SD microSD 128 GB V60) | |
| Lenovo ThinkPad X1 Extreme G5-21DE003RGE (AV Pro V60) | |
Comunicación
La conexión WiFi está por encima de la media en términos de velocidad y estabilidad. El módulo LAN Intel X211 muestra aquí todo su potencial.
Cámara web
En el interior del portátil Schenker se puede encontrar una típica webcam de 720p. Como mucho, sólo pudimos determinar desviaciones de color comparativamente pequeñas. Por lo demás, la calidad de imagen de la webcam está a un nivel típico.


 GeForce RTX 3060 Laptop GPU, i7-12700H, Samsung SSD 980 Pro 1TB MZ-V8P1T0BW")
 GeForce RTX 3060 Laptop GPU, i7-12700H, Samsung SSD 980 Pro 1TB MZ-V8P1T0BW")
Seguridad
El Schenker XMG Focus 16 tiene una ranura de seguridad Kensington. Por lo demás, cumple todos los estándares. TPM 2.0 (a través de Intel PTT) está a bordo.
Extras
Schenker incluye una amplia documentación con todos sus portátiles. En la caja encontramos un CD con controladores, una memoria USB con Windows preconfigurado y una gran alfombrilla de ratón con el logotipo de XMG.
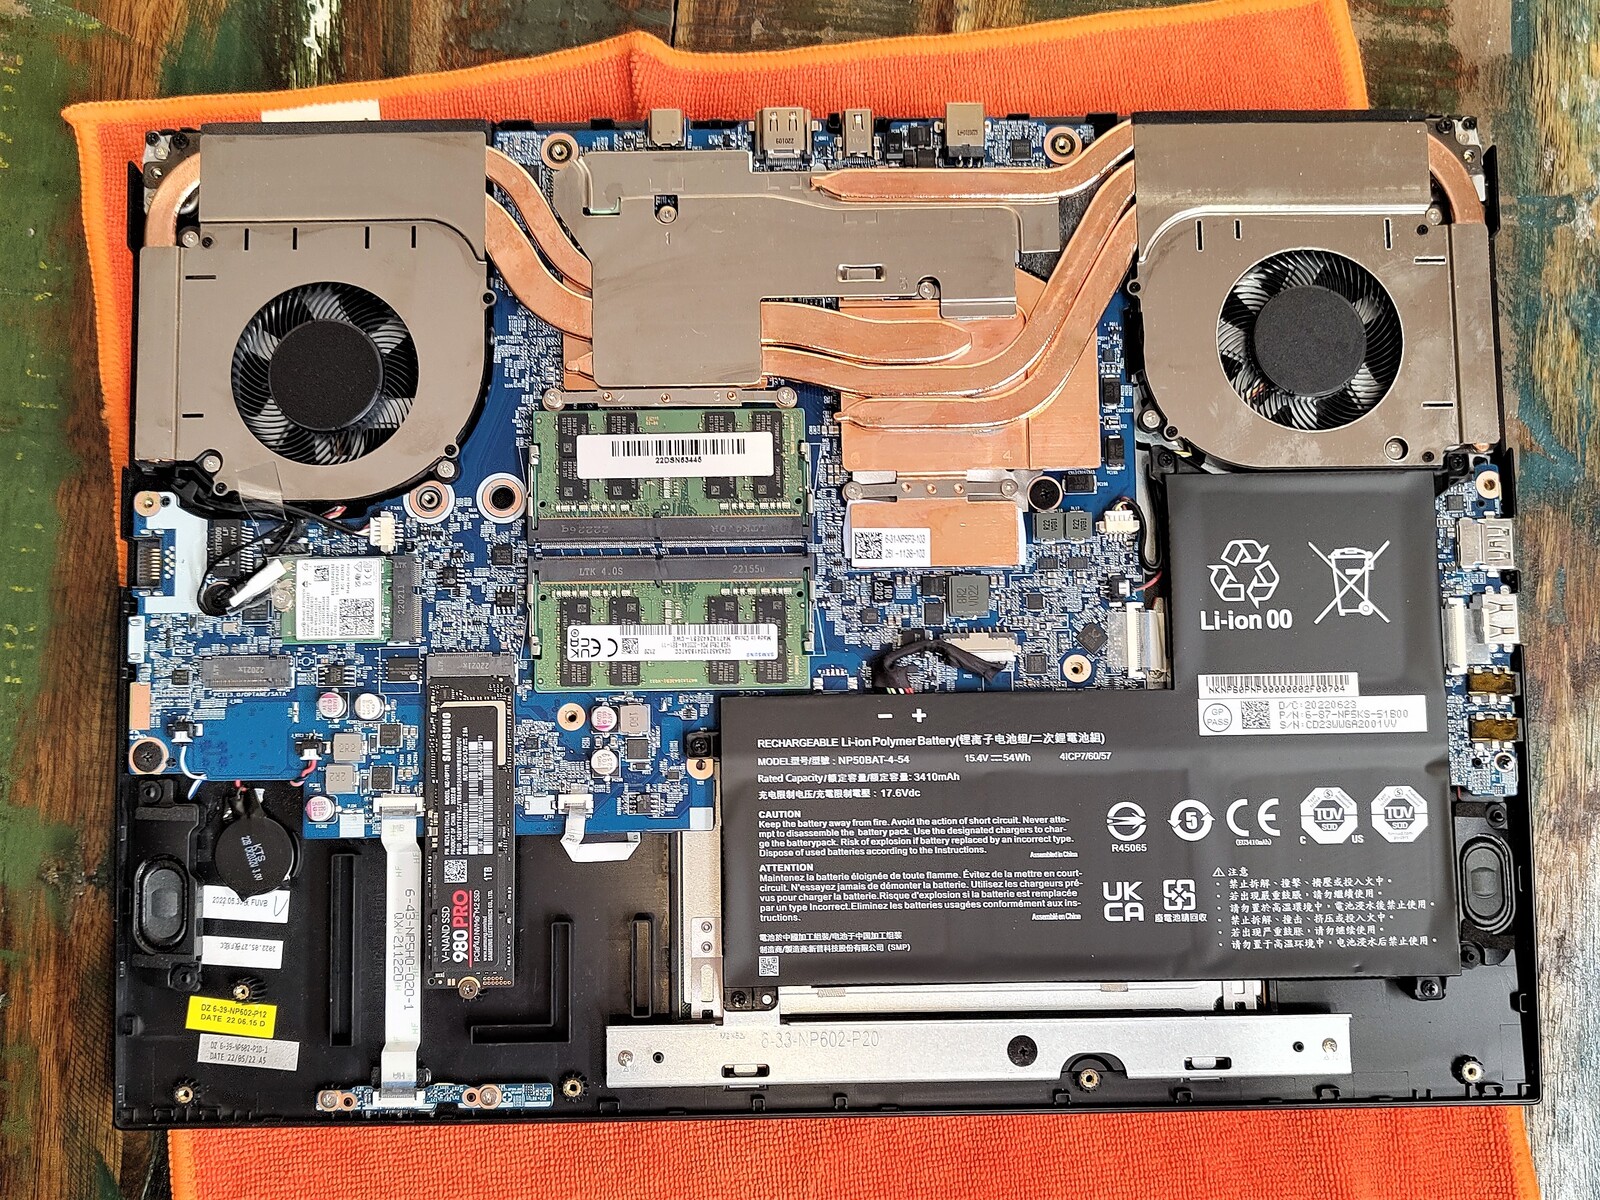
Servicio
Trece tornillos de estrella sujetan firmemente la tapa de la base. Cuando se retiran, la cubierta se puede levantar fácilmente. Dentro del portátil, encontramos dos ranuras RAM (ya ocupadas) y dos ranuras M.2 (una ocupada). Todas las demás partes están atornilladas pero no pegadas.
Garantía
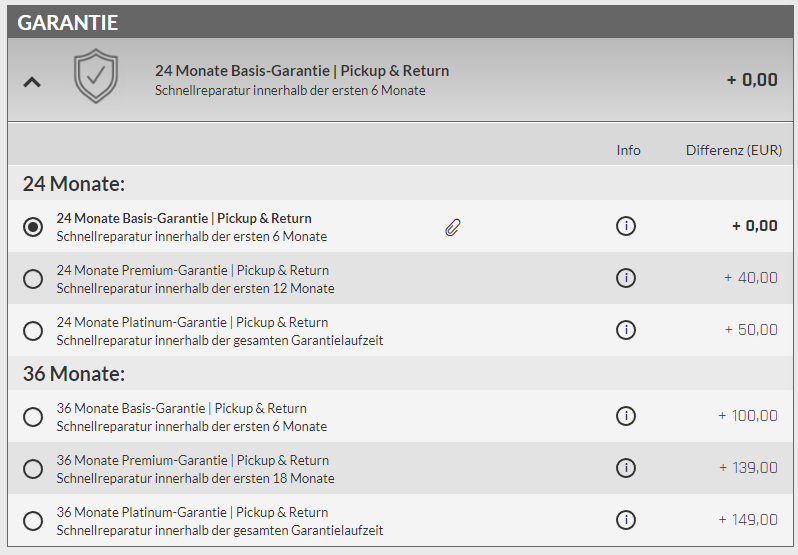
Los servicios de garantía que ofrece Schenker dependen de las decisiones individuales tomadas al comprar el aparato. La garantía básica es de 24 meses e incluye servicios de recogida y devolución y de reparación rápida durante los seis primeros meses.
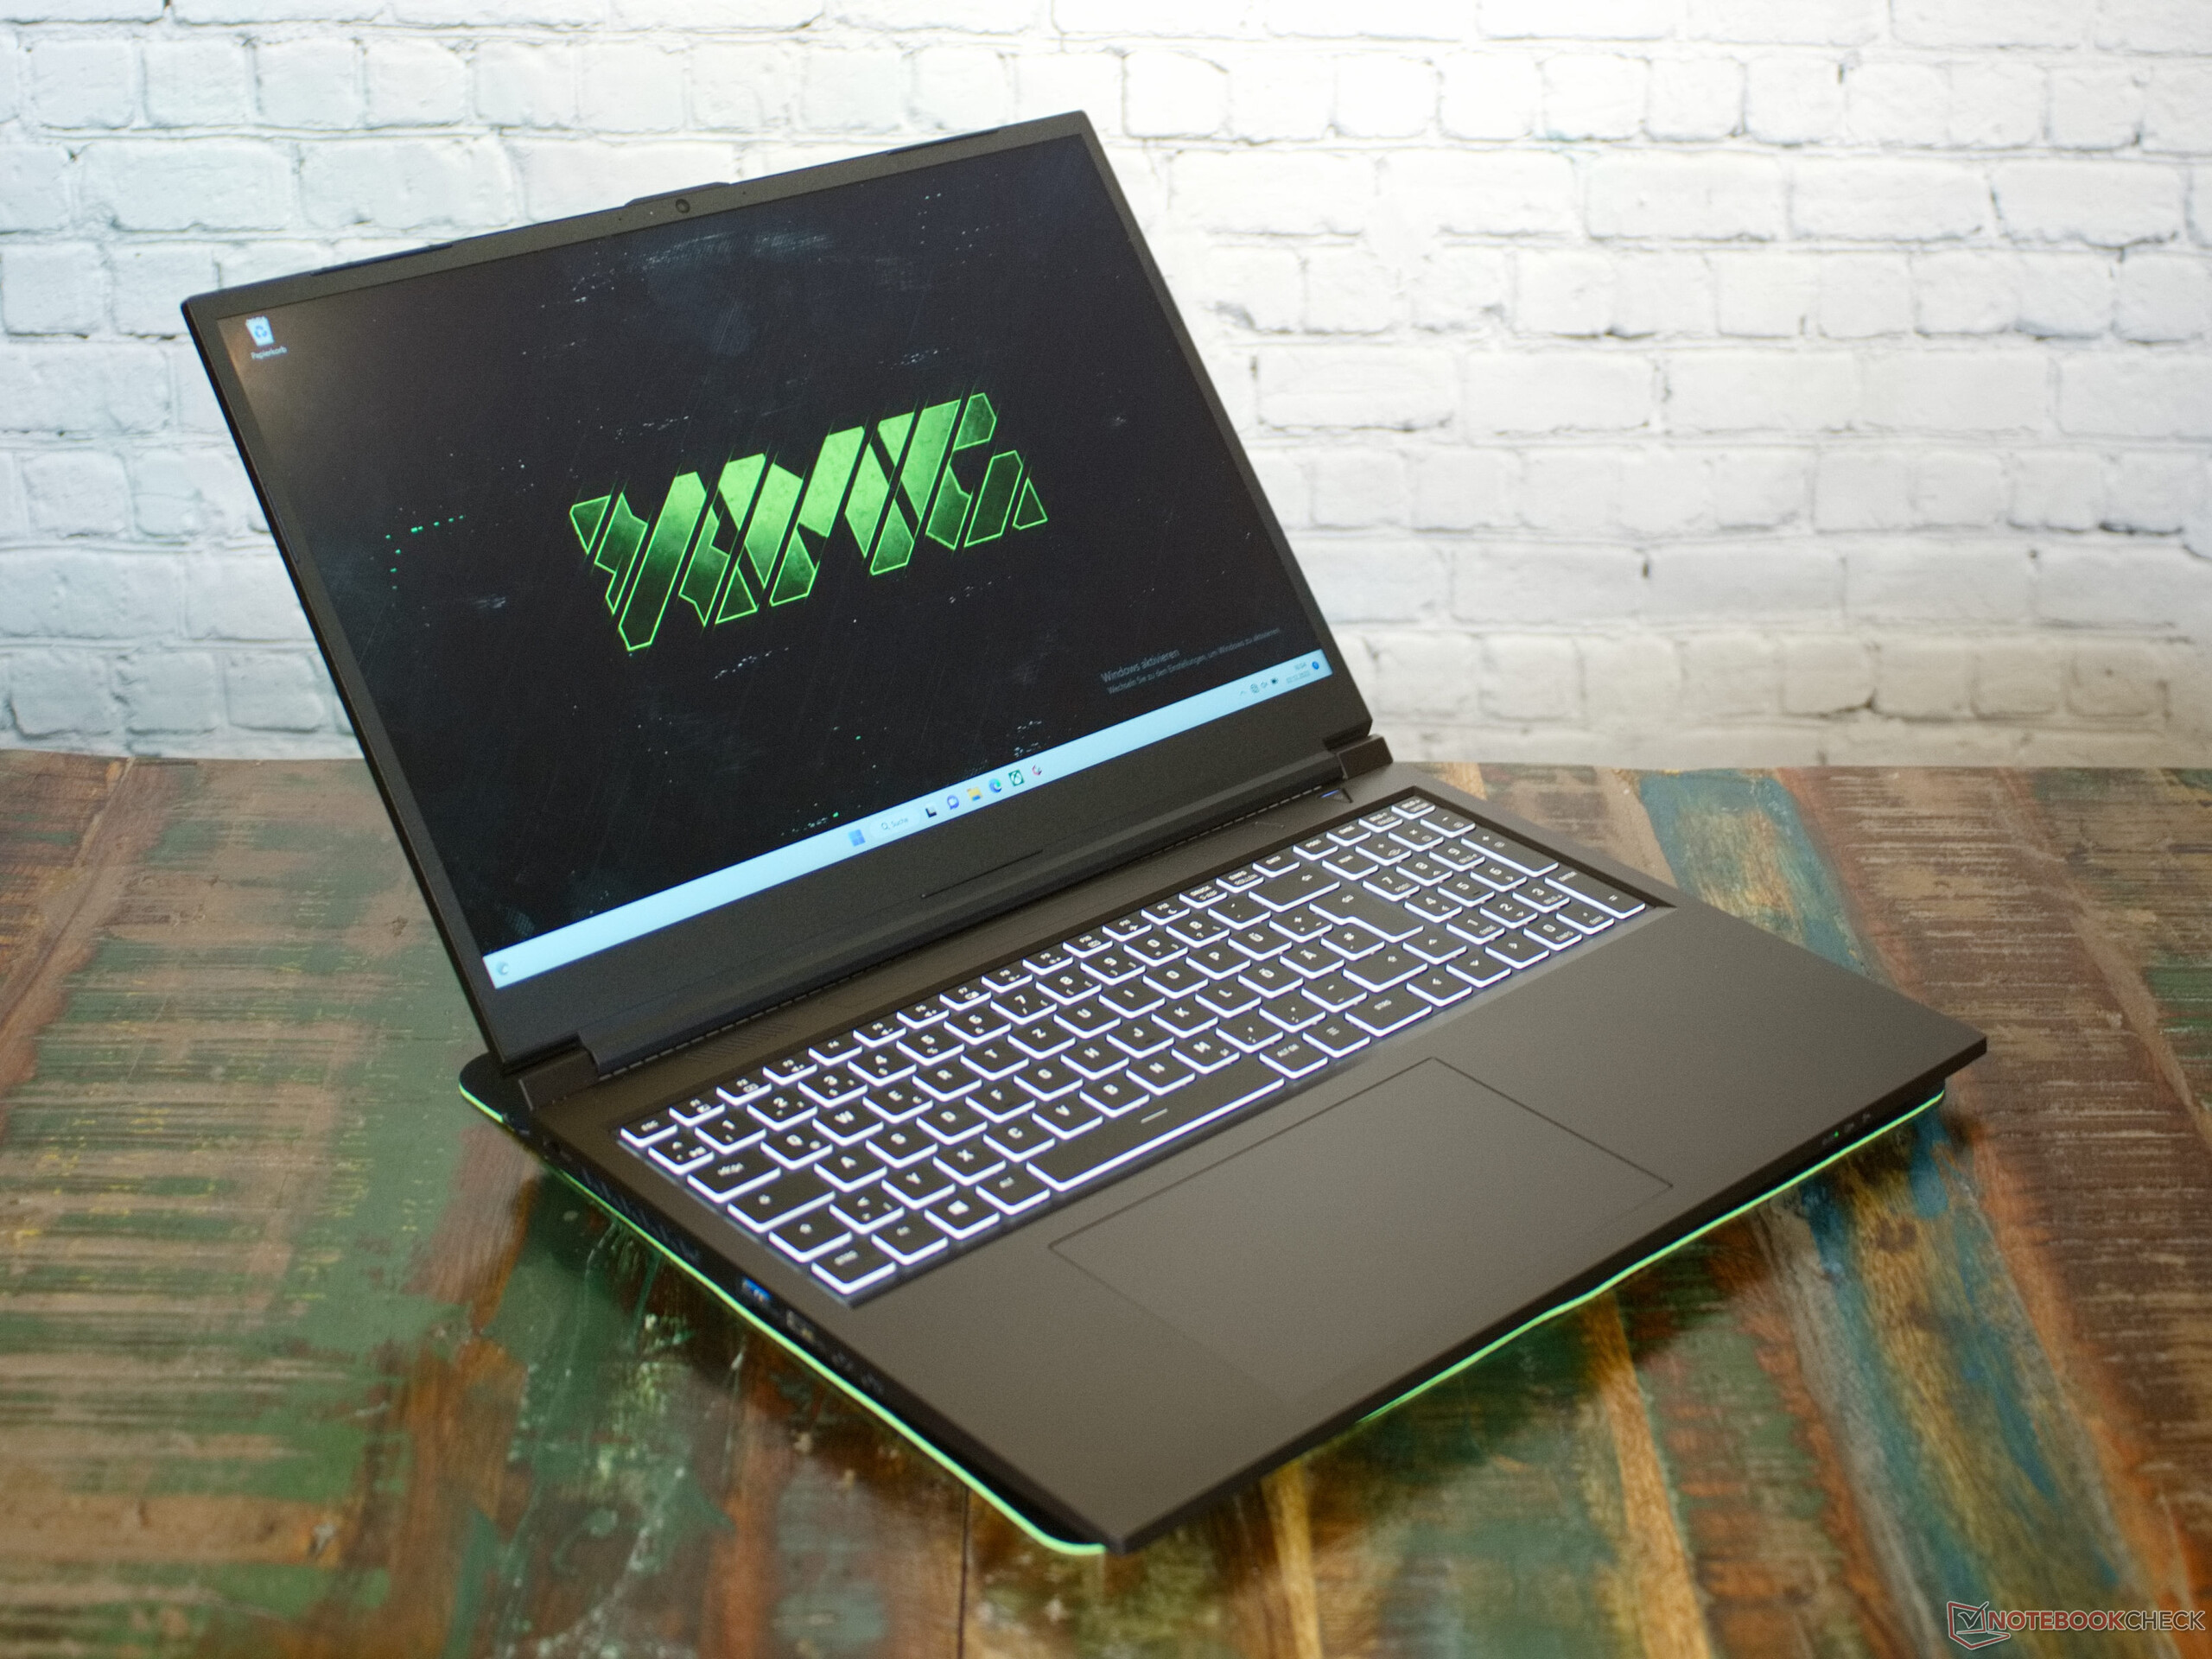
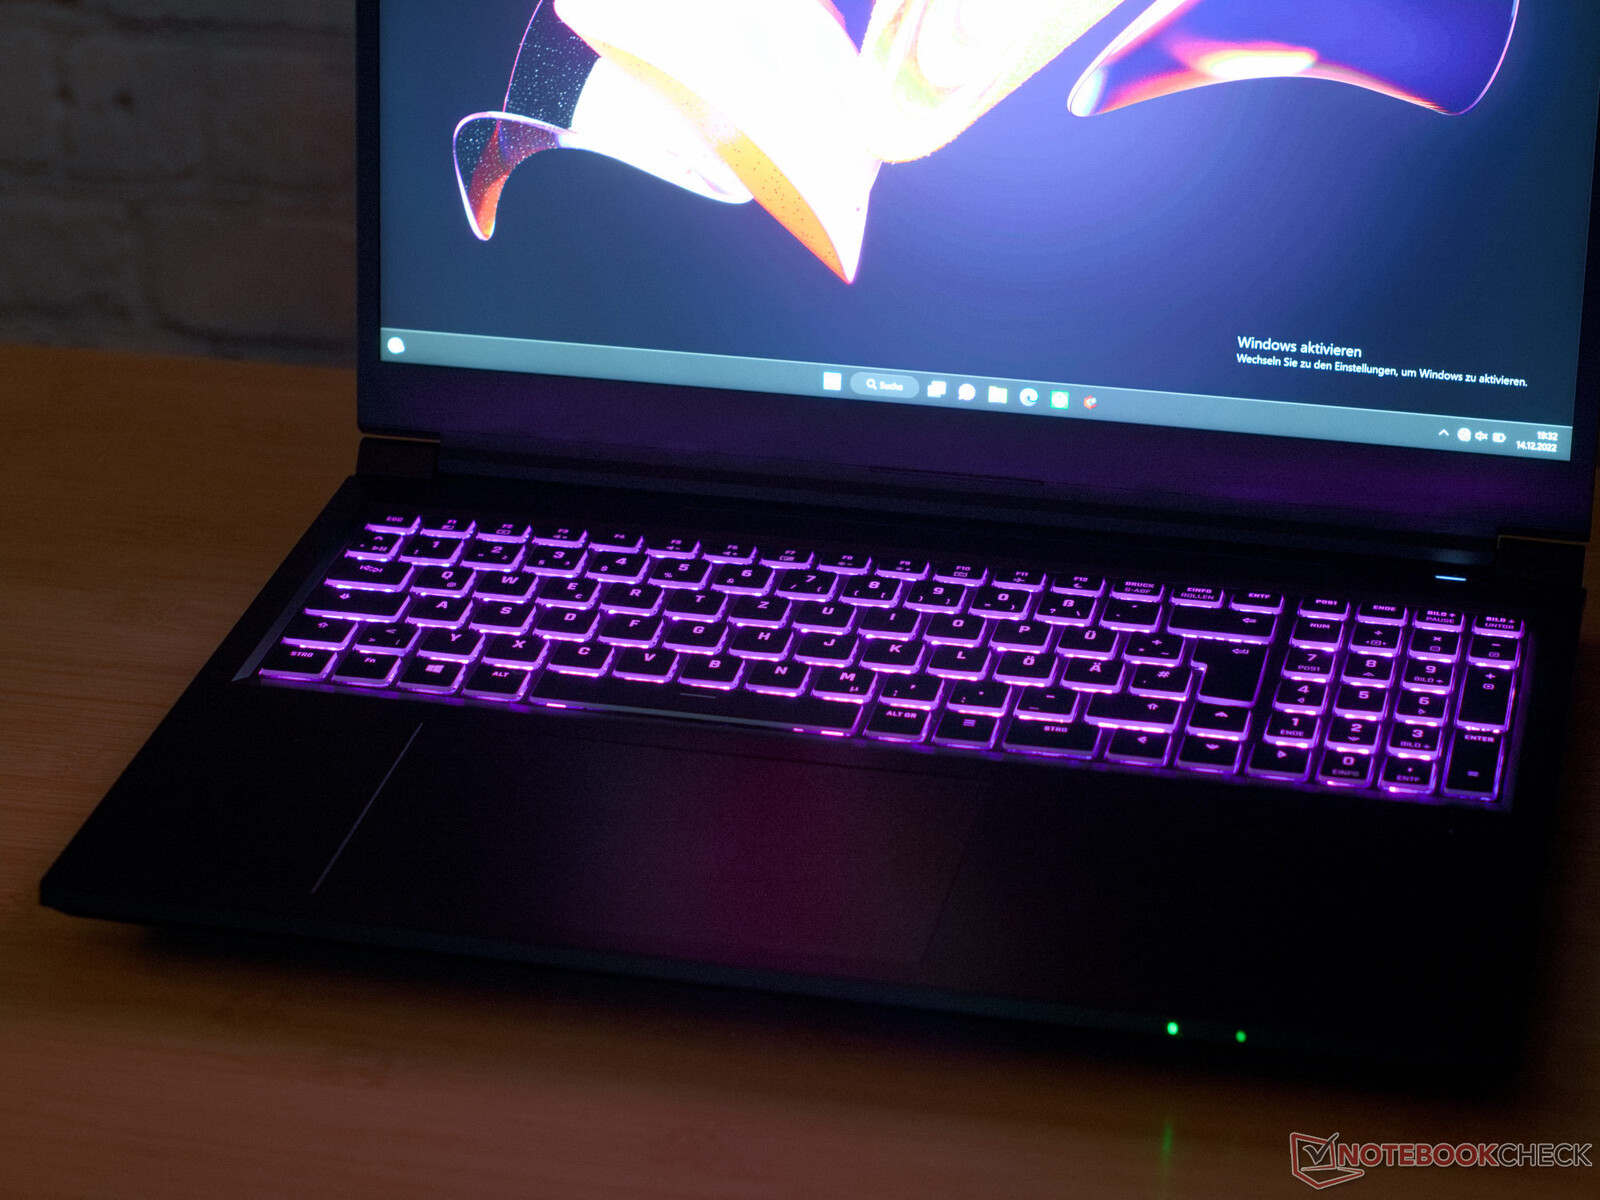
Dispositivos de entrada: recorrido largo de las teclas
Las letras impresas con láser del teclado son fáciles de leer, con un recorrido de las teclas de casi 2 mm, así como teclas de flecha de tamaño completo, iluminación RGB y teclado numérico. Si lo desea, Schenker puede imprimir con láser todas las distribuciones de teclado imaginables.
Con sus 15 × 9 cm, el trackpad del portátil es muy grande. Vergonzoso para Schenker: en el momento de la entrega, el cable plano del trackpad no estaba bien conectado, por lo que al principio tuvimos problemas con un trackpad que no respondía. Una vez solucionado este problema, el dispositivo de entrada funcionó al máximo nivel.
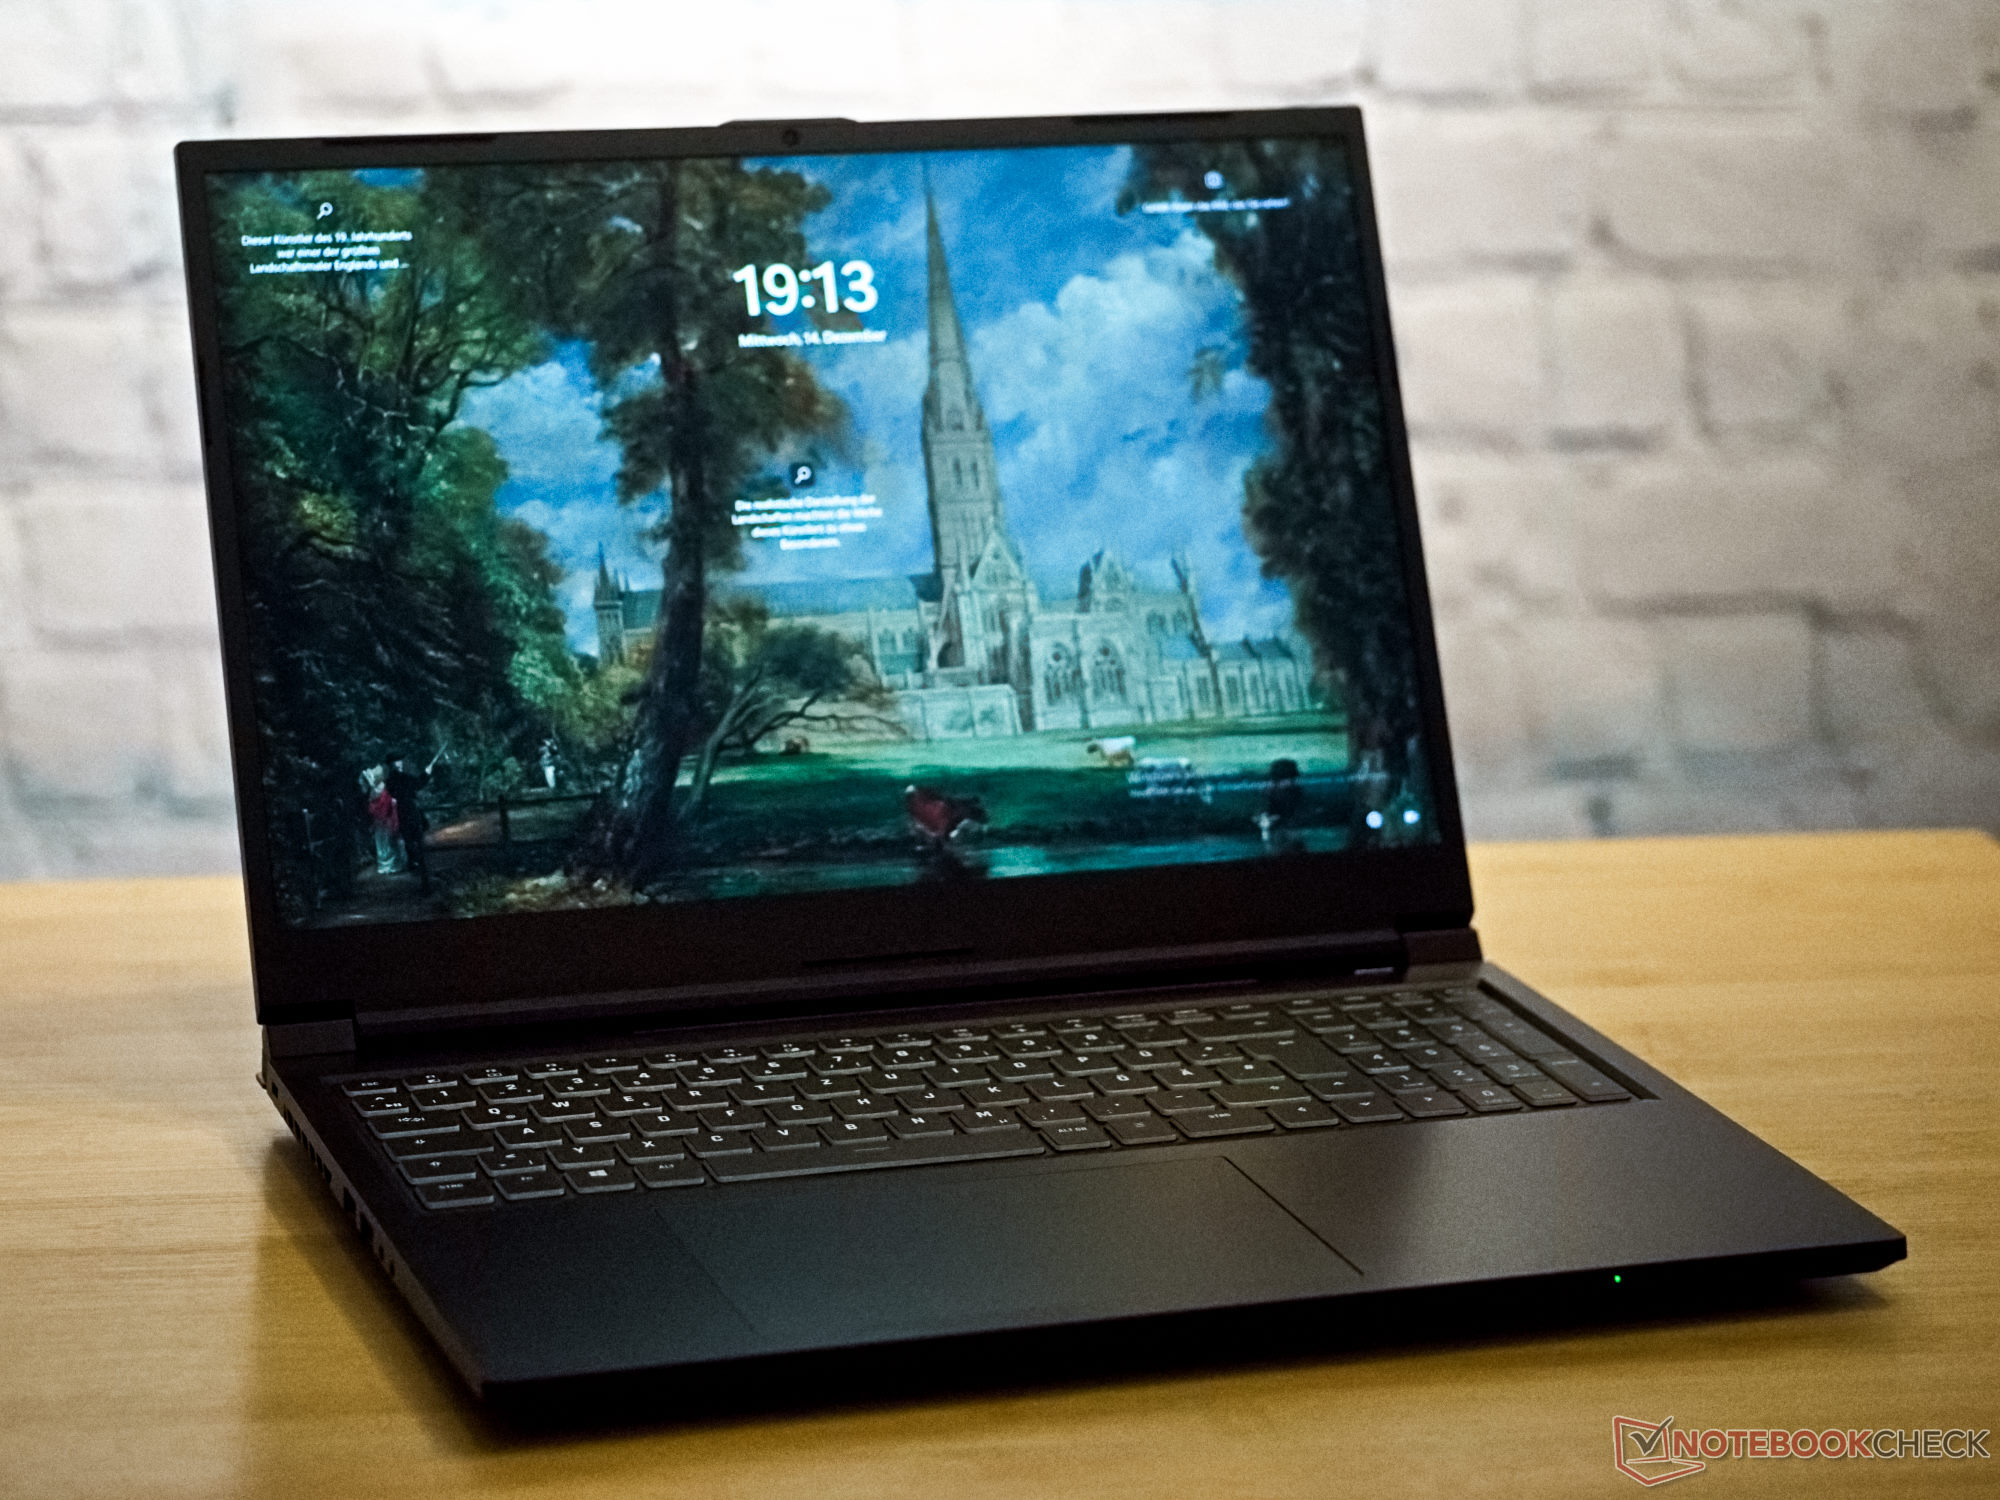
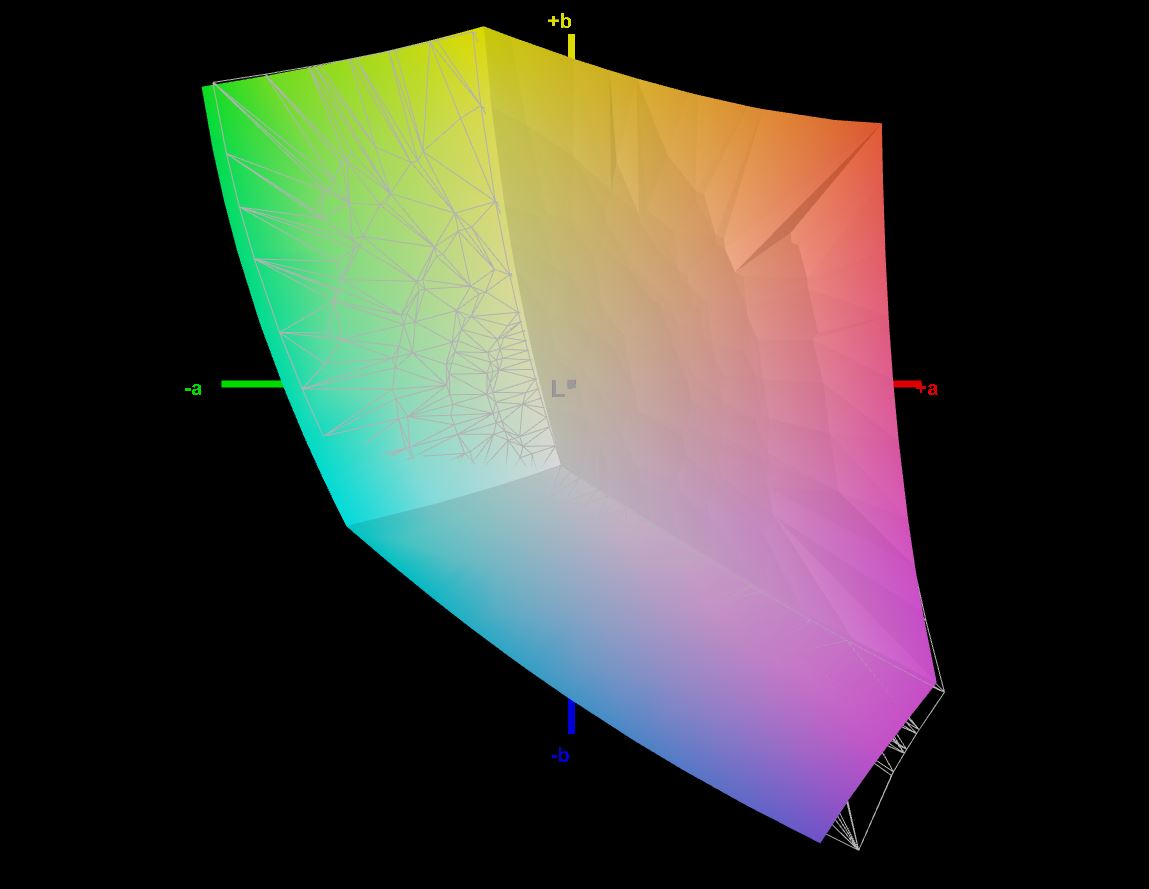
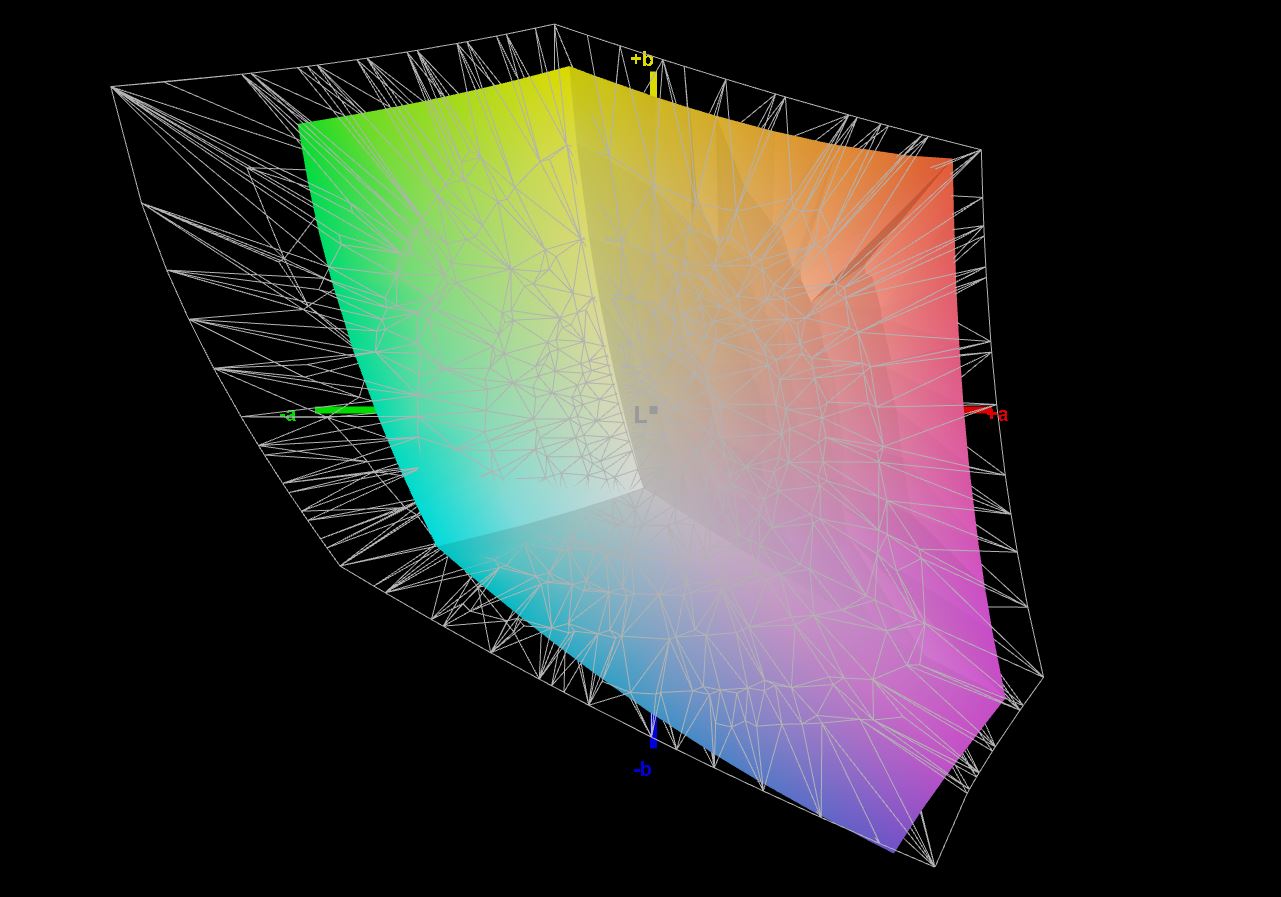
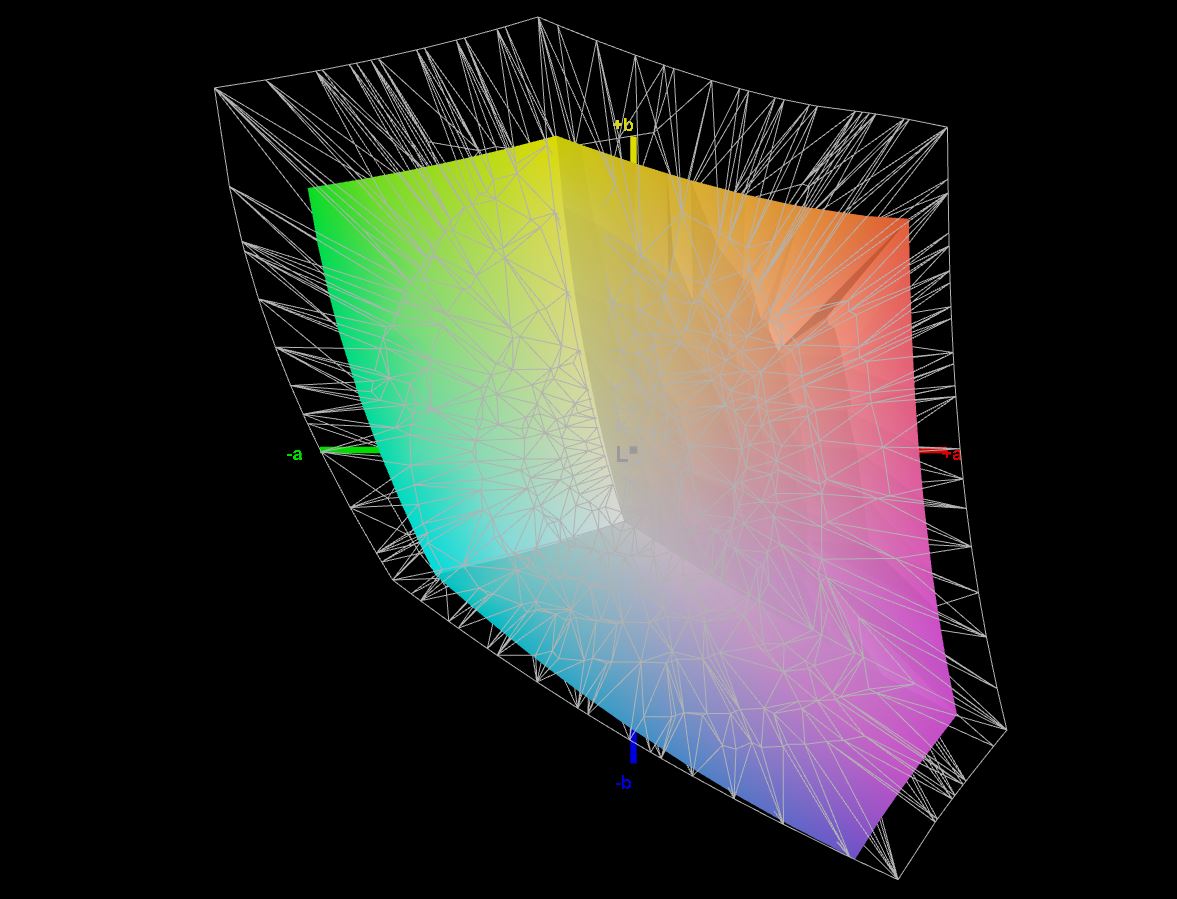
Pantalla - 16:10 con QHD+
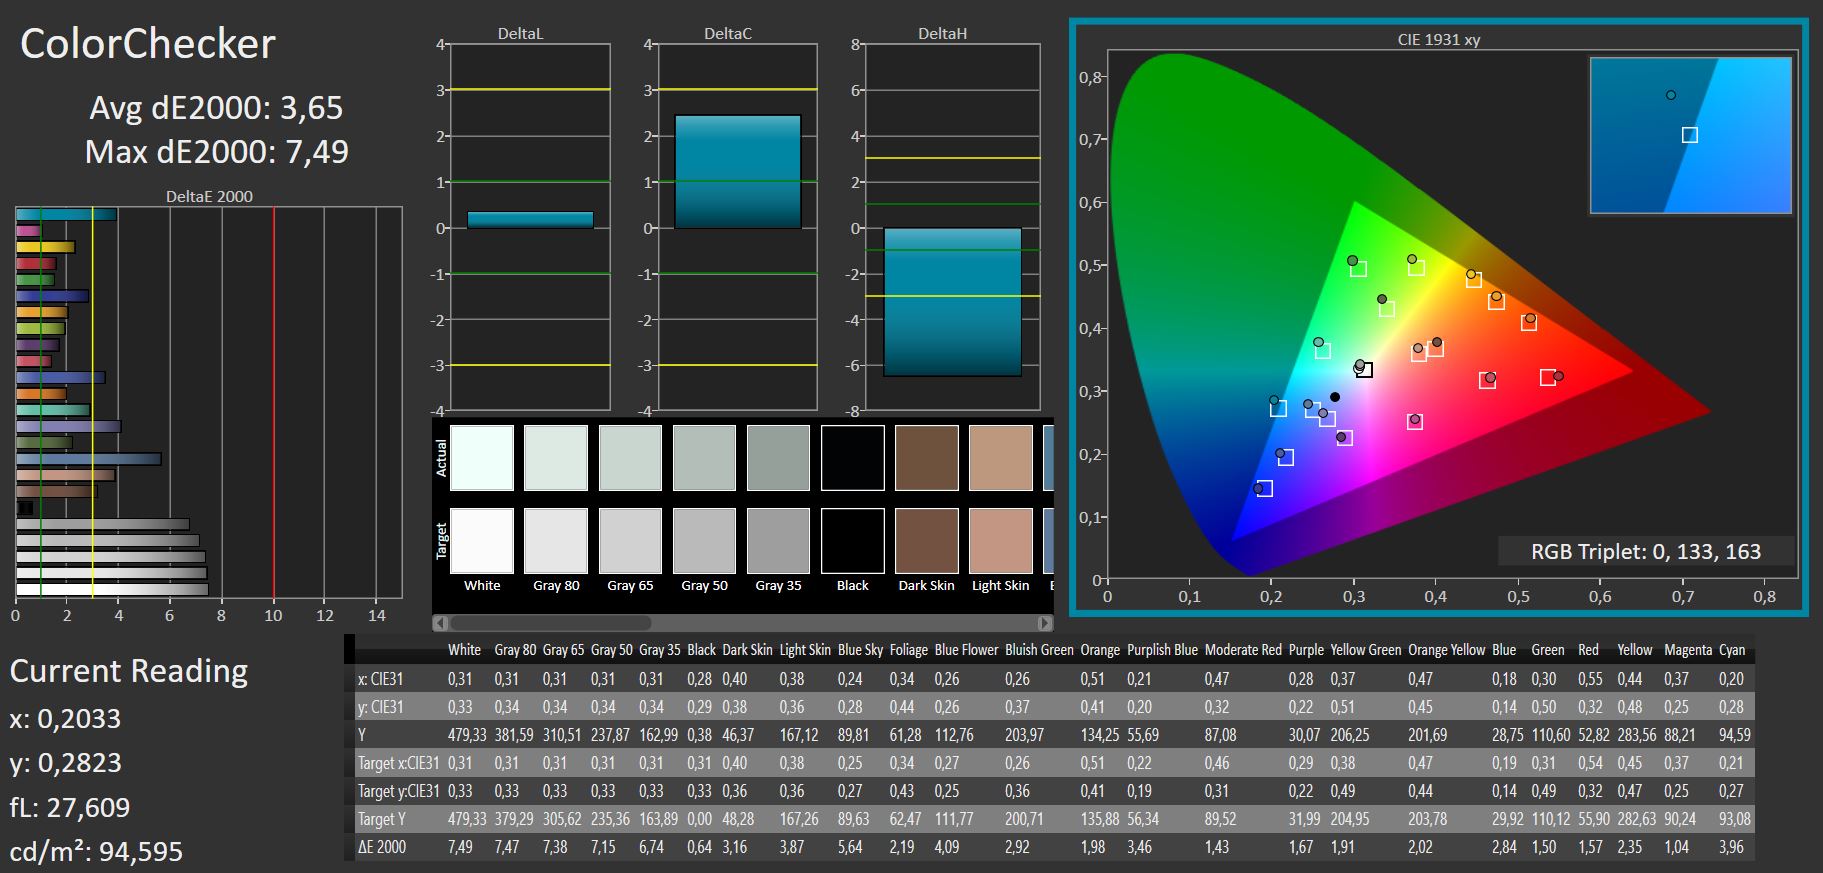
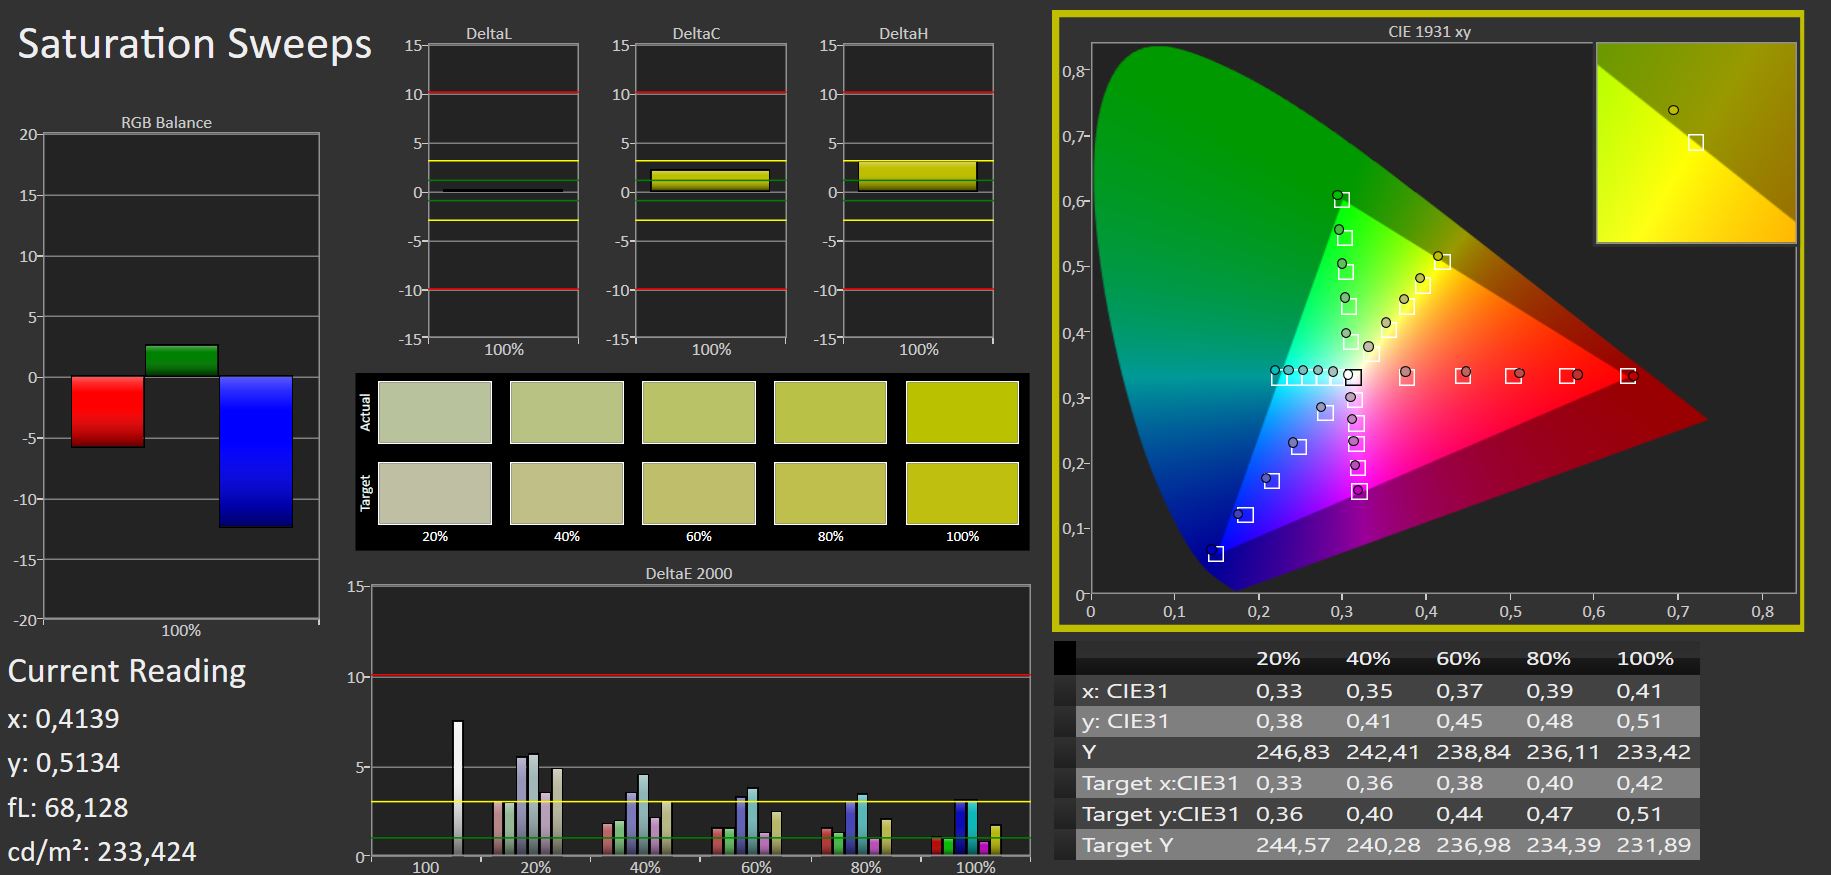
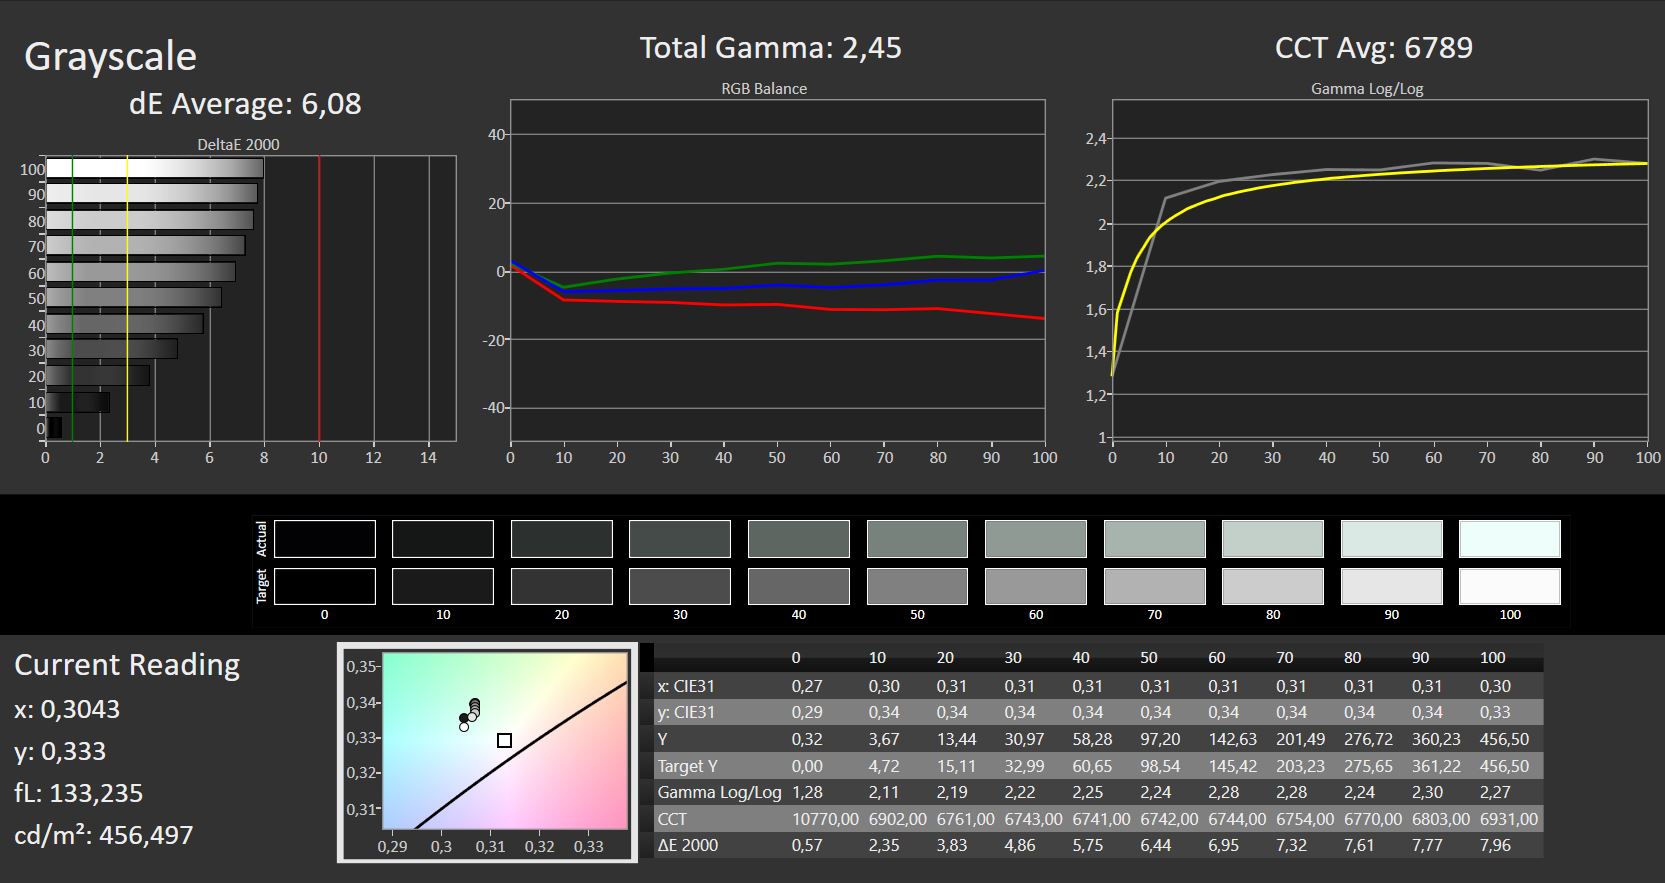
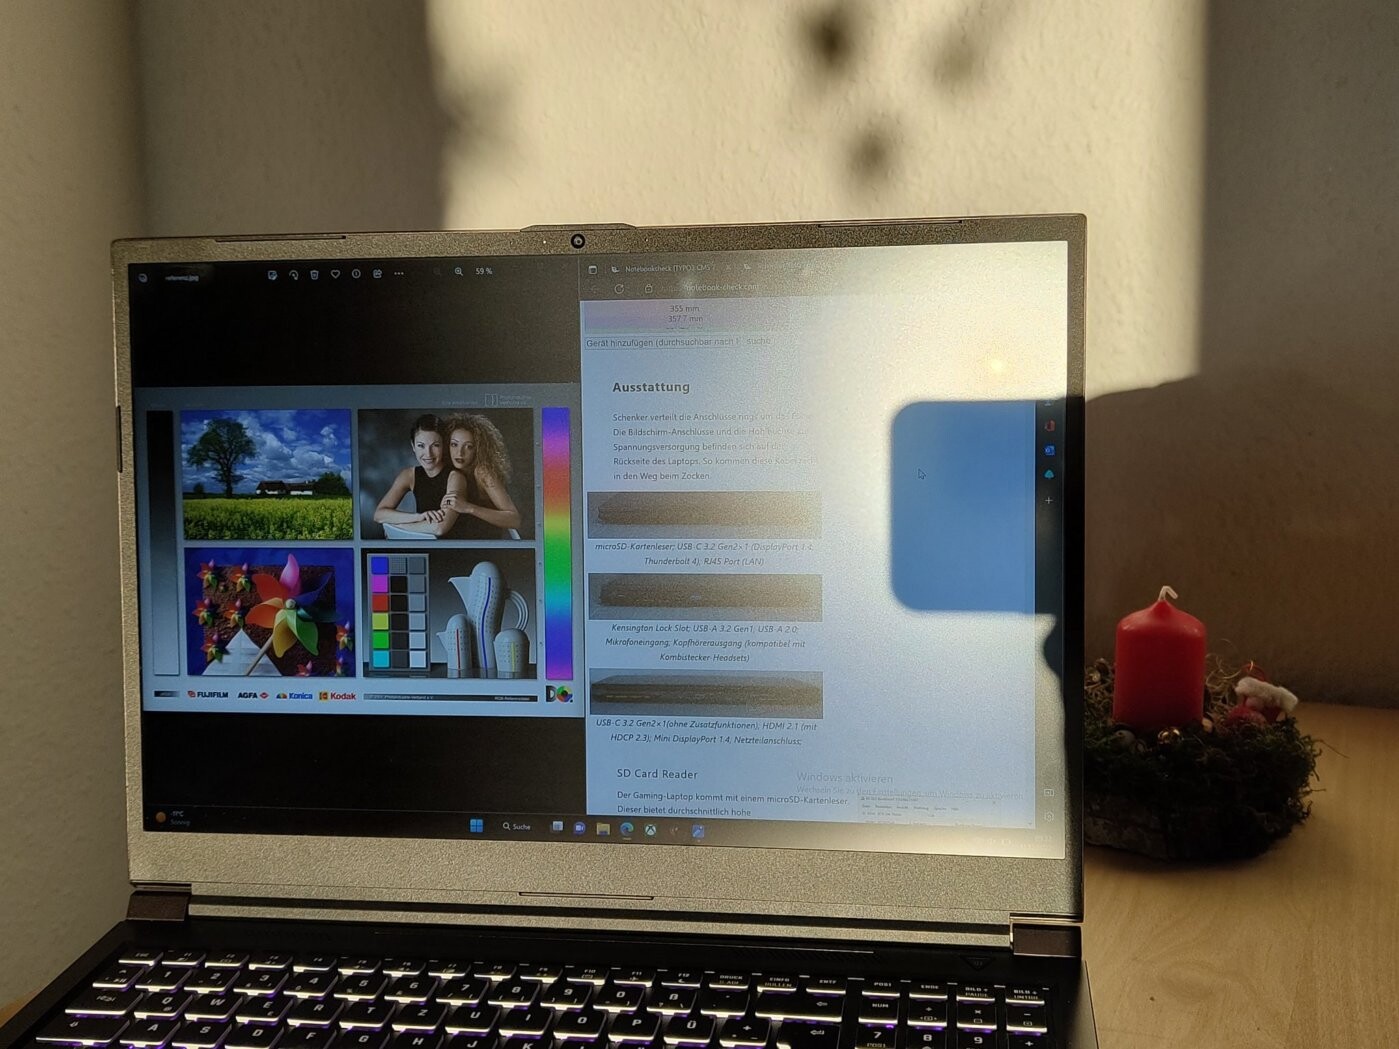
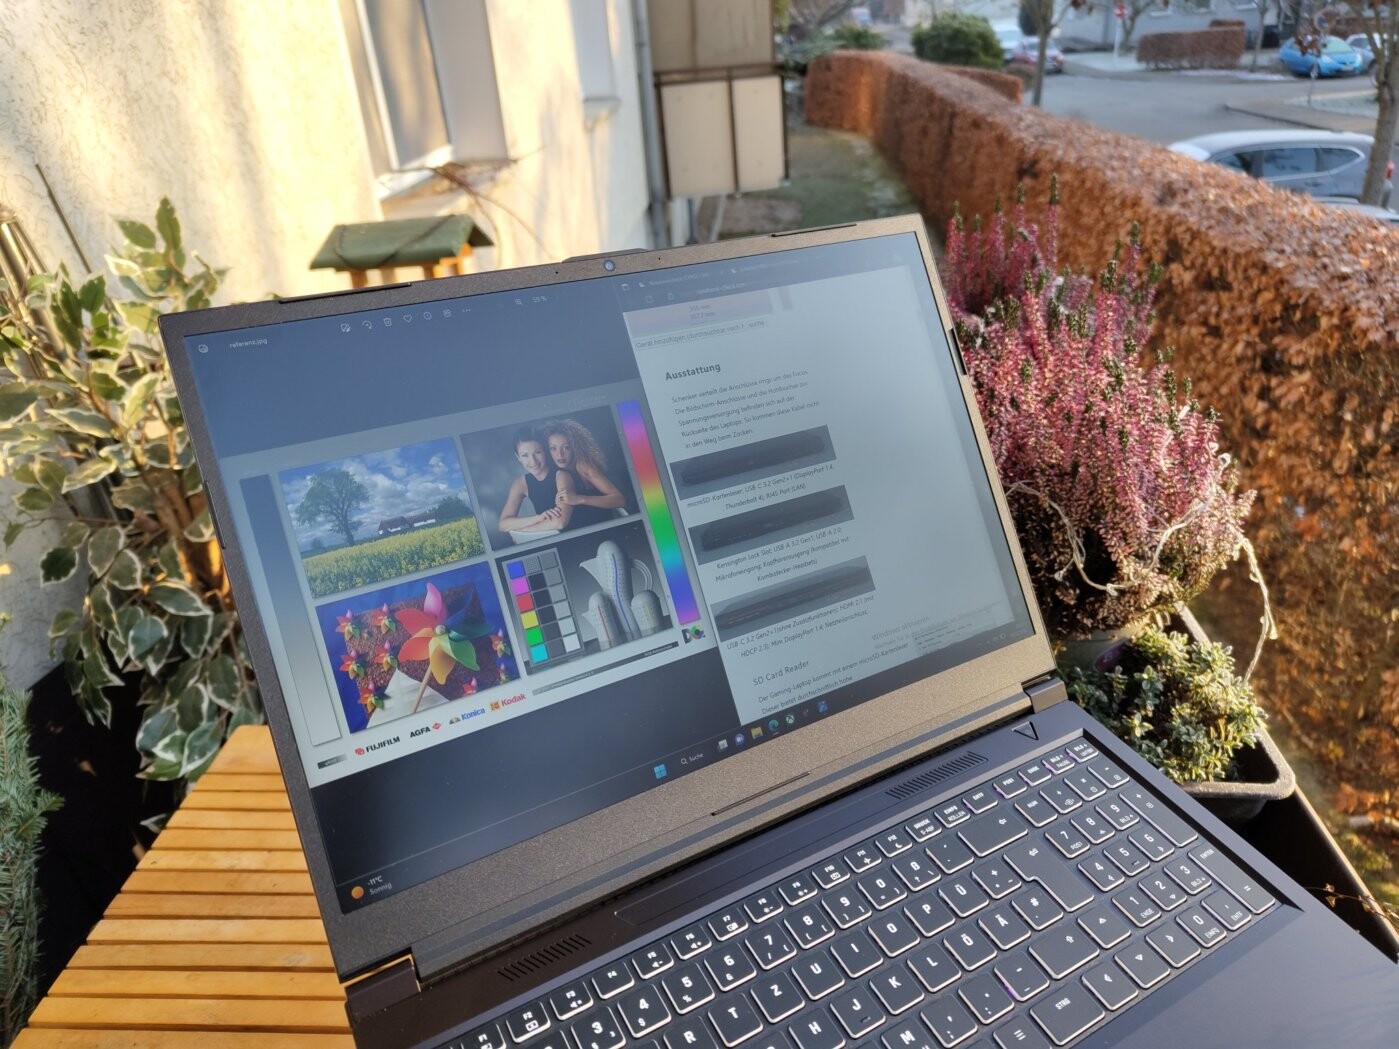
Con una relación de aspecto de 16:10, la pantalla del XMG Focus 16 no es precisamente típica. Aunque ofrece una alta resolución de 2560 × 1600 píxeles y una frecuencia de refresco de 165 Hz, el tiempo de respuesta de esta brillante pantalla de 450 cd/m² no es tan bajo como cabría esperar de un portátil de juego. Los niveles de contraste, cobertura de color, niveles de negro e iluminación pueden describirse como buenos. No pudimos detectar ningún sangrado de luz.
| |||||||||||||||||||||||||
iluminación: 89 %
Brillo con batería: 455 cd/m²
Contraste: 1438:1 (Negro: 0.32 cd/m²)
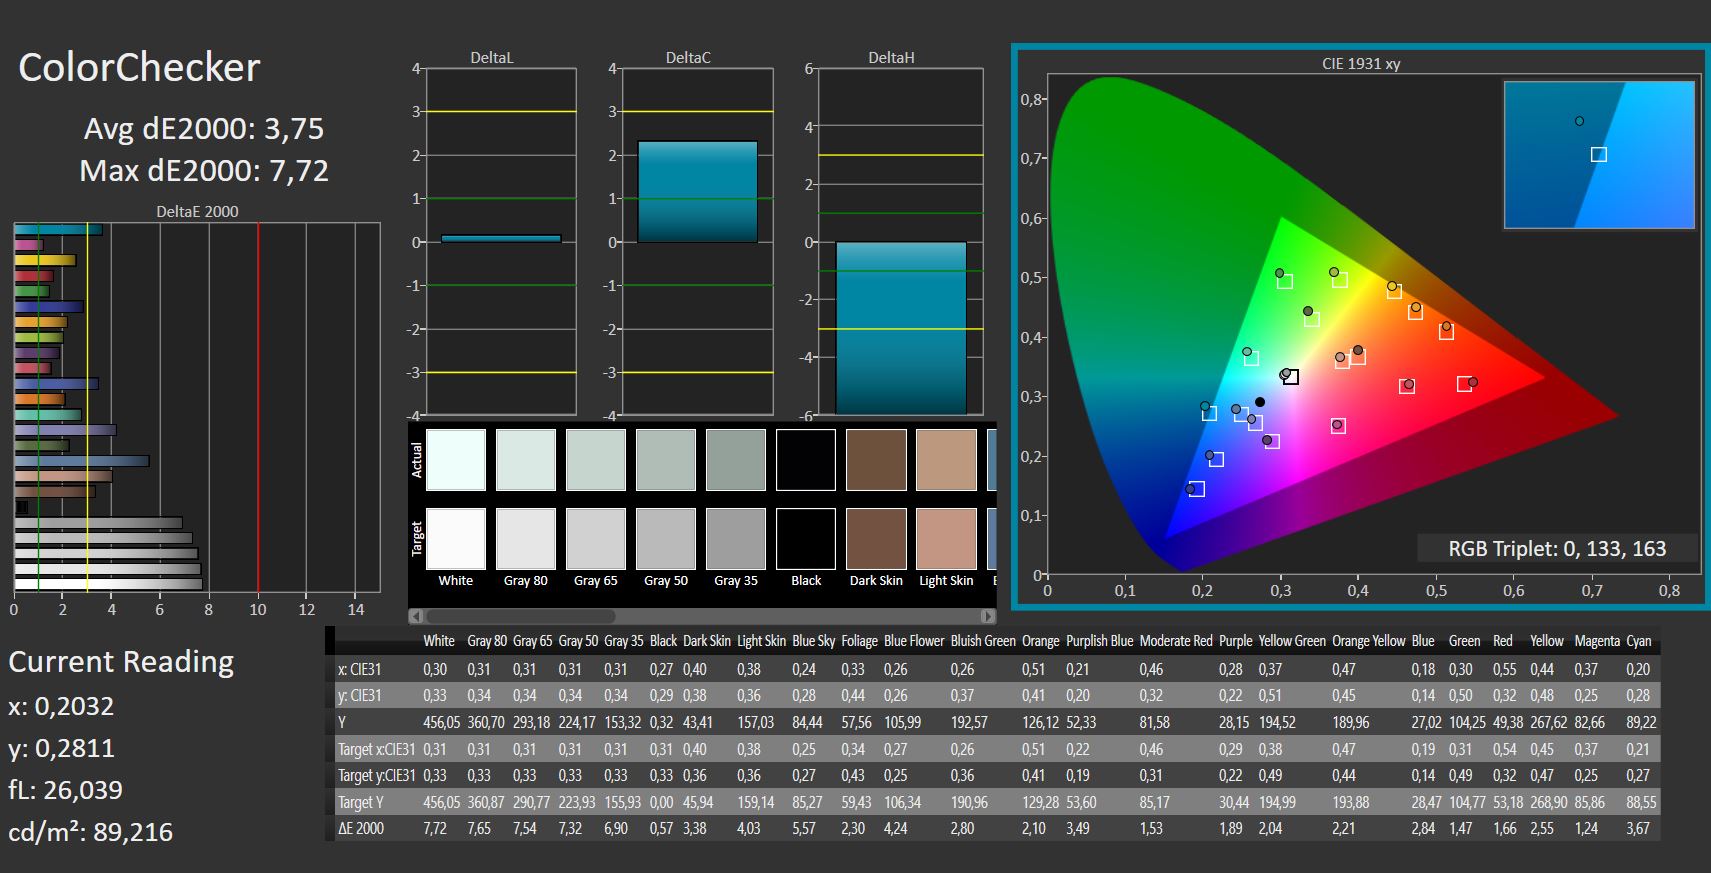
ΔE ColorChecker Calman: 3.65 | ∀{0.5-29.43 Ø4.71}
calibrated: 3.65
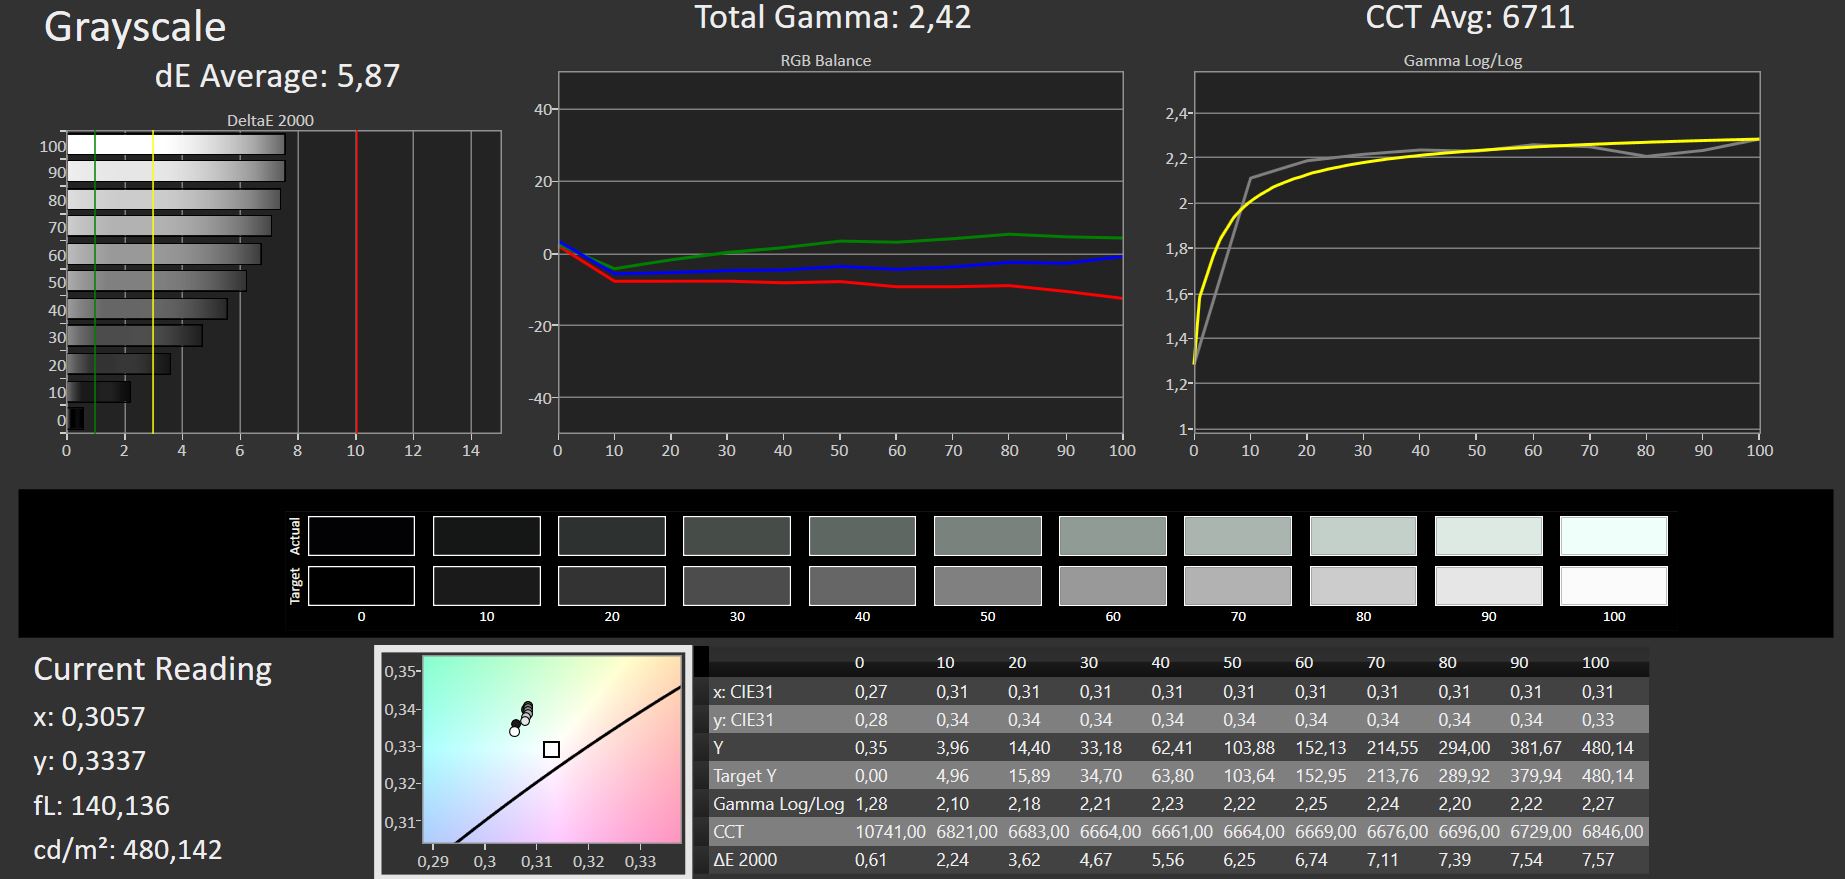
ΔE Greyscale Calman: 5.87 | ∀{0.09-98 Ø4.96}
70.6% AdobeRGB 1998 (Argyll 3D)
96.6% sRGB (Argyll 3D)
68.3% Display P3 (Argyll 3D)
Gamma: 2.42
CCT: 6711 K
| Schenker XMG Focus 16 (i7-12700H, RTX 3060) BOE NE16oQDM-NY1, IPS, 2560x1600, 16" | Dell G16 7620 BOE NE16QDM, IPS, 2560x1600, 16" | Asus ZenBook Pro 16X OLED UX7602ZM-ME115W Samsung SDC415D, OLED, 3840x2400, 16" | Asus ROG Flow X16 GV601RW-M5082W AUO B160QAN02.S, Mini LED, 2560x1600, 16.1" | Lenovo ThinkPad X1 Extreme G5-21DE003RGE LP160UQ1-SPB1, IPS, 3840x2400, 16" | Lenovo Legion Slim 7-16IAH 82TF004YGE MNG007DA1-G , IPS LED, 2560x1600, 16" | Lenovo Legion 5 Pro 16IAH7H BOE CCQ_NE160QDM_NY1, IPS, 2560x1600, 16" | |
|---|---|---|---|---|---|---|---|
| Display | 0% | 25% | 26% | 22% | 3% | 1% | |
| Display P3 Coverage (%) | 68.3 | 68.3 0% | 99.84 46% | 99.82 46% | 84.6 24% | 70.5 3% | 68.53 0% |
| sRGB Coverage (%) | 96.6 | 98 1% | 99.99 4% | 99.99 4% | 99.2 3% | 99.1 3% | 98.38 2% |
| AdobeRGB 1998 Coverage (%) | 70.6 | 70.5 0% | 88.9 26% | 90.21 28% | 97.7 38% | 72.8 3% | 70.45 0% |
| Response Times | 26% | 85% | 16% | -129% | 31% | 30% | |
| Response Time Grey 50% / Grey 80% * (ms) | 16.4 ? | 8.6 ? 48% | 2 ? 88% | 11 ? 33% | 46 ? -180% | 12 ? 27% | 14 ? 15% |
| Response Time Black / White * (ms) | 10.8 ? | 10.4 ? 4% | 2 ? 81% | 11 ? -2% | 19.2 ? -78% | 7 ? 35% | 6 ? 44% |
| PWM Frequency (Hz) | 59 ? | 7400 ? | |||||
| Screen | 15% | 21% | 52% | 23% | 19% | 17% | |
| Brightness middle (cd/m²) | 460 | 369.4 -20% | 346 -25% | 498 8% | 476 3% | 523 14% | 515 12% |
| Brightness (cd/m²) | 442 | 348 -21% | 354 -20% | 502 14% | 470 6% | 494 12% | 475 7% |
| Brightness Distribution (%) | 89 | 83 -7% | 96 8% | 94 6% | 90 1% | 90 1% | 85 -4% |
| Black Level * (cd/m²) | 0.32 | 0.32 -0% | 0.11 66% | 0.35 -9% | 0.4 -25% | 0.45 -41% | |
| Contrast (:1) | 1438 | 1154 -20% | 4527 215% | 1360 -5% | 1308 -9% | 1144 -20% | |
| Colorchecker dE 2000 * | 3.65 | 1.78 51% | 2.28 38% | 1.87 49% | 1.9 48% | 2.6 29% | 2.38 35% |
| Colorchecker dE 2000 max. * | 7.49 | 4.41 41% | 4.94 34% | 6.15 18% | 4.7 37% | 5 33% | 4.37 42% |
| Colorchecker dE 2000 calibrated * | 3.65 | 1.22 67% | 2.16 41% | 1.94 47% | 1.3 64% | 1 73% | 1.1 70% |
| Greyscale dE 2000 * | 5.87 | 3.2 45% | 1.64 72% | 3.15 46% | 2.4 59% | 3.3 44% | 2.71 54% |
| Gamma | 2.42 91% | 2.2 100% | 2.37 93% | 330.95 1% | 2.24 98% | 2.17 101% | 2.49 88% |
| CCT | 6711 97% | 6750 96% | 6384 102% | 7294 89% | 6377 102% | 6013 108% | 6117 106% |
| Media total (Programa/Opciones) | 14% /
14% | 44% /
33% | 31% /
41% | -28% /
1% | 18% /
17% | 16% /
15% |
* ... más pequeño es mejor
La pantalla del portátil para juegos Schenker cubre el 95 % de sRGB con AdobeRGB y DisplayP3 en torno al 70 %. La reproducción del color es buena, aunque no exactamente perfecta. Una ΔΕ inferior a 3 sería deseable, y el Focus 16 logra una ΔΕ media de 3,65. Así pues, las devociones de color de fábrica son aceptables. Nuestro perfil ICC no dio lugar a ninguna mejora en la reproducción del color.

Tiempos de respuesta del display
| ↔ Tiempo de respuesta de Negro a Blanco | ||
|---|---|---|
| 10.8 ms ... subida ↗ y bajada ↘ combinada | ↗ 5 ms subida | 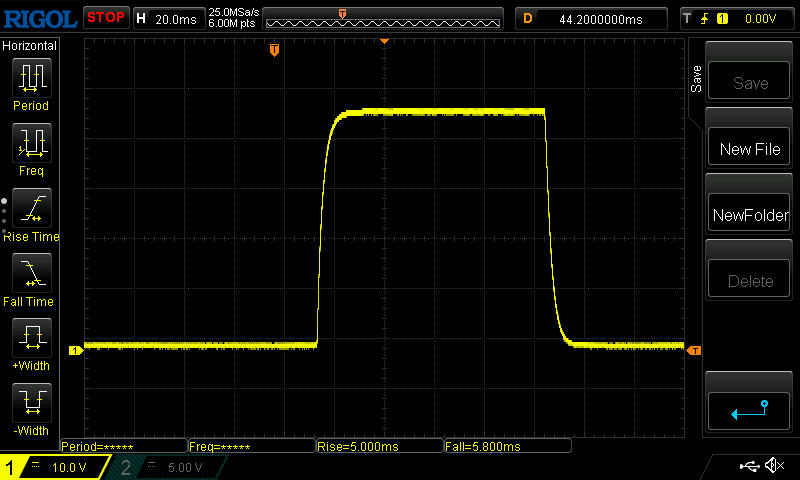 |
| ↘ 5.8 ms bajada | ||
| La pantalla mostró buenos tiempos de respuesta en nuestros tests pero podría ser demasiado lenta para los jugones competitivos. En comparación, todos los dispositivos de prueba van de ##min### (mínimo) a 240 (máximo) ms. » 29 % de todos los dispositivos son mejores. Esto quiere decir que el tiempo de respuesta medido es mejor que la media (19.8 ms) de todos los dispositivos testados. | ||
| ↔ Tiempo de respuesta 50% Gris a 80% Gris | ||
| 16.4 ms ... subida ↗ y bajada ↘ combinada | ↗ 7.4 ms subida | 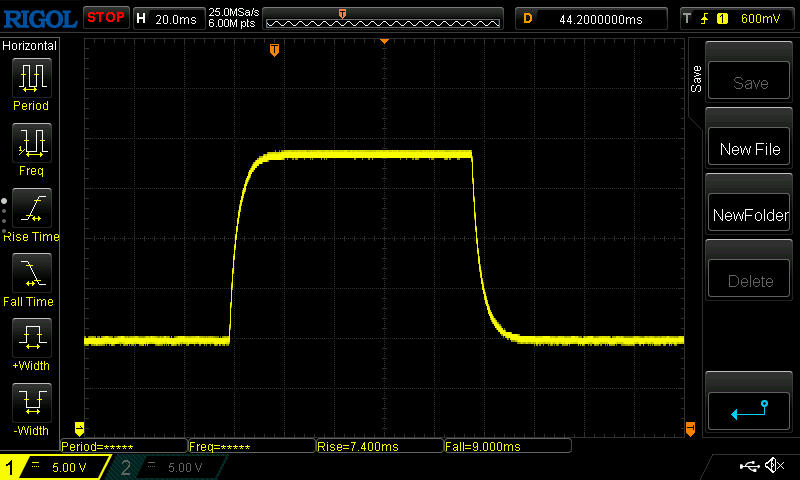 |
| ↘ 9 ms bajada | ||
| La pantalla mostró buenos tiempos de respuesta en nuestros tests pero podría ser demasiado lenta para los jugones competitivos. En comparación, todos los dispositivos de prueba van de ##min### (mínimo) a 636 (máximo) ms. » 31 % de todos los dispositivos son mejores. Esto quiere decir que el tiempo de respuesta medido es mejor que la media (30.9 ms) de todos los dispositivos testados. | ||
Parpadeo de Pantalla / PWM (Pulse-Width Modulation)
| Parpadeo de Pantalla / PWM no detectado | 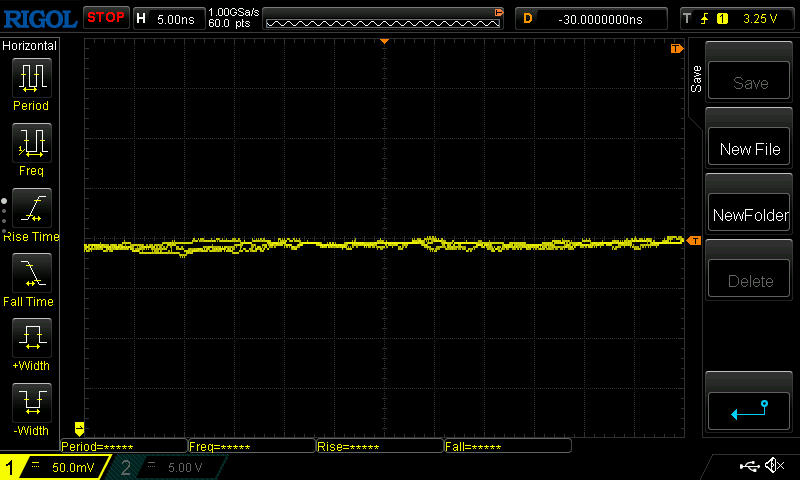 | ||
Comparación: 52 % de todos los dispositivos testados no usaron PWM para atenuar el display. Si se usó, medimos una media de 7741 (mínimo: 5 - máxmo: 343500) Hz. | |||
El panel IPS sin parpadeos causó una buena impresión en el uso en exteriores, así como cuando se ve desde varios ángulos. Sólo cuando el sol brilló sobre la pantalla mate en un ángulo desfavorable encontramos dificultades de legibilidad.

Rendimiento: un poco por encima de la media
Como todos los portátiles Schenker, el XMG Focus 16 también es muy personalizable. Así, es posible seleccionar la RAM, varios discos duros y otras opciones en el configurador XMG Focus 16configurador. Actualmente no es posible elegir diferentes CPUs y GPUs. Todos los dispositivos XMG Focus 16 vienen con unIntel Core i7-12700Hy unaNvidia GeForce RTX 3060. Además, nuestro dispositivo de prueba estaba equipado con 2×16 GB de RAM DDR4 y una unidad SSD Samsung NVMe de 1 TB.
Todo esto significa que tenemos un portátil que debería manejar la mayoría de juegos modernos. Sin embargo, la RTX 3060 no siempre logra superar los 60 fps con los ajustes gráficos más altos y a la resolución nativa del dispositivo.
Control del rendimiento y condiciones de ensayo
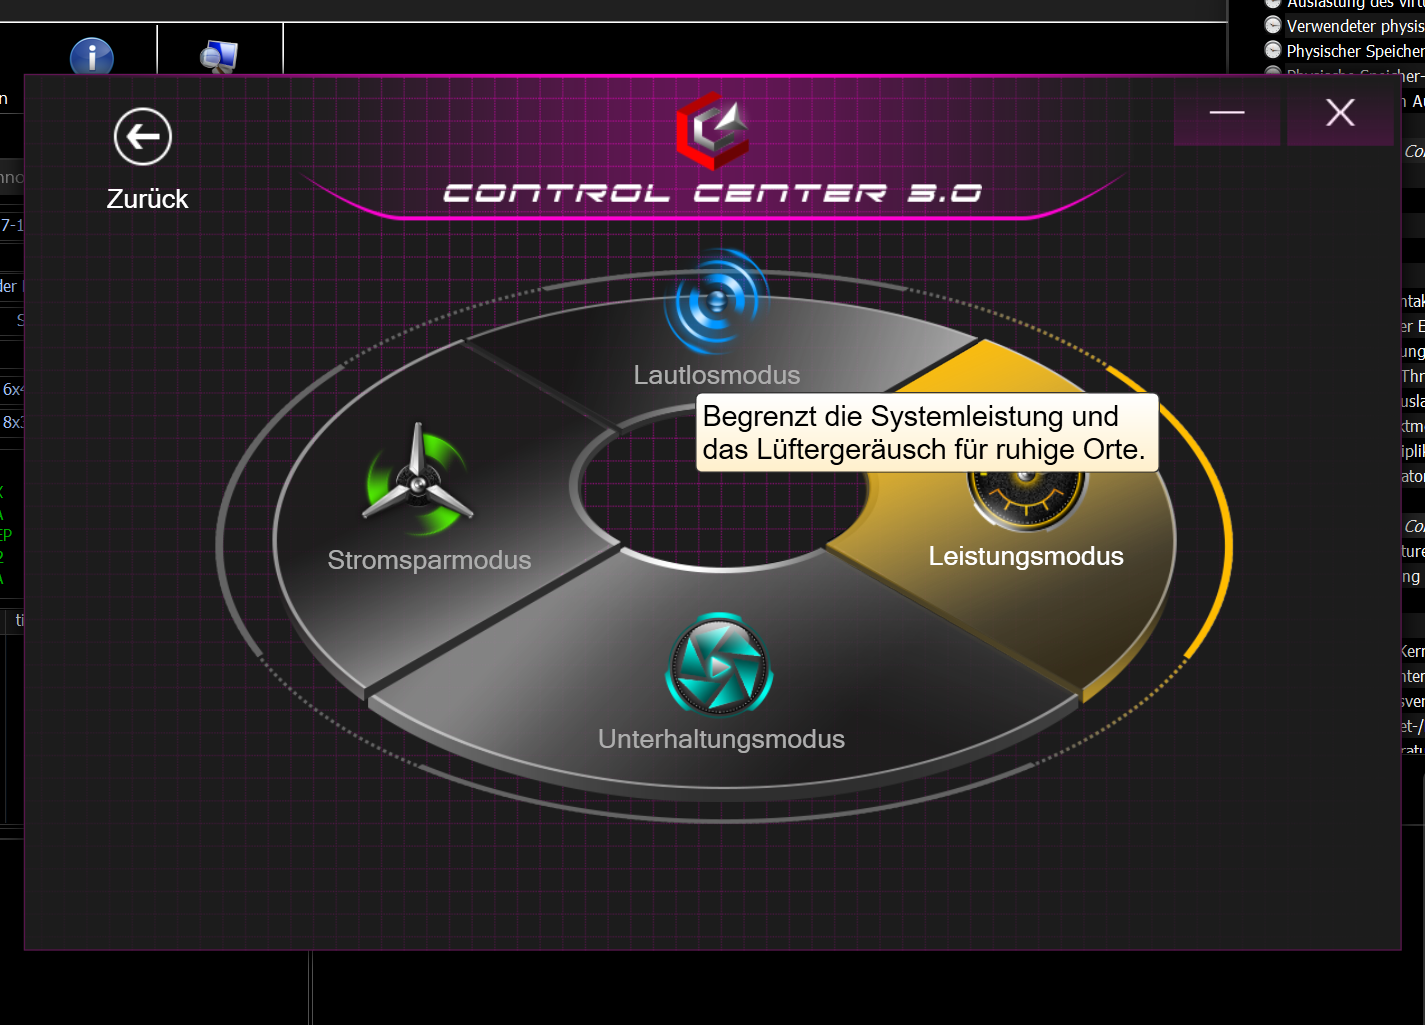
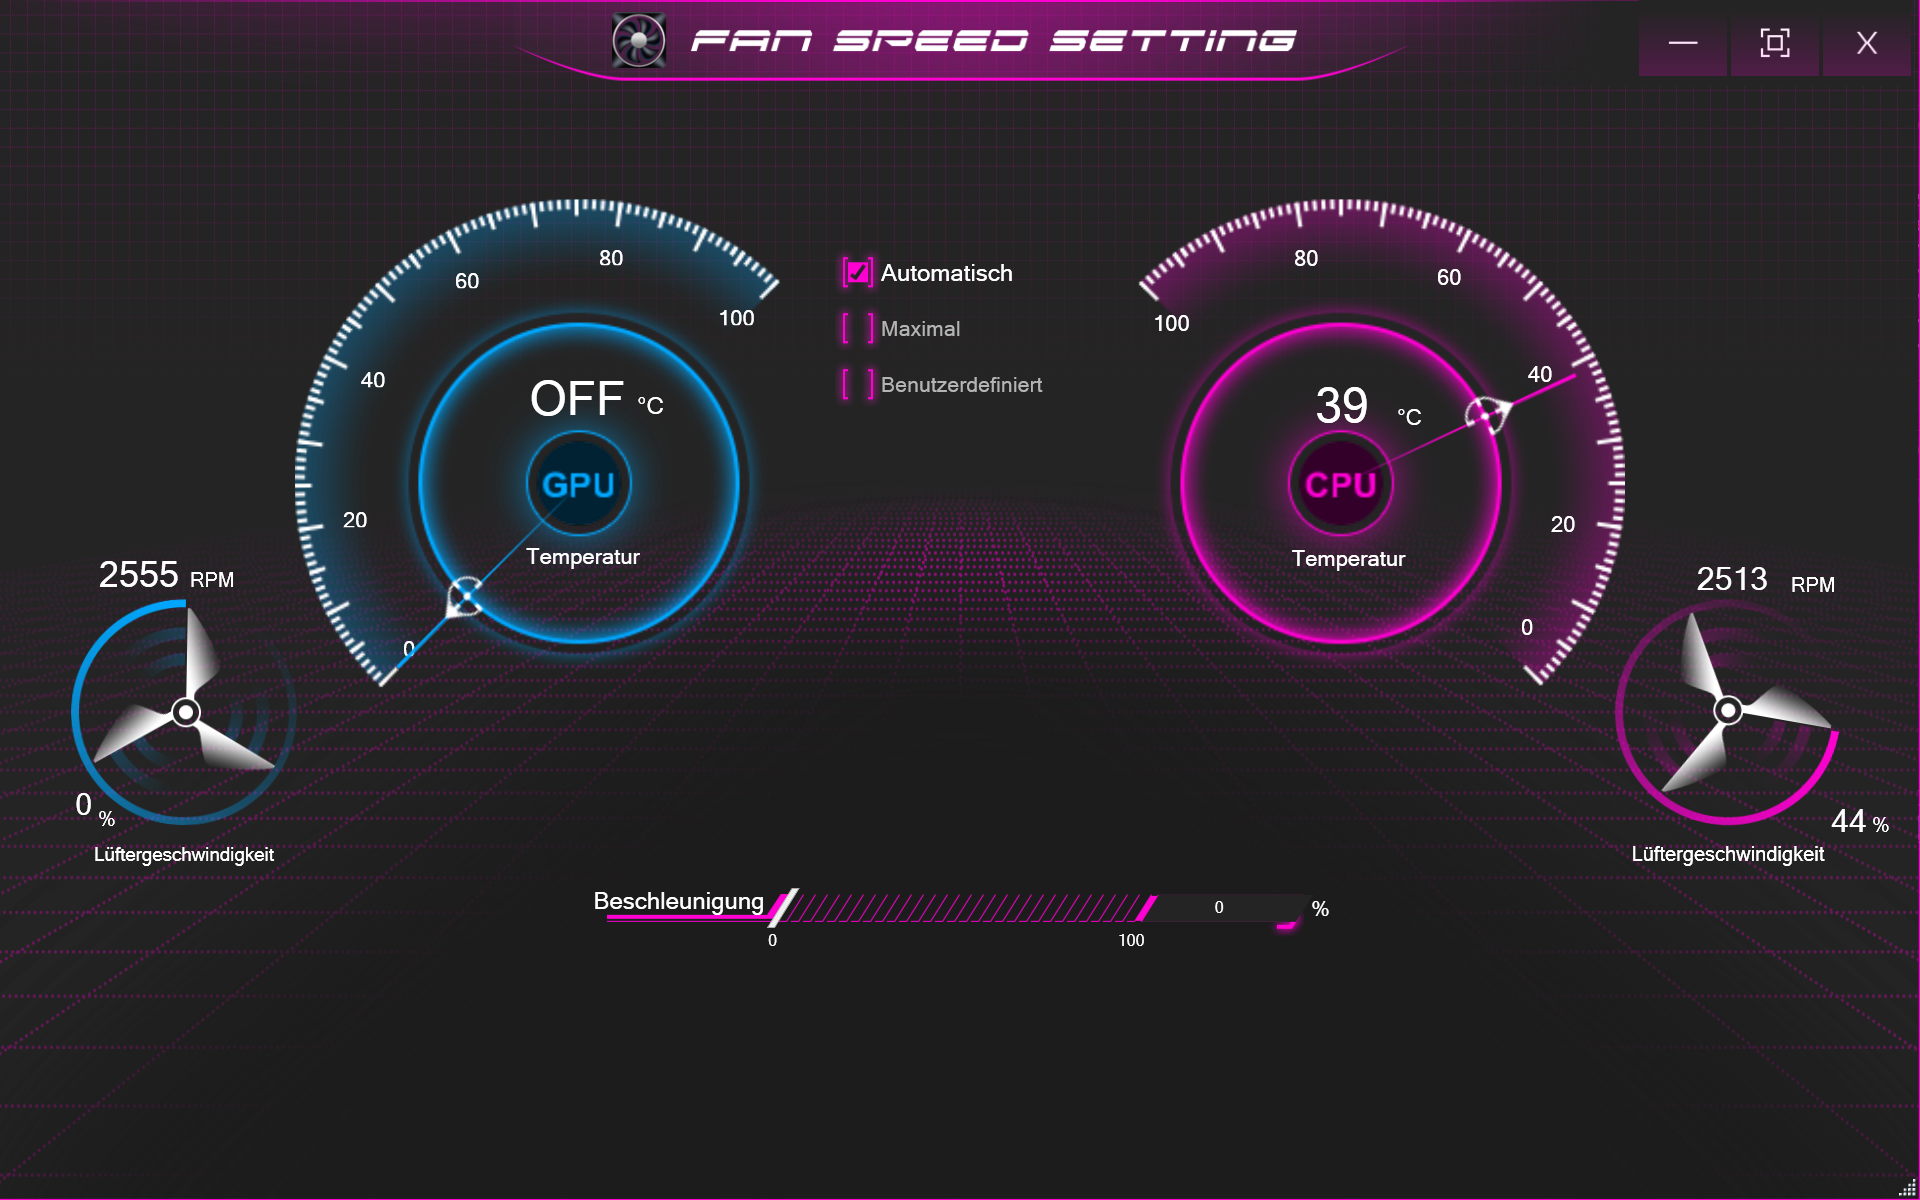
El nivel de rendimiento de los portátiles Schenker actuales se ajusta a través del Control Center 3.0. Aquí puedes encontrar cuatro opciones para el rendimiento: desde el modo susurro hasta el modo rendimiento. Aquí se especifican las velocidades de los ventiladores, los límites de rendimiento y las temperaturas objetivo. Para quien le guste controlar estos ajustes, Control Center también ofrece varias opciones para ajustar y supervisar la velocidad del ventilador.
Esto afecta en gran medida al rendimiento del portátil. En modo rendimiento, la CPU y la GPU disponen de 140 vatios. Durante las pruebas, observamos un aumento dinámico de unos 25 vatios. El procesador por sí solo puede trabajar a unos buenos 65 vatios. Cuando funciona en modo susurro o de ahorro de energía, el consumo combinado del Intel Core i7 y la Nvidia RTX 3060 ronda los 45 vatios. Debido a las diversas opciones de ajuste del ventilador, en el modo de ahorro de energía, la temperatura del hardware aumenta considerablemente más despacio debido a las diversas opciones de ajuste del ventilador. Asimismo, en modo batería, medimos un consumo de energía combinado de unos 25 vatios.
Análisis de registros
Procesador
ElIntel Core i7-12700Hpertenece a los procesadores más potentes de la generación Alder Lake de Intel. En el Schenker XMG Focus 16, el procesador rinde relativamente bien sin alcanzar sus mejores niveles. A largo plazo, el portátil fue incapaz de aguantar el empuje, ya que el rendimiento en el bucle Cinbench cayó con el tiempo más de 100 puntos.
Además, las puntuaciones de la CPU muestran que el i7 del portátil de juegos se sitúa en el medio del pelotón en comparación con sus competidores. No obstante, su rendimiento es superior al rendimiento medio de unIntel Core i7-12700H. Sin embargo, el 12700H rinde al máximo en el Lenovo Legion 5 Pro. En ningún portátil de nuestra base de datos rinde mejor el i7 que en el Legion. Determinamos unos relativamente altos 105 vatios para el PL2 en el portátil Schenker, pero sólo 65 vatios para el PL1.
Cinebench R15 Multi sustained load
Cinebench R23: Multi Core | Single Core
Cinebench R20: CPU (Multi Core) | CPU (Single Core)
Cinebench R15: CPU Multi 64Bit | CPU Single 64Bit
Blender: v2.79 BMW27 CPU
7-Zip 18.03: 7z b 4 | 7z b 4 -mmt1
Geekbench 5.5: Multi-Core | Single-Core
HWBOT x265 Benchmark v2.2: 4k Preset
LibreOffice : 20 Documents To PDF
R Benchmark 2.5: Overall mean
| CPU Performance rating | |
| Media de la clase Gaming | |
| Lenovo Legion 5 Pro 16IAH7H | |
| Asus ZenBook Pro 16X OLED UX7602ZM-ME115W | |
| Lenovo ThinkPad X1 Extreme G5-21DE003RGE | |
| Lenovo Legion Slim 7-16IAH 82TF004YGE | |
| Schenker XMG Focus 16 (i7-12700H, RTX 3060) | |
| Dell G16 7620 | |
| Medio Intel Core i7-12700H | |
| Asus ROG Flow X16 GV601RW-M5082W | |
| Cinebench R23 / Multi Core | |
| Media de la clase Gaming (10488 - 42661, n=104, últimos 2 años) | |
| Lenovo Legion 5 Pro 16IAH7H | |
| Lenovo Legion Slim 7-16IAH 82TF004YGE | |
| Lenovo ThinkPad X1 Extreme G5-21DE003RGE | |
| Schenker XMG Focus 16 (i7-12700H, RTX 3060) | |
| Dell G16 7620 | |
| Asus ZenBook Pro 16X OLED UX7602ZM-ME115W | |
| Medio Intel Core i7-12700H (4032 - 19330, n=64) | |
| Asus ROG Flow X16 GV601RW-M5082W | |
| Cinebench R23 / Single Core | |
| Media de la clase Gaming (1601 - 2415, n=104, últimos 2 años) | |
| Lenovo ThinkPad X1 Extreme G5-21DE003RGE | |
| Schenker XMG Focus 16 (i7-12700H, RTX 3060) | |
| Medio Intel Core i7-12700H (778 - 1826, n=63) | |
| Lenovo Legion Slim 7-16IAH 82TF004YGE | |
| Lenovo Legion 5 Pro 16IAH7H | |
| Dell G16 7620 | |
| Asus ZenBook Pro 16X OLED UX7602ZM-ME115W | |
| Asus ROG Flow X16 GV601RW-M5082W | |
| Cinebench R20 / CPU (Multi Core) | |
| Media de la clase Gaming (4029 - 16433, n=103, últimos 2 años) | |
| Lenovo Legion 5 Pro 16IAH7H | |
| Lenovo ThinkPad X1 Extreme G5-21DE003RGE | |
| Lenovo Legion Slim 7-16IAH 82TF004YGE | |
| Dell G16 7620 | |
| Schenker XMG Focus 16 (i7-12700H, RTX 3060) | |
| Asus ZenBook Pro 16X OLED UX7602ZM-ME115W | |
| Medio Intel Core i7-12700H (1576 - 7407, n=64) | |
| Asus ROG Flow X16 GV601RW-M5082W | |
| Cinebench R20 / CPU (Single Core) | |
| Media de la clase Gaming (622 - 913, n=103, últimos 2 años) | |
| Lenovo ThinkPad X1 Extreme G5-21DE003RGE | |
| Schenker XMG Focus 16 (i7-12700H, RTX 3060) | |
| Asus ZenBook Pro 16X OLED UX7602ZM-ME115W | |
| Medio Intel Core i7-12700H (300 - 704, n=64) | |
| Lenovo Legion Slim 7-16IAH 82TF004YGE | |
| Lenovo Legion 5 Pro 16IAH7H | |
| Dell G16 7620 | |
| Asus ROG Flow X16 GV601RW-M5082W | |
| Cinebench R15 / CPU Multi 64Bit | |
| Media de la clase Gaming (1578 - 6330, n=102, últimos 2 años) | |
| Lenovo Legion 5 Pro 16IAH7H | |
| Lenovo Legion Slim 7-16IAH 82TF004YGE | |
| Lenovo ThinkPad X1 Extreme G5-21DE003RGE | |
| Schenker XMG Focus 16 (i7-12700H, RTX 3060) | |
| Dell G16 7620 | |
| Asus ZenBook Pro 16X OLED UX7602ZM-ME115W | |
| Medio Intel Core i7-12700H (1379 - 2916, n=70) | |
| Asus ROG Flow X16 GV601RW-M5082W | |
| Cinebench R15 / CPU Single 64Bit | |
| Media de la clase Gaming (188.8 - 350, n=103, últimos 2 años) | |
| Asus ZenBook Pro 16X OLED UX7602ZM-ME115W | |
| Asus ZenBook Pro 16X OLED UX7602ZM-ME115W | |
| Lenovo ThinkPad X1 Extreme G5-21DE003RGE | |
| Schenker XMG Focus 16 (i7-12700H, RTX 3060) | |
| Lenovo Legion Slim 7-16IAH 82TF004YGE | |
| Medio Intel Core i7-12700H (113 - 263, n=65) | |
| Lenovo Legion 5 Pro 16IAH7H | |
| Dell G16 7620 | |
| Asus ROG Flow X16 GV601RW-M5082W | |
| Blender / v2.79 BMW27 CPU | |
| Medio Intel Core i7-12700H (168 - 732, n=63) | |
| Asus ROG Flow X16 GV601RW-M5082W | |
| Schenker XMG Focus 16 (i7-12700H, RTX 3060) | |
| Lenovo ThinkPad X1 Extreme G5-21DE003RGE | |
| Asus ZenBook Pro 16X OLED UX7602ZM-ME115W | |
| Dell G16 7620 | |
| Lenovo Legion Slim 7-16IAH 82TF004YGE | |
| Lenovo Legion 5 Pro 16IAH7H | |
| Media de la clase Gaming (79 - 330, n=101, últimos 2 años) | |
| 7-Zip 18.03 / 7z b 4 | |
| Media de la clase Gaming (33491 - 148086, n=102, últimos 2 años) | |
| Asus ZenBook Pro 16X OLED UX7602ZM-ME115W | |
| Lenovo Legion 5 Pro 16IAH7H | |
| Lenovo ThinkPad X1 Extreme G5-21DE003RGE | |
| Lenovo Legion Slim 7-16IAH 82TF004YGE | |
| Dell G16 7620 | |
| Schenker XMG Focus 16 (i7-12700H, RTX 3060) | |
| Asus ROG Flow X16 GV601RW-M5082W | |
| Medio Intel Core i7-12700H (22844 - 73067, n=63) | |
| 7-Zip 18.03 / 7z b 4 -mmt1 | |
| Media de la clase Gaming (4824 - 7436, n=102, últimos 2 años) | |
| Lenovo ThinkPad X1 Extreme G5-21DE003RGE | |
| Asus ZenBook Pro 16X OLED UX7602ZM-ME115W | |
| Schenker XMG Focus 16 (i7-12700H, RTX 3060) | |
| Asus ROG Flow X16 GV601RW-M5082W | |
| Medio Intel Core i7-12700H (2743 - 5972, n=63) | |
| Lenovo Legion 5 Pro 16IAH7H | |
| Lenovo Legion Slim 7-16IAH 82TF004YGE | |
| Dell G16 7620 | |
| Geekbench 5.5 / Multi-Core | |
| Media de la clase Gaming (6460 - 28263, n=102, últimos 2 años) | |
| Asus ZenBook Pro 16X OLED UX7602ZM-ME115W | |
| Lenovo Legion 5 Pro 16IAH7H | |
| Lenovo Legion Slim 7-16IAH 82TF004YGE | |
| Schenker XMG Focus 16 (i7-12700H, RTX 3060) | |
| Dell G16 7620 | |
| Lenovo ThinkPad X1 Extreme G5-21DE003RGE | |
| Medio Intel Core i7-12700H (5144 - 13745, n=64) | |
| Asus ROG Flow X16 GV601RW-M5082W | |
| Geekbench 5.5 / Single-Core | |
| Media de la clase Gaming (1403 - 2474, n=102, últimos 2 años) | |
| Asus ZenBook Pro 16X OLED UX7602ZM-ME115W | |
| Lenovo ThinkPad X1 Extreme G5-21DE003RGE | |
| Schenker XMG Focus 16 (i7-12700H, RTX 3060) | |
| Medio Intel Core i7-12700H (803 - 1851, n=64) | |
| Lenovo Legion Slim 7-16IAH 82TF004YGE | |
| Lenovo Legion 5 Pro 16IAH7H | |
| Dell G16 7620 | |
| Asus ROG Flow X16 GV601RW-M5082W | |
| HWBOT x265 Benchmark v2.2 / 4k Preset | |
| Media de la clase Gaming (11.5 - 44.4, n=102, últimos 2 años) | |
| Lenovo Legion 5 Pro 16IAH7H | |
| Asus ZenBook Pro 16X OLED UX7602ZM-ME115W | |
| Dell G16 7620 | |
| Lenovo Legion Slim 7-16IAH 82TF004YGE | |
| Schenker XMG Focus 16 (i7-12700H, RTX 3060) | |
| Lenovo ThinkPad X1 Extreme G5-21DE003RGE | |
| Medio Intel Core i7-12700H (4.67 - 21.8, n=64) | |
| Asus ROG Flow X16 GV601RW-M5082W | |
| LibreOffice / 20 Documents To PDF | |
| Asus ROG Flow X16 GV601RW-M5082W | |
| Dell G16 7620 | |
| Media de la clase Gaming (33.2 - 88.8, n=102, últimos 2 años) | |
| Medio Intel Core i7-12700H (34.2 - 95.3, n=63) | |
| Schenker XMG Focus 16 (i7-12700H, RTX 3060) | |
| Lenovo ThinkPad X1 Extreme G5-21DE003RGE | |
| Lenovo Legion 5 Pro 16IAH7H | |
| Lenovo Legion Slim 7-16IAH 82TF004YGE | |
| Asus ZenBook Pro 16X OLED UX7602ZM-ME115W | |
| R Benchmark 2.5 / Overall mean | |
| Dell G16 7620 | |
| Asus ROG Flow X16 GV601RW-M5082W | |
| Lenovo Legion 5 Pro 16IAH7H | |
| Medio Intel Core i7-12700H (0.4441 - 1.052, n=63) | |
| Lenovo Legion Slim 7-16IAH 82TF004YGE | |
| Schenker XMG Focus 16 (i7-12700H, RTX 3060) | |
| Lenovo ThinkPad X1 Extreme G5-21DE003RGE | |
| Asus ZenBook Pro 16X OLED UX7602ZM-ME115W | |
| Media de la clase Gaming (0.3439 - 0.59, n=102, últimos 2 años) | |
* ... más pequeño es mejor
AIDA64: FP32 Ray-Trace | FPU Julia | CPU SHA3 | CPU Queen | FPU SinJulia | FPU Mandel | CPU AES | CPU ZLib | FP64 Ray-Trace | CPU PhotoWorxx
| Performance rating | |
| Media de la clase Gaming | |
| Asus ROG Flow X16 GV601RW-M5082W | |
| Lenovo Legion Slim 7-16IAH 82TF004YGE | |
| Asus ZenBook Pro 16X OLED UX7602ZM-ME115W | |
| Schenker XMG Focus 16 (i7-12700H, RTX 3060) | |
| Dell G16 7620 | |
| Lenovo ThinkPad X1 Extreme G5-21DE003RGE | |
| Lenovo Legion 5 Pro 16IAH7H | |
| Medio Intel Core i7-12700H | |
| AIDA64 / FP32 Ray-Trace | |
| Media de la clase Gaming (10227 - 85542, n=102, últimos 2 años) | |
| Lenovo Legion Slim 7-16IAH 82TF004YGE | |
| Lenovo ThinkPad X1 Extreme G5-21DE003RGE | |
| Asus ROG Flow X16 GV601RW-M5082W | |
| Schenker XMG Focus 16 (i7-12700H, RTX 3060) | |
| Dell G16 7620 | |
| Lenovo Legion 5 Pro 16IAH7H | |
| Lenovo Legion 5 Pro 16IAH7H | |
| Asus ZenBook Pro 16X OLED UX7602ZM-ME115W | |
| Medio Intel Core i7-12700H (2585 - 17957, n=64) | |
| AIDA64 / CPU Queen | |
| Media de la clase Gaming (49785 - 173351, n=86, últimos 2 años) | |
| Asus ZenBook Pro 16X OLED UX7602ZM-ME115W | |
| Asus ROG Flow X16 GV601RW-M5082W | |
| Lenovo Legion Slim 7-16IAH 82TF004YGE | |
| Schenker XMG Focus 16 (i7-12700H, RTX 3060) | |
| Lenovo ThinkPad X1 Extreme G5-21DE003RGE | |
| Dell G16 7620 | |
| Lenovo Legion 5 Pro 16IAH7H | |
| Medio Intel Core i7-12700H (57923 - 103202, n=63) | |
| AIDA64 / FPU SinJulia | |
| Media de la clase Gaming (4424 - 33636, n=102, últimos 2 años) | |
| Asus ROG Flow X16 GV601RW-M5082W | |
| Lenovo Legion 5 Pro 16IAH7H | |
| Lenovo Legion 5 Pro 16IAH7H | |
| Dell G16 7620 | |
| Lenovo ThinkPad X1 Extreme G5-21DE003RGE | |
| Lenovo Legion Slim 7-16IAH 82TF004YGE | |
| Schenker XMG Focus 16 (i7-12700H, RTX 3060) | |
| Asus ZenBook Pro 16X OLED UX7602ZM-ME115W | |
| Medio Intel Core i7-12700H (3249 - 9939, n=64) | |
| AIDA64 / FP64 Ray-Trace | |
| Media de la clase Gaming (5509 - 45446, n=102, últimos 2 años) | |
| Asus ROG Flow X16 GV601RW-M5082W | |
| Lenovo ThinkPad X1 Extreme G5-21DE003RGE | |
| Lenovo Legion Slim 7-16IAH 82TF004YGE | |
| Schenker XMG Focus 16 (i7-12700H, RTX 3060) | |
| Asus ZenBook Pro 16X OLED UX7602ZM-ME115W | |
| Dell G16 7620 | |
| Lenovo Legion 5 Pro 16IAH7H | |
| Lenovo Legion 5 Pro 16IAH7H | |
| Medio Intel Core i7-12700H (1437 - 9692, n=64) | |
| AIDA64 / CPU PhotoWorxx | |
| Asus ZenBook Pro 16X OLED UX7602ZM-ME115W | |
| Media de la clase Gaming (12271 - 89891, n=102, últimos 2 años) | |
| Lenovo Legion Slim 7-16IAH 82TF004YGE | |
| Dell G16 7620 | |
| Lenovo Legion 5 Pro 16IAH7H | |
| Lenovo Legion 5 Pro 16IAH7H | |
| Medio Intel Core i7-12700H (12863 - 52207, n=64) | |
| Schenker XMG Focus 16 (i7-12700H, RTX 3060) | |
| Asus ROG Flow X16 GV601RW-M5082W | |
| Lenovo ThinkPad X1 Extreme G5-21DE003RGE | |
Rendimiento del sistema
Aunque no se puede acusar al portátil Schenker de debilidad en el uso normal, una comparación con otros portátiles potentes para juegos muestra que se puede hacer más. Los resultados de PCMark10 y Crossmark están ligeramente por debajo de la media. Como ambos programas de pruebas no someten al SSD a estrés prolongado en ninguna de las subpruebas, es más probable que los culpables sean la memoria DDR4 algo más lenta y el rendimiento comparativamente bajo del procesador.
CrossMark: Overall | Productivity | Creativity | Responsiveness
| PCMark 10 / Score | |
| Media de la clase Gaming (5828 - 12414, n=93, últimos 2 años) | |
| Lenovo Legion 5 Pro 16IAH7H | |
| Asus ZenBook Pro 16X OLED UX7602ZM-ME115W | |
| Lenovo Legion Slim 7-16IAH 82TF004YGE | |
| Lenovo ThinkPad X1 Extreme G5-21DE003RGE | |
| Medio Intel Core i7-12700H, NVIDIA GeForce RTX 3060 Laptop GPU (5986 - 8156, n=12) | |
| Dell G16 7620 | |
| Schenker XMG Focus 16 (i7-12700H, RTX 3060) | |
| Asus ROG Flow X16 GV601RW-M5082W | |
| PCMark 10 / Essentials | |
| Lenovo Legion 5 Pro 16IAH7H | |
| Asus ZenBook Pro 16X OLED UX7602ZM-ME115W | |
| Lenovo Legion Slim 7-16IAH 82TF004YGE | |
| Media de la clase Gaming (8810 - 11935, n=97, últimos 2 años) | |
| Medio Intel Core i7-12700H, NVIDIA GeForce RTX 3060 Laptop GPU (9289 - 12144, n=12) | |
| Lenovo ThinkPad X1 Extreme G5-21DE003RGE | |
| Dell G16 7620 | |
| Schenker XMG Focus 16 (i7-12700H, RTX 3060) | |
| Asus ROG Flow X16 GV601RW-M5082W | |
| PCMark 10 / Productivity | |
| Media de la clase Gaming (6845 - 25323, n=95, últimos 2 años) | |
| Asus ZenBook Pro 16X OLED UX7602ZM-ME115W | |
| Schenker XMG Focus 16 (i7-12700H, RTX 3060) | |
| Asus ROG Flow X16 GV601RW-M5082W | |
| Lenovo Legion Slim 7-16IAH 82TF004YGE | |
| Lenovo Legion 5 Pro 16IAH7H | |
| Lenovo ThinkPad X1 Extreme G5-21DE003RGE | |
| Medio Intel Core i7-12700H, NVIDIA GeForce RTX 3060 Laptop GPU (6161 - 10362, n=12) | |
| Dell G16 7620 | |
| PCMark 10 / Digital Content Creation | |
| Media de la clase Gaming (7602 - 19954, n=95, últimos 2 años) | |
| Lenovo Legion 5 Pro 16IAH7H | |
| Dell G16 7620 | |
| Lenovo Legion Slim 7-16IAH 82TF004YGE | |
| Medio Intel Core i7-12700H, NVIDIA GeForce RTX 3060 Laptop GPU (8950 - 12554, n=12) | |
| Lenovo ThinkPad X1 Extreme G5-21DE003RGE | |
| Asus ZenBook Pro 16X OLED UX7602ZM-ME115W | |
| Schenker XMG Focus 16 (i7-12700H, RTX 3060) | |
| Asus ROG Flow X16 GV601RW-M5082W | |
| CrossMark / Overall | |
| Media de la clase Gaming (1366 - 2409, n=94, últimos 2 años) | |
| Lenovo Legion Slim 7-16IAH 82TF004YGE | |
| Medio Intel Core i7-12700H, NVIDIA GeForce RTX 3060 Laptop GPU (1649 - 2017, n=11) | |
| Asus ZenBook Pro 16X OLED UX7602ZM-ME115W | |
| Dell G16 7620 | |
| Lenovo Legion 5 Pro 16IAH7H | |
| Lenovo ThinkPad X1 Extreme G5-21DE003RGE | |
| Asus ROG Flow X16 GV601RW-M5082W | |
| Schenker XMG Focus 16 (i7-12700H, RTX 3060) | |
| CrossMark / Productivity | |
| Media de la clase Gaming (1386 - 2254, n=94, últimos 2 años) | |
| Lenovo Legion Slim 7-16IAH 82TF004YGE | |
| Medio Intel Core i7-12700H, NVIDIA GeForce RTX 3060 Laptop GPU (1536 - 1958, n=11) | |
| Lenovo Legion 5 Pro 16IAH7H | |
| Dell G16 7620 | |
| Asus ZenBook Pro 16X OLED UX7602ZM-ME115W | |
| Lenovo ThinkPad X1 Extreme G5-21DE003RGE | |
| Asus ROG Flow X16 GV601RW-M5082W | |
| Schenker XMG Focus 16 (i7-12700H, RTX 3060) | |
| CrossMark / Creativity | |
| Media de la clase Gaming (1343 - 2786, n=94, últimos 2 años) | |
| Asus ZenBook Pro 16X OLED UX7602ZM-ME115W | |
| Lenovo Legion Slim 7-16IAH 82TF004YGE | |
| Medio Intel Core i7-12700H, NVIDIA GeForce RTX 3060 Laptop GPU (1816 - 2084, n=11) | |
| Dell G16 7620 | |
| Lenovo ThinkPad X1 Extreme G5-21DE003RGE | |
| Lenovo Legion 5 Pro 16IAH7H | |
| Schenker XMG Focus 16 (i7-12700H, RTX 3060) | |
| Asus ROG Flow X16 GV601RW-M5082W | |
| CrossMark / Responsiveness | |
| Lenovo Legion Slim 7-16IAH 82TF004YGE | |
| Lenovo Legion 5 Pro 16IAH7H | |
| Media de la clase Gaming (1226 - 2334, n=94, últimos 2 años) | |
| Medio Intel Core i7-12700H, NVIDIA GeForce RTX 3060 Laptop GPU (1210 - 2207, n=11) | |
| Dell G16 7620 | |
| Asus ZenBook Pro 16X OLED UX7602ZM-ME115W | |
| Lenovo ThinkPad X1 Extreme G5-21DE003RGE | |
| Asus ROG Flow X16 GV601RW-M5082W | |
| Schenker XMG Focus 16 (i7-12700H, RTX 3060) | |
| PCMark 10 Score | 7134 puntos | |
ayuda | ||
| AIDA64 / Memory Latency | |
| Lenovo Legion 5 Pro 16IAH7H | |
| Lenovo Legion 5 Pro 16IAH7H | |
| Asus ZenBook Pro 16X OLED UX7602ZM-ME115W | |
| Media de la clase Gaming (75.3 - 165.4, n=102, últimos 2 años) | |
| Dell G16 7620 | |
| Lenovo Legion Slim 7-16IAH 82TF004YGE | |
| Asus ROG Flow X16 GV601RW-M5082W | |
| Schenker XMG Focus 16 (i7-12700H, RTX 3060) | |
| Lenovo ThinkPad X1 Extreme G5-21DE003RGE | |
| Medio Intel Core i7-12700H (76.2 - 133.9, n=62) | |
* ... más pequeño es mejor
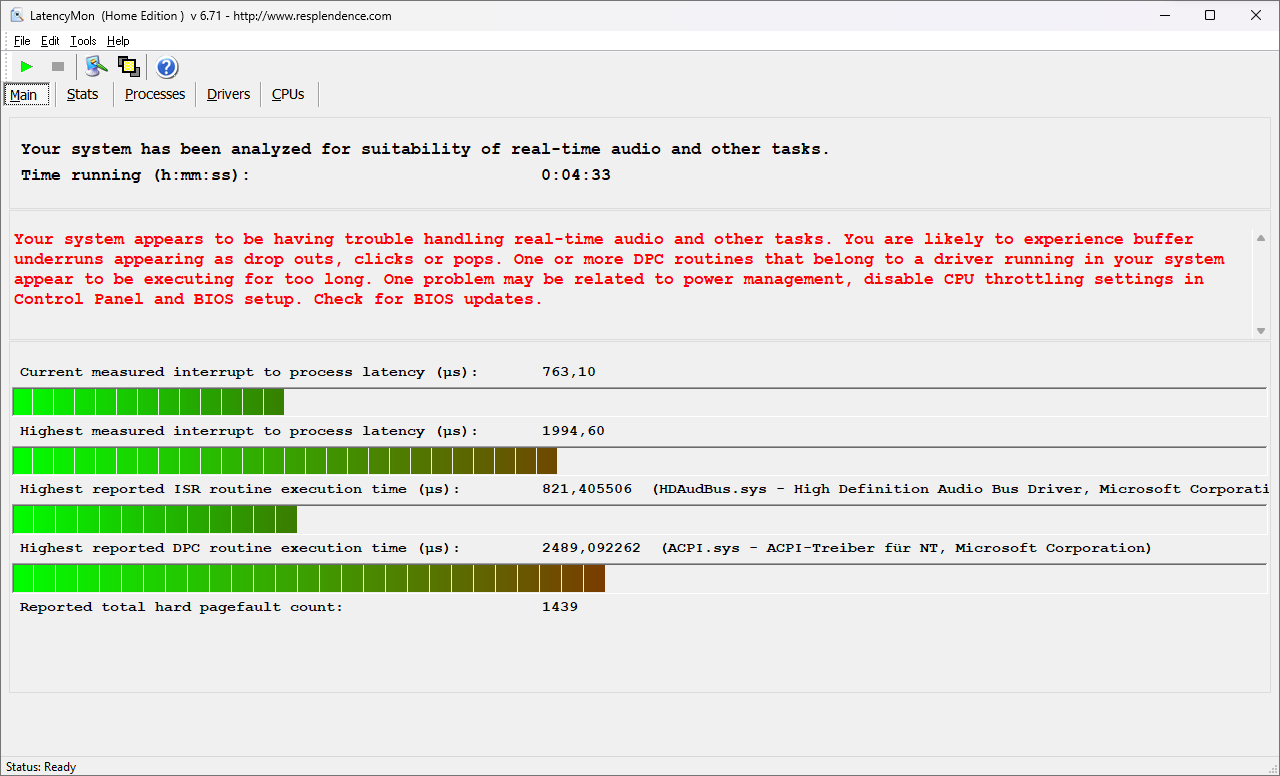
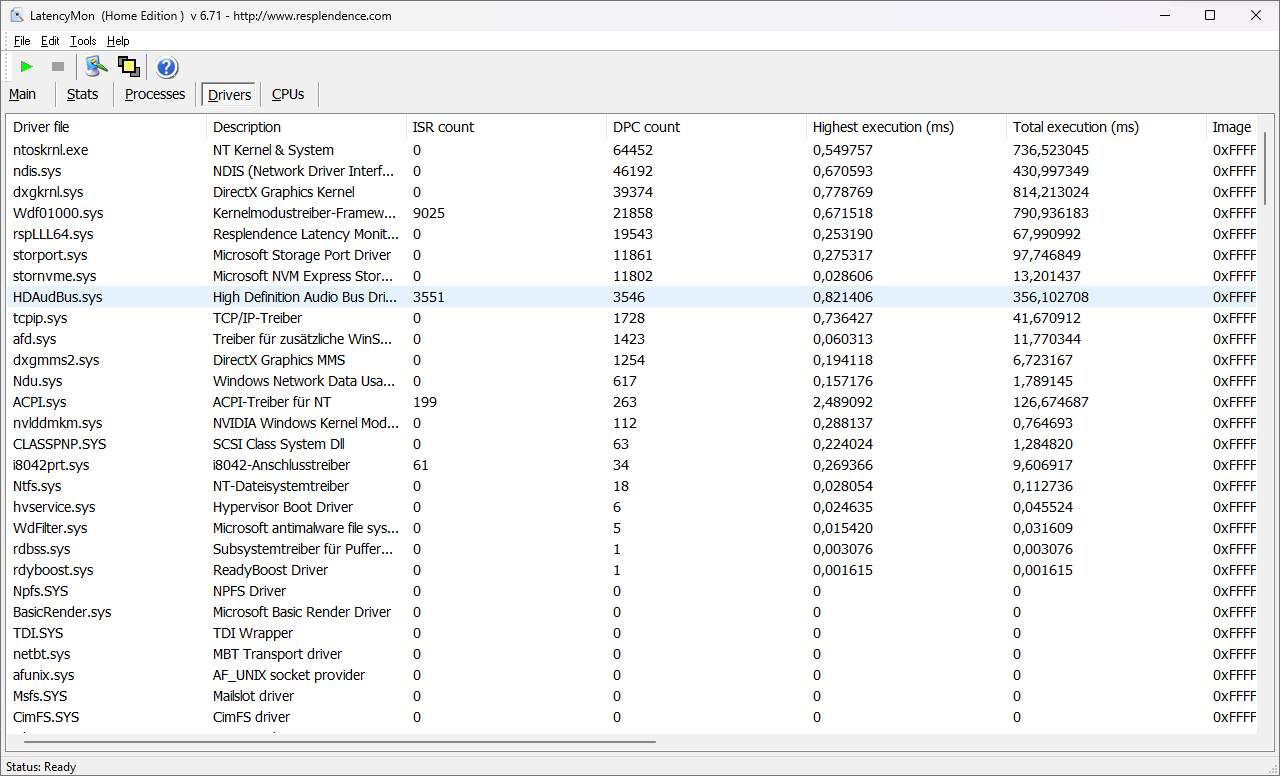
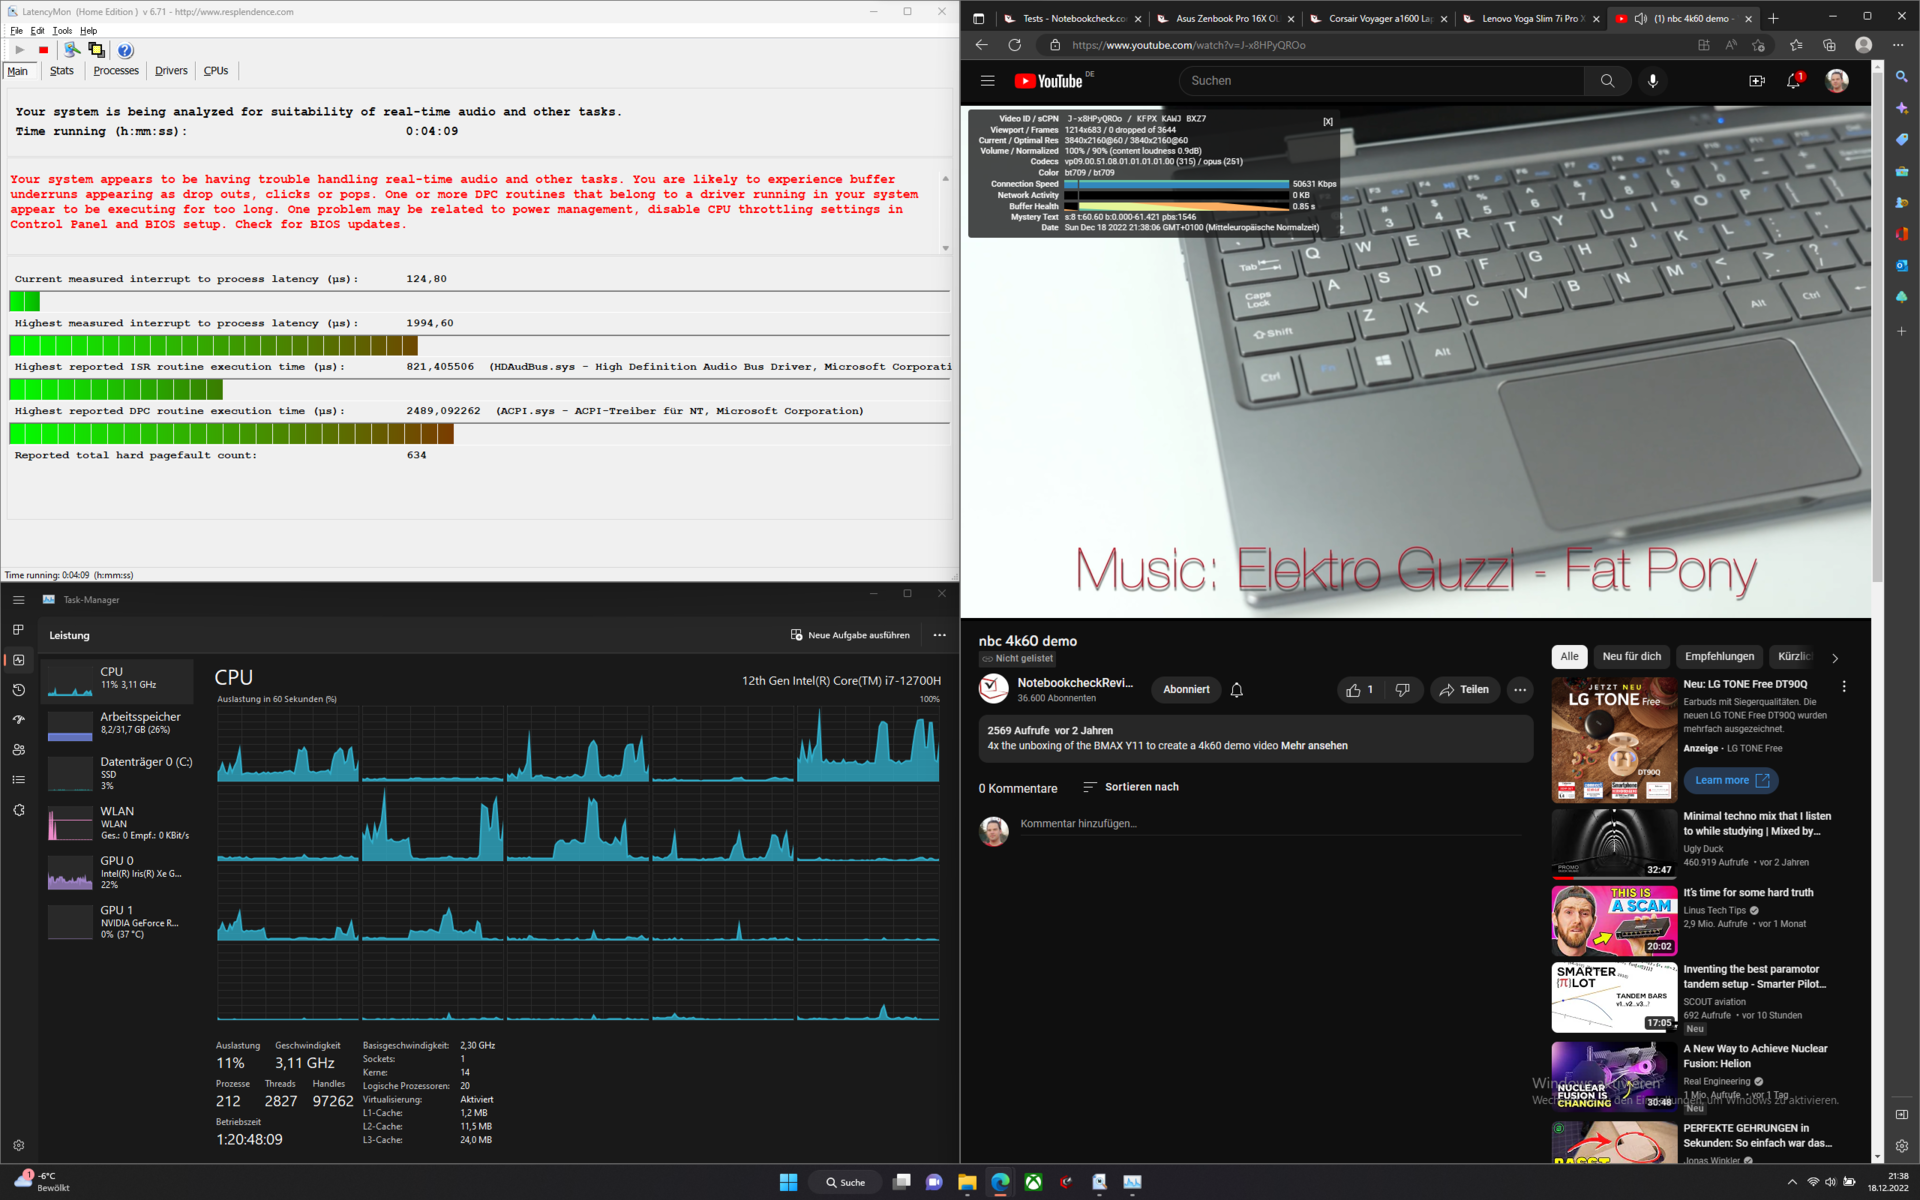
Latencias del CPD
El XMG Focus 16 no es el único con altas latencias de CPD. Con la combinación de drivers actual, el portátil de juego registró niveles altos y por tanto no es adecuado para aplicaciones en tiempo real. No se saltó ningún frame durante la prueba YouTube 4K 60Hz.
| DPC Latencies / LatencyMon - interrupt to process latency (max), Web, Youtube, Prime95 | |
| Schenker XMG Focus 16 (i7-12700H, RTX 3060) | |
| Asus ROG Flow X16 GV601RW-M5082W | |
| Lenovo ThinkPad X1 Extreme G5-21DE003RGE | |
| Dell G16 7620 | |
| Lenovo Legion 5 Pro 16IAH7H | |
| Lenovo Legion Slim 7-16IAH 82TF004YGE | |
| Asus ZenBook Pro 16X OLED UX7602ZM-ME115W | |
* ... más pequeño es mejor
Almacenamiento masivo
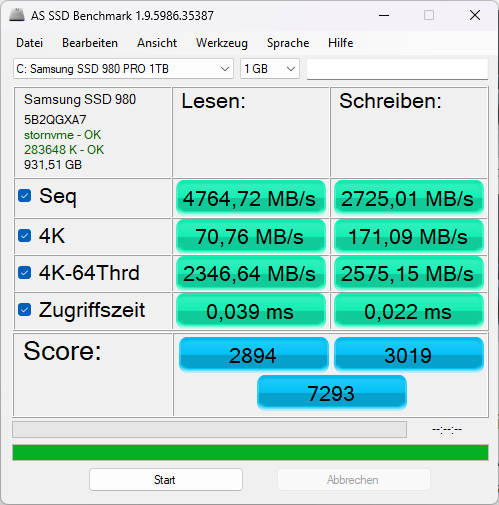
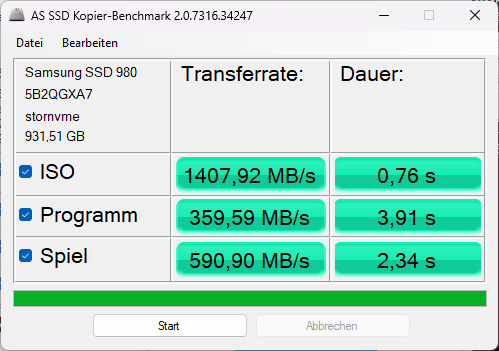
El portátil para juegos Schenker posee un SSD Samsung 980 Pro de 1 TB. Este potente SSD está cerca de la cima de nuestra tabla de pruebas de SSDs y HDDs. El almacenamiento NVMe del portátil para juegos también es de alto rendimiento. Sin embargo, tras unas cuantas ejecuciones en el bucle DiskSpd, el SSD NVMe se ralentizó significativamente. Este comportamiento indica una mala disipación del calor. Mientras que muchos otros fabricantes han empezado a implementar almohadillas térmicas encima o debajo de los SSDs, para disipar el calor operativo, esto es algo que no se puede decir del portátil de Schenker.

* ... más pequeño es mejor
Continuous performance read: DiskSpd Read Loop, Queue Depth 8
Tarjeta gráfica
UnNvidia GeForce RTX 3060hace su trabajo en el XMG Focus 16. Dependiendo de los requisitos de calidad, la tarjeta gráfica es adecuada para juegos Full HD o QHD. La 3060 del portátil de Schenker debería ser capaz de ejecutar la mayoría de títulos actuales a más de 60 fps a la resolución máxima de la pantalla. Sólo unos pocos juegos requieren más potencia.
Tras unos resultados de rendimiento del sistema bastante poco alentadores, la tarjeta gráfica del dispositivo Schenker nos sorprendió con un rendimiento excelente. En la mayoría de los benchmarks, la 3060 de Schenker logró puntuaciones altas. La altísima puntuación en el benchmark 3DMark Cloud Gate indica un rápido acceso a la memoria gráfica.
| 3DMark 11 Performance | 26508 puntos | |
| 3DMark Ice Storm Standard Score | 147494 puntos | |
| 3DMark Cloud Gate Standard Score | 57261 puntos | |
| 3DMark Fire Strike Score | 19951 puntos | |
| 3DMark Time Spy Score | 8675 puntos | |
ayuda | ||
* ... más pequeño es mejor
Rendimiento de juego
La Nvidia GeForce RTX 3060 debería ser lo bastante potente como para jugar a la mayoría de juegos actuales a 60 fps en los ajustes más altos usando la resolución QHD del display. Sin embargo, esta pantalla ofrece una frecuencia de actualización de 165 Hz. Los resultados de los benchmarks muestran que se pueden lograr 165fps en Full HD con ajustes de calidad media.
Comparado con otros portátiles de juego, el XMG Focus 16 logra resultados moderadamente buenos. Sin embargo, elLenovo Legion 5 Proy elDell G16son algo más potentes.
Witcher 3 la velocidad de fotogramas muestra el comportamiento típico del juego día/noche. Durante el juego, la velocidad de fotogramas cambia en función de si aumenta o disminuye la distancia de dibujado.
Witcher 3 fps-diagram
| bajo | medio | alto | ultra | QHD | 4K | |
|---|---|---|---|---|---|---|
| GTA V (2015) | 183.8 | 179.1 | 167.9 | 94.7 | 80.9 | |
| The Witcher 3 (2015) | 80 | |||||
| Dota 2 Reborn (2015) | 165.8 | 151.7 | 143.4 | 135.7 | 103.4 | |
| Final Fantasy XV Benchmark (2018) | 111.4 | 84.5 | 64.3 | 37.8 | ||
| X-Plane 11.11 (2018) | 137.6 | 123.9 | 99.5 | 89 | ||
| Strange Brigade (2018) | 340 | 210 | 171.2 | 150.1 | ||
| F1 22 (2022) | 168 | 166.1 | 141.8 | 53.5 | 34.8 |
Emisiones: los ventiladores se pueden ajustar gracias a Control Center
Emisiones sonoras
En comparación directa, 54 dB(A) bajo carga no es precisamente silencioso. Si el portátil realmente necesita ser tan silencioso como un ratón, Control Center 3.0 ofrece un modo silencioso.
Ruido
| Ocioso |
| 23 / 23 / 32.07 dB(A) |
| Carga |
| 53.7 / 54.58 dB(A) |
 | ||
30 dB silencioso 40 dB(A) audible 50 dB(A) ruidosamente alto |
||
min: | ||
| Schenker XMG Focus 16 (i7-12700H, RTX 3060) GeForce RTX 3060 Laptop GPU, i7-12700H, Samsung SSD 980 Pro 1TB MZ-V8P1T0BW | Asus ZenBook Pro 16X OLED UX7602ZM-ME115W GeForce RTX 3060 Laptop GPU, i9-12900H, Samsung PM9A1 MZVL21T0HCLR | Dell G16 7620 GeForce RTX 3060 Laptop GPU, i7-12700H, WDC PC SN810 512GB | Asus ROG Flow X16 GV601RW-M5082W GeForce RTX 3070 Ti Laptop GPU, R9 6900HS, Micron 3400 1TB MTFDKBA1T0TFH | Lenovo ThinkPad X1 Extreme G5-21DE003RGE GeForce RTX 3060 Laptop GPU, i7-12700H, Micron 3400 1TB MTFDKBA1T0TFH | Lenovo Legion Slim 7-16IAH 82TF004YGE GeForce RTX 3060 Laptop GPU, i7-12700H, SK Hynix HFS001TEJ9X115N | Lenovo Legion 5 Pro 16IAH7H GeForce RTX 3060 Laptop GPU, i7-12700H, 2x Samsung PM9A1 MZVL21T0HCLR (RAID 0) | |
|---|---|---|---|---|---|---|---|
| Noise | -2% | 4% | -2% | 11% | 8% | -9% | |
| apagado / medio ambiente * (dB) | 23 | 26 -13% | 23.2 -1% | 25.5 -11% | 23.2 -1% | 23 -0% | 24.6 -7% |
| Idle Minimum * (dB) | 23 | 26 -13% | 28.3 -23% | 25.5 -11% | 23.2 -1% | 23 -0% | 28.7 -25% |
| Idle Average * (dB) | 23 | 26 -13% | 28.8 -25% | 25.5 -11% | 23.2 -1% | 23 -0% | 32 -39% |
| Idle Maximum * (dB) | 32.07 | 26 19% | 28.9 10% | 27.4 15% | 23.2 28% | 23 28% | 32 -0% |
| Load Average * (dB) | 53.7 | 48 11% | 32.4 40% | 49.9 7% | 45.5 15% | 43.7 19% | 45.2 16% |
| Witcher 3 ultra * (dB) | 54.58 | 48.3 12% | 45.5 17% | 51.7 5% | |||
| Load Maximum * (dB) | 54.58 | 54.6 -0% | 48.1 12% | 55 -1% | 45.5 17% | 52 5% | 54.4 -0% |
* ... más pequeño es mejor
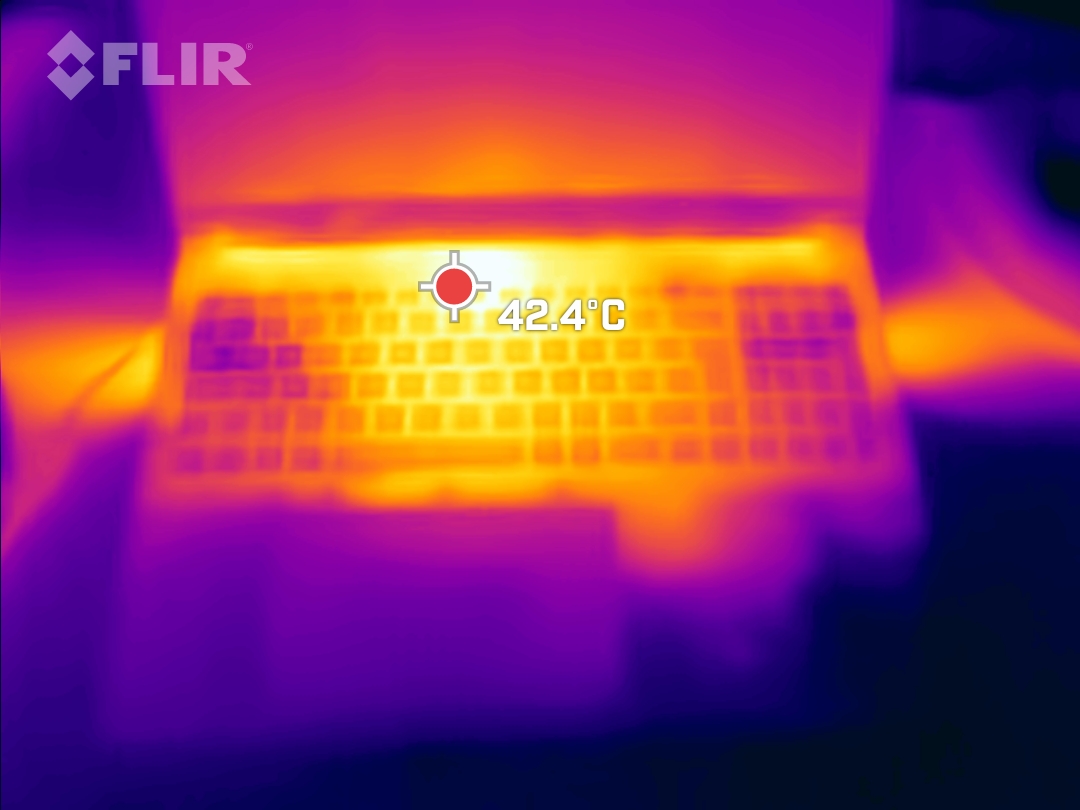
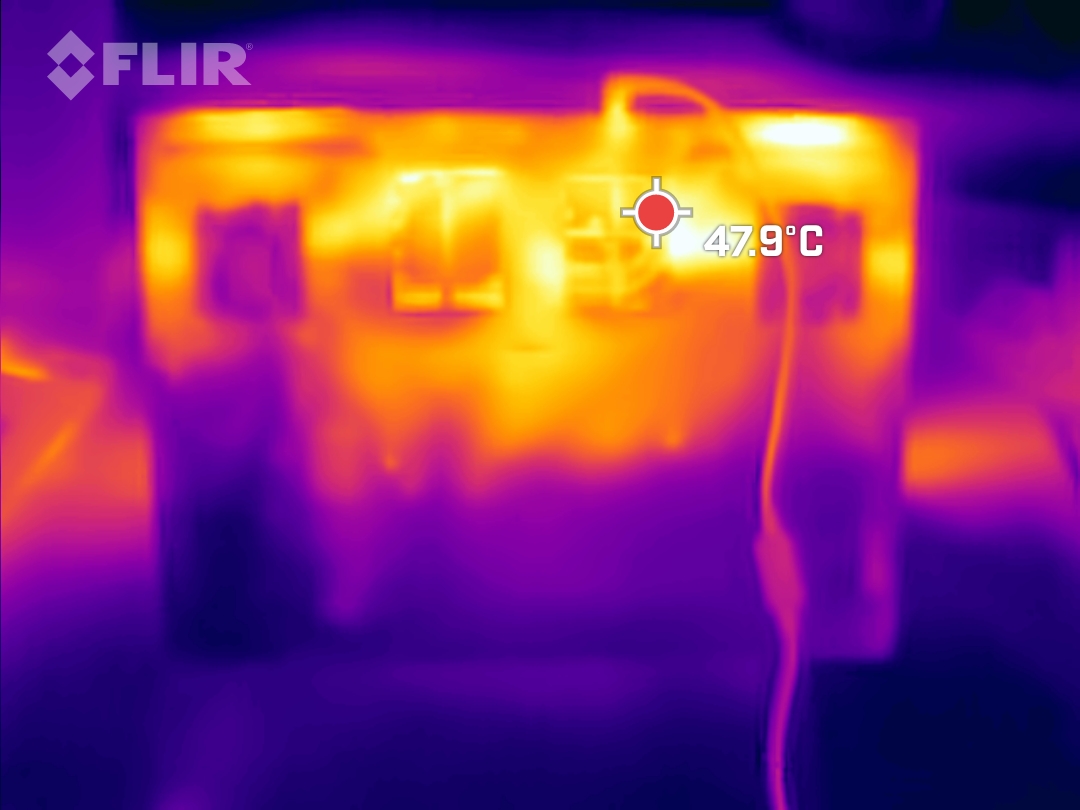
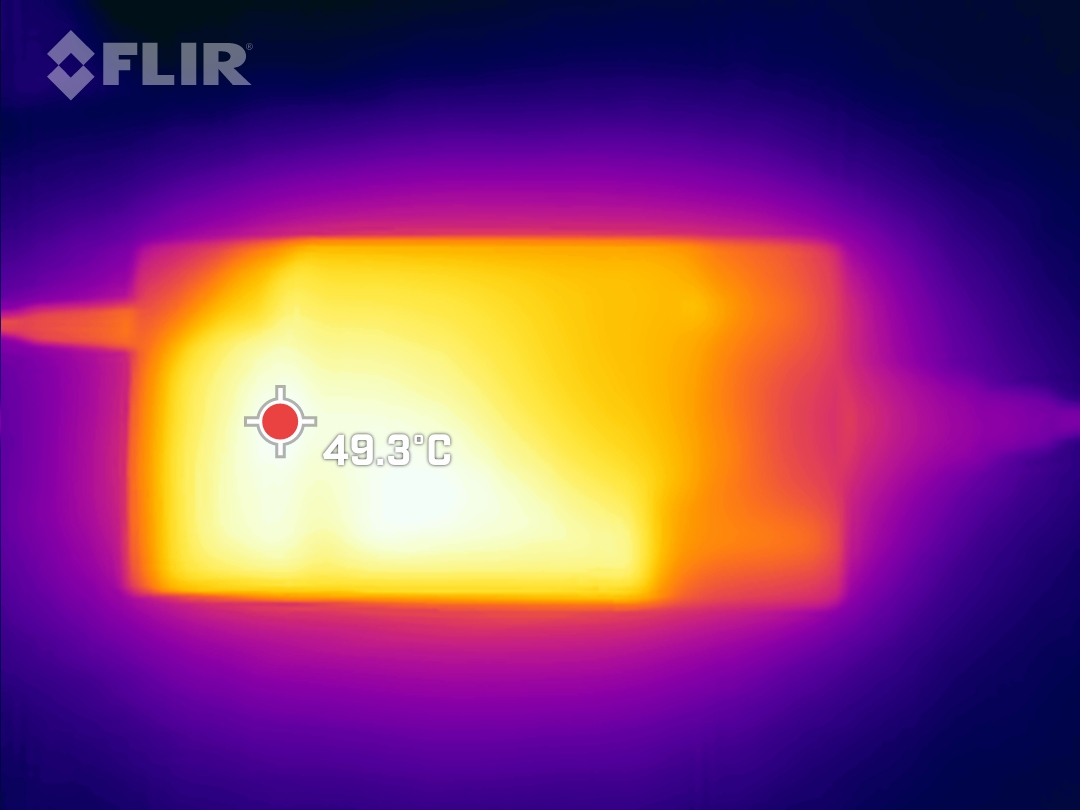
Temperatura
En última instancia, el alto nivel de rendimiento de los portátiles para juegos siempre va de la mano de mucho calor. El Focus 16 también se calienta relativamente, pero sin quemarte los dedos en el teclado. Además del portátil en sí, la fuente de alimentación también se calienta durante el funcionamiento. A veces puede alcanzar temperaturas de más de 50 °C.
(-) La temperatura máxima en la parte superior es de 50 °C / 122 F, frente a la media de 40.4 °C / 105 F, que oscila entre 21.2 y 68.8 °C para la clase Gaming.
(-) El fondo se calienta hasta un máximo de 48 °C / 118 F, frente a la media de 43.2 °C / 110 F
(+) En reposo, la temperatura media de la parte superior es de 25.3 °C / 78# F, frente a la media del dispositivo de 33.9 °C / 93 F.
(±) Jugando a The Witcher 3, la temperatura media de la parte superior es de 37.1 °C / 99 F, frente a la media del dispositivo de 33.9 °C / 93 F.
(+) El reposamanos y el panel táctil están a una temperatura inferior a la de la piel, con un máximo de 30 °C / 86 F y, por tanto, son fríos al tacto.
(±) La temperatura media de la zona del reposamanos de dispositivos similares fue de 28.8 °C / 83.8 F (-1.2 °C / -2.2 F).
| Schenker XMG Focus 16 (i7-12700H, RTX 3060) Intel Core i7-12700H, NVIDIA GeForce RTX 3060 Laptop GPU | Asus ZenBook Pro 16X OLED UX7602ZM-ME115W Intel Core i9-12900H, NVIDIA GeForce RTX 3060 Laptop GPU | Dell G16 7620 Intel Core i7-12700H, NVIDIA GeForce RTX 3060 Laptop GPU | Asus ROG Flow X16 GV601RW-M5082W AMD Ryzen 9 6900HS, NVIDIA GeForce RTX 3070 Ti Laptop GPU | Lenovo ThinkPad X1 Extreme G5-21DE003RGE Intel Core i7-12700H, NVIDIA GeForce RTX 3060 Laptop GPU | Lenovo Legion Slim 7-16IAH 82TF004YGE Intel Core i7-12700H, NVIDIA GeForce RTX 3060 Laptop GPU | Lenovo Legion 5 Pro 16IAH7H Intel Core i7-12700H, NVIDIA GeForce RTX 3060 Laptop GPU | |
|---|---|---|---|---|---|---|---|
| Heat | 5% | 8% | -14% | -0% | -15% | -9% | |
| Maximum Upper Side * (°C) | 50 | 32 36% | 47.6 5% | 55.1 -10% | 52 -4% | 48.3 3% | 45.8 8% |
| Maximum Bottom * (°C) | 48 | 41.6 13% | 54 -13% | 50.3 -5% | 56.4 -18% | 55.3 -15% | 66.3 -38% |
| Idle Upper Side * (°C) | 28 | 32.6 -16% | 23 18% | 35.5 -27% | 26.4 6% | 35.7 -28% | 30.4 -9% |
| Idle Bottom * (°C) | 32 | 36 -13% | 24.6 23% | 36.1 -13% | 27.2 15% | 37.6 -18% | 30.4 5% |
* ... más pequeño es mejor
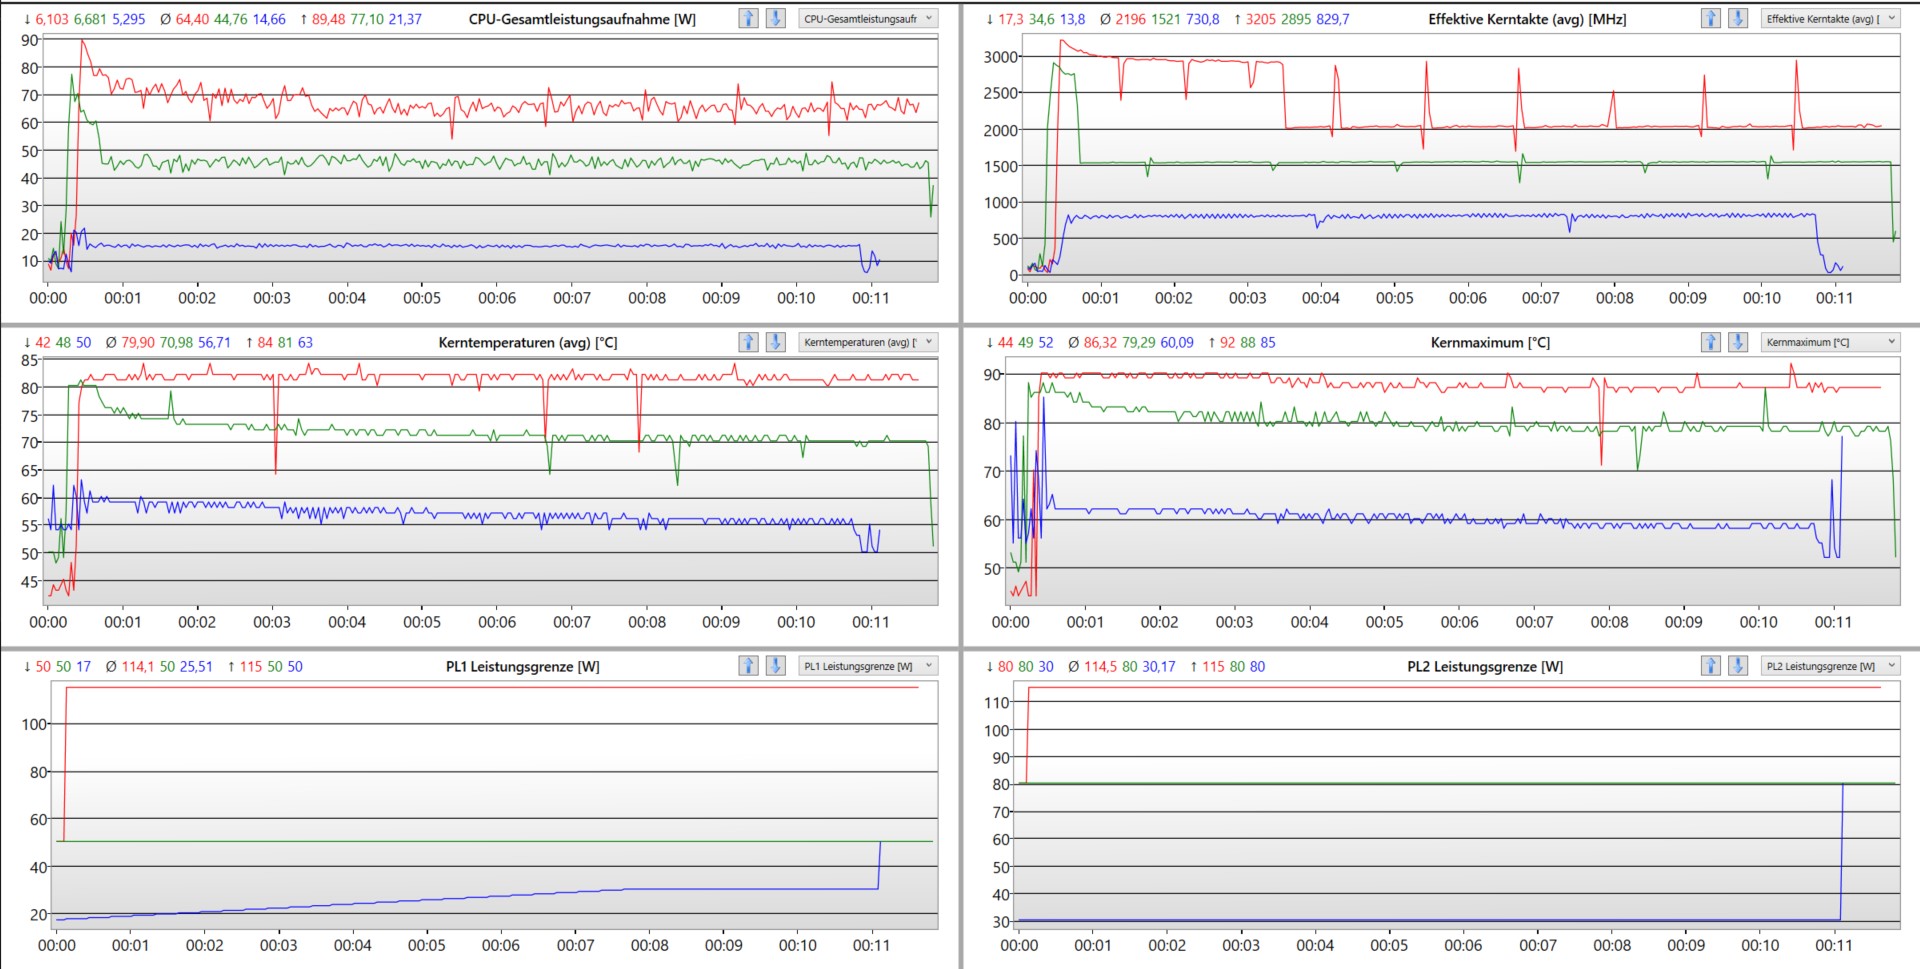
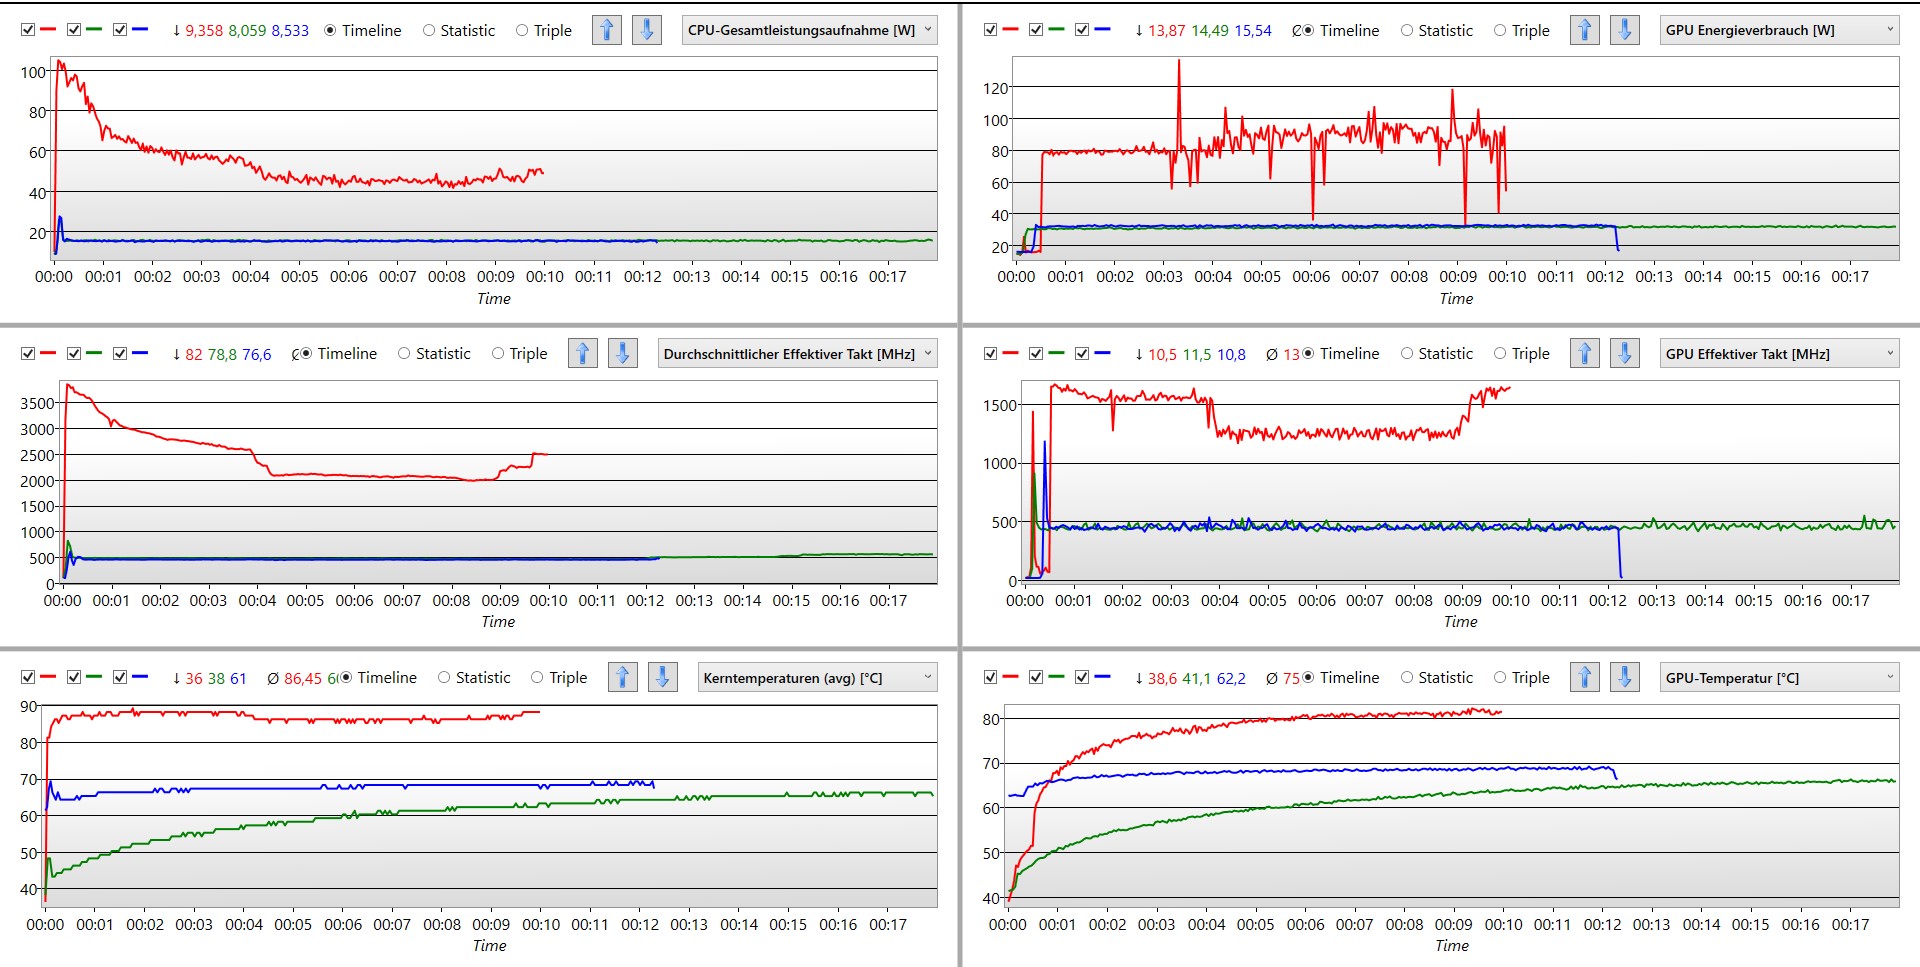
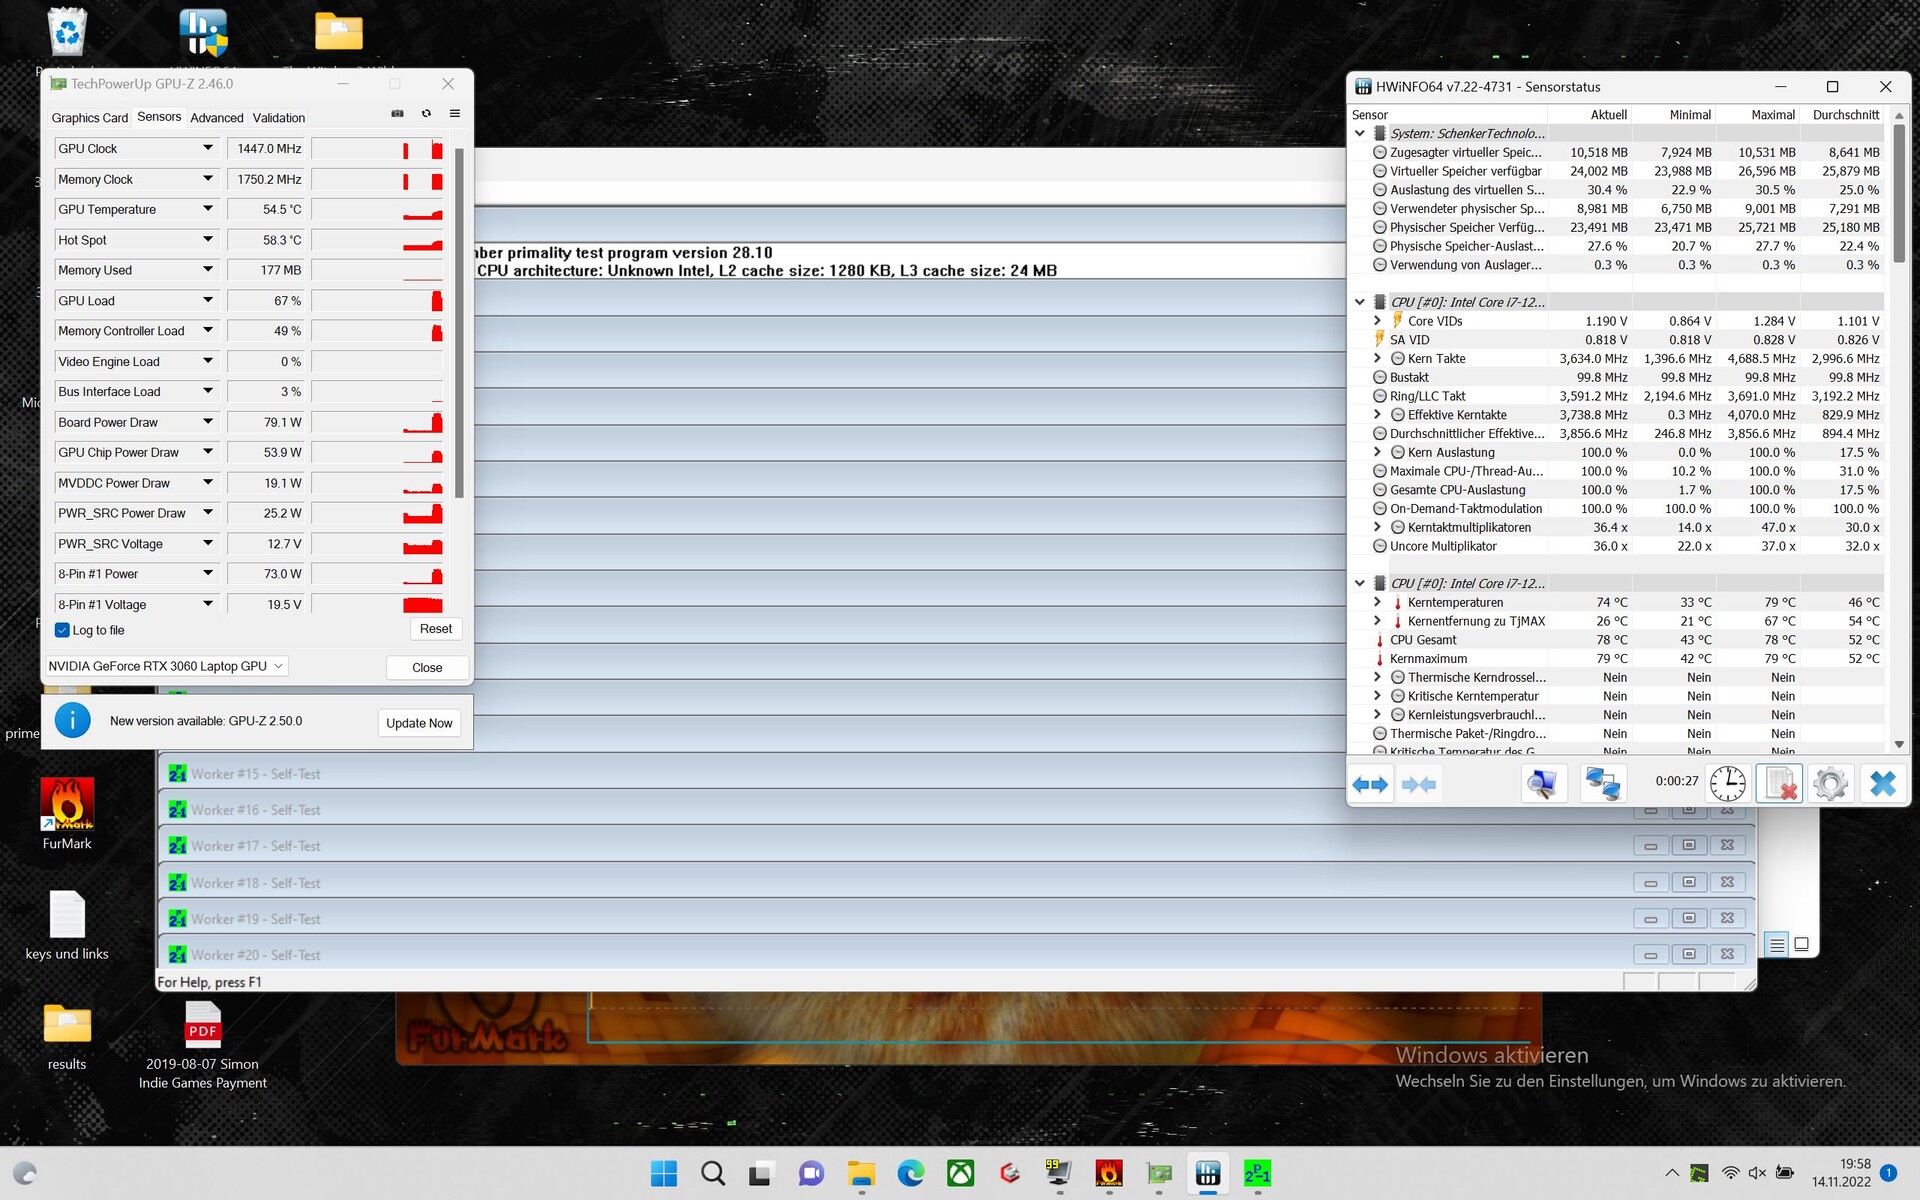
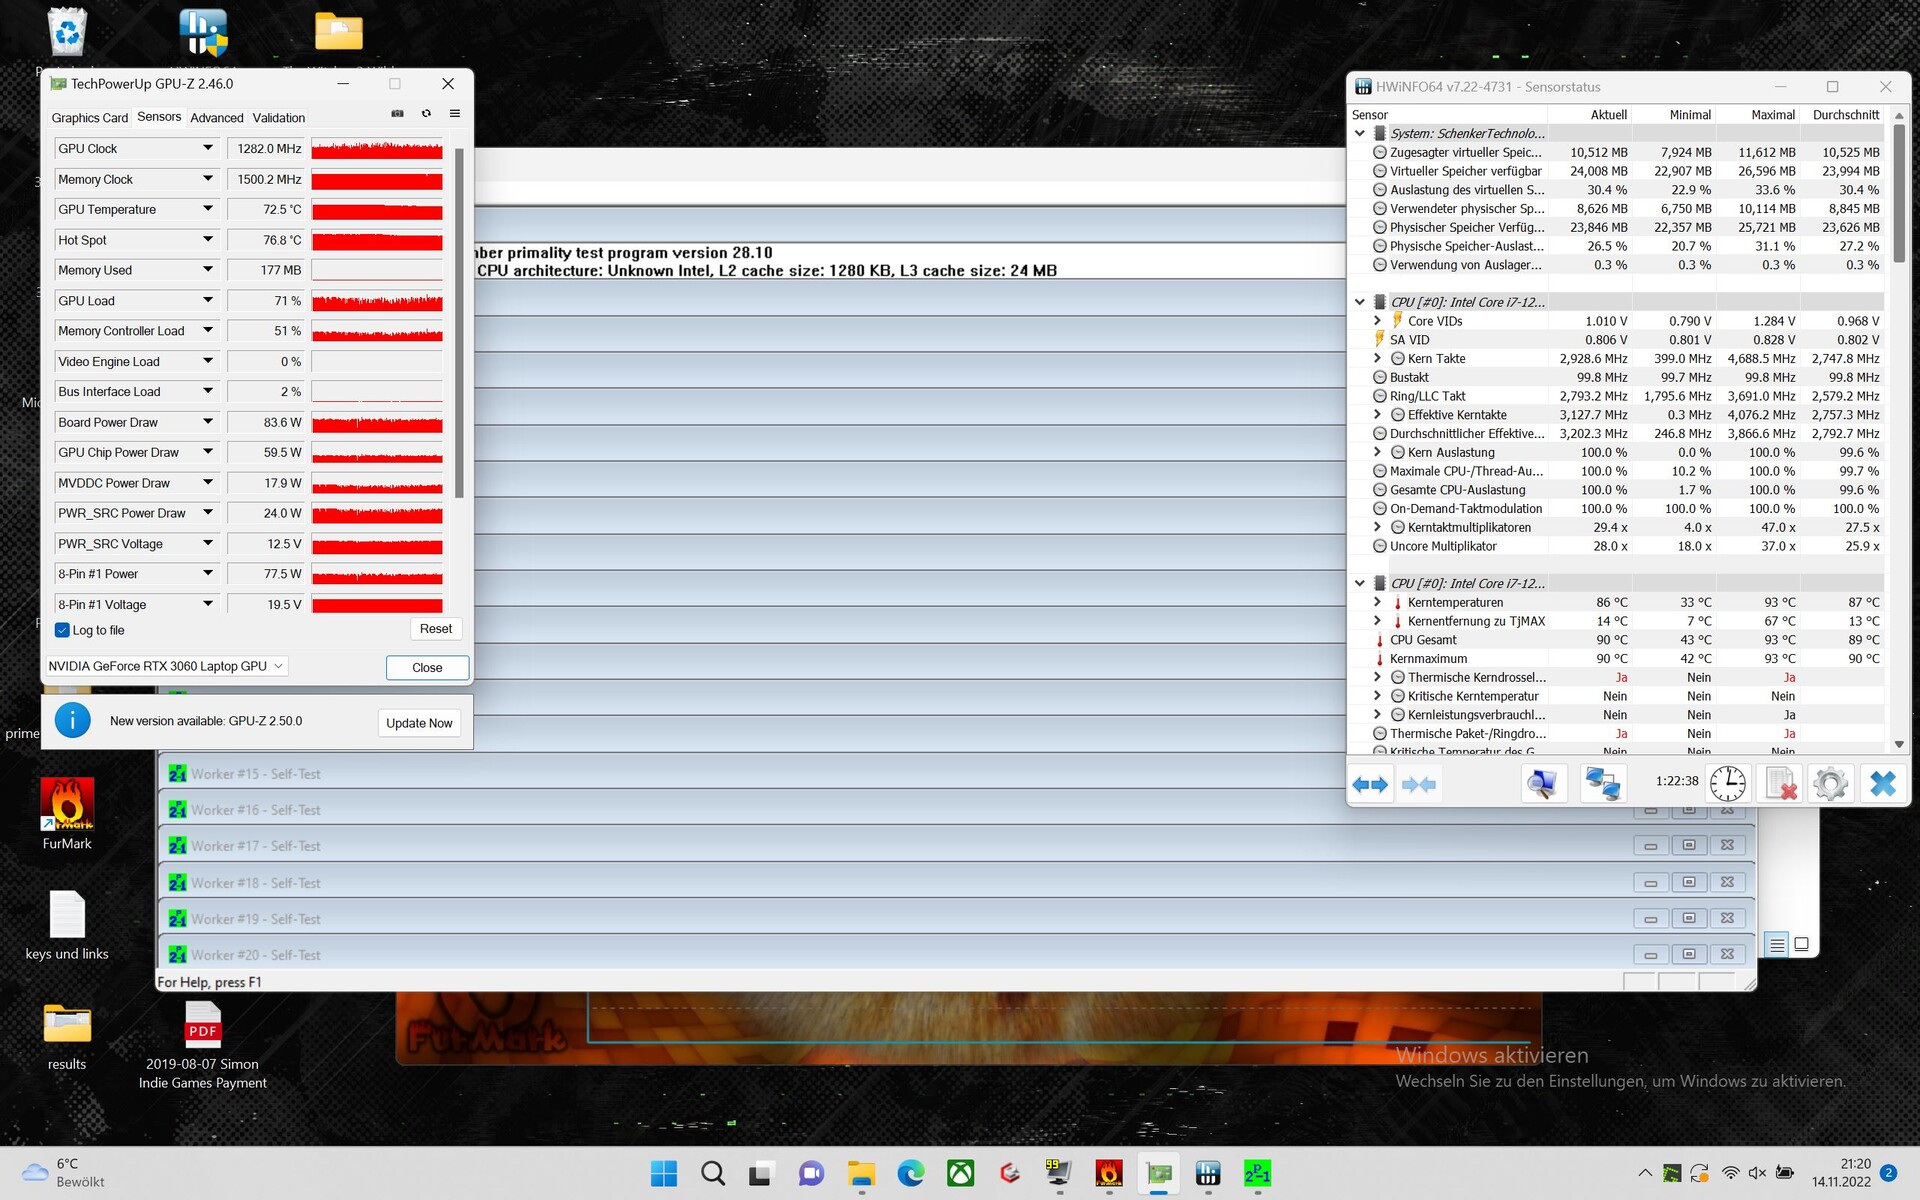
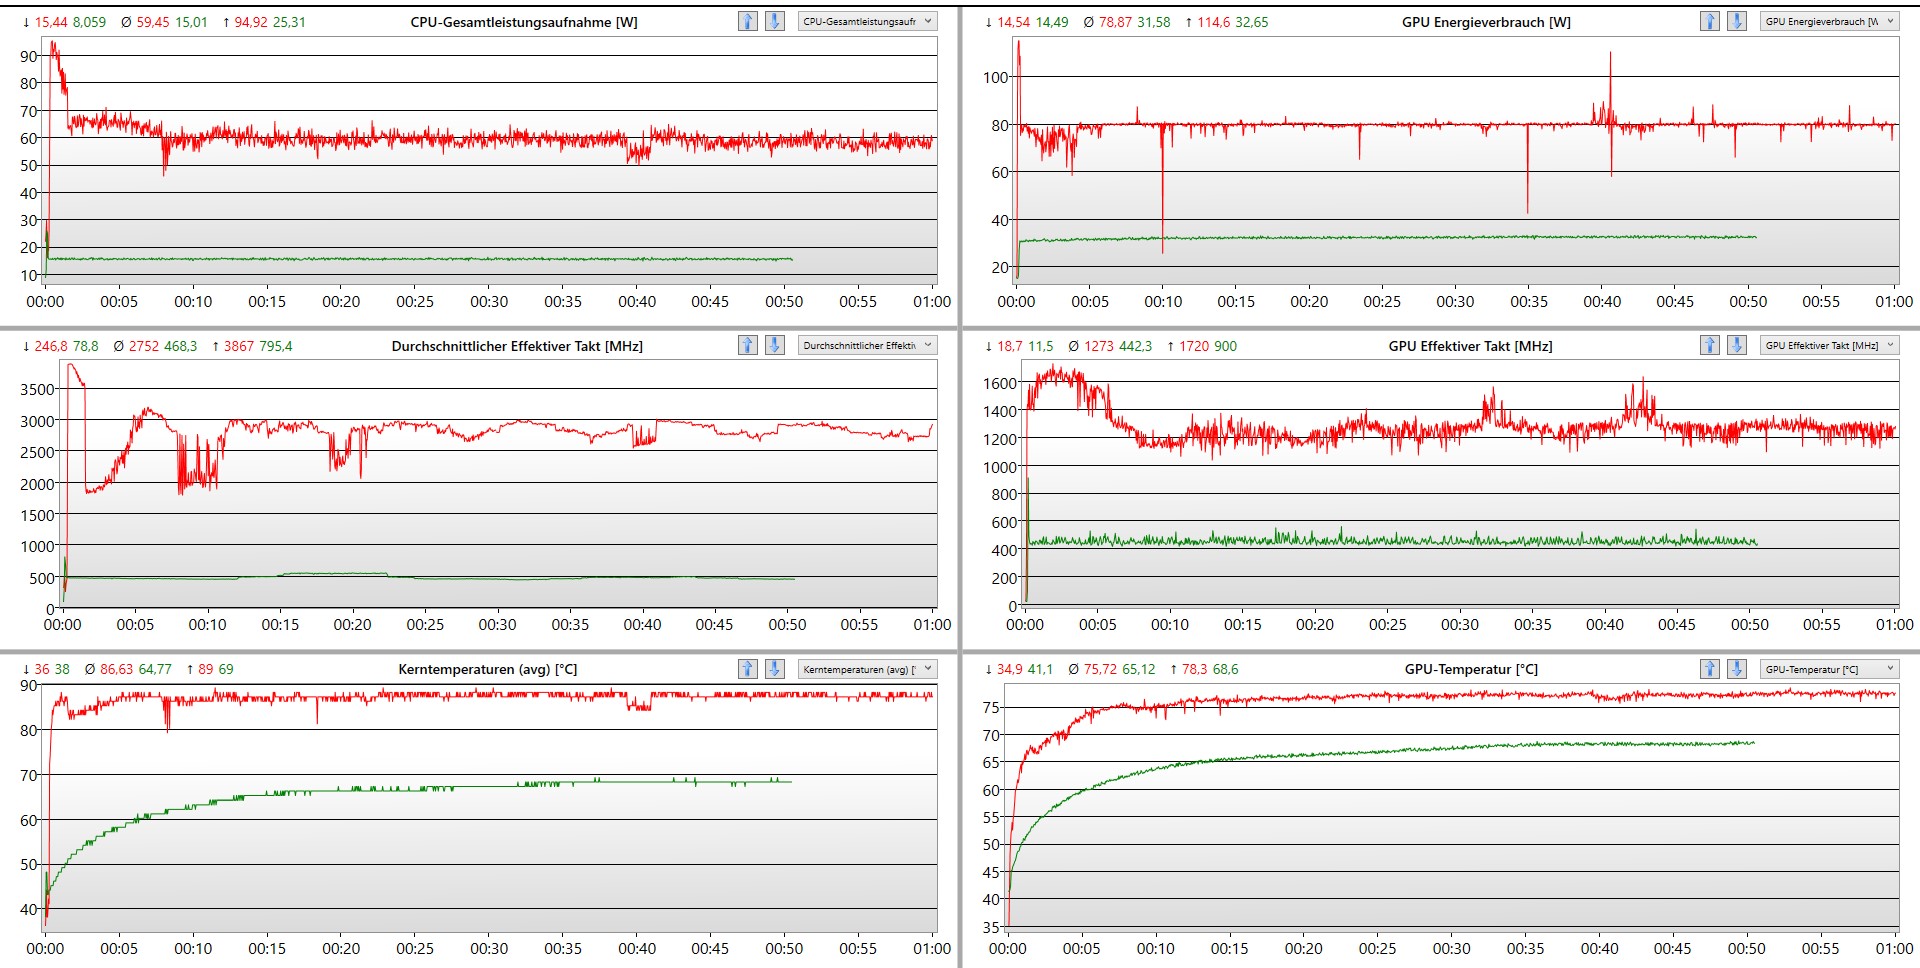
Prueba de esfuerzo
Durante la prueba de estrés, las velocidades de la CPU y la GPU del Schenker XMG Focus 16 caen en cuanto las temperaturas alcanzan los 80° y 90°C, respectivamente.
Altavoces
El Schenker XMG Focus 16 tiene dos pequeños altavoces con poco rango dinámico. Apenas consiguen ahogar los ventiladores del portátil. Los altavoces externos conectados a través de la clavija de audio de 3,5 mm o Bluetooth son casi imprescindibles. El portátil Schenker viene con la aplicación Sound Blaster Cinema 6+. Esto garantiza una excelente calidad de sonido con auriculares.
Schenker XMG Focus 16 (i7-12700H, RTX 3060) análisis de audio
(±) | la sonoridad del altavoz es media pero buena (79.2 dB)
Graves 100 - 315 Hz
(-) | casi sin bajos - de media 24.4% inferior a la mediana
(±) | la linealidad de los graves es media (8.1% delta a frecuencia anterior)
Medios 400 - 2000 Hz
(±) | medias más altas - de media 10.6% más altas que la mediana
(±) | la linealidad de los medios es media (13.1% delta respecto a la frecuencia anterior)
Altos 2 - 16 kHz
(+) | máximos equilibrados - a sólo 4.7% de la mediana
(±) | la linealidad de los máximos es media (10.4% delta a frecuencia anterior)
Total 100 - 16.000 Hz
(-) | el sonido global no es lineal (30.1% de diferencia con la mediana)
En comparación con la misma clase
» 96% de todos los dispositivos probados de esta clase eran mejores, 2% similares, 3% peores
» El mejor tuvo un delta de 6%, la media fue 18%, el peor fue ###max##%
En comparación con todos los dispositivos probados
» 88% de todos los dispositivos probados eran mejores, 3% similares, 9% peores
» El mejor tuvo un delta de 4%, la media fue 23%, el peor fue ###max##%
Asus ROG Flow X16 GV601RW-M5082W análisis de audio
(±) | la sonoridad del altavoz es media pero buena (80.7 dB)
Graves 100 - 315 Hz
(±) | lubina reducida - en promedio 12.7% inferior a la mediana
(±) | la linealidad de los graves es media (13.8% delta a frecuencia anterior)
Medios 400 - 2000 Hz
(+) | medios equilibrados - a sólo 1.3% de la mediana
(+) | los medios son lineales (4.7% delta a la frecuencia anterior)
Altos 2 - 16 kHz
(±) | máximos más altos - de media 6.4% más altos que la mediana
(+) | los máximos son lineales (6.8% delta a la frecuencia anterior)
Total 100 - 16.000 Hz
(+) | el sonido global es lineal (12.9% de diferencia con la mediana)
En comparación con la misma clase
» 17% de todos los dispositivos probados de esta clase eran mejores, 4% similares, 79% peores
» El mejor tuvo un delta de 6%, la media fue 18%, el peor fue ###max##%
En comparación con todos los dispositivos probados
» 12% de todos los dispositivos probados eran mejores, 3% similares, 85% peores
» El mejor tuvo un delta de 4%, la media fue 23%, el peor fue ###max##%
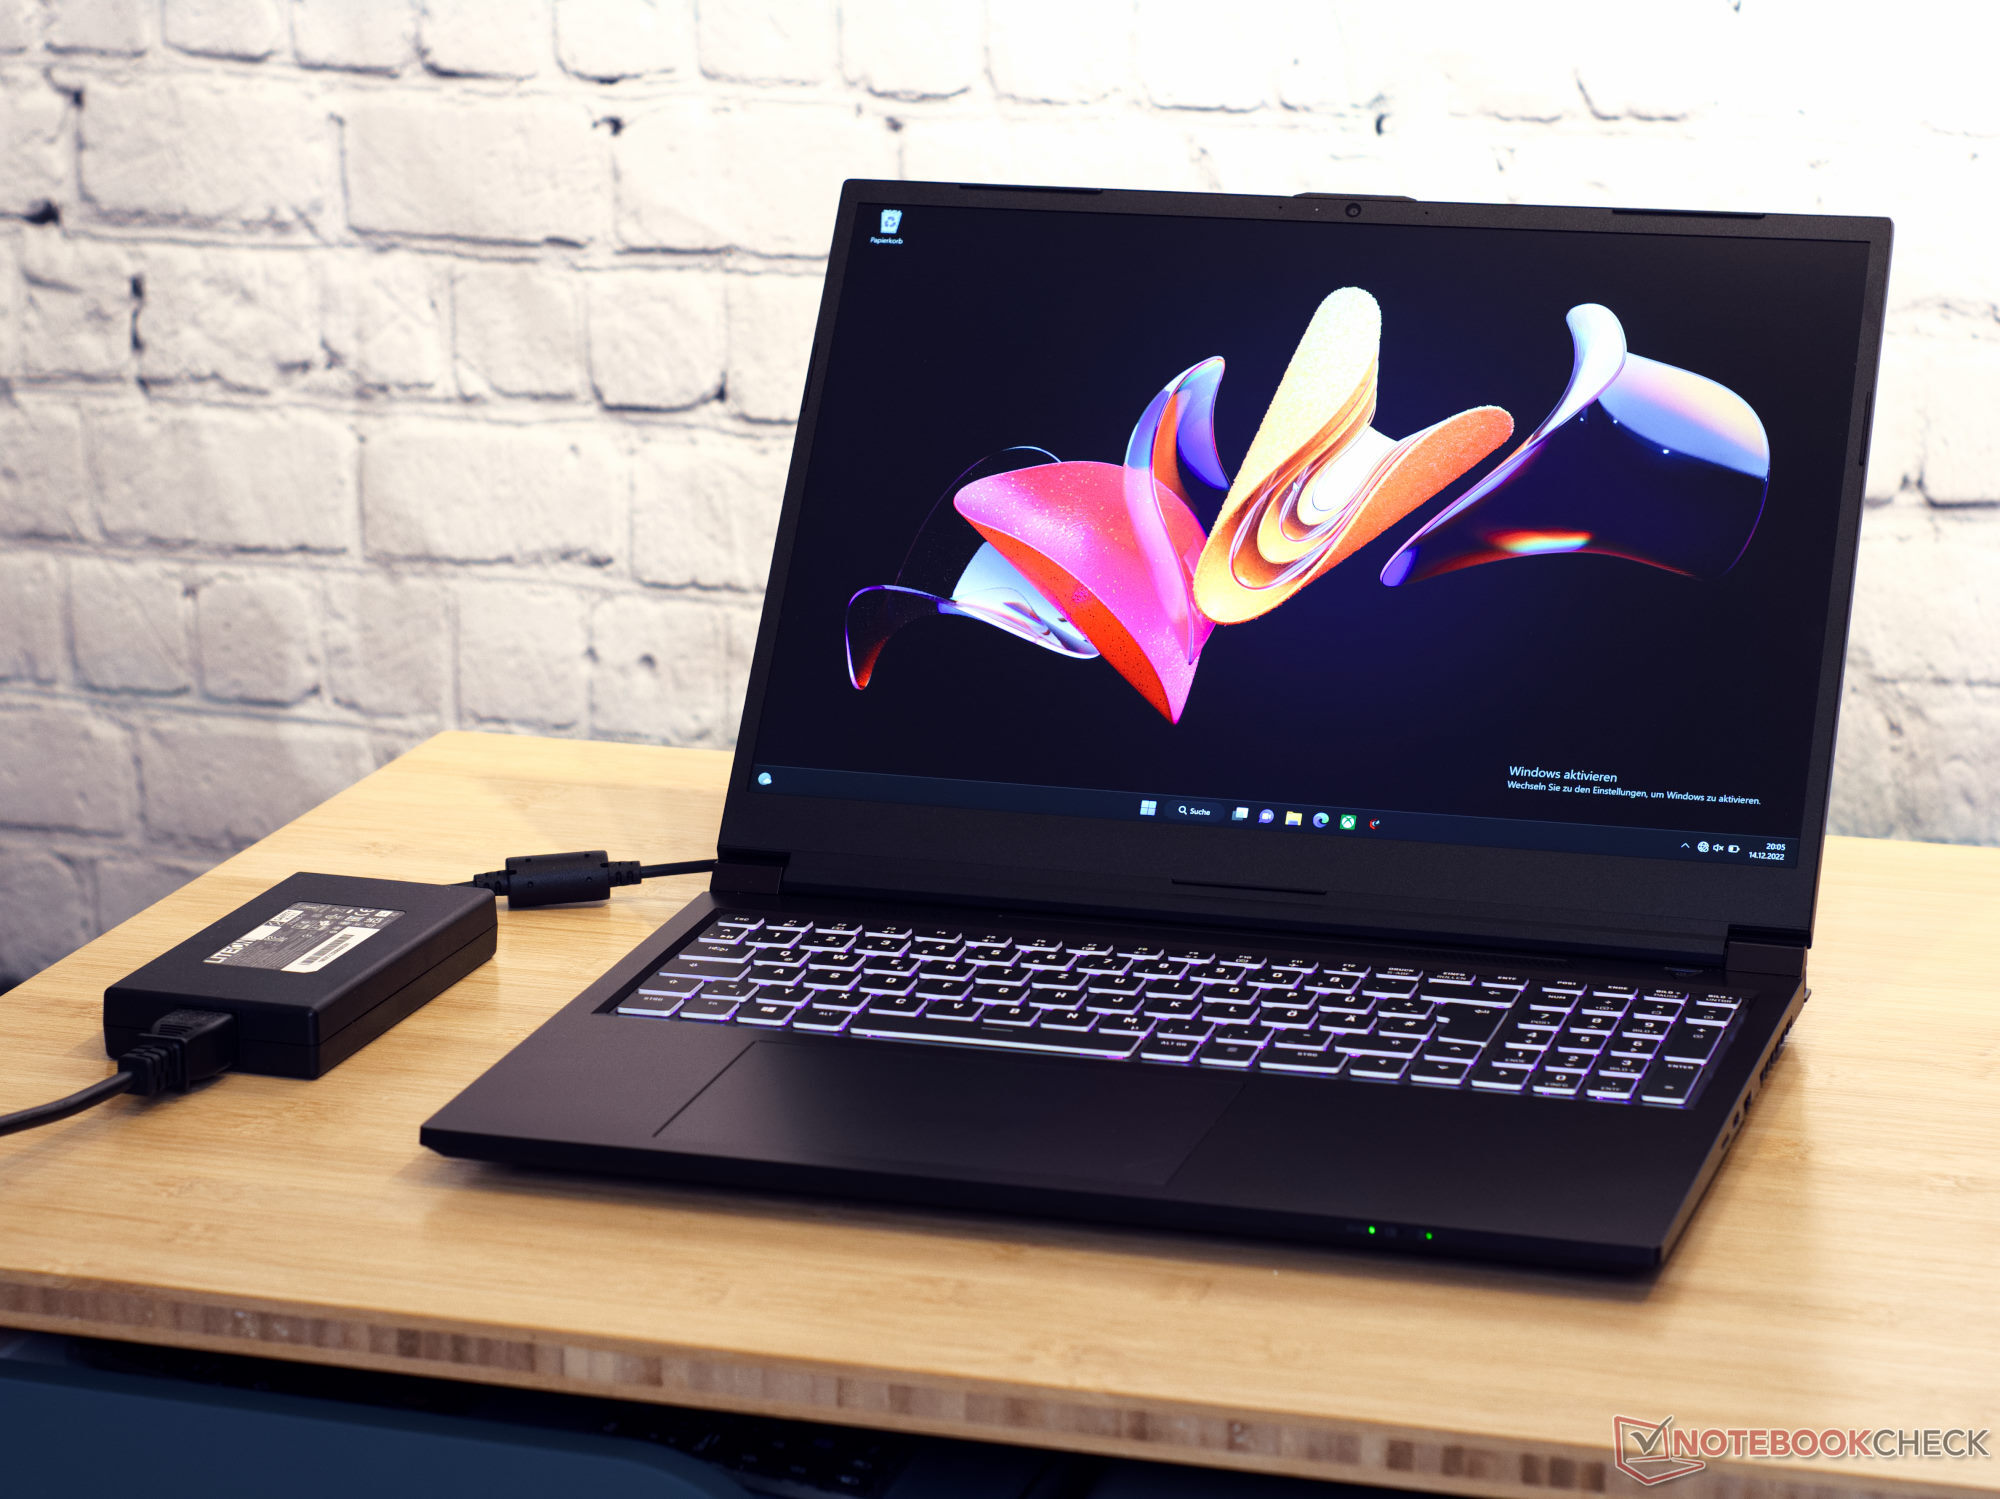
Gestión de la energía: consumo típico de un portátil para juegos
Consumo de energía
El portátil viene con una fuente de alimentación de 180 vatios de Lite-ON (PA-1181-76). Durante la prueba de estrés, medimos un consumo de energía a largo plazo de 190 vatios. En general, la fuente de alimentación parece débil teniendo en cuenta la configuración del portátil. Los dispositivos de comparación de Dell y Lenovo, con una configuración similar a la del portátil Schenker, vienen con al menos una fuente de alimentación de 230 vatios. Y estos portátiles lo aprovechan.
En reposo, el portátil consume 3 vatios más que los dispositivos de comparación y, por tanto, se sitúa a la par de los demás portátiles para juegos en cuanto a requisitos energéticos. En resumen, el Schenker XMG Focus 16 no es realmente una maravilla de ahorro de energía a pesar de la pequeña fuente de alimentación.
| Off / Standby | |
| Ocioso | |
| Carga |
|
Clave:
min: | |
| Schenker XMG Focus 16 (i7-12700H, RTX 3060) i7-12700H, GeForce RTX 3060 Laptop GPU, Samsung SSD 980 Pro 1TB MZ-V8P1T0BW, IPS, 2560x1600, 16" | Asus ZenBook Pro 16X OLED UX7602ZM-ME115W i9-12900H, GeForce RTX 3060 Laptop GPU, Samsung PM9A1 MZVL21T0HCLR, OLED, 3840x2400, 16" | Dell G16 7620 i7-12700H, GeForce RTX 3060 Laptop GPU, WDC PC SN810 512GB, IPS, 2560x1600, 16" | Asus ROG Flow X16 GV601RW-M5082W R9 6900HS, GeForce RTX 3070 Ti Laptop GPU, Micron 3400 1TB MTFDKBA1T0TFH, Mini LED, 2560x1600, 16.1" | Lenovo ThinkPad X1 Extreme G5-21DE003RGE i7-12700H, GeForce RTX 3060 Laptop GPU, Micron 3400 1TB MTFDKBA1T0TFH, IPS, 3840x2400, 16" | Lenovo Legion Slim 7-16IAH 82TF004YGE i7-12700H, GeForce RTX 3060 Laptop GPU, SK Hynix HFS001TEJ9X115N, IPS LED, 2560x1600, 16" | Lenovo Legion 5 Pro 16IAH7H i7-12700H, GeForce RTX 3060 Laptop GPU, 2x Samsung PM9A1 MZVL21T0HCLR (RAID 0), IPS, 2560x1600, 16" | Medio NVIDIA GeForce RTX 3060 Laptop GPU | Media de la clase Gaming | |
|---|---|---|---|---|---|---|---|---|---|
| Power Consumption | 20% | -5% | -21% | 1% | 7% | -44% | 14% | -2% | |
| Idle Minimum * (Watt) | 14.7 | 11.1 24% | 14.4 2% | 12.2 17% | 11.8 20% | 13.3 10% | 22.8 -55% | 10.4 ? 29% | 13.1 ? 11% |
| Idle Average * (Watt) | 18.6 | 11.4 39% | 17.8 4% | 25.5 -37% | 22.4 -20% | 17.5 6% | 26.5 -42% | 14.5 ? 22% | 19 ? -2% |
| Idle Maximum * (Watt) | 21.2 | 14.4 32% | 31.5 -49% | 29.8 -41% | 23.1 -9% | 18.4 13% | 41 -93% | 21.4 ? -1% | 24.6 ? -16% |
| Load Average * (Watt) | 121 | 137.4 -14% | 101.2 16% | 183 -51% | 138 -14% | 122.8 -1% | 191 -58% | 109.3 ? 10% | 111.3 ? 8% |
| Witcher 3 ultra * (Watt) | 174 | 136 22% | 176.9 -2% | 183.6 -6% | 129.9 25% | 154.7 11% | 194.7 -12% | ||
| Load Maximum * (Watt) | 235 | 197 16% | 242.9 -3% | 253 -8% | 225.6 4% | 232.6 1% | 238 -1% | 206 ? 12% | 260 ? -11% |
* ... más pequeño es mejor
Power consumption Witcher 3 / stress test
Power consumption with an external monitor
Duración de la batería
El Focus 16 tiene una pequeña batería de 54 Wh. Por este motivo, no es de extrañar que la duración de la batería sea menos de la mitad que la de los dispositivos de la competencia. No obstante, el modo de ahorro de energía del Centro de Control es muy eficaz. La prueba de navegación por Internet WiFi a pantalla completa se realizó con el modo de entretenimiento y la prueba de 150 cd/m² con el modo de ahorro de energía y una frecuencia de refresco de 60 Hz. En este modo, la batería dura bastante más.
| Schenker XMG Focus 16 (i7-12700H, RTX 3060) i7-12700H, GeForce RTX 3060 Laptop GPU, 54 Wh | Asus ZenBook Pro 16X OLED UX7602ZM-ME115W i9-12900H, GeForce RTX 3060 Laptop GPU, 96 Wh | Dell G16 7620 i7-12700H, GeForce RTX 3060 Laptop GPU, 84 Wh | Asus ROG Flow X16 GV601RW-M5082W R9 6900HS, GeForce RTX 3070 Ti Laptop GPU, 90 Wh | Lenovo ThinkPad X1 Extreme G5-21DE003RGE i7-12700H, GeForce RTX 3060 Laptop GPU, 90 Wh | Lenovo Legion Slim 7-16IAH 82TF004YGE i7-12700H, GeForce RTX 3060 Laptop GPU, 99.99 Wh | Lenovo Legion 5 Pro 16IAH7H i7-12700H, GeForce RTX 3060 Laptop GPU, 80 Wh | Media de la clase Gaming | |
|---|---|---|---|---|---|---|---|---|
| Duración de Batería | 86% | -23% | -9% | 31% | 1% | -41% | 28% | |
| WiFi v1.3 (h) | 4.8 | 8.9 85% | 5 4% | 5.7 19% | 6.7 40% | 5.2 8% | 3.6 -25% | 7.08 ? 48% |
| Load (h) | 1.4 | 2.6 86% | 0.7 -50% | 0.9 -36% | 1.7 21% | 1.3 -7% | 0.6 -57% | 1.496 ? 7% |
| Reader / Idle (h) | 12.7 | 7.1 | 7.84 ? | |||||
| Witcher 3 ultra (h) | 0.9 | 1.5 | 2.1 | |||||
| H.264 (h) | 7.3 | 9.5 | 4.1 | 8.27 ? |
Pro
Contra
Veredicto: un portátil para juegos normal con un servicio por encima de la media
El Schenker XMG Focus 16 ofreció constantemente altos fps en los juegos probados. En general, el portátil para juegos Nvidia RTX 3060 ofrece un rendimiento por encima de la media. No obstante, la competencia en forma del Dell G16 o el Lenovo Legion 5 Pro ofrece más potencia bruta a un precio casi idéntico. A pesar de ello, el aumento de rendimiento es más bien marginal.
Sin embargo, el portátil de Schenker presume de unas capacidades blandas superiores a las de la competencia de Dell y Lenovo. El teclado del portátil de Schenker impresiona por su gran recorrido de teclas y su buena respuesta háptica. El XMG Focus 16 también disfruta de una buena selección de puertos bien situados. Además, el servicio de atención al cliente de Schenker también es impresionante. Al igual que antes, las consultas se responden de forma rápida y competente, a menudo en pocas horas. Esto ha ayudado a Schenker a alcanzar el primer puesto por tercera vez consecutiva en nuestra encuesta sobre servicio y atención al cliente de portátiles y smartphones encuesta sobre atención al cliente en portátiles y smartphones. El diseño del XMG Focus 16 es cuestión de gustos. Para ser un portátil de juegos, el dispositivo es discreto, negro y cuadrado.
El XMG Focus 16 saca mucha potencia del hardware sin llegar a los límites de su potencial.
En general, el portátil de Schenker es sólido como una roca, pero es incapaz de alcanzar un rendimiento de alto nivel. En ninguna de las áreas de nuestras pruebas y análisis, el portátil para juegos fue capaz de dominar a la competencia. El mejor rendimiento de tarjeta gráfica se encuentra en el Asus ROG Flow X16, mientras que el Lenovo Legion 5 Pro logra el mejor rendimiento de CPU. Además, el Asus Zenbook Pro 16X OLED tiene la pantalla más sensible. En cada una de estas áreas, el portátil Schenker ofrece un rendimiento adecuado o superior a la media.
Precio y disponibilidad
Bestware.com es la tienda online de Schenker donde se puede configurar y encargar el portátil para juegos. En el momento de la revisión, nuestra especificación de prueba XMG Focus 16se puede conseguir por unos 1800 dólares. Con sólo 8 GB de RAM y sin SSD NVMe, el precio base del portátil ronda los 1600 dólares.
Schenker XMG Focus 16 (i7-12700H, RTX 3060)
- 12/21/2022 v7 (old)
Marc Herter
Price comparison

