Análisis del portátil Lenovo ThinkPad X1 Extreme G5 - ThinkPad insignia con más potencia de CPU
Tras recibir una amplia actualización de cuarta generación justo el año pasado en su buque insignia Thinkpad X1 Extreme, Lenovo se concentra ahora en la calidad interior del nuevo modelo -el G5- instalando un nuevo y mejorado sistema de refrigeración de metal líquido, así como un procesador Intel actual de 12ª generación (Alder Lake H). Las tarjetas gráficas siguen siendo de la gama de GPU de Nvidia de la serie RTX 3000, incluida una rápida opción RTX 3080 Ti
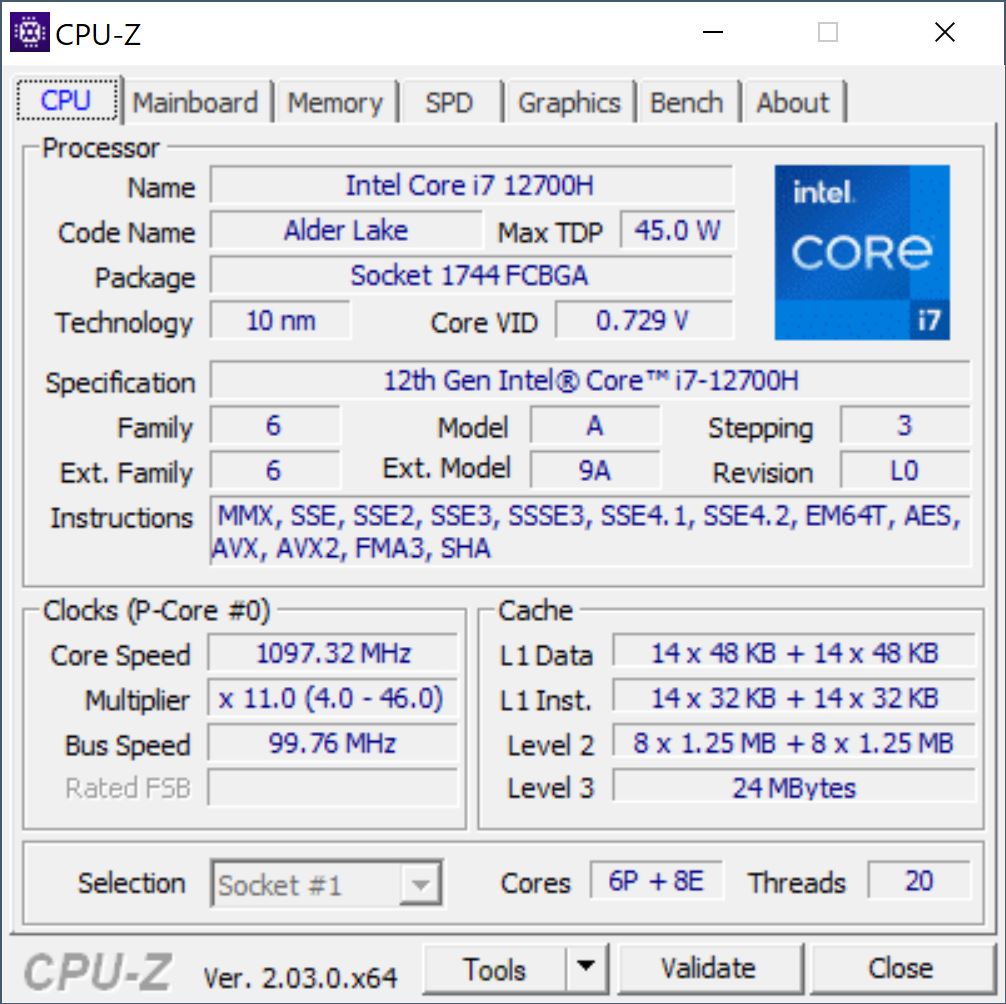
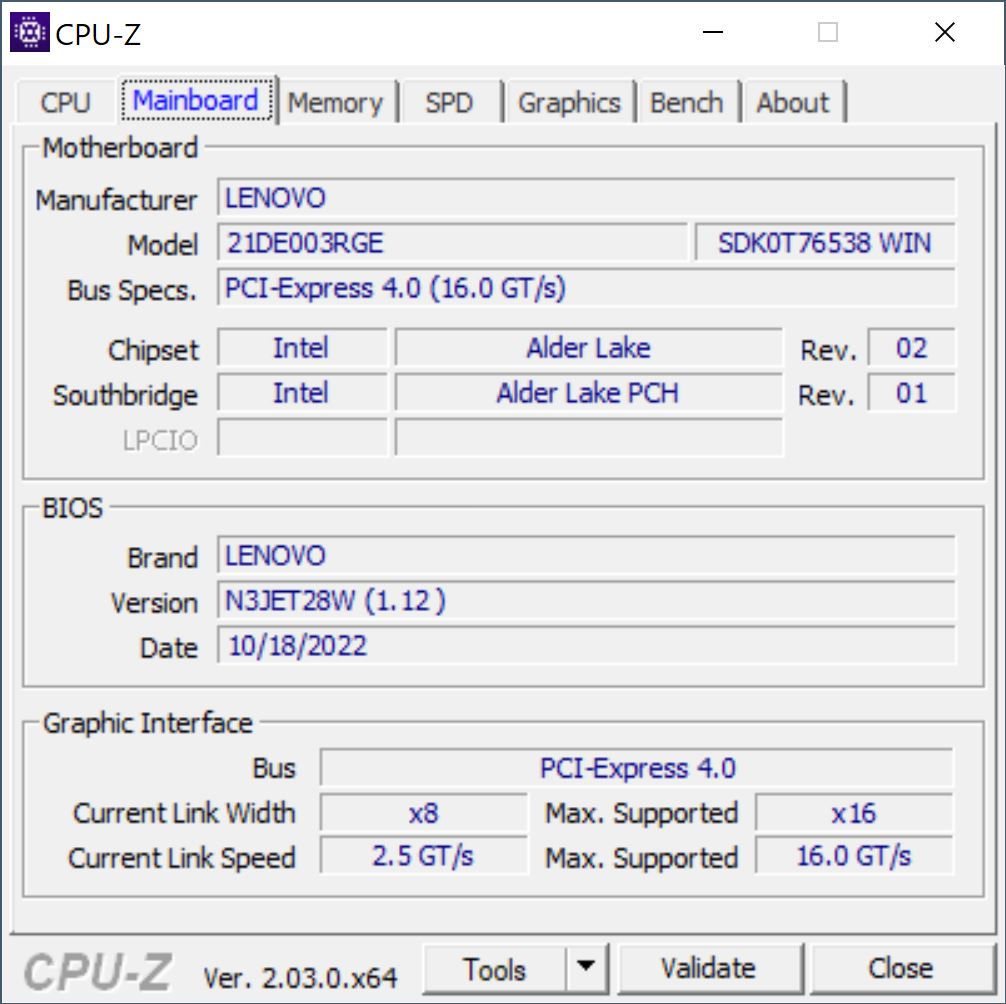
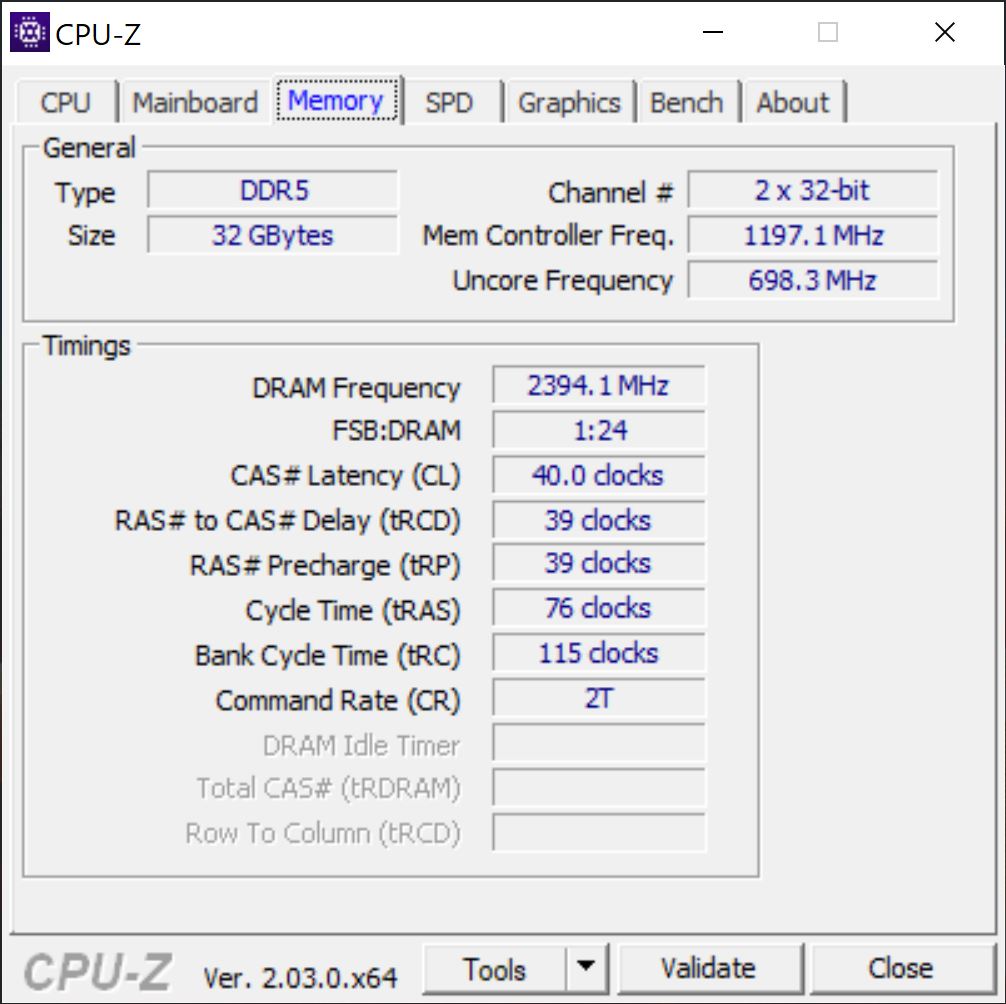
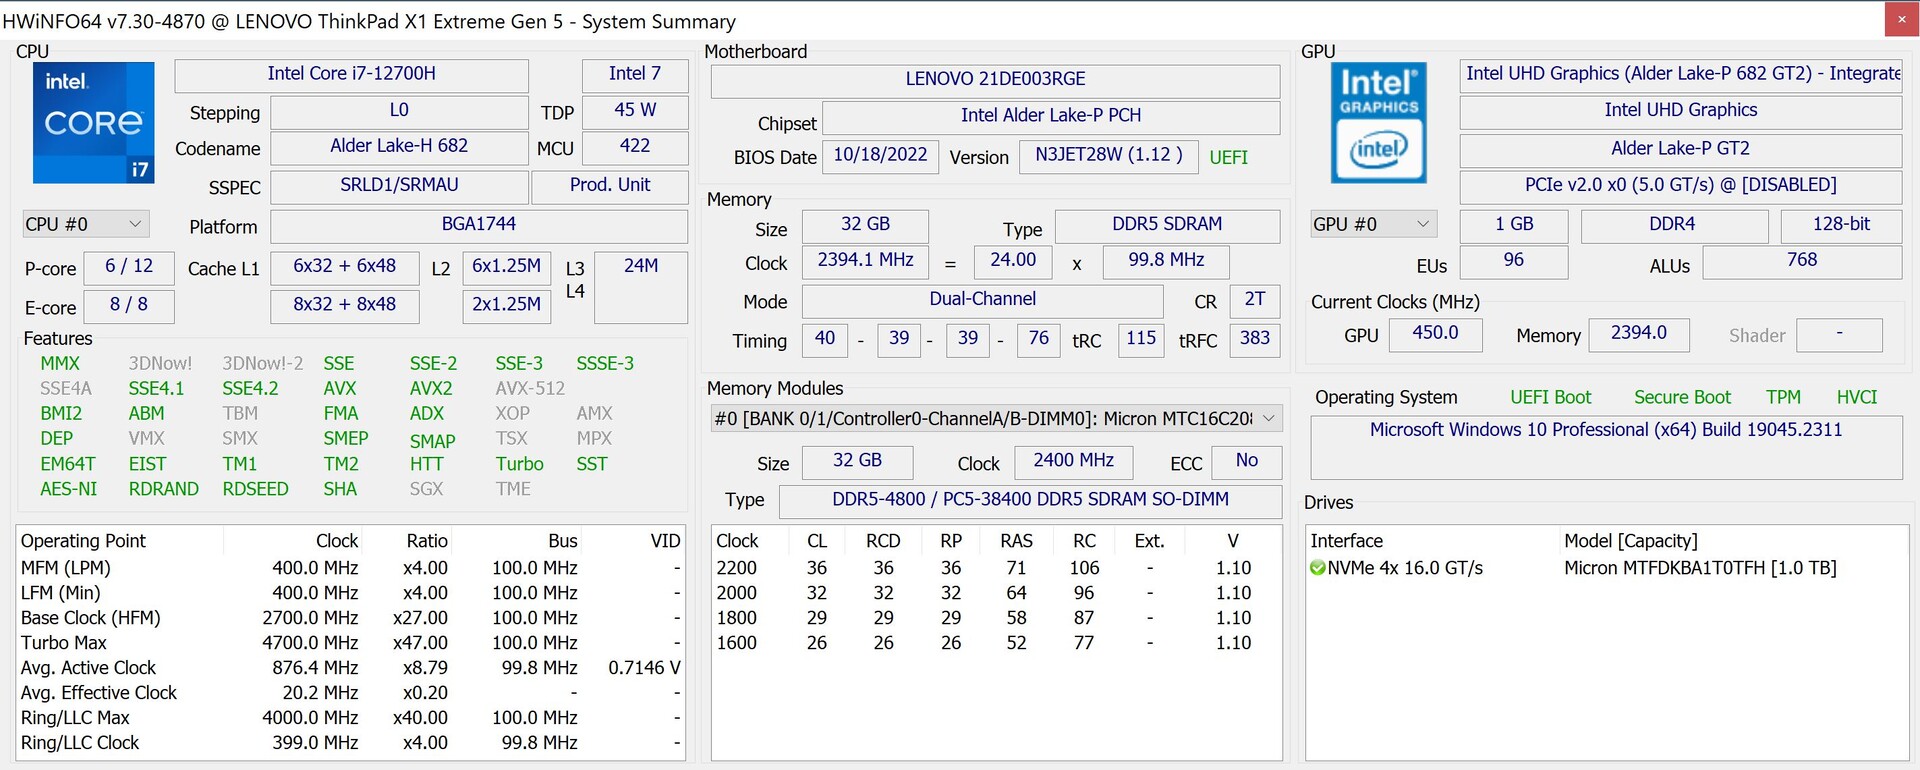
Nuestro modelo de análisis, el 21DE003RGE, puede conseguirse por unos 3600 dólares y viene con un Intel Core i7-12700H, 32 GB de RAM DDR5-4800, un SSD PCIe 4.0 de 1 TB, una pantalla IPS 4K con cobertura AdobeRGB completa, así como una GPU dedicada, la GeForce RTX 3060. Nuestro modelo venía preinstalado con Windows 10 Pro (mediante derechos de downgrade desde Windows 11 Pro). Por desgracia, experimentamos algunos problemas de rendimiento, como que Wi-Fi 6E no funcionaba con Windows 10. Por esta razón, usamos Windows 11 Pro durante las pruebas y también recomendaríamos esta actualización a todos los usuarios.
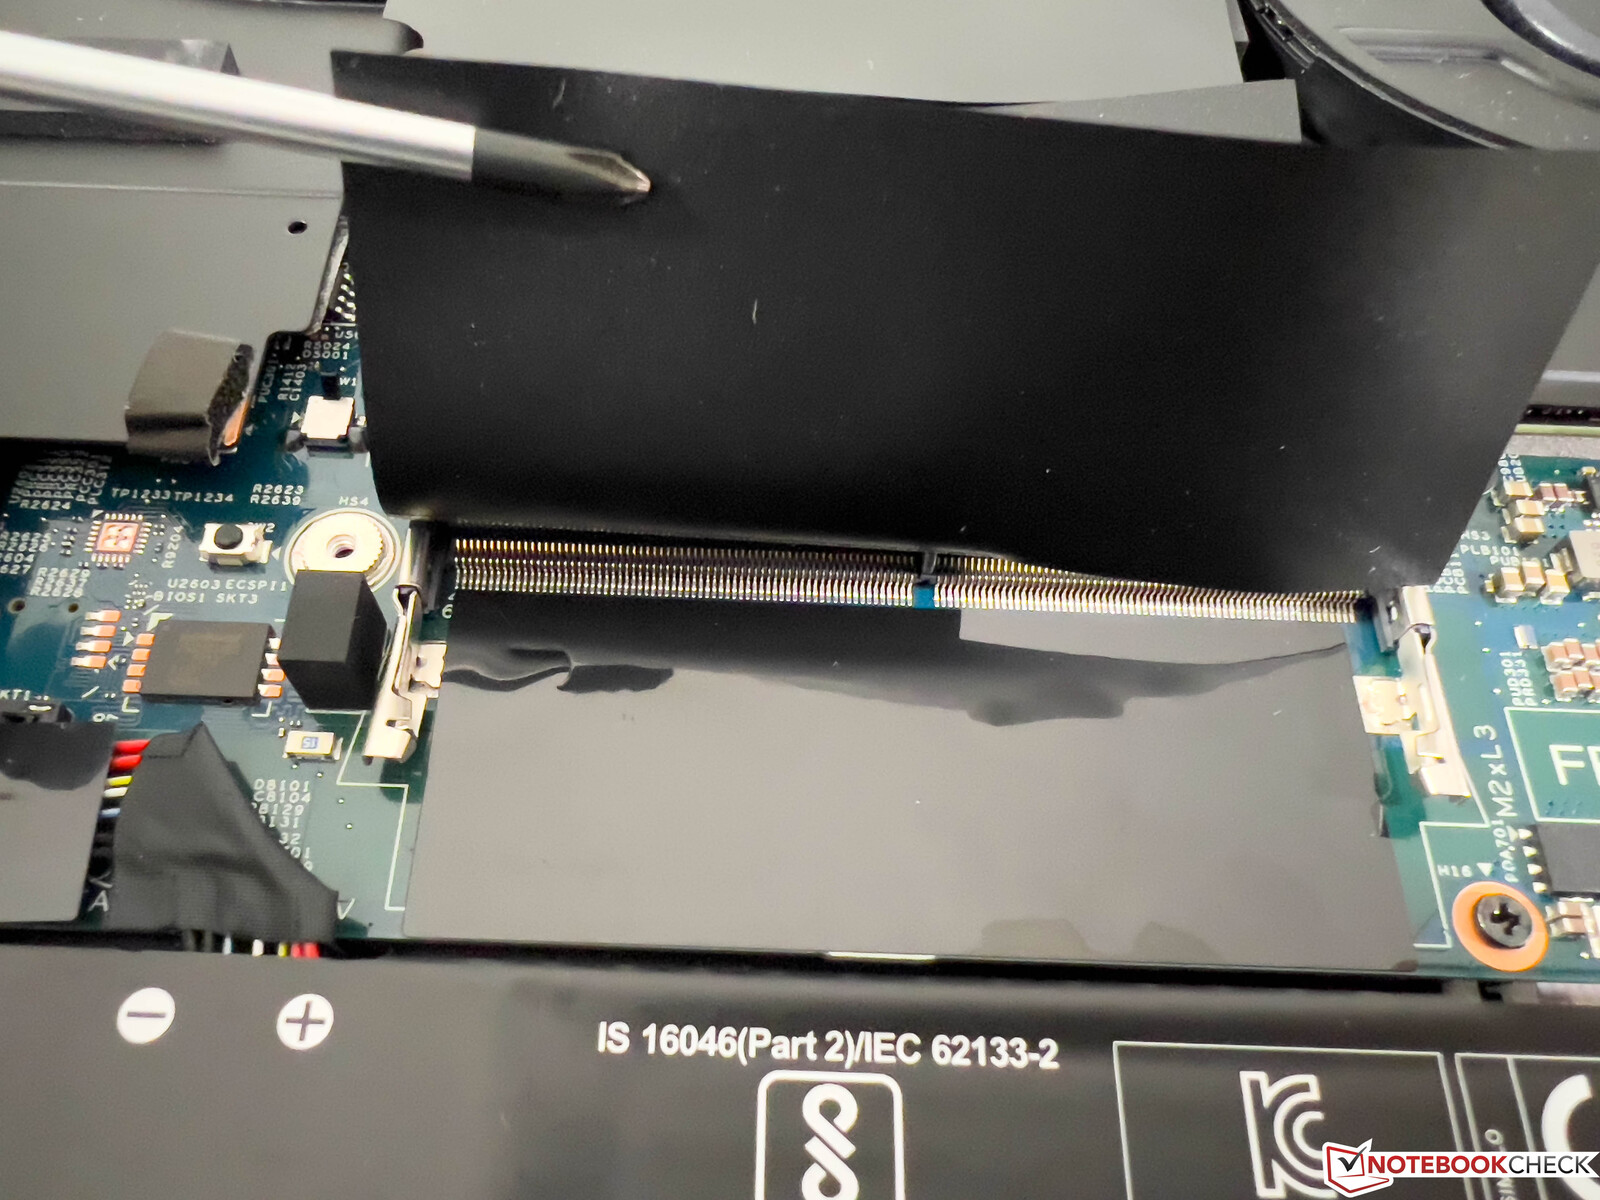
Nota: al igual que con el último modelo, el X1 Extreme G5 viene en dos versiones básicas. Las configuraciones con la RTX 3050 Ti usan refrigeración normal basada en tubos de calor, razón por la que hay espacio adicional para un segundo SSD M.2 así como un módulo WWAN. Las configuraciones con GPU más potentes (a partir de la RTX 3060) están equipadas con un sistema de refrigeración por cámara de vapor más grande, lo que da lugar a la implementación de una sola SSD M.2.
Posibles contendientes en la comparación
Valoración | Fecha | Modelo | Peso | Altura | Tamaño | Resolución | Precio |
|---|---|---|---|---|---|---|---|
| 88.7 % v7 (old) | 12/2022 | Lenovo ThinkPad X1 Extreme G5-21DE003RGE i7-12700H, GeForce RTX 3060 Laptop GPU | 2.1 kg | 17.9 mm | 16.00" | 3840x2400 | |
| 86.9 % v7 (old) | 09/2022 | HP Envy 16 h0112nr i7-12700H, GeForce RTX 3060 Laptop GPU | 2.3 kg | 19.8 mm | 16.00" | 3840x2400 | |
| 87.8 % v7 (old) | 11/2022 | Schenker Vision 16 Pro RTX 3070 Ti i7-12700H, GeForce RTX 3070 Ti Laptop GPU | 1.7 kg | 17.1 mm | 16.00" | 2560x1600 | |
| 89.5 % v7 (old) | 05/2022 | Dell XPS 15 9520 RTX 3050 Ti i7-12700H, GeForce RTX 3050 Ti Laptop GPU | 1.9 kg | 18 mm | 15.60" | 3456x2160 | |
| 93.2 % v7 (old) | 11/2021 | Apple MacBook Pro 16 2021 M1 Pro M1 Pro, M1 Pro 16-Core GPU | 2.2 kg | 16.8 mm | 16.20" | 3456x2234 | |
| 88.8 % v7 (old) | 06/2022 | Dell XPS 17 9720 RTX 3060 i7-12700H, GeForce RTX 3060 Laptop GPU | 2.5 kg | 19.5 mm | 17.00" | 3840x2400 |
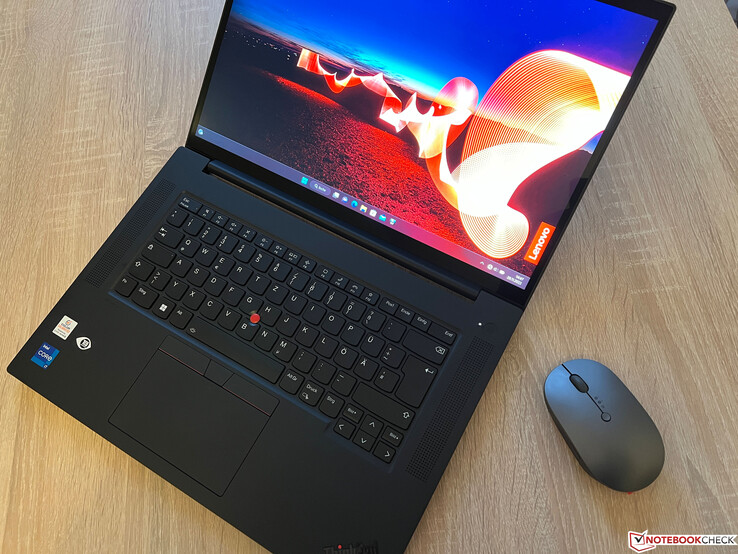
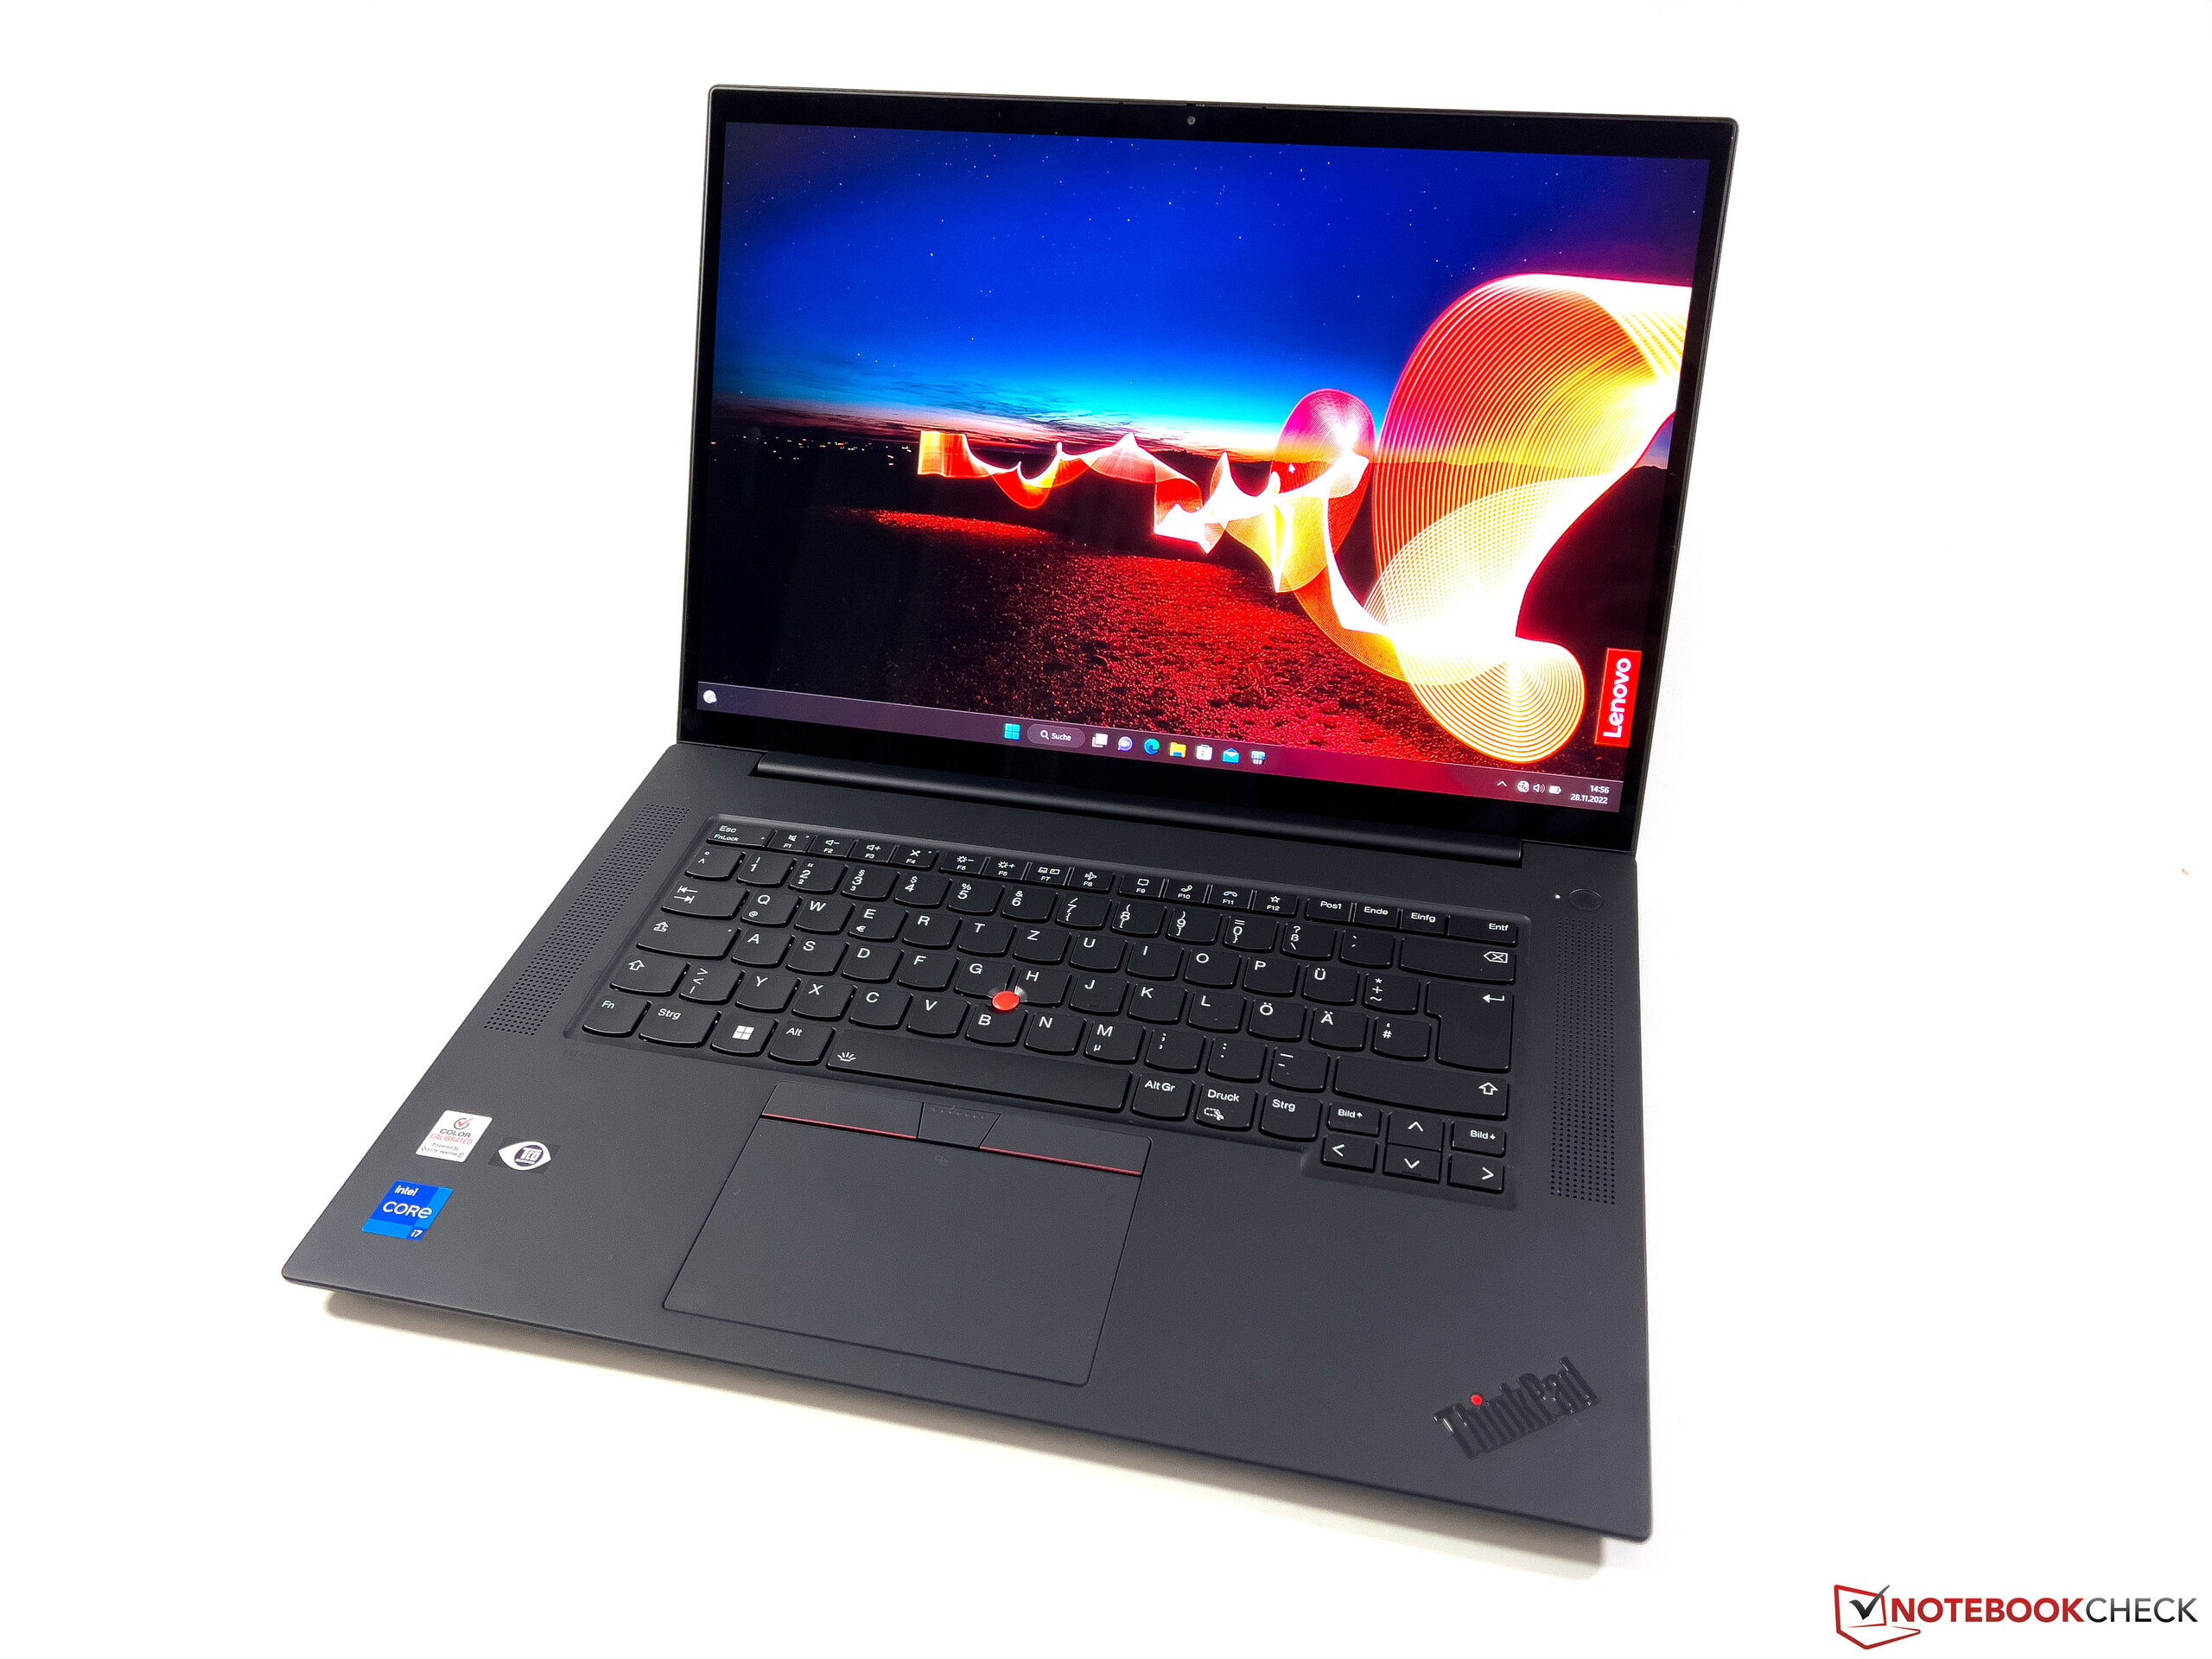
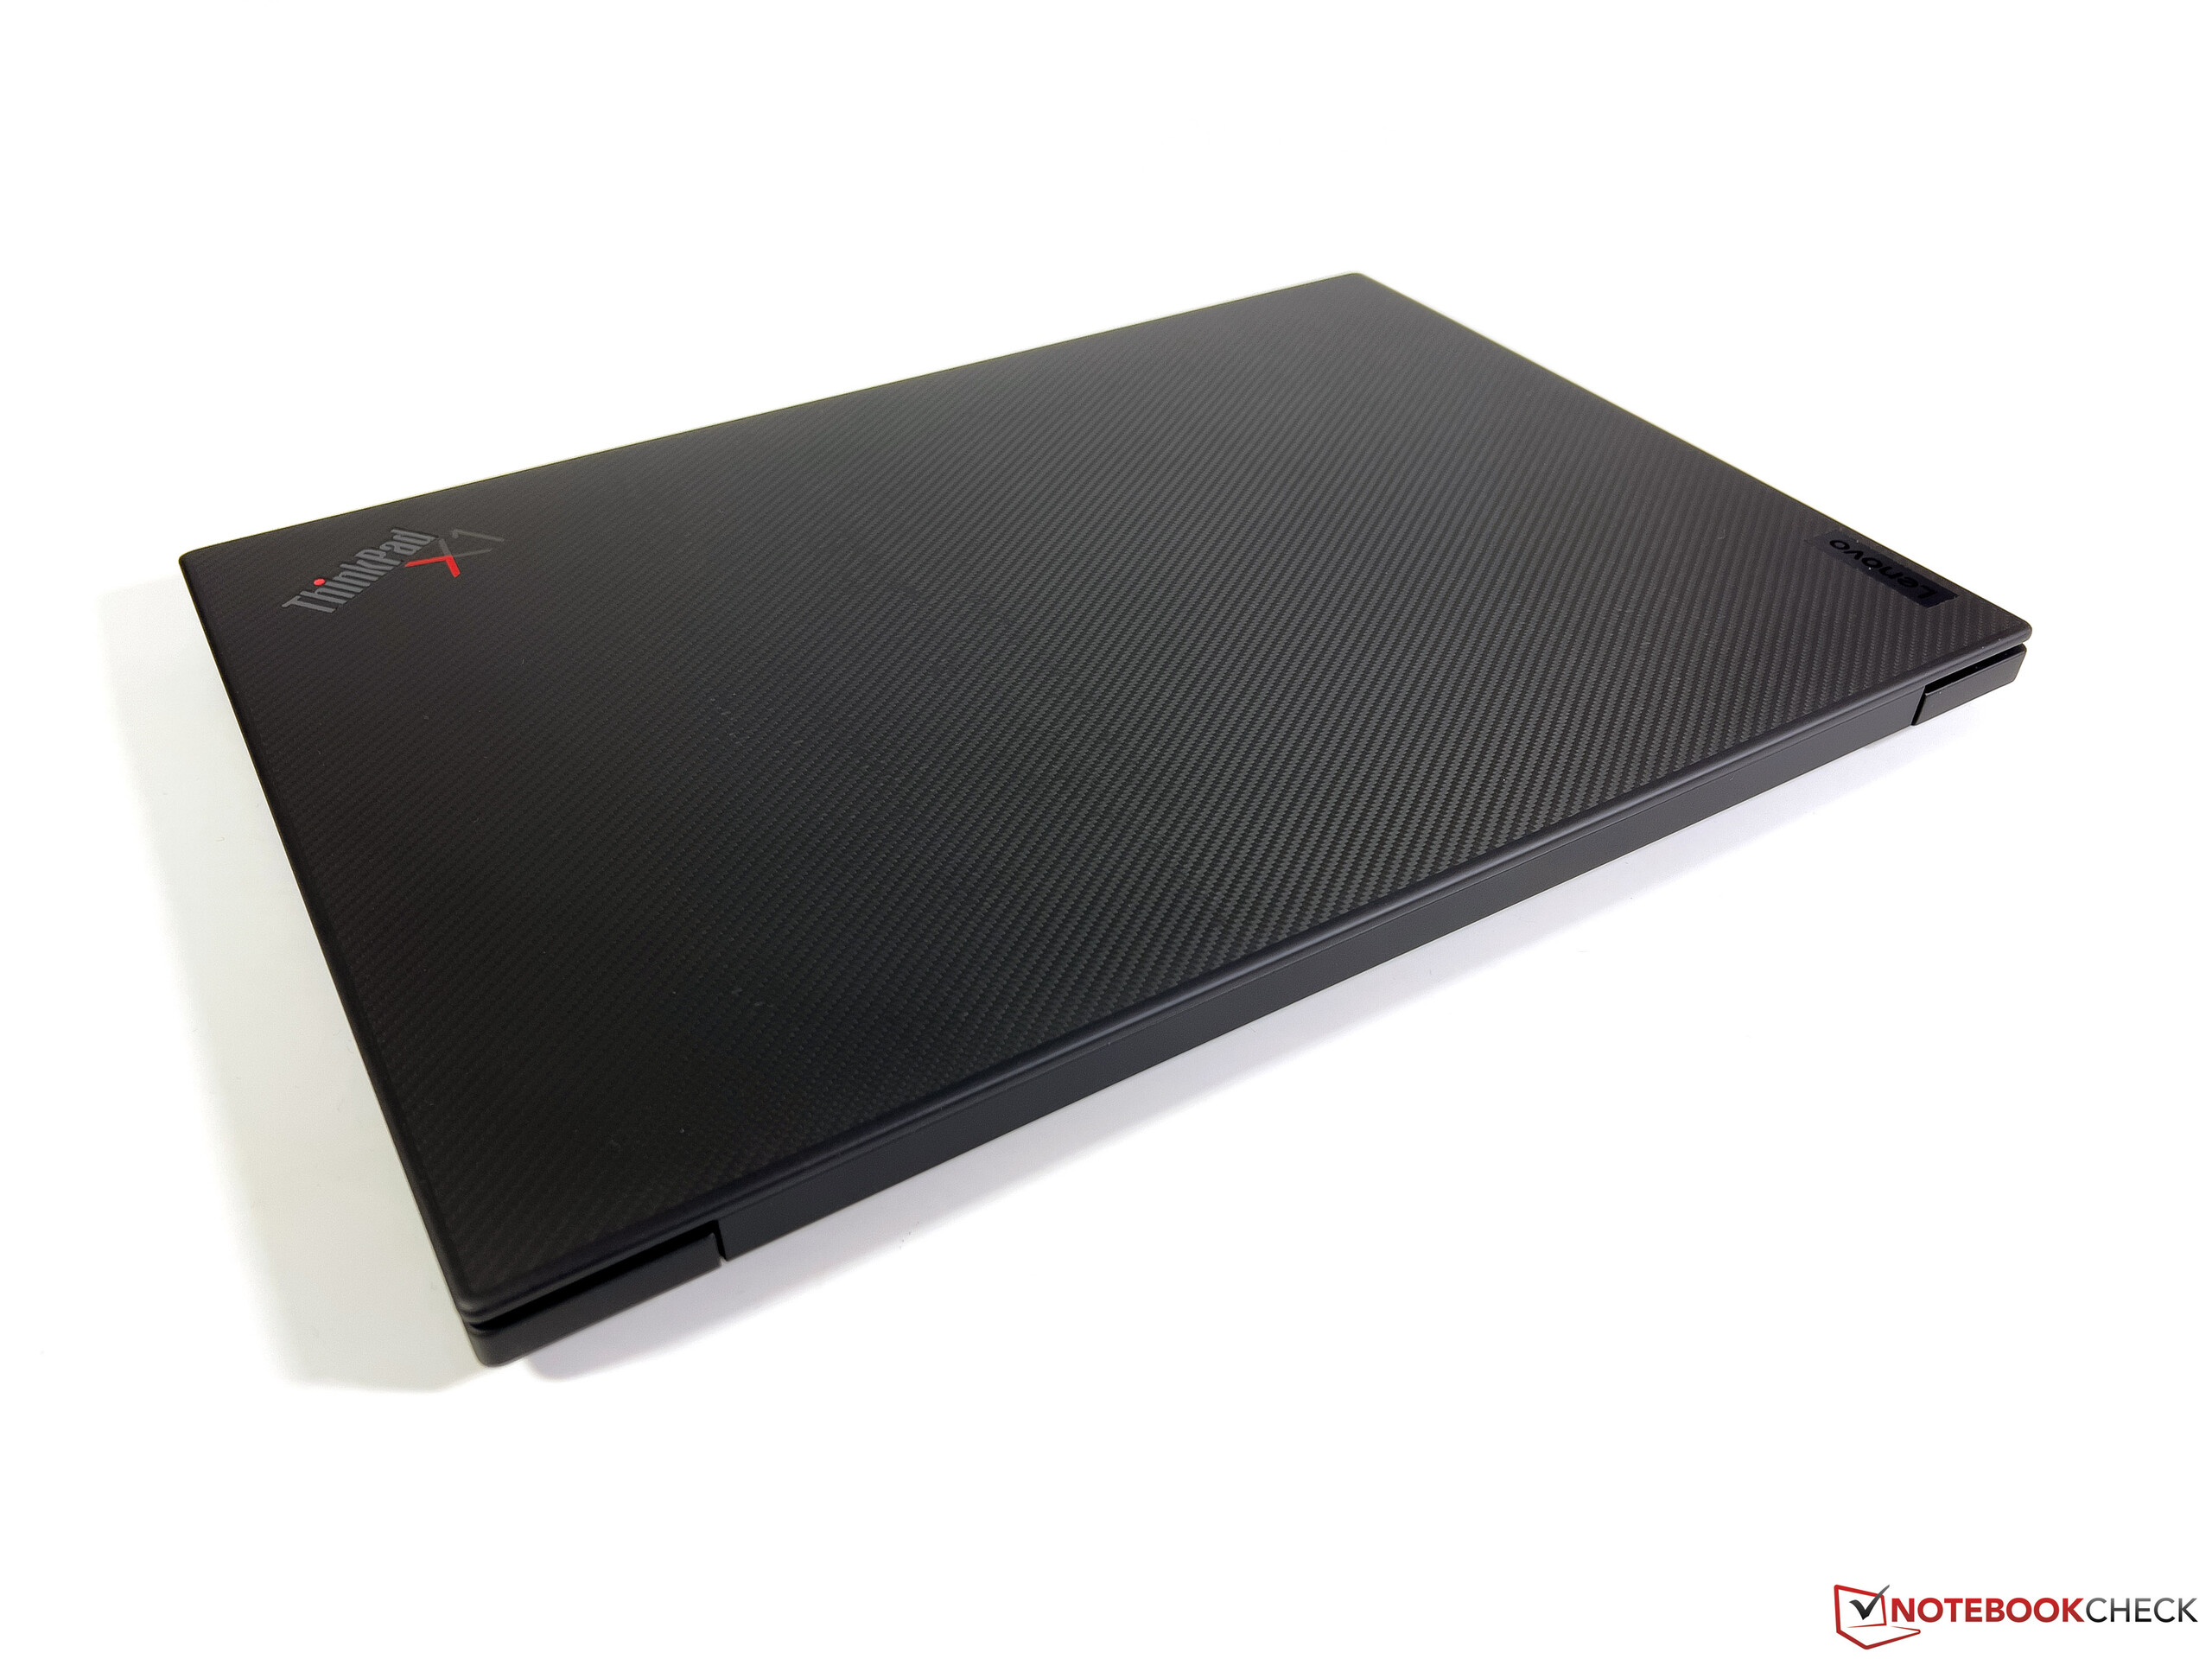
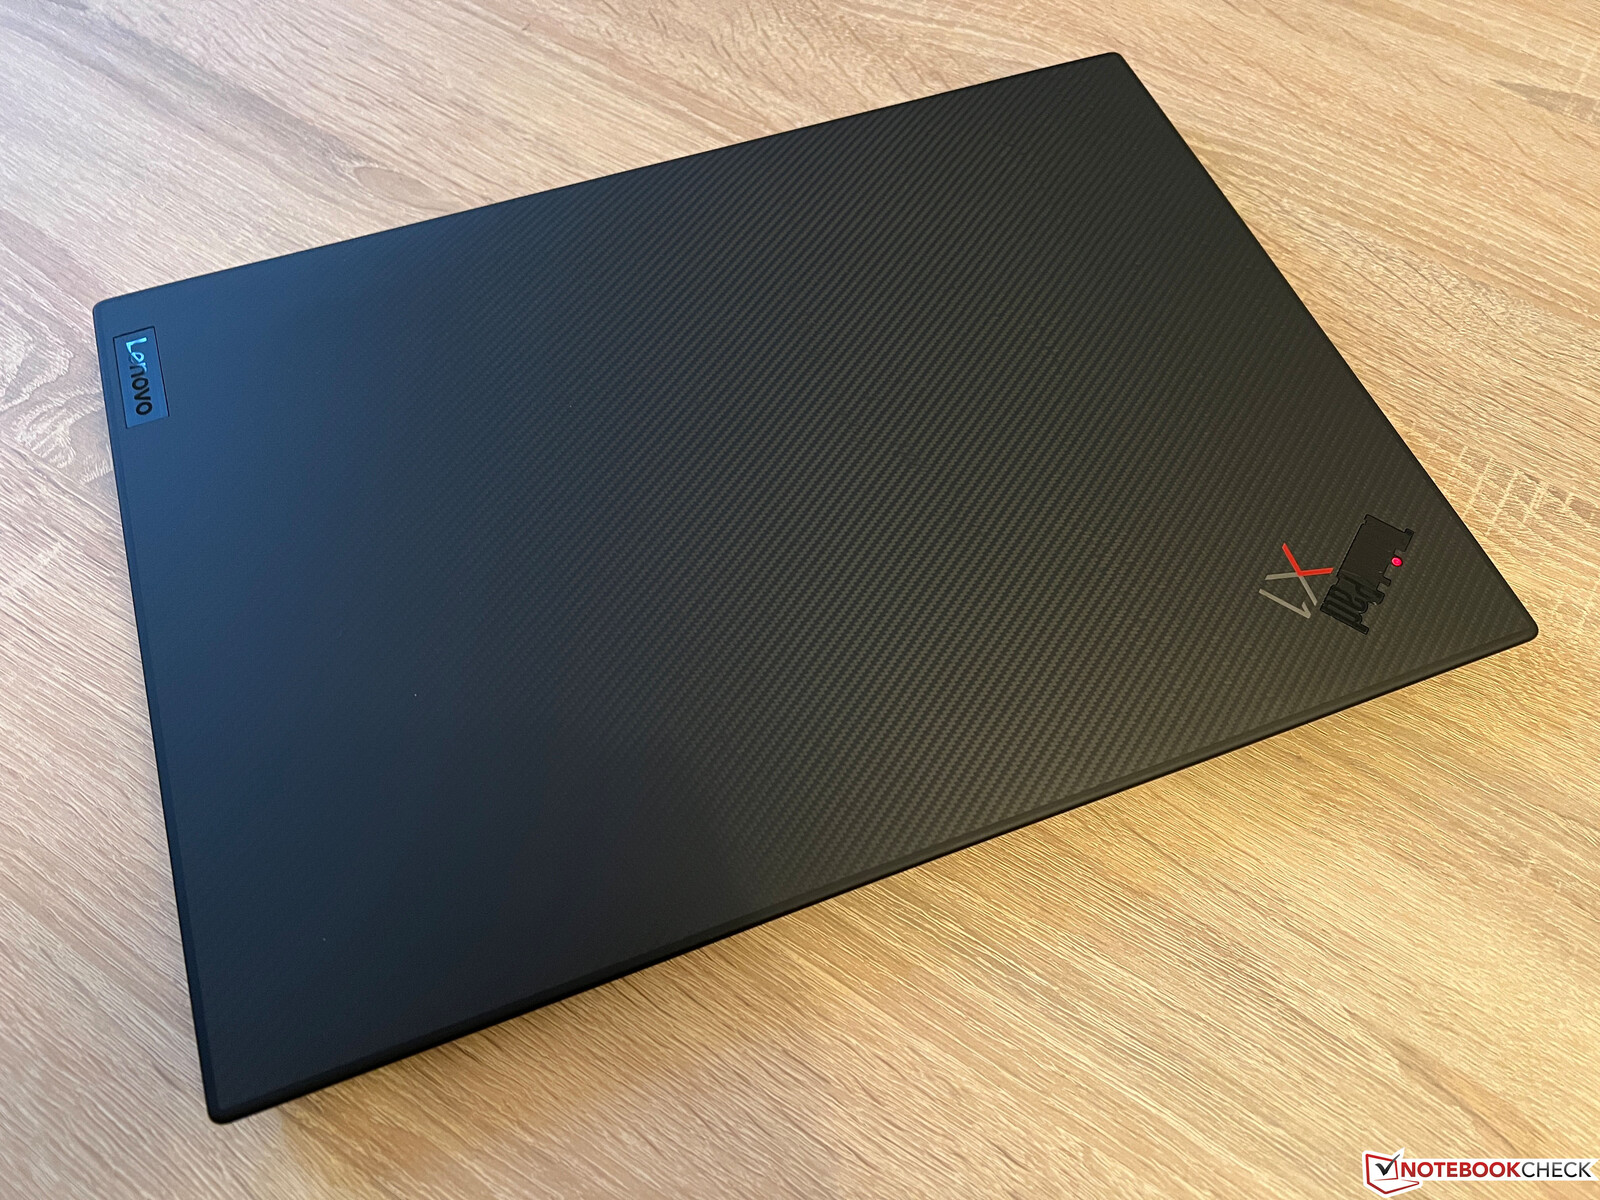
Carcasa - Lenovo apuesta por la fibra de carbono y el magnesio
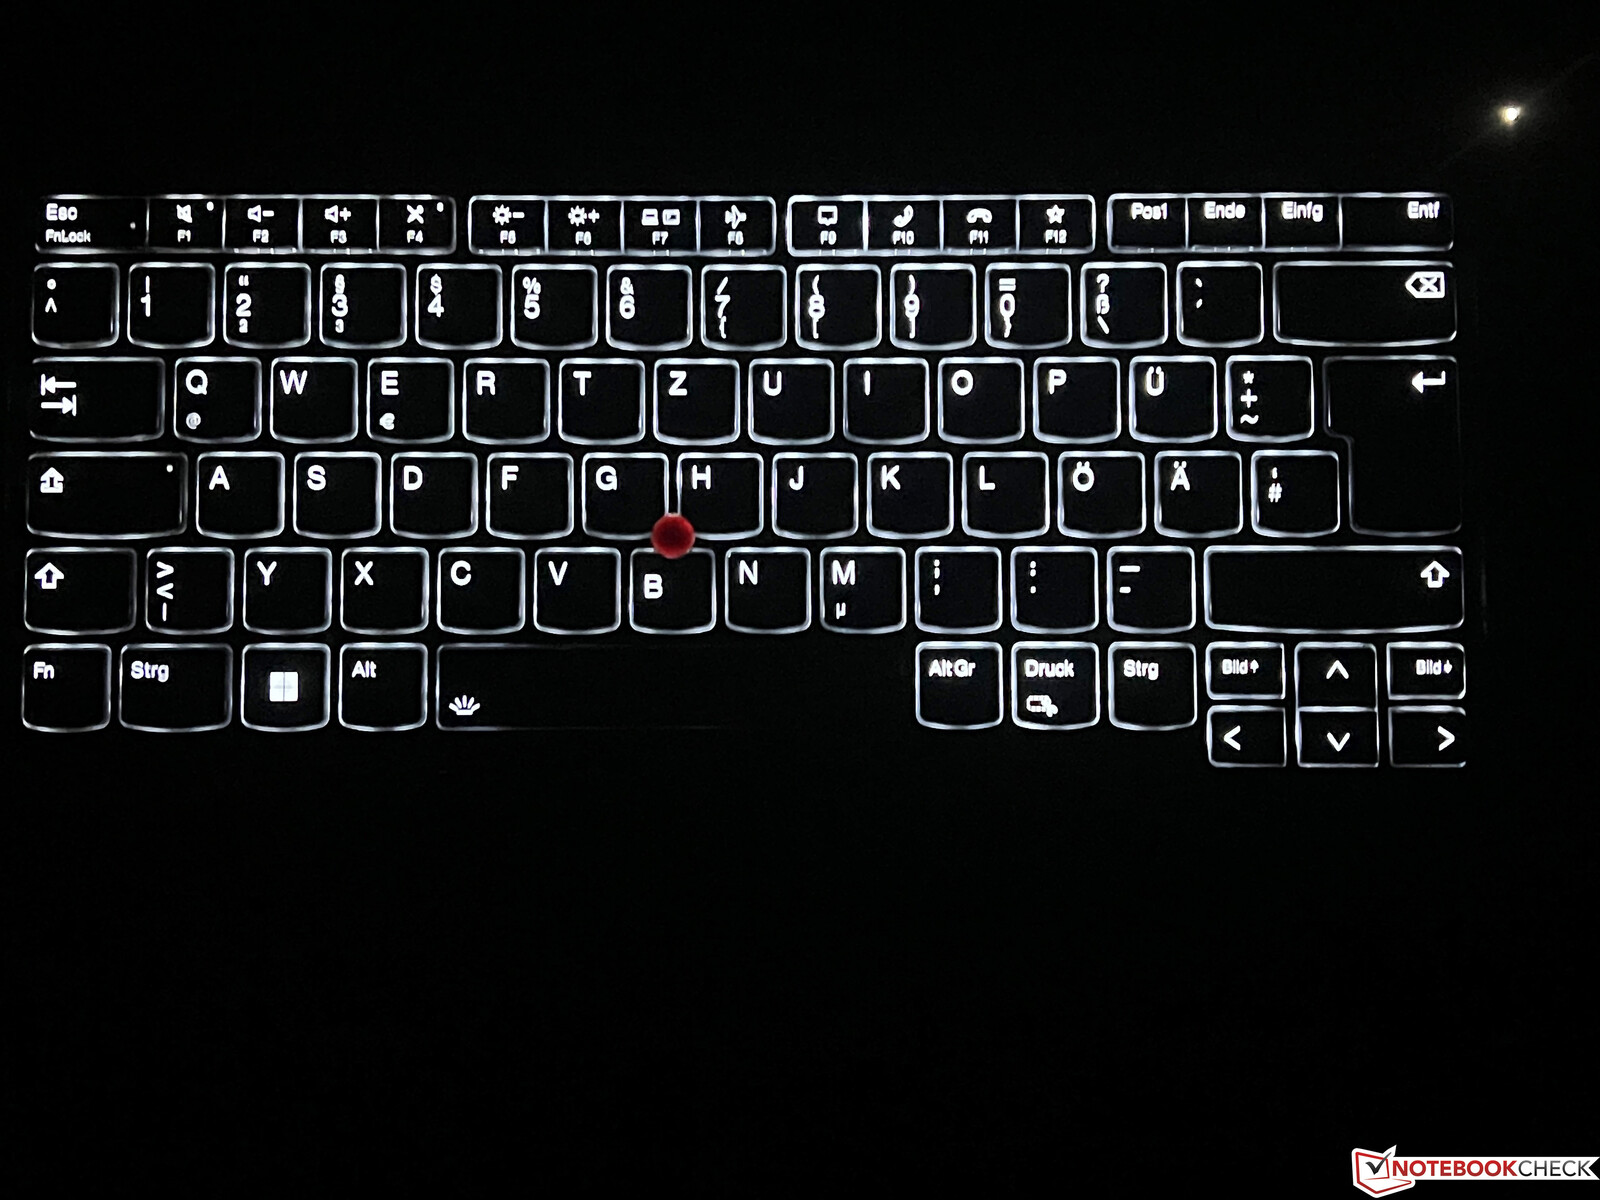
Tras el importante rediseño del año pasado, la carcasa del X1 Extreme G5 permanece inalterada con una mezcla continuada de fibra de carbono y magnesio. Además, la tapa del modelo 4K tiene aspecto de fibra de carbono, aunque es sólo una impresión. Por lo demás, el ThinkPad negro parece muy reservado con los acentos de color centrados en el logo así como el TrackPoint rojo en el centro del teclado
Tanto la unidad base como la tapa de la pantalla son muy estables, lo que significa que la flexión del teclado sólo es posible aplicando mucha presión en la zona central. Las bisagras de la pantalla también están maravillosamente calibradas, ya que la tapa de la pantalla se puede abrir fácilmente con una mano, evitando así casi por completo cualquier movimiento de balanceo. El ángulo máximo de apertura es de 180 grados.
Con sólo 2.1 kg de peso, nuestro modelo de pruebas se sitúa en el medio del pelotón comparado con sus competidores, por lo que los modelos XPS de 15 y 17 pulgadas no deberían incluirse en la comparación. En la categoría de 16 pulgadas, sólo elSchenker Vision 16 Proes mucho más ligero y el X1 Extreme también es el que ocupa más espacio. En marcha, hay que añadir otros 880 gramos por la fuente de alimentación.
Conectividad - X1 Extreme G5 con TB4 y Wi-Fi 6E
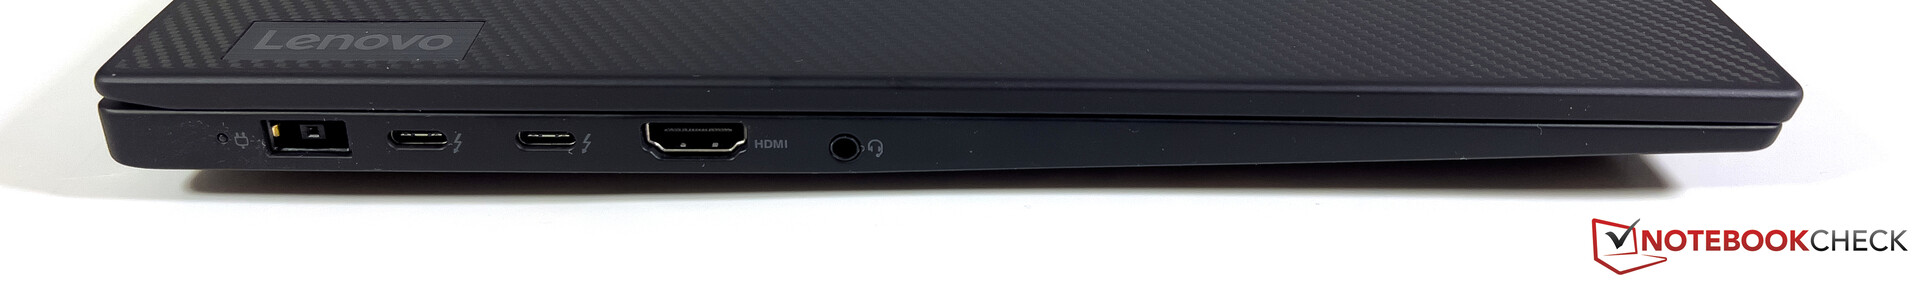
En términos de conectividad, no hay cambios respecto al predecesor en ninguno de los lados del dispositivo. Además de Thunderbolt 4 por USB-C, también hay puertos USB-A normales. Sobre la marcha, el X1 Extreme G5 se puede cargar por USB-C, aunque, como mínimo, con una fuente de alimentación de 90 vatios. Se pueden conectar un total de cuatro pantallas (1x interna + 3x externa).
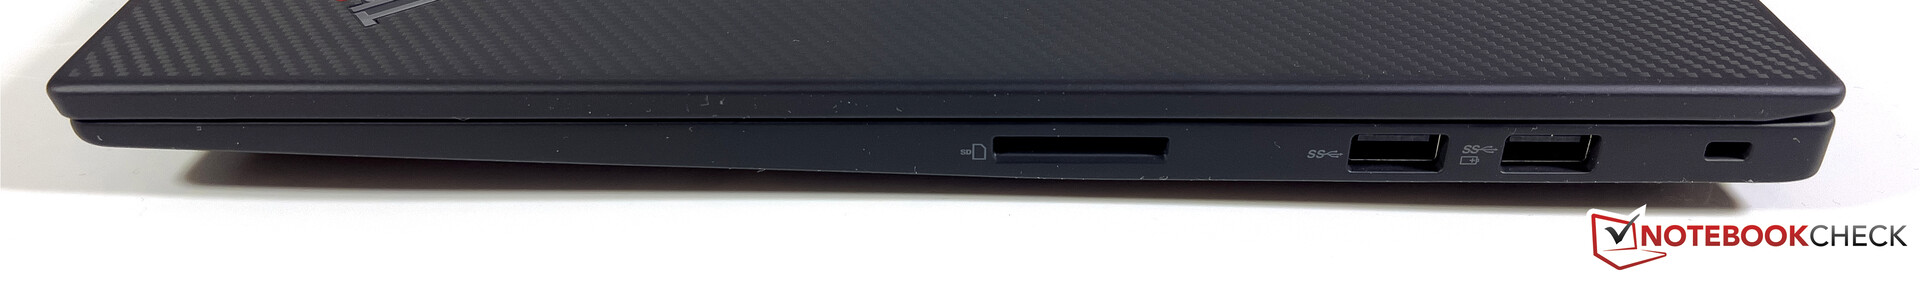
Lector de tarjetas SD
En el lado derecho del dispositivo, el lector de tarjetas SD sigue aceptando tarjetas SD de tamaño normal, pero a una velocidad reducida en comparación con la de su predecesor. Tanto con nuestra tarjeta de referencia actual (Angelbird AV Pro V60) como con la anterior, sólo es posible alcanzar los 80 MB/s. LaX1 Extreme G4pudo superar los 170 MB/s.
| SD Card Reader | |
| average JPG Copy Test (av. of 3 runs) | |
| Dell XPS 17 9720 RTX 3060 (Toshiba Exceria Pro SDXC 64 GB UHS-II) | |
| Lenovo ThinkPad X1 Extreme G4-20Y5CTO1WW (3050 Ti) (AV Pro V60) | |
| Dell XPS 15 9520 RTX 3050 Ti (Toshiba Exceria Pro SDXC 64 GB UHS-II) | |
| Media de la clase Multimedia (23 - 531, n=37, últimos 2 años) | |
| Apple MacBook Pro 16 2021 M1 Pro (Angelbird AV Pro V60) | |
| Schenker Vision 16 Pro RTX 3070 Ti (AV Pro V60) | |
| Lenovo ThinkPad X1 Extreme G5-21DE003RGE (AV Pro V60) | |
| HP Envy 16 h0112nr (AV Pro SD microSD 128 GB V60) | |
| maximum AS SSD Seq Read Test (1GB) | |
| Dell XPS 17 9720 RTX 3060 (Toshiba Exceria Pro SDXC 64 GB UHS-II) | |
| Media de la clase Multimedia (37.3 - 1455, n=36, últimos 2 años) | |
| Dell XPS 15 9520 RTX 3050 Ti (Toshiba Exceria Pro SDXC 64 GB UHS-II) | |
| Lenovo ThinkPad X1 Extreme G4-20Y5CTO1WW (3050 Ti) (AV Pro V60) | |
| HP Envy 16 h0112nr (AV Pro SD microSD 128 GB V60) | |
| Schenker Vision 16 Pro RTX 3070 Ti (AV Pro V60) | |
| Lenovo ThinkPad X1 Extreme G5-21DE003RGE (AV Pro V60) | |
Comunicación
Lenovo ha equipado el X1 Extreme G5 con el módulo AX211 de Intel que soporta el estándar Wi-Fi-6E actual. Windows 11 es necesario para poder conectarse a redes de 6 GHz. Tras la actualización, pudimos conectarnos a la red de 6 GHz de nuestro router de referencia Asus. Las tasas de transferencia son muy altas y estables y también es compatible con Bluetooth 5.2. Las redes cableadas sólo pueden usarse con un adaptador apropiado vía Thunderbolt/USB-C.
El menos potente X1 Extreme G5 con la RTX 3050 Ti y refrigeración convencional es opcional y también está disponible con 5G, pero con el sobreprecio añadido en el configurador que asciende a la friolera de 330 dólares estadounidenses. Además, las antenas correspondientes no están preparadas y tampoco hay ranura Nano SIM mientras no se configure WWAN de fábrica.
| Networking | |
| Lenovo ThinkPad X1 Extreme G5-21DE003RGE | |
| iperf3 receive AXE11000 6GHz | |
| iperf3 transmit AXE11000 6GHz | |
| HP Envy 16 h0112nr | |
| iperf3 receive AXE11000 6GHz | |
| iperf3 transmit AXE11000 6GHz | |
| Schenker Vision 16 Pro RTX 3070 Ti | |
| iperf3 receive AXE11000 | |
| iperf3 transmit AXE11000 | |
| Dell XPS 15 9520 RTX 3050 Ti | |
| iperf3 receive AXE11000 | |
| iperf3 transmit AXE11000 | |
| Apple MacBook Pro 16 2021 M1 Pro | |
| iperf3 transmit AX12 | |
| iperf3 receive AX12 | |
| iperf3 receive AXE11000 | |
| iperf3 transmit AXE11000 | |
| Dell XPS 17 9720 RTX 3060 | |
| iperf3 receive AXE11000 | |
| iperf3 transmit AXE11000 | |
Cámara web
Nada ha cambiado respecto a la webcam 1080p y su obturador mecánico de privacidad. La calidad es ligeramente mejor que la de los antiguos módulos de 720p, pero sin llegar a convencer, ni siquiera en condiciones de luz favorables. Un módulo IR adicional está a mano para el reconocimiento facial.


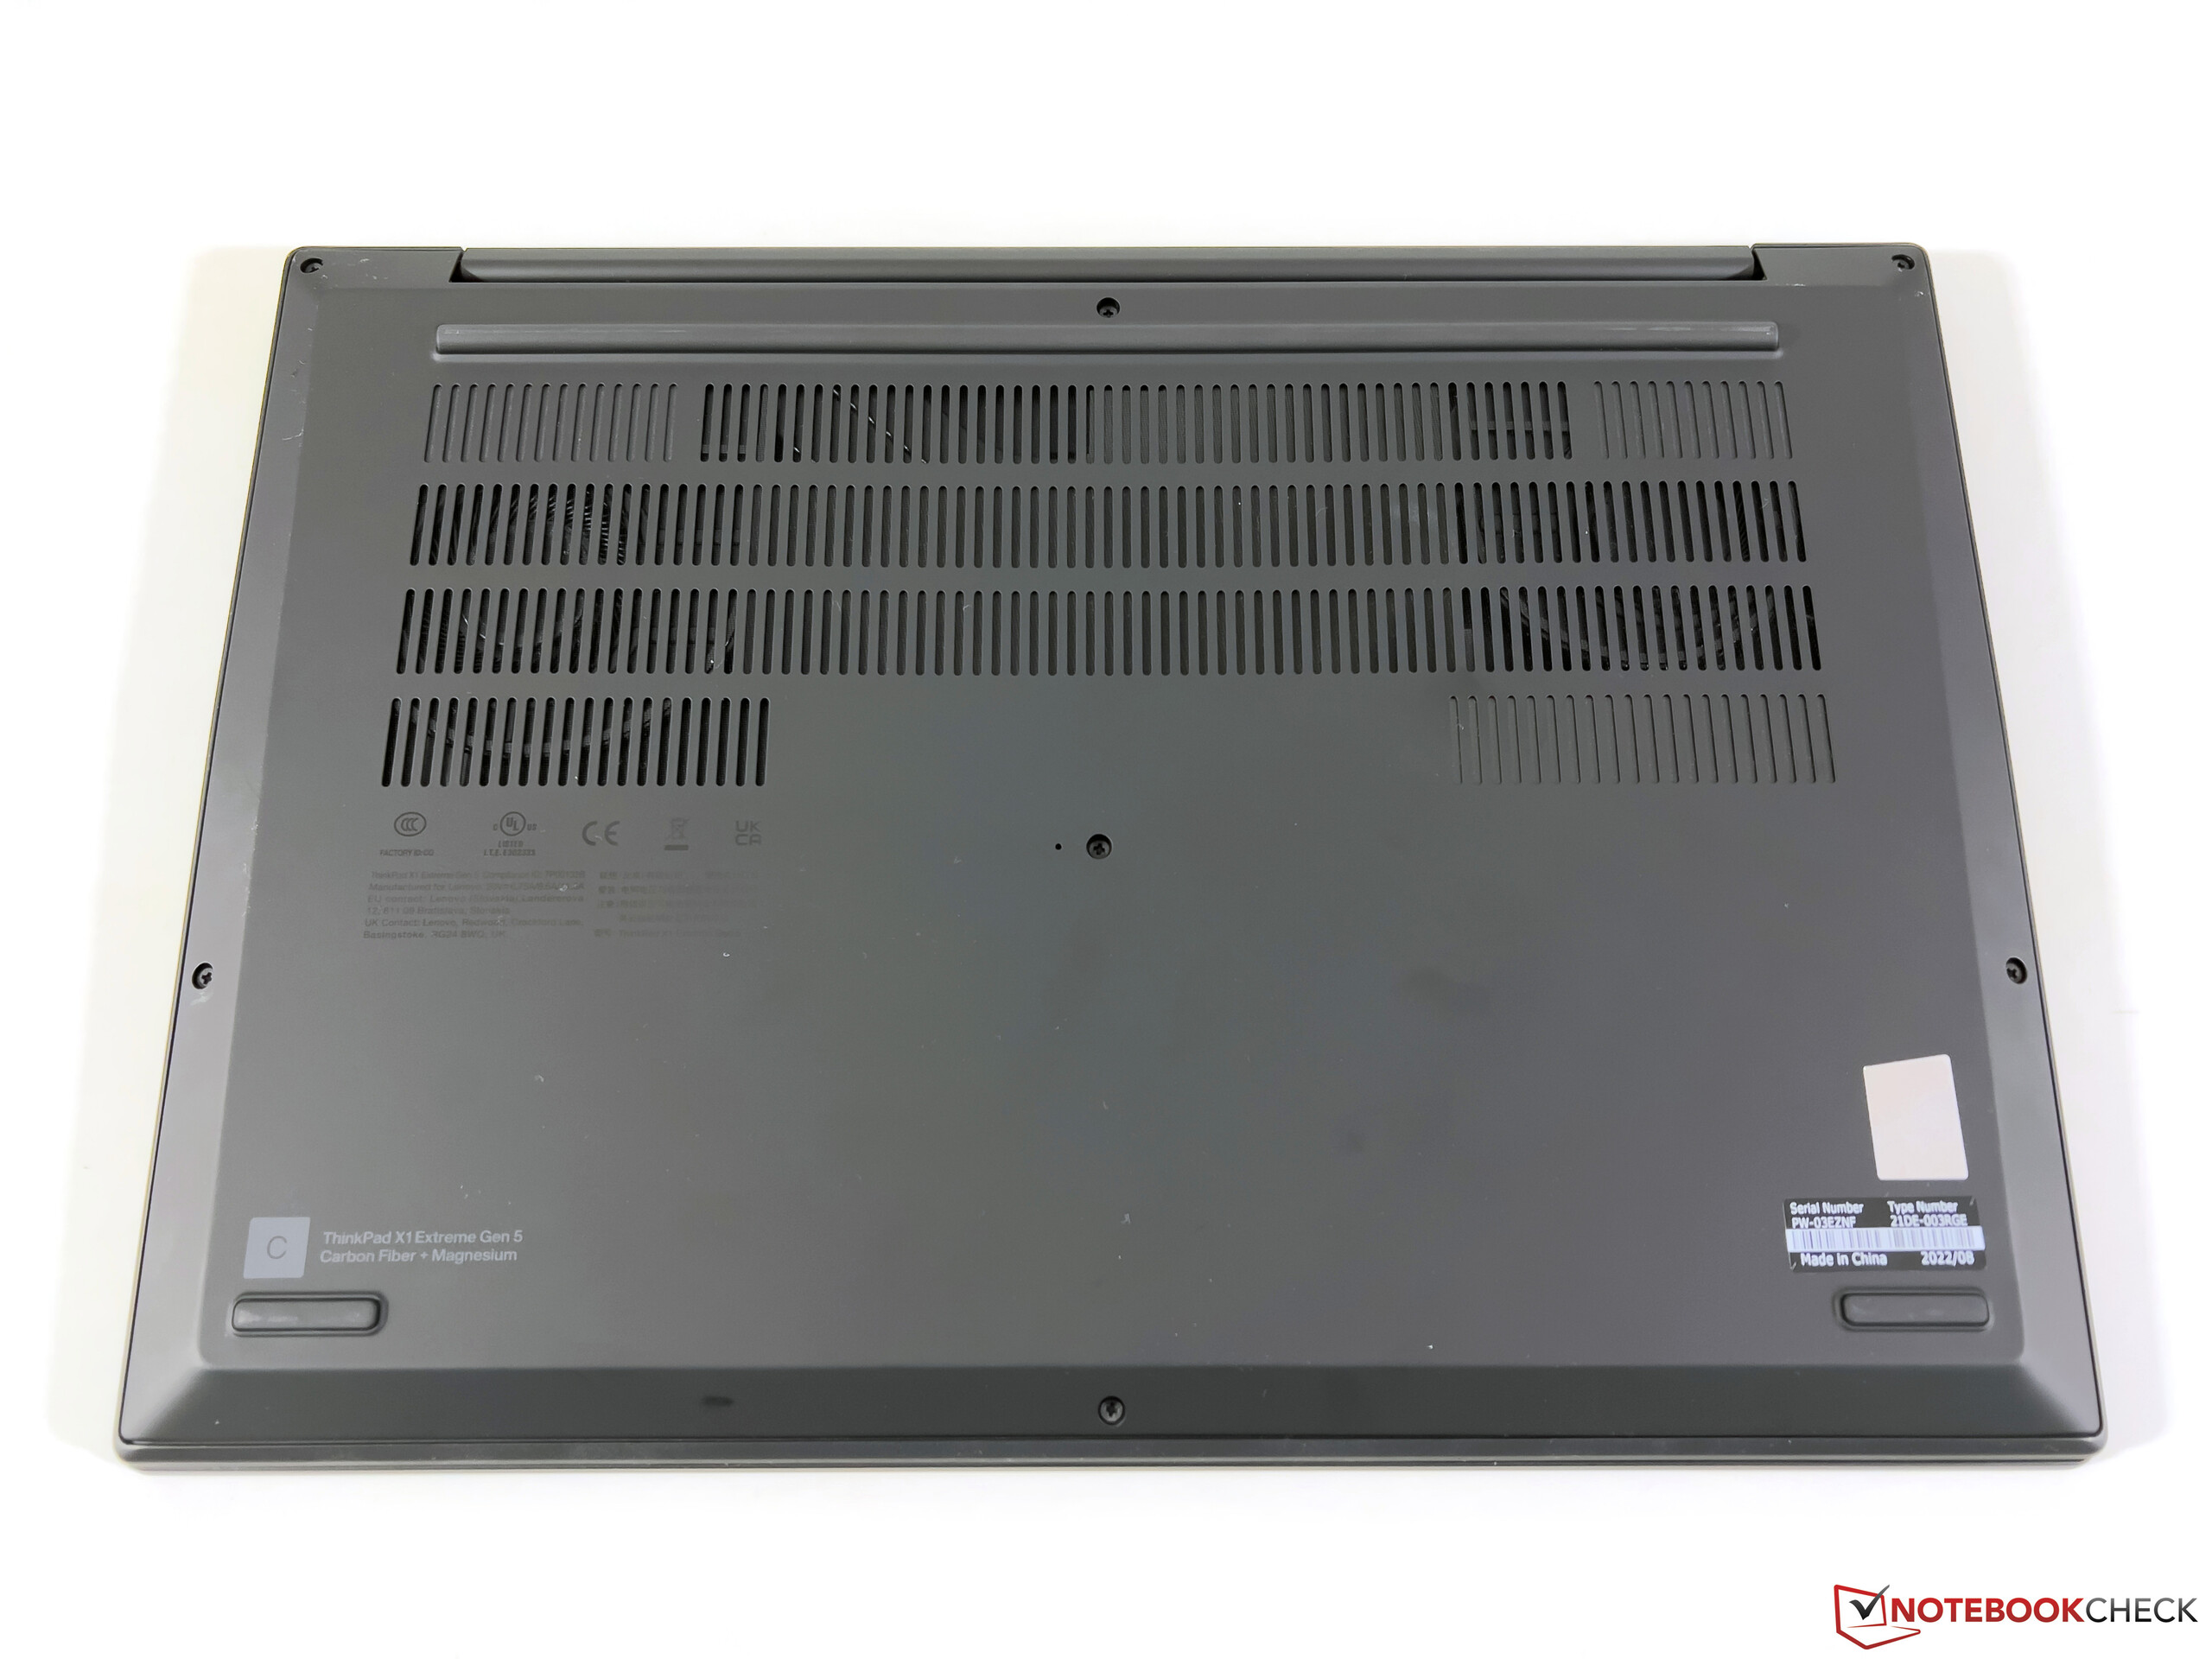
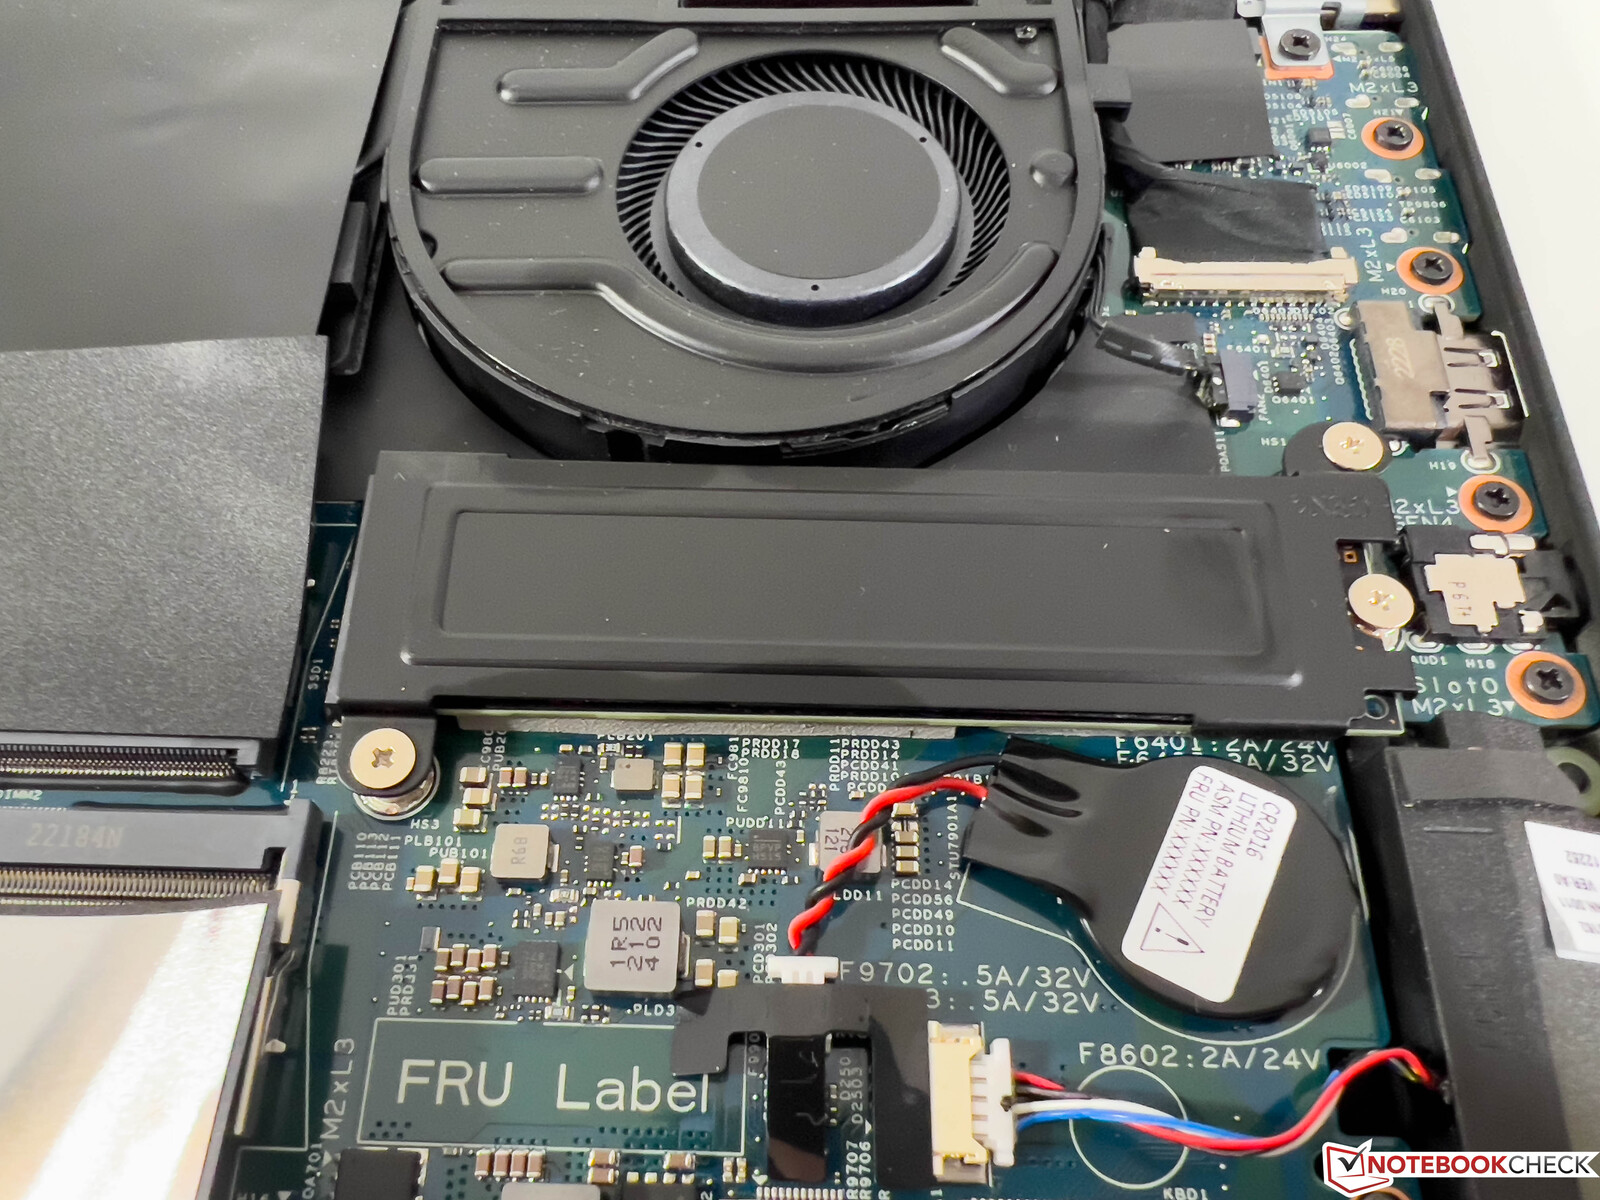
Mantenimiento
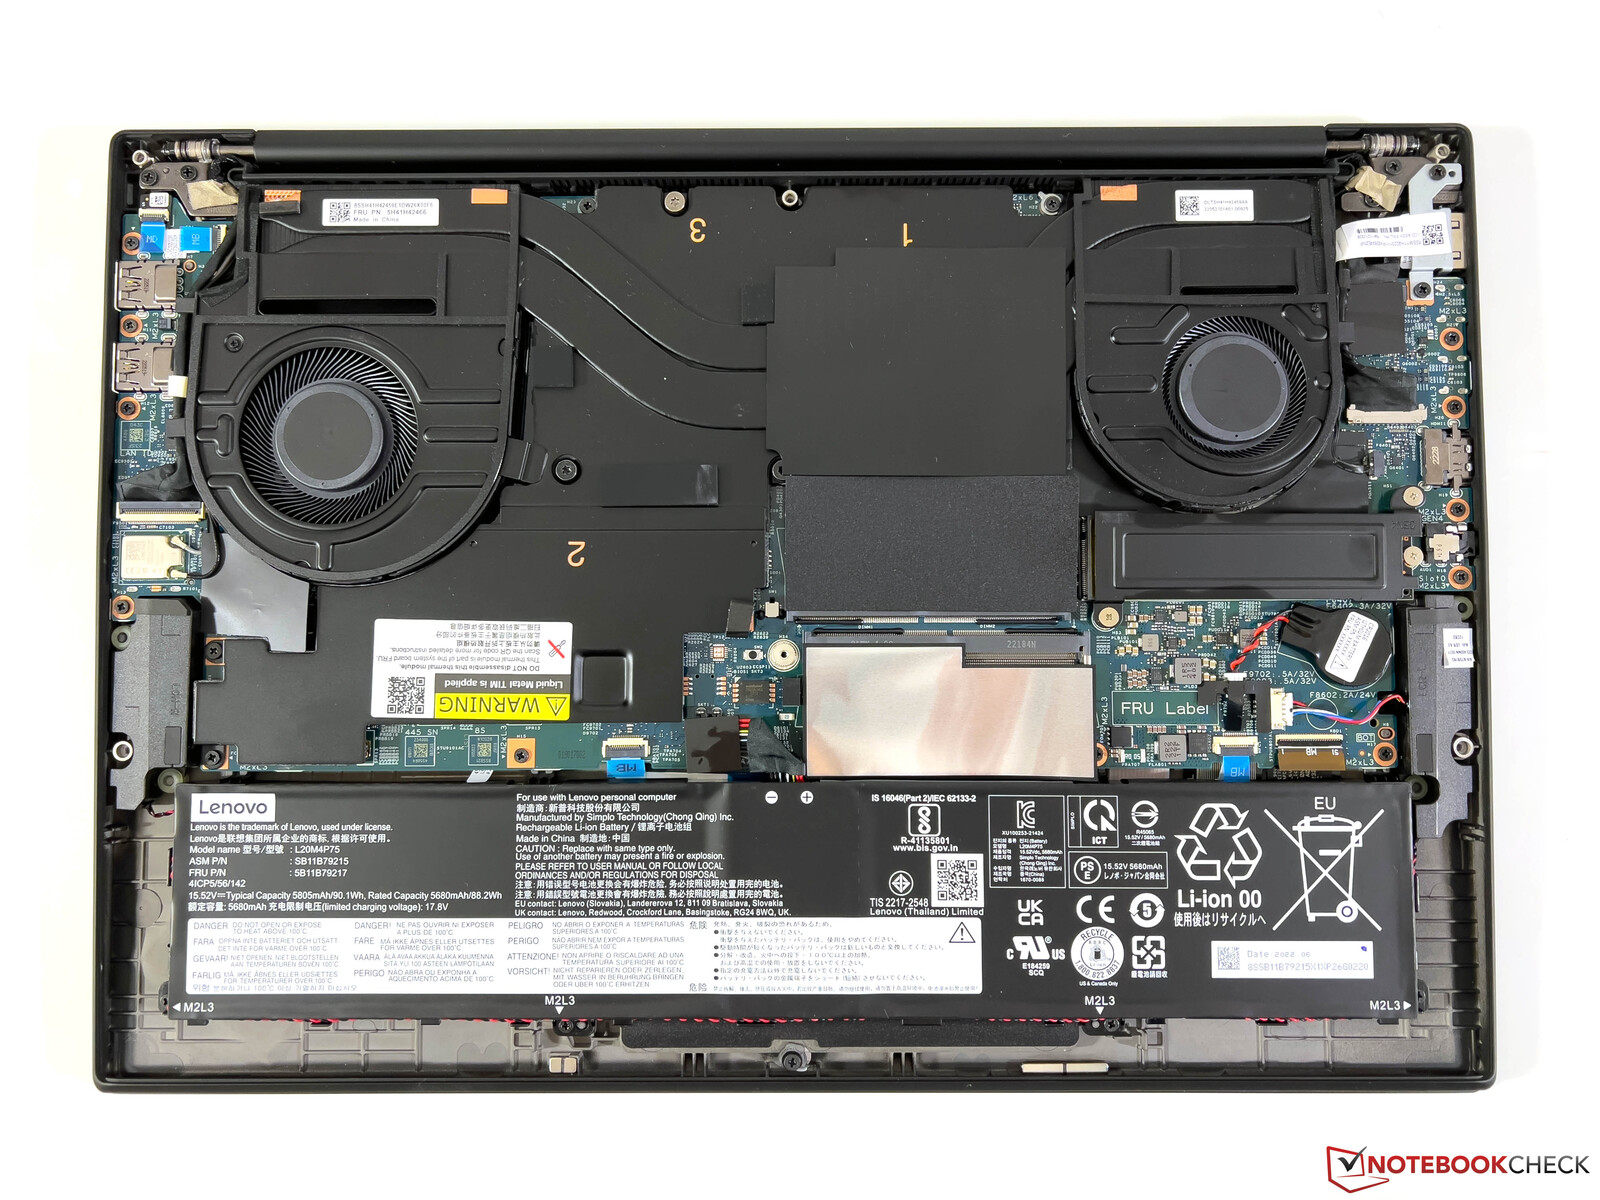
La cubierta de la base sólo está asegurada con seis tornillos normales en cruz (cuidado: sólo aflojar y no desenroscar completamente) y se puede quitar muy fácilmente. Dentro tienes acceso a los dos ventiladores, el SSD M.2 2280 y ambas ranuras RAM.
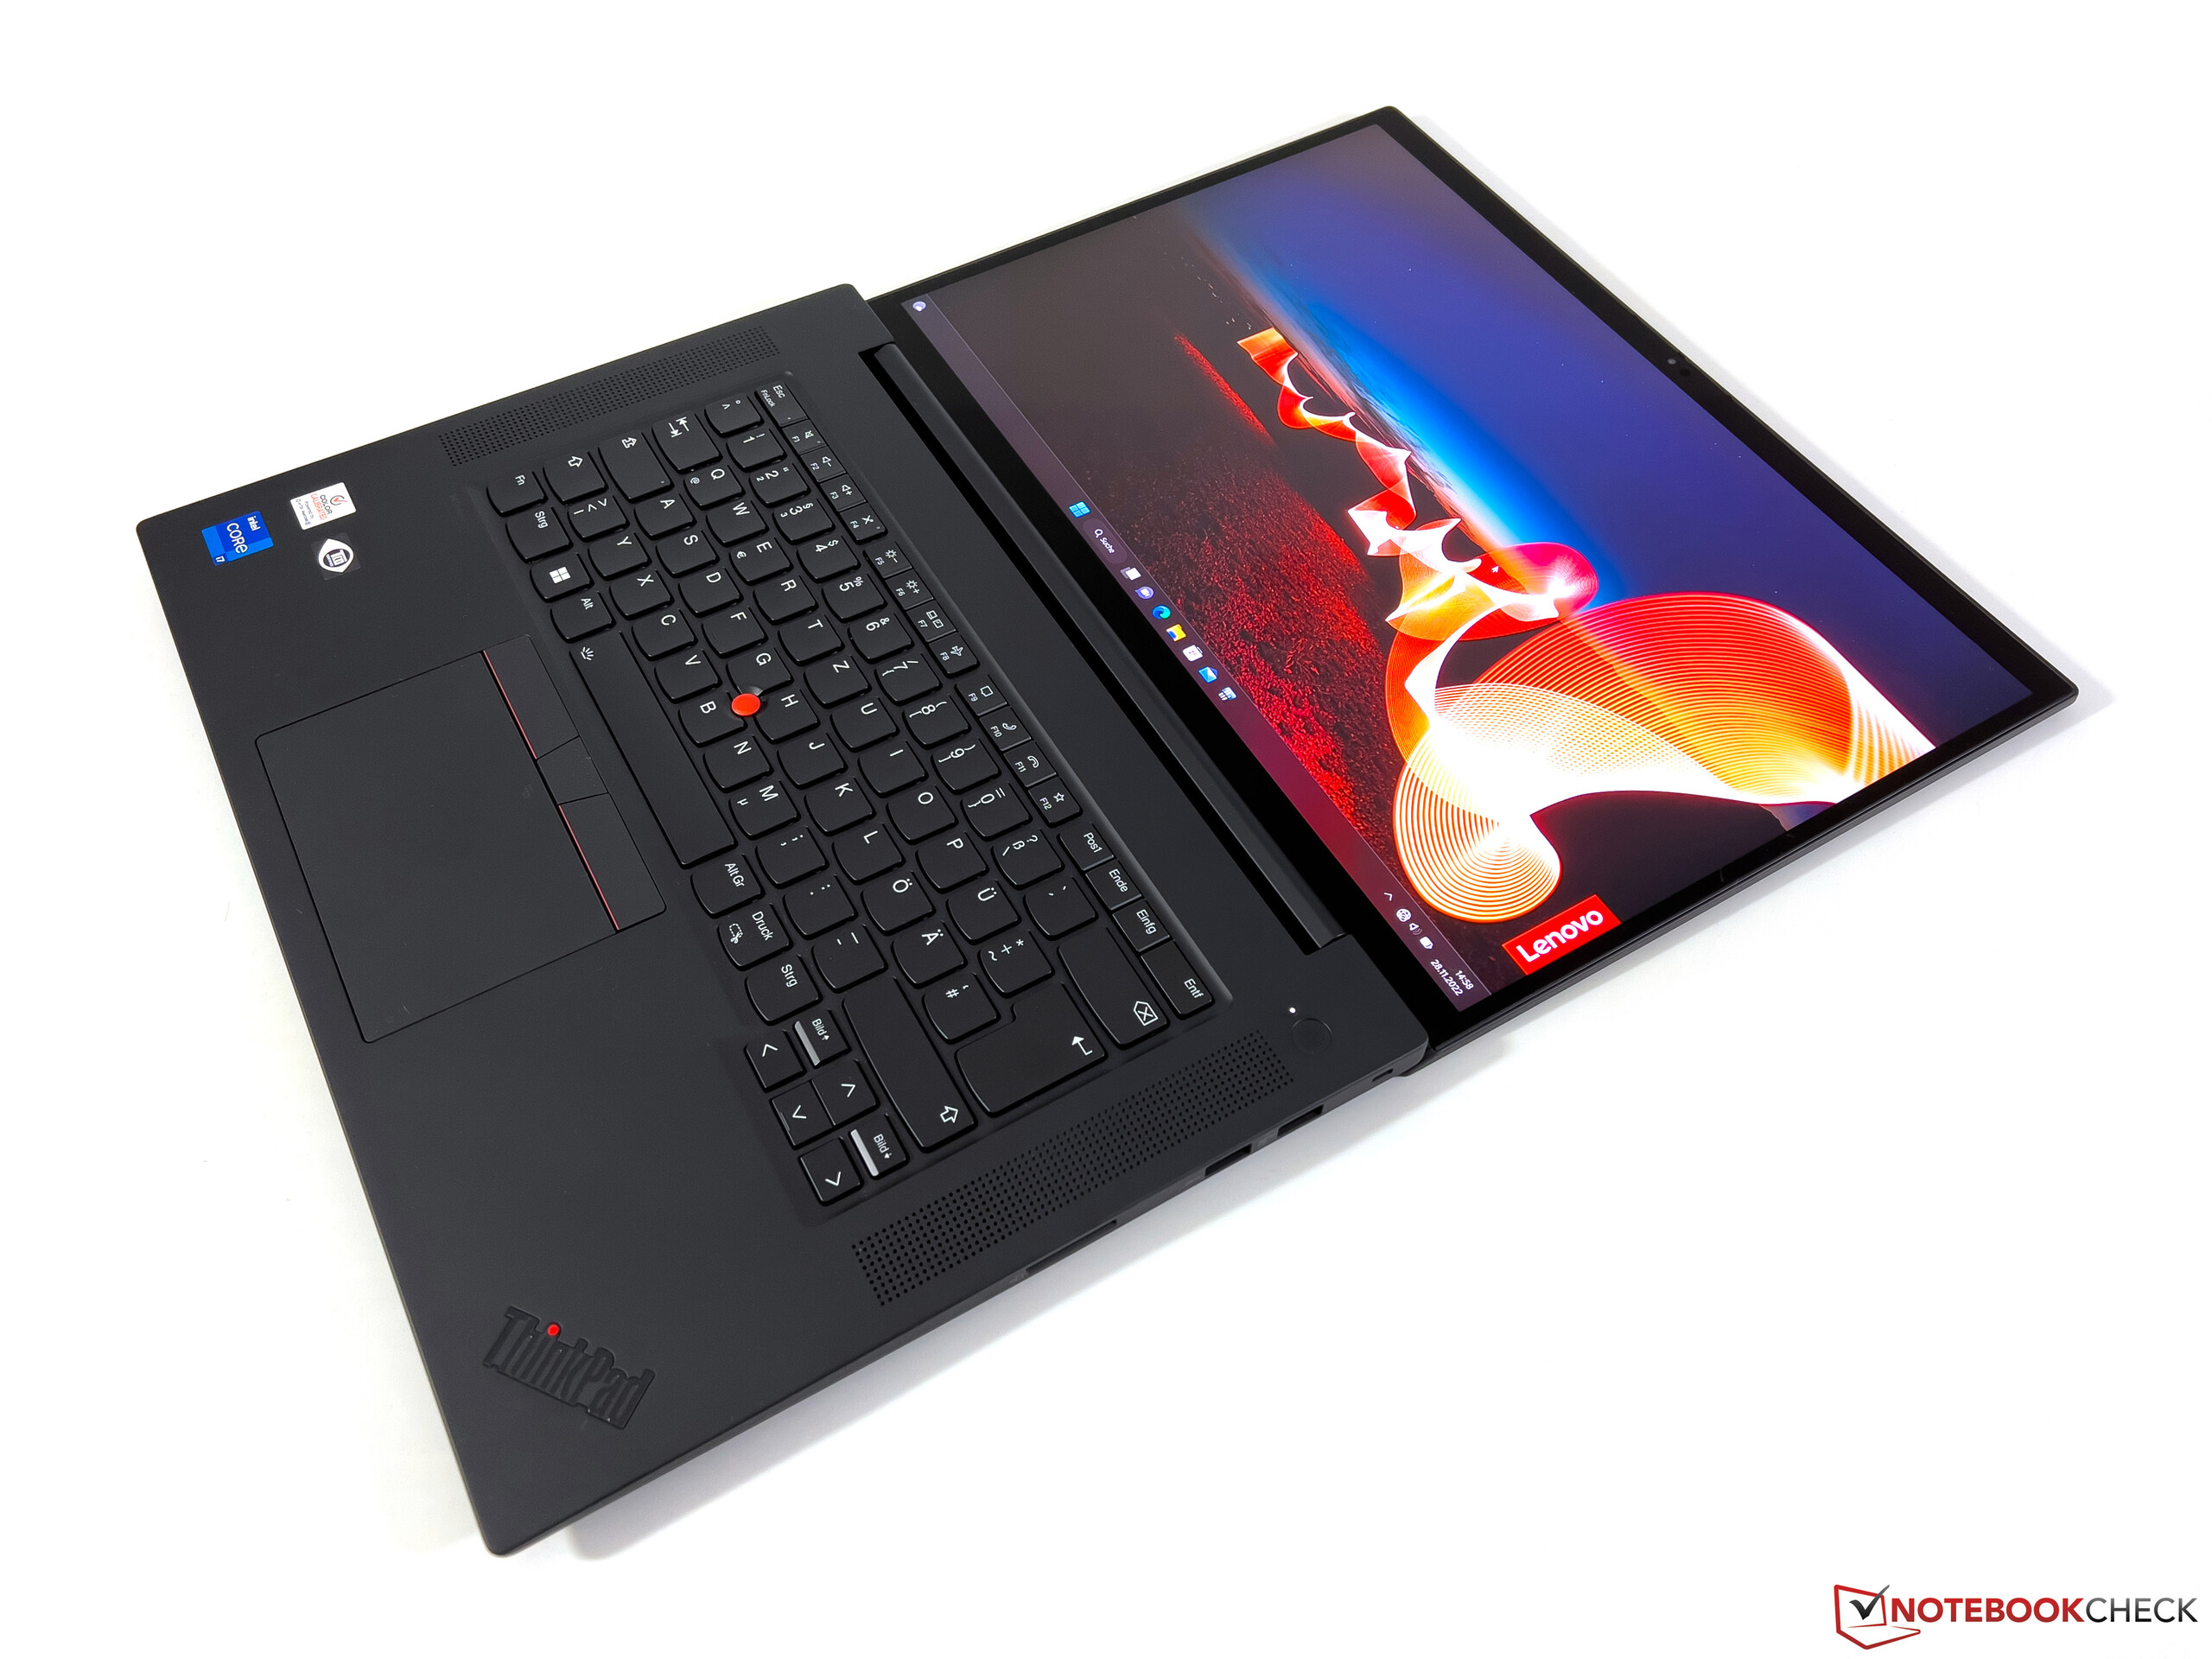
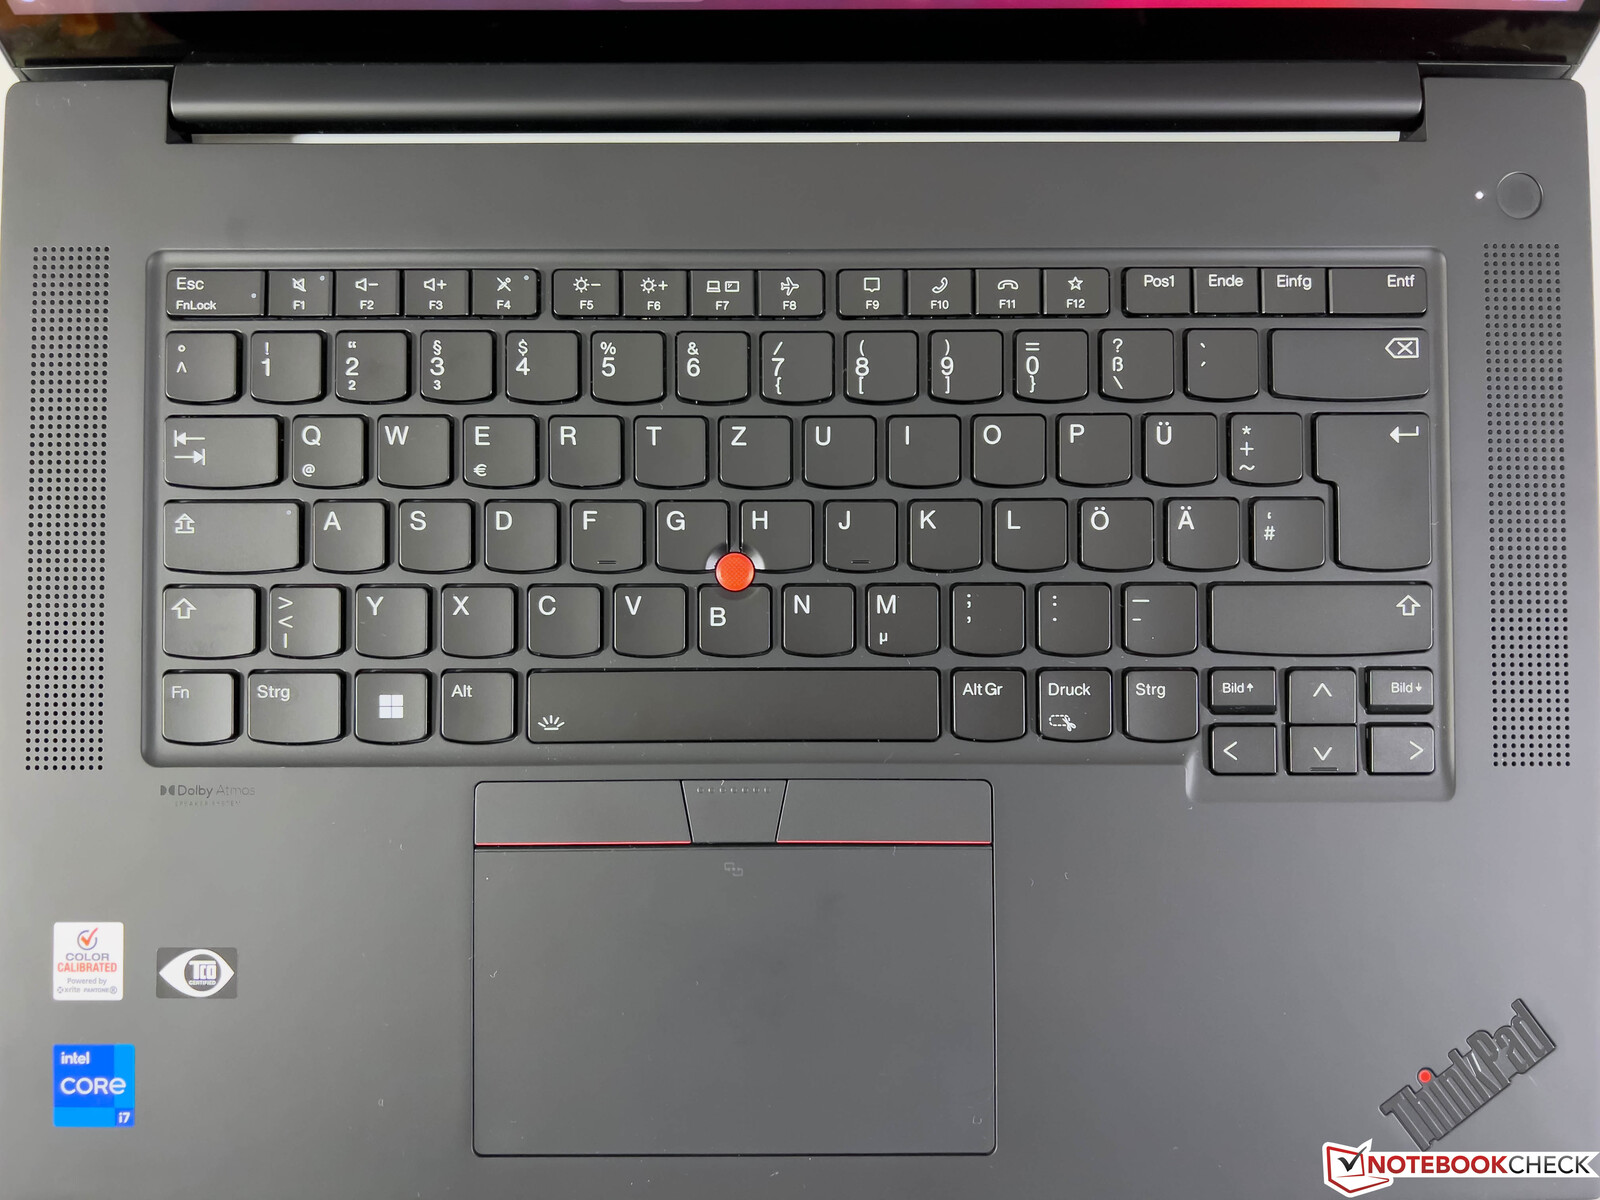
Dispositivos de entrada: ThinkPad insignia con desplazamiento de tecla de 1,5 mm
Con el X1 Extreme G4 del año pasado, Lenovo cambió a un teclado con un recorrido de tecla más corto y con ello empeoró notablemente la calidad en comparación con los modelos antiguos (1,8 mm de recorrido). El teclado actual no está mal, pero nos deja sin entender por qué Lenovo eligió acortar el desplazamiento de tecla con un dispositivo tan grande como el X1 Extreme G5. La única ventaja del teclado ThinkPad ha desaparecido. Como es habitual, el teclado tiene una retroiluminación blanca de dos niveles y el lector de huellas está integrado en el botón de encendido a la derecha sobre el teclado
El trackpad es muy suave al tacto y ofrece una buena mecánica, con sonidos de clic silenciosos y de alta calidad. Además, hay un TrackPoint con teclas dedicadas que se pueden utilizar para controlar el puntero. Las teclas planas ofrecen una respuesta buena y silenciosa con un control intuitivo. Además, hay disponible una pantalla táctil capacitiva que también admite la entrada de lápiz óptico (compatible con los lápices opcionales Lenovo Active Pen 2 y Lenovo Pen Pro).
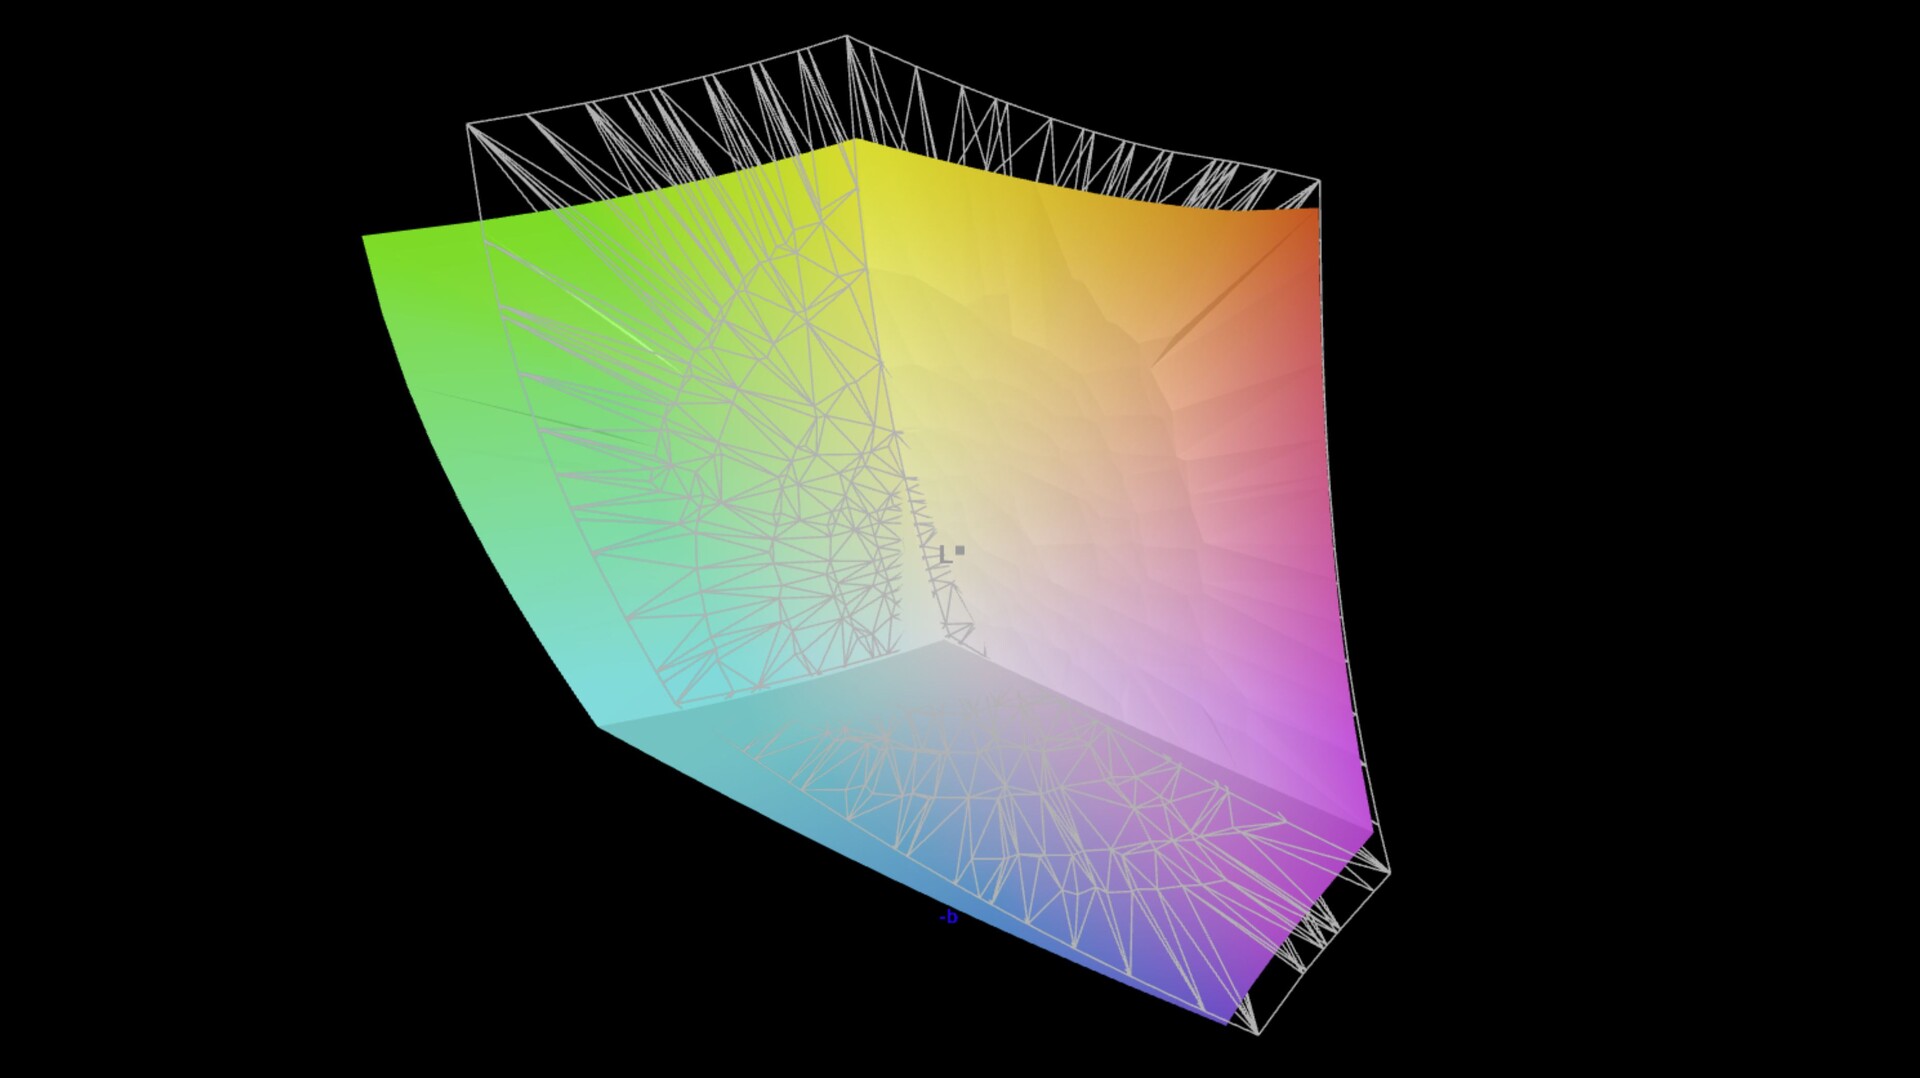
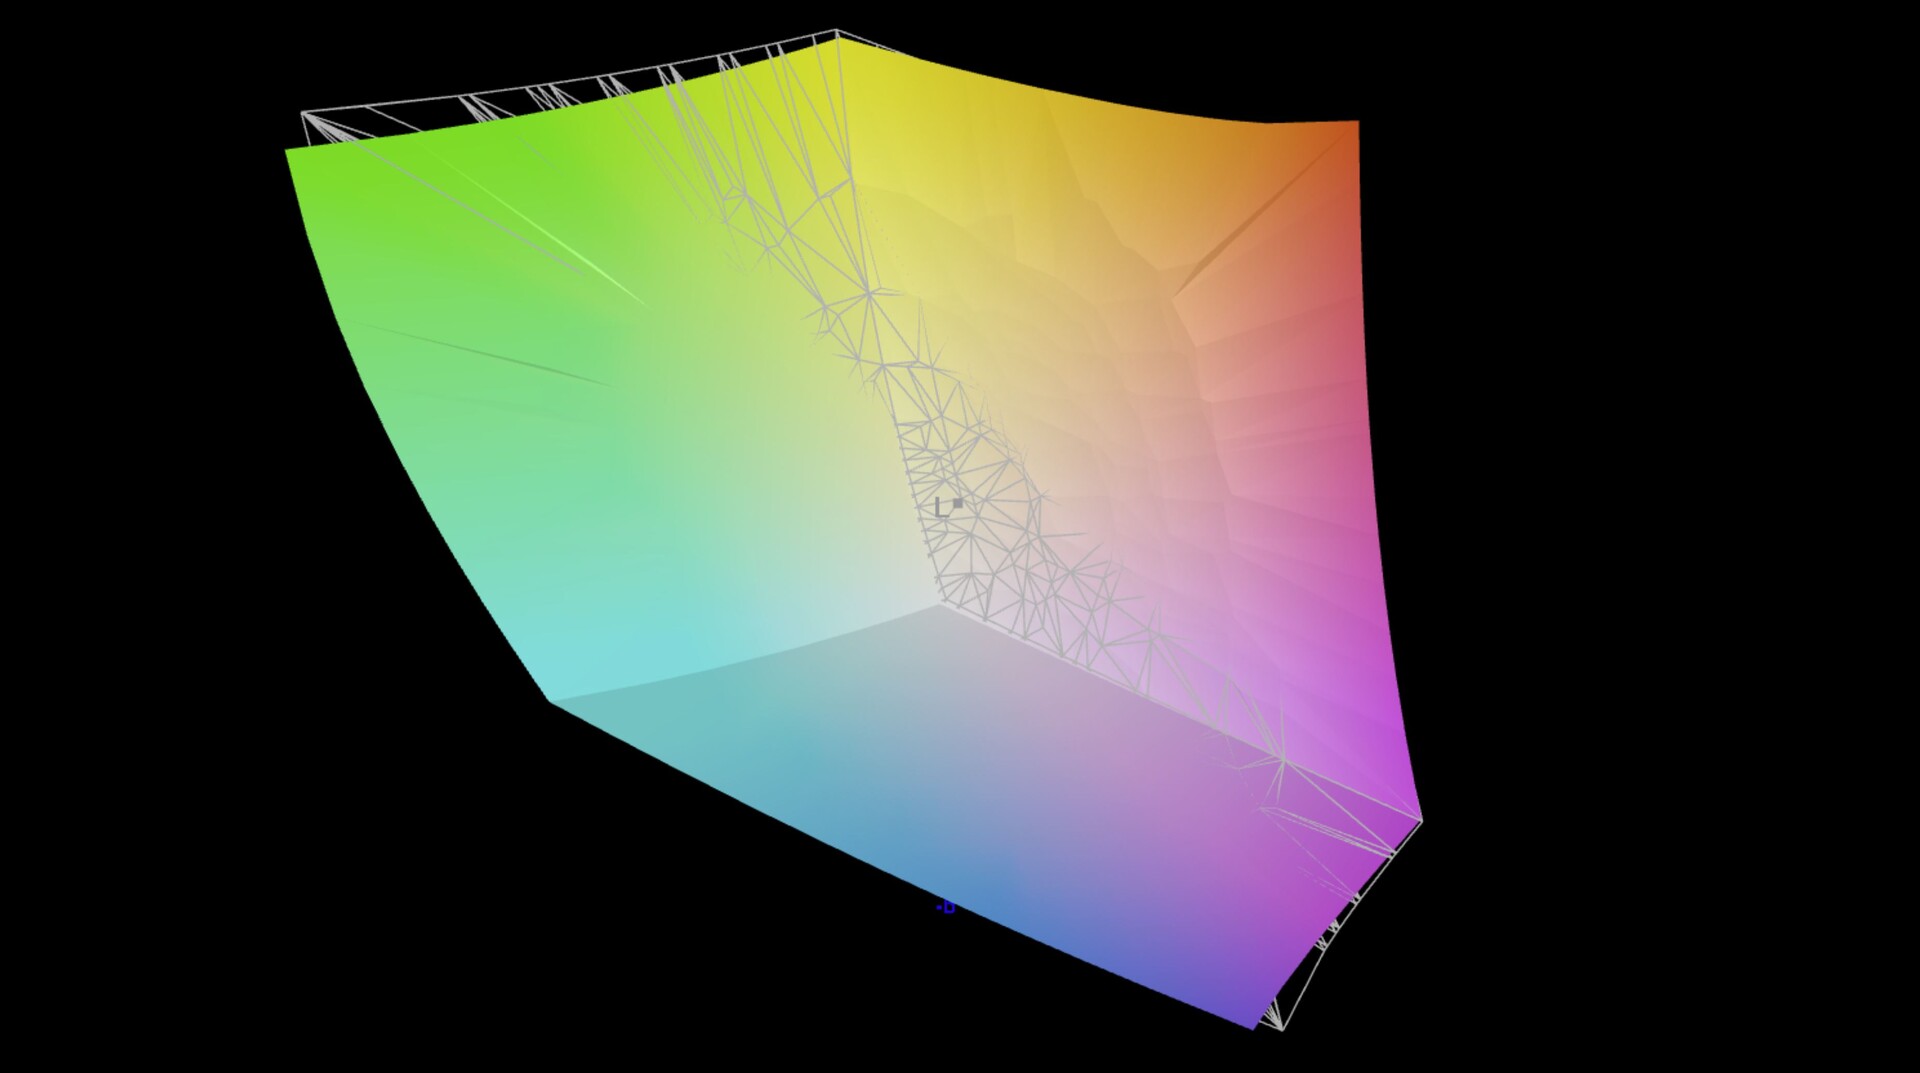
Pantalla: el X1 Extreme aún viene con AdobeRGB

Lenovo es uno de los pocos fabricantes que siguen ofreciendo pantallas AdobeRGB. La pantalla táctil 4K de formato 16:10 (3840 x 2400 pixels) es la misma que la de su predecesor. Una nueva característica de esta generación es el panel WQHD mate de 165 Hz que pronto pondremos a prueba en el ThinkPad P1 G5. Visto subjetivamente, el panel reflectante causa una excelente impresión visual. Aunque Lenovo ha usado el mismo panel que su predecesor, nuestras pruebas revelaron que el brillo del display es de 470 cd/m² de media, lo que no sólo es mucho menor esta vez, sino que también está por debajo de la especificación del fabricante de 600 cd/m². Al mismo tiempo, sin embargo, el nivel de negro es algo mejor, lo que resulta en una relación de contraste sin cambios de algo menos de 1400:1. Además, la pantalla soporta HDR sin ningún atisbo de PWM. Además, los tiempos de respuesta son mejores que los de su predecesor.
| |||||||||||||||||||||||||
iluminación: 90 %
Brillo con batería: 475 cd/m²
Contraste: 1360:1 (Negro: 0.35 cd/m²)
ΔE ColorChecker Calman: 1.9 | ∀{0.5-29.43 Ø4.71}
calibrated: 1.3
ΔE Greyscale Calman: 2.4 | ∀{0.09-98 Ø4.96}
97.7% AdobeRGB 1998 (Argyll 3D)
99.2% sRGB (Argyll 3D)
84.6% Display P3 (Argyll 3D)
Gamma: 2.24
CCT: 6377 K
| Lenovo ThinkPad X1 Extreme G5-21DE003RGE LP160UQ1-SPB1, IPS, 3840x2400, 16" | HP Envy 16 h0112nr Samsung SDC4174, OLED, 3840x2400, 16" | Schenker Vision 16 Pro RTX 3070 Ti N160QDM-NZ1, IPS, 2560x1600, 16" | Dell XPS 15 9520 RTX 3050 Ti Samsung 156XG01, OLED, 3456x2160, 15.6" | Apple MacBook Pro 16 2021 M1 Pro Liquid Retina XDR, Mini-LED, 3456x2234, 16.2" | Dell XPS 17 9720 RTX 3060 Sharp LQ170R1, IPS, 3840x2400, 17" | Lenovo ThinkPad X1 Extreme G4-20Y5CTO1WW (3050 Ti) LP160UQ1-SPB1, IPS LED, 3840x2400, 16" | |
|---|---|---|---|---|---|---|---|
| Display | 3% | -17% | 2% | 3% | -1% | -0% | |
| Display P3 Coverage (%) | 84.6 | 99.3 17% | 68.7 -19% | 97.8 16% | 99.1 17% | 92.9 10% | 84.3 0% |
| sRGB Coverage (%) | 99.2 | 100 1% | 96.7 -3% | 99.9 1% | 100 1% | 100 1% | 98.3 -1% |
| AdobeRGB 1998 Coverage (%) | 97.7 | 88 -10% | 70 -28% | 86 -12% | 88 -10% | 85.3 -13% | 97.8 0% |
| Response Times | 93% | 62% | 93% | -185% | -47% | -75% | |
| Response Time Grey 50% / Grey 80% * (ms) | 46 ? | 2 ? 96% | 14.3 ? 69% | 1.9 ? 96% | 42.8 ? 7% | 51.2 ? -11% | 60 ? -30% |
| Response Time Black / White * (ms) | 19.2 ? | 1.9 ? 90% | 8.6 ? 55% | 1.9 ? 90% | 91.6 ? -377% | 35.2 ? -83% | 42 ? -119% |
| PWM Frequency (Hz) | 240.4 ? | 59.52 ? | 14880 | ||||
| Screen | -3% | -41% | -40% | 247% | -68% | 2% | |
| Brightness middle (cd/m²) | 476 | 328.8 -31% | 364 -24% | 381.4 -20% | 514 8% | 512.7 8% | 639 34% |
| Brightness (cd/m²) | 470 | 332 -29% | 347 -26% | 384 -18% | 497 6% | 463 -1% | 612 30% |
| Brightness Distribution (%) | 90 | 97 8% | 89 -1% | 95 6% | 95 6% | 85 -6% | 84 -7% |
| Black Level * (cd/m²) | 0.35 | 0.3 14% | 0.02 94% | 0.32 9% | 0.47 -34% | ||
| Contrast (:1) | 1360 | 1213 -11% | 25700 1790% | 1602 18% | 1360 0% | ||
| Colorchecker dE 2000 * | 1.9 | 1.53 19% | 3.3 -74% | 4.34 -128% | 1.4 26% | 5.98 -215% | 2.2 -16% |
| Colorchecker dE 2000 max. * | 4.7 | 6.04 -29% | 6.6 -40% | 9.24 -97% | 2.8 40% | 12.09 -157% | 5.3 -13% |
| Colorchecker dE 2000 calibrated * | 1.3 | 2.5 -92% | 1.4 -8% | ||||
| Greyscale dE 2000 * | 2.4 | 1.3 46% | 5.2 -117% | 2 17% | 2.3 4% | 7.2 -200% | 1.7 29% |
| Gamma | 2.24 98% | 2.18 101% | 2.14 103% | 2.13 103% | 2.27 97% | 2.54 87% | 2.31 95% |
| CCT | 6377 102% | 6362 102% | 6331 103% | 6210 105% | 6792 96% | 6914 94% | 6390 102% |
| Media total (Programa/Opciones) | 31% /
16% | 1% /
-21% | 18% /
-4% | 22% /
124% | -39% /
-49% | -24% /
-10% |
* ... más pequeño es mejor
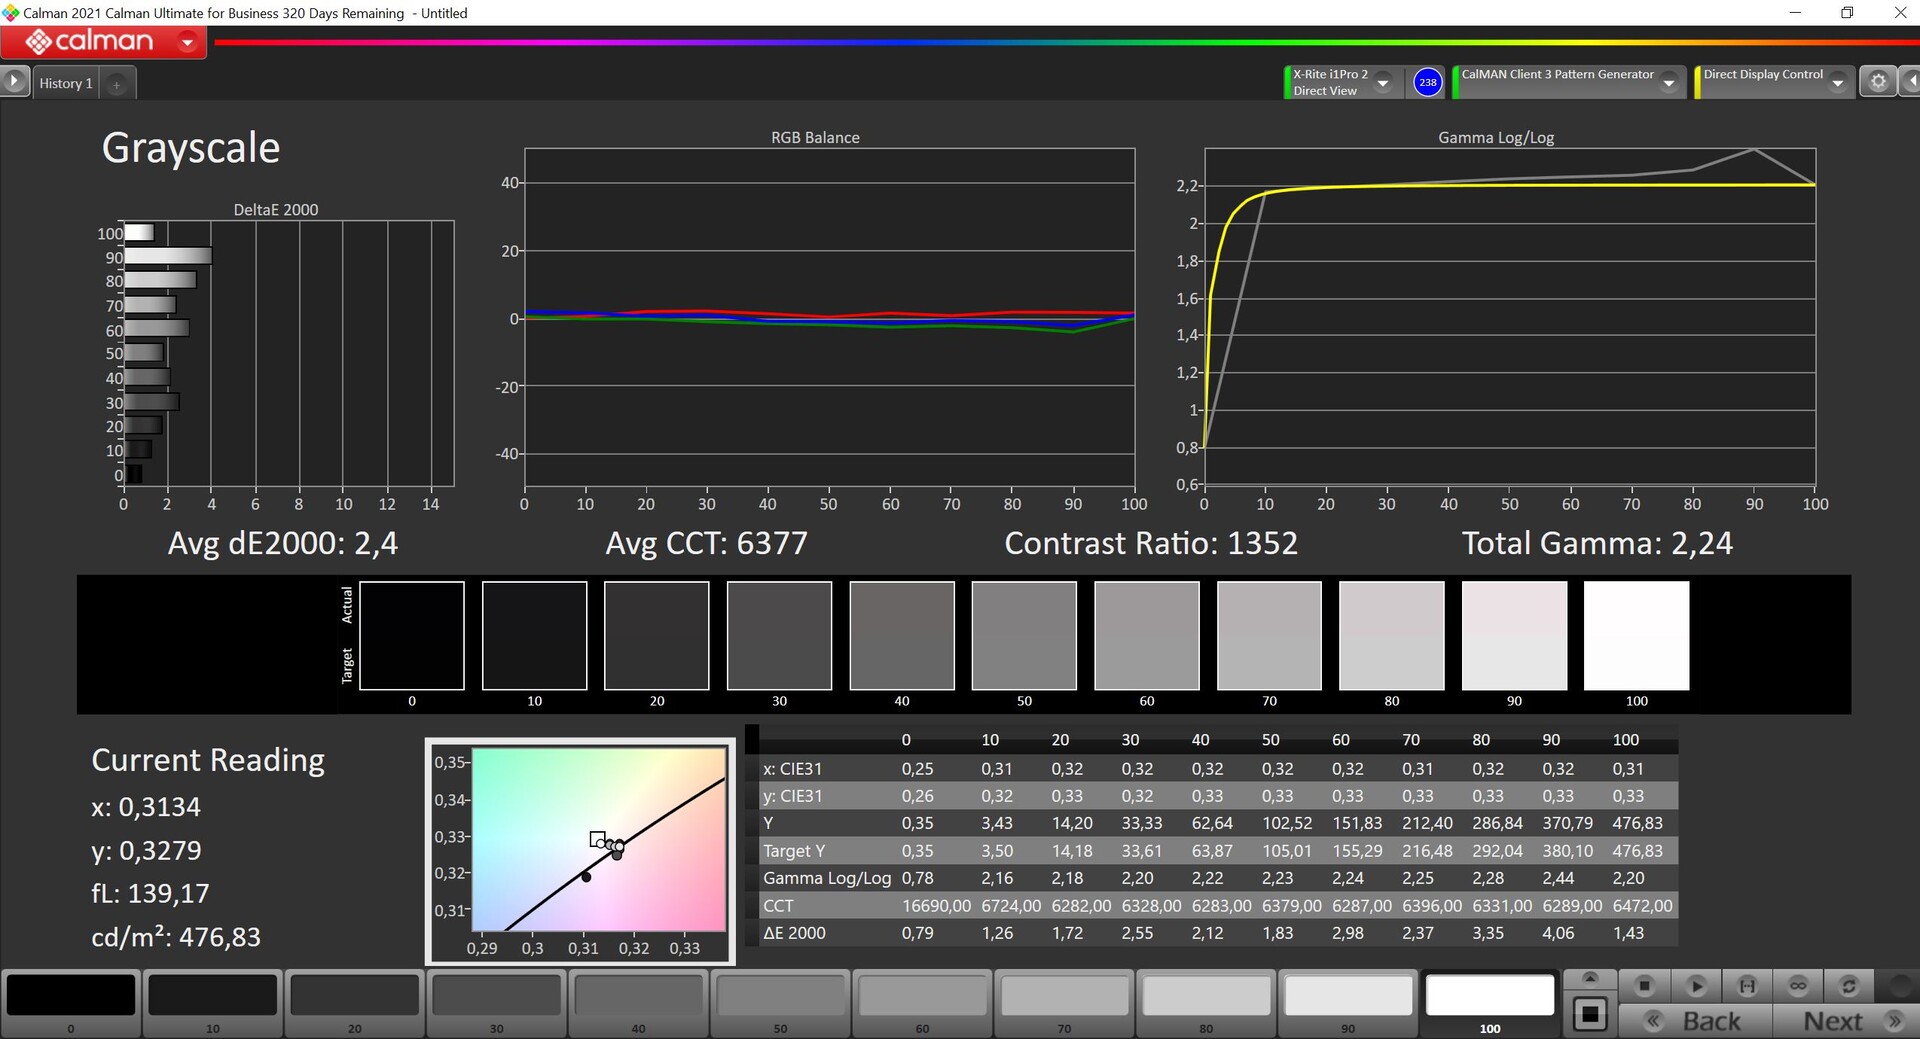
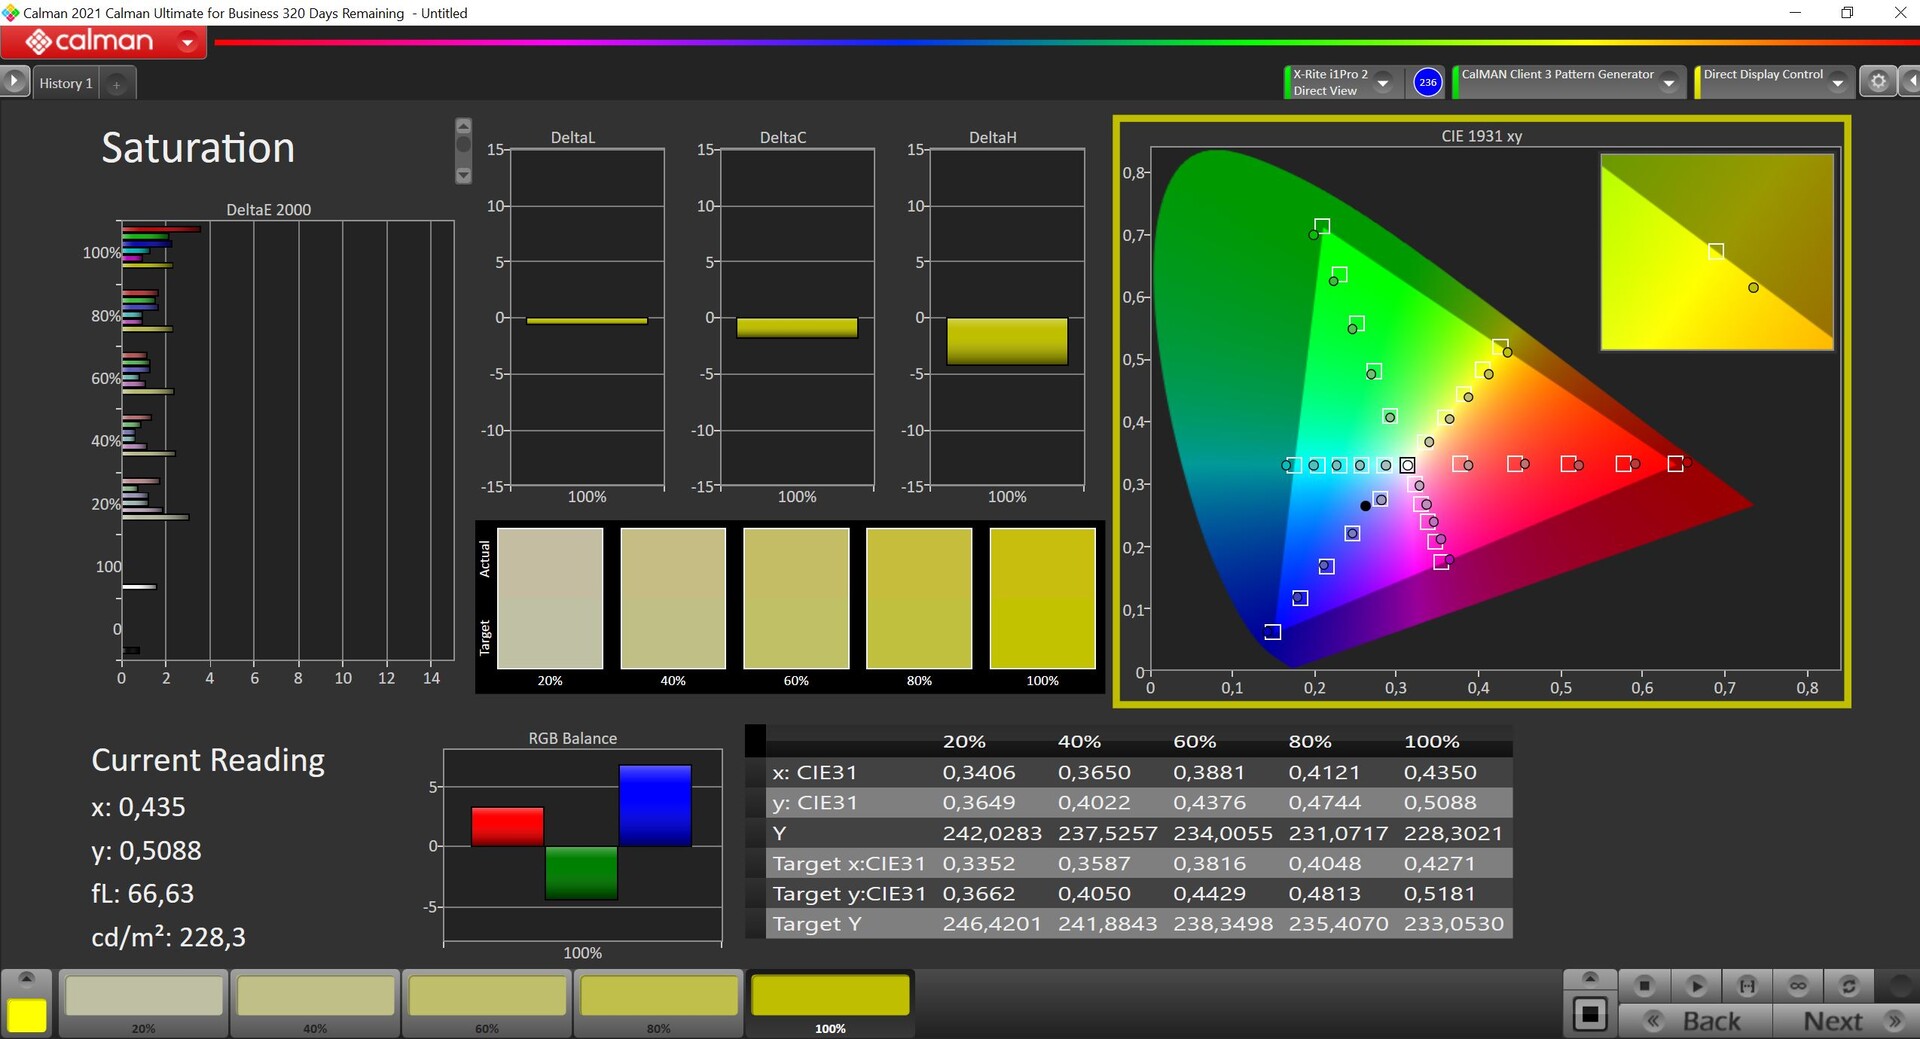
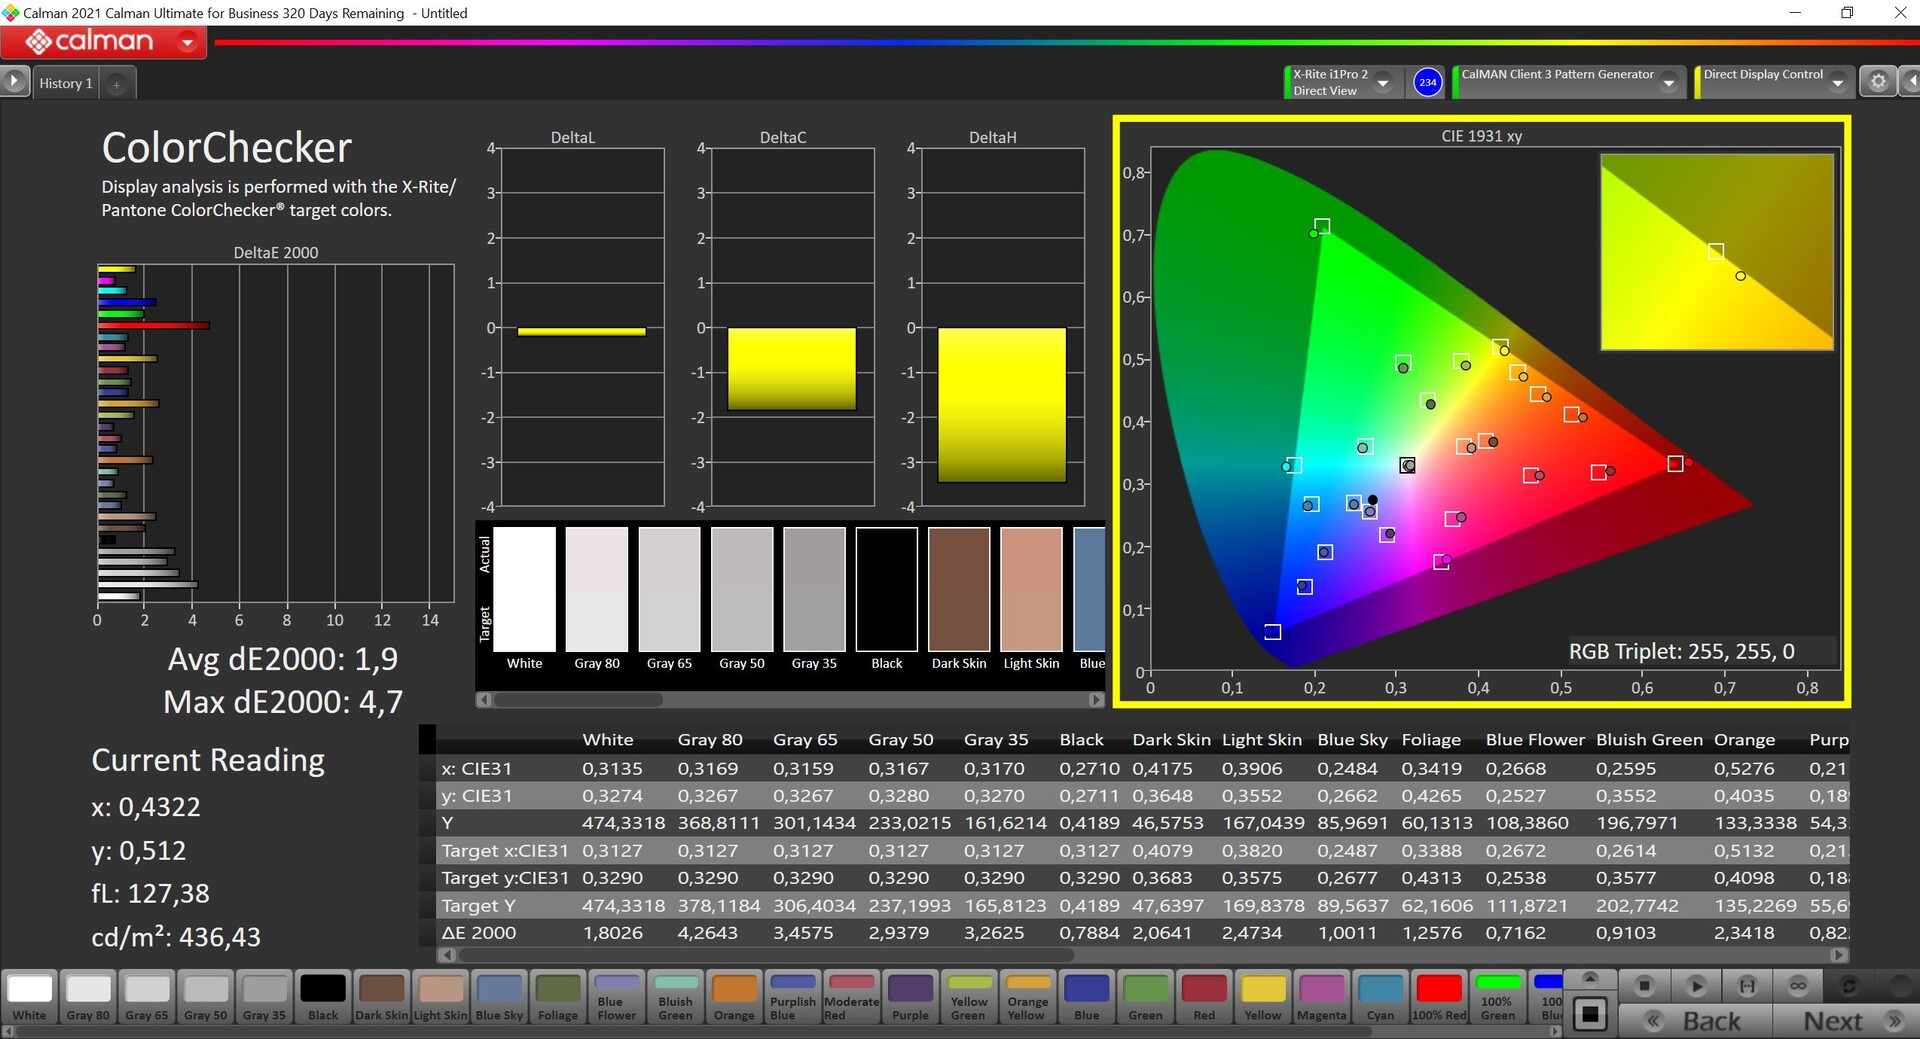

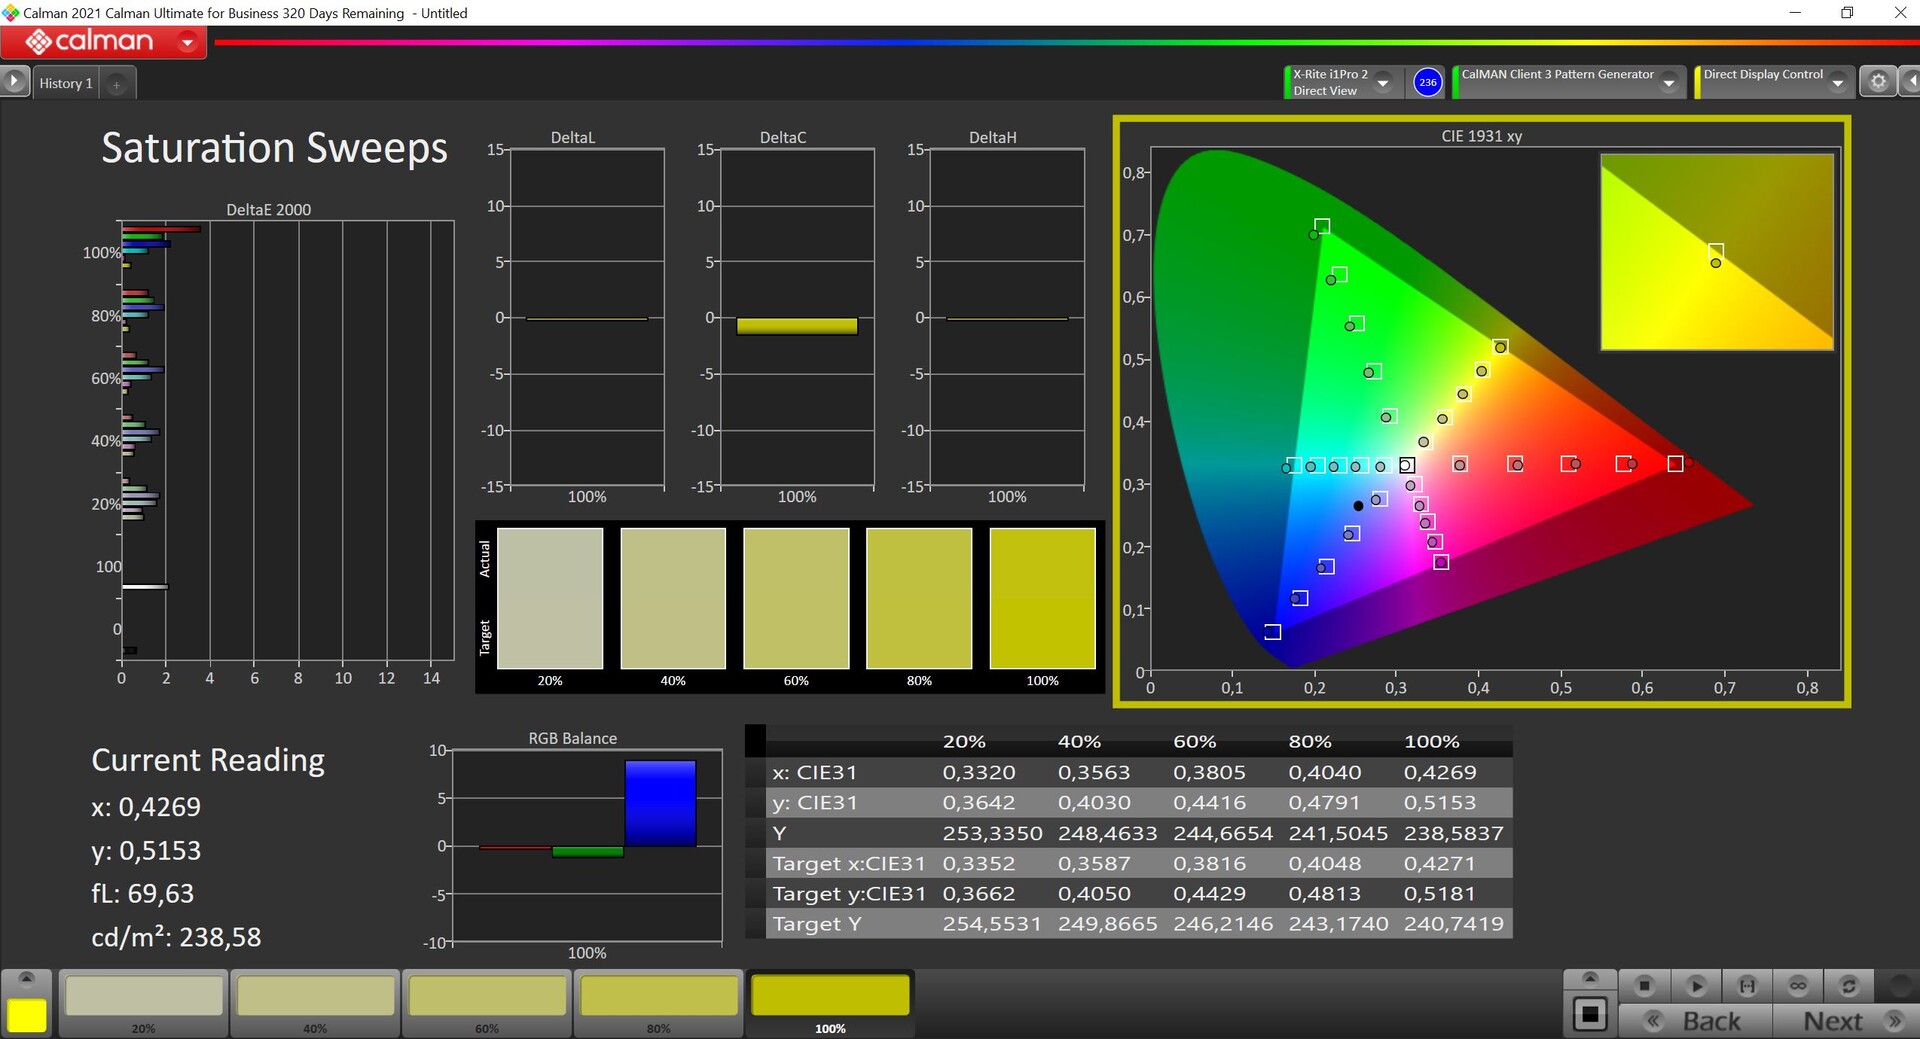
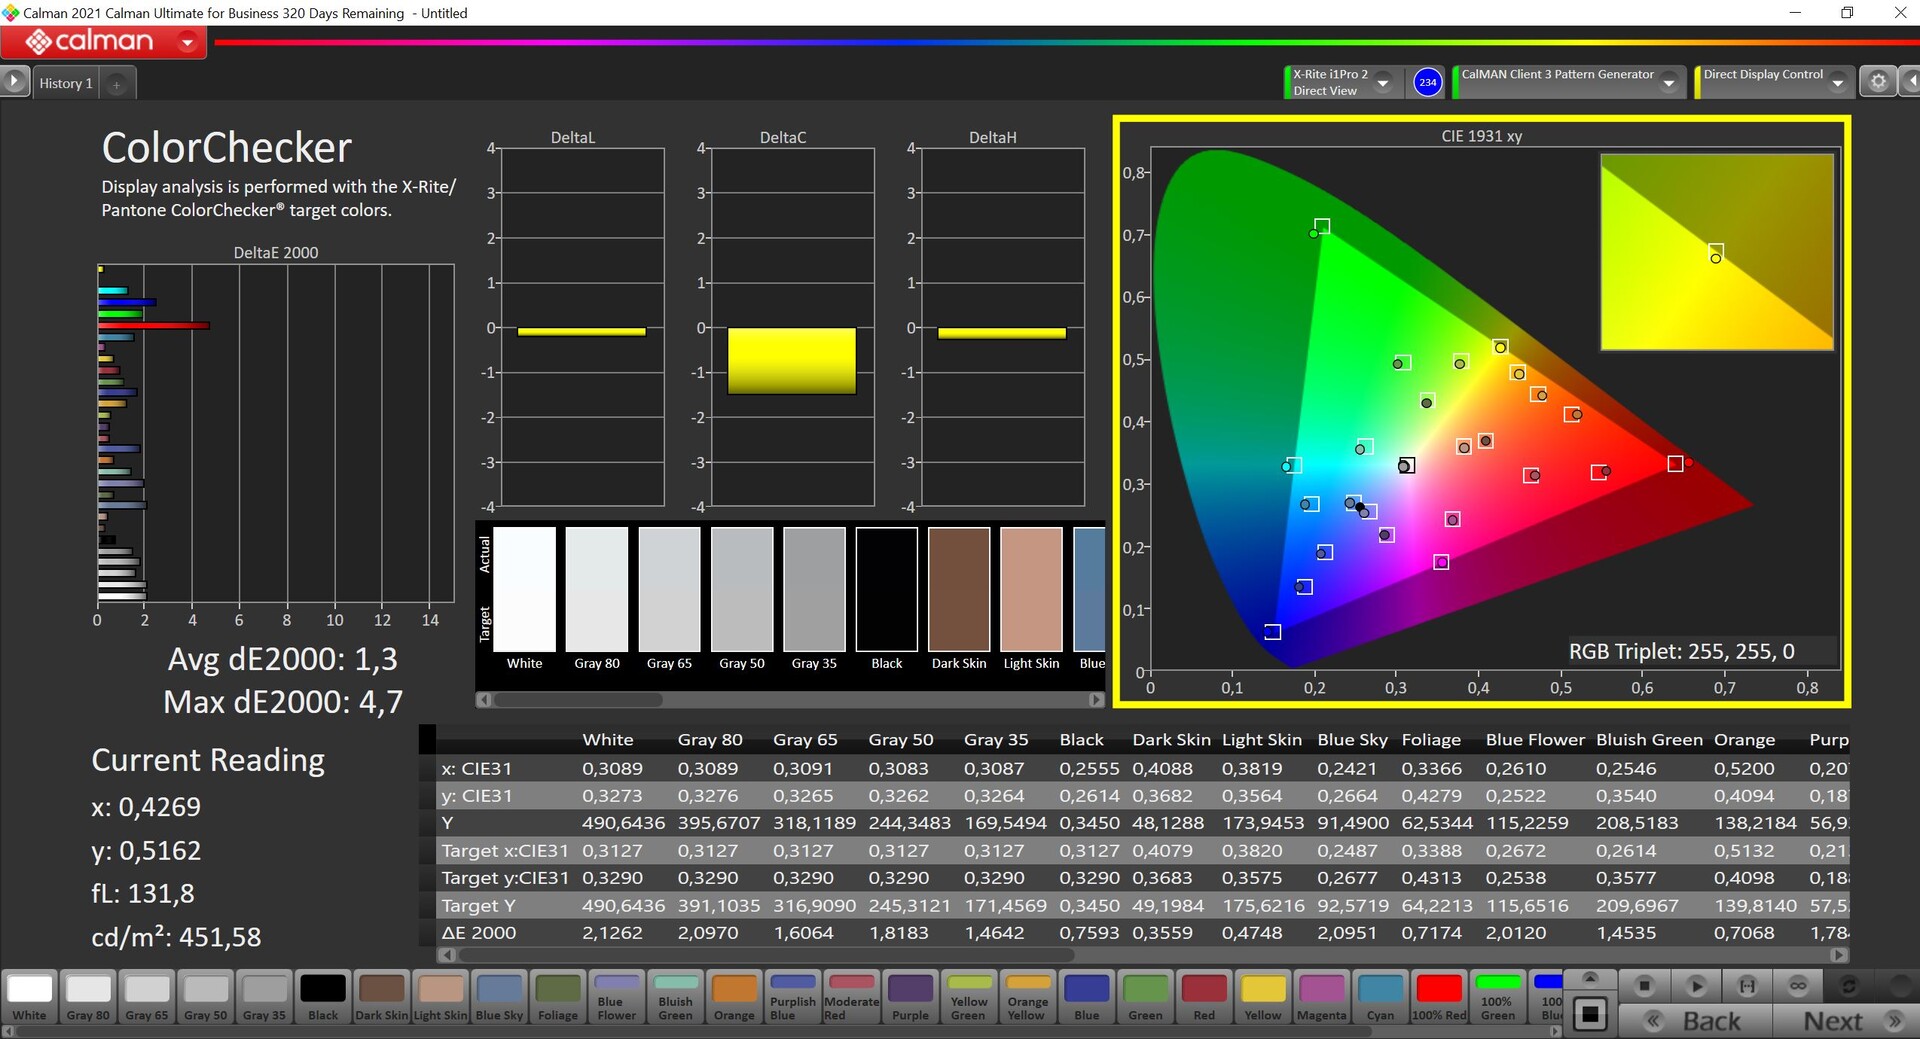
La pantalla 4K viene con software X-Rite preinstalado y ofrece varios perfiles. Analizamos la pantalla con el software profesional CalMAN (X-Rite i1 Pro 2) usando el perfil preestablecido "Native". No hay cambios no deseados en los tonos de color en comparación con la referencia AdobeRGB, las desviaciones medias de la escala de grises DeltaE 2000 están por debajo del valor objetivo de 3. Esto también se aplica a los colores, con sólo el rojo al 100% mostrando una fuerte desviación. Hemos podido reducirla con nuestra propia calibración, aunque las demás desviaciones son menores. Por tanto, no es necesario un calibrado posterior, lo que también hace que el panel sea muy adecuado para la edición de imágenes gracias a su cobertura AdobeRGB de casi el 100%.
Tiempos de respuesta del display
| ↔ Tiempo de respuesta de Negro a Blanco | ||
|---|---|---|
| 19.2 ms ... subida ↗ y bajada ↘ combinada | ↗ 6 ms subida | 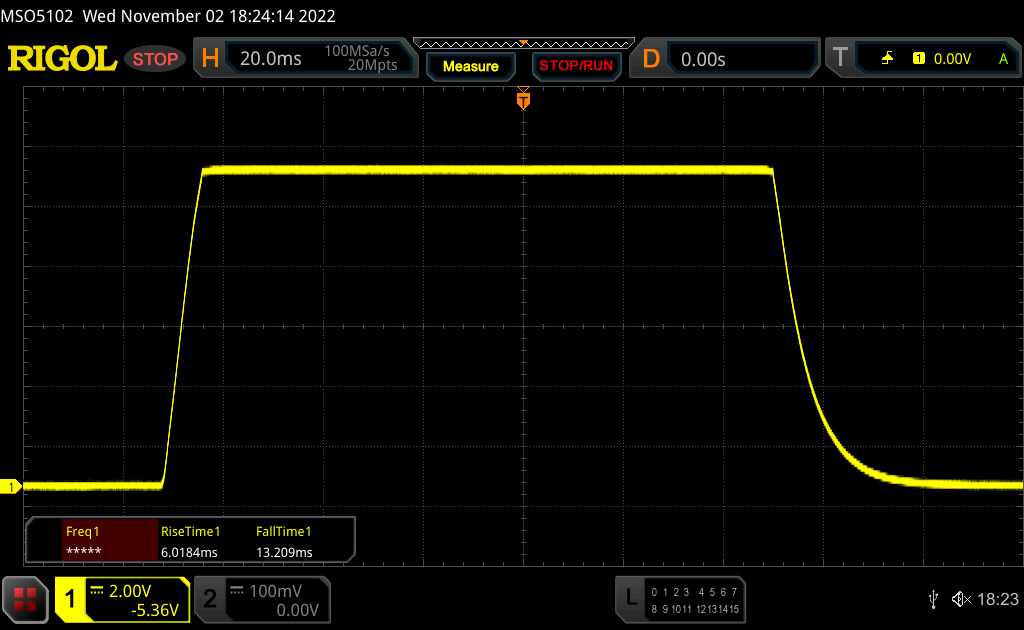 |
| ↘ 13.2 ms bajada | ||
| La pantalla mostró buenos tiempos de respuesta en nuestros tests pero podría ser demasiado lenta para los jugones competitivos. En comparación, todos los dispositivos de prueba van de ##min### (mínimo) a 240 (máximo) ms. » 43 % de todos los dispositivos son mejores. Eso quiere decir que el tiempo de respuesta es similar al dispositivo testado medio (19.8 ms). | ||
| ↔ Tiempo de respuesta 50% Gris a 80% Gris | ||
| 46 ms ... subida ↗ y bajada ↘ combinada | ↗ 21.2 ms subida | 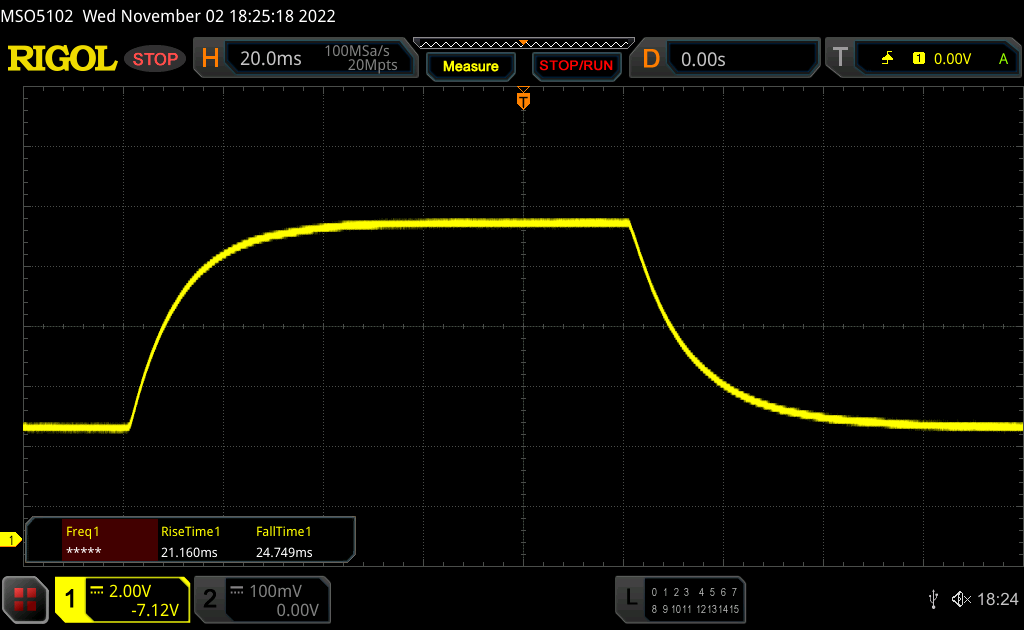 |
| ↘ 24.8 ms bajada | ||
| La pantalla mostró tiempos de respuesta lentos en nuestros tests y podría ser demasiado lenta para los jugones. En comparación, todos los dispositivos de prueba van de ##min### (mínimo) a 636 (máximo) ms. » 79 % de todos los dispositivos son mejores. Eso quiere decir que el tiempo de respuesta es peor que la media (31 ms) de todos los dispositivos testados. | ||
Parpadeo de Pantalla / PWM (Pulse-Width Modulation)
| Parpadeo de Pantalla / PWM no detectado |  | ||
Comparación: 52 % de todos los dispositivos testados no usaron PWM para atenuar el display. Si se usó, medimos una media de 7757 (mínimo: 5 - máxmo: 343500) Hz. | |||
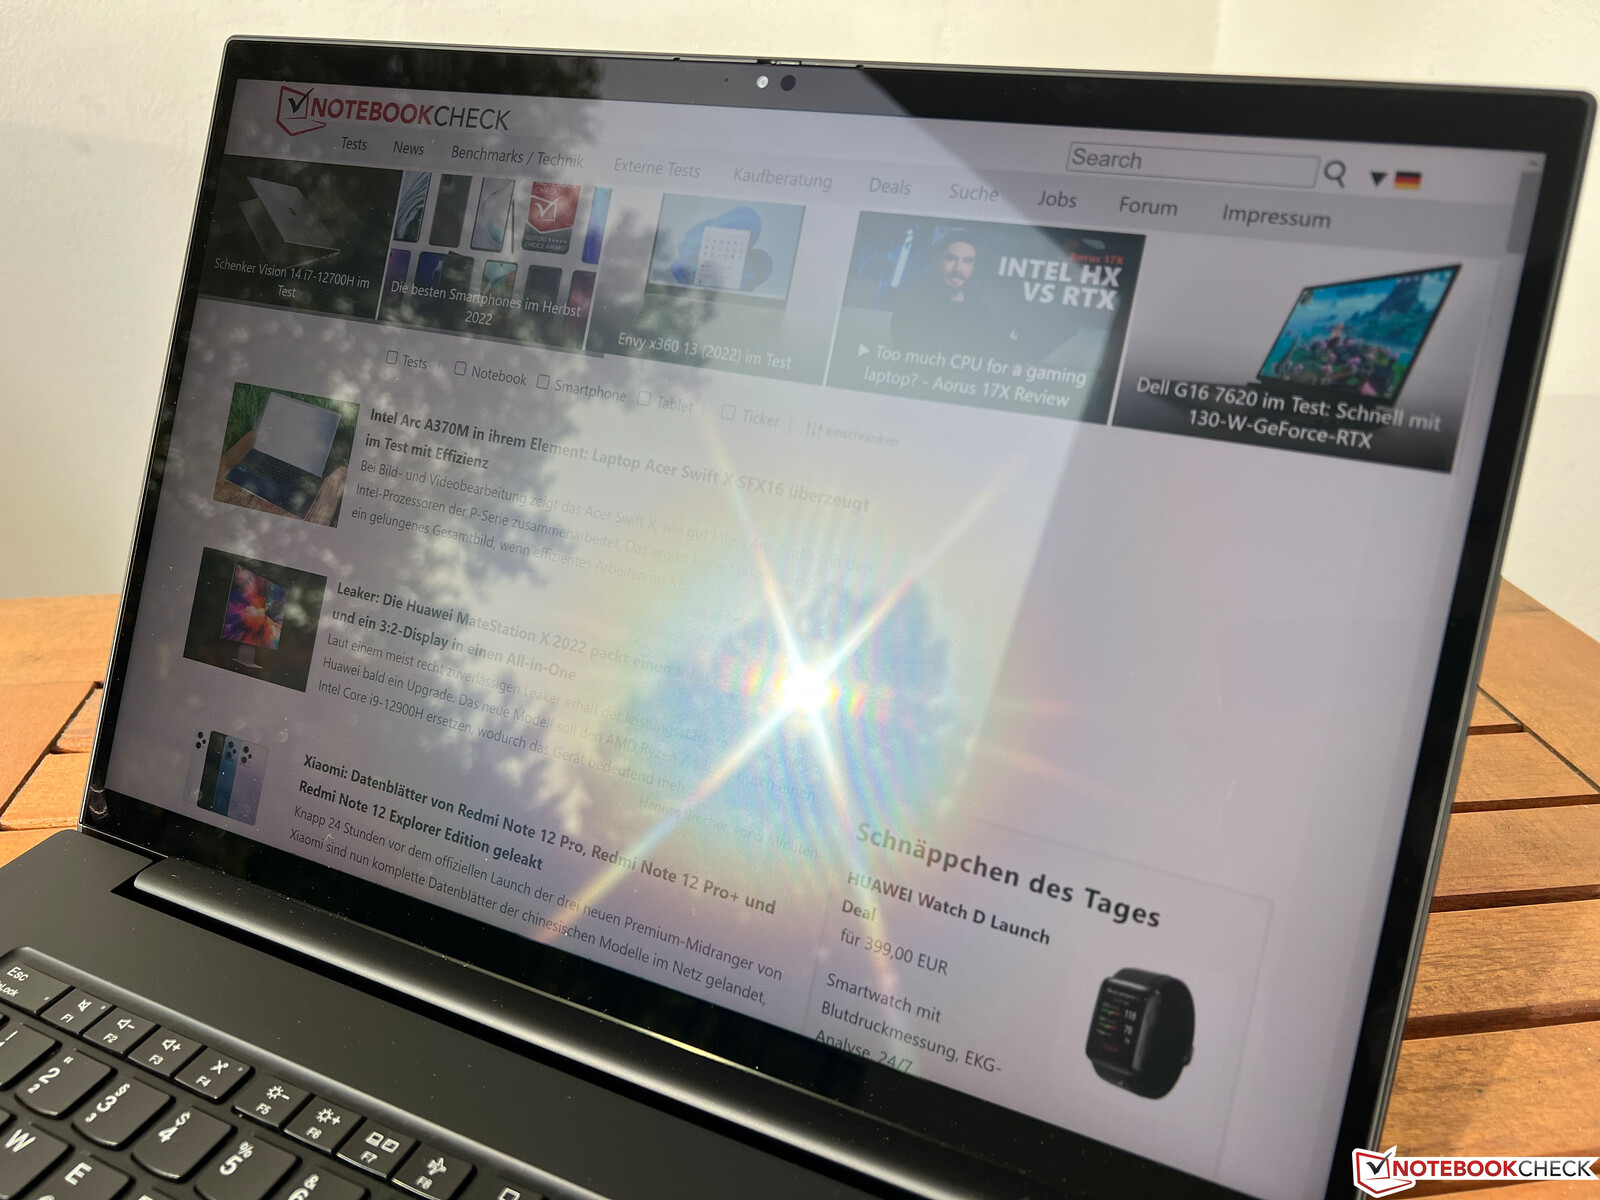
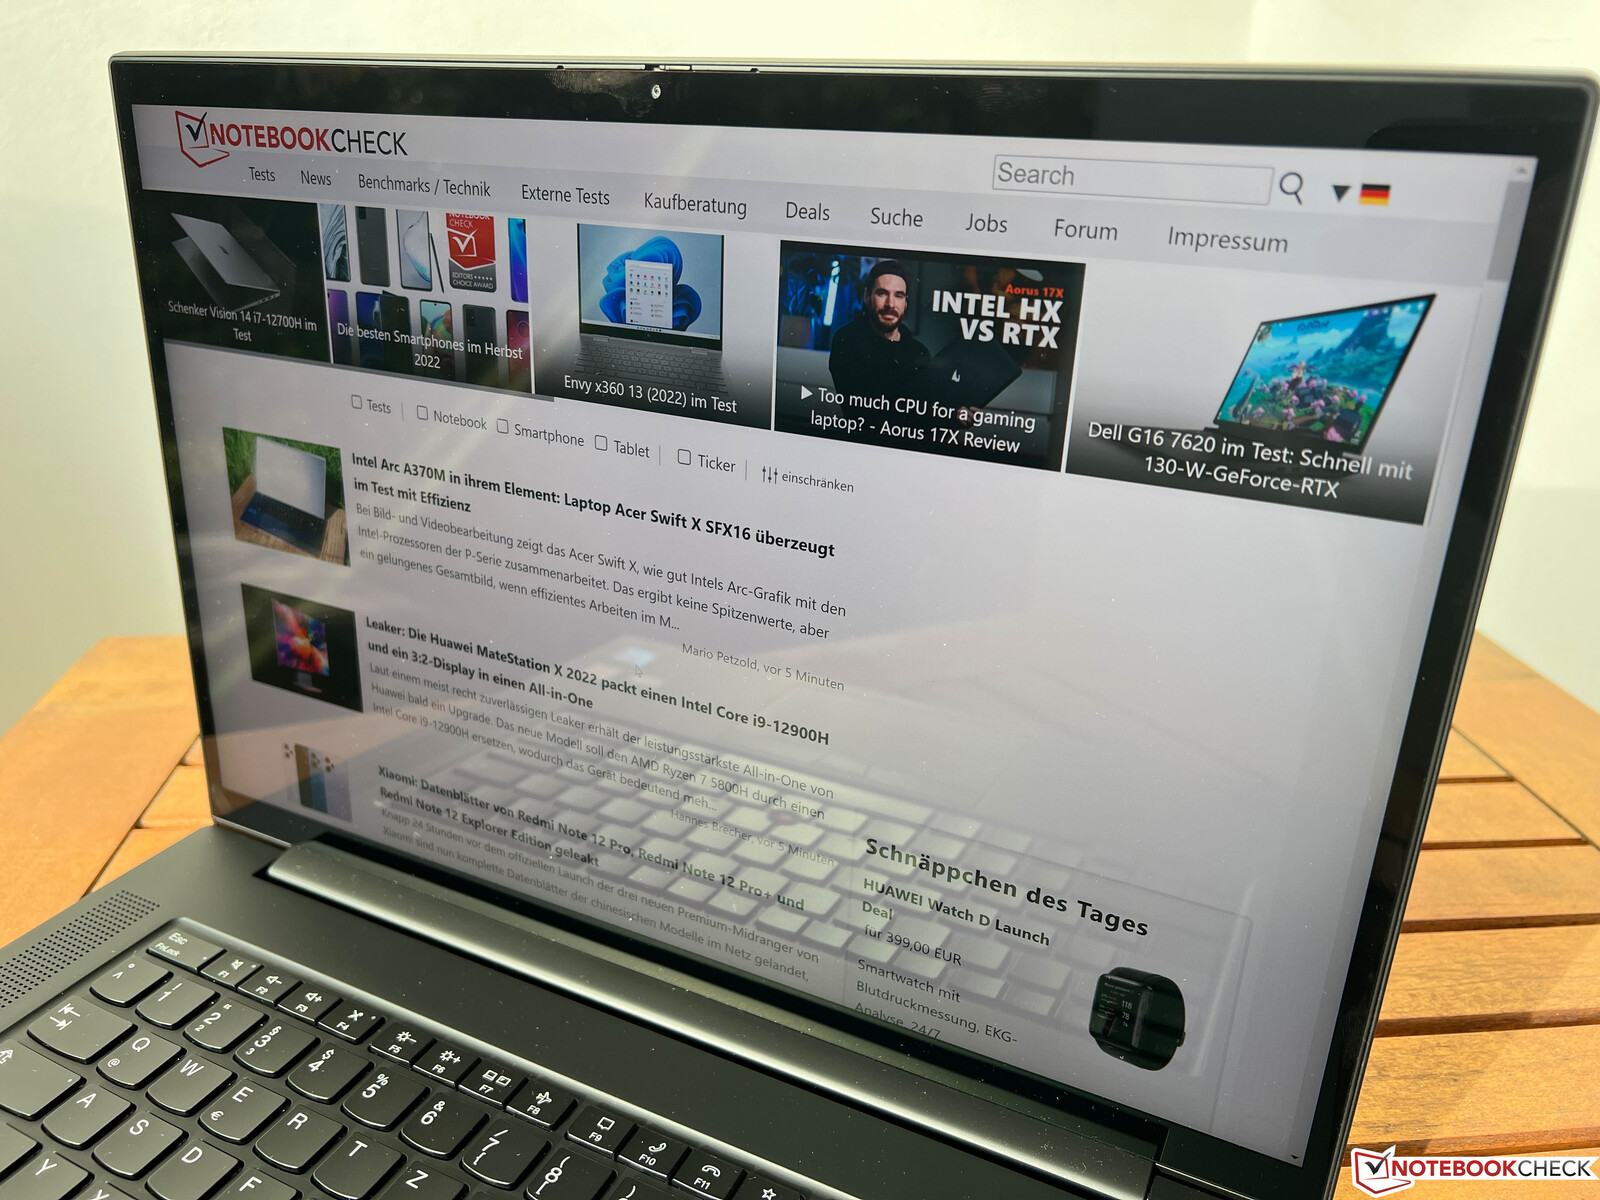
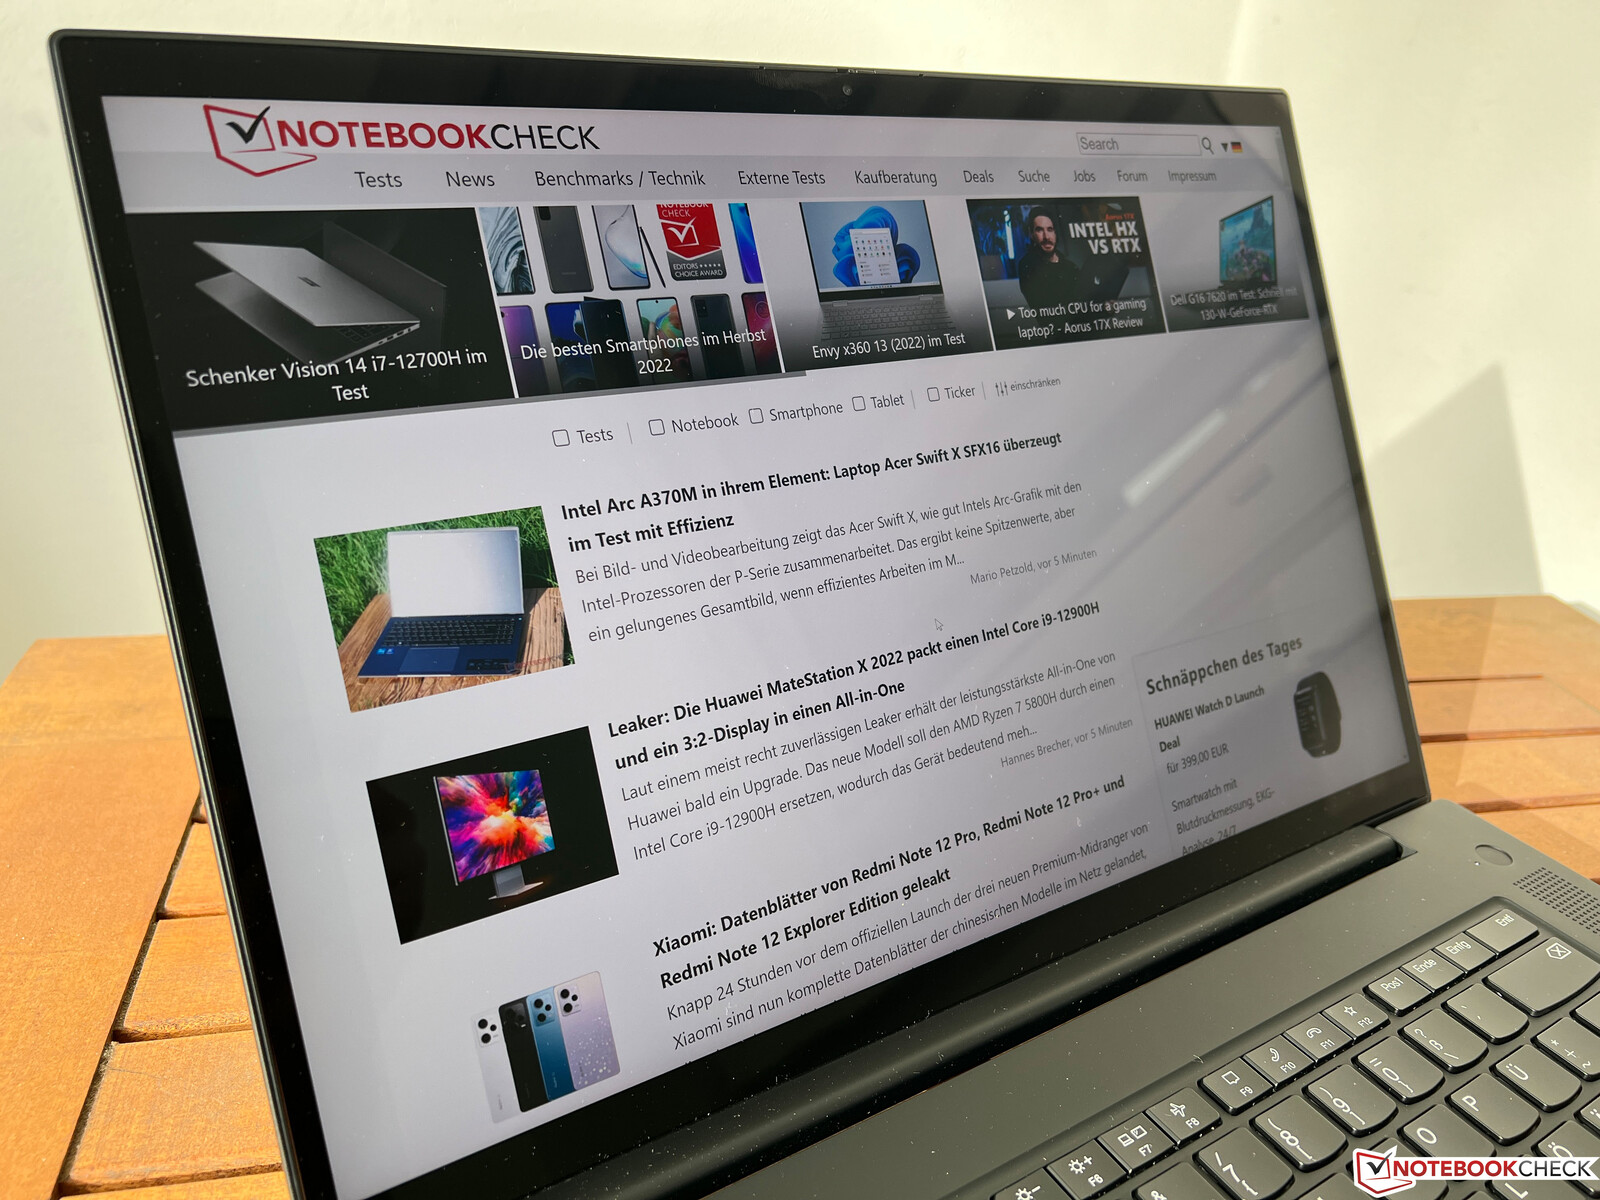
En exteriores -y especialmente en días luminosos- puede ser difícil trabajar cómodamente, ya que la pantalla brillante es inevitablemente muy reflectante. Los usuarios del X1 Extreme G5 que trabajen a menudo fuera de casa deberían considerar una configuración con panel mate. No obstante, no se puede encontrar ningún fallo en la estabilidad del ángulo de visión del panel IPS.

Rendimiento - X1 Extreme G5 opcionalmente con la RTX 3080 Ti
El ThinkPad X1 Extreme G5 está disponible con una gama de procesadores Intel, incluidos los modelos vPro opcionales. Las tarjetas gráficas comienzan con laGeForce RTX 3050 Tiy llegan hasta laRTX 3080 Ti. Para GPU profesionales, merece la pena echar un vistazo al ThinkPad P1 G5. Nuestro dispositivo de pruebas venía equipado con un único módulo RAM (32 GB) y sólo funciona en modo monocanal.
Condiciones de la prueba
En lugar de ofrecer perfiles de energía adicionales, Lenovo vincula los ajustes a los ajustes de energía habituales de Windows, lo que resulta muy cómodo en la práctica. A diferencia de algunos ThinkPads AMD, no hay forma de activar o desactivar la función de "refrigeración inteligente".
Procesador - Core i7-12700H
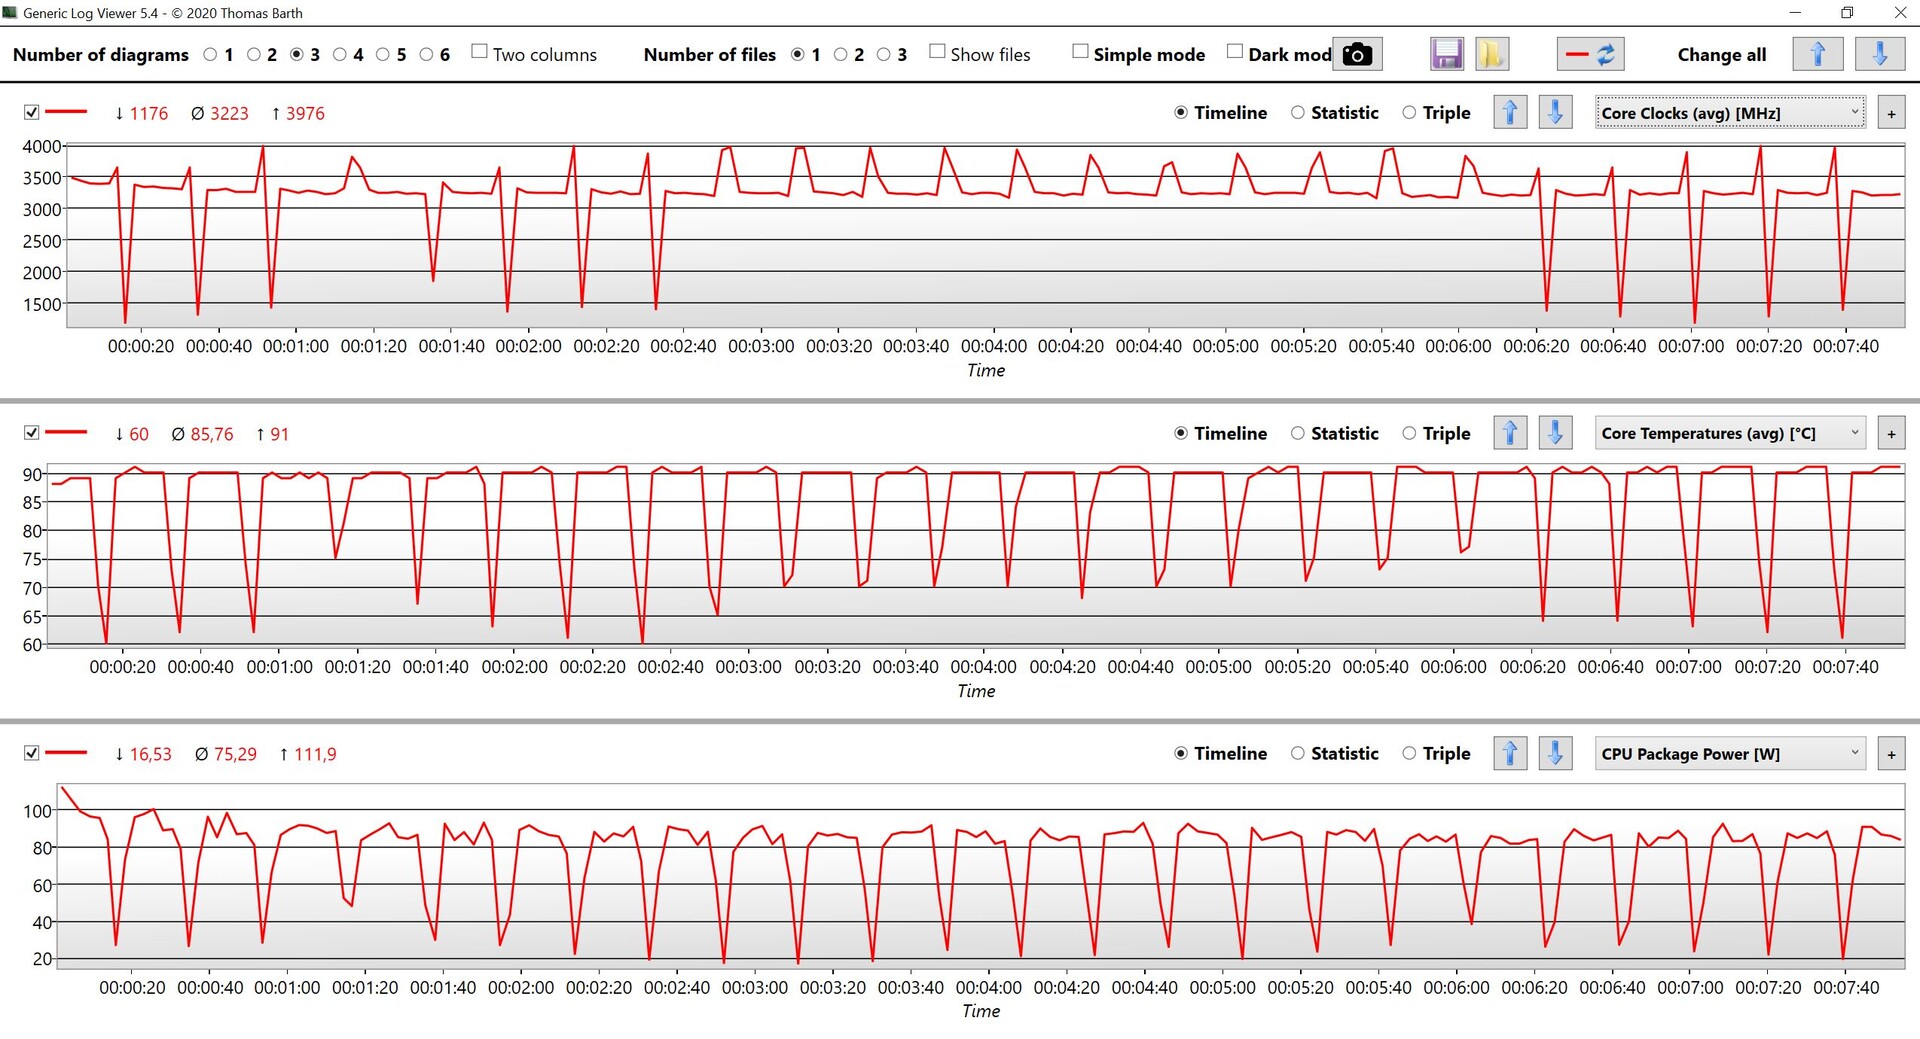
ElCore i7-12700Hpertenece a la actual generación Alder Lake de Intel y ofrece 6 núcleos de rendimiento y 8 de eficiencia. En uso corto, el procesador del ThinkPad usa 112W y 80W en uso sostenido, por lo que los resultados de las pruebas son buenos, incluso bajo carga más larga. Por esta razón, el ThinkPad pertenece a los modelos más rápidos de nuestro grupo de comparación. Cuando se tienen en cuenta todos los benchmarks de CPU, el X1 Extreme G5 se sitúa un 28 % por delante de su predecesor con el antiguo Análisis del portátil Lenovo ThinkPad X1 Extreme Gen 4: El buque insignia del rendimiento con pantalla táctil 16:10Core i7-11800H. Aquí es donde las mayores capacidades de refrigeración de la pasta térmica de metal líquido realmente valen la pena
El procesador sigue consumiendo unos 70 vatios en modo batería, lo que hace que el rendimiento en las pruebas multinúcleo sólo caiga un 13 %; el rendimiento mononúcleo no se ve afectado. Encontrará más pruebas de CPU en nuestra sección técnica de Procesadores mobiles - lista de benchmarks (nueva) .
Cinebench R15 Multi endurance test
Cinebench R23: Multi Core | Single Core
Cinebench R20: CPU (Multi Core) | CPU (Single Core)
Cinebench R15: CPU Multi 64Bit | CPU Single 64Bit
Blender: v2.79 BMW27 CPU
7-Zip 18.03: 7z b 4 | 7z b 4 -mmt1
Geekbench 5.5: Multi-Core | Single-Core
HWBOT x265 Benchmark v2.2: 4k Preset
LibreOffice : 20 Documents To PDF
R Benchmark 2.5: Overall mean
| CPU Performance rating | |
| Lenovo ThinkPad X1 Extreme G5-21DE003RGE | |
| Media de la clase Multimedia | |
| Dell XPS 17 9720 RTX 3060 | |
| Medio Intel Core i7-12700H | |
| Dell XPS 15 9520 RTX 3050 Ti | |
| HP Envy 16 h0112nr | |
| Schenker Vision 16 Pro RTX 3070 Ti | |
| Apple MacBook Pro 16 2021 M1 Pro -5! | |
| Lenovo ThinkPad X1 Extreme G4-20Y5CTO1WW (3050 Ti) | |
| Cinebench R23 / Multi Core | |
| Lenovo ThinkPad X1 Extreme G5-21DE003RGE | |
| Dell XPS 17 9720 RTX 3060 | |
| Media de la clase Multimedia (4861 - 33362, n=74, últimos 2 años) | |
| Medio Intel Core i7-12700H (4032 - 19330, n=64) | |
| Dell XPS 15 9520 RTX 3050 Ti | |
| HP Envy 16 h0112nr | |
| Schenker Vision 16 Pro RTX 3070 Ti | |
| Lenovo ThinkPad X1 Extreme G4-20Y5CTO1WW (3050 Ti) | |
| Apple MacBook Pro 16 2021 M1 Pro | |
| Cinebench R23 / Single Core | |
| Media de la clase Multimedia (1128 - 2459, n=66, últimos 2 años) | |
| Lenovo ThinkPad X1 Extreme G5-21DE003RGE | |
| Schenker Vision 16 Pro RTX 3070 Ti | |
| Dell XPS 15 9520 RTX 3050 Ti | |
| HP Envy 16 h0112nr | |
| Dell XPS 17 9720 RTX 3060 | |
| Medio Intel Core i7-12700H (778 - 1826, n=63) | |
| Apple MacBook Pro 16 2021 M1 Pro | |
| Lenovo ThinkPad X1 Extreme G4-20Y5CTO1WW (3050 Ti) | |
| Cinebench R20 / CPU (Multi Core) | |
| Lenovo ThinkPad X1 Extreme G5-21DE003RGE | |
| Dell XPS 17 9720 RTX 3060 | |
| Media de la clase Multimedia (1887 - 12912, n=57, últimos 2 años) | |
| Medio Intel Core i7-12700H (1576 - 7407, n=64) | |
| Dell XPS 15 9520 RTX 3050 Ti | |
| HP Envy 16 h0112nr | |
| Schenker Vision 16 Pro RTX 3070 Ti | |
| Lenovo ThinkPad X1 Extreme G4-20Y5CTO1WW (3050 Ti) | |
| Apple MacBook Pro 16 2021 M1 Pro | |
| Cinebench R20 / CPU (Single Core) | |
| Media de la clase Multimedia (425 - 853, n=57, últimos 2 años) | |
| Lenovo ThinkPad X1 Extreme G5-21DE003RGE | |
| Schenker Vision 16 Pro RTX 3070 Ti | |
| HP Envy 16 h0112nr | |
| Dell XPS 15 9520 RTX 3050 Ti | |
| Medio Intel Core i7-12700H (300 - 704, n=64) | |
| Dell XPS 17 9720 RTX 3060 | |
| Lenovo ThinkPad X1 Extreme G4-20Y5CTO1WW (3050 Ti) | |
| Apple MacBook Pro 16 2021 M1 Pro | |
| Cinebench R15 / CPU Multi 64Bit | |
| Lenovo ThinkPad X1 Extreme G5-21DE003RGE | |
| Schenker Vision 16 Pro RTX 3070 Ti | |
| Schenker Vision 16 Pro RTX 3070 Ti | |
| Media de la clase Multimedia (856 - 5224, n=61, últimos 2 años) | |
| HP Envy 16 h0112nr | |
| Medio Intel Core i7-12700H (1379 - 2916, n=70) | |
| Dell XPS 17 9720 RTX 3060 | |
| Dell XPS 15 9520 RTX 3050 Ti | |
| Lenovo ThinkPad X1 Extreme G4-20Y5CTO1WW (3050 Ti) | |
| Apple MacBook Pro 16 2021 M1 Pro | |
| Cinebench R15 / CPU Single 64Bit | |
| Media de la clase Multimedia (184.8 - 326, n=59, últimos 2 años) | |
| Schenker Vision 16 Pro RTX 3070 Ti | |
| Lenovo ThinkPad X1 Extreme G5-21DE003RGE | |
| HP Envy 16 h0112nr | |
| Dell XPS 17 9720 RTX 3060 | |
| Medio Intel Core i7-12700H (113 - 263, n=65) | |
| Dell XPS 15 9520 RTX 3050 Ti | |
| Lenovo ThinkPad X1 Extreme G4-20Y5CTO1WW (3050 Ti) | |
| Apple MacBook Pro 16 2021 M1 Pro | |
| Blender / v2.79 BMW27 CPU | |
| Schenker Vision 16 Pro RTX 3070 Ti | |
| Lenovo ThinkPad X1 Extreme G4-20Y5CTO1WW (3050 Ti) | |
| Media de la clase Multimedia (100 - 557, n=58, últimos 2 años) | |
| HP Envy 16 h0112nr | |
| Dell XPS 15 9520 RTX 3050 Ti | |
| Medio Intel Core i7-12700H (168 - 732, n=63) | |
| Dell XPS 17 9720 RTX 3060 | |
| Lenovo ThinkPad X1 Extreme G5-21DE003RGE | |
| Apple MacBook Pro 16 2021 M1 Pro | |
| 7-Zip 18.03 / 7z b 4 | |
| Dell XPS 17 9720 RTX 3060 | |
| Lenovo ThinkPad X1 Extreme G5-21DE003RGE | |
| Dell XPS 15 9520 RTX 3050 Ti | |
| Medio Intel Core i7-12700H (22844 - 73067, n=63) | |
| Media de la clase Multimedia (26062 - 130368, n=55, últimos 2 años) | |
| HP Envy 16 h0112nr | |
| Schenker Vision 16 Pro RTX 3070 Ti | |
| Lenovo ThinkPad X1 Extreme G4-20Y5CTO1WW (3050 Ti) | |
| 7-Zip 18.03 / 7z b 4 -mmt1 | |
| Media de la clase Multimedia (3666 - 7545, n=56, últimos 2 años) | |
| Lenovo ThinkPad X1 Extreme G5-21DE003RGE | |
| Schenker Vision 16 Pro RTX 3070 Ti | |
| Dell XPS 15 9520 RTX 3050 Ti | |
| HP Envy 16 h0112nr | |
| Dell XPS 17 9720 RTX 3060 | |
| Medio Intel Core i7-12700H (2743 - 5972, n=63) | |
| Lenovo ThinkPad X1 Extreme G4-20Y5CTO1WW (3050 Ti) | |
| Geekbench 5.5 / Multi-Core | |
| Media de la clase Multimedia (4652 - 20422, n=56, últimos 2 años) | |
| HP Envy 16 h0112nr | |
| Apple MacBook Pro 16 2021 M1 Pro | |
| Dell XPS 17 9720 RTX 3060 | |
| Dell XPS 15 9520 RTX 3050 Ti | |
| Lenovo ThinkPad X1 Extreme G5-21DE003RGE | |
| Medio Intel Core i7-12700H (5144 - 13745, n=64) | |
| Schenker Vision 16 Pro RTX 3070 Ti | |
| Lenovo ThinkPad X1 Extreme G4-20Y5CTO1WW (3050 Ti) | |
| Geekbench 5.5 / Single-Core | |
| Media de la clase Multimedia (805 - 2974, n=56, últimos 2 años) | |
| Schenker Vision 16 Pro RTX 3070 Ti | |
| Lenovo ThinkPad X1 Extreme G5-21DE003RGE | |
| HP Envy 16 h0112nr | |
| Dell XPS 15 9520 RTX 3050 Ti | |
| Apple MacBook Pro 16 2021 M1 Pro | |
| Medio Intel Core i7-12700H (803 - 1851, n=64) | |
| Dell XPS 17 9720 RTX 3060 | |
| Lenovo ThinkPad X1 Extreme G4-20Y5CTO1WW (3050 Ti) | |
| HWBOT x265 Benchmark v2.2 / 4k Preset | |
| Media de la clase Multimedia (5.26 - 36.1, n=56, últimos 2 años) | |
| Lenovo ThinkPad X1 Extreme G5-21DE003RGE | |
| Medio Intel Core i7-12700H (4.67 - 21.8, n=64) | |
| Dell XPS 17 9720 RTX 3060 | |
| Dell XPS 15 9520 RTX 3050 Ti | |
| HP Envy 16 h0112nr | |
| Schenker Vision 16 Pro RTX 3070 Ti | |
| Lenovo ThinkPad X1 Extreme G4-20Y5CTO1WW (3050 Ti) | |
| LibreOffice / 20 Documents To PDF | |
| Media de la clase Multimedia (23.9 - 146.7, n=57, últimos 2 años) | |
| Medio Intel Core i7-12700H (34.2 - 95.3, n=63) | |
| HP Envy 16 h0112nr | |
| Schenker Vision 16 Pro RTX 3070 Ti | |
| Dell XPS 17 9720 RTX 3060 | |
| Lenovo ThinkPad X1 Extreme G4-20Y5CTO1WW (3050 Ti) | |
| Dell XPS 15 9520 RTX 3050 Ti | |
| Lenovo ThinkPad X1 Extreme G5-21DE003RGE | |
| R Benchmark 2.5 / Overall mean | |
| Lenovo ThinkPad X1 Extreme G4-20Y5CTO1WW (3050 Ti) | |
| Medio Intel Core i7-12700H (0.4441 - 1.052, n=63) | |
| Media de la clase Multimedia (0.3604 - 0.947, n=56, últimos 2 años) | |
| Lenovo ThinkPad X1 Extreme G5-21DE003RGE | |
| Dell XPS 17 9720 RTX 3060 | |
| HP Envy 16 h0112nr | |
| Schenker Vision 16 Pro RTX 3070 Ti | |
| Dell XPS 15 9520 RTX 3050 Ti | |
* ... más pequeño es mejor
AIDA64: FP32 Ray-Trace | FPU Julia | CPU SHA3 | CPU Queen | FPU SinJulia | FPU Mandel | CPU AES | CPU ZLib | FP64 Ray-Trace | CPU PhotoWorxx
| Performance rating | |
| Media de la clase Multimedia | |
| Lenovo ThinkPad X1 Extreme G5-21DE003RGE | |
| Lenovo ThinkPad X1 Extreme G4-20Y5CTO1WW (3050 Ti) | |
| HP Envy 16 h0112nr | |
| Schenker Vision 16 Pro RTX 3070 Ti | |
| Medio Intel Core i7-12700H | |
| Dell XPS 17 9720 RTX 3060 | |
| Dell XPS 15 9520 RTX 3050 Ti | |
| AIDA64 / FP32 Ray-Trace | |
| Media de la clase Multimedia (2214 - 50388, n=53, últimos 2 años) | |
| Lenovo ThinkPad X1 Extreme G5-21DE003RGE | |
| Lenovo ThinkPad X1 Extreme G4-20Y5CTO1WW (3050 Ti) | |
| Schenker Vision 16 Pro RTX 3070 Ti | |
| HP Envy 16 h0112nr | |
| Medio Intel Core i7-12700H (2585 - 17957, n=64) | |
| Dell XPS 15 9520 RTX 3050 Ti | |
| Dell XPS 17 9720 RTX 3060 | |
| AIDA64 / FPU Julia | |
| Media de la clase Multimedia (12867 - 201874, n=54, últimos 2 años) | |
| Lenovo ThinkPad X1 Extreme G5-21DE003RGE | |
| Schenker Vision 16 Pro RTX 3070 Ti | |
| Lenovo ThinkPad X1 Extreme G4-20Y5CTO1WW (3050 Ti) | |
| HP Envy 16 h0112nr | |
| Medio Intel Core i7-12700H (12439 - 90760, n=64) | |
| Dell XPS 17 9720 RTX 3060 | |
| Dell XPS 15 9520 RTX 3050 Ti | |
| AIDA64 / CPU SHA3 | |
| Lenovo ThinkPad X1 Extreme G4-20Y5CTO1WW (3050 Ti) | |
| Media de la clase Multimedia (626 - 8623, n=54, últimos 2 años) | |
| Lenovo ThinkPad X1 Extreme G5-21DE003RGE | |
| Medio Intel Core i7-12700H (833 - 4242, n=64) | |
| Schenker Vision 16 Pro RTX 3070 Ti | |
| HP Envy 16 h0112nr | |
| Dell XPS 15 9520 RTX 3050 Ti | |
| Dell XPS 17 9720 RTX 3060 | |
| AIDA64 / CPU Queen | |
| Lenovo ThinkPad X1 Extreme G5-21DE003RGE | |
| HP Envy 16 h0112nr | |
| Dell XPS 17 9720 RTX 3060 | |
| Dell XPS 15 9520 RTX 3050 Ti | |
| Medio Intel Core i7-12700H (57923 - 103202, n=63) | |
| Lenovo ThinkPad X1 Extreme G4-20Y5CTO1WW (3050 Ti) | |
| Schenker Vision 16 Pro RTX 3070 Ti | |
| Media de la clase Multimedia (13483 - 181505, n=41, últimos 2 años) | |
| AIDA64 / FPU SinJulia | |
| Lenovo ThinkPad X1 Extreme G5-21DE003RGE | |
| Lenovo ThinkPad X1 Extreme G4-20Y5CTO1WW (3050 Ti) | |
| Medio Intel Core i7-12700H (3249 - 9939, n=64) | |
| Dell XPS 17 9720 RTX 3060 | |
| Media de la clase Multimedia (886 - 28794, n=54, últimos 2 años) | |
| Dell XPS 15 9520 RTX 3050 Ti | |
| Schenker Vision 16 Pro RTX 3070 Ti | |
| HP Envy 16 h0112nr | |
| AIDA64 / FPU Mandel | |
| Media de la clase Multimedia (6395 - 105740, n=53, últimos 2 años) | |
| Lenovo ThinkPad X1 Extreme G5-21DE003RGE | |
| Lenovo ThinkPad X1 Extreme G4-20Y5CTO1WW (3050 Ti) | |
| Schenker Vision 16 Pro RTX 3070 Ti | |
| HP Envy 16 h0112nr | |
| Medio Intel Core i7-12700H (7135 - 44760, n=64) | |
| Dell XPS 15 9520 RTX 3050 Ti | |
| Dell XPS 17 9720 RTX 3060 | |
| AIDA64 / CPU AES | |
| Lenovo ThinkPad X1 Extreme G4-20Y5CTO1WW (3050 Ti) | |
| HP Envy 16 h0112nr | |
| Medio Intel Core i7-12700H (31839 - 144360, n=64) | |
| Dell XPS 15 9520 RTX 3050 Ti | |
| Dell XPS 17 9720 RTX 3060 | |
| Lenovo ThinkPad X1 Extreme G5-21DE003RGE | |
| Media de la clase Multimedia (8171 - 126790, n=54, últimos 2 años) | |
| Schenker Vision 16 Pro RTX 3070 Ti | |
| AIDA64 / CPU ZLib | |
| Lenovo ThinkPad X1 Extreme G5-21DE003RGE | |
| Media de la clase Multimedia (143.8 - 2022, n=54, últimos 2 años) | |
| Medio Intel Core i7-12700H (305 - 1171, n=64) | |
| Dell XPS 17 9720 RTX 3060 | |
| Schenker Vision 16 Pro RTX 3070 Ti | |
| Dell XPS 15 9520 RTX 3050 Ti | |
| HP Envy 16 h0112nr | |
| Lenovo ThinkPad X1 Extreme G4-20Y5CTO1WW (3050 Ti) | |
| AIDA64 / FP64 Ray-Trace | |
| Media de la clase Multimedia (1014 - 26875, n=54, últimos 2 años) | |
| Lenovo ThinkPad X1 Extreme G5-21DE003RGE | |
| Lenovo ThinkPad X1 Extreme G4-20Y5CTO1WW (3050 Ti) | |
| Schenker Vision 16 Pro RTX 3070 Ti | |
| HP Envy 16 h0112nr | |
| Medio Intel Core i7-12700H (1437 - 9692, n=64) | |
| Dell XPS 15 9520 RTX 3050 Ti | |
| Dell XPS 17 9720 RTX 3060 | |
| AIDA64 / CPU PhotoWorxx | |
| Media de la clase Multimedia (8187 - 88154, n=54, últimos 2 años) | |
| Schenker Vision 16 Pro RTX 3070 Ti | |
| Dell XPS 17 9720 RTX 3060 | |
| HP Envy 16 h0112nr | |
| Dell XPS 15 9520 RTX 3050 Ti | |
| Medio Intel Core i7-12700H (12863 - 52207, n=64) | |
| Lenovo ThinkPad X1 Extreme G5-21DE003RGE | |
| Lenovo ThinkPad X1 Extreme G4-20Y5CTO1WW (3050 Ti) | |
Rendimiento del sistema
El ThinkPad X1 Extreme G5 es básicamente un dispositivo muy rápido y sensible, pero la ausencia de una configuración RAM dual-channel es notable, especialmente en las pruebas sintéticas. Aunque es posible ampliar fácilmente la RAM, los 32 GB integrados deberían ser más que suficientes incluso para la mayoría de usuarios. Sin embargo, una configuración de fábrica de 2 x 16 GB habría sido una elección más sensata. Como mencionamos al principio, experimentamos problemas de rendimiento ocasionales con Windows 10 y por esta razón recomendaríamos no actualizar a Windows 11 Pro.
CrossMark: Overall | Productivity | Creativity | Responsiveness
| PCMark 10 / Score | |
| Media de la clase Multimedia (4325 - 10386, n=52, últimos 2 años) | |
| HP Envy 16 h0112nr | |
| Dell XPS 17 9720 RTX 3060 | |
| Lenovo ThinkPad X1 Extreme G5-21DE003RGE | |
| Medio Intel Core i7-12700H, NVIDIA GeForce RTX 3060 Laptop GPU (5986 - 8156, n=12) | |
| Dell XPS 15 9520 RTX 3050 Ti | |
| Lenovo ThinkPad X1 Extreme G4-20Y5CTO1WW (3050 Ti) | |
| PCMark 10 / Essentials | |
| HP Envy 16 h0112nr | |
| Dell XPS 15 9520 RTX 3050 Ti | |
| Lenovo ThinkPad X1 Extreme G4-20Y5CTO1WW (3050 Ti) | |
| Dell XPS 17 9720 RTX 3060 | |
| Medio Intel Core i7-12700H, NVIDIA GeForce RTX 3060 Laptop GPU (9289 - 12144, n=12) | |
| Lenovo ThinkPad X1 Extreme G5-21DE003RGE | |
| Media de la clase Multimedia (8025 - 11664, n=51, últimos 2 años) | |
| PCMark 10 / Productivity | |
| Media de la clase Multimedia (7323 - 18233, n=51, últimos 2 años) | |
| Dell XPS 15 9520 RTX 3050 Ti | |
| Dell XPS 17 9720 RTX 3060 | |
| Lenovo ThinkPad X1 Extreme G5-21DE003RGE | |
| HP Envy 16 h0112nr | |
| Medio Intel Core i7-12700H, NVIDIA GeForce RTX 3060 Laptop GPU (6161 - 10362, n=12) | |
| Lenovo ThinkPad X1 Extreme G4-20Y5CTO1WW (3050 Ti) | |
| PCMark 10 / Digital Content Creation | |
| Medio Intel Core i7-12700H, NVIDIA GeForce RTX 3060 Laptop GPU (8950 - 12554, n=12) | |
| HP Envy 16 h0112nr | |
| Media de la clase Multimedia (3651 - 16240, n=51, últimos 2 años) | |
| Lenovo ThinkPad X1 Extreme G5-21DE003RGE | |
| Dell XPS 17 9720 RTX 3060 | |
| Dell XPS 15 9520 RTX 3050 Ti | |
| Lenovo ThinkPad X1 Extreme G4-20Y5CTO1WW (3050 Ti) | |
| CrossMark / Overall | |
| Dell XPS 17 9720 RTX 3060 | |
| Media de la clase Multimedia (866 - 2728, n=60, últimos 2 años) | |
| Dell XPS 15 9520 RTX 3050 Ti | |
| HP Envy 16 h0112nr | |
| Medio Intel Core i7-12700H, NVIDIA GeForce RTX 3060 Laptop GPU (1649 - 2017, n=11) | |
| Lenovo ThinkPad X1 Extreme G5-21DE003RGE | |
| Schenker Vision 16 Pro RTX 3070 Ti | |
| Apple MacBook Pro 16 2021 M1 Pro | |
| CrossMark / Productivity | |
| Dell XPS 15 9520 RTX 3050 Ti | |
| Media de la clase Multimedia (931 - 2489, n=60, últimos 2 años) | |
| Dell XPS 17 9720 RTX 3060 | |
| HP Envy 16 h0112nr | |
| Medio Intel Core i7-12700H, NVIDIA GeForce RTX 3060 Laptop GPU (1536 - 1958, n=11) | |
| Lenovo ThinkPad X1 Extreme G5-21DE003RGE | |
| Schenker Vision 16 Pro RTX 3070 Ti | |
| Apple MacBook Pro 16 2021 M1 Pro | |
| CrossMark / Creativity | |
| Media de la clase Multimedia (907 - 3465, n=60, últimos 2 años) | |
| Dell XPS 17 9720 RTX 3060 | |
| Apple MacBook Pro 16 2021 M1 Pro | |
| HP Envy 16 h0112nr | |
| Dell XPS 15 9520 RTX 3050 Ti | |
| Medio Intel Core i7-12700H, NVIDIA GeForce RTX 3060 Laptop GPU (1816 - 2084, n=11) | |
| Lenovo ThinkPad X1 Extreme G5-21DE003RGE | |
| Schenker Vision 16 Pro RTX 3070 Ti | |
| CrossMark / Responsiveness | |
| Dell XPS 15 9520 RTX 3050 Ti | |
| Dell XPS 17 9720 RTX 3060 | |
| Medio Intel Core i7-12700H, NVIDIA GeForce RTX 3060 Laptop GPU (1210 - 2207, n=11) | |
| HP Envy 16 h0112nr | |
| Media de la clase Multimedia (605 - 2024, n=60, últimos 2 años) | |
| Lenovo ThinkPad X1 Extreme G5-21DE003RGE | |
| Schenker Vision 16 Pro RTX 3070 Ti | |
| Apple MacBook Pro 16 2021 M1 Pro | |
| PCMark 10 Score | 7243 puntos | |
ayuda | ||
| AIDA64 / Memory Copy | |
| Media de la clase Multimedia (11299 - 132135, n=54, últimos 2 años) | |
| Schenker Vision 16 Pro RTX 3070 Ti | |
| Dell XPS 17 9720 RTX 3060 | |
| Dell XPS 15 9520 RTX 3050 Ti | |
| HP Envy 16 h0112nr | |
| Medio Intel Core i7-12700H (25615 - 80511, n=64) | |
| Lenovo ThinkPad X1 Extreme G4-20Y5CTO1WW (3050 Ti) | |
| Lenovo ThinkPad X1 Extreme G5-21DE003RGE | |
| AIDA64 / Memory Read | |
| Media de la clase Multimedia (11624 - 174586, n=54, últimos 2 años) | |
| Dell XPS 17 9720 RTX 3060 | |
| HP Envy 16 h0112nr | |
| Schenker Vision 16 Pro RTX 3070 Ti | |
| Dell XPS 15 9520 RTX 3050 Ti | |
| Medio Intel Core i7-12700H (25586 - 79442, n=64) | |
| Lenovo ThinkPad X1 Extreme G4-20Y5CTO1WW (3050 Ti) | |
| Lenovo ThinkPad X1 Extreme G5-21DE003RGE | |
| AIDA64 / Memory Write | |
| Media de la clase Multimedia (11755 - 134998, n=54, últimos 2 años) | |
| Schenker Vision 16 Pro RTX 3070 Ti | |
| Dell XPS 17 9720 RTX 3060 | |
| HP Envy 16 h0112nr | |
| Dell XPS 15 9520 RTX 3050 Ti | |
| Medio Intel Core i7-12700H (23679 - 88660, n=64) | |
| Lenovo ThinkPad X1 Extreme G4-20Y5CTO1WW (3050 Ti) | |
| Lenovo ThinkPad X1 Extreme G5-21DE003RGE | |
| AIDA64 / Memory Latency | |
| Media de la clase Multimedia (7 - 535, n=53, últimos 2 años) | |
| Dell XPS 15 9520 RTX 3050 Ti | |
| Dell XPS 17 9720 RTX 3060 | |
| Schenker Vision 16 Pro RTX 3070 Ti | |
| HP Envy 16 h0112nr | |
| Lenovo ThinkPad X1 Extreme G5-21DE003RGE | |
| Lenovo ThinkPad X1 Extreme G4-20Y5CTO1WW (3050 Ti) | |
| Medio Intel Core i7-12700H (76.2 - 133.9, n=62) | |
* ... más pequeño es mejor
Latencias del CPD
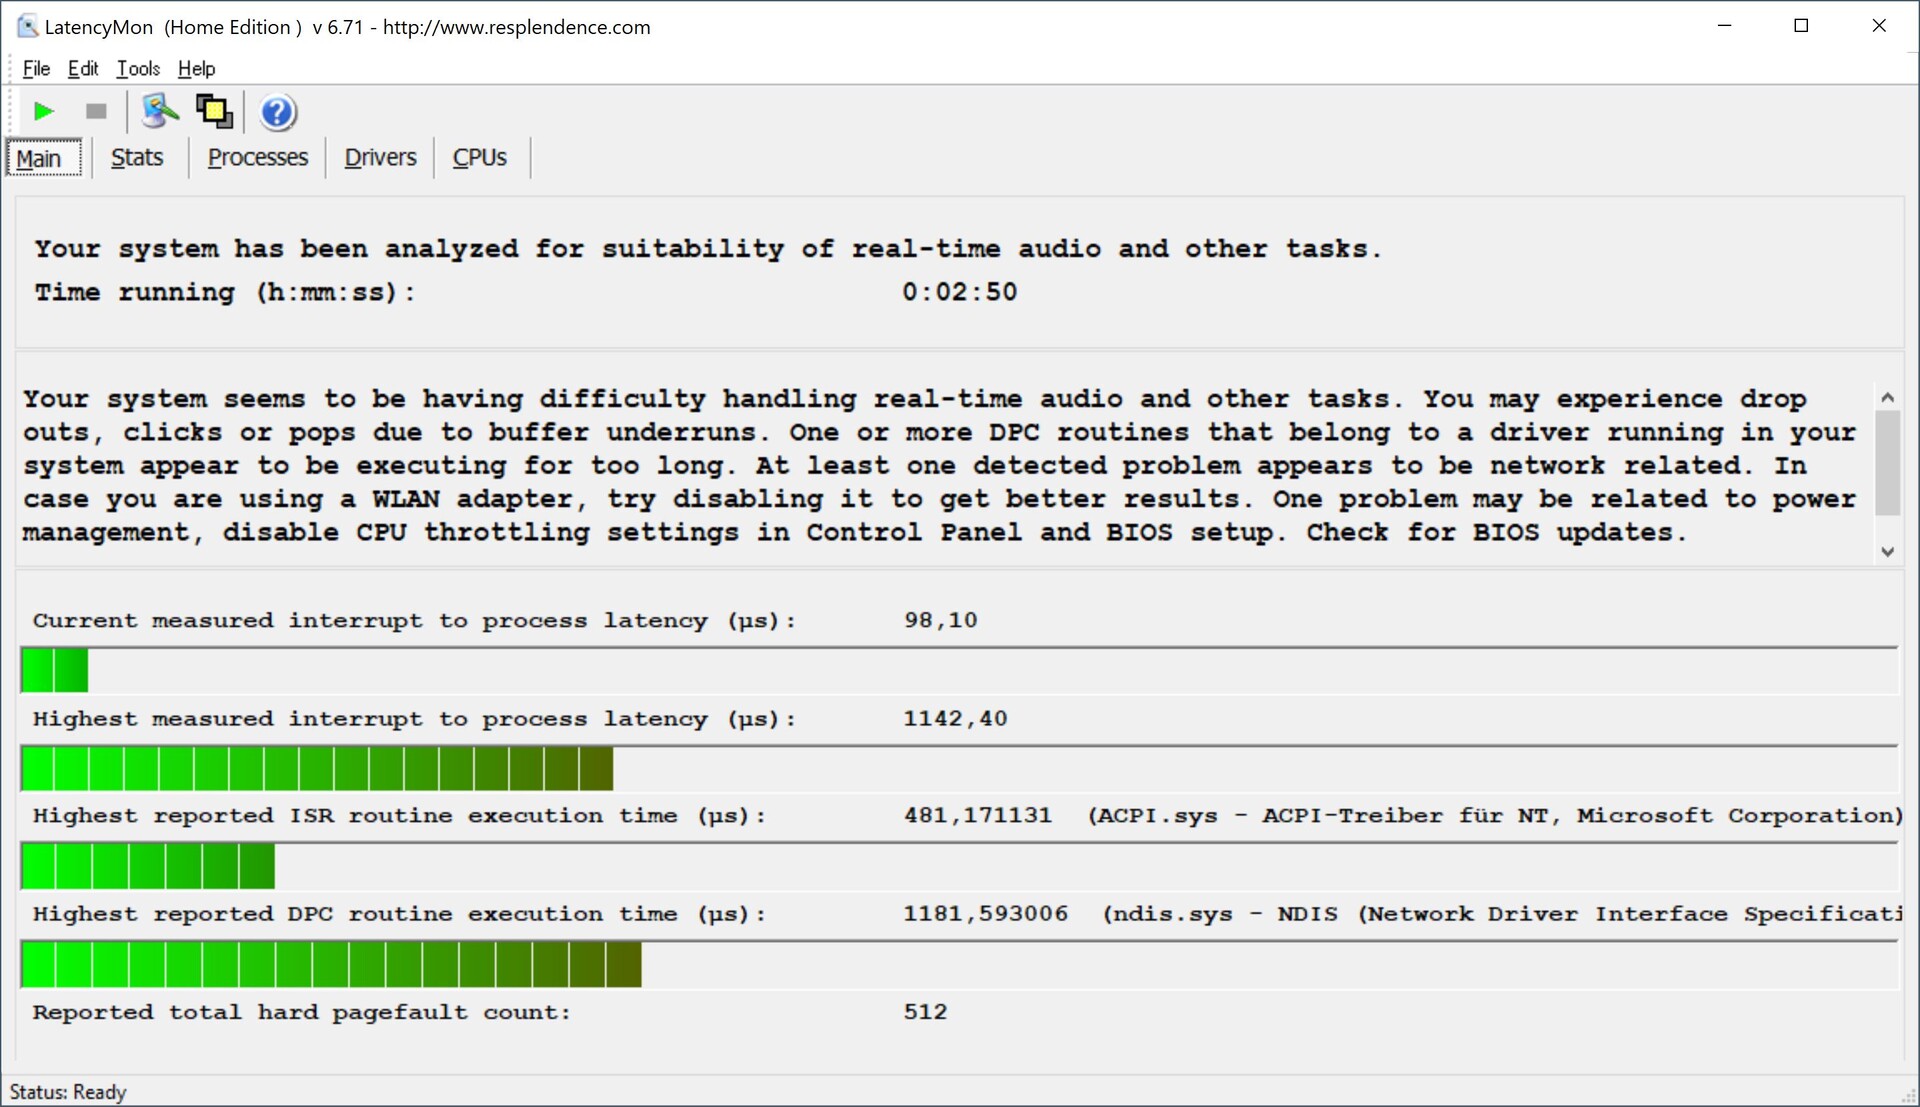
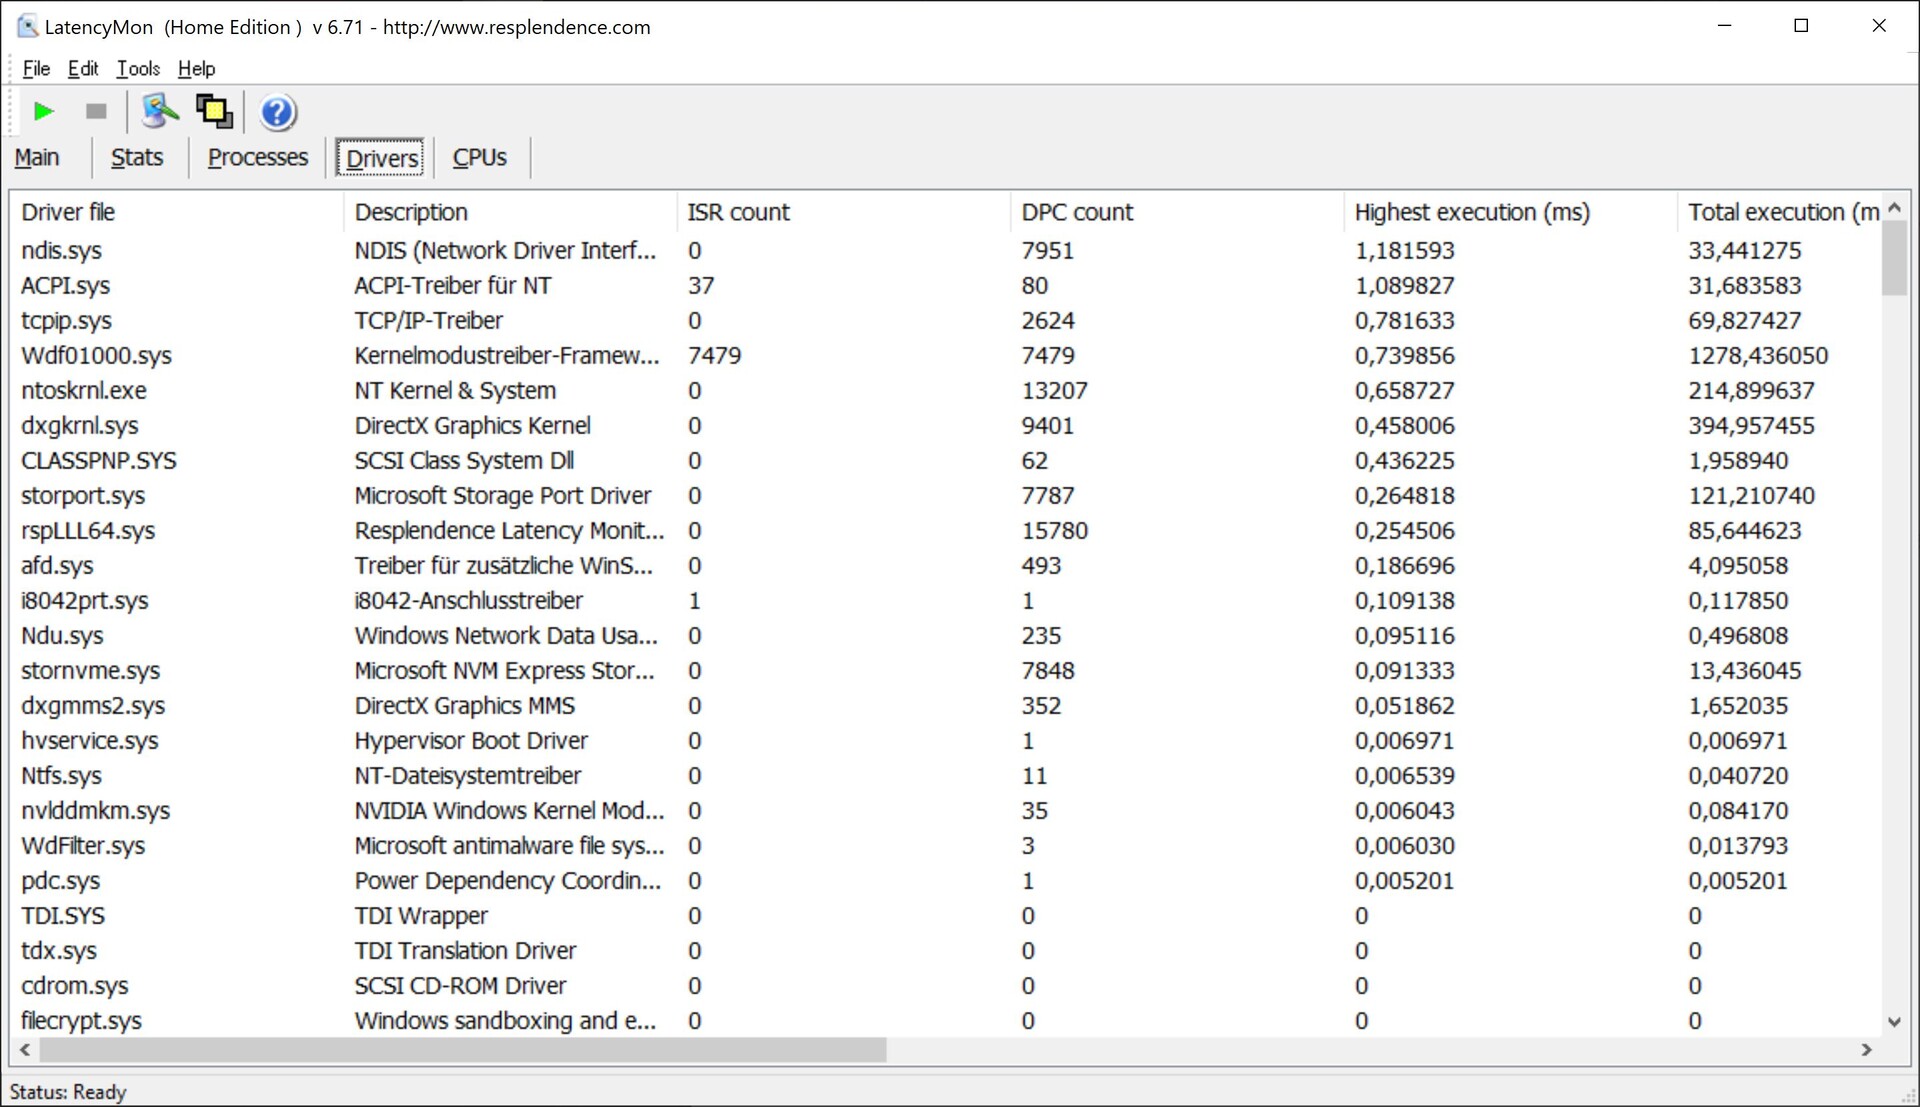
En nuestra prueba de latencia estandarizada (navegación por Internet, reproducción 4K de YouTube, carga de la CPU), el dispositivo de análisis demuestra algunas limitaciones con la versión actual de la BIOS y, por tanto, es más adecuado para el uso de aplicaciones de audio en tiempo real.
| DPC Latencies / LatencyMon - interrupt to process latency (max), Web, Youtube, Prime95 | |
| Lenovo ThinkPad X1 Extreme G5-21DE003RGE | |
| Lenovo ThinkPad X1 Extreme G4-20Y5CTO1WW (3050 Ti) | |
| Dell XPS 15 9520 RTX 3050 Ti | |
| HP Envy 16 h0112nr | |
| Schenker Vision 16 Pro RTX 3070 Ti | |
| Dell XPS 17 9720 RTX 3060 | |
* ... más pequeño es mejor
Almacenamiento masivo
En nuestro dispositivo de pruebas, Lenovo equipó el X1 Extreme G5 con un veloz SSD PCIe 4.0 de Micron (3400) que ofrece una capacidad de almacenamiento de 1 TB de la que hay 900 GB disponibles tras la primera instalación. Con todo, hay disponibles unidades PCIe 4.0 algo más rápidas, sin embargo, la diferencia en la práctica es insignificante y el dispositivo también permanece completamente estable durante cargas más largas. Se pueden encontrar más pruebas de SSD aquí.Laptop solid state disks (HDD, SSD) benchmarks

* ... más pequeño es mejor
Continuous load read: DiskSpd Read Loop, Queue Depth 8
Tarjeta gráfica
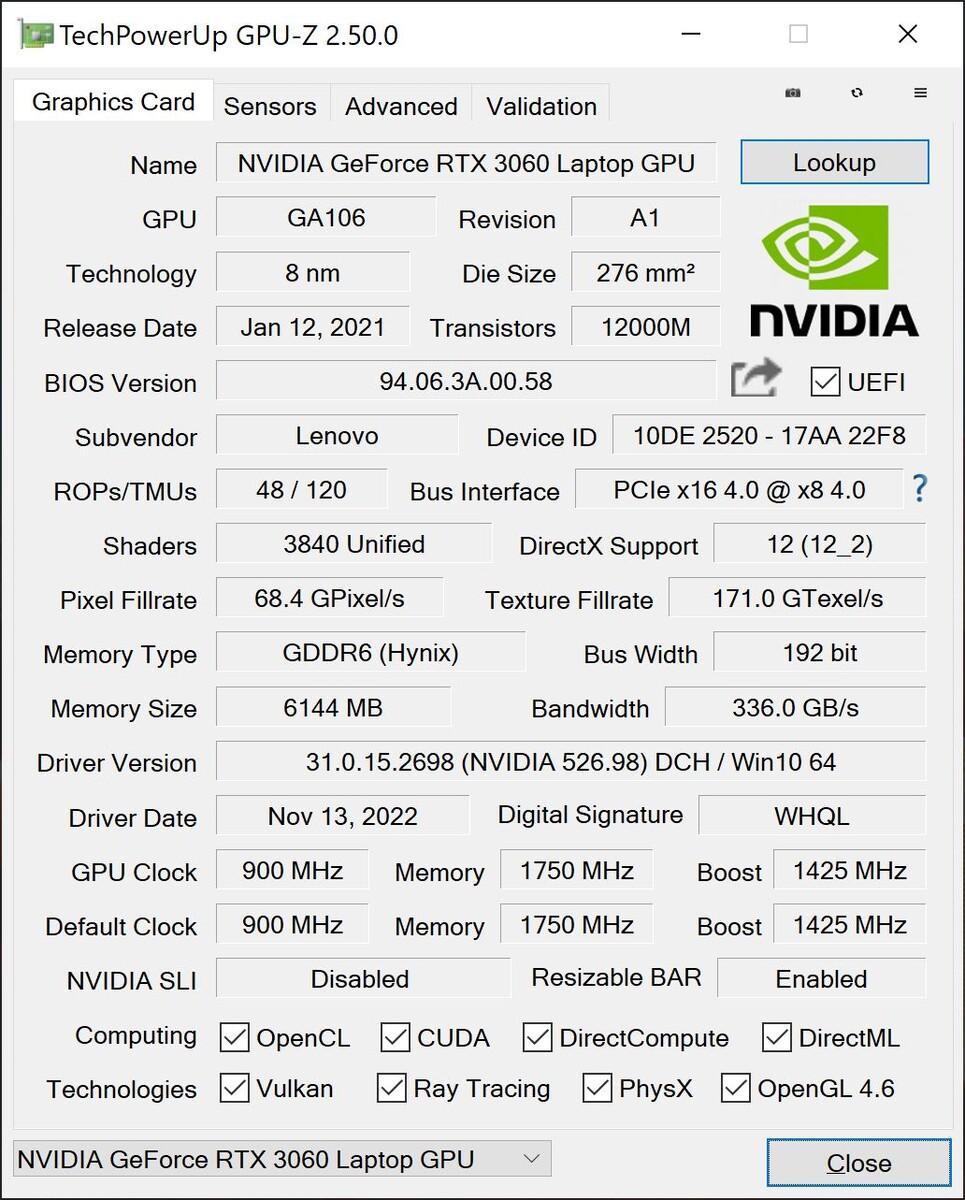
Lenovo utiliza la versión de 80 vatios de laNvidia GeForce RTX 3060. La GPU también puede usar 15 vatios de refuerzo dinámico, lo que le permite usar un total de 95 vatios. La RTX 3060 ofrece 6 GB de VRAM GDDR6 y el sistema puede alternar dinámicamente entre la GPU integrada y la dedicada mediante la tecnología Optimus. Suponemos que las dos GPU opcionales RTX 3070 Tiy RTX 3080 Tison las versiones más lentas, ya que pueden usarse con un máximo de 80 y 95 vatios respectivamente
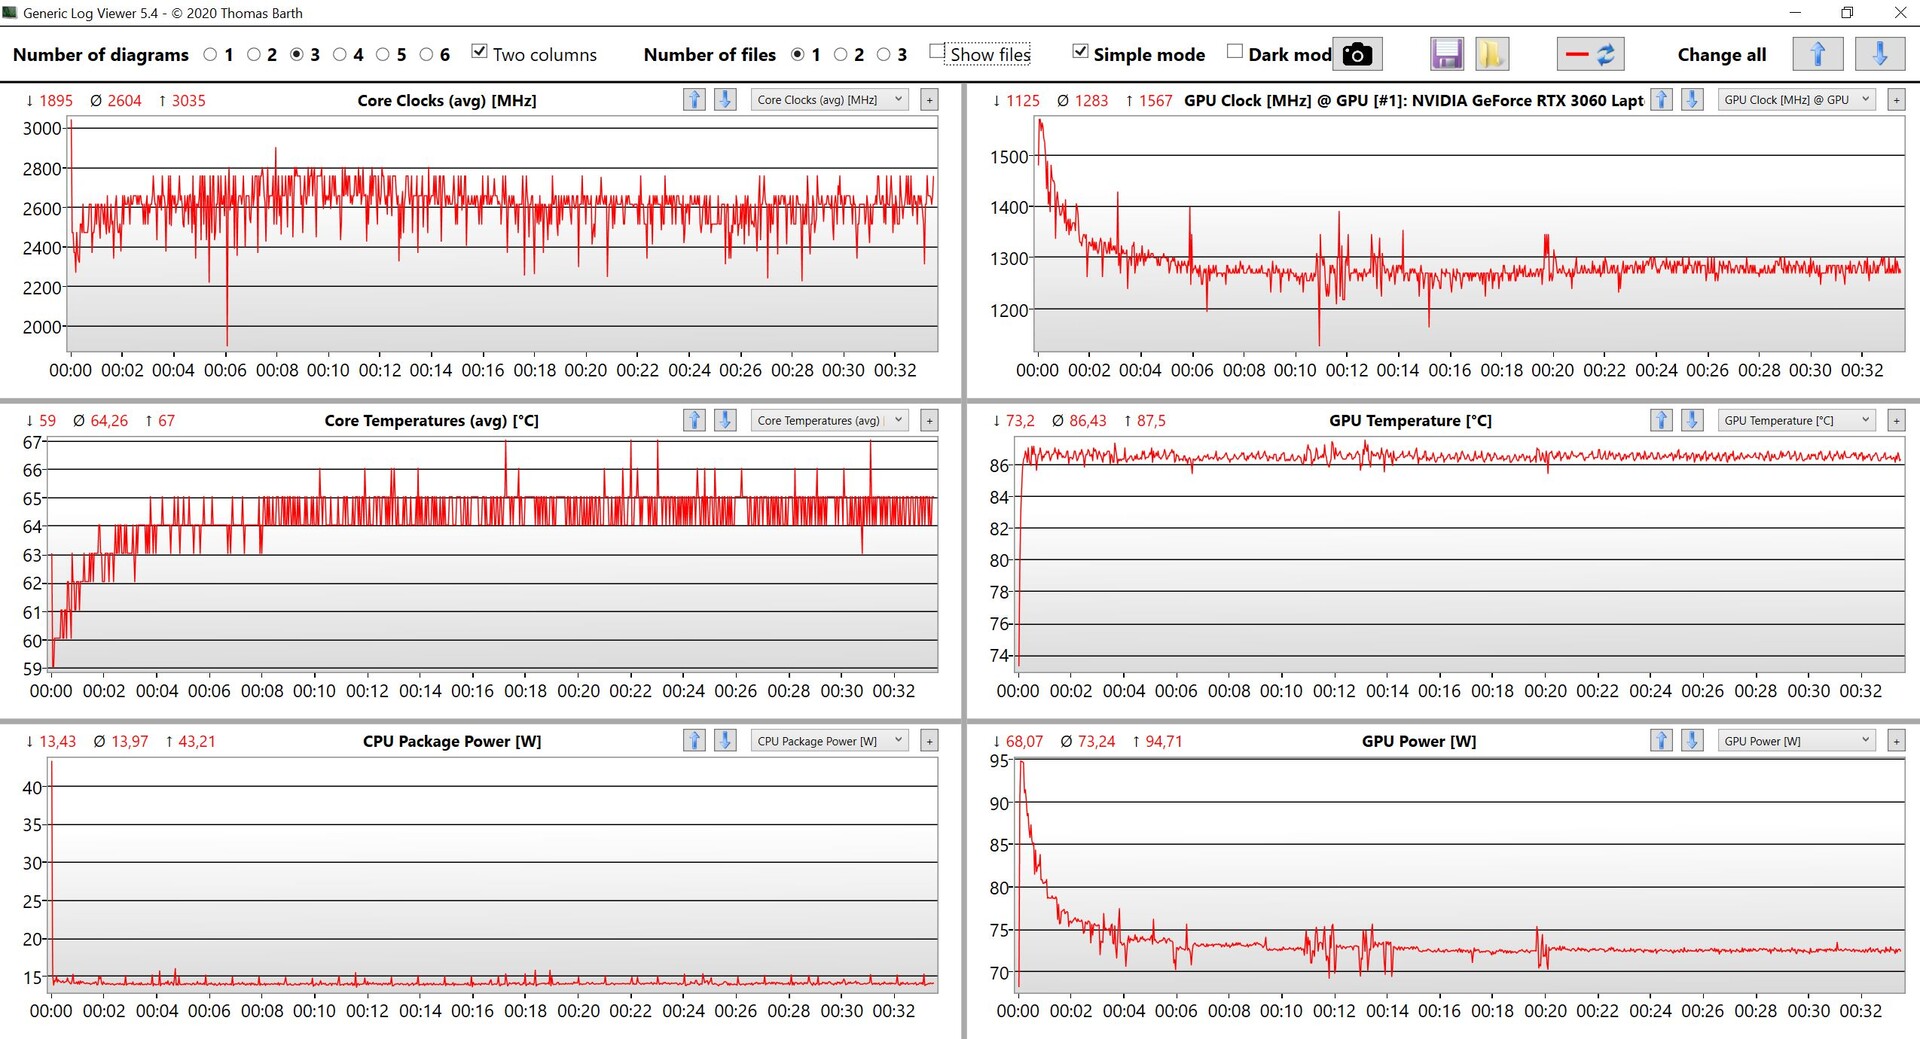
Sin embargo, las pruebas muestran rápidamente que el sistema no puede mantener 95 vatios durante mucho tiempo y la GPU baja rápidamente a 80 vatios. Esto explica el ligero déficit en comparación con el HP Envy 16que está equipado de forma similar con la versión de 90 vatios de la RTX 3060. Además, el ThinkPad no fue capaz de lograr un 91 % de aprobados en el test de estrés 3DMark Time Spy. En modo batería, hay un pequeño déficit de rendimiento de aproximadamente el 30 %. Se pueden encontrar más pruebas de rendimiento de GPU aquí.
| 3DMark 11 Performance | 22654 puntos | |
| 3DMark Fire Strike Score | 15945 puntos | |
| 3DMark Time Spy Score | 7111 puntos | |
ayuda | ||
| Blender / v3.3 Classroom OPTIX/RTX | |
| HP Envy 16 h0112nr | |
| Lenovo ThinkPad X1 Extreme G5-21DE003RGE | |
| Media de la clase Multimedia (12 - 105, n=22, últimos 2 años) | |
| Medio NVIDIA GeForce RTX 3060 Laptop GPU (30 - 56, n=15) | |
| Schenker Vision 16 Pro RTX 3070 Ti | |
| Blender / v3.3 Classroom CUDA | |
| HP Envy 16 h0112nr | |
| Lenovo ThinkPad X1 Extreme G5-21DE003RGE | |
| Media de la clase Multimedia (20 - 186, n=22, últimos 2 años) | |
| Medio NVIDIA GeForce RTX 3060 Laptop GPU (51 - 89, n=15) | |
| Schenker Vision 16 Pro RTX 3070 Ti | |
| Blender / v3.3 Classroom CPU | |
| HP Envy 16 h0112nr | |
| Schenker Vision 16 Pro RTX 3070 Ti | |
| Media de la clase Multimedia (134.5 - 1042, n=62, últimos 2 años) | |
| Medio NVIDIA GeForce RTX 3060 Laptop GPU (291 - 508, n=15) | |
| Lenovo ThinkPad X1 Extreme G5-21DE003RGE | |
* ... más pequeño es mejor
Rendimiento en juegos
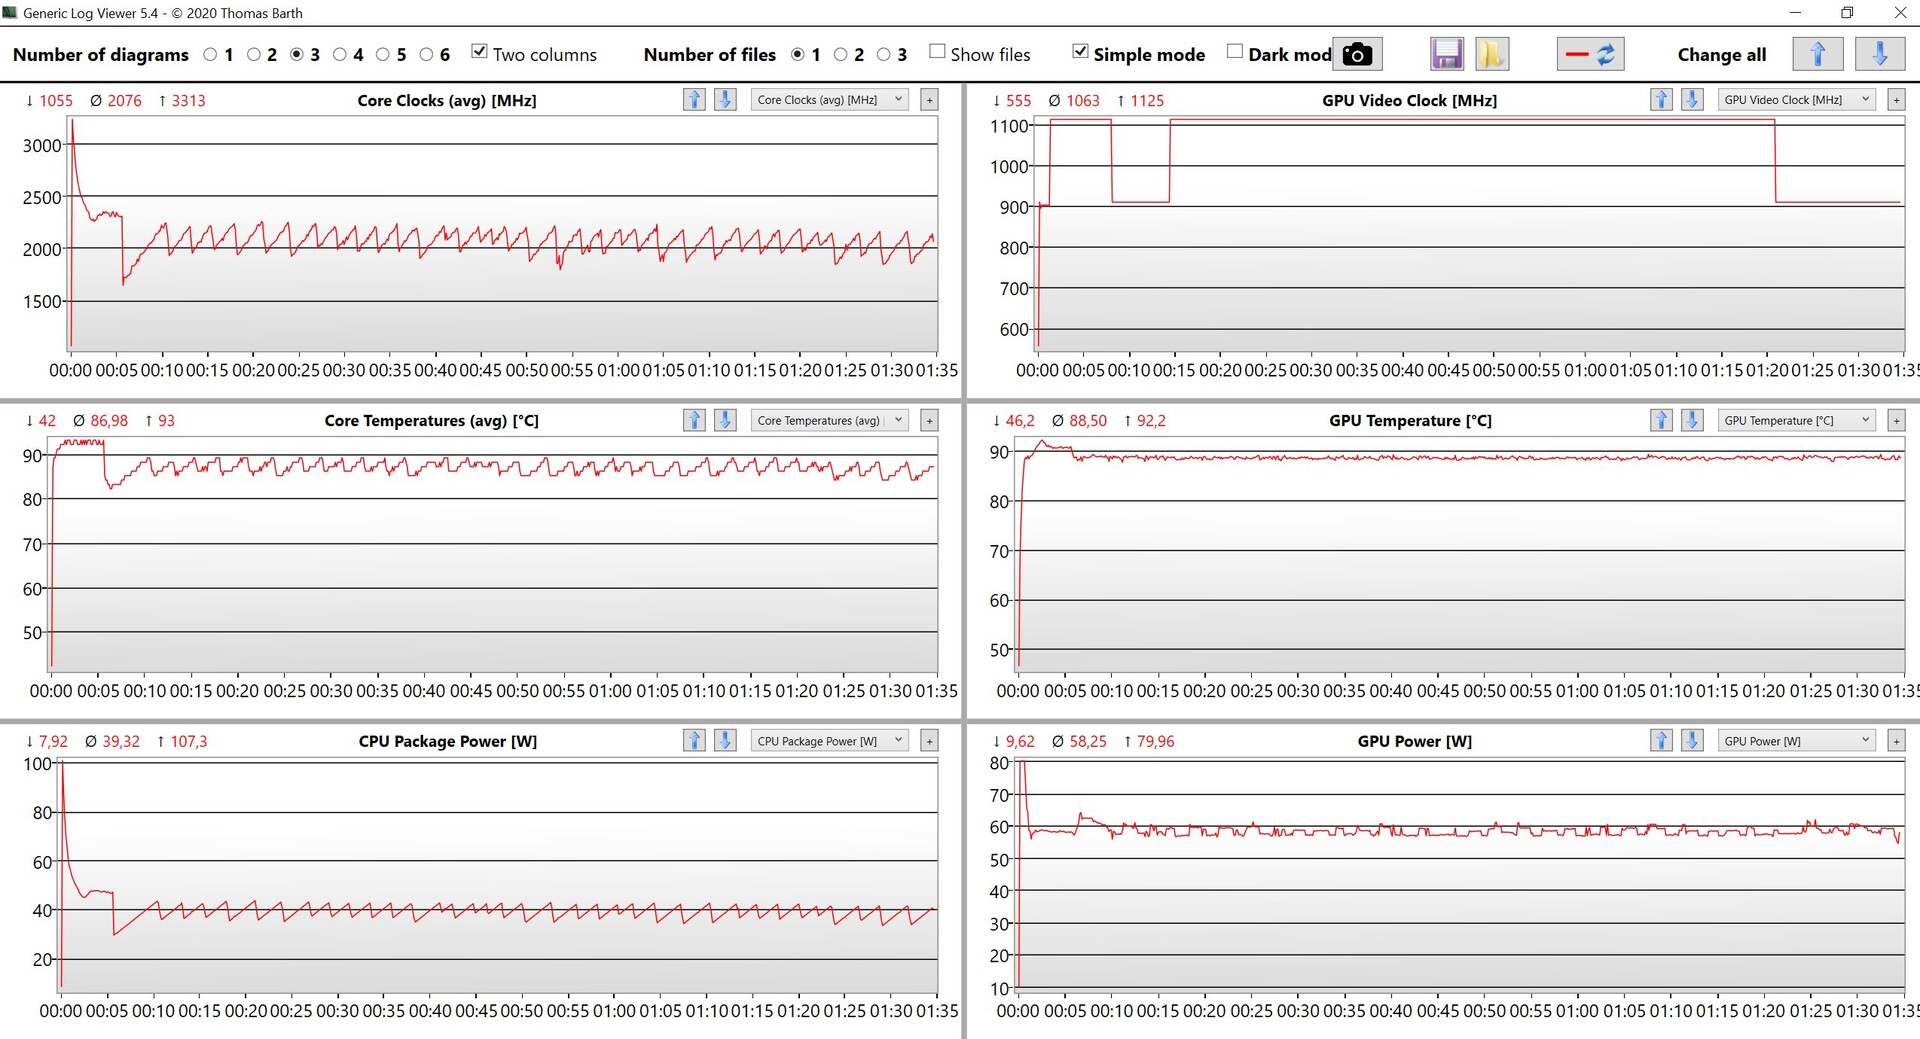
Básicamente, la RTX 3060ofrece una potencia de juego decente, aunque aquí también se nota una caída de rendimiento. La evaluación de nuestro bucle Witcher 3 demuestra que la tarjeta gráfica sólo usa algo más de 70 vatios en cuanto se empuja el procesador. La costosa refrigeración por cámara de vapor es algo decepcionante. Con su RTX 3060, la X1 Extreme G5 RTX 3060 se encuentra por delante de la antigua RTX 3050 Tipero por un margen menor del esperado - algo que no es un buen prerrequisito para la más rápida y cara RTX 3070 Ti y RTX 3080 Ti GeForce.
En general, la RTX 3060 del X1 Extreme G5 ofrece rendimiento suficiente para configuraciones de detalle altas, y en algunos casos máximas, a 1080p y, según el título, incluso a resolución QHD. Para resolución 4K nativa, la GPU es demasiado débil. Otras pruebas de juego se enumeran aquí.
| The Witcher 3 - 1920x1080 Ultra Graphics & Postprocessing (HBAO+) | |
| Schenker Vision 16 Pro RTX 3070 Ti | |
| HP Envy 16 h0112nr | |
| Dell XPS 17 9720 RTX 3060 | |
| Lenovo ThinkPad X1 Extreme G5-21DE003RGE | |
| Media de la clase Multimedia (11 - 121, n=7, últimos 2 años) | |
| Lenovo ThinkPad X1 Extreme G4-20Y5CTO1WW (3050 Ti) | |
| Dell XPS 15 9520 RTX 3050 Ti | |
| Final Fantasy XV Benchmark - 1920x1080 High Quality | |
| Schenker Vision 16 Pro RTX 3070 Ti | |
| HP Envy 16 h0112nr | |
| Dell XPS 17 9720 RTX 3060 | |
| Media de la clase Multimedia (7.61 - 144.4, n=57, últimos 2 años) | |
| Lenovo ThinkPad X1 Extreme G5-21DE003RGE | |
| Dell XPS 15 9520 RTX 3050 Ti | |
Witcher 3 FPS diagram
| bajo | medio | alto | ultra | QHD | 4K | |
|---|---|---|---|---|---|---|
| GTA V (2015) | 182.6 | 176.9 | 146.8 | 72 | 52 | 42.8 |
| The Witcher 3 (2015) | 313 | 210 | 126 | 60.5 | 26 | |
| Dota 2 Reborn (2015) | 169.6 | 150.7 | 143.2 | 133.4 | 66.1 | |
| Final Fantasy XV Benchmark (2018) | 123.2 | 70.4 | 55 | 41.1 | 22.9 | |
| X-Plane 11.11 (2018) | 135.1 | 110.1 | 91.6 | 58.5 | ||
| Far Cry 5 (2018) | 148 | 106 | 98 | 92 | 58 | 32 |
| Strange Brigade (2018) | 357 | 154.9 | 115.6 | 102.2 | 75.4 | 40 |
| F1 2021 (2021) | 263 | 163.7 | 128.9 | 76.2 | 47.5 | 25.9 |
| Cyberpunk 2077 1.6 (2022) | 80 | 68 | 48 | 40 | 23 | 11 |
| F1 22 (2022) | 144.2 | 135.2 | 112.9 | 36.6 | 22.8 | 10.6 |
Emisiones: ventiladores más silenciosos en el modelo G5
Emisiones sonoras
Las configuraciones con GeForce RTX 3060 o superior vienen con la refrigeración por cámara de vapor de Lenovo. Ambos ventiladores suelen estar apagados en reposo y suelen ser silenciosos o muy silenciosos a baja carga. Sin embargo, en cuanto se exige más al procesador y/o a la tarjeta gráfica, ambos ventiladores alcanzan su velocidad máxima, lo que corresponde a un nivel de ruido de 45,5 dB(A). Pudimos determinar esta medida tanto durante los juegos como en nuestras pruebas de estrés. De este modo, el nuevo X1 Extreme G5 es notablemente más silencioso que el modeloModelo G4 con su RTX 3050 Ti refrigeración convencional
Los ventiladores más silenciosos son, por supuesto, siempre bienvenidos, pero al menos habríamos preferido un rendimiento de GPU más estable combinado con ventiladores ligeramente más ruidosos usando la configuración de perfil de energía más rápida. No pudimos detectar ningún otro ruido electrónico.
Ruido
| Ocioso |
| 23.2 / 23.2 / 23.2 dB(A) |
| Carga |
| 45.5 / 45.5 dB(A) |
 | ||
30 dB silencioso 40 dB(A) audible 50 dB(A) ruidosamente alto |
||
min: | ||
| Lenovo ThinkPad X1 Extreme G5-21DE003RGE GeForce RTX 3060 Laptop GPU, i7-12700H, Micron 3400 1TB MTFDKBA1T0TFH | HP Envy 16 h0112nr GeForce RTX 3060 Laptop GPU, i7-12700H, Micron 3400 1TB MTFDKBA1T0TFH | Schenker Vision 16 Pro RTX 3070 Ti GeForce RTX 3070 Ti Laptop GPU, i7-12700H, Samsung SSD 980 Pro 1TB MZ-V8P1T0BW | Dell XPS 15 9520 RTX 3050 Ti GeForce RTX 3050 Ti Laptop GPU, i7-12700H, WDC PC SN810 512GB | Apple MacBook Pro 16 2021 M1 Pro M1 Pro 16-Core GPU, M1 Pro, Apple SSD AP1024R | Dell XPS 17 9720 RTX 3060 GeForce RTX 3060 Laptop GPU, i7-12700H, Samsung PM9A1 MZVL21T0HCLR | Lenovo ThinkPad X1 Extreme G4-20Y5CTO1WW (3050 Ti) GeForce RTX 3050 Ti Laptop GPU, i7-11800H, Samsung PM9A1 MZVL21T0HCLR | |
|---|---|---|---|---|---|---|---|
| Noise | -6% | -3% | 8% | 6% | -3% | -4% | |
| apagado / medio ambiente * (dB) | 23.2 | 22.8 2% | 22.9 1% | 22.8 2% | 24.7 -6% | 23.8 -3% | 23.52 -1% |
| Idle Minimum * (dB) | 23.2 | 22.9 1% | 24.3 -5% | 22.9 1% | 24.7 -6% | 24.1 -4% | 23.52 -1% |
| Idle Average * (dB) | 23.2 | 22.9 1% | 24.3 -5% | 22.9 1% | 24.7 -6% | 24.1 -4% | 23.52 -1% |
| Idle Maximum * (dB) | 23.2 | 30.5 -31% | 24.3 -5% | 22.9 1% | 24.7 -6% | 24.1 -4% | 23.52 -1% |
| Load Average * (dB) | 45.5 | 41.4 9% | 38.5 15% | 30.9 32% | 26.1 43% | 43.2 5% | 42.9 6% |
| Witcher 3 ultra * (dB) | 45.5 | 51.1 -12% | 51 -12% | 37.8 17% | 48 -5% | 52.5 -15% | |
| Load Maximum * (dB) | 45.5 | 51.4 -13% | 51 -12% | 44.7 2% | 37.4 18% | 48 -5% | 52.45 -15% |
* ... más pequeño es mejor
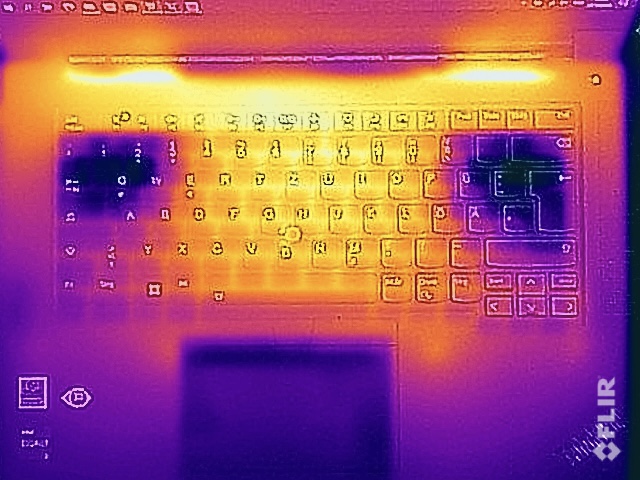
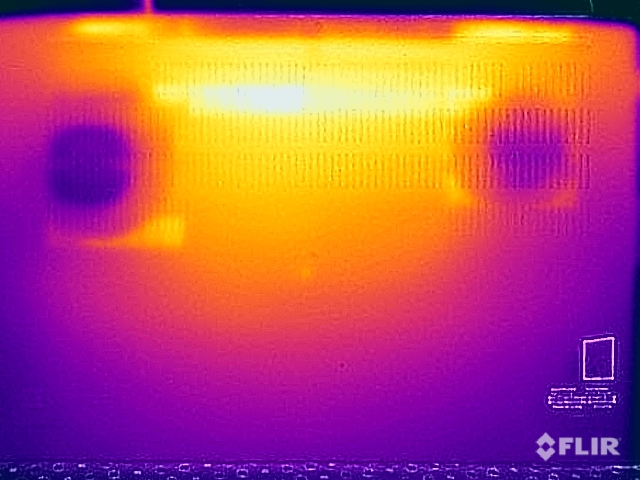
Temperatura

Recientemente, Lenovo ha estado utilizando una pasta térmica de metal líquido en la CPU que ya ha tenido un efecto positivo en el rendimiento de la CPU. Sin embargo, las cosas se calientan bajo carga y está relacionado con los ventiladores más lentos. Tanto durante los juegos como durante el test de estrés, medimos más de 55 °C en la parte inferior y 50 °C en la superior de la unidad base, respectivamente. Bajo carga, no es aconsejable poner el dispositivo en el regazo del usuario y también cabe esperar dedos calientes al teclear. Sin embargo, no hay problemas de temperatura durante las tareas cotidianas.
En las pruebas de estrés, la CPU y la GPU se nivelan rápidamente a 40 y 60 vatios, respectivamente, lo que significa que el sistema es capaz de enfriar un total de 100 vatios. A 90 °C, ambos componentes se calientan rápidamente. Al finalizar la prueba de estrés no se produjo ninguna caída del rendimiento.
(-) La temperatura máxima en la parte superior es de 52 °C / 126 F, frente a la media de 36.8 °C / 98 F, que oscila entre 21 y 71 °C para la clase Multimedia.
(-) El fondo se calienta hasta un máximo de 56.4 °C / 134 F, frente a la media de 39.1 °C / 102 F
(+) En reposo, la temperatura media de la parte superior es de 25.6 °C / 78# F, frente a la media del dispositivo de 31.3 °C / 88 F.
(-) Jugando a The Witcher 3, la temperatura media de la parte superior es de 41.1 °C / 106 F, frente a la media del dispositivo de 31.3 °C / 88 F.
(±) El reposamanos y el touchpad pueden calentarse mucho al tacto con un máximo de 36.1 °C / 97 F.
(-) La temperatura media de la zona del reposamanos de dispositivos similares fue de 28.7 °C / 83.7 F (-7.4 °C / -13.3 F).
| Lenovo ThinkPad X1 Extreme G5-21DE003RGE Intel Core i7-12700H, NVIDIA GeForce RTX 3060 Laptop GPU | HP Envy 16 h0112nr Intel Core i7-12700H, NVIDIA GeForce RTX 3060 Laptop GPU | Schenker Vision 16 Pro RTX 3070 Ti Intel Core i7-12700H, NVIDIA GeForce RTX 3070 Ti Laptop GPU | Dell XPS 15 9520 RTX 3050 Ti Intel Core i7-12700H, NVIDIA GeForce RTX 3050 Ti Laptop GPU | Apple MacBook Pro 16 2021 M1 Pro Apple M1 Pro, Apple M1 Pro 16-Core GPU | Dell XPS 17 9720 RTX 3060 Intel Core i7-12700H, NVIDIA GeForce RTX 3060 Laptop GPU | Lenovo ThinkPad X1 Extreme G4-20Y5CTO1WW (3050 Ti) Intel Core i7-11800H, NVIDIA GeForce RTX 3050 Ti Laptop GPU | |
|---|---|---|---|---|---|---|---|
| Heat | -3% | 5% | -6% | 18% | -8% | -1% | |
| Maximum Upper Side * (°C) | 52 | 45.2 13% | 50.8 2% | 51.4 1% | 41 21% | 51.8 -0% | 49 6% |
| Maximum Bottom * (°C) | 56.4 | 44 22% | 46.3 18% | 51 10% | 39 31% | 44.2 22% | 44.4 21% |
| Idle Upper Side * (°C) | 26.4 | 33.6 -27% | 27.2 -3% | 30 -14% | 24 9% | 34.8 -32% | 32.1 -22% |
| Idle Bottom * (°C) | 27.2 | 32.6 -20% | 26.6 2% | 33 -21% | 24 12% | 33.2 -22% | 29.8 -10% |
* ... más pequeño es mejor
Altavoces
Lenovo sigue equipando el dispositivo con dos altavoces estéreo que no sólo son capaces de emitir 20 vatios, sino que también producen un sonido decente. Sin embargo, el resultado no es tan potente como el de competidores con más módulos como elMacBook Pro 16con seis altavoces, o el XPS 17con cuatro.
Lenovo ThinkPad X1 Extreme G5-21DE003RGE análisis de audio
(±) | la sonoridad del altavoz es media pero buena (81.4 dB)
Graves 100 - 315 Hz
(±) | lubina reducida - en promedio 11.5% inferior a la mediana
(±) | la linealidad de los graves es media (10.6% delta a frecuencia anterior)
Medios 400 - 2000 Hz
(±) | medias más altas - de media 6.1% más altas que la mediana
(+) | los medios son lineales (4.6% delta a la frecuencia anterior)
Altos 2 - 16 kHz
(+) | máximos equilibrados - a sólo 3.4% de la mediana
(+) | los máximos son lineales (4.2% delta a la frecuencia anterior)
Total 100 - 16.000 Hz
(+) | el sonido global es lineal (14.5% de diferencia con la mediana)
En comparación con la misma clase
» 34% de todos los dispositivos probados de esta clase eran mejores, 4% similares, 61% peores
» El mejor tuvo un delta de 5%, la media fue 17%, el peor fue ###max##%
En comparación con todos los dispositivos probados
» 18% de todos los dispositivos probados eran mejores, 4% similares, 77% peores
» El mejor tuvo un delta de 4%, la media fue 23%, el peor fue ###max##%
Apple MacBook Pro 16 2021 M1 Pro análisis de audio
(+) | los altavoces pueden reproducir a un volumen relativamente alto (#84.7 dB)
Graves 100 - 315 Hz
(+) | buen bajo - sólo 3.8% lejos de la mediana
(+) | el bajo es lineal (5.2% delta a la frecuencia anterior)
Medios 400 - 2000 Hz
(+) | medios equilibrados - a sólo 1.3% de la mediana
(+) | los medios son lineales (2.1% delta a la frecuencia anterior)
Altos 2 - 16 kHz
(+) | máximos equilibrados - a sólo 1.9% de la mediana
(+) | los máximos son lineales (2.7% delta a la frecuencia anterior)
Total 100 - 16.000 Hz
(+) | el sonido global es lineal (4.6% de diferencia con la mediana)
En comparación con la misma clase
» 0% de todos los dispositivos probados de esta clase eran mejores, 0% similares, 100% peores
» El mejor tuvo un delta de 5%, la media fue 17%, el peor fue ###max##%
En comparación con todos los dispositivos probados
» 0% de todos los dispositivos probados eran mejores, 0% similares, 100% peores
» El mejor tuvo un delta de 4%, la media fue 23%, el peor fue ###max##%
Gestión de la energía: un panel 4K que consume mucha energía
Consumo de energía
Como era de esperar, nuestro análisis energético no descubrió ninguna sorpresa. El panel 4K sigue consumiendo mucha energía, midiendo hasta 23 vatios en inactivo. Bajo carga, vimos brevemente 226 vatios, tras lo cual el consumo se estabilizó rápidamente en 156 vatios. Durante los juegos, el dispositivo consume 130 vatios, lo que significa que la fuente de alimentación de 230 vatios suministrada es más que suficiente e incluso es capaz de cargar el dispositivo bajo carga. Con 1,3 vatios, el consumo en espera es un poco elevado.
| Off / Standby | |
| Ocioso | |
| Carga |
|
Clave:
min: | |
| Lenovo ThinkPad X1 Extreme G5-21DE003RGE i7-12700H, GeForce RTX 3060 Laptop GPU, Micron 3400 1TB MTFDKBA1T0TFH, IPS, 3840x2400, 16" | HP Envy 16 h0112nr i7-12700H, GeForce RTX 3060 Laptop GPU, Micron 3400 1TB MTFDKBA1T0TFH, OLED, 3840x2400, 16" | Schenker Vision 16 Pro RTX 3070 Ti i7-12700H, GeForce RTX 3070 Ti Laptop GPU, Samsung SSD 980 Pro 1TB MZ-V8P1T0BW, IPS, 2560x1600, 16" | Dell XPS 15 9520 RTX 3050 Ti i7-12700H, GeForce RTX 3050 Ti Laptop GPU, WDC PC SN810 512GB, OLED, 3456x2160, 15.6" | Apple MacBook Pro 16 2021 M1 Pro M1 Pro, M1 Pro 16-Core GPU, Apple SSD AP1024R, Mini-LED, 3456x2234, 16.2" | Dell XPS 17 9720 RTX 3060 i7-12700H, GeForce RTX 3060 Laptop GPU, Samsung PM9A1 MZVL21T0HCLR, IPS, 3840x2400, 17" | Lenovo ThinkPad X1 Extreme G4-20Y5CTO1WW (3050 Ti) i7-11800H, GeForce RTX 3050 Ti Laptop GPU, Samsung PM9A1 MZVL21T0HCLR, IPS LED, 3840x2400, 16" | Medio NVIDIA GeForce RTX 3060 Laptop GPU | Media de la clase Multimedia | |
|---|---|---|---|---|---|---|---|---|---|
| Power Consumption | 11% | 22% | 45% | 49% | 22% | 16% | 17% | 51% | |
| Idle Minimum * (Watt) | 11.8 | 10 15% | 9 24% | 5.5 53% | 5 58% | 5.9 50% | 10.3 13% | 10.4 ? 12% | 5.66 ? 52% |
| Idle Average * (Watt) | 22.4 | 10.9 51% | 13.3 41% | 7.2 68% | 15.1 33% | 15.8 29% | 22.06 2% | 14.5 ? 35% | 10.2 ? 54% |
| Idle Maximum * (Watt) | 23.1 | 27.8 -20% | 14.3 38% | 16 31% | 15.5 33% | 26.7 -16% | 23 -0% | 21.4 ? 7% | 12.5 ? 46% |
| Load Average * (Watt) | 138 | 116.4 16% | 107 22% | 91.8 33% | 54 61% | 117.4 15% | 102.57 26% | 109.3 ? 21% | 65.2 ? 53% |
| Witcher 3 ultra * (Watt) | 129.9 | 133.7 -3% | 155.2 -19% | 74.6 43% | 114.8 12% | 106 18% | |||
| Load Maximum * (Watt) | 225.6 | 209.8 7% | 172 24% | 134.7 40% | 90 60% | 136.6 39% | 147.8 34% | 206 ? 9% | 113.5 ? 50% |
* ... más pequeño es mejor
Energy consumption Witcher 3 / stress test
Energy consumption with an external monitor
Duración de la batería
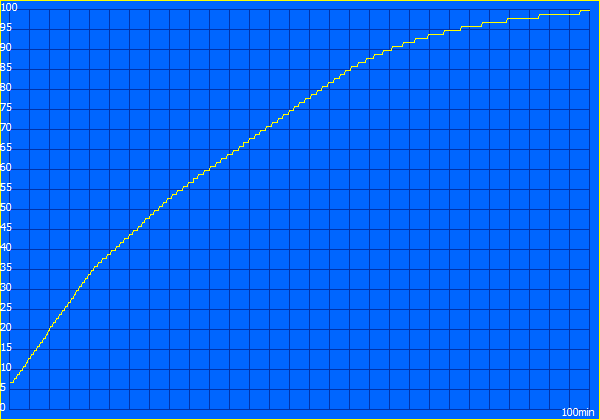
Nada ha cambiado en la batería de 90 vatios/hora y los tiempos de funcionamiento son comparables a los de su predecesor predecesor que también probamos con un panel 4K. Con un brillo de 150 cd/m² (que representa el 56 % del brillo máximo), la prueba de vídeo duró más de 7 horas y la prueba Wi-Fi unas 6,5 horas. Con el brillo al máximo, sólo duró 4,5 horas.
Una carga completa tarda 100 minutos, de los cuales el 35 % se consigue tras sólo 14 minutos y el 80 % está disponible tras aproximadamente 52 minutos.
| Lenovo ThinkPad X1 Extreme G5-21DE003RGE i7-12700H, GeForce RTX 3060 Laptop GPU, 90 Wh | HP Envy 16 h0112nr i7-12700H, GeForce RTX 3060 Laptop GPU, 83 Wh | Schenker Vision 16 Pro RTX 3070 Ti i7-12700H, GeForce RTX 3070 Ti Laptop GPU, 80 Wh | Dell XPS 15 9520 RTX 3050 Ti i7-12700H, GeForce RTX 3050 Ti Laptop GPU, 86 Wh | Apple MacBook Pro 16 2021 M1 Pro M1 Pro, M1 Pro 16-Core GPU, 99.6 Wh | Dell XPS 17 9720 RTX 3060 i7-12700H, GeForce RTX 3060 Laptop GPU, 97 Wh | Lenovo ThinkPad X1 Extreme G4-20Y5CTO1WW (3050 Ti) i7-11800H, GeForce RTX 3050 Ti Laptop GPU, 90 Wh | Media de la clase Multimedia | |
|---|---|---|---|---|---|---|---|---|
| Duración de Batería | 6% | -17% | 60% | 146% | -6% | -13% | 71% | |
| H.264 (h) | 7.3 | 6.1 -16% | 17.5 140% | 6.7 -8% | 17.1 ? 134% | |||
| WiFi v1.3 (h) | 6.7 | 7.9 18% | 6 -10% | 8.8 31% | 16.9 152% | 8.7 30% | 6.6 -1% | 12.2 ? 82% |
| Load (h) | 1.7 | 1.6 -6% | 1.3 -24% | 3.2 88% | 1 -41% | 1.2 -29% | 1.664 ? -2% |
Pro
Contra
Veredicto - Un ThinkPad con mayor potencia de CPU

Aunque aparentemente nada ha cambiado en el exterior, Lenovo ha conseguido introducir algunas innovaciones interesantes en su ThinkPad X1 Extreme de 5ª generación. Comparado con el modelo anterior, el procesador consume ahora bastante más energía. Junto con el nuevo procesador Alder Lake, esto contribuye a un aumento tangible del rendimiento. Aquí es donde el uso de pasta térmica de metal líquido realmente vale la pena. En general, la refrigeración por cámara de vapor hace un buen trabajo y aunque los ventiladores permanecen comparativamente silenciosos, el rendimiento gráfico es inconsistente
El ThinkPad aún viene con Windows 10 Pro, lo que nos dejó experimentando algunos problemas de rendimiento. Wi-Fi 6E sólo es compatible con Windows 11 y es una de las razones por las que recomendamos una actualización. También hay disponible un módem 5G opcional, pero el módulo WWAN debe pedirse de fábrica, ya que si no, no están preparadas ni las antenas necesarias ni la ranura SIM. Además, sigue existiendo la limitación de que un módulo WWAN (así como un segundo SSD M.2) solo están disponibles en modelos equipados con una tarjeta de memoria RTX 3050 Tique usan refrigeración convencional. La configuración de RAM monocanal es algo desafortunada, ya que 32 GB bastan para la mayoría de usuarios y dos módulos de 16 GB habrían sido sin duda la mejor elección
Con el ThinkPad X1 Extreme G5, Lenovo mejora principalmente la potencia de procesado y ofrece conectividad 5G opcional, con un rendimiento gráfico que sigue siendo algo inestable.
Una vez más, sentimos la necesidad de criticar la calidad del teclado. Hasta los modelos G3, el teclado del X1 Extreme pertenecía a lo mejor que ofrecía el sector móvil. Nos sigue intrigando por qué Lenovo ha considerado necesario reducir el recorrido de las teclas de un dispositivo relativamente grueso como el X1 Extreme (después de todo, no estamos hablando delX1 NanooX1 Carbon).
Lenovo sigue siendo uno de los pocos fabricantes que ofrecen un panel con cobertura AdobeRGB completa, ya que incluso HP lleva un tiempo usando sólo sus paneles DramColor con espacio de color P3. Visto subjetivamente, la calidad de imagen es muy buena sin sufrir problemas de PWM. Sin embargo, el consumo de energía es muy elevado y los reflejos en exteriores podrían ser un problema. Pronto probaremos el nuevo panel WQHD de 165 Hz que se encuentra en el modelo de estación de trabajo ThinkPad P1 G5
El X1 Extreme G5 tiene mucho que completar, especialmente teniendo en cuenta su elevado precio. Esto empieza con el maravilloso MacBook Pro 16con su mini pantalla LED, así como los recién llegados como elSchenker Vision 16 Proque ofrece más potencia en un formato más pequeño y ligero. Sin embargo, ninguno de los dos dispositivos puede presumir de una mayor duración de la batería. El HP Envy 16 de HP es un poco más pesado y grueso, pero ofrece un rendimiento de GPU más estable. Actualmente, Dell no ha actualizado su XPS 16, dejando a los compradores potenciales la elección entre el XPS 15y 17.
Precio y disponibilidad
El ThinkPad X1 Extreme se puede configurar en Lenovos Online-Store desde 2189 dólares. Nuestra configuración de prueba está disponible en online desde 3643 dólares en Amazon.
Lenovo ThinkPad X1 Extreme G5-21DE003RGE
- 12/05/2022 v7 (old)
Andreas Osthoff
Price comparison

