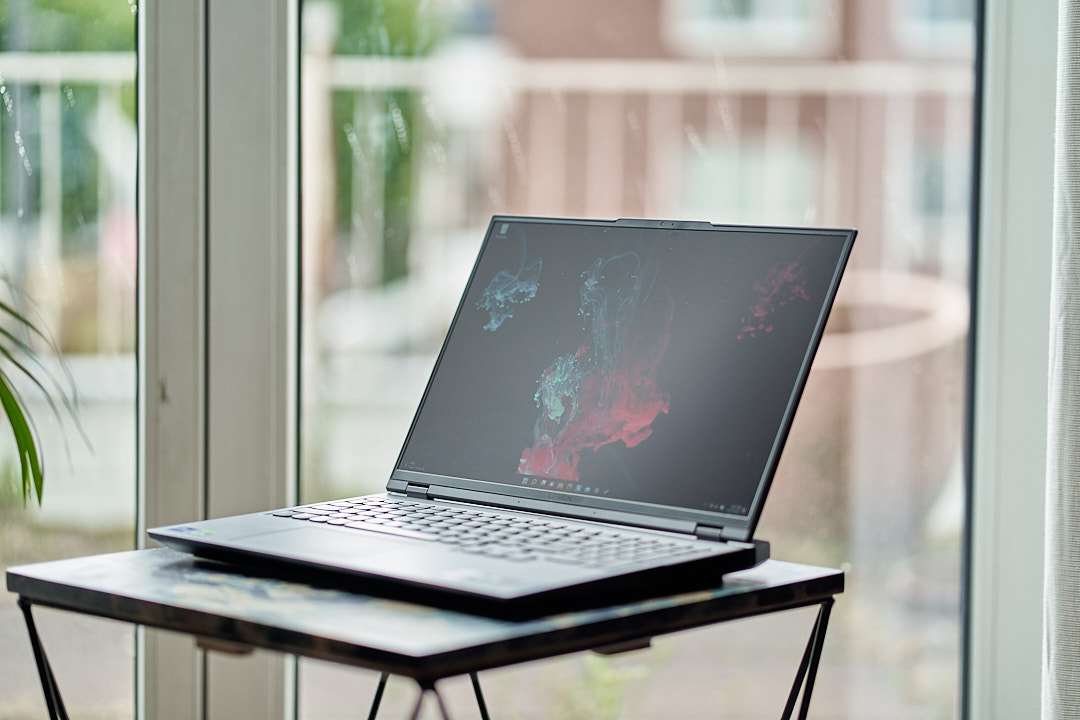
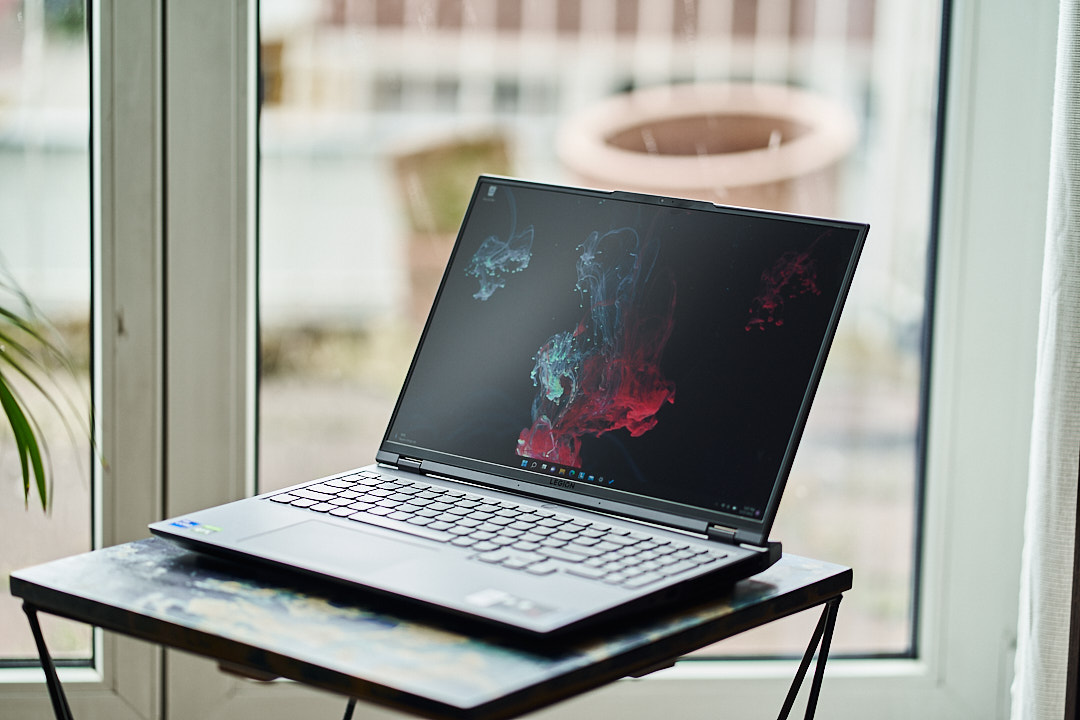
Para jugadores y creadores de contenidos: Análisis del portátil Lenovo Legion 5 Pro
El año pasado, Lenovo presentó un portátil para juegos de gama alta excepcionalmente impresionante y extremadamente popular en el Legion 5 Pro. Ya hemos probado la versión RTX 3070 Ti de Nvidia, así que hemos pensado en echar un vistazo a la versión RTX 3060 de 120W, ligeramente más barata. Para los jugadores que priorizan la relación calidad-precio y que se conforman con correr a 60 FPS en los últimos juegos en QHD, o los creativos que se centran en el rendimiento de la CPU, Lenovo ha reunido aquí una combinación convincente. Entre los competidores se encuentran otros portátiles RTX-3060 con CPUs Intel i7 o AMD Ryzen 7 comparables, como el recientemente probado HP Omen 16o portátiles bastante más caros como el Gigabyte Aero 16 con un i9 a bordo. Este último tendrá dificultades para desarrollar su potencial de rendimiento en el mismo grado
Posibles contendientes en la comparación
Valoración | Fecha | Modelo | Peso | Altura | Tamaño | Resolución | Precio |
|---|---|---|---|---|---|---|---|
| 86.6 % v7 (old) | 07/2022 | Lenovo Legion 5 Pro 16IAH7H i7-12700H, GeForce RTX 3060 Laptop GPU | 2.6 kg | 27 mm | 16.00" | 2560x1600 | |
| 85.5 % v7 (old) | 05/2022 | HP Omen 16-b1090ng i7-12700H, GeForce RTX 3070 Ti Laptop GPU | 2.3 kg | 23 mm | 16.10" | 2560x1440 | |
| 86 % v7 (old) | 04/2022 | HP Omen 16-c0077ng R7 5800H, Radeon RX 6600M | 2.3 kg | 26 mm | 16.10" | 2560x1440 | |
| 84.7 % v7 (old) | 03/2022 | Gigabyte Aero 16 YE5 i9-12900HK, GeForce RTX 3080 Ti Laptop GPU | 2.3 kg | 22.4 mm | 16.00" | 3840x2400 | |
| 86.7 % v7 (old) | 03/2022 | Alienware x14 i7 RTX 3060 i7-12700H, GeForce RTX 3060 Laptop GPU | 1.8 kg | 14.5 mm | 14.00" | 1920x1080 | |
| 88 % v7 (old) | 03/2022 | Lenovo Legion 5 Pro 16 G7 i7 RTX 3070Ti i7-12700H, GeForce RTX 3070 Ti Laptop GPU | 2.6 kg | 26.6 mm | 16.00" | 2560x1600 |
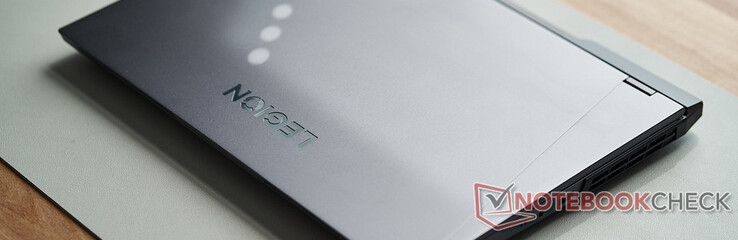
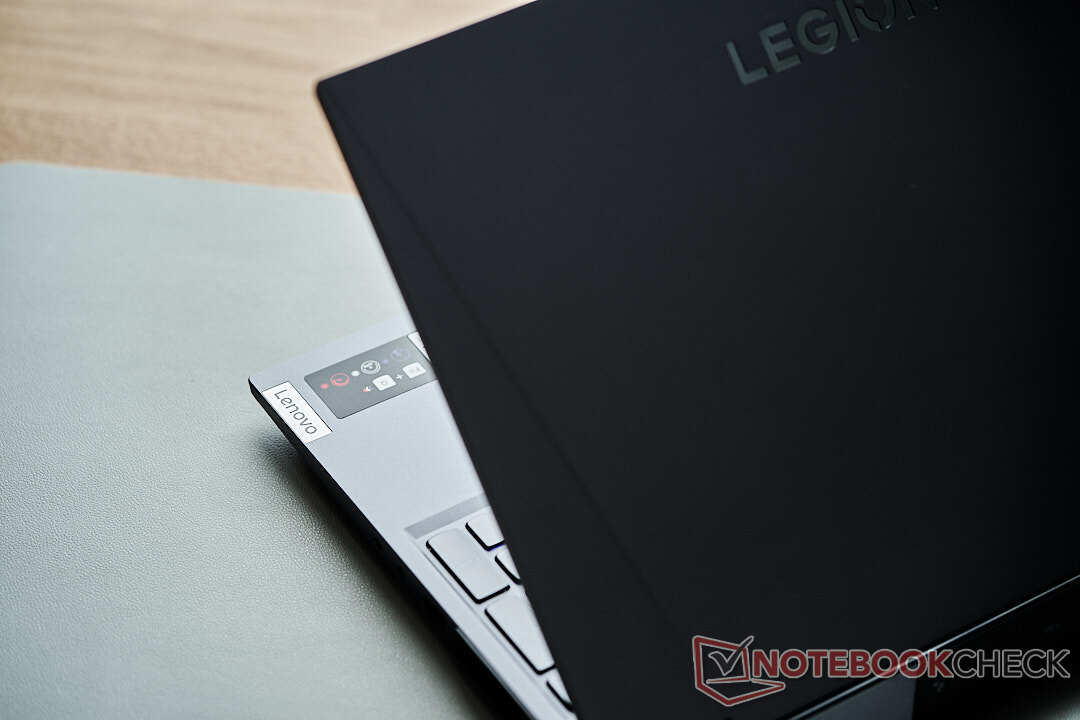
Funda - Legion 5 Pro con mucho metal
Lenovo ofrece una sólida carcasa metálica para el Legion 5 Pro. Su fabricación es impecable, el portátil de juegos de 16 pulgadas rezuma calidad, y ni el manejo casual o deliberado da lugar a superficies flexibles ni evoca ningún ruido de crujido desagradable. Incluso la tapa, que suele ser un talón de Aquiles en muchos portátiles de la competencia, resultó firme dejando la pantalla rígida en la posición deseada.
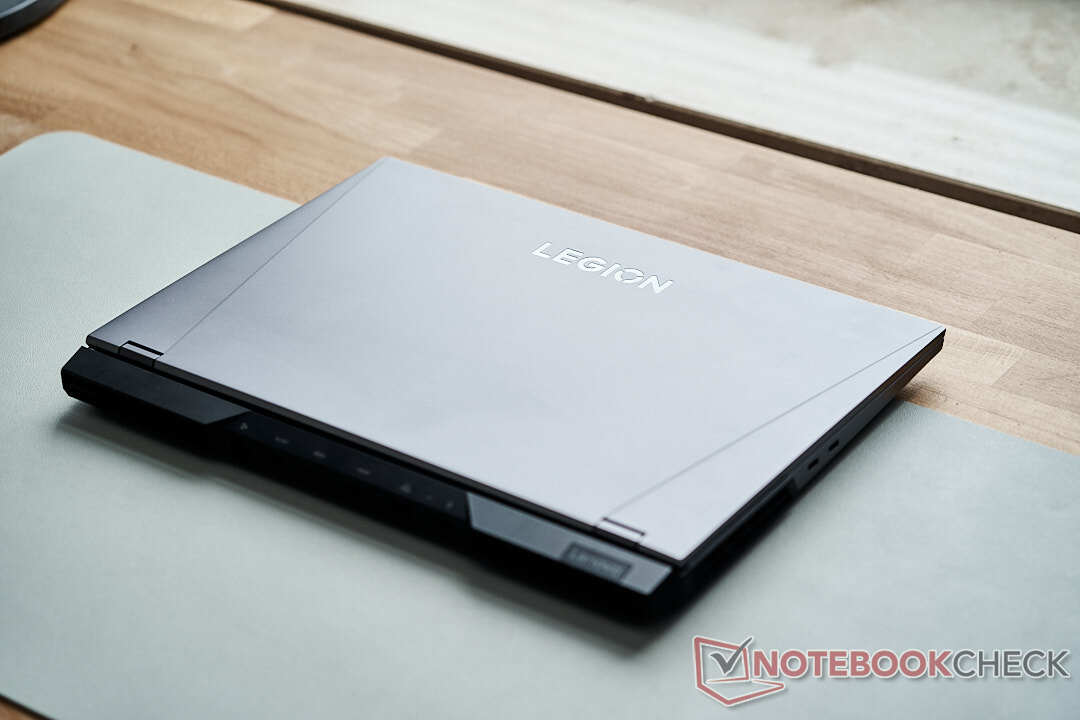
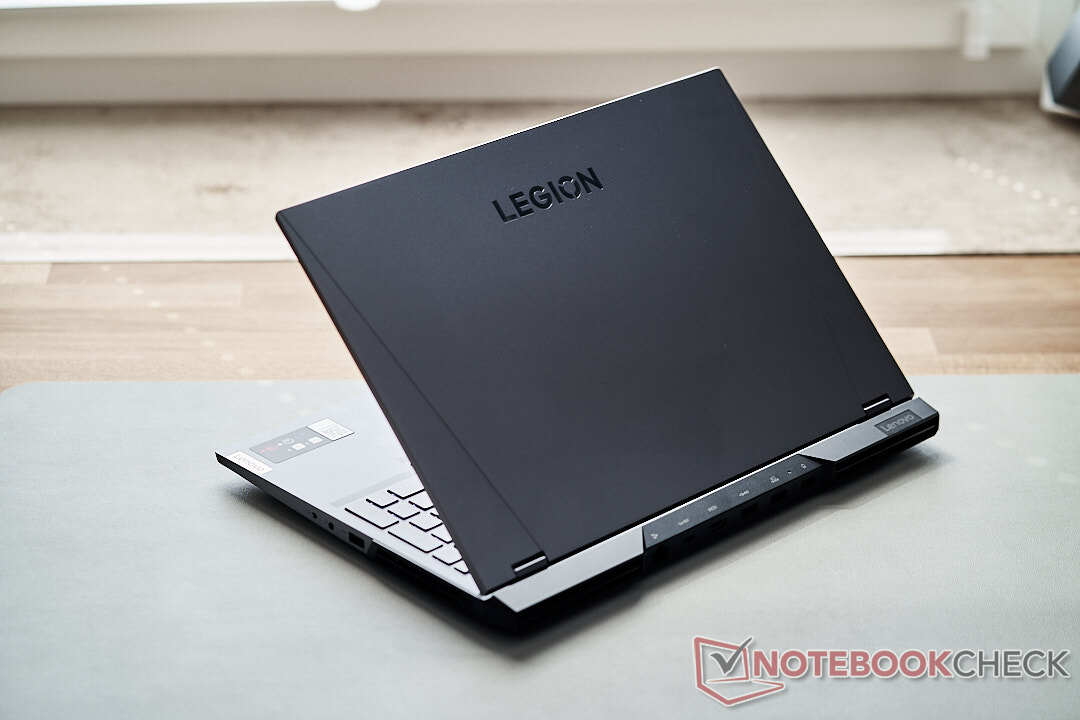
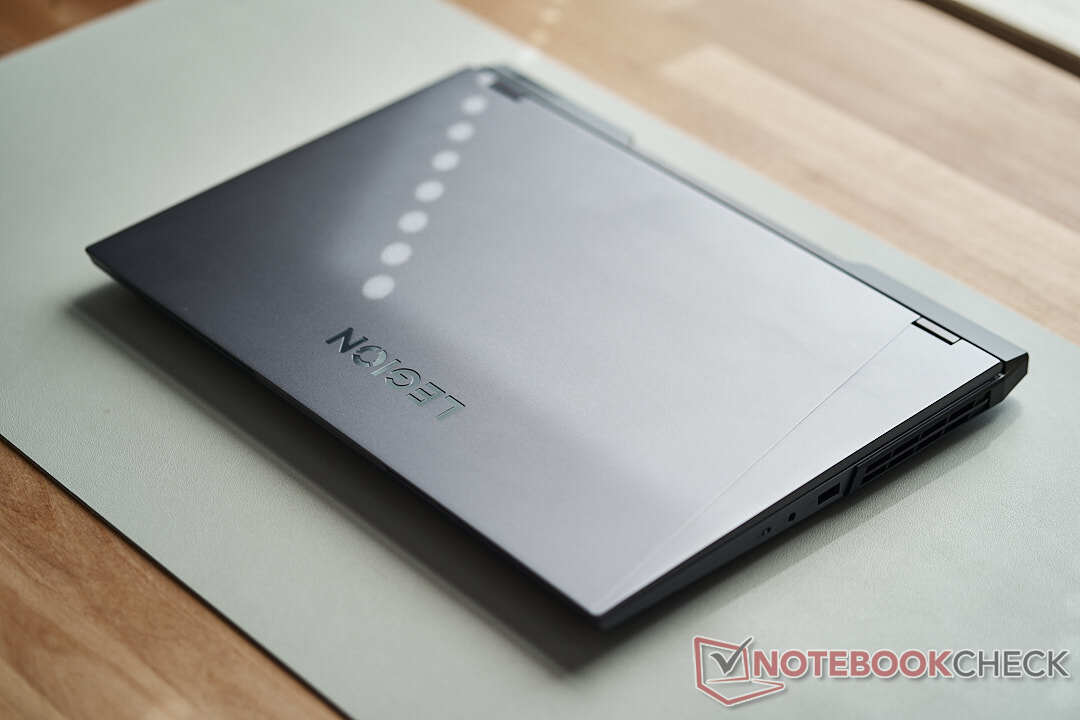
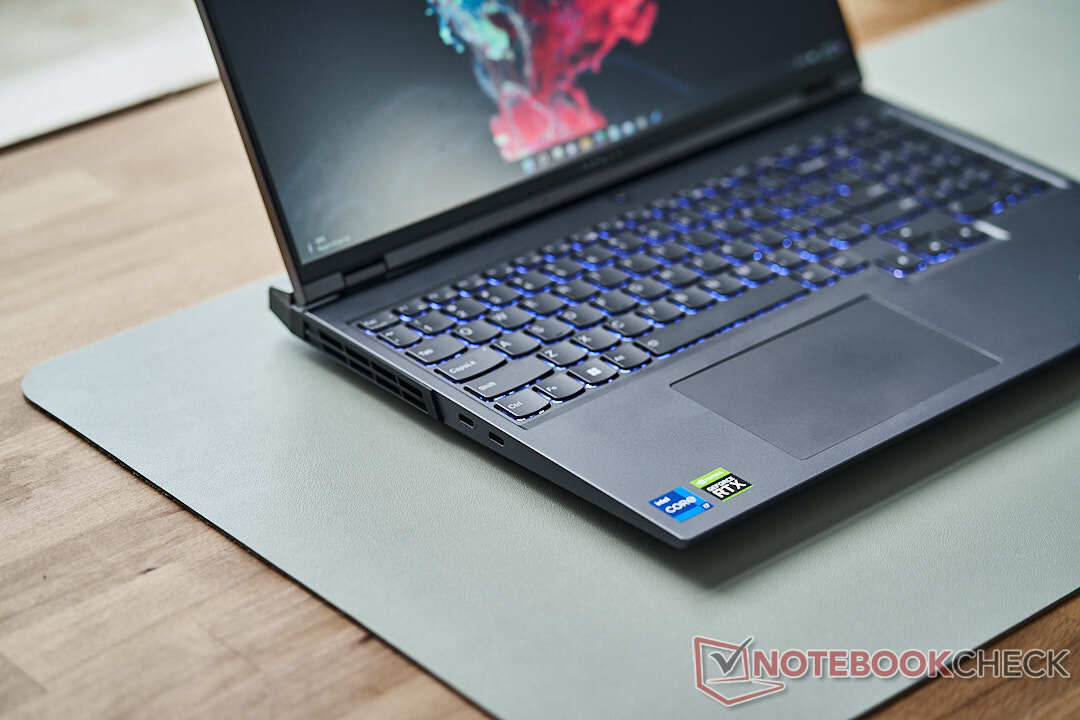
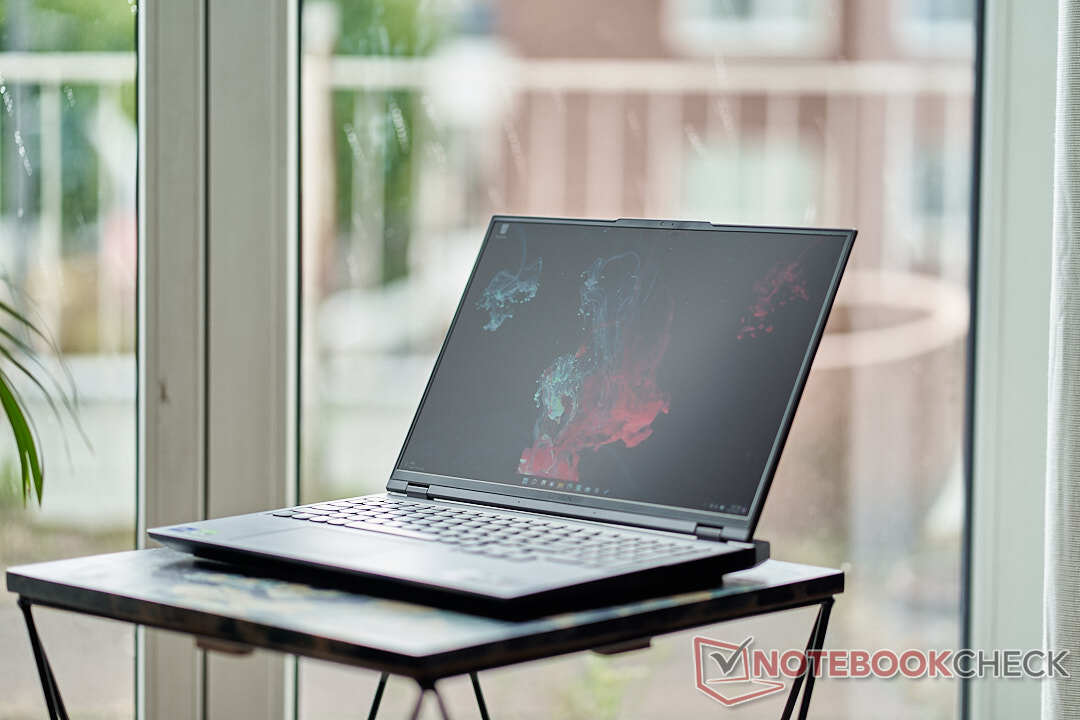
En cuanto al peso, se nota el fuerte uso de materiales metálicos. El Legion es uno de los más pesados de los dispositivos comparables. Las rejillas de refrigeración están repartidas por toda la base de la unidad. Lenovo se desmarca de la tendencia de presentar dispositivos cada vez más finos y pequeños y se ha centrado claramente en la robustez y el potencial de refrigeración para esta potente exposición de hardware.
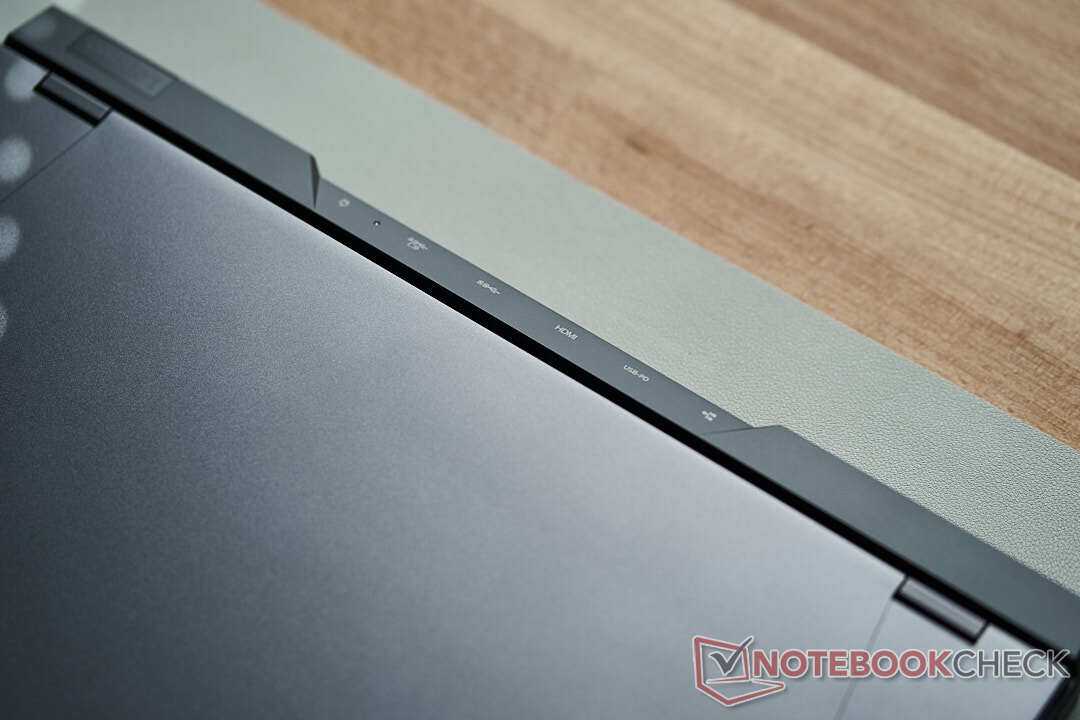
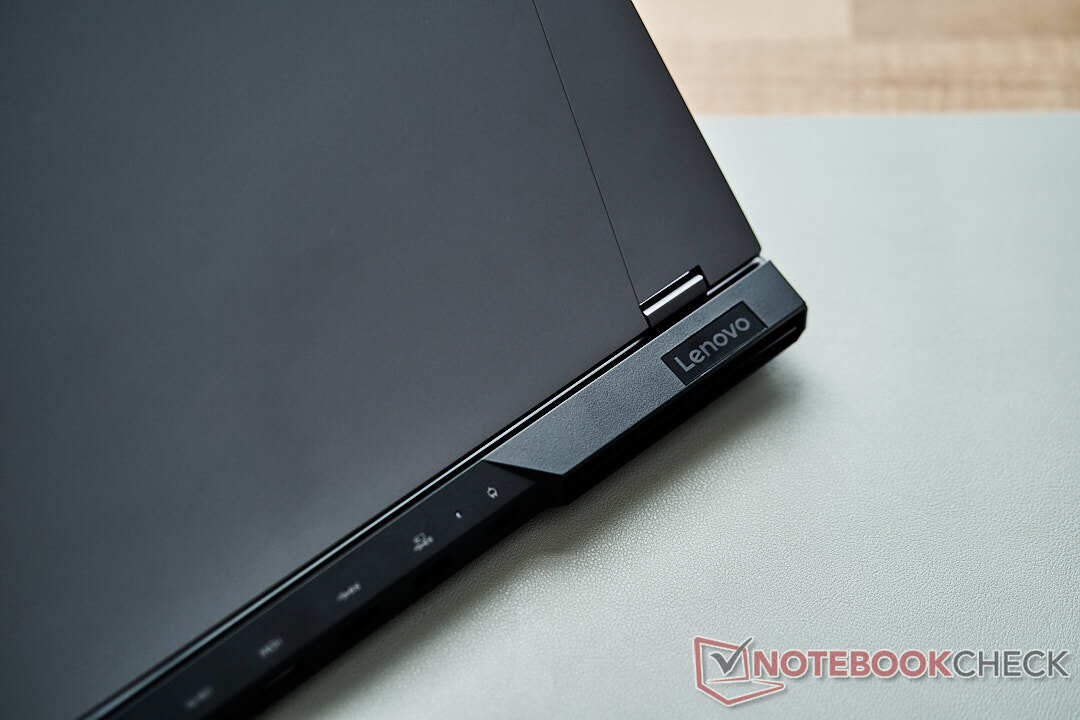
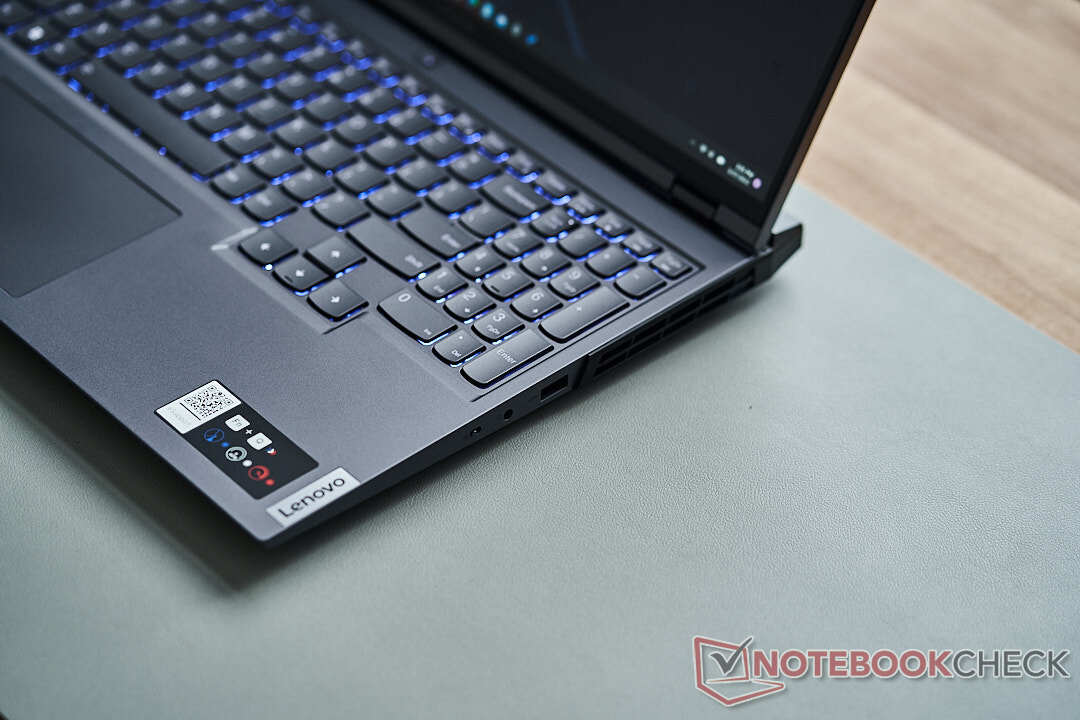
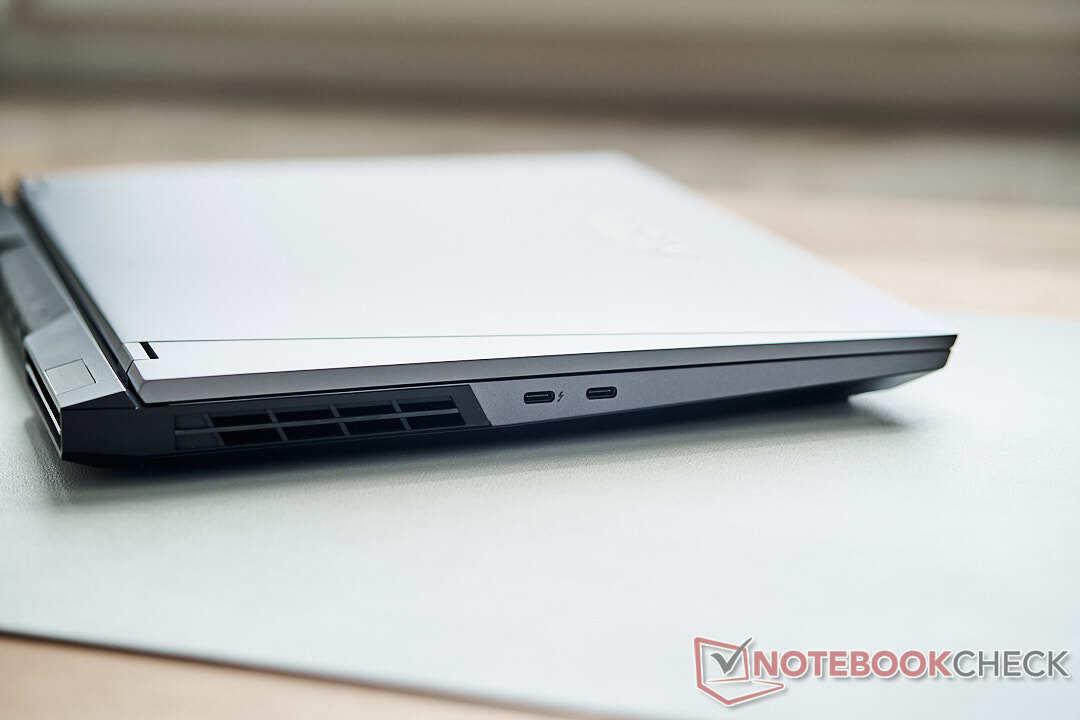
Conectividad: todo está ahí con Thunderbolt 4 y USB-C Power Delivery
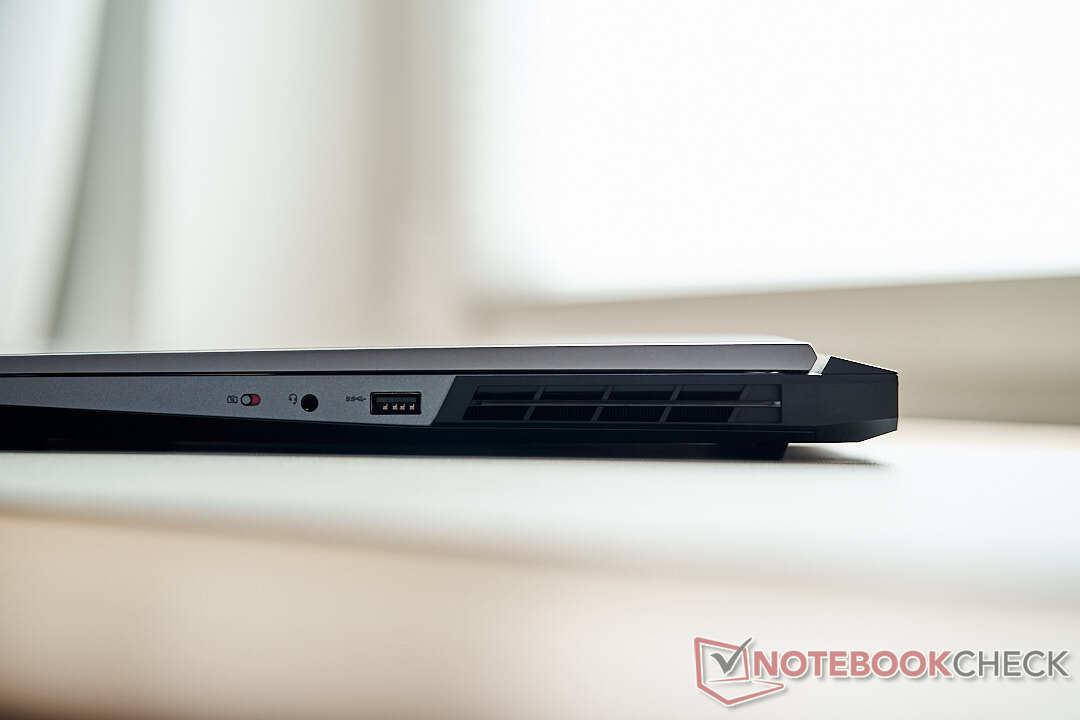
Lenovo también da un buen ejemplo en cuanto al tipo y número de puertos y ranuras que se distribuyen en tres lados de la carcasa. Ergonómicamente favorece a los usuarios diestros proporcionando un único puerto USB-A (USB 3.2 Gen 1) en el lado derecho de la carcasa. Esto reduce el riesgo de enredarse con los cables de la pantalla o de la red con el ratón. A modo de ejemplo, este puerto es ideal para dongles inalámbricos para dispositivos periféricos.
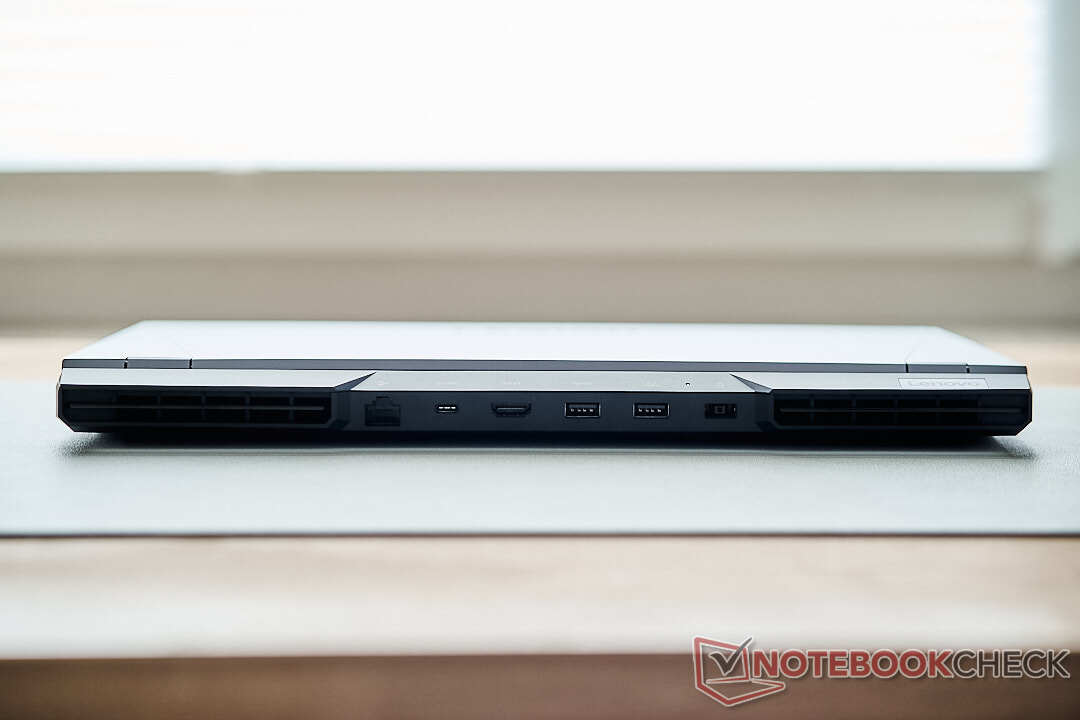
A la izquierda hay dos puertos USB-C de última generación, uno es Thunderbolt 4 y el otro se ajusta al estándar USB 3.2 Gen 2 con soporte completo de 20 Gbit/s y Displayport 1.4. El resto de puertos se encuentran en la parte trasera de la carcasa, donde Lenovo ha aprovechado al máximo el espacio disponible. Además de otros dos puertos USB-A 3.2 Gen-1, hay un tercer puerto USB-C, a través del cual también se puede cargar el portátil hasta 135 W. La conectividad se completa con un puerto HDMI y un puerto RJ45 para redes cableadas. La ranura para el enchufe de alimentación también está en la parte trasera de la carcasa.
Dada la variedad y ubicación de los puertos y ranuras, el Legion 5 Pro puede utilizarse fácilmente como dispositivo de sustitución de escritorio con múltiples monitores y periféricos, y como dispositivo móvil está equipado para cualquier situación. También existe la posibilidad de limitar el uso de dongles al adaptador DisplayPort.
Comunicación
El Legion 5 Pro está equipado con el extremadamente popular módulo WLAN Intel AX211. Con Wi-Fi 6E a bordo no sólo ofrece el estándar Wi-Fi más actual. La tarjeta ofrece todo su potencial y ocupa la primera posición entre los dispositivos comparables. No es sólo que las velocidades de transferencia de datos sean impresionantes, sino que tampoco decepciona como portátil para juegos en el uso diario. Con velocidades de transferencia estables y rápidas, incluso las grandes descargas de juegos no tienen importancia. Un puerto Gigabit Ethernet está disponible para las conexiones por cable. Aquí habríamos preferido el puerto más rápido de 2.5 GbE, dado que ya está instalado en muchos dispositivos de la competencia. Las ventajas de velocidad en redes conmutadas o al conectarse a sistemas NAS son enormes y se habrían adaptado bien al resto de la configuración de hardware.
| Networking | |
| iperf3 transmit AX12 | |
| Alienware x14 i7 RTX 3060 | |
| Medio Intel Wi-Fi 6E AX211 (1003 - 1501, n=4) | |
| HP Omen 16-c0077ng | |
| iperf3 receive AX12 | |
| Medio Intel Wi-Fi 6E AX211 (1178 - 1623, n=4) | |
| Alienware x14 i7 RTX 3060 | |
| HP Omen 16-c0077ng | |
| iperf3 receive AXE11000 6GHz | |
| Lenovo Legion 5 Pro 16IAH7H | |
| Media de la clase Gaming (975 - 1775, n=35, últimos 2 años) | |
| Medio Intel Wi-Fi 6E AX211 (700 - 1857, n=226) | |
| iperf3 transmit AXE11000 6GHz | |
| Lenovo Legion 5 Pro 16IAH7H | |
| Media de la clase Gaming (723 - 1868, n=36, últimos 2 años) | |
| Medio Intel Wi-Fi 6E AX211 (385 - 1851, n=226) | |
Cámara web
En lo que respecta a la cámara web, Lenovo ofrece lo habitual; por desgracia, no mejor de lo que estamos acostumbrados con los portátiles para juegos desde hace años. La calidad de la imagen es sin duda aceptable para una u otra llamada de zoom, pero aquí nos habría gustado ver mejoras en todo el tablero en la reproducción del color, la resolución y el rango dinámico.

")
")
Accesorios
Aparte del propio portátil, sólola fuente de alimentación está en la caja. Ésta se ha estandarizado para todas las configuraciones de Legion 5 Pro, por lo que nuestro modelo RTX-3060 también recibe la fuente de alimentación de 300 W, algo sobredimensionada. El peso adicional de 1 kg (~2,2 lb) sólo para la fuente de alimentación debe tenerse en cuenta si se planea estar en la carretera con el Legion.
Mantenimiento
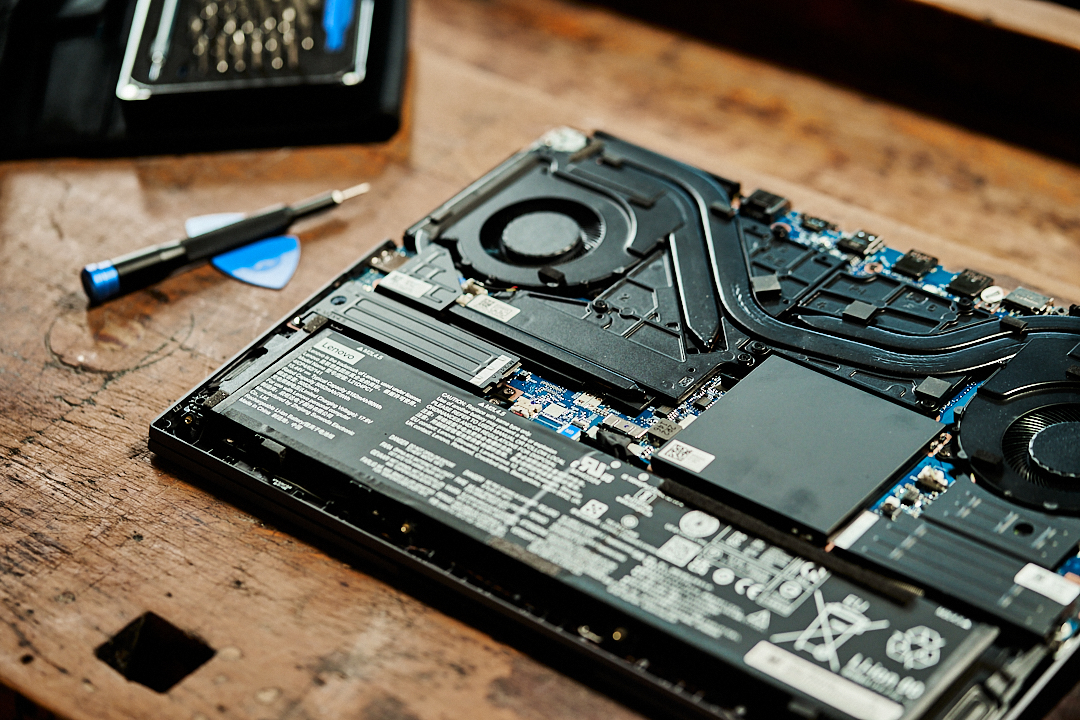
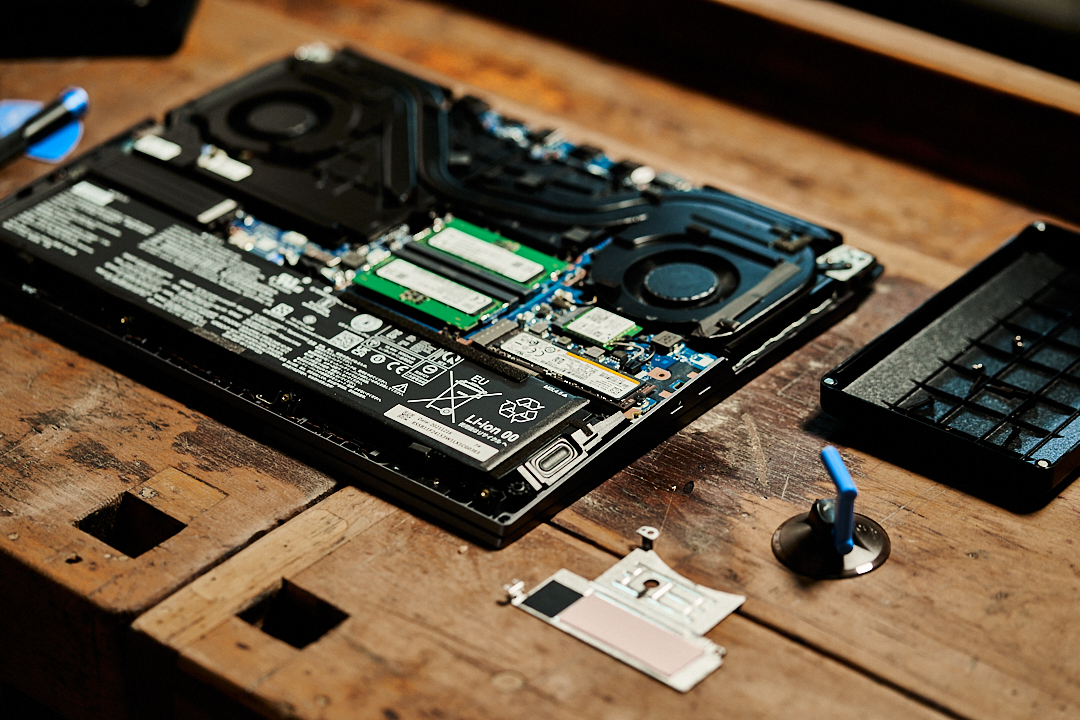
Para reparaciones o actualizaciones, el Legion requiere aflojar diez tornillos de cabeza Philips. Lenovo utiliza tres tamaños diferentes, por lo que hay que tener cuidado de recordar a dónde pertenecen los diferentes tornillos. Retirar la placa base requiere más esfuerzo del que nos gustaría. Particularmente los elementos de plástico en el tercio posterior de la placa están asegurados muy fuertemente. Trabajamos progresivamente desde el centro de la parte delantera hasta la parte trasera de la placa con las ayudas adecuadas. Para aflojar las cubiertas de plástico, lo mejor es utilizar las herramientas apropiadas de iFixit (enlace afiliado). Alternativamente, uno podría utilizar una tarjeta de crédito de plástico con la fuerza aplicada hábilmente hasta que se sueltan.
Dentro de la carcasa, podemos esperar una imagen ordenada y, sobre todo, una visión de la elaborada solución de refrigeración para el potente hardware. En principio, los usuarios tienen acceso a las dos ranuras M.2 y a la RAM. Para refrigerarlas, unos enormes disipadores de calor cubren las unidades rápidas, y la RAM se encuentra bajo una cubierta de plástico.
Garantía
En Alemania, el Lenovo Legion 5 Pro está cubierto por una garantía básica de 2 años.
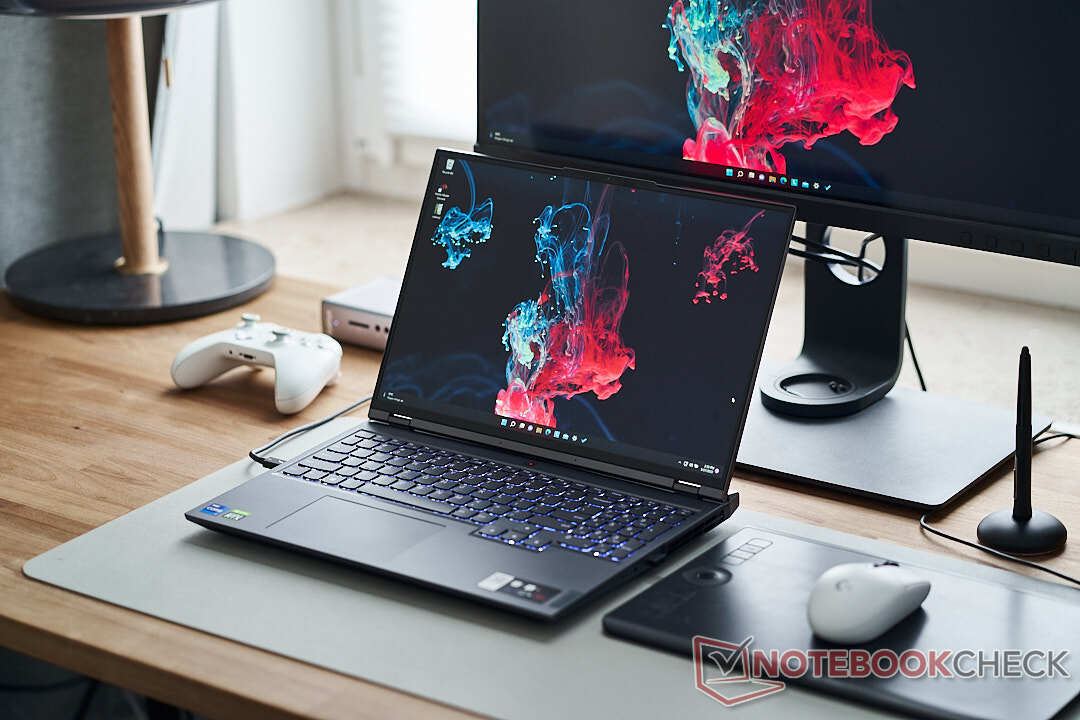
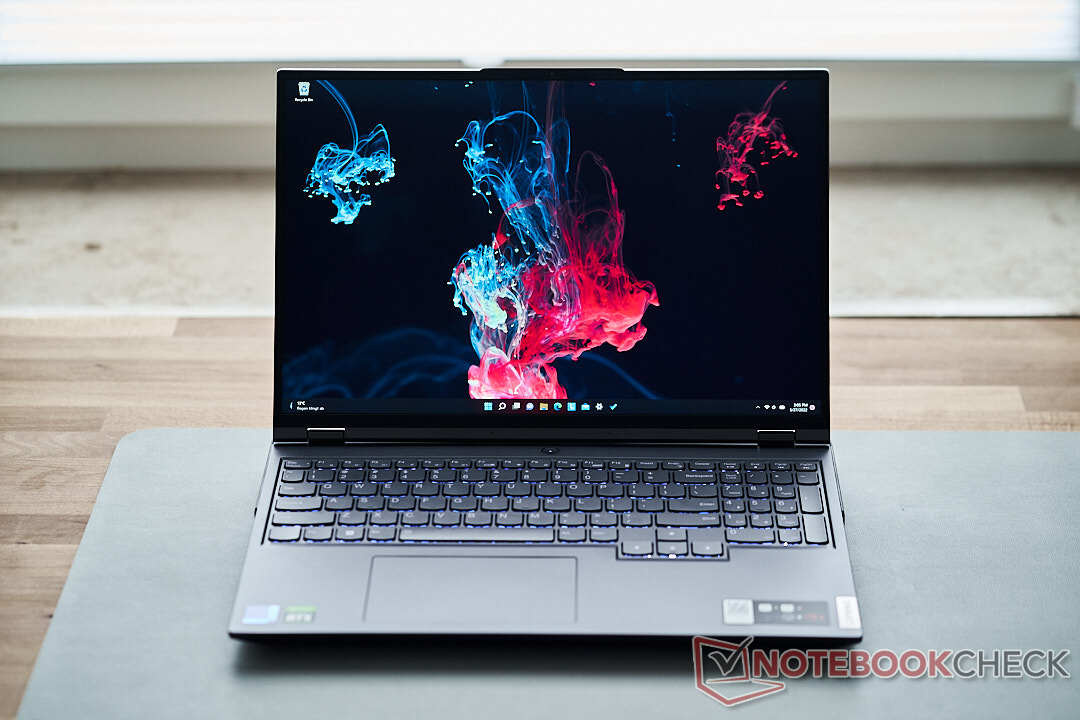
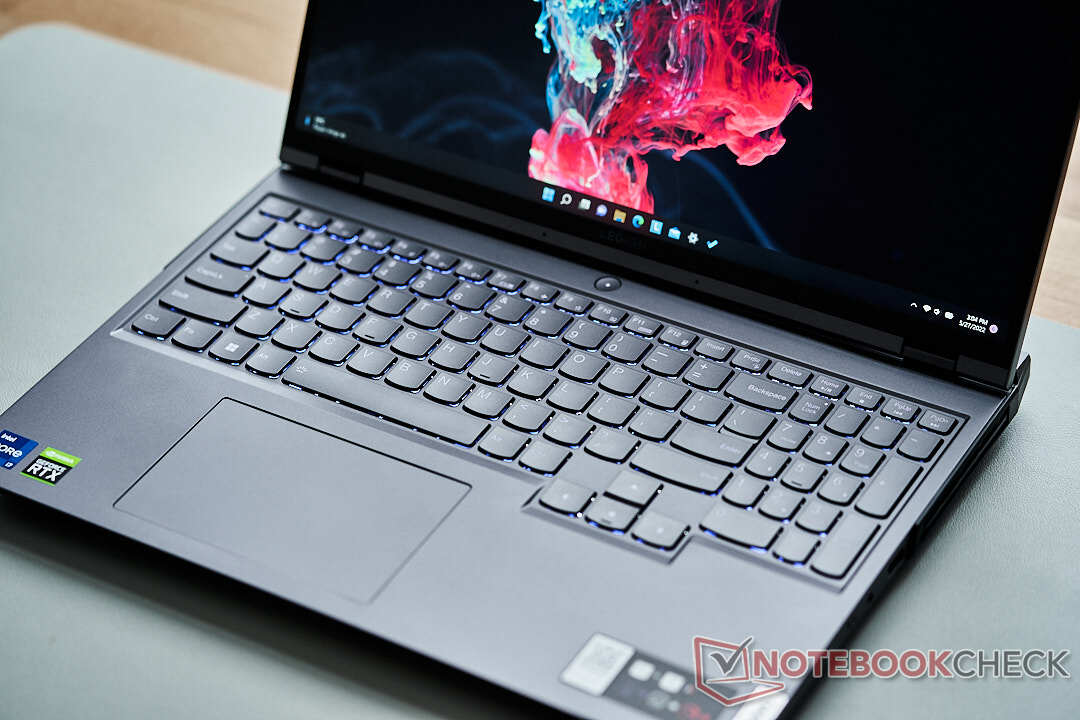
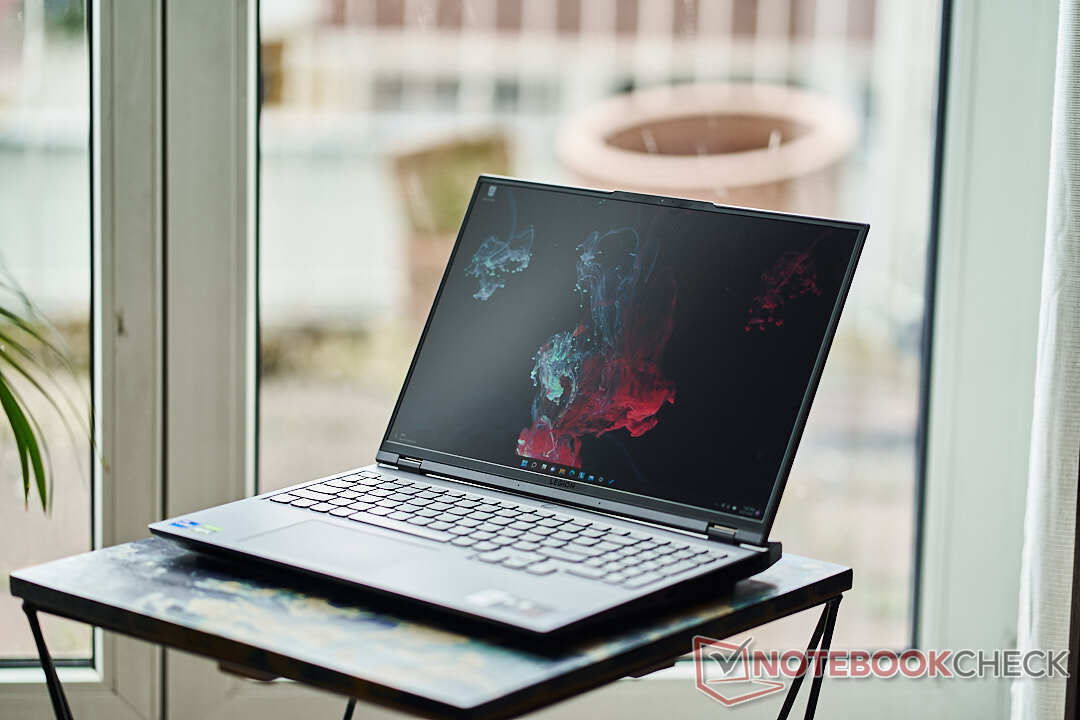
Dispositivos de entrada: una solución atractiva y completa tanto para los jugadores como para los creadores de contenidos
Teclado
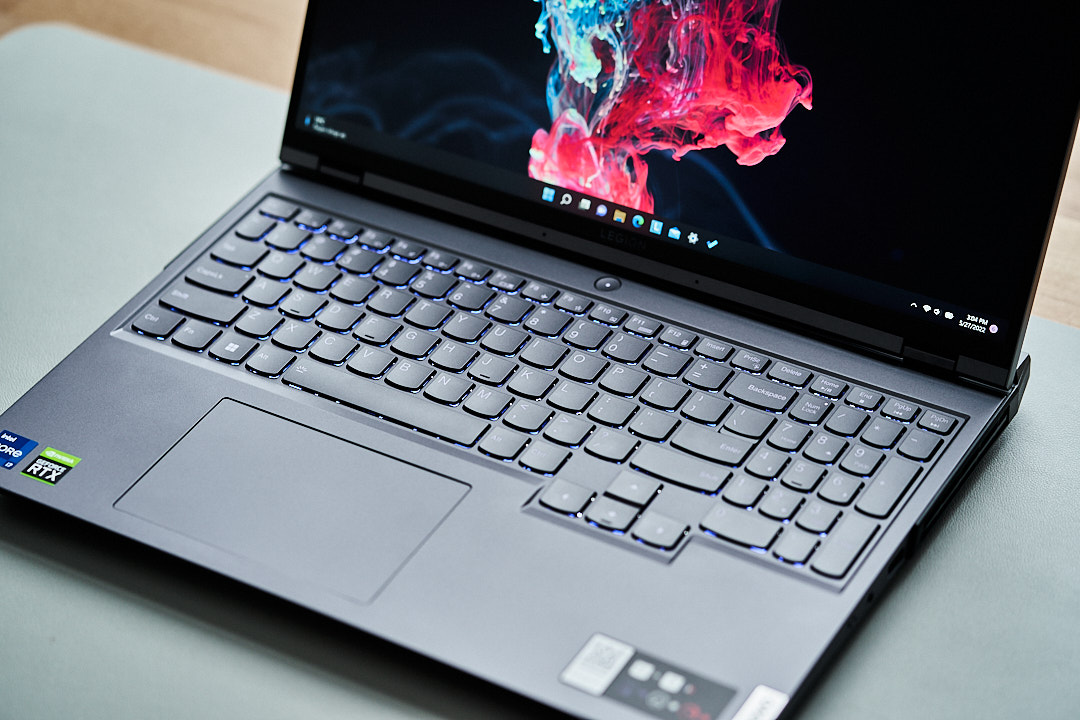
El rendimiento del teclado para las sesiones intensivas de juego es nada menos que excepcional en este dispositivo de dieciséis pulgadas. Las teclas de tipo chiclet, con su forma y curvatura un tanto inusuales, ofrecen un punto de presión palpable, una resistencia agradable y un trazo sólido. La retroiluminación de las teclas RGB se puede ajustar en cuatro zonas del teclado y la iluminación funciona bien. Visualmente, las teclas ligeramente más pequeñas del teclado numérico y las teclas de dirección de tamaño normal no están tan bien definidas como podrían estarlo, pero no hay motivo de queja en términos puramente funcionales.
Teclado táctil
El touchpad es suficientemente grande para un portátil de juegos y permite un suave deslizamiento por su superficie. Las propiedades hápticas al desplazarse y hacer clic son de alta calidad. El touchpad del ratón está ligeramente desplazado hacia la izquierda, lo que en ocasiones lleva a hacer clic a la derecha en lugar de a la izquierda cuando se usa demasiado a la ligera. Como resultado de la alta tasa de refresco de 165 Hz, el uso de Legion parece muy suave y preciso. Aunque la mayoría de los jugadores utilizarán un ratón, nadie debería tener problemas para navegar en Windows o desplazarse por páginas web.
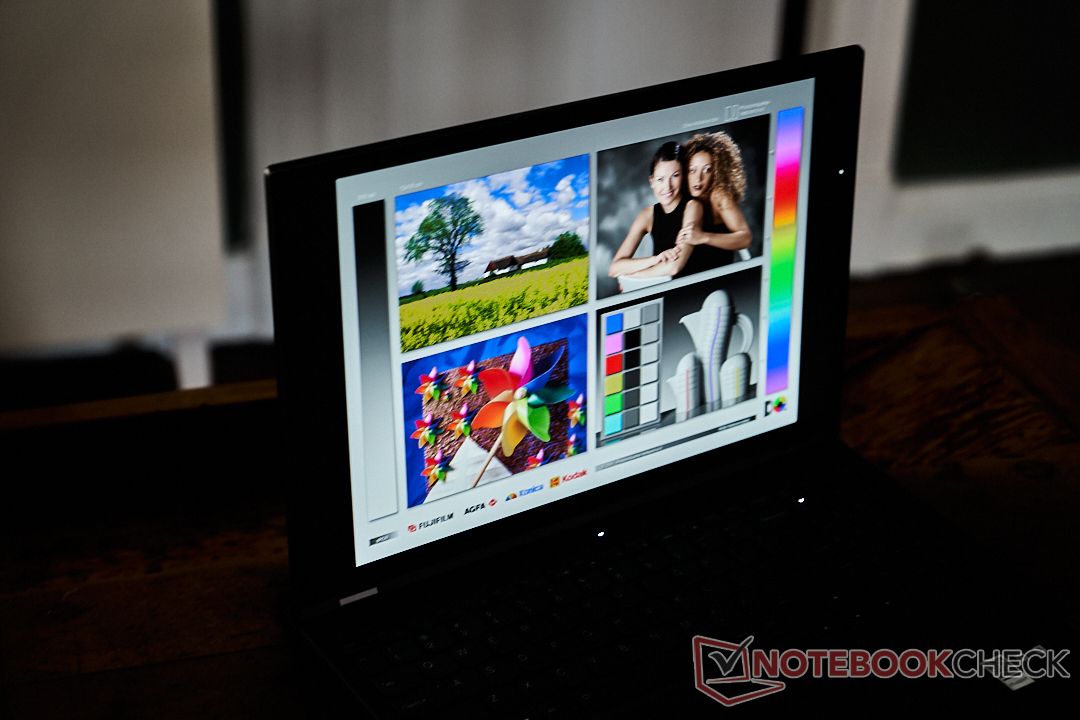
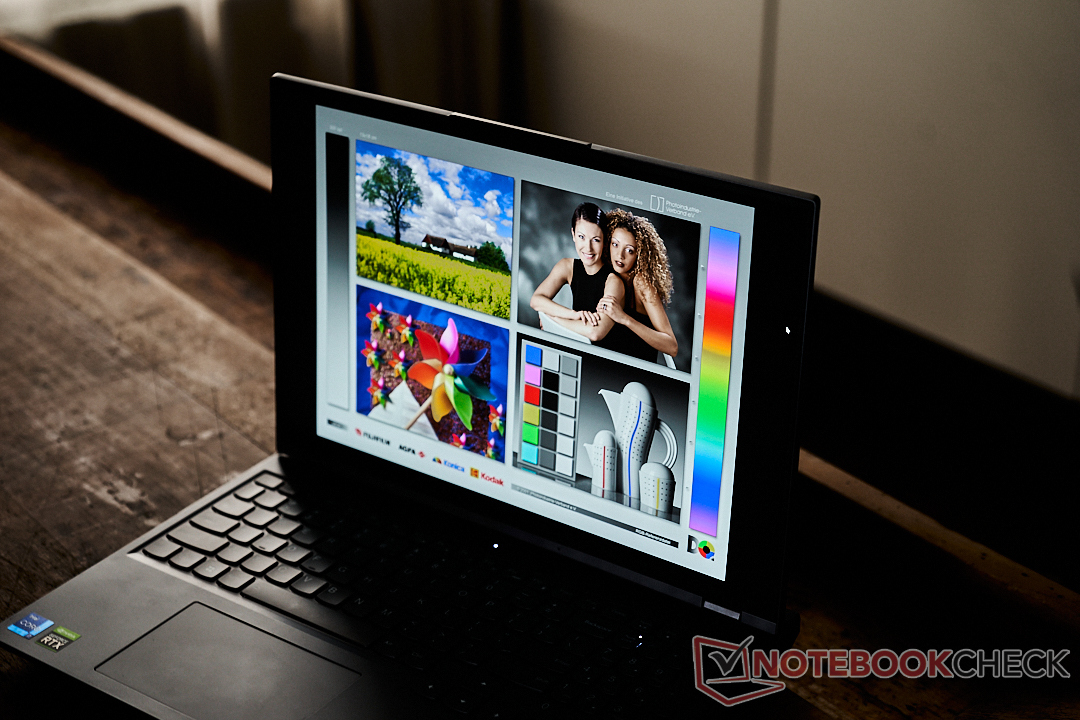
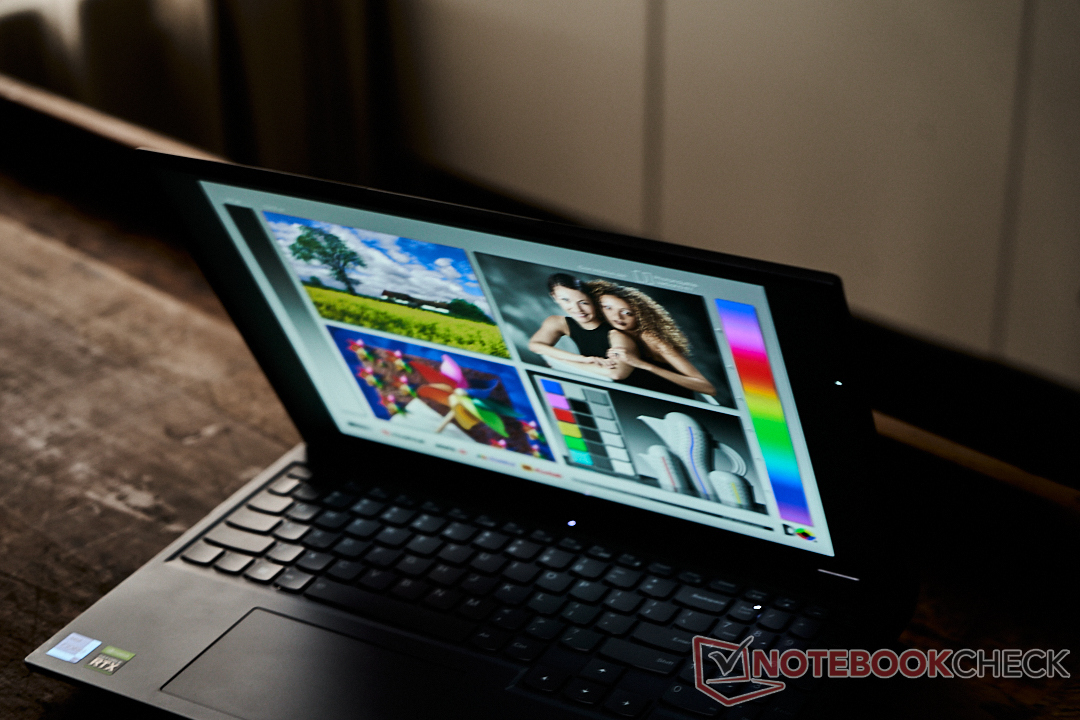
Pantalla: rápida de 165 Hz con G-Sync y resolución WQHD

las pantallas de 16 pulgadas son cada vez más habituales en los últimos portátiles para juegos, y la versión Legion es un excelente ejemplo. Hay mucho que ofrecer aquí para los jugadores, escritores de contenido, así como para el uso diario. La pantalla mate ofrece el típico contraste IPS y una excelente legibilidad desde prácticamente cualquier ángulo. Comparado con la competencia, el Lenovo tiene el mayor nivel de brillo máximo, aunque la luminancia de la pantalla, de sólo un 85%, podría ser mejor.
La resolución QHD en la versión 16:10 con 2.560 por 1.600 píxeles ofrece una imagen nítida en cualquier escenario de uso, y la combinación de la pantalla mate y su alto nivel de brillo hacen posible incluso el uso en exteriores. Los jugadores apreciarán la alta tasa de refresco de 165 Hz y los tiempos de respuesta agradablemente rápidos. Aunque esta pantalla no supone un serio desafío para la pantalla de 360 Hz y 4 ms del recientemente probado MSI Vector GP76sigue siendo un buen ejemplo para los amantes de los juegos rápidos.
| |||||||||||||||||||||||||
iluminación: 85 %
Contraste: 1144:1 (Negro: 0.45 cd/m²)
ΔE ColorChecker Calman: 2.38 | ∀{0.5-29.43 Ø4.71}
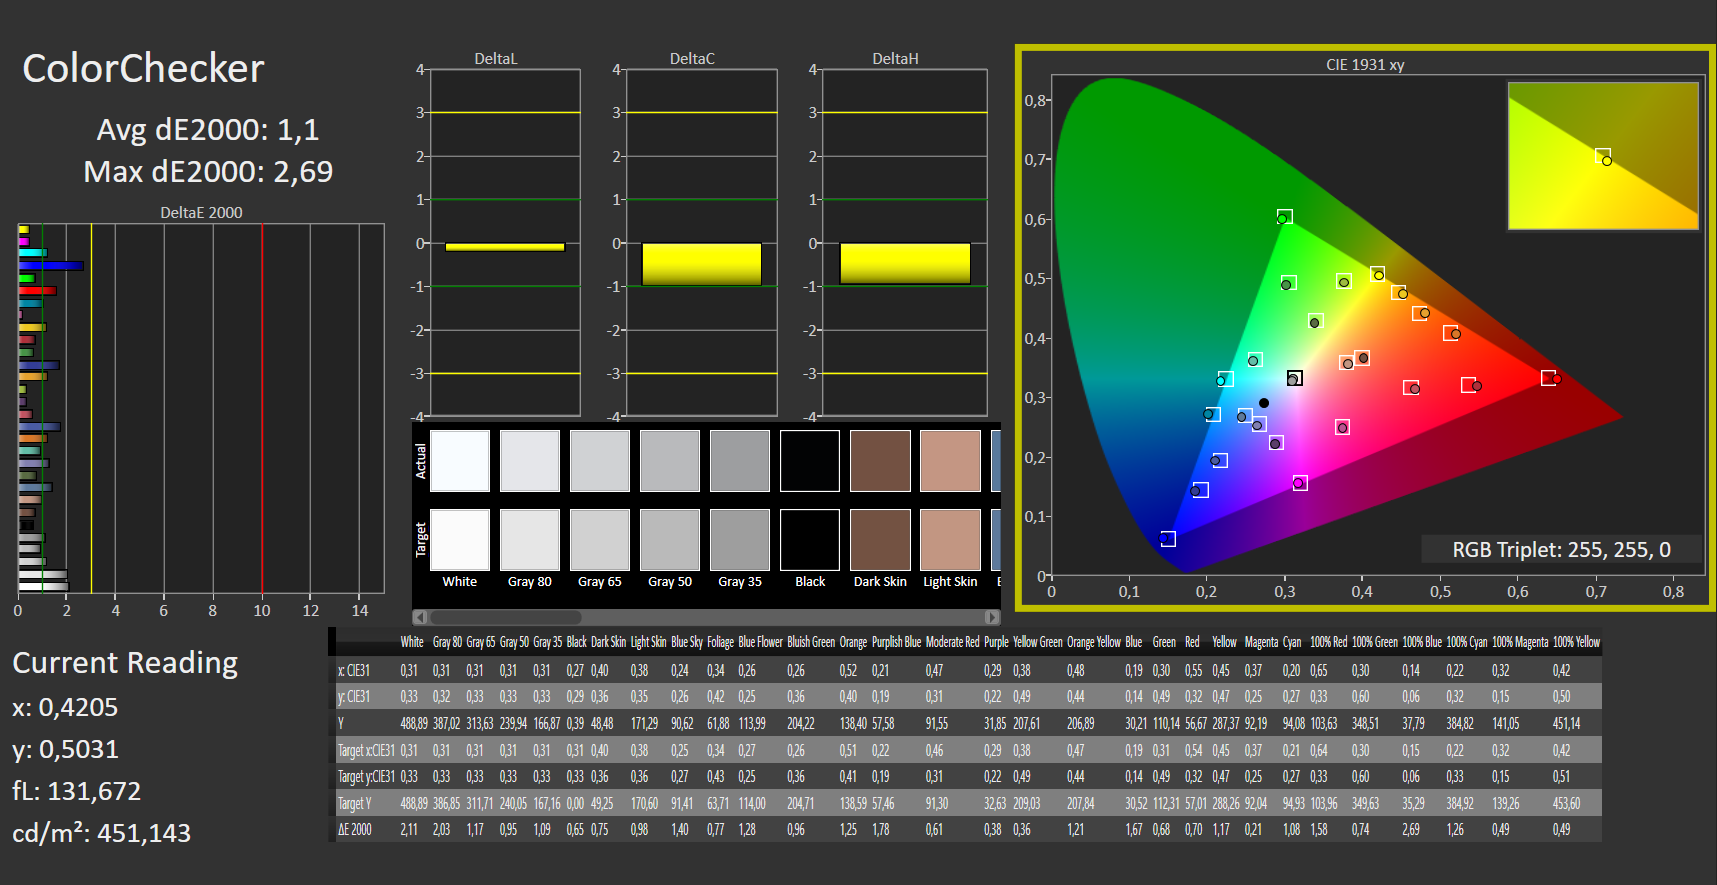
calibrated: 1.1
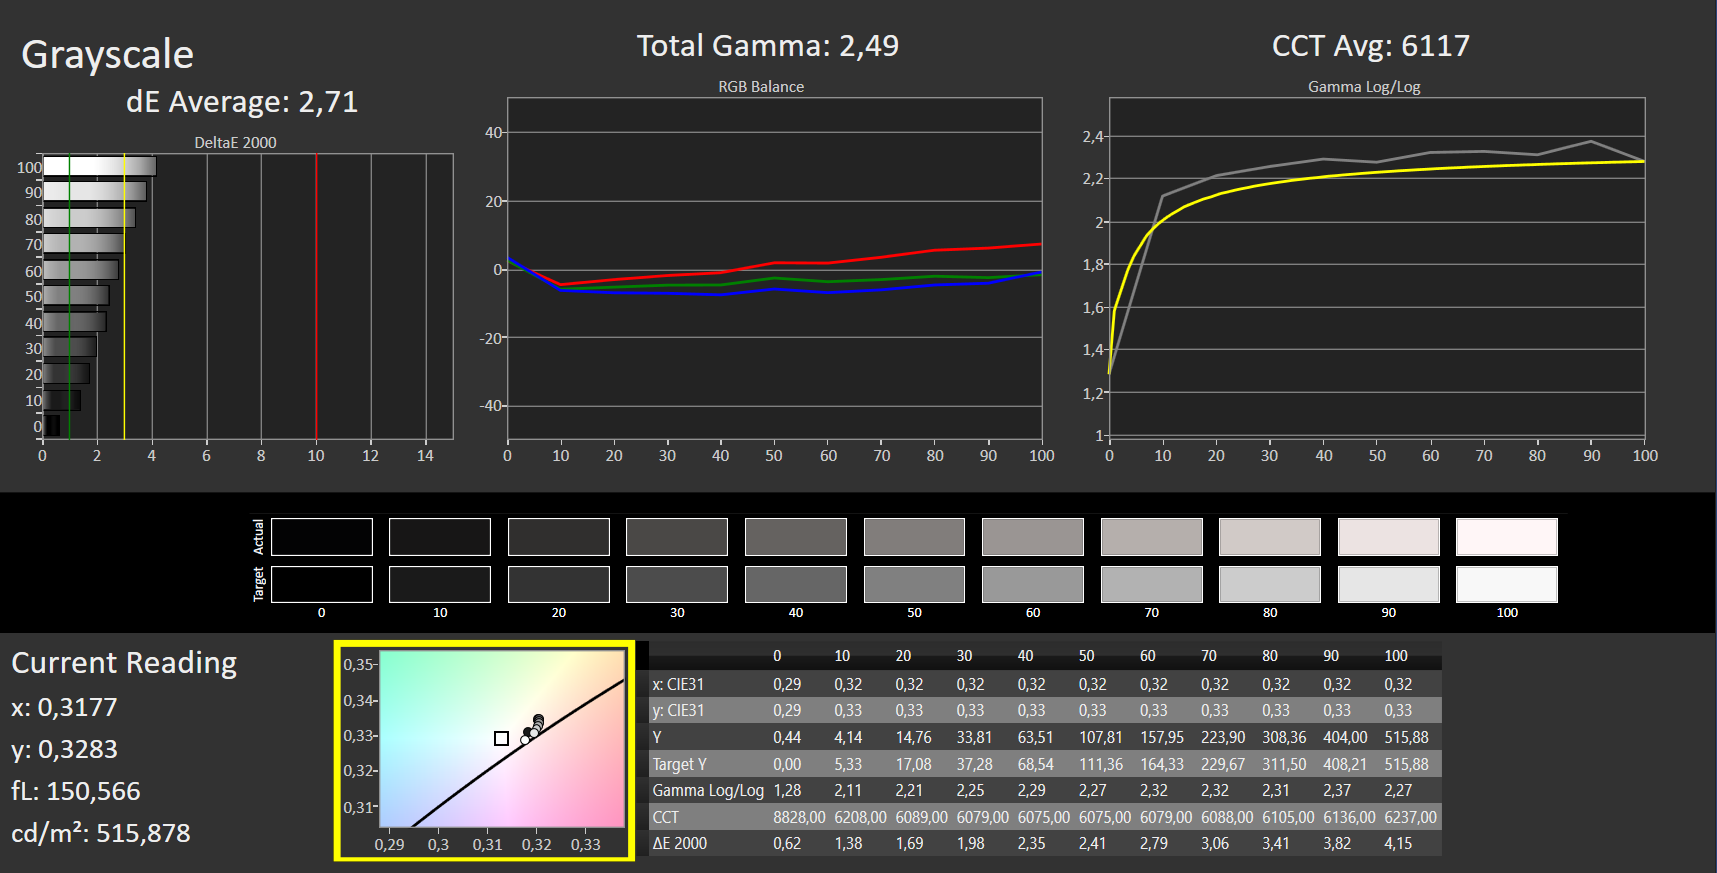
ΔE Greyscale Calman: 2.71 | ∀{0.09-98 Ø4.96}
70.45% AdobeRGB 1998 (Argyll 3D)
98.38% sRGB (Argyll 3D)
68.53% Display P3 (Argyll 3D)
Gamma: 2.49
CCT: 6117 K
| Lenovo Legion 5 Pro 16IAH7H BOE CCQ_NE160QDM_NY1, IPS, 2560x1600, 16" | HP Omen 16-b1090ng BOE09E5, IPS, 2560x1440, 16.1" | HP Omen 16-c0077ng BOE09E5, IPS, 2560x1440, 16.1" | Gigabyte Aero 16 YE5 Samsung SDC416B, AMOLED, 3840x2400, 16" | Alienware x14 i7 RTX 3060 SHP154D, IPS, 1920x1080, 14" | |
|---|---|---|---|---|---|
| Display | 3% | -0% | 24% | ||
| Display P3 Coverage (%) | 68.53 | 71 4% | 68.8 0% | 99.6 45% | |
| sRGB Coverage (%) | 98.38 | 97.9 0% | 96.9 -2% | 100 2% | |
| AdobeRGB 1998 Coverage (%) | 70.45 | 73.3 4% | 71.1 1% | 87.6 24% | |
| Response Times | -31% | -30% | 75% | 2% | |
| Response Time Grey 50% / Grey 80% * (ms) | 14 ? | 14.5 ? -4% | 13 ? 7% | 2.4 ? 83% | 9.6 ? 31% |
| Response Time Black / White * (ms) | 6 ? | 9.4 ? -57% | 10 ? -67% | 2 ? 67% | 7.6 ? -27% |
| PWM Frequency (Hz) | 60 ? | ||||
| Screen | -44% | -27% | 406% | -8% | |
| Brightness middle (cd/m²) | 515 | 335 -35% | 297 -42% | 368 -29% | 434 -16% |
| Brightness (cd/m²) | 475 | 319 -33% | 283 -40% | 368 -23% | 411 -13% |
| Brightness Distribution (%) | 85 | 90 6% | 91 7% | 93 9% | 89 5% |
| Black Level * (cd/m²) | 0.45 | 0.28 38% | 0.22 51% | 0.01 98% | 0.25 44% |
| Contrast (:1) | 1144 | 1196 5% | 1350 18% | 36800 3117% | 1736 52% |
| Colorchecker dE 2000 * | 2.38 | 4.38 -84% | 3.25 -37% | 2.33 2% | 3 -26% |
| Colorchecker dE 2000 max. * | 4.37 | 9.48 -117% | 6.33 -45% | 4.34 1% | 7.1 -62% |
| Colorchecker dE 2000 calibrated * | 1.1 | 1.33 -21% | 1.11 -1% | 0.7 36% | |
| Greyscale dE 2000 * | 2.71 | 7 -158% | 6.97 -157% | 0.8 70% | 5.1 -88% |
| Gamma | 2.49 88% | 2.103 105% | 2.3 96% | 2.119 104% | 2.19 100% |
| CCT | 6117 106% | 6244 104% | 6050 107% | 6569 99% | 6204 105% |
| Media total (Programa/Opciones) | -24% /
-32% | -19% /
-22% | 241% /
340% | 6% /
1% |
* ... más pequeño es mejor
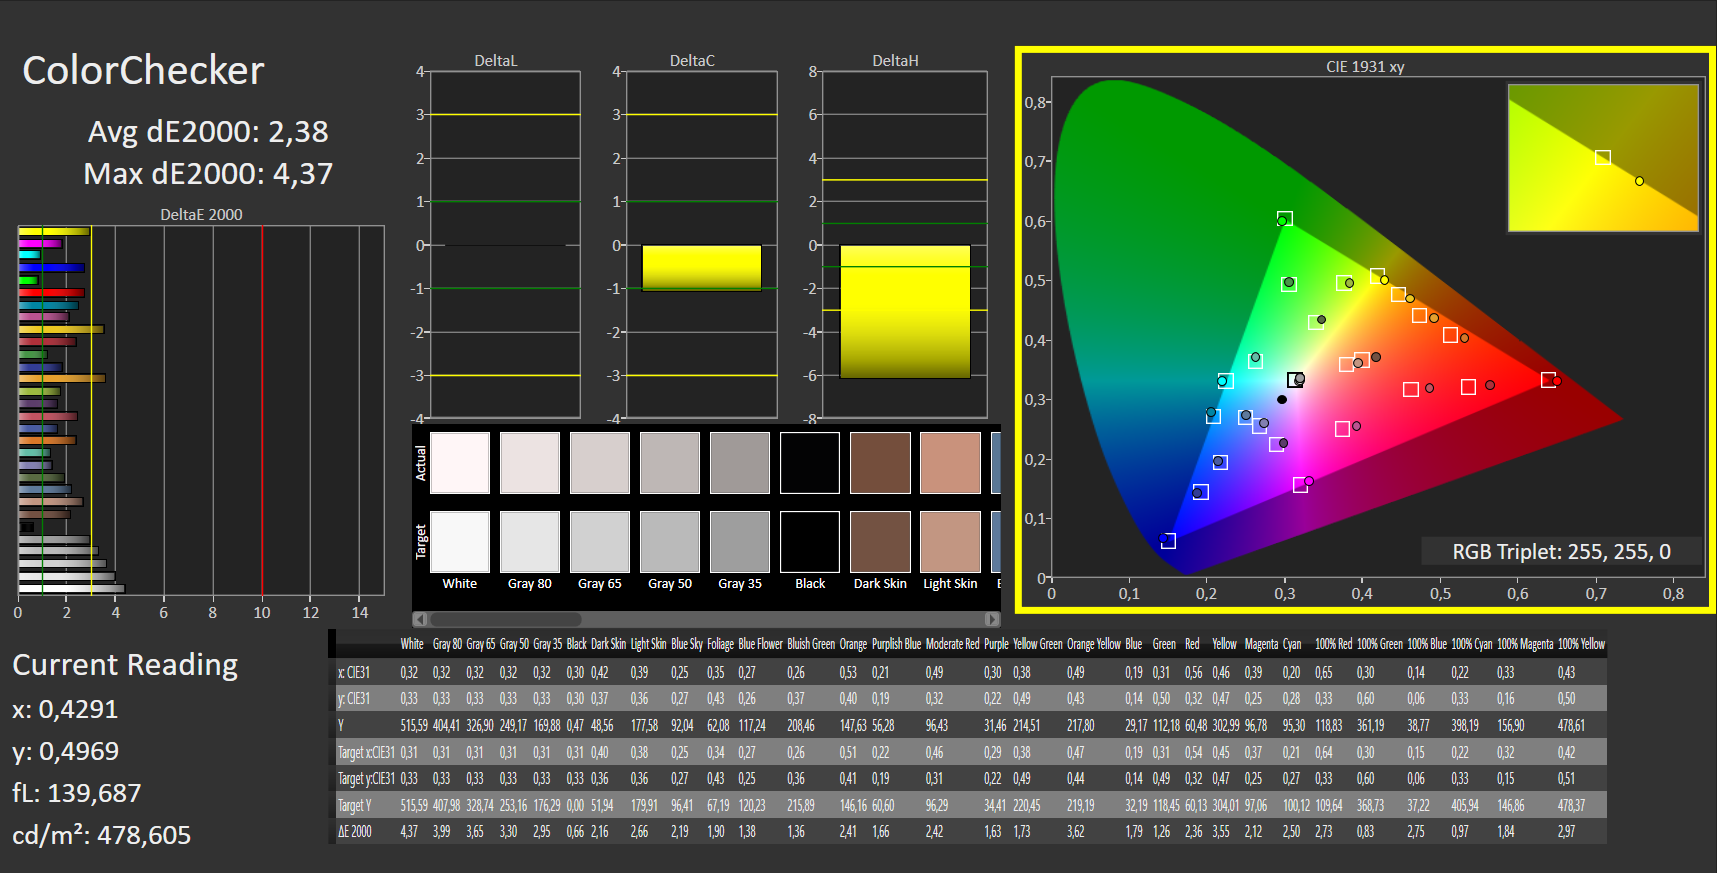
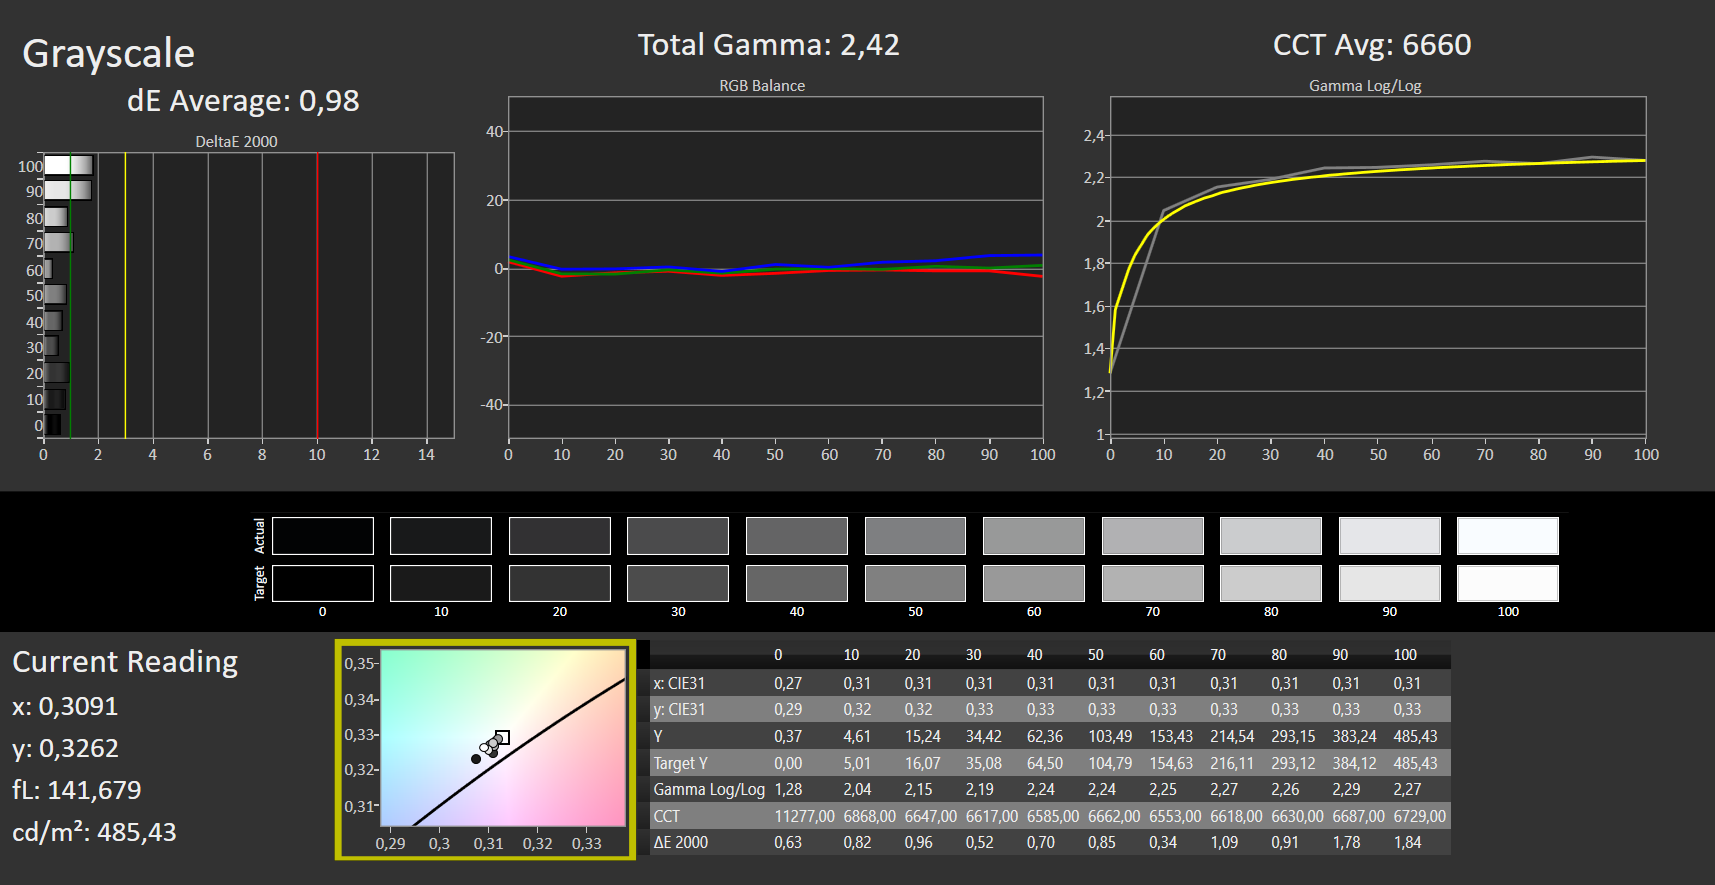
Con unos valores sólidos para los espacios de color habituales y una buena calibración de fábrica, la reproducción del color en el Legion 5 Pro es indudablemente adecuada para el uso diario. Con una diferencia de color media de alrededor de 2,5 DeltaE de fábrica, la reproducción del color en el dispositivo de 16 pulgadas está inmediatamente preparada para la edición de imágenes semiprofesional, mientras que los profesionales pueden sacar aún más partido a la pantalla con algo de calibración manual.
Nuestra calibración con equipos profesionales reduce el DeltaE a menos de 1 (el perfil está disponible arriba para su descarga) y ofrece así una excelente reproducción del color dentro de los límites del sRGB. Para poder prescindir de un monitor externo en aplicaciones profesionales y de color crítico, nos hubiera gustado tener una mejor cobertura en los espacios de color AdobeRGB y DCI-P3. En este sentido, especialmente los fotógrafos y los editores de imágenes se quedan algo cortos. Sin embargo, para los videógrafos que producen principalmente para la web, la pantalla es más que adecuada
La aplicación de color X-Rite en el Lenovo permite ofrecer varios preajustes adicionales para espacios de color de uso frecuente, algo que resulta enormemente útil para el trabajo diario de contenido creativo. Por ejemplo, el modo sRGB puede ser interesante para el diseño en línea, mientras que los videógrafos que utilizan el perfil Rec709 pueden incluso colorear material de vídeo con cierto grado de confianza.
Tiempos de respuesta del display
| ↔ Tiempo de respuesta de Negro a Blanco | ||
|---|---|---|
| 6 ms ... subida ↗ y bajada ↘ combinada | ↗ 2 ms subida |  |
| ↘ 4 ms bajada | ||
| La pantalla mostró tiempos de respuesta muy rápidos en nuestros tests y debería ser adecuada para juegos frenéticos. En comparación, todos los dispositivos de prueba van de ##min### (mínimo) a 240 (máximo) ms. » 19 % de todos los dispositivos son mejores. Esto quiere decir que el tiempo de respuesta medido es mejor que la media (19.8 ms) de todos los dispositivos testados. | ||
| ↔ Tiempo de respuesta 50% Gris a 80% Gris | ||
| 14 ms ... subida ↗ y bajada ↘ combinada | ↗ 6 ms subida |  |
| ↘ 8 ms bajada | ||
| La pantalla mostró buenos tiempos de respuesta en nuestros tests pero podría ser demasiado lenta para los jugones competitivos. En comparación, todos los dispositivos de prueba van de ##min### (mínimo) a 636 (máximo) ms. » 28 % de todos los dispositivos son mejores. Esto quiere decir que el tiempo de respuesta medido es mejor que la media (30.9 ms) de todos los dispositivos testados. | ||
Parpadeo de Pantalla / PWM (Pulse-Width Modulation)
| Parpadeo de Pantalla / PWM no detectado |  | ||
Comparación: 52 % de todos los dispositivos testados no usaron PWM para atenuar el display. Si se usó, medimos una media de 7741 (mínimo: 5 - máxmo: 343500) Hz. | |||
Como ya se ha mencionado, el alto nivel de brillo de más de 500 cd/m² ayuda en exteriores. La luz solar directa aún debe evitarse, pero eso se aplica a la mayoría de las pantallas de los portátiles. El revestimiento mate ciertamente evita que se vea más que el contenido de la pantalla.

Rendimiento: el desenfrenado i7-12700H se une a la rápida RTX 3060
Mientras que Lenovo ha sido capaz de ofrecer más que la mayoría de sus competidores hasta ahora (una plétora de puertos, una excelente carcasa y una gran pantalla), el rendimiento que ofrece es prácticamente inigualable. El i7 supera a su competencia, aunque esté parcialmente equipado con procesadores i9. La RTX 3060 también ofrece un rendimiento totalmente impresionante. Para conseguir un rendimiento de sistema tan estelar, Lenovo apuntala sus componentes principales con 16 GB de memoria RAM DDR5 4800 de última generación y una matriz de SSD NVME RAID-0 de 2 TB de gran capacidad de respuesta.
Condiciones de la prueba
El software Vantage que viene con la unidad puede ser algo exagerado, pero ofrece tres modos de rendimiento diferentes. Todas nuestras pruebas de rendimiento se realizaron en el modo de potencia, que hace honor a su nombre y proporciona al i7 hasta 120 W de pico y 100 W de potencia constante. El LED de color del botón de encendido cambia, sirviendo de indicador visual (rojo: modo de potencia, blanco: equilibrado, azul: silencioso). El modo silencioso también hace honor a su nombre: tras un pico inicial de 120 W, el procesador consume 65 W, y los ventiladores suenan agradablemente contenidos. Si no buscas necesariamente las mejores puntuaciones en Cinebench, el modo equilibrado también es una buena opción para la informática intensiva de la CPU. El consumo de energía es de unos 85-90 W, pero en comparación con el modo de potencia, el ruido de los ventiladores es un poco más silencioso.
Procesador
Estamos a mediados de 2022 y el i7-12700H se ha convertido en un conocido. Se ha convertido en el estándar de Intel para los creadores de contenidos rápidos y los portátiles para juegos. El rendimiento varía mucho de un equipo a otro y depende tanto de la configuración del fabricante como de la gestión de la refrigeración de un equipo específico.
El i7 es la potencia principal de la última generación Alder Lake de Intel y ofrece seis núcleos de rendimiento con soporte de hyper-threading y velocidades de reloj de 2,4 a 4,7 GHz. Las tareas en segundo plano o el soporte multinúcleo son proporcionados por los ocho núcleos de eficiencia (1,8-3,5 GHz) y completan los 14 núcleos que ofrecen un total de 20 hilos.
Lenovo permite que la CPU trabaje sin restricciones en la página web Legion, permitiendo que el portátil de 16 pulgadas alcance fácilmente la cima de la tabla de líderes en cuanto el rendimiento multinúcleo sea un requisito. Algunos portátiles ofrecen un rendimiento de un solo núcleo ligeramente superior, y los portátiles con el i9 tienen una ligera ventaja aquí. Sin embargo, el rendimiento mononúcleo es relevante para muy pocas aplicaciones hoy en día y esa ventaja de rendimiento es prácticamente indetectable en el uso diario.
El Legion 5 Pro rinde de forma excelente, especialmente bajo carga constante: Mientras que muchos portátiles sólo pueden mantener el rendimiento de su hardware para la renombrada primera o segunda ejecución de Cinebench, el Legion 5 Pro ofrece un rendimiento persistente sin fluctuaciones. Siempre hay suficiente potencia para los juegos, así como para las aplicaciones de contenido creativo.
Además de nuestras secuencias de prueba estandarizadas, también utilizamos el portátil con nuestro canal de YouTube. Cortamos, coloreamos y exportamos nuestros vídeos con BlackMagics DaVinci Resolve 17. A diferencia de las aplicaciones comunes de Adobe, que utilizan principalmente sólo el procesador, la CPU y la GPU se utilizan por igual en este software de edición. Gracias a los generosos niveles de potencia, nuestro material de origen (4k, BlackMagic RAW) se procesó sin problemas y sin pérdida de fotogramas. Además, la edición de imágenes en PhaseOnes Capture One y el líder de la clase Photoshop no nos causó ningún problema.
Cinebench R15 Multi Loop
Cinebench R23: Multi Core | Single Core
Cinebench R20: CPU (Multi Core) | CPU (Single Core)
Cinebench R15: CPU Multi 64Bit | CPU Single 64Bit
Blender: v2.79 BMW27 CPU
7-Zip 18.03: 7z b 4 | 7z b 4 -mmt1
Geekbench 5.5: Multi-Core | Single-Core
HWBOT x265 Benchmark v2.2: 4k Preset
LibreOffice : 20 Documents To PDF
R Benchmark 2.5: Overall mean
| CPU Performance rating | |
| Media de la clase Gaming | |
| Gigabyte Aero 16 YE5 | |
| HP Omen 16-b1090ng | |
| Lenovo Legion 5 Pro 16IAH7H | |
| Alienware x14 i7 RTX 3060 | |
| Medio Intel Core i7-12700H | |
| HP Omen 16-c0077ng -1! | |
| Cinebench R23 / Multi Core | |
| Media de la clase Gaming (10488 - 42661, n=104, últimos 2 años) | |
| Lenovo Legion 5 Pro 16IAH7H | |
| Gigabyte Aero 16 YE5 | |
| HP Omen 16-b1090ng | |
| Alienware x14 i7 RTX 3060 | |
| Medio Intel Core i7-12700H (4032 - 19330, n=64) | |
| HP Omen 16-c0077ng | |
| Cinebench R23 / Single Core | |
| Media de la clase Gaming (1601 - 2415, n=104, últimos 2 años) | |
| Gigabyte Aero 16 YE5 | |
| HP Omen 16-b1090ng | |
| Alienware x14 i7 RTX 3060 | |
| Medio Intel Core i7-12700H (778 - 1826, n=63) | |
| Lenovo Legion 5 Pro 16IAH7H | |
| HP Omen 16-c0077ng | |
| Cinebench R20 / CPU (Multi Core) | |
| Media de la clase Gaming (4029 - 16433, n=103, últimos 2 años) | |
| Lenovo Legion 5 Pro 16IAH7H | |
| Gigabyte Aero 16 YE5 | |
| Alienware x14 i7 RTX 3060 | |
| Medio Intel Core i7-12700H (1576 - 7407, n=64) | |
| HP Omen 16-b1090ng | |
| HP Omen 16-c0077ng | |
| Cinebench R20 / CPU (Single Core) | |
| Media de la clase Gaming (622 - 913, n=103, últimos 2 años) | |
| HP Omen 16-b1090ng | |
| Gigabyte Aero 16 YE5 | |
| Alienware x14 i7 RTX 3060 | |
| Medio Intel Core i7-12700H (300 - 704, n=64) | |
| Lenovo Legion 5 Pro 16IAH7H | |
| HP Omen 16-c0077ng | |
| Cinebench R15 / CPU Multi 64Bit | |
| Media de la clase Gaming (1578 - 6330, n=102, últimos 2 años) | |
| Lenovo Legion 5 Pro 16IAH7H | |
| HP Omen 16-b1090ng | |
| Gigabyte Aero 16 YE5 | |
| Alienware x14 i7 RTX 3060 | |
| Medio Intel Core i7-12700H (1379 - 2916, n=70) | |
| HP Omen 16-c0077ng | |
| Cinebench R15 / CPU Single 64Bit | |
| Media de la clase Gaming (188.8 - 350, n=103, últimos 2 años) | |
| Gigabyte Aero 16 YE5 | |
| HP Omen 16-b1090ng | |
| Medio Intel Core i7-12700H (113 - 263, n=65) | |
| Alienware x14 i7 RTX 3060 | |
| Lenovo Legion 5 Pro 16IAH7H | |
| HP Omen 16-c0077ng | |
| Blender / v2.79 BMW27 CPU | |
| HP Omen 16-c0077ng | |
| Medio Intel Core i7-12700H (168 - 732, n=63) | |
| Alienware x14 i7 RTX 3060 | |
| Gigabyte Aero 16 YE5 | |
| HP Omen 16-b1090ng | |
| Lenovo Legion 5 Pro 16IAH7H | |
| Media de la clase Gaming (79 - 330, n=101, últimos 2 años) | |
| 7-Zip 18.03 / 7z b 4 | |
| Media de la clase Gaming (33491 - 148086, n=102, últimos 2 años) | |
| HP Omen 16-b1090ng | |
| Lenovo Legion 5 Pro 16IAH7H | |
| Gigabyte Aero 16 YE5 | |
| Alienware x14 i7 RTX 3060 | |
| Medio Intel Core i7-12700H (22844 - 73067, n=63) | |
| 7-Zip 18.03 / 7z b 4 -mmt1 | |
| Media de la clase Gaming (4824 - 7436, n=102, últimos 2 años) | |
| Gigabyte Aero 16 YE5 | |
| HP Omen 16-b1090ng | |
| Medio Intel Core i7-12700H (2743 - 5972, n=63) | |
| Alienware x14 i7 RTX 3060 | |
| Lenovo Legion 5 Pro 16IAH7H | |
| HP Omen 16-c0077ng | |
| Geekbench 5.5 / Multi-Core | |
| Media de la clase Gaming (6460 - 28263, n=102, últimos 2 años) | |
| Gigabyte Aero 16 YE5 | |
| HP Omen 16-b1090ng | |
| Alienware x14 i7 RTX 3060 | |
| Lenovo Legion 5 Pro 16IAH7H | |
| Medio Intel Core i7-12700H (5144 - 13745, n=64) | |
| HP Omen 16-c0077ng | |
| Geekbench 5.5 / Single-Core | |
| Media de la clase Gaming (1403 - 2474, n=102, últimos 2 años) | |
| Gigabyte Aero 16 YE5 | |
| HP Omen 16-b1090ng | |
| Alienware x14 i7 RTX 3060 | |
| Medio Intel Core i7-12700H (803 - 1851, n=64) | |
| Lenovo Legion 5 Pro 16IAH7H | |
| HP Omen 16-c0077ng | |
| HWBOT x265 Benchmark v2.2 / 4k Preset | |
| Media de la clase Gaming (11.5 - 44.4, n=102, últimos 2 años) | |
| Lenovo Legion 5 Pro 16IAH7H | |
| HP Omen 16-b1090ng | |
| Gigabyte Aero 16 YE5 | |
| Alienware x14 i7 RTX 3060 | |
| Medio Intel Core i7-12700H (4.67 - 21.8, n=64) | |
| HP Omen 16-c0077ng | |
| LibreOffice / 20 Documents To PDF | |
| HP Omen 16-c0077ng | |
| Media de la clase Gaming (33.2 - 88.8, n=102, últimos 2 años) | |
| Medio Intel Core i7-12700H (34.2 - 95.3, n=63) | |
| HP Omen 16-b1090ng | |
| Lenovo Legion 5 Pro 16IAH7H | |
| Alienware x14 i7 RTX 3060 | |
| Gigabyte Aero 16 YE5 | |
| R Benchmark 2.5 / Overall mean | |
| HP Omen 16-c0077ng | |
| Lenovo Legion 5 Pro 16IAH7H | |
| Medio Intel Core i7-12700H (0.4441 - 1.052, n=63) | |
| Alienware x14 i7 RTX 3060 | |
| HP Omen 16-b1090ng | |
| Media de la clase Gaming (0.3439 - 0.59, n=102, últimos 2 años) | |
| Gigabyte Aero 16 YE5 | |
* ... más pequeño es mejor
AIDA64: FP32 Ray-Trace | FPU Julia | CPU SHA3 | CPU Queen | FPU SinJulia | FPU Mandel | CPU AES | CPU ZLib | FP64 Ray-Trace | CPU PhotoWorxx
| Performance rating | |
| Media de la clase Gaming | |
| HP Omen 16-c0077ng | |
| Lenovo Legion 5 Pro 16IAH7H | |
| Alienware x14 i7 RTX 3060 | |
| Medio Intel Core i7-12700H | |
| Gigabyte Aero 16 YE5 | |
| HP Omen 16-b1090ng | |
| AIDA64 / FP32 Ray-Trace | |
| Media de la clase Gaming (10227 - 85542, n=102, últimos 2 años) | |
| Lenovo Legion 5 Pro 16IAH7H | |
| Lenovo Legion 5 Pro 16IAH7H | |
| HP Omen 16-c0077ng | |
| Medio Intel Core i7-12700H (2585 - 17957, n=64) | |
| Alienware x14 i7 RTX 3060 | |
| Gigabyte Aero 16 YE5 | |
| HP Omen 16-b1090ng | |
| AIDA64 / FPU Julia | |
| Media de la clase Gaming (51376 - 372155, n=102, últimos 2 años) | |
| HP Omen 16-c0077ng | |
| Lenovo Legion 5 Pro 16IAH7H | |
| Lenovo Legion 5 Pro 16IAH7H | |
| Medio Intel Core i7-12700H (12439 - 90760, n=64) | |
| Alienware x14 i7 RTX 3060 | |
| Gigabyte Aero 16 YE5 | |
| HP Omen 16-b1090ng | |
| AIDA64 / CPU SHA3 | |
| Media de la clase Gaming (2180 - 10115, n=102, últimos 2 años) | |
| Lenovo Legion 5 Pro 16IAH7H | |
| Lenovo Legion 5 Pro 16IAH7H | |
| HP Omen 16-c0077ng | |
| Medio Intel Core i7-12700H (833 - 4242, n=64) | |
| Gigabyte Aero 16 YE5 | |
| Alienware x14 i7 RTX 3060 | |
| HP Omen 16-b1090ng | |
| AIDA64 / CPU Queen | |
| Media de la clase Gaming (49785 - 173351, n=86, últimos 2 años) | |
| Gigabyte Aero 16 YE5 | |
| HP Omen 16-b1090ng | |
| Alienware x14 i7 RTX 3060 | |
| HP Omen 16-c0077ng | |
| Lenovo Legion 5 Pro 16IAH7H | |
| Medio Intel Core i7-12700H (57923 - 103202, n=63) | |
| AIDA64 / FPU SinJulia | |
| Media de la clase Gaming (4424 - 33636, n=102, últimos 2 años) | |
| HP Omen 16-c0077ng | |
| Lenovo Legion 5 Pro 16IAH7H | |
| Lenovo Legion 5 Pro 16IAH7H | |
| Gigabyte Aero 16 YE5 | |
| Alienware x14 i7 RTX 3060 | |
| HP Omen 16-b1090ng | |
| Medio Intel Core i7-12700H (3249 - 9939, n=64) | |
| AIDA64 / FPU Mandel | |
| Media de la clase Gaming (25115 - 196829, n=102, últimos 2 años) | |
| HP Omen 16-c0077ng | |
| Lenovo Legion 5 Pro 16IAH7H | |
| Lenovo Legion 5 Pro 16IAH7H | |
| Medio Intel Core i7-12700H (7135 - 44760, n=64) | |
| Gigabyte Aero 16 YE5 | |
| Alienware x14 i7 RTX 3060 | |
| HP Omen 16-b1090ng | |
| AIDA64 / CPU AES | |
| Lenovo Legion 5 Pro 16IAH7H | |
| Lenovo Legion 5 Pro 16IAH7H | |
| HP Omen 16-c0077ng | |
| Media de la clase Gaming (39258 - 247074, n=102, últimos 2 años) | |
| Alienware x14 i7 RTX 3060 | |
| Gigabyte Aero 16 YE5 | |
| Medio Intel Core i7-12700H (31839 - 144360, n=64) | |
| HP Omen 16-b1090ng | |
| AIDA64 / CPU ZLib | |
| Media de la clase Gaming (574 - 2531, n=102, últimos 2 años) | |
| Lenovo Legion 5 Pro 16IAH7H | |
| Lenovo Legion 5 Pro 16IAH7H | |
| Alienware x14 i7 RTX 3060 | |
| Gigabyte Aero 16 YE5 | |
| Medio Intel Core i7-12700H (305 - 1171, n=64) | |
| HP Omen 16-b1090ng | |
| HP Omen 16-c0077ng | |
| AIDA64 / FP64 Ray-Trace | |
| Media de la clase Gaming (5509 - 45446, n=102, últimos 2 años) | |
| Lenovo Legion 5 Pro 16IAH7H | |
| Lenovo Legion 5 Pro 16IAH7H | |
| HP Omen 16-c0077ng | |
| Medio Intel Core i7-12700H (1437 - 9692, n=64) | |
| Alienware x14 i7 RTX 3060 | |
| Gigabyte Aero 16 YE5 | |
| HP Omen 16-b1090ng | |
| AIDA64 / CPU PhotoWorxx | |
| Alienware x14 i7 RTX 3060 | |
| Media de la clase Gaming (12271 - 89891, n=102, últimos 2 años) | |
| HP Omen 16-b1090ng | |
| Gigabyte Aero 16 YE5 | |
| Lenovo Legion 5 Pro 16IAH7H | |
| Lenovo Legion 5 Pro 16IAH7H | |
| Medio Intel Core i7-12700H (12863 - 52207, n=64) | |
| HP Omen 16-c0077ng | |
Rendimiento del sistema
El rendimiento del sistema de este portátil de gama alta es irrefutable y, a pesar de la "pequeña" tarjeta gráfica Ampere, nuestra configuración de prueba está muy bien posicionada en relación con otros portátiles. Como demuestran los resultados de PC Mark y nuestras propias observaciones, el Legion domina las tareas cotidianas a la velocidad del rayo y nada lo sacará de su ritmo. Es fácil editar una imagen en Photoshop, saltar a un programa de edición de vídeo y ver un vlog 4k en YouTube por el camino; y además sigue teniendo una gran capacidad incluso con un montón de pestañas del navegador abiertas.
CrossMark: Overall | Productivity | Creativity | Responsiveness
| PCMark 10 / Score | |
| Media de la clase Gaming (5828 - 12414, n=93, últimos 2 años) | |
| Gigabyte Aero 16 YE5 | |
| Lenovo Legion 5 Pro 16IAH7H | |
| HP Omen 16-b1090ng | |
| Medio Intel Core i7-12700H, NVIDIA GeForce RTX 3060 Laptop GPU (5986 - 8156, n=12) | |
| Alienware x14 i7 RTX 3060 | |
| HP Omen 16-c0077ng | |
| PCMark 10 / Essentials | |
| Lenovo Legion 5 Pro 16IAH7H | |
| Gigabyte Aero 16 YE5 | |
| Media de la clase Gaming (8810 - 11935, n=97, últimos 2 años) | |
| Medio Intel Core i7-12700H, NVIDIA GeForce RTX 3060 Laptop GPU (9289 - 12144, n=12) | |
| HP Omen 16-c0077ng | |
| Alienware x14 i7 RTX 3060 | |
| HP Omen 16-b1090ng | |
| PCMark 10 / Productivity | |
| Media de la clase Gaming (6845 - 25323, n=95, últimos 2 años) | |
| Gigabyte Aero 16 YE5 | |
| Alienware x14 i7 RTX 3060 | |
| HP Omen 16-b1090ng | |
| Lenovo Legion 5 Pro 16IAH7H | |
| HP Omen 16-c0077ng | |
| Medio Intel Core i7-12700H, NVIDIA GeForce RTX 3060 Laptop GPU (6161 - 10362, n=12) | |
| PCMark 10 / Digital Content Creation | |
| Media de la clase Gaming (7602 - 19954, n=95, últimos 2 años) | |
| Gigabyte Aero 16 YE5 | |
| Lenovo Legion 5 Pro 16IAH7H | |
| HP Omen 16-b1090ng | |
| Medio Intel Core i7-12700H, NVIDIA GeForce RTX 3060 Laptop GPU (8950 - 12554, n=12) | |
| HP Omen 16-c0077ng | |
| Alienware x14 i7 RTX 3060 | |
| CrossMark / Overall | |
| Gigabyte Aero 16 YE5 | |
| Media de la clase Gaming (1366 - 2409, n=94, últimos 2 años) | |
| Alienware x14 i7 RTX 3060 | |
| Medio Intel Core i7-12700H, NVIDIA GeForce RTX 3060 Laptop GPU (1649 - 2017, n=11) | |
| Lenovo Legion 5 Pro 16IAH7H | |
| CrossMark / Productivity | |
| Gigabyte Aero 16 YE5 | |
| Media de la clase Gaming (1386 - 2254, n=94, últimos 2 años) | |
| Alienware x14 i7 RTX 3060 | |
| Medio Intel Core i7-12700H, NVIDIA GeForce RTX 3060 Laptop GPU (1536 - 1958, n=11) | |
| Lenovo Legion 5 Pro 16IAH7H | |
| CrossMark / Creativity | |
| Media de la clase Gaming (1343 - 2786, n=94, últimos 2 años) | |
| Gigabyte Aero 16 YE5 | |
| Alienware x14 i7 RTX 3060 | |
| Medio Intel Core i7-12700H, NVIDIA GeForce RTX 3060 Laptop GPU (1816 - 2084, n=11) | |
| Lenovo Legion 5 Pro 16IAH7H | |
| CrossMark / Responsiveness | |
| Gigabyte Aero 16 YE5 | |
| Alienware x14 i7 RTX 3060 | |
| Lenovo Legion 5 Pro 16IAH7H | |
| Media de la clase Gaming (1226 - 2334, n=94, últimos 2 años) | |
| Medio Intel Core i7-12700H, NVIDIA GeForce RTX 3060 Laptop GPU (1210 - 2207, n=11) | |
| PCMark 10 Score | 7531 puntos | |
ayuda | ||
| AIDA64 / Memory Copy | |
| Alienware x14 i7 RTX 3060 | |
| Media de la clase Gaming (21750 - 129946, n=102, últimos 2 años) | |
| HP Omen 16-b1090ng | |
| Gigabyte Aero 16 YE5 | |
| Lenovo Legion 5 Pro 16IAH7H | |
| Lenovo Legion 5 Pro 16IAH7H | |
| Medio Intel Core i7-12700H (25615 - 80511, n=64) | |
| HP Omen 16-c0077ng | |
| AIDA64 / Memory Read | |
| Alienware x14 i7 RTX 3060 | |
| Media de la clase Gaming (22956 - 118858, n=102, últimos 2 años) | |
| HP Omen 16-b1090ng | |
| Gigabyte Aero 16 YE5 | |
| Lenovo Legion 5 Pro 16IAH7H | |
| Lenovo Legion 5 Pro 16IAH7H | |
| Medio Intel Core i7-12700H (25586 - 79442, n=64) | |
| HP Omen 16-c0077ng | |
| AIDA64 / Memory Write | |
| Media de la clase Gaming (22297 - 135096, n=102, últimos 2 años) | |
| HP Omen 16-b1090ng | |
| Alienware x14 i7 RTX 3060 | |
| Gigabyte Aero 16 YE5 | |
| Lenovo Legion 5 Pro 16IAH7H | |
| Lenovo Legion 5 Pro 16IAH7H | |
| Medio Intel Core i7-12700H (23679 - 88660, n=64) | |
| HP Omen 16-c0077ng | |
| AIDA64 / Memory Latency | |
| Lenovo Legion 5 Pro 16IAH7H | |
| Lenovo Legion 5 Pro 16IAH7H | |
| Alienware x14 i7 RTX 3060 | |
| Media de la clase Gaming (75.3 - 165.4, n=102, últimos 2 años) | |
| HP Omen 16-b1090ng | |
| Gigabyte Aero 16 YE5 | |
| HP Omen 16-c0077ng | |
| Medio Intel Core i7-12700H (76.2 - 133.9, n=62) | |
* ... más pequeño es mejor
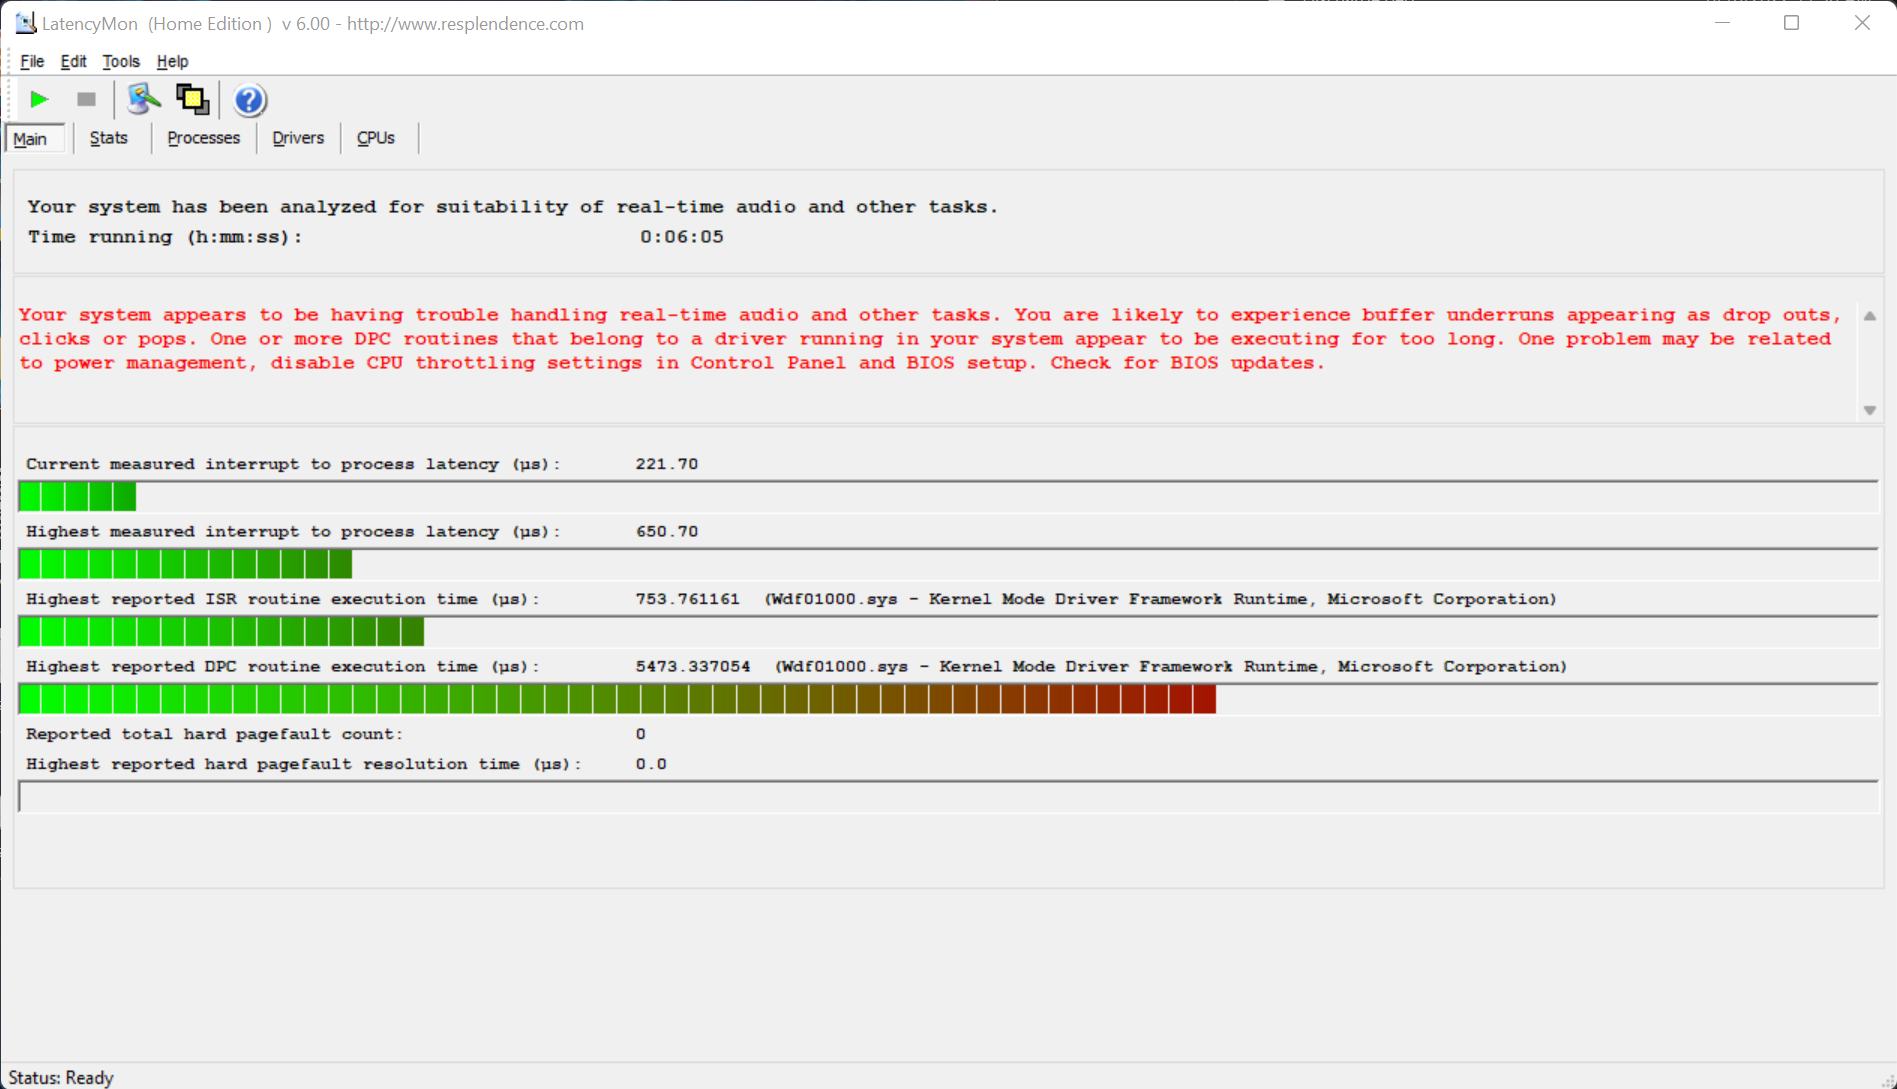
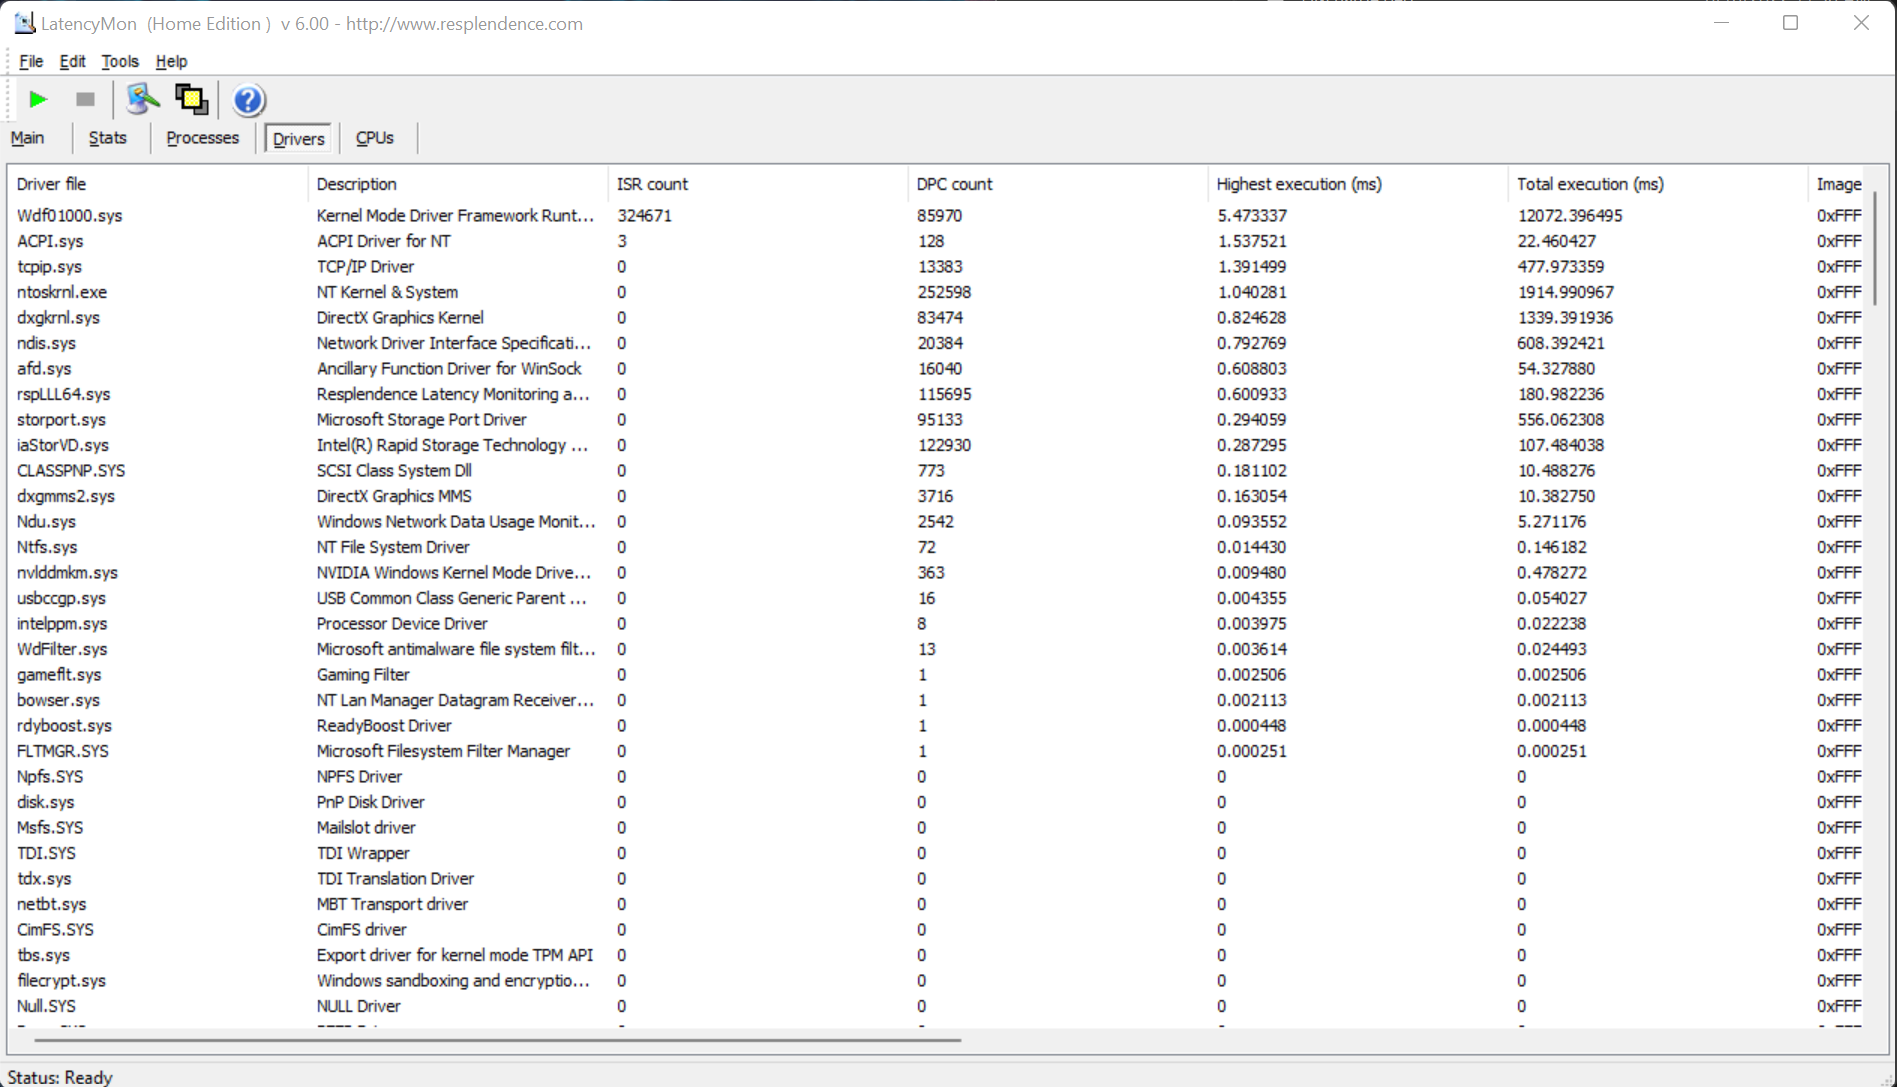
Latencia del CPD
Los resultados de la prueba LatencyMon de nuestro dispositivo de análisis son en parte mucho mejores que los de la competencia, pero el Legion no es el dispositivo preferido cuando se trata de editar audio en tiempo real. Sin embargo, teniendo en cuenta que es esencialmente un portátil para juegos, y dado que nuestro vídeo de YouTube sólo perdió un puñado de fotogramas, los resultados de LatencyMon pueden ser aceptables. Sin embargo, la carga de la CPU/GPU durante la reproducción de vídeo 4K fue, en efecto, bastante elevada y nos habría gustado ver un despliegue algo más eficaz de los recursos del sistema.
| DPC Latencies / LatencyMon - interrupt to process latency (max), Web, Youtube, Prime95 | |
| HP Omen 16-c0077ng | |
| Alienware x14 i7 RTX 3060 | |
| HP Omen 16-b1090ng | |
| Lenovo Legion 5 Pro 16IAH7H | |
| Gigabyte Aero 16 YE5 | |
* ... más pequeño es mejor
Dispositivos de almacenamiento
Las últimas unidades SSD PCI-E Gen 4 NVME son, en efecto, tan rápidas que sus diferencias de rendimiento en el uso cotidiano apenas tienen importancia y son casi imperceptibles. No obstante, Lenovo ha decidido incluir dos de sus exponentes más rápidos en una matriz RAID-0 en el Legion 5i Pro.
Mientras que cada uno de estos SSDs puntúa bien individualmente y encabezan nuestras tablas de rendimiento, casi duplican sus tasas de lectura y escritura en un array doble. Alrededor de 12 GB en mediciones máximas suena extremadamente impresionante sobre el papel, pero probablemente no hay muchas aplicaciones que se beneficien de tales velocidades de vértigo. Por supuesto, esto no es en absoluto una queja, dado que hay 2 TB de espacio de almacenamiento total disponible para juegos, imágenes o datos de vídeo de alta resolución. Especialmente en el trabajo diario, la molestia de tener que trabajar con varios discos duros externos se hace evitable. La prueba de resistencia del SSD sí muestra repetidas caídas tras largos periodos. Esto podría ser un indicio de temperaturas excesivamente altas, que se producen bajo una alta carga constante del SSD.

* ... más pequeño es mejor
Disk Throttling: DiskSpd Read Loop, Queue Depth 8
Rendimiento de la GPU
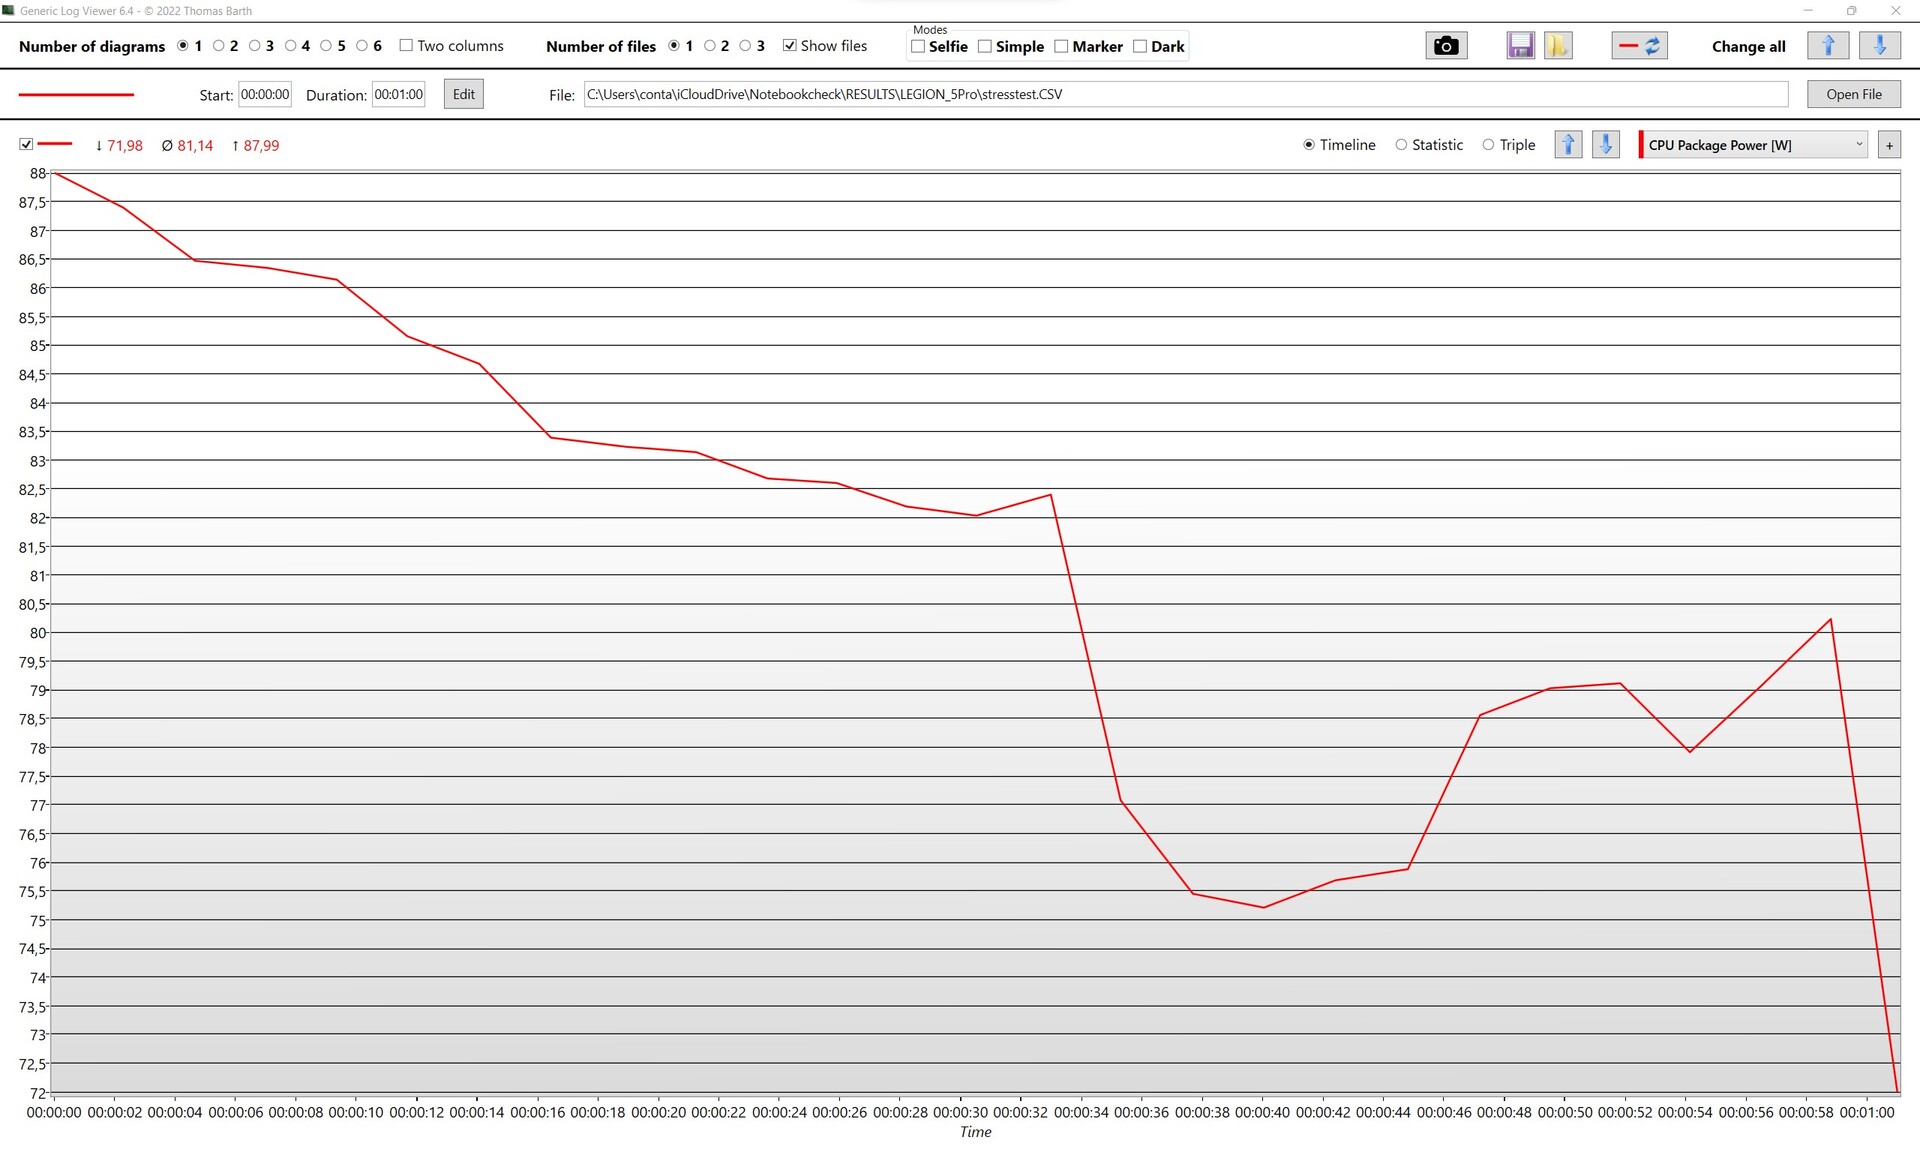
Al igual que con la CPU, las herramientas de modelado ya no son adecuadas para evaluar de forma fiable el rendimiento de las tarjetas gráficas. Nvidia deja mucho margen a los fabricantes en cuanto al consumo de energía, por lo que a veces es difícil predecir el rendimiento de un chip gráfico en los portátiles modernos. Una vez más, Lenovo da un buen ejemplo en este sentido: La RTX 3060 de gama media utiliza 120 W continuos en el Legion 5 y alcanza un máximo de unos 140 W. Mientras que la 3070 Ti de su modelo hermano (ver nuestro análisis aquí) es alrededor de un 20% más rápida, la 3080 Ti de la Gigabyte Aero 16, por ejemplo, está unos pocos puntos porcentuales por delante. La tarjeta Ampere más pequeña también rinde bien en comparación con los portátiles con la misma GPU. El Legion 5 Pro con la RTX 3060 está un buen 14% por encima de la media de la categoría, e incluso supera a la 3060 del Alienware x14 en un 20%.
| 3DMark 11 Performance | 27368 puntos | |
| 3DMark Cloud Gate Standard Score | 55891 puntos | |
| 3DMark Fire Strike Score | 20491 puntos | |
| 3DMark Fire Strike Extreme Score | 10399 puntos | |
| 3DMark Time Spy Score | 9640 puntos | |
| 3DMark Steel Nomad Score | 1882 puntos | |
| 3DMark Steel Nomad Light Score | 8440 puntos | |
ayuda | ||
Rendimiento de los juegos
Dejando a un lado los benchmarks sintéticos, la impresión excepcionalmente buena persiste para los juegos. El rendimiento es excelente y permite alrededor de 60 FPS en alto detalle en casi todos los títulos actuales. Si la tasa de refresco nativa del display QHD se agota, la resolución debería reducirse a Full HD y posiblemente incluso a HD.
| The Witcher 3 - 1920x1080 Ultra Graphics & Postprocessing (HBAO+) | |
| Media de la clase Gaming (104.7 - 240, n=7, últimos 2 años) | |
| Lenovo Legion 5 Pro 16 G7 i7 RTX 3070Ti | |
| HP Omen 16-b1090ng | |
| Gigabyte Aero 16 YE5 | |
| Lenovo Legion 5 Pro 16IAH7H | |
| HP Omen 16-c0077ng | |
| Medio NVIDIA GeForce RTX 3060 Laptop GPU (58.2 - 91.5, n=48) | |
| Alienware x14 i7 RTX 3060 | |
| Alienware x14 i7 RTX 3060 | |
| F1 2021 - 1920x1080 Ultra High Preset + Raytracing AA:T AF:16x | |
| Lenovo Legion 5 Pro 16 G7 i7 RTX 3070Ti | |
| Lenovo Legion 5 Pro 16IAH7H | |
| Gigabyte Aero 16 YE5 | |
| Alienware x14 i7 RTX 3060 | |
| Medio NVIDIA GeForce RTX 3060 Laptop GPU (67 - 112.8, n=9) | |
| Far Cry 6 - 1920x1080 Ultra Graphics Quality + HD Textures AA:T | |
| Media de la clase Gaming (n=1últimos 2 años) | |
| Lenovo Legion 5 Pro 16IAH7H | |
| Medio NVIDIA GeForce RTX 3060 Laptop GPU (59.8 - 94.3, n=6) | |
| Tiny Tina's Wonderlands | |
| 1920x1080 High Preset (DX12) | |
| Media de la clase Gaming (72.1 - 203, n=4, últimos 2 años) | |
| HP Omen 16-b1090ng | |
| Lenovo Legion 5 Pro 16IAH7H | |
| Medio NVIDIA GeForce RTX 3060 Laptop GPU (94.8 - 102.7, n=2) | |
| 1920x1080 Badass Preset (DX12) | |
| Media de la clase Gaming (55 - 159.4, n=4, últimos 2 años) | |
| HP Omen 16-b1090ng | |
| Lenovo Legion 5 Pro 16IAH7H | |
| Medio NVIDIA GeForce RTX 3060 Laptop GPU (72.3 - 80.5, n=3) | |
La RTX 3060 también puede mantener un rendimiento constante, como demuestran nuestros benchmarks y especialmente nuestra Witcher 3 prueba. En el test de 30 minutos, las tasas de refresco sólo caen unos pocos frames al principio y luego pueden mantenerse permanentemente sin más caídas.
Para un rendimiento máximo en el display interno, Lenovo equipa el Legion 5 Pro con un interruptor MUX y Advanced Optimus para puentear la GPU. Usando el software Vantage de Lenovo, la GPU también puede ser overclockeada con el interruptor. En nuestras pruebas, esto se notó con una media de 50-100 MHz más de velocidad de reloj del núcleo.
Witcher 3 FPS-Diagram
| bajo | medio | alto | ultra | QHD DLSS | QHD FSR | QHD | 4K DLSS | 4K FSR | 4K | |
|---|---|---|---|---|---|---|---|---|---|---|
| GTA V (2015) | 185.4 | 181.3 | 161.8 | 107.8 | 83.1 | |||||
| The Witcher 3 (2015) | 389 | 276.8 | 184.6 | 88.2 | ||||||
| Dota 2 Reborn (2015) | 172.1 | 159.4 | 148.9 | 142.8 | ||||||
| Civilization 6 (2016) | 349 | 149 | 131 | |||||||
| Final Fantasy XV Benchmark (2018) | 199.2 | 117.8 | 87.2 | 63.8 | ||||||
| X-Plane 11.11 (2018) | 150.4 | 138 | 105.6 | |||||||
| World of Tanks enCore (2018) | 121.1 | |||||||||
| Far Cry 5 (2018) | 165 | 135 | 128 | 120 | 90 | |||||
| Strange Brigade (2018) | 393 | 235 | 186.6 | 160.7 | ||||||
| Apex Legends (2019) | 164.7 | 163.9 | 135.1 | 92.4 | 73.5 | 48.6 | ||||
| Borderlands 3 (2019) | 72.1 | 51.3 | ||||||||
| Gears Tactics (2020) | 109 | 73.3 | ||||||||
| Valorant (2020) | 189.4 | 304 | ||||||||
| Assassin´s Creed Valhalla (2020) | 152 | 106 | 85 | 62 | 53 | |||||
| F1 2021 (2021) | 360 | 287 | 227 | 112.8 | ||||||
| Far Cry 6 (2021) | 148.1 | 119.8 | 104.1 | 94.3 | 70.3 | |||||
| Cyberpunk 2077 1.6 (2022) | 61.9 | 38.6 | ||||||||
| Tiny Tina's Wonderlands (2022) | 180.27 | 147.17 | 102.73 | 80.51 | 56.25 | |||||
| F1 22 (2022) | 184.2 | 171.6 | 141.2 | 50.4 | 31.4 | |||||
| FIFA 23 (2022) | 116.9 | 118.2 | 111.9 | 88.9 | 62.8 | |||||
| A Plague Tale Requiem (2022) | 40.5 | 28.8 | ||||||||
| Uncharted Legacy of Thieves Collection (2022) | 57 | 34.3 | ||||||||
| Call of Duty Modern Warfare 2 2022 (2022) | 76 | 54 | ||||||||
| Spider-Man Miles Morales (2022) | 75.8 | 63.8 | ||||||||
| Starfield (2023) | 40.1 | 35.3 | 28.6 | 18.8 | ||||||
| Baldur's Gate 3 (2023) | 90.6 | 60.6 | ||||||||
| Cyberpunk 2077 (2023) | 107.6 | 85.8 | 73.3 | 63.6 | 46 | 38.2 | 22.2 | 17 | ||
| Counter-Strike 2 (2023) | 122.9 | 82.2 | 49.2 | |||||||
| EA Sports FC 24 (2023) | 125.6 | 101 | 58.2 | |||||||
| Total War Pharaoh (2023) | 97.3 | 69.3 | 36.5 | |||||||
| The Finals (2023) | 120.9 | 75.4 | 35 | |||||||
| Helldivers 2 (2024) | 73.9 | 37.9 | 27.6 | |||||||
| Horizon Forbidden West (2024) | 33.3 | 26.7 | 12.1 | |||||||
| Senua's Saga Hellblade 2 (2024) | 23.9 | 17.7 | 9.25 | |||||||
| F1 24 (2024) | 130.9 | 106.2 | 66.3 | 31 | 31.3 | 29.4 | 19.8 | 15.3 | 14 | 9.08 |
| Black Myth: Wukong (2024) | 41 | 32 | 18 | 15 | ||||||
| Star Wars Outlaws (2024) | 29.8 | 27.8 | 23.7 | 19.2 | 25.2 | 17.8 | ||||
| Space Marine 2 (2024) | 61.9 | 56.9 | 43 | 22.5 | ||||||
| Final Fantasy XVI (2024) | 49.7 | 43.8 | 40.9 | |||||||
| EA Sports FC 25 (2024) | 73.6 | 58 | 32.3 | |||||||
| Stalker 2 (2024) | 54.7 | 16.1 | 11.6 | 13.9 | 4 | |||||
| Marvel Rivals (2024) | 81 | 64 | 57 | 34 | 21 | |||||
| Kingdom Come Deliverance 2 (2025) | 60.4 | 44.2 | 43.6 | 31.6 | ||||||
| Monster Hunter Wilds (2025) | 59.6 | 49.3 | 27 | 25.5 | 18.8 | |||||
| Civilization 7 (2025) | 110.3 | 103.2 | 70.8 | 46.5 | 30.6 | |||||
| The Elder Scrolls IV Oblivion Remastered (2025) | 69 | 58.9 | 49.4 | 19.7 | 11.9 | |||||
| Doom: The Dark Ages (2025) | 62.5 | 58.1 | 50.4 | 49.9 | 40.9 | 44.8 | 31.6 | 12.7 | 10.3 | 10.4 |
| F1 25 (2025) | 186.8 | 165.1 | 126.5 | 10.4 | 10.7 | 6 | 4.54 | 1.697 | ||
| Borderlands 4 (2025) | 39.1 | 30.7 | 23.2 | 13.8 | ||||||
| Battlefield 6 (2025) | 94.1 | 82.3 | 67.9 | 45.2 | 41.1 | 26.9 | ||||
| The Outer Worlds 2 (2025) | 86.1 | 64.3 | 47.1 | 23.4 | 14.6 | |||||
| ARC Raiders (2025) | 143.8 | 90.5 | 70 | 37.5 | 27.2 | |||||
| Anno 117: Pax Romana (2025) | 80 | 59.2 | 44.6 | 24.3 | 24.9 | 17.2 | ||||
| Call of Duty Black Ops 7 (2025) | 122 | 111 | 83 | 27 | 15 | 3 | ||||
| Resident Evil Requiem (2026) | 86.1 | 60.6 | 57 | |||||||
| Death Stranding 2 (2026) | 67 | 57.2 | 51.8 | 38.8 | 42 | 26 | ||||
| Crimson Desert (2026) | 84.9 | 52 | 48.8 | 41.7 | 35 | 31.9 | ||||
| Pragmata (2026) | 58.2 | 53.8 | 39.5 | 25.2 | 19.1 | |||||
| War Thunder (2026) | 245 | 261 | 240 | 62.3 | 37.7 | 19.6 | ||||
| Forza Horizon 6 (2026) | 79 | 47 | 21 | 19 | 14 | |||||
| 007 First Light (2026) | 53.9 | 51.1 | 44.7 | 41.6 | 35.5 | 13.2 |
Emisiones - Typical Gamer
Ruido del sistema
Aunque Lenovo ofrece un margen muy generoso para el consumo de energía tanto de la CPU como de la GPU, el Legion 5 se comporta de forma poco notable en comparación con la competencia en la prueba de ruido. Aunque los ventiladores también funcionan durante actividades sencillas, no nos pareció molesto. Como los ventiladores no pulsan y registran su despliegue con un lento aumento de velocidad y sin molestas frecuencias de interferencia, también puedes cortar vídeos o editar imágenes sin los auriculares puestos. En cuanto la CPU y la tarjeta gráfica funcionan a un máximo de 120 W, el calor residual resultante debe ser disipado de la caja. Cuando esto ocurre, los ventiladores entran en acción pero mantienen sus características discretas incluso a velocidades más altas.
Sin embargo, hay que mantener los auriculares o los cascos en stand-by cuando se pone en marcha, esto se aplica a casi todos los portátiles para juegos de 2022, incluso cuando el hardware no se aprovecha tan eficazmente como en el Legion 5 Pro.
Ruido
| Ocioso |
| 28.7 / 32 / 32 dB(A) |
| Carga |
| 45.2 / 54.4 dB(A) |
 | ||
30 dB silencioso 40 dB(A) audible 50 dB(A) ruidosamente alto |
||
min: | ||
| Lenovo Legion 5 Pro 16IAH7H GeForce RTX 3060 Laptop GPU, i7-12700H, 2x Samsung PM9A1 MZVL21T0HCLR (RAID 0) | HP Omen 16-b1090ng GeForce RTX 3070 Ti Laptop GPU, i7-12700H, WDC PC SN810 1TB | HP Omen 16-c0077ng Radeon RX 6600M, R7 5800H, Samsung PM981a MZVLB1T0HBLR | Gigabyte Aero 16 YE5 GeForce RTX 3080 Ti Laptop GPU, i9-12900HK, Phison ESR01TBMFCT | Alienware x14 i7 RTX 3060 GeForce RTX 3060 Laptop GPU, i7-12700H, WDC PC SN810 1TB | |
|---|---|---|---|---|---|
| Noise | -4% | -3% | -1% | 10% | |
| apagado / medio ambiente * (dB) | 24.6 | 26 -6% | 25 -2% | 25 -2% | 24.7 -0% |
| Idle Minimum * (dB) | 28.7 | 30 -5% | 25 13% | 30 -5% | 24.7 14% |
| Idle Average * (dB) | 32 | 31 3% | 31.2 2% | 32 -0% | 24.7 23% |
| Idle Maximum * (dB) | 32 | 33 -3% | 33.8 -6% | 33 -3% | 30.9 3% |
| Load Average * (dB) | 45.2 | 49 -8% | 55.4 -23% | 45 -0% | 40 12% |
| Load Maximum * (dB) | 54.4 | 57 -5% | 56 -3% | 52 4% | 51.5 5% |
| Witcher 3 ultra * (dB) | 53 | 50 | 51.5 |
* ... más pequeño es mejor
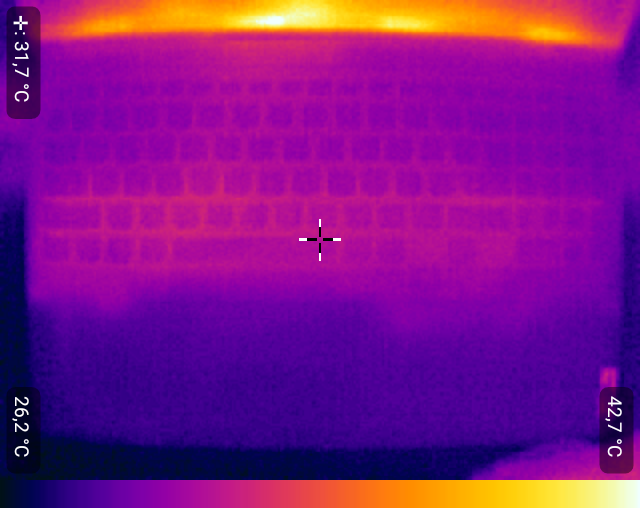
Temperatura
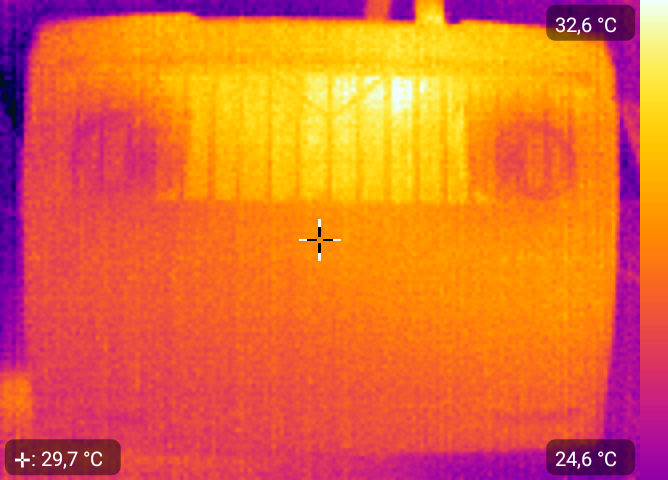
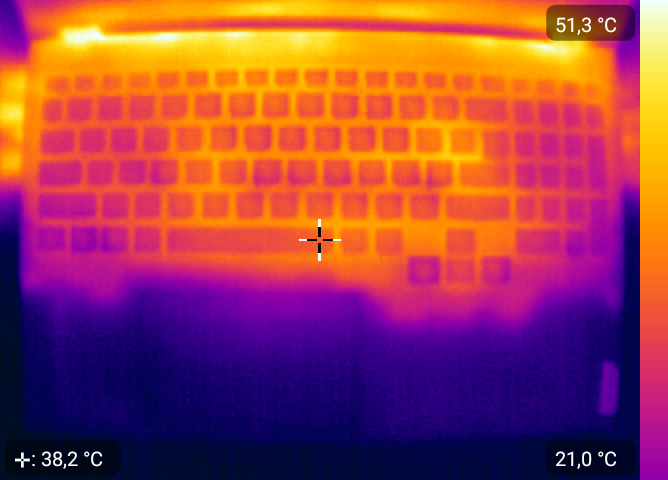
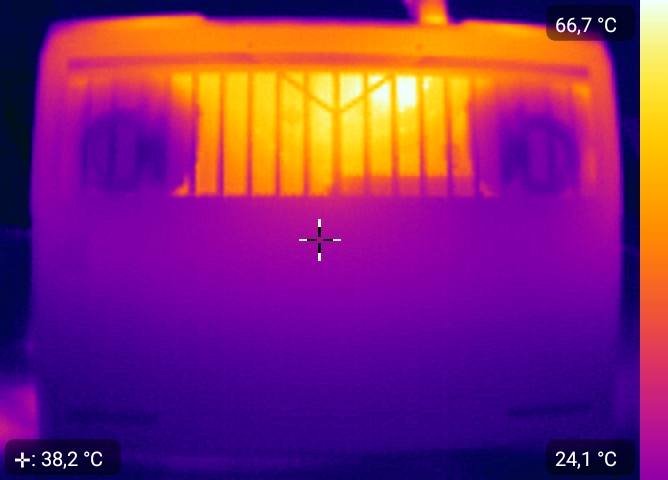
Las superficies metálicas superiores de esta unidad de 16 pulgadas se calientan moderadamente bajo carga. También puede calentarse mucho cerca de la pantalla, pero ni el teclado ni el reposamuñecas se calentaron de forma desagradable durante nuestras pruebas. En la parte inferior y cerca de los elementos de refrigeración en la parte trasera del portátil, puede calentarse razonablemente. Digamos que el Legion preferiría estar apoyado en un escritorio mientras se juega.
(-) La temperatura máxima en la parte superior es de 45.8 °C / 114 F, frente a la media de 40.4 °C / 105 F, que oscila entre 21.2 y 68.8 °C para la clase Gaming.
(-) El fondo se calienta hasta un máximo de 66.3 °C / 151 F, frente a la media de 43.2 °C / 110 F
(+) En reposo, la temperatura media de la parte superior es de 27.8 °C / 82# F, frente a la media del dispositivo de 33.9 °C / 93 F.
(+) El reposamanos y el panel táctil están a una temperatura inferior a la de la piel, con un máximo de 29 °C / 84.2 F y, por tanto, son fríos al tacto.
(±) La temperatura media de la zona del reposamanos de dispositivos similares fue de 28.8 °C / 83.8 F (-0.2 °C / -0.4 F).
| Lenovo Legion 5 Pro 16IAH7H Intel Core i7-12700H, NVIDIA GeForce RTX 3060 Laptop GPU | HP Omen 16-b1090ng Intel Core i7-12700H, NVIDIA GeForce RTX 3070 Ti Laptop GPU | HP Omen 16-c0077ng AMD Ryzen 7 5800H, AMD Radeon RX 6600M | Gigabyte Aero 16 YE5 Intel Core i9-12900HK, NVIDIA GeForce RTX 3080 Ti Laptop GPU | Alienware x14 i7 RTX 3060 Intel Core i7-12700H, NVIDIA GeForce RTX 3060 Laptop GPU | |
|---|---|---|---|---|---|
| Heat | 12% | 9% | -2% | 11% | |
| Maximum Upper Side * (°C) | 45.8 | 41 10% | 40.6 11% | 49 -7% | 51.3 -12% |
| Maximum Bottom * (°C) | 66.3 | 62 6% | 36 46% | 55 17% | 44.4 33% |
| Idle Upper Side * (°C) | 30.4 | 25 18% | 31.3 -3% | 33 -9% | 27.2 11% |
| Idle Bottom * (°C) | 30.4 | 26 14% | 36 -18% | 33 -9% | 26.6 12% |
* ... más pequeño es mejor
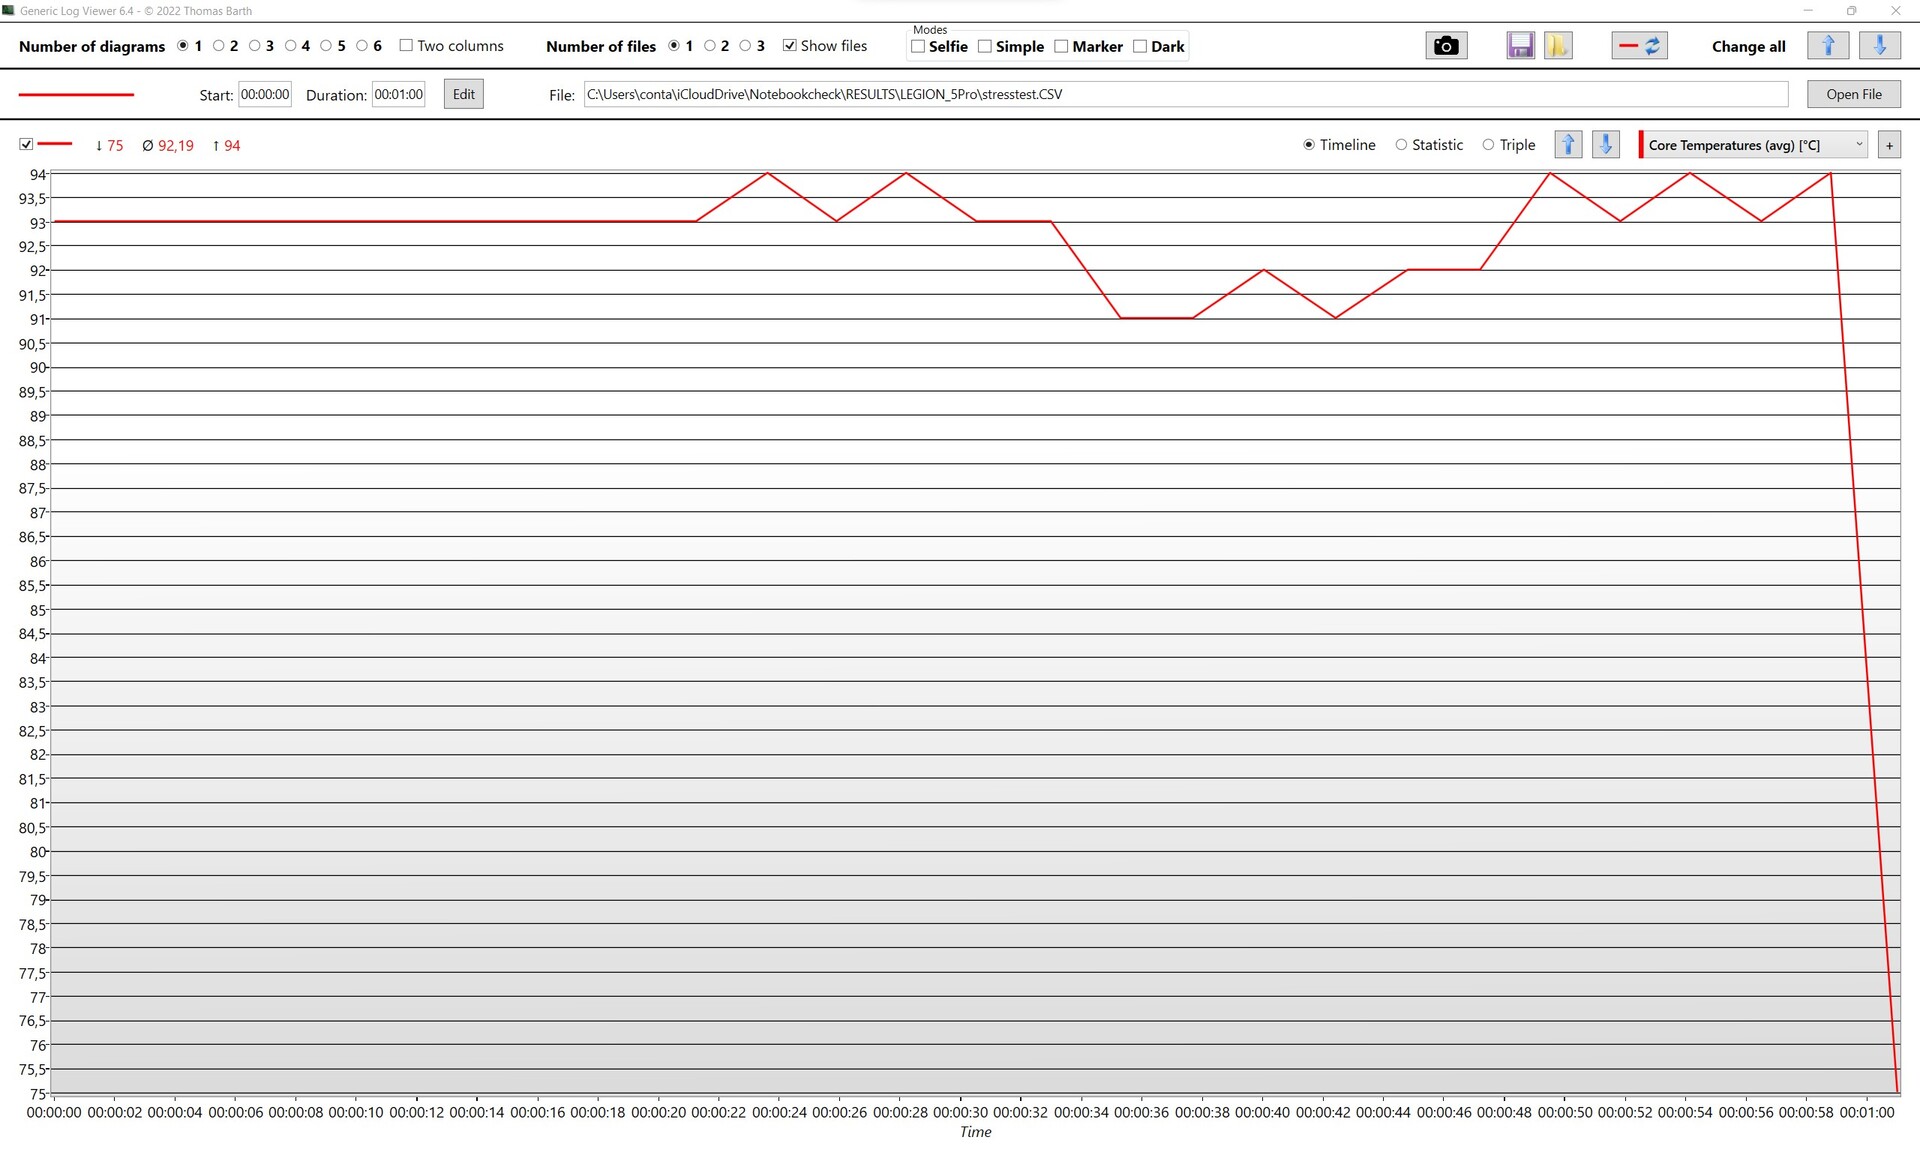
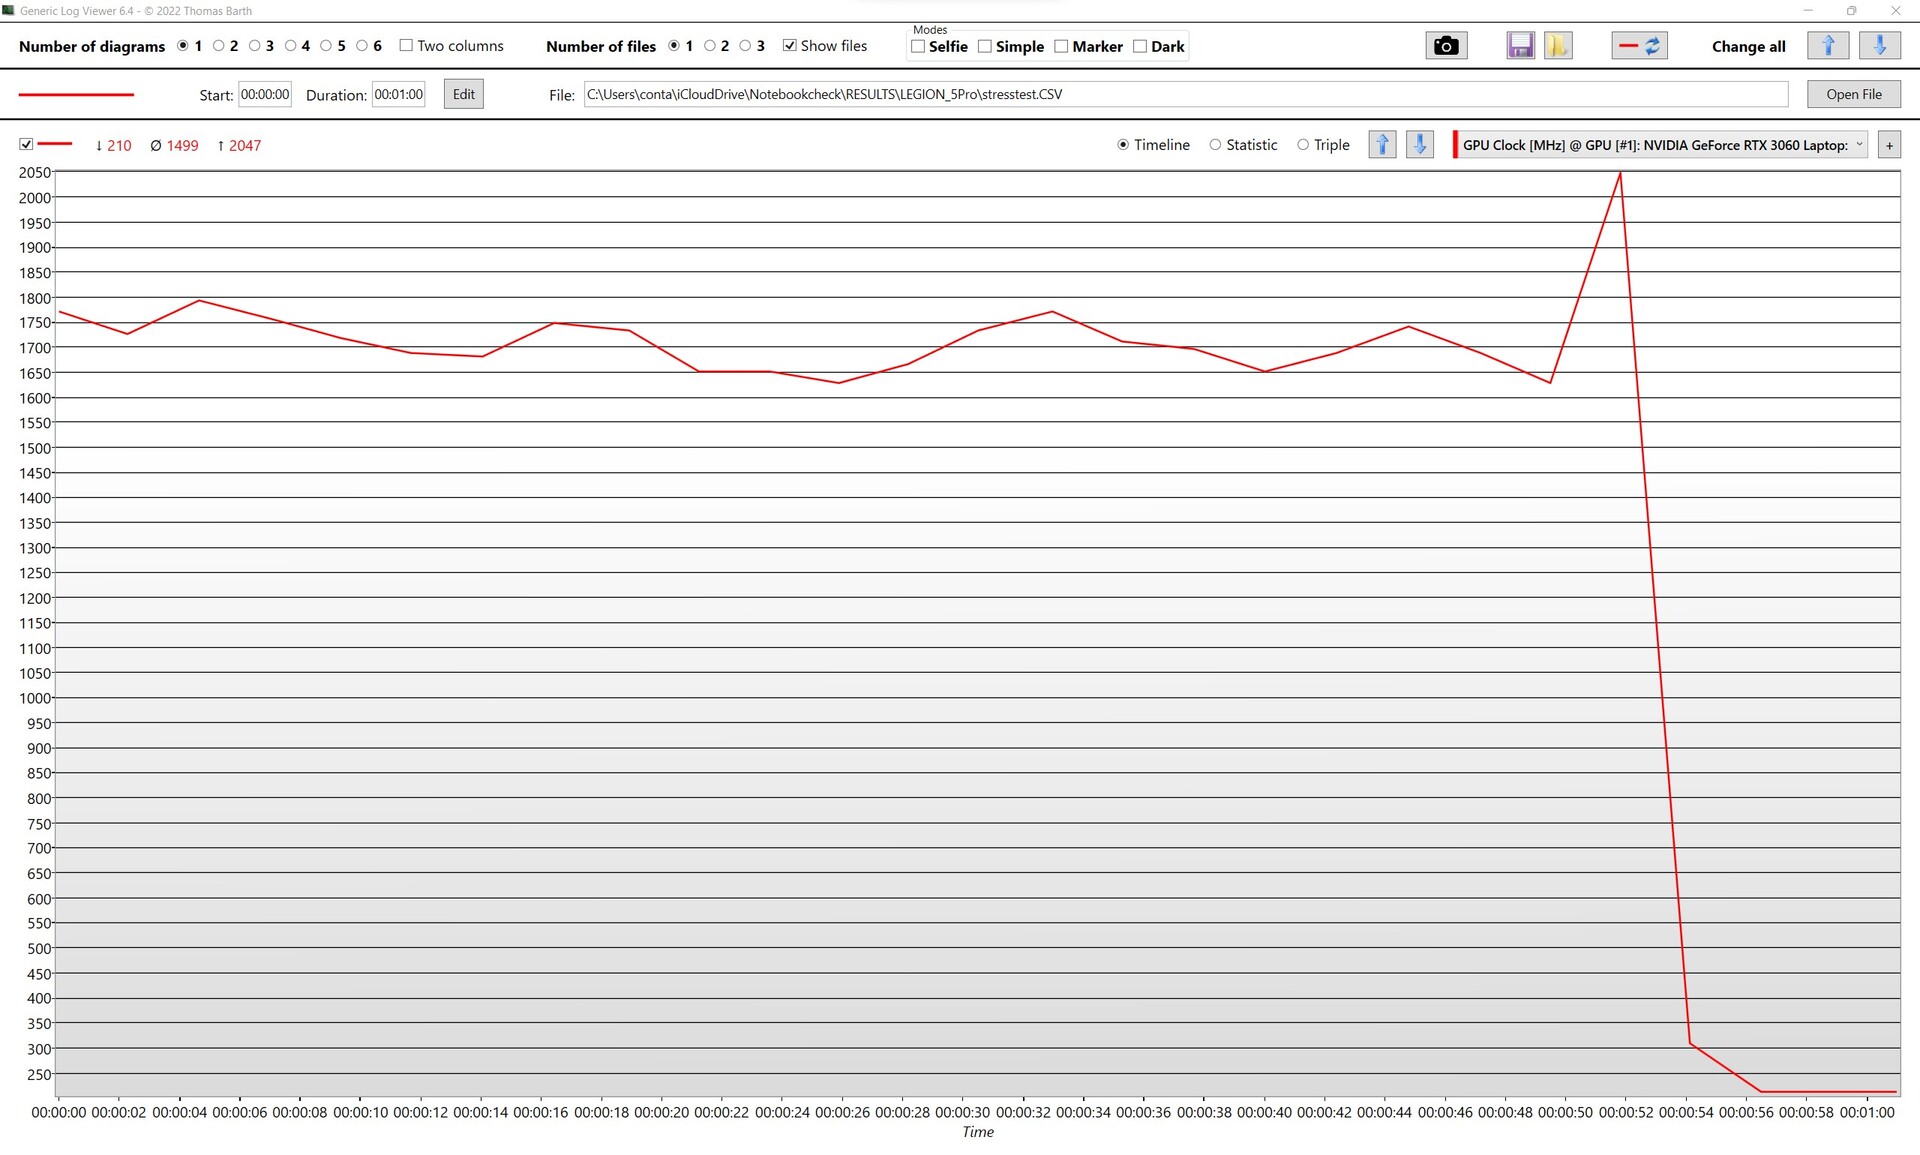
| Reloj dela CPU (GHz) | Reloj de la GPU (MHz) | durchschnittlich. Temperatura de la CPU (°C) | Temperatura de la GPU durchschnittliche (°C) | |
| Sistema en reposo | 3.910 | 210 | 46 | 48 |
| Prime95Stress | 3.352 | 210 | 91 | 61 |
| Prime95+ FurMark Tensión | 2.773 | 1.568 | 93 | 86 |
| Witcher 3 Stress | 3.800 | 1.810 | 79 | 86 |
Prueba de esfuerzo
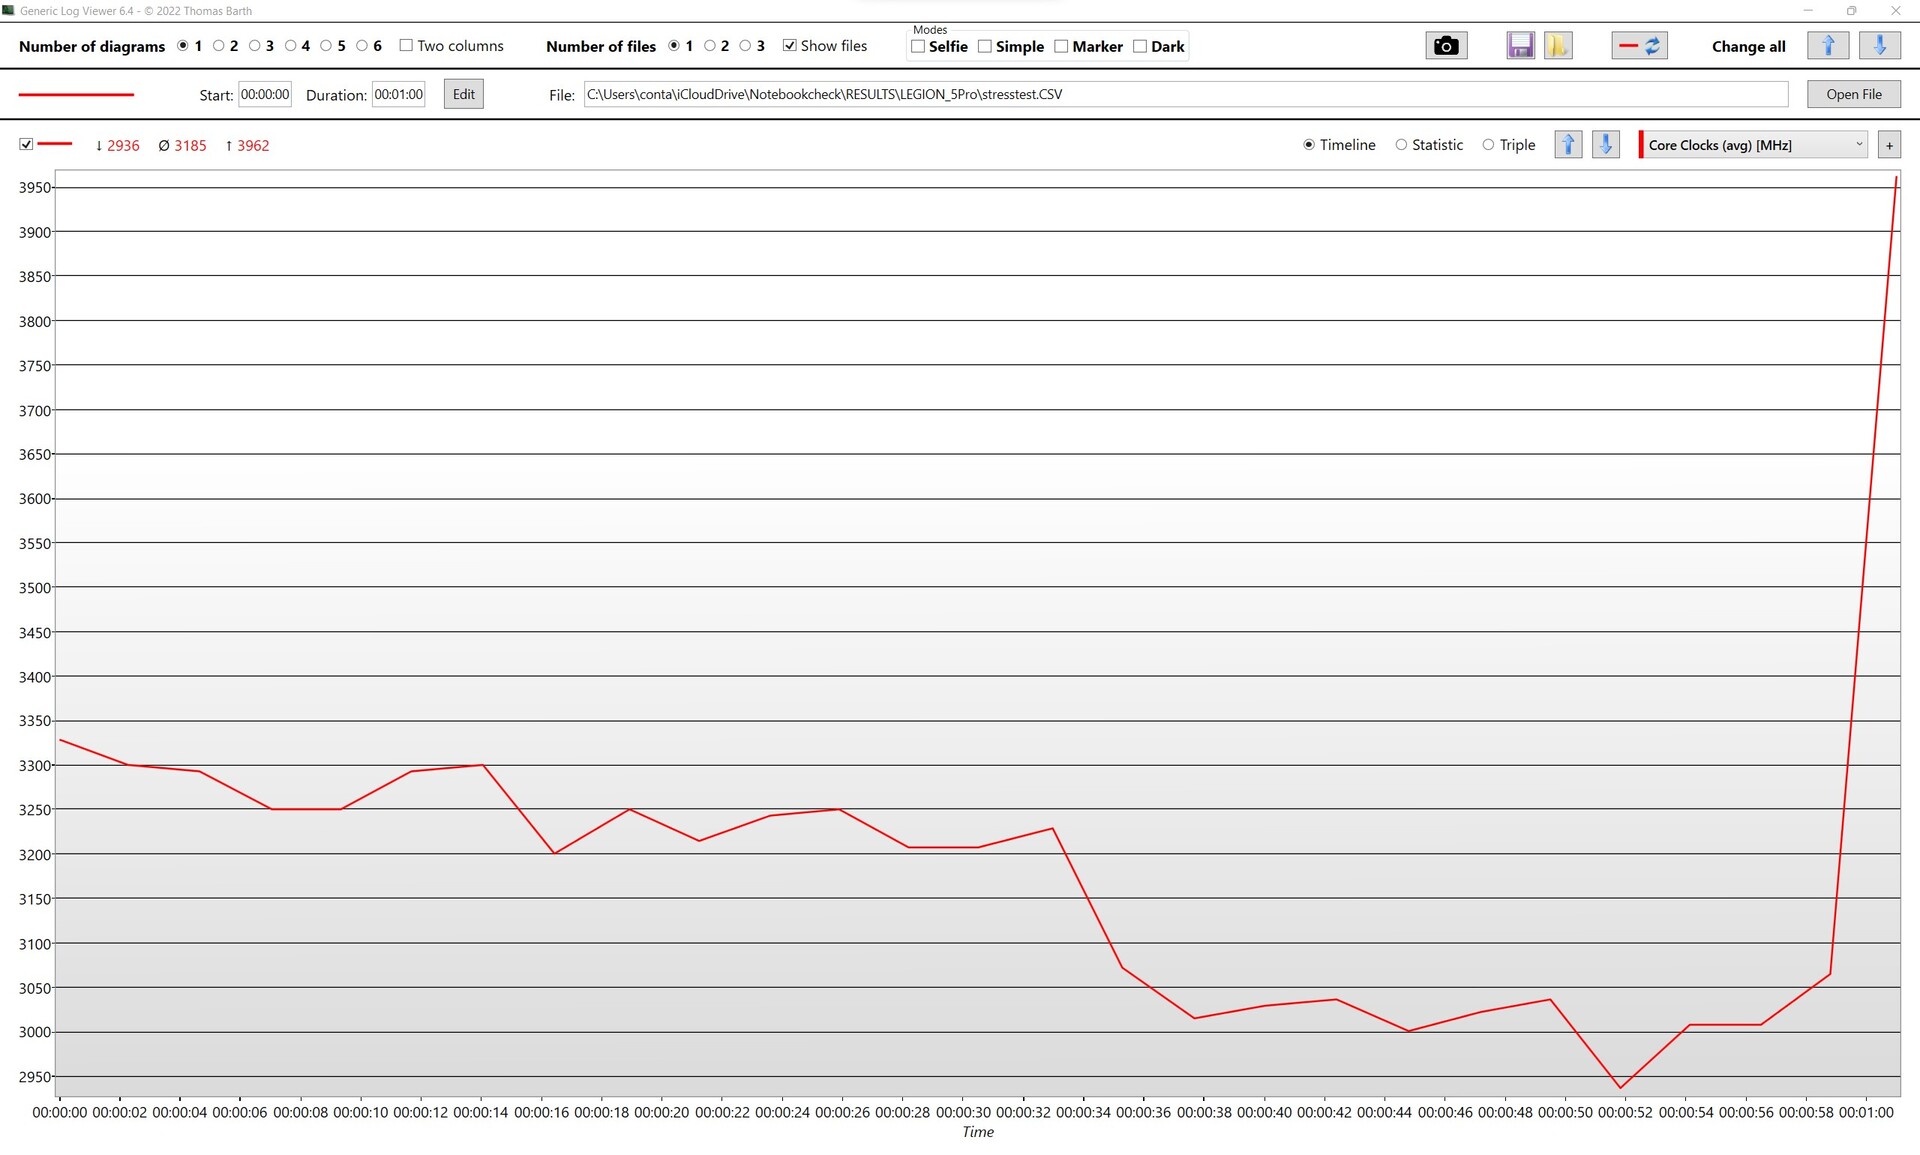
En nuestra prueba de estrés de una hora utilizando Prime 95 y FurMark, queríamos explorar los problemas de calor y/o consumo de energía en casos extremos. Ni siquiera en un escenario artificial que generalmente nunca ocurriría bajo patrones de uso normales, el Legion 5 Pro se dobló. Aunque las temperaturas eran altas, estaban dentro de las especificaciones de Intel y Nvidia y las velocidades de reloj seguían siendo aceptables. Ni el i7 ni la RTX 3060 cayeron por debajo de sus frecuencias de reloj básicas, y las frecuencias de reloj del procesador y la tarjeta gráfica se mantuvieron constantemente altas en los juegos normales.
Altavoces
Los altavoces integrados hacen su trabajo de forma más que adecuada para algún que otro vídeo de YouTube o incluso para una noche de cine. La calidad es realmente sobresaliente, y por desgracia no es la típica de los portátiles. Es algo en lo que nos gustaría ver un poco más de atención por parte de casi todos los fabricantes.
En el Legion 5, las frecuencias medias y los agudos son completamente satisfactorios y ofrecen un sonido claro, mientras que el volumen podría necesitar ser ligeramente más alto para salas grandes o grupos de personas. Por desgracia, echamos en falta casi por completo los bajos, pero eso no es nada raro en los portátiles. En contraste con las otras categorías de productos, este dispositivo de 16 pulgadas sólo ofrece la tarifa estándar. Pero para un portátil de juegos, que el probable jugador usa con auriculares la mayor parte del tiempo, esto es aceptable en nuestra opinión.
Lenovo Legion 5 Pro 16IAH7H análisis de audio
(±) | la sonoridad del altavoz es media pero buena (72.7 dB)
Graves 100 - 315 Hz
(-) | casi sin bajos - de media 21.7% inferior a la mediana
(±) | la linealidad de los graves es media (12.8% delta a frecuencia anterior)
Medios 400 - 2000 Hz
(±) | medias más altas - de media 5% más altas que la mediana
(+) | los medios son lineales (3.4% delta a la frecuencia anterior)
Altos 2 - 16 kHz
(+) | máximos equilibrados - a sólo 1.7% de la mediana
(+) | los máximos son lineales (4.1% delta a la frecuencia anterior)
Total 100 - 16.000 Hz
(±) | la linealidad del sonido global es media (18% de diferencia con la mediana)
En comparación con la misma clase
» 56% de todos los dispositivos probados de esta clase eran mejores, 9% similares, 36% peores
» El mejor tuvo un delta de 6%, la media fue 18%, el peor fue ###max##%
En comparación con todos los dispositivos probados
» 38% de todos los dispositivos probados eran mejores, 8% similares, 54% peores
» El mejor tuvo un delta de 4%, la media fue 23%, el peor fue ###max##%
HP Omen 16-b1090ng análisis de audio
(+) | los altavoces pueden reproducir a un volumen relativamente alto (#83 dB)
Graves 100 - 315 Hz
(-) | casi sin bajos - de media 24.4% inferior a la mediana
(±) | la linealidad de los graves es media (13.8% delta a frecuencia anterior)
Medios 400 - 2000 Hz
(+) | medios equilibrados - a sólo 1.9% de la mediana
(+) | los medios son lineales (2.8% delta a la frecuencia anterior)
Altos 2 - 16 kHz
(+) | máximos equilibrados - a sólo 2.2% de la mediana
(+) | los máximos son lineales (3.8% delta a la frecuencia anterior)
Total 100 - 16.000 Hz
(±) | la linealidad del sonido global es media (15.1% de diferencia con la mediana)
En comparación con la misma clase
» 32% de todos los dispositivos probados de esta clase eran mejores, 6% similares, 61% peores
» El mejor tuvo un delta de 6%, la media fue 18%, el peor fue ###max##%
En comparación con todos los dispositivos probados
» 21% de todos los dispositivos probados eran mejores, 4% similares, 75% peores
» El mejor tuvo un delta de 4%, la media fue 23%, el peor fue ###max##%
Gestión de la energía: los niveles de potencia elevados requieren mucha energía
Consumo de energía
Los elevados objetivos de potencia del hardware instalado se notan en el consumo de energía: Incluso en reposo, el Legion consume a veces más del doble de energía que la competencia. Bajo carga, resulta que la gran fuente de alimentación de 300 W está un poco sobredimensionada, pero ciertamente no está sobreespecificada. El Legion lidera sin duda el campo del consumo de energía con un consumo máximo de 240 W, pero a la vista del rendimiento ofrecido es absolutamente aceptable.
| Off / Standby | |
| Ocioso | |
| Carga |
|
Clave:
min: | |
| Lenovo Legion 5 Pro 16IAH7H i7-12700H, GeForce RTX 3060 Laptop GPU, 2x Samsung PM9A1 MZVL21T0HCLR (RAID 0), IPS, 2560x1600, 16" | HP Omen 16-b1090ng i7-12700H, GeForce RTX 3070 Ti Laptop GPU, WDC PC SN810 1TB, IPS, 2560x1440, 16.1" | HP Omen 16-c0077ng R7 5800H, Radeon RX 6600M, Samsung PM981a MZVLB1T0HBLR, IPS, 2560x1440, 16.1" | Gigabyte Aero 16 YE5 i9-12900HK, GeForce RTX 3080 Ti Laptop GPU, Phison ESR01TBMFCT, AMOLED, 3840x2400, 16" | Alienware x14 i7 RTX 3060 i7-12700H, GeForce RTX 3060 Laptop GPU, WDC PC SN810 1TB, IPS, 1920x1080, 14" | Apple MacBook Pro 16 2021 M1 Pro M1 Pro, M1 Pro 16-Core GPU, Apple SSD AP1024R, Mini-LED, 3456x2234, 16.2" | Medio NVIDIA GeForce RTX 3060 Laptop GPU | Media de la clase Gaming | |
|---|---|---|---|---|---|---|---|---|
| Power Consumption | 42% | 29% | 5% | 54% | 63% | 41% | 29% | |
| Idle Minimum * (Watt) | 22.8 | 4 82% | 12 47% | 26 -14% | 7.9 65% | 5 78% | 10.4 ? 54% | 13.1 ? 43% |
| Idle Average * (Watt) | 26.5 | 10 62% | 12.8 52% | 30 -13% | 11.1 58% | 15.1 43% | 14.5 ? 45% | 19 ? 28% |
| Idle Maximum * (Watt) | 41 | 19 54% | 18.5 55% | 37 10% | 11.8 71% | 15.5 62% | 21.4 ? 48% | 24.6 ? 40% |
| Load Average * (Watt) | 191 | 114 40% | 190 1% | 127 34% | 107.4 44% | 54 72% | 109.3 ? 43% | 111.3 ? 42% |
| Witcher 3 ultra * (Watt) | 194.7 | 183.2 6% | 194 -0% | 176 10% | 111 43% | |||
| Load Maximum * (Watt) | 238 | 221 7% | 200 16% | 236 1% | 140.4 41% | 90 62% | 206 ? 13% | 260 ? -9% |
* ... más pequeño es mejor
Witcher 3 power consumption / Stress test
Power consumption external monitor
Duración de la batería
Nuestra prueba muestra la cara oculta de la alta demanda de energía sin necesidad de estar conectado a una toma de corriente. Aquí, la competencia deja al Legion por los suelos. Lenovo no ganó un premio de resistencia por las 3,5 horas que logró en nuestra prueba de navegación web con un brillo de pantalla fijo de 150 nits. los 30 minutos de funcionamiento bajo carga tampoco son competitivos. Aproximadamente 2 horas de juego le dan al Legion algunos puntos de consuelo. Pero aquí también creemos que los resultados deben considerarse en el contexto de un probable uso diario. Probablemente no se compra un portátil de juegos tan potente para escribir correos electrónicos todo el día en una cafetería o para organizar una maratón de series mientras se acampa.
| Lenovo Legion 5 Pro 16IAH7H i7-12700H, GeForce RTX 3060 Laptop GPU, 80 Wh | HP Omen 16-b1090ng i7-12700H, GeForce RTX 3070 Ti Laptop GPU, 83 Wh | HP Omen 16-c0077ng R7 5800H, Radeon RX 6600M, 70 Wh | Gigabyte Aero 16 YE5 i9-12900HK, GeForce RTX 3080 Ti Laptop GPU, 99 Wh | Alienware x14 i7 RTX 3060 i7-12700H, GeForce RTX 3060 Laptop GPU, 80 Wh | Media de la clase Gaming | |
|---|---|---|---|---|---|---|
| Duración de Batería | 137% | 36% | 109% | 62% | 116% | |
| H.264 (h) | 4.1 | 7 71% | 7.5 83% | 9.4 129% | 8.27 ? 102% | |
| WiFi v1.3 (h) | 3.6 | 5.6 56% | 6.1 69% | 6.4 78% | 8.9 147% | 7.08 ? 97% |
| Witcher 3 ultra (h) | 2.1 | 1.4 -33% | 0.8 -62% | |||
| Load (h) | 0.6 | 1.9 217% | 1.6 167% | 0.8 33% | 1.496 ? 149% | |
| Reader / Idle (h) | 10.1 | 8.9 | 7.84 ? |
Pro
Contra
Veredicto - Un paquete bien equilibrado que muestra lo que una CPU y una GPU pueden lograr realmente
Lenovo vuelve a hacer muchas cosas bien este año después de haber presentado el Legion 5 Pro, que fue uno de los portátiles para juegos más populares del mercado el año pasado. La carcasa está claramente orientada al mercado de los juegos, pero los llamativos logotipos se han desmarcado con buen gusto, facilitando así el paso de este dispositivo de 16 pulgadas como caballo de batalla del rendimiento.
Tanto los jugadores como los editores y videógrafos de imágenes estarán encantados con la enorme variedad de opciones de conectividad. Es refrescante ver que Lenovo se resiste a la tendencia de renunciar a puertos y ranuras esenciales en favor de carcasas más delgadas. La pantalla de 16 pulgadas 16:10 QHD tampoco ofrece muchos motivos de crítica. Para los juegos, es irreprochable y está más que encendida por la RTX 3060. Aunque nos hubiera gustado más cobertura AdobeRGB para la edición de imágenes o los fotógrafos profesionales, los editores de vídeo también sacarán partido a su dinero aquí. El software X-Rite incluido está disponible con perfiles sRGB y Rec.709 llave en mano, lo que supone una gran ventaja.
La característica más destacada del Legion 5 Pro es su rendimiento. Los componentes instalados se despliegan con delicadeza y ofrecen un escaparate de lo que son capaces. Esto se aplica tanto al excepcionalmente potente i7-12700H como a la RTX 3060 de gama alta. Es difícil imaginar que uno pueda necesitar más y, como tal, está preparado para el futuro durante unos cuantos años todavía.
Nos costó bastante esfuerzo encontrar algún defecto sustancial, e incluso cuando lo hicimos, son insignificantes en el contexto de un portátil de juegos (a saber, la duración de la batería); o contribuyen a otros puntos fuertes de alguna manera. El Legion 5 Pro puede ser ligeramente más grande, pesado y voluminoso que sus competidores, pero eso es lo que allana el camino para un sistema de refrigeración eficaz y un montón de conectividad. Si lo que buscas es algo más ligero, quizá quieras echar un vistazo al HP Omen 16 (análisis en YouTube). Su rendimiento de la CPU está lejos del de Legion, pero con una RTX 3070 Ti obtienes un rendimiento de la GPU significativamente mejor y una carcasa más delgada. Si tu día a día tiene más que ver con el trabajo real, quizá quieras echar un vistazo al Gigabyte Aero 16. Aunque el precio más alto del i9 apenas merece la pena (en nuestra prueba Cinebench R23 es incluso superado por el i7 en el Legion 5 Pro), la RTX 3080 Ti y el gran panel OLED son aptos para la edición de vídeo y fotos.
Precio y disponibilidad
Con un precio que ronda los 1.800 euros (1.825 dólares) para la unidad SSD de 1 TB, el Lenovo Legion 5 Pro es un todoterreno casi perfecto para cualquier aplicación y puede rechazar con toda seguridad el recargo de la 3070 Ti de la competencia con su RTX 3060.
Lenovo Legion 5 Pro 16IAH7H
- 07/25/2022 v7 (old)
Alexander Wätzel
Price comparison

