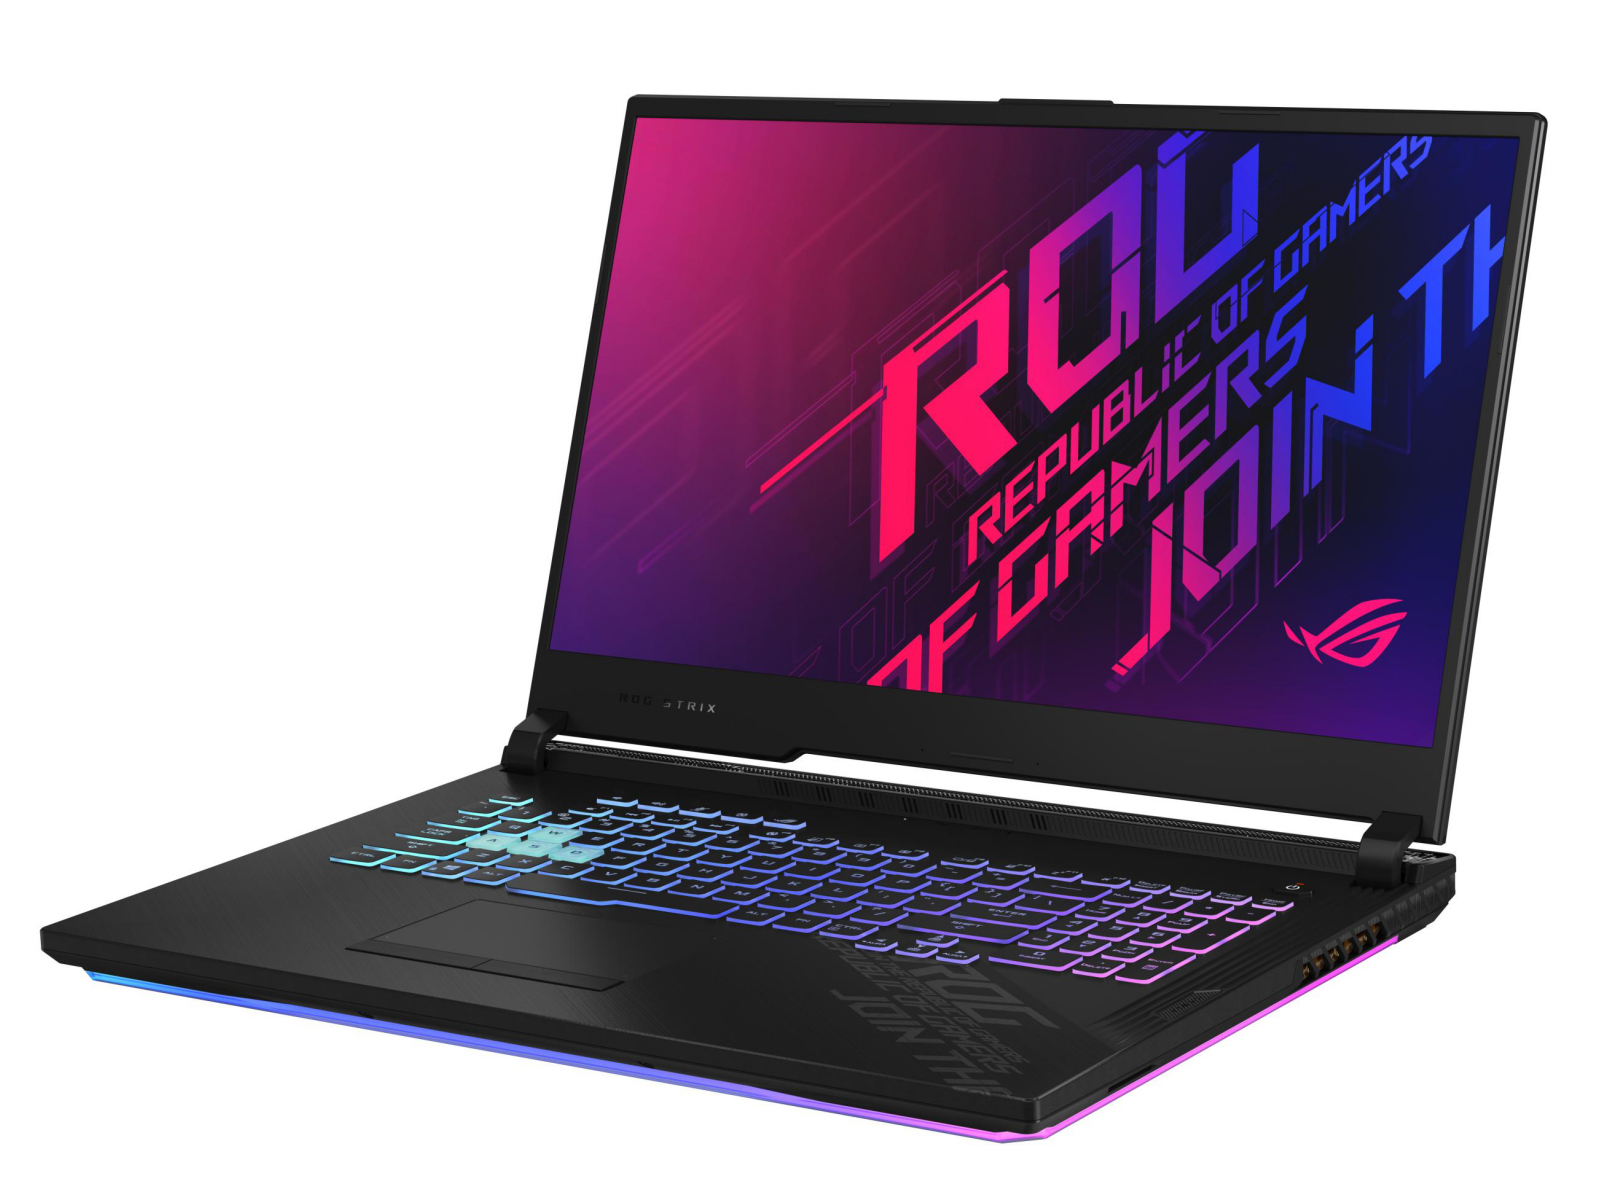
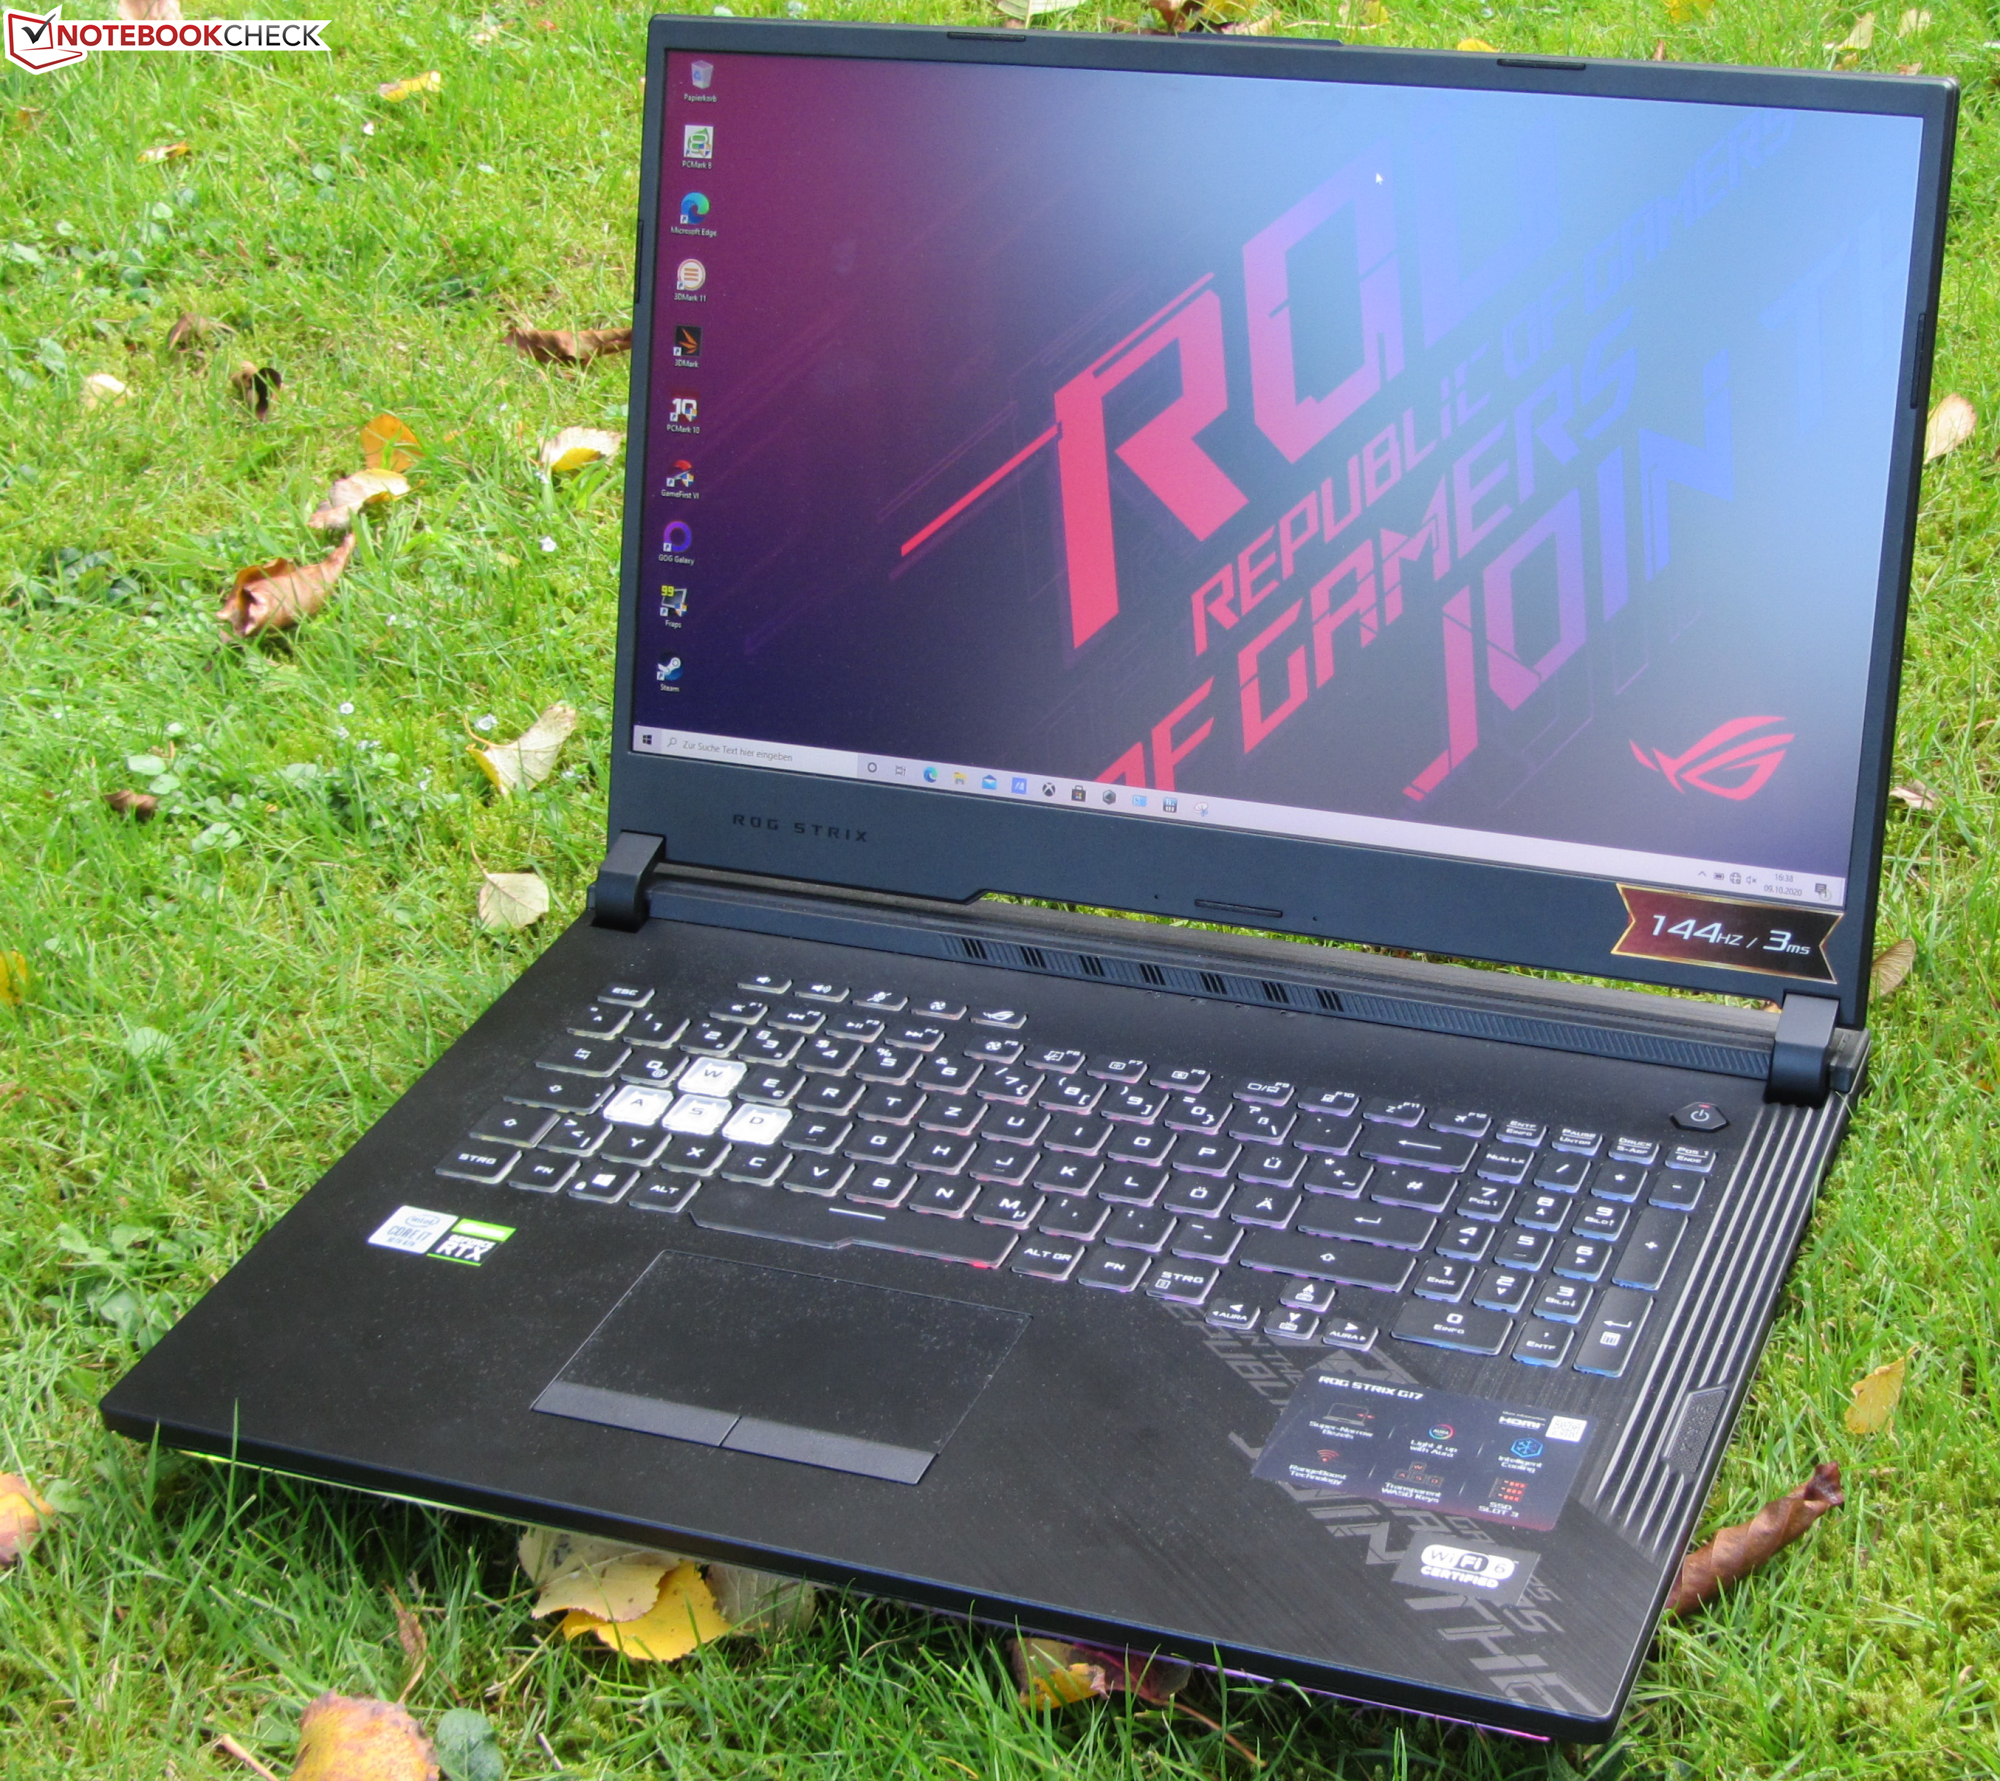
Asus ROG Strix G17 G712LWS en review: Potente máquina de juego con espectáculo de luces integrado

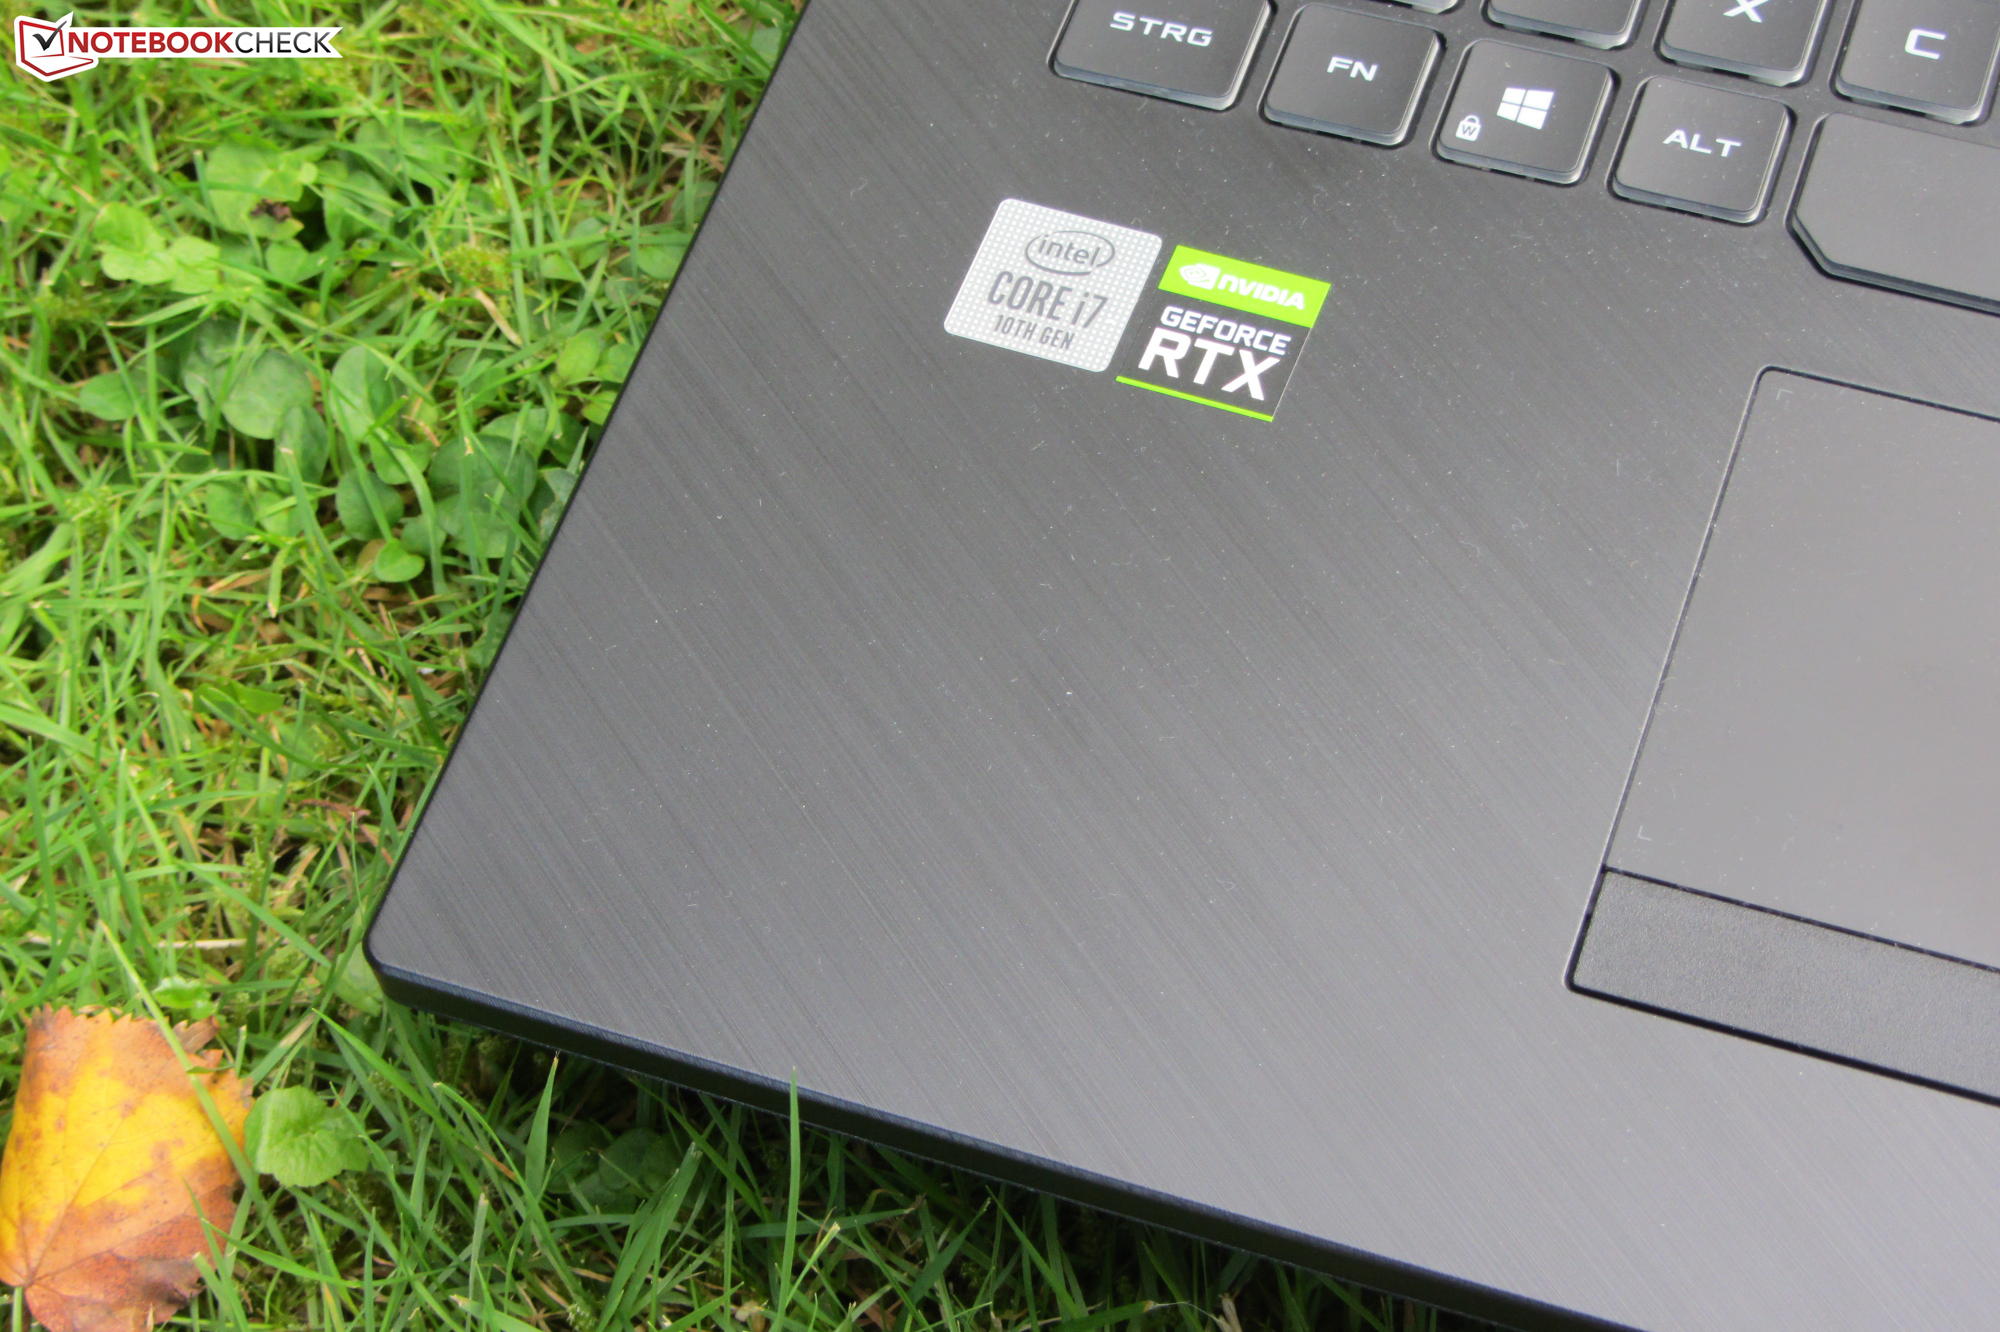
El Asus ROG Strix G17 G712LWS es un portátil para juegos de alta gama de 17,3 pulgadas. El dispositivo está alimentado por un procesador Core i7-10750H y un núcleo gráfico GeForce RTX 2070 Super. Este es el modelo hermano de idéntica construcción del Asus ROG Strix G GL731GU, que ya hemos probado. Los competidores incluyen dispositivos como el Schenker XMG Pro 17, el MSI GL75 10SFR, el Lenovo Legion Y740-17IRHg, y el Acer Predator Helios 300 PH317-54.
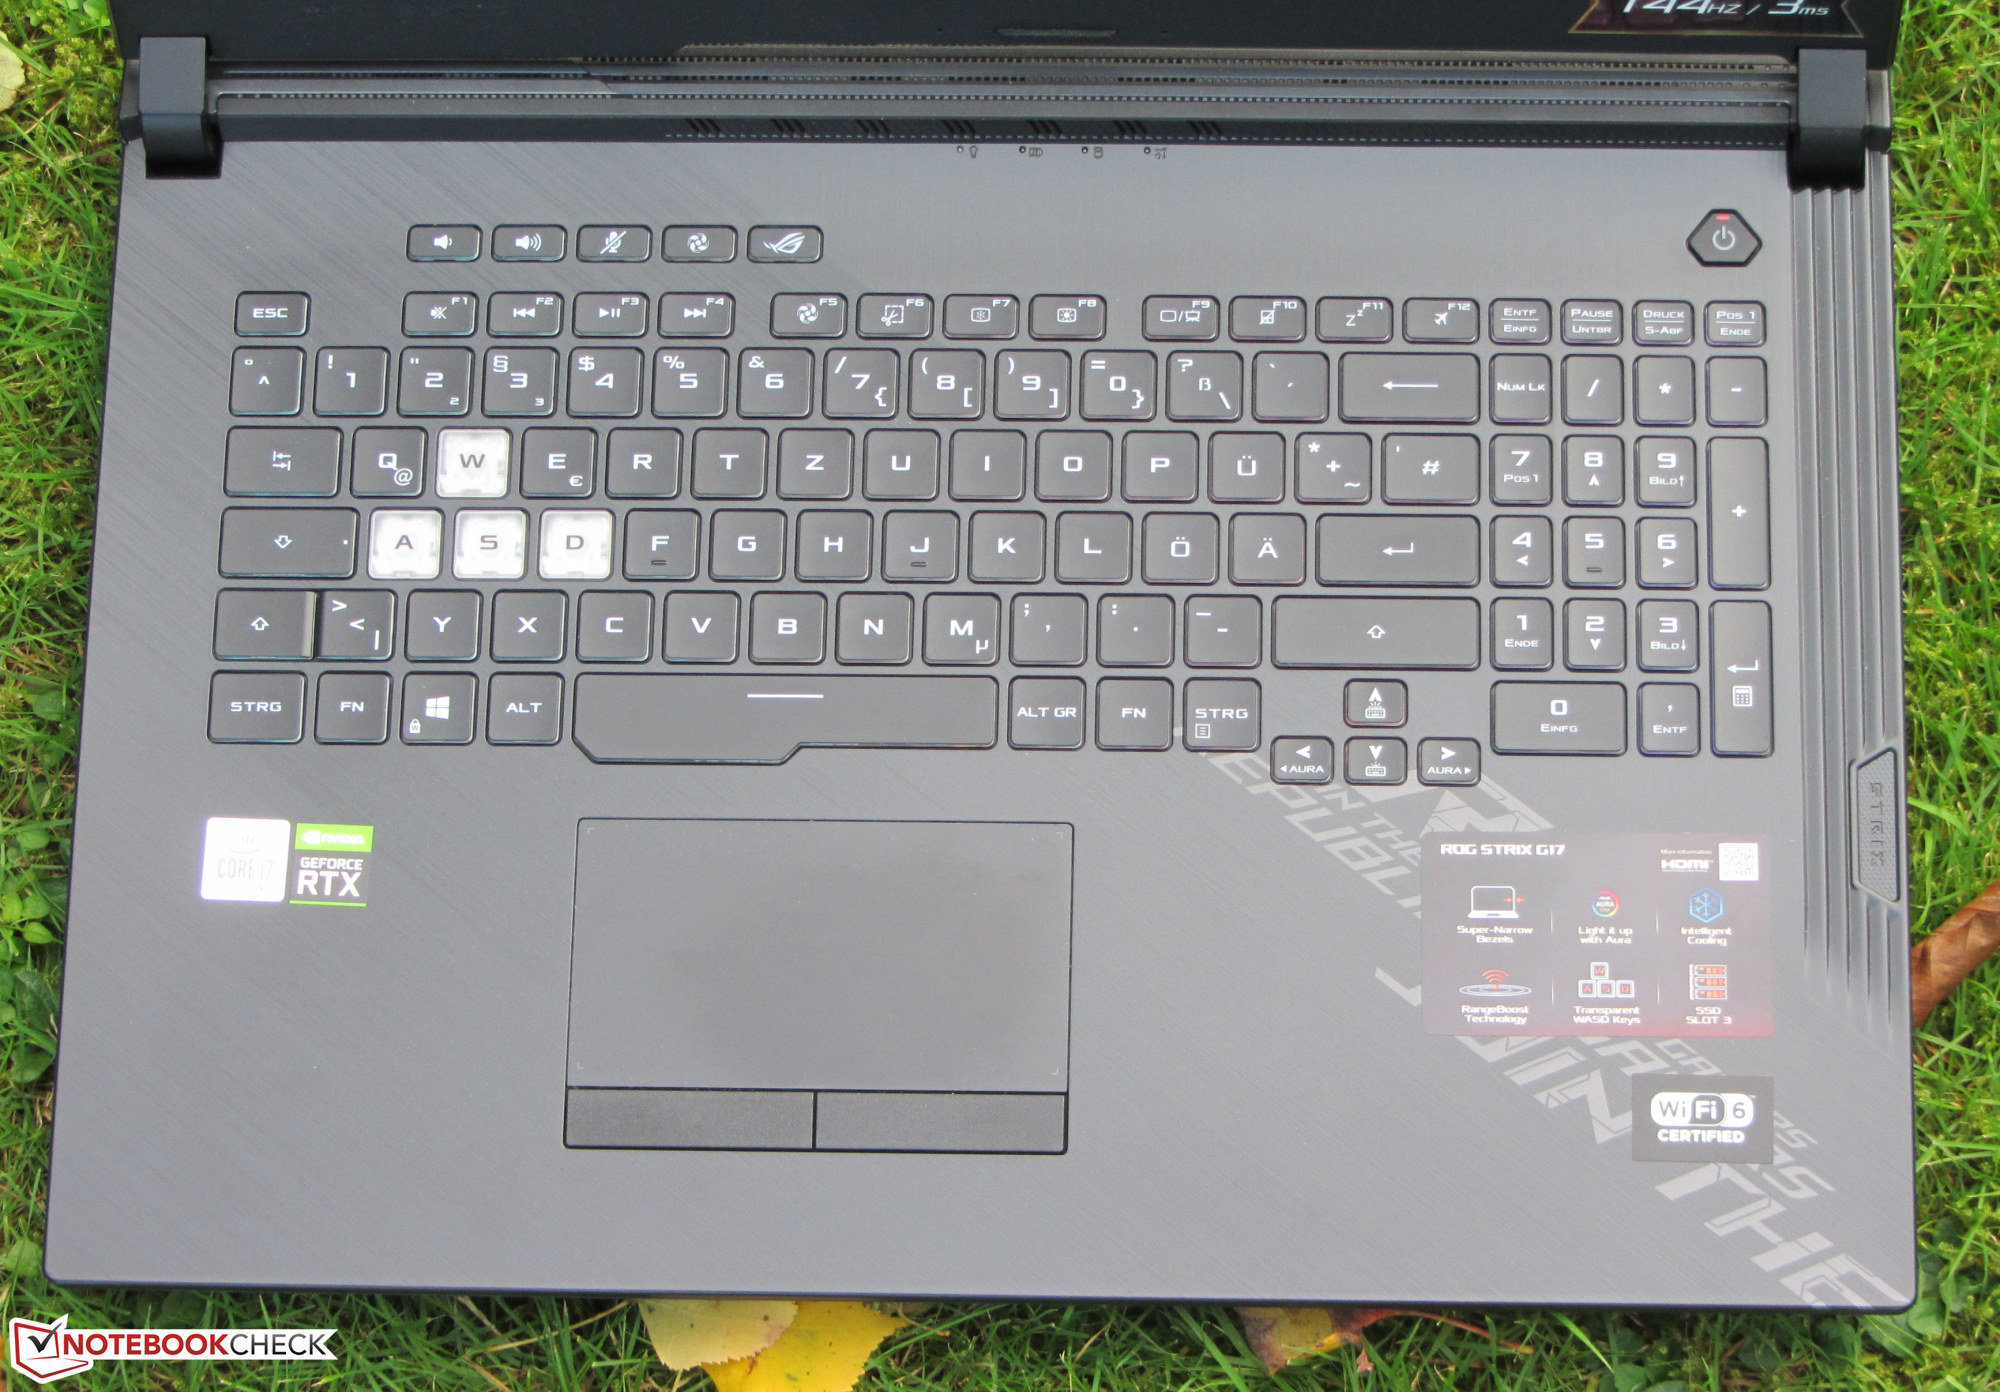
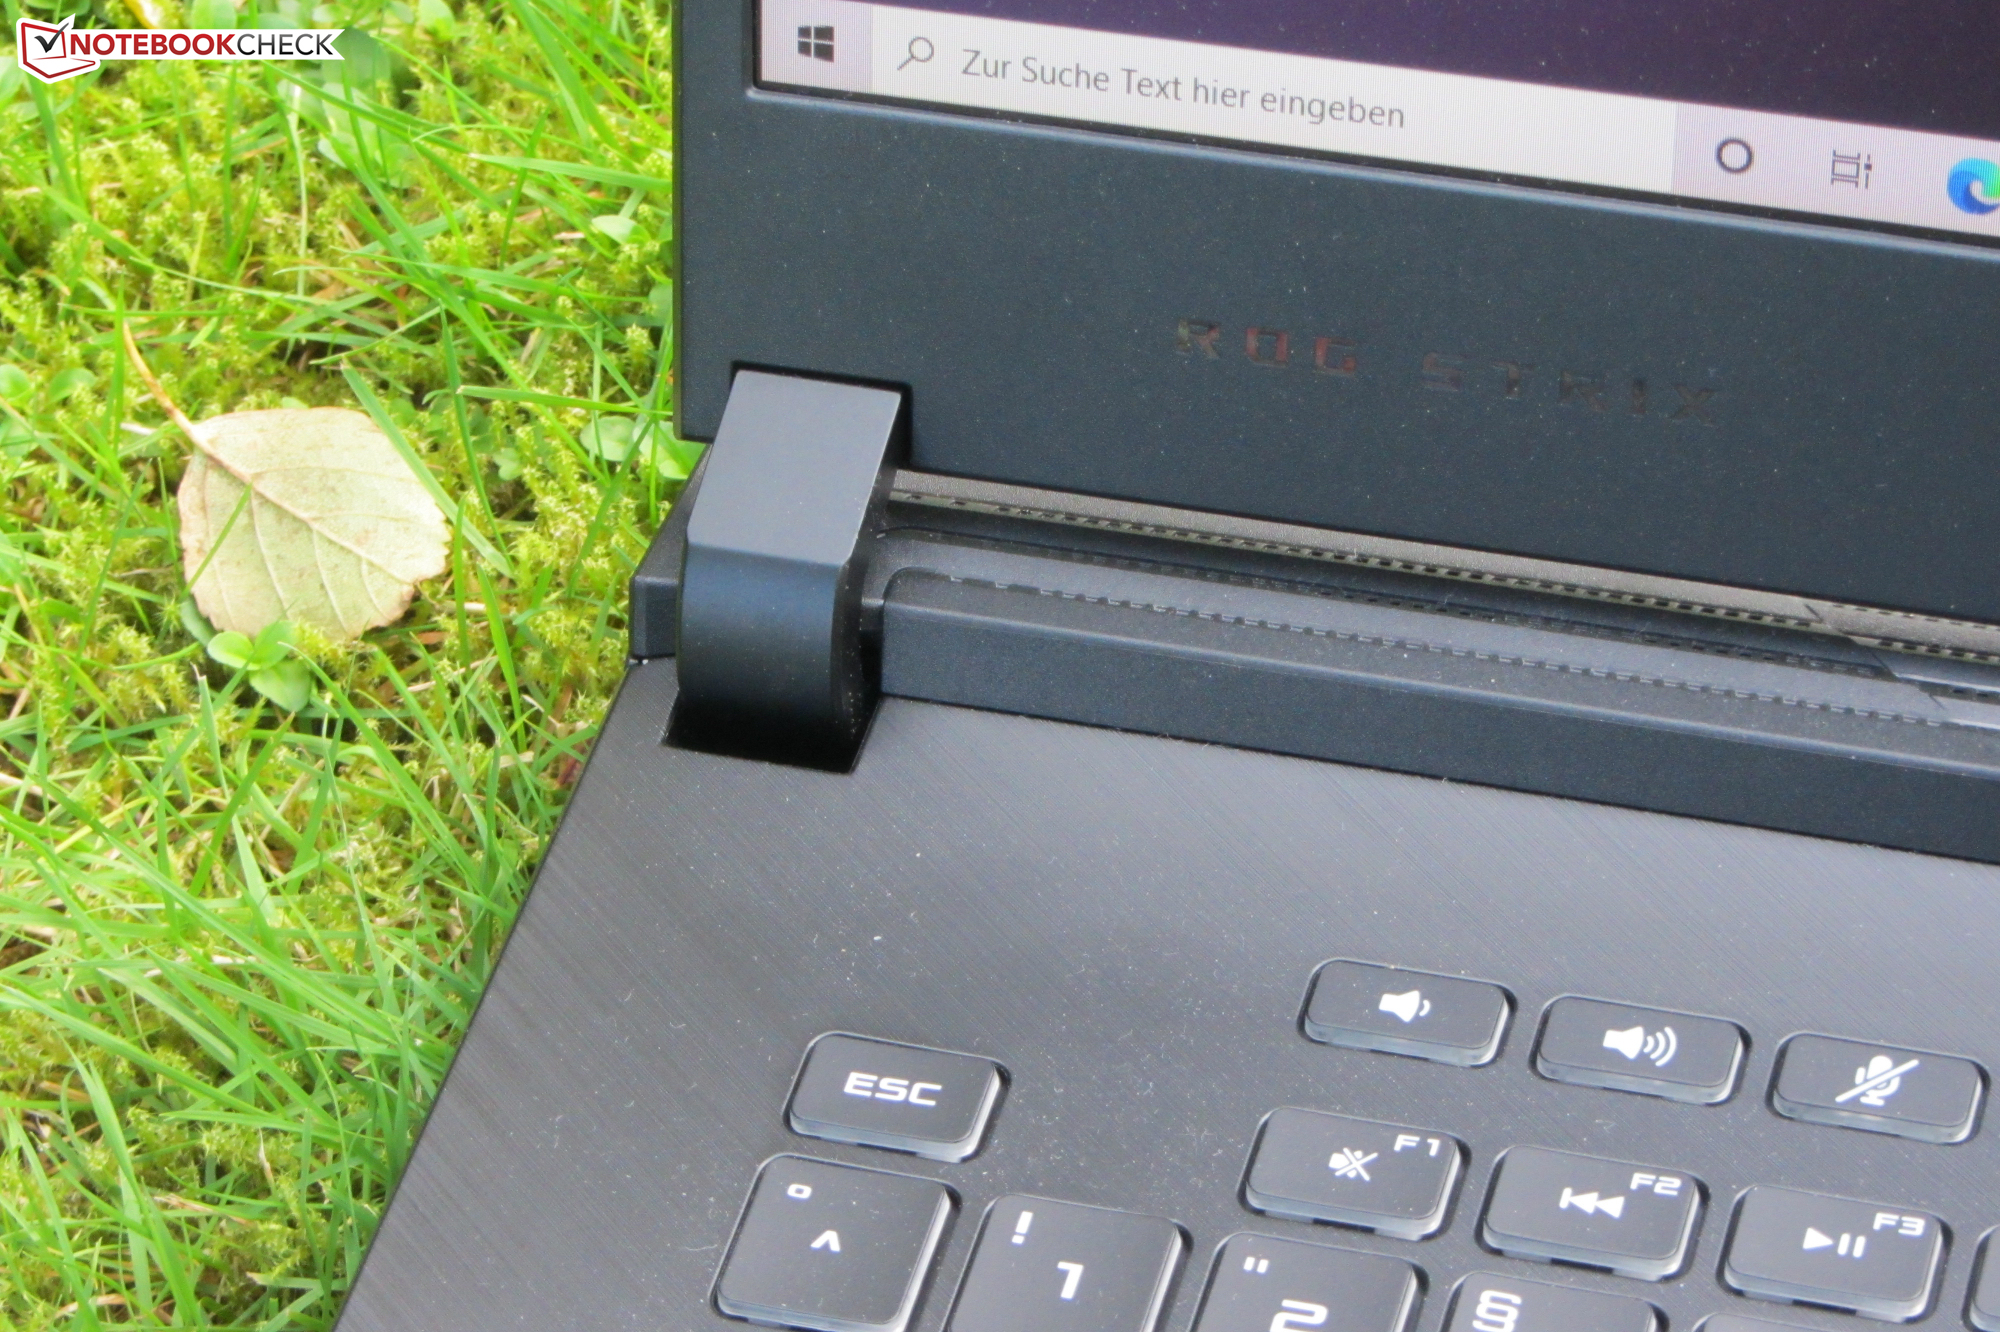
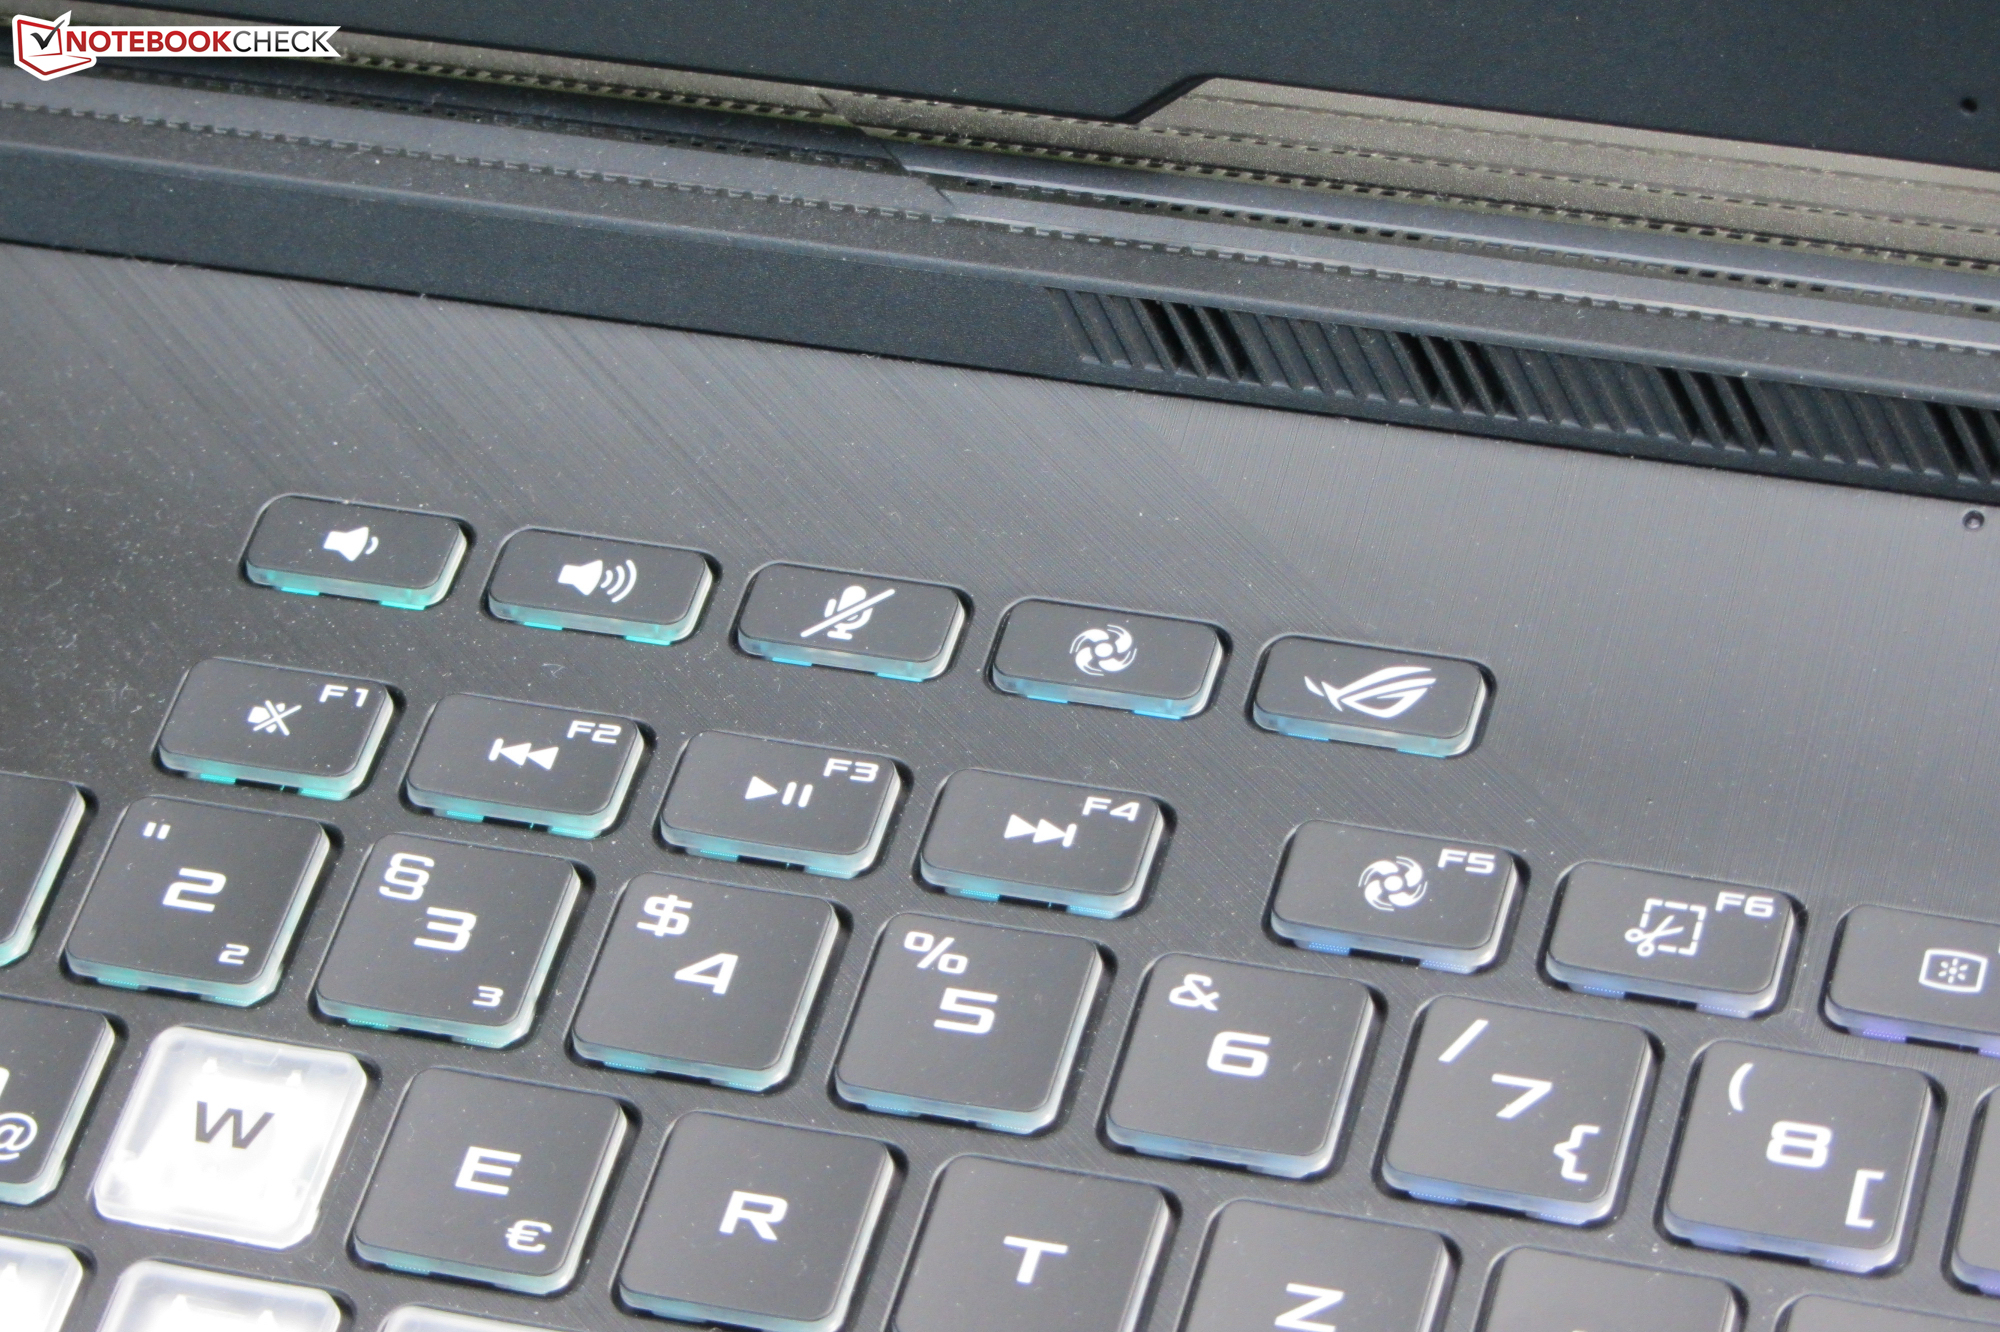
Como el G712LWS y el GL731GU son idénticos en su construcción, no entraremos en más detalles sobre la carcasa, la conectividad, los dispositivos de entrada y los altavoces. La información correspondiente se puede encontrar en la review del Asus ROG Strix G GL731GU.
Valoración | Fecha | Modelo | Peso | Altura | Tamaño | Resolución | Precio |
|---|---|---|---|---|---|---|---|
| 83.1 % v7 (old) | 10/2020 | Asus Strix G17 G712LWS i7-10750H, GeForce RTX 2070 Super Mobile | 2.8 kg | 26.5 mm | 17.30" | 1920x1080 | |
| 83.2 % v7 (old) | 02/2020 | Schenker XMG Pro 17 PB71RD-G i7-9750H, GeForce RTX 2060 Mobile | 2.8 kg | 30 mm | 17.30" | 1920x1080 | |
| 83.5 % v7 (old) | 08/2020 | MSI GL75 10SFR i7-10750H, GeForce RTX 2070 Mobile | 2.6 kg | 28 mm | 17.30" | 1920x1080 | |
| 84 % v7 (old) | 03/2020 | Lenovo Legion Y740-17IRHg-81UJ001VGE i7-9750H, GeForce RTX 2080 Max-Q | 3 kg | 25.5 mm | 17.30" | 1920x1080 | |
| 83.6 % v7 (old) | 10/2020 | Acer Predator Helios 300 PH317-54-75G8 i7-10750H, GeForce RTX 2060 Mobile | 2.8 kg | 25 mm | 17.30" | 1920x1080 |

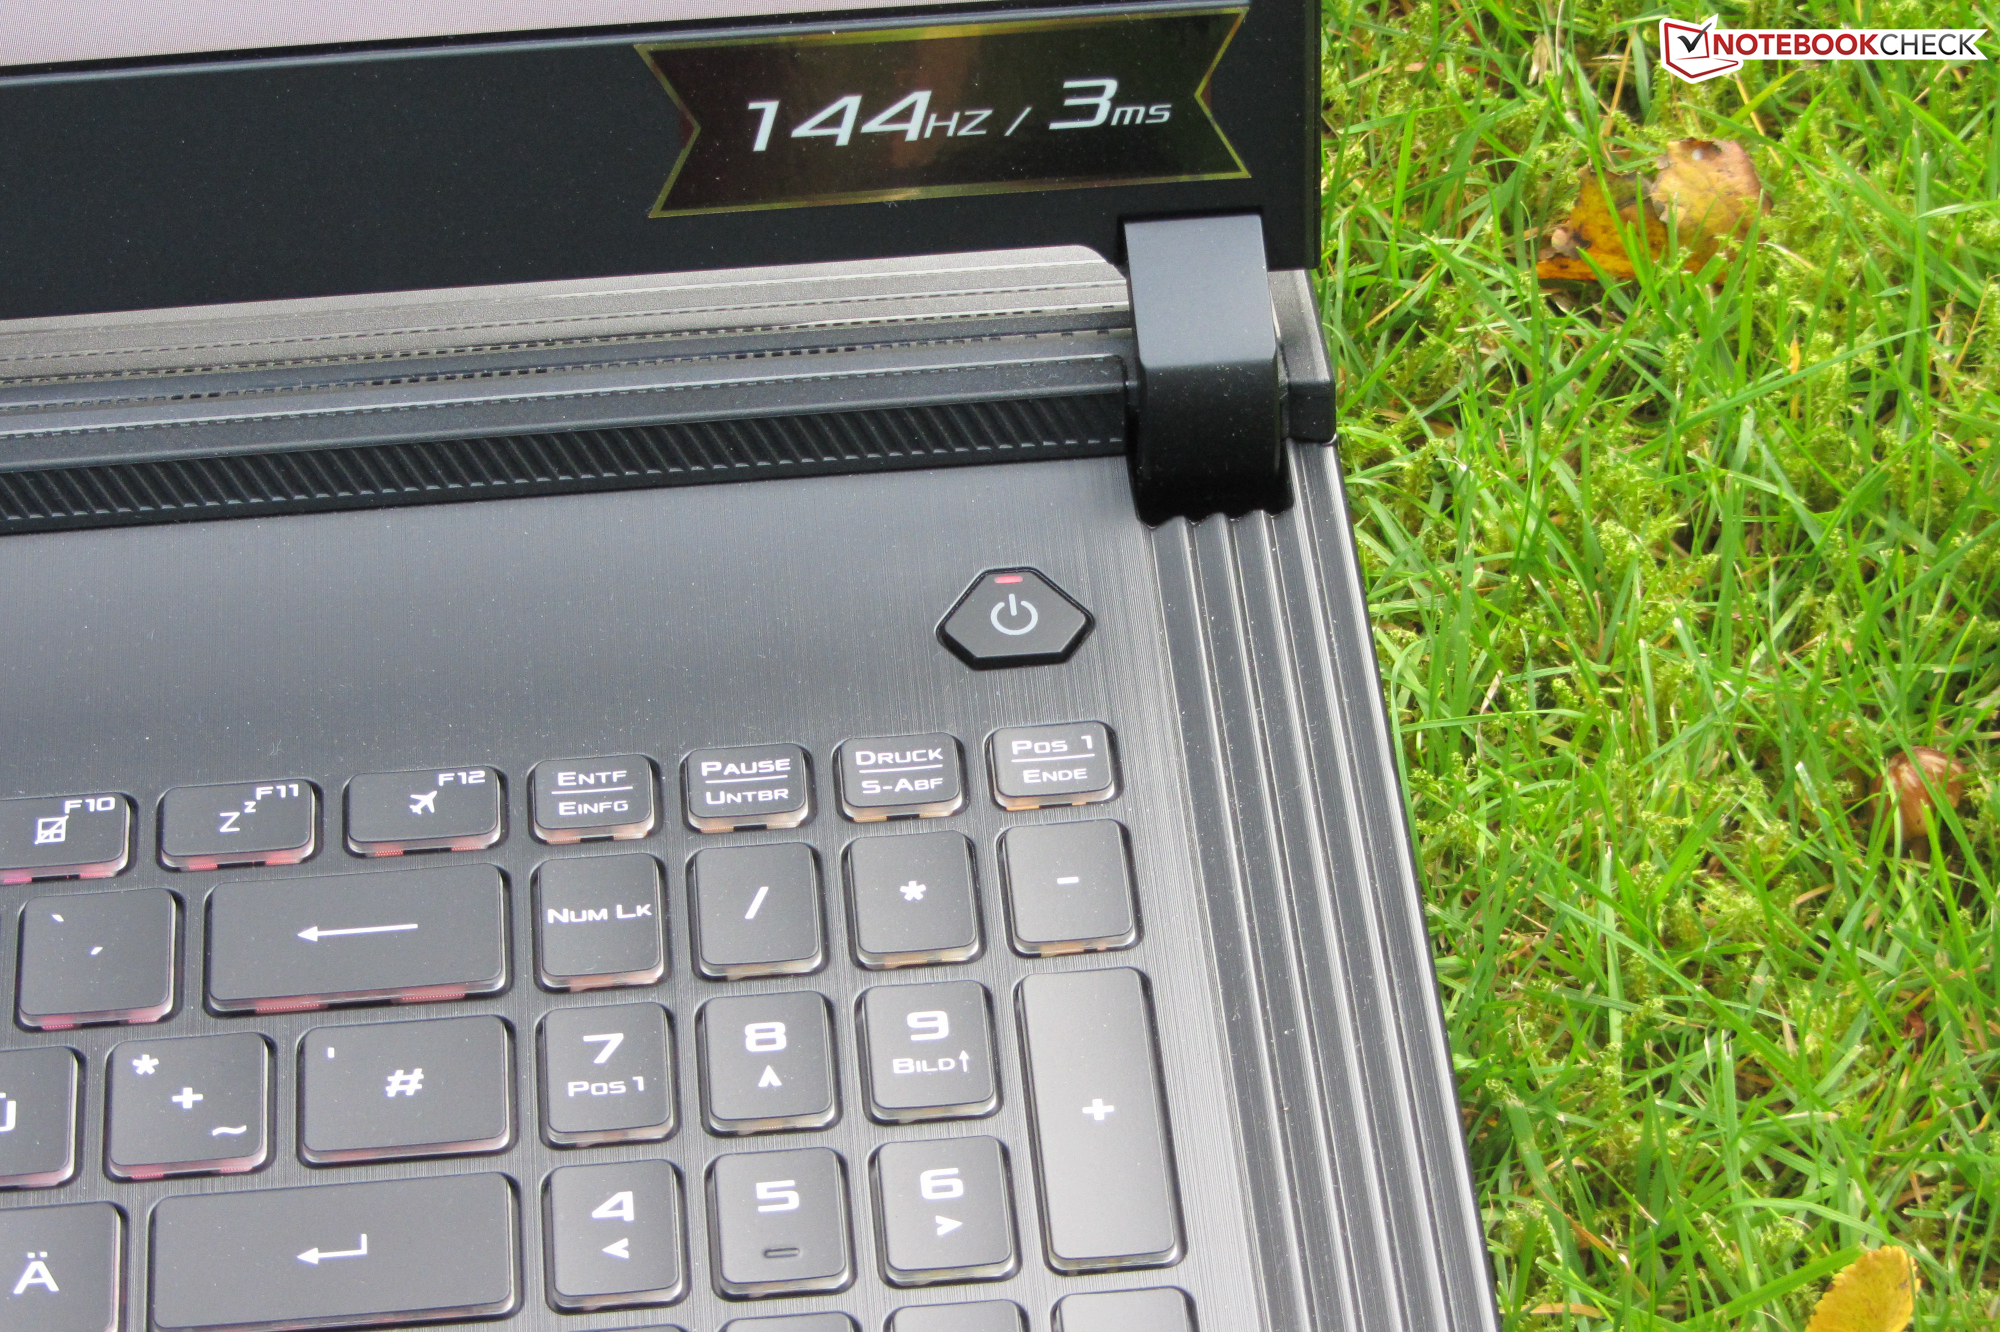
Display - 144 Hz IPS
La pantalla mate de 17,3 pulgadas tiene una resolución nativa de 1920x1080 píxeles. El brillo (300 cd/m²) y el contraste (1.042:1) están bien. Además, el panel de 144 Hz proporciona tiempos de respuesta rápidos. Positivo: La pantalla no muestra ningún parpadeo PWM.
| |||||||||||||||||||||||||
iluminación: 89 %
Brillo con batería: 323 cd/m²
Contraste: 1042:1 (Negro: 0.31 cd/m²)
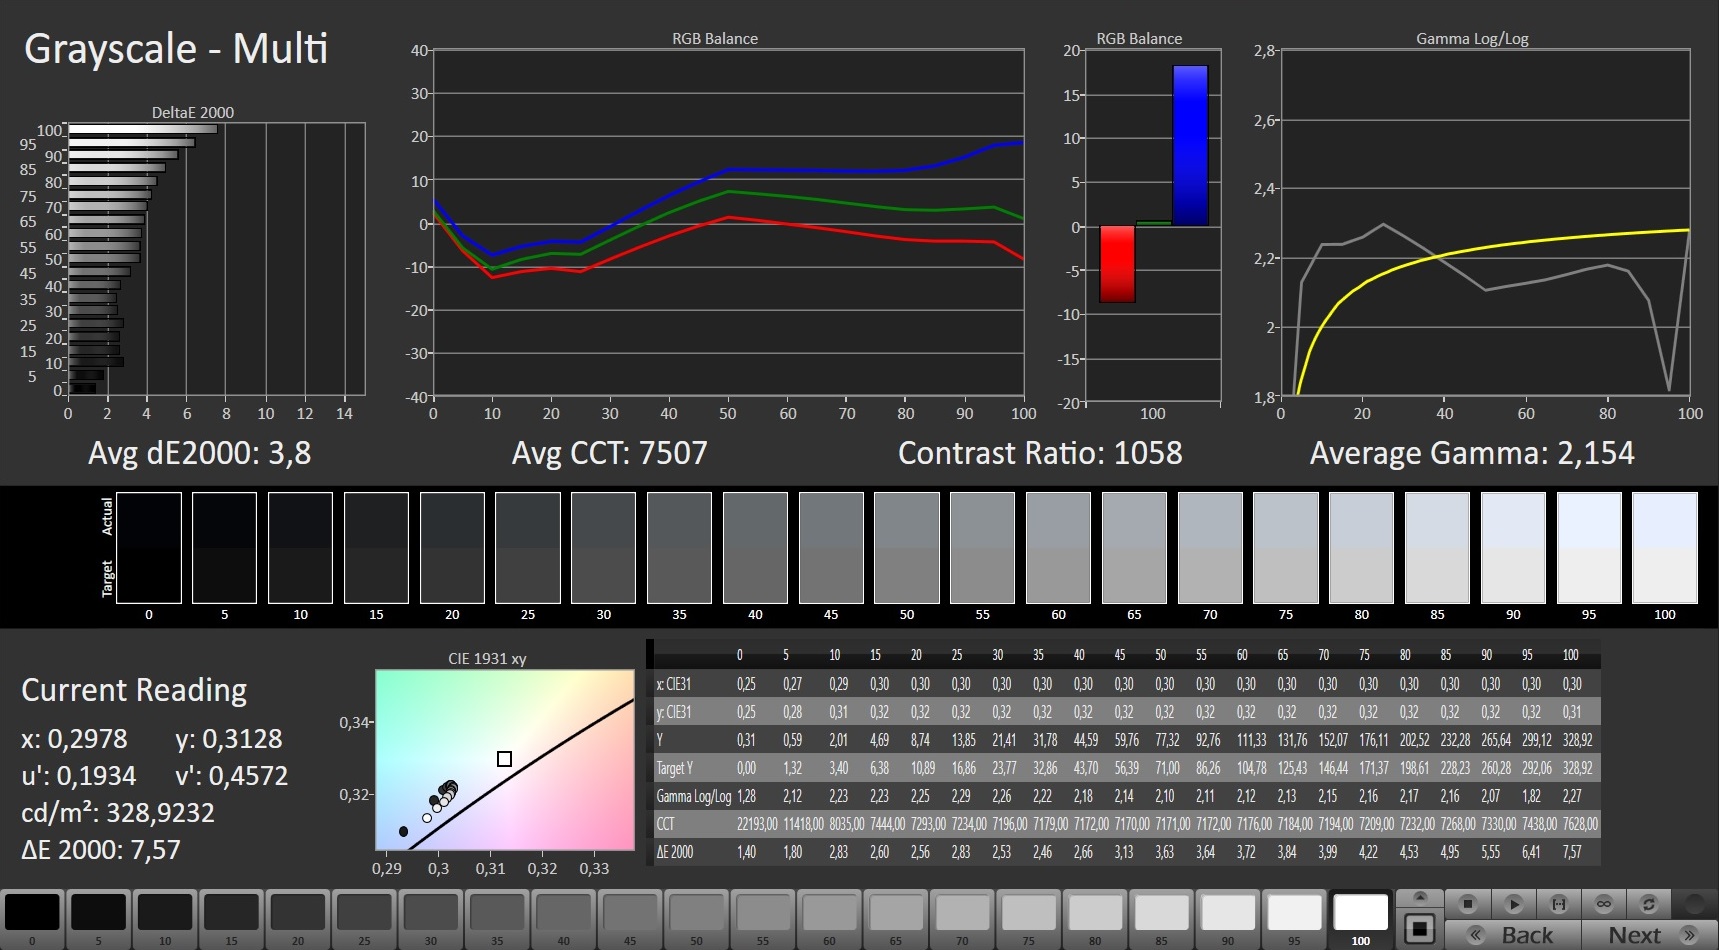
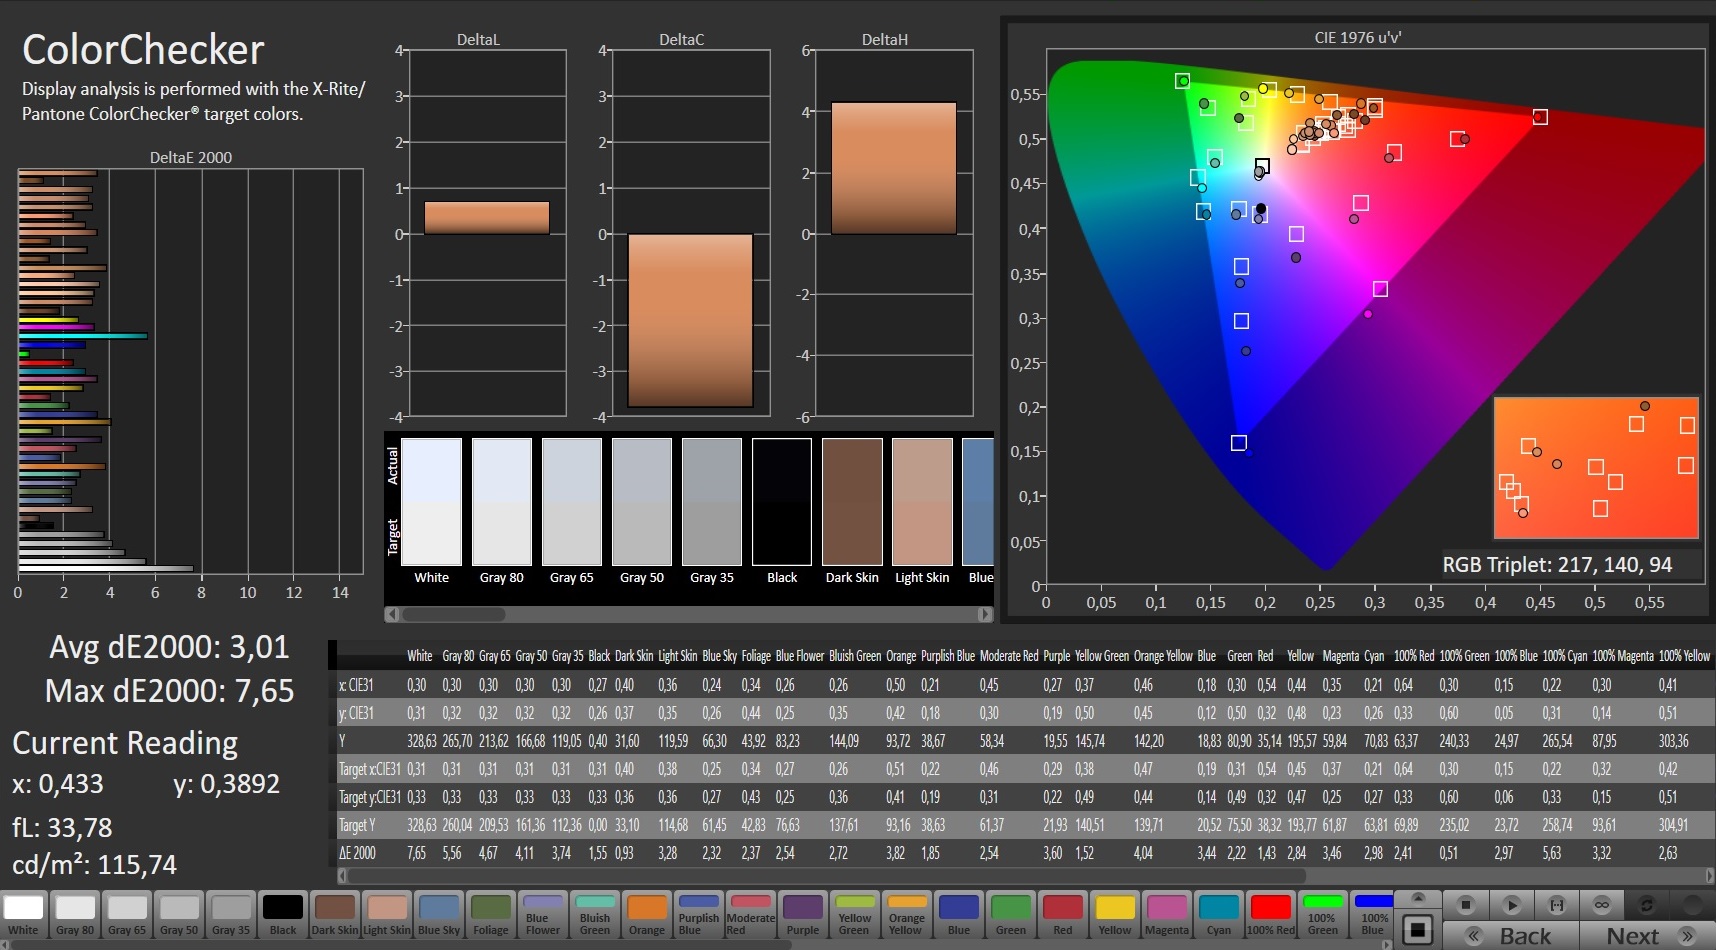
ΔE ColorChecker Calman: 3.01 | ∀{0.5-29.43 Ø4.72}
calibrated: 1
ΔE Greyscale Calman: 3.8 | ∀{0.09-98 Ø4.97}
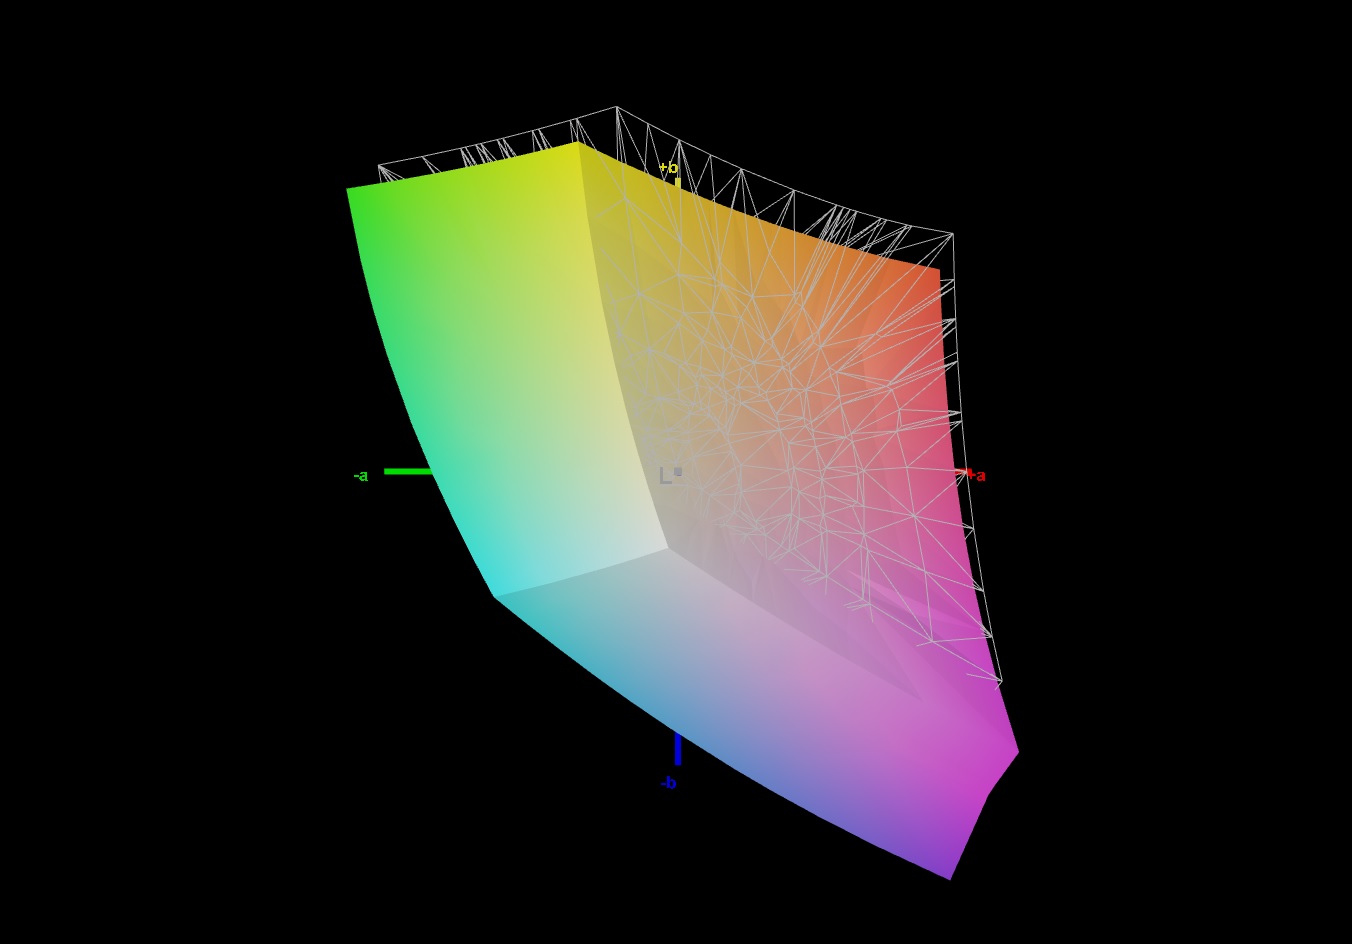
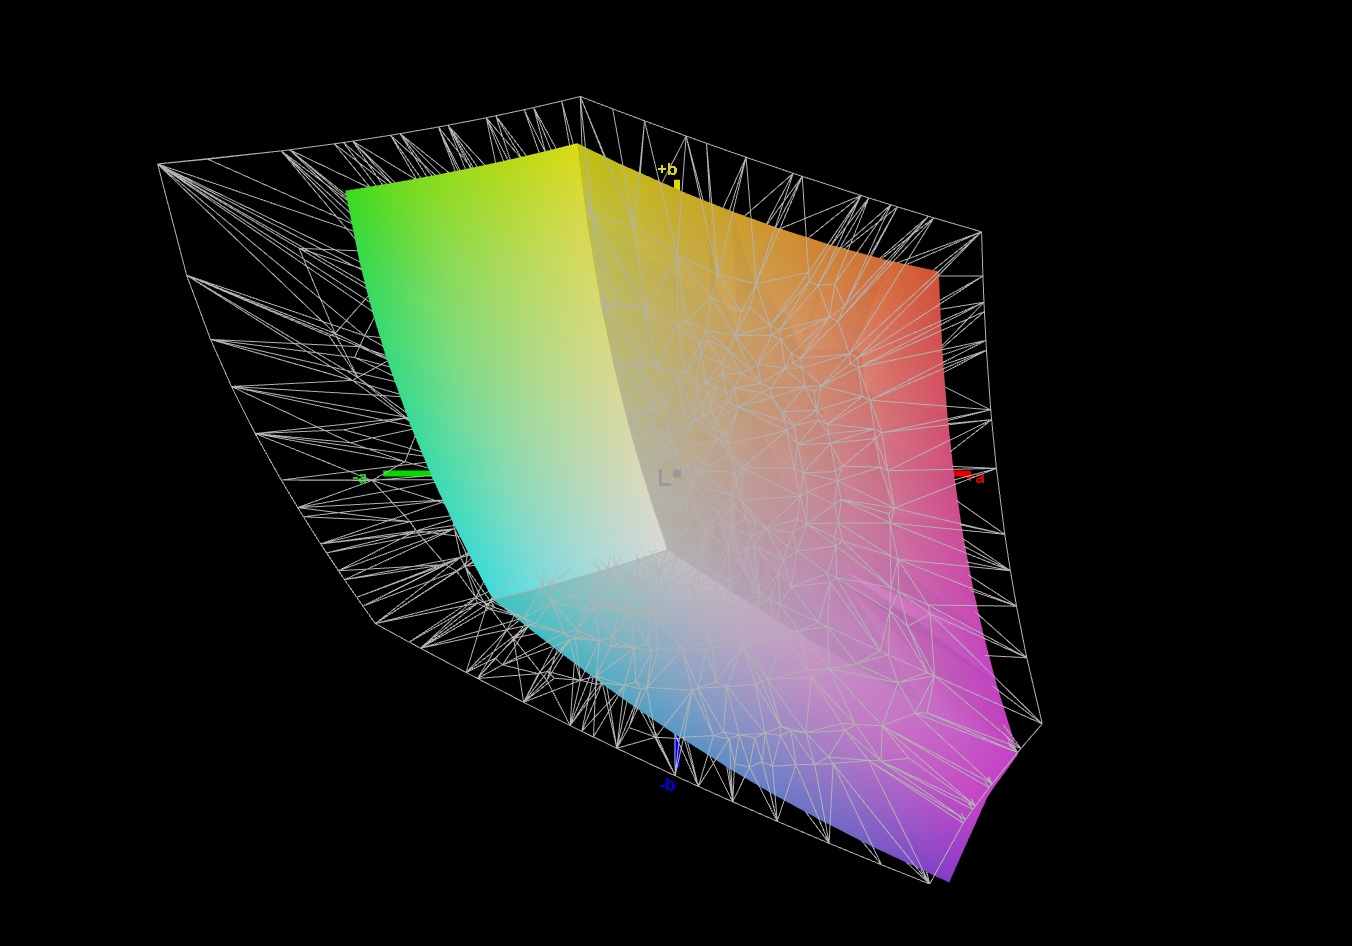
90% sRGB (Argyll 1.6.3 3D)
66% AdobeRGB 1998 (Argyll 1.6.3 3D)
66.4% AdobeRGB 1998 (Argyll 3D)
96.8% sRGB (Argyll 3D)
65.2% Display P3 (Argyll 3D)
Gamma: 2.154
CCT: 7507 K
| Asus Strix G17 G712LWS LG Philips LP173WFG-SPB3, IPS, 1920x1080, 17.3" | Asus ROG Strix G GL731GU-RB74 AU Optronics B173HAN04.0, IPS, 1920x1080, 17.3" | Acer Predator Helios 300 PH317-54-75G8 Chi Mei N173HCE-G33, IPS, 1920x1080, 17.3" | Schenker XMG Pro 17 PB71RD-G AU Optronics B173HAN04.0 (AUO409D), IPS, 1920x1080, 17.3" | MSI GL75 10SFR Chi Mei N173HCE-G33, IPS, 1920x1080, 17.3" | Lenovo Legion Y740-17IRHg-81UJ001VGE AUO_B173HAN03, IPS, 1920x1080, 17.3" | |
|---|---|---|---|---|---|---|
| Display | -6% | -3% | -5% | -1% | -3% | |
| Display P3 Coverage (%) | 65.2 | 61.9 -5% | 62.6 -4% | 62.8 -4% | 63.9 -2% | 63.8 -2% |
| sRGB Coverage (%) | 96.8 | 89.4 -8% | 94.3 -3% | 89.8 -7% | 96.2 -1% | 92.7 -4% |
| AdobeRGB 1998 Coverage (%) | 66.4 | 63.3 -5% | 64.7 -3% | 64.2 -3% | 66 -1% | 65.3 -2% |
| Response Times | 24% | -9% | -16% | 15% | -9% | |
| Response Time Grey 50% / Grey 80% * (ms) | 14.4 ? | 6.4 ? 56% | 16.4 ? -14% | 16.8 ? -17% | 12 ? 17% | 16 ? -11% |
| Response Time Black / White * (ms) | 10.4 ? | 11.2 ? -8% | 10.8 ? -4% | 12 ? -15% | 9 ? 13% | 11 ? -6% |
| PWM Frequency (Hz) | 24510 ? | 208 ? | ||||
| Screen | -23% | 27% | -18% | 7% | -7% | |
| Brightness middle (cd/m²) | 323 | 294.3 -9% | 322 0% | 274 -15% | 333 3% | 310 -4% |
| Brightness (cd/m²) | 300 | 289 -4% | 308 3% | 273 -9% | 309 3% | 281 -6% |
| Brightness Distribution (%) | 89 | 89 0% | 92 3% | 95 7% | 86 -3% | 85 -4% |
| Black Level * (cd/m²) | 0.31 | 0.3 3% | 0.18 42% | 0.26 16% | 0.215 31% | 0.31 -0% |
| Contrast (:1) | 1042 | 981 -6% | 1789 72% | 1054 1% | 1549 49% | 1000 -4% |
| Colorchecker dE 2000 * | 3.01 | 3.95 -31% | 1.53 49% | 4.62 -53% | 1.98 34% | 3.86 -28% |
| Colorchecker dE 2000 max. * | 7.65 | 6.49 15% | 3.14 59% | 7.66 -0% | 4.34 43% | 7.8 -2% |
| Colorchecker dE 2000 calibrated * | 1 | 3.08 -208% | 0.74 26% | 1.93 -93% | 2.01 -101% | |
| Greyscale dE 2000 * | 3.8 | 3.7 3% | 1.9 50% | 5.3 -39% | 2.97 22% | 4.48 -18% |
| Gamma | 2.154 102% | 2.07 106% | 2.144 103% | 2.34 94% | 2.41 91% | 2.5 88% |
| CCT | 7507 87% | 7155 91% | 6809 95% | 7619 85% | 6750 96% | 7542 86% |
| Color Space (Percent of AdobeRGB 1998) (%) | 66 | 57.7 -13% | 65 -2% | 58 -12% | 61 -8% | 60 -9% |
| Color Space (Percent of sRGB) (%) | 90 | 89 -1% | 87 -3% | 90 0% | 96 7% | 93 3% |
| Media total (Programa/Opciones) | -2% /
-14% | 5% /
17% | -13% /
-15% | 7% /
7% | -6% /
-6% |
* ... más pequeño es mejor
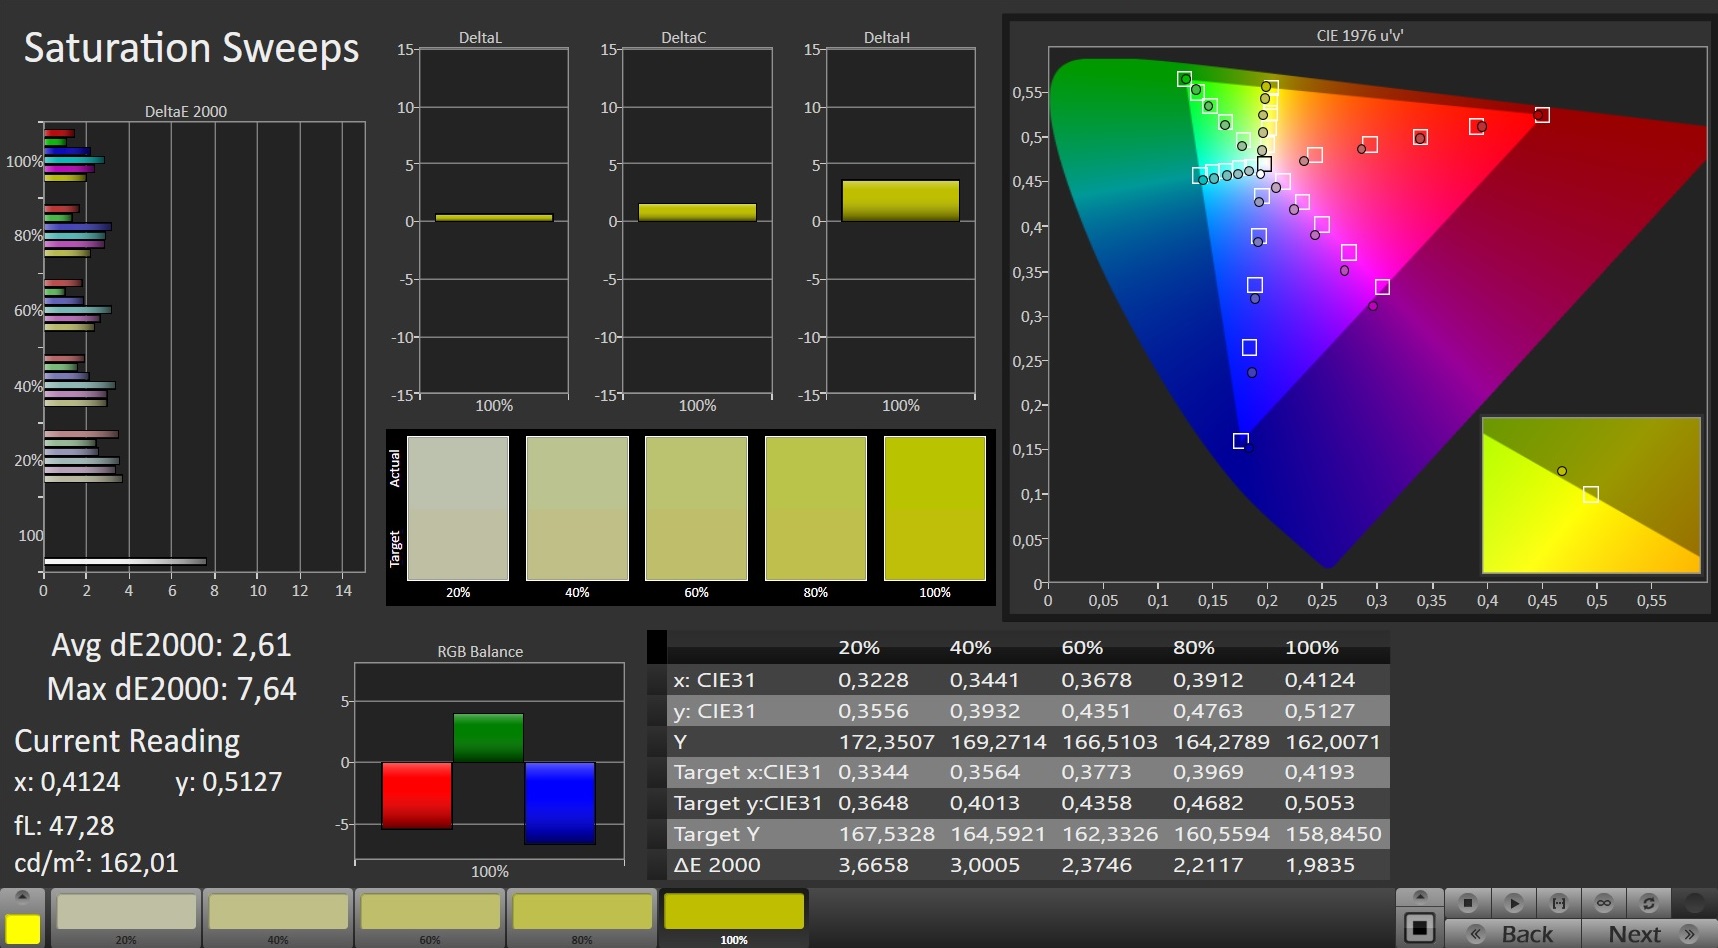
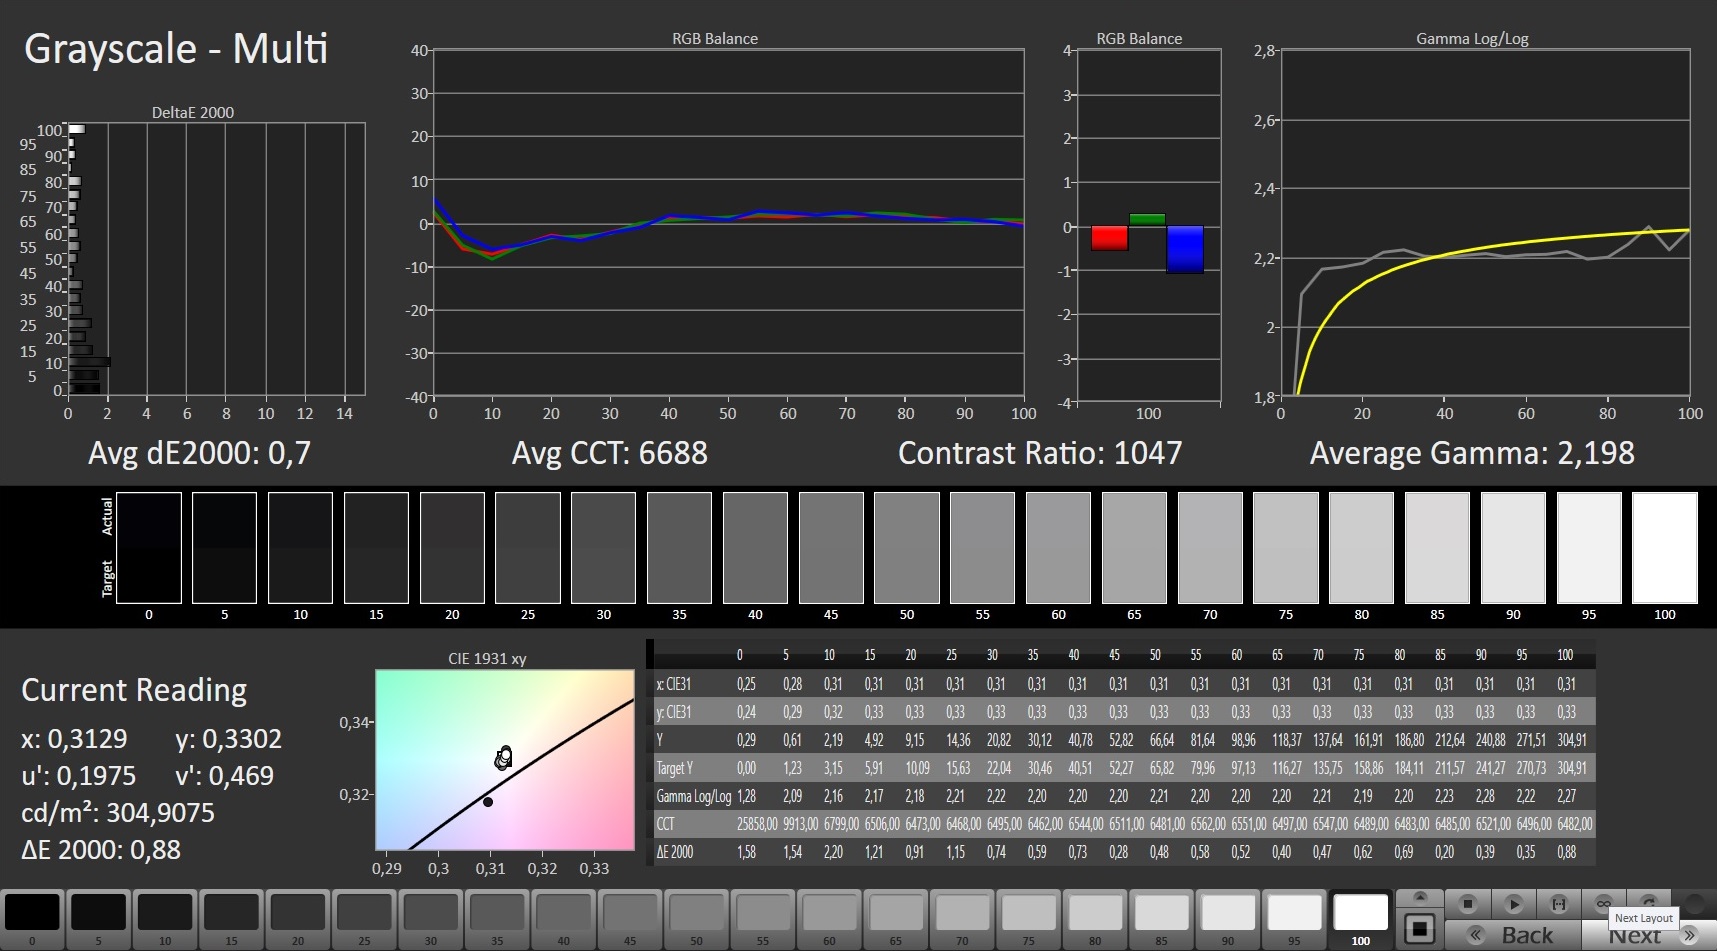
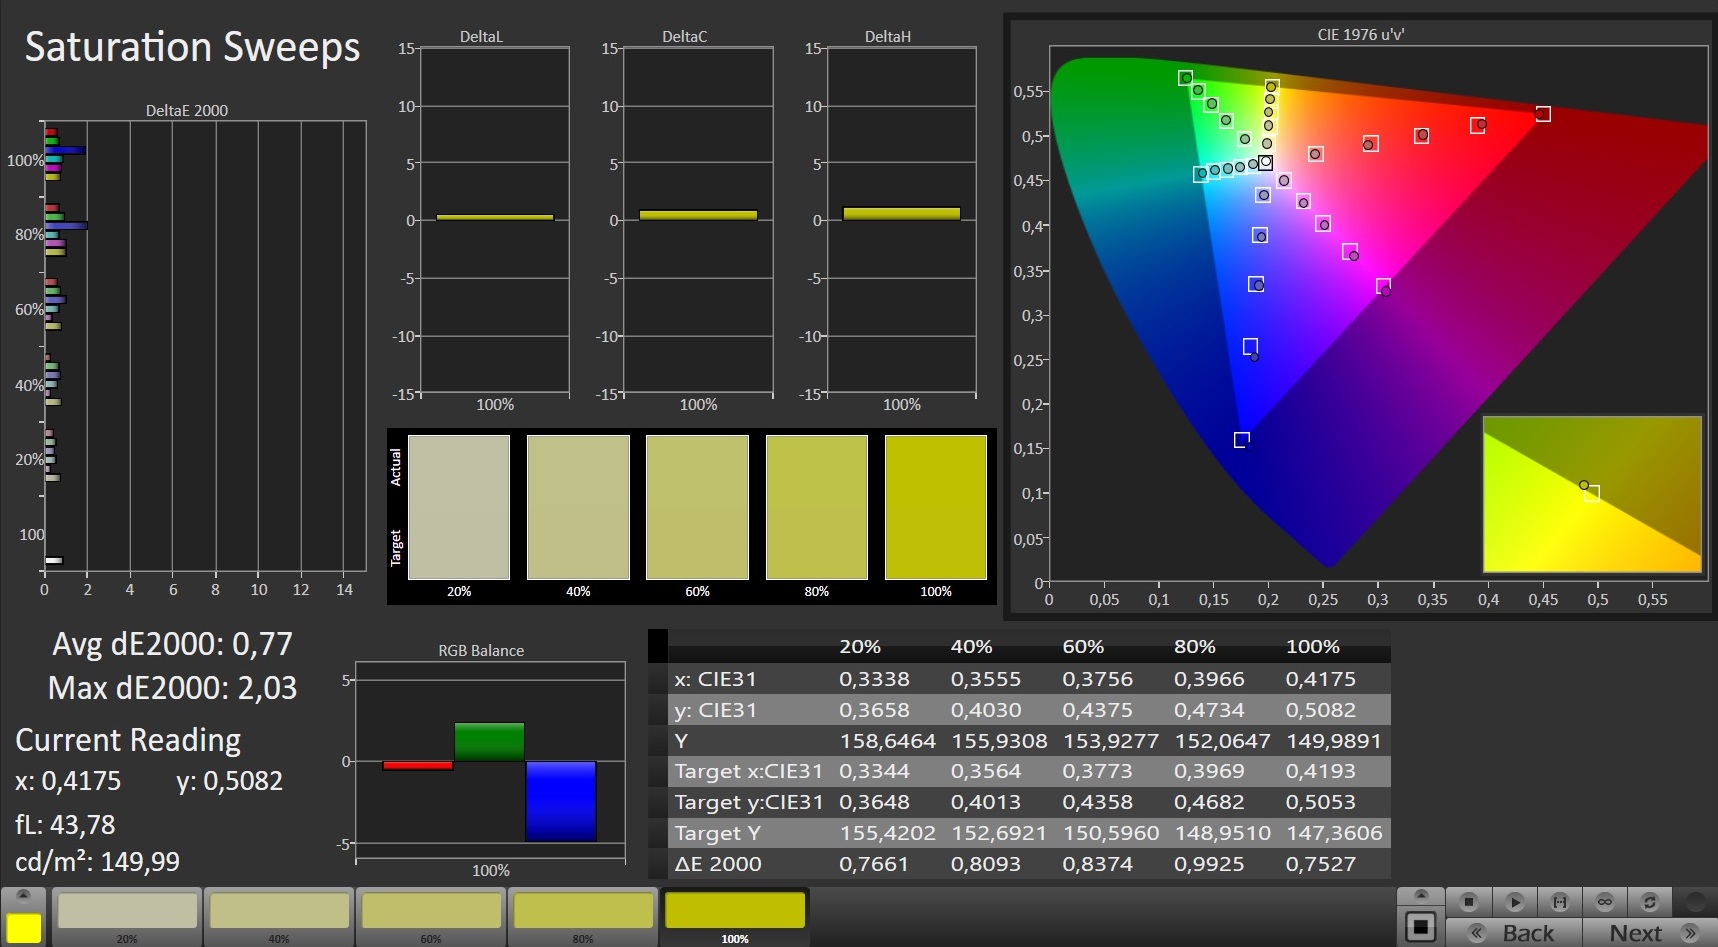
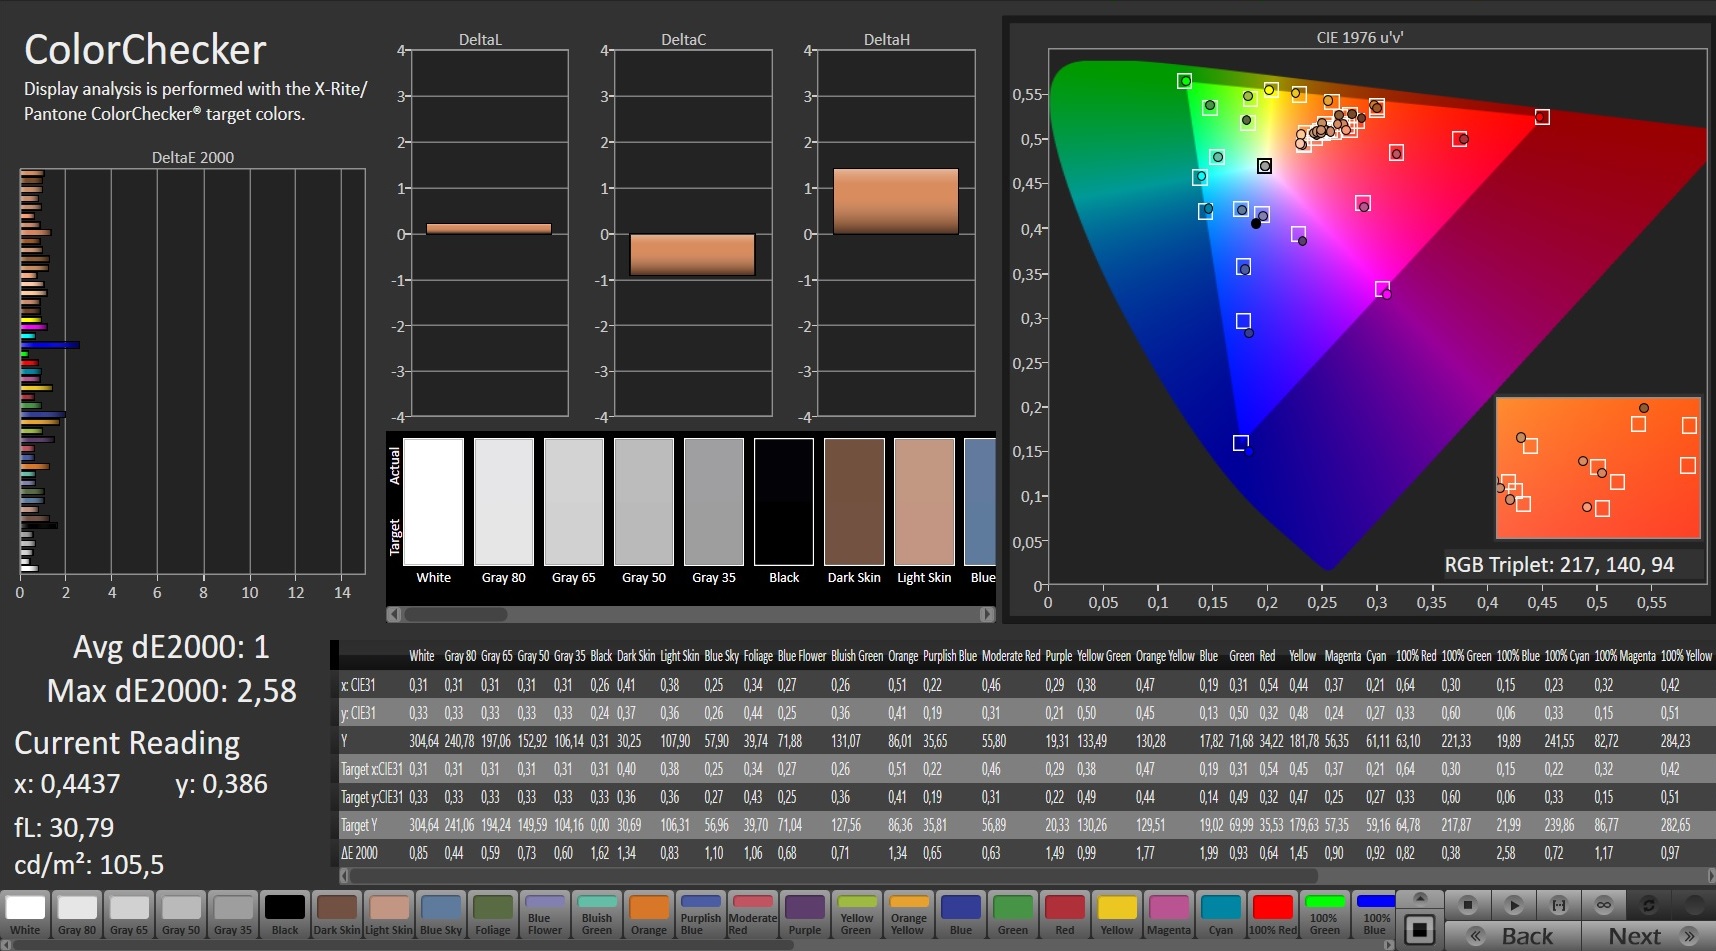
La pantalla ya muestra una reproducción de color muy decente fuera de la caja. Con una desviación de color Delta E 2000 de 3,01, el objetivo (Delta E menos de 3) se pierde por un pelo. La pantalla no sufre de un tinte azul. Además, las mejoras se logran por medio de la calibración: De esta manera, la desviación de color se reduce a 1, y las escalas de grises se muestran de una manera más equilibrada. Los espacios de color AdobeRGB (66%) y sRGB (90%) no se reproducen completamente.
Tiempos de respuesta del display
| ↔ Tiempo de respuesta de Negro a Blanco | ||
|---|---|---|
| 10.4 ms ... subida ↗ y bajada ↘ combinada | ↗ 5.2 ms subida | 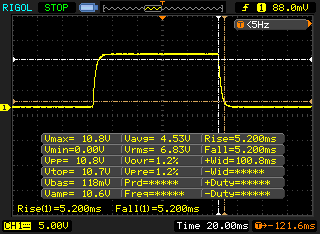 |
| ↘ 5.2 ms bajada | ||
| La pantalla mostró buenos tiempos de respuesta en nuestros tests pero podría ser demasiado lenta para los jugones competitivos. En comparación, todos los dispositivos de prueba van de ##min### (mínimo) a 240 (máximo) ms. » 28 % de todos los dispositivos son mejores. Esto quiere decir que el tiempo de respuesta medido es mejor que la media (19.8 ms) de todos los dispositivos testados. | ||
| ↔ Tiempo de respuesta 50% Gris a 80% Gris | ||
| 14.4 ms ... subida ↗ y bajada ↘ combinada | ↗ 6.8 ms subida | 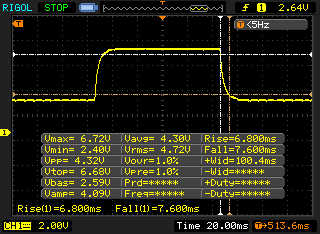 |
| ↘ 7.6 ms bajada | ||
| La pantalla mostró buenos tiempos de respuesta en nuestros tests pero podría ser demasiado lenta para los jugones competitivos. En comparación, todos los dispositivos de prueba van de ##min### (mínimo) a 636 (máximo) ms. » 28 % de todos los dispositivos son mejores. Esto quiere decir que el tiempo de respuesta medido es mejor que la media (31 ms) de todos los dispositivos testados. | ||
Parpadeo de Pantalla / PWM (Pulse-Width Modulation)
| Parpadeo de Pantalla / PWM no detectado | 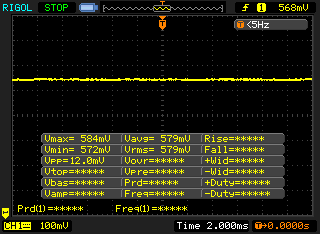 | ||
Comparación: 52 % de todos los dispositivos testados no usaron PWM para atenuar el display. Si se usó, medimos una media de 7769 (mínimo: 5 - máxmo: 343500) Hz. | |||
La pantalla está equipada con un panel IPS con ángulo de visión estable. Así la pantalla puede ser leída desde cualquier posición. En el exterior, la pantalla puede ser leída cuando el sol no es demasiado brillante.


Rendimiento - Suficiente para los próximos años
Con el ROG Strix G17 G712LWS, Asus tiene un portátil para juegos de 17,3 pulgadas en su gama que lleva todos los juegos modernos sin problemas a la pantalla. Nuestro dispositivo de prueba cuesta un poco menos de 2.000 euros (~$2.362). Además, hay disponibles otras variantes de configuración.

Condiciones de la prueba
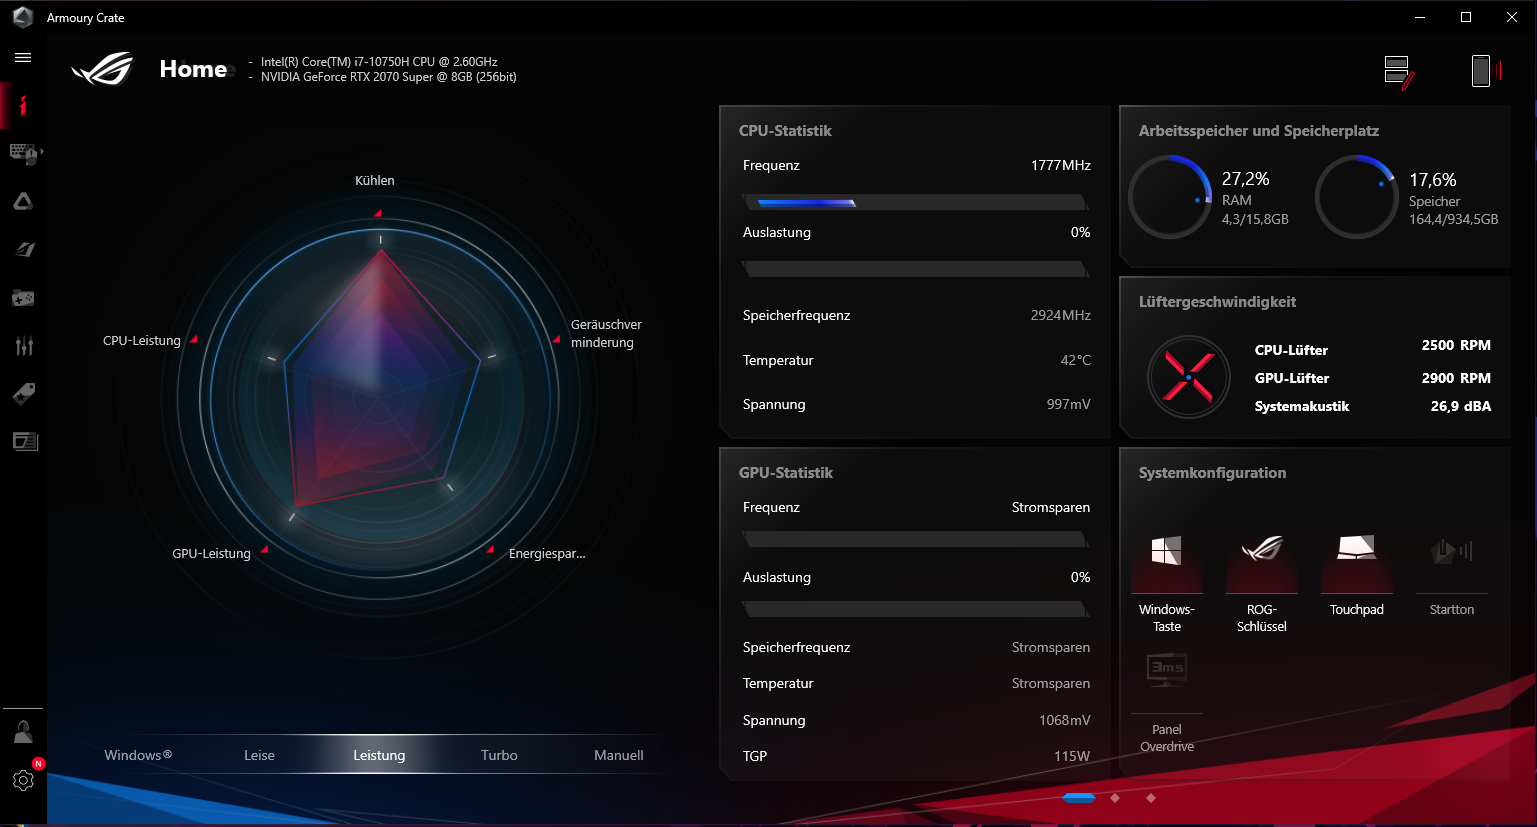
El Armoury Crate Control Center preinstalado permite la selección de un perfil de energía. Realizamos nuestra prueba con el perfil de "Rendimiento" activo. Algunos puntos de referencia fueron adicionalmente ejecutados bajo el perfil "Turbo". Para las pruebas de batería, utilizamos los planes de energía de Windows.
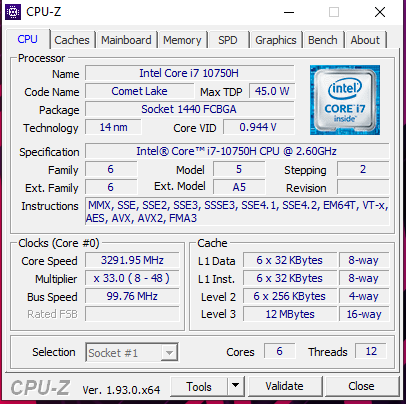
Procesador
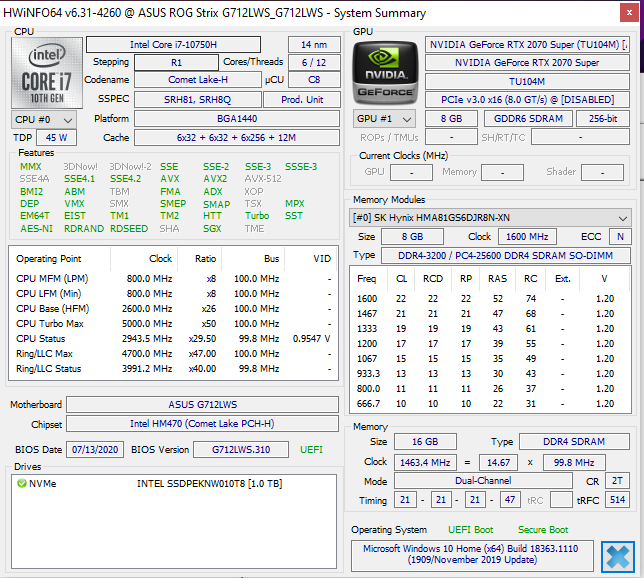
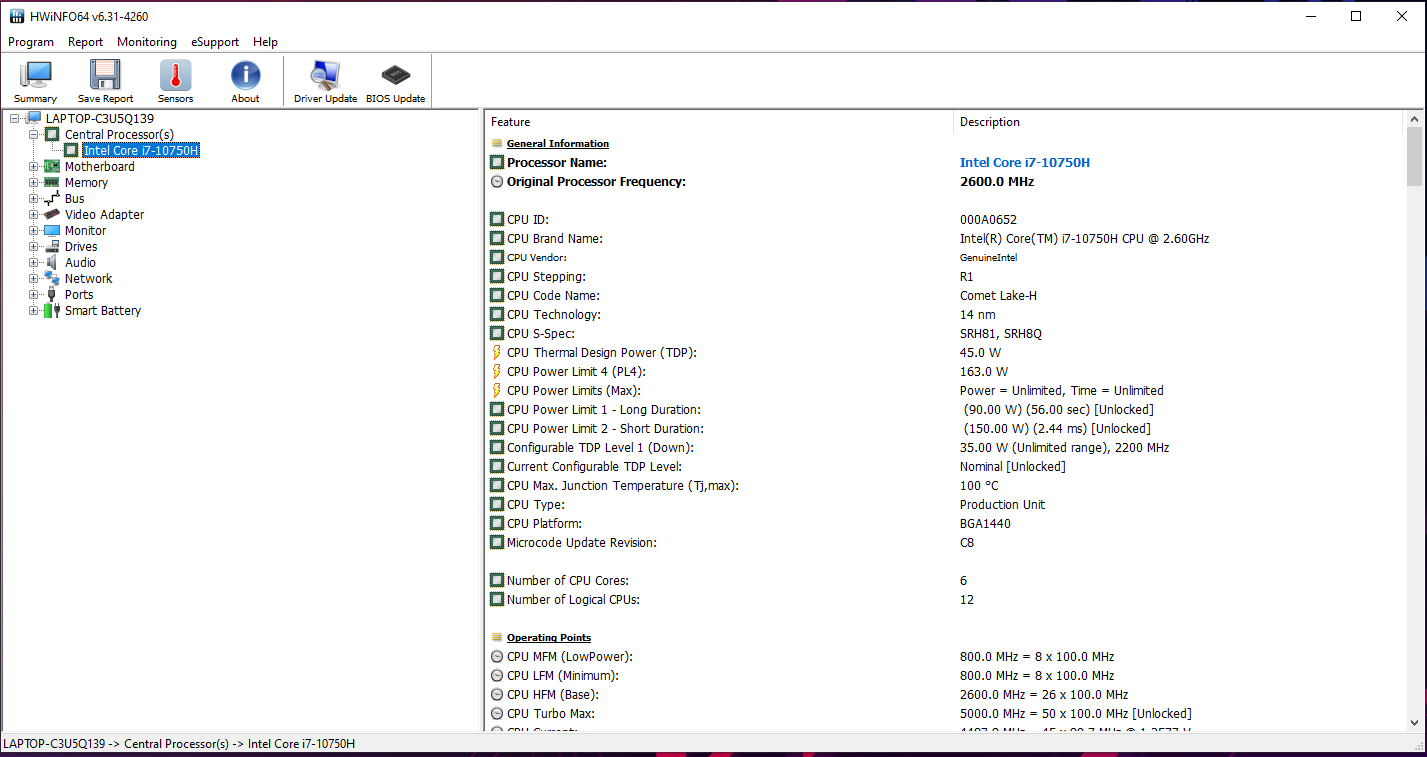
Asus equipa el Strix con un Core i7-10750H un procesador de núcleo hexa (Comet Lake). La CPU funciona a una velocidad base de 2,6 GHz. La velocidad puede aumentarse a 4,3 GHz (seis núcleos) o 5 GHz (un núcleo) mediante Turbo. Se admite Hyper-Threading (dos hilos por núcleo)
El procesador funciona a través de la prueba multihilo del benchmark Cinebench R15 a 4,2 GHz. La prueba de un solo hilo se realiza a 4,3 a 4,6 GHz. Con la energía de las baterías, las velocidades son de 2,6 a 2,8 GHz (multihilo) y de 3,2 a 3,5 GHz (un solo hilo), respectivamente
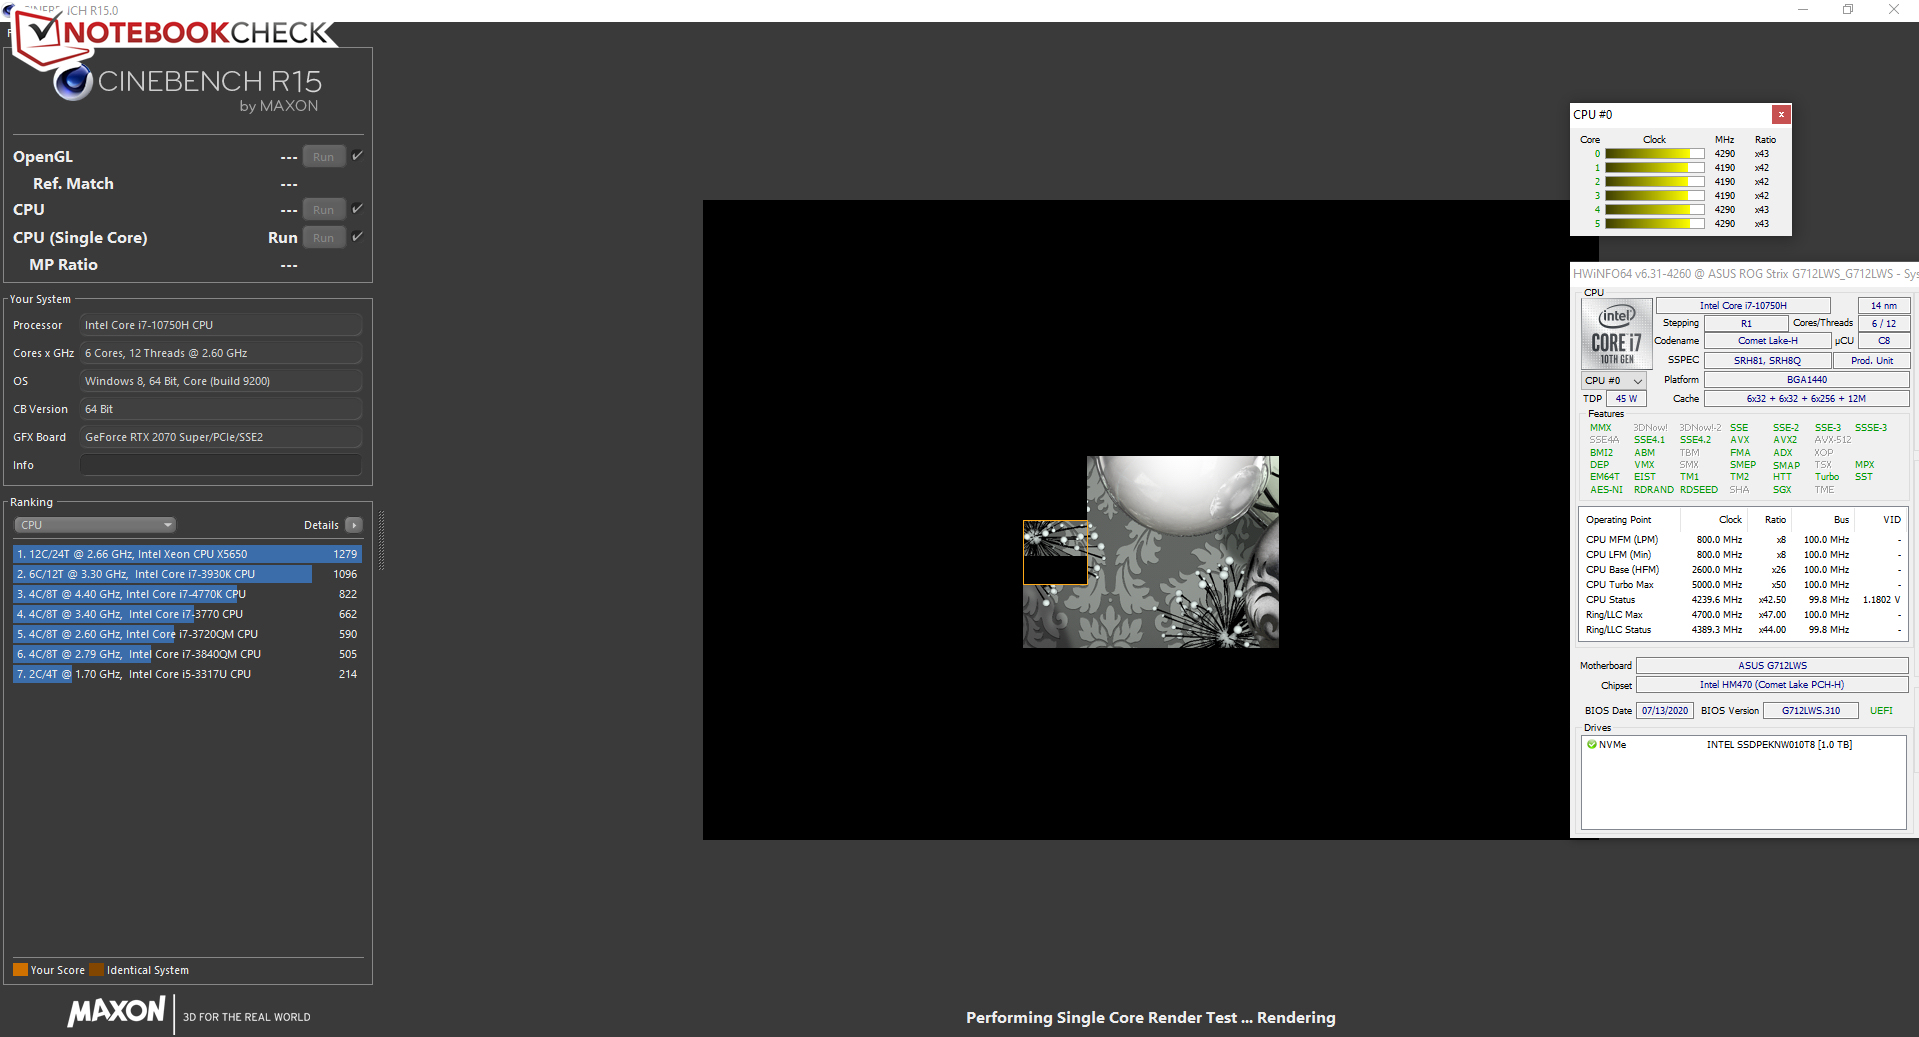
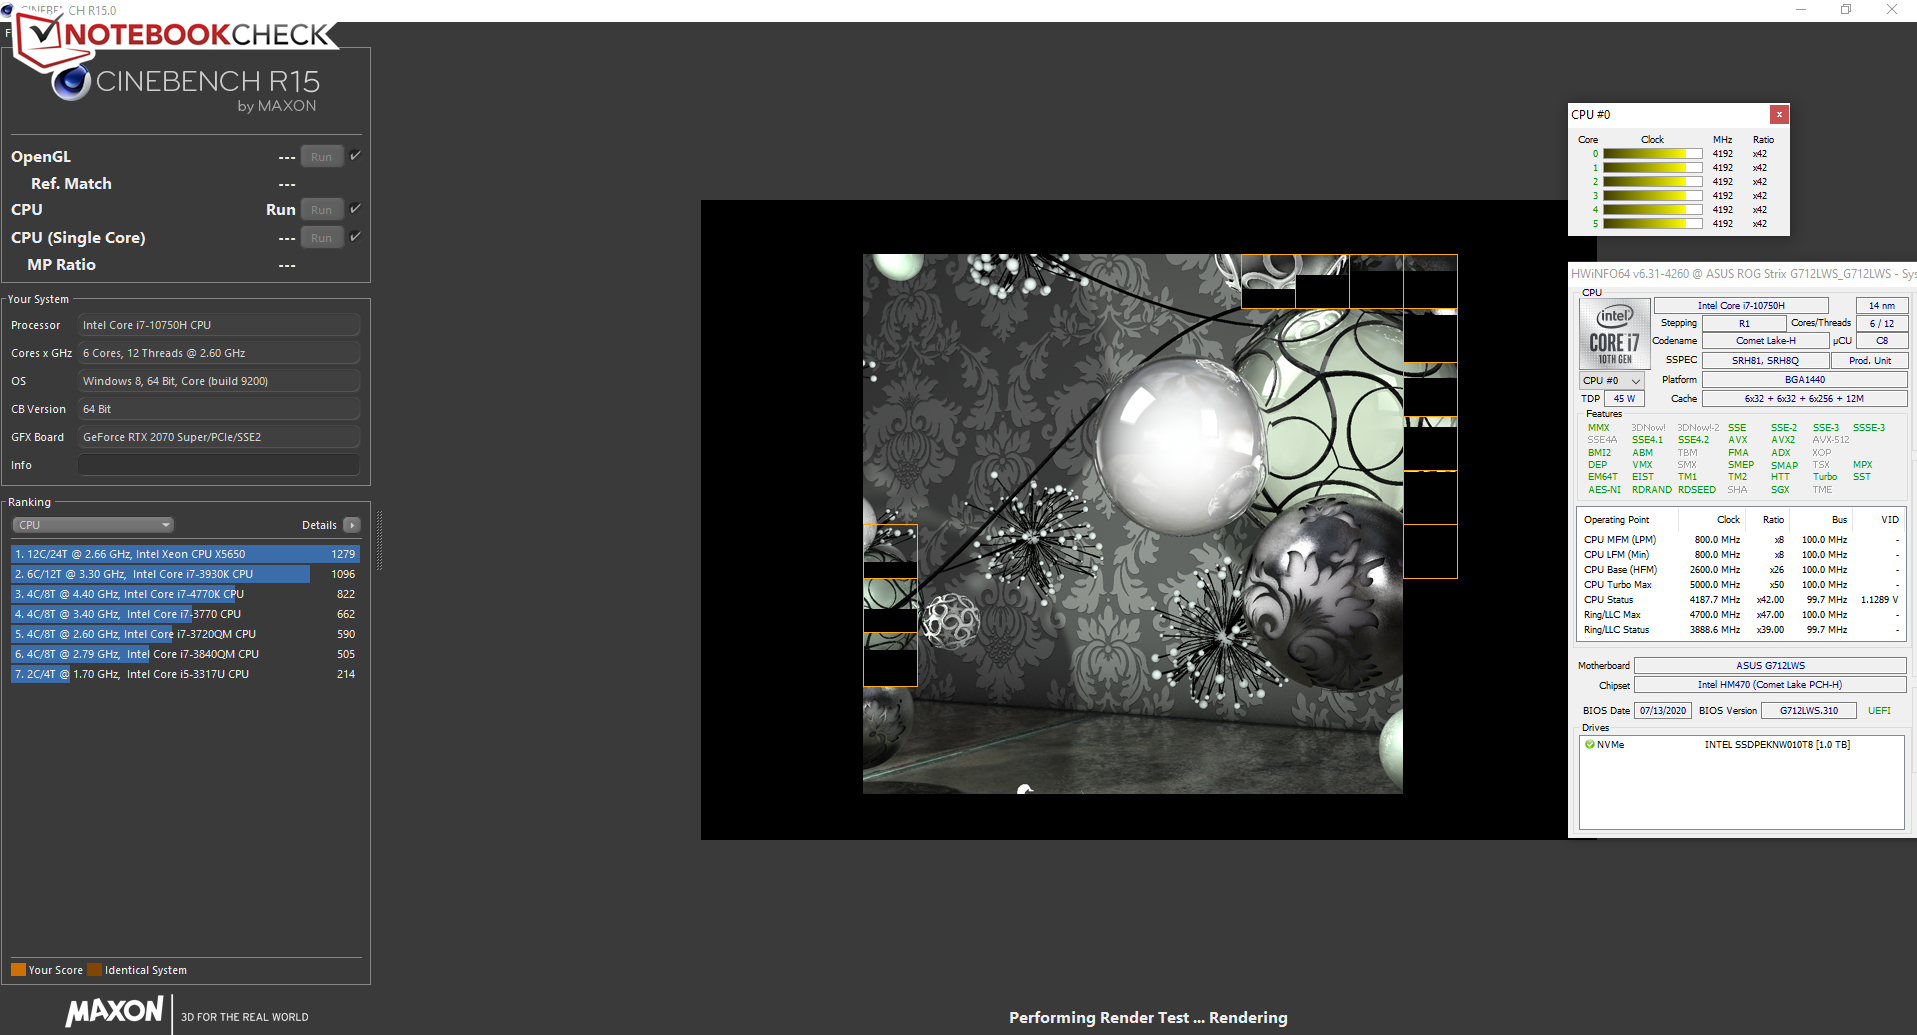
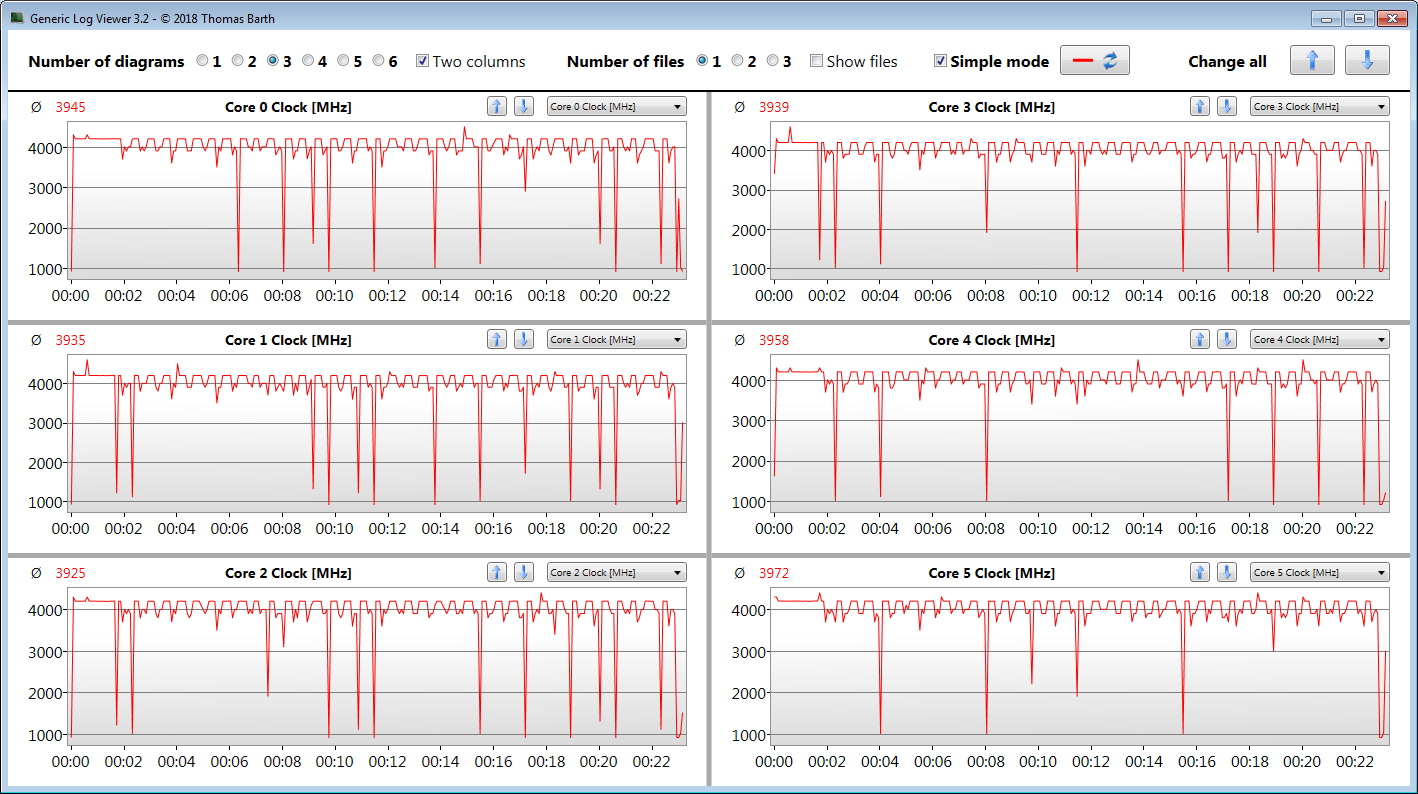
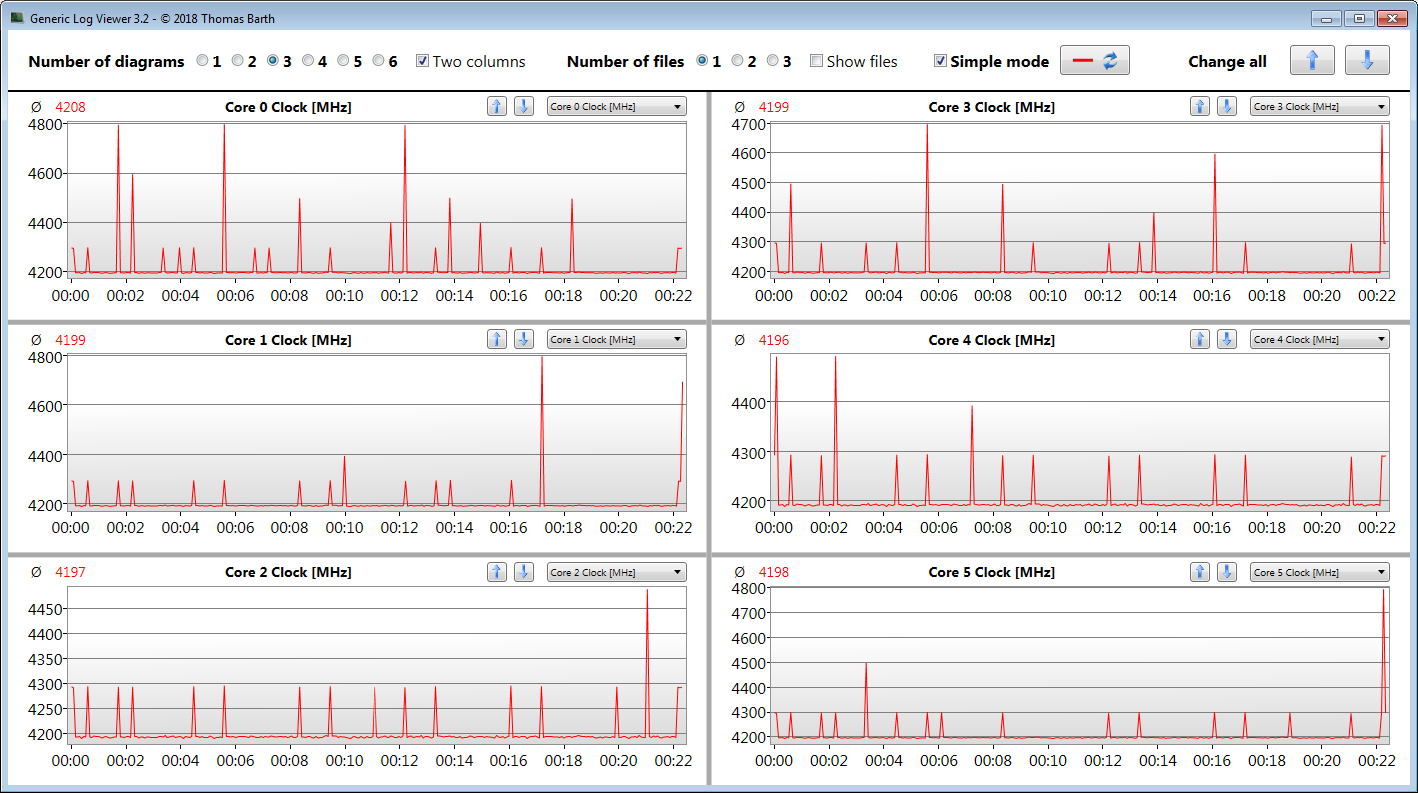
Verificamos si el Turbo de la CPU se usa consistentemente cuando se conecta ejecutando la prueba multihilo del Cinebench R15 en un bucle continuo durante al menos 30 minutos. Los resultados caen ligeramente de la primera a la tercera corrida y luego se mantienen a un nivel relativamente constante. El turbo se utiliza en gran medida. Se alcanzan velocidades ligeramente superiores cuando se utiliza el perfil "Turbo" del software Armoury Crate.
* ... más pequeño es mejor
Rendimiento del sistema
El sistema funciona bien y sin problemas, y no encontramos ningún problema. Los buenos resultados de PCMark revelan que el portátil ofrece un rendimiento más que suficiente para todas las áreas de aplicación comunes - y esto debería ser cierto también para los próximos años.
| PCMark 8 Home Score Accelerated v2 | 4412 puntos | |
| PCMark 8 Creative Score Accelerated v2 | 4201 puntos | |
| PCMark 8 Work Score Accelerated v2 | 5832 puntos | |
| PCMark 10 Score | 5262 puntos | |
ayuda | ||
Latencias DPC
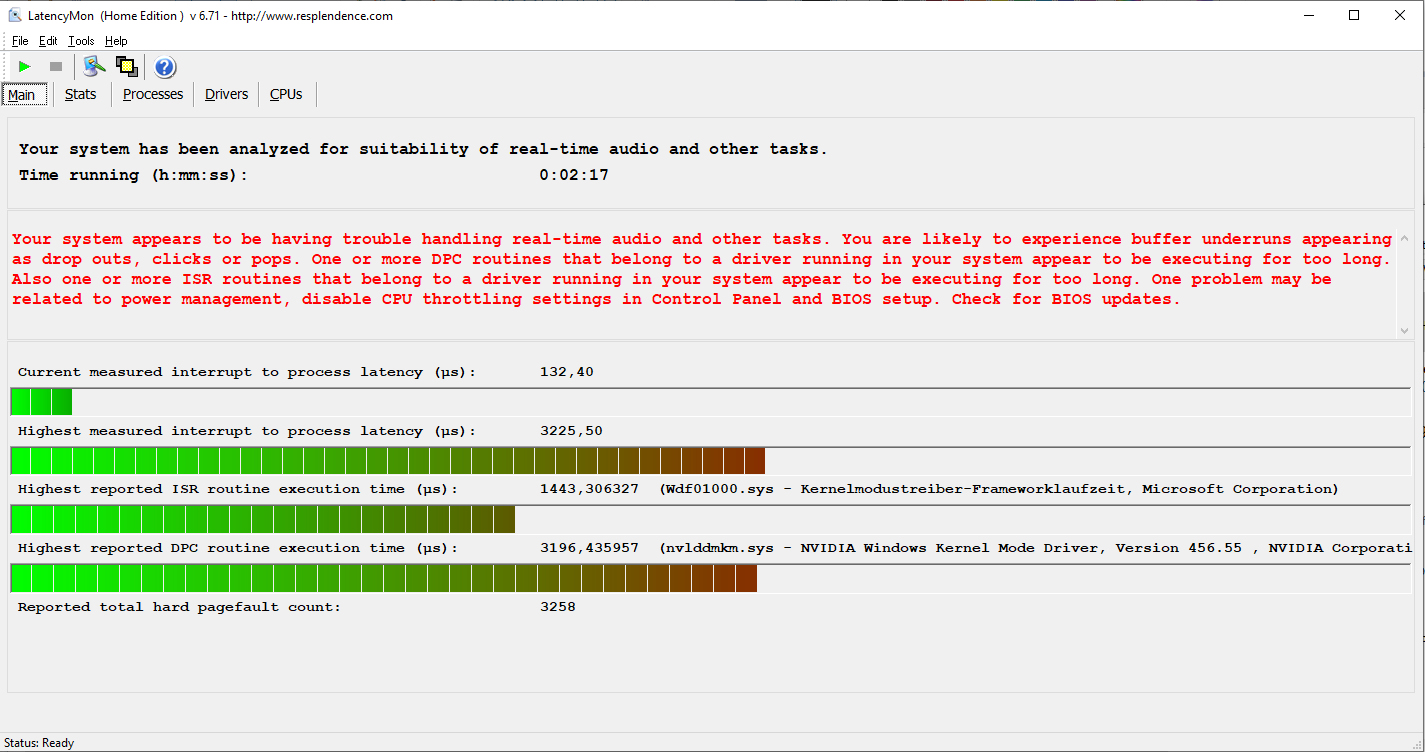
En nuestra prueba de monitor de latencia estandarizada (navegación por la web, reproducción de vídeo 4K, Prime95 de alta carga), pudimos observar problemas con las latencias DPC. El sistema no parece ser adecuado para la edición de vídeo y audio en tiempo real.
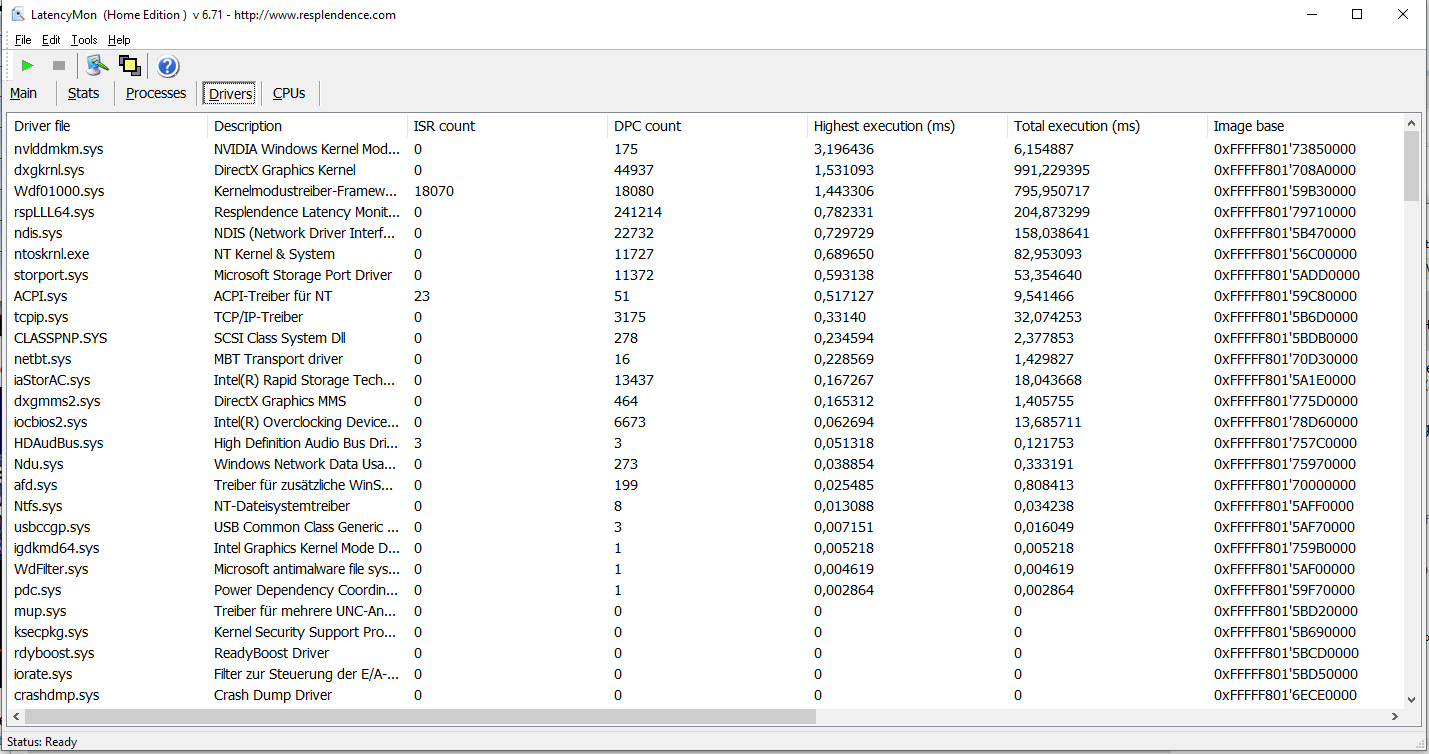
| DPC Latencies / LatencyMon - interrupt to process latency (max), Web, Youtube, Prime95 | |
| Asus Strix G17 G712LWS | |
| MSI GL75 10SFR | |
| Acer Predator Helios 300 PH317-54-75G8 | |
* ... más pequeño es mejor
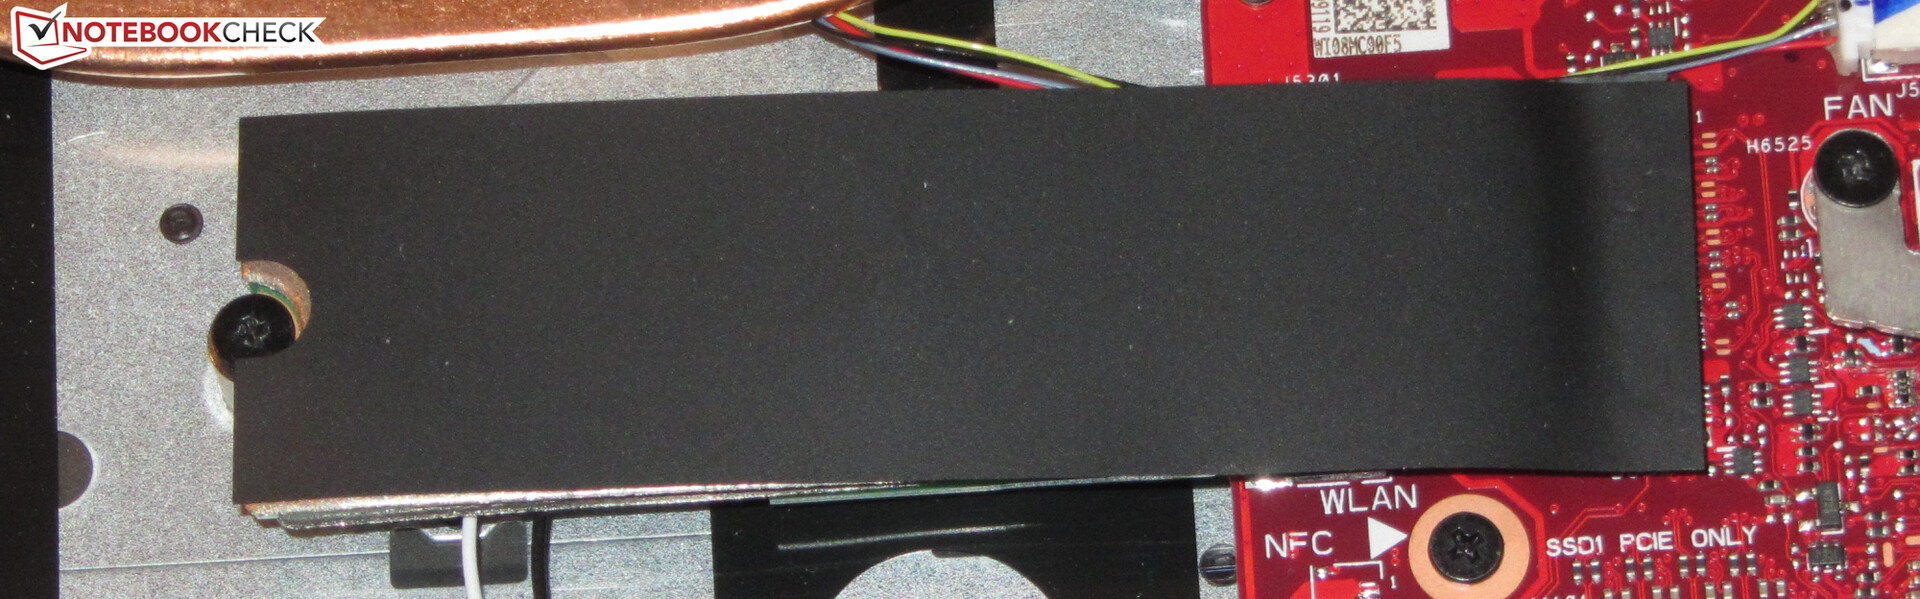
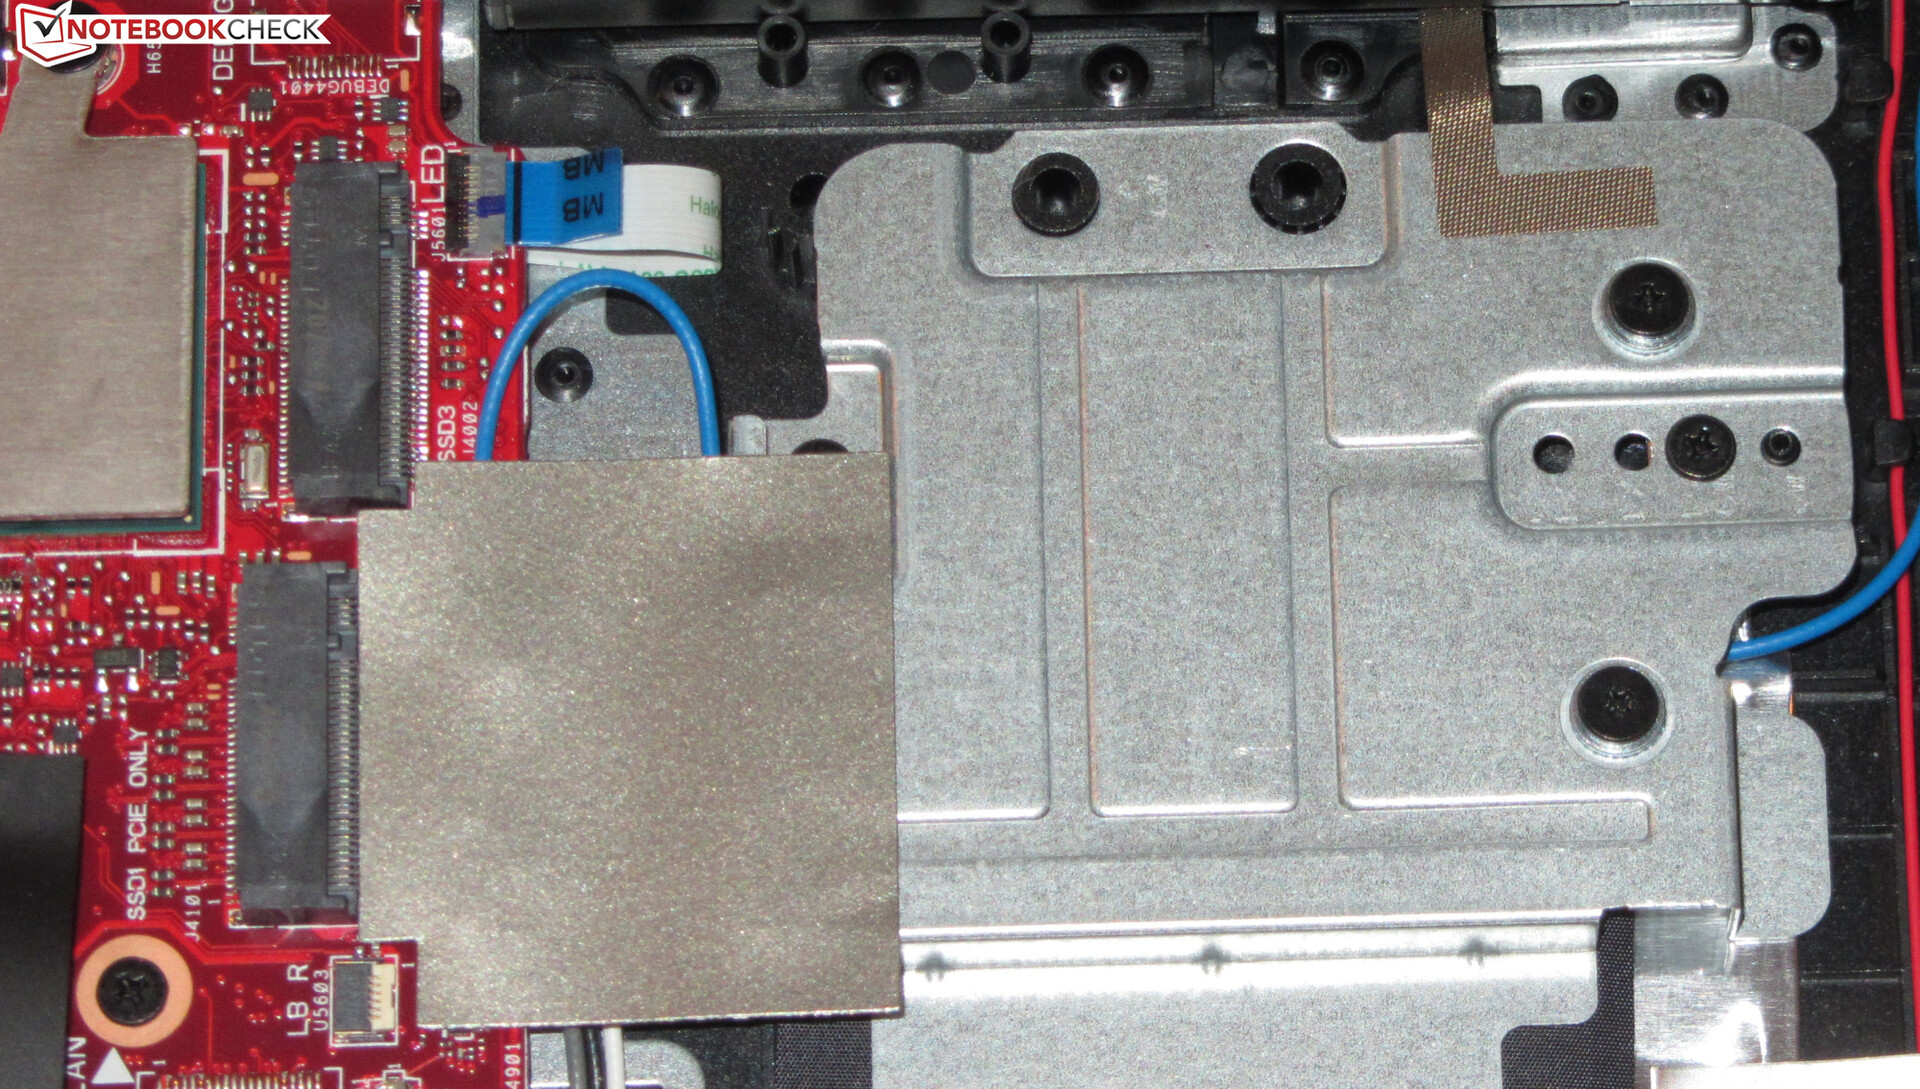
Almacenamiento
La unidad del sistema es un SSD NVMe (M.2 2280) de Intel que proporciona 1 TB de espacio de almacenamiento. El SSD ofrece buenas tasas de transferencia en general, pero no está entre los mejores modelos ya que todavía se puede mejorar. El portátil ofrece espacio para dos SSD M.2 2280 más. Además, es compatible con RAID 0.

| Asus Strix G17 G712LWS Intel SSD 660p 1TB SSDPEKNW010T8 | Asus ROG Strix G GL731GU-RB74 Intel SSD 660p SSDPEKNW512G8 | Acer Predator Helios 300 PH317-54-75G8 WDC PC SN730 SDBQNTY-1T00 | Schenker XMG Pro 17 PB71RD-G Samsung SSD 970 EVO Plus 500GB | MSI GL75 10SFR Lite-On CL1-8D512 | Lenovo Legion Y740-17IRHg-81UJ001VGE Samsung SSD PM981 MZVLB1T0HALR | |
|---|---|---|---|---|---|---|
| CrystalDiskMark 5.2 / 6 | -16% | 27% | 20% | -4% | 16% | |
| Write 4K (MB/s) | 141.1 | 127.6 -10% | 141.9 1% | 117.5 -17% | 132.2 -6% | 101.2 -28% |
| Read 4K (MB/s) | 60.9 | 56 -8% | 48.75 -20% | 46.47 -24% | 45.62 -25% | 44.61 -27% |
| Write Seq (MB/s) | 1681 | 986 -41% | 2734 63% | 1345 -20% | 1511 -10% | 2295 37% |
| Read Seq (MB/s) | 1602 | 1605 0% | 1921 20% | 2804 75% | 1890 18% | 2174 36% |
| Write 4K Q32T1 (MB/s) | 406.6 | 451.5 11% | 422.6 4% | 368.2 -9% | 375.9 -8% | 401.2 -1% |
| Read 4K Q32T1 (MB/s) | 470.2 | 343.3 -27% | 509 8% | 412.9 -12% | 525 12% | 475.5 1% |
| Write Seq Q32T1 (MB/s) | 1759 | 983 -44% | 3055 74% | 3248 85% | 1505 -14% | 2397 36% |
| Read Seq Q32T1 (MB/s) | 1932 | 1810 -6% | 3257 69% | 3559 84% | 2008 4% | 3337 73% |
| AS SSD | -38% | 73% | 83% | -35% | 59% | |
| Seq Read (MB/s) | 1778 | 1319 -26% | 2828 59% | 2946 66% | 1923 8% | 2800 57% |
| Seq Write (MB/s) | 1478 | 930 -37% | 2677 81% | 2627 78% | 1065 -28% | 2424 64% |
| 4K Read (MB/s) | 49.76 | 49.43 -1% | 39.94 -20% | 56.9 14% | 25.43 -49% | 42.77 -14% |
| 4K Write (MB/s) | 117.9 | 104.3 -12% | 100.9 -14% | 151.7 29% | 101.9 -14% | 94.8 -20% |
| 4K-64 Read (MB/s) | 591 | 321.9 -46% | 1562 164% | 1222 107% | 477.9 -19% | 1406 138% |
| 4K-64 Write (MB/s) | 875 | 774 -12% | 1867 113% | 2444 179% | 563 -36% | 1697 94% |
| Access Time Read * (ms) | 0.082 | 0.055 33% | 0.051 38% | 0.053 35% | 0.05 39% | |
| Access Time Write * (ms) | 0.041 | 0.138 -237% | 0.037 10% | 0.025 39% | 0.126 -207% | 0.039 5% |
| Score Read (Points) | 818 | 503 -39% | 1885 130% | 1574 92% | 696 -15% | 1729 111% |
| Score Write (Points) | 1140 | 971 -15% | 2236 96% | 2859 151% | 771 -32% | 2034 78% |
| Score Total (Points) | 2377 | 1731 -27% | 5076 114% | 5232 120% | 1785 -25% | 4630 95% |
| Media total (Programa/Opciones) | -27% /
-29% | 50% /
53% | 52% /
57% | -20% /
-22% | 38% /
41% |
* ... más pequeño es mejor
Continuous load read: DiskSpd Read Loop, Queue Depth 8
Tarjeta gráfica
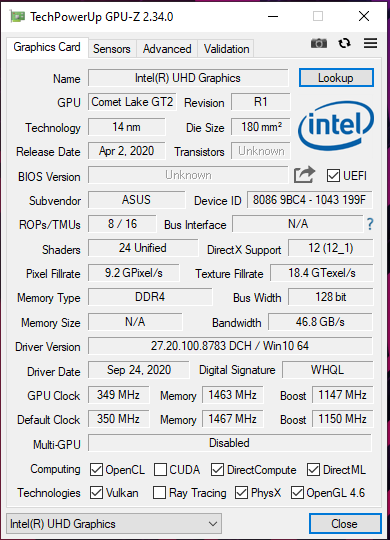
El núcleo gráfico GeForce RTX 2070 Super pertenece a la clase superior de la GPU. Puede acceder a la rápida memoria de gráficos GDDR6 (8.192 MB). El chip UHD Graphics 630 integrado en el procesador está activo, y el portátil funciona con la solución de conmutación de gráficos Optimus de Nvidia.
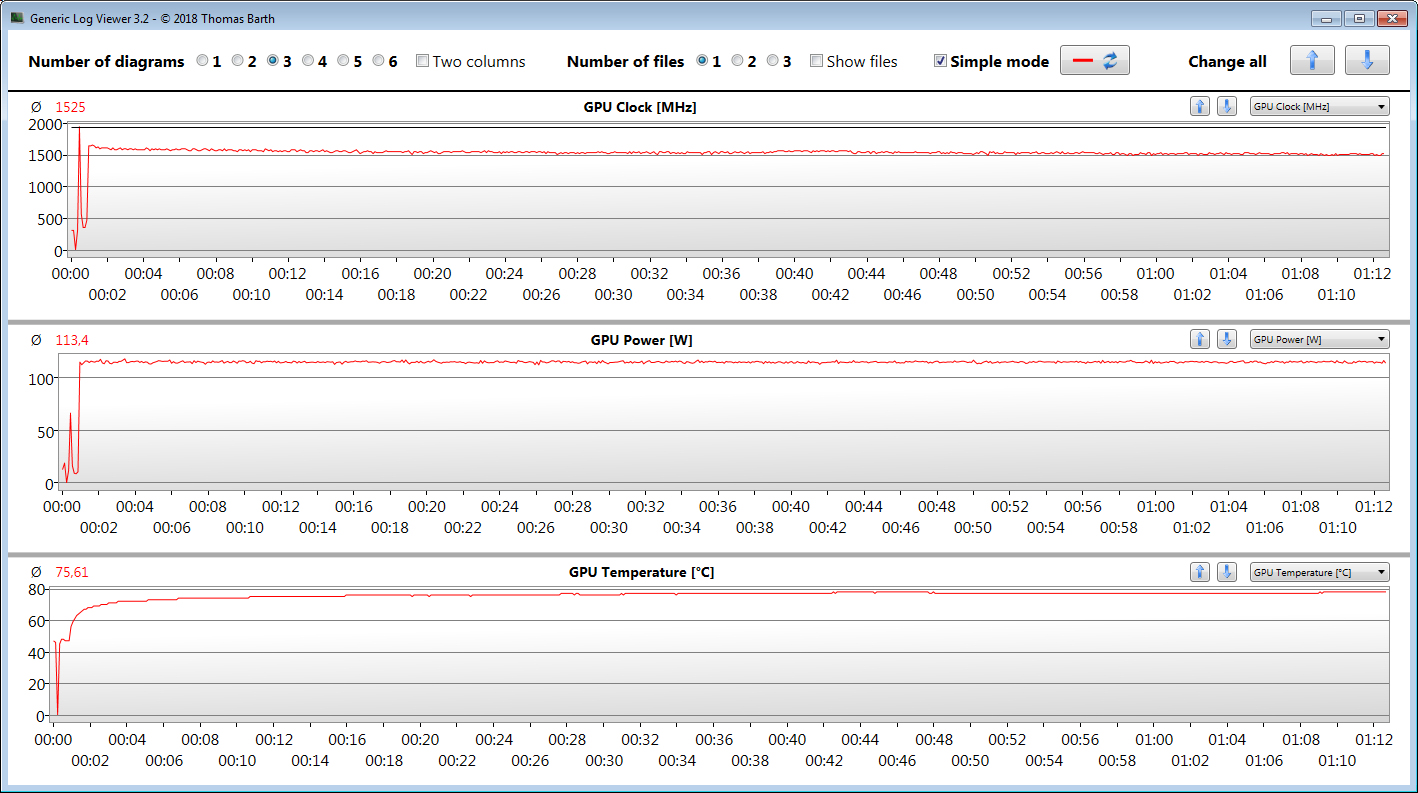
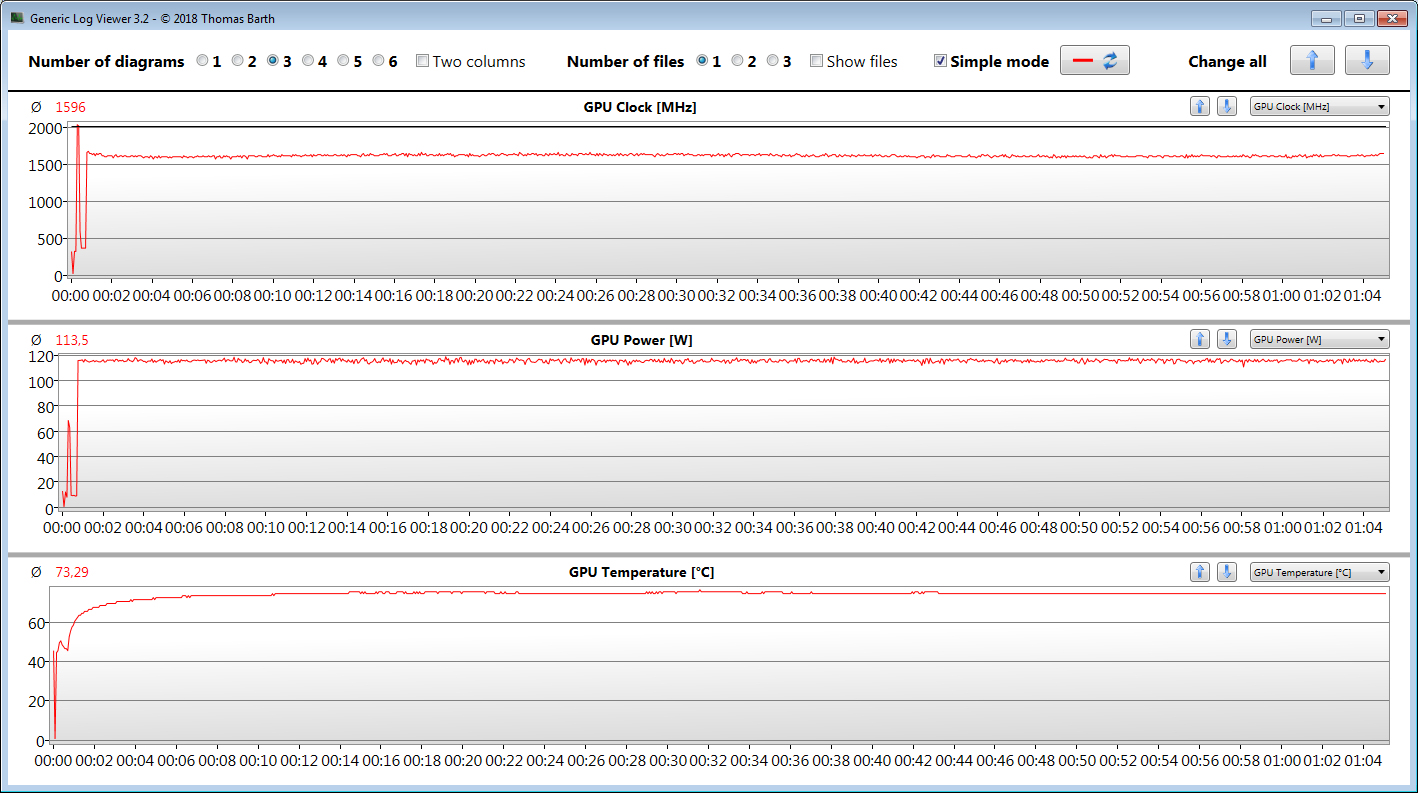
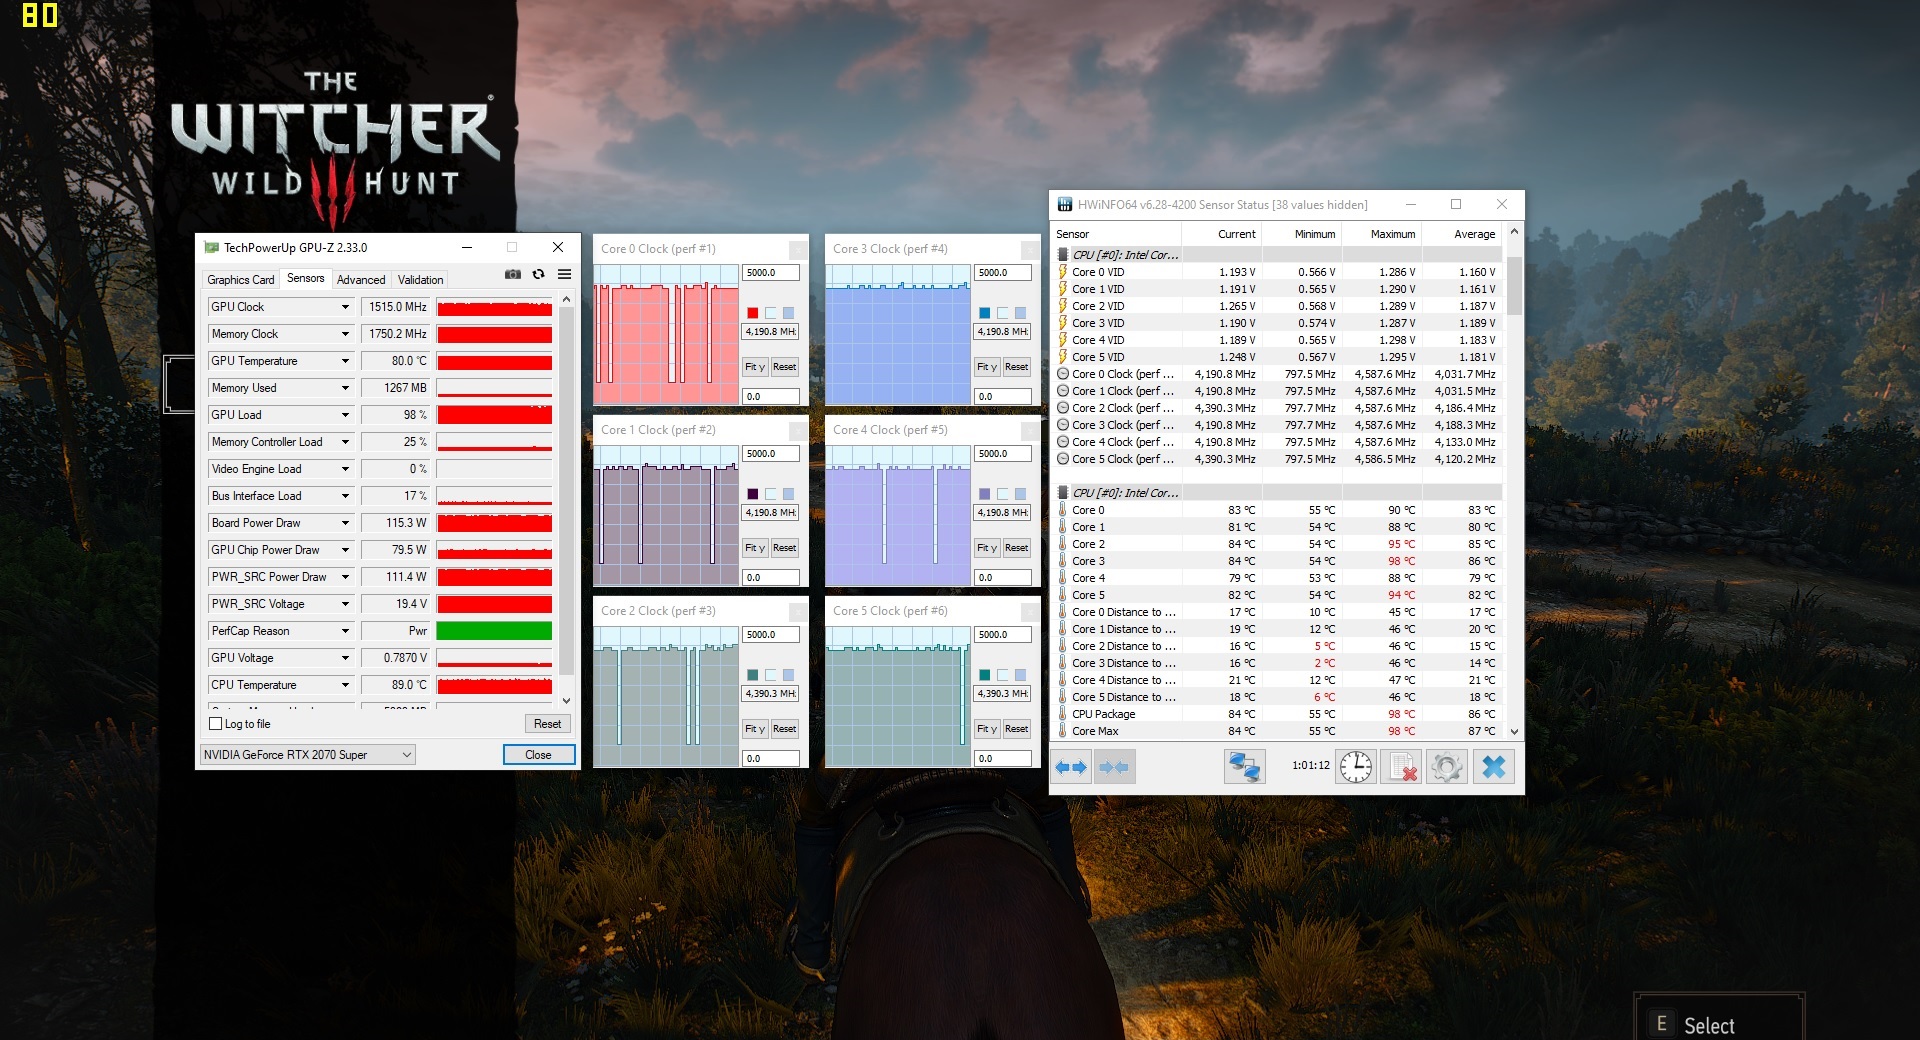
Nvidia especifica un rango entre 1.140 MHz (base) y 1.380 MHz (boost) para esta GPU DirectX 12. Se pueden alcanzar velocidades más altas si la GPU no alcanza un umbral de temperatura y/o energía especificado. De esta forma, registramos un máximo de 1.994 MHz. Además, nuestra prueba de The Witcher 3 se ejecuta a una velocidad media de 1.525 MHz y 1.596 MHz (Turbo), respectivamente.
Los resultados en los puntos de referencia de 3DMark están a un nivel normal para la GPU instalada aquí. El perfil "Turbo" de Armoury Crate permite que los valores aumenten ligeramente.

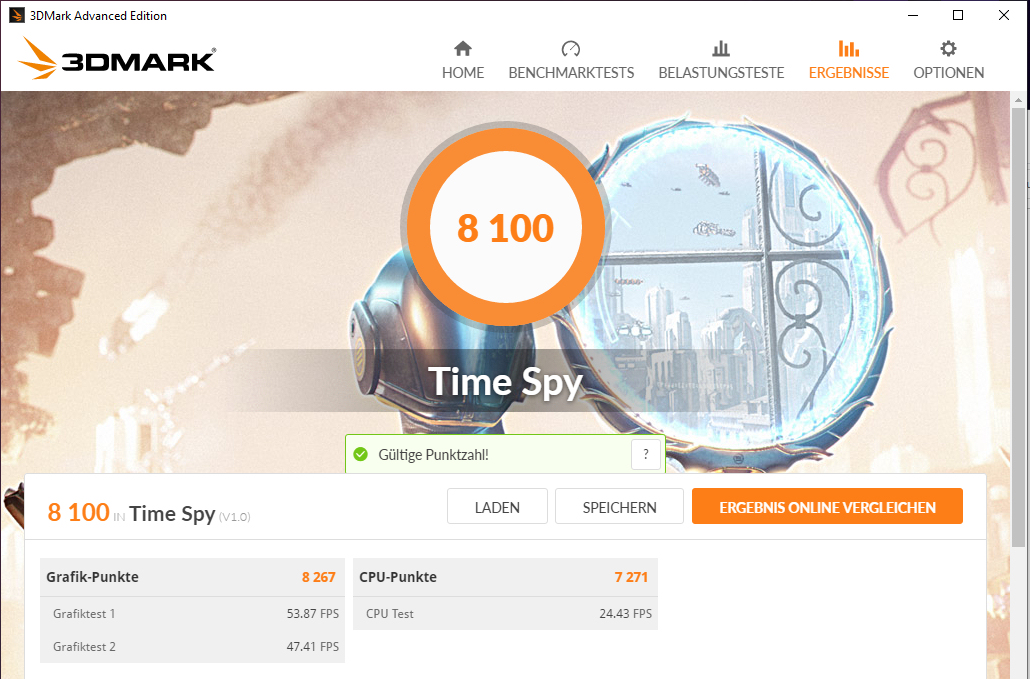
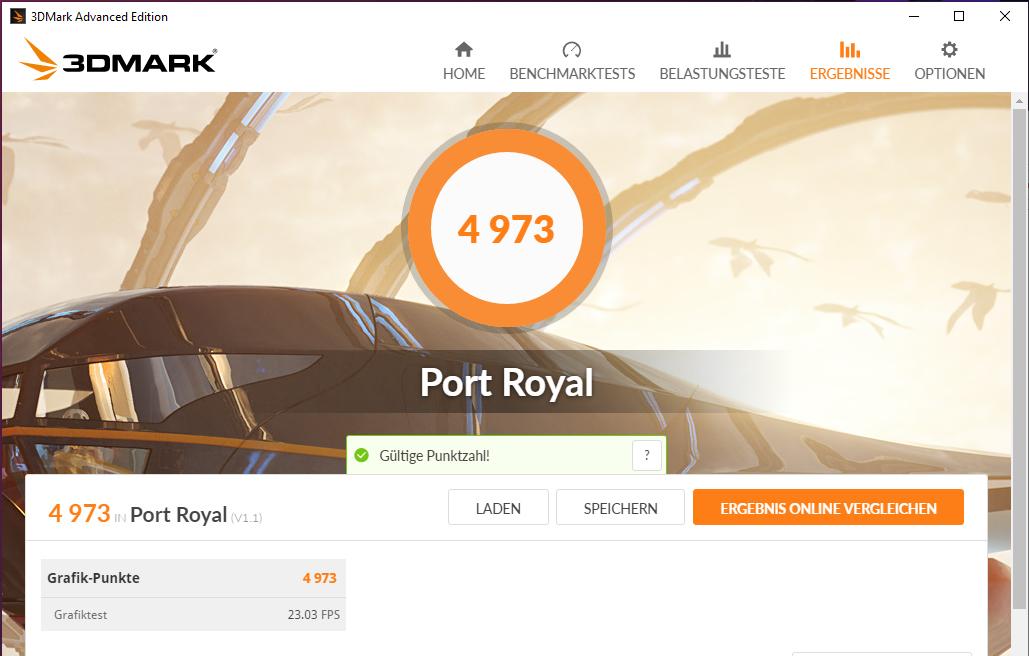
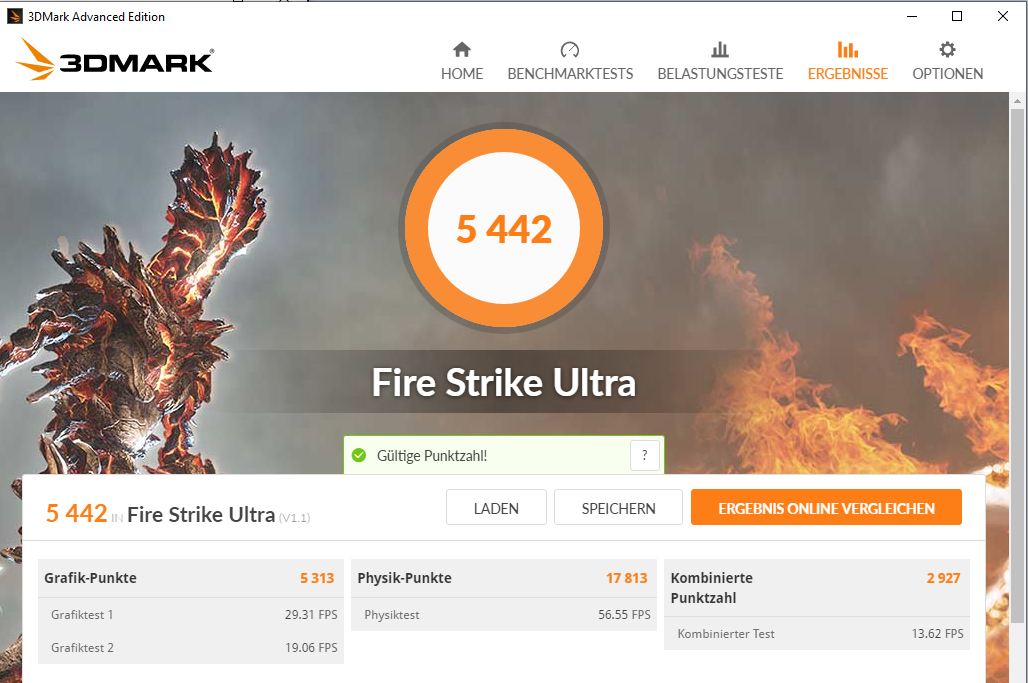
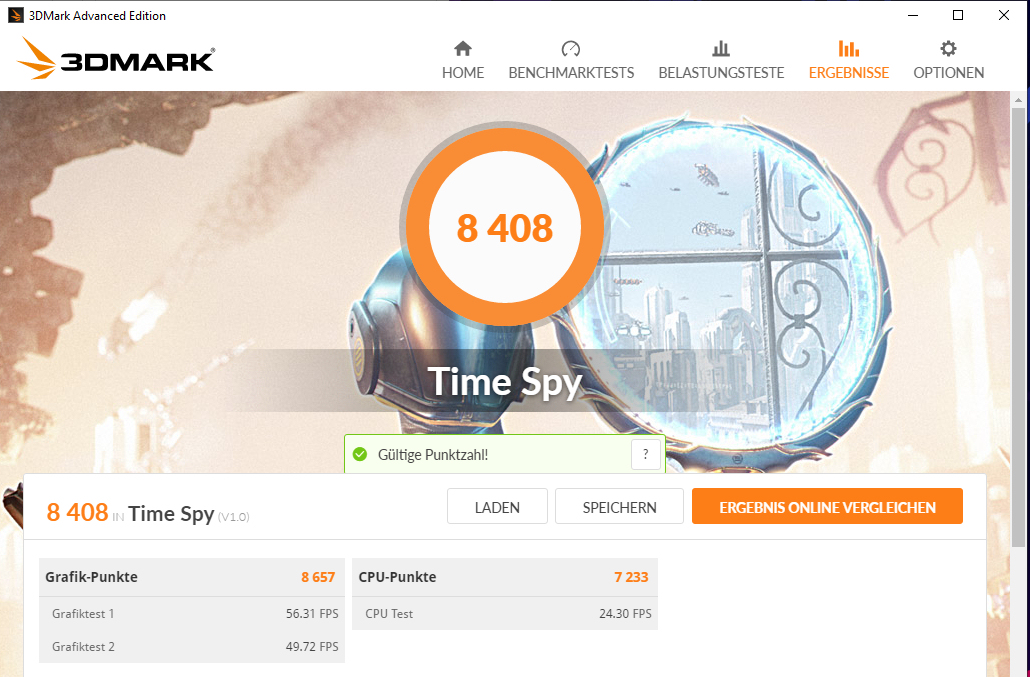
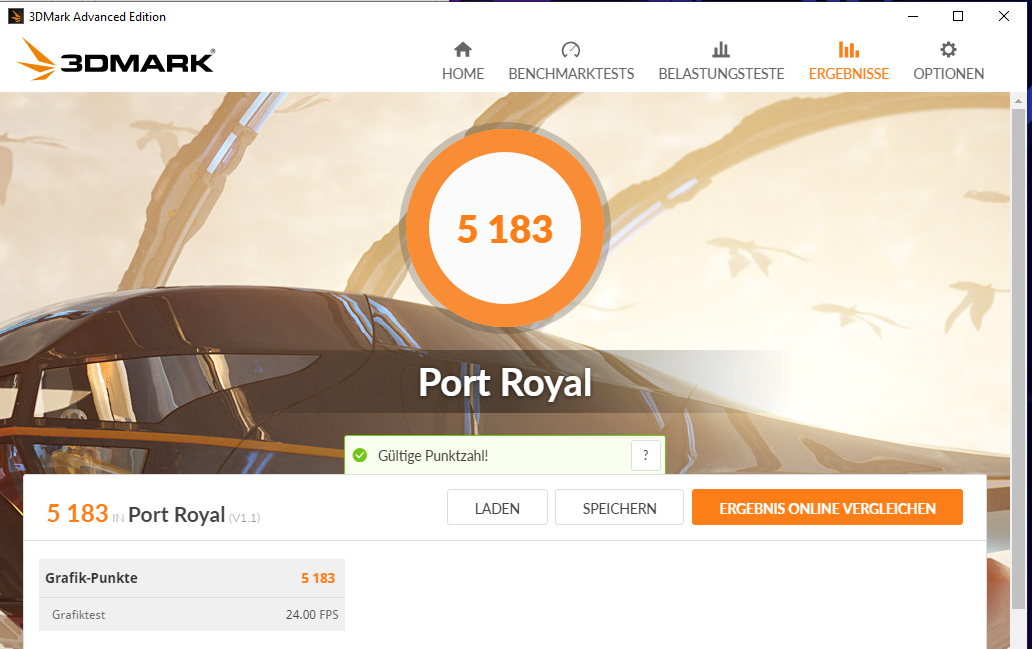

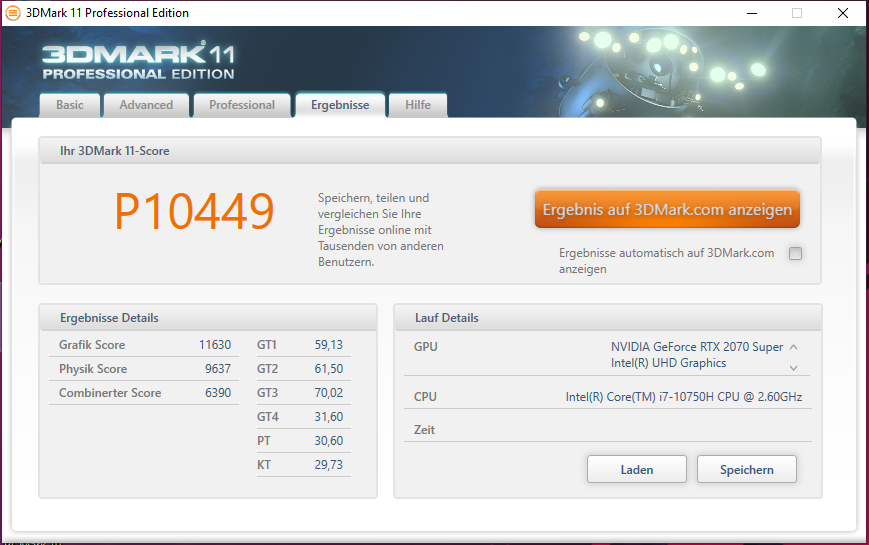
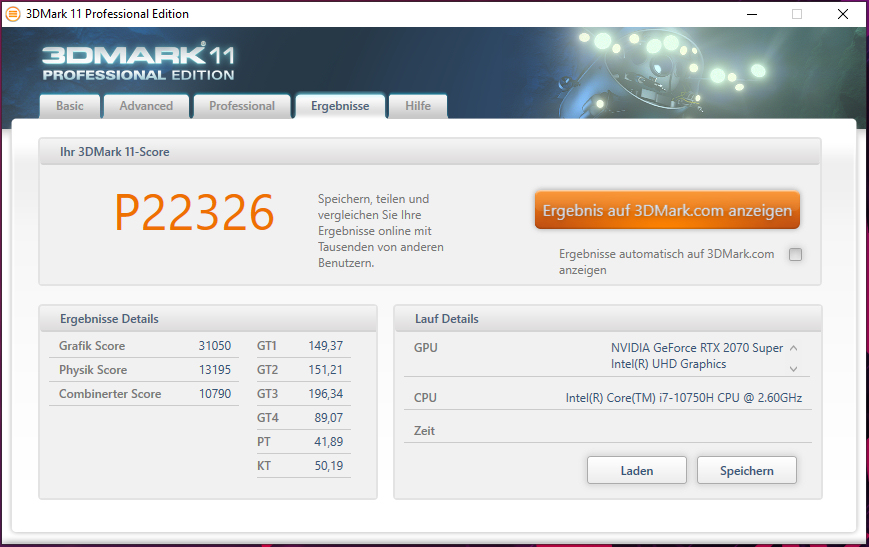
| 3DMark 11 Performance | 20961 puntos | |
| 3DMark Cloud Gate Standard Score | 39220 puntos | |
| 3DMark Fire Strike Score | 18270 puntos | |
| 3DMark Time Spy Score | 8100 puntos | |
ayuda | ||
El rendimiento de los juegos
No hay problemas en el frente de los juegos. La combinación CPU-GPU incorporada lleva todos los juegos modernos sin problemas a la pantalla mate con una resolución Full HD y una configuración de máxima calidad. Las resoluciones más allá de Full HD también son posibles cuando se conecta un monitor apropiado. El perfil "Turbo" de Armoury Crate produce un ligero aumento de la velocidad de fotogramas.
| The Witcher 3 - 1920x1080 Ultra Graphics & Postprocessing (HBAO+) | |
| Media de la clase Gaming (95 - 240, n=8, últimos 2 años) | |
| Asus Strix G17 G712LWS (Turbo) | |
| Asus Strix G17 G712LWS | |
| Medio NVIDIA GeForce RTX 2070 Super Mobile (76.3 - 94.6, n=8) | |
| Lenovo Legion Y740-17IRHg-81UJ001VGE | |
| MSI GL75 10SFR | |
| Acer Predator Helios 300 PH317-54-75G8 | |
| Schenker XMG Pro 17 PB71RD-G | |
| Asus ROG Strix G GL731GU-RB74 | |
| Horizon Zero Dawn - 1920x1080 Ultimate Quality | |
| Medio NVIDIA GeForce RTX 2070 Super Mobile (77 - 98, n=3) | |
| Asus Strix G17 G712LWS (Turbo) | |
| Asus Strix G17 G712LWS | |
| Acer Predator Helios 300 PH317-54-75G8 | |
| Doom Eternal - 1920x1080 Ultra Preset | |
| Medio NVIDIA GeForce RTX 2070 Super Mobile (151 - 190.4, n=5) | |
| Asus Strix G17 G712LWS (Turbo) | |
| Asus Strix G17 G712LWS | |
| MSI GL75 10SFR | |
| Acer Predator Helios 300 PH317-54-75G8 | |
| F1 2020 - 1920x1080 Ultra High Preset AA:T AF:16x | |
| Asus Strix G17 G712LWS (Turbo) | |
| Medio NVIDIA GeForce RTX 2070 Super Mobile (118 - 124, n=2) | |
| Asus Strix G17 G712LWS | |
| MSI GL75 10SFR | |
| Acer Predator Helios 300 PH317-54-75G8 | |
| Death Stranding - 1920x1080 Very High Preset | |
| Asus Strix G17 G712LWS (Turbo) | |
| Medio NVIDIA GeForce RTX 2070 Super Mobile (116.2 - 123.8, n=4) | |
| Asus Strix G17 G712LWS | |
| MSI GL75 10SFR | |
| Flight Simulator 2020 - 1920x1080 High-End AA:TAA AF:8x | |
| Medio NVIDIA GeForce RTX 2070 Super Mobile (48.8 - 53.3, n=2) | |
| Asus Strix G17 G712LWS | |
| Acer Predator Helios 300 PH317-54-75G8 | |
| Serious Sam 4 - 1920x1080 Ultra (DX12) AA:2xMS | |
| Medio NVIDIA GeForce RTX 2070 Super Mobile (71.1 - 82.1, n=4) | |
| Asus Strix G17 G712LWS | |
| Acer Predator Helios 300 PH317-54-75G8 | |
| Mafia Definitive Edition - 1920x1080 High Preset | |
| Medio NVIDIA GeForce RTX 2070 Super Mobile (92 - 96.6, n=2) | |
| Asus Strix G17 G712LWS | |
| Acer Predator Helios 300 PH317-54-75G8 | |
Para verificar si las frecuencias de cuadro se mantienen en gran medida constantes durante un período de tiempo prolongado, dejamos que el juego The Witcher 3 se ejecute durante unos 60 minutos con una resolución Full HD y una configuración de máxima calidad. El personaje no se mueve. No se encontró una caída en la frecuencia de fotogramas.
| bajo | medio | alto | ultra | |
|---|---|---|---|---|
| BioShock Infinite (2013) | 371.8 | 308.3 | 299 | 173.4 |
| The Witcher 3 (2015) | 296.3 | 236.7 | 154.3 | 87.8 |
| Shadow of the Tomb Raider (2018) | 121 | 110 | 107 | 100 |
| Doom Eternal (2020) | 219.1 | 165.7 | 158.5 | 155.4 |
| Gears Tactics (2020) | 249.1 | 172.4 | 122.2 | 90 |
| F1 2020 (2020) | 227 | 168 | 147 | 118 |
| Death Stranding (2020) | 145 | 128.2 | 117.8 | 116.2 |
| Horizon Zero Dawn (2020) | 139 | 107 | 94 | 77 |
| Flight Simulator 2020 (2020) | 66.6 | 58 | 48.8 | 37.8 |
| Serious Sam 4 (2020) | 124 | 94 | 81.6 | 71.1 |
| Mafia Definitive Edition (2020) | 123.7 | 95.2 | 92 | |
| Star Wars Squadrons (2020) | 263.1 | 224.6 | 211.5 | 202.4 |
Emisiones - El Strix se pone ruidoso bajo carga
Emisiones de ruido
Los ventiladores funcionan principalmente a bajas velocidades en el uso en reposo. El nivel de ruido resultante es aceptable aquí. Sin embargo, los ventiladores aparecen bajo carga. Por consiguiente, registramos un nivel de presión sonora máximo de 53 dB(A) (prueba de esfuerzo). Jugar sin auriculares no es divertido.
Ruido
| Ocioso |
| 32 / 34 / 37 dB(A) |
| Carga |
| 51 / 53 dB(A) |
 | ||
30 dB silencioso 40 dB(A) audible 50 dB(A) ruidosamente alto |
||
min: | ||
| Asus Strix G17 G712LWS i7-10750H, GeForce RTX 2070 Super Mobile | Asus ROG Strix G GL731GU-RB74 i7-9750H, GeForce GTX 1660 Ti Mobile | Schenker XMG Pro 17 PB71RD-G i7-9750H, GeForce RTX 2060 Mobile | MSI GL75 10SFR i7-10750H, GeForce RTX 2070 Mobile | Lenovo Legion Y740-17IRHg-81UJ001VGE i7-9750H, GeForce RTX 2080 Max-Q | Acer Predator Helios 300 PH317-54-75G8 i7-10750H, GeForce RTX 2060 Mobile | |
|---|---|---|---|---|---|---|
| Noise | -0% | -3% | -2% | 11% | 7% | |
| apagado / medio ambiente * (dB) | 25 | 28.2 -13% | 30 -20% | 30.1 -20% | 30.3 -21% | 24 4% |
| Idle Minimum * (dB) | 32 | 31.8 1% | 30 6% | 32.2 -1% | 30.3 5% | 25 22% |
| Idle Average * (dB) | 34 | 32 6% | 32 6% | 32.2 5% | 30.3 11% | 30 12% |
| Idle Maximum * (dB) | 37 | 40.6 -10% | 39 -5% | 32.2 13% | 30.5 18% | 37 -0% |
| Load Average * (dB) | 51 | 48 6% | 51 -0% | 52.8 -4% | 40.8 20% | 48 6% |
| Witcher 3 ultra * (dB) | 50 | 48 4% | 54 -8% | 53.8 -8% | 40.5 19% | 50 -0% |
| Load Maximum * (dB) | 53 | 51.5 3% | 54 -2% | 53.2 -0% | 40.8 23% | 52 2% |
* ... más pequeño es mejor
Temperatura
Nuestra prueba de esfuerzo (Prime95 y FurMark se ejecutan durante al menos una hora) es procesada por la CPU y la GPU a 2,5 GHz y 1.470 MHz, respectivamente. La prueba de estrés representa un escenario extremo que no ocurre en la vida cotidiana. Con esta prueba, comprobamos si el sistema se mantiene estable incluso a plena carga.
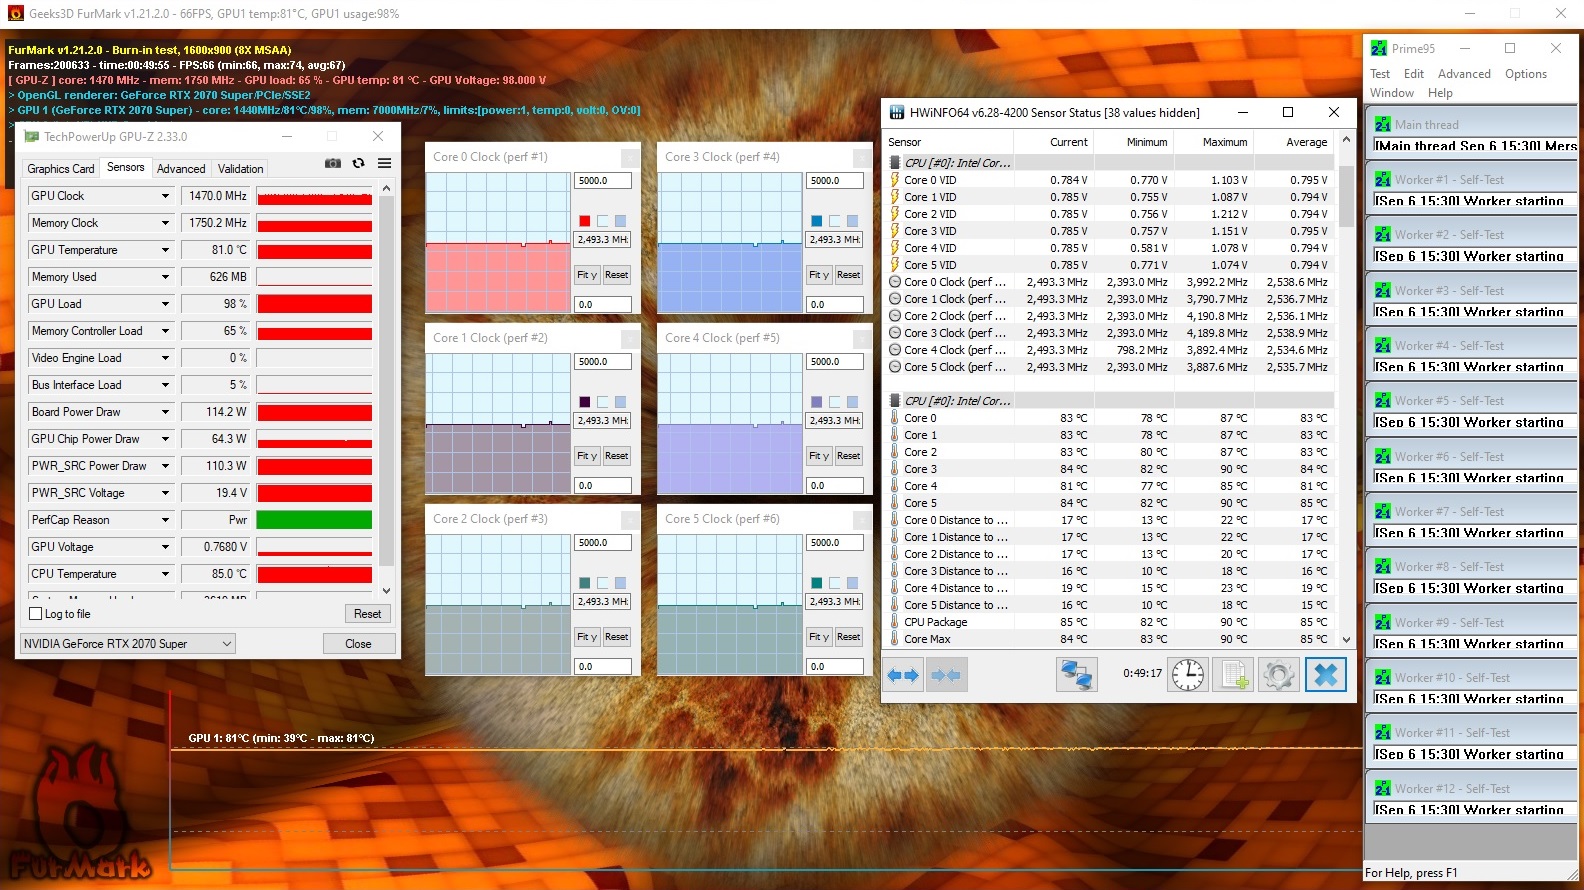
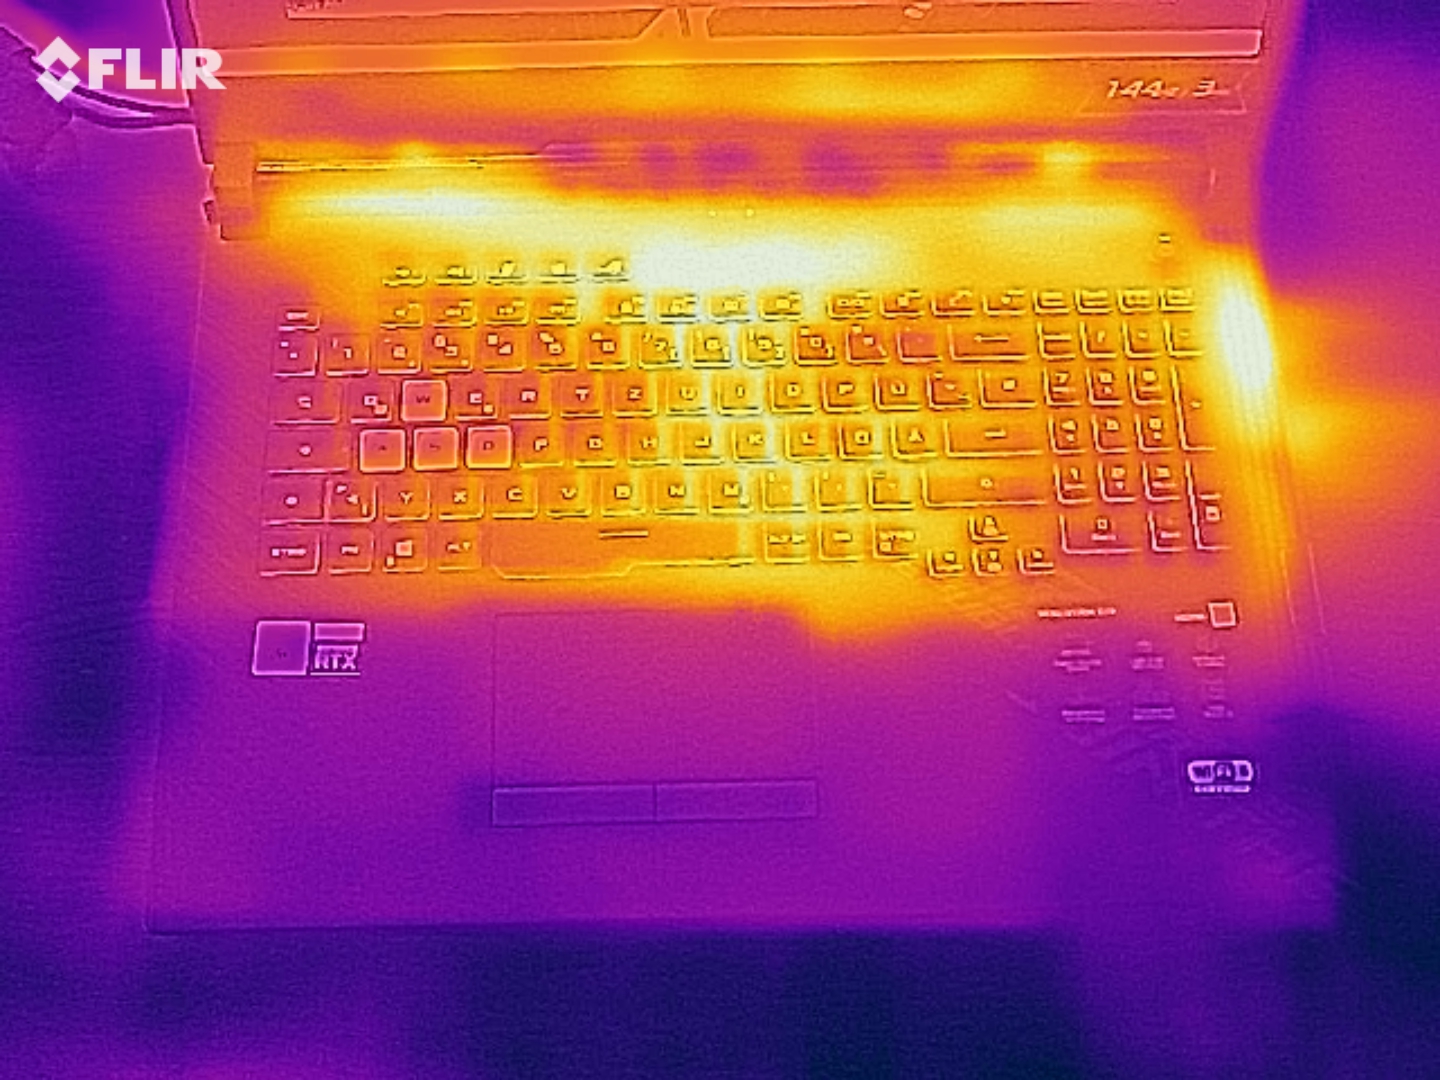
El G17 se calienta notablemente pero no excesivamente. Durante la prueba de estrés, registramos temperaturas superiores a los 50 °C en dos puntos de medición. El desarrollo de calor es ligeramente menor cuando realizamos nuestra prueba de The Witcher 3. Además, los valores están en el rango verde en el uso diario.
(-) La temperatura máxima en la parte superior es de 53 °C / 127 F, frente a la media de 40.4 °C / 105 F, que oscila entre 21.2 y 68.8 °C para la clase Gaming.
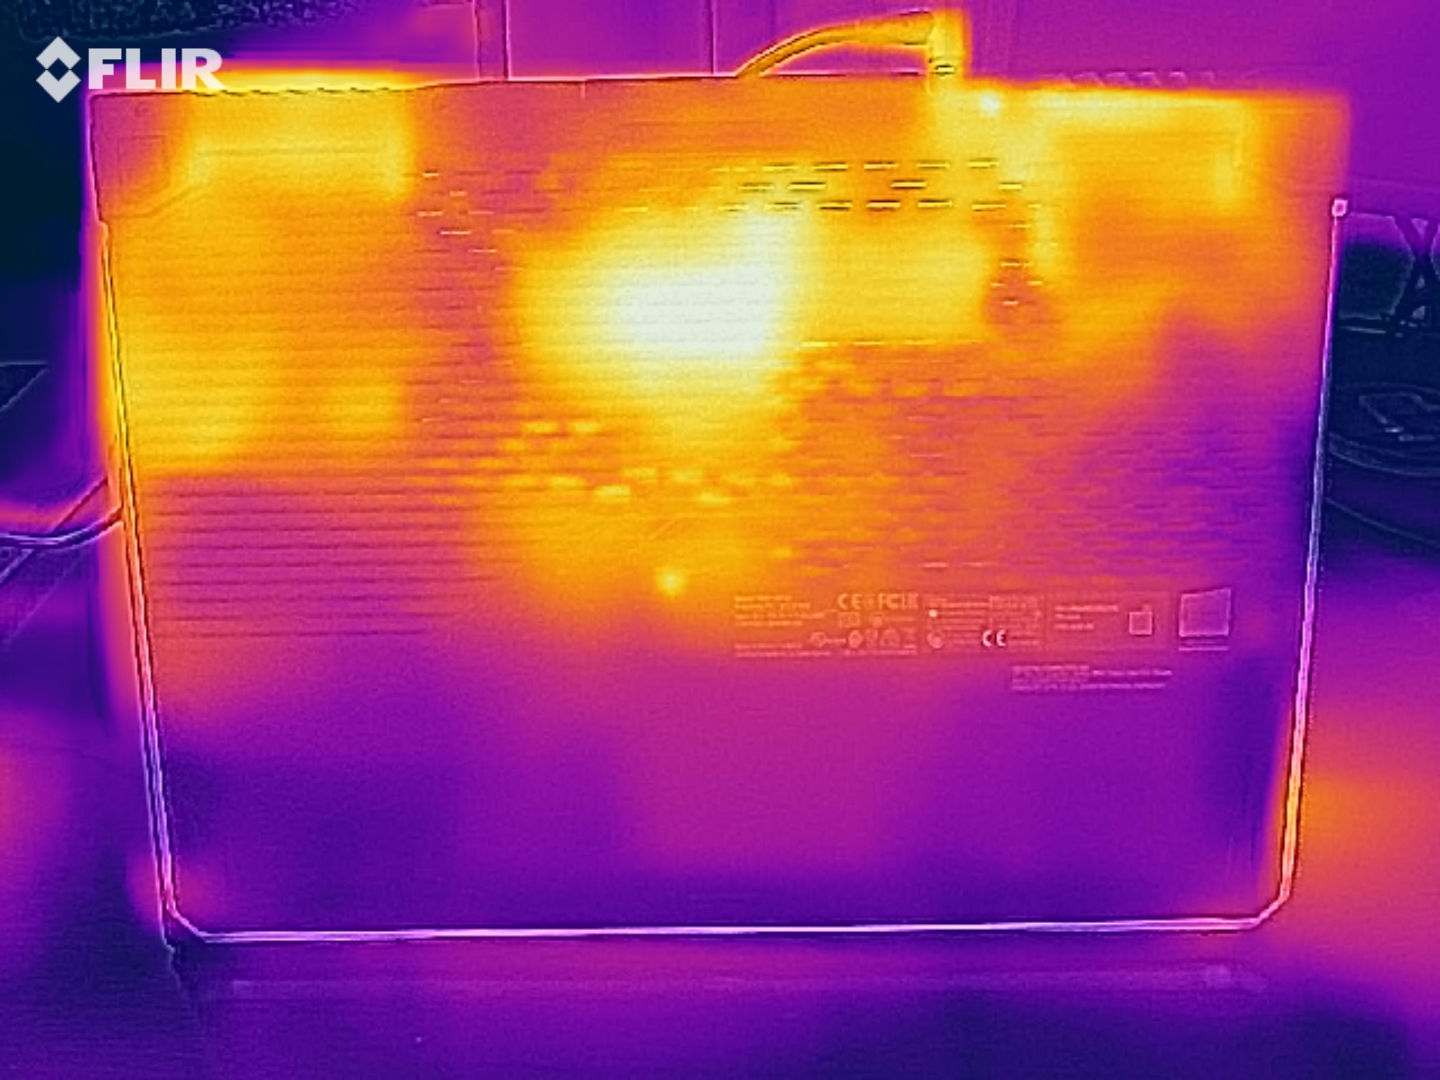
(-) El fondo se calienta hasta un máximo de 56 °C / 133 F, frente a la media de 43.2 °C / 110 F
(+) En reposo, la temperatura media de la parte superior es de 27.7 °C / 82# F, frente a la media del dispositivo de 33.9 °C / 93 F.
(-) Jugando a The Witcher 3, la temperatura media de la parte superior es de 39.6 °C / 103 F, frente a la media del dispositivo de 33.9 °C / 93 F.
(+) El reposamanos y el panel táctil están a una temperatura inferior a la de la piel, con un máximo de 28 °C / 82.4 F y, por tanto, son fríos al tacto.
(±) La temperatura media de la zona del reposamanos de dispositivos similares fue de 28.8 °C / 83.8 F (+0.8 °C / 1.4 F).
| Asus Strix G17 G712LWS i7-10750H, GeForce RTX 2070 Super Mobile | Asus ROG Strix G GL731GU-RB74 i7-9750H, GeForce GTX 1660 Ti Mobile | Schenker XMG Pro 17 PB71RD-G i7-9750H, GeForce RTX 2060 Mobile | MSI GL75 10SFR i7-10750H, GeForce RTX 2070 Mobile | Lenovo Legion Y740-17IRHg-81UJ001VGE i7-9750H, GeForce RTX 2080 Max-Q | Acer Predator Helios 300 PH317-54-75G8 i7-10750H, GeForce RTX 2060 Mobile | |
|---|---|---|---|---|---|---|
| Heat | 4% | 3% | 12% | 7% | -2% | |
| Maximum Upper Side * (°C) | 53 | 44.6 16% | 47 11% | 44 17% | 40.7 23% | 53 -0% |
| Maximum Bottom * (°C) | 56 | 51.6 8% | 48 14% | 42.5 24% | 42.2 25% | 59 -5% |
| Idle Upper Side * (°C) | 29 | 31.6 -9% | 30 -3% | 29.1 -0% | 31.9 -10% | 29 -0% |
| Idle Bottom * (°C) | 31 | 31.4 -1% | 34 -10% | 29.5 5% | 33.9 -9% | 32 -3% |
* ... más pequeño es mejor
Altavoces
Asus Strix G17 G712LWS análisis de audio
(±) | la sonoridad del altavoz es media pero buena (81 dB)
Graves 100 - 315 Hz
(±) | lubina reducida - en promedio 9.8% inferior a la mediana
(±) | la linealidad de los graves es media (8.3% delta a frecuencia anterior)
Medios 400 - 2000 Hz
(±) | medias más altas - de media 5.5% más altas que la mediana
(+) | los medios son lineales (5.8% delta a la frecuencia anterior)
Altos 2 - 16 kHz
(+) | máximos equilibrados - a sólo 2.4% de la mediana
(+) | los máximos son lineales (3.4% delta a la frecuencia anterior)
Total 100 - 16.000 Hz
(+) | el sonido global es lineal (12.9% de diferencia con la mediana)
En comparación con la misma clase
» 17% de todos los dispositivos probados de esta clase eran mejores, 4% similares, 79% peores
» El mejor tuvo un delta de 6%, la media fue 18%, el peor fue ###max##%
En comparación con todos los dispositivos probados
» 12% de todos los dispositivos probados eran mejores, 3% similares, 85% peores
» El mejor tuvo un delta de 4%, la media fue 24%, el peor fue ###max##%
Gestión de la energía - La duración de la batería del G712LWS está en orden
El consumo de energía
Registramos un consumo de energía máximo de 25 vatios en uso inactivo. La prueba de esfuerzo permite que la demanda aumente hasta 230 vatios. Durante la ejecución de nuestra prueba de The Witcher 3, medimos un consumo de energía de 186 vatios en promedio. La salida del adaptador de corriente es de 230 vatios.
| Off / Standby | |
| Ocioso | |
| Carga |
|
Clave:
min: | |
| Asus Strix G17 G712LWS i7-10750H, GeForce RTX 2070 Super Mobile | Asus ROG Strix G GL731GU-RB74 i7-9750H, GeForce GTX 1660 Ti Mobile | Schenker XMG Pro 17 PB71RD-G i7-9750H, GeForce RTX 2060 Mobile | MSI GL75 10SFR i7-10750H, GeForce RTX 2070 Mobile | Lenovo Legion Y740-17IRHg-81UJ001VGE i7-9750H, GeForce RTX 2080 Max-Q | Acer Predator Helios 300 PH317-54-75G8 i7-10750H, GeForce RTX 2060 Mobile | |
|---|---|---|---|---|---|---|
| Power Consumption | -18% | 1% | -2% | -20% | 25% | |
| Idle Minimum * (Watt) | 10 | 13.6 -36% | 11 -10% | 12 -20% | 15.7 -57% | 6 40% |
| Idle Average * (Watt) | 14 | 26.2 -87% | 18 -29% | 16.6 -19% | 26.3 -88% | 11 21% |
| Idle Maximum * (Watt) | 25 | 35 -40% | 28 -12% | 18 28% | 28 -12% | 19 24% |
| Load Average * (Watt) | 134 | 113.6 15% | 99 26% | 130 3% | 136 -1% | 96 28% |
| Witcher 3 ultra * (Watt) | 186 | 134.1 28% | 146 22% | 203 -9% | 160 14% | 144 23% |
| Load Maximum * (Watt) | 230 | 200.2 13% | 210 9% | 224 3% | 177 23% | 197 14% |
* ... más pequeño es mejor
Duración de la batería
El Strix ofrece una vida de batería muy decente. El 17.3 pulgadas completa nuestra prueba WLAN (acceso a sitios web a través de un guión) y prueba de video (el cortometraje Big Buck Bunny (codificación H.264, Full HD) corriendo en un bucle) después de 5:30 horas y 7:06 horas, respectivamente.
| Asus Strix G17 G712LWS i7-10750H, GeForce RTX 2070 Super Mobile, 66 Wh | Asus ROG Strix G GL731GU-RB74 i7-9750H, GeForce GTX 1660 Ti Mobile, 66 Wh | Schenker XMG Pro 17 PB71RD-G i7-9750H, GeForce RTX 2060 Mobile, 62 Wh | MSI GL75 10SFR i7-10750H, GeForce RTX 2070 Mobile, 51 Wh | Lenovo Legion Y740-17IRHg-81UJ001VGE i7-9750H, GeForce RTX 2080 Max-Q, 76 Wh | Acer Predator Helios 300 PH317-54-75G8 i7-10750H, GeForce RTX 2060 Mobile, 59 Wh | |
|---|---|---|---|---|---|---|
| Duración de Batería | -5% | -29% | -34% | -47% | 1% | |
| Reader / Idle (h) | 9.1 | 8.6 -5% | 5.2 -43% | 6.4 -30% | 3.8 -58% | 8.2 -10% |
| H.264 (h) | 7.1 | 5.2 -27% | 2.8 -61% | 5.9 -17% | ||
| WiFi v1.3 (h) | 5.5 | 4.9 -11% | 4.1 -25% | 3.9 -29% | 3 -45% | 5.1 -7% |
| Load (h) | 1.6 | 1.6 0% | 1.3 -19% | 0.8 -50% | 1.2 -25% | 2.2 38% |
Pro
Contra
Veredicto
El potente hardware del Strix G17 lleva a la pantalla todos los últimos juegos de ordenador sin problemas. No tendrás que comprometerte en lo que se refiere a la resolución y el nivel de calidad.
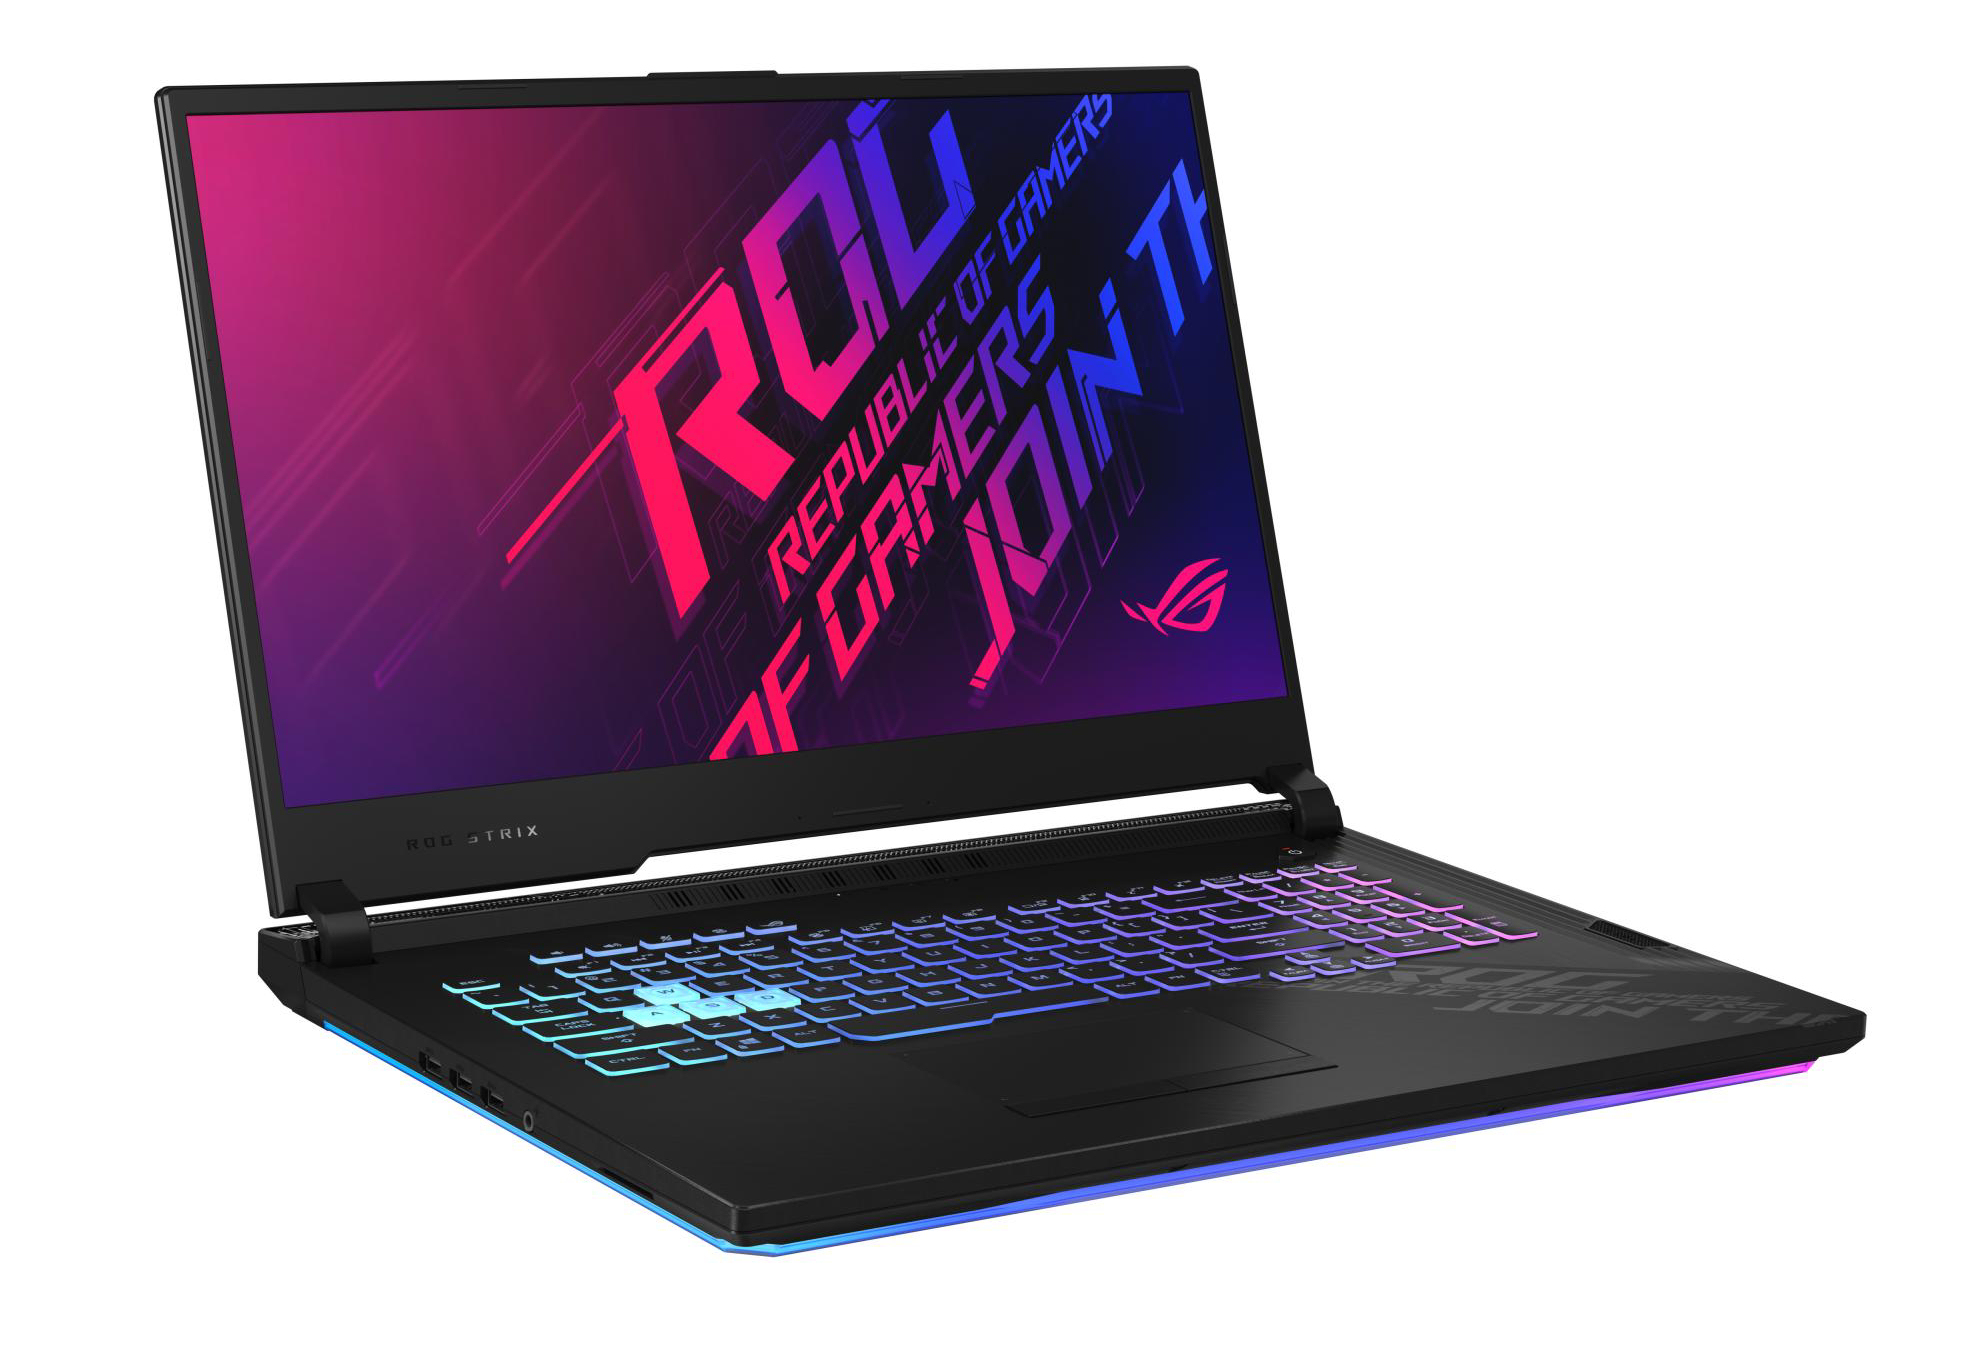
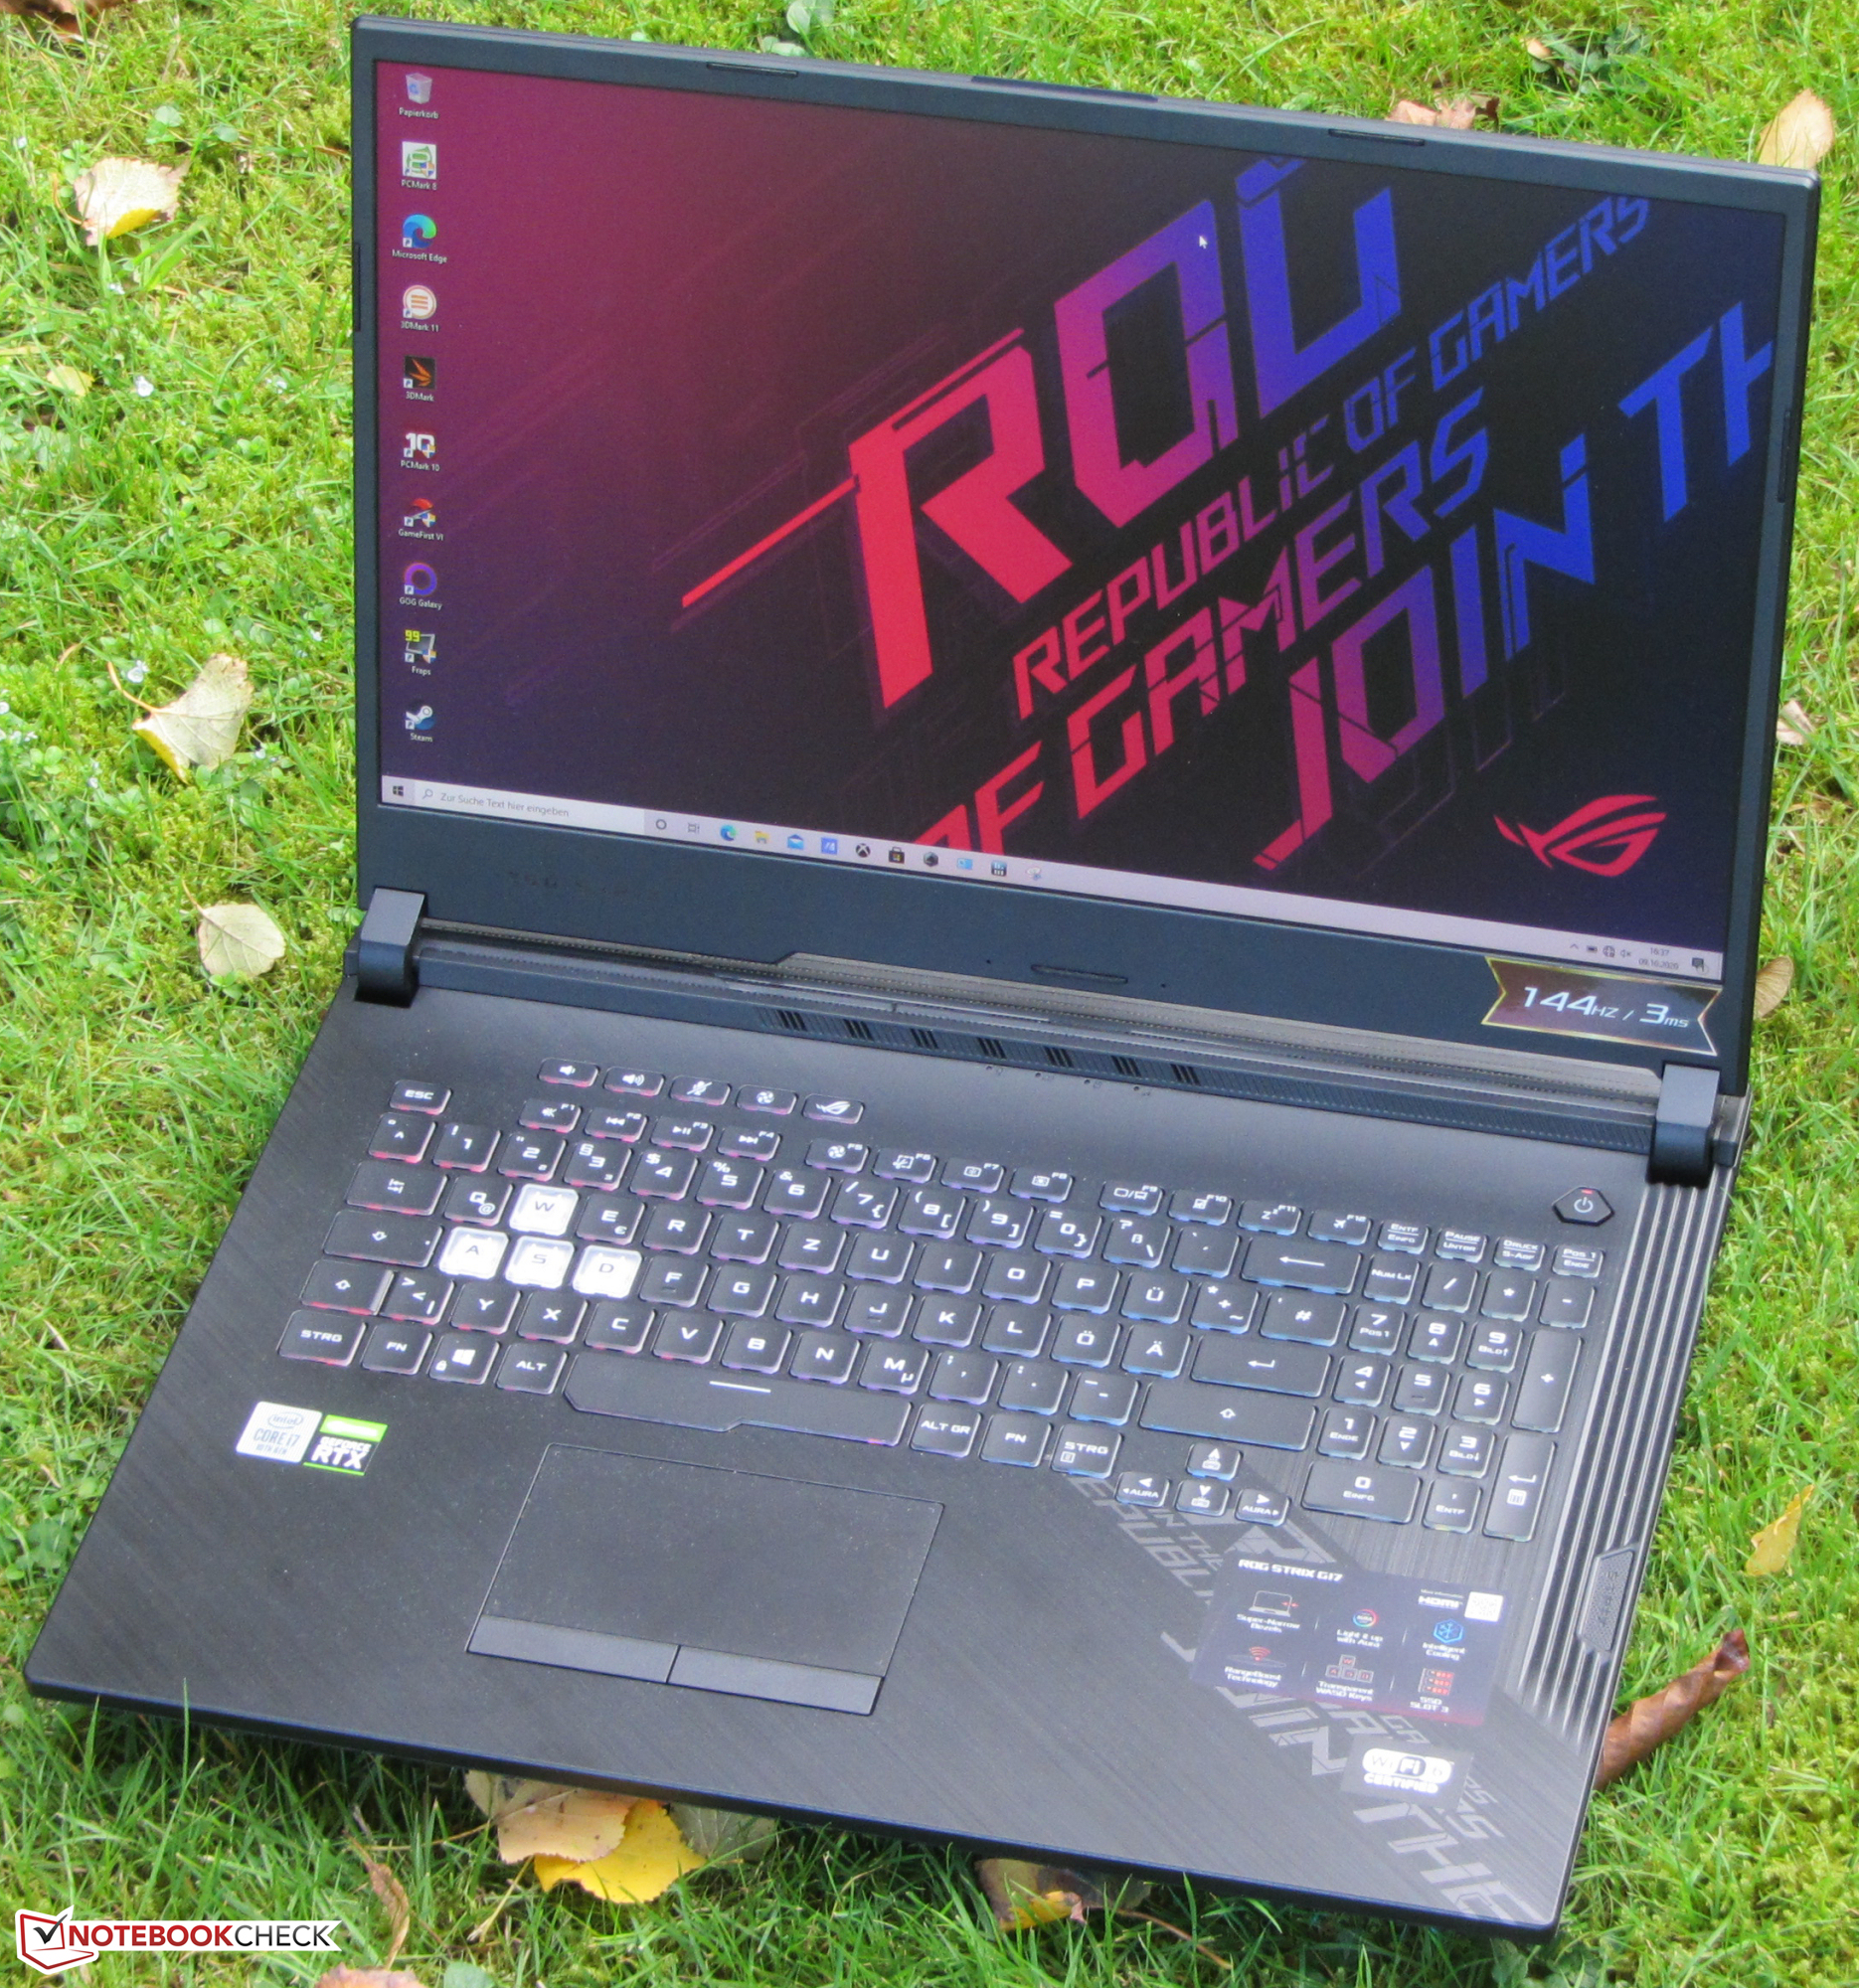
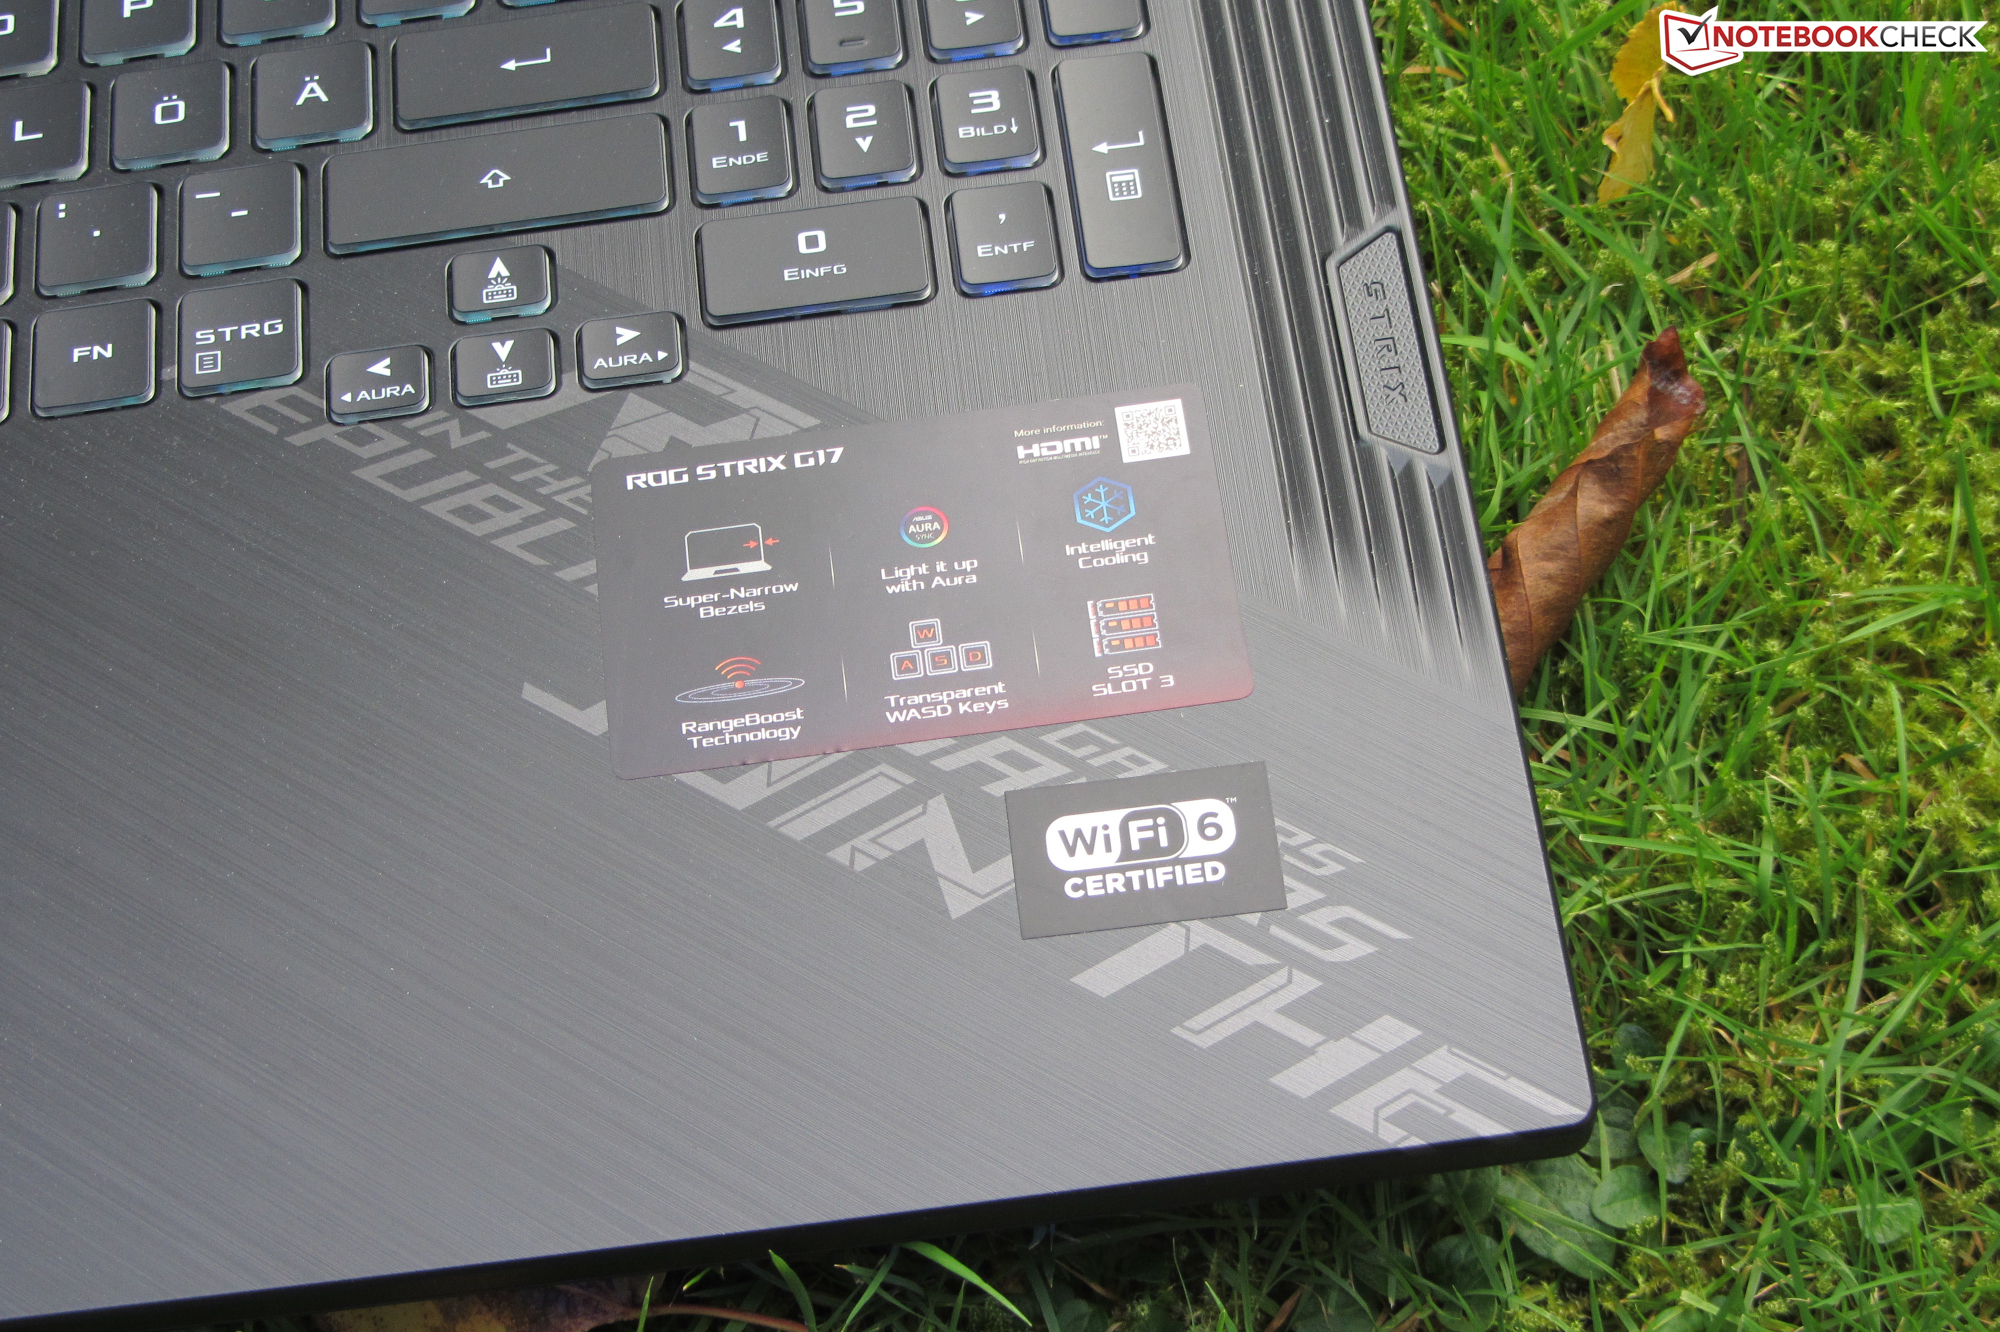
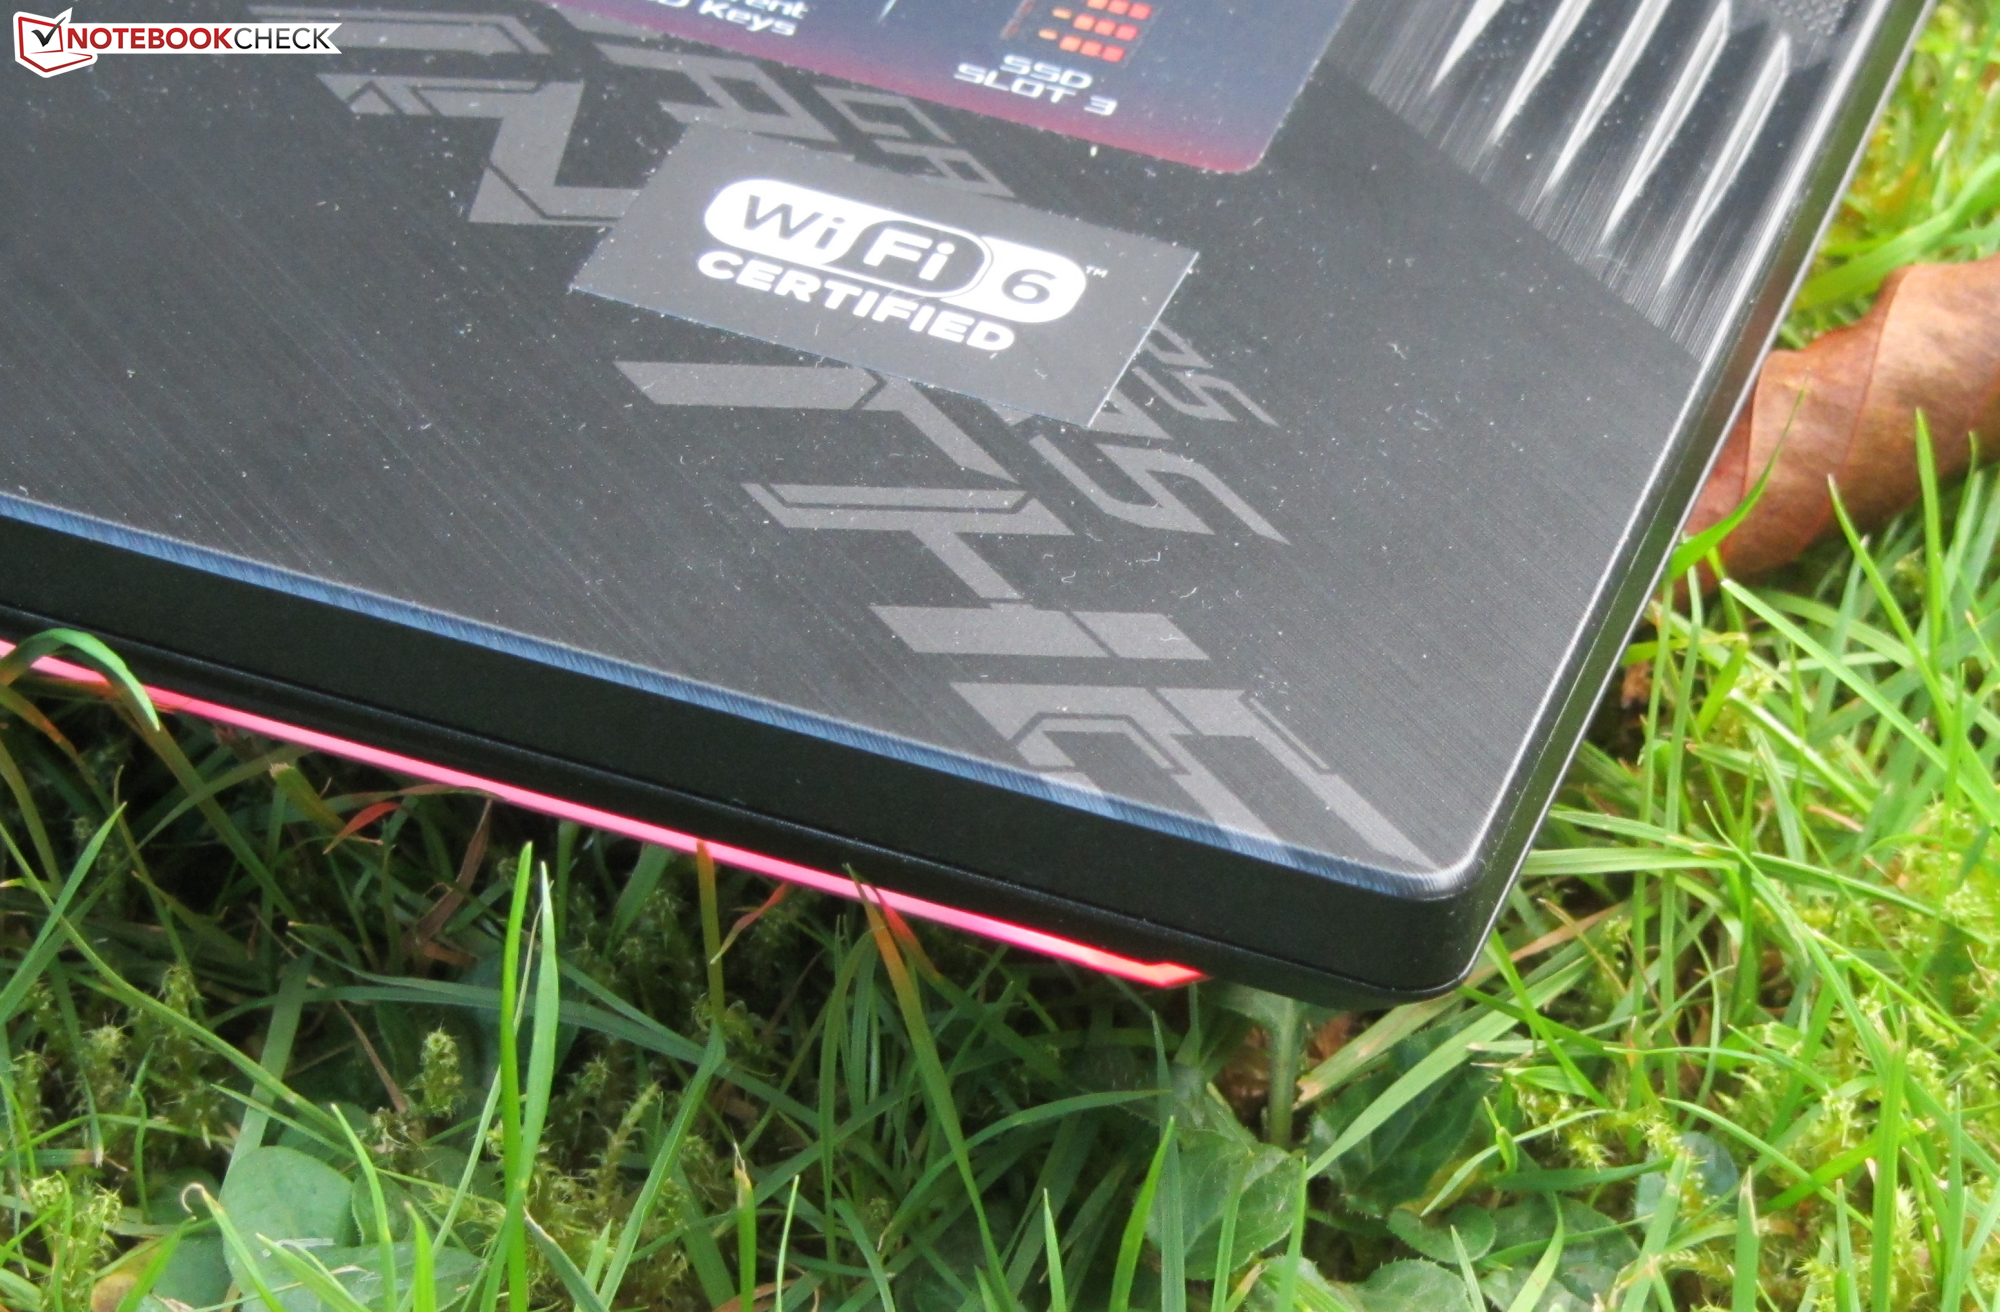
El atractivo del portátil es la barra de LED que se extiende a lo largo de tres lados de la cubierta inferior. El esquema de colores puede ser ajustado individualmente a su gusto.
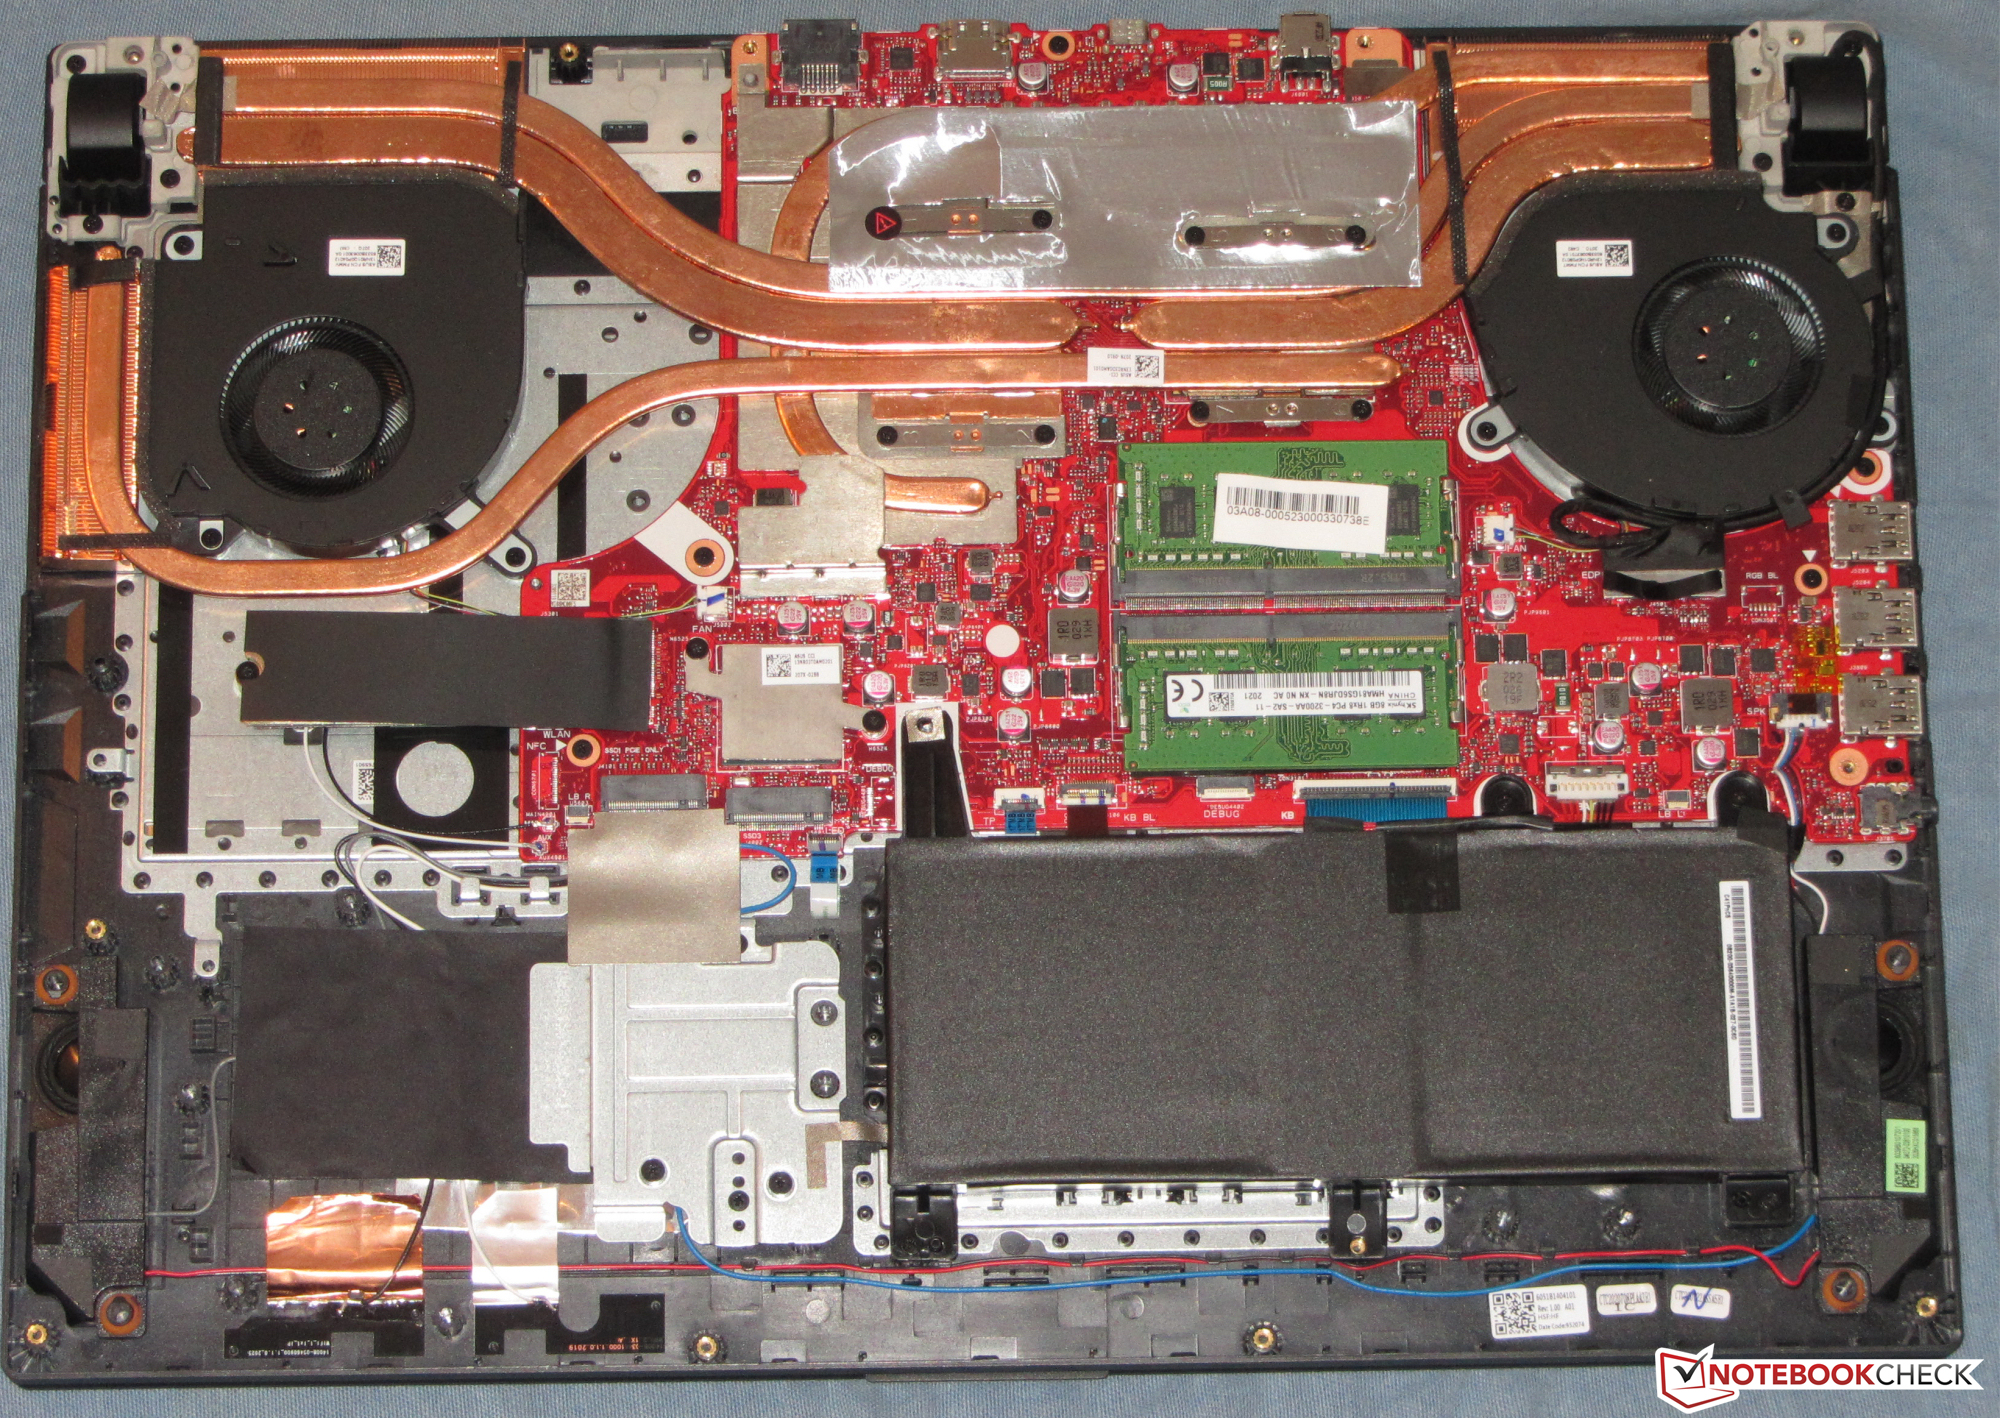
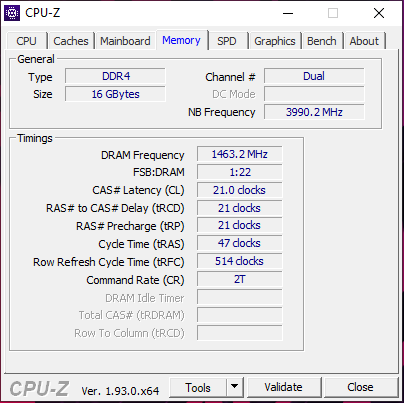
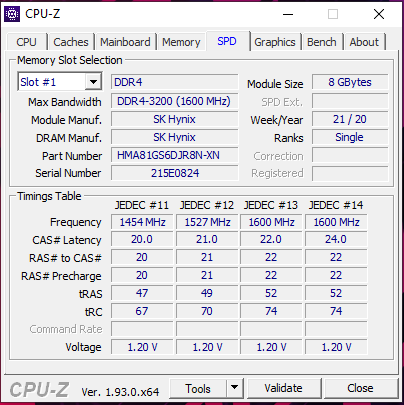
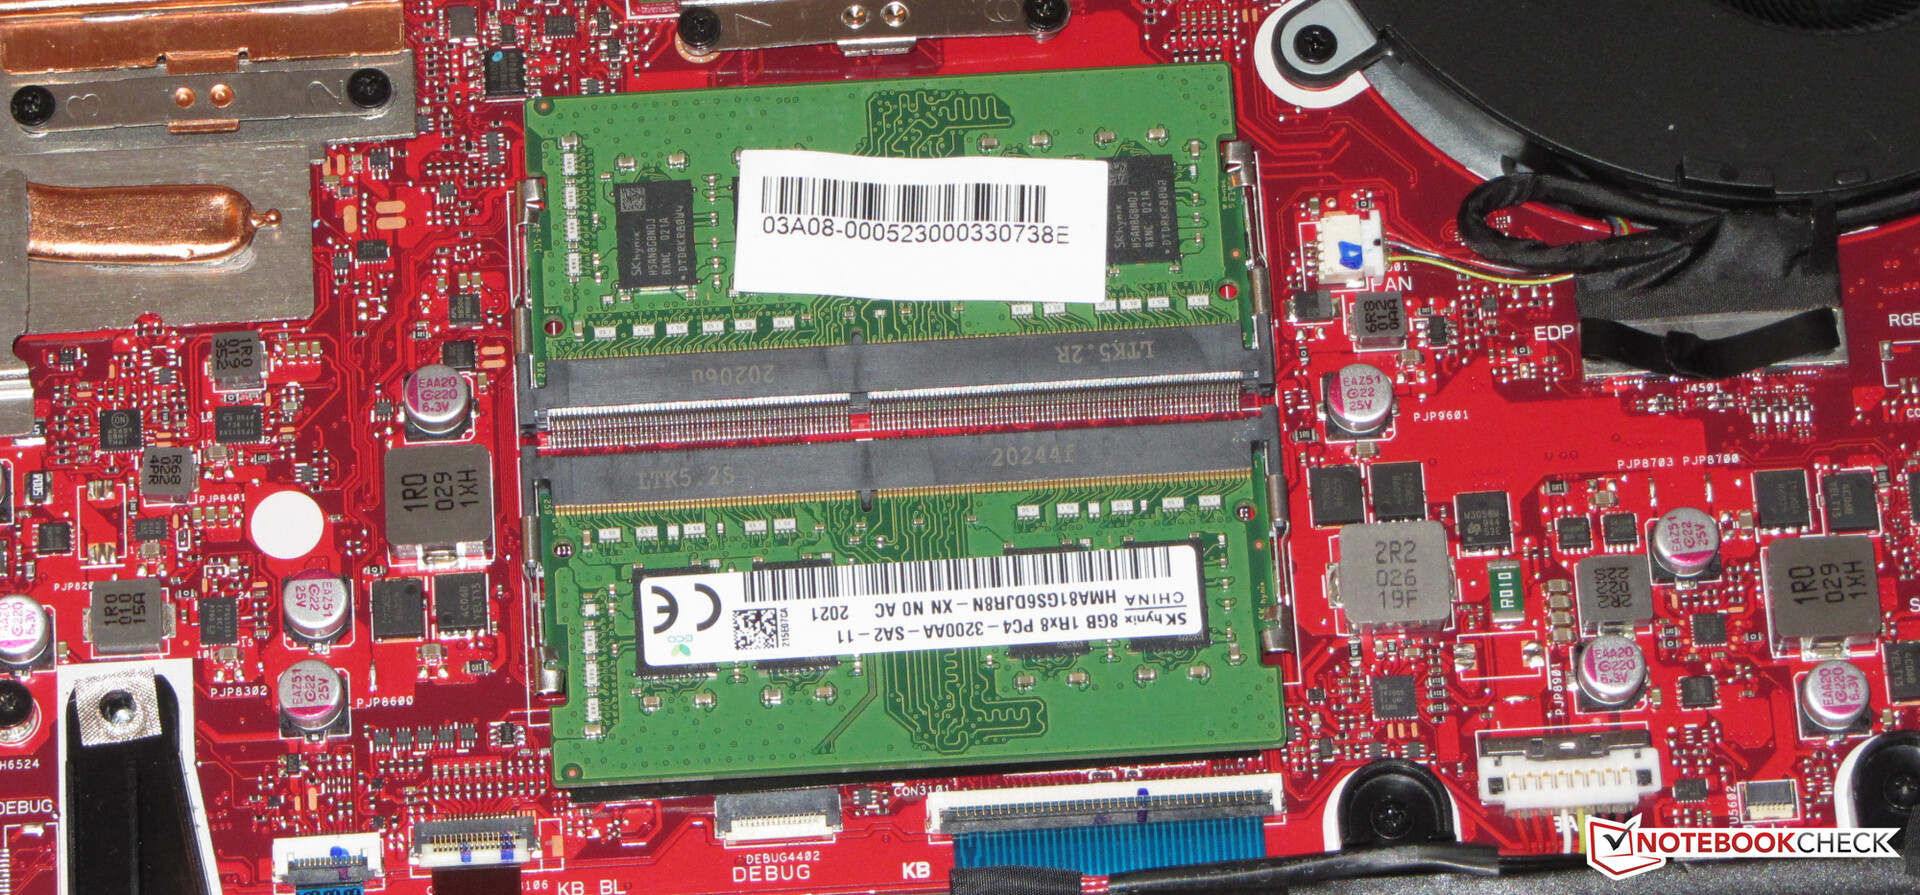
La capacidad de almacenamiento (1 TB) puede ser ampliada. Además del actual SSD NVMe, hay espacio para dos modelos M.2 más. Se admite el RAID 0. La memoria (2x 8 GB, modo de doble canal) también se puede ampliar. Sin embargo, según el sitio web de Asus, 32 GB es el límite. Muchos competidores soportan hasta 64 GB.
Los procedimientos de mantenimiento y actualización requieren la eliminación de la cubierta inferior. Esto es factible en principio. Sin embargo, la cubierta inferior está conectada a la placa madre con dos cables de cinta, por lo que hay que proceder con cautela. Los cables se pueden aflojar y volver a conectar con un poco de habilidad.
La pantalla Full HD (IPS, 144 Hz) gana puntos con una superficie mate, ángulos de visión estables, suficiente brillo, buen contraste, tiempos de respuesta rápidos y una reproducción del color muy decente.
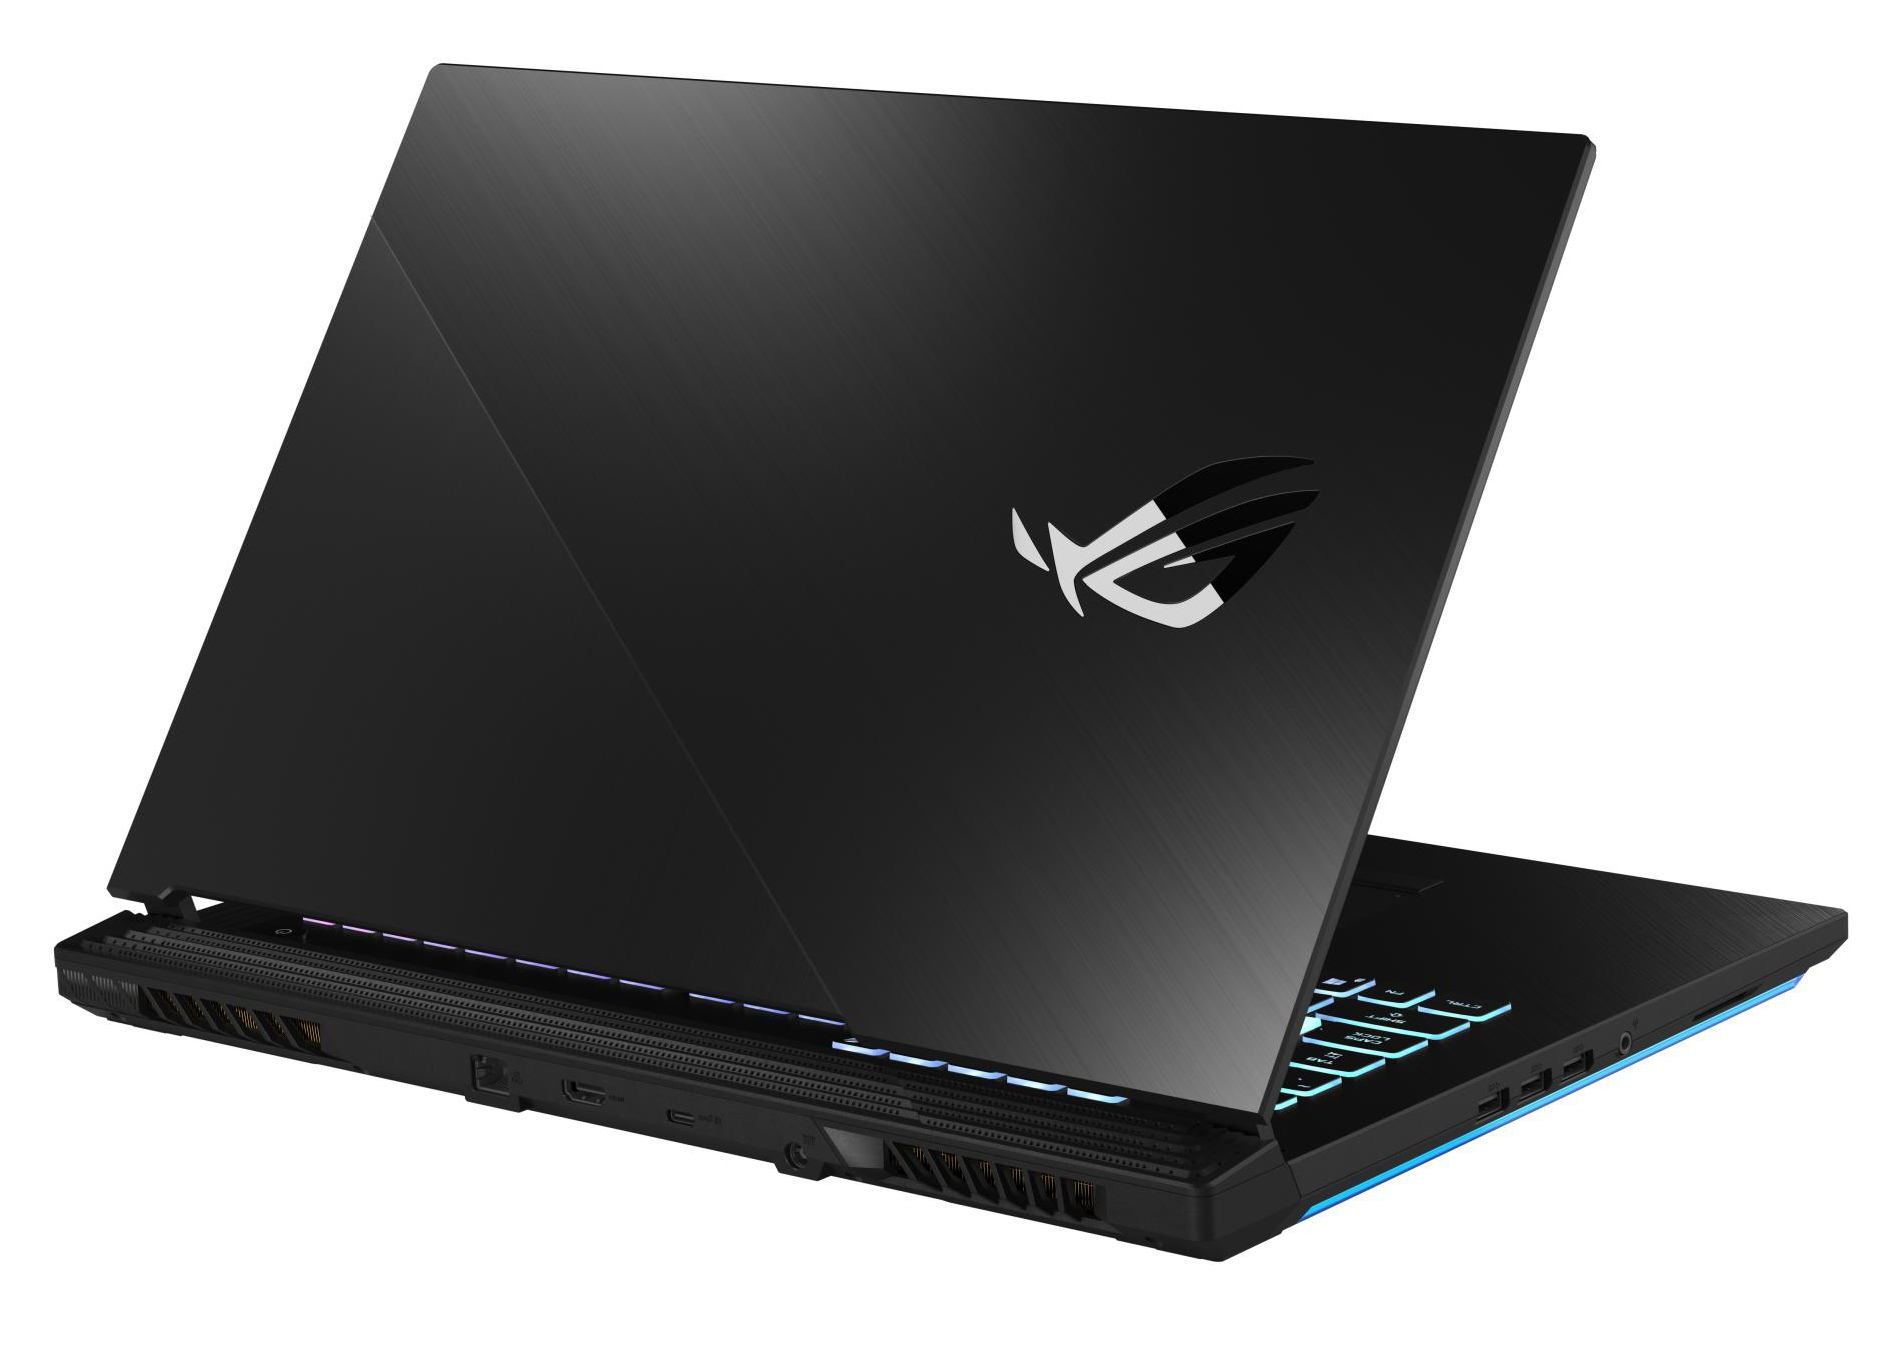
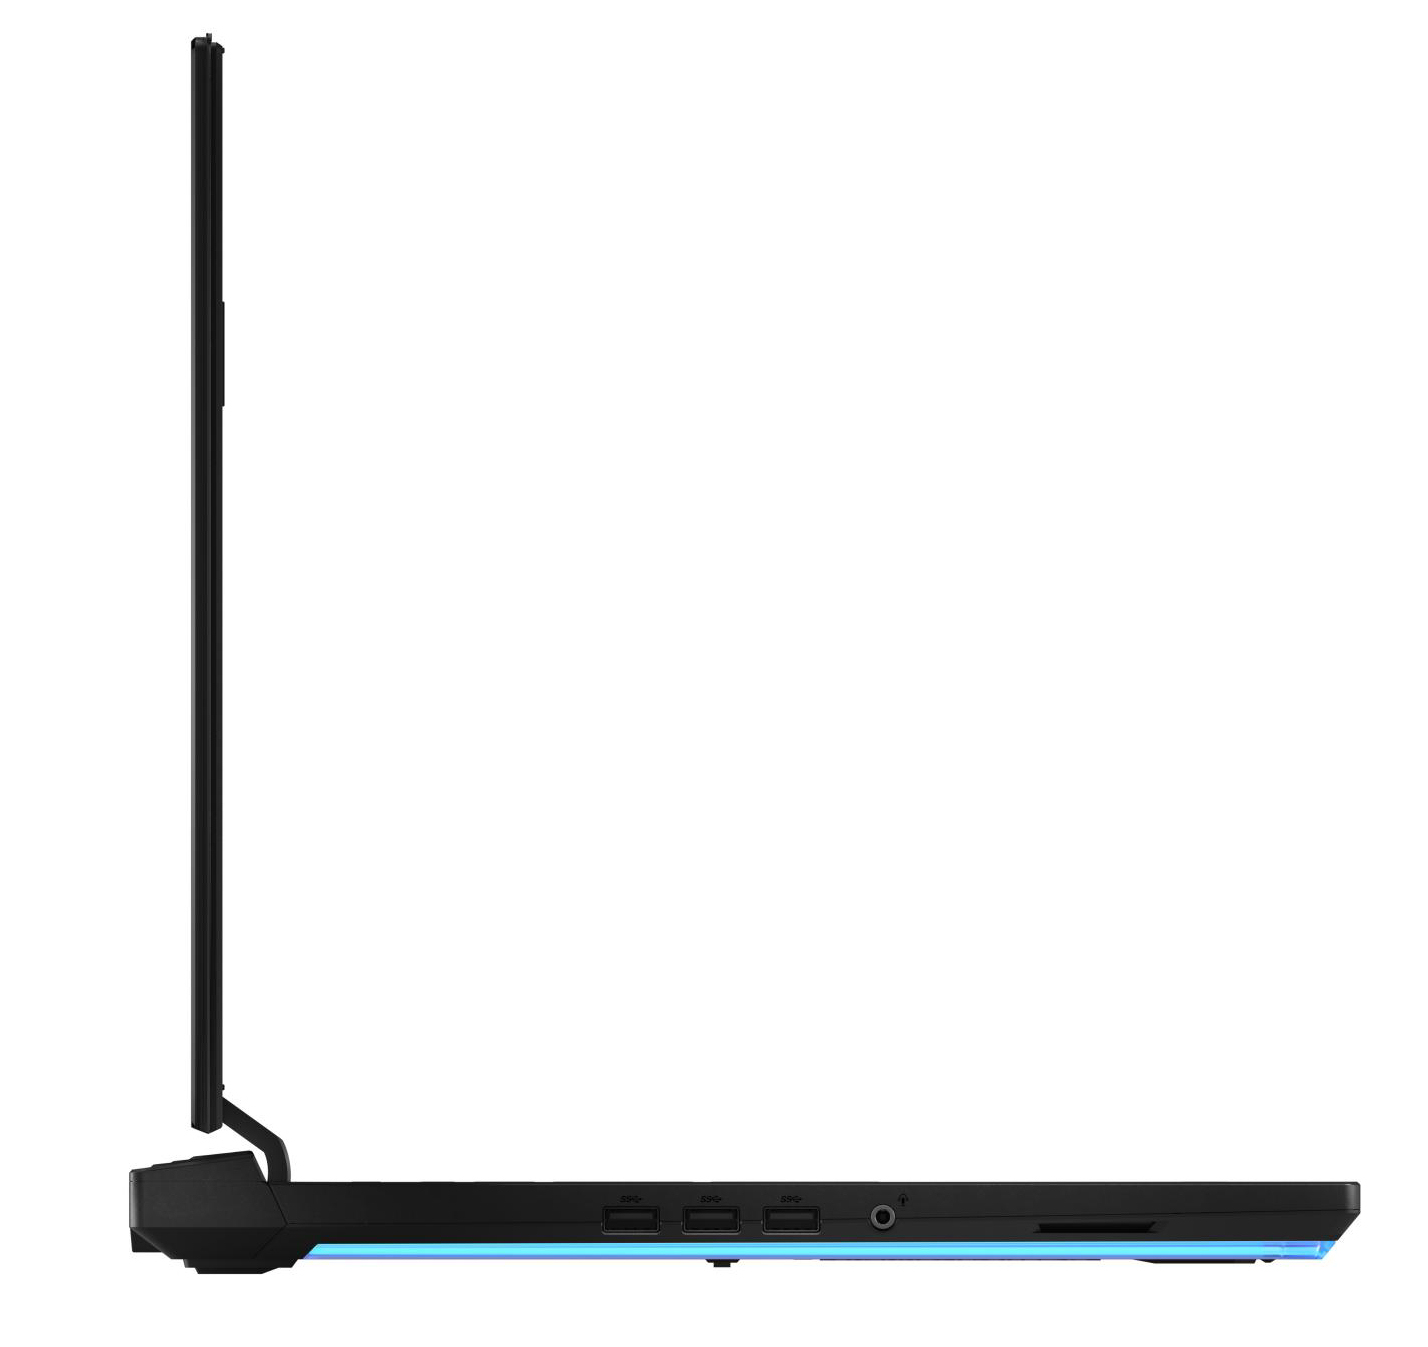
La selección de puertos bien redondeada incluye tres puertos USB tipo A 3.2 Gen 1, todos ellos situados en el lado izquierdo de la carcasa. Asus debería haber instalado al menos un puerto en el lado derecho. Un puerto Thunderbolt 3 no está entre las conexiones. Sólo hay un puerto USB tipo C 3.2 Gen 2 que soporta DisplayPort a través de USB-C.
Asus Strix G17 G712LWS
- 10/11/2020 v7 (old)
Sascha Mölck
Price comparison
