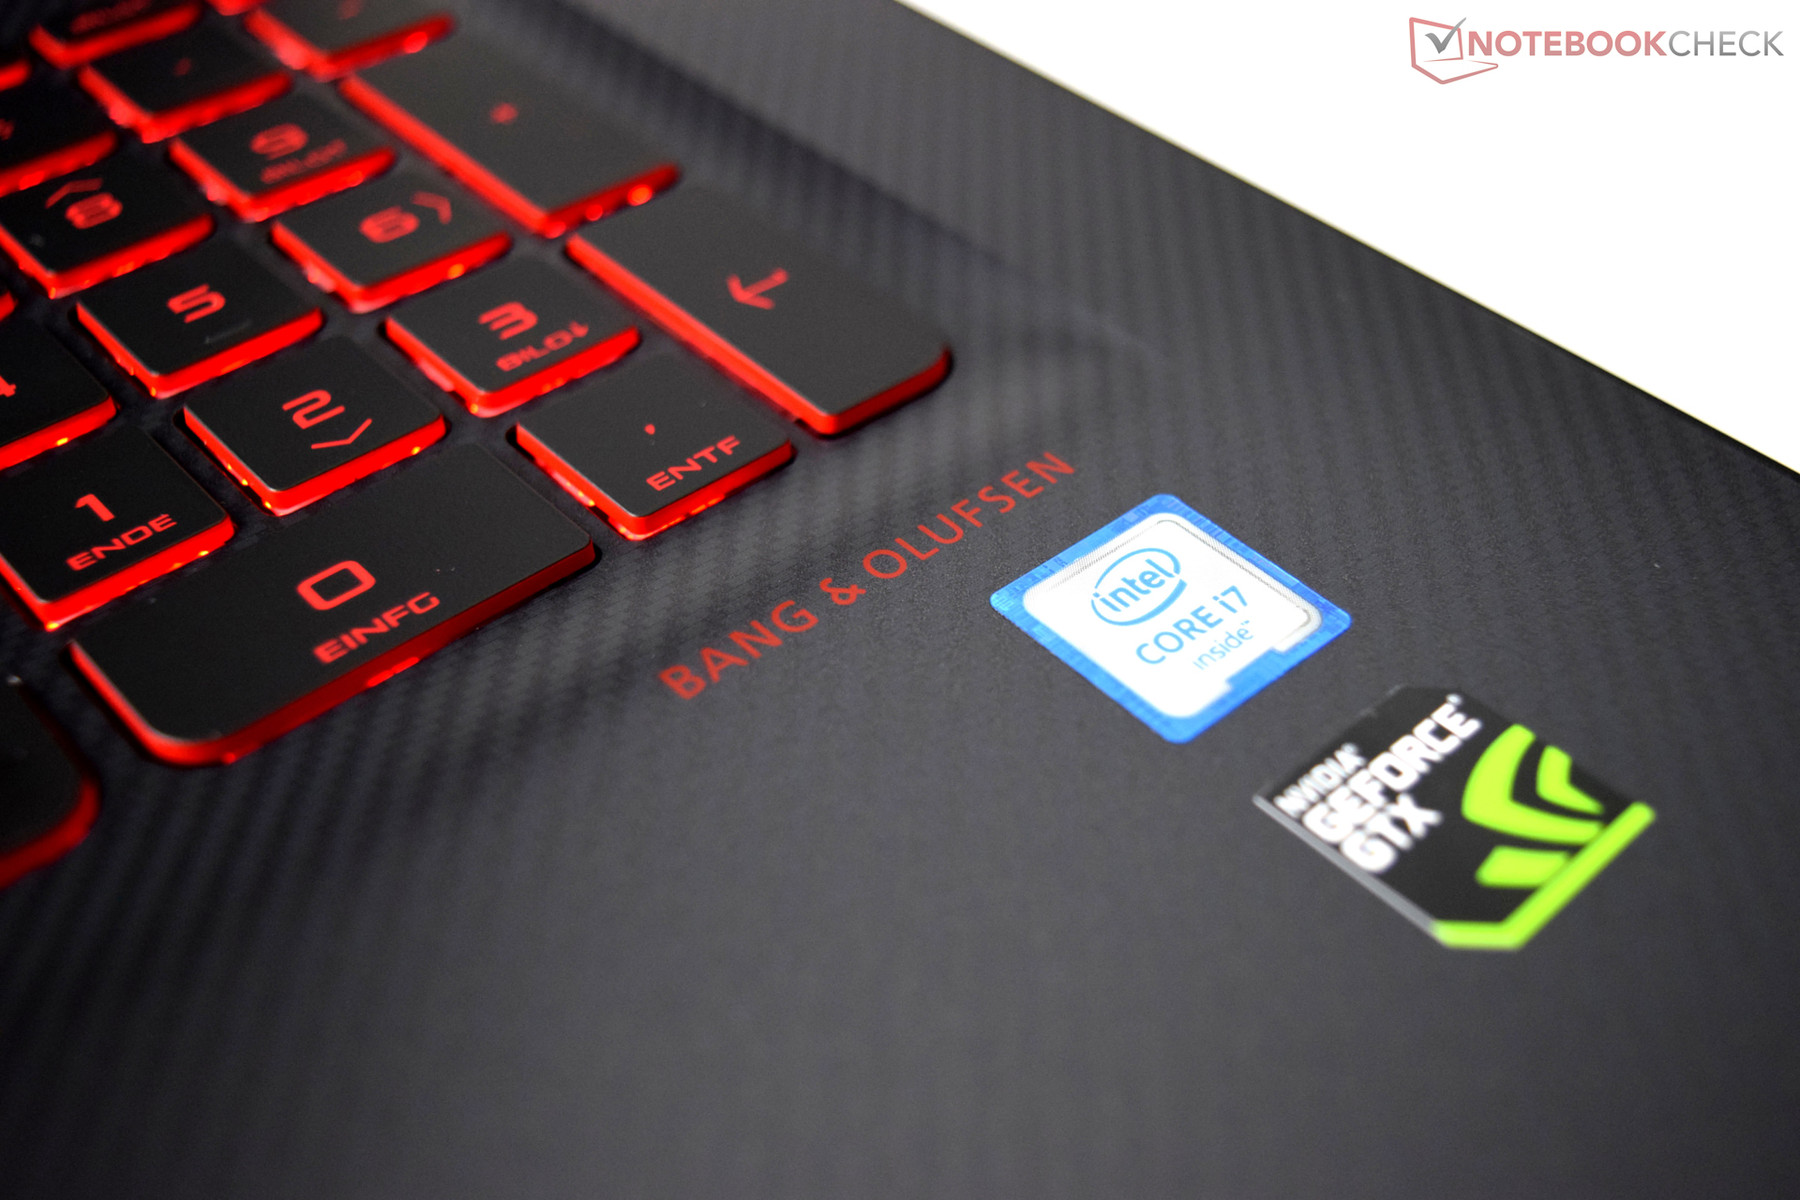
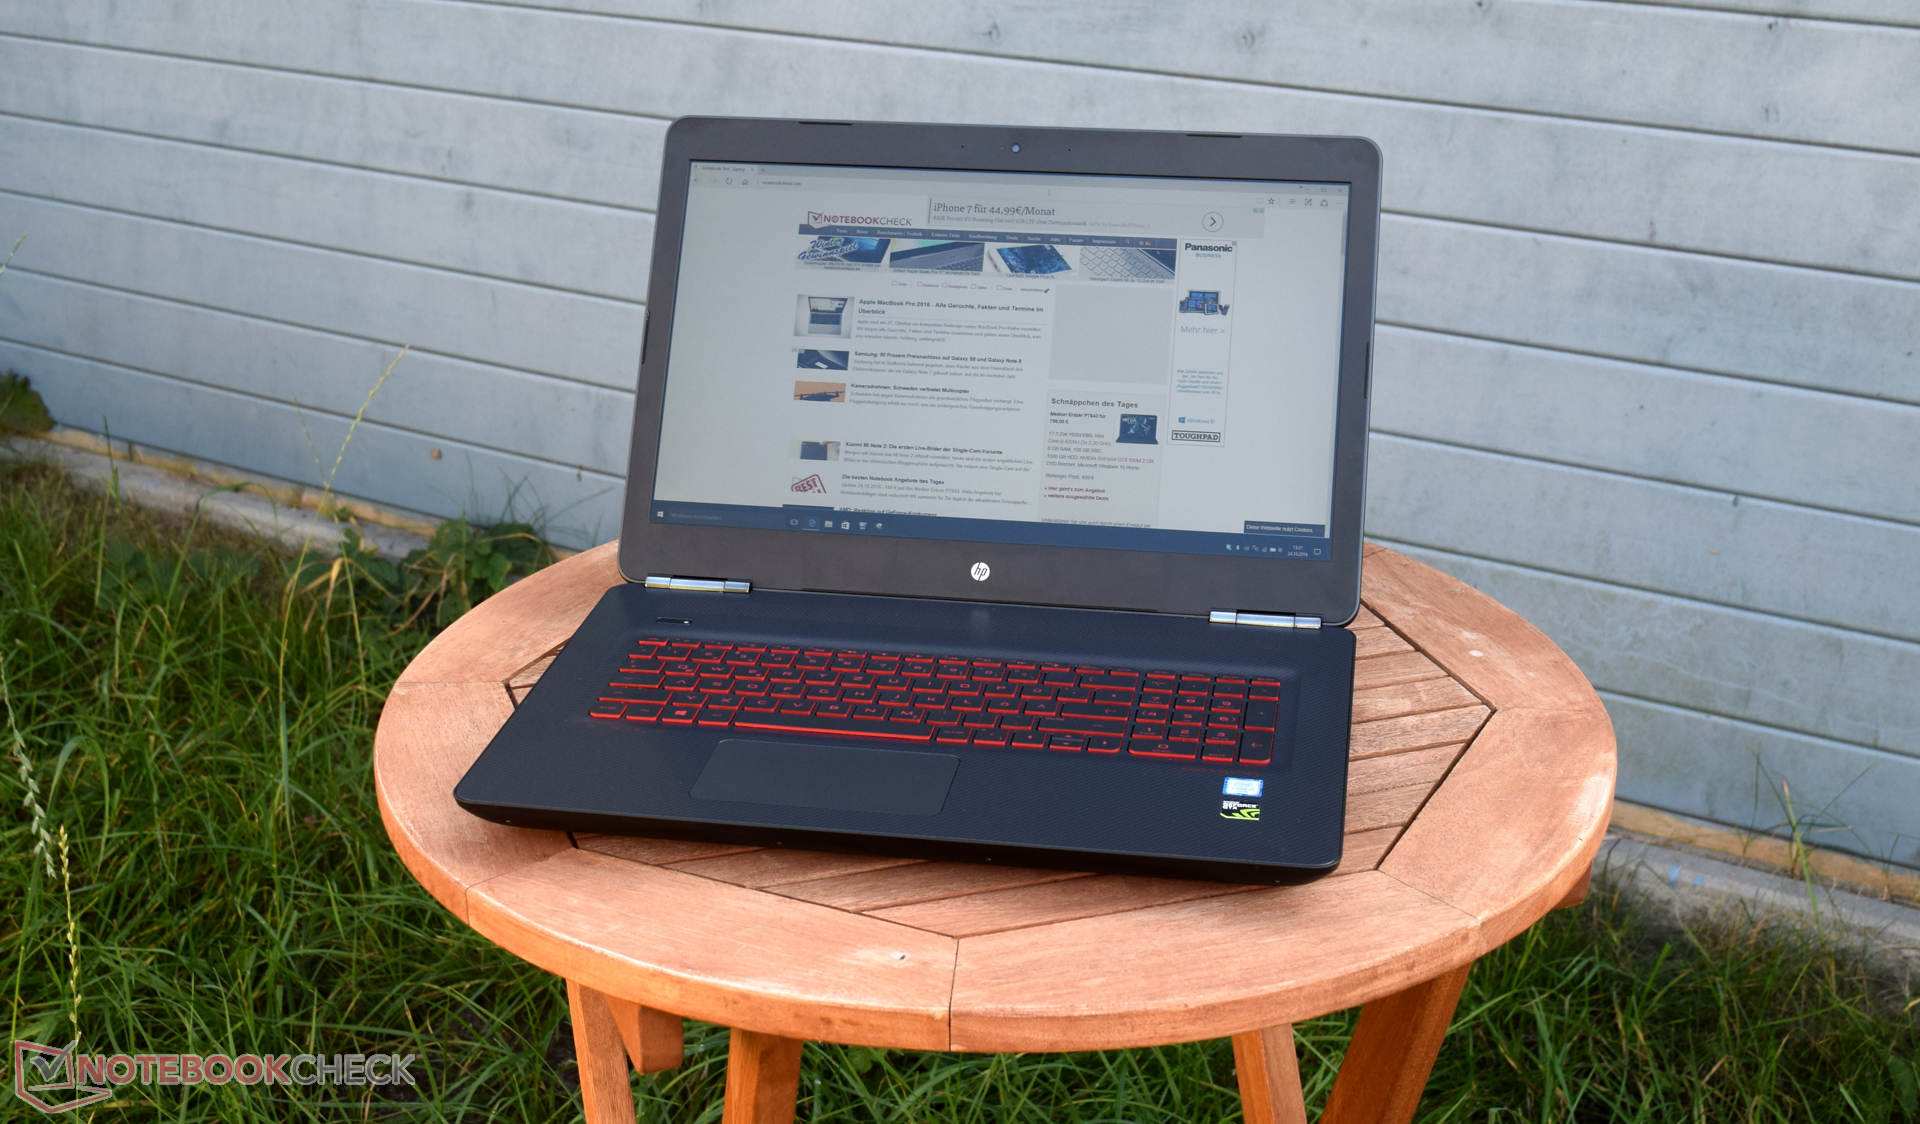
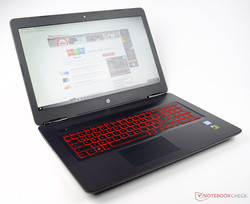
Breve análisis del HP Omen 17 (i7-6700HQ, GTX 1070)

| SD Card Reader | |
| average JPG Copy Test (av. of 3 runs) | |
| Nexoc G734III | |
| Gigabyte P57X v6 | |
| Asus G752VS-XB78K | |
| HP Omen 17-w110ng | |
| HP Omen 17-w010ng | |
| MSI GS73VR 6RF | |
| maximum AS SSD Seq Read Test (1GB) | |
| Gigabyte P57X v6 | |
| HP Omen 17-w110ng | |
| HP Omen 17-w010ng | |
| Asus G752VS-XB78K | |
| Nexoc G734III | |
| MSI GS73VR 6RF | |
| Networking | |
| iperf Server (receive) TCP 1 m | |
| HP Omen 17-w110ng | |
| Nexoc G734III | |
| Asus G752VS-XB78K | |
| MSI GS73VR 6RF | |
| HP Omen 17-w010ng | |
| iperf Client (transmit) TCP 1 m | |
| MSI GS73VR 6RF | |
| HP Omen 17-w110ng | |
| Asus G752VS-XB78K | |
| Nexoc G734III | |
| HP Omen 17-w010ng | |
| |||||||||||||||||||||||||
iluminación: 87 %
Brillo con batería: 362 cd/m²
Contraste: 1168:1 (Negro: 0.31 cd/m²)
ΔE ColorChecker Calman: 4.5 | ∀{0.5-29.43 Ø4.71}
ΔE Greyscale Calman: 3.48 | ∀{0.09-98 Ø4.96}
84% sRGB (Argyll 1.6.3 3D)
55% AdobeRGB 1998 (Argyll 1.6.3 3D)
61.5% AdobeRGB 1998 (Argyll 3D)
84.1% sRGB (Argyll 3D)
66.6% Display P3 (Argyll 3D)
Gamma: 2.23
CCT: 6144 K
| HP Omen 17-w110ng LG Philips LGD046E, 1920x1080 | HP Omen 17-w010ng AUO119B, 3840x2160 | Nexoc G734III LG Philips LP173WF4-SPD1 (LGD046C), 1920x1080 | MSI GS73VR 6RF 1920x1080 | Gigabyte P57X v6 LGD0469, 1920x1080 | Asus G752VS-XB78K LG Philips LP173WF4-SPF3 (LGD04E8), 1920x1080 | |
|---|---|---|---|---|---|---|
| Display | 38% | 2% | 30% | 3% | 1% | |
| Display P3 Coverage (%) | 66.6 | 88.5 33% | 67.4 1% | 90 35% | 68 2% | 66.9 0% |
| sRGB Coverage (%) | 84.1 | 100 19% | 85.8 2% | 99.9 19% | 87.5 4% | 85.2 1% |
| AdobeRGB 1998 Coverage (%) | 61.5 | 100 63% | 62.8 2% | 83.6 36% | 64 4% | 62.3 1% |
| Response Times | -25% | 4% | 42% | 1% | 3% | |
| Response Time Grey 50% / Grey 80% * (ms) | 37 ? | 49 ? -32% | 36 ? 3% | 28 ? 24% | 33.6 ? 9% | 38 ? -3% |
| Response Time Black / White * (ms) | 24 ? | 28 ? -17% | 23 ? 4% | 9.6 ? 60% | 25.6 ? -7% | 22 ? 8% |
| PWM Frequency (Hz) | 50 ? | |||||
| Screen | -3% | -1% | 13% | -12% | 3% | |
| Brightness middle (cd/m²) | 362 | 316 -13% | 314 -13% | 337.2 -7% | 329.2 -9% | 328 -9% |
| Brightness (cd/m²) | 342 | 312 -9% | 308 -10% | 315 -8% | 321 -6% | 317 -7% |
| Brightness Distribution (%) | 87 | 90 3% | 92 6% | 86 -1% | 93 7% | 88 1% |
| Black Level * (cd/m²) | 0.31 | 0.29 6% | 0.28 10% | 0.308 1% | 0.267 14% | 0.3 3% |
| Contrast (:1) | 1168 | 1090 -7% | 1121 -4% | 1095 -6% | 1233 6% | 1093 -6% |
| Colorchecker dE 2000 * | 4.5 | 5.69 -26% | 4.17 7% | 2.96 34% | 5.93 -32% | 3.74 17% |
| Colorchecker dE 2000 max. * | 9.31 | 7.94 15% | 8.94 4% | 5.45 41% | 11.07 -19% | 8.97 4% |
| Greyscale dE 2000 * | 3.48 | 6.12 -76% | 3.84 -10% | 2.57 26% | 6.72 -93% | 2.67 23% |
| Gamma | 2.23 99% | 2.56 86% | 2.41 91% | 2.25 98% | 2.12 104% | 2.41 91% |
| CCT | 6144 106% | 5875 111% | 6950 94% | 7114 91% | 7611 85% | 6861 95% |
| Color Space (Percent of AdobeRGB 1998) (%) | 55 | 87 58% | 56 2% | 74.3 35% | 57 4% | 56 2% |
| Color Space (Percent of sRGB) (%) | 84 | 100 19% | 86 2% | 100 19% | 87 4% | 85 1% |
| Media total (Programa/Opciones) | 3% /
2% | 2% /
0% | 28% /
21% | -3% /
-7% | 2% /
2% |
* ... más pequeño es mejor
Tiempos de respuesta del display
| ↔ Tiempo de respuesta de Negro a Blanco | ||
|---|---|---|
| 24 ms ... subida ↗ y bajada ↘ combinada | ↗ 4 ms subida | 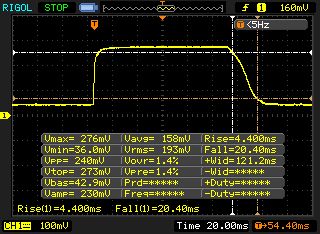 |
| ↘ 20 ms bajada | ||
| La pantalla mostró buenos tiempos de respuesta en nuestros tests pero podría ser demasiado lenta para los jugones competitivos. En comparación, todos los dispositivos de prueba van de ##min### (mínimo) a 240 (máximo) ms. » 54 % de todos los dispositivos son mejores. Eso quiere decir que el tiempo de respuesta es peor que la media (19.8 ms) de todos los dispositivos testados. | ||
| ↔ Tiempo de respuesta 50% Gris a 80% Gris | ||
| 37 ms ... subida ↗ y bajada ↘ combinada | ↗ 13 ms subida | 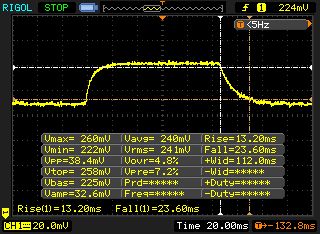 |
| ↘ 24 ms bajada | ||
| La pantalla mostró tiempos de respuesta lentos en nuestros tests y podría ser demasiado lenta para los jugones. En comparación, todos los dispositivos de prueba van de ##min### (mínimo) a 636 (máximo) ms. » 53 % de todos los dispositivos son mejores. Eso quiere decir que el tiempo de respuesta es peor que la media (31 ms) de todos los dispositivos testados. | ||
Parpadeo de Pantalla / PWM (Pulse-Width Modulation)
| Parpadeo de Pantalla / PWM no detectado | 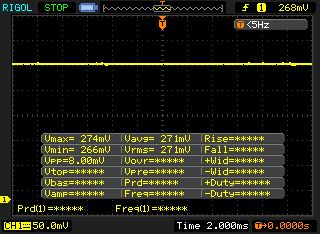 | ||
Comparación: 52 % de todos los dispositivos testados no usaron PWM para atenuar el display. Si se usó, medimos una media de 7754 (mínimo: 5 - máxmo: 343500) Hz. | |||
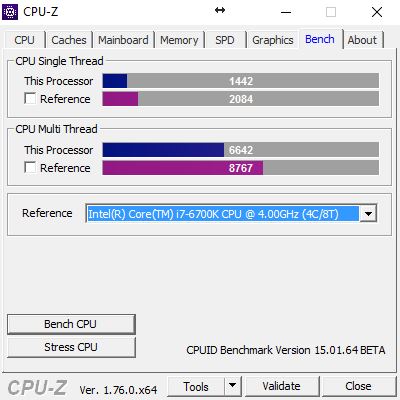
| Cinebench R11.5 | |
| CPU Single 64Bit | |
| Asus G752VS-XB78K | |
| HP Omen 17-w110ng | |
| HP Omen 17-w010ng | |
| Nexoc G734III | |
| MSI GS73VR 6RF | |
| Gigabyte P57X v6 | |
| CPU Multi 64Bit | |
| Asus G752VS-XB78K | |
| HP Omen 17-w110ng | |
| HP Omen 17-w010ng | |
| Gigabyte P57X v6 | |
| MSI GS73VR 6RF | |
| Nexoc G734III | |
| Cinebench R10 | |
| Rendering Single CPUs 64Bit | |
| Asus G752VS-XB78K | |
| HP Omen 17-w110ng | |
| Rendering Multiple CPUs 64Bit | |
| Asus G752VS-XB78K | |
| HP Omen 17-w110ng | |
| JetStream 1.1 - 1.1 Total | |
| HP Omen 17-w110ng | |
| Gigabyte P57X v6 | |
| Asus G752VS-XB78K | |
| MSI GS73VR 6RF | |
| Nexoc G734III | |
| Octane V2 - Total Score | |
| Asus G752VS-XB78K | |
| HP Omen 17-w110ng | |
| MSI GS73VR 6RF | |
| Nexoc G734III | |
| Mozilla Kraken 1.1 - Total | |
| Nexoc G734III | |
| Gigabyte P57X v6 | |
| HP Omen 17-w110ng | |
| Asus G752VS-XB78K | |
* ... más pequeño es mejor
| PCMark 7 - Score | |
| Asus G752VS-XB78K | |
| HP Omen 17-w010ng | |
| HP Omen 17-w110ng | |
| Nexoc G734III | |
| PCMark 8 | |
| Home Score Accelerated v2 | |
| Asus G752VS-XB78K | |
| HP Omen 17-w110ng | |
| Gigabyte P57X v6 | |
| Nexoc G734III | |
| MSI GS73VR 6RF | |
| HP Omen 17-w010ng | |
| Work Score Accelerated v2 | |
| Asus G752VS-XB78K | |
| HP Omen 17-w110ng | |
| Gigabyte P57X v6 | |
| Nexoc G734III | |
| MSI GS73VR 6RF | |
| HP Omen 17-w010ng | |
| Creative Score Accelerated v2 | |
| Asus G752VS-XB78K | |
| HP Omen 17-w110ng | |
| Nexoc G734III | |
| Gigabyte P57X v6 | |
| MSI GS73VR 6RF | |
| HP Omen 17-w010ng | |
| PCMark 7 Score | 5556 puntos | |
| PCMark 8 Home Score Accelerated v2 | 4833 puntos | |
| PCMark 8 Creative Score Accelerated v2 | 7128 puntos | |
| PCMark 8 Work Score Accelerated v2 | 5394 puntos | |
ayuda | ||
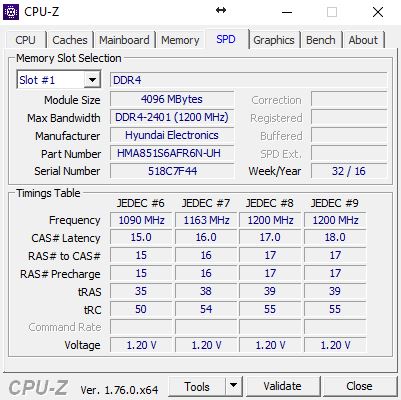
| HP Omen 17-w110ng Samsung PM951 NVMe MZVLV256 | HP Omen 17-w010ng Samsung PM951 NVMe MZVLV512 | Nexoc G734III Samsung SM951 MZVPV256HDGL m.2 PCI-e | MSI GS73VR 6RF SanDisk SD8SN8U1T001122 | Gigabyte P57X v6 Transcend MTS800 256GB M.2 (TS256GMTS800) | Asus G752VS-XB78K Toshiba NVMe THNSN5512GPU7 | |
|---|---|---|---|---|---|---|
| CrystalDiskMark 3.0 | 20% | 99% | -45% | -30% | 126% | |
| Read Seq (MB/s) | 1156 | 1234 7% | 1917 66% | 334.3 -71% | 481.7 -58% | 1718 49% |
| Write Seq (MB/s) | 294.9 | 583 98% | 1283 335% | 319 8% | 315.4 7% | 1305 343% |
| Read 512 (MB/s) | 616 | 606 -2% | 871 41% | 242.3 -61% | 303.1 -51% | 1250 103% |
| Write 512 (MB/s) | 294.7 | 428.3 45% | 1199 307% | 254.4 -14% | 314.4 7% | 1438 388% |
| Read 4k (MB/s) | 42.7 | 41.42 -3% | 51 19% | 20.3 -52% | 25.93 -39% | 44.42 4% |
| Write 4k (MB/s) | 153.3 | 137.2 -11% | 142.1 -7% | 42.51 -72% | 84.6 -45% | 154.4 1% |
| Read 4k QD32 (MB/s) | 600 | 622 4% | 603 0% | 251.6 -58% | 273.9 -54% | 744 24% |
| Write 4k QD32 (MB/s) | 295.3 | 348.3 18% | 382.4 29% | 167.1 -43% | 274.9 -7% | 578 96% |

| 3DMark | |
| 1280x720 Cloud Gate Standard Graphics | |
| Asus G752VS-XB78K | |
| HP Omen 17-w110ng | |
| Gigabyte P57X v6 | |
| Nexoc G734III | |
| MSI GS73VR 6RF | |
| HP Omen 17-w010ng | |
| 1920x1080 Fire Strike Graphics | |
| Asus G752VS-XB78K | |
| Nexoc G734III | |
| HP Omen 17-w110ng | |
| MSI GS73VR 6RF | |
| HP Omen 17-w010ng | |
| 3DMark 11 - 1280x720 Performance GPU | |
| Gigabyte P57X v6 | |
| Asus G752VS-XB78K | |
| Nexoc G734III | |
| HP Omen 17-w110ng | |
| MSI GS73VR 6RF | |
| HP Omen 17-w010ng | |
| 3DMark 11 Performance | 14116 puntos | |
| 3DMark Ice Storm Standard Score | 107777 puntos | |
| 3DMark Cloud Gate Standard Score | 22908 puntos | |
| 3DMark Fire Strike Score | 11779 puntos | |
| 3DMark Fire Strike Extreme Score | 6894 puntos | |
| 3DMark Time Spy Score | 4729 puntos | |
ayuda | ||
| The Witcher 3 | |
| 1920x1080 Ultra Graphics & Postprocessing (HBAO+) | |
| Asus G752VS-XB78K | |
| Nexoc G734III | |
| HP Omen 17-w110ng | |
| 3840x2160 High Graphics & Postprocessing (Nvidia HairWorks Off) | |
| Asus G752VS-XB78K | |
| HP Omen 17-w110ng | |
| Rise of the Tomb Raider | |
| 1920x1080 Very High Preset AA:FX AF:16x | |
| Asus G752VS-XB78K | |
| Gigabyte P57X v6 | |
| HP Omen 17-w110ng | |
| MSI GS73VR 6RF | |
| 3840x2160 High Preset AA:FX AF:4x | |
| Asus G752VS-XB78K | |
| HP Omen 17-w110ng | |
| bajo | medio | alto | ultra | 4K | |
|---|---|---|---|---|---|
| BioShock Infinite (2013) | 197.1 | 171 | 161 | 103.8 | |
| The Witcher 3 (2015) | 196.3 | 150 | 94.8 | 50.8 | 34 |
| Rise of the Tomb Raider (2016) | 173 | 151.7 | 105.6 | 89.7 | 36.1 |
| XCOM 2 (2016) | 86.4 | 74.9 | 66.1 | 39.2 | 22.8 |
| Far Cry Primal (2016) | 107 | 93 | 83 | 79 | 37 |
| Doom (2016) | 147.5 | 140.1 | 125.7 | 116.6 | 49.8 |
| No Man's Sky (2016) | 118.6 | 114.5 | 104 | 48.7 | 43.3 |
| Mafia 3 (2016) | 72.3 | 70.2 | 43.2 | 19 | |
| Battlefield 1 (2016) | 176.3 | 159.5 | 118.9 | 110.1 | 45.7 |
Ruido
| Ocioso |
| 33 / 34 / 35 dB(A) |
| HDD |
| 34 dB(A) |
| Carga |
| 45 / 52 dB(A) |
 | ||
30 dB silencioso 40 dB(A) audible 50 dB(A) ruidosamente alto |
||
min: | ||
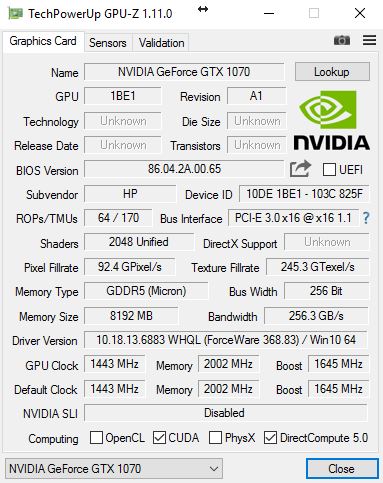
| HP Omen 17-w110ng 6700HQ, GeForce GTX 1070 Mobile | HP Omen 17-w010ng 6700HQ, GeForce GTX 965M | Nexoc G734III 6700HQ, GeForce GTX 1070 Mobile | MSI GS73VR 6RF 6700HQ, GeForce GTX 1060 Mobile | Gigabyte P57X v6 6700HQ, GeForce GTX 1070 Mobile | Asus G752VS-XB78K 6820HK, GeForce GTX 1070 Mobile | |
|---|---|---|---|---|---|---|
| Noise | 3% | 2% | 3% | 0% | 7% | |
| apagado / medio ambiente * (dB) | 30 | 30 -0% | 30 -0% | 28.4 5% | 29.7 1% | 30 -0% |
| Idle Minimum * (dB) | 33 | 32 3% | 31 6% | 31.9 3% | 33.2 -1% | 31 6% |
| Idle Average * (dB) | 34 | 33 3% | 32 6% | 32 6% | 33.2 2% | 32 6% |
| Idle Maximum * (dB) | 35 | 34 3% | 33 6% | 34 3% | 33.2 5% | 33 6% |
| Load Average * (dB) | 45 | 41 9% | 49 -9% | 47 -4% | 47.5 -6% | 40 11% |
| Load Maximum * (dB) | 52 | 51 2% | 50 4% | 49.4 5% | 52.5 -1% | 47 10% |
* ... más pequeño es mejor
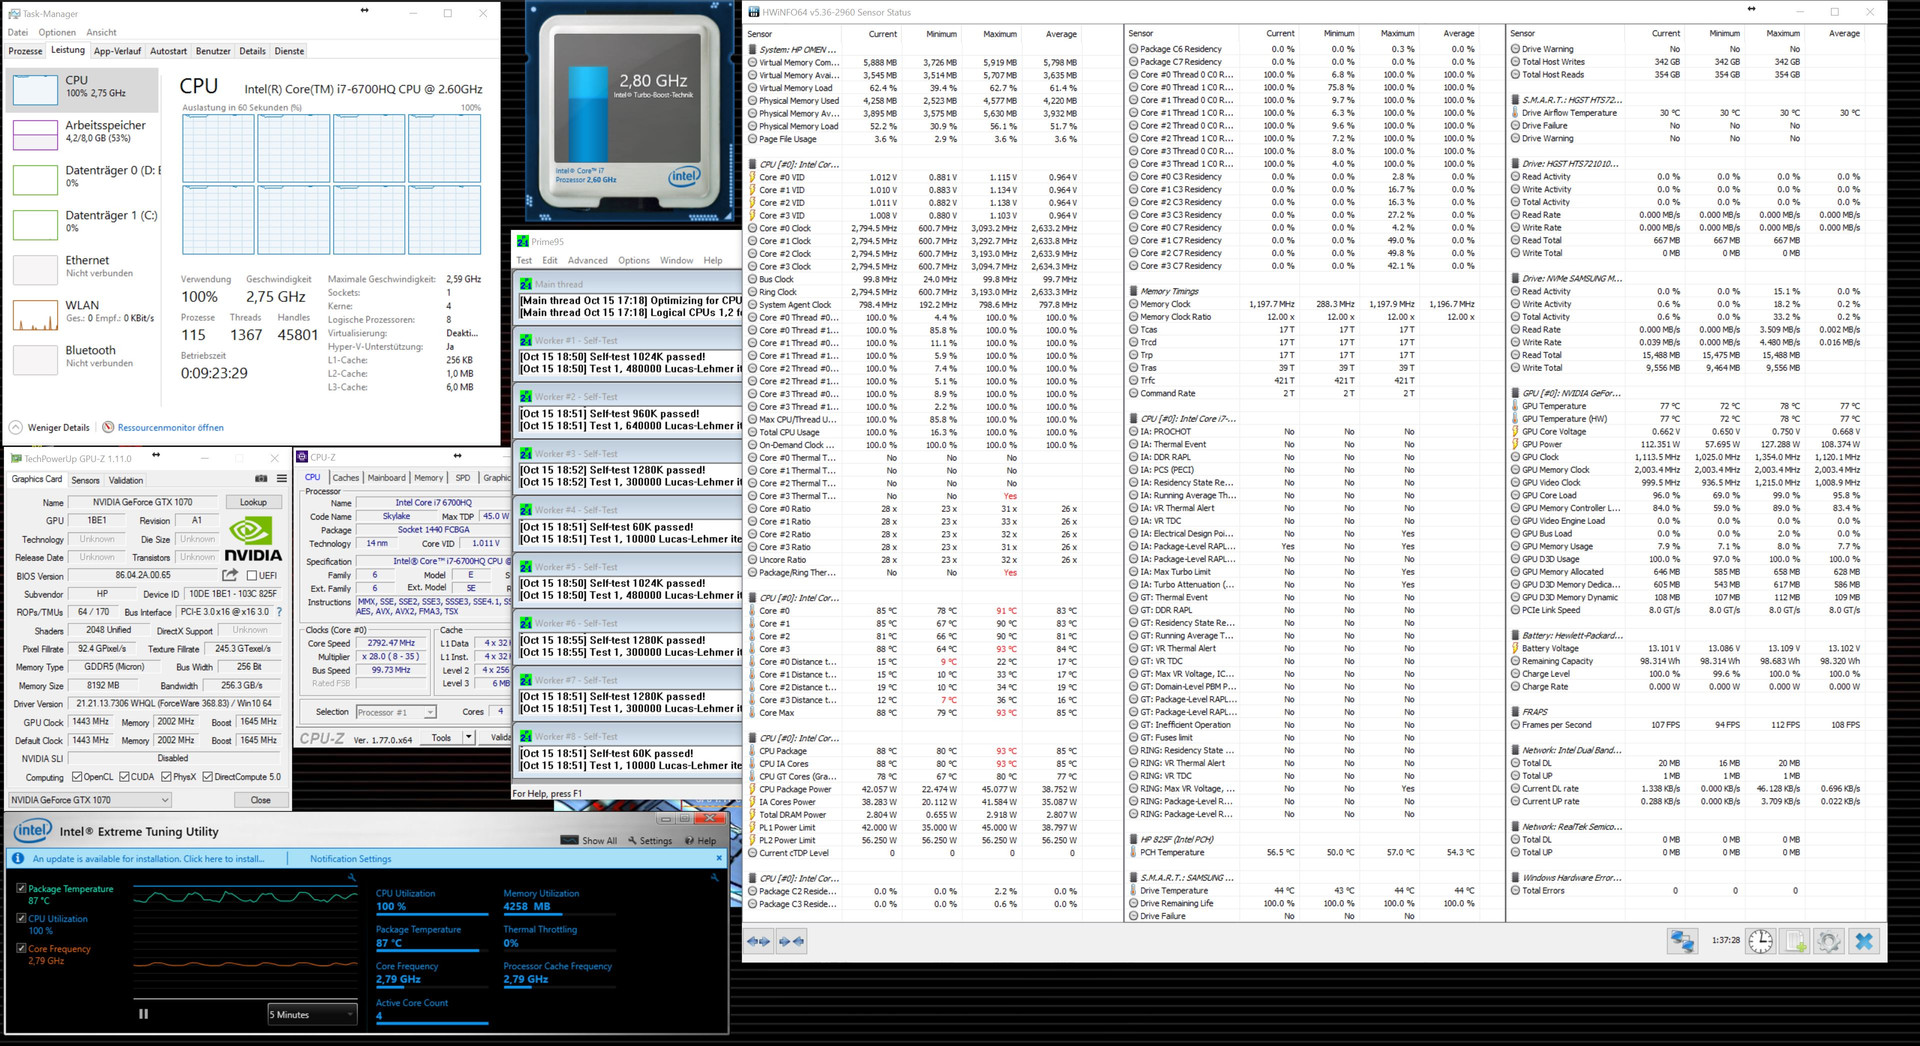
(±) La temperatura máxima en la parte superior es de 45 °C / 113 F, frente a la media de 40.4 °C / 105 F, que oscila entre 21.2 y 68.8 °C para la clase Gaming.
(-) El fondo se calienta hasta un máximo de 54.3 °C / 130 F, frente a la media de 43.2 °C / 110 F
(+) En reposo, la temperatura media de la parte superior es de 26.5 °C / 80# F, frente a la media del dispositivo de 33.9 °C / 93 F.
(+) El reposamanos y el panel táctil están a una temperatura inferior a la de la piel, con un máximo de 29.8 °C / 85.6 F y, por tanto, son fríos al tacto.
(±) La temperatura media de la zona del reposamanos de dispositivos similares fue de 28.8 °C / 83.8 F (-1 °C / -1.8 F).
| HP Omen 17-w110ng 6700HQ, GeForce GTX 1070 Mobile | HP Omen 17-w010ng 6700HQ, GeForce GTX 965M | Nexoc G734III 6700HQ, GeForce GTX 1070 Mobile | MSI GS73VR 6RF 6700HQ, GeForce GTX 1060 Mobile | Gigabyte P57X v6 6700HQ, GeForce GTX 1070 Mobile | Asus G752VS-XB78K 6820HK, GeForce GTX 1070 Mobile | |
|---|---|---|---|---|---|---|
| Heat | 1% | -4% | -4% | -18% | 5% | |
| Maximum Upper Side * (°C) | 45 | 50.2 -12% | 50 -11% | 50.8 -13% | 59 -31% | 42.9 5% |
| Maximum Bottom * (°C) | 54.3 | 54.1 -0% | 60.5 -11% | 60 -10% | 66 -22% | 41.5 24% |
| Idle Upper Side * (°C) | 29.6 | 28.9 2% | 29.1 2% | 27.4 7% | 33.2 -12% | 31.6 -7% |
| Idle Bottom * (°C) | 28.6 | 24.3 15% | 26.9 6% | 28.8 -1% | 30.6 -7% | 29.5 -3% |
* ... más pequeño es mejor
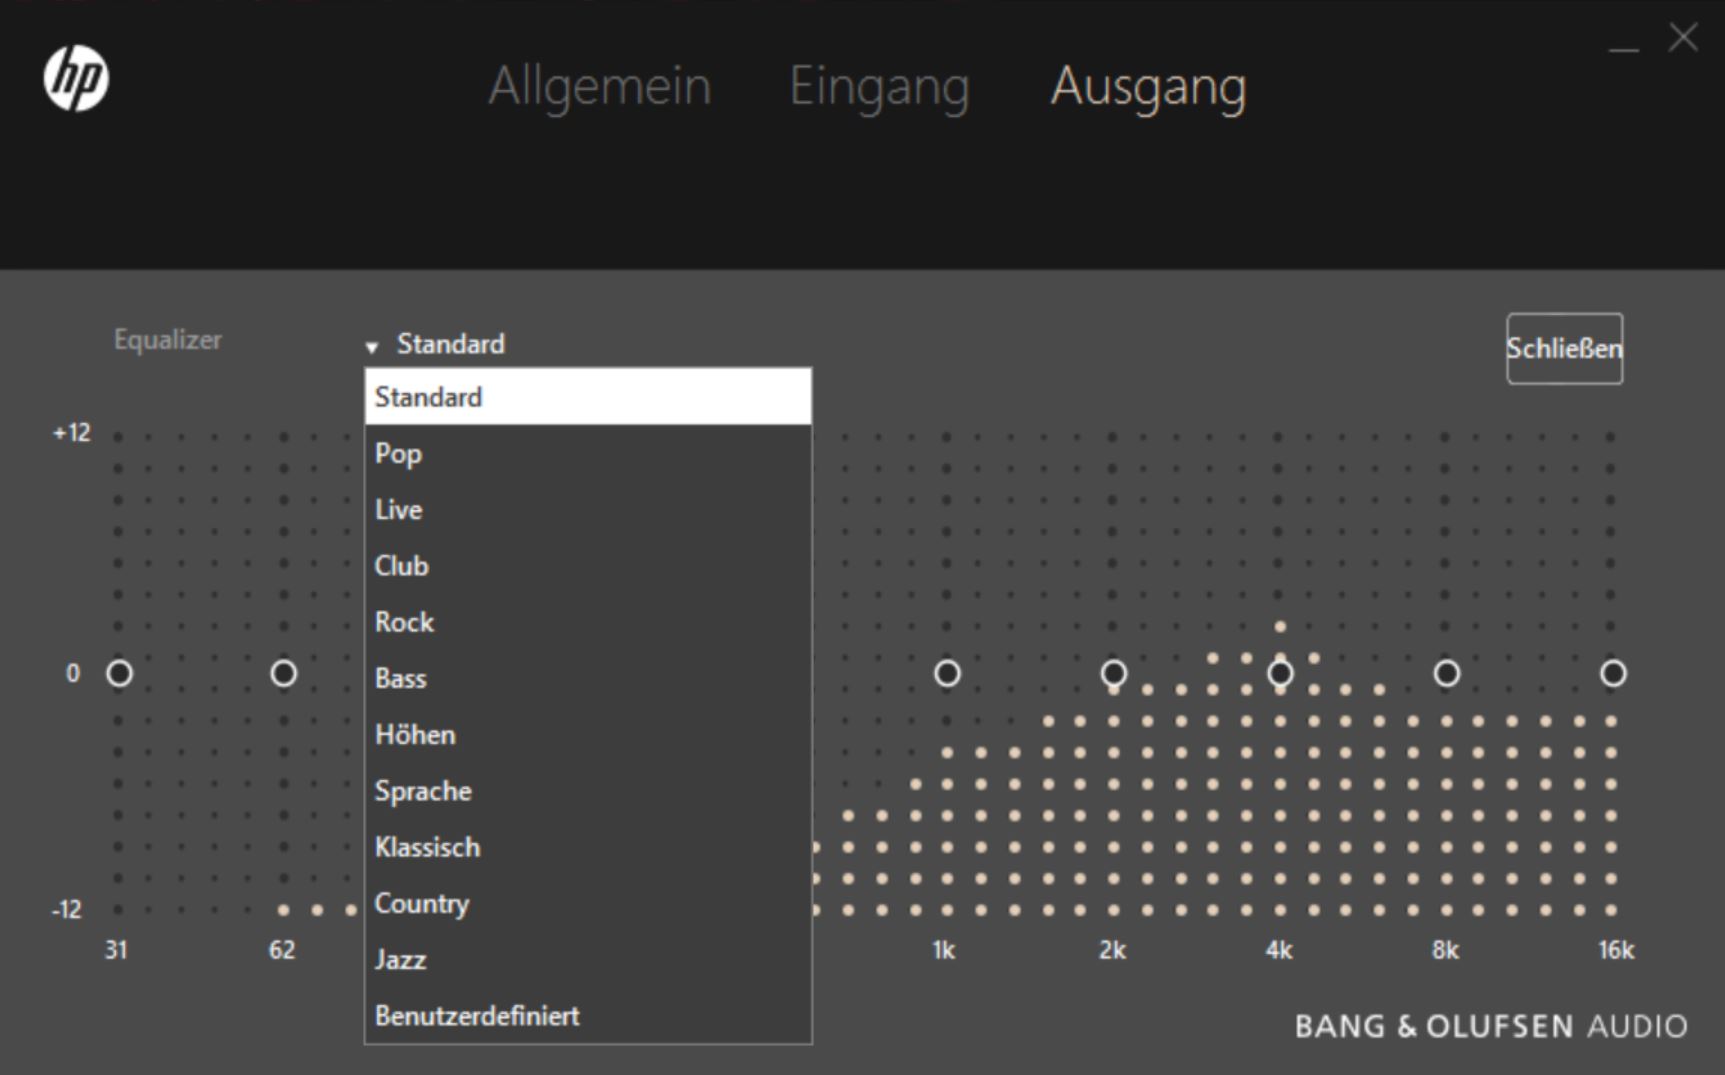
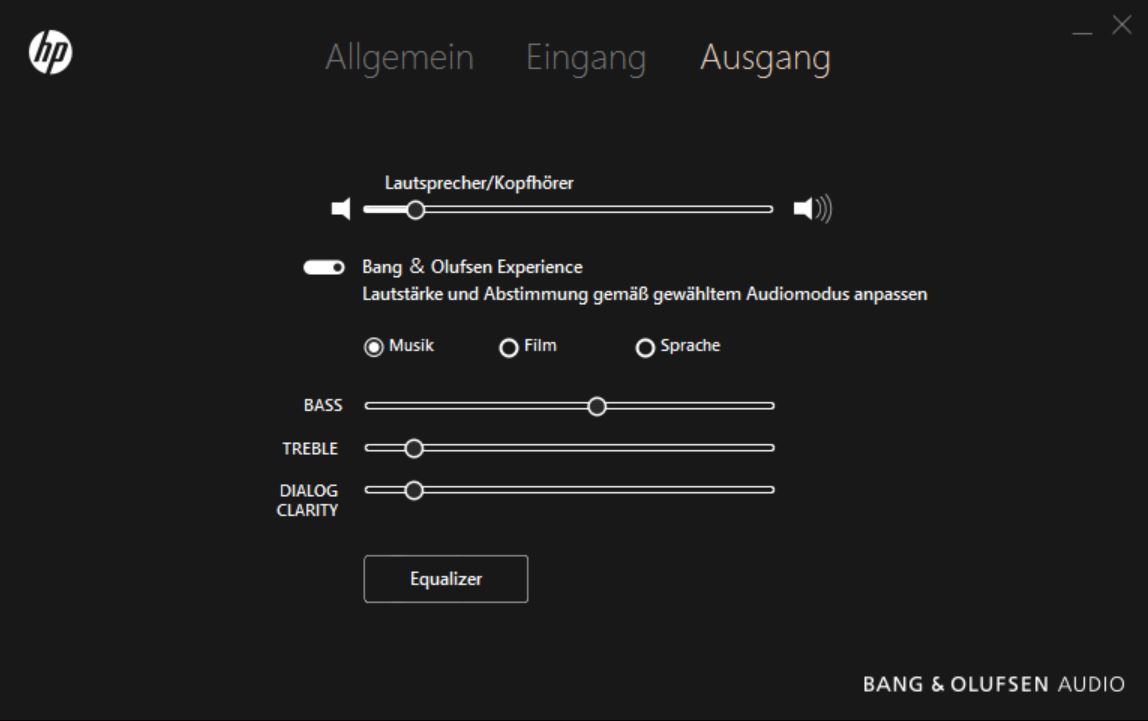
HP Omen 17-w110ng análisis de audio
(+) | los altavoces pueden reproducir a un volumen relativamente alto (#85 dB)
Graves 100 - 315 Hz
(-) | casi sin bajos - de media 22.3% inferior a la mediana
(±) | la linealidad de los graves es media (13.2% delta a frecuencia anterior)
Medios 400 - 2000 Hz
(+) | medios equilibrados - a sólo 2.7% de la mediana
(+) | los medios son lineales (4.9% delta a la frecuencia anterior)
Altos 2 - 16 kHz
(±) | máximos más altos - de media 5.9% más altos que la mediana
(+) | los máximos son lineales (5.3% delta a la frecuencia anterior)
Total 100 - 16.000 Hz
(±) | la linealidad del sonido global es media (18.5% de diferencia con la mediana)
En comparación con la misma clase
» 60% de todos los dispositivos probados de esta clase eran mejores, 8% similares, 32% peores
» El mejor tuvo un delta de 6%, la media fue 18%, el peor fue ###max##%
En comparación con todos los dispositivos probados
» 42% de todos los dispositivos probados eran mejores, 8% similares, 51% peores
» El mejor tuvo un delta de 4%, la media fue 23%, el peor fue ###max##%
Acer Predator 17 G9-793-77LG análisis de audio
(+) | los altavoces pueden reproducir a un volumen relativamente alto (#83 dB)
Graves 100 - 315 Hz
(±) | lubina reducida - en promedio 7.8% inferior a la mediana
(±) | la linealidad de los graves es media (8.2% delta a frecuencia anterior)
Medios 400 - 2000 Hz
(+) | medios equilibrados - a sólo 4% de la mediana
(+) | los medios son lineales (4.6% delta a la frecuencia anterior)
Altos 2 - 16 kHz
(+) | máximos equilibrados - a sólo 3.7% de la mediana
(±) | la linealidad de los máximos es media (7.1% delta a frecuencia anterior)
Total 100 - 16.000 Hz
(+) | el sonido global es lineal (12% de diferencia con la mediana)
En comparación con la misma clase
» 12% de todos los dispositivos probados de esta clase eran mejores, 4% similares, 84% peores
» El mejor tuvo un delta de 6%, la media fue 18%, el peor fue ###max##%
En comparación con todos los dispositivos probados
» 9% de todos los dispositivos probados eran mejores, 2% similares, 88% peores
» El mejor tuvo un delta de 4%, la media fue 23%, el peor fue ###max##%
| Off / Standby | |
| Ocioso | |
| Carga |
|
Clave:
min: | |
| HP Omen 17-w110ng 6700HQ, GeForce GTX 1070 Mobile | HP Omen 17-w010ng 6700HQ, GeForce GTX 965M | Nexoc G734III 6700HQ, GeForce GTX 1070 Mobile | MSI GS73VR 6RF 6700HQ, GeForce GTX 1060 Mobile | Gigabyte P57X v6 6700HQ, GeForce GTX 1070 Mobile | Asus G752VS-XB78K 6820HK, GeForce GTX 1070 Mobile | |
|---|---|---|---|---|---|---|
| Power Consumption | 27% | 11% | -14% | -16% | -15% | |
| Idle Minimum * (Watt) | 19 | 10 47% | 13 32% | 22.6 -19% | 18.4 3% | 24 -26% |
| Idle Average * (Watt) | 25 | 19 24% | 20 20% | 32.7 -31% | 22.8 9% | 31 -24% |
| Idle Maximum * (Watt) | 31 | 25 19% | 27 13% | 32.8 -6% | 24 23% | 36 -16% |
| Load Average * (Watt) | 90 | 83 8% | 90 -0% | 114.7 -27% | 175.5 -95% | 94 -4% |
| Load Maximum * (Watt) | 193 | 118 39% | 210 -9% | 167.9 13% | 229.5 -19% | 204 -6% |
* ... más pequeño es mejor
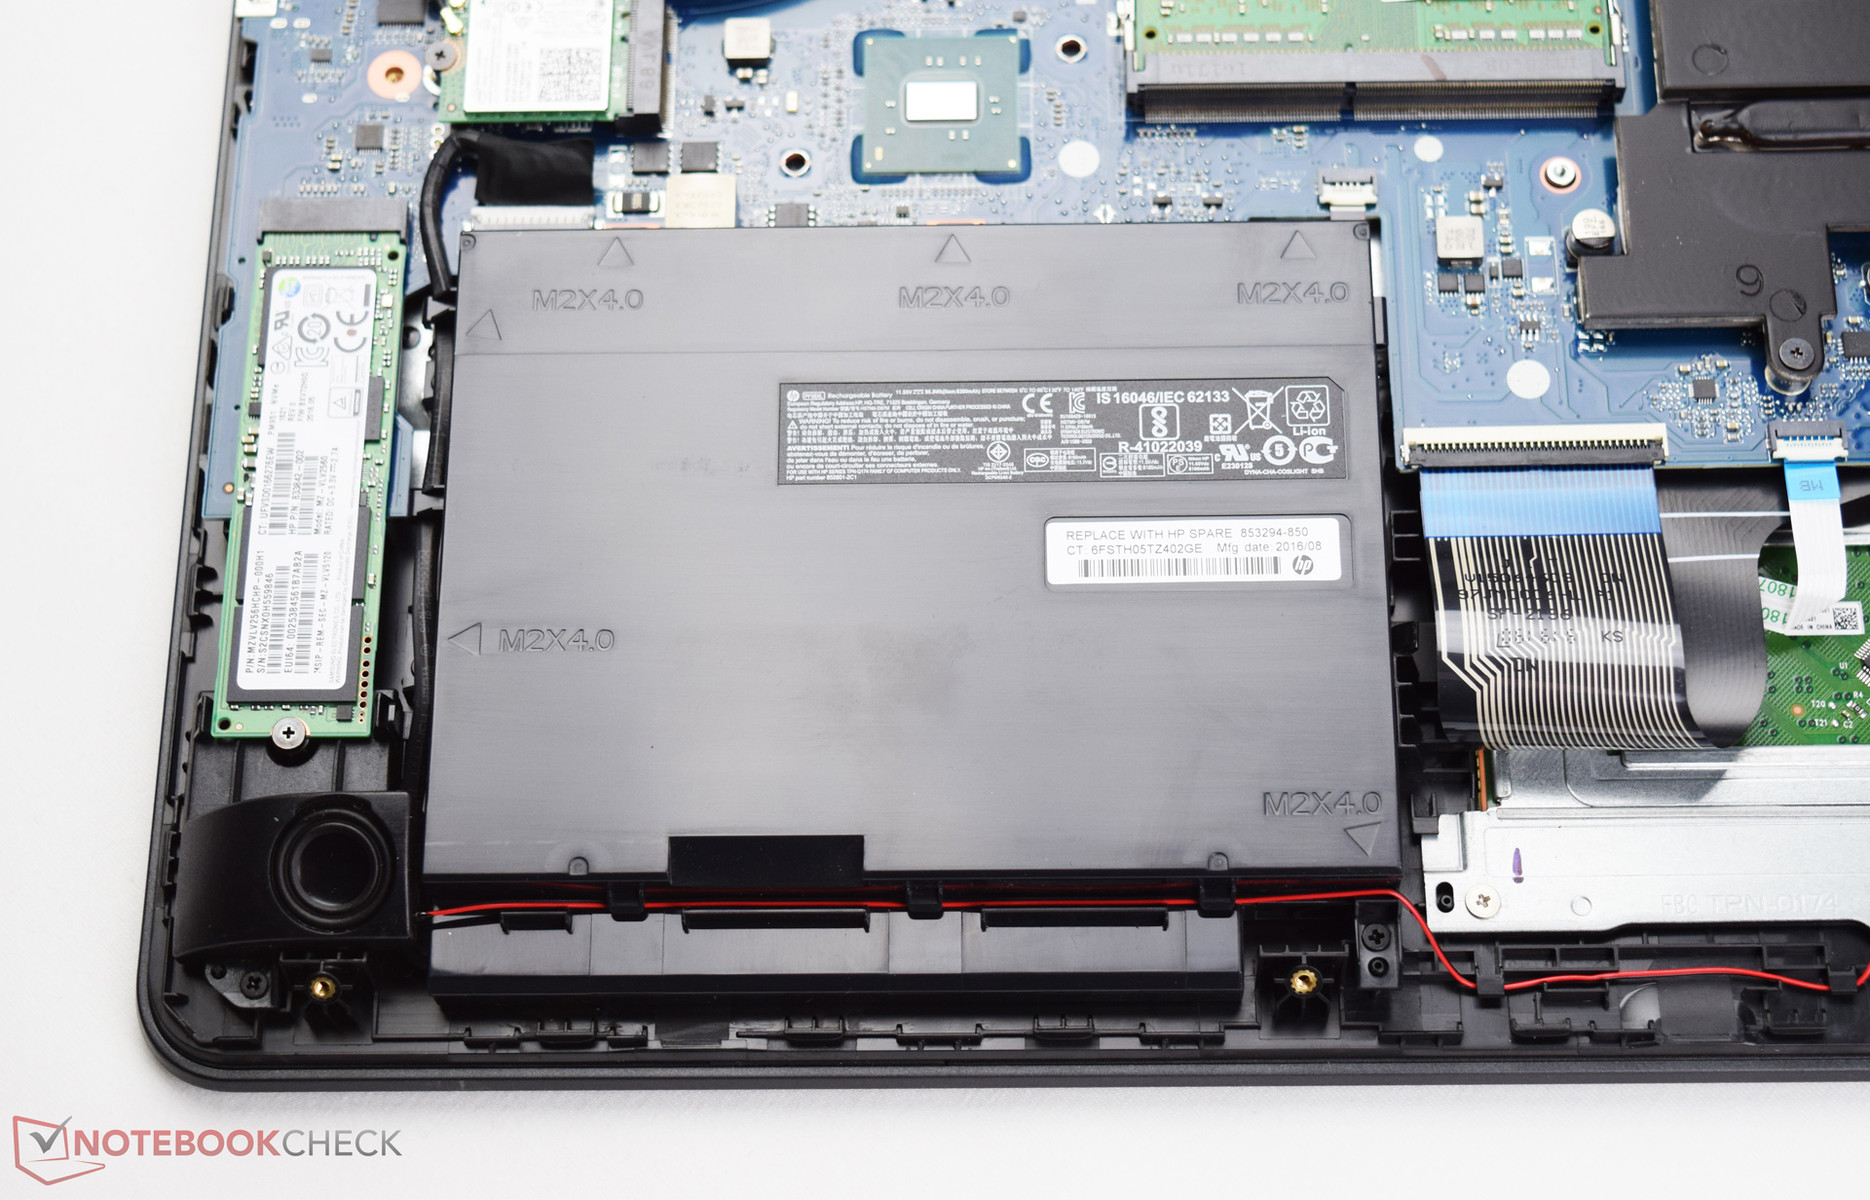
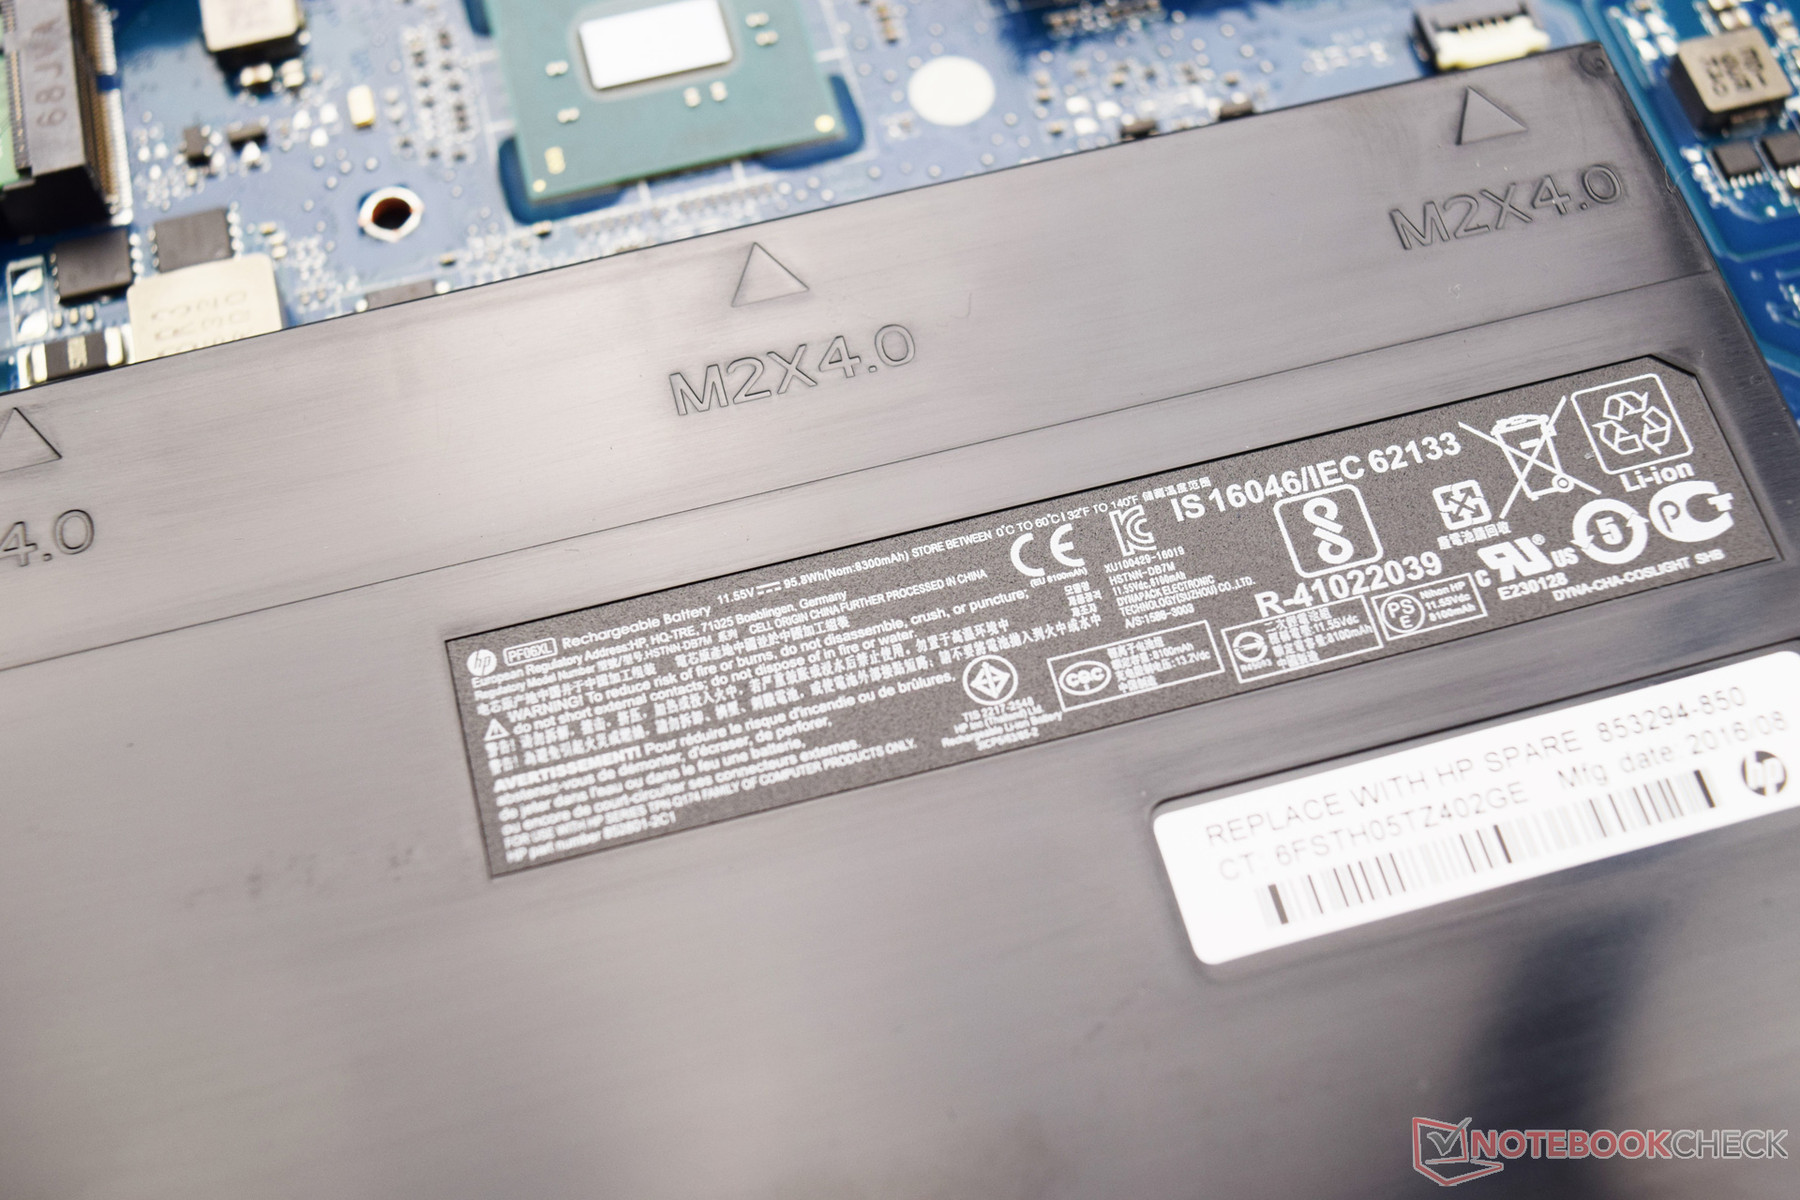
| HP Omen 17-w110ng 95 Wh | HP Omen 17-w010ng 62 Wh | Nexoc G734III 60 Wh | MSI GS73VR 6RF 65 Wh | Gigabyte P57X v6 75.81 Wh | Asus G752VS-XB78K 90 Wh | |
|---|---|---|---|---|---|---|
| Duración de Batería | -10% | -15% | -24% | -10% | -23% | |
| Reader / Idle (h) | 7.2 | 7.3 1% | 6.7 -7% | 5.9 -18% | 7 -3% | 5.2 -28% |
| H.264 (h) | 3.9 | 3.6 -8% | 3.5 -10% | 3.1 -21% | ||
| WiFi v1.3 (h) | 4.1 | 4 -2% | 3 -27% | 3.6 -12% | 3.4 -17% | 3.5 -15% |
| Load (h) | 1.9 | 1.3 -32% | 1.6 -16% | 1.1 -42% | 1.7 -11% | 1.4 -26% |
Pro
Contra
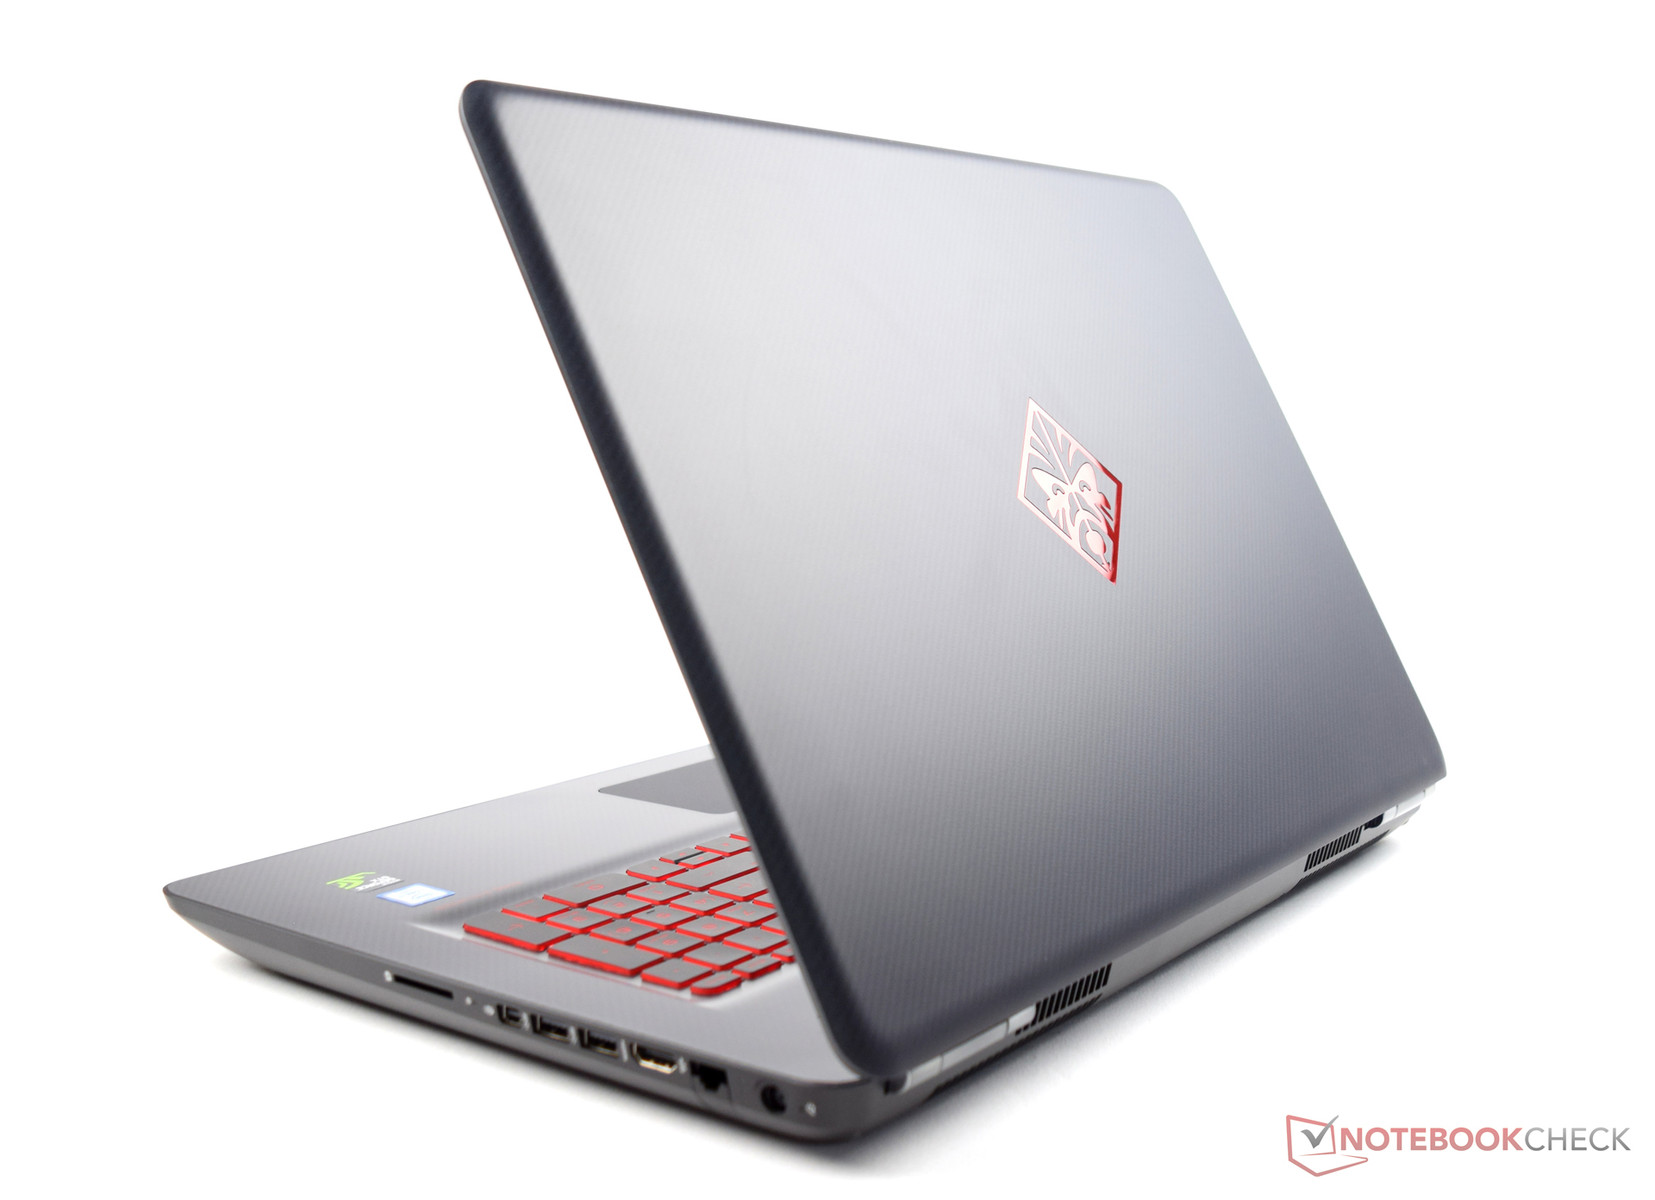
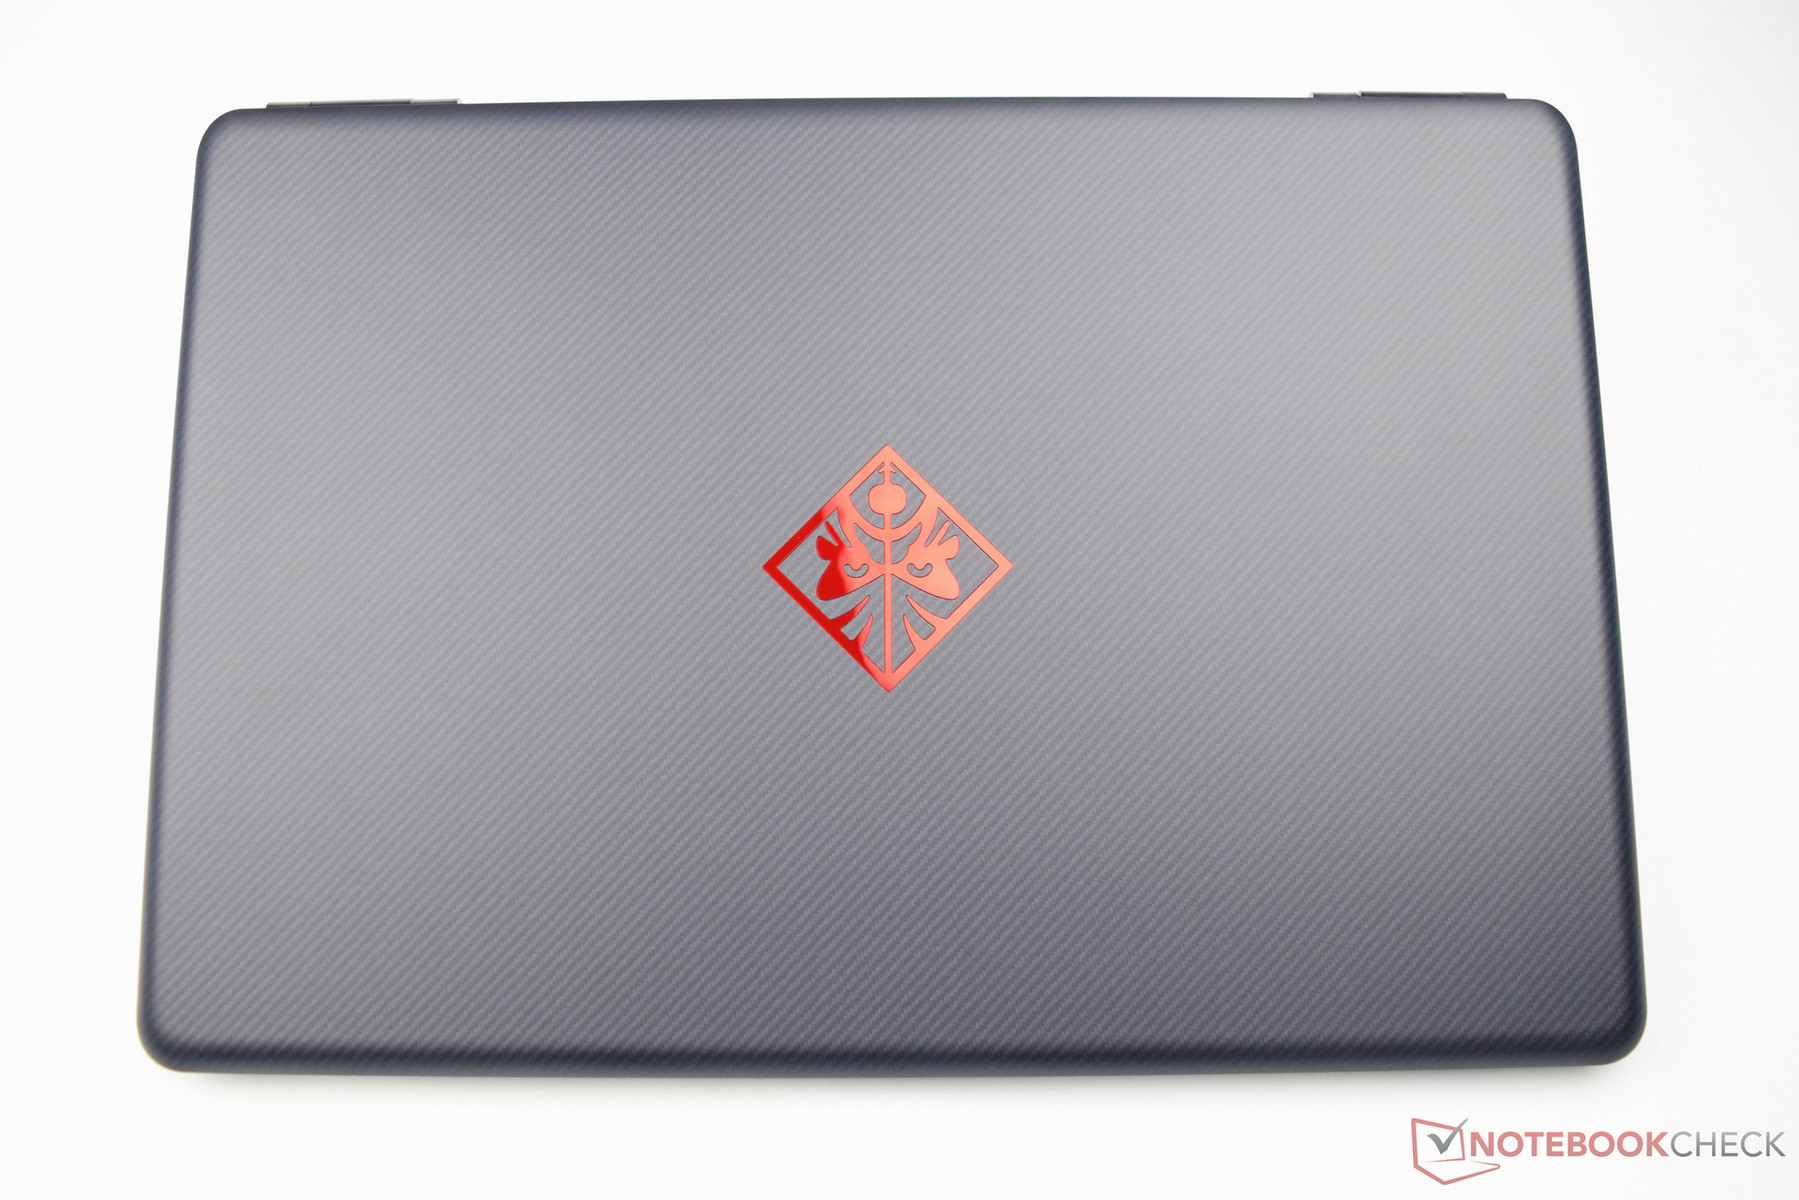
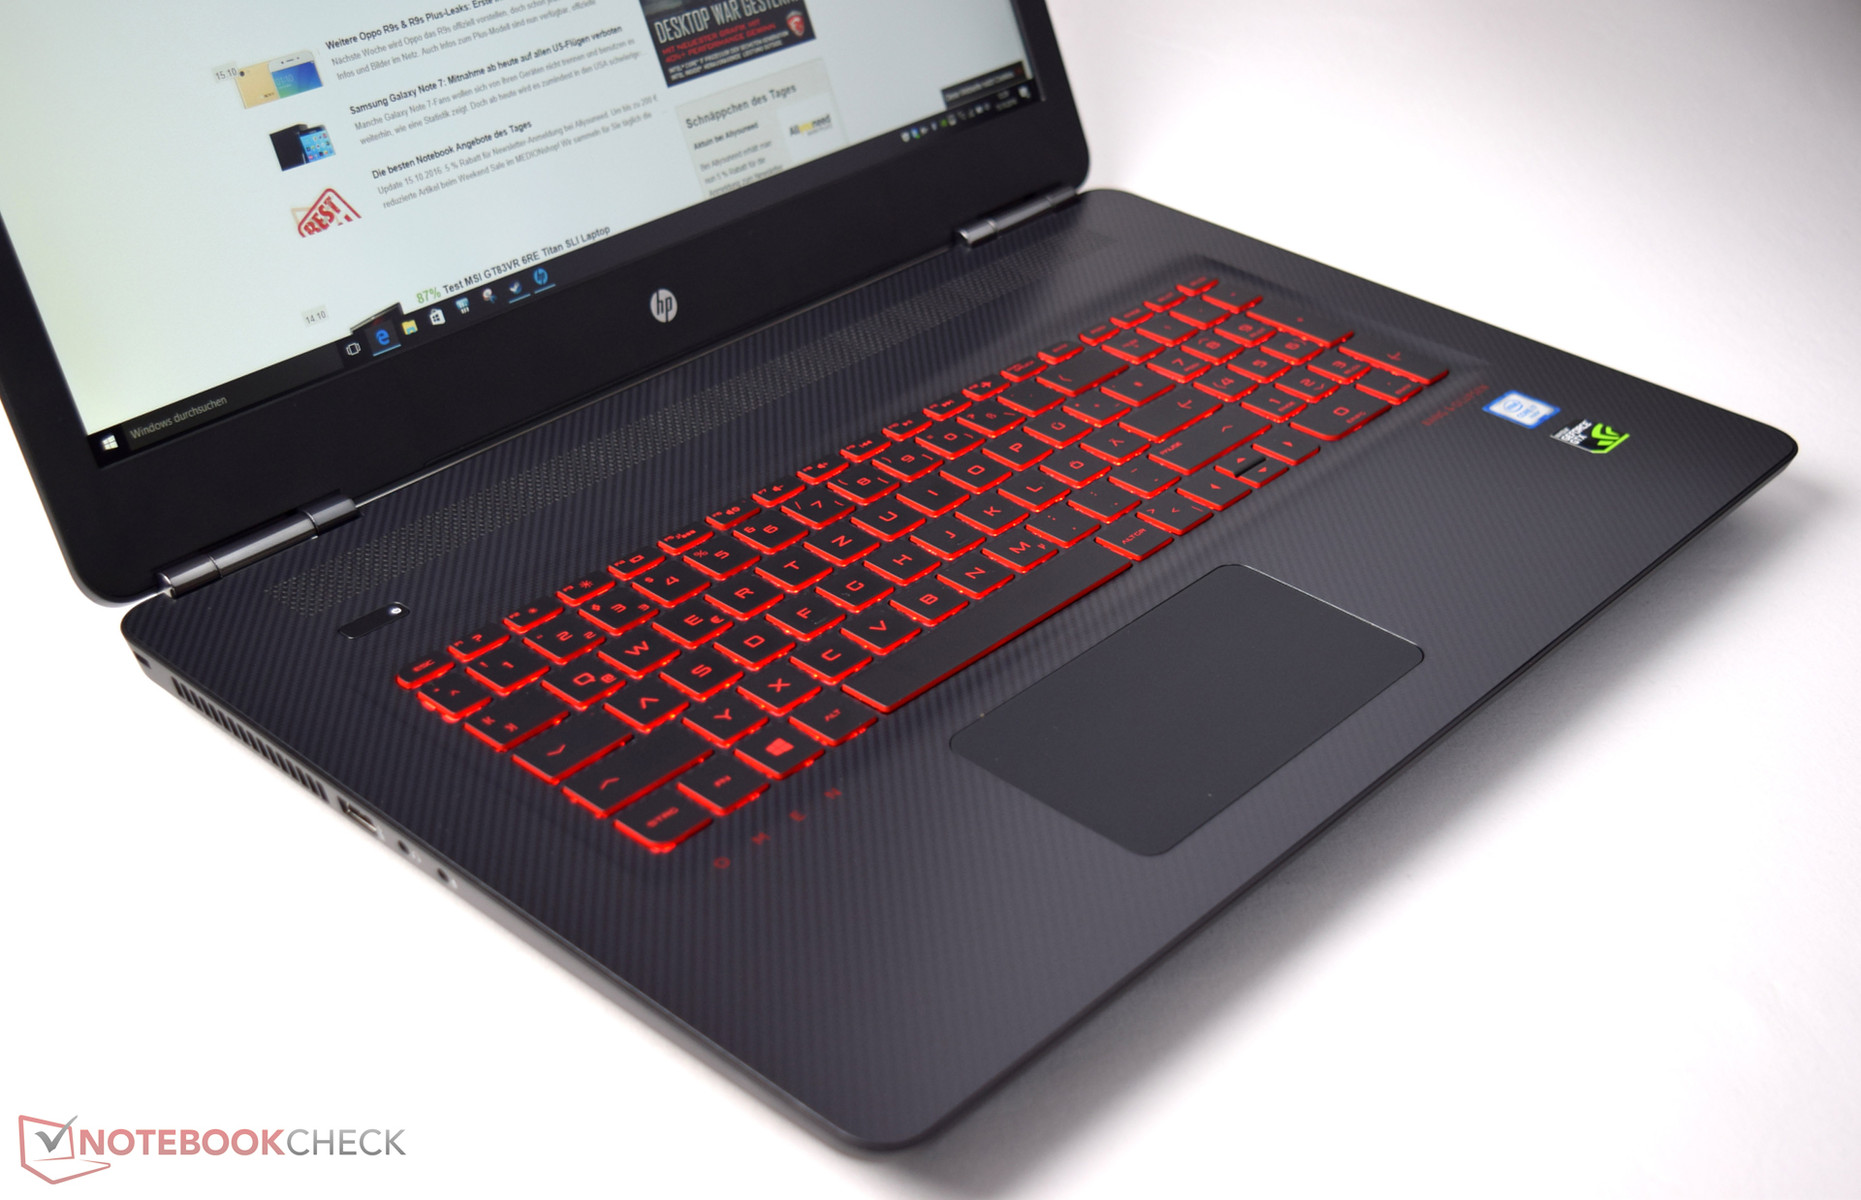
Mucha gente piensa en portátiles de oficina business cuando oyen HP, pero el añadido Omen representa a la serie de gaming de HP. Nuestro modelo de pruebas Omen 17-w110ng puede cumplir con las expectativas para un portátil gaming. Los usuarios se llevan una potente combinación CPU/GPU dentro de un chasis estiloso, pero está hecho dep lástico y no tiene unidad óptica. La falta de dicha unidad no es tan importante cuando tienes en cuenta plataformas gaming como Steam, dónde puedes descargar tus juegos.
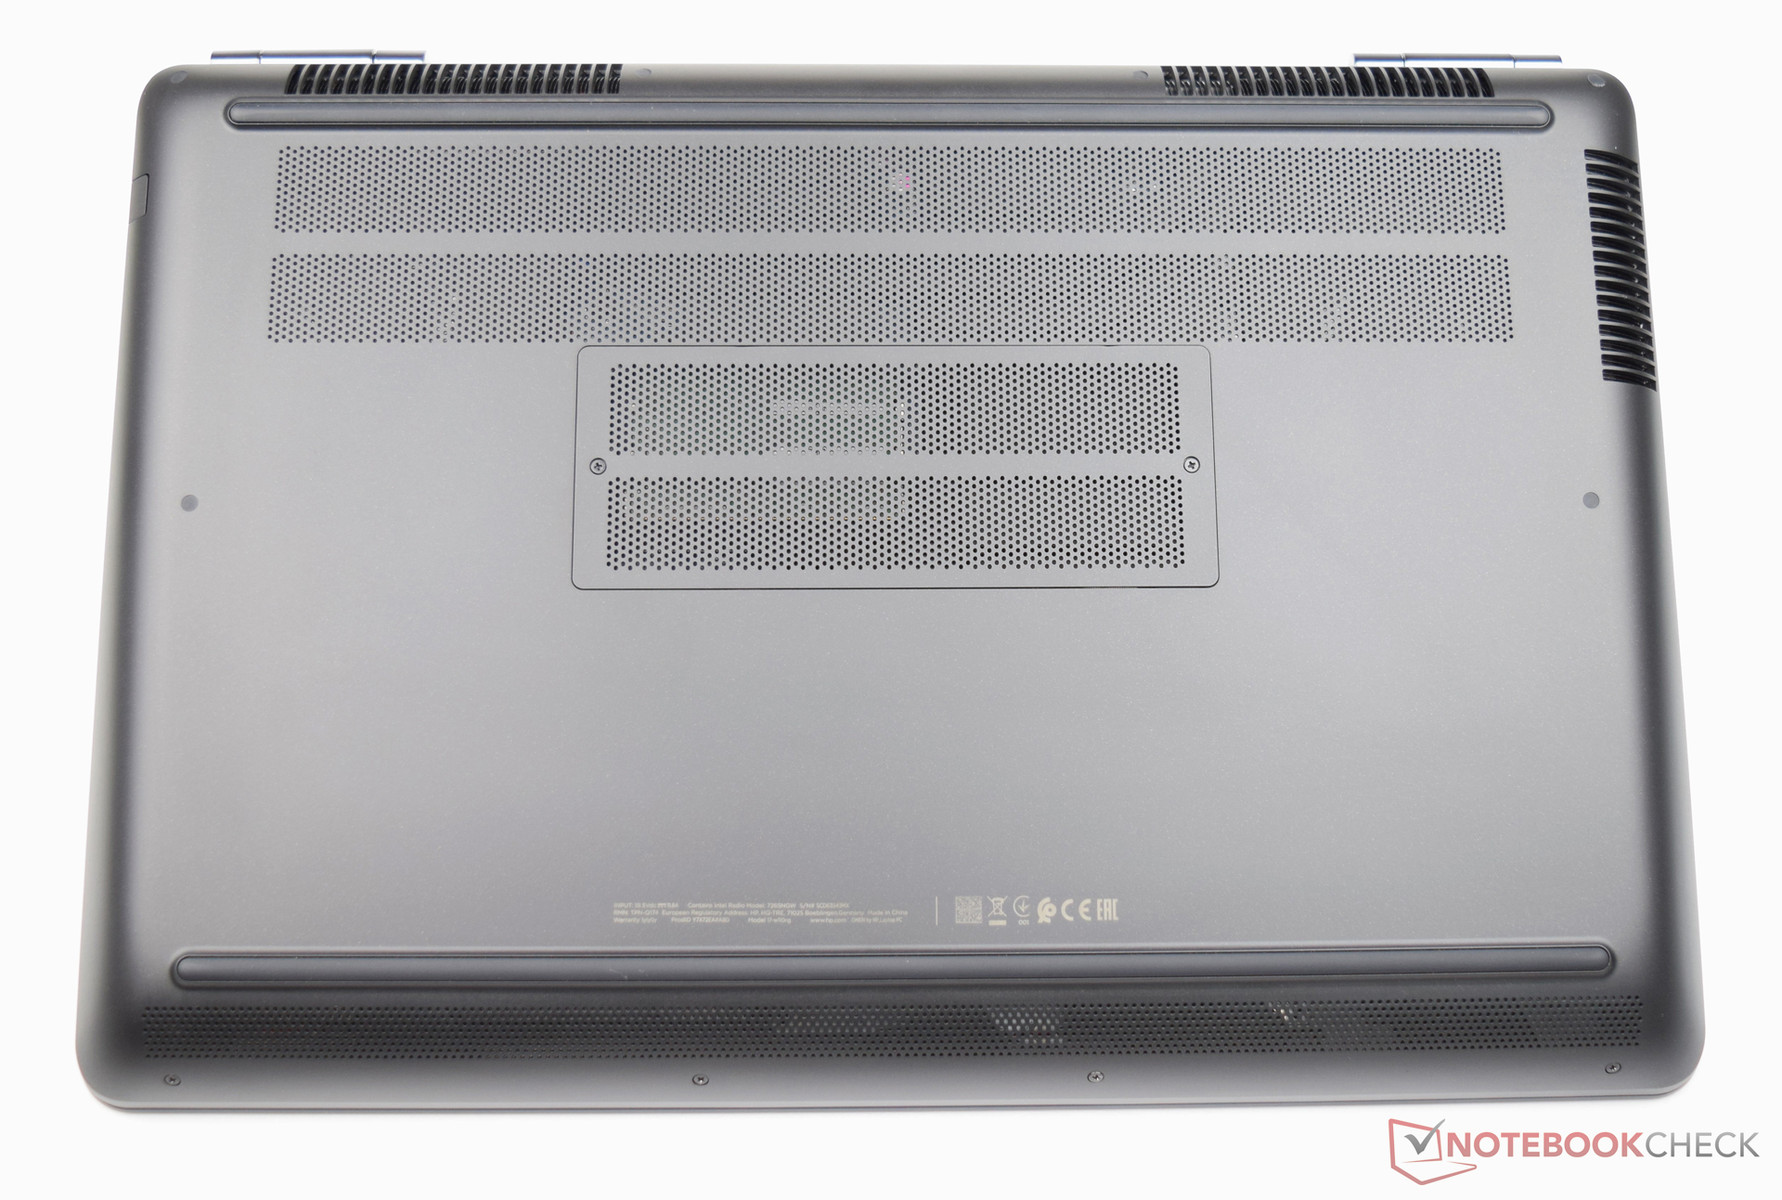
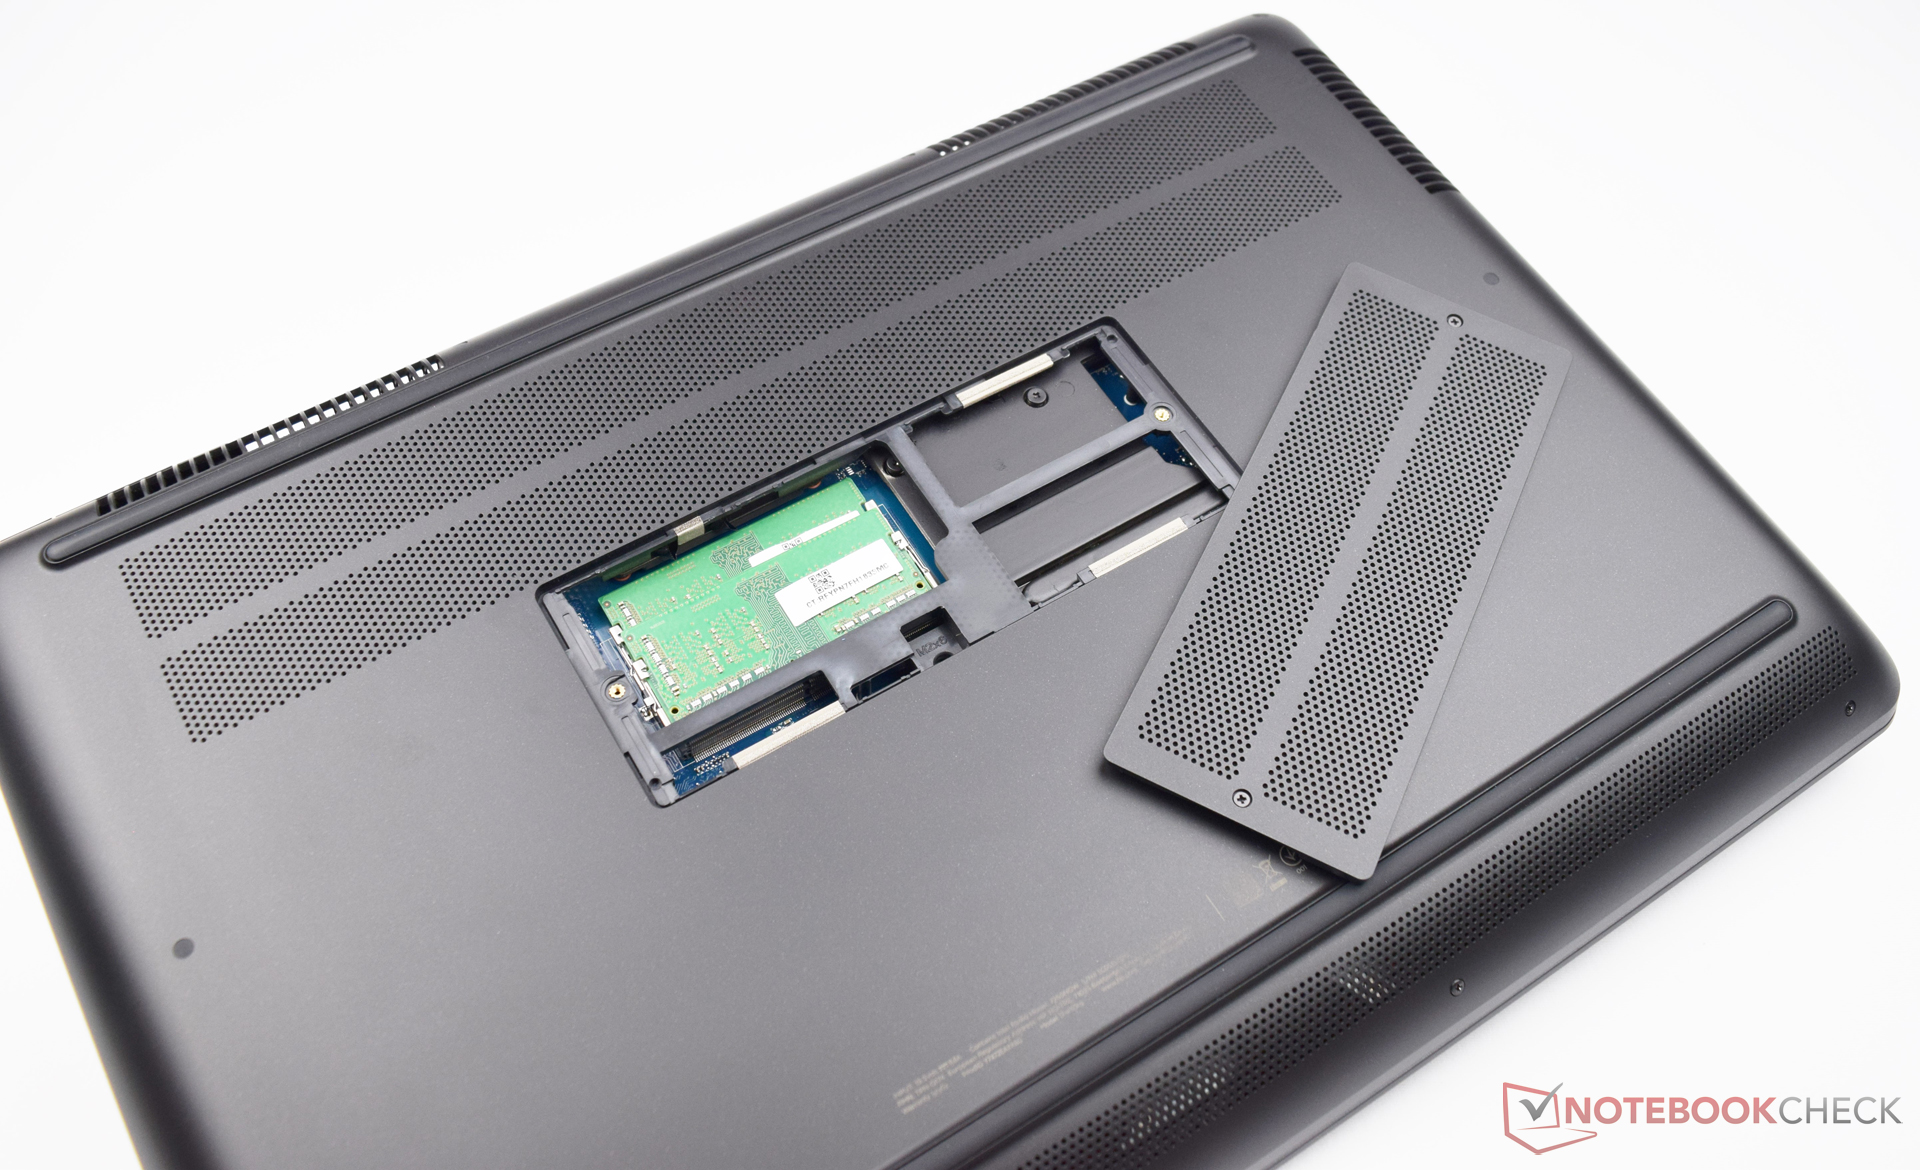
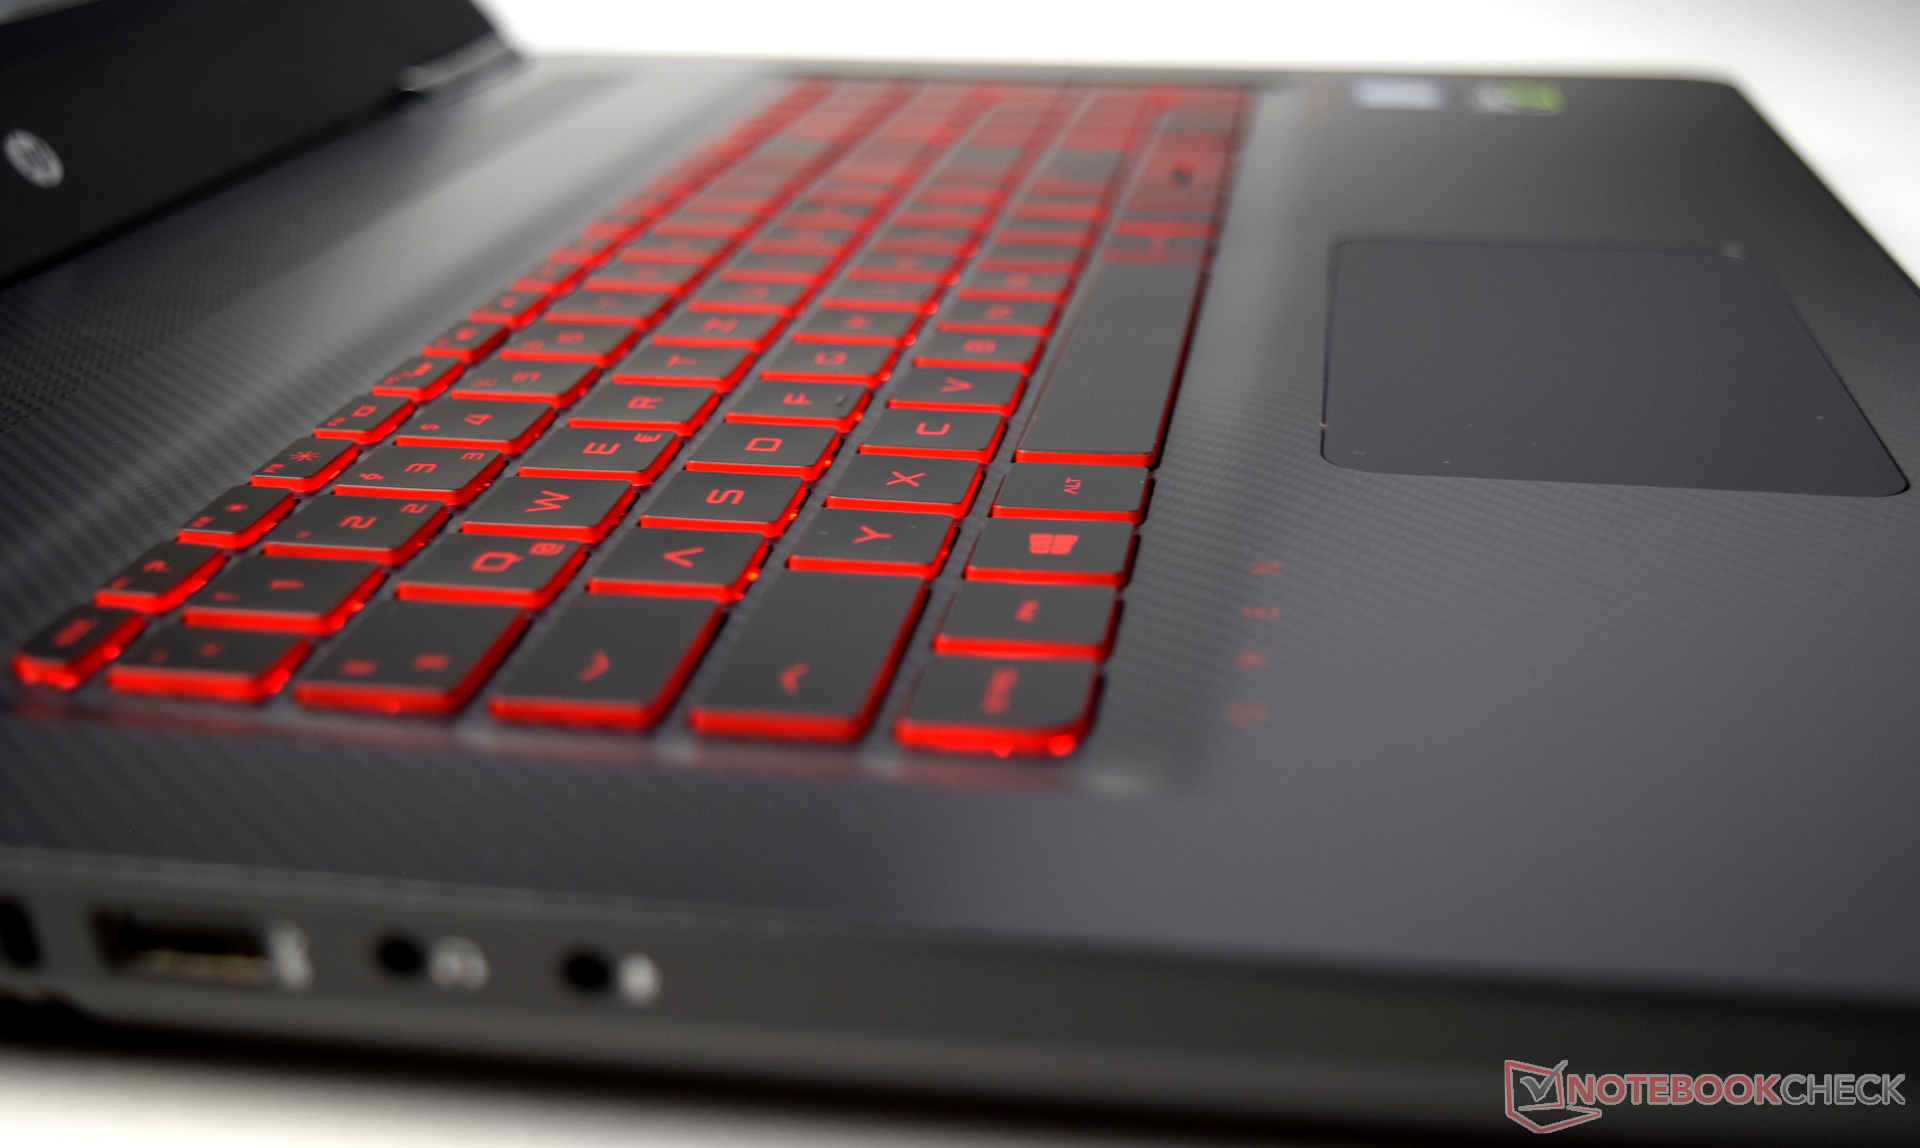
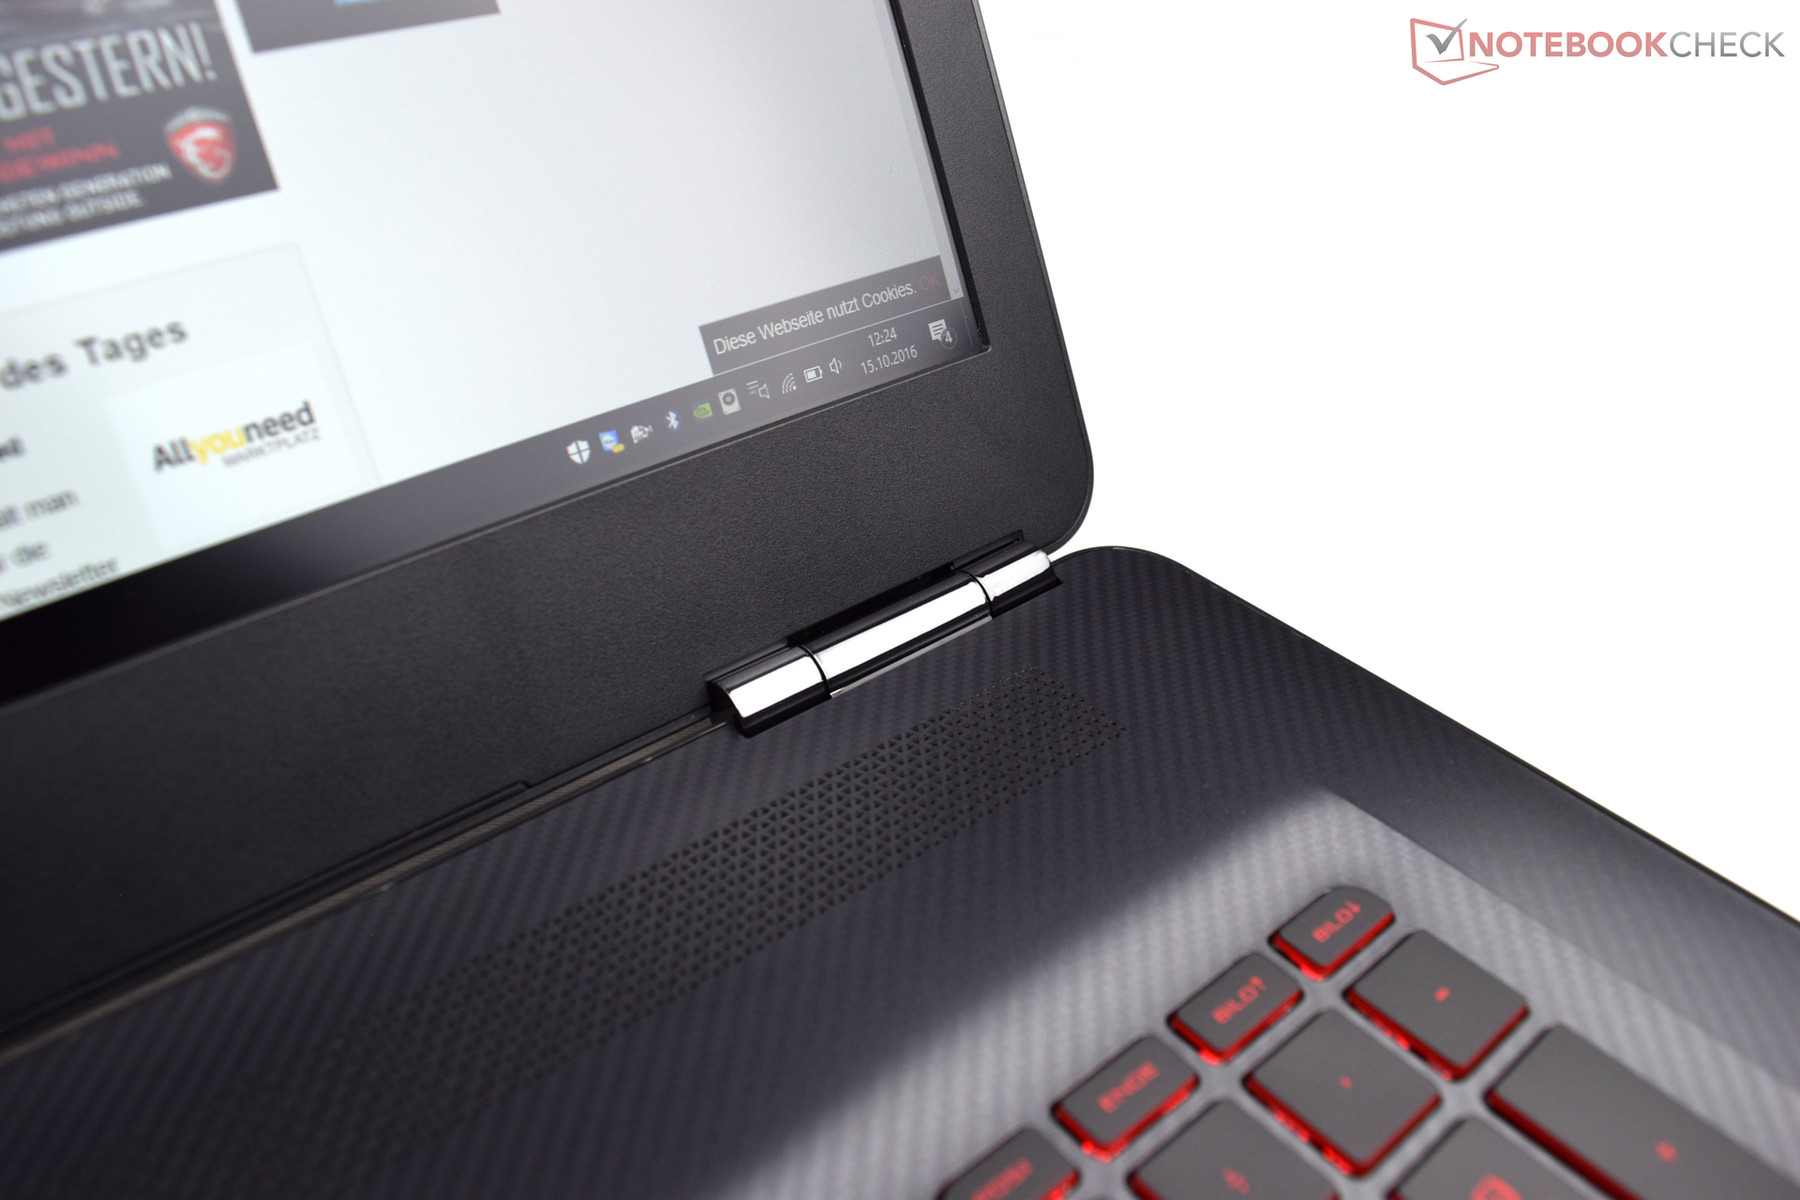
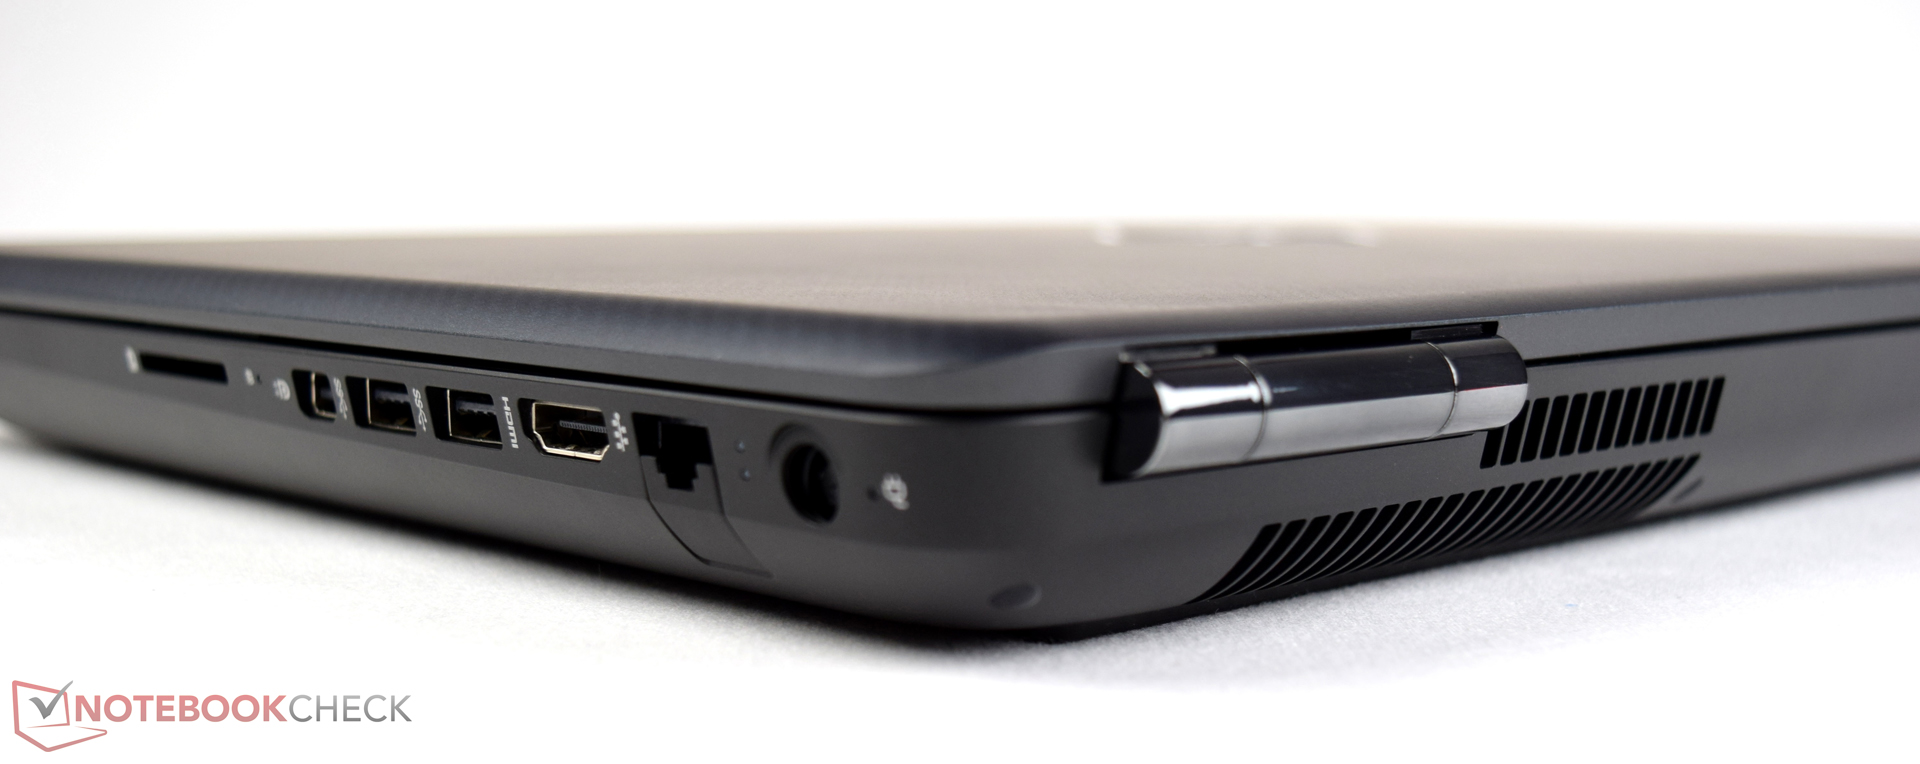
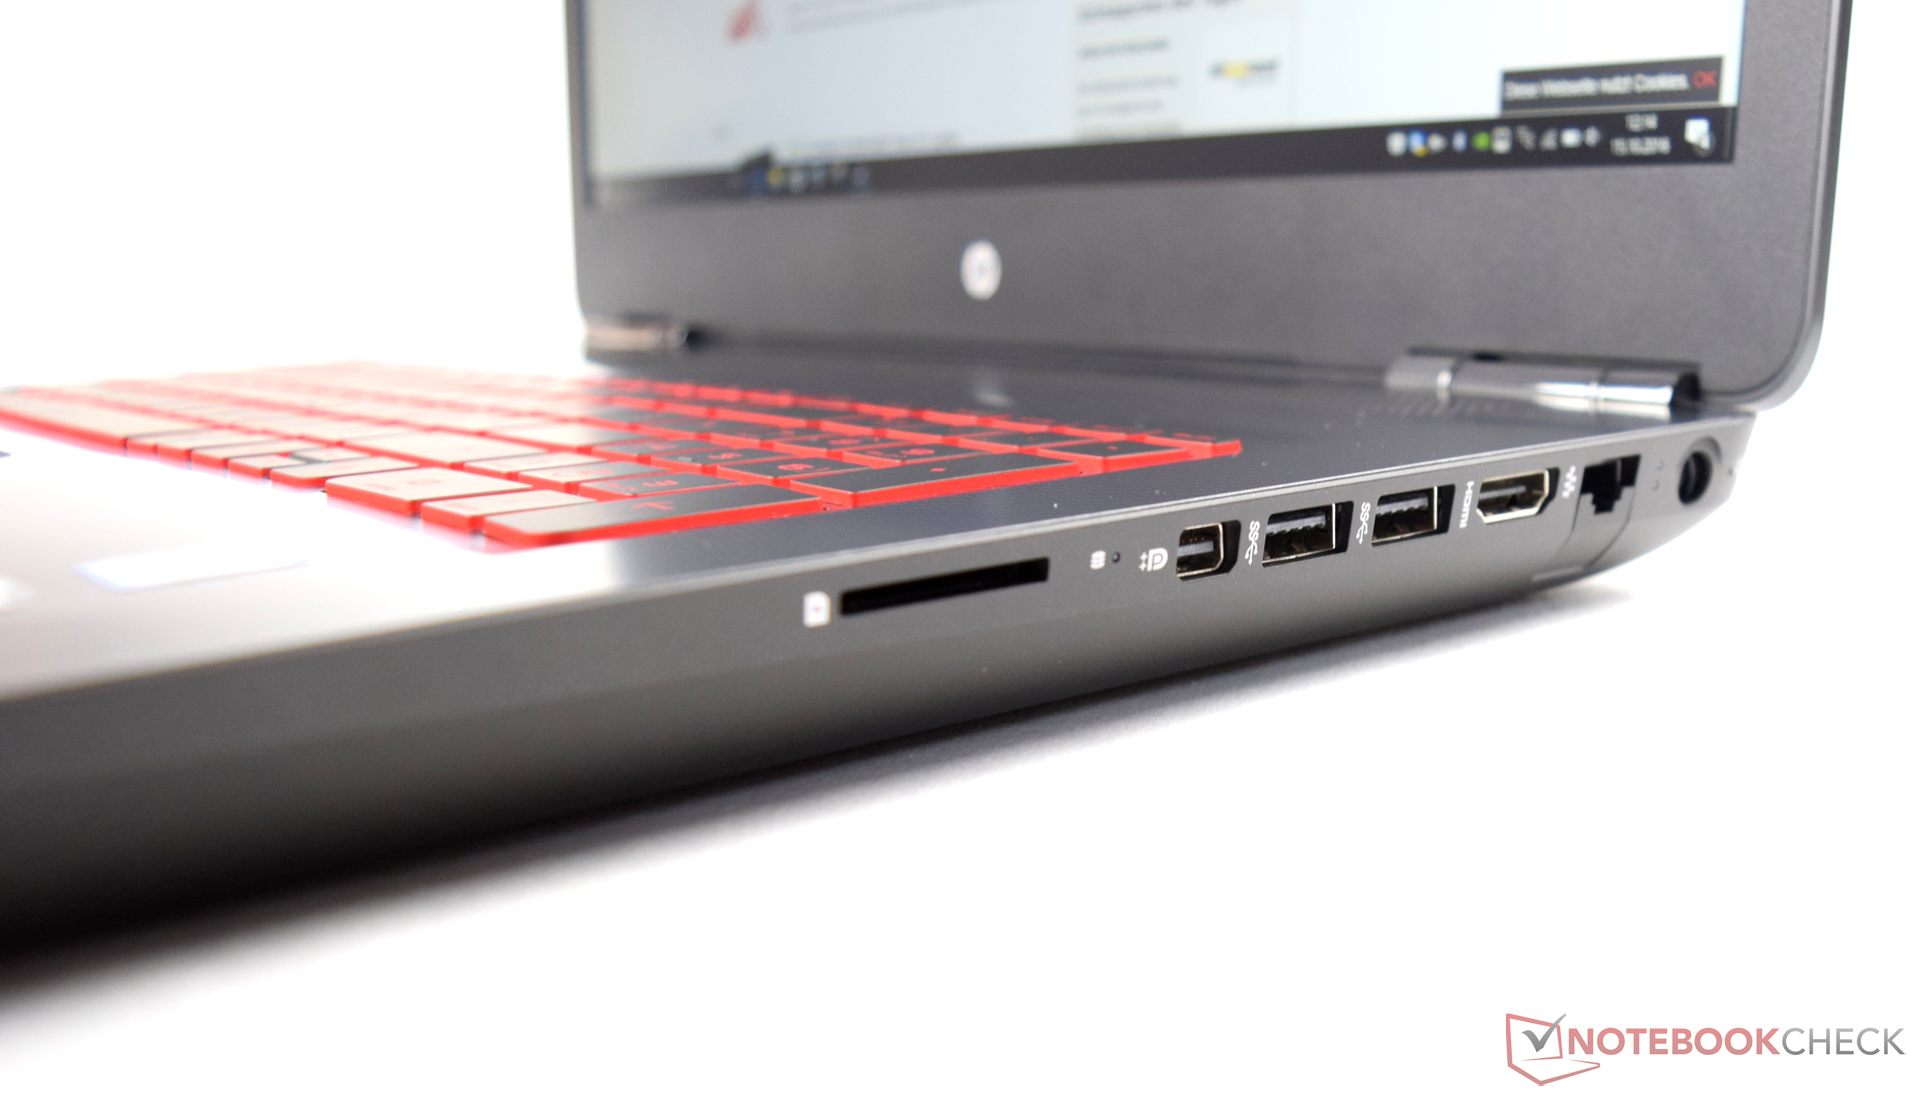
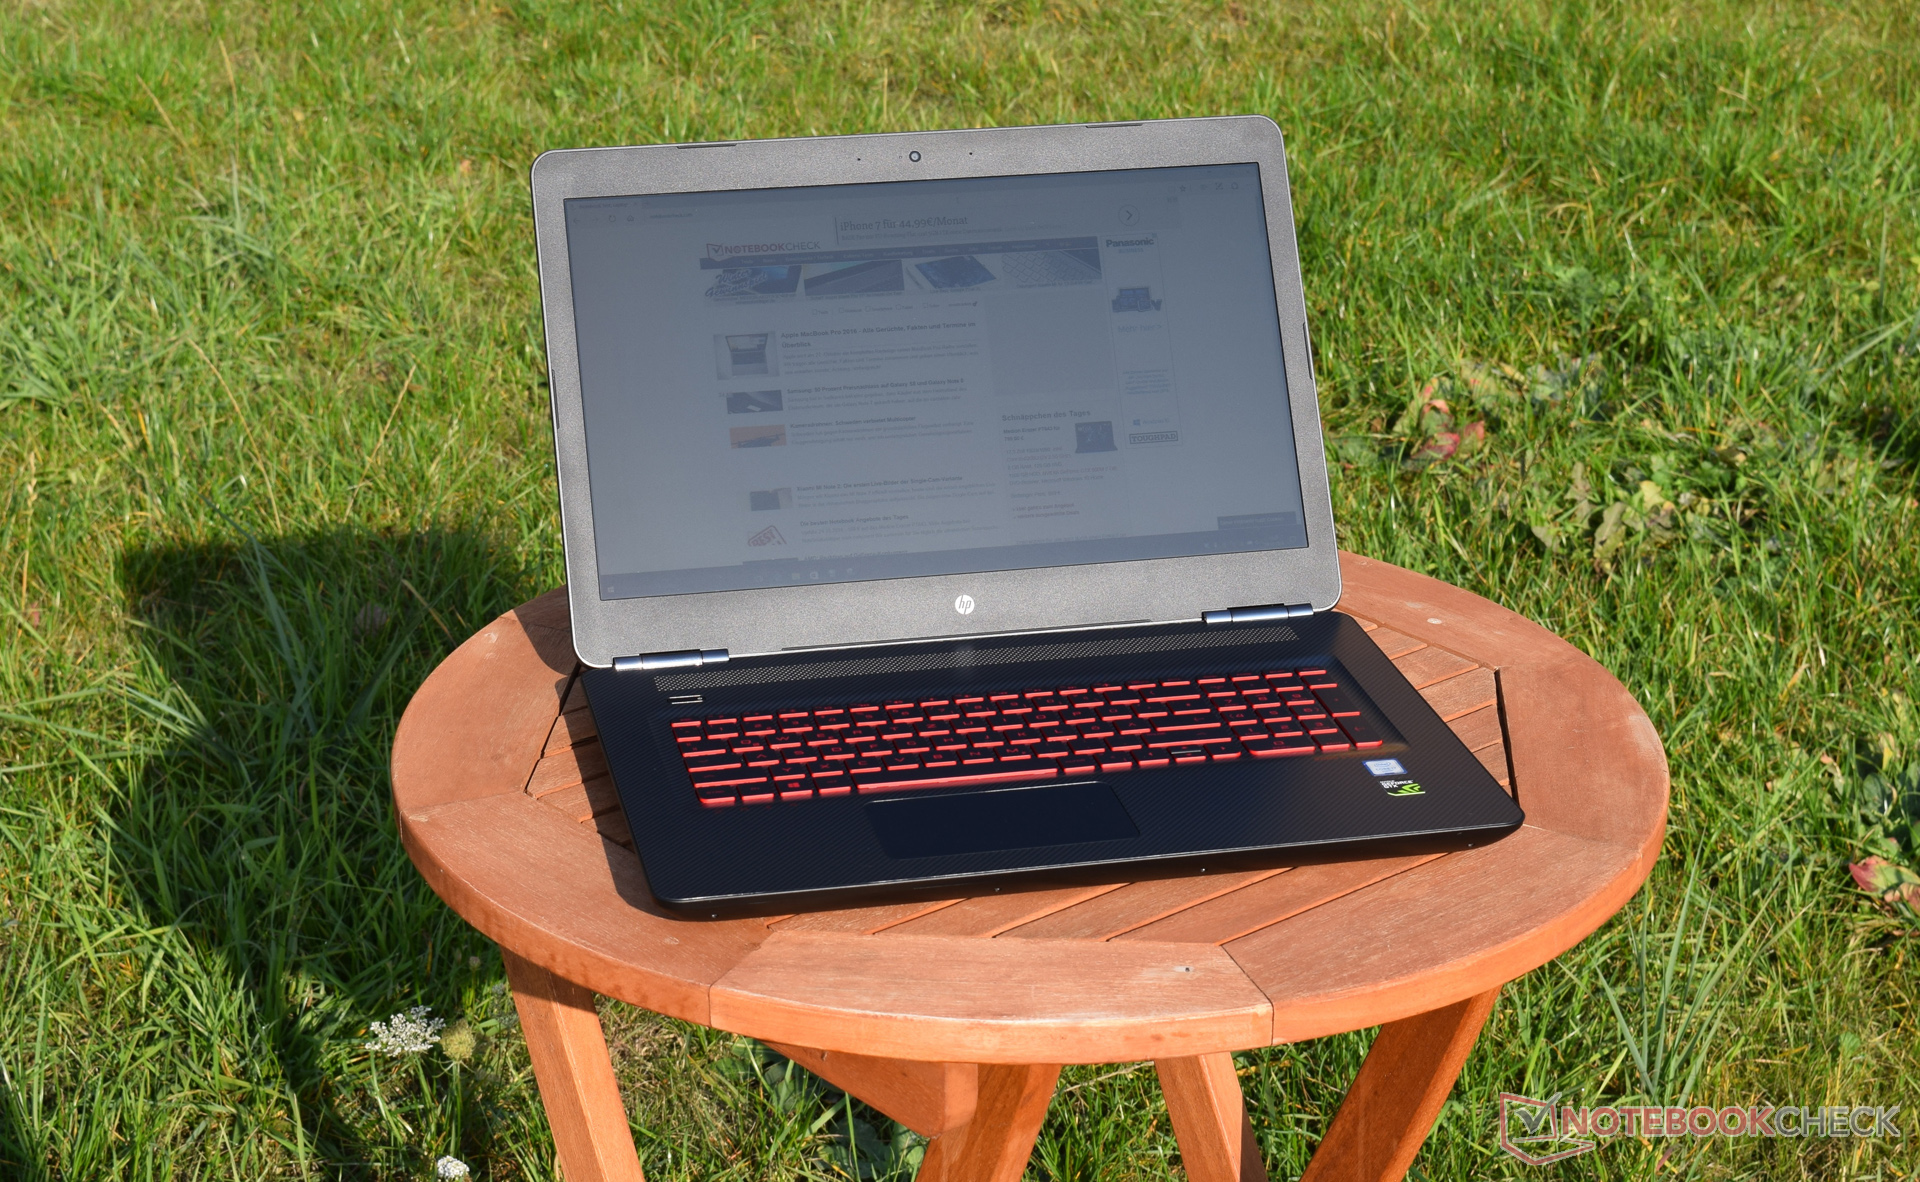
Algo cuestionable es la selección de puertos con sólo 3 puertos USB 3.0. Habríamos esperado al menos un puerto USB 3.1 Gen.2 con conector Type-C. HP debería también echarle otro vistazo a los dispositivos de entrada. HAblamos del touchpad en particular, que parece barato para este nivel de precio. Las dimensiones tampoco son perfectas, ya que una altura de sólo 6.5 cm no es muy generosa.
Con todo, el HP Omen 17-w110ng es un buen paquete por un precio justo. El rendimiento del sistema gaming no da motivo de quejas. El portátil va muy bien, y puedes disfrutar de juegos sin restricción alguna.
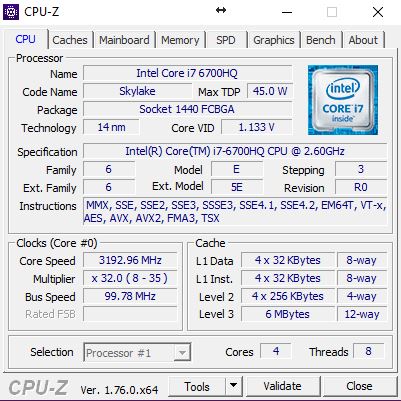
El paquete en general es bastante convincente, a pesar de los defectos mencionados. El rendimiento es muy bueno, y el dispositivo fue diseñado para jugones, lo que queda apoyado por nuestros resultados. La Intel Core i7-6700HQ ofrece rendimiento suficiente para todas las aplicaciones, e incluso se puede jugar a los juegos exigentes en FHD (a veces incluso 4K) gracias a la Nvidia GeForce GTX 1070. El precio también es atractivo a 1800 Euros. Dispositivos similares de la competencia suelen costar 2000-2500 Euros, por lo que la serie Omen de HP definitivamente debería estar en tu lista.
Ésta es una versión acortada del análisis original. Puedes leer el análisis completo en inglés aquí.
HP Omen 17-w110ng
- 10/26/2016 v5.1 (old)
Sebastian Bade
Price comparison
