Breve análisis de la estación de trabajo Dell Precision 3520 (i7-7820HQ, M620M)


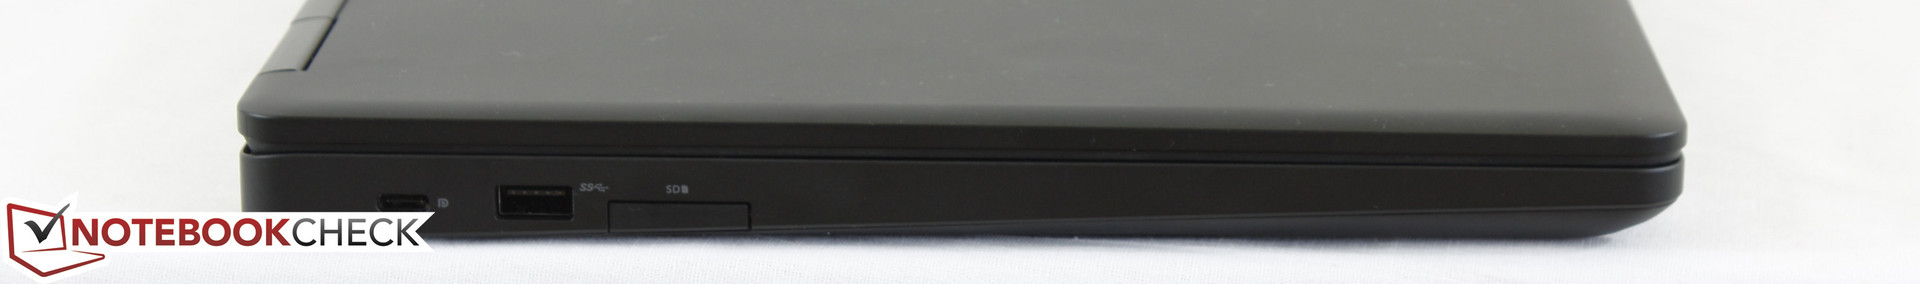
| SD Card Reader | |
| average JPG Copy Test (av. of 3 runs) | |
| Dell Precision 3520 | |
| Dell Precision 5520 UHD | |
| Dell Precision 3510 | |
| maximum AS SSD Seq Read Test (1GB) | |
| Dell Precision 5520 UHD | |
| Dell Precision 3510 | |
| Dell Precision 3520 | |
| Networking | |
| iperf3 transmit AX12 | |
| Dell Precision 5520 UHD | |
| Dell Precision 3520 | |
| iperf3 receive AX12 | |
| Dell Precision 3520 | |
| Dell Precision 5520 UHD | |
| |||||||||||||||||||||||||
iluminación: 88 %
Brillo con batería: 346 cd/m²
Contraste: 932:1 (Negro: 0.37 cd/m²)
ΔE ColorChecker Calman: 5 | ∀{0.5-29.43 Ø4.71}
ΔE Greyscale Calman: 6.2 | ∀{0.09-98 Ø4.96}
94.7% sRGB (Argyll 1.6.3 3D)
61.8% AdobeRGB 1998 (Argyll 1.6.3 3D)
69.3% AdobeRGB 1998 (Argyll 3D)
94.8% sRGB (Argyll 3D)
72.7% Display P3 (Argyll 3D)
Gamma: 2.35
CCT: 6702 K
| Dell Precision 3520 1920x1080, 15.6" | Dell Precision 3510 LGD04AF, K96D2_156WHU, , 1366x768, 15.6" | Dell Precision 5520 UHD SHP1476, , 3840x2160, 15.6" | Lenovo ThinkPad P50 LP156WF6-SPK1, , 1920x1080, 15.6" | HP ZBook 15 G3 Samsung SDC5344, , 1920x1080, 15.6" | Lenovo ThinkPad T570-20HAS01E00 BOE NV156QUM-N44, , 3840x2160, 15.6" | |
|---|---|---|---|---|---|---|
| Display | -38% | -1% | -42% | -2% | -4% | |
| Display P3 Coverage (%) | 72.7 | 41.48 -43% | 67.4 -7% | 39.13 -46% | 66.8 -8% | 70 -4% |
| sRGB Coverage (%) | 94.8 | 62.4 -34% | 98.5 4% | 58.5 -38% | 95.5 1% | 91.1 -4% |
| AdobeRGB 1998 Coverage (%) | 69.3 | 42.86 -38% | 68.9 -1% | 40.45 -42% | 69 0% | 66.7 -4% |
| Response Times | 1% | -22% | 14% | -8% | 35% | |
| Response Time Grey 50% / Grey 80% * (ms) | 48 ? | 56 ? -17% | 59.2 ? -23% | 46 ? 4% | 54 ? -13% | 41.6 ? 13% |
| Response Time Black / White * (ms) | 34.4 ? | 28 ? 19% | 41.6 ? -21% | 26 ? 24% | 35.6 ? -3% | 15.2 ? 56% |
| PWM Frequency (Hz) | 1064 ? | 198 ? | 926 ? | |||
| Screen | -41% | 10% | -6% | -6% | 3% | |
| Brightness middle (cd/m²) | 345 | 199 -42% | 372.4 8% | 263 -24% | 306 -11% | 339 -2% |
| Brightness (cd/m²) | 329 | 201 -39% | 368 12% | 236 -28% | 289 -12% | 314 -5% |
| Brightness Distribution (%) | 88 | 83 -6% | 90 2% | 78 -11% | 85 -3% | 89 1% |
| Black Level * (cd/m²) | 0.37 | 0.4 -8% | 0.48 -30% | 0.34 8% | 0.34 8% | 0.36 3% |
| Contrast (:1) | 932 | 498 -47% | 776 -17% | 774 -17% | 900 -3% | 942 1% |
| Colorchecker dE 2000 * | 5 | 9 -80% | 2.6 48% | 2.35 53% | 5.1 -2% | 4.2 16% |
| Colorchecker dE 2000 max. * | 8 | 13.3 -66% | 5.6 30% | 9.9 -24% | 7.8 2% | |
| Greyscale dE 2000 * | 6.2 | 9.6 -55% | 3.7 40% | 3.33 46% | 7.4 -19% | 5.1 18% |
| Gamma | 2.35 94% | 2.41 91% | 2.14 103% | 2.38 92% | 2.37 93% | 2.16 102% |
| CCT | 6702 97% | 10695 61% | 7096 92% | 6917 94% | 7263 89% | 6569 99% |
| Color Space (Percent of AdobeRGB 1998) (%) | 61.8 | 39.6 -36% | 63 2% | 37 -40% | 63 2% | 59.4 -4% |
| Color Space (Percent of sRGB) (%) | 94.7 | 62.4 -34% | 99 5% | 58 -39% | 95 0% | 91 -4% |
| Media total (Programa/Opciones) | -26% /
-35% | -4% /
3% | -11% /
-11% | -5% /
-6% | 11% /
6% |
* ... más pequeño es mejor
Parpadeo de Pantalla / PWM (Pulse-Width Modulation)
| Parpadeo de Pantalla / PWM detectado | 1064 Hz | ≤ 90 % de brillo | 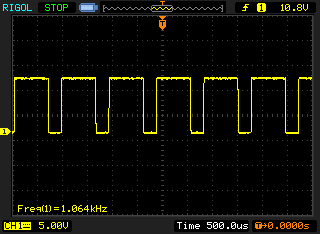 |
La retroiluminación del display parpadea a 1064 Hz (seguramente usa PWM - Pulse-Width Modulation) a un brillo del 90 % e inferior. Sobre este nivel de brillo no debería darse parpadeo / PWM. La frecuencia de 1064 Hz es bastante alta, por lo que la mayoría de gente sensible al parpadeo no debería ver parpadeo o tener fatiga visual. Comparación: 52 % de todos los dispositivos testados no usaron PWM para atenuar el display. Si se usó, medimos una media de 7754 (mínimo: 5 - máxmo: 343500) Hz. | |||

Tiempos de respuesta del display
| ↔ Tiempo de respuesta de Negro a Blanco | ||
|---|---|---|
| 34.4 ms ... subida ↗ y bajada ↘ combinada | ↗ 17.2 ms subida | 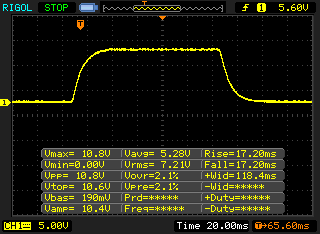 |
| ↘ 17.2 ms bajada | ||
| La pantalla mostró tiempos de respuesta lentos en nuestros tests y podría ser demasiado lenta para los jugones. En comparación, todos los dispositivos de prueba van de ##min### (mínimo) a 240 (máximo) ms. » 92 % de todos los dispositivos son mejores. Eso quiere decir que el tiempo de respuesta es peor que la media (19.8 ms) de todos los dispositivos testados. | ||
| ↔ Tiempo de respuesta 50% Gris a 80% Gris | ||
| 48 ms ... subida ↗ y bajada ↘ combinada | ↗ 24.4 ms subida | 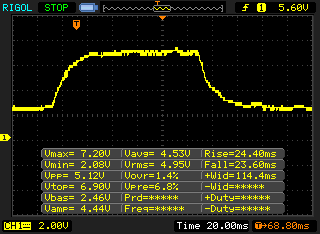 |
| ↘ 23.6 ms bajada | ||
| La pantalla mostró tiempos de respuesta lentos en nuestros tests y podría ser demasiado lenta para los jugones. En comparación, todos los dispositivos de prueba van de ##min### (mínimo) a 636 (máximo) ms. » 82 % de todos los dispositivos son mejores. Eso quiere decir que el tiempo de respuesta es peor que la media (31 ms) de todos los dispositivos testados. | ||
| PCMark 8 | |
| Home Score Accelerated v2 | |
| Dell Precision 3510 | |
| Lenovo ThinkPad P50 | |
| Dell Precision 3520 | |
| HP ZBook 15 G3 | |
| Dell Precision 5520 UHD | |
| Work Score Accelerated v2 | |
| Dell Precision 3510 | |
| HP ZBook 15 G3 | |
| Dell Precision 3520 | |
| Lenovo ThinkPad P50 | |
| Dell Precision 5520 UHD | |
| PCMark 8 Home Score Accelerated v2 | 4183 puntos | |
| PCMark 8 Work Score Accelerated v2 | 5194 puntos | |
ayuda | ||
| Dell Precision 3520 Toshiba XG4 NVMe (THNSN5512GPUK) | Dell Precision 5520 UHD Samsung SM961 MZVKW512HMJP m.2 PCI-e | HP ZBook 15 G3 Samsung SM951 MZVPV512HDGL m.2 PCI-e | Lenovo ThinkPad T570-20HAS01E00 Samsung PM961 NVMe MZVLW512HMJP | Lenovo ThinkPad P51 20HH0016GE Samsung PM961 NVMe MZVLW512HMJP | |
|---|---|---|---|---|---|
| CrystalDiskMark 3.0 | 87% | 86% | 43% | 79% | |
| Read Seq (MB/s) | 1096 | 2253 106% | 1502 37% | 1210 10% | 1705 56% |
| Write Seq (MB/s) | 476.3 | 1662 249% | 1538 223% | 1134 138% | 1541 224% |
| Read 512 (MB/s) | 829 | 459.1 -45% | 1164 40% | 789 -5% | 1038 25% |
| Write 512 (MB/s) | 456.1 | 1611 253% | 1432 214% | 903 98% | 1157 154% |
| Read 4k (MB/s) | 35.2 | 56.1 59% | 59.1 68% | 58.4 66% | 61.3 74% |
| Write 4k (MB/s) | 128 | 169.4 32% | 207.3 62% | 144.1 13% | 176 38% |
| Read 4k QD32 (MB/s) | 552 | 633 15% | 798 45% | 559 1% | 664 20% |
| Write 4k QD32 (MB/s) | 396.1 | 506 28% | 393.8 -1% | 474.4 20% | 560 41% |

| LuxMark v2.0 64Bit | |
| Room GPUs-only | |
| Dell Precision 5520 UHD | |
| HP ZBook 15 G3 | |
| Dell Precision 3520 | |
| Lenovo ThinkPad P50 | |
| Lenovo ThinkPad P70-20ER000BMS | |
| Dell Precision 3510 | |
| Sala GPUs-only | |
| Dell Precision 5520 UHD | |
| HP ZBook 15 G3 | |
| Dell Precision 3520 | |
| Lenovo ThinkPad P50 | |
| Lenovo ThinkPad P70-20ER000BMS | |
| Dell Precision 3510 | |
| SiSoft Sandra 2016 | |
| Image Processing | |
| HP ZBook 15 G3 | |
| Lenovo ThinkPad P50 | |
| Dell Precision 3520 | |
| GP Cryptography (Higher Security AES256+SHA2-512) | |
| Lenovo ThinkPad P50 | |
| HP ZBook 15 G3 | |
| Dell Precision 3520 | |
| GP Financial Analysis (FP High/Double Precision) | |
| HP ZBook 15 G3 | |
| Lenovo ThinkPad P50 | |
| Dell Precision 3520 | |
| SPECviewperf 11 | |
| 1920x1080 Siemens NX | |
| Lenovo ThinkPad P50 | |
| HP ZBook 15 G3 | |
| Dell Precision 3520 | |
| Lenovo ThinkPad P70-20ER000BMS | |
| Dell Precision 3510 | |
| 1920x1080 Tcvis | |
| HP ZBook 15 G3 | |
| Lenovo ThinkPad P50 | |
| Dell Precision 3520 | |
| Lenovo ThinkPad P70-20ER000BMS | |
| Dell Precision 3510 | |
| 1920x1080 SolidWorks | |
| Dell Precision 3520 | |
| HP ZBook 15 G3 | |
| Lenovo ThinkPad P70-20ER000BMS | |
| Lenovo ThinkPad P50 | |
| Dell Precision 3510 | |
| 1920x1080 Pro/ENGINEER | |
| HP ZBook 15 G3 | |
| Dell Precision 3520 | |
| Lenovo ThinkPad P50 | |
| Lenovo ThinkPad P70-20ER000BMS | |
| Dell Precision 3510 | |
| 1920x1080 Maya | |
| HP ZBook 15 G3 | |
| Lenovo ThinkPad P50 | |
| Dell Precision 3520 | |
| Lenovo ThinkPad P70-20ER000BMS | |
| Dell Precision 3510 | |
| 1920x1080 Lightwave | |
| Dell Precision 3520 | |
| Lenovo ThinkPad P70-20ER000BMS | |
| HP ZBook 15 G3 | |
| Lenovo ThinkPad P50 | |
| Dell Precision 3510 | |
| 1920x1080 Ensight | |
| HP ZBook 15 G3 | |
| Lenovo ThinkPad P50 | |
| Dell Precision 3520 | |
| Lenovo ThinkPad P70-20ER000BMS | |
| Dell Precision 3510 | |
| 1920x1080 Catia | |
| Lenovo ThinkPad P50 | |
| HP ZBook 15 G3 | |
| Dell Precision 3520 | |
| Lenovo ThinkPad P70-20ER000BMS | |
| Dell Precision 3510 | |
| Unigine Heaven 2.1 - 1280x1024 high, Tesselation (normal), DirectX11 AA:off AF:1x | |
| Lenovo ThinkPad P50 | |
| HP ZBook 15 G3 | |
| Dell Precision 3520 | |
| Dell Precision 3510 | |
| Unigine Valley 1.0 | |
| 1920x1080 Extreme HD DirectX AA:x8 | |
| Lenovo ThinkPad P50 | |
| HP ZBook 15 G3 | |
| Dell Precision 3520 | |
| 1920x1080 Extreme HD Preset OpenGL AA:x8 | |
| HP ZBook 15 G3 | |
| Dell Precision 3520 | |
| Lenovo ThinkPad P50 | |
| 3DMark 11 - 1280x720 Performance GPU | |
| Lenovo ThinkPad P50 | |
| Dell Precision 5520 UHD | |
| HP ZBook 15 G3 | |
| Dell Precision 3520 | |
| Lenovo ThinkPad P70-20ER000BMS | |
| 3DMark | |
| 1280x720 Cloud Gate Standard Graphics | |
| Lenovo ThinkPad P50 | |
| HP ZBook 15 G3 | |
| Dell Precision 5520 UHD | |
| Dell Precision 3520 | |
| Lenovo ThinkPad P70-20ER000BMS | |
| Dell Precision 3510 | |
| 1920x1080 Fire Strike Graphics | |
| Dell Precision 5520 UHD | |
| Lenovo ThinkPad P50 | |
| HP ZBook 15 G3 | |
| Dell Precision 3520 | |
| Lenovo ThinkPad P70-20ER000BMS | |
| Dell Precision 3510 | |
| 1280x720 Ice Storm Standard Graphics | |
| Dell Precision 3520 | |
| HP ZBook 15 G3 | |
| Lenovo ThinkPad P50 | |
| Lenovo ThinkPad P70-20ER000BMS | |
| Dell Precision 5520 UHD | |
| Unigine Heaven 4.0 | |
| Extreme Preset OpenGL | |
| Lenovo ThinkPad P70-20ER000BMS | |
| Dell Precision 3520 | |
| Extreme Preset DX11 | |
| Lenovo ThinkPad P70-20ER000BMS | |
| Dell Precision 3520 | |
| 3DMark 06 Standard Score | 24751 puntos | |
| 3DMark Vantage P Result | 17237 puntos | |
| 3DMark 11 Performance | 4200 puntos | |
| 3DMark Ice Storm Standard Score | 103599 puntos | |
| 3DMark Cloud Gate Standard Score | 15759 puntos | |
| 3DMark Fire Strike Score | 3059 puntos | |
ayuda | ||
| BioShock Infinite - 1366x768 High Preset | |
| Dell Precision 5520 UHD | |
| HP ZBook 15 G3 | |
| Lenovo ThinkPad P50 | |
| Dell Precision 3520 | |
| Lenovo ThinkPad P70-20ER000BMS | |
| Lenovo ThinkPad T570-20HAS01E00 | |
| Rise of the Tomb Raider - 1920x1080 High Preset AA:FX AF:4x | |
| HP ZBook 15 G3 | |
| Dell Precision 3520 | |
| Lenovo ThinkPad P70-20ER000BMS | |
| Star Wars Battlefront - 1920x1080 Ultra Preset AA:FX | |
| Lenovo ThinkPad P50 | |
| Dell Precision 3520 | |
| Lenovo ThinkPad P70-20ER000BMS | |
| bajo | medio | alto | ultra | |
|---|---|---|---|---|
| BioShock Infinite (2013) | 176.4 | 105.6 | 92.3 | 35.6 |
| GRID 2 (2013) | 192.8 | 147.4 | 126 | 39.1 |
| Company of Heroes 2 (2013) | 51.7 | 44.4 | 27.1 | 11.7 |
| Total War: Rome II (2013) | 190.5 | 139.6 | 114.4 | 17.8 |
| Dirt Rally (2015) | 249 | 118.5 | 62 | 28.2 |
| The Witcher 3 (2015) | 53.9 | 32.83 | 18.62 | 10 |
| Star Wars Battlefront (2015) | 110.6 | 64.3 | 28.92 | 24.37 |
| Rise of the Tomb Raider (2016) | 62.2 | 36.6 | 20.4 | |
| Doom (2016) | 60.4 | 46.3 | 25.2 | 19.5 |
| Warhammer 40.000: Dawn of War III (2017) | 70.3 | 18.7 |
Ruido
| Ocioso |
| 29.6 / 29.6 / 31.2 dB(A) |
| Carga |
| 43 / 46.9 dB(A) |
 | ||
30 dB silencioso 40 dB(A) audible 50 dB(A) ruidosamente alto |
||
min: | ||
(-) La temperatura máxima en la parte superior es de 45.8 °C / 114 F, frente a la media de 38.2 °C / 101 F, que oscila entre 22.2 y 69.8 °C para la clase Workstation.
(-) El fondo se calienta hasta un máximo de 57.1 °C / 135 F, frente a la media de 41.1 °C / 106 F
(+) En reposo, la temperatura media de la parte superior es de 23.7 °C / 75# F, frente a la media del dispositivo de 32 °C / 90 F.
(±) Jugando a The Witcher 3, la temperatura media de la parte superior es de 32 °C / 90 F, frente a la media del dispositivo de 32 °C / 90 F.
(+) Los reposamanos y el panel táctil alcanzan como máximo la temperatura de la piel (34.1 °C / 93.4 F) y, por tanto, no están calientes.
(-) La temperatura media de la zona del reposamanos de dispositivos similares fue de 27.8 °C / 82 F (-6.3 °C / -11.4 F).
Dell Precision 3520 análisis de audio
(+) | los altavoces pueden reproducir a un volumen relativamente alto (#85.6 dB)
Graves 100 - 315 Hz
(-) | casi sin bajos - de media 16.2% inferior a la mediana
(±) | la linealidad de los graves es media (7% delta a frecuencia anterior)
Medios 400 - 2000 Hz
(±) | medias más altas - de media 5.2% más altas que la mediana
(+) | los medios son lineales (3.9% delta a la frecuencia anterior)
Altos 2 - 16 kHz
(+) | máximos equilibrados - a sólo 3.7% de la mediana
(+) | los máximos son lineales (3.5% delta a la frecuencia anterior)
Total 100 - 16.000 Hz
(±) | la linealidad del sonido global es media (15.2% de diferencia con la mediana)
En comparación con la misma clase
» 33% de todos los dispositivos probados de esta clase eran mejores, 10% similares, 57% peores
» El mejor tuvo un delta de 7%, la media fue 17%, el peor fue ###max##%
En comparación con todos los dispositivos probados
» 22% de todos los dispositivos probados eran mejores, 4% similares, 74% peores
» El mejor tuvo un delta de 4%, la media fue 23%, el peor fue ###max##%
Apple MacBook 12 (Early 2016) 1.1 GHz análisis de audio
(+) | los altavoces pueden reproducir a un volumen relativamente alto (#83.6 dB)
Graves 100 - 315 Hz
(±) | lubina reducida - en promedio 11.3% inferior a la mediana
(±) | la linealidad de los graves es media (14.2% delta a frecuencia anterior)
Medios 400 - 2000 Hz
(+) | medios equilibrados - a sólo 2.4% de la mediana
(+) | los medios son lineales (5.5% delta a la frecuencia anterior)
Altos 2 - 16 kHz
(+) | máximos equilibrados - a sólo 2% de la mediana
(+) | los máximos son lineales (4.5% delta a la frecuencia anterior)
Total 100 - 16.000 Hz
(+) | el sonido global es lineal (10.2% de diferencia con la mediana)
En comparación con la misma clase
» 7% de todos los dispositivos probados de esta clase eran mejores, 2% similares, 90% peores
» El mejor tuvo un delta de 5%, la media fue 18%, el peor fue ###max##%
En comparación con todos los dispositivos probados
» 5% de todos los dispositivos probados eran mejores, 1% similares, 94% peores
» El mejor tuvo un delta de 4%, la media fue 23%, el peor fue ###max##%
| Off / Standby | |
| Ocioso | |
| Carga |
|
Clave:
min: | |
| Dell Precision 3520 i7-7820HQ, Quadro M620, Toshiba XG4 NVMe (THNSN5512GPUK), IPS LED, 1920x1080, 15.6" | Dell Precision 3510 6700HQ, FirePro W5130M, Samsung SM951 MZVPV256HDGL m.2 PCI-e, TN LED, 1366x768, 15.6" | Dell Precision 5520 UHD E3-1505M v6, Quadro M1200, Samsung SM961 MZVKW512HMJP m.2 PCI-e, IPS, 3840x2160, 15.6" | Lenovo ThinkPad P50 6820HQ, Quadro M2000M, Samsung SSD PM871 MZNLN256HCHP, IPS, 1920x1080, 15.6" | HP ZBook 15 G3 E3-1505M v5, Quadro M2000M, Samsung SM951 MZVPV512HDGL m.2 PCI-e, UWVA-IPS, 1920x1080, 15.6" | |
|---|---|---|---|---|---|
| Power Consumption | 28% | -32% | 10% | -6% | |
| Idle Minimum * (Watt) | 5.8 | 4.2 28% | 8.9 -53% | 5.6 3% | 5.7 2% |
| Idle Average * (Watt) | 10.7 | 6.5 39% | 13.6 -27% | 8.6 20% | 12.2 -14% |
| Idle Maximum * (Watt) | 13.3 | 7.1 47% | 14.1 -6% | 9.3 30% | 12.6 5% |
| Load Average * (Watt) | 78.2 | 74.6 5% | 100.3 -28% | 89.5 -14% | 83.1 -6% |
| Witcher 3 ultra * (Watt) | 58.8 | 100.2 -70% | |||
| Load Maximum * (Watt) | 116 | 92.2 21% | 126.3 -9% | 105 9% | 138.2 -19% |
* ... más pequeño es mejor
| Dell Precision 3520 i7-7820HQ, Quadro M620, 68 Wh | Dell Precision 3510 6700HQ, FirePro W5130M, 84 Wh | Dell Precision 5520 UHD E3-1505M v6, Quadro M1200, 97 Wh | HP ZBook 15 G3 E3-1505M v5, Quadro M2000M, 90 Wh | Lenovo ThinkPad T570-20HAS01E00 i7-7500U, GeForce 940MX, 56 Wh | Lenovo ThinkPad P50 6820HQ, Quadro M2000M, 90 Wh | |
|---|---|---|---|---|---|---|
| Duración de Batería | 30% | -32% | -1% | 24% | 13% | |
| Reader / Idle (h) | 16.6 | 19.5 17% | 12.1 -27% | 13.7 -17% | 13.3 -20% | 14.3 -14% |
| H.264 (h) | 8.1 | 10.1 25% | 7.5 -7% | 8.1 0% | 8.9 10% | |
| WiFi v1.3 (h) | 7.6 | 9.9 30% | 4.2 -45% | 6.4 -16% | 6.9 -9% | 8.3 9% |
| Load (h) | 1.3 | 1.9 46% | 1 -23% | 1.8 38% | 2.9 123% | 1.9 46% |
Pro
Contra
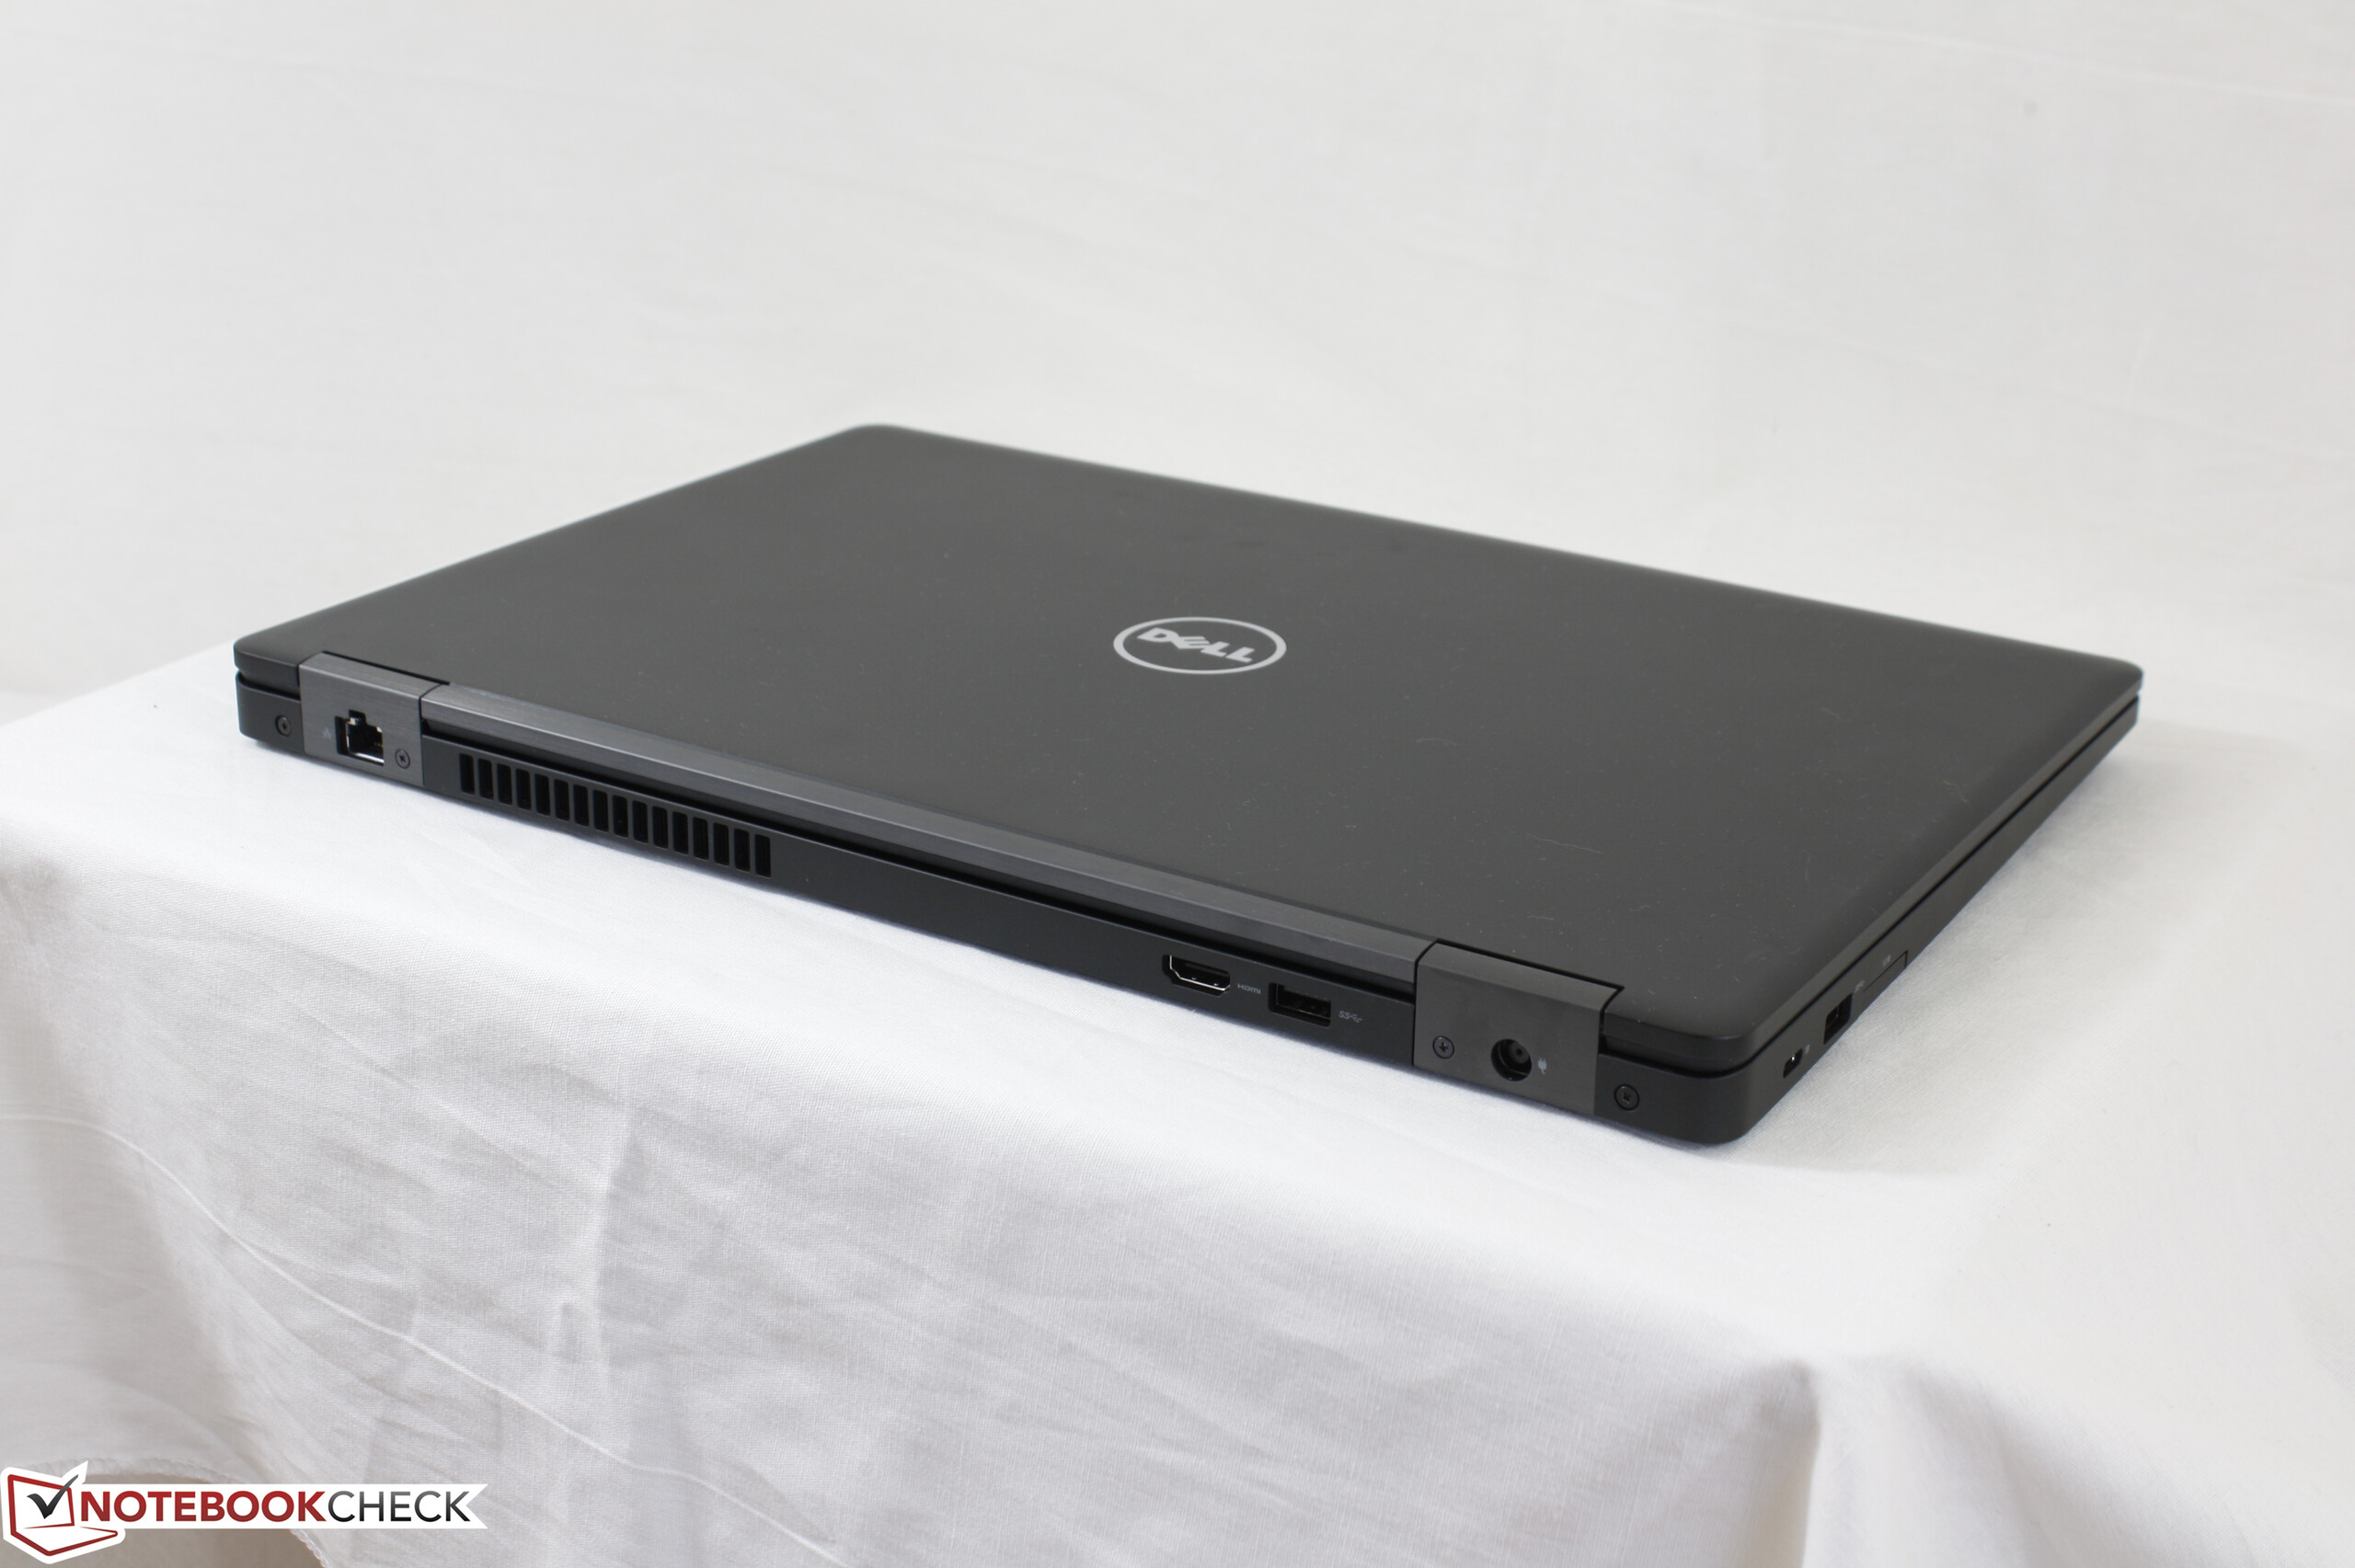
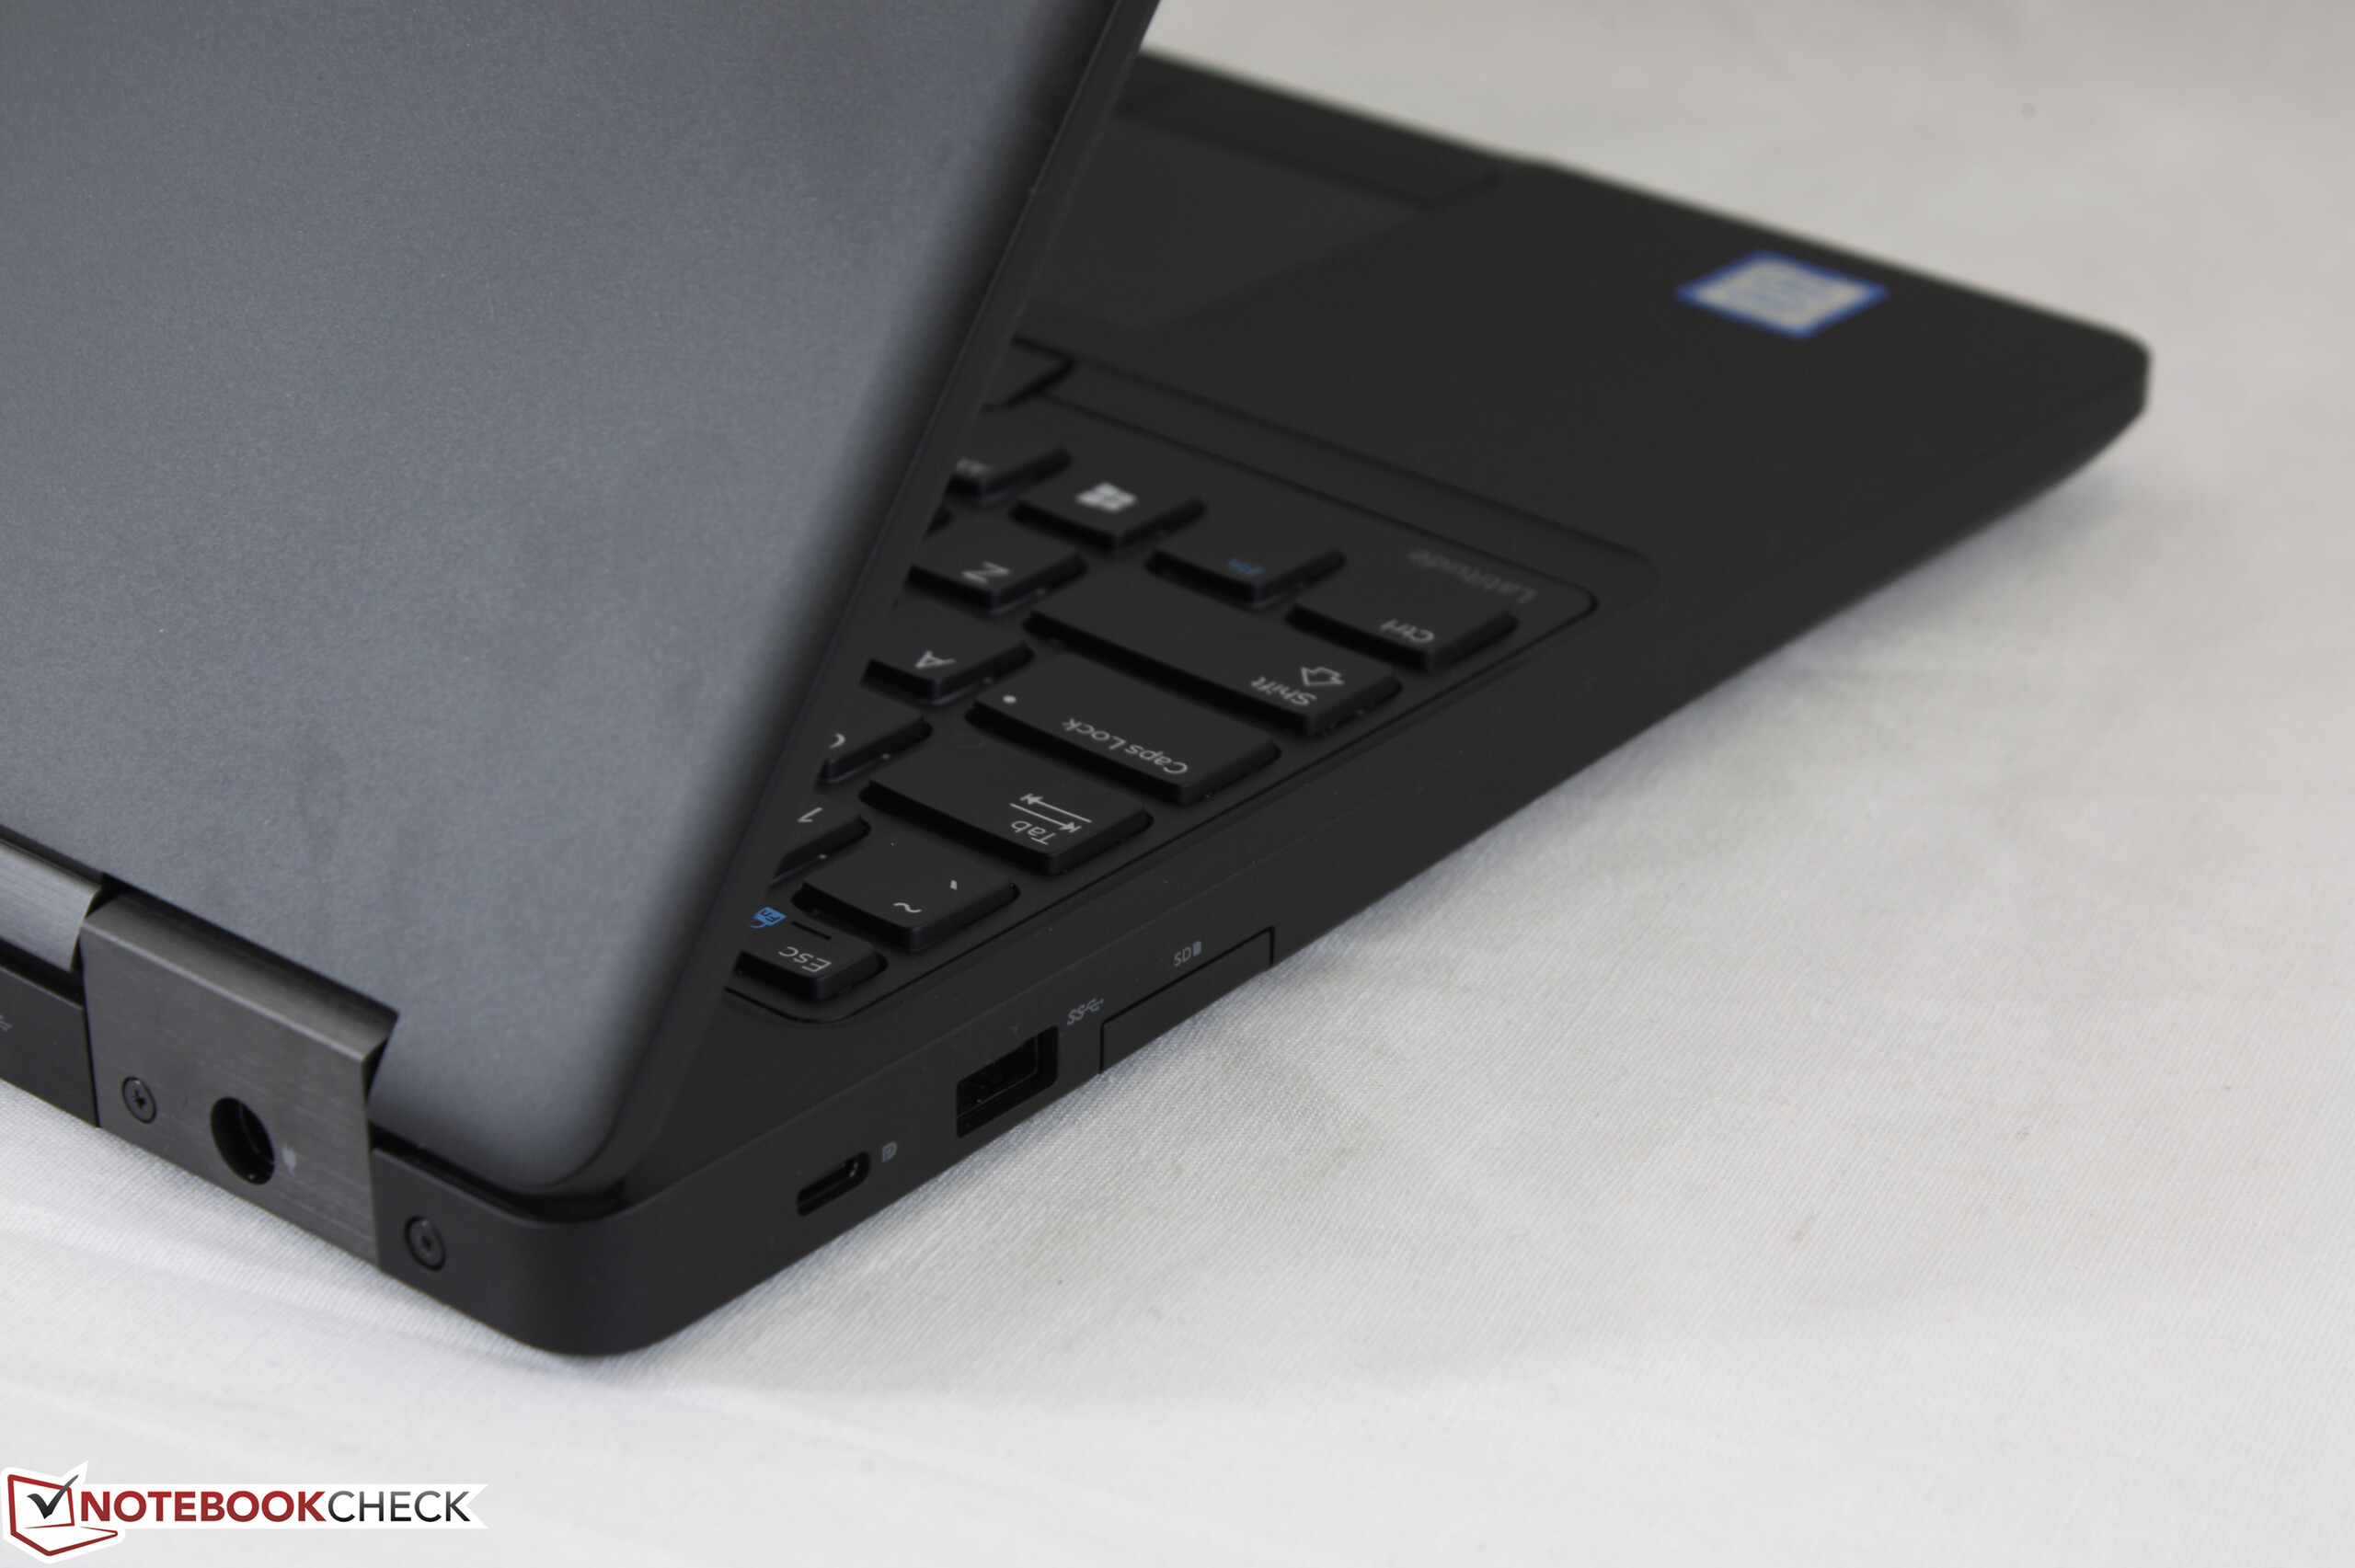
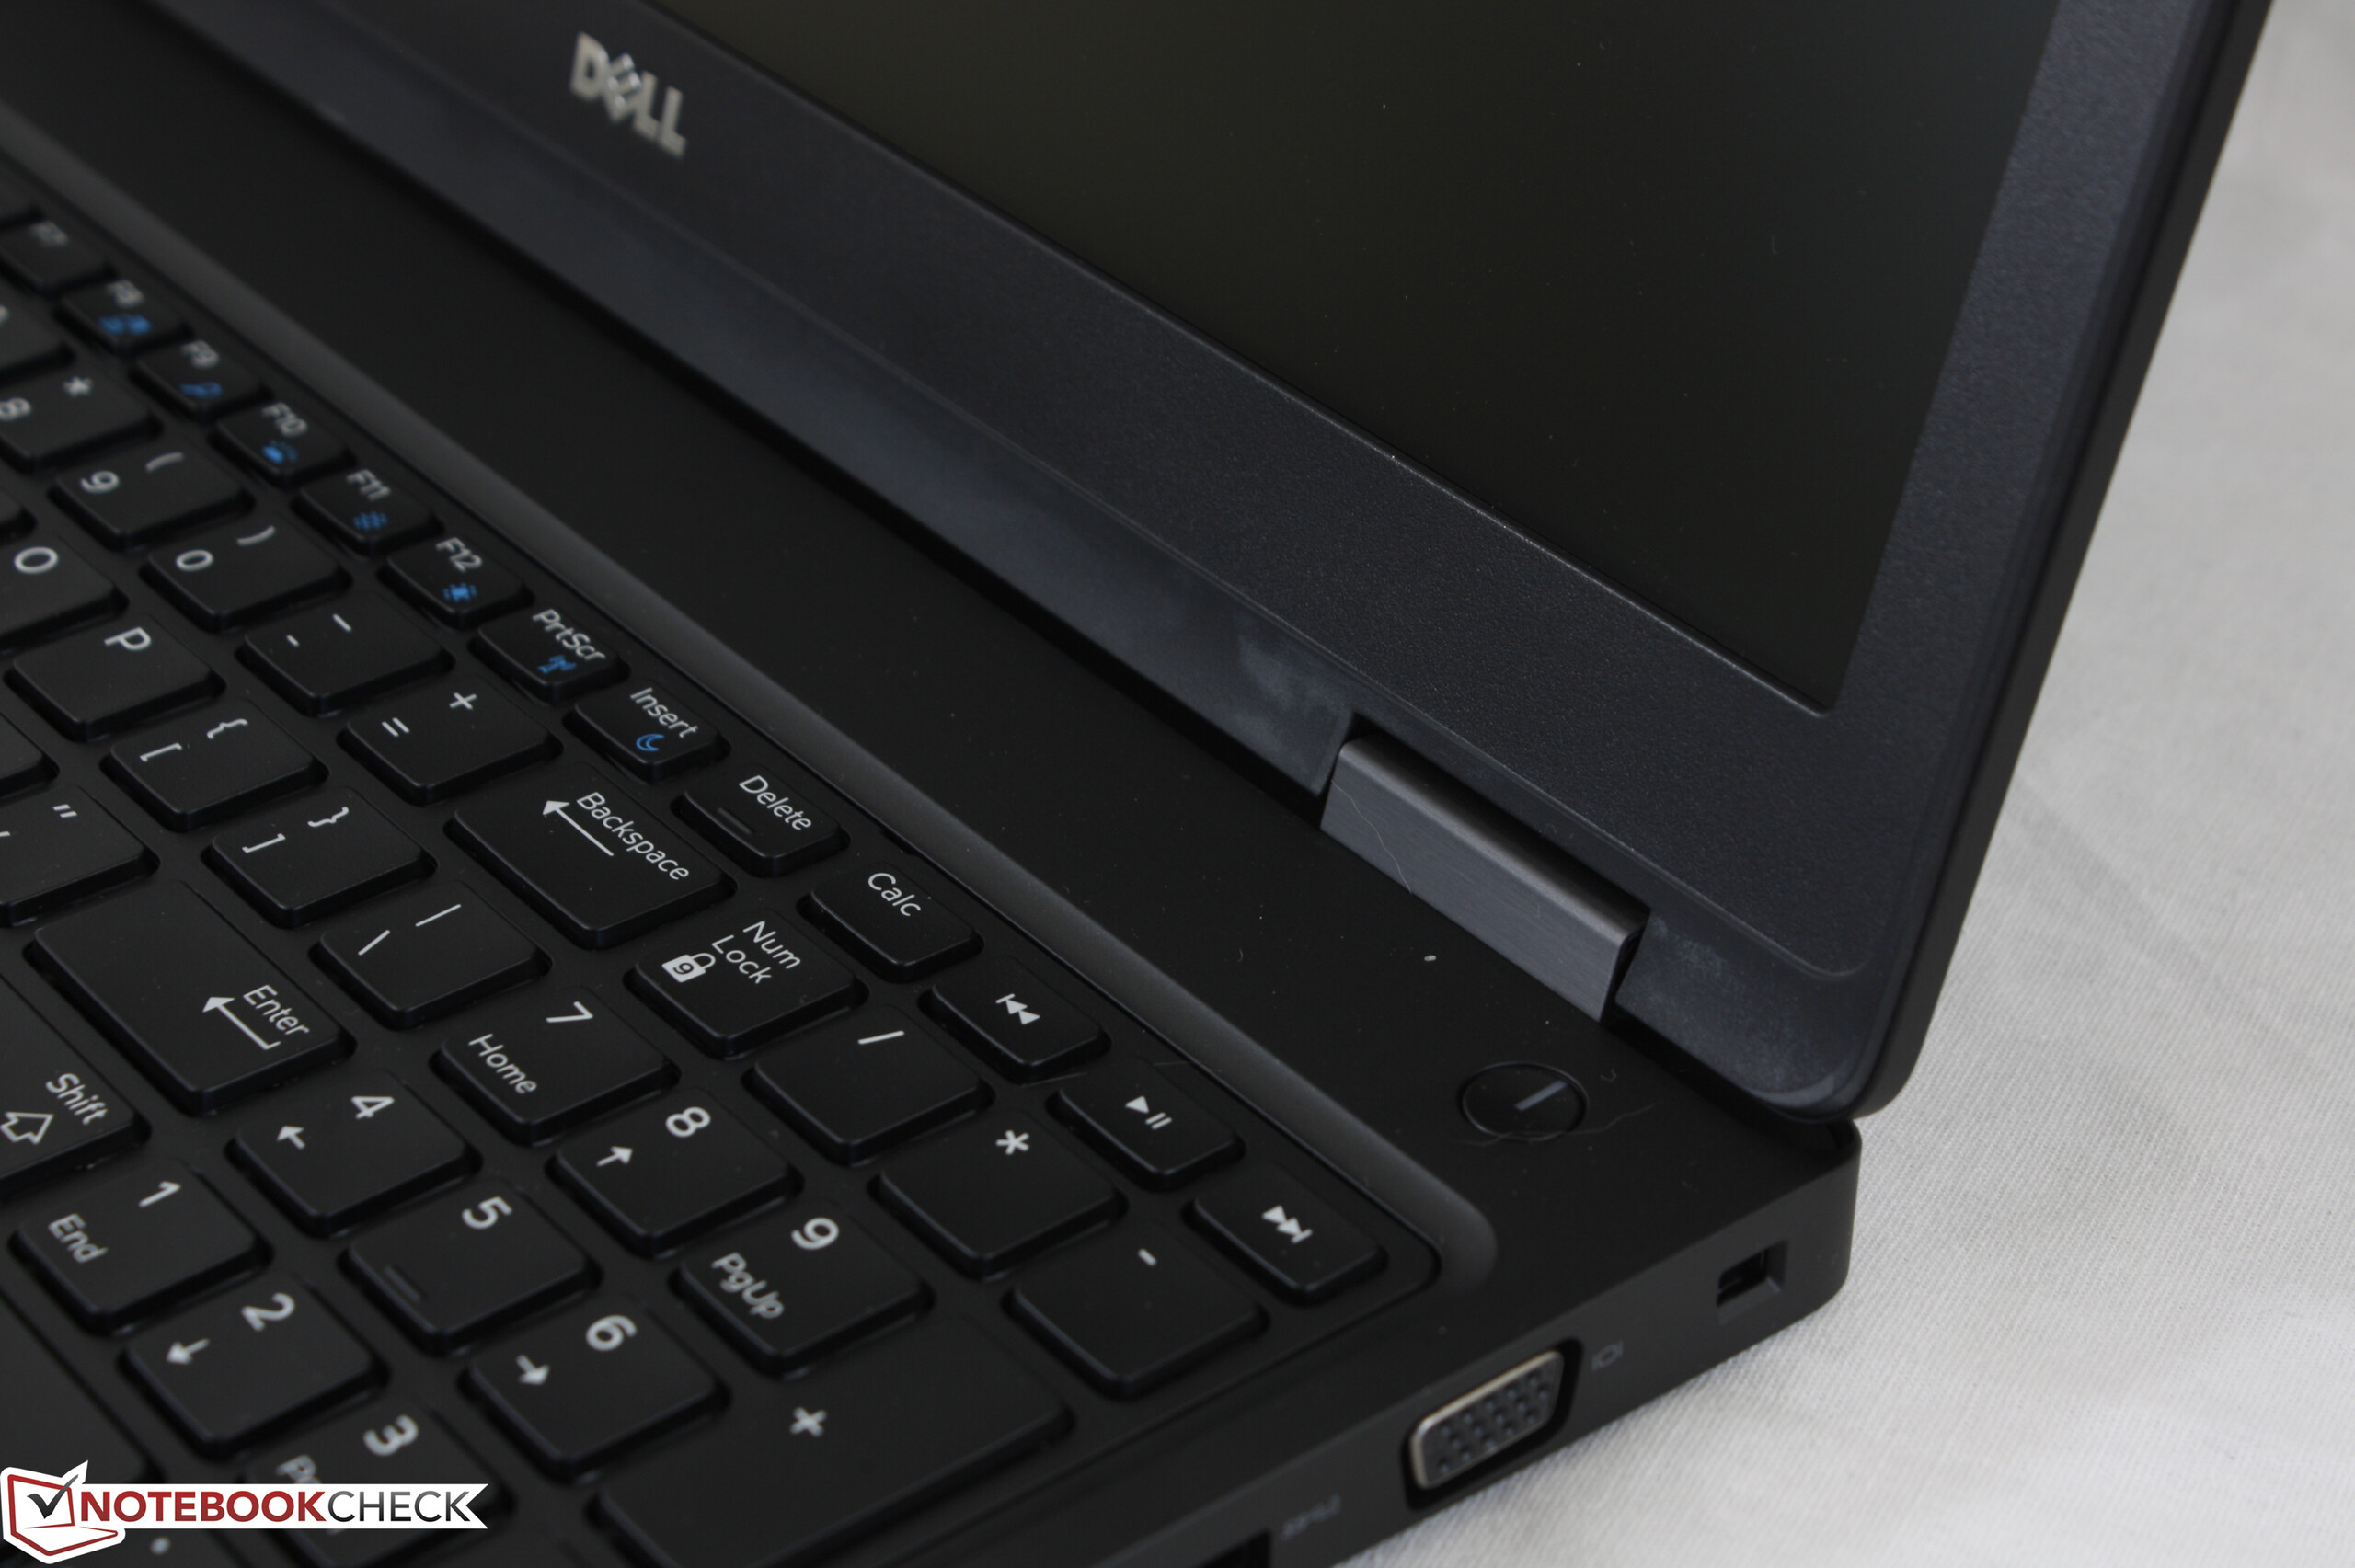
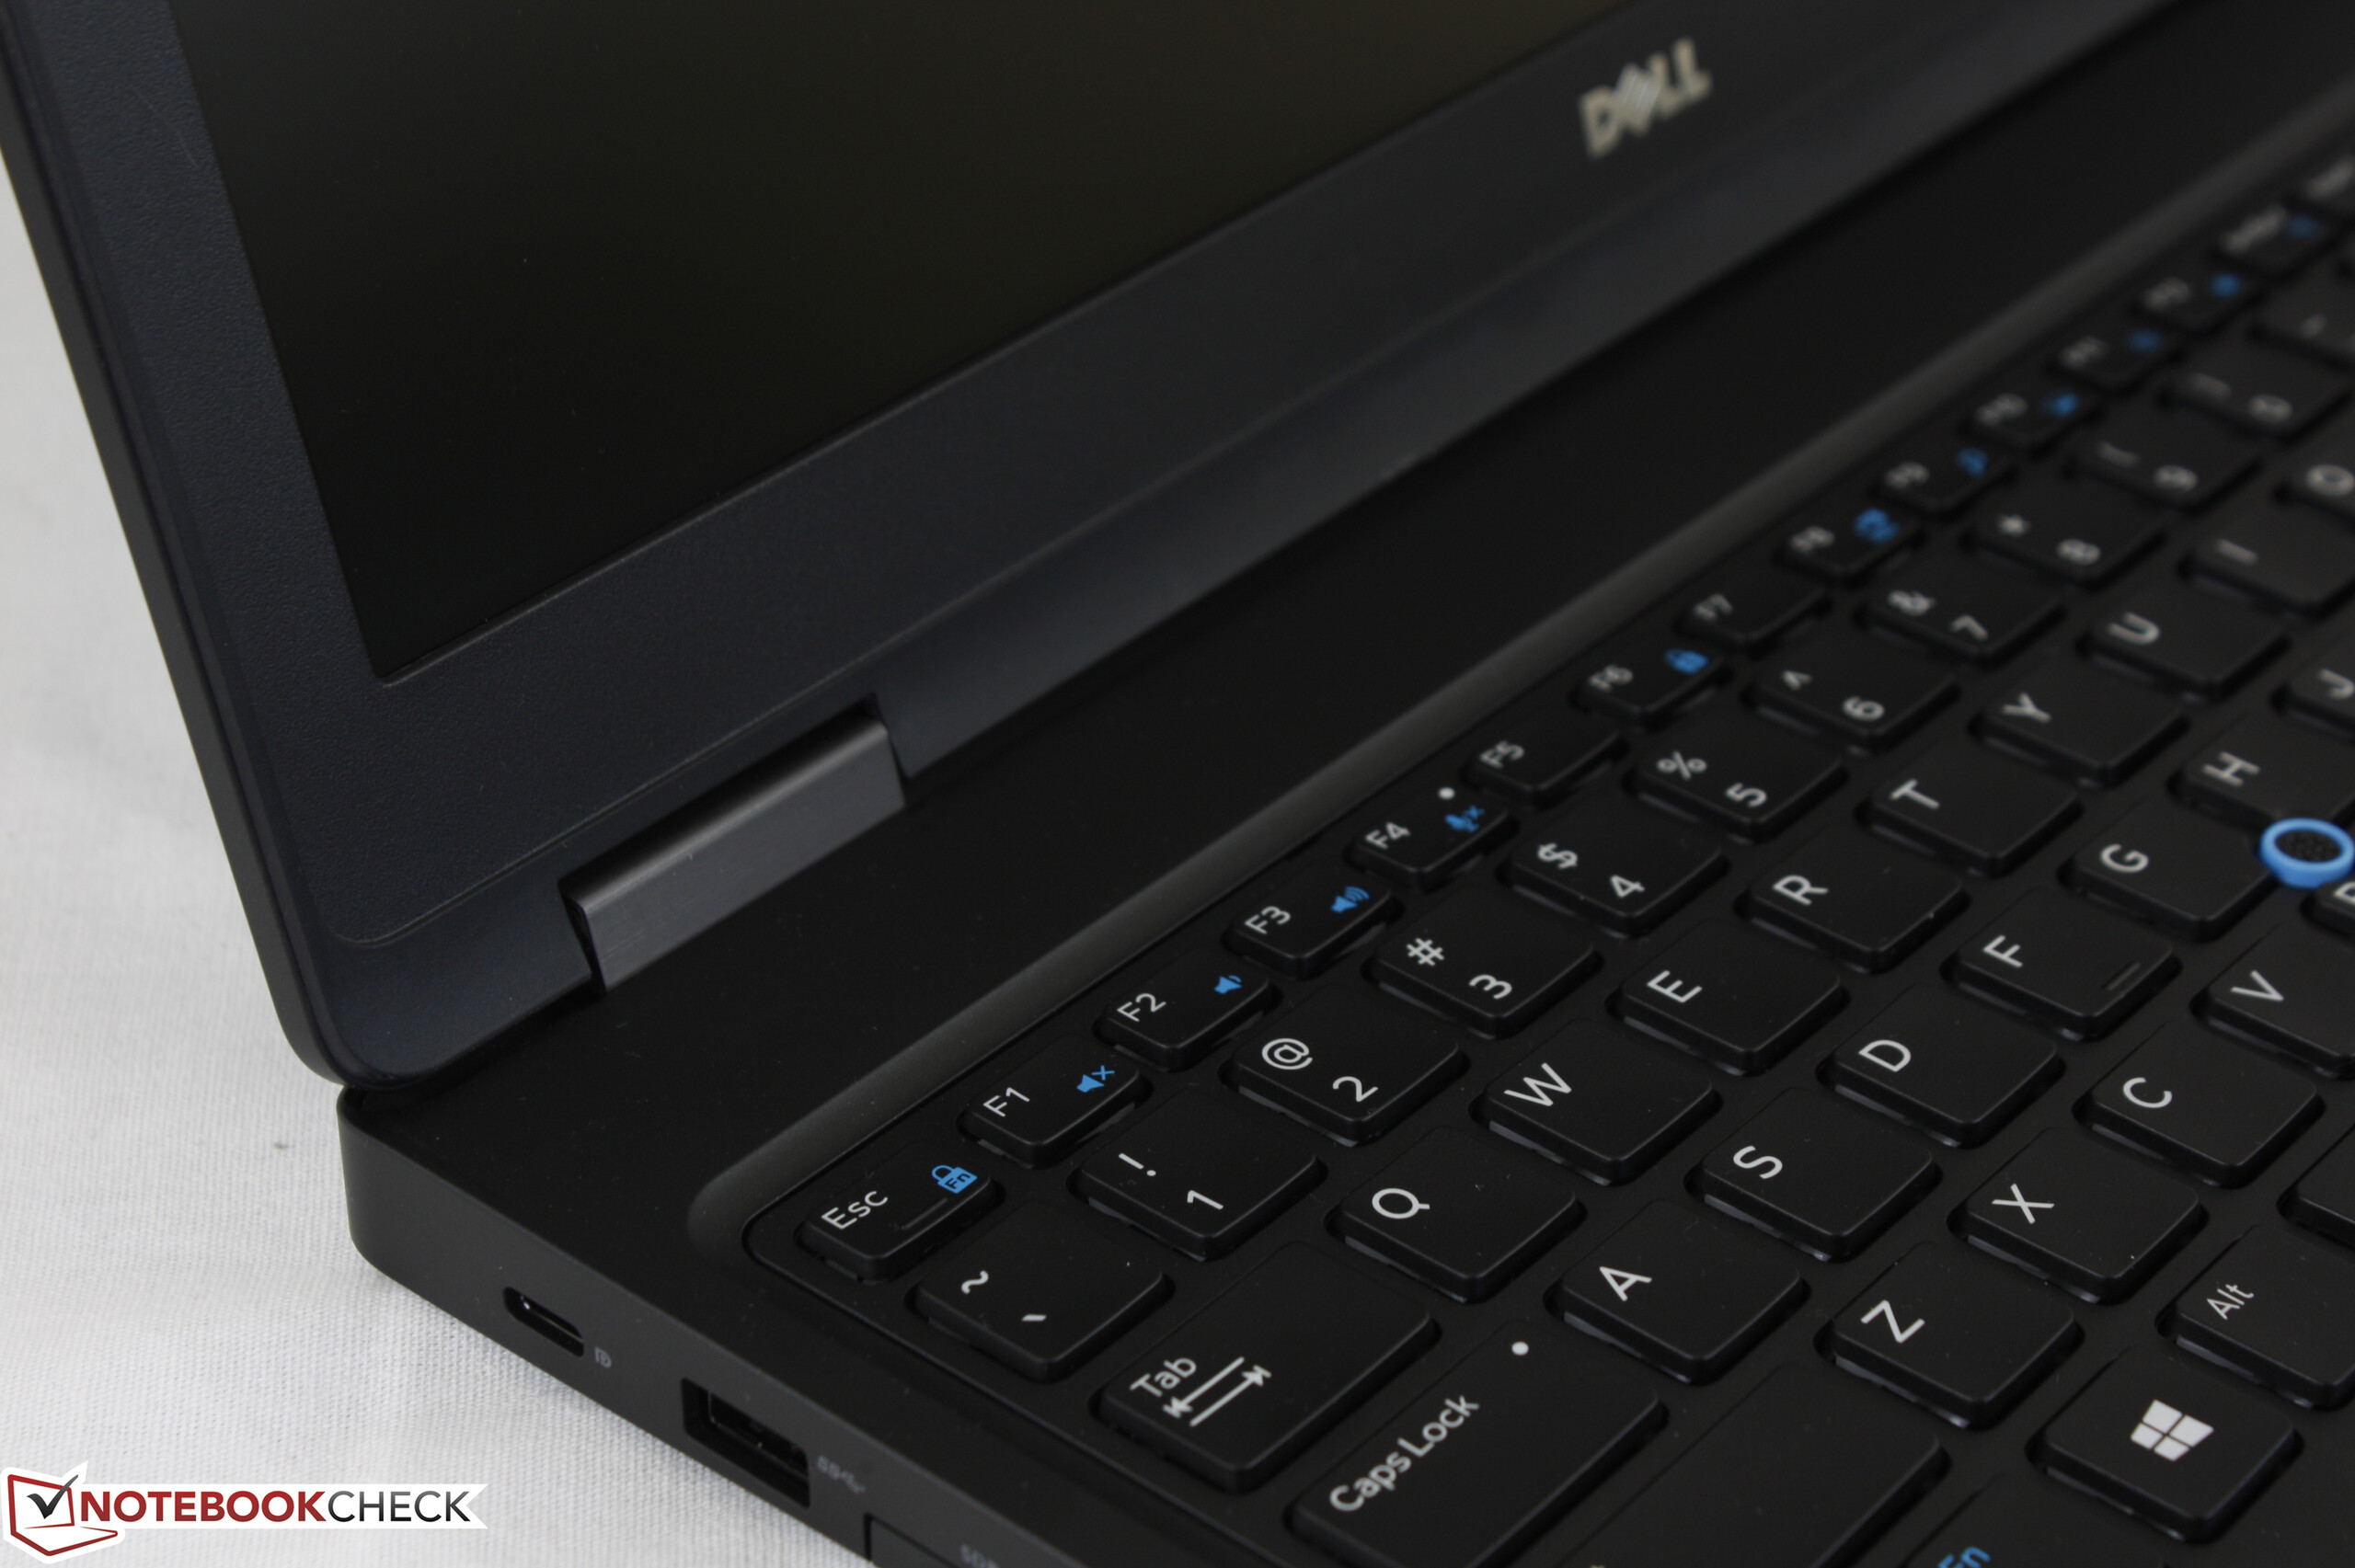
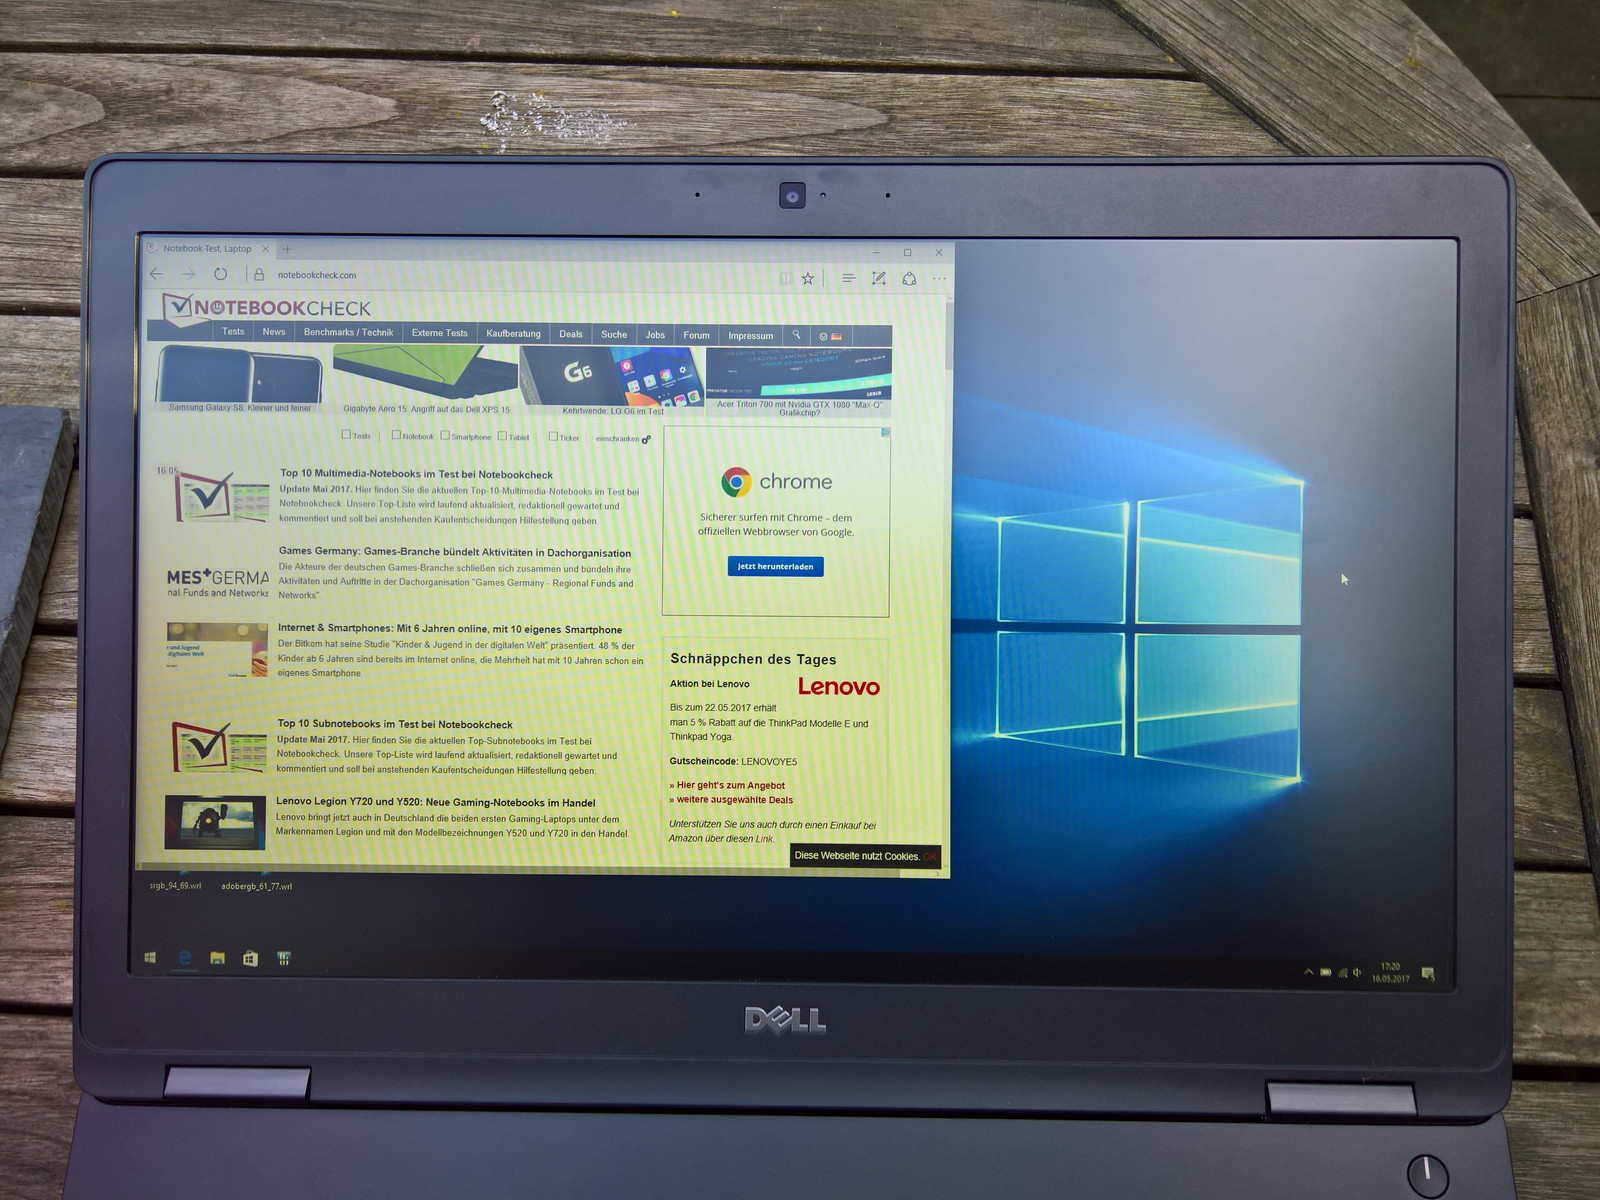
El Precision 3520 definitivamente tiene puntos positivos. En primer lugar la pantalla, que muestra colores vivos y es brillante. La duración de batería es muy buena para una estación de trabajo y debe ser impresionante con la opción de 92 Wh. El número de puertos es suficiente. El chasis y los dispositivos de entrada son suficientemente buenos para una máquina de negocios, pero no perfectos.
Desafortunadamente el Precision falla respecto a lo más importante para una estación de trabajo: rendimiento y nivel de ruido. La restricción a un TDP de 35 W resulta sorprendente - Dell probablemente debería buscar un sistema de refrigeración más sofisticado, aunque no podemos olvidar que estamos ante una estación de trabajo de bajo precio. Nos preguntamos si no habría sido mejor elección una CPU con un consumo más bajo. Nuestro test de estrés revela que el rendimiento puede variar mucho bajo carga, como si el firmware realizase algún tipo de ajustes. Desafortunadamente, esto ocurre también con el control de ventilador, ya que en ocasiones se activa sin motivo aparente. Tras las pruebas, el ventilador tardó mucho en desactivarse de nuevo. Además el 3520 emite un ruido electrónico.
The Precision 3520 es una estación de trabajo solida - pero podría mejorar en varios aspectos.
En resumen podemos decir que el Precision 3520 tiene potencial. El portátil es muy potente y tiene un buen ratio precio-rendimiento. Al fin y al cabo las estaciones de trabajo pueden ser muy caras. De todas formas Dell necesita replantearse el control del ventilador y mejorar el rendimiento. En cuanto eso ocurra, el 3520 será una buena recomendación de compra.
Ésta es una versión acortada del análisis original. Puedes leer el análisis completo en inglés aquí.
Dell Precision 3520
- 05/25/2017 v6 (old)
Benjamin Herzig
Price comparison
