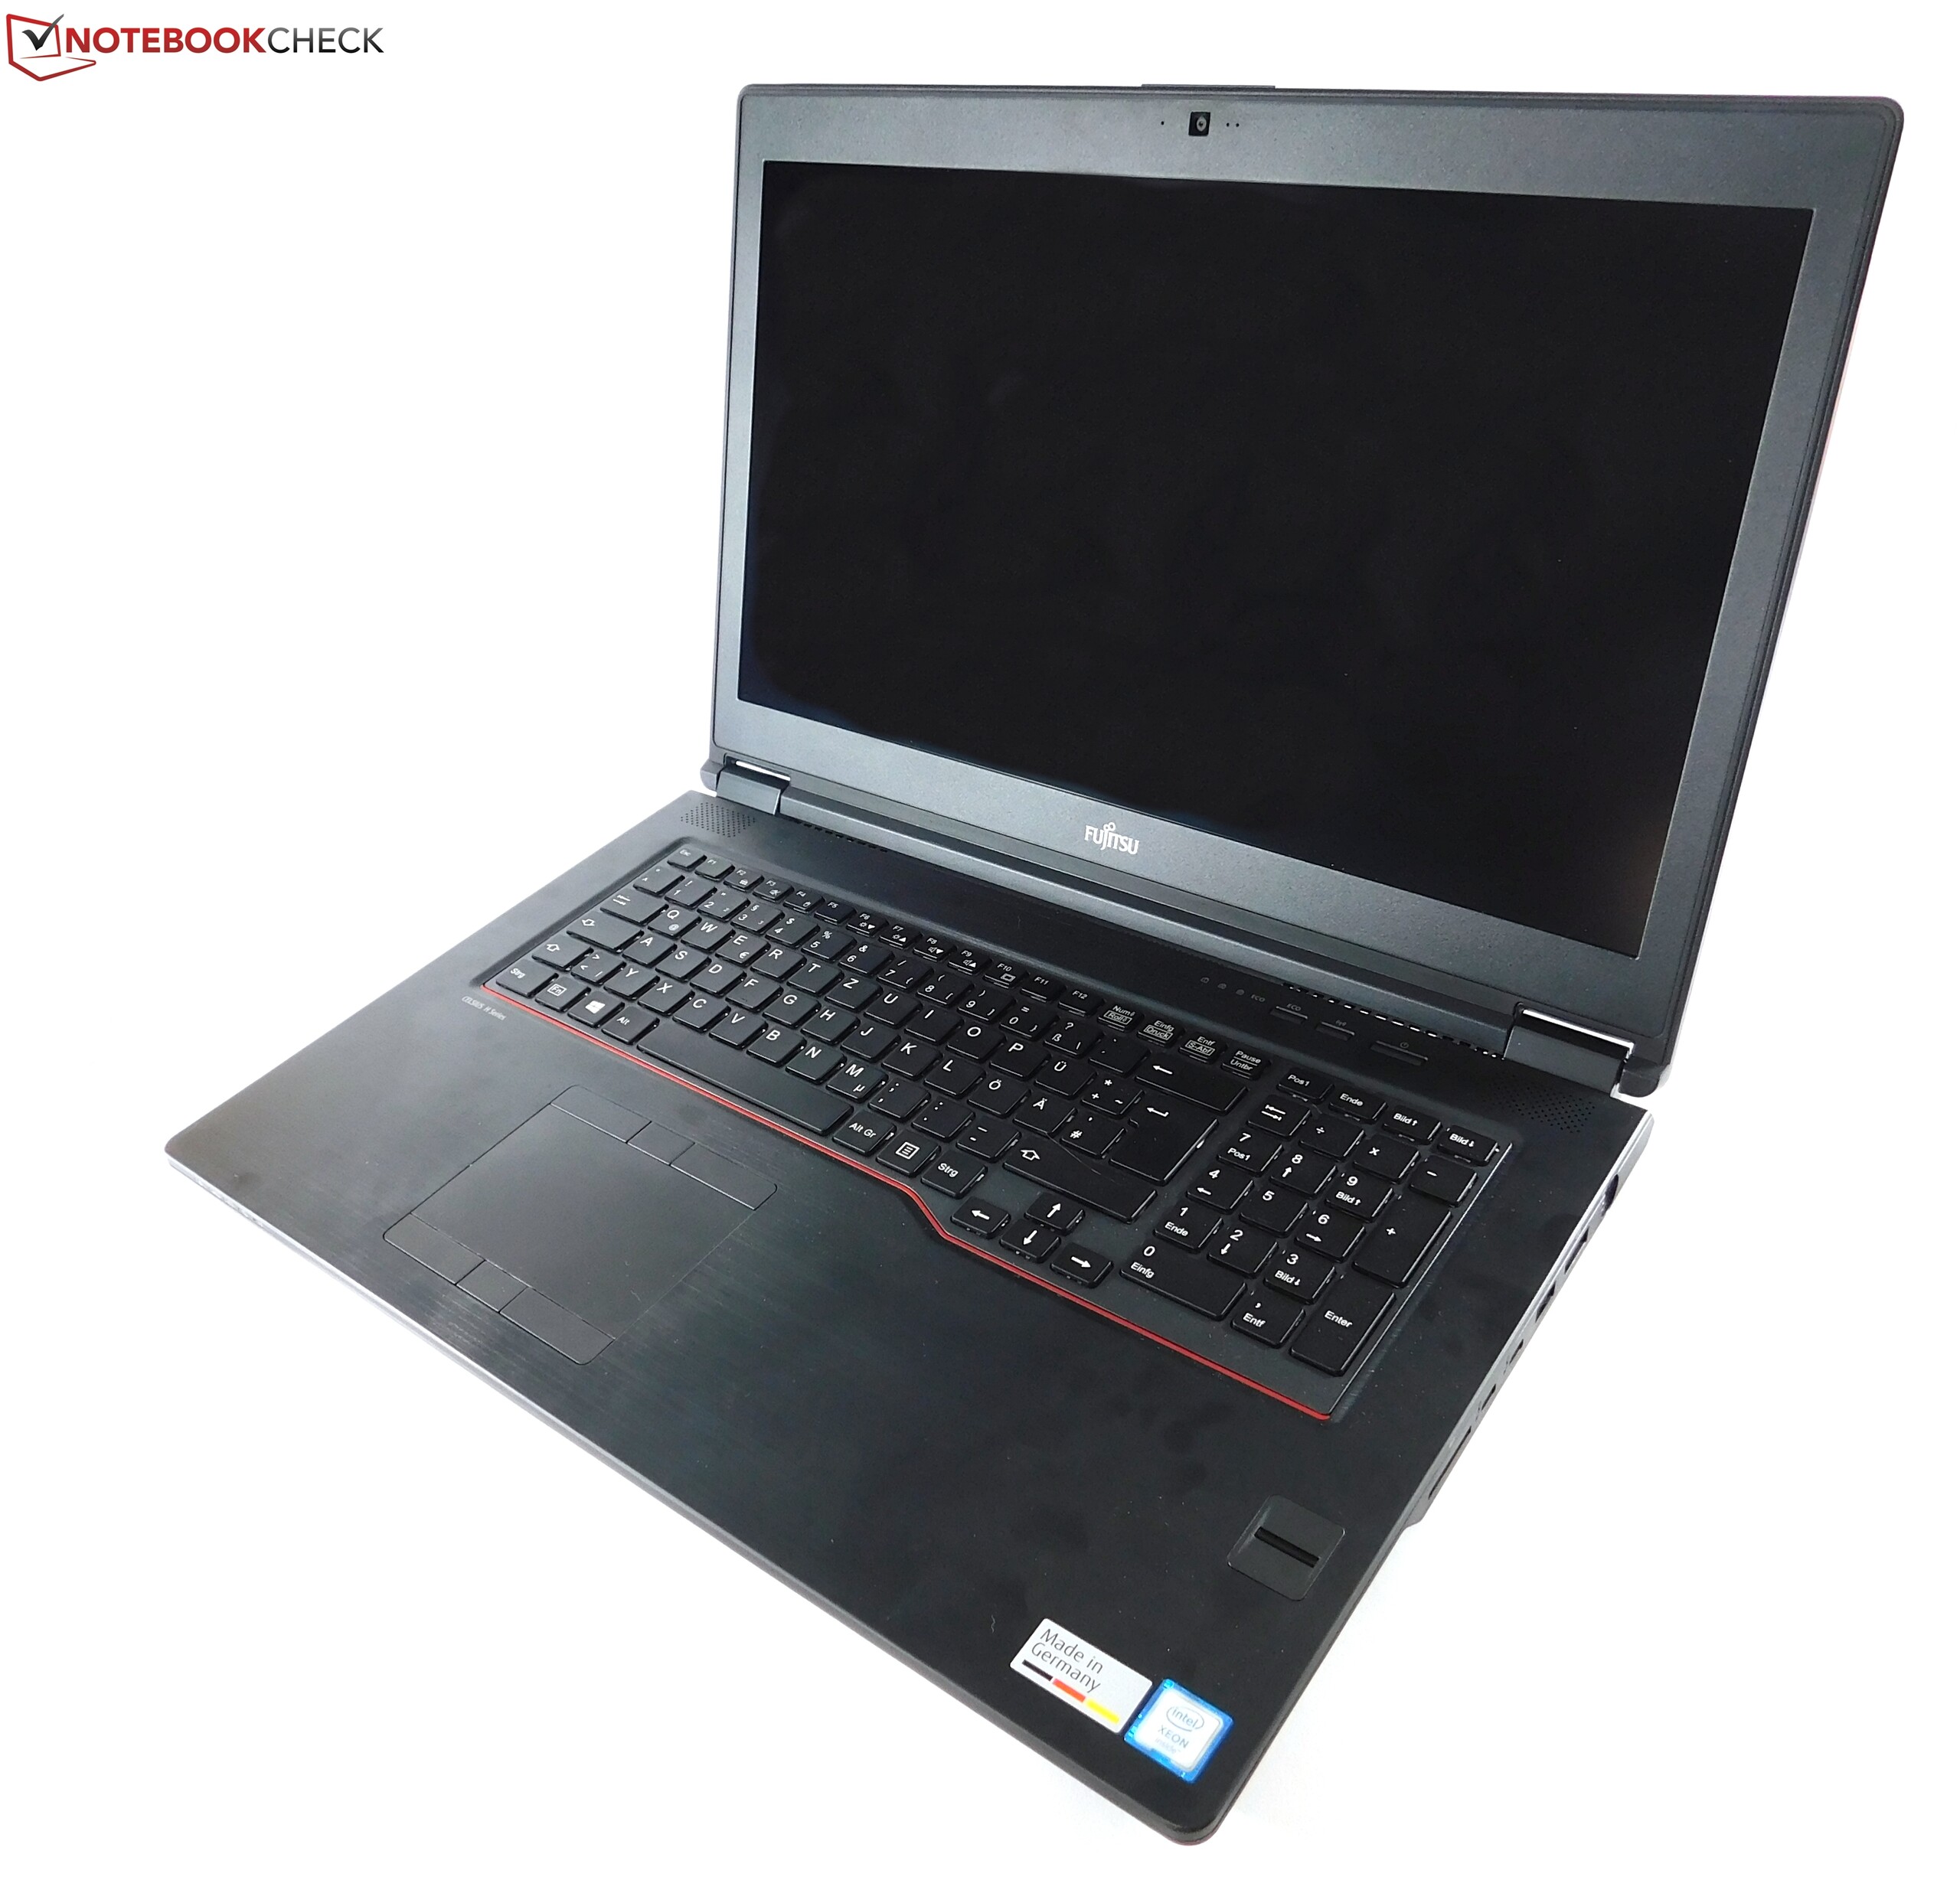
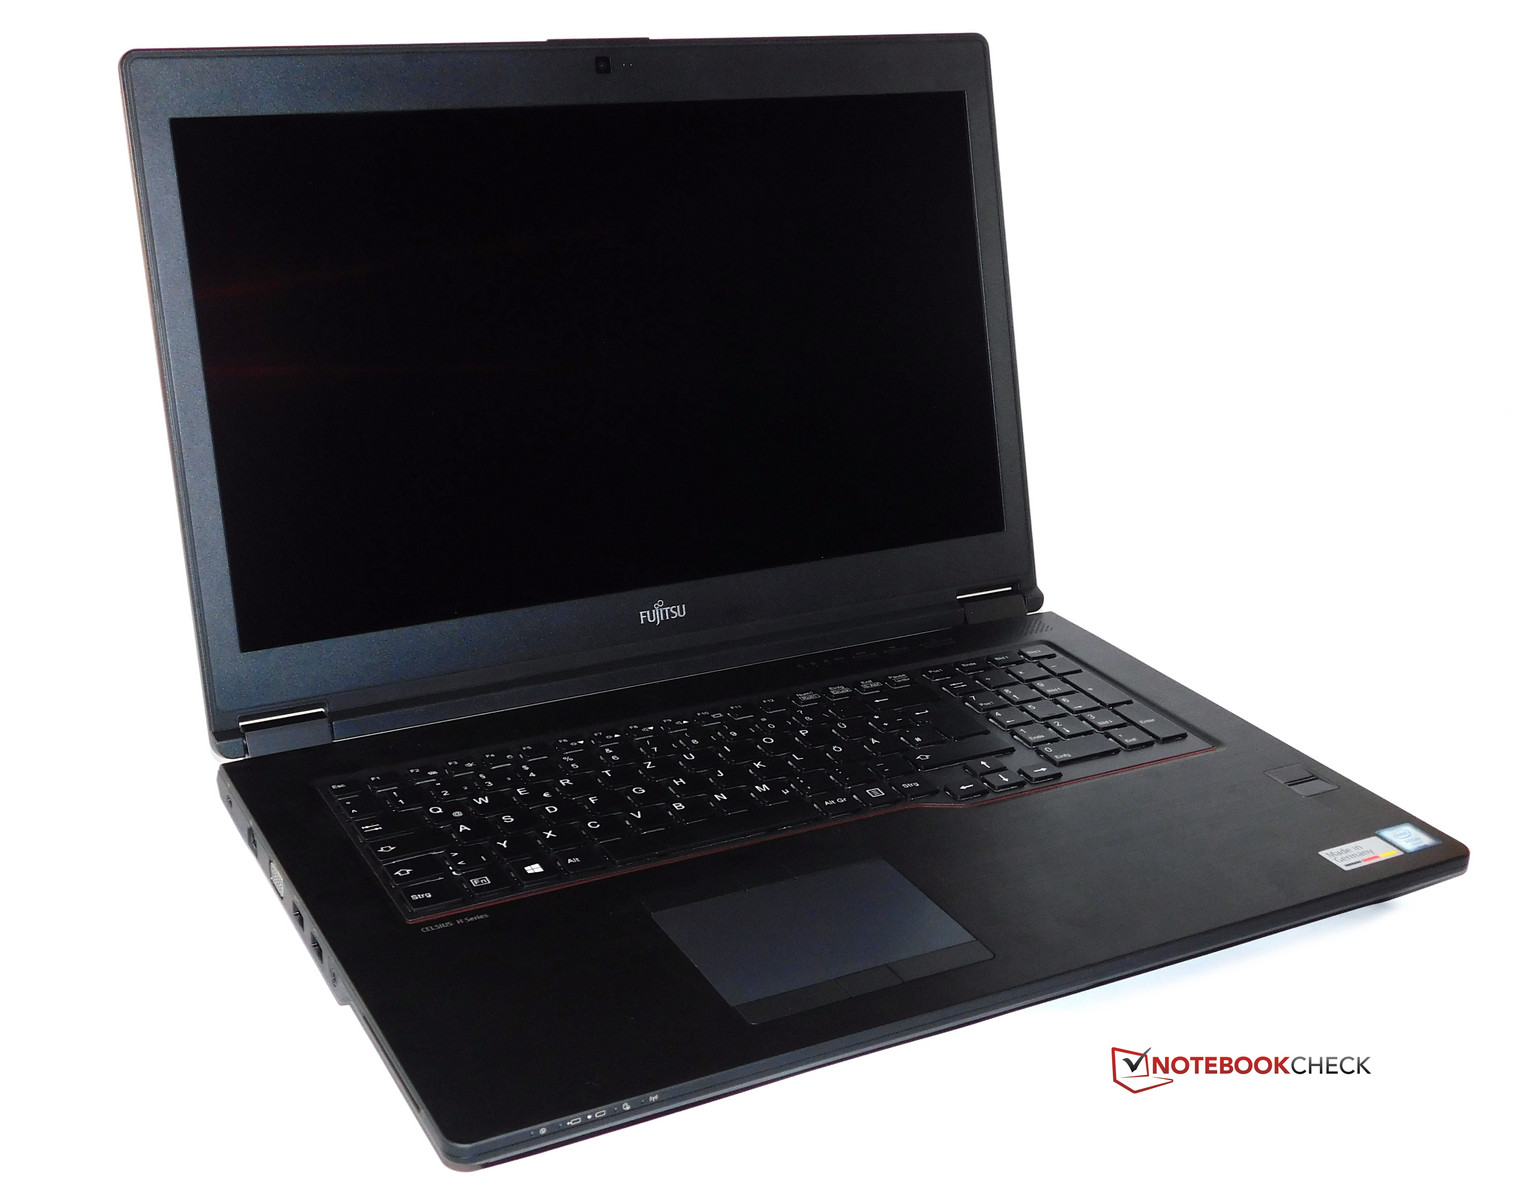
Breve análisis de la estación de trabajo Fujitsu Celsius H970 (E3-1535M v6, P4000)

| SD Card Reader | |
| average JPG Copy Test (av. of 3 runs) | |
| Dell Precision 7710 | |
| Lenovo ThinkPad P71-20HK0004GE | |
| Fujitsu Celsius H970 | |
| HP ZBook 17 G3 TZV66eA | |
| maximum AS SSD Seq Read Test (1GB) | |
| Lenovo ThinkPad P71-20HK0004GE | |
| HP ZBook 17 G3 TZV66eA | |
| Fujitsu Celsius H970 | |
| Dell Precision 7710 | |
| Networking | |
| iperf3 transmit AX12 | |
| Lenovo ThinkPad P71-20HK0004GE | |
| Fujitsu Celsius H970 | |
| MSI WE72 7RJ | |
| iperf3 receive AX12 | |
| Fujitsu Celsius H970 | |
| Lenovo ThinkPad P71-20HK0004GE | |
| MSI WE72 7RJ | |
| |||||||||||||||||||||||||
iluminación: 91 %
Brillo con batería: 373 cd/m²
Contraste: 1227:1 (Negro: 0.3 cd/m²)
ΔE ColorChecker Calman: 6.4 | ∀{0.5-29.43 Ø4.71}
ΔE Greyscale Calman: 7.2 | ∀{0.09-98 Ø4.96}
84.4% sRGB (Argyll 1.6.3 3D)
55.5% AdobeRGB 1998 (Argyll 1.6.3 3D)
61.8% AdobeRGB 1998 (Argyll 3D)
84.6% sRGB (Argyll 3D)
66.8% Display P3 (Argyll 3D)
Gamma: 2.02
CCT: 6882 K
| Fujitsu Celsius H970 LP173WF4-SPF3, , 1920x1080, 17.3" | Lenovo ThinkPad P71-20HK0004GE LEN4123, VVX17P051J00, , 3840x2160, 17.3" | HP ZBook 17 G3 TZV66eA SDC3854, , 1920x1080, 17.3" | Dell Precision 7710 SDC8151, VHN17_173HL, , 1920x1080, 17.3" | MSI WE72 7RJ LP173WF4-SPF1, , 1920x1080, 17.3" | Schenker W706 LP173WF4-SPD1, LGD046C, , 1920x1080, 17.3" | |
|---|---|---|---|---|---|---|
| Display | 9% | 9% | 1% | -0% | ||
| Display P3 Coverage (%) | 66.8 | 67.3 1% | 66.6 0% | 67.4 1% | 66.2 -1% | |
| sRGB Coverage (%) | 84.6 | 95.9 13% | 96.9 15% | 85.3 1% | 84.2 0% | |
| AdobeRGB 1998 Coverage (%) | 61.8 | 69 12% | 68.6 11% | 62.4 1% | 61.5 0% | |
| Response Times | -6% | -33% | -46% | -21% | -25% | |
| Response Time Grey 50% / Grey 80% * (ms) | 32 ? | 39.2 ? -23% | 50.4 ? -58% | 50 ? -56% | 45.2 ? -41% | 44 ? -38% |
| Response Time Black / White * (ms) | 26.4 ? | 23.2 ? 12% | 28.4 ? -8% | 36 ? -36% | 26.4 ? -0% | 29.2 ? -11% |
| PWM Frequency (Hz) | 1412 ? | 200 ? | 198 ? | |||
| Screen | 23% | 18% | 7% | -6% | -4% | |
| Brightness middle (cd/m²) | 368 | 358 -3% | 252 -32% | 332 -10% | 302 -18% | 356 -3% |
| Brightness (cd/m²) | 360 | 338 -6% | 243 -32% | 307 -15% | 306 -15% | 331 -8% |
| Brightness Distribution (%) | 91 | 83 -9% | 86 -5% | 83 -9% | 93 2% | 86 -5% |
| Black Level * (cd/m²) | 0.3 | 0.31 -3% | 0.21 30% | 0.33 -10% | 0.31 -3% | 0.48 -60% |
| Contrast (:1) | 1227 | 1155 -6% | 1200 -2% | 1006 -18% | 974 -21% | 742 -40% |
| Colorchecker dE 2000 * | 6.4 | 2.1 67% | 2.2 66% | 3 53% | 6.2 3% | 4.64 28% |
| Colorchecker dE 2000 max. * | 10.1 | 3.6 64% | 3.8 62% | 10.6 -5% | ||
| Greyscale dE 2000 * | 7.2 | 2 72% | 2.7 62% | 4 44% | 7.3 -1% | 3.65 49% |
| Gamma | 2.02 109% | 2.16 102% | 2.28 96% | 2 110% | 2.08 106% | 2.02 109% |
| CCT | 6882 94% | 6216 105% | 6686 97% | 7089 92% | 7020 93% | 6393 102% |
| Color Space (Percent of AdobeRGB 1998) (%) | 55.5 | 77 39% | 62 12% | 62 12% | 56 1% | 55 -1% |
| Color Space (Percent of sRGB) (%) | 84.4 | 99.97 18% | 96 14% | 97 15% | 85.2 1% | 84 0% |
| Media total (Programa/Opciones) | 9% /
19% | -2% /
9% | -10% /
-0% | -9% /
-6% | -10% /
-6% |
* ... más pequeño es mejor
Tiempos de respuesta del display
| ↔ Tiempo de respuesta de Negro a Blanco | ||
|---|---|---|
| 26.4 ms ... subida ↗ y bajada ↘ combinada | ↗ 14.8 ms subida | 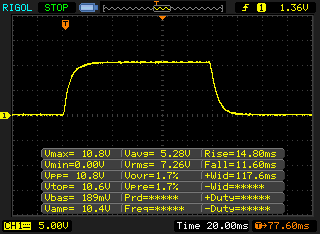 |
| ↘ 11.6 ms bajada | ||
| La pantalla mostró tiempos de respuesta relativamente lentos en nuestros tests pero podría ser demasiado lenta para los jugones. En comparación, todos los dispositivos de prueba van de ##min### (mínimo) a 240 (máximo) ms. » 66 % de todos los dispositivos son mejores. Eso quiere decir que el tiempo de respuesta es peor que la media (19.8 ms) de todos los dispositivos testados. | ||
| ↔ Tiempo de respuesta 50% Gris a 80% Gris | ||
| 32 ms ... subida ↗ y bajada ↘ combinada | ↗ 14.8 ms subida | 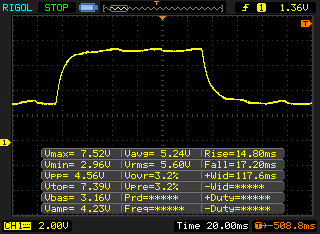 |
| ↘ 17.2 ms bajada | ||
| La pantalla mostró tiempos de respuesta lentos en nuestros tests y podría ser demasiado lenta para los jugones. En comparación, todos los dispositivos de prueba van de ##min### (mínimo) a 636 (máximo) ms. » 43 % de todos los dispositivos son mejores. Eso quiere decir que el tiempo de respuesta es similar al dispositivo testado medio (30.9 ms). | ||
Parpadeo de Pantalla / PWM (Pulse-Width Modulation)
| Parpadeo de Pantalla / PWM no detectado |  | ||
Comparación: 52 % de todos los dispositivos testados no usaron PWM para atenuar el display. Si se usó, medimos una media de 7748 (mínimo: 5 - máxmo: 343500) Hz. | |||
| Cinebench R15 | |
| CPU Single 64Bit | |
| Fujitsu Celsius H970 | |
| Lenovo ThinkPad P71-20HK0004GE | |
| Dell Precision 7710 | |
| MSI WE72 7RJ | |
| HP ZBook 17 G3 TZV66eA | |
| Schenker W706 | |
| CPU Multi 64Bit | |
| Lenovo ThinkPad P71-20HK0004GE | |
| Dell Precision 7710 | |
| Schenker W706 | |
| MSI WE72 7RJ | |
| HP ZBook 17 G3 TZV66eA | |
| Fujitsu Celsius H970 | |
| PCMark 8 | |
| Work Score Accelerated v2 | |
| Dell Precision 7710 | |
| Fujitsu Celsius H970 | |
| HP ZBook 17 G3 TZV66eA | |
| Schenker W706 | |
| MSI WE72 7RJ | |
| Creative Score Accelerated v2 | |
| Fujitsu Celsius H970 | |
| Schenker W706 | |
| Lenovo ThinkPad P71-20HK0004GE | |
| Dell Precision 7710 | |
| HP ZBook 17 G3 TZV66eA | |
| PCMark 8 Creative Score Accelerated v2 | 7135 puntos | |
| PCMark 8 Work Score Accelerated v2 | 5277 puntos | |
| PCMark 10 Score | 5041 puntos | |
ayuda | ||
| Fujitsu Celsius H970 Samsung SM961 MZVKW512HMJP m.2 PCI-e | HP ZBook 17 G3 TZV66eA Samsung SM951 MZVPV256HDGL m.2 PCI-e | MSI WE72 7RJ Samsung SM961 MZVPW256 m.2 PCI-e | Lenovo ThinkPad P71-20HK0004GE Samsung PM961 NVMe MZVLW512HMJP | Dell Precision 7710 Samsung SM951 MZVPV256HDGL m.2 PCI-e | Schenker W706 Samsung SM951 MZVPV512HDGL m.2 PCI-e | |
|---|---|---|---|---|---|---|
| AS SSD | -15% | 18% | 14% | -7% | -2% | |
| Seq Read (MB/s) | 2726 | 1596 -41% | 2586 -5% | 2447 -10% | 1886 -31% | 1915 -30% |
| Seq Write (MB/s) | 1609 | 703 -56% | 1441 -10% | 1596 -1% | 626 -61% | 1511 -6% |
| 4K Read (MB/s) | 38.88 | 51.1 31% | 53 36% | 53.3 37% | 51 31% | 49.71 28% |
| 4K Write (MB/s) | 78.1 | 148.2 90% | 148.1 90% | 144.1 85% | 179 129% | 146.2 87% |
| 4K-64 Read (MB/s) | 1246 | 1037 -17% | 1517 22% | 1362 9% | 1064 -15% | 1115 -11% |
| 4K-64 Write (MB/s) | 971 | 230.4 -76% | 826 -15% | 740 -24% | 275 -72% | 375 -61% |
| Score Total (Points) | 3509 | 2302 -34% | 3831 9% | 3517 0% | 2435 -31% | 2712 -23% |

| 3DMark 11 - 1280x720 Performance GPU | |
| Fujitsu Celsius H970 | |
| Schenker W706 | |
| Lenovo ThinkPad P71-20HK0004GE | |
| Lenovo ThinkPad P70-20ER000XUS | |
| Dell Precision 7710 | |
| HP ZBook 17 G3 TZV66eA | |
| MSI WE72 7RJ | |
| 3DMark | |
| 1280x720 Cloud Gate Standard Graphics | |
| Schenker W706 | |
| Lenovo ThinkPad P71-20HK0004GE | |
| Fujitsu Celsius H970 | |
| HP ZBook 17 G3 TZV66eA | |
| Lenovo ThinkPad P70-20ER000XUS | |
| Dell Precision 7710 | |
| MSI WE72 7RJ | |
| 1920x1080 Fire Strike Graphics | |
| Fujitsu Celsius H970 | |
| Schenker W706 | |
| Lenovo ThinkPad P71-20HK0004GE | |
| Lenovo ThinkPad P70-20ER000XUS | |
| Dell Precision 7710 | |
| HP ZBook 17 G3 TZV66eA | |
| MSI WE72 7RJ | |
| LuxMark v2.0 64Bit | |
| Room GPUs-only | |
| Fujitsu Celsius H970 | |
| Lenovo ThinkPad P71-20HK0004GE | |
| Schenker W706 | |
| HP ZBook 17 G3 TZV66eA | |
| MSI WE72 7RJ | |
| Dell Precision 7710 | |
| Sala GPUs-only | |
| Fujitsu Celsius H970 | |
| Lenovo ThinkPad P71-20HK0004GE | |
| HP ZBook 17 G3 TZV66eA | |
| Schenker W706 | |
| MSI WE72 7RJ | |
| Dell Precision 7710 | |
| ComputeMark v2.1 - 1024x600 Normal, Score | |
| Fujitsu Celsius H970 | |
| Lenovo ThinkPad P71-20HK0004GE | |
| Schenker W706 | |
| Lenovo ThinkPad P70-20ER000XUS | |
| MSI WE72 7RJ | |
| Dell Precision 7710 | |
| GFXBench | |
| 1920x1080 Car Chase Offscreen | |
| Fujitsu Celsius H970 | |
| Lenovo ThinkPad P71-20HK0004GE | |
| MSI WE72 7RJ | |
| on screen Car Chase Onscreen | |
| MSI WE72 7RJ | |
| Fujitsu Celsius H970 | |
| Lenovo ThinkPad P71-20HK0004GE | |
| 3DMark Vantage - 1280x1024 P Result | |
| Fujitsu Celsius H970 | |
| Lenovo ThinkPad P71-20HK0004GE | |
| Dell Precision 7710 | |
| MSI WE72 7RJ | |
| 3DMark 06 Standard Score | 29155 puntos | |
| 3DMark Vantage P Result | 36260 puntos | |
| 3DMark 11 Performance | 12346 puntos | |
| 3DMark Ice Storm Standard Score | 68394 puntos | |
| 3DMark Cloud Gate Standard Score | 18726 puntos | |
| 3DMark Fire Strike Score | 10158 puntos | |
| 3DMark Fire Strike Extreme Score | 5526 puntos | |
| 3DMark Time Spy Score | 3825 puntos | |
ayuda | ||
| Rise of the Tomb Raider - 1920x1080 Very High Preset AA:FX AF:16x | |
| MSI GT62VR-6RE16H21 | |
| Fujitsu Celsius H970 | |
| Schenker XMG P507 | |
| Lenovo ThinkPad P71-20HK0004GE | |
| MSI GE72 7RE-046 | |
| MSI WE72 7RJ | |
| HP ZBook 17 G3 TZV66eA | |
| bajo | medio | alto | ultra | |
|---|---|---|---|---|
| BioShock Infinite (2013) | 196.9 | 174.4 | 162.4 | 96 |
| Company of Heroes 2 (2013) | 67.6 | 61.1 | 59.7 | 44.94 |
| Total War: Rome II (2013) | 236.7 | 184.1 | 151.4 | 63.3 |
| GRID: Autosport (2014) | 153.8 | 106.3 | 96.9 | 84.5 |
| The Witcher 3 (2015) | 159.7 | 113.6 | 77.2 | 41.09 |
| Star Wars Battlefront (2015) | 122.5 | 116.4 | 89.2 | 85.7 |
| Rise of the Tomb Raider (2016) | 115.9 | 103.2 | 76.8 | 65.5 |
| Doom (2016) | 119.5 | 112.4 | 91 | 87.1 |
| Civilization 6 (2016) | 66.7 | 55.2 | 45.13 | 43.7 |
| Warhammer 40.000: Dawn of War III (2017) | 70.3 | 61.6 | 58.8 | 54 |
Ruido
| Ocioso |
| 30.2 / 32.8 / 32.8 dB(A) |
| Carga |
| 47.3 / 47.3 dB(A) |
 | ||
30 dB silencioso 40 dB(A) audible 50 dB(A) ruidosamente alto |
||
min: | ||
(±) La temperatura máxima en la parte superior es de 41.4 °C / 107 F, frente a la media de 38.2 °C / 101 F, que oscila entre 22.2 y 69.8 °C para la clase Workstation.
(-) El fondo se calienta hasta un máximo de 48.7 °C / 120 F, frente a la media de 41.1 °C / 106 F
(+) En reposo, la temperatura media de la parte superior es de 25.9 °C / 79# F, frente a la media del dispositivo de 32 °C / 90 F.
(+) El reposamanos y el panel táctil están a una temperatura inferior a la de la piel, con un máximo de 26.6 °C / 79.9 F y, por tanto, son fríos al tacto.
(±) La temperatura media de la zona del reposamanos de dispositivos similares fue de 27.8 °C / 82 F (+1.2 °C / 2.1 F).
Fujitsu Celsius H970 análisis de audio
(±) | la sonoridad del altavoz es media pero buena (73.8 dB)
Graves 100 - 315 Hz
(-) | casi sin bajos - de media 26.7% inferior a la mediana
(+) | el bajo es lineal (5.1% delta a la frecuencia anterior)
Medios 400 - 2000 Hz
(±) | medios reducidos - de media 5.4% inferior a la mediana
(±) | la linealidad de los medios es media (8.3% delta respecto a la frecuencia anterior)
Altos 2 - 16 kHz
(+) | máximos equilibrados - a sólo 4.1% de la mediana
(+) | los máximos son lineales (6.2% delta a la frecuencia anterior)
Total 100 - 16.000 Hz
(±) | la linealidad del sonido global es media (29.1% de diferencia con la mediana)
En comparación con la misma clase
» 96% de todos los dispositivos probados de esta clase eran mejores, 1% similares, 3% peores
» El mejor tuvo un delta de 7%, la media fue 17%, el peor fue ###max##%
En comparación con todos los dispositivos probados
» 87% de todos los dispositivos probados eran mejores, 2% similares, 11% peores
» El mejor tuvo un delta de 4%, la media fue 23%, el peor fue ###max##%
Lenovo ThinkPad P71-20HK0004GE análisis de audio
(-) | altavoces no muy altos (#70.9 dB)
Graves 100 - 315 Hz
(±) | lubina reducida - en promedio 12.4% inferior a la mediana
(±) | la linealidad de los graves es media (10.5% delta a frecuencia anterior)
Medios 400 - 2000 Hz
(±) | medias más altas - de media 5.9% más altas que la mediana
(+) | los medios son lineales (6.4% delta a la frecuencia anterior)
Altos 2 - 16 kHz
(±) | máximos reducidos - de media 5% inferior a la mediana
(±) | la linealidad de los máximos es media (13.6% delta a frecuencia anterior)
Total 100 - 16.000 Hz
(±) | la linealidad del sonido global es media (26.6% de diferencia con la mediana)
En comparación con la misma clase
» 90% de todos los dispositivos probados de esta clase eran mejores, 4% similares, 6% peores
» El mejor tuvo un delta de 7%, la media fue 17%, el peor fue ###max##%
En comparación con todos los dispositivos probados
» 82% de todos los dispositivos probados eran mejores, 3% similares, 15% peores
» El mejor tuvo un delta de 4%, la media fue 23%, el peor fue ###max##%
| Off / Standby | |
| Ocioso | |
| Carga |
|
Clave:
min: | |
| Fujitsu Celsius H970 E3-1535M v6, Quadro P4000, Samsung SM961 MZVKW512HMJP m.2 PCI-e, IPS LED, 1920x1080, 17.3" | HP ZBook 17 G3 TZV66eA E3-1535M v5, Quadro M3000M, Samsung SM951 MZVPV256HDGL m.2 PCI-e, IPS, 1920x1080, 17.3" | Dell Precision 7710 E3-1535M v5, FirePro W7170M, Samsung SM951 MZVPV256HDGL m.2 PCI-e, IPS LED, 1920x1080, 17.3" | MSI WE72 7RJ i7-7700HQ, Quadro M2200, Samsung SM961 MZVPW256 m.2 PCI-e, IPS, 1920x1080, 17.3" | Schenker W706 6700, Quadro M5000M, Samsung SM951 MZVPV512HDGL m.2 PCI-e, IPS LED, 1920x1080, 17.3" | Lenovo ThinkPad P71-20HK0004GE i7-7820HQ, Quadro P3000, Samsung PM961 NVMe MZVLW512HMJP, IPS, 3840x2160, 17.3" | |
|---|---|---|---|---|---|---|
| Power Consumption | 6% | -29% | -17% | -74% | 0% | |
| Idle Minimum * (Watt) | 10.7 | 6.7 37% | 6.04 44% | 15 -40% | 25.9 -142% | 7.44 30% |
| Idle Average * (Watt) | 15.8 | 12.5 21% | 15.2 4% | 20.1 -27% | 31 -96% | 18 -14% |
| Idle Maximum * (Watt) | 17.8 | 13.2 26% | 42.3 -138% | 23.8 -34% | 31.9 -79% | 21.8 -22% |
| Load Average * (Watt) | 92 | 128.2 -39% | 112.8 -23% | 85.6 7% | 104.7 -14% | 77.1 16% |
| Load Maximum * (Watt) | 137 | 158.9 -16% | 182.2 -33% | 128 7% | 193 -41% | 150.5 -10% |
* ... más pequeño es mejor
| Fujitsu Celsius H970 E3-1535M v6, Quadro P4000, 96 Wh | HP ZBook 17 G3 TZV66eA E3-1535M v5, Quadro M3000M, 96 Wh | Dell Precision 7710 E3-1535M v5, FirePro W7170M, 72 Wh | MSI WE72 7RJ i7-7700HQ, Quadro M2200, 51 Wh | Schenker W706 6700, Quadro M5000M, 82 Wh | Lenovo ThinkPad P71-20HK0004GE i7-7820HQ, Quadro P3000, 96 Wh | |
|---|---|---|---|---|---|---|
| Duración de Batería | -13% | -22% | -63% | -47% | -16% | |
| Reader / Idle (h) | 16.7 | 15.9 -5% | 12.9 -23% | 4.5 -73% | 3.4 -80% | 14.5 -13% |
| H.264 (h) | 9.6 | 5 -48% | 4.7 -51% | 3 -69% | 2.5 -74% | 8.6 -10% |
| WiFi v1.3 (h) | 9 | 4.8 -47% | 6.1 -32% | 3 -67% | 3 -67% | 6 -33% |
| Load (h) | 1.2 | 1.8 50% | 1.4 17% | 0.7 -42% | 1.6 33% | 1.1 -8% |
Pro
Contra
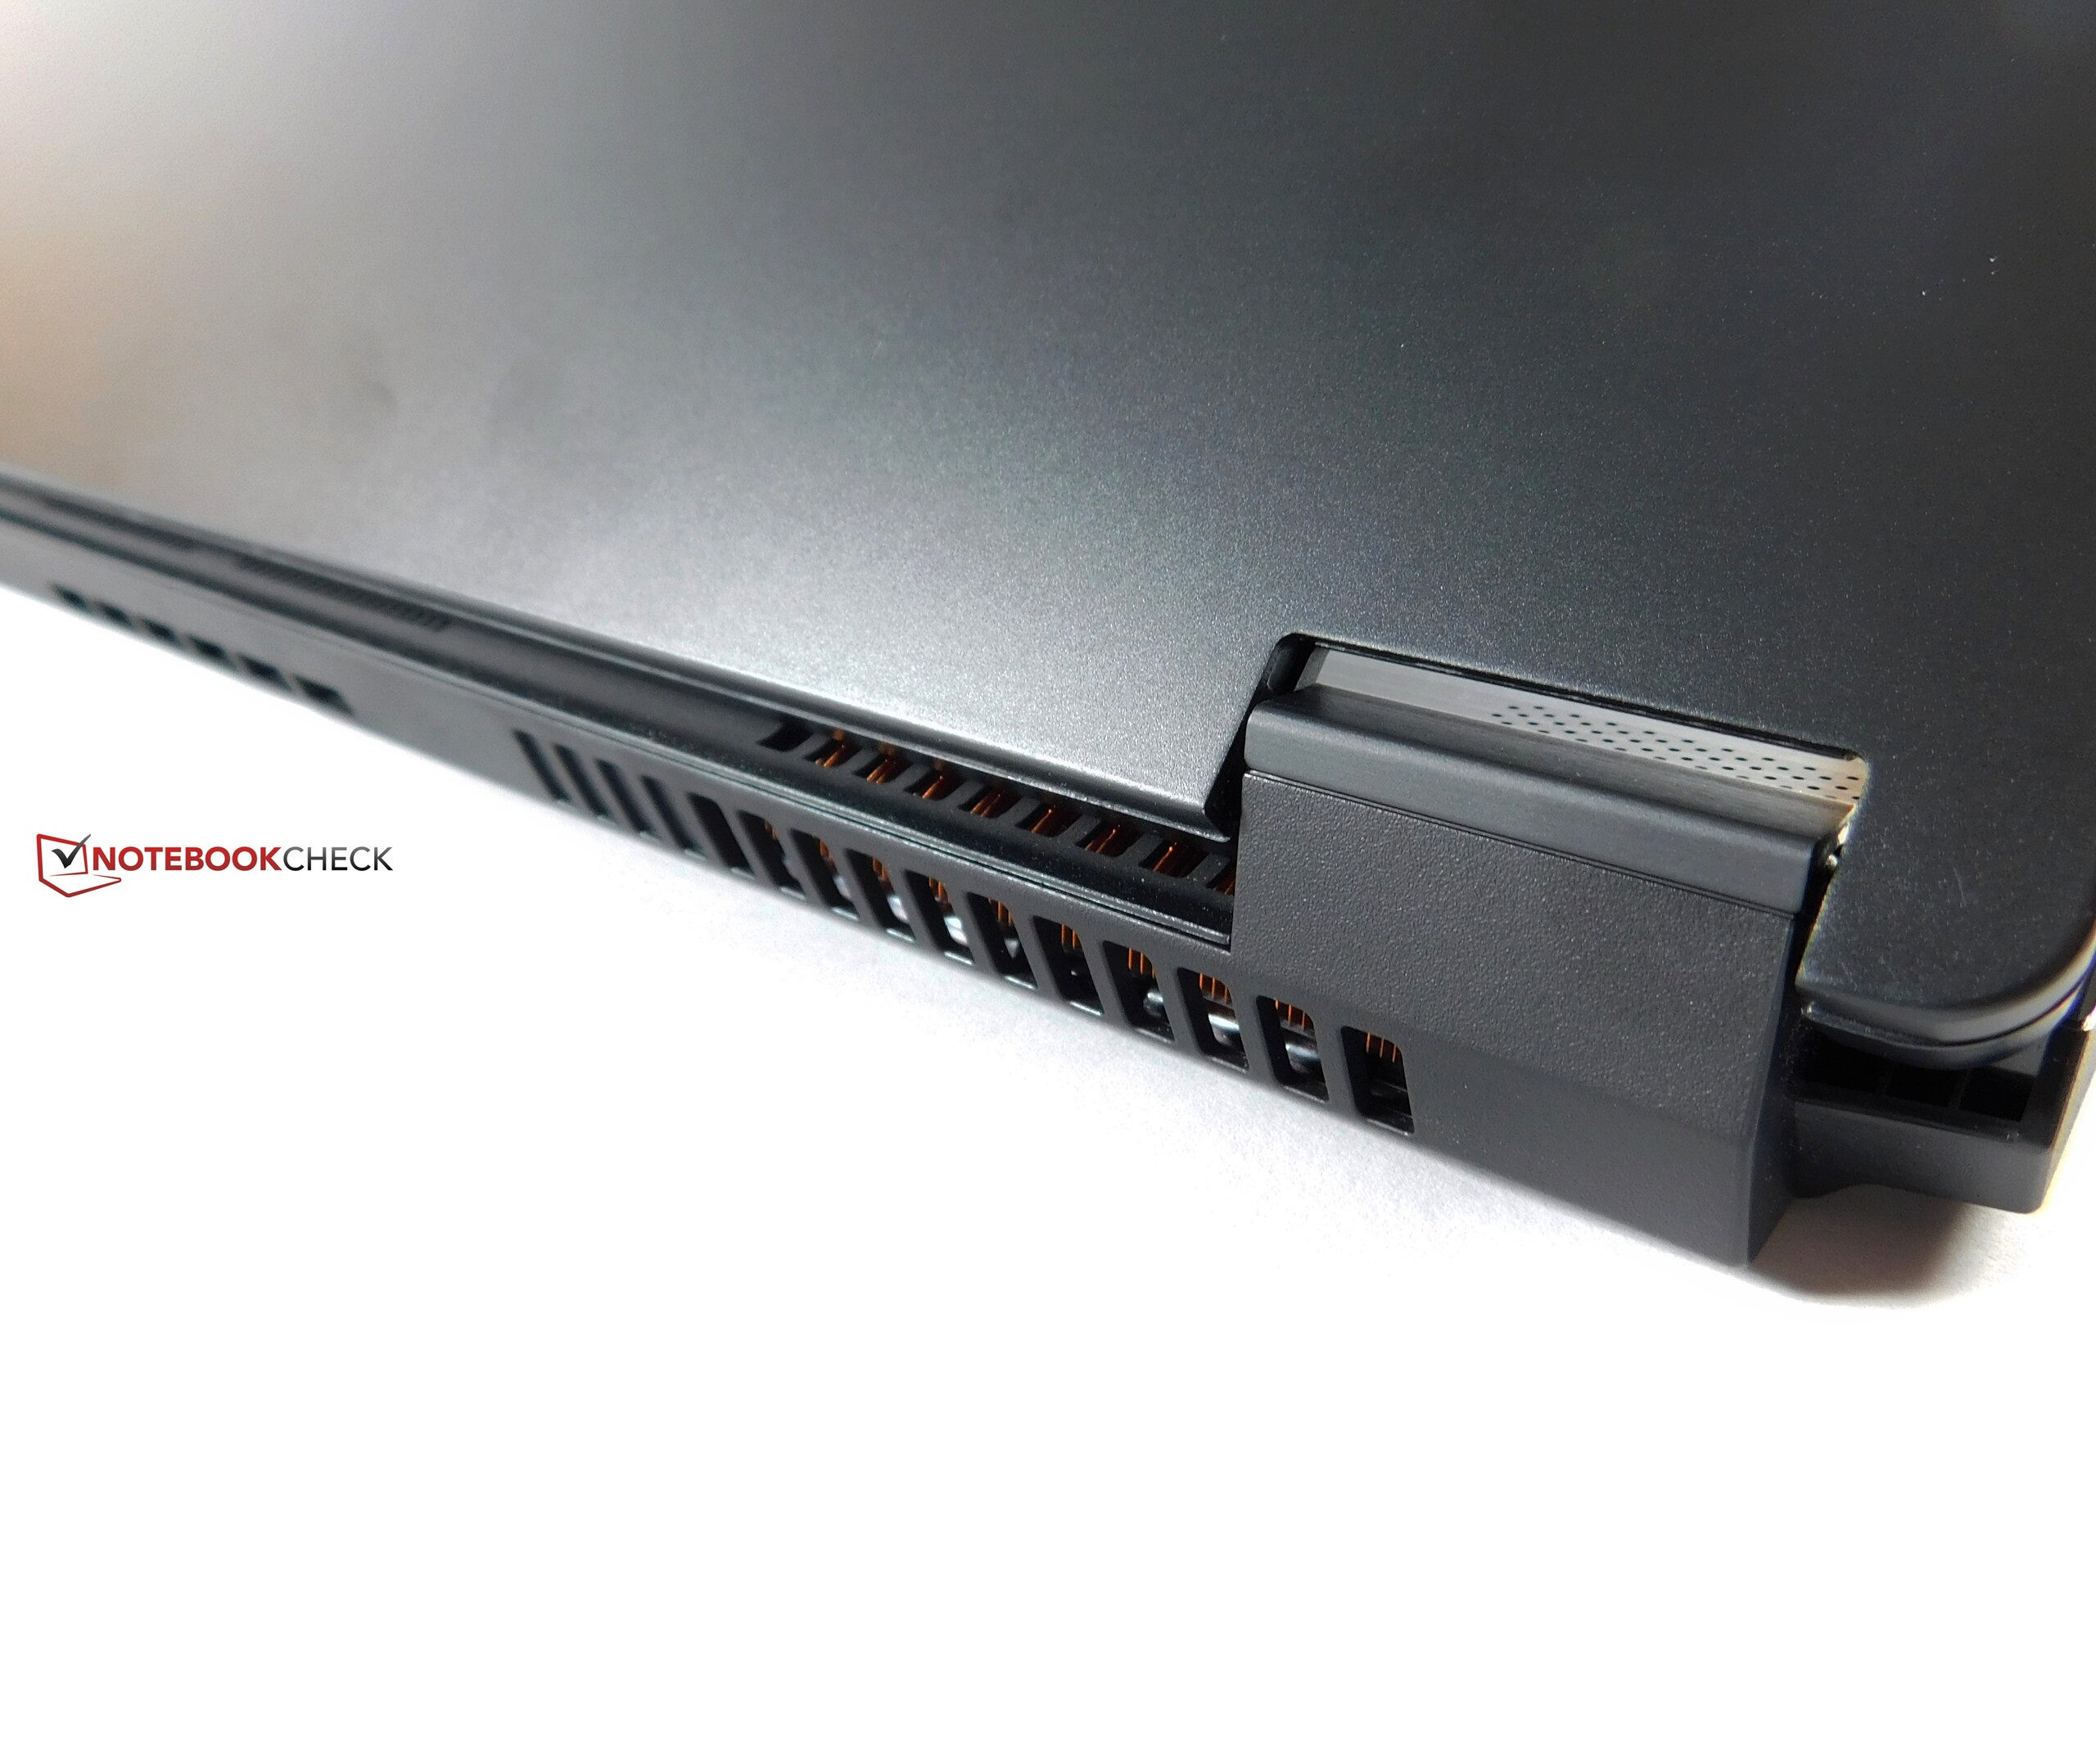
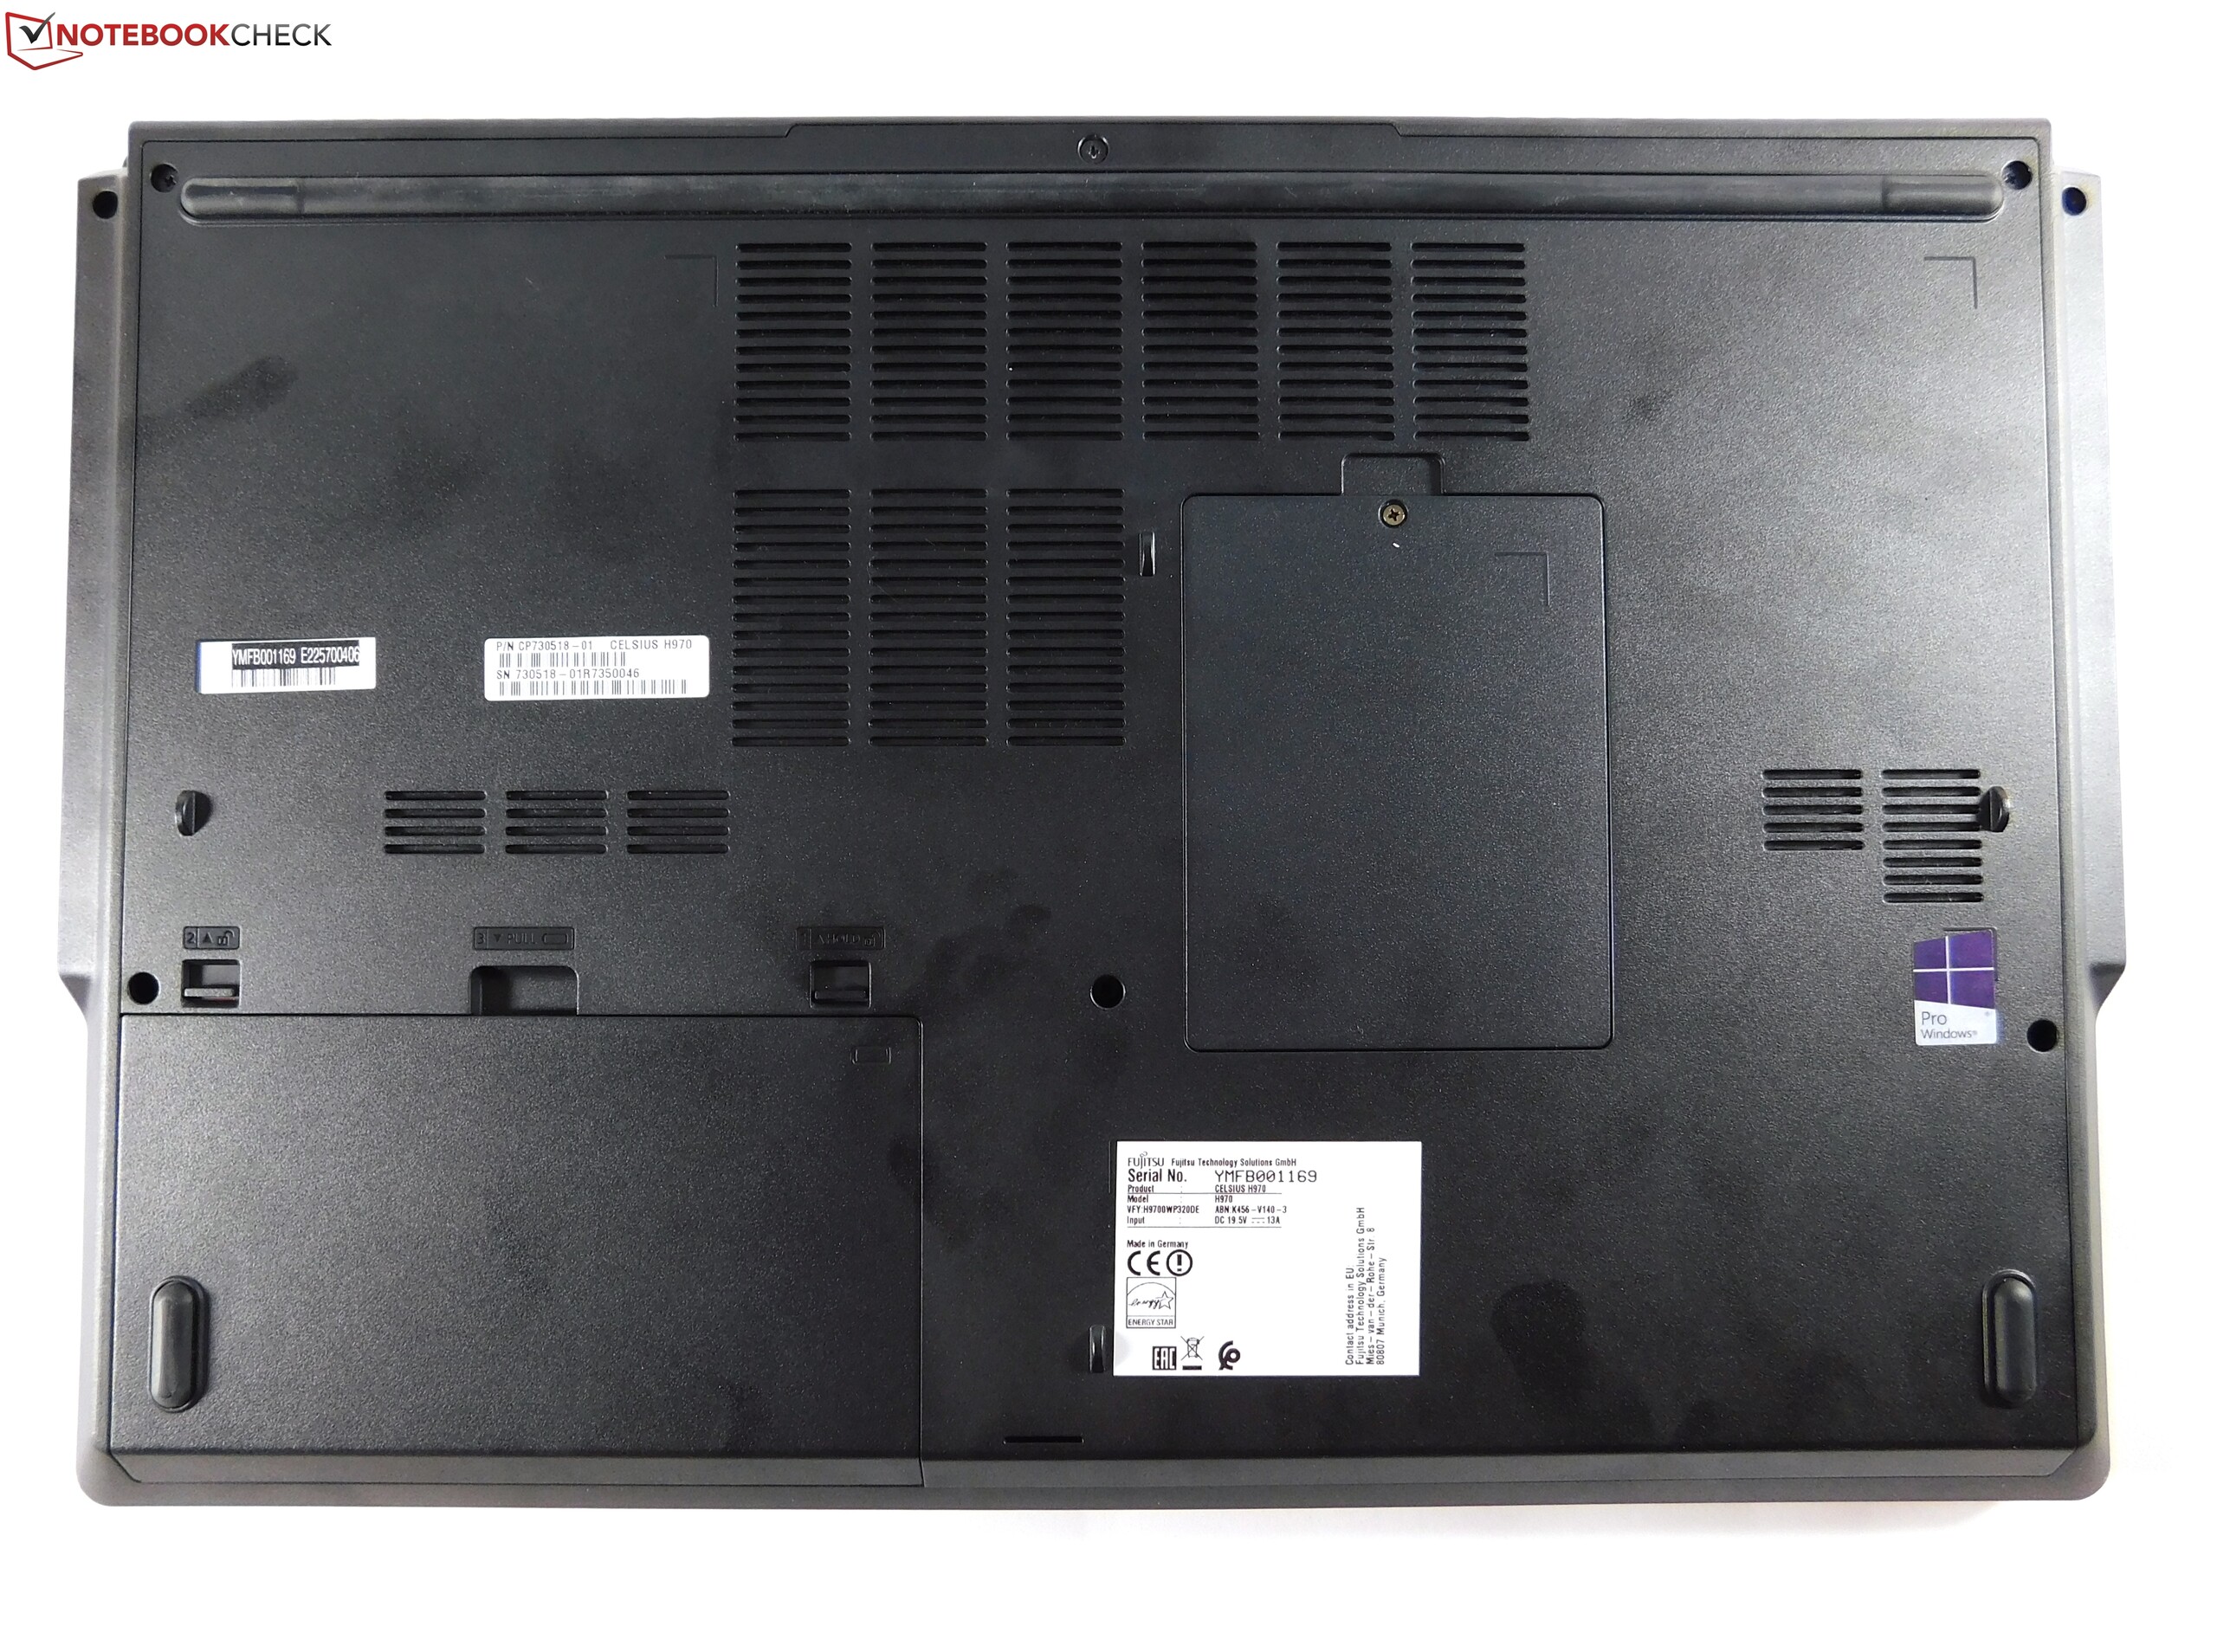
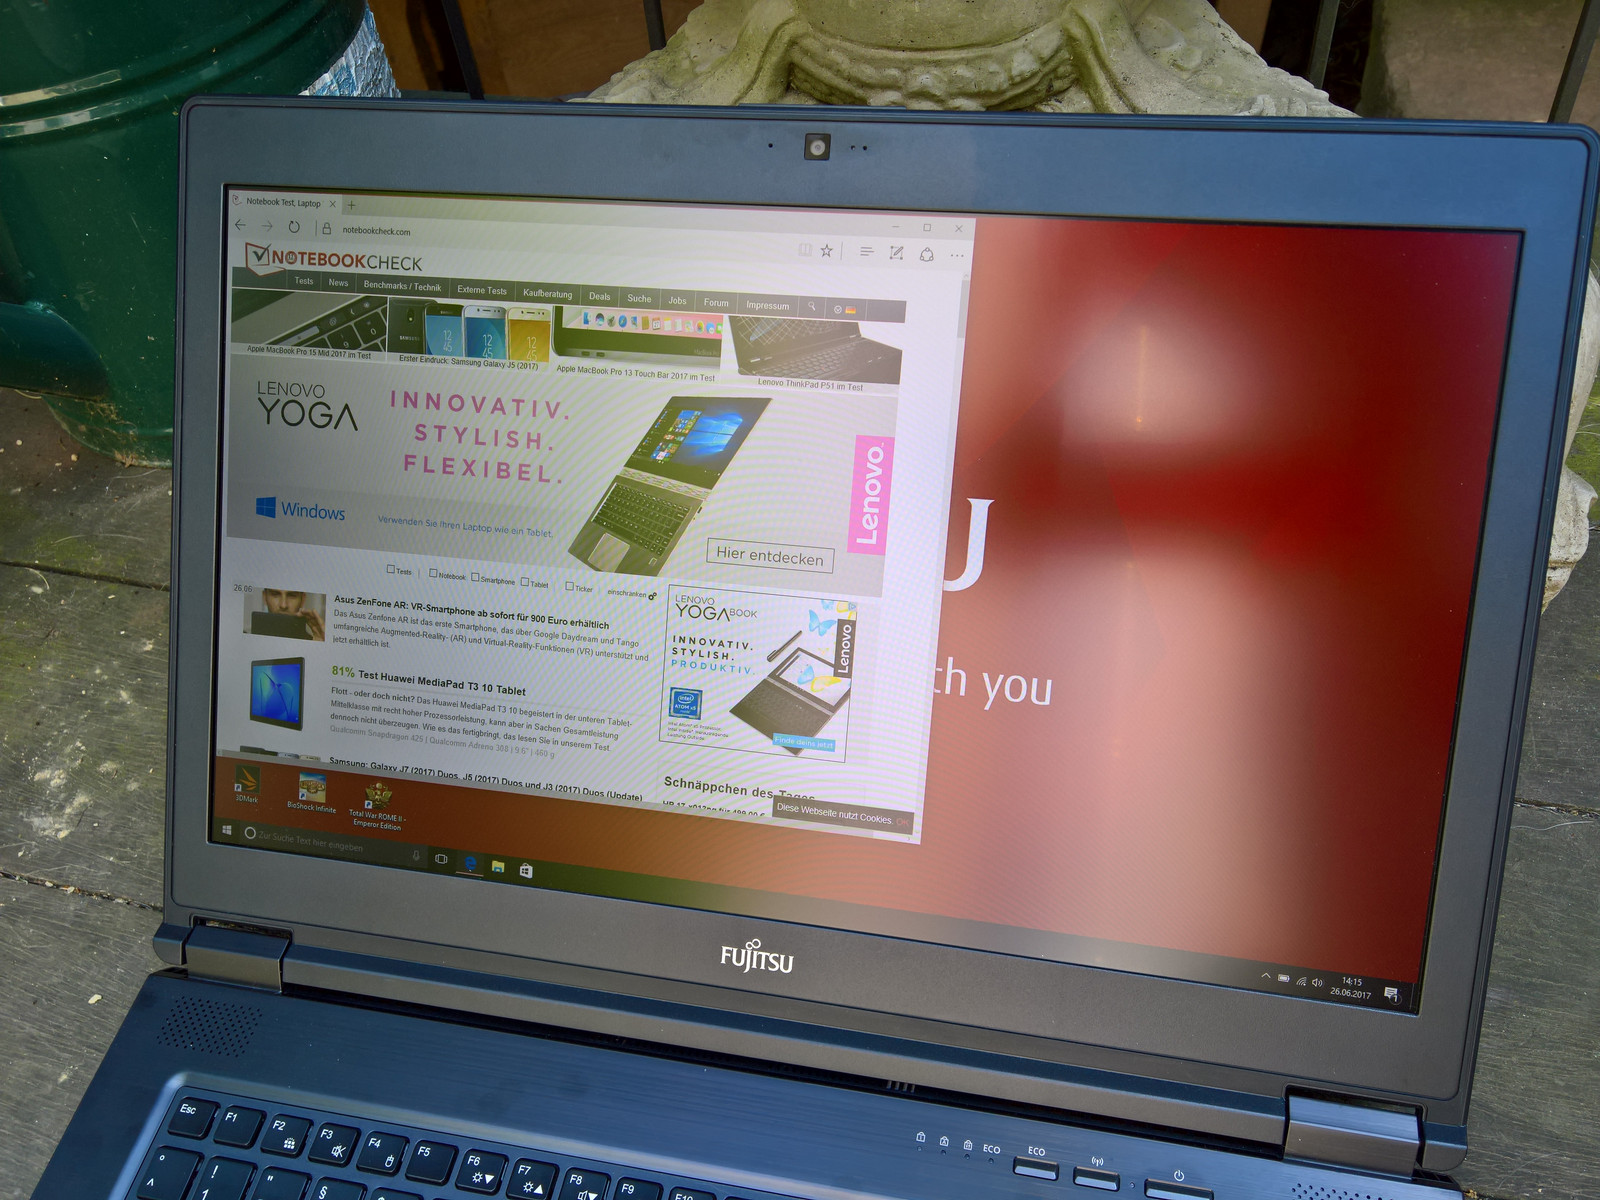
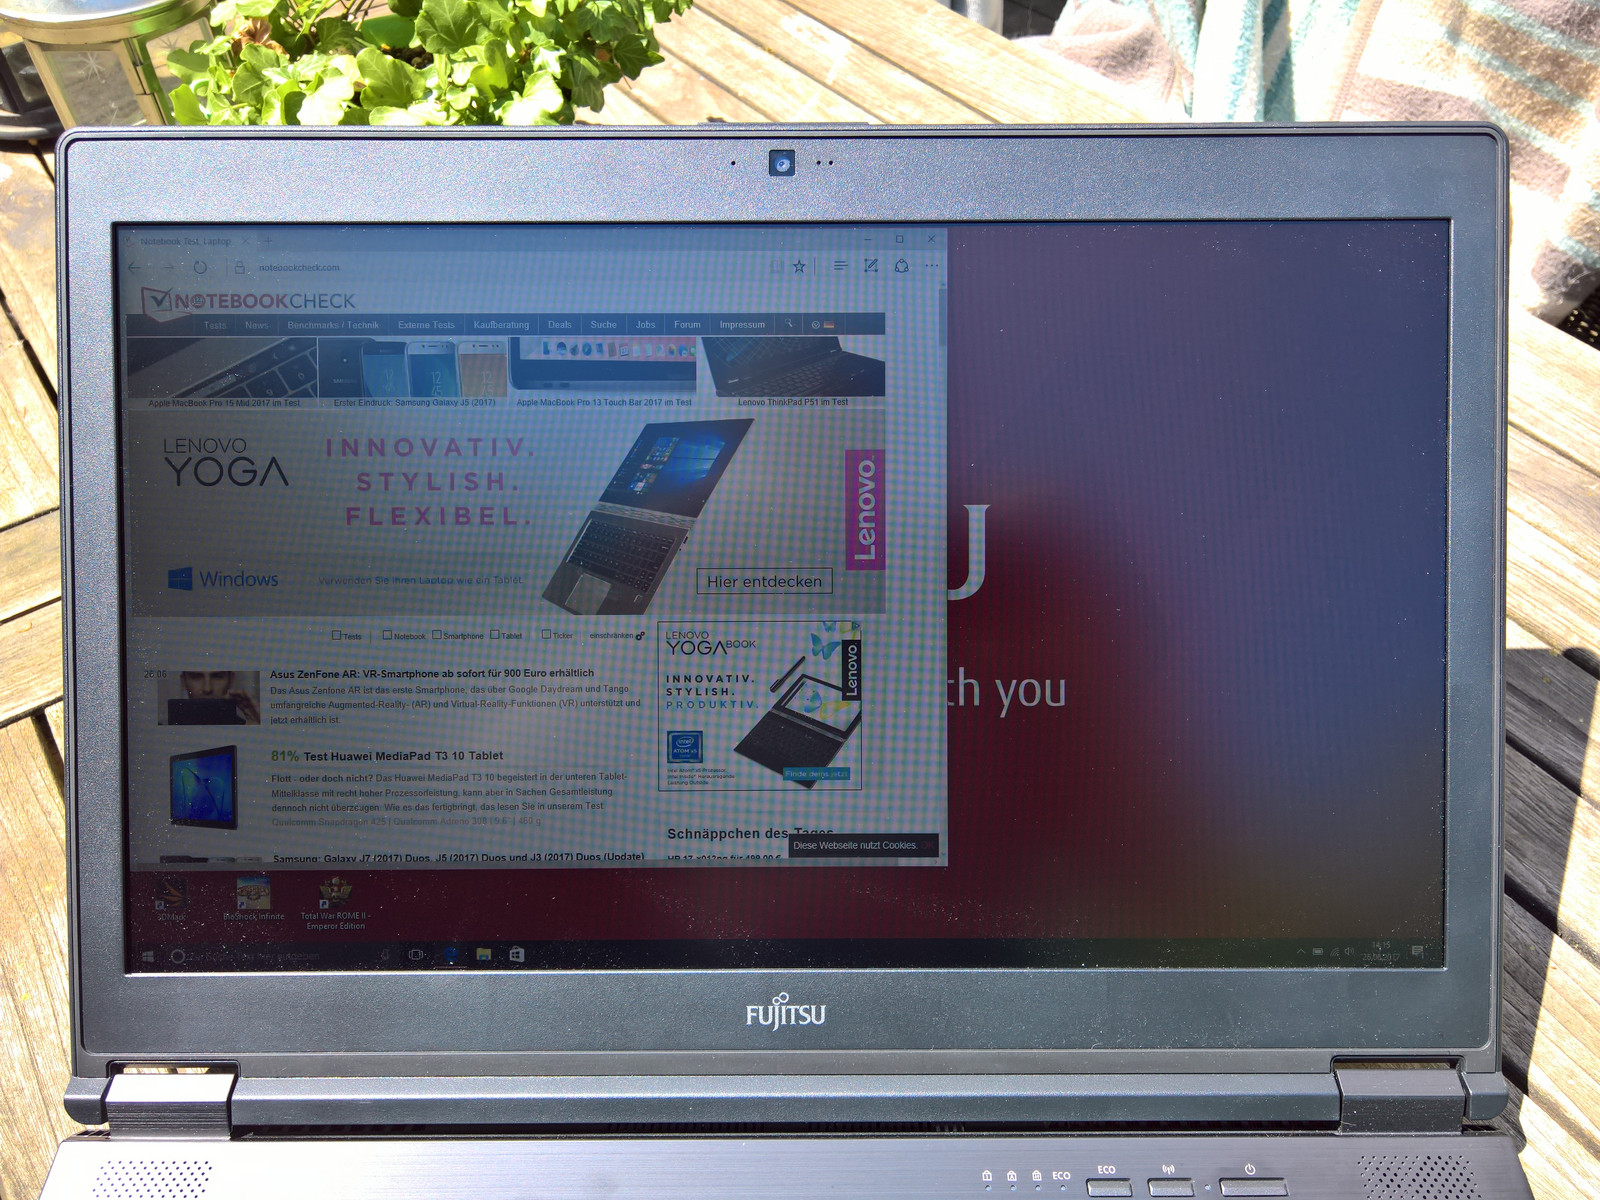
No es fácil servir al mercado de las estaciones de trabajo. Sólo hay unos pocos fabricantes con experiencia y reputación suficientes para jugar en la clase de portátiles de la "realeza". Fujitsu quiere ser uno de estos fabricantes - al menos por ahora. Sin embargo, el Fujitsu Celsius H970 no nos puede convencer. Fujitsu ofrece una estación de trabajo móvil que es sorprendentemente buena en algunas áreas, pero demasiado mala en otras. Las áreas buenas ciertamente incluyen el aguante de batería, que es más que decente para una estación de trabajo. Muestra que con las nuevas generaciones de CPUs eficientes, los procesdores quad-core no tienen por qué implicar un mal aguante de batería. El brillo del display también es atractivo, y como en el aguante de batería, el Celsius es el mejor de su clase. El rendimiento GPU es de primera, lo que se debe al efectivo sistema de ventilación GPU. Y por último, ciertamente tenemos que mencionar la excelente mantenibilidad como una de las ventajas del Celsius. Sólo queda levemente opacada por el hecho de necesitar cables especiales para insertar discos de 2.5".
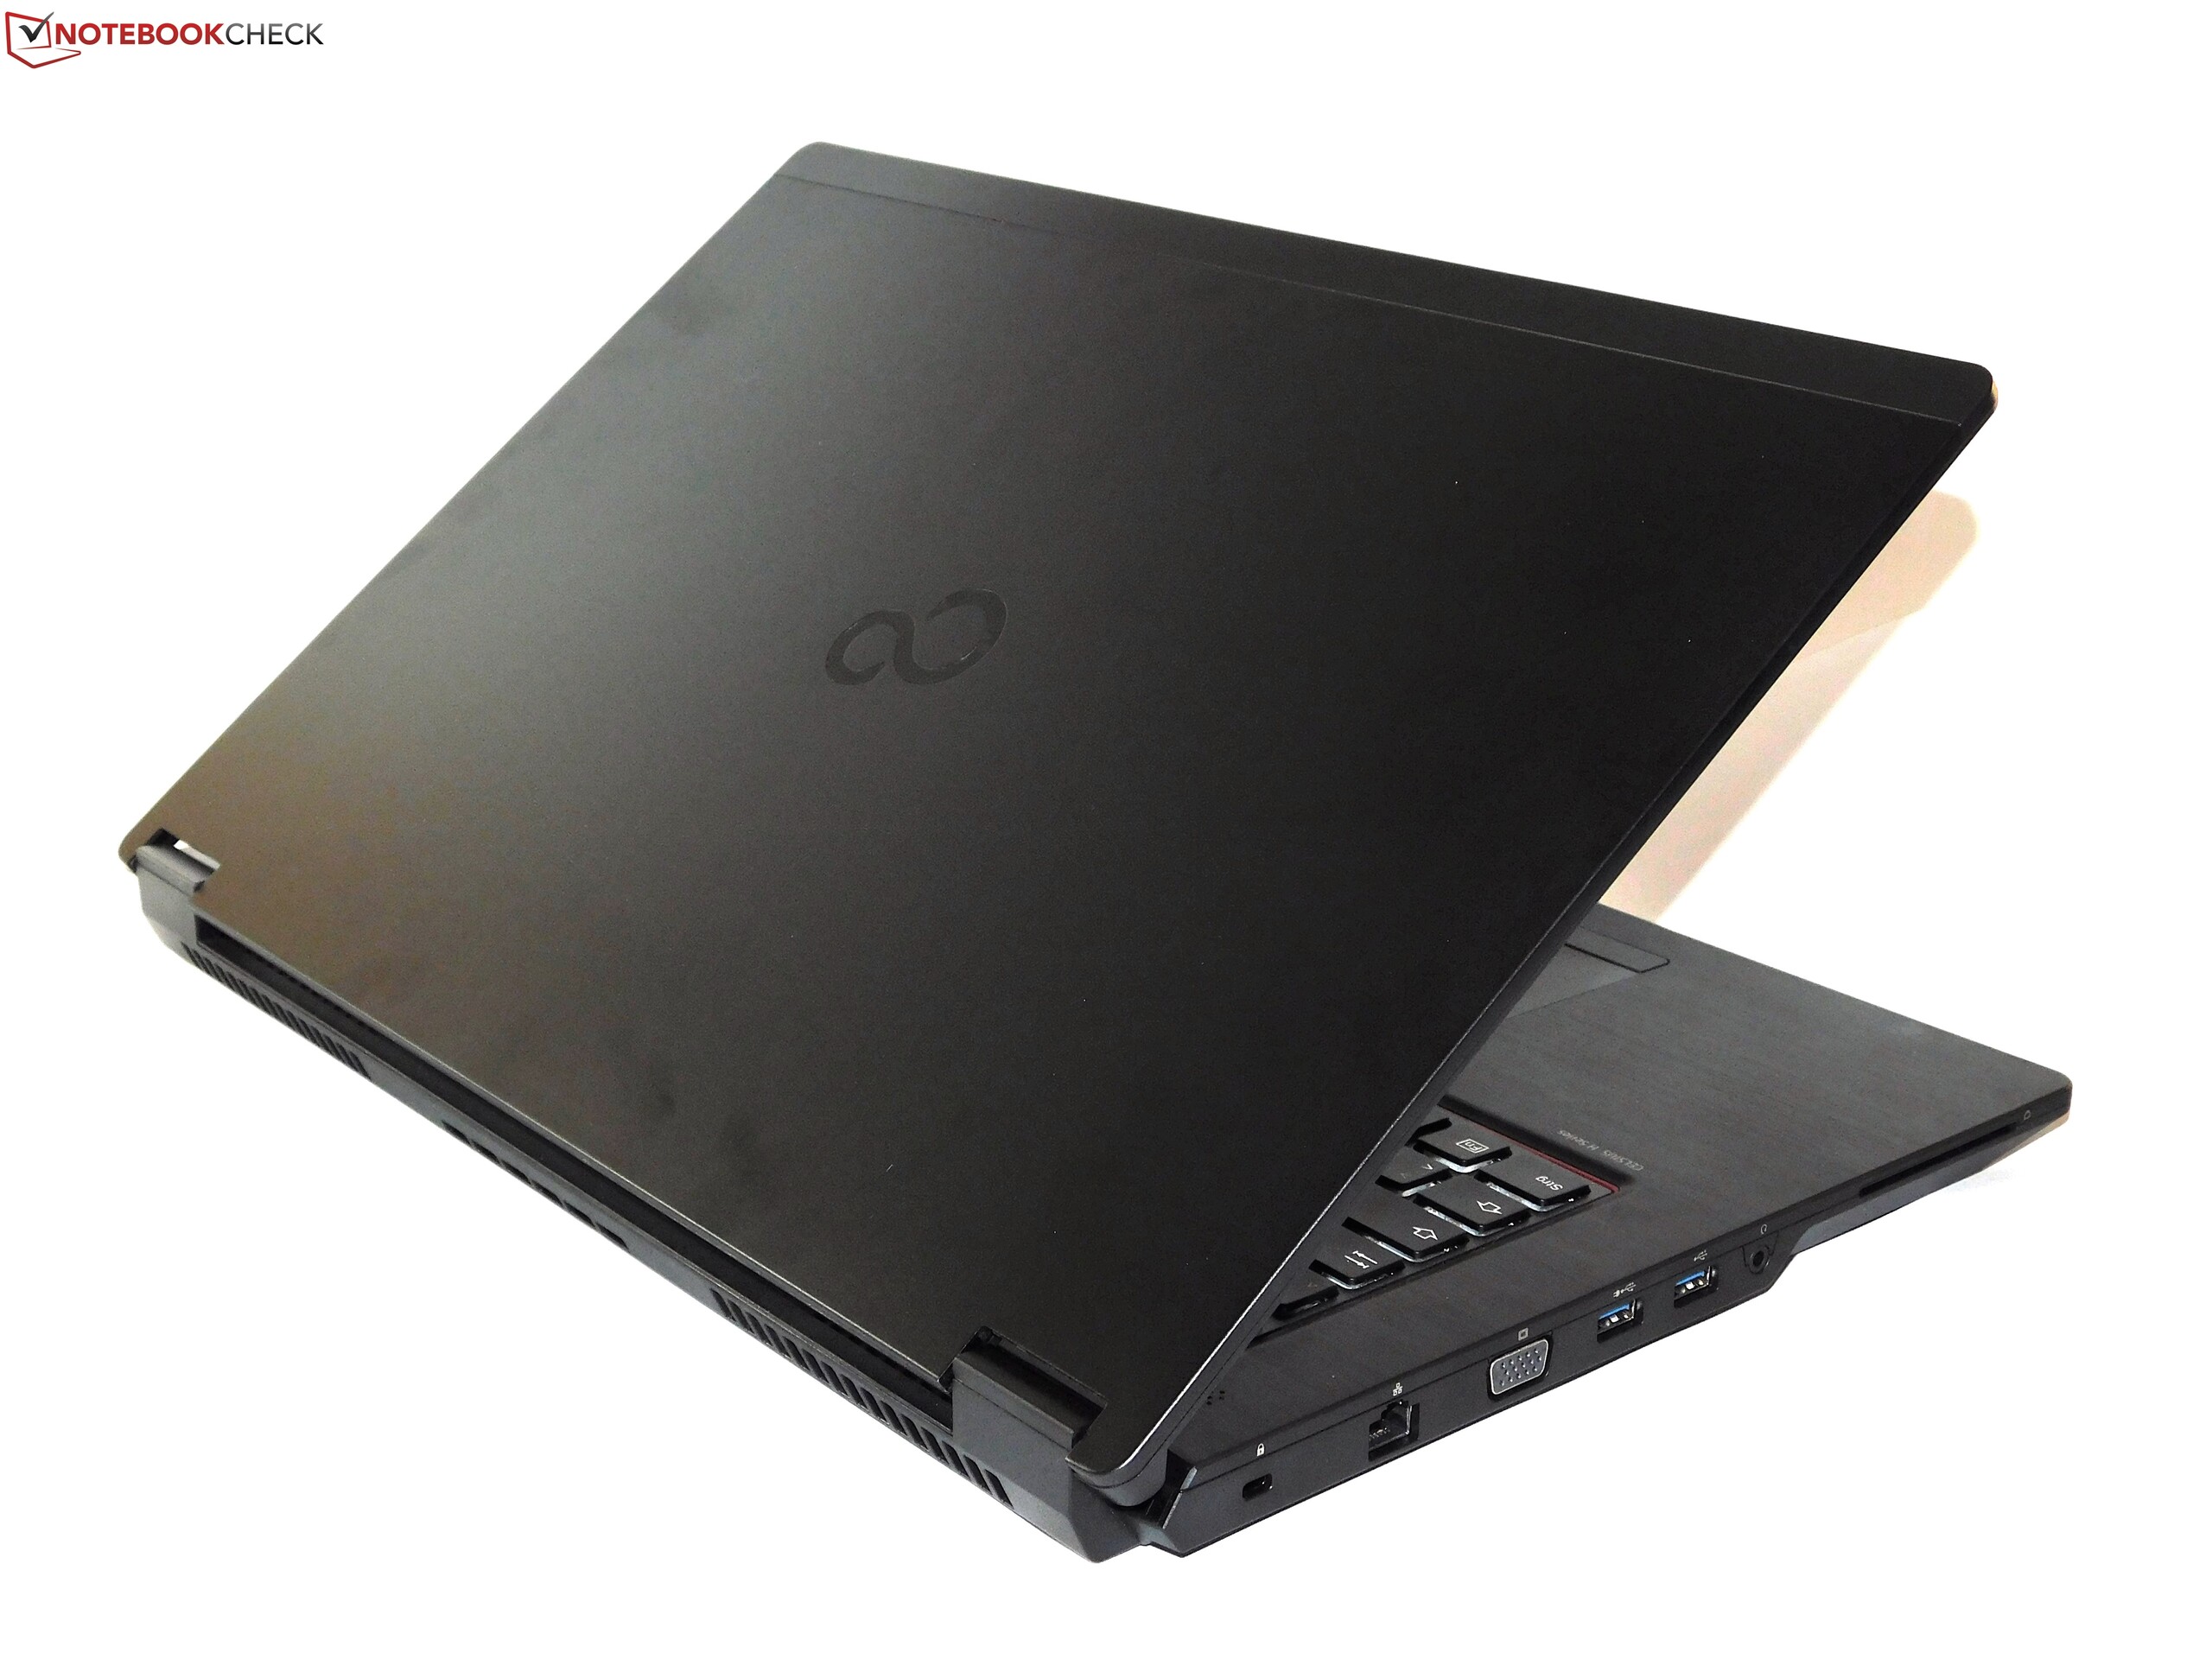
El aguante de batería y el brillo del display, ¿son esos los valores más importantes para un portátil que seguramente sólo moveras de un escritorio a otro debido a su tamaño y peso? ¡Seguramente no! Por desgracia, el Fujitsu falla en cosas más importantes, como el sistema de ventilación CPU. Dónde la ventilación de la GPU tiene éxito, la de la CPU falla. Es demasiado pequeña. Esto hace que el dispositivo sea muy ruidoso, ya que el ventilador tiene que correr mucho para enfriar algo la CPU. Y a pesar de eso, la ralentización térmica es inevitable. Esto ya se da en el test Cinebench que ni siquiera da mucha carga, por lo que en el día a día, el Celsius no alcanza a usar todo el potencial de la CPU integrada. De este modo, el caro Xeon E3-1535M V6, que en realidad es la CPU móvil Kaby-Lake más rápida, se vuelve el chip más lento de la comparación. Como si esto no fuera ya bastante malo, Fujitsu comete otro gran error con el teclado elástico. Y aunque el display es brillante, los colores no son particularmente fuertes, y ni siquiera c ubre el espacio de color sRGB. Fujitsu no ofrece un display de más resolución y cobertura de espacio de color.
No aprueba: Si bien el Fujitsu Celsius H970 tiene sus cualidades, en particular el deficiente sistema de ventilación CPU queda fuera de lugar en una estación de trabajo móvil.
Debido a estos problemas, al Celsius le cuesta hacerle frente a la competencia establecida como ThinkPad P71, ZBook 17 G3, o Precision 7710. Que aún logre una buena valoración se debe principalmente al elevado rendimiento de la GPU profesional.
Ésta es una versión acortada del análisis original. Puedes leer el análisis completo en inglés aquí.
Fujitsu Celsius H970
- 07/07/2017 v6 (old)
Benjamin Herzig