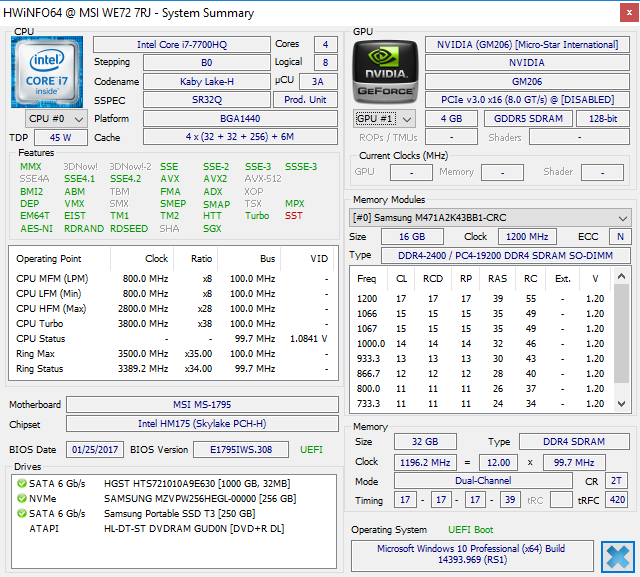
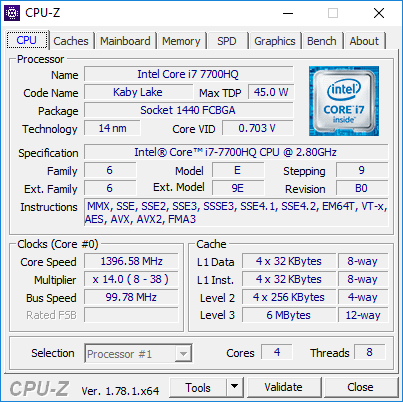
Breve análisis de la estación de trabajo MSI WE72 7RJ (7700HQ, FHD, M2200)

| SD Card Reader | |
| average JPG Copy Test (av. of 3 runs) | |
| Dell Precision 7710 | |
| HP ZBook 17 G3 TZV66eA | |
| Lenovo ThinkPad P70 | |
| MSI WE72 7RJ | |
| maximum AS SSD Seq Read Test (1GB) | |
| HP ZBook 17 G3 TZV66eA | |
| Lenovo ThinkPad P70 | |
| Dell Precision 7710 | |
| MSI WE72 7RJ | |
| Networking | |
| iperf3 transmit AX12 | |
| Lenovo ThinkPad T570-20HAS01E00 | |
| MSI GE72 7RE-046 | |
| MSI WE72 7RJ | |
| iperf3 receive AX12 | |
| Lenovo ThinkPad T570-20HAS01E00 | |
| MSI WE72 7RJ | |
| MSI GE72 7RE-046 | |
| |||||||||||||||||||||||||
iluminación: 93 %
Brillo con batería: 301 cd/m²
Contraste: 974:1 (Negro: 0.31 cd/m²)
ΔE ColorChecker Calman: 6.2 | ∀{0.5-29.43 Ø4.71}
ΔE Greyscale Calman: 7.3 | ∀{0.09-98 Ø4.96}
85.2% sRGB (Argyll 1.6.3 3D)
56% AdobeRGB 1998 (Argyll 1.6.3 3D)
62.4% AdobeRGB 1998 (Argyll 3D)
85.3% sRGB (Argyll 3D)
67.4% Display P3 (Argyll 3D)
Gamma: 2.08
CCT: 7020 K
| MSI WE72 7RJ LP173WF4-SPF1, , 1920x1080, 17.3" | Dell Precision 7710 SDC8151, VHN17_173HL, , 1920x1080, 17.3" | Lenovo ThinkPad P70 LEN4123, , 3840x2160, 17.3" | HP ZBook 17 G3 TZV66eA SDC3854, , 1920x1080, 17.3" | |
|---|---|---|---|---|
| Display | 8% | 30% | 8% | |
| Display P3 Coverage (%) | 67.4 | 66.6 -1% | 90.8 35% | 67.3 0% |
| sRGB Coverage (%) | 85.3 | 96.9 14% | 100 17% | 95.9 12% |
| AdobeRGB 1998 Coverage (%) | 62.4 | 68.6 10% | 85.4 37% | 69 11% |
| Response Times | -24% | -1% | -10% | |
| Response Time Grey 50% / Grey 80% * (ms) | 45.2 ? | 50 ? -11% | 44 ? 3% | 50.4 ? -12% |
| Response Time Black / White * (ms) | 26.4 ? | 36 ? -36% | 27.6 ? -5% | 28.4 ? -8% |
| PWM Frequency (Hz) | 198 ? | 228 ? | 200 ? | |
| Screen | 13% | 11% | 23% | |
| Brightness middle (cd/m²) | 302 | 332 10% | 365 21% | 252 -17% |
| Brightness (cd/m²) | 306 | 307 0% | 341 11% | 243 -21% |
| Brightness Distribution (%) | 93 | 83 -11% | 85 -9% | 86 -8% |
| Black Level * (cd/m²) | 0.31 | 0.33 -6% | 0.4 -29% | 0.21 32% |
| Contrast (:1) | 974 | 1006 3% | 913 -6% | 1200 23% |
| Colorchecker dE 2000 * | 6.2 | 3 52% | 3.8 39% | 2.2 65% |
| Colorchecker dE 2000 max. * | 10.6 | 3.8 64% | ||
| Greyscale dE 2000 * | 7.3 | 4 45% | 6.09 17% | 2.7 63% |
| Gamma | 2.08 106% | 2 110% | 2.3 96% | 2.28 96% |
| CCT | 7020 93% | 7089 92% | 6332 103% | 6686 97% |
| Color Space (Percent of AdobeRGB 1998) (%) | 56 | 62 11% | 76.01 36% | 62 11% |
| Color Space (Percent of sRGB) (%) | 85.2 | 97 14% | 99.97 17% | 96 13% |
| Media total (Programa/Opciones) | -1% /
7% | 13% /
13% | 7% /
15% |
* ... más pequeño es mejor
Tiempos de respuesta del display
| ↔ Tiempo de respuesta de Negro a Blanco | ||
|---|---|---|
| 26.4 ms ... subida ↗ y bajada ↘ combinada | ↗ 14.8 ms subida | 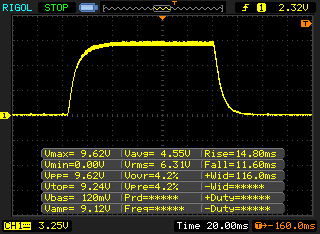 |
| ↘ 11.6 ms bajada | ||
| La pantalla mostró tiempos de respuesta relativamente lentos en nuestros tests pero podría ser demasiado lenta para los jugones. En comparación, todos los dispositivos de prueba van de ##min### (mínimo) a 240 (máximo) ms. » 66 % de todos los dispositivos son mejores. Eso quiere decir que el tiempo de respuesta es peor que la media (19.8 ms) de todos los dispositivos testados. | ||
| ↔ Tiempo de respuesta 50% Gris a 80% Gris | ||
| 45.2 ms ... subida ↗ y bajada ↘ combinada | ↗ 27.2 ms subida | 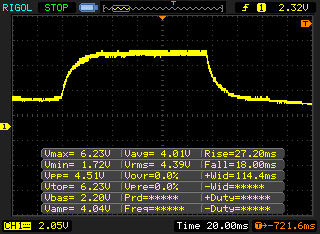 |
| ↘ 18 ms bajada | ||
| La pantalla mostró tiempos de respuesta lentos en nuestros tests y podría ser demasiado lenta para los jugones. En comparación, todos los dispositivos de prueba van de ##min### (mínimo) a 636 (máximo) ms. » 78 % de todos los dispositivos son mejores. Eso quiere decir que el tiempo de respuesta es peor que la media (31 ms) de todos los dispositivos testados. | ||
Parpadeo de Pantalla / PWM (Pulse-Width Modulation)
| Parpadeo de Pantalla / PWM no detectado | 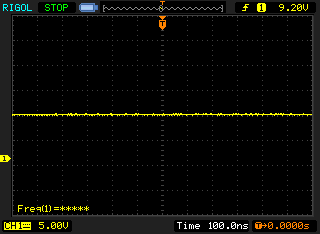 | ||
Comparación: 52 % de todos los dispositivos testados no usaron PWM para atenuar el display. Si se usó, medimos una media de 7754 (mínimo: 5 - máxmo: 343500) Hz. | |||
| PCMark 8 | |
| Home Score Accelerated v2 | |
| Dell Precision 7710 | |
| MSI WE72 7RJ | |
| HP ZBook 17 G3 TZV66eA | |
| Lenovo ThinkPad P70 | |
| Work Score Accelerated v2 | |
| Dell Precision 7710 | |
| HP ZBook 17 G3 TZV66eA | |
| MSI WE72 7RJ | |
| Lenovo ThinkPad P70 | |
| PCMark 8 Home Score Accelerated v2 | 4295 puntos | |
| PCMark 8 Work Score Accelerated v2 | 5150 puntos | |
ayuda | ||
| MSI WE72 7RJ Samsung SM961 MZVPW256 m.2 PCI-e | Lenovo ThinkPad P70 Samsung SSD PM871 MZNLN512HCJH | HP ZBook 17 G3 TZV66eA Samsung SM951 MZVPV256HDGL m.2 PCI-e | MSI GE72 7RE-046 Toshiba HG6 THNSNJ256G8NY | Dell Precision 5520 UHD Samsung SM961 MZVKW512HMJP m.2 PCI-e | MSI GS63VR 7RF-228US Samsung SM961 MZVKW512HMJP m.2 PCI-e | |
|---|---|---|---|---|---|---|
| CrystalDiskMark 3.0 | -44% | 30% | -45% | 10% | 9% | |
| Read Seq (MB/s) | 1492 | 509 -66% | 1481 -1% | 540 -64% | 2253 51% | 2141 43% |
| Write Seq (MB/s) | 1512 | 457.8 -70% | 1243 -18% | 495.7 -67% | 1662 10% | 1621 7% |
| Read 512 (MB/s) | 312.6 | 420.3 34% | 1202 285% | 455.1 46% | 459.1 47% | 499.7 60% |
| Write 512 (MB/s) | 1483 | 420.5 -72% | 1163 -22% | 481.4 -68% | 1611 9% | 1531 3% |
| Read 4k (MB/s) | 59.9 | 29.88 -50% | 58.7 -2% | 22.7 -62% | 56.1 -6% | 54.2 -10% |
| Write 4k (MB/s) | 184.2 | 104.1 -43% | 207.4 13% | 112.9 -39% | 169.4 -8% | 158.2 -14% |
| Read 4k QD32 (MB/s) | 681 | 391.8 -42% | 832 22% | 372.5 -45% | 633 -7% | 632 -7% |
| Write 4k QD32 (MB/s) | 590 | 350.4 -41% | 377.9 -36% | 212.9 -64% | 506 -14% | 527 -11% |

| 3DMark - 1920x1080 Fire Strike Graphics | |
| MSI GE72VR-6RF16H21 | |
| MSI GE72 7RE-046 | |
| Acer Predator 15 G9-592-7925 | |
| Dell Precision 7710 | |
| HP ZBook 17 G3 TZV66eA | |
| Lenovo ThinkPad P70 | |
| MSI GE72 965M Ti | |
| Asus FX553VD-DM249T | |
| MSI WE72 7RJ | |
| HP Omen 17-w010ng | |
| Dell Precision 5520 UHD | |
| Lenovo ThinkPad P50 | |
| Unigine Heaven 4.0 | |
| Extreme Preset DX11 | |
| MSI GE72VR-6RF16H21 | |
| MSI GE72 7RE-046 | |
| MSI WE72 7RJ | |
| MSI GE72 965M Ti | |
| HP Omen 17-w010ng | |
| Extreme Preset OpenGL | |
| MSI WE72 7RJ | |
| Unigine Valley 1.0 | |
| 1920x1080 Extreme HD DirectX AA:x8 | |
| MSI GE72VR-6RF16H21 | |
| HP ZBook 17 G3 TZV66eA | |
| Lenovo ThinkPad P70 | |
| Dell Precision 7710 | |
| MSI WE72 7RJ | |
| MSI GE72 965M Ti | |
| Lenovo ThinkPad P50 | |
| 1920x1080 Extreme HD Preset OpenGL AA:x8 | |
| HP ZBook 17 G3 TZV66eA | |
| Dell Precision 7710 | |
| MSI WE72 7RJ | |
| Lenovo ThinkPad P70 | |
| Lenovo ThinkPad P50 | |
| 3DMark 06 Standard Score | 26834 puntos | |
| 3DMark Vantage P Result | 24622 puntos | |
| 3DMark 11 Performance | 7453 puntos | |
| 3DMark Ice Storm Standard Score | 93770 puntos | |
| 3DMark Cloud Gate Standard Score | 20388 puntos | |
| 3DMark Fire Strike Score | 5252 puntos | |
| 3DMark Fire Strike Extreme Score | 2627 puntos | |
| 3DMark Time Spy Score | 1845 puntos | |
ayuda | ||
| Ghost Recon Wildlands - 1920x1080 High Preset AA:T AF:4x | |
| Gigabyte Aero 15 | |
| Acer Aspire VX5-591G-75C4 VX15 | |
| MSI WE72 7RJ | |
| MSI GL62M 7RD-077 | |
| Apple MacBook Pro 15 2016 (2.6 GHz, 450) | |
| For Honor - 1920x1080 High Preset AA:T AF:8x | |
| Gigabyte Aero 15 | |
| Razer Blade (2017) | |
| MSI WE72 7RJ | |
| MSI GE72 965M Ti | |
| Acer Aspire VX5-591G-75C4 VX15 | |
| Apple MacBook Pro 15 2016 (2.6 GHz, 450) | |
| Battlefield 1 - 1920x1080 High Preset AA:T | |
| Schenker XMG P407 | |
| Acer Aspire VN7-593G-73HP V15 Nitro BE | |
| MSI GE72 965M Ti | |
| Dell XPS 15 2017 9560 (7300HQ, Full-HD) | |
| MSI GL62M 7RD-077 | |
| MSI WE72 7RJ | |
| Apple MacBook Pro 15 2016 (2.9 GHz, 460) | |
| Apple MacBook Pro 15 2016 (2.6 GHz, 450) | |
| bajo | medio | alto | ultra | |
|---|---|---|---|---|
| Tomb Raider (2013) | 381.4 | 238.8 | 149.3 | 70.2 |
| BioShock Infinite (2013) | 229.4 | 177.2 | 155.5 | 58.6 |
| Battlefield 4 (2013) | 171.5 | 148.3 | 115.9 | 47.8 |
| Thief (2014) | 108.8 | 88.6 | 74.8 | 39.6 |
| The Witcher 3 (2015) | 116.6 | 68.4 | 37.8 | 20.3 |
| Star Wars Battlefront (2015) | 148.8 | 119 | 56.4 | 48.2 |
| Rainbow Six Siege (2015) | 214.2 | 131.2 | 70.4 | 52.4 |
| Rise of the Tomb Raider (2016) | 128.7 | 72.8 | 40.7 | 34.4 |
| Battlefield 1 (2016) | 139.4 | 105.3 | 47.1 | 42 |
| For Honor (2017) | 78 | 52.3 | 50.5 | 36.2 |
| Ghost Recon Wildlands (2017) | 83.4 | 37.1 | 33.7 | 17.6 |
Ruido
| Ocioso |
| 36.3 / 36.3 / 36.6 dB(A) |
| Carga |
| 40.4 / 46.6 dB(A) |
 | ||
30 dB silencioso 40 dB(A) audible 50 dB(A) ruidosamente alto |
||
min: | ||
(-) La temperatura máxima en la parte superior es de 45.7 °C / 114 F, frente a la media de 38.2 °C / 101 F, que oscila entre 22.2 y 69.8 °C para la clase Workstation.
(-) El fondo se calienta hasta un máximo de 48.4 °C / 119 F, frente a la media de 41.1 °C / 106 F
(+) En reposo, la temperatura media de la parte superior es de 26.7 °C / 80# F, frente a la media del dispositivo de 32 °C / 90 F.
(-) El reposamanos y el touchpad pueden calentarse mucho al tacto con un máximo de 40.4 °C / 104.7 F.
(-) La temperatura media de la zona del reposamanos de dispositivos similares fue de 27.8 °C / 82 F (-12.6 °C / -22.7 F).
| Off / Standby | |
| Ocioso | |
| Carga |
|
Clave:
min: | |
| MSI WE72 7RJ i7-7700HQ, Quadro M2200, Samsung SM961 MZVPW256 m.2 PCI-e, IPS, 1920x1080, 17.3" | Dell Precision 7710 E3-1535M v5, FirePro W7170M, Samsung SM951 MZVPV256HDGL m.2 PCI-e, IPS LED, 1920x1080, 17.3" | Lenovo ThinkPad P70 6820HQ, Quadro M3000M, Samsung SSD PM871 MZNLN512HCJH, IPS, 3840x2160, 17.3" | HP ZBook 17 G3 TZV66eA E3-1535M v5, Quadro M3000M, Samsung SM951 MZVPV256HDGL m.2 PCI-e, IPS, 1920x1080, 17.3" | MSI GE72 7RE-046 i7-7700HQ, GeForce GTX 1050 Ti Mobile, Toshiba HG6 THNSNJ256G8NY, TN LED, 1920x1080, 17.3" | |
|---|---|---|---|---|---|
| Power Consumption | -14% | 3% | 13% | 0% | |
| Idle Minimum * (Watt) | 15 | 6.04 60% | 12.1 19% | 6.7 55% | 14 7% |
| Idle Average * (Watt) | 20.1 | 15.2 24% | 19.7 2% | 12.5 38% | 20 -0% |
| Idle Maximum * (Watt) | 23.8 | 42.3 -78% | 20.5 14% | 13.2 45% | 25 -5% |
| Load Average * (Watt) | 85.6 | 112.8 -32% | 94.3 -10% | 128.2 -50% | 82 4% |
| Load Maximum * (Watt) | 128 | 182.2 -42% | 139.6 -9% | 158.9 -24% | 135 -5% |
* ... más pequeño es mejor
| MSI WE72 7RJ i7-7700HQ, Quadro M2200, 51 Wh | Dell Precision 7710 E3-1535M v5, FirePro W7170M, 72 Wh | Lenovo ThinkPad P70 6820HQ, Quadro M3000M, 96 Wh | HP ZBook 17 G3 TZV66eA E3-1535M v5, Quadro M3000M, 96 Wh | MSI GE72 7RE-046 i7-7700HQ, GeForce GTX 1050 Ti Mobile, 51.4 Wh | |
|---|---|---|---|---|---|
| Duración de Batería | 112% | 95% | 134% | 7% | |
| Reader / Idle (h) | 4.5 | 12.9 187% | 7.7 71% | 15.9 253% | |
| H.264 (h) | 3 | 4.7 57% | 7.5 150% | 5 67% | 3.3 10% |
| WiFi v1.3 (h) | 3 | 6.1 103% | 6 100% | 4.8 60% | 3.1 3% |
| Load (h) | 0.7 | 1.4 100% | 1.1 57% | 1.8 157% |
Pro
Contra
El MSI GE72 es un buen portátil para juegos, ¿basta incluir una tarjeta gráfica profesional para crear una buena estación de trabajo móvil? Tras el análisis no estamos totalmente convencidos, y el MSI WE72 sufre ante algunos rivales ya establecidos. A menudo recuerdas sus raíces jugonas. No hay base de expansión, ni Thunderbolt 3, así que tampoco puedes usar estaciones de trabajo en condiciones.
Esto podría no ser un grave problema según el uso que le vayas a dar, pero hay también algunas limitaciones respecto al rendimiento y las emisiones. El sistema de refrigeración tiene problemas con el calor generado por el procesador lo que provoca que la velocidad de reloj caiga por debajo de la frecuencia base incluso en escenarios como la prueba de CPU de Cinebench. El adaptador de corriente de 120 watt es otro factor limitante al poner los componentes a prueba. Los ventiladores también se pueden mejorar, lo que es posible gracias al control preinstalado. Sin embargo no hay mucho que hacer debido a las elevadas temperaturas.
Limitadas características profesionales y mala refrigeración: La impresión que deja la nueva estación de trabajo de MSI no resulta particularmente convincente. El WE72 podría tener sentido dependiendo de la carga de trabajo, especialmente teniendo en cuenta su atractivo precio.
Una ventaja del MSI WE72 es el competitivo precio (1799$) que que la competencia de la gama Precision de Del o los modelos ThinkPad P superan con facilidad los 3000$. Si vas a usar el WE72 principalmente para aplicaciones CAD y puedes vivir con las limitaciones ya citadas, deberías añadirlo a la lista de candidatos.
Ésta es una versión acortada del análisis original. Puedes leer el análisis completo en inglés aquí.
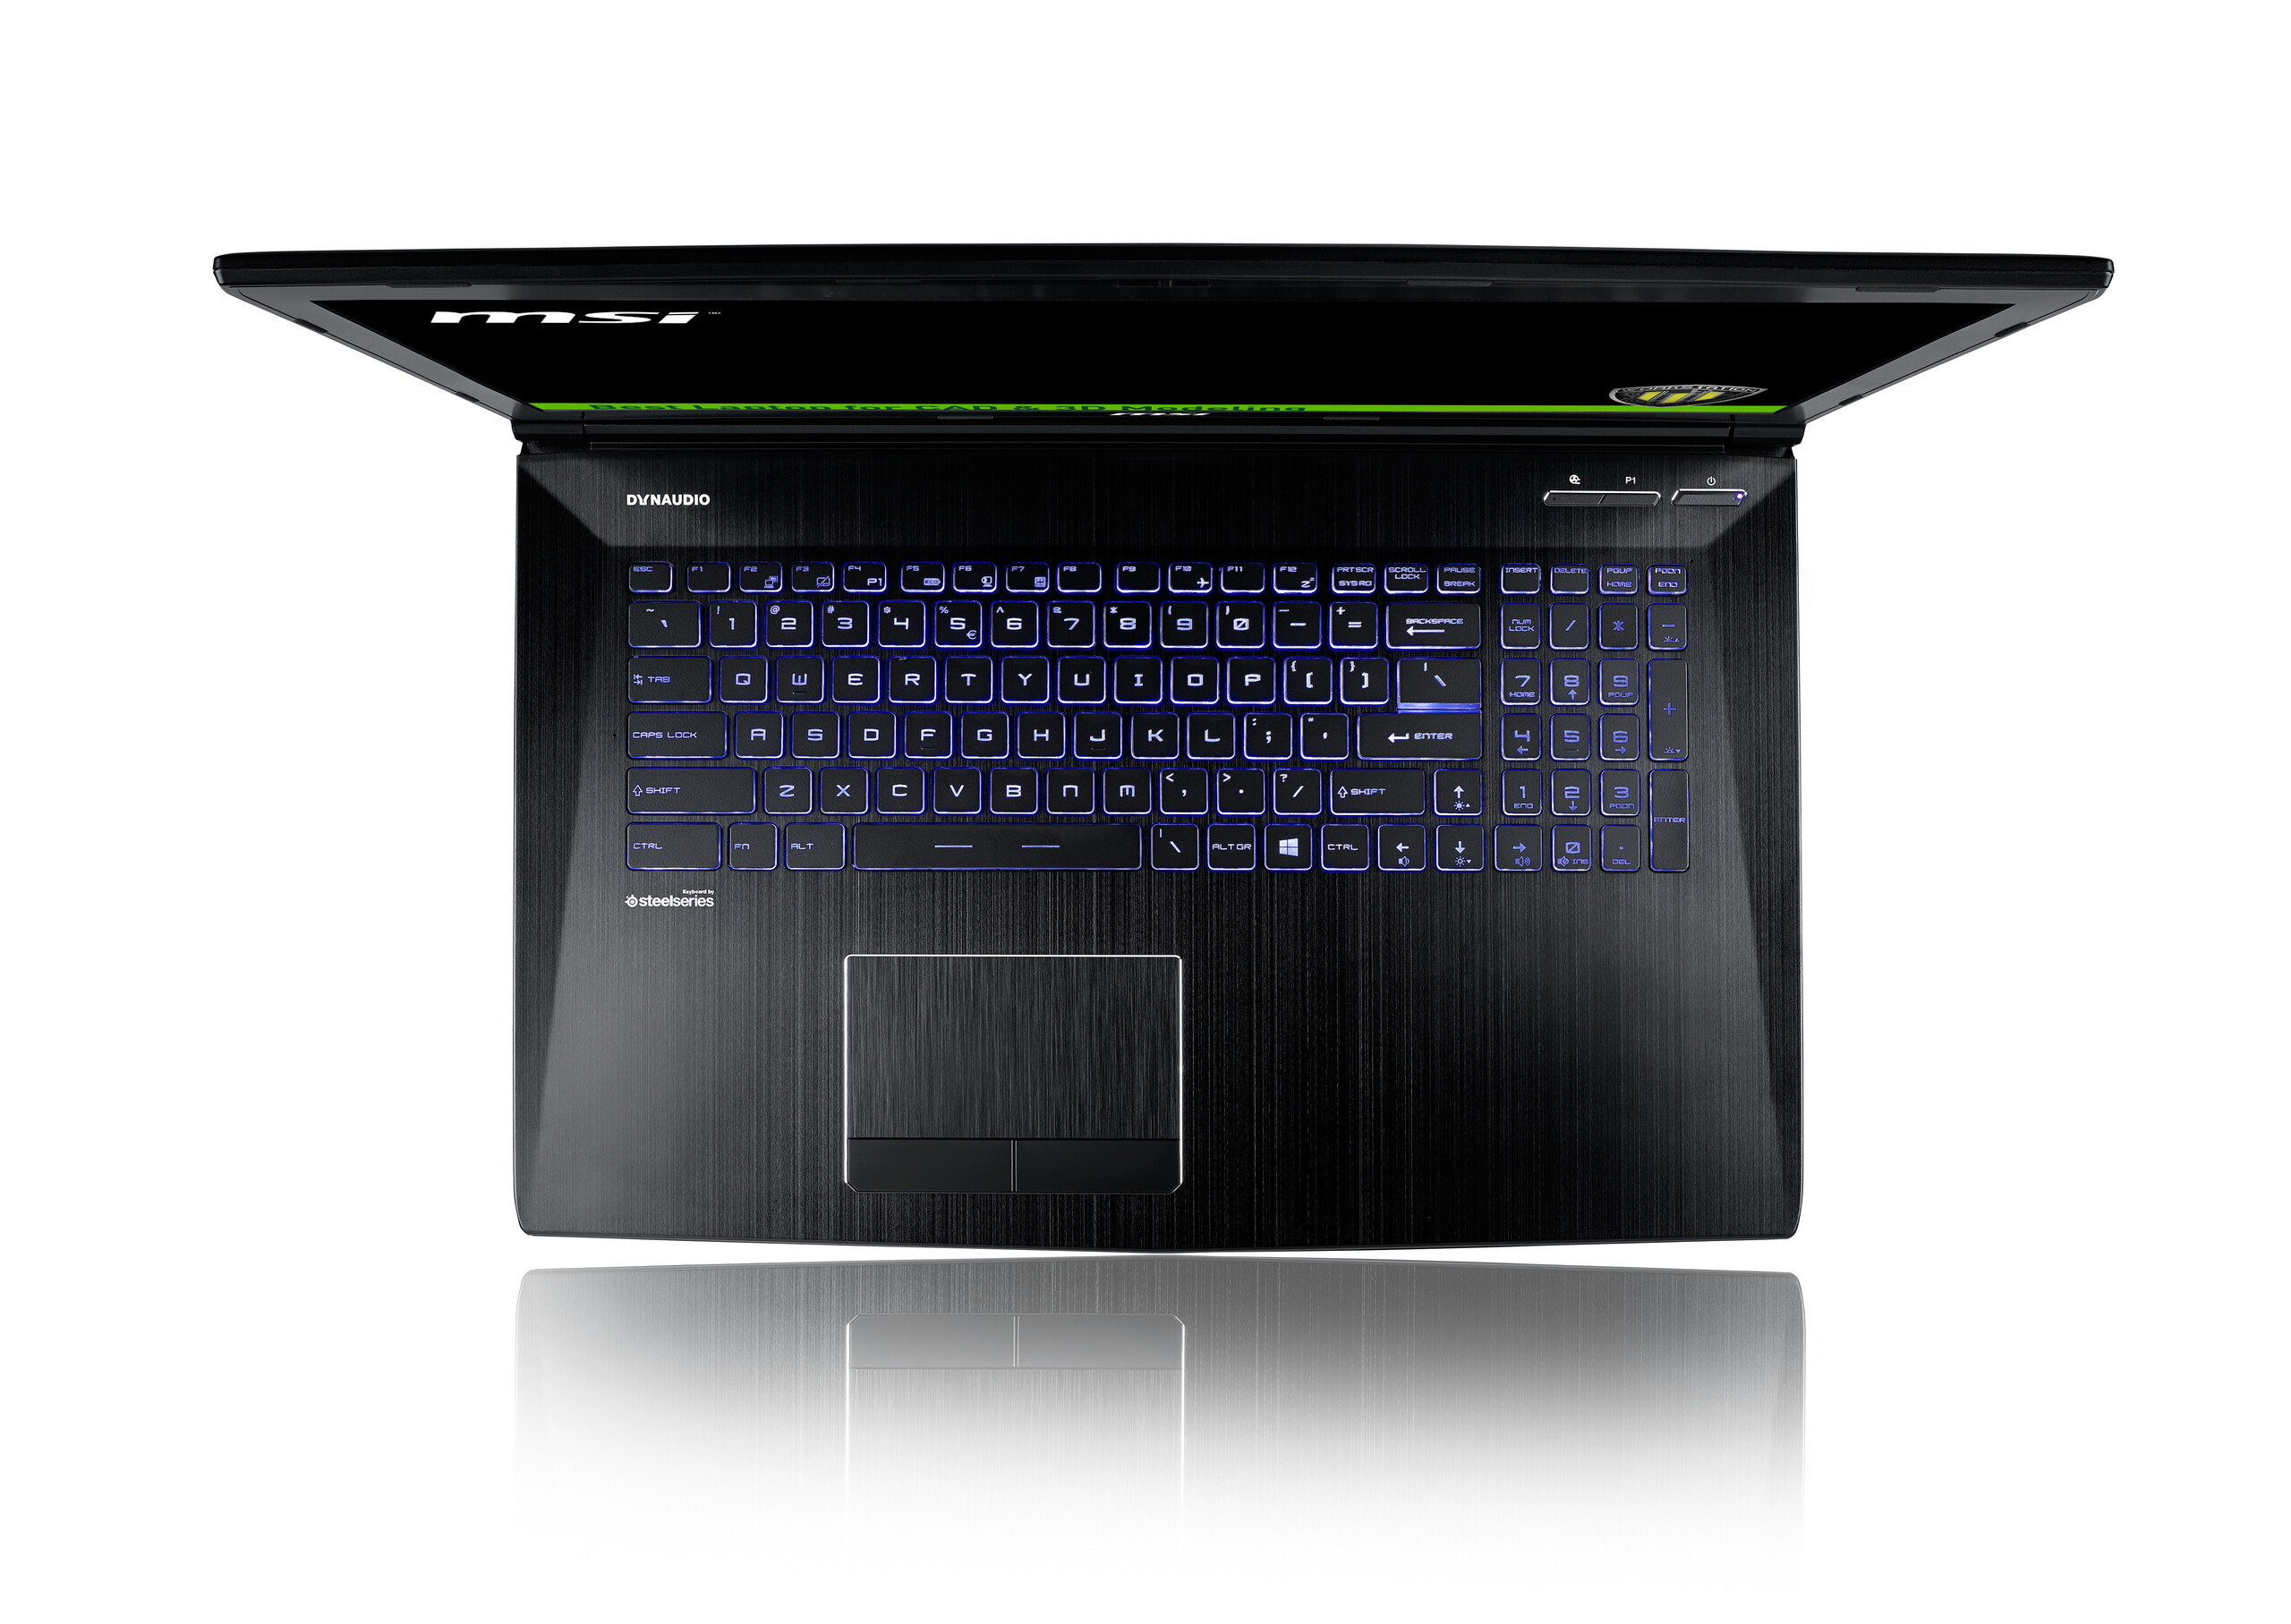
MSI WE72 7RJ
- 05/09/2017 v6 (old)
Andreas Osthoff
Price comparison
