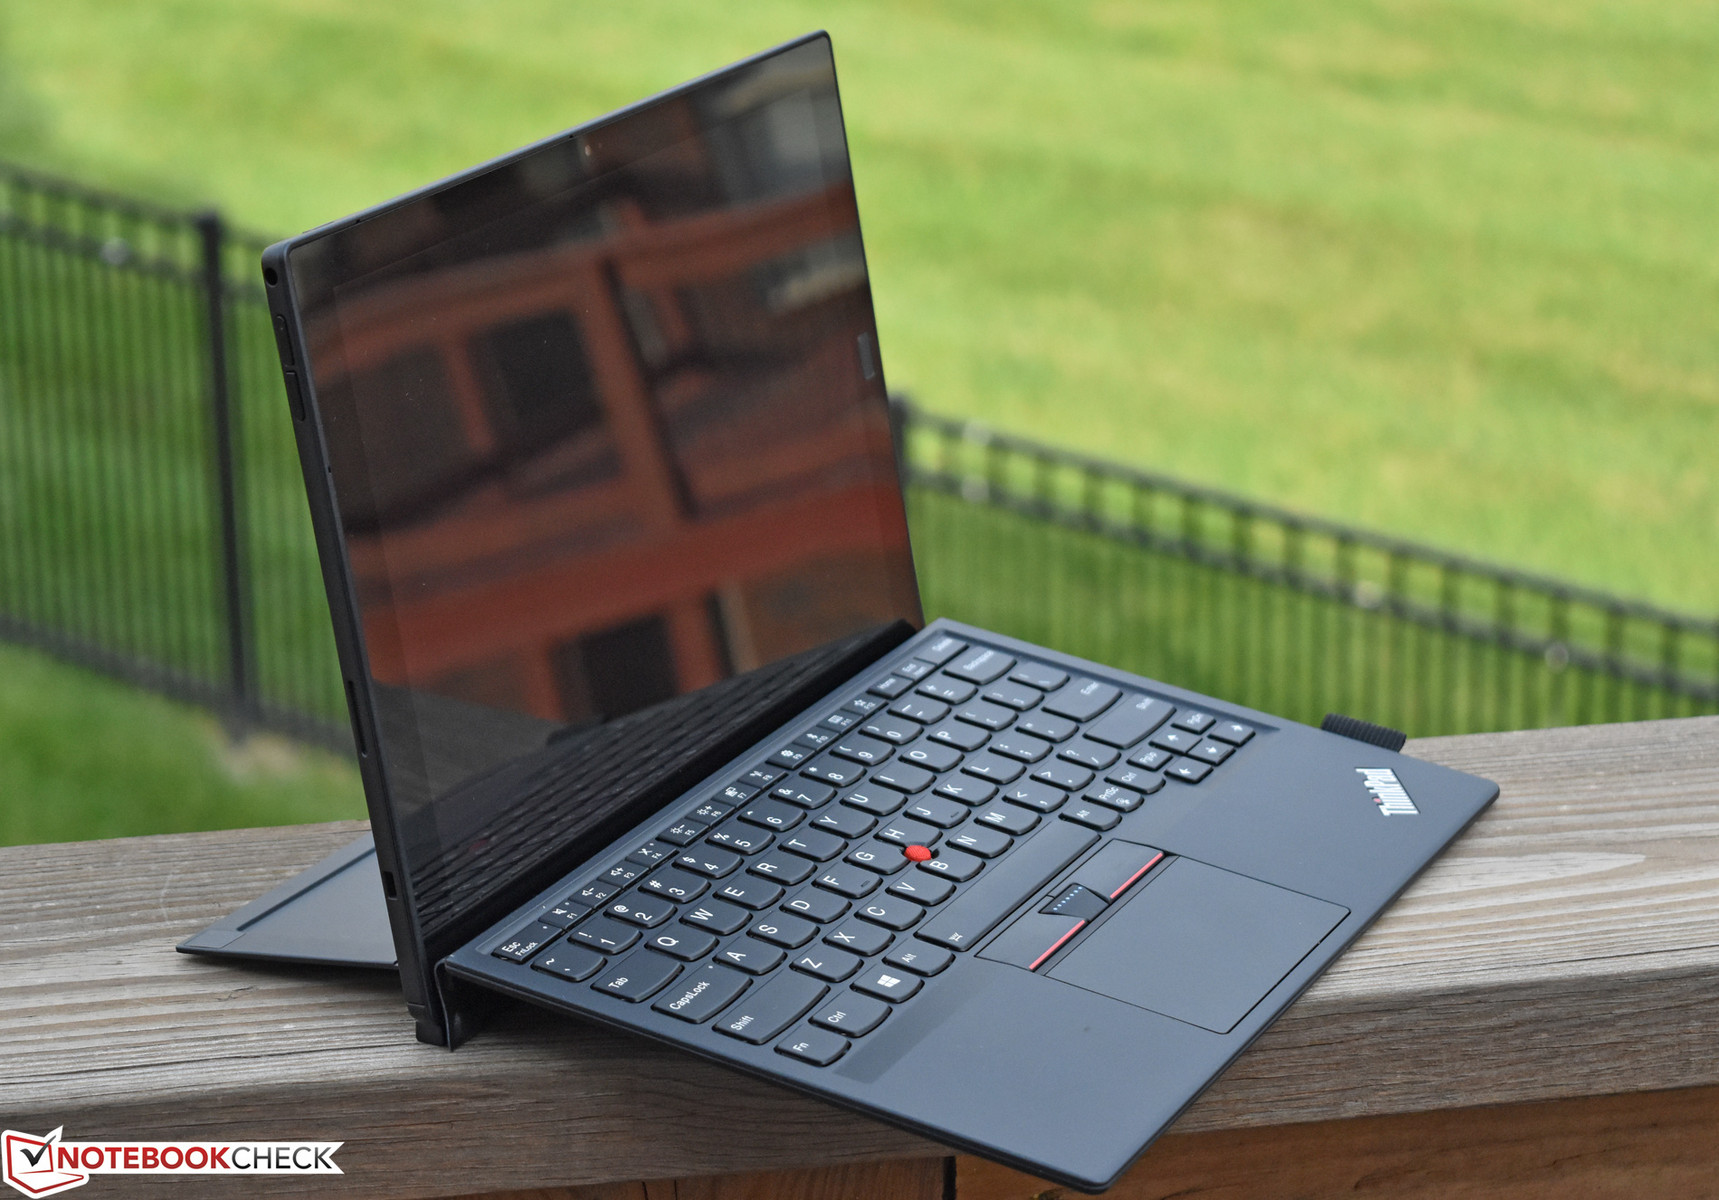
Breve análisis de la tablet Lenovo ThinkPad X1 Tablet Gen 2 (i5-7Y54)
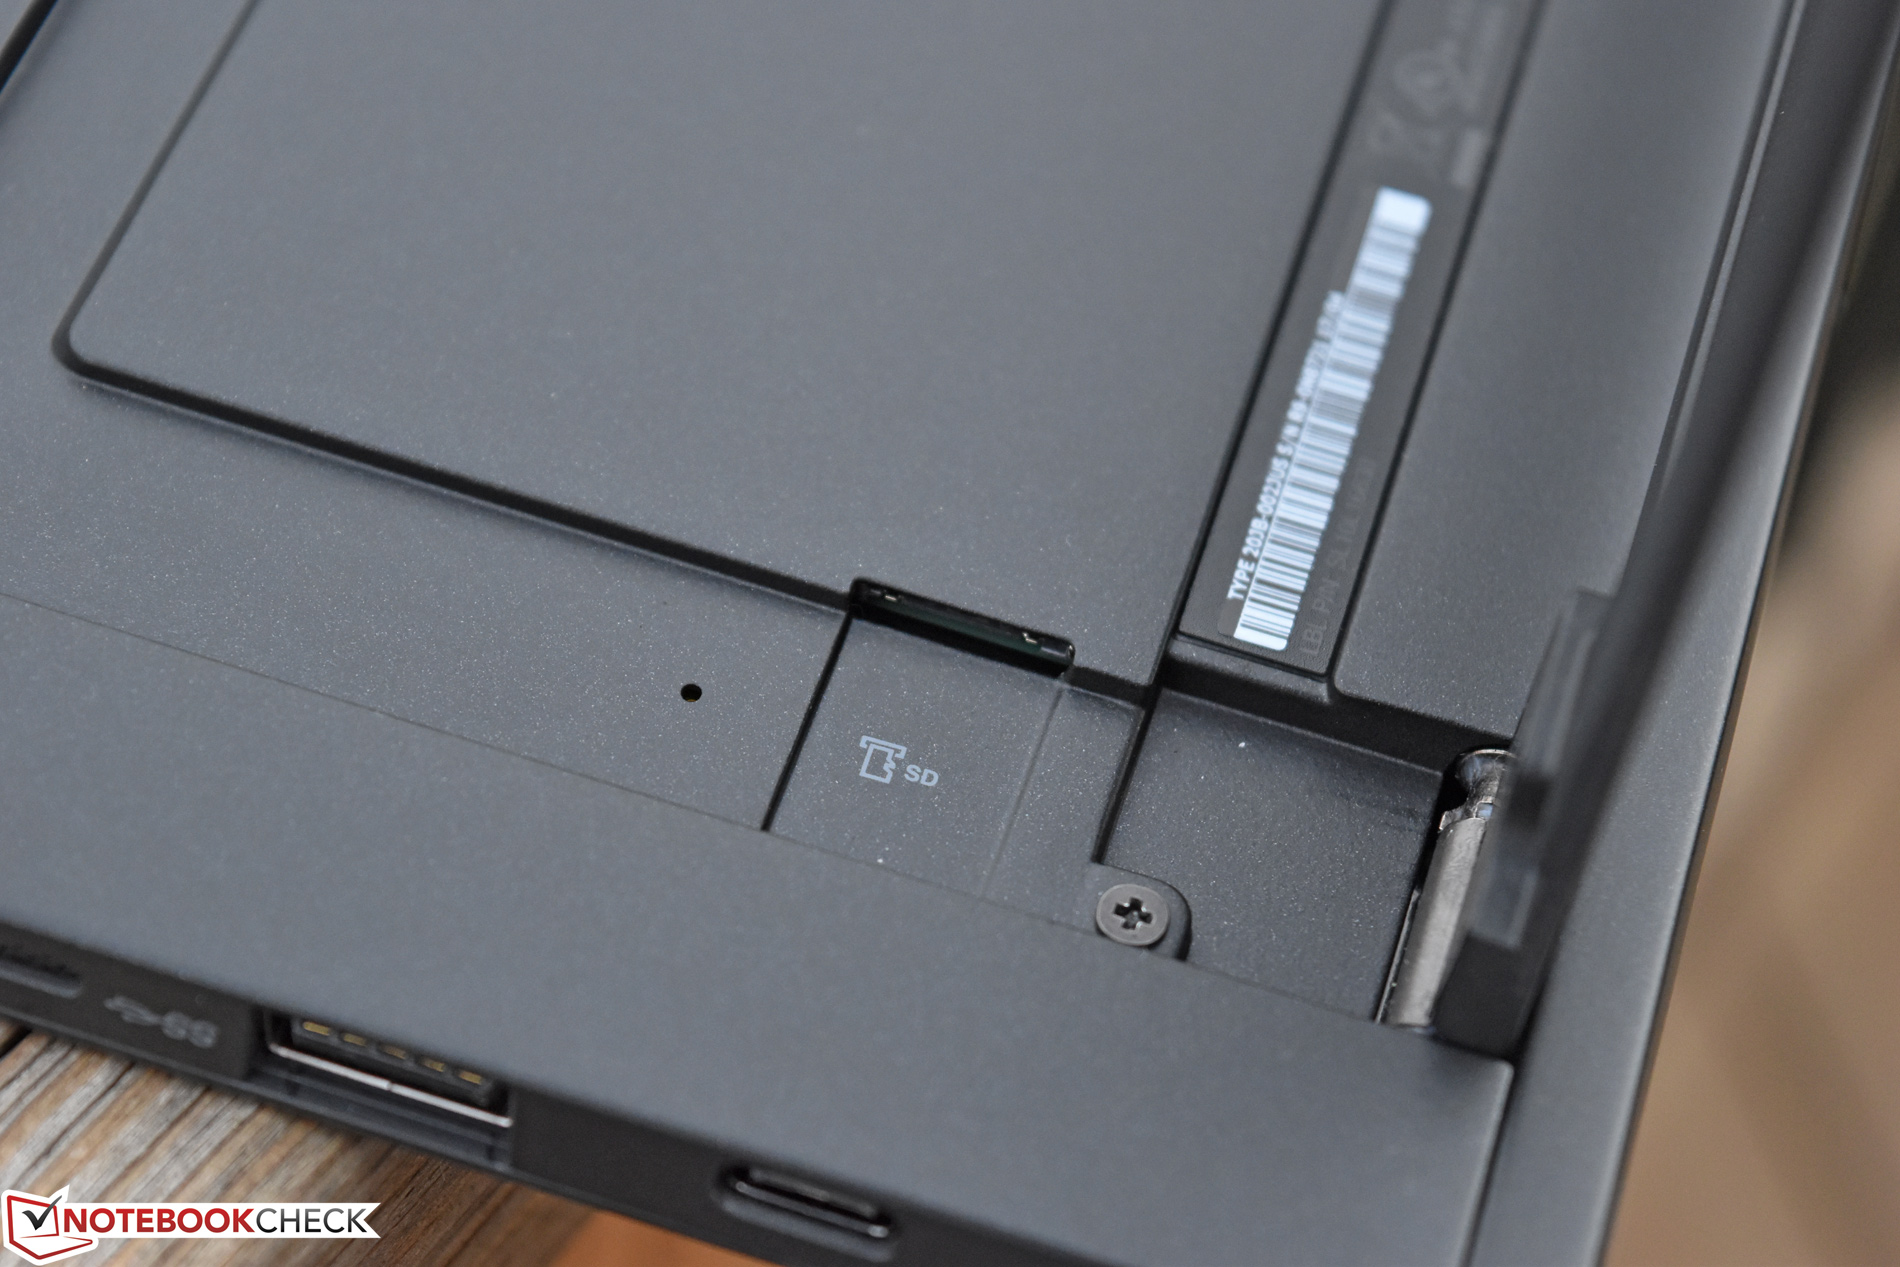
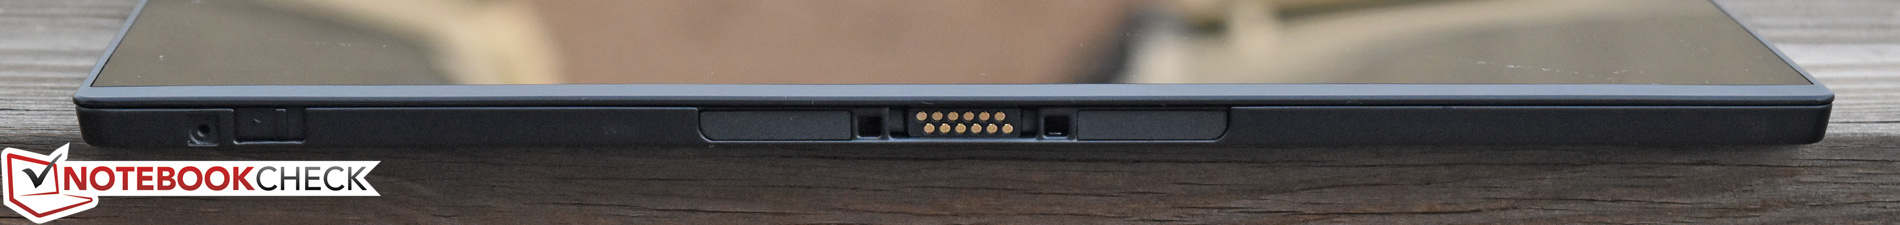


| SD Card Reader | |
| average JPG Copy Test (av. of 3 runs) | |
| Lenovo ThinkPad X1 Yoga 2017 20JES03T00 | |
| Lenovo ThinkPad X1 Tablet Gen 2 | |
| Dell Latitude 12 5285 2-in-1 | |
| maximum AS SSD Seq Read Test (1GB) | |
| Lenovo ThinkPad X1 Tablet Gen 2 | |
| Lenovo ThinkPad X1 Yoga 2017 20JES03T00 | |
| Dell Latitude 12 5285 2-in-1 | |
| |||||||||||||||||||||||||
iluminación: 78 %
Brillo con batería: 388.1 cd/m²
Contraste: 995:1 (Negro: 0.39 cd/m²)
ΔE ColorChecker Calman: 4.6 | ∀{0.5-29.43 Ø4.72}
ΔE Greyscale Calman: 6.1 | ∀{0.09-98 Ø4.97}
91% sRGB (Argyll 1.6.3 3D)
59% AdobeRGB 1998 (Argyll 1.6.3 3D)
Gamma: 2.07
CCT: 7104 K
| Lenovo ThinkPad X1 Tablet Gen 2 LSN120QL01L01, IPS, 12", 2160x1440 | Lenovo ThinkPad X1 Tablet INT3470, IPS, 12", 2160x1440 | Dell Latitude 12 5285 2-in-1 BOE06DC, IPS, 12.3", 1920x1280 | HP EliteBook x360 1030 G2 CMN1374, IPS, 13.3", 1920x1080 | Microsoft Surface Pro 4, Core m3 Samsung SDC3853, IPS, 12.3", 2736x1824 | Lenovo ThinkPad X1 Yoga 2017 20JES03T00 LEN4140, OLED, 14", 2560x1440 | |
|---|---|---|---|---|---|---|
| Display | ||||||
| Display P3 Coverage (%) | 62.4 | 62.8 | 65.5 | 67.5 | ||
| sRGB Coverage (%) | 93 | 94 | 88.8 | 96.6 | ||
| AdobeRGB 1998 Coverage (%) | 63.9 | 64.7 | 64.9 | 69 | ||
| Response Times | 12% | -42% | -57% | -49% | 87% | |
| Response Time Grey 50% / Grey 80% * (ms) | 28.4 ? | 28.4 ? -0% | 42.4 ? -49% | 55.2 ? -94% | 46 ? -62% | 3.6 ? 87% |
| Response Time Black / White * (ms) | 22.8 ? | 17.6 ? 23% | 30.8 ? -35% | 27.2 ? -19% | 31 ? -36% | 3.2 ? 86% |
| PWM Frequency (Hz) | 221.2 ? | 222.2 ? | 210.1 ? | 50 ? | 240.4 ? | |
| Screen | -16% | 16% | -3% | 20% | 4% | |
| Brightness middle (cd/m²) | 388.1 | 342.4 -12% | 523.2 35% | 262 -32% | 389.2 0% | 243 -37% |
| Brightness (cd/m²) | 344 | 315 -8% | 522 52% | 256 -26% | 392 14% | 240 -30% |
| Brightness Distribution (%) | 78 | 85 9% | 88 13% | 83 6% | 92 18% | 95 22% |
| Black Level * (cd/m²) | 0.39 | 0.744 -91% | 0.42 -8% | 0.25 36% | 0.27 31% | |
| Contrast (:1) | 995 | 460 -54% | 1246 25% | 1048 5% | 1441 45% | |
| Colorchecker dE 2000 * | 4.6 | 5.33 -16% | 4 13% | 5.13 -12% | 3.61 22% | 5.3 -15% |
| Colorchecker dE 2000 max. * | 9.1 | 9.25 -2% | 8.6 5% | 9.46 -4% | 8.9 2% | |
| Greyscale dE 2000 * | 6.1 | 5.36 12% | 5.5 10% | 6.23 -2% | 3.8 38% | 3.7 39% |
| Gamma | 2.07 106% | 2.12 104% | 2.16 102% | 2.45 90% | 2.16 102% | 1.78 124% |
| CCT | 7104 91% | 7671 85% | 7546 86% | 6413 101% | 5969 109% | 6202 105% |
| Color Space (Percent of AdobeRGB 1998) (%) | 59 | 57 -3% | 64.86 10% | 57.84 -2% | 63 7% | 84.8 44% |
| Color Space (Percent of sRGB) (%) | 91 | 93 2% | 93.97 3% | 88.57 -3% | 97 7% | 100 10% |
| Media total (Programa/Opciones) | -2% /
-12% | -13% /
6% | -30% /
-12% | -15% /
8% | 46% /
21% |
* ... más pequeño es mejor
Tiempos de respuesta del display
| ↔ Tiempo de respuesta de Negro a Blanco | ||
|---|---|---|
| 22.8 ms ... subida ↗ y bajada ↘ combinada | ↗ 13.6 ms subida | 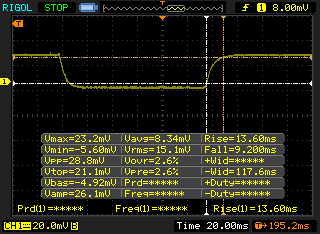 |
| ↘ 9.2 ms bajada | ||
| La pantalla mostró buenos tiempos de respuesta en nuestros tests pero podría ser demasiado lenta para los jugones competitivos. En comparación, todos los dispositivos de prueba van de ##min### (mínimo) a 240 (máximo) ms. » 51 % de todos los dispositivos son mejores. Eso quiere decir que el tiempo de respuesta es peor que la media (19.8 ms) de todos los dispositivos testados. | ||
| ↔ Tiempo de respuesta 50% Gris a 80% Gris | ||
| 28.4 ms ... subida ↗ y bajada ↘ combinada | ↗ 15.2 ms subida | 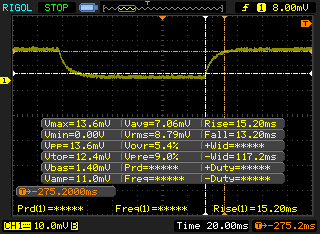 |
| ↘ 13.2 ms bajada | ||
| La pantalla mostró tiempos de respuesta relativamente lentos en nuestros tests pero podría ser demasiado lenta para los jugones. En comparación, todos los dispositivos de prueba van de ##min### (mínimo) a 636 (máximo) ms. » 38 % de todos los dispositivos son mejores. Eso quiere decir que el tiempo de respuesta es similar al dispositivo testado medio (31 ms). | ||
Parpadeo de Pantalla / PWM (Pulse-Width Modulation)
| Parpadeo de Pantalla / PWM detectado | 221.2 Hz | ≤ 49 % de brillo | 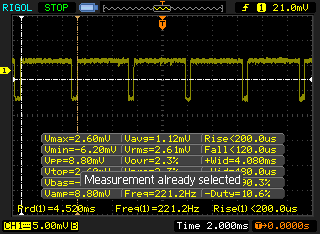 |
La retroiluminación del display parpadea a 221.2 Hz (seguramente usa PWM - Pulse-Width Modulation) a un brillo del 49 % e inferior. Sobre este nivel de brillo no debería darse parpadeo / PWM. La frecuencia de 221.2 Hz es relativamente baja, por lo que la gente sensible debería ver parpadeos y padecer fatiga visual por la pantalla (usado al brillo indicado a continuación). Comparación: 52 % de todos los dispositivos testados no usaron PWM para atenuar el display. Si se usó, medimos una media de 7753 (mínimo: 5 - máxmo: 343500) Hz. | |||
| wPrime 2.10 - 1024m | |
| Microsoft Surface Pro 4, Core m3 | |
| Lenovo ThinkPad X1 Tablet Gen 2 | |
| Lenovo ThinkPad X1 Tablet | |
| Dell Latitude 12 5285 2-in-1 | |
* ... más pequeño es mejor
| PCMark 8 Home Score Accelerated v2 | 3092 puntos | |
| PCMark 8 Creative Score Accelerated v2 | 3924 puntos | |
| PCMark 8 Work Score Accelerated v2 | 4288 puntos | |
ayuda | ||
| Lenovo ThinkPad X1 Tablet Gen 2 Samsung PM961 MZVLW256HEHP | Lenovo ThinkPad X1 Tablet Samsung PM871 MZYLN256HCHP | Dell Latitude 12 5285 2-in-1 Samsung PM961 MZVLW256HEHP | HP EliteBook x360 1030 G2 Sandisk SD8TN8U-256G-1006 | Microsoft Surface Pro 4, Core m3 Samsung MZFLV128 NVMe | Lenovo ThinkPad X1 Yoga 2017 20JES03T00 Samsung SSD PM961 1TB M.2 PCIe 3.0 x4 NVMe (MZVLW1T0) | |
|---|---|---|---|---|---|---|
| CrystalDiskMark 3.0 | -42% | -5% | -42% | -52% | 58% | |
| Read Seq (MB/s) | 1739 | 420.3 -76% | 1294 -26% | 467.1 -73% | 663 -62% | 2004 15% |
| Write Seq (MB/s) | 1259 | 305.6 -76% | 865 -31% | 443.6 -65% | 158.2 -87% | 1693 34% |
| Read 512 (MB/s) | 698 | 324.6 -53% | 406 -42% | 312.3 -55% | 313.1 -55% | 1040 49% |
| Write 512 (MB/s) | 869 | 297.8 -66% | 589 -32% | 372.5 -57% | 158.2 -82% | 1292 49% |
| Read 4k (MB/s) | 52.3 | 32.36 -38% | 31.75 -39% | 29.43 -44% | 30.14 -42% | 58.2 11% |
| Write 4k (MB/s) | 120 | 73.6 -39% | 72.2 -40% | 56.5 -53% | 68 -43% | 182.2 52% |
| Read 4k QD32 (MB/s) | 247.9 | 325.6 31% | 493.3 99% | 311.3 26% | 243.7 -2% | 632 155% |
| Write 4k QD32 (MB/s) | 259 | 215.5 -17% | 434.5 68% | 225.2 -13% | 149.2 -42% | 507 96% |

| 3DMark | |
| 1280x720 Cloud Gate Standard Graphics | |
| Dell Latitude 12 5285 2-in-1 | |
| HP EliteBook x360 1030 G2 | |
| Lenovo ThinkPad X1 Yoga 2017 20JES03T00 | |
| Microsoft Surface Pro 4, Core m3 | |
| Lenovo ThinkPad X1 Tablet Gen 2 | |
| Lenovo ThinkPad X1 Tablet | |
| 1920x1080 Fire Strike Graphics | |
| Dell Latitude 12 5285 2-in-1 | |
| Lenovo ThinkPad X1 Yoga 2017 20JES03T00 | |
| HP EliteBook x360 1030 G2 | |
| Microsoft Surface Pro 4, Core m3 | |
| Lenovo ThinkPad X1 Tablet | |
| Lenovo ThinkPad X1 Tablet Gen 2 | |
| 1920x1080 Ice Storm Extreme Graphics | |
| HP EliteBook x360 1030 G2 | |
| Dell Latitude 12 5285 2-in-1 | |
| 3DMark 06 Standard Score | 6873 puntos | |
| 3DMark 11 Performance | 1274 puntos | |
| 3DMark Ice Storm Standard Score | 44515 puntos | |
| 3DMark Cloud Gate Standard Score | 4509 puntos | |
| 3DMark Fire Strike Score | 678 puntos | |
ayuda | ||
| bajo | medio | alto | ultra | |
|---|---|---|---|---|
| BioShock Infinite (2013) | 42 | 21 | 19 | 6 |
(-) La temperatura máxima en la parte superior es de 47.2 °C / 117 F, frente a la media de 35.4 °C / 96 F, que oscila entre 19.6 y 60 °C para la clase Convertible.
(-) El fondo se calienta hasta un máximo de 49.8 °C / 122 F, frente a la media de 36.9 °C / 98 F
(+) En reposo, la temperatura media de la parte superior es de 28.3 °C / 83# F, frente a la media del dispositivo de 30.3 °C / 87 F.
(-) El reposamanos y el touchpad pueden calentarse mucho al tacto con un máximo de 47.2 °C / 117 F.
(-) La temperatura media de la zona del reposamanos de dispositivos similares fue de 28 °C / 82.4 F (-19.2 °C / -34.6 F).
Lenovo ThinkPad X1 Tablet Gen 2 análisis de audio
(±) | la sonoridad del altavoz es media pero buena (74 dB)
Graves 100 - 315 Hz
(-) | casi sin bajos - de media 16.1% inferior a la mediana
(±) | la linealidad de los graves es media (9.7% delta a frecuencia anterior)
Medios 400 - 2000 Hz
(±) | medias más altas - de media 9.6% más altas que la mediana
(±) | la linealidad de los medios es media (11.2% delta respecto a la frecuencia anterior)
Altos 2 - 16 kHz
(±) | máximos más altos - de media 7% más altos que la mediana
(-) | los máximos no son lineales (16.1% delta a la frecuencia anterior)
Total 100 - 16.000 Hz
(-) | el sonido global no es lineal (42.5% de diferencia con la mediana)
En comparación con la misma clase
» 98% de todos los dispositivos probados de esta clase eran mejores, 1% similares, 1% peores
» El mejor tuvo un delta de 6%, la media fue 20%, el peor fue ###max##%
En comparación con todos los dispositivos probados
» 95% de todos los dispositivos probados eran mejores, 0% similares, 4% peores
» El mejor tuvo un delta de 4%, la media fue 23%, el peor fue ###max##%
HP EliteBook x360 1030 G2 análisis de audio
(+) | los altavoces pueden reproducir a un volumen relativamente alto (#86.3 dB)
Analysis not possible as minimum curve is missing or too high
| Off / Standby | |
| Ocioso | |
| Carga |
|
Clave:
min: | |
| Lenovo ThinkPad X1 Tablet Gen 2 i5-7Y54, HD Graphics 615, Samsung PM961 MZVLW256HEHP, IPS, 2160x1440, 12" | Lenovo ThinkPad X1 Tablet 6Y75, HD Graphics 515, Samsung PM871 MZYLN256HCHP, IPS, 2160x1440, 12" | Dell Latitude 12 5285 2-in-1 i7-7600U, HD Graphics 620, Samsung PM961 MZVLW256HEHP, IPS, 1920x1280, 12.3" | HP EliteBook x360 1030 G2 i5-7300U, HD Graphics 620, Sandisk SD8TN8U-256G-1006, IPS, 1920x1080, 13.3" | Microsoft Surface Pro 4, Core m3 6Y30, HD Graphics 515, Samsung MZFLV128 NVMe, IPS, 2736x1824, 12.3" | Lenovo ThinkPad X1 Yoga 2017 20JES03T00 i7-7600U, HD Graphics 620, Samsung SSD PM961 1TB M.2 PCIe 3.0 x4 NVMe (MZVLW1T0), OLED, 2560x1440, 14" | |
|---|---|---|---|---|---|---|
| Power Consumption | -4% | -23% | -19% | -61% | ||
| Idle Minimum * (Watt) | 5 | 5.87 -17% | 2.85 43% | 3.2 36% | 4.9 2% | |
| Idle Average * (Watt) | 6.3 | 6.05 4% | 6.76 -7% | 5.5 13% | 7.6 -21% | |
| Idle Maximum * (Watt) | 7.8 | 6.13 21% | 6.91 11% | 6.5 17% | 13.8 -77% | |
| Load Average * (Watt) | 19.5 | 21.27 -9% | 32.88 -69% | 29.7 -52% | 33.4 -71% | |
| Load Maximum * (Watt) | 19.6 | 23.03 -18% | 37.41 -91% | 41.3 -111% | 46.5 -137% |
* ... más pequeño es mejor
| Lenovo ThinkPad X1 Tablet Gen 2 i5-7Y54, HD Graphics 615, 37 Wh | Lenovo ThinkPad X1 Tablet 6Y75, HD Graphics 515, 37 Wh | Dell Latitude 12 5285 2-in-1 i7-7600U, HD Graphics 620, 42 Wh | HP EliteBook x360 1030 G2 i5-7300U, HD Graphics 620, 57 Wh | Microsoft Surface Pro 4, Core m3 6Y30, HD Graphics 515, 38 Wh | Lenovo ThinkPad X1 Yoga 2017 20JES03T00 i7-7600U, HD Graphics 620, 56 Wh | |
|---|---|---|---|---|---|---|
| Duración de Batería | -15% | 18% | 79% | 11% | -3% | |
| Reader / Idle (h) | 11 | 10.5 -5% | 17.9 63% | 23.1 110% | 13.2 20% | 13.1 19% |
| WiFi v1.3 (h) | 7.4 | 5 -32% | 8.1 9% | 10.5 42% | 8.1 9% | 6.1 -18% |
| Load (h) | 2.2 | 2 -9% | 1.8 -18% | 4.1 86% | 2.3 5% | 2 -9% |
Pro
Contra
Aún siendo cierto que el ThinkPad X1 de este año (segunda generación) apenas es más que una actualización de chipset, las ventajas que proporciona esta actualización sobre el rendimiento total del dispositivo en nuestro análisis fueron considerables. Por ejemplo, tres de las mayores quejas que tuvimos sobre el modelo de 2016 con procesador m7 -rendimiento sostenido de la CPU/GPU, temperaturas en superficie y duración de batería- han sido, al menos parcialmente, resueltas. Si, el rendimiento sostenido del SoC es menor que el rendimiento total, pero no demasiado: medimos una caída del 12% en nuestro test Cinebench (como se detalla en la sección procesador del análisis completo), que no está demasiado mal teniendo en cuenta la ausencia de refrigeración activa. Al mismo tiempo, la temperatura en superficie y la duración de batería son ahora aceptables o incluso buenas dependiendo de como planees usar el dispositivo. La pantalla también ha recibido algunas mejoras, sobre todo en lo relativo al brillo y al contraste (que fueron las mayores quejas sobre la pantalla del dispositivo del año pasado).
A pesar de todo resulta comprensible que suponga cierta decepción la no actualización del diseño de la carcasa ,la selección de puertos y la calidad del altavoz. Los dispositivos de la competencia están aumentando el número de puertos -y con recién llegados como el Dell Latitude 12 5285 2-en-1, el conservadurismo del X1 podría suponerle un problema. Aparte de esto, los convertibles convencionales tienden a ser cada vez más portables, reduciendo la ventaja que supone un diseño de carcasa con un teclado desmontable en tamaño y peso.
Ha pasado un año, pero el ThinkPad X1 de segunda generación solo presenta ligeras mejoras sobre su predecesor. Sin embargo, aún se mantiene como una de las pocas opciones que combina las ventajas de una máquina para usuarios profesionales de gama alta con la versatilidad de un tablet.
Sin embargo, a día de hoy, la diferencia de precio y la ausencia de opciones, proporcionan al X1 el lujo de la exclusividad. Para usuarios de negocios en movilidad, es una de las pocas opciones que combinan buenas posibilidades de mantenimiento, durabilidad y gestión sencilla de una máquina de negocios con la versatilidad de un teclado desmontable. Para el usuario adecuado y para el objetivo adecuado, incluso a pesar de ser solo una evolución, aún tiene sentido.
Ésta es una versión acortada del análisis original. Puedes leer el análisis completo en inglés aquí.
Lenovo ThinkPad X1 Tablet Gen 2
- 06/15/2017 v6 (old)
Steve Schardein
Price comparison
