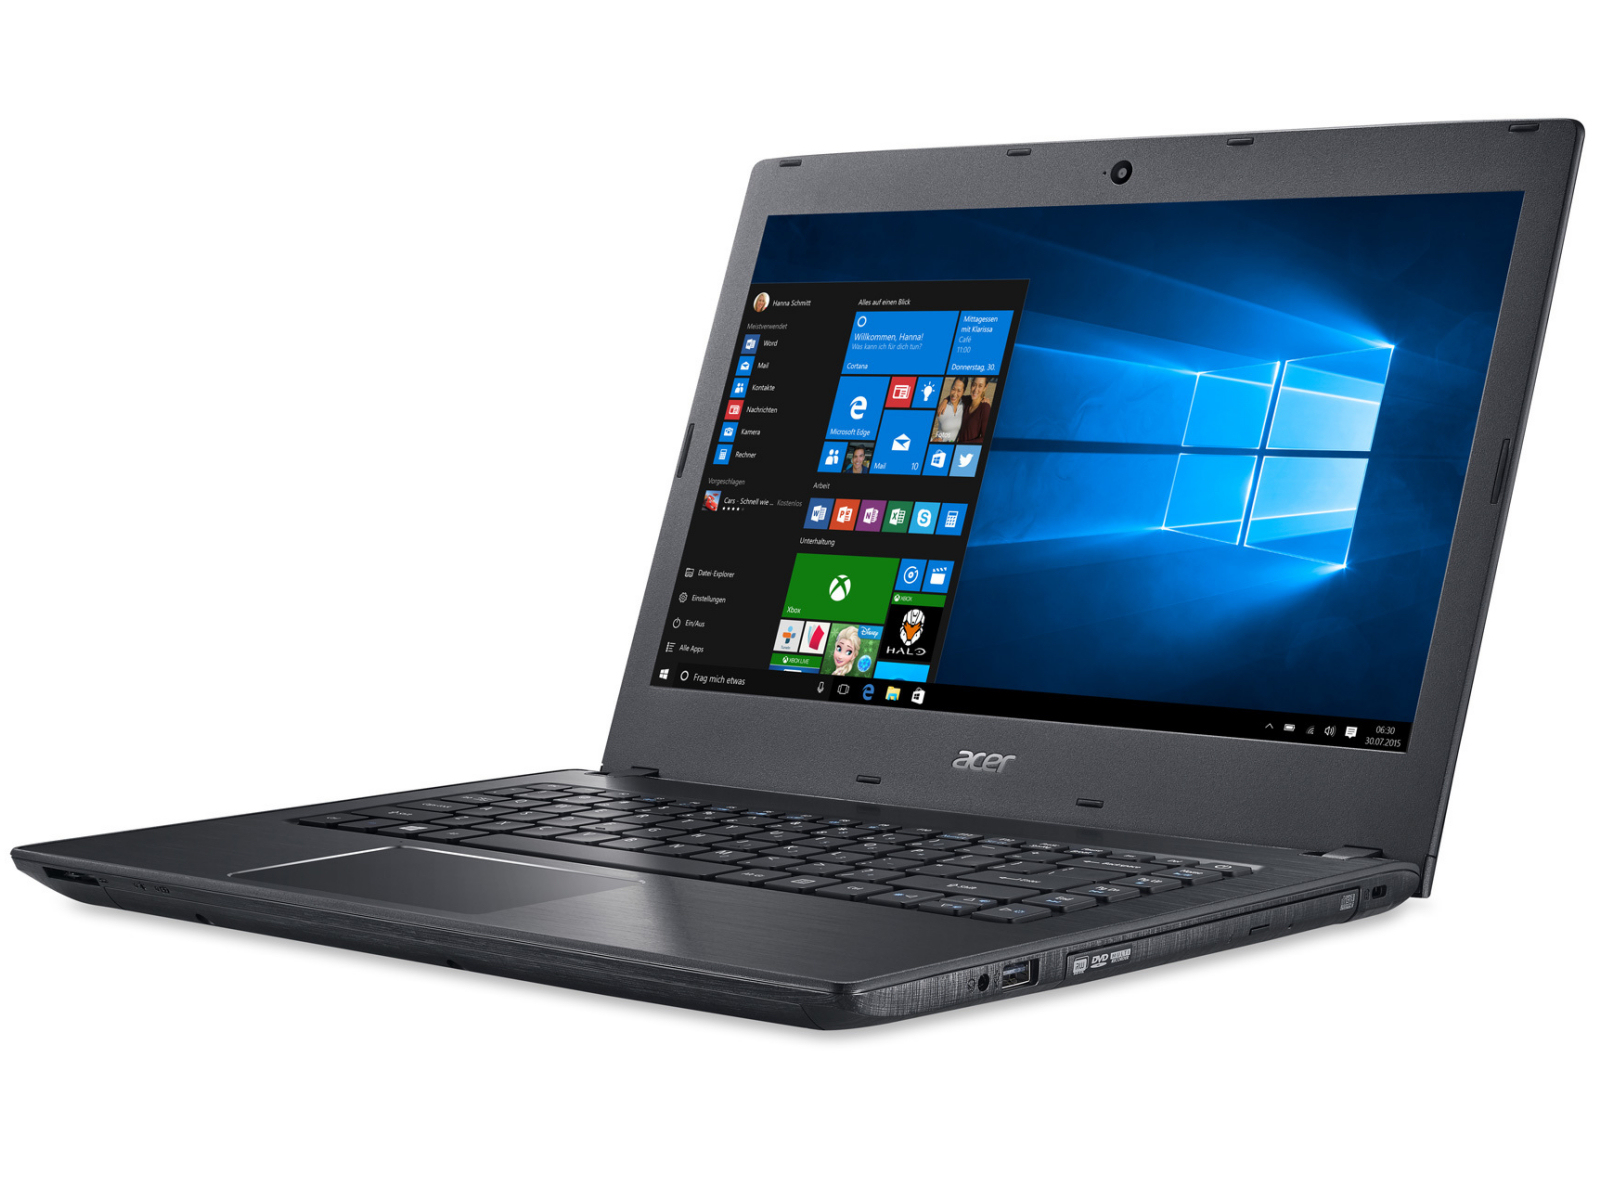
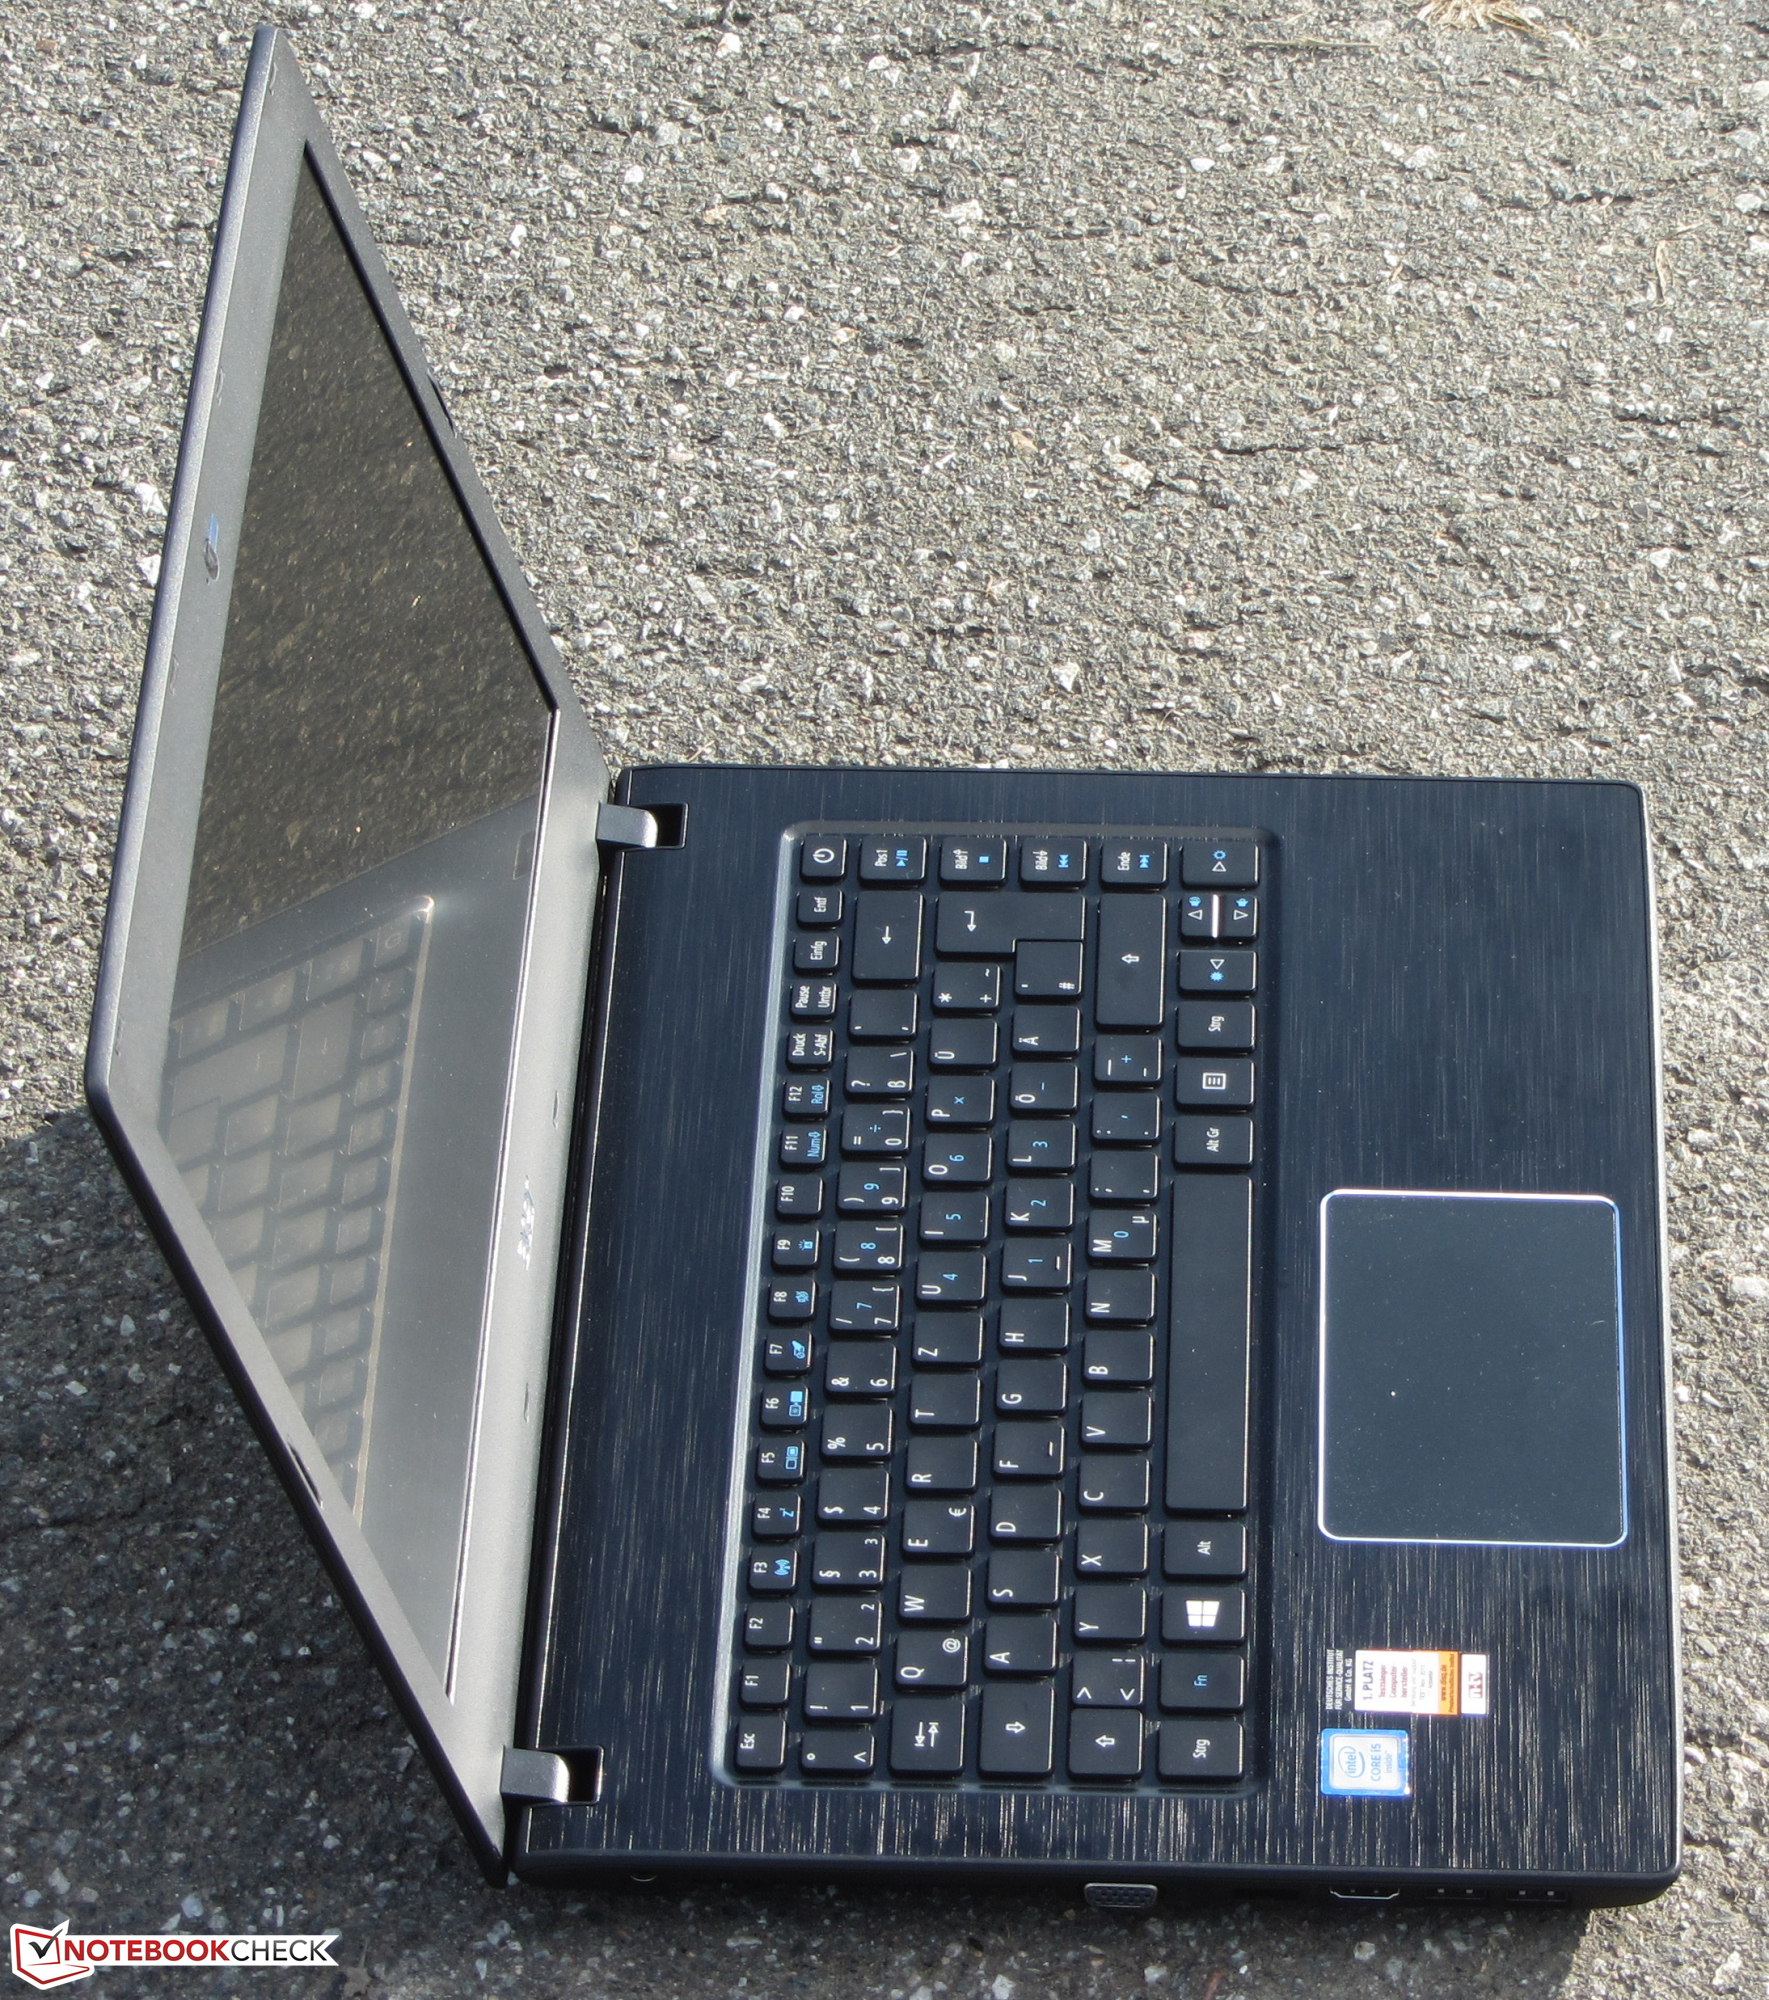
Breve análisis del Acer TravelMate P249-M-5452 (Core i5, Full HD)

| SD Card Reader | |
| average JPG Copy Test (av. of 3 runs) | |
| Lenovo ThinkPad E460-20EUS00000 | |
| HP ProBook 440 G3 | |
| Dell Latitude 14 3470 | |
| Acer TravelMate X3 X349-M-7261 | |
| Acer TravelMate P249-M-5452 | |
| maximum AS SSD Seq Read Test (1GB) | |
| HP ProBook 440 G3 | |
| Lenovo ThinkPad E460-20EUS00000 | |
| Dell Latitude 14 3470 | |
| Acer TravelMate X3 X349-M-7261 | |
| Networking | |
| iperf Server (receive) TCP 1 m | |
| Acer TravelMate X3 X349-M-7261 (jseb) | |
| Dell Latitude 14 3470 | |
| Acer TravelMate P249-M-5452 | |
| iperf Client (transmit) TCP 1 m | |
| Acer TravelMate X3 X349-M-7261 (jseb) | |
| Dell Latitude 14 3470 | |
| Acer TravelMate P249-M-5452 | |
| |||||||||||||||||||||||||
iluminación: 87 %
Brillo con batería: 257 cd/m²
Contraste: 607:1 (Negro: 0.41 cd/m²)
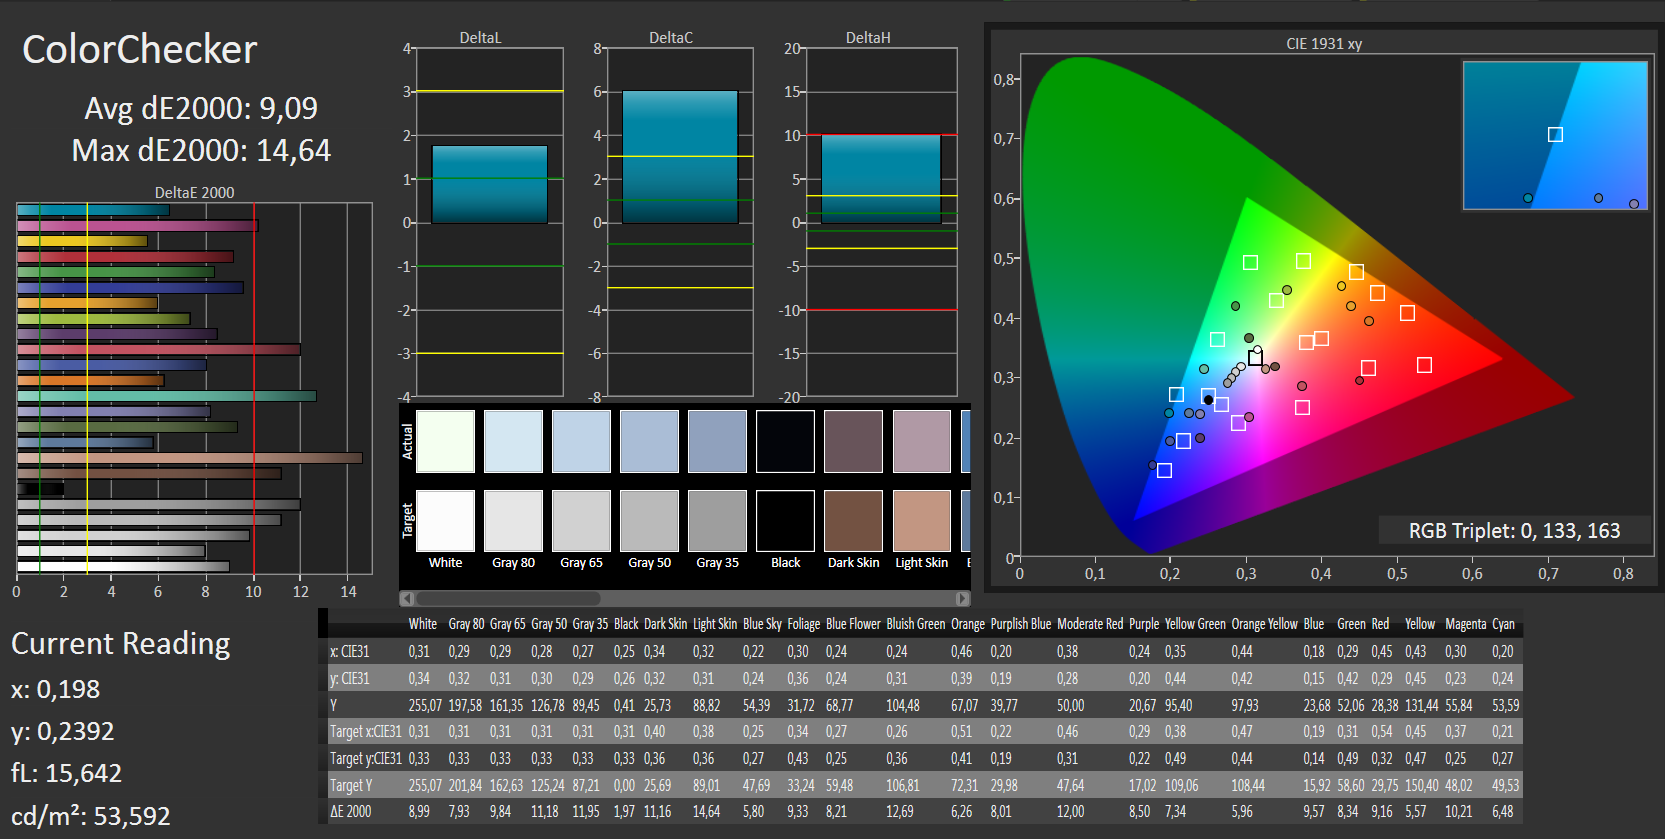
ΔE ColorChecker Calman: 9.09 | ∀{0.5-29.43 Ø4.71}
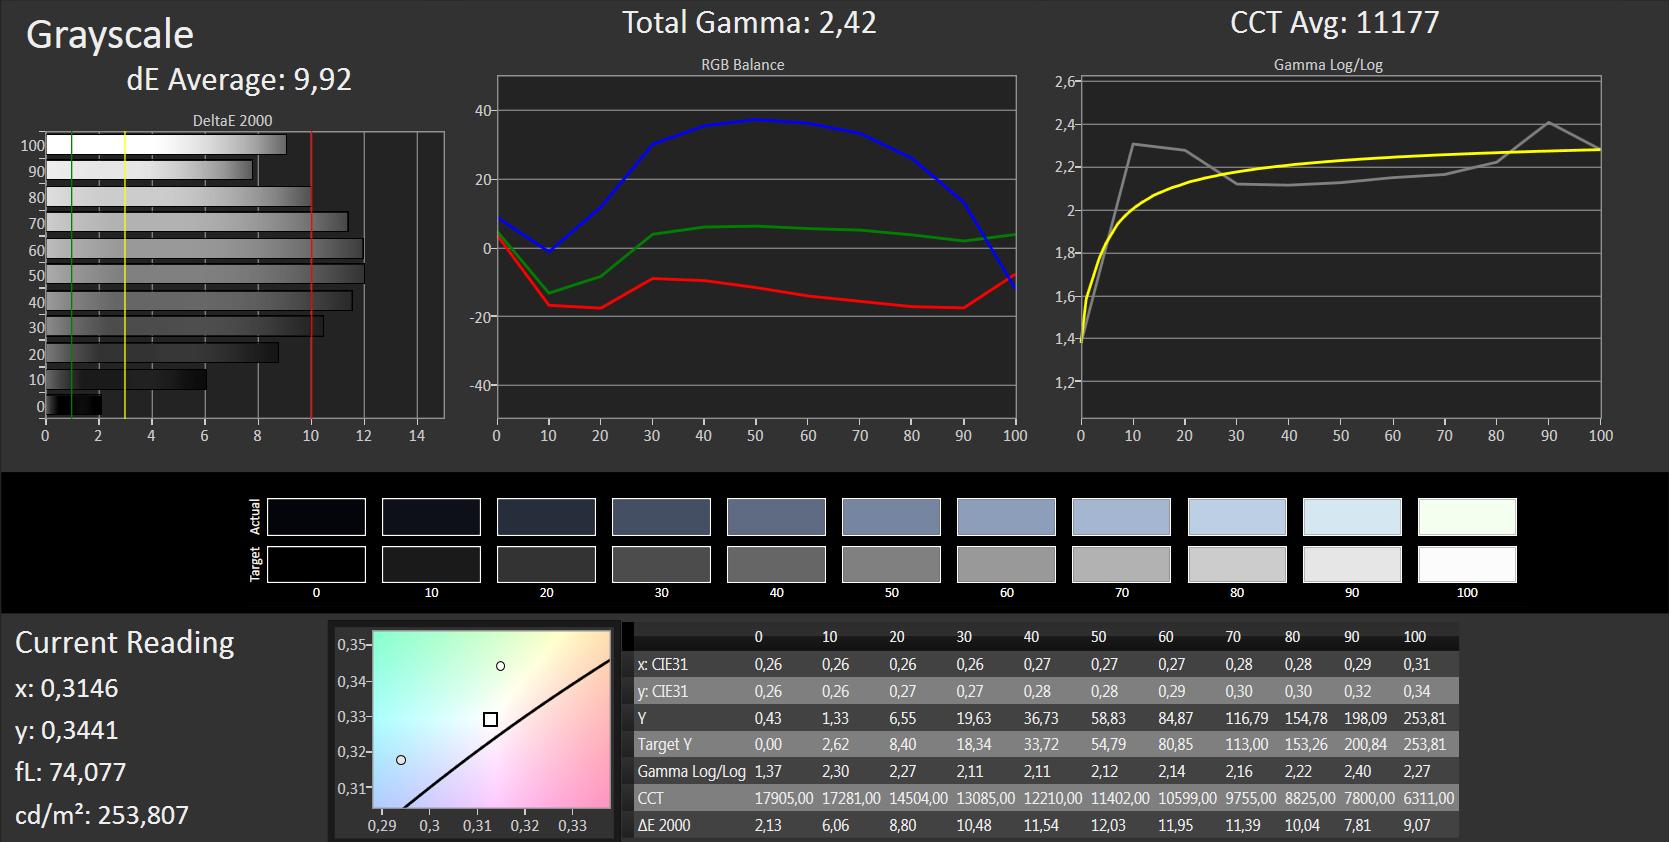
ΔE Greyscale Calman: 9.92 | ∀{0.09-98 Ø4.96}
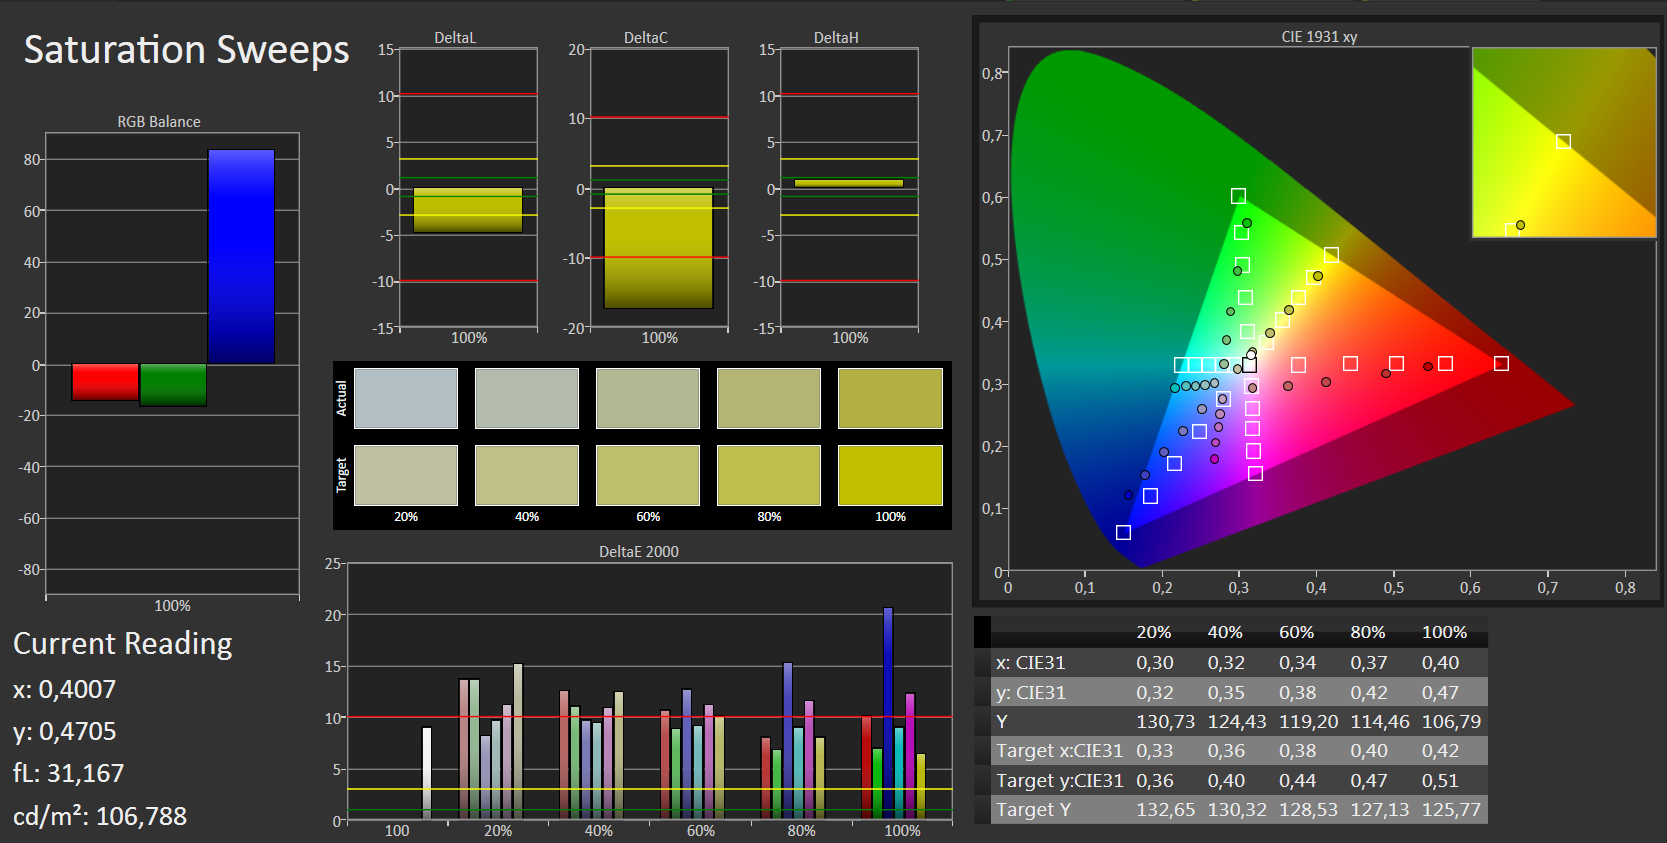
56.7% sRGB (Argyll 1.6.3 3D)
36.5% AdobeRGB 1998 (Argyll 1.6.3 3D)
39.48% AdobeRGB 1998 (Argyll 3D)
56.7% sRGB (Argyll 3D)
38.15% Display P3 (Argyll 3D)
Gamma: 2.42
CCT: 11177 K
| Acer TravelMate P249-M-5452 TN LED, 1920x1080, 14" | HP ProBook 440 G3 TN, 1920x1080, 14" | Lenovo ThinkPad E460-20EUS00000 IPS-Panel, 1920x1080, 14" | Dell Latitude 14 3470 TN LED, 1366x768, 14" | Acer TravelMate X3 X349-M-7261 IPS, 1920x1080, 14" | |
|---|---|---|---|---|---|
| Display | 4% | 3% | 6% | -3% | |
| Display P3 Coverage (%) | 38.15 | 39.6 4% | 39.1 2% | 40.21 5% | 36.97 -3% |
| sRGB Coverage (%) | 56.7 | 59.1 4% | 58.8 4% | 60.5 7% | 55.6 -2% |
| AdobeRGB 1998 Coverage (%) | 39.48 | 40.94 4% | 40.41 2% | 41.55 5% | 38.2 -3% |
| Response Times | -39% | -18% | -35% | -35% | |
| Response Time Grey 50% / Grey 80% * (ms) | 44 ? | 46 ? -5% | 40 ? 9% | 47 ? -7% | 42 ? 5% |
| Response Time Black / White * (ms) | 16 ? | 27.6 ? -73% | 23.2 ? -45% | 26 ? -63% | 28 ? -75% |
| PWM Frequency (Hz) | 50 ? | ||||
| Screen | -4% | 18% | -14% | 26% | |
| Brightness middle (cd/m²) | 249 | 246 -1% | 233 -6% | 206 -17% | 230 -8% |
| Brightness (cd/m²) | 238 | 215 -10% | 221 -7% | 193 -19% | 226 -5% |
| Brightness Distribution (%) | 87 | 84 -3% | 88 1% | 87 0% | 86 -1% |
| Black Level * (cd/m²) | 0.41 | 0.5 -22% | 0.3 27% | 0.48 -17% | 0.2 51% |
| Contrast (:1) | 607 | 492 -19% | 777 28% | 429 -29% | 1150 89% |
| Colorchecker dE 2000 * | 9.09 | 8.6 5% | 4.43 51% | 11 -21% | 5.07 44% |
| Colorchecker dE 2000 max. * | 14.64 | 19.57 -34% | 10.07 31% | ||
| Greyscale dE 2000 * | 9.92 | 9.36 6% | 3.78 62% | 11.51 -16% | 3.64 63% |
| Gamma | 2.42 91% | 2.39 92% | 2.31 95% | 2.23 99% | 2.46 89% |
| CCT | 11177 58% | 11226 58% | 7171 91% | 13671 48% | 6521 100% |
| Color Space (Percent of AdobeRGB 1998) (%) | 36.5 | 37.8 4% | 37.3 2% | 38.46 5% | 35 -4% |
| Color Space (Percent of sRGB) (%) | 56.7 | 59.1 4% | 58.7 4% | 60.61 7% | 55 -3% |
| Media total (Programa/Opciones) | -13% /
-7% | 1% /
10% | -14% /
-13% | -4% /
12% |
* ... más pequeño es mejor
Parpadeo de Pantalla / PWM (Pulse-Width Modulation)
| Parpadeo de Pantalla / PWM detectado | 50 Hz | ≤ 10 % de brillo | 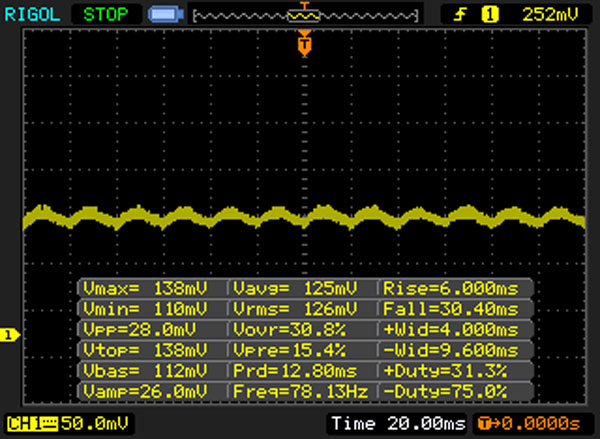 |
La retroiluminación del display parpadea a 50 Hz (seguramente usa PWM - Pulse-Width Modulation) a un brillo del 10 % e inferior. Sobre este nivel de brillo no debería darse parpadeo / PWM. La frecuencia de 50 Hz es bajísima, por lo que el parpadeo puede causar fatiga visual y cefaleas cuando se usa mucho tiempo. Comparación: 52 % de todos los dispositivos testados no usaron PWM para atenuar el display. Si se usó, medimos una media de 7754 (mínimo: 5 - máxmo: 343500) Hz. | |||
Tiempos de respuesta del display
| ↔ Tiempo de respuesta de Negro a Blanco | ||
|---|---|---|
| 16 ms ... subida ↗ y bajada ↘ combinada | ↗ 10 ms subida | 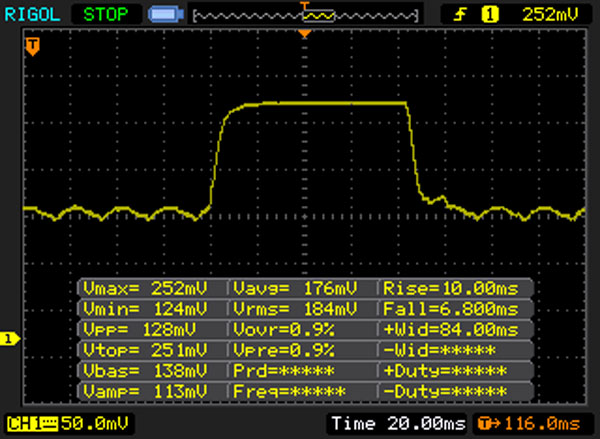 |
| ↘ 6 ms bajada | ||
| La pantalla mostró buenos tiempos de respuesta en nuestros tests pero podría ser demasiado lenta para los jugones competitivos. En comparación, todos los dispositivos de prueba van de ##min### (mínimo) a 240 (máximo) ms. » 37 % de todos los dispositivos son mejores. Esto quiere decir que el tiempo de respuesta medido es mejor que la media (19.8 ms) de todos los dispositivos testados. | ||
| ↔ Tiempo de respuesta 50% Gris a 80% Gris | ||
| 44 ms ... subida ↗ y bajada ↘ combinada | ↗ 23 ms subida | 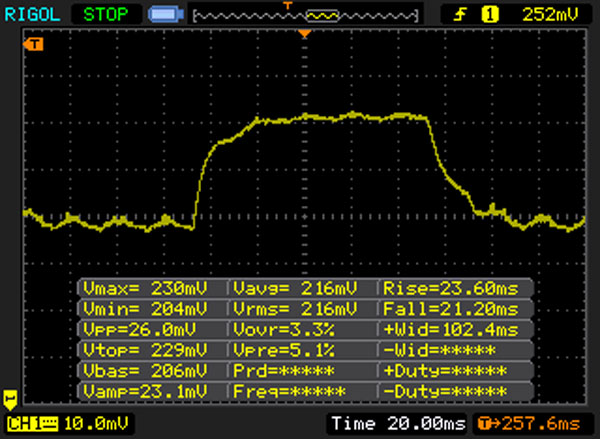 |
| ↘ 21 ms bajada | ||
| La pantalla mostró tiempos de respuesta lentos en nuestros tests y podría ser demasiado lenta para los jugones. En comparación, todos los dispositivos de prueba van de ##min### (mínimo) a 636 (máximo) ms. » 73 % de todos los dispositivos son mejores. Eso quiere decir que el tiempo de respuesta es peor que la media (31 ms) de todos los dispositivos testados. | ||

| Cinebench R15 | |
| CPU Single 64Bit | |
| Acer TravelMate X3 X349-M-7261 | |
| Acer Aspire E5-575G-549D | |
| Dell Vostro 5468 | |
| Acer TravelMate P249-M-5452 | |
| Lenovo ThinkPad E460-20EUS00000 | |
| HP ProBook 440 G3 | |
| Dell Latitude 14 3470 | |
| CPU Multi 64Bit | |
| Acer Aspire E5-575G-549D | |
| Dell Vostro 5468 | |
| Acer TravelMate X3 X349-M-7261 | |
| HP ProBook 440 G3 | |
| Acer TravelMate P249-M-5452 | |
| Lenovo ThinkPad E460-20EUS00000 | |
| Dell Latitude 14 3470 | |
| Cinebench R10 | |
| Rendering Multiple CPUs 32Bit | |
| Acer Aspire E5-575G-549D | |
| Acer TravelMate X3 X349-M-7261 | |
| HP ProBook 440 G3 | |
| Acer TravelMate P249-M-5452 | |
| Lenovo ThinkPad E460-20EUS00000 | |
| Rendering Single 32Bit | |
| Acer Aspire E5-575G-549D | |
| Acer TravelMate X3 X349-M-7261 | |
| HP ProBook 440 G3 | |
| Lenovo ThinkPad E460-20EUS00000 | |
| Acer TravelMate P249-M-5452 | |
| Geekbench 3 | |
| 32 Bit Single-Core Score | |
| Acer TravelMate X3 X349-M-7261 | |
| Acer TravelMate P249-M-5452 | |
| Acer Aspire E5-575G-549D | |
| Lenovo ThinkPad E460-20EUS00000 | |
| 32 Bit Multi-Core Score | |
| Acer TravelMate X3 X349-M-7261 | |
| Acer Aspire E5-575G-549D | |
| Acer TravelMate P249-M-5452 | |
| Lenovo ThinkPad E460-20EUS00000 | |
| Geekbench 4.0 | |
| 64 Bit Single-Core Score | |
| Acer TravelMate X3 X349-M-7261 | |
| Acer Aspire E5-575G-549D | |
| Acer TravelMate P249-M-5452 | |
| 64 Bit Multi-Core Score | |
| Acer TravelMate X3 X349-M-7261 | |
| Acer TravelMate P249-M-5452 | |
| Acer Aspire E5-575G-549D | |
| JetStream 1.1 - 1.1 Total | |
| Acer Aspire E5-575G-549D | |
| Acer TravelMate X3 X349-M-7261 | |
| Acer TravelMate P249-M-5452 | |
| Acer TravelMate P249-M-5452 | |
| HP ProBook 440 G3 | |
| Lenovo ThinkPad E460-20EUS00000 | |
| PCMark 7 Score | 4603 puntos | |
| PCMark 8 Home Score Accelerated v2 | 3472 puntos | |
| PCMark 8 Creative Score Accelerated v2 | 3760 puntos | |
| PCMark 8 Work Score Accelerated v2 | 4463 puntos | |
ayuda | ||

| Acer TravelMate P249-M-5452 SK Hynix HFS256G39TND-N210A | HP ProBook 440 G3 Hitachi Travelstar Z7K500 HTS725050A7E630 | Lenovo ThinkPad E460-20EUS00000 Samsung CM871 MZ7LF192HCGS | Dell Latitude 14 3470 Toshiba MQ01ACF050 | Acer TravelMate X3 X349-M-7261 Liteonit CV3-8D512 | |
|---|---|---|---|---|---|
| CrystalDiskMark 3.0 | -87% | -44% | -90% | 10% | |
| Read Seq (MB/s) | 510 | 124.8 -76% | 497.6 -2% | 108.9 -79% | 484.1 -5% |
| Write Seq (MB/s) | 267.2 | 123.6 -54% | 180 -33% | 103.2 -61% | 449.8 68% |
| Read 512 (MB/s) | 347.6 | 42.34 -88% | 297.1 -15% | 399.1 15% | |
| Write 512 (MB/s) | 267.5 | 61.9 -77% | 169.1 -37% | 355.1 33% | |
| Read 4k (MB/s) | 33.12 | 0.559 -98% | 18.91 -43% | 0.362 -99% | 33.44 1% |
| Write 4k (MB/s) | 95.9 | 1.277 -99% | 37.13 -61% | 0.946 -99% | 67.5 -30% |
| Read 4k QD32 (MB/s) | 392.8 | 1.179 -100% | 95.7 -76% | 0.721 -100% | 368.5 -6% |
| Write 4k QD32 (MB/s) | 266.4 | 1.304 -100% | 37.26 -86% | 0.901 -100% | 280.6 5% |
| 3DMark 06 Standard Score | 9061 puntos | |
| 3DMark 11 Performance | 1503 puntos | |
| 3DMark Ice Storm Standard Score | 53902 puntos | |
| 3DMark Cloud Gate Standard Score | 5329 puntos | |
| 3DMark Fire Strike Score | 736 puntos | |
ayuda | ||
| 3DMark 11 - 1280x720 Performance GPU | |
| Lenovo ThinkPad E460-20EUS00000 | |
| Acer TravelMate X3 X349-M-7261 | |
| Acer TravelMate P249-M-5452 | |
| HP ProBook 440 G3 | |
| Dell Latitude 14 3470 | |
| 3DMark | |
| 1280x720 Cloud Gate Standard Graphics | |
| Acer TravelMate X3 X349-M-7261 | |
| Acer TravelMate P249-M-5452 | |
| HP ProBook 440 G3 | |
| Lenovo ThinkPad E460-20EUS00000 | |
| Dell Latitude 14 3470 | |
| 1920x1080 Fire Strike Graphics | |
| Lenovo ThinkPad E460-20EUS00000 | |
| Acer TravelMate X3 X349-M-7261 | |
| Acer TravelMate P249-M-5452 | |
| HP ProBook 440 G3 | |
| Dell Latitude 14 3470 | |
| bajo | medio | alto | ultra | |
|---|---|---|---|---|
| Tomb Raider (2013) | 76.4 | 38.4 | 23.8 | 11.1 |
| BioShock Infinite (2013) | 50.9 | 26.8 | 22.2 | 6.6 |
| Battlefield 4 (2013) | 31.2 | 23.3 | 10.6 | 4.2 |
| Battlefield 1 (2016) | 30.1 | 15.7 | 7.3 | 6.5 |
| Farming Simulator 17 (2016) | 82.1 | 52.2 | 20.6 | 12 |
| Titanfall 2 (2016) | 33.1 | 23.9 | 8.5 |
Ruido
| Ocioso |
| 31.8 / 31.8 / 31.8 dB(A) |
| DVD |
| 35.9 / dB(A) |
| Carga |
| 35.7 / 36 dB(A) |
 | ||
30 dB silencioso 40 dB(A) audible 50 dB(A) ruidosamente alto |
||
min: | ||
| Acer TravelMate P249-M-5452 6200U, HD Graphics 520 | HP ProBook 440 G3 6200U, HD Graphics 520 | Lenovo ThinkPad E460-20EUS00000 6200U, Radeon R7 M360 | Dell Latitude 14 3470 6100U, HD Graphics 520 | Acer TravelMate X3 X349-M-7261 6500U, HD Graphics 520 | |
|---|---|---|---|---|---|
| Noise | 6% | 7% | 3% | 4% | |
| apagado / medio ambiente * (dB) | 31.8 | 29.2 8% | 31.15 2% | ||
| Idle Minimum * (dB) | 31.8 | 29.7 7% | 29 9% | 32.3 -2% | 31.5 1% |
| Idle Average * (dB) | 31.8 | 29.7 7% | 29 9% | 32.3 -2% | 31.5 1% |
| Idle Maximum * (dB) | 31.8 | 29.7 7% | 29 9% | 32.3 -2% | 31.5 1% |
| Load Average * (dB) | 35.7 | 32.7 8% | 33.1 7% | 33.3 7% | 31.7 11% |
| Load Maximum * (dB) | 36 | 35.1 2% | 35.6 1% | 33.4 7% | 34.1 5% |
* ... más pequeño es mejor
(+) La temperatura máxima en la parte superior es de 34.8 °C / 95 F, frente a la media de 34.3 °C / 94 F, que oscila entre 21.2 y 62.5 °C para la clase Office.
(±) El fondo se calienta hasta un máximo de 42.8 °C / 109 F, frente a la media de 36.8 °C / 98 F
(+) En reposo, la temperatura media de la parte superior es de 22.9 °C / 73# F, frente a la media del dispositivo de 29.5 °C / 85 F.
(+) El reposamanos y el panel táctil están a una temperatura inferior a la de la piel, con un máximo de 31.6 °C / 88.9 F y, por tanto, son fríos al tacto.
(-) La temperatura media de la zona del reposamanos de dispositivos similares fue de 27.5 °C / 81.5 F (-4.1 °C / -7.4 F).
| Acer TravelMate P249-M-5452 6200U, HD Graphics 520 | HP ProBook 440 G3 6200U, HD Graphics 520 | Lenovo ThinkPad E460-20EUS00000 6200U, Radeon R7 M360 | Dell Latitude 14 3470 6100U, HD Graphics 520 | Acer TravelMate X3 X349-M-7261 6500U, HD Graphics 520 | |
|---|---|---|---|---|---|
| Heat | -24% | -19% | -18% | 1% | |
| Maximum Upper Side * (°C) | 34.8 | 41.4 -19% | 47.8 -37% | 38.9 -12% | 38.6 -11% |
| Maximum Bottom * (°C) | 42.8 | 50.2 -17% | 48.3 -13% | 37.7 12% | 39.5 8% |
| Idle Upper Side * (°C) | 24.6 | 34 -38% | 28.6 -16% | 35.1 -43% | 24.8 -1% |
| Idle Bottom * (°C) | 27.8 | 33.3 -20% | 30.6 -10% | 35.5 -28% | 25.4 9% |
* ... más pequeño es mejor
Acer TravelMate P249-M-5452 análisis de audio
(±) | la sonoridad del altavoz es media pero buena (72 dB)
Graves 100 - 315 Hz
(-) | casi sin bajos - de media 15.9% inferior a la mediana
(+) | el bajo es lineal (6.1% delta a la frecuencia anterior)
Medios 400 - 2000 Hz
(+) | medios equilibrados - a sólo 2.5% de la mediana
(+) | los medios son lineales (6.9% delta a la frecuencia anterior)
Altos 2 - 16 kHz
(±) | máximos más altos - de media 7.2% más altos que la mediana
(±) | la linealidad de los máximos es media (7.3% delta a frecuencia anterior)
Total 100 - 16.000 Hz
(±) | la linealidad del sonido global es media (19.3% de diferencia con la mediana)
En comparación con la misma clase
» 39% de todos los dispositivos probados de esta clase eran mejores, 7% similares, 54% peores
» El mejor tuvo un delta de 7%, la media fue 21%, el peor fue ###max##%
En comparación con todos los dispositivos probados
» 47% de todos los dispositivos probados eran mejores, 8% similares, 46% peores
» El mejor tuvo un delta de 4%, la media fue 23%, el peor fue ###max##%
Apple MacBook 12 (Early 2016) 1.1 GHz análisis de audio
(+) | los altavoces pueden reproducir a un volumen relativamente alto (#83.6 dB)
Graves 100 - 315 Hz
(±) | lubina reducida - en promedio 11.3% inferior a la mediana
(±) | la linealidad de los graves es media (14.2% delta a frecuencia anterior)
Medios 400 - 2000 Hz
(+) | medios equilibrados - a sólo 2.4% de la mediana
(+) | los medios son lineales (5.5% delta a la frecuencia anterior)
Altos 2 - 16 kHz
(+) | máximos equilibrados - a sólo 2% de la mediana
(+) | los máximos son lineales (4.5% delta a la frecuencia anterior)
Total 100 - 16.000 Hz
(+) | el sonido global es lineal (10.2% de diferencia con la mediana)
En comparación con la misma clase
» 7% de todos los dispositivos probados de esta clase eran mejores, 2% similares, 90% peores
» El mejor tuvo un delta de 5%, la media fue 18%, el peor fue ###max##%
En comparación con todos los dispositivos probados
» 5% de todos los dispositivos probados eran mejores, 1% similares, 94% peores
» El mejor tuvo un delta de 4%, la media fue 23%, el peor fue ###max##%
| Off / Standby | |
| Ocioso | |
| Carga |
|
Clave:
min: | |
| Acer TravelMate P249-M-5452 6200U, HD Graphics 520 | HP ProBook 440 G3 6200U, HD Graphics 520 | Lenovo ThinkPad E460-20EUS00000 6200U, Radeon R7 M360 | Dell Latitude 14 3470 6100U, HD Graphics 520 | Acer TravelMate X3 X349-M-7261 6500U, HD Graphics 520 | |
|---|---|---|---|---|---|
| Power Consumption | -11% | -23% | -3% | -8% | |
| Idle Minimum * (Watt) | 3.8 | 5.2 -37% | 4.1 -8% | 5 -32% | 4.9 -29% |
| Idle Average * (Watt) | 7.6 | 8.2 -8% | 8 -5% | 6.8 11% | 7.3 4% |
| Idle Maximum * (Watt) | 8 | 9 -13% | 8.9 -11% | 8.9 -11% | 9.4 -18% |
| Load Average * (Watt) | 30.5 | 28.8 6% | 39.3 -29% | 26.2 14% | 26 15% |
| Load Maximum * (Watt) | 32.5 | 34 -5% | 52.2 -61% | 31.8 2% | 36 -11% |
* ... más pequeño es mejor
| Acer TravelMate P249-M-5452 6200U, HD Graphics 520, 41 Wh | HP ProBook 440 G3 6200U, HD Graphics 520, 44 Wh | Lenovo ThinkPad E460-20EUS00000 6200U, Radeon R7 M360, 47 Wh | Dell Latitude 14 3470 6100U, HD Graphics 520, 41 Wh | Acer TravelMate X3 X349-M-7261 6500U, HD Graphics 520, 48.9 Wh | |
|---|---|---|---|---|---|
| Duración de Batería | -14% | 3% | 2% | 4% | |
| Reader / Idle (h) | 13.2 | 9 -32% | 12.3 -7% | 11.1 -16% | 11.3 -14% |
| H.264 (h) | 6 | 5.4 -10% | 7.1 18% | 6.7 12% | |
| WiFi v1.3 (h) | 6.7 | 4.9 -27% | 4.9 -27% | 4.6 -31% | 6.5 -3% |
| Load (h) | 1.5 | 1.7 13% | 1.9 27% | 2.3 53% | 1.8 20% |
Pro
Contra
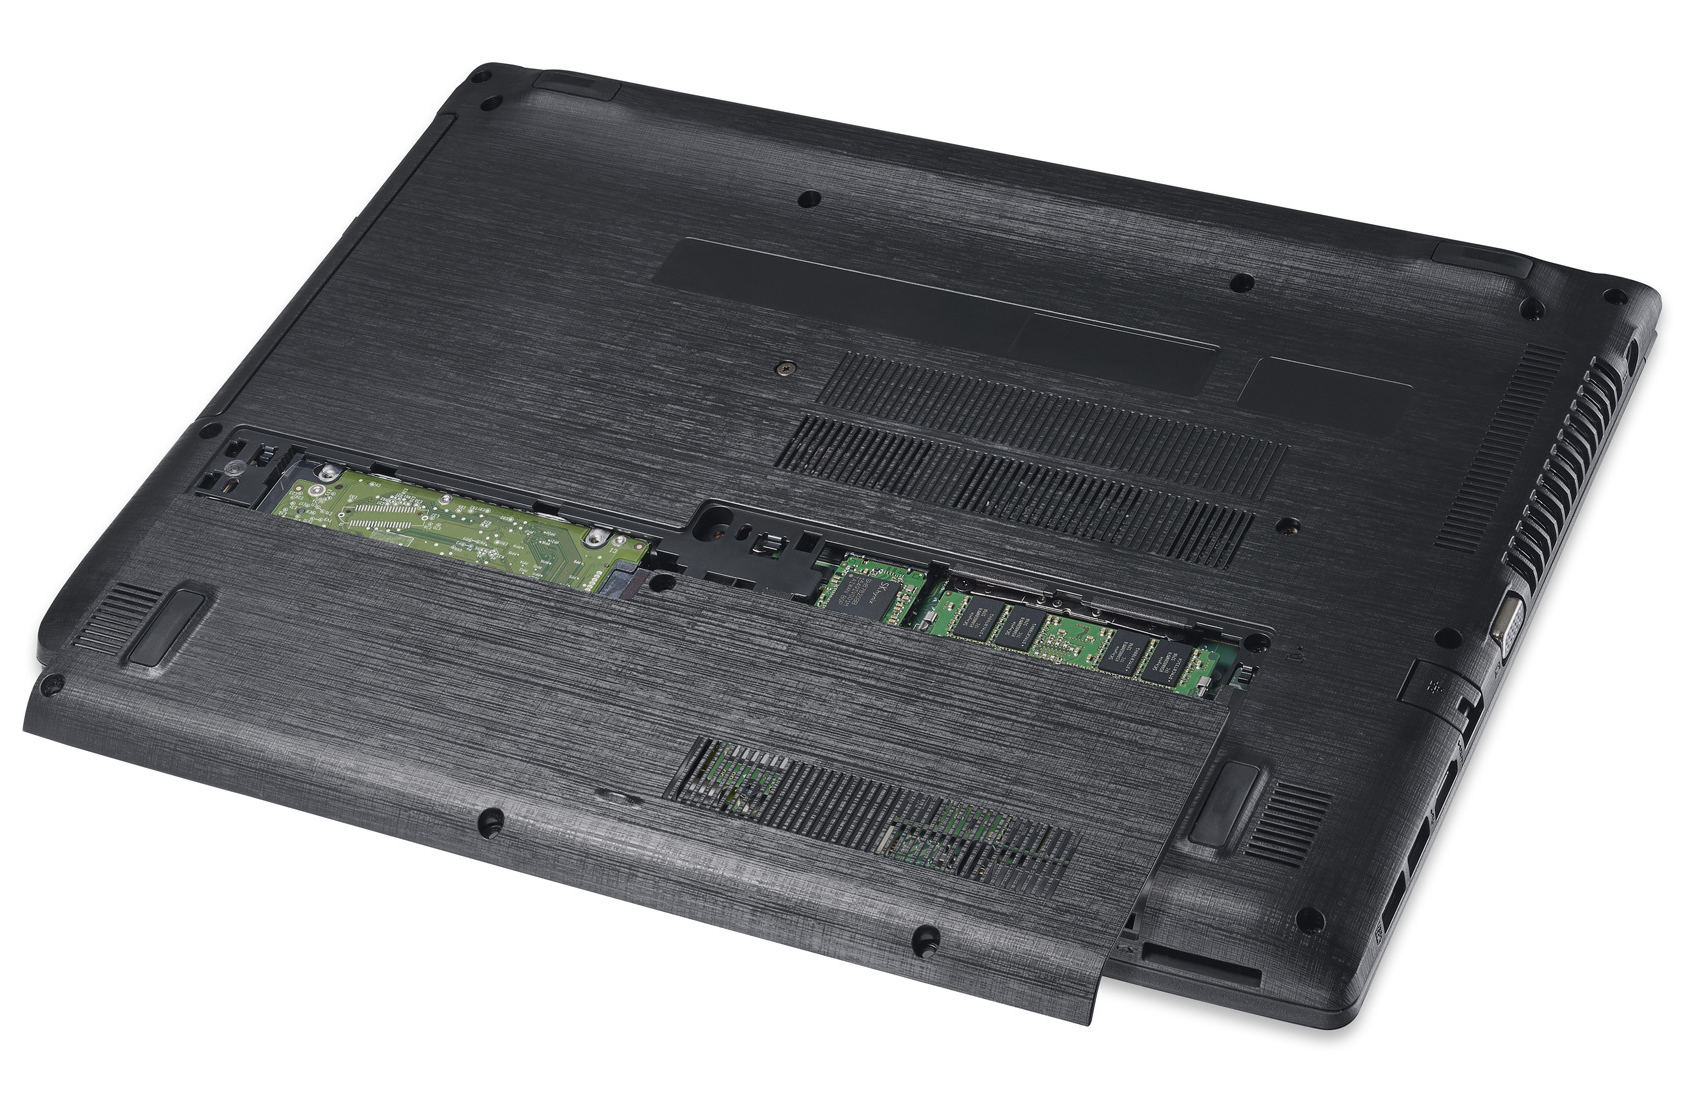
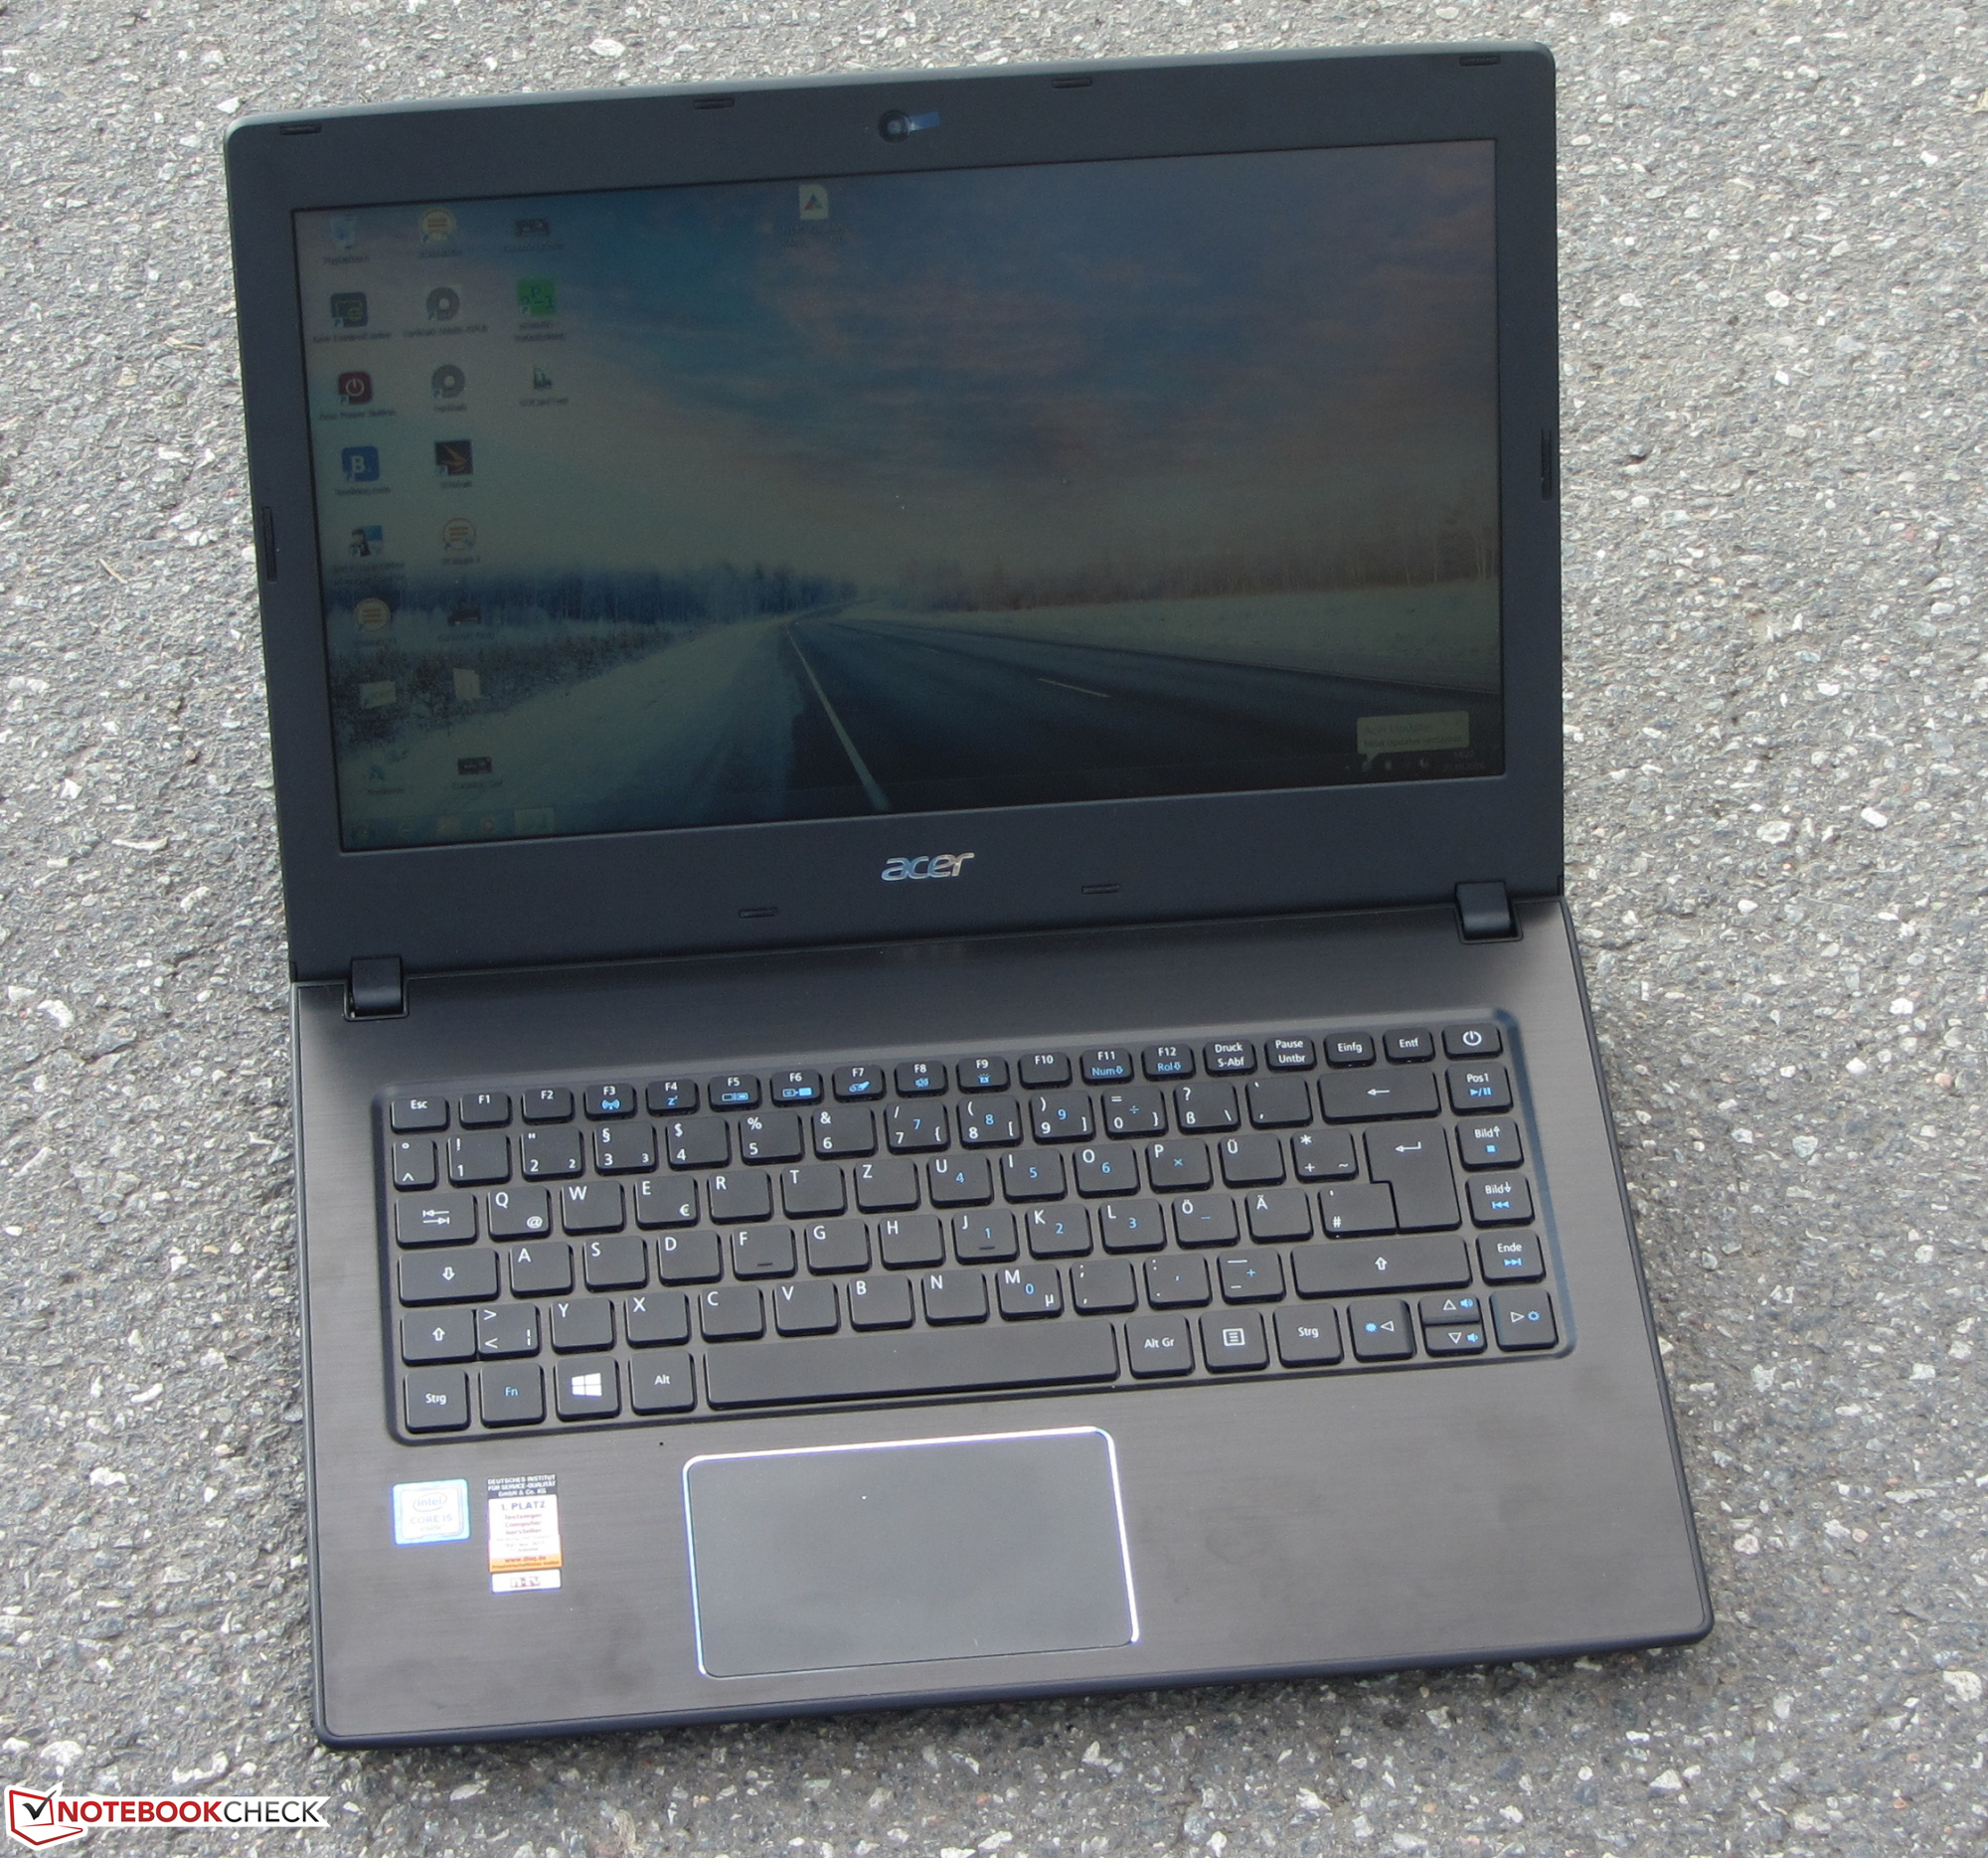
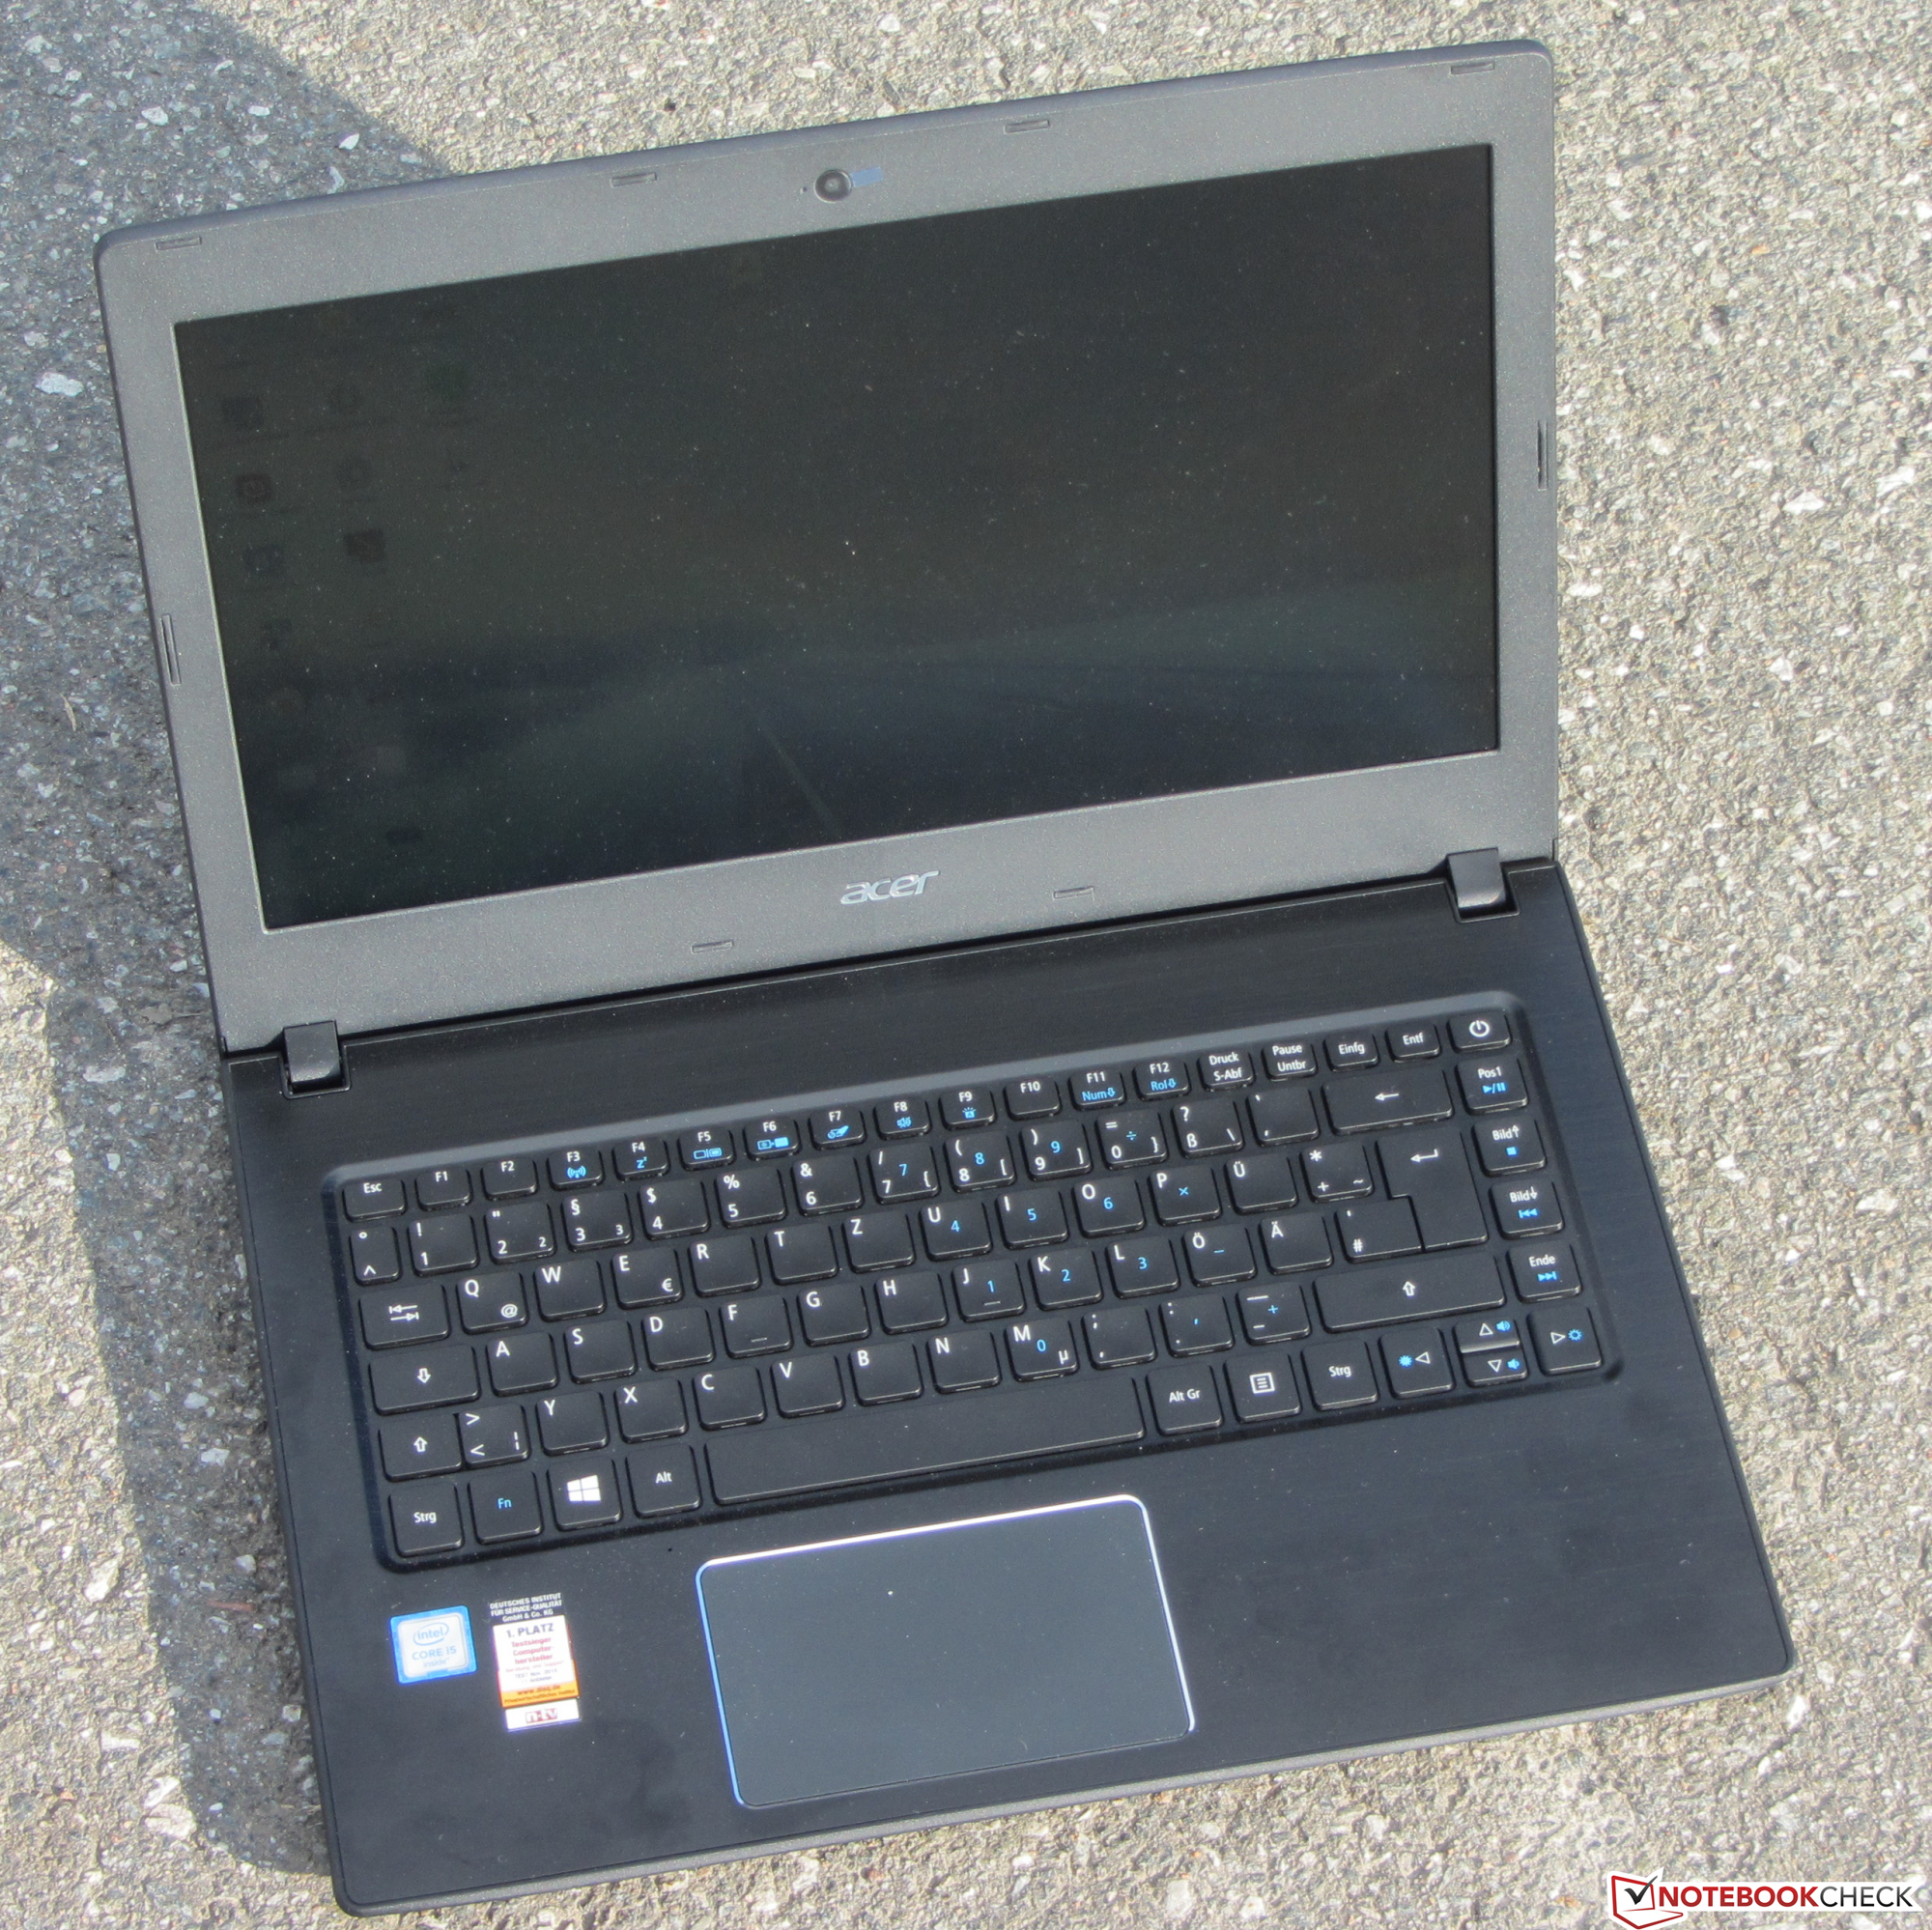
Acer quiere dar servicio a los usuarios business básicos con el TravelMate P249-M. El grupo objetivo incluye empresas, autónomos, y estudiantes. Las características business clásicas tales como lector de huellas, puerto de anclaje, o módem LTE, no se han incluido. El procesador ofrece rendimiento suficiente para las tareas diarias y el portátil funciona en silencio y sin apenas calentarse. Un veloz SSD se encarga de que el sistema vaya fluido. Se puede cambiar el SSD por la escotilla de mantenimiento sin problemas. El aguante de batería y los dispositivos de entrada también son buenos. El fabricante remata el paquete con tres años de garantía. Sólo podemos criticar la pantalla, ya que Acer ha elegido un panel TN que ofrece un contraste decente pero poco ángulo de visión y brillo.
El Acer TravelMate P249-M es un dispositivo de trabajo fiable que merece un mejor display.
Nuestro modelo de pruebas es el top model de la serie, ya que viene equipado con una pantalla FHD, CPU Core-i5, y SSD. Si prefieres precios inferiores, mira la configuración básica (P249-M-3895). El precio de los modelos más baratos ronda los 560-580 Euros. Publicaremos un análisis de esa configuración en un futuro próximo en Notebookcheck.com.
Si no te gusta el aspecto del P249-M, te recomendamos echar un vistazo al Acer TravelMate X349-M, que es más estiloso. El X349-M va equipado con una carcasa de aluminio delgada, un panel IPS (P249-M: TN LED), un lector de huellas, y un puerto USB Type-C. El P249-M ofrece mejor teclado y mejores opciones de mejora.
Ésta es una versión acortada del análisis original. Puedes leer el análisis completo en inglés aquí.
Acer TravelMate P249-M-5452
- 11/01/2016 v5.1 (old)
Sascha Mölck