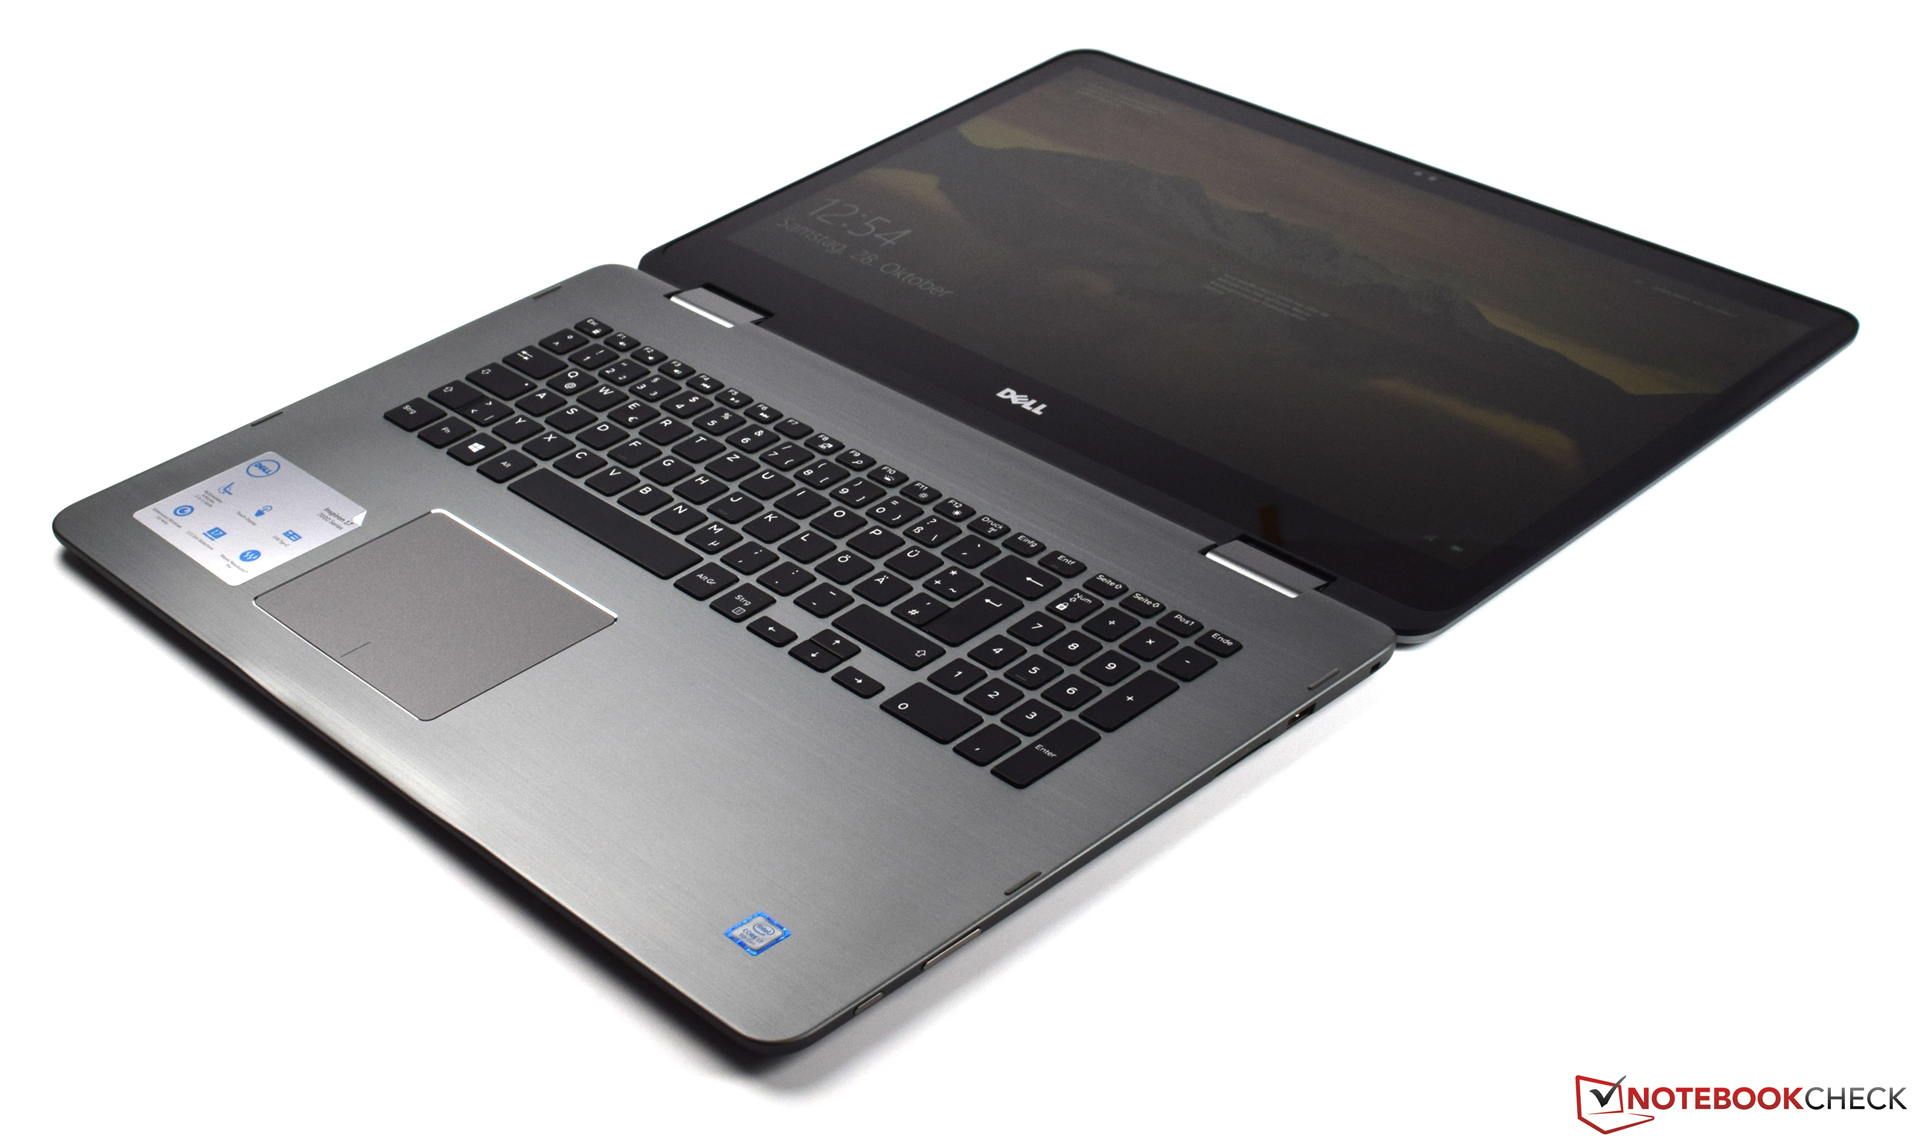
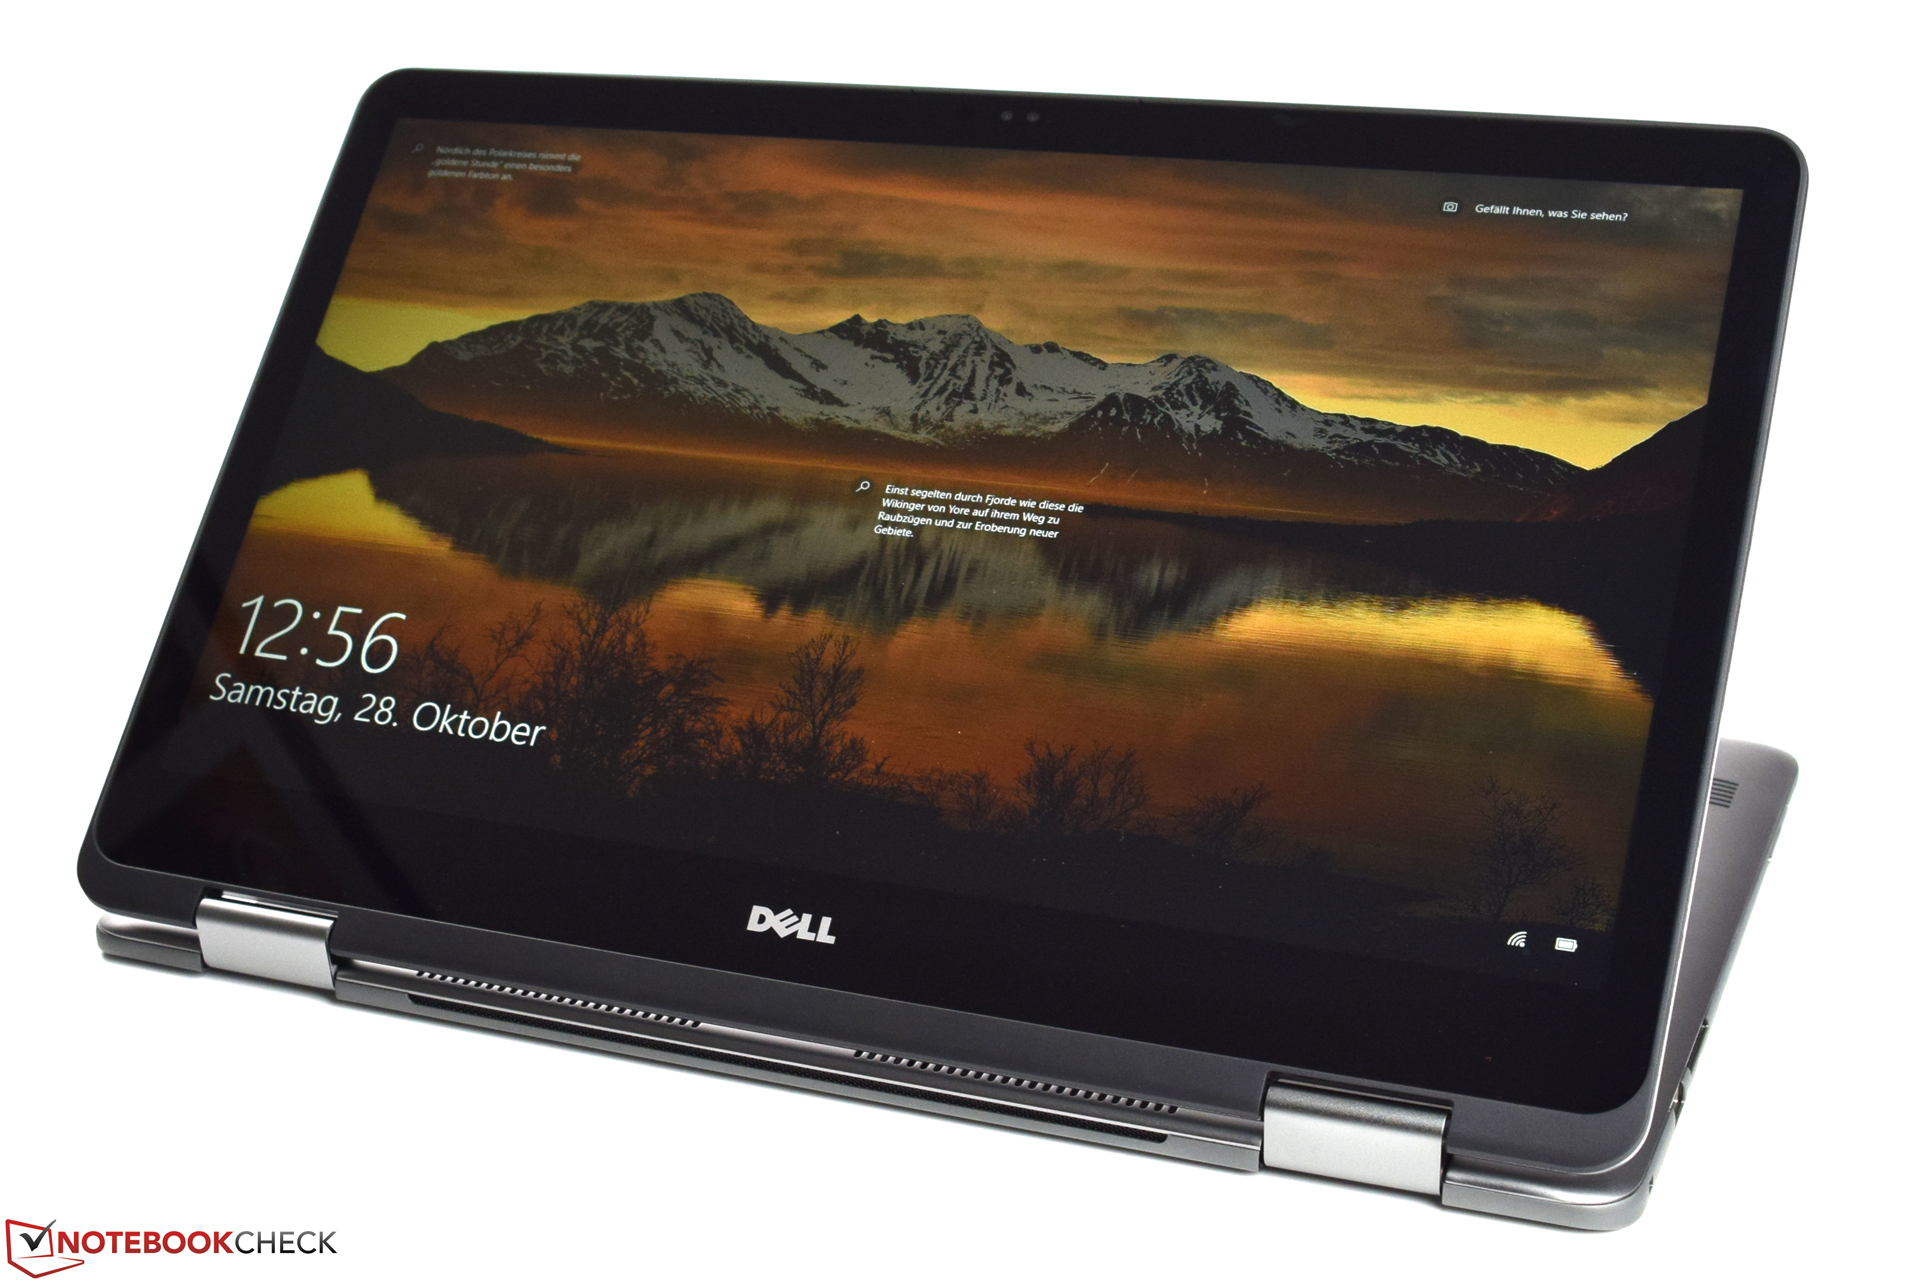
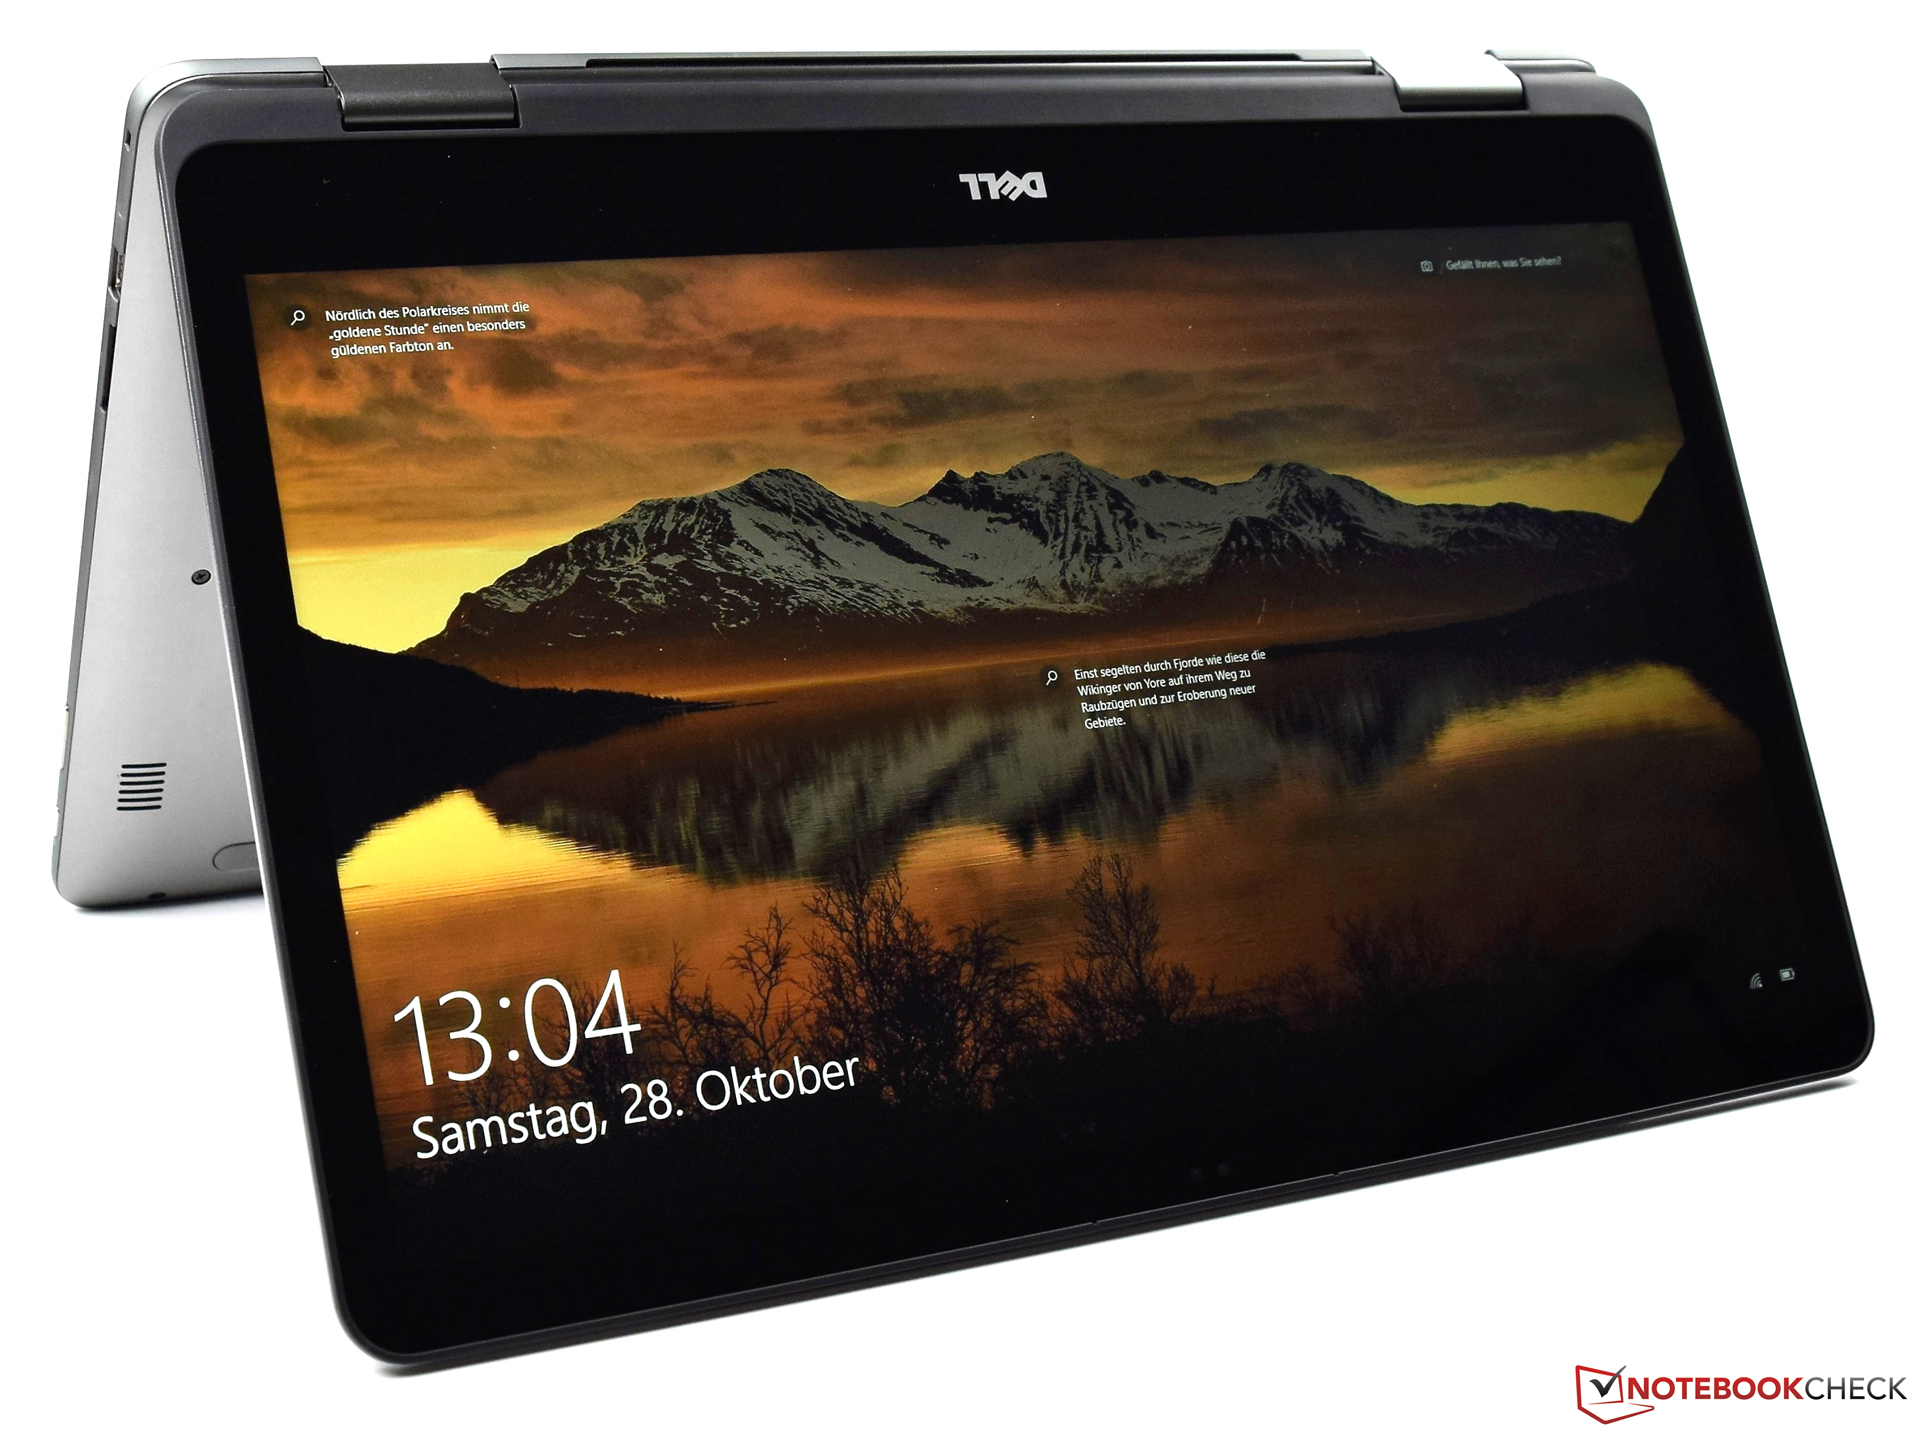
Breve análisis del convertible Dell Inspiron 17 7773 (i7-8550U, 16 GB, 17" Touch)


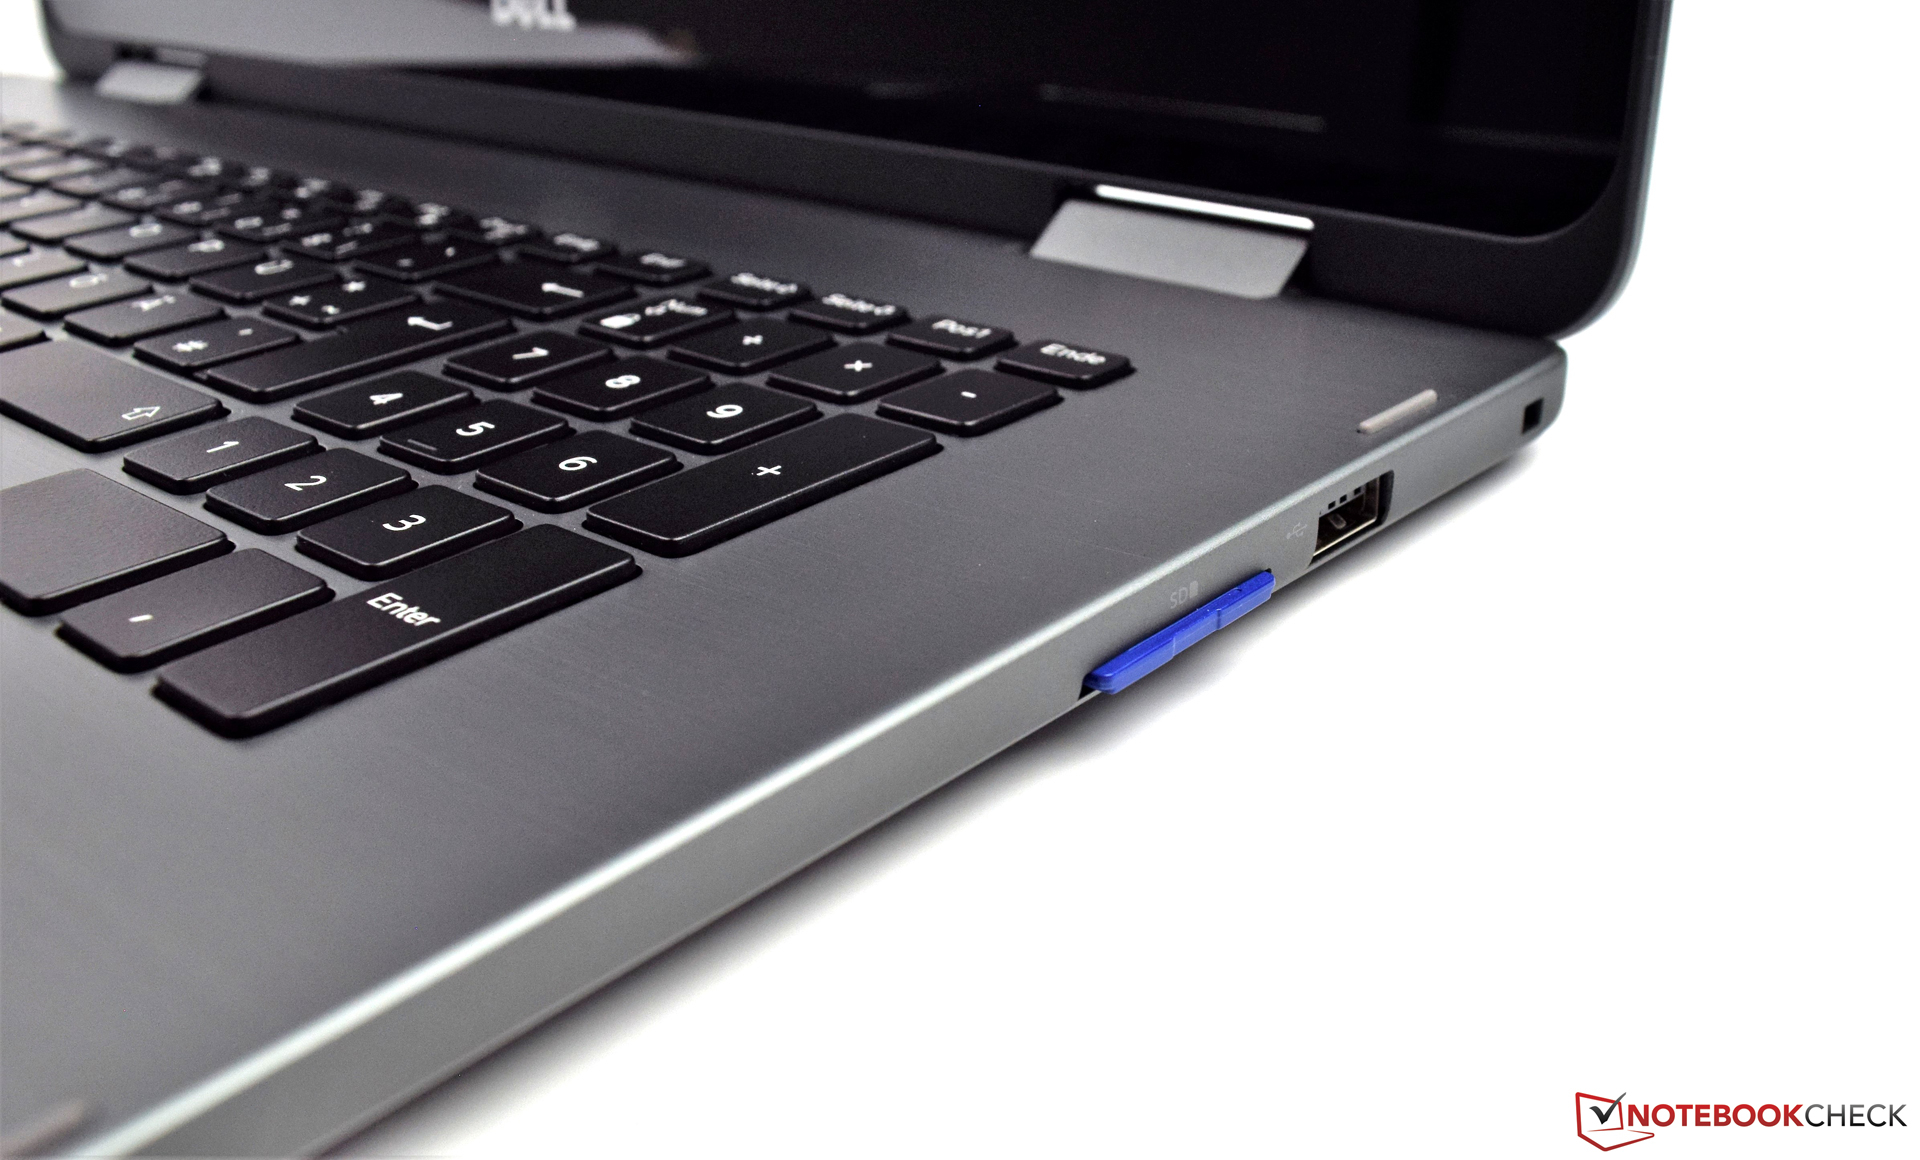
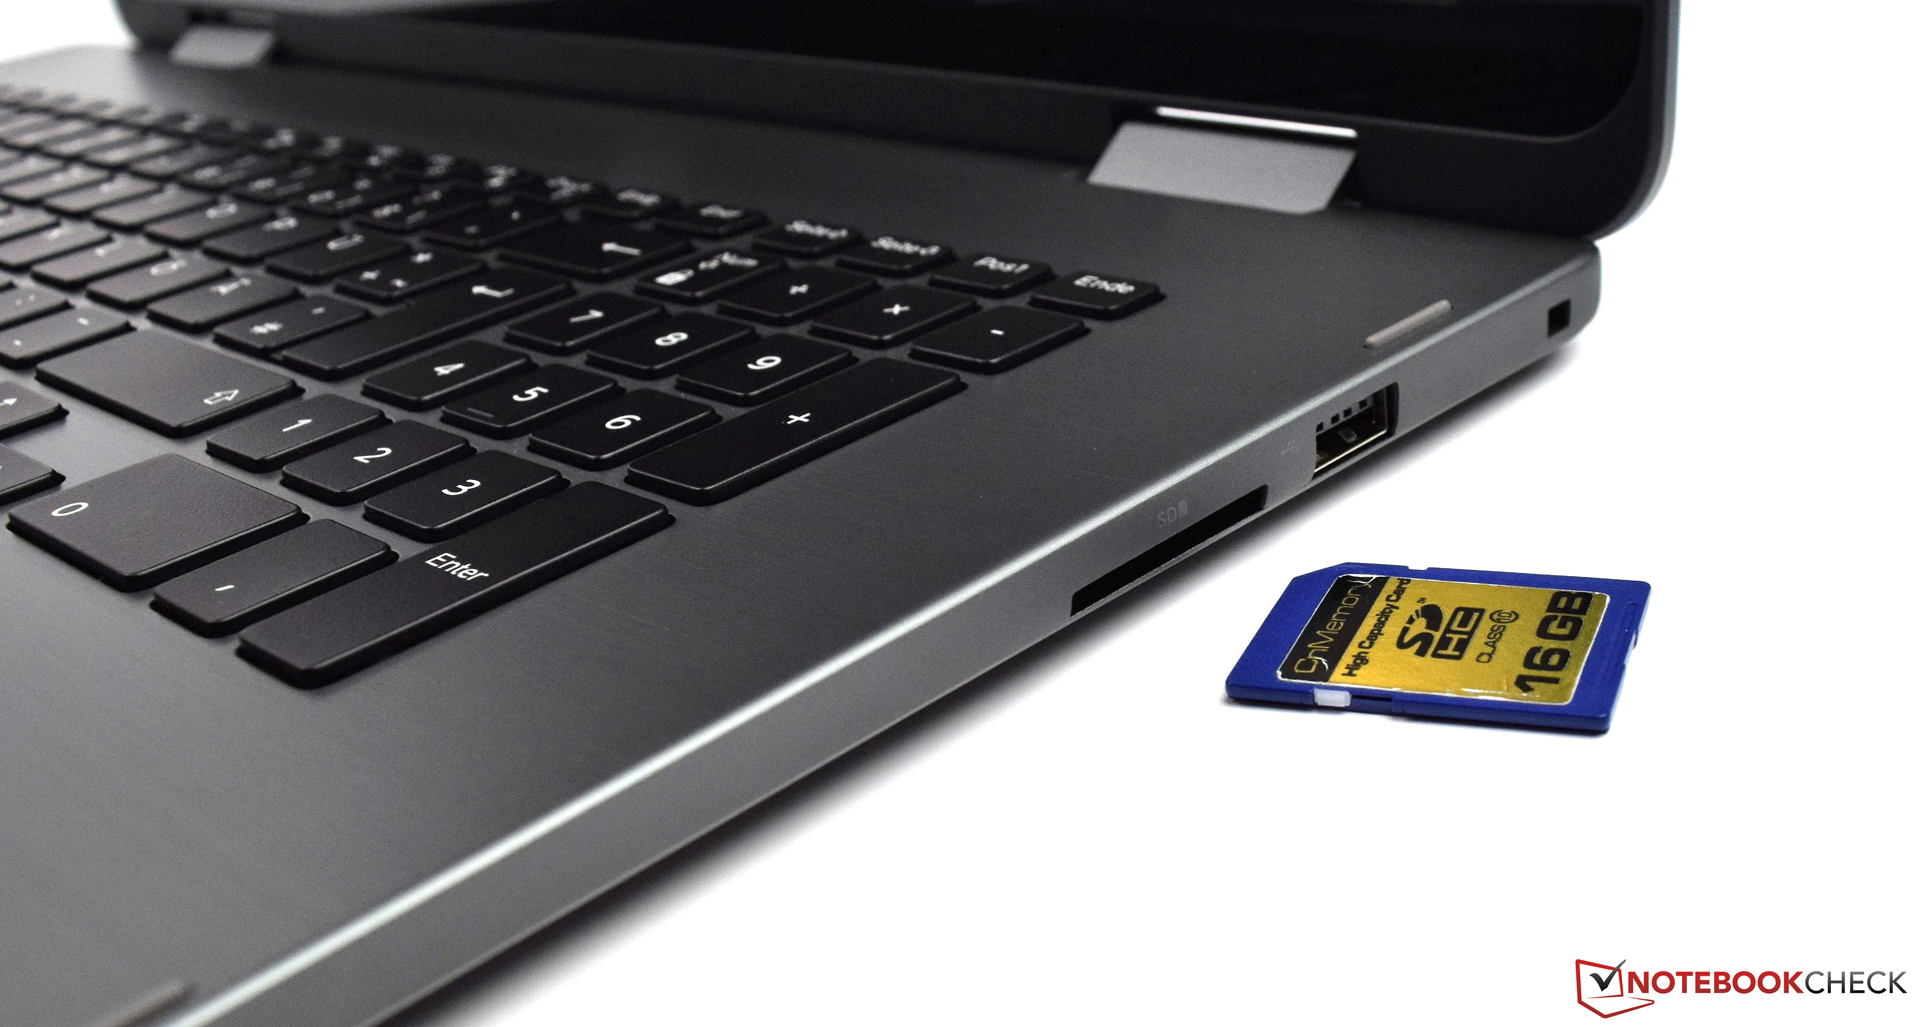
| SD Card Reader | |
| average JPG Copy Test (av. of 3 runs) | |
| HP Omen 17-w206ng (Toshiba Exceria Pro SDXC 64 GB UHS-II) | |
| Acer Aspire 5 A517-51G-80L (Toshiba Exceria Pro SDXC 64 GB UHS-II) | |
| Acer Aspire 7 A717-71G-72VY (Toshiba Exceria Pro SDXC 64 GB UHS-II) | |
| Dell Inspiron 17-7773-0043 (Toshiba Exceria Pro SDXC 64 GB UHS-II) | |
| Acer Aspire Nitro BE VN7-793G-5811 (Toshiba Exceria Pro SDXC 64 GB UHS-II) | |
| Dell Inspiron 17 7778 | |
| maximum AS SSD Seq Read Test (1GB) | |
| HP Omen 17-w206ng (Toshiba Exceria Pro SDXC 64 GB UHS-II) | |
| Acer Aspire 7 A717-71G-72VY (Toshiba Exceria Pro SDXC 64 GB UHS-II) | |
| Acer Aspire 5 A517-51G-80L (Toshiba Exceria Pro SDXC 64 GB UHS-II) | |
| Dell Inspiron 17-7773-0043 (Toshiba Exceria Pro SDXC 64 GB UHS-II) | |
| Dell Inspiron 17 7778 | |
| Acer Aspire Nitro BE VN7-793G-5811 (Toshiba Exceria Pro SDXC 64 GB UHS-II) | |
| |||||||||||||||||||||||||
iluminación: 77 %
Brillo con batería: 323 cd/m²
Contraste: 1538:1 (Negro: 0.21 cd/m²)
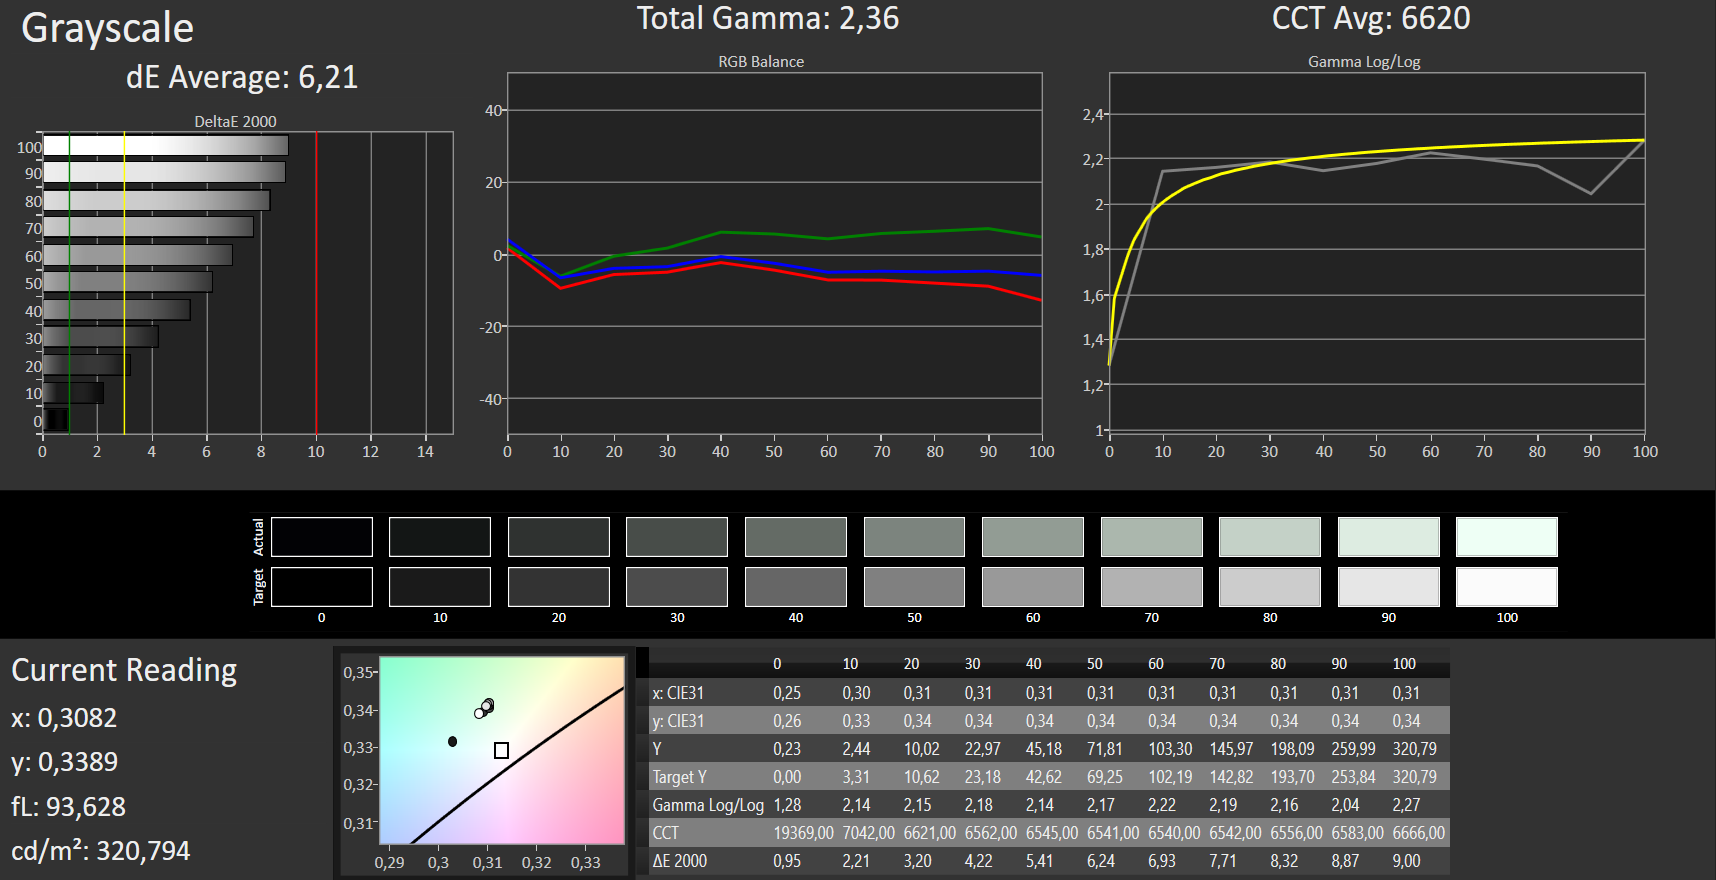
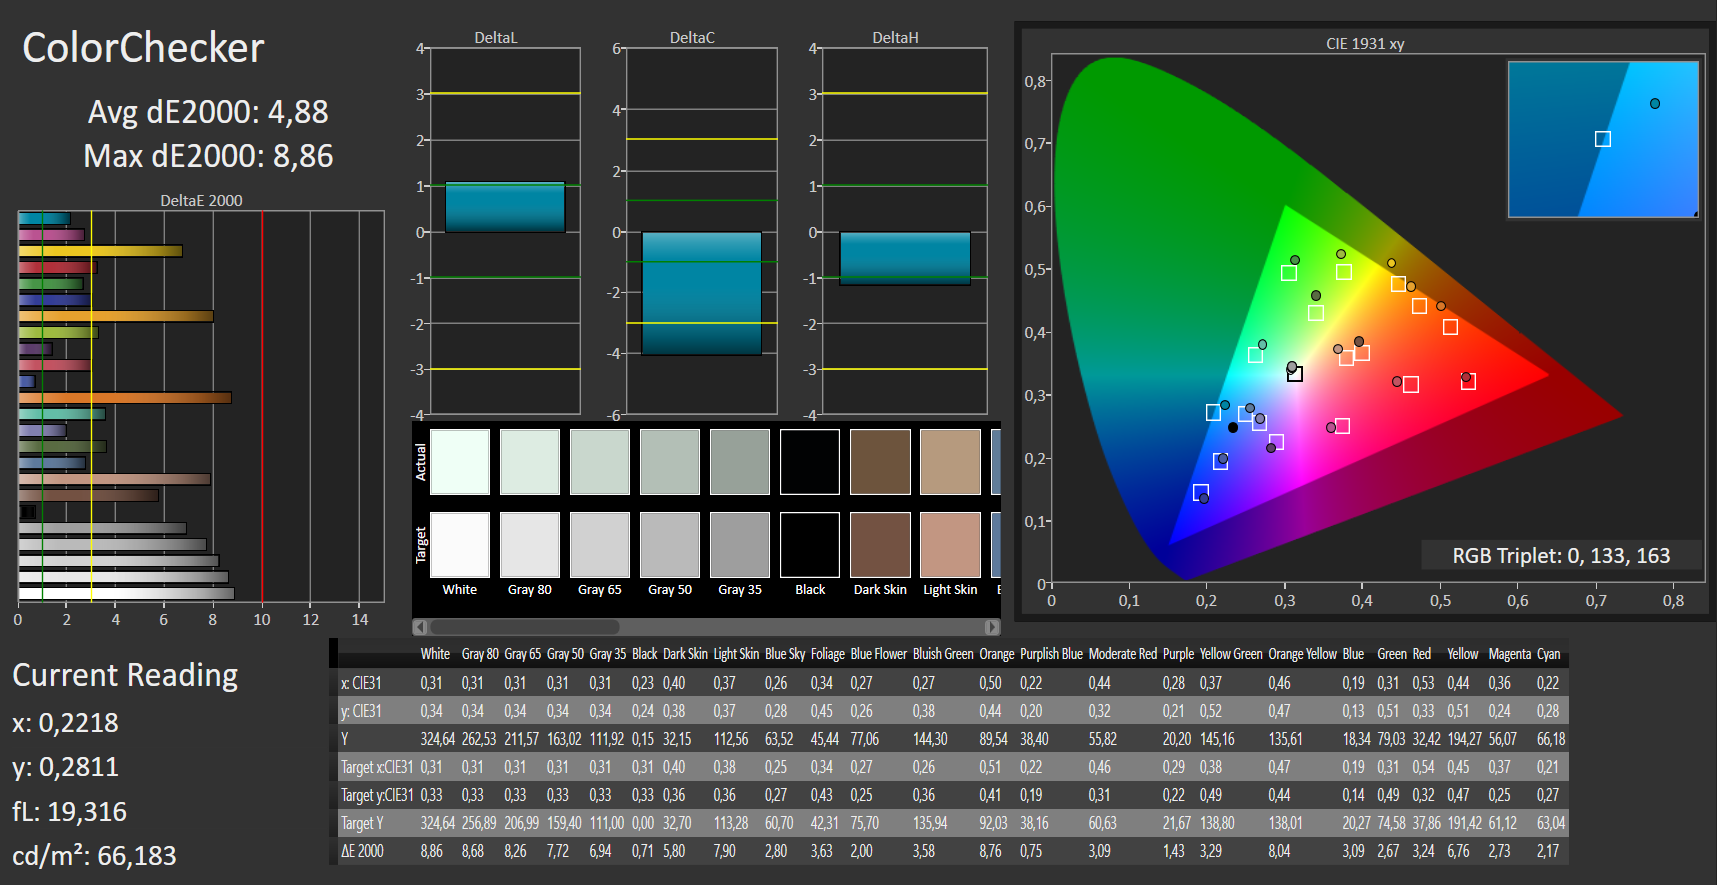
ΔE ColorChecker Calman: 4.88 | ∀{0.5-29.43 Ø4.71}
ΔE Greyscale Calman: 6.21 | ∀{0.09-98 Ø4.96}
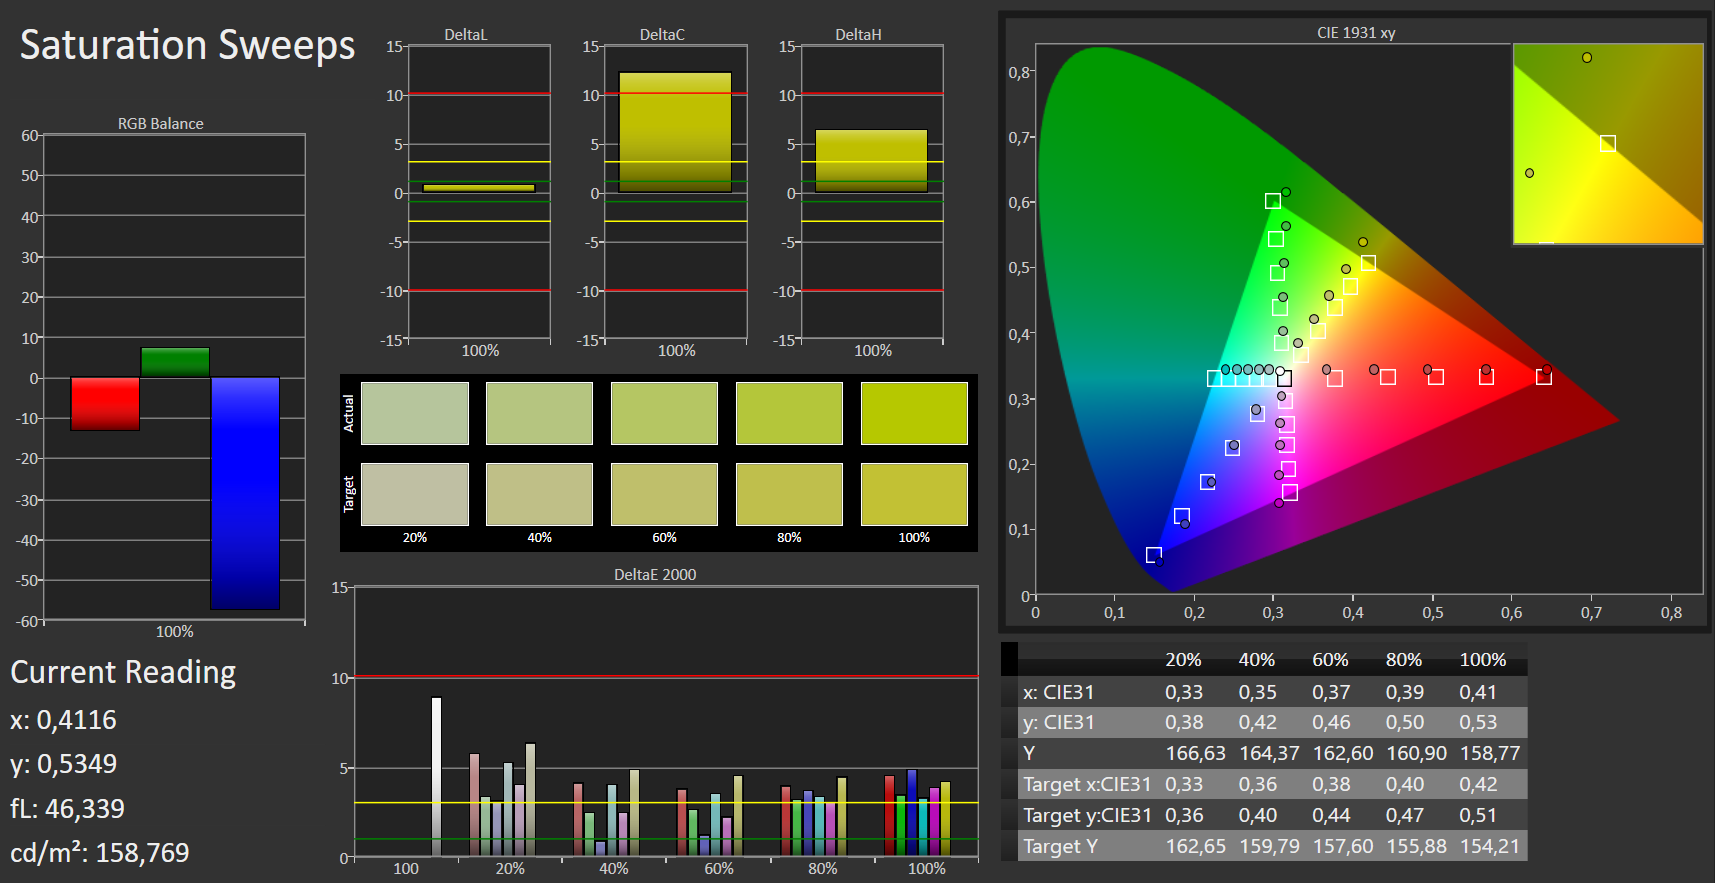
92% sRGB (Argyll 1.6.3 3D)
60% AdobeRGB 1998 (Argyll 1.6.3 3D)
67.2% AdobeRGB 1998 (Argyll 3D)
91.9% sRGB (Argyll 3D)
67.4% Display P3 (Argyll 3D)
Gamma: 2.36
CCT: 6620 K
| Dell Inspiron 17-7773-0043 Chi Mei CMN1738, 1920x1080, 17.3" | Dell Inspiron 17 7778 LG Philips LGD 0513 / 173WF4, 1920x1080, 17.3" | Acer Aspire 5 A517-51G-80L LG Display, LP173WF4-SPF5, 1920x1080, 17.3" | Acer Aspire Nitro BE VN7-793G-5811 AU Optronics, 1920x1080, 17.3" | HP Omen 17-w206ng Chi Mei CMN1738, 1920x1080, 17.3" | Acer Aspire 7 A717-71G-72VY LG Philips LGD056D / LP173WF4-SPF5, 1920x1080, 17.3" | |
|---|---|---|---|---|---|---|
| Display | -4% | -6% | -6% | 0% | -5% | |
| Display P3 Coverage (%) | 67.4 | 67.4 0% | 66.3 -2% | 63.1 -6% | 67.2 0% | 66.2 -2% |
| sRGB Coverage (%) | 91.9 | 86.3 -6% | 84.2 -8% | 86.5 -6% | 93.1 1% | 85.2 -7% |
| AdobeRGB 1998 Coverage (%) | 67.2 | 63.1 -6% | 61.6 -8% | 63.3 -6% | 67.4 0% | 62.3 -7% |
| Response Times | 16% | -7% | 5% | 6% | 5% | |
| Response Time Grey 50% / Grey 80% * (ms) | 40 ? | 36 ? 10% | 41 ? -2% | 38 ? 5% | 38 ? 5% | 41 ? -2% |
| Response Time Black / White * (ms) | 28 ? | 22 ? 21% | 31 ? -11% | 27 ? 4% | 26 ? 7% | 25 ? 11% |
| PWM Frequency (Hz) | 1000 ? | 122000 ? | 200 ? | 125000 ? | ||
| Screen | -16% | 7% | -4% | -1% | -20% | |
| Brightness middle (cd/m²) | 323 | 327 1% | 397 23% | 301 -7% | 318 -2% | 382 18% |
| Brightness (cd/m²) | 290 | 314 8% | 364 26% | 270 -7% | 295 2% | 357 23% |
| Brightness Distribution (%) | 77 | 87 13% | 84 9% | 79 3% | 79 3% | 86 12% |
| Black Level * (cd/m²) | 0.21 | 0.3 -43% | 0.29 -38% | 0.38 -81% | 0.25 -19% | 0.38 -81% |
| Contrast (:1) | 1538 | 1090 -29% | 1369 -11% | 792 -49% | 1272 -17% | 1005 -35% |
| Colorchecker dE 2000 * | 4.88 | 6.75 -38% | 3.88 20% | 3.49 28% | 4.7 4% | 6.9 -41% |
| Colorchecker dE 2000 max. * | 8.86 | 11.82 -33% | 8.22 7% | 7.49 15% | 8.8 1% | 13.14 -48% |
| Greyscale dE 2000 * | 6.21 | 7.91 -27% | 3.1 50% | 1.88 70% | 5 19% | 8.22 -32% |
| Gamma | 2.36 93% | 2.31 95% | 2.59 85% | 2.35 94% | 2.28 96% | 2.39 92% |
| CCT | 6620 98% | 7642 85% | 6570 99% | 6587 99% | 7374 88% | 7580 86% |
| Color Space (Percent of AdobeRGB 1998) (%) | 60 | 57 -5% | 55 -8% | 56 -7% | 61 2% | 56 -7% |
| Color Space (Percent of sRGB) (%) | 92 | 86 -7% | 84 -9% | 86 -7% | 93 1% | 85 -8% |
| Media total (Programa/Opciones) | -1% /
-9% | -2% /
3% | -2% /
-3% | 2% /
0% | -7% /
-14% |
* ... más pequeño es mejor
Tiempos de respuesta del display
| ↔ Tiempo de respuesta de Negro a Blanco | ||
|---|---|---|
| 28 ms ... subida ↗ y bajada ↘ combinada | ↗ 17 ms subida | 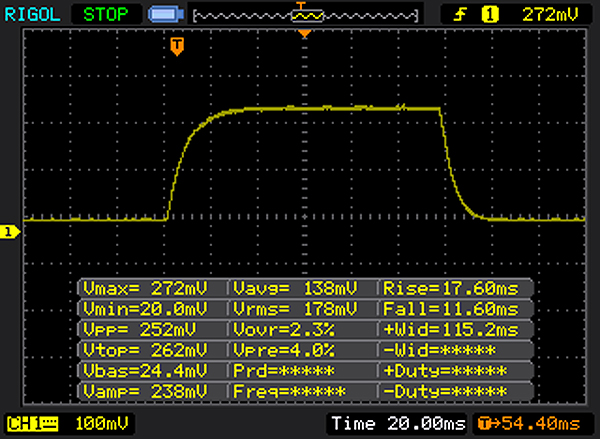 |
| ↘ 11 ms bajada | ||
| La pantalla mostró tiempos de respuesta relativamente lentos en nuestros tests pero podría ser demasiado lenta para los jugones. En comparación, todos los dispositivos de prueba van de ##min### (mínimo) a 240 (máximo) ms. » 71 % de todos los dispositivos son mejores. Eso quiere decir que el tiempo de respuesta es peor que la media (19.8 ms) de todos los dispositivos testados. | ||
| ↔ Tiempo de respuesta 50% Gris a 80% Gris | ||
| 40 ms ... subida ↗ y bajada ↘ combinada | ↗ 22 ms subida | 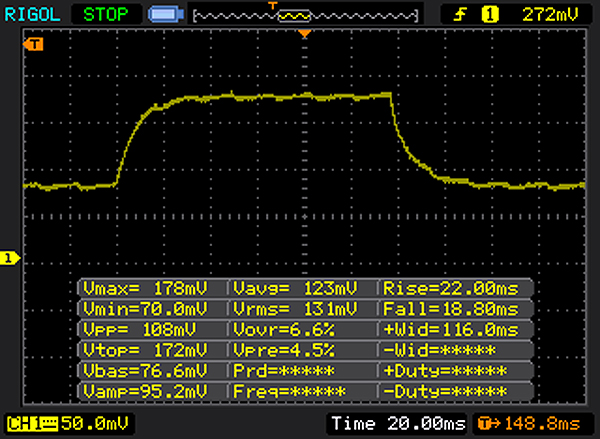 |
| ↘ 18 ms bajada | ||
| La pantalla mostró tiempos de respuesta lentos en nuestros tests y podría ser demasiado lenta para los jugones. En comparación, todos los dispositivos de prueba van de ##min### (mínimo) a 636 (máximo) ms. » 61 % de todos los dispositivos son mejores. Eso quiere decir que el tiempo de respuesta es peor que la media (31 ms) de todos los dispositivos testados. | ||
Parpadeo de Pantalla / PWM (Pulse-Width Modulation)
| Parpadeo de Pantalla / PWM detectado | 1000 Hz | ≤ 90 % de brillo | 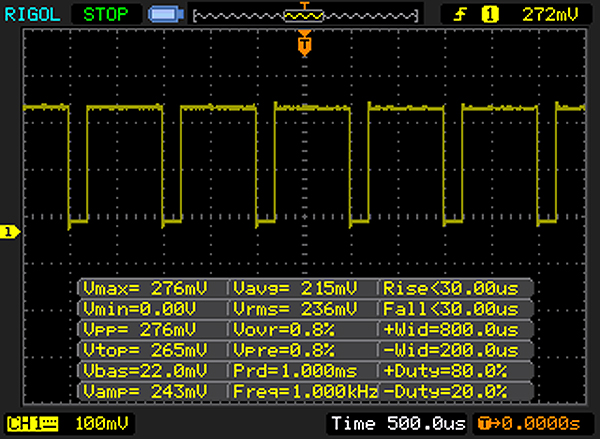 |
La retroiluminación del display parpadea a 1000 Hz (seguramente usa PWM - Pulse-Width Modulation) a un brillo del 90 % e inferior. Sobre este nivel de brillo no debería darse parpadeo / PWM. La frecuencia de 1000 Hz es bastante alta, por lo que la mayoría de gente sensible al parpadeo no debería ver parpadeo o tener fatiga visual. Comparación: 52 % de todos los dispositivos testados no usaron PWM para atenuar el display. Si se usó, medimos una media de 7754 (mínimo: 5 - máxmo: 343500) Hz. | |||
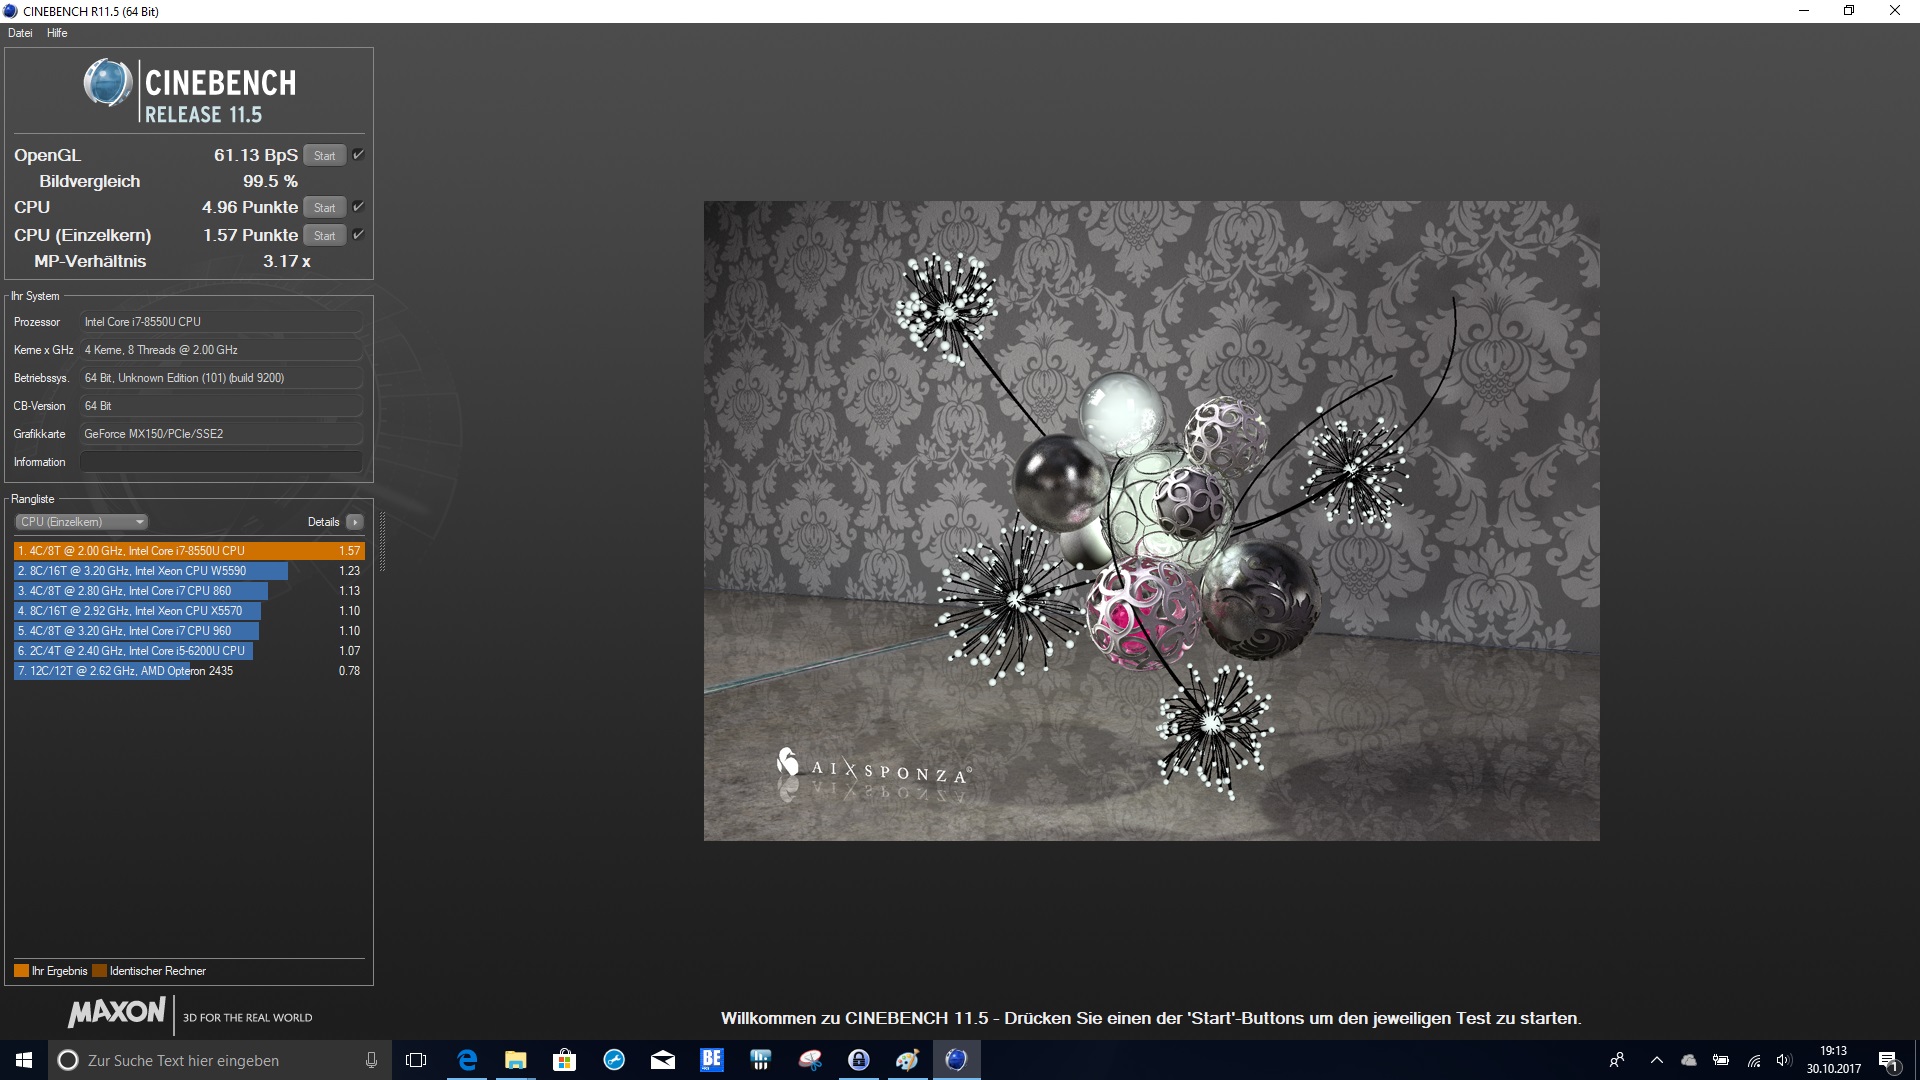
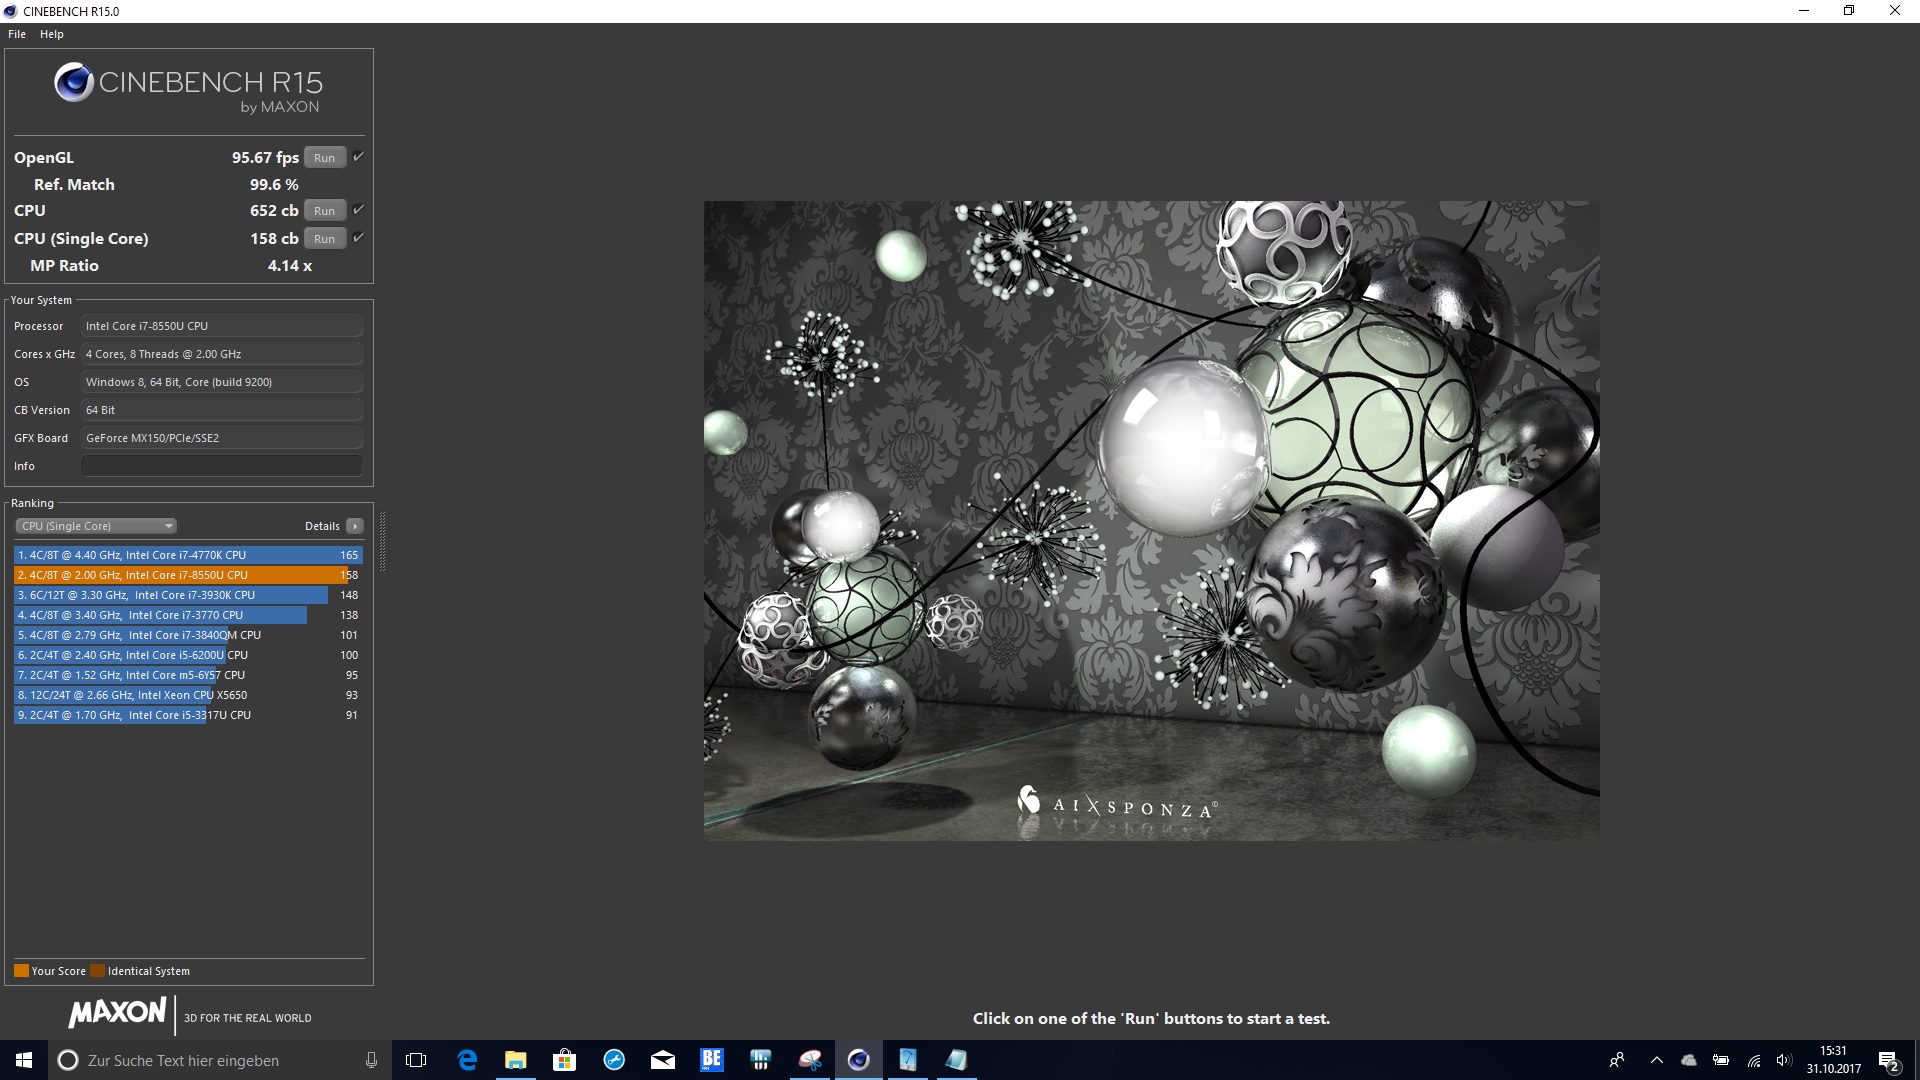
| Cinebench R11.5 | |
| CPU Single 64Bit | |
| Acer Aspire 5 A517-51G-80L | |
| HP Omen 17-w206ng | |
| Dell Inspiron 17-7773-0043 | |
| CPU Multi 64Bit | |
| HP Omen 17-w206ng | |
| Acer Aspire 5 A517-51G-80L | |
| Dell Inspiron 17-7773-0043 | |
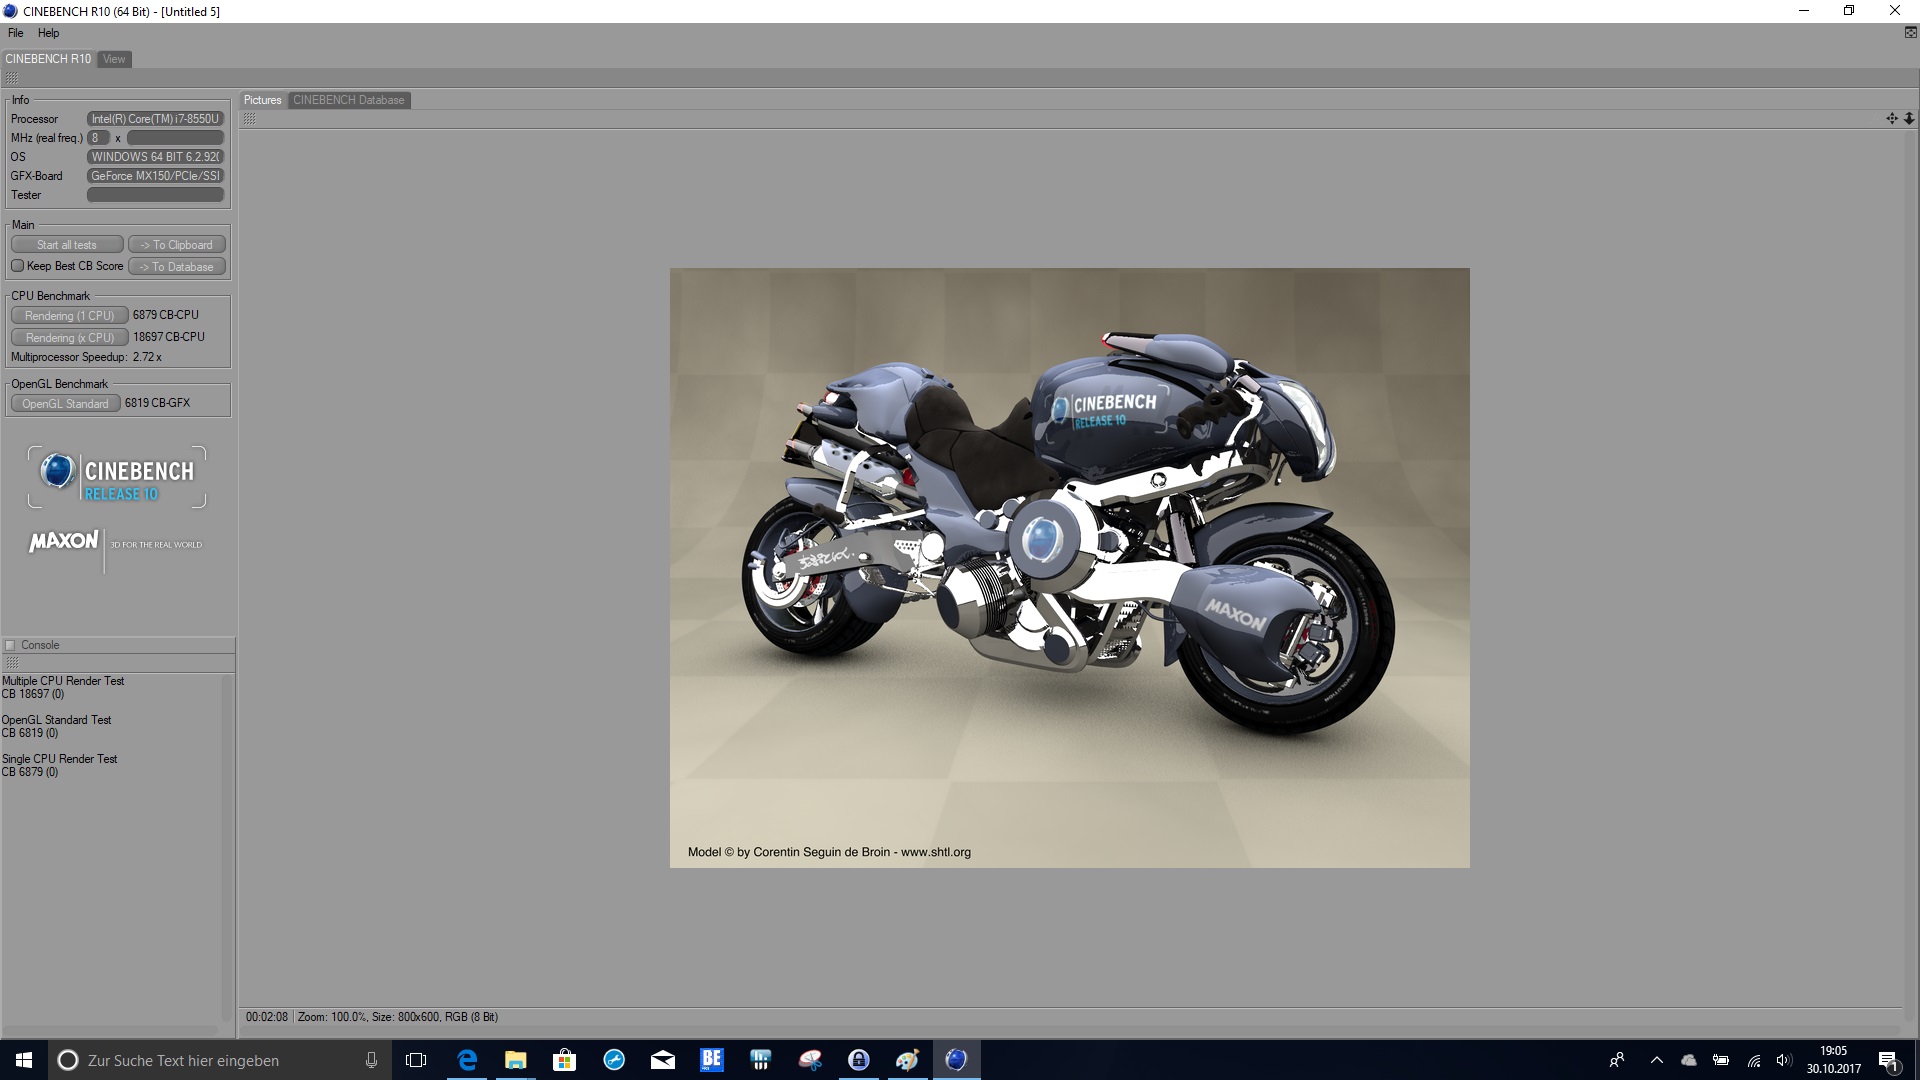
| Cinebench R10 | |
| Rendering Single CPUs 64Bit | |
| Acer Aspire 5 A517-51G-80L | |
| HP Omen 17-w206ng | |
| Dell Inspiron 17-7773-0043 | |
| Rendering Multiple CPUs 64Bit | |
| HP Omen 17-w206ng | |
| Acer Aspire 5 A517-51G-80L | |
| Dell Inspiron 17-7773-0043 | |
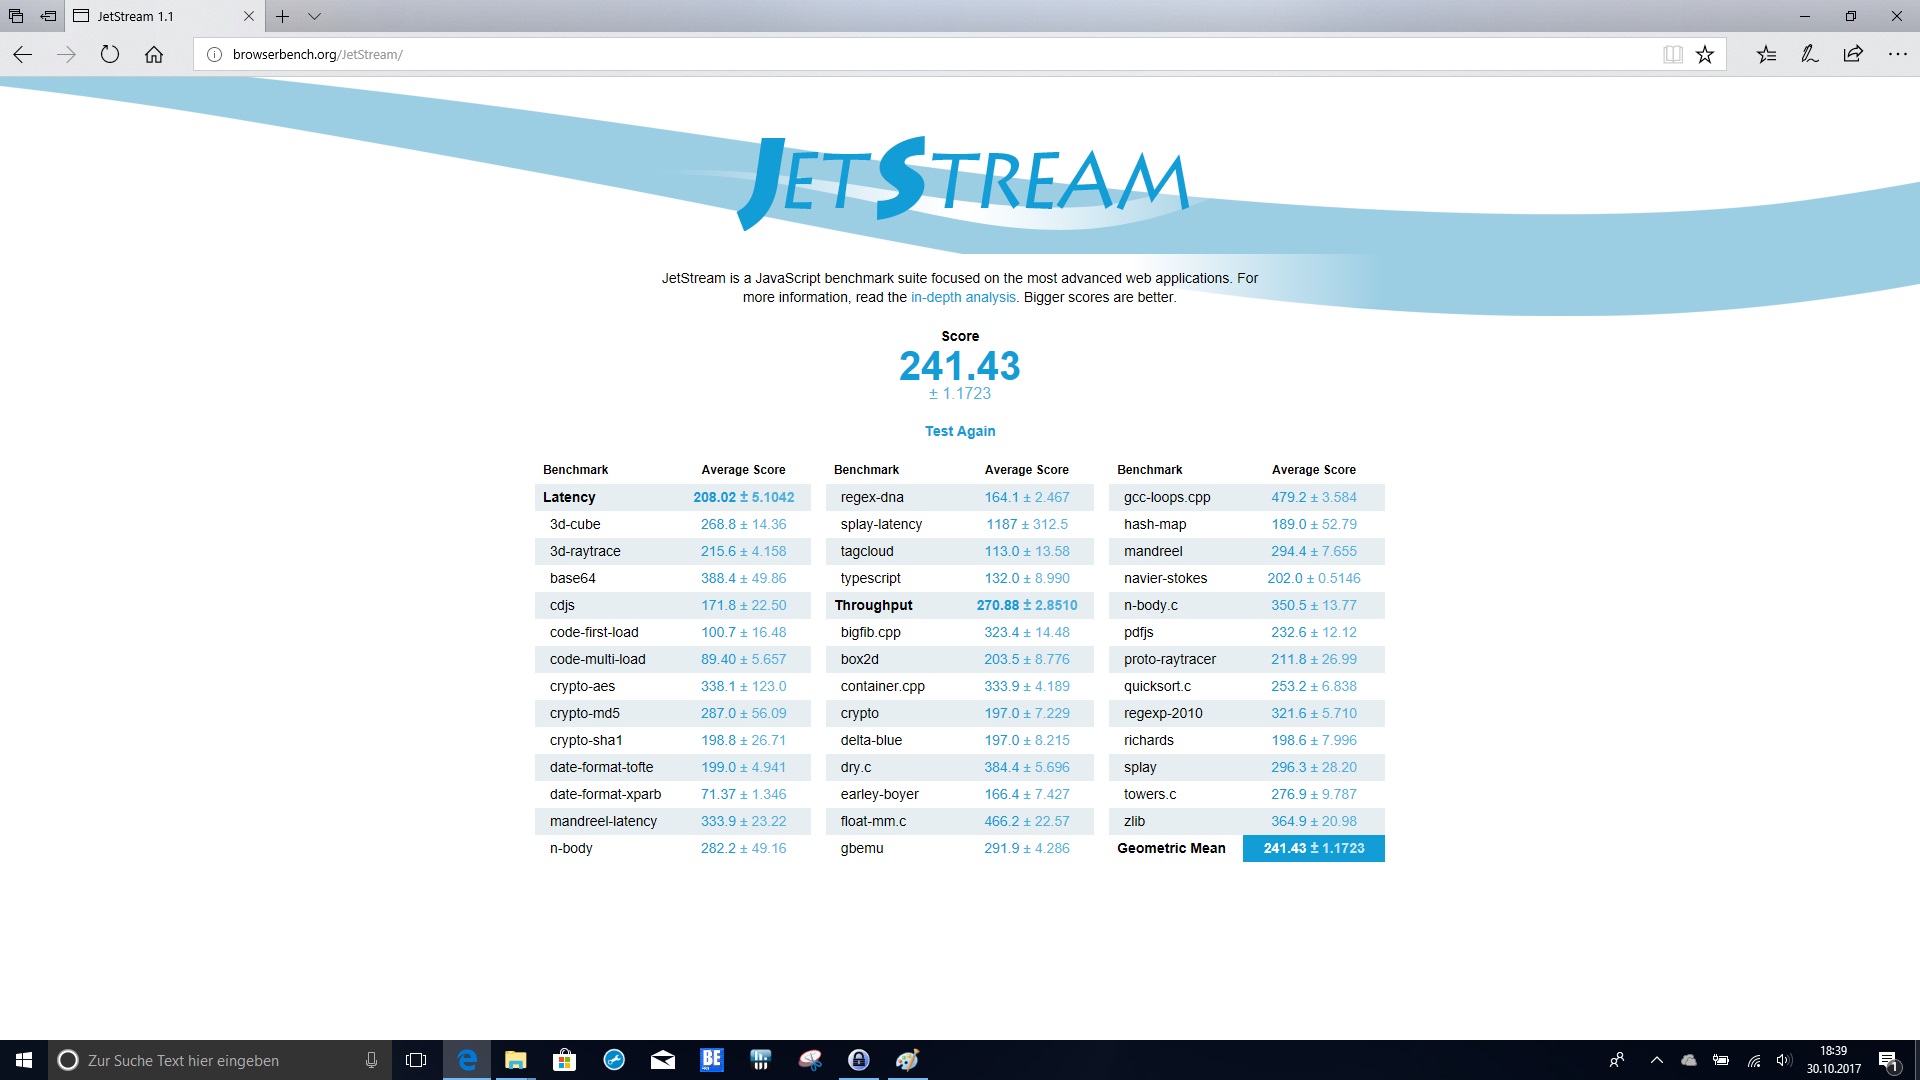
| JetStream 1.1 - 1.1 Total | |
| Acer Aspire 5 A517-51G-80L | |
| HP Omen 17-w206ng | |
| Acer Aspire Nitro BE VN7-793G-5811 | |
| Dell Inspiron 17-7773-0043 | |
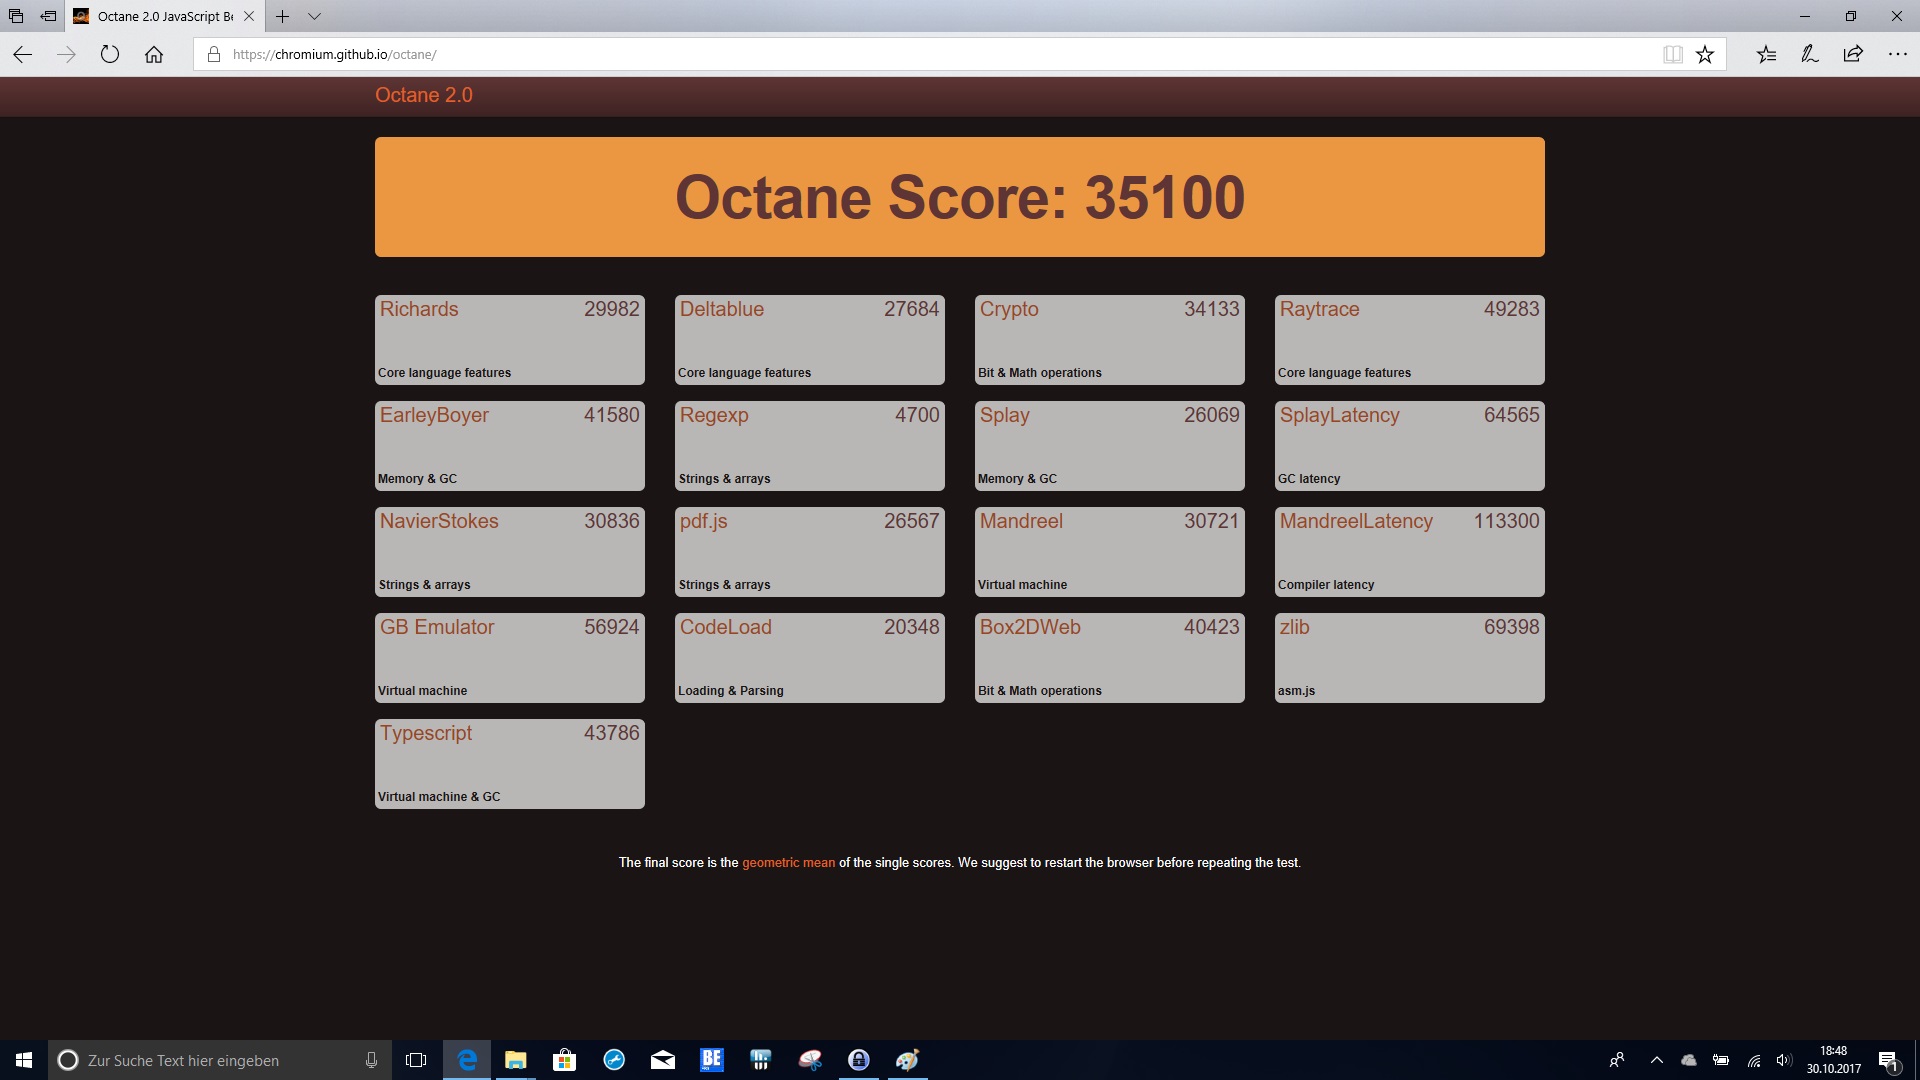
| Octane V2 - Total Score | |
| Acer Aspire 5 A517-51G-80L | |
| Dell Inspiron 17-7773-0043 | |
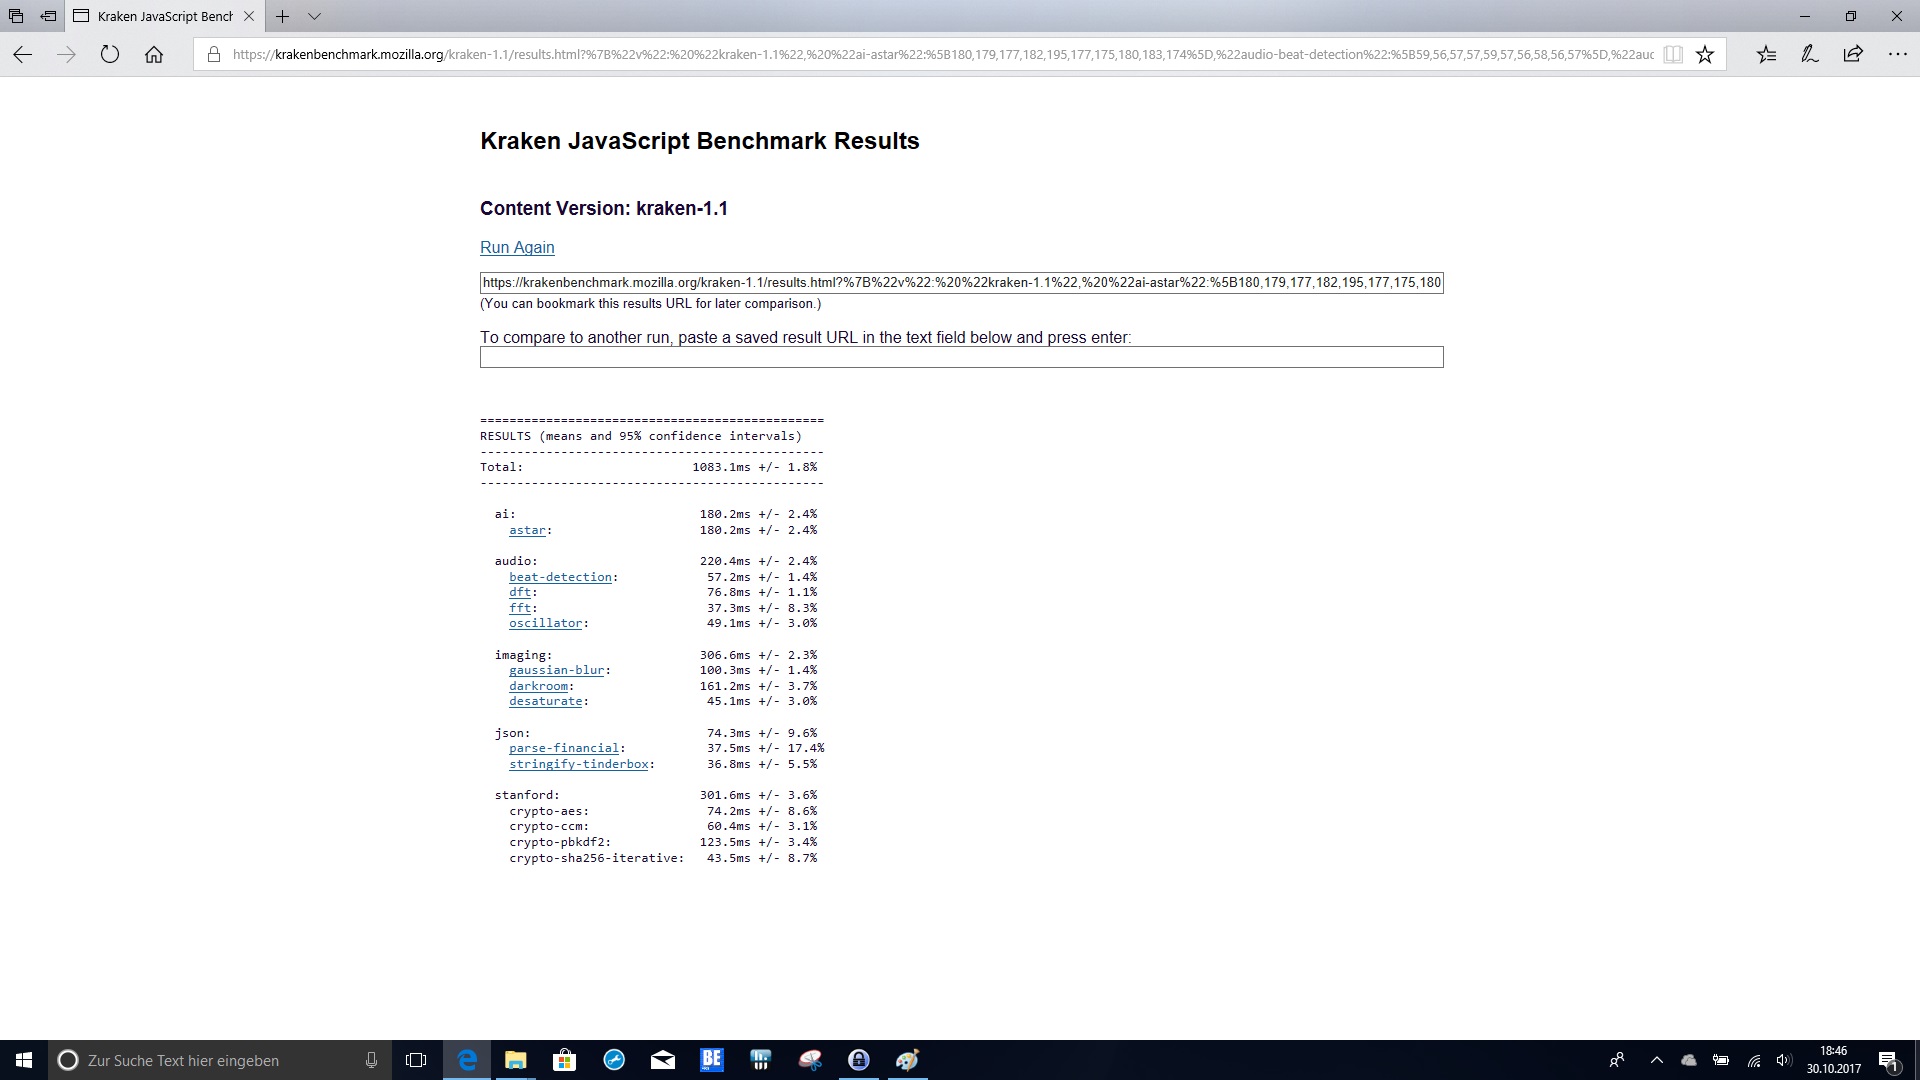
| Mozilla Kraken 1.1 - Total | |
| Dell Inspiron 17-7773-0043 | |
| Acer Aspire 5 A517-51G-80L | |
* ... más pequeño es mejor
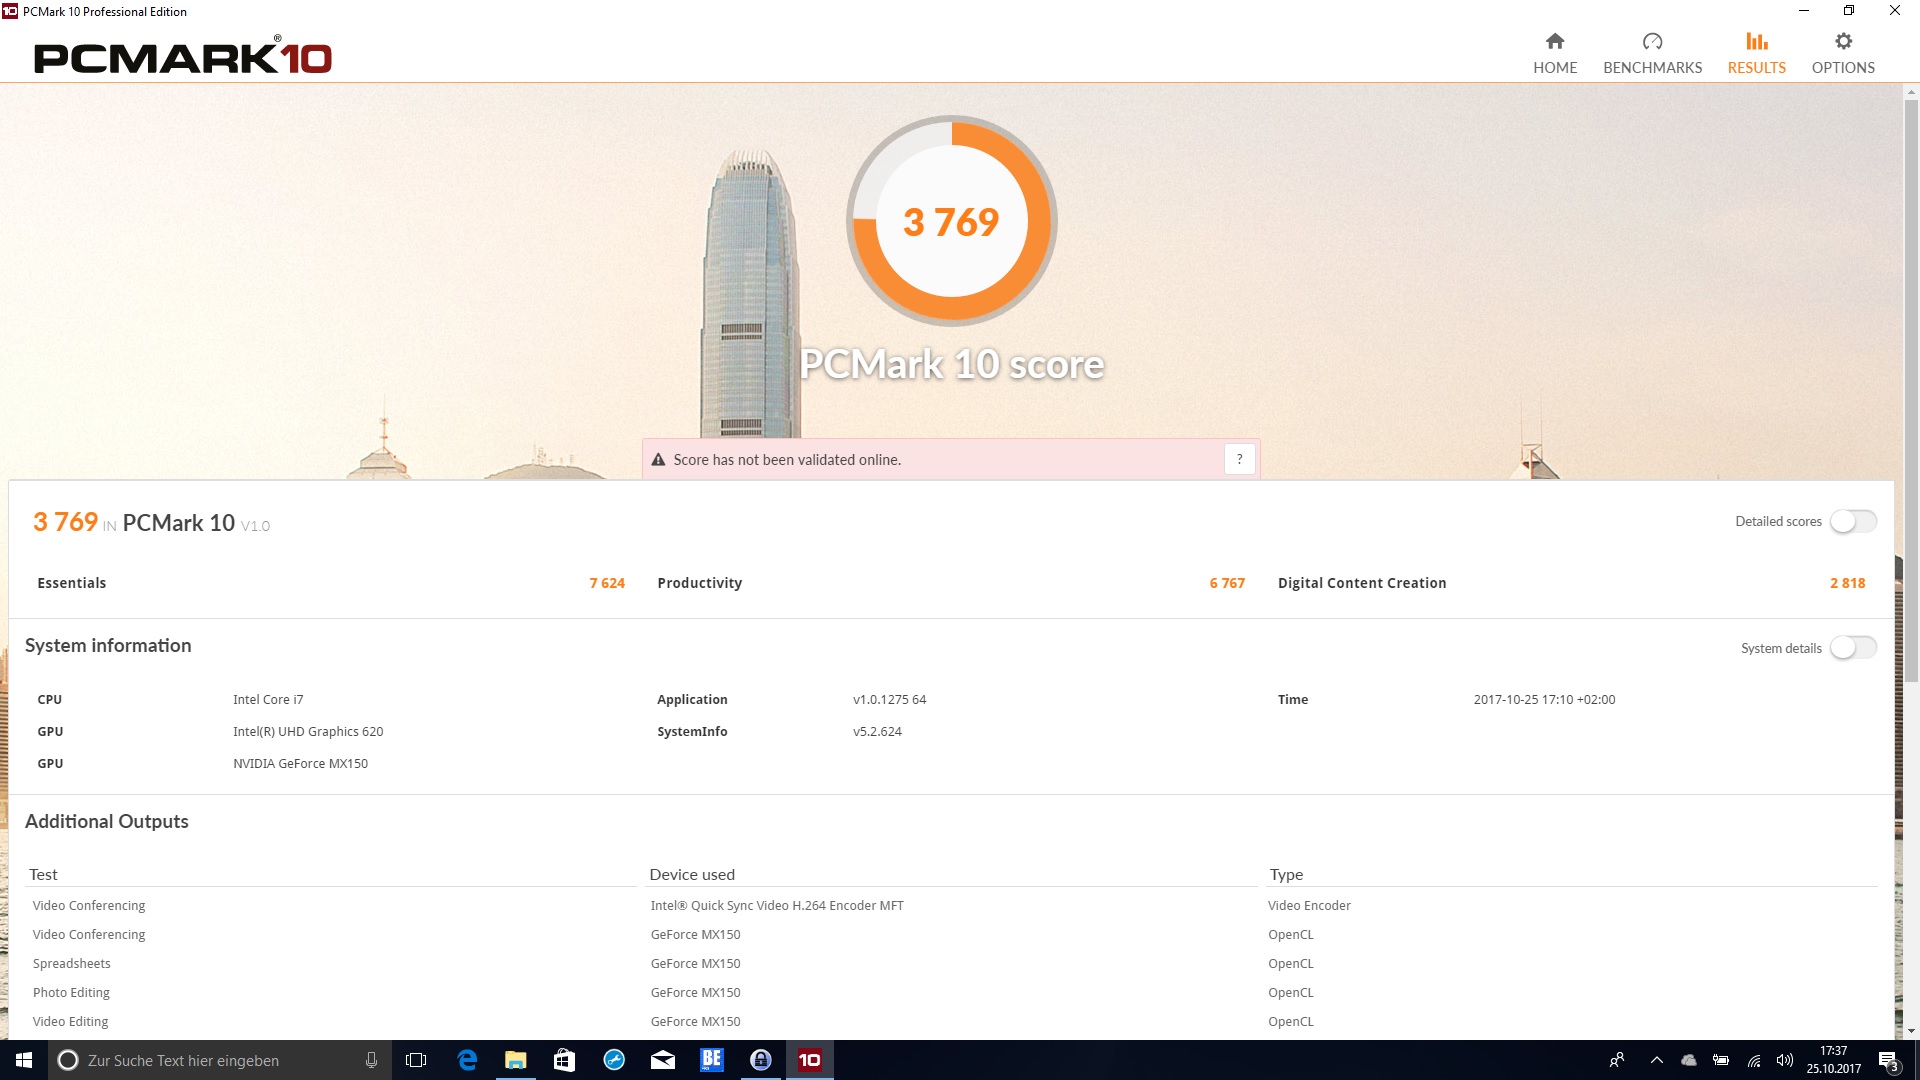
| PCMark 10 | |
| Score | |
| Acer Aspire 5 A517-51G-80L | |
| Dell Inspiron 17-7773-0043 | |
| Productivity | |
| Acer Aspire 5 A517-51G-80L | |
| Dell Inspiron 17-7773-0043 | |
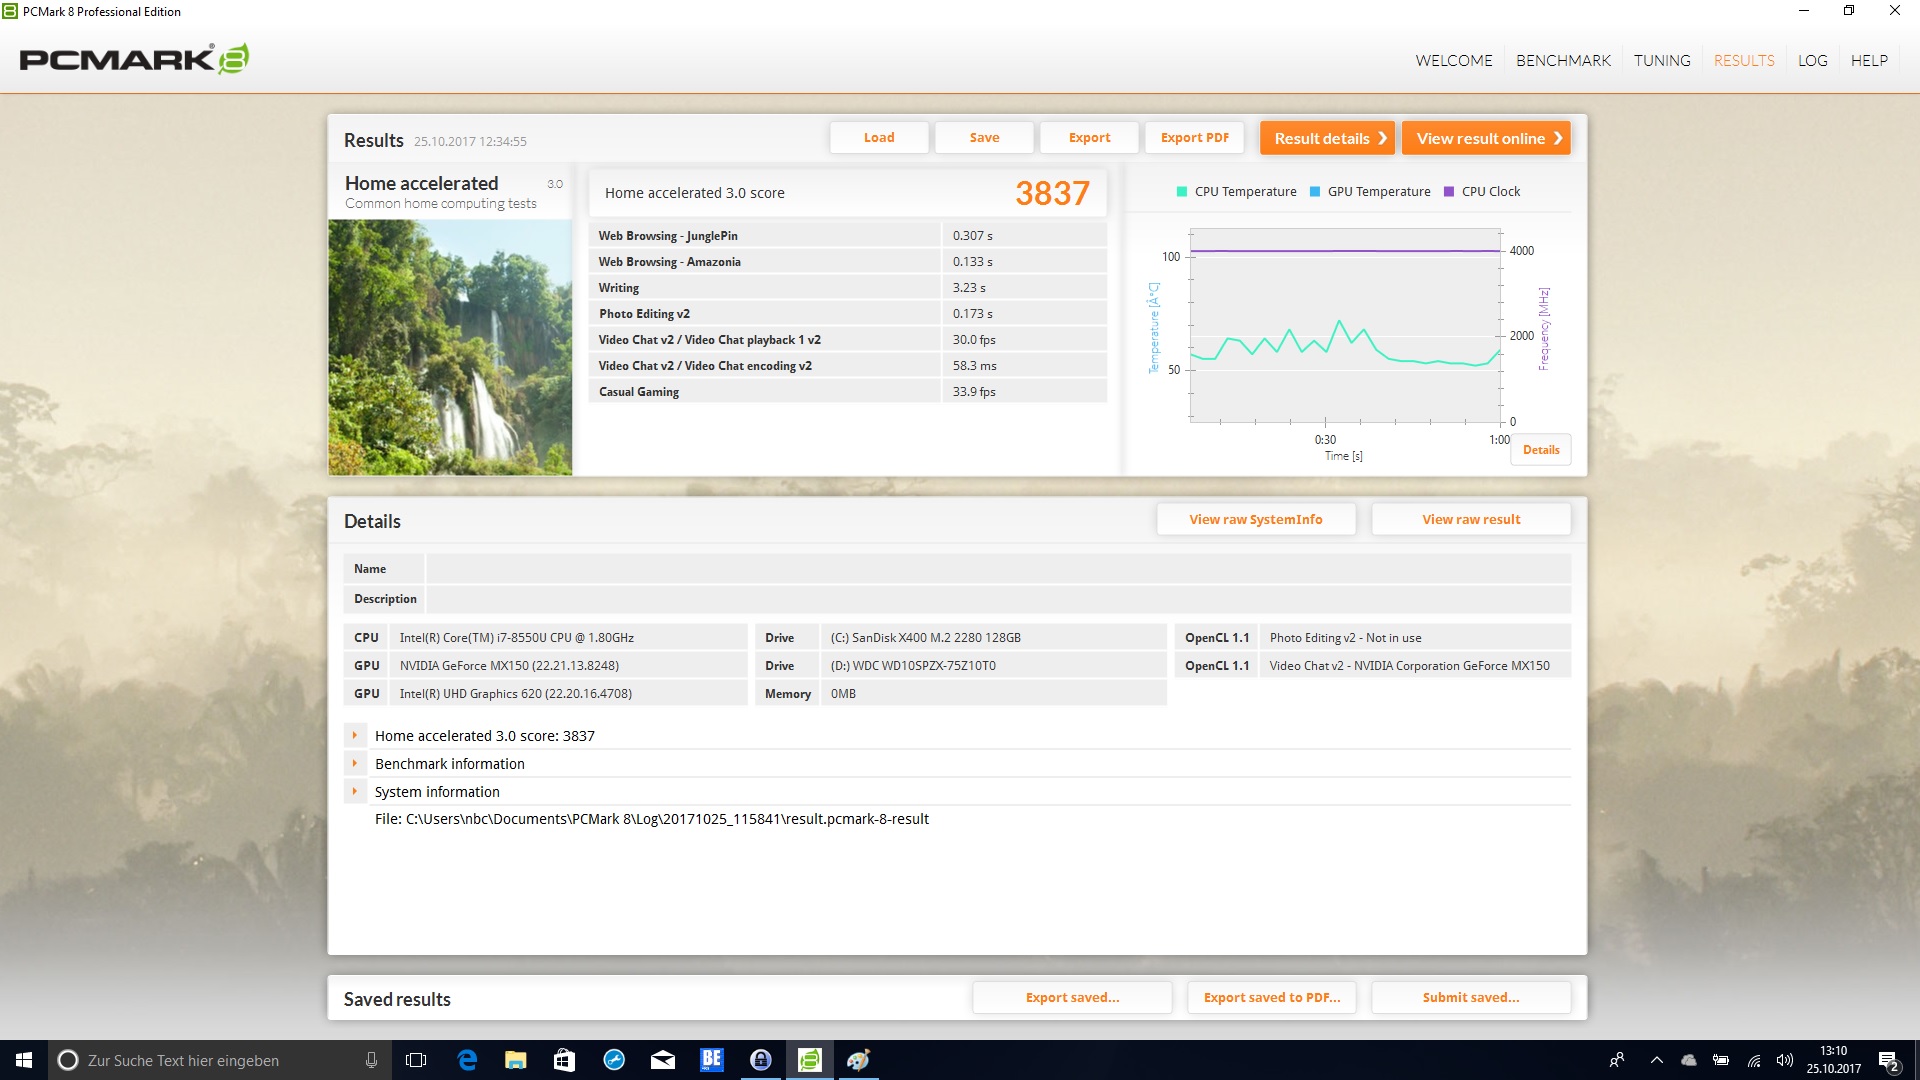
| PCMark 8 Home Score Accelerated v2 | 3837 puntos | |
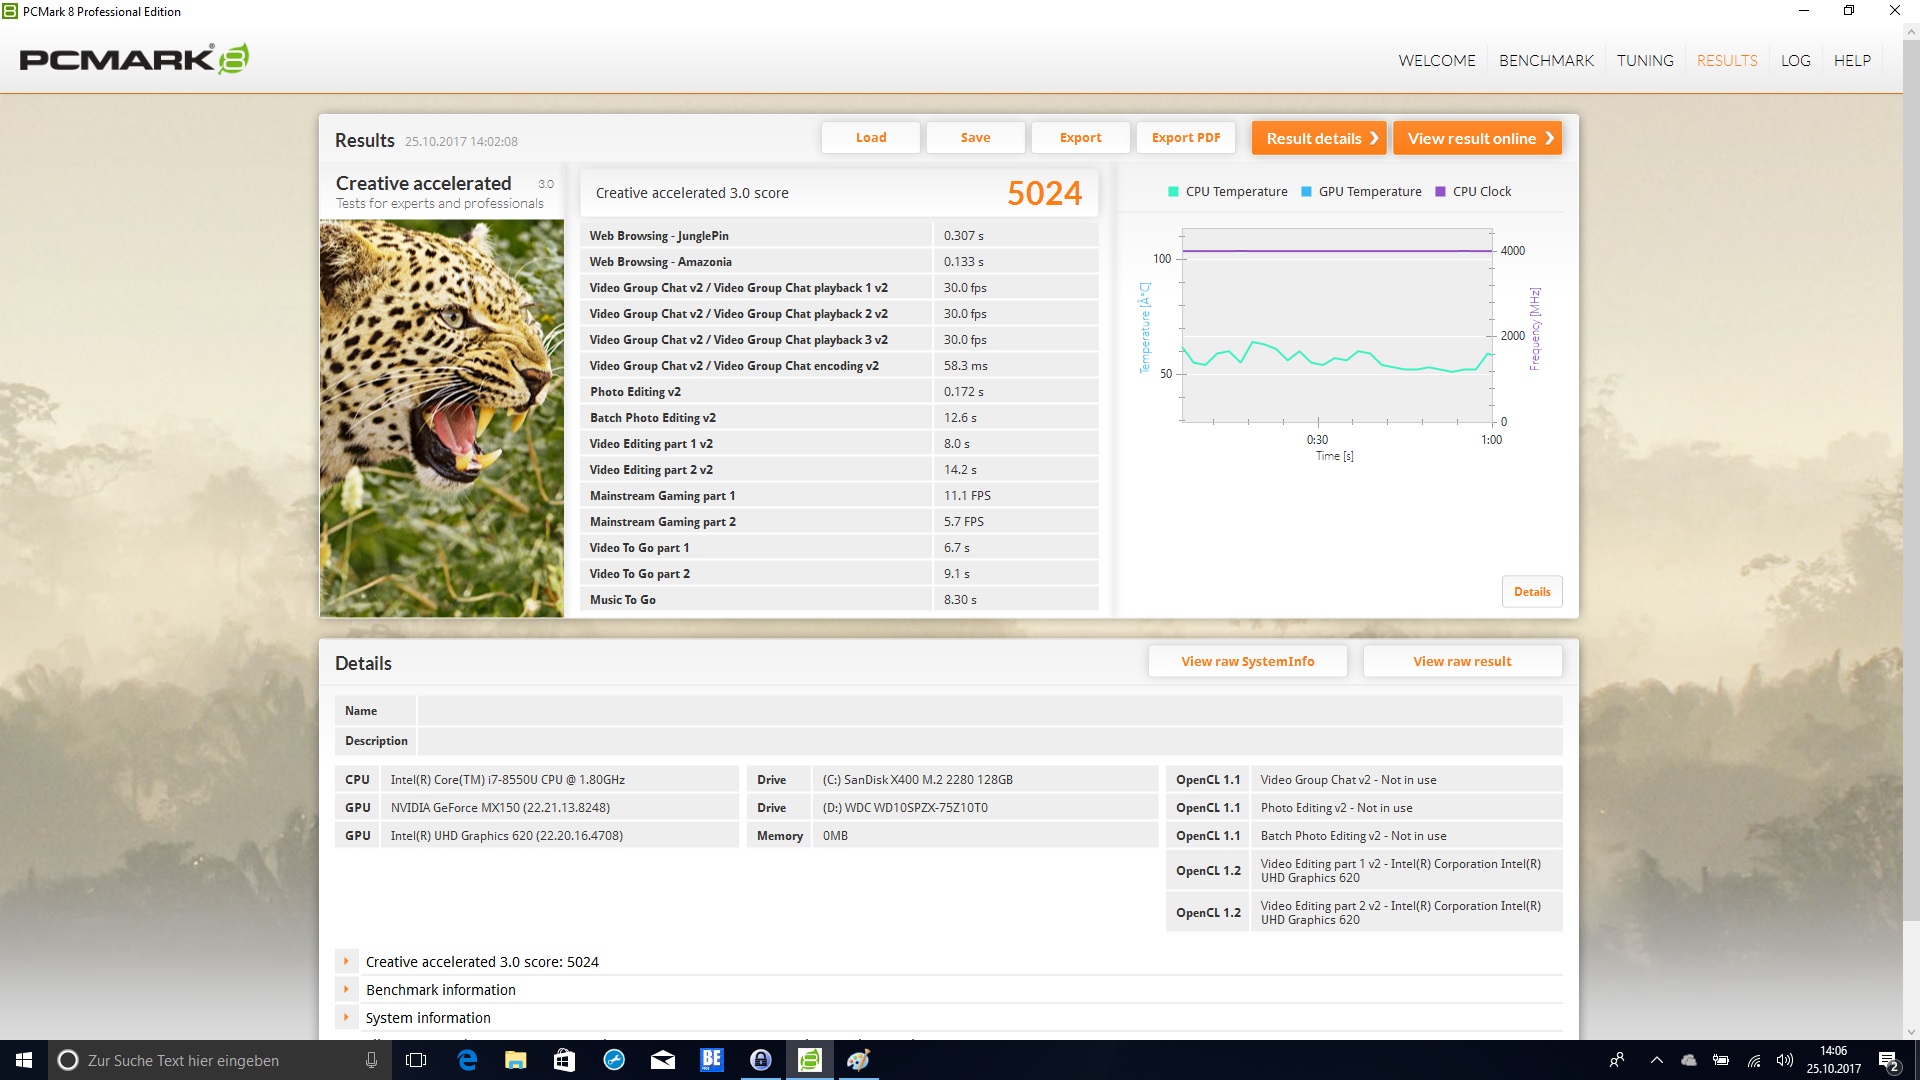
| PCMark 8 Creative Score Accelerated v2 | 5024 puntos | |
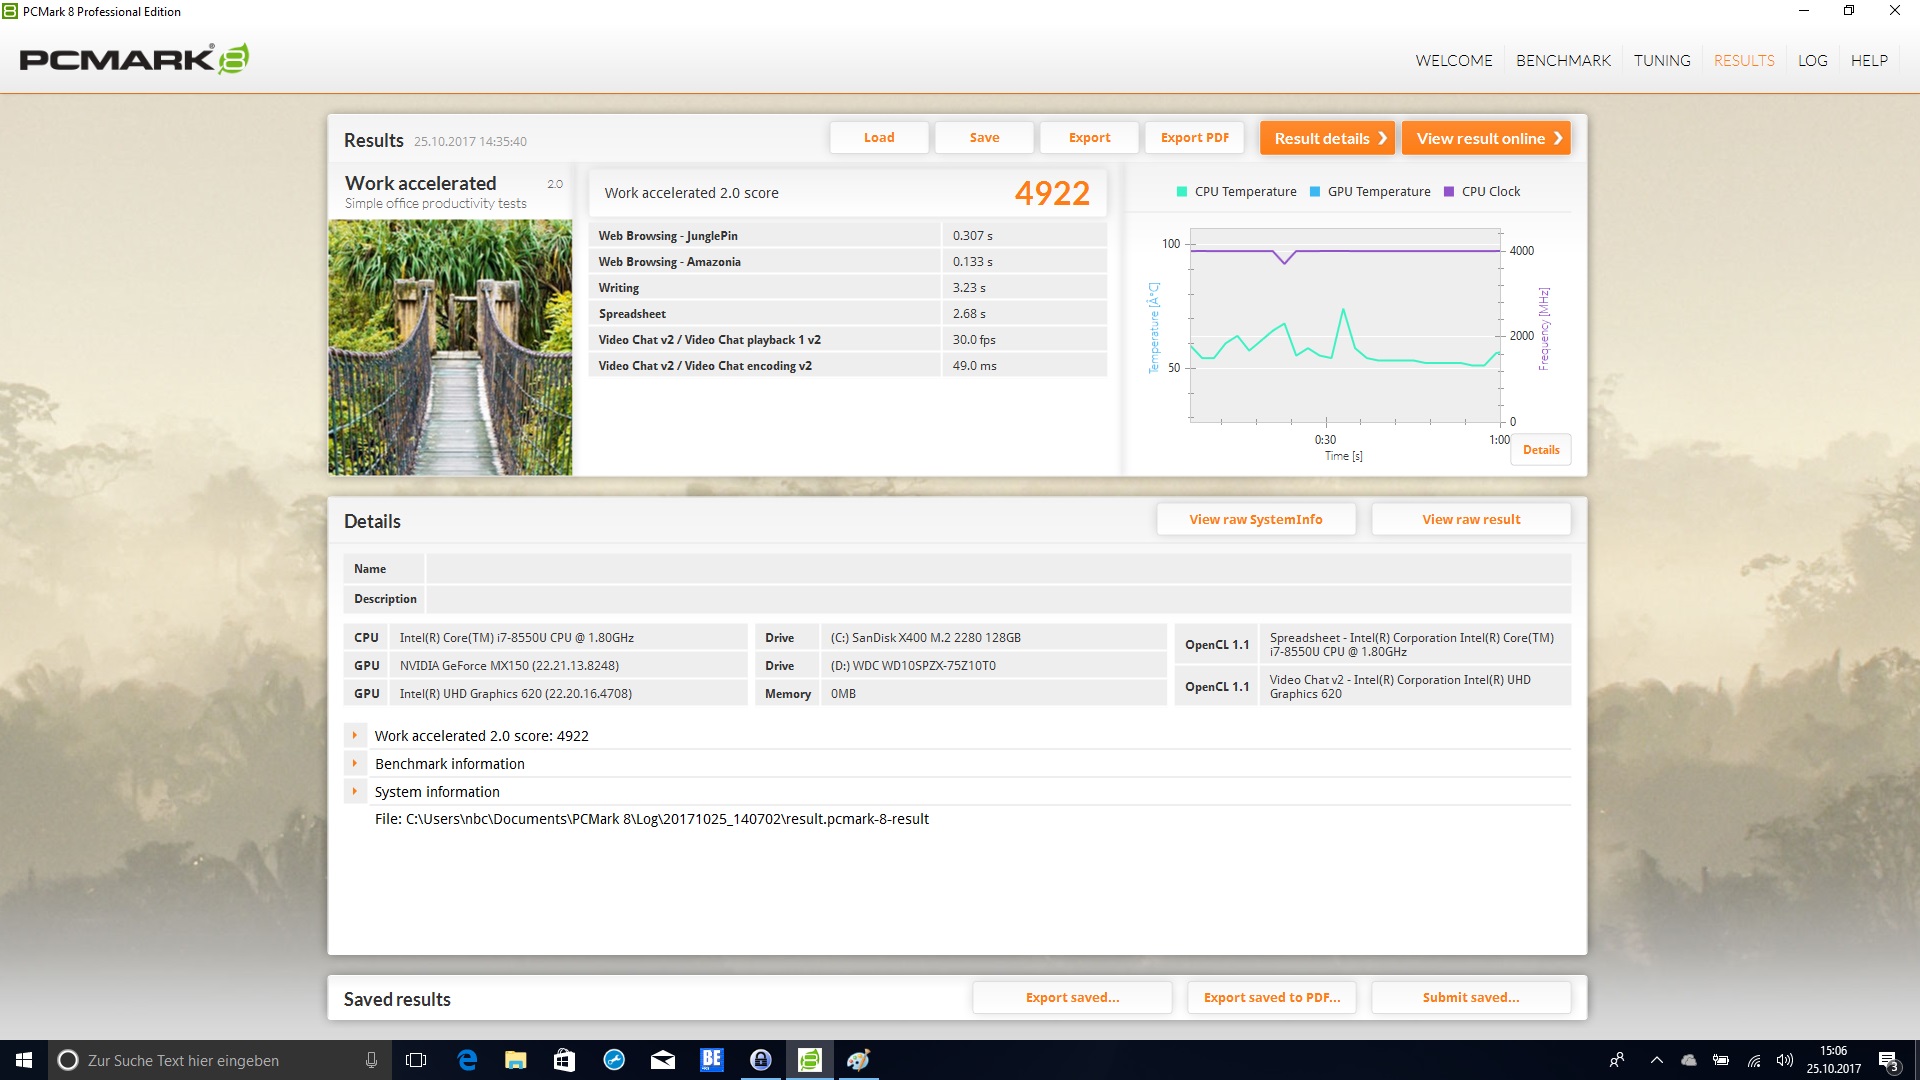
| PCMark 8 Work Score Accelerated v2 | 4922 puntos | |
| PCMark 10 Score | 3769 puntos | |
ayuda | ||
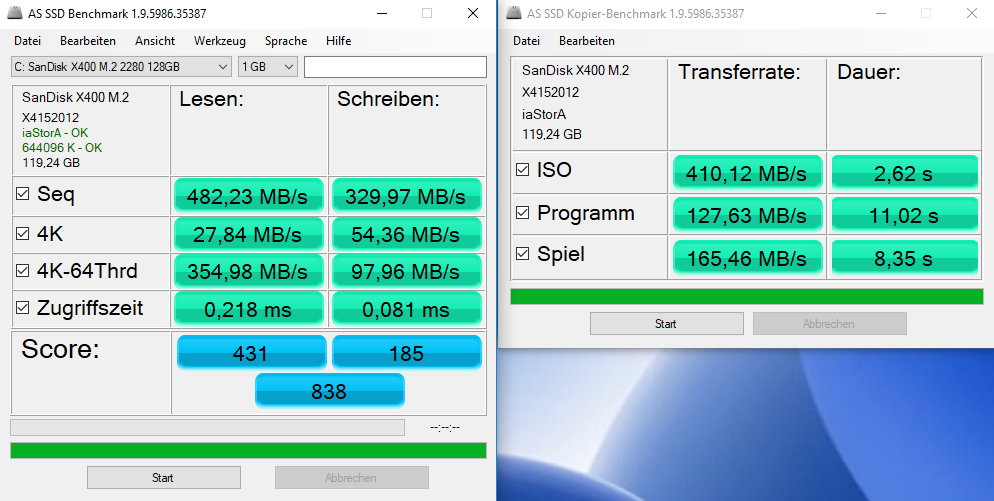
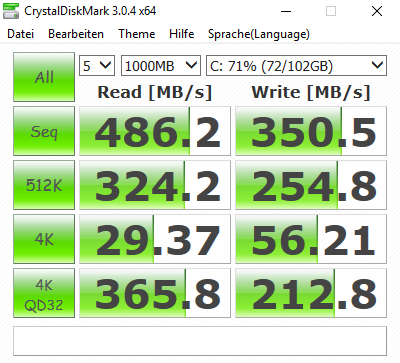
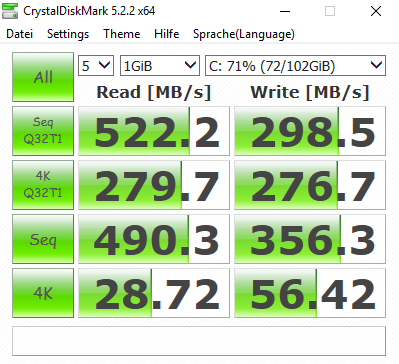
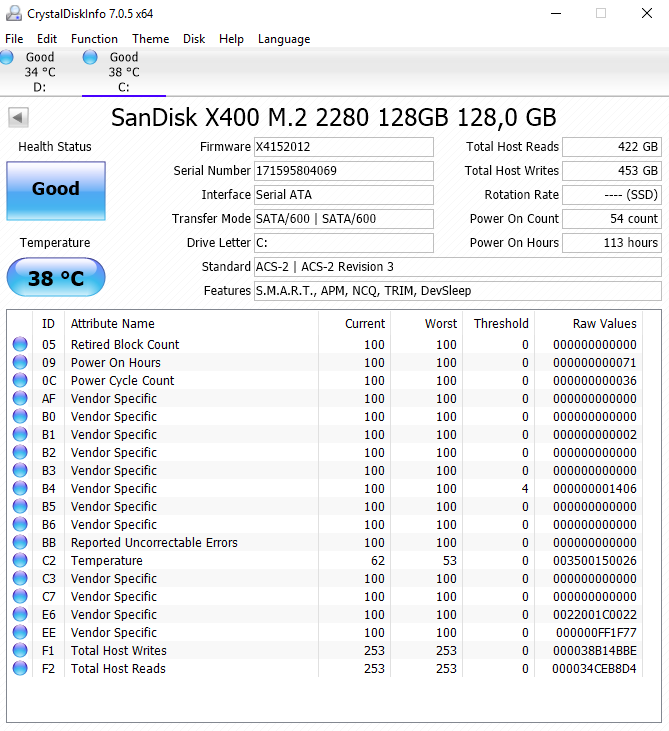
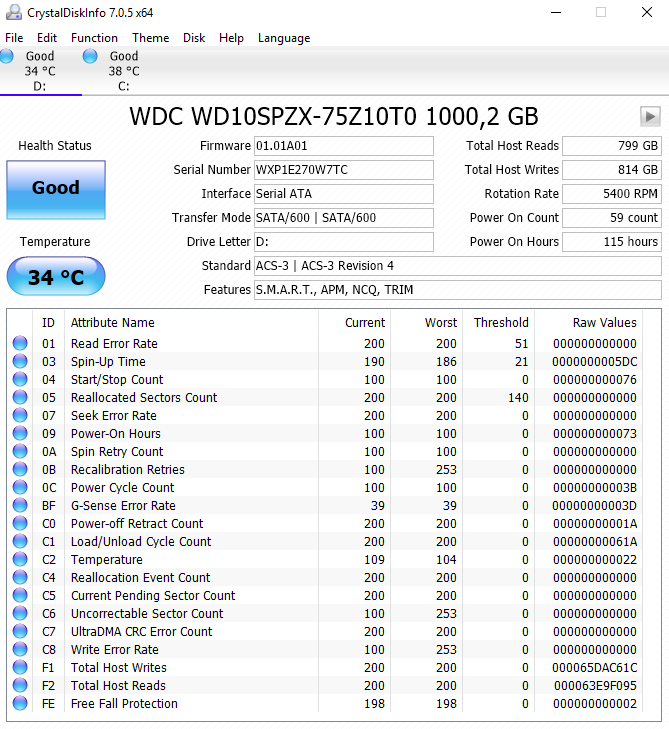
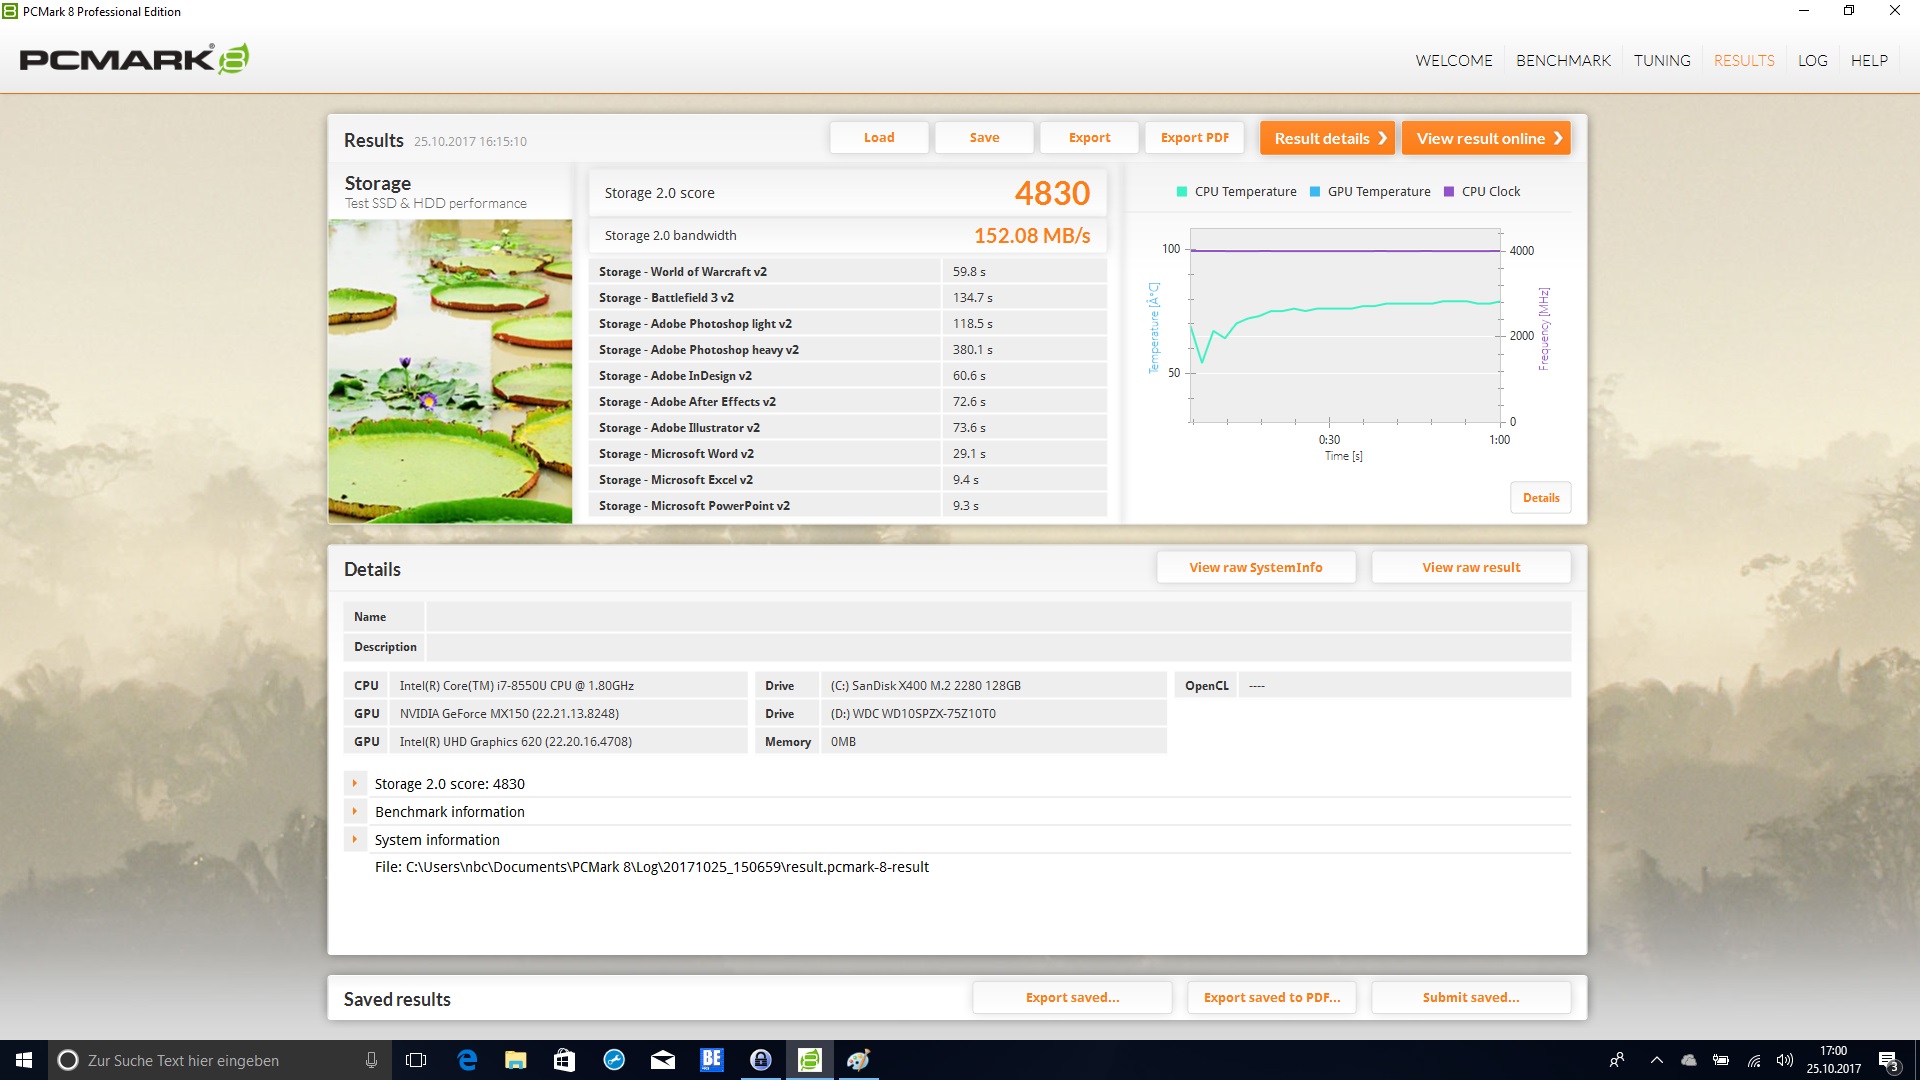
| Dell Inspiron 17-7773-0043 SanDisk X400 M.2 2280 128GB | Dell Inspiron 17 7778 Liteonit CV3-CE512 | Acer Aspire 5 A517-51G-80L Micron 1100 MTFDDAV256TBN | Acer Aspire Nitro BE VN7-793G-5811 Seagate Mobile HDD 1TB ST1000LM035 | HP Omen 17-w206ng Samsung PM961 MZVLW256HEHP | Acer Aspire 7 A717-71G-72VY Toshiba MQ01ABD100 | |
|---|---|---|---|---|---|---|
| CrystalDiskMark 3.0 | 13% | 5% | -86% | 165% | -91% | |
| Read Seq (MB/s) | 486.2 | 486.4 0% | 480.1 -1% | 117.6 -76% | 1606 230% | 108.7 -78% |
| Write Seq (MB/s) | 350.5 | 438.4 25% | 385.6 10% | 109.1 -69% | 1176 236% | 100.7 -71% |
| Read 512 (MB/s) | 324.2 | 232.8 -28% | 295.6 -9% | 39.93 -88% | 846 161% | 29.74 -91% |
| Write 512 (MB/s) | 254.8 | 386.7 52% | 302.5 19% | 98.6 -61% | 805 216% | 28.06 -89% |
| Read 4k (MB/s) | 29.37 | 32.3 10% | 27.58 -6% | 0.435 -99% | 59.9 104% | 0.345 -99% |
| Write 4k (MB/s) | 56.2 | 65.8 17% | 81.4 45% | 3.152 -94% | 155.6 177% | 0.78 -99% |
| Read 4k QD32 (MB/s) | 365.8 | 334.4 -9% | 247.4 -32% | 1.008 -100% | 588 61% | 0.688 -100% |
| Write 4k QD32 (MB/s) | 212.8 | 289.5 36% | 237.7 12% | 4.705 -98% | 505 137% | 0.767 -100% |

| 3DMark | |
| 1280x720 Cloud Gate Standard Graphics | |
| Acer Aspire 7 A717-71G-72VY | |
| Acer Aspire Nitro BE VN7-793G-5811 | |
| Dell Inspiron 17-7773-0043 | |
| Acer Aspire 5 A517-51G-80L | |
| Dell Inspiron 17 7778 | |
| 1920x1080 Fire Strike Graphics | |
| Acer Aspire 7 A717-71G-72VY | |
| Acer Aspire Nitro BE VN7-793G-5811 | |
| Acer Aspire 5 A517-51G-80L | |
| Dell Inspiron 17-7773-0043 | |
| Dell Inspiron 17 7778 | |
| 3DMark 11 - 1280x720 Performance GPU | |
| Acer Aspire 7 A717-71G-72VY | |
| Acer Aspire Nitro BE VN7-793G-5811 | |
| HP Omen 17-w206ng | |
| Acer Aspire 5 A517-51G-80L | |
| Dell Inspiron 17-7773-0043 | |
| Dell Inspiron 17 7778 | |
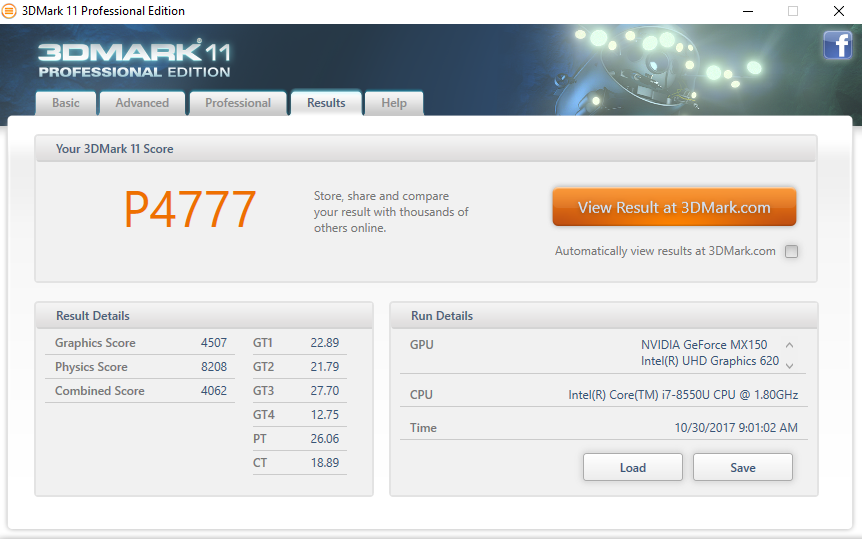
| 3DMark 11 Performance | 4777 puntos | |
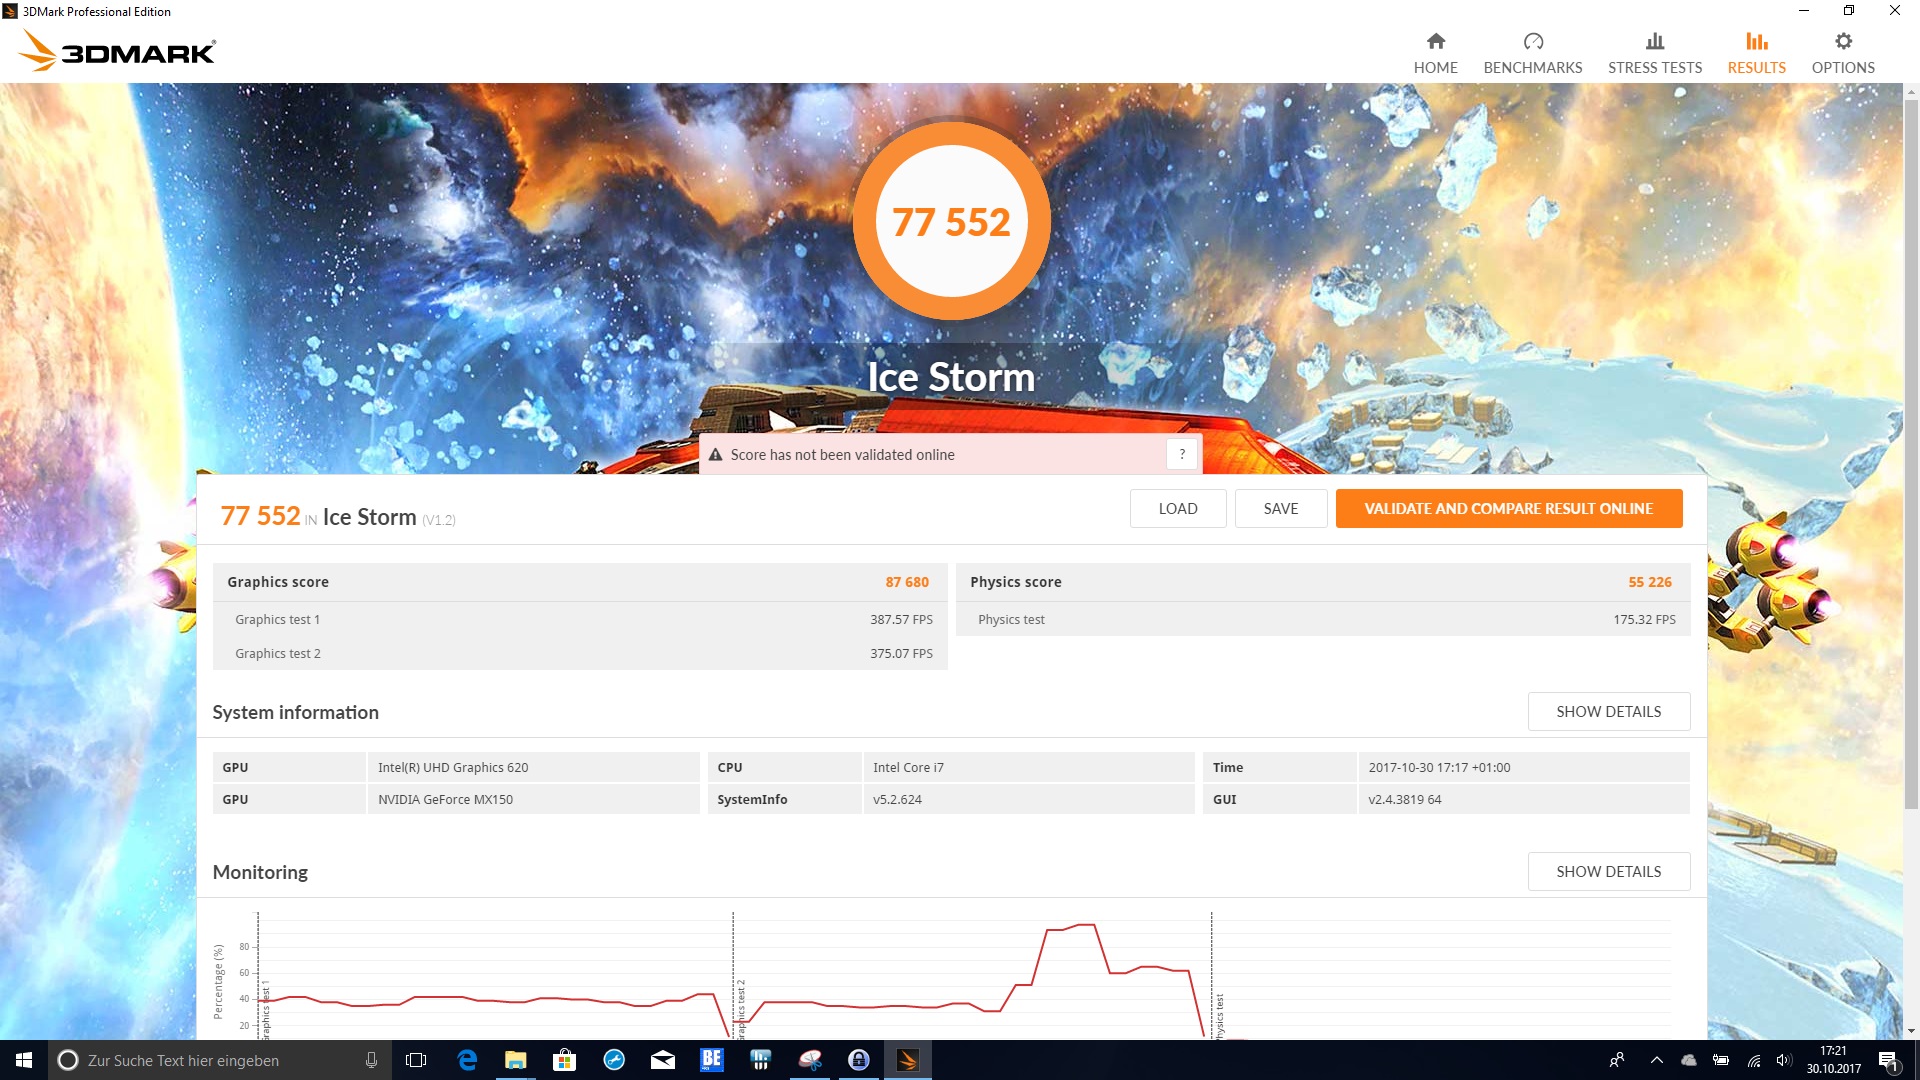
| 3DMark Ice Storm Standard Score | 77552 puntos | |
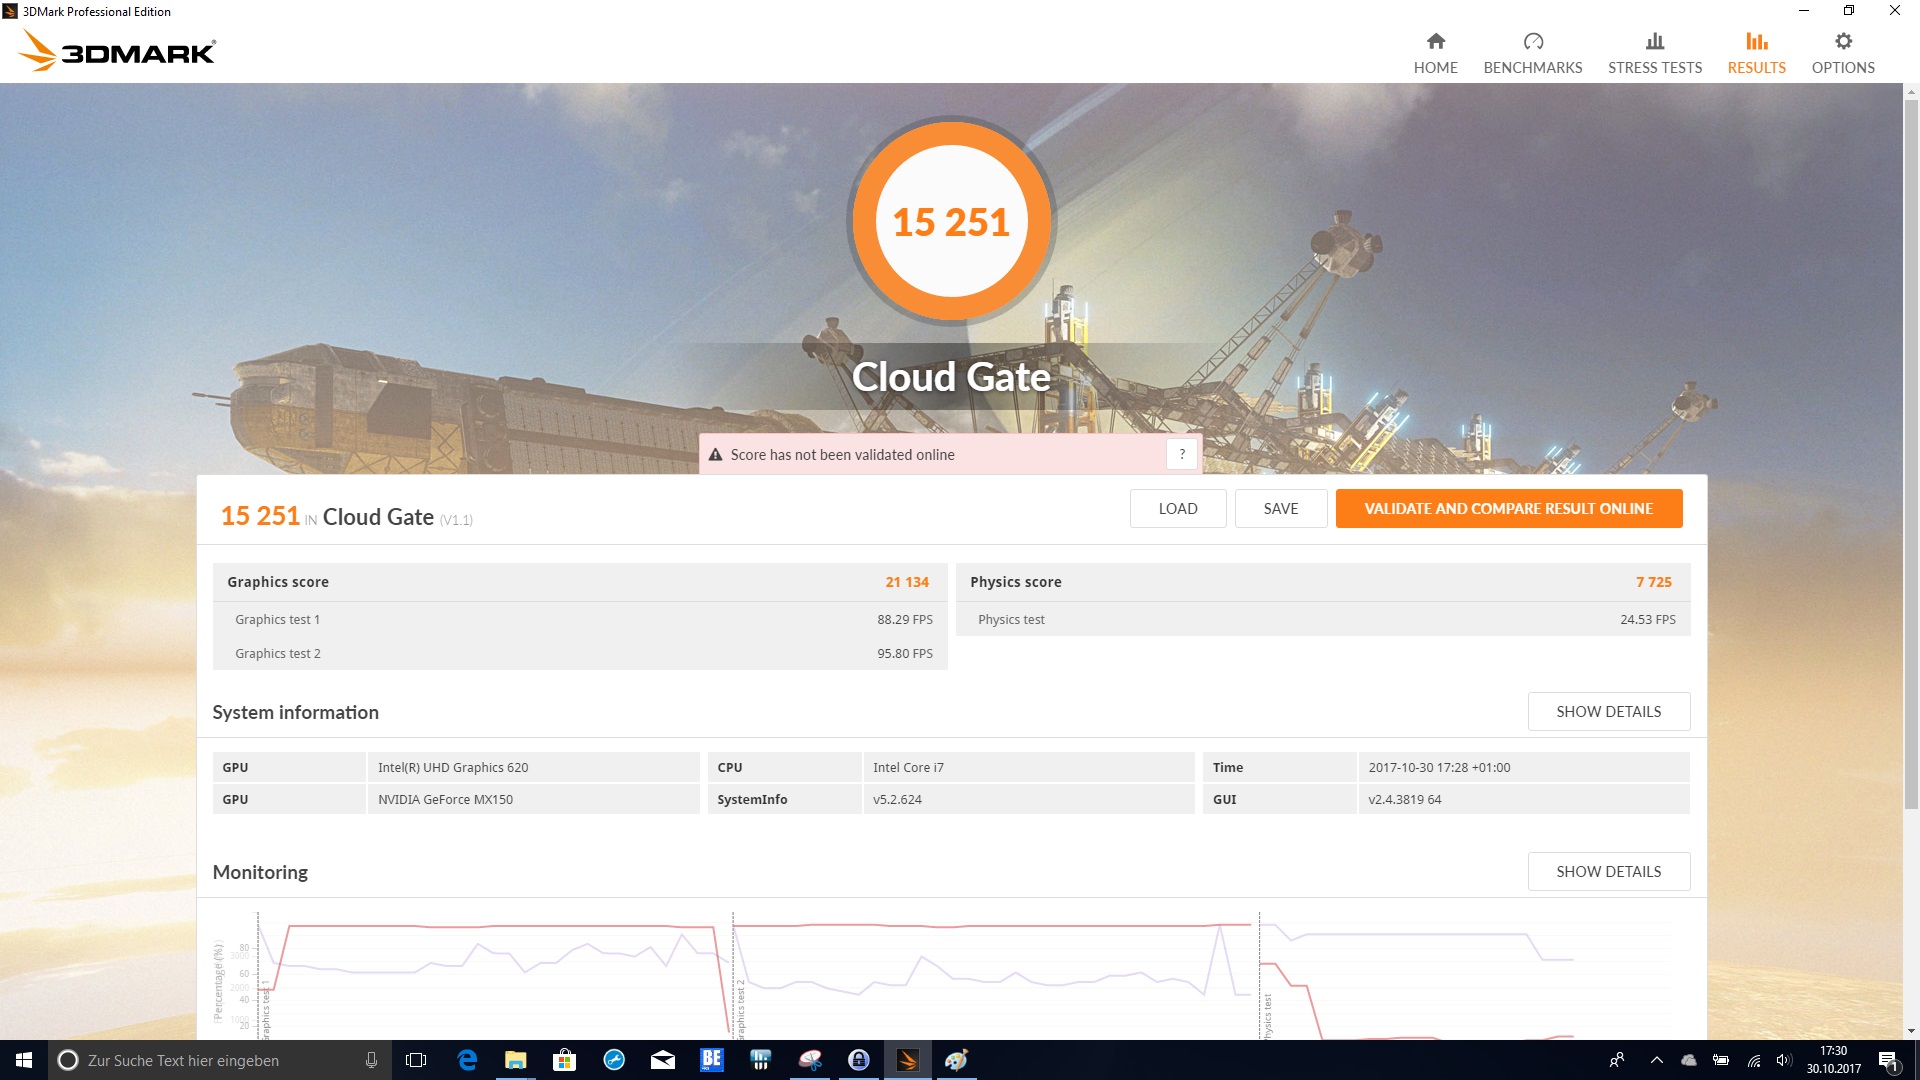
| 3DMark Cloud Gate Standard Score | 15251 puntos | |
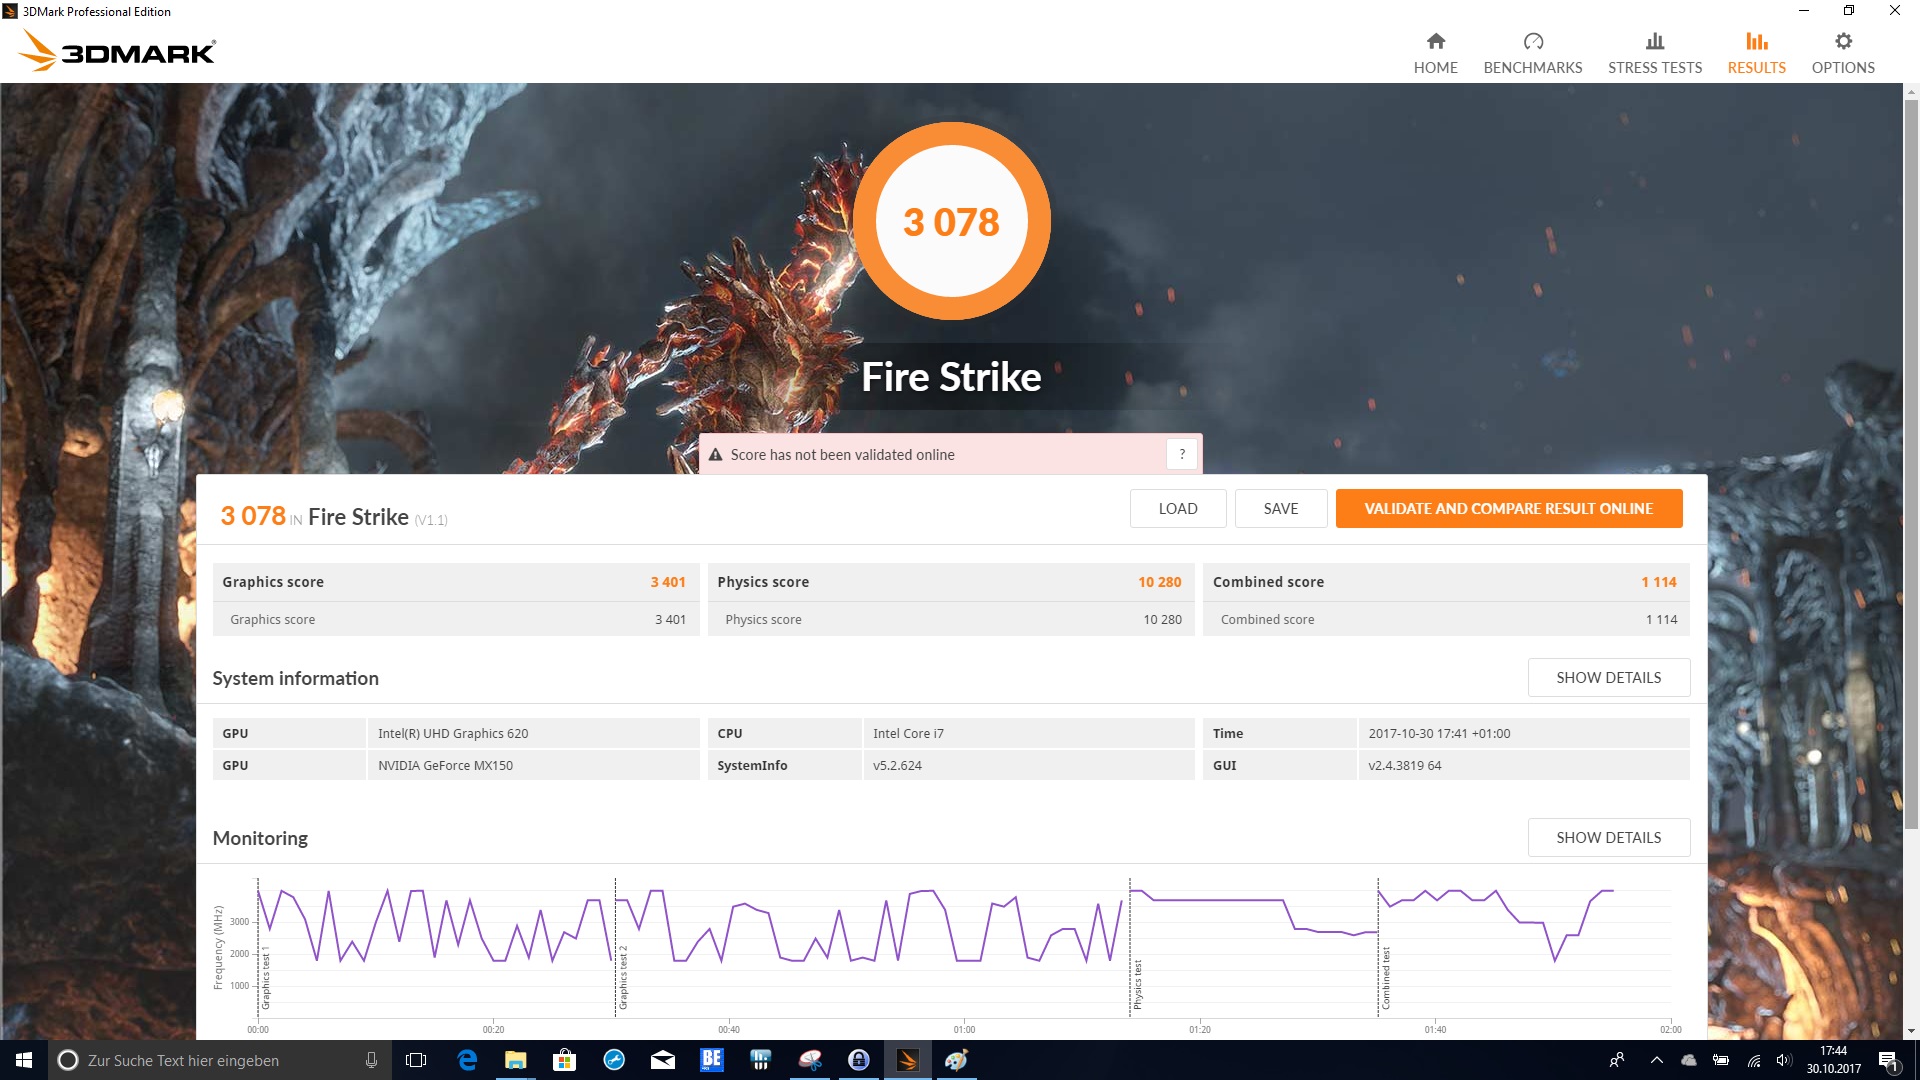
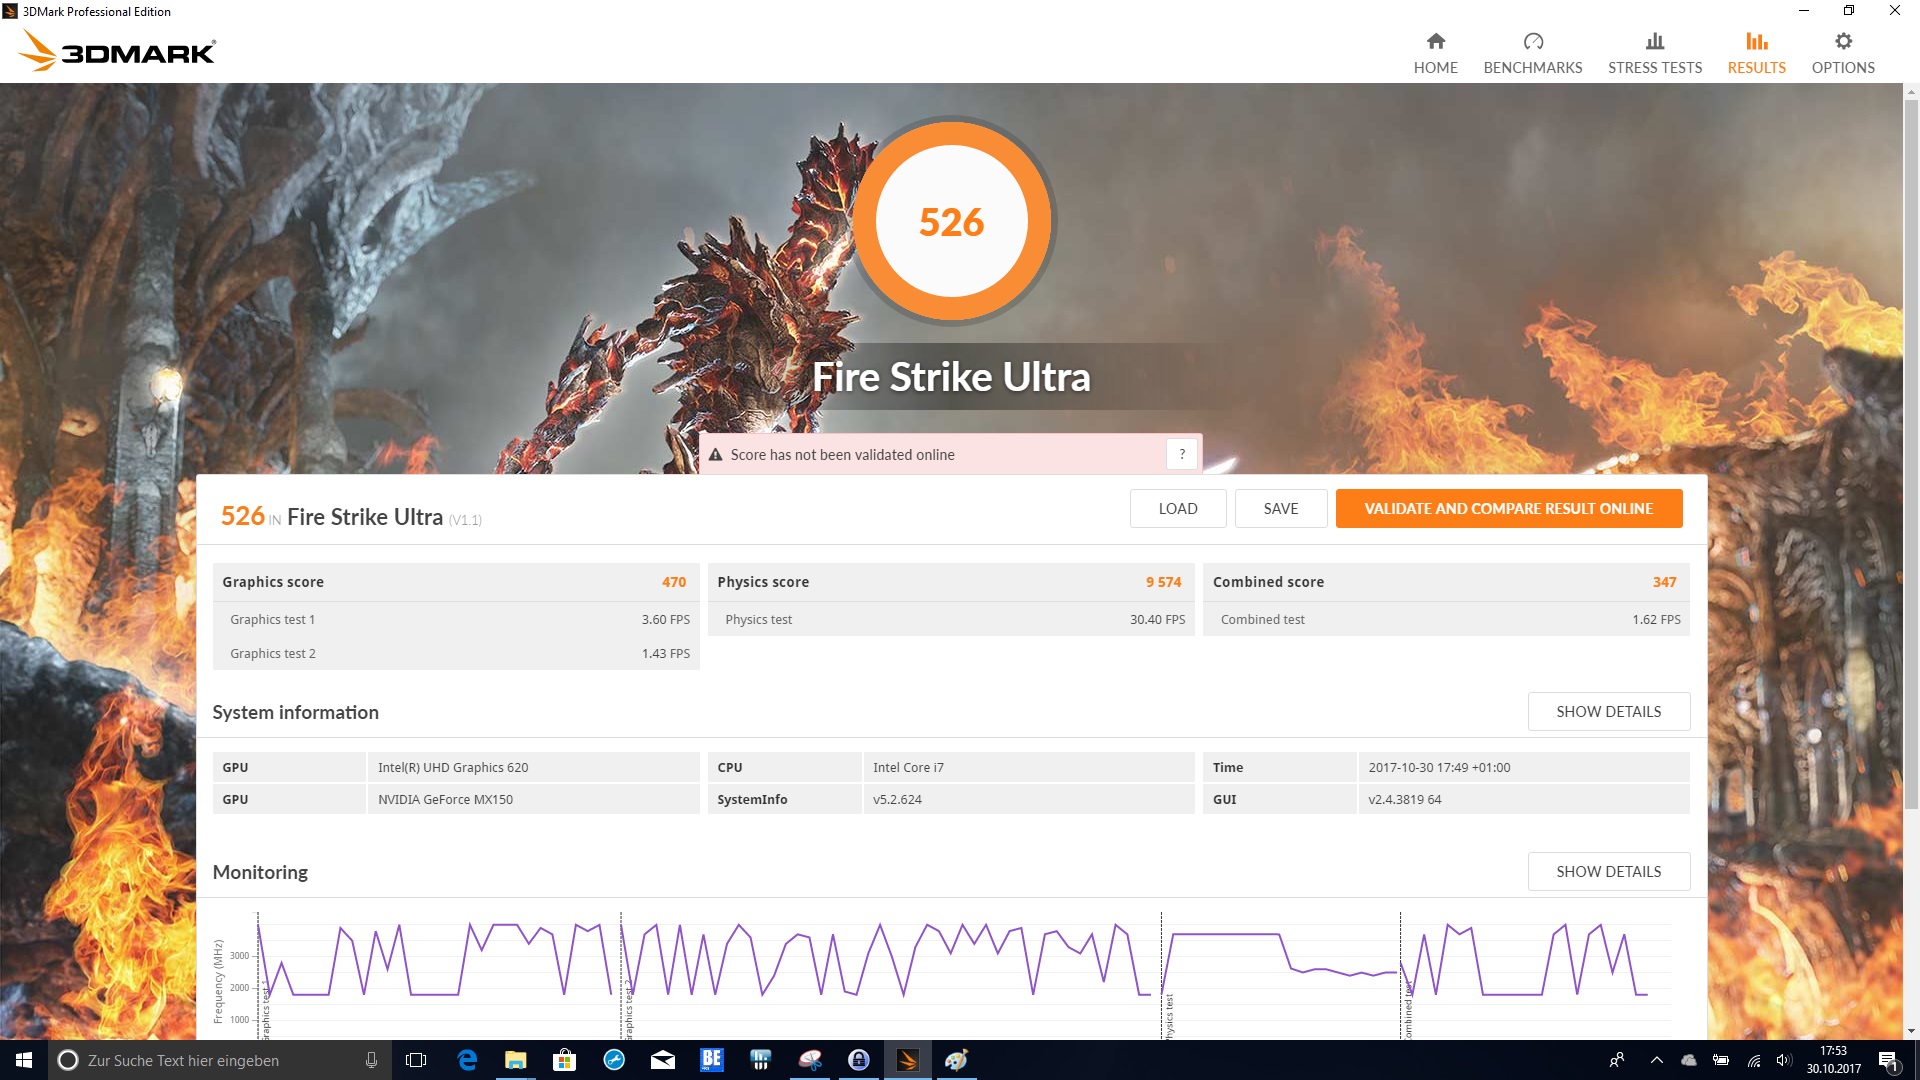
| 3DMark Fire Strike Score | 3078 puntos | |
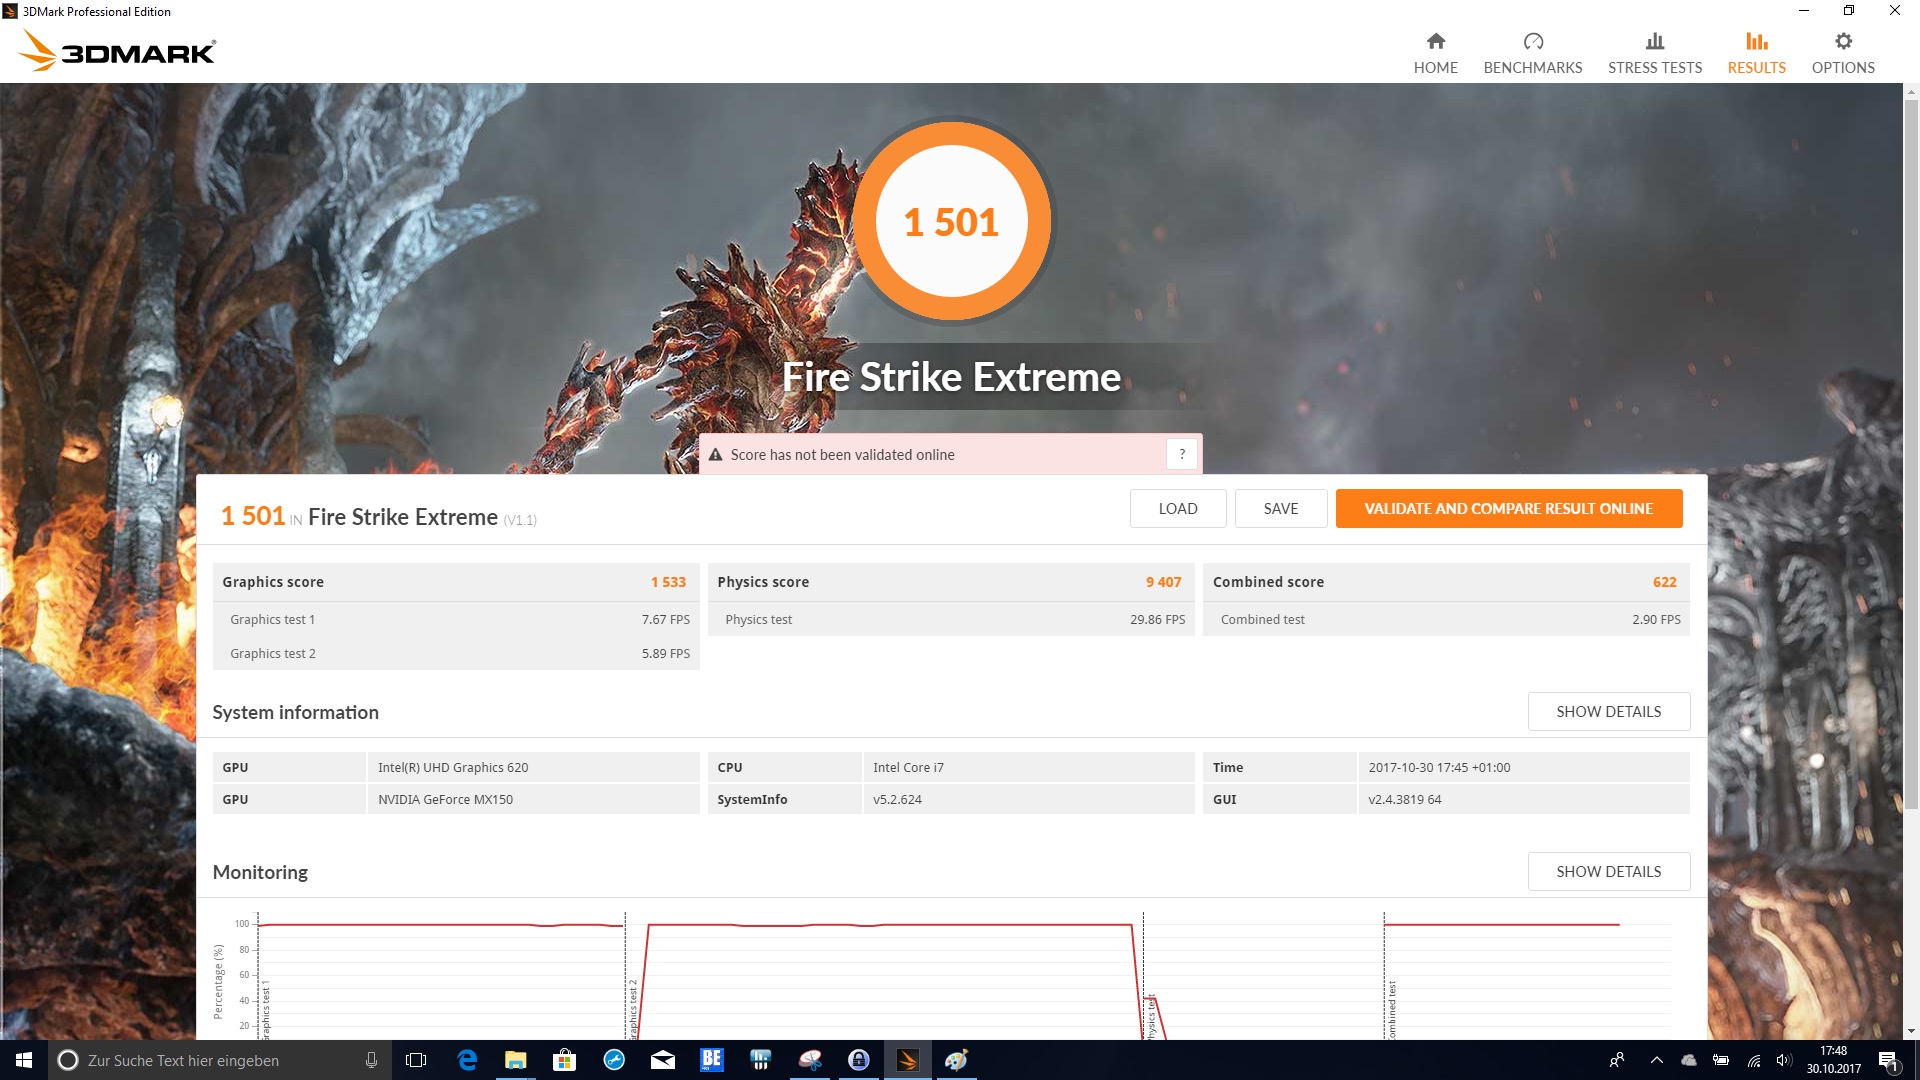
| 3DMark Fire Strike Extreme Score | 1501 puntos | |
ayuda | ||
| bajo | medio | alto | ultra | |
|---|---|---|---|---|
| BioShock Infinite (2013) | 170 | 85.9 | 70.4 | 30.5 |
| Battlefield 4 (2013) | 111.1 | 66.7 | 26 | 17.9 |
| Rise of the Tomb Raider (2016) | 61.1 | 32.4 | 18.4 | 15.2 |
Ruido
| Ocioso |
| 30.6 / 30.6 / 32.2 dB(A) |
| Carga |
| 40.5 / 39.5 dB(A) |
 | ||
30 dB silencioso 40 dB(A) audible 50 dB(A) ruidosamente alto |
||
min: | ||
| Dell Inspiron 17-7773-0043 GeForce MX150, i5-8550U, SanDisk X400 M.2 2280 128GB | Dell Inspiron 17 7778 GeForce 940MX, 6500U, Liteonit CV3-CE512 | Acer Aspire 5 A517-51G-80L GeForce MX150, i5-8550U, Micron 1100 MTFDDAV256TBN | Acer Aspire Nitro BE VN7-793G-5811 GeForce GTX 1050 Ti Mobile, i5-7300HQ, Seagate Mobile HDD 1TB ST1000LM035 | HP Omen 17-w206ng GeForce GTX 1050 Ti Mobile, i7-7700HQ, Samsung PM961 MZVLW256HEHP | Acer Aspire 7 A717-71G-72VY GeForce GTX 1060 Mobile, i7-7700HQ, Toshiba MQ01ABD100 | |
|---|---|---|---|---|---|---|
| Noise | -5% | 7% | 3% | -14% | 0% | |
| apagado / medio ambiente * (dB) | 30.3 | 32.1 -6% | 29.4 3% | 29.7 2% | 30 1% | 30.1 1% |
| Idle Minimum * (dB) | 30.6 | 32.1 -5% | 30.1 2% | 30.2 1% | 34 -11% | 31.4 -3% |
| Idle Average * (dB) | 30.6 | 32.1 -5% | 30.1 2% | 30.2 1% | 35 -14% | 31.4 -3% |
| Idle Maximum * (dB) | 32.2 | 34 -6% | 29.7 8% | 30.6 5% | 36 -12% | 31.7 2% |
| Load Average * (dB) | 40.5 | 40.3 -0% | 34.4 15% | 33.8 17% | 47 -16% | 35.2 13% |
| Load Maximum * (dB) | 39.5 | 42.6 -8% | 34.4 13% | 42.6 -8% | 52 -32% | 43.5 -10% |
| Witcher 3 ultra * (dB) | 39.5 | 48 | 39.9 |
* ... más pequeño es mejor
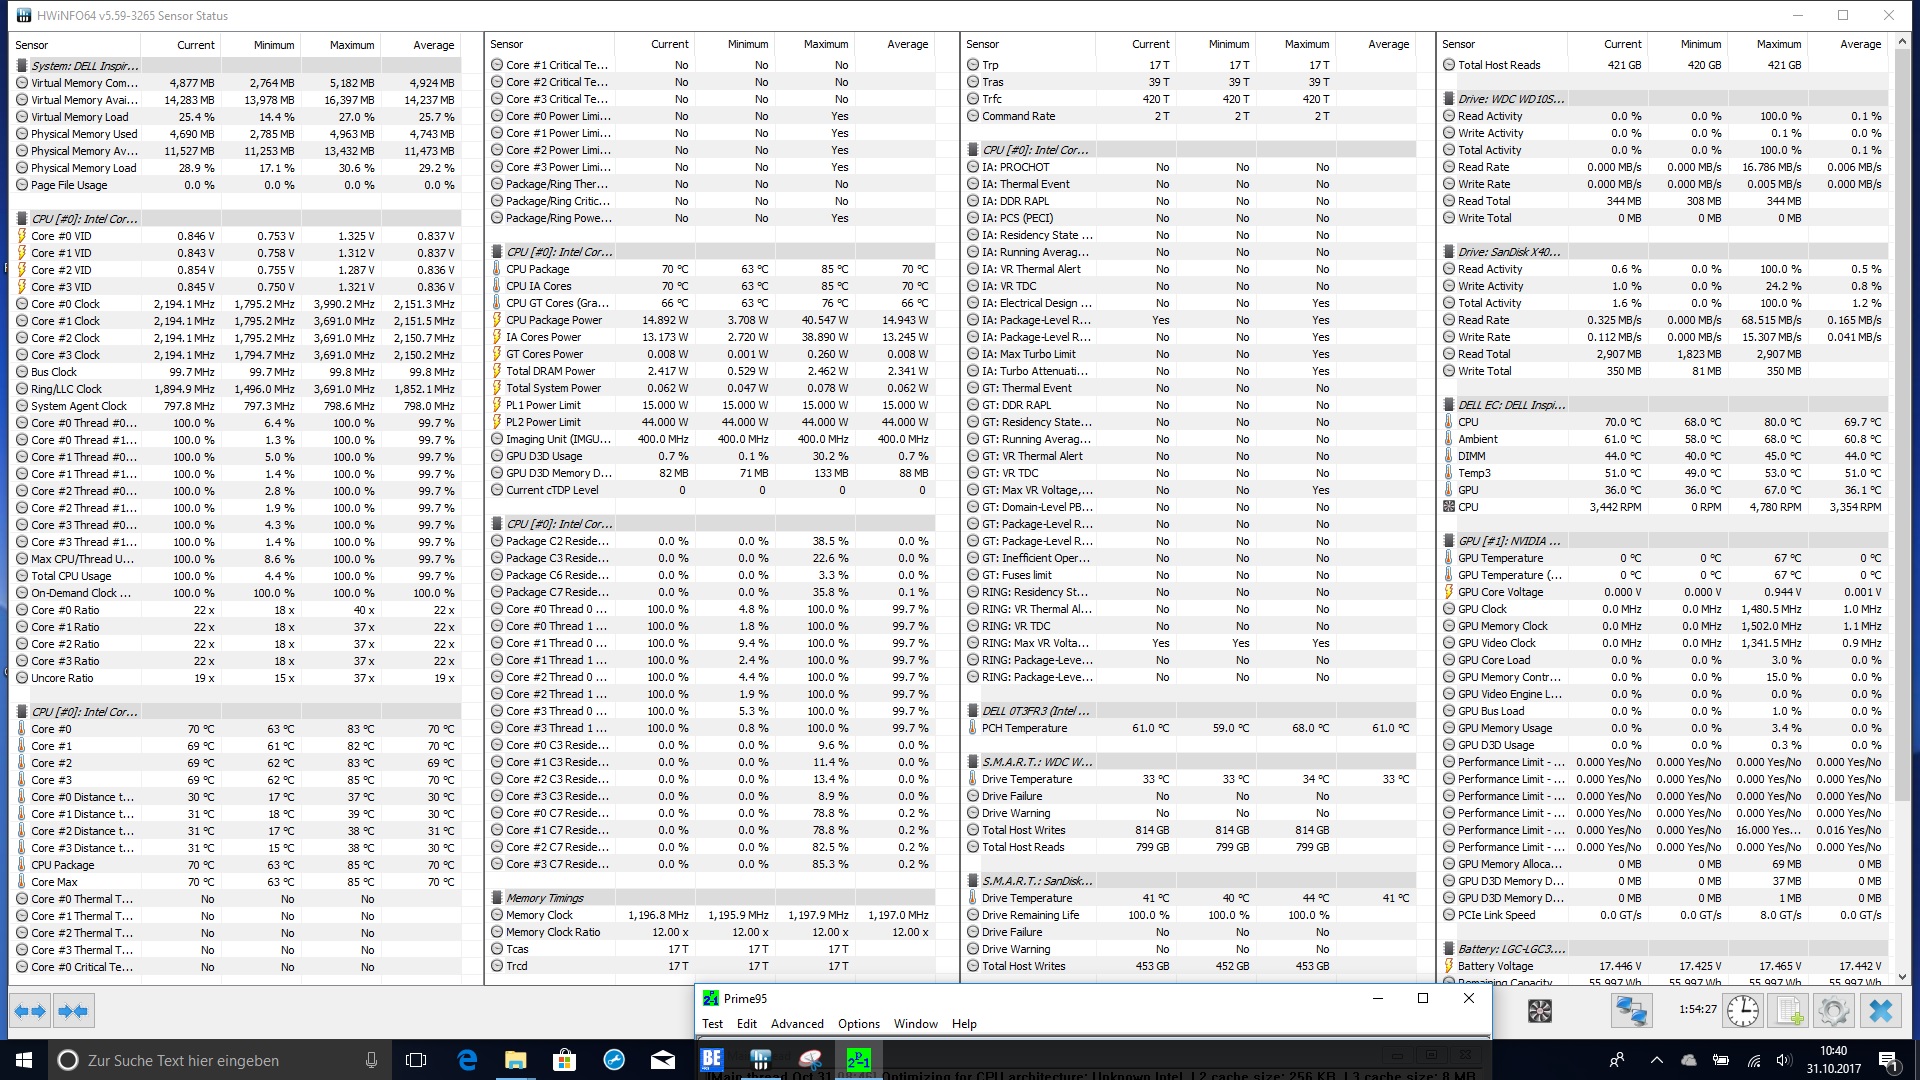
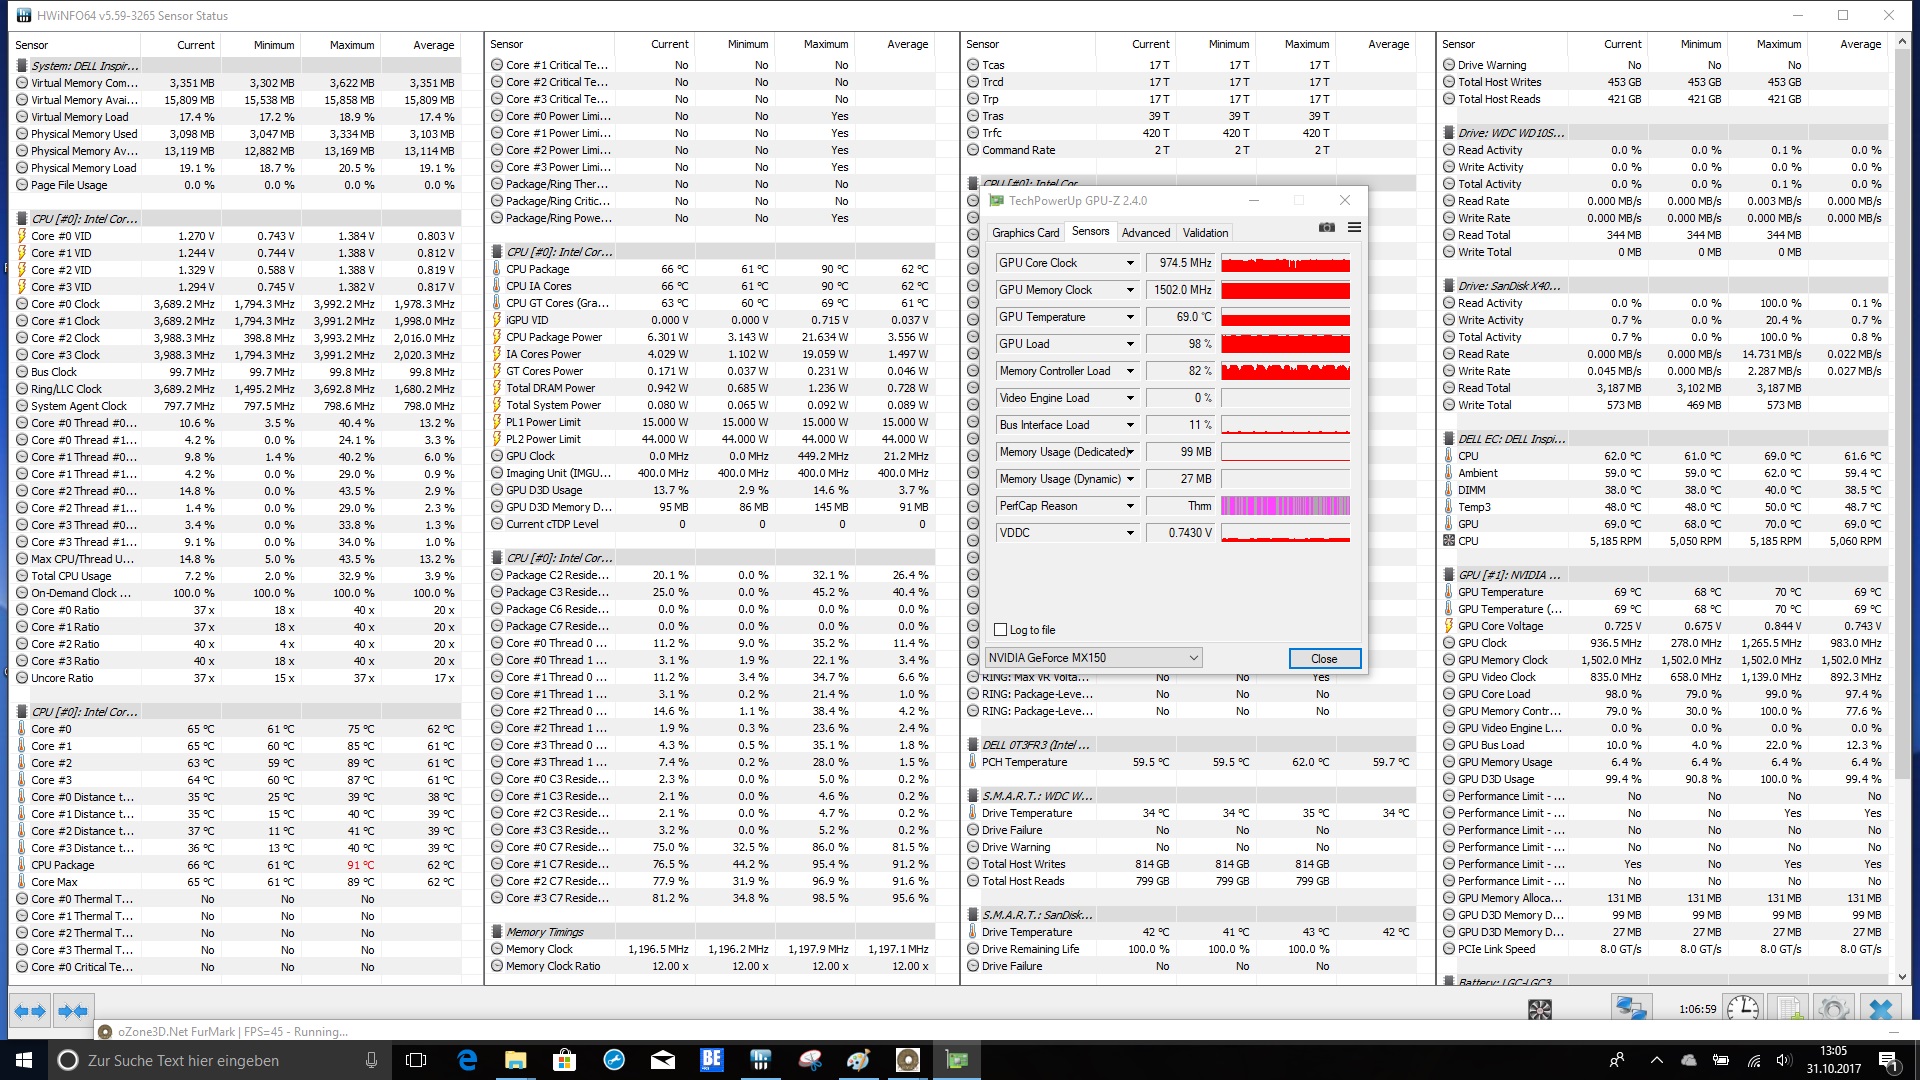
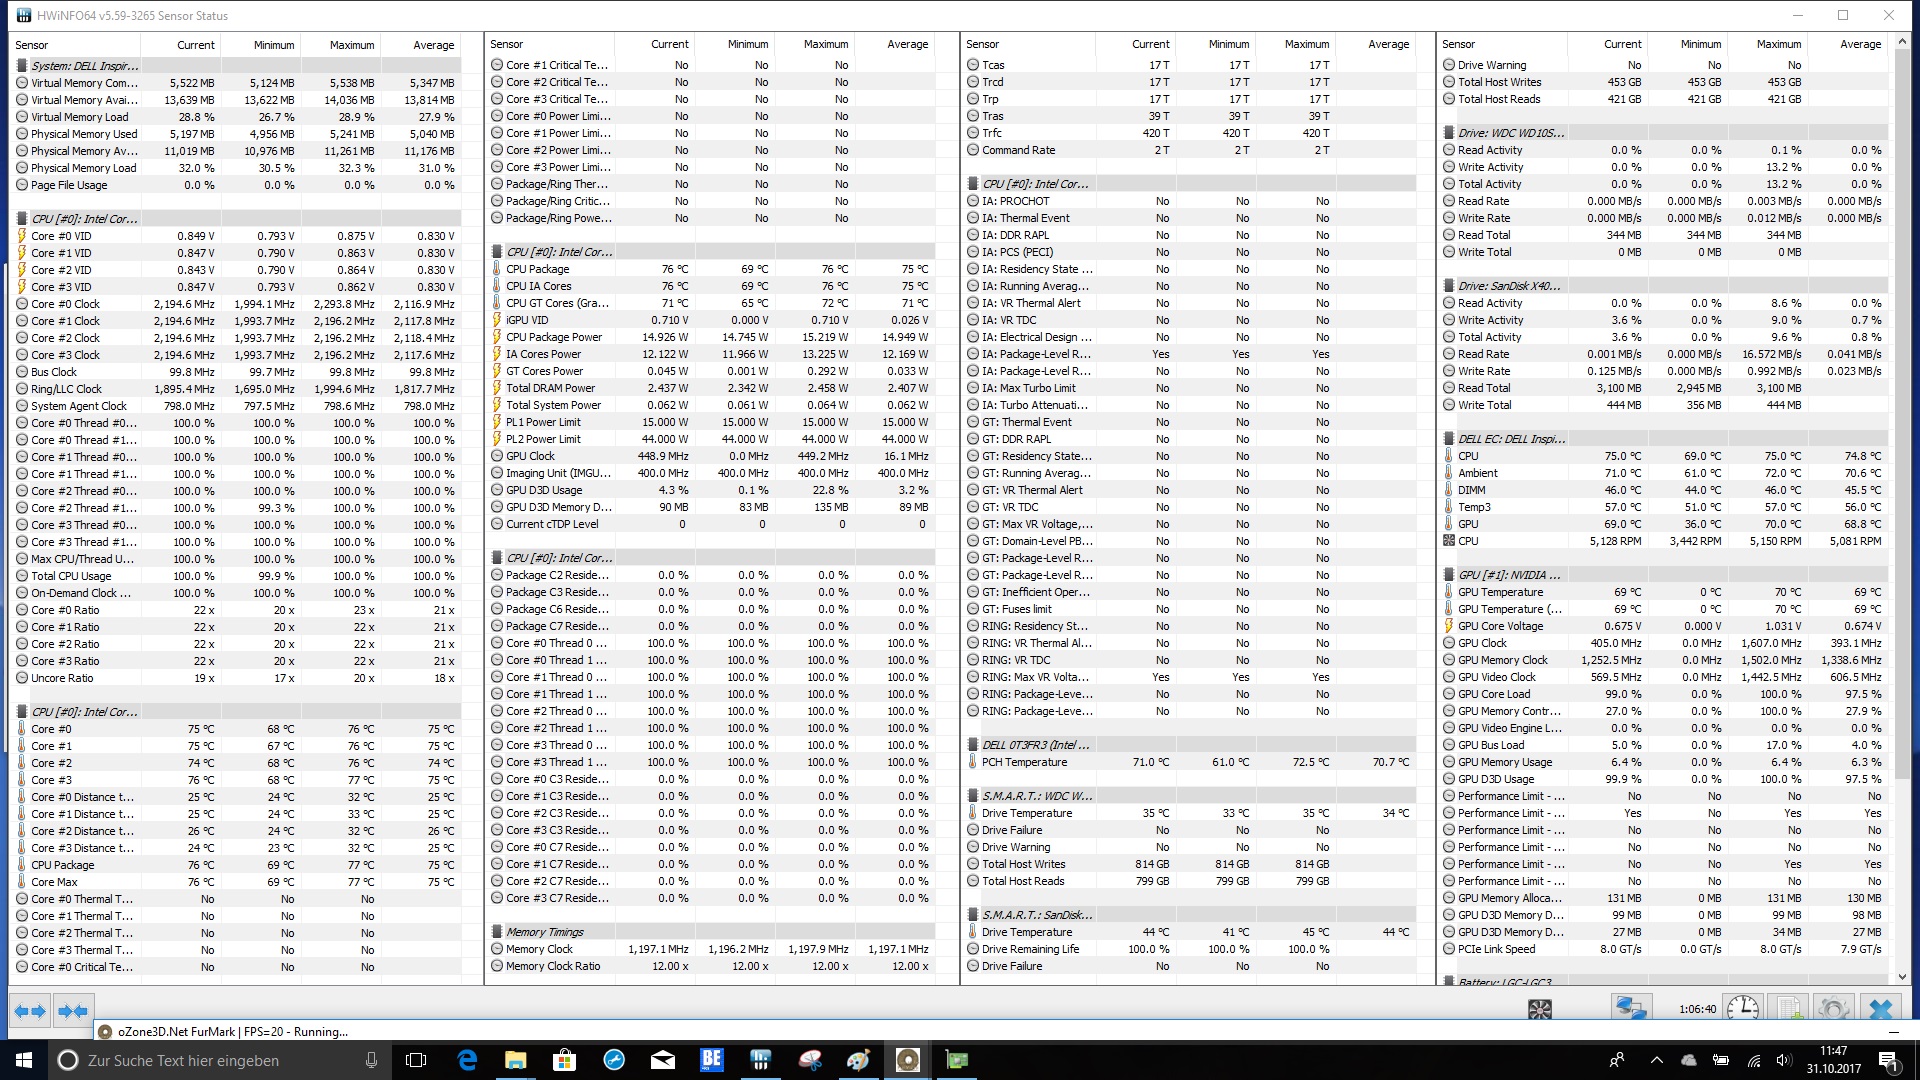
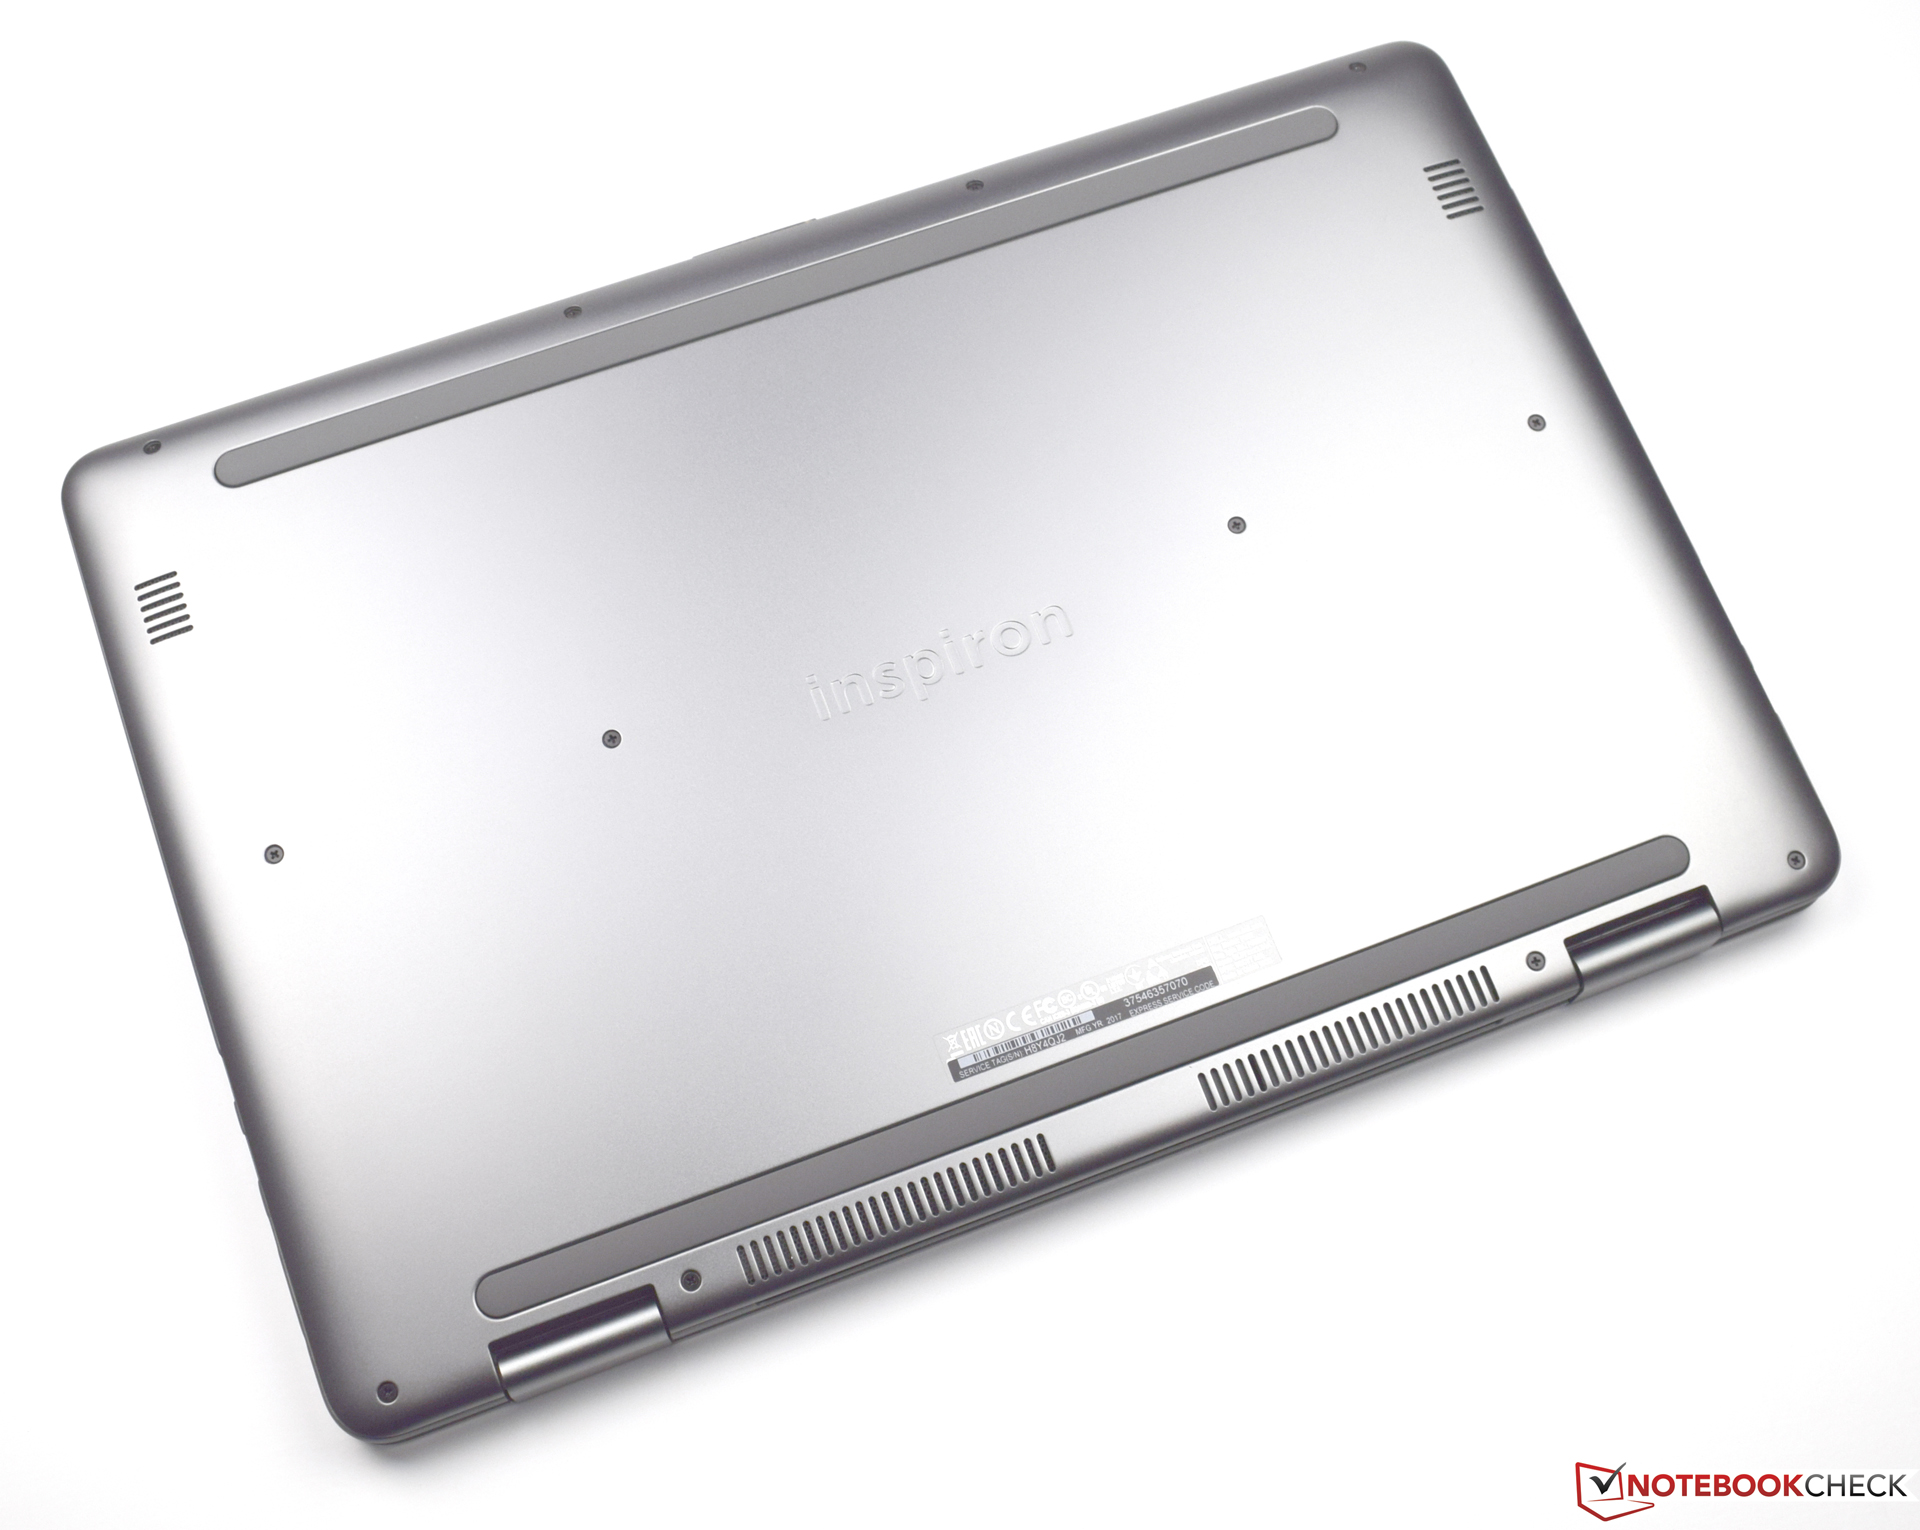
(±) La temperatura máxima en la parte superior es de 42.7 °C / 109 F, frente a la media de 36.8 °C / 98 F, que oscila entre 21 y 71 °C para la clase Multimedia.
(-) El fondo se calienta hasta un máximo de 47.2 °C / 117 F, frente a la media de 39.1 °C / 102 F
(+) En reposo, la temperatura media de la parte superior es de 27.3 °C / 81# F, frente a la media del dispositivo de 31.3 °C / 88 F.
(+) El reposamanos y el panel táctil están a una temperatura inferior a la de la piel, con un máximo de 29.2 °C / 84.6 F y, por tanto, son fríos al tacto.
(±) La temperatura media de la zona del reposamanos de dispositivos similares fue de 28.7 °C / 83.7 F (-0.5 °C / -0.9 F).
| Dell Inspiron 17-7773-0043 GeForce MX150, i5-8550U, SanDisk X400 M.2 2280 128GB | Dell Inspiron 17 7778 GeForce 940MX, 6500U, Liteonit CV3-CE512 | Acer Aspire 5 A517-51G-80L GeForce MX150, i5-8550U, Micron 1100 MTFDDAV256TBN | Acer Aspire Nitro BE VN7-793G-5811 GeForce GTX 1050 Ti Mobile, i5-7300HQ, Seagate Mobile HDD 1TB ST1000LM035 | HP Omen 17-w206ng GeForce GTX 1050 Ti Mobile, i7-7700HQ, Samsung PM961 MZVLW256HEHP | Acer Aspire 7 A717-71G-72VY GeForce GTX 1060 Mobile, i7-7700HQ, Toshiba MQ01ABD100 | |
|---|---|---|---|---|---|---|
| Heat | -4% | 14% | -1% | -14% | -7% | |
| Maximum Upper Side * (°C) | 42.7 | 44.7 -5% | 40.4 5% | 48 -12% | 55.6 -30% | 48 -12% |
| Maximum Bottom * (°C) | 47.2 | 45.5 4% | 37 22% | 40.8 14% | 57.7 -22% | 46.6 1% |
| Idle Upper Side * (°C) | 28.4 | 31 -9% | 25.3 11% | 29.9 -5% | 32.2 -13% | 31.1 -10% |
| Idle Bottom * (°C) | 29.7 | 31.4 -6% | 24.7 17% | 29.8 -0% | 27.2 8% | 31.7 -7% |
* ... más pequeño es mejor
Dell Inspiron 17-7773-0043 análisis de audio
(-) | altavoces no muy altos (#67.2 dB)
Graves 100 - 315 Hz
(±) | lubina reducida - en promedio 14.8% inferior a la mediana
(±) | la linealidad de los graves es media (12.9% delta a frecuencia anterior)
Medios 400 - 2000 Hz
(+) | medios equilibrados - a sólo 4.1% de la mediana
(+) | los medios son lineales (6.4% delta a la frecuencia anterior)
Altos 2 - 16 kHz
(+) | máximos equilibrados - a sólo 3.3% de la mediana
(±) | la linealidad de los máximos es media (8.7% delta a frecuencia anterior)
Total 100 - 16.000 Hz
(±) | la linealidad del sonido global es media (18.5% de diferencia con la mediana)
En comparación con la misma clase
» 57% de todos los dispositivos probados de esta clase eran mejores, 7% similares, 36% peores
» El mejor tuvo un delta de 5%, la media fue 17%, el peor fue ###max##%
En comparación con todos los dispositivos probados
» 42% de todos los dispositivos probados eran mejores, 8% similares, 51% peores
» El mejor tuvo un delta de 4%, la media fue 23%, el peor fue ###max##%
Acer Aspire 5 A517-51G-80L análisis de audio
(-) | altavoces no muy altos (#71.9 dB)
Graves 100 - 315 Hz
(-) | casi sin bajos - de media 15.8% inferior a la mediana
(+) | el bajo es lineal (5% delta a la frecuencia anterior)
Medios 400 - 2000 Hz
(+) | medios equilibrados - a sólo 3.5% de la mediana
(±) | la linealidad de los medios es media (7.6% delta respecto a la frecuencia anterior)
Altos 2 - 16 kHz
(+) | máximos equilibrados - a sólo 3.6% de la mediana
(+) | los máximos son lineales (6.9% delta a la frecuencia anterior)
Total 100 - 16.000 Hz
(±) | la linealidad del sonido global es media (16.3% de diferencia con la mediana)
En comparación con la misma clase
» 41% de todos los dispositivos probados de esta clase eran mejores, 8% similares, 51% peores
» El mejor tuvo un delta de 5%, la media fue 17%, el peor fue ###max##%
En comparación con todos los dispositivos probados
» 27% de todos los dispositivos probados eran mejores, 6% similares, 68% peores
» El mejor tuvo un delta de 4%, la media fue 23%, el peor fue ###max##%
| Off / Standby | |
| Ocioso | |
| Carga |
|
Clave:
min: | |
| Dell Inspiron 17-7773-0043 i5-8550U, GeForce MX150, SanDisk X400 M.2 2280 128GB, IPS, 1920x1080, 17.3" | Dell Inspiron 17 7778 6500U, GeForce 940MX, Liteonit CV3-CE512, IPS, 1920x1080, 17.3" | Acer Aspire 5 A517-51G-80L i5-8550U, GeForce MX150, Micron 1100 MTFDDAV256TBN, aSi TFT, IPS, 1920x1080, 17.3" | Acer Aspire Nitro BE VN7-793G-5811 i5-7300HQ, GeForce GTX 1050 Ti Mobile, Seagate Mobile HDD 1TB ST1000LM035, IPS, 1920x1080, 17.3" | HP Omen 17-w206ng i7-7700HQ, GeForce GTX 1050 Ti Mobile, Samsung PM961 MZVLW256HEHP, IPS, 1920x1080, 17.3" | Acer Aspire 7 A717-71G-72VY i7-7700HQ, GeForce GTX 1060 Mobile, Toshiba MQ01ABD100, IPS, 1920x1080, 17.3" | |
|---|---|---|---|---|---|---|
| Power Consumption | 8% | 10% | -47% | -88% | -47% | |
| Idle Minimum * (Watt) | 5.5 | 5.6 -2% | 4.1 25% | 8.7 -58% | 11 -100% | 7 -27% |
| Idle Average * (Watt) | 11.6 | 11.2 3% | 9.3 20% | 12.4 -7% | 18 -55% | 12.3 -6% |
| Idle Maximum * (Watt) | 12.4 | 11.9 4% | 9.8 21% | 15.4 -24% | 24 -94% | 14.2 -15% |
| Load Average * (Watt) | 65 | 46 29% | 64 2% | 73 -12% | 84 -29% | 72.6 -12% |
| Load Maximum * (Watt) | 56 | 53 5% | 66.4 -19% | 130 -132% | 146 -161% | 153 -173% |
| Witcher 3 ultra * (Watt) | 98 | 101 | 125 |
* ... más pequeño es mejor

| Dell Inspiron 17-7773-0043 i5-8550U, GeForce MX150, 56 Wh | Dell Inspiron 17 7778 6500U, GeForce 940MX, 56 Wh | Acer Aspire 5 A517-51G-80L i5-8550U, GeForce MX150, 48 Wh | Acer Aspire Nitro BE VN7-793G-5811 i5-7300HQ, GeForce GTX 1050 Ti Mobile, 52.5 Wh | HP Omen 17-w206ng i7-7700HQ, GeForce GTX 1050 Ti Mobile, 62 Wh | Acer Aspire 7 A717-71G-72VY i7-7700HQ, GeForce GTX 1060 Mobile, 48 Wh | |
|---|---|---|---|---|---|---|
| Duración de Batería | 1% | -21% | -32% | -12% | -30% | |
| Reader / Idle (h) | 14.7 | 13.5 -8% | 9.3 -37% | 13.3 -10% | 9.2 -37% | |
| H.264 (h) | 6.2 | 5.4 -13% | 4.7 -24% | |||
| WiFi v1.3 (h) | 6.8 | 8.3 22% | 6.3 -7% | 4.6 -32% | 6.3 -7% | 5.6 -18% |
| Load (h) | 2 | 1.8 -10% | 1.5 -25% | 1.6 -20% | 1.2 -40% |
Pro
Contra

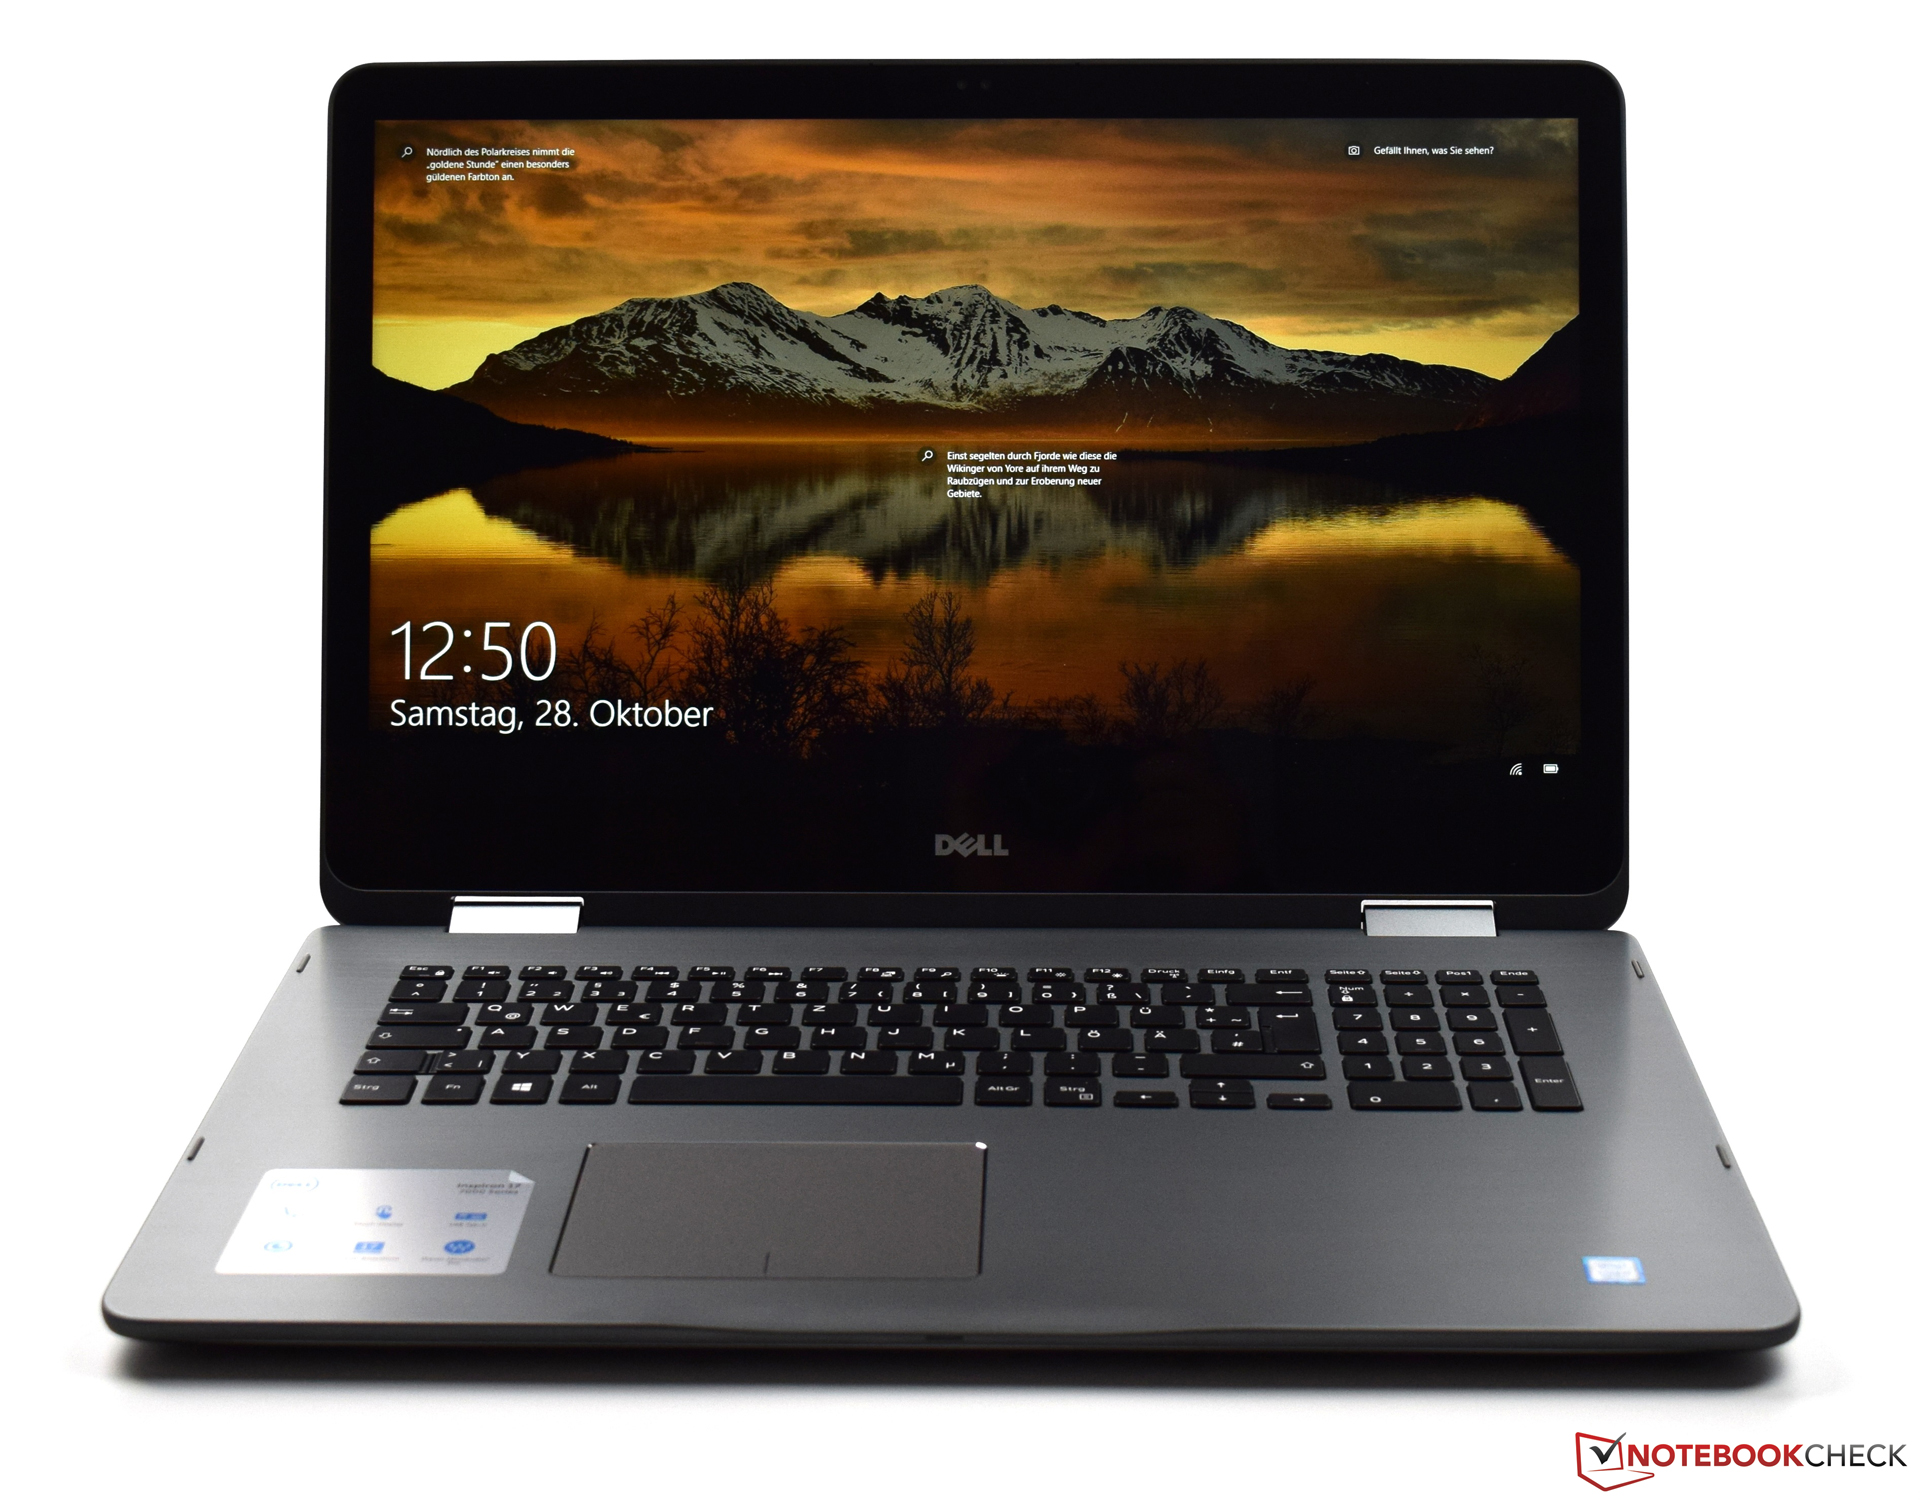
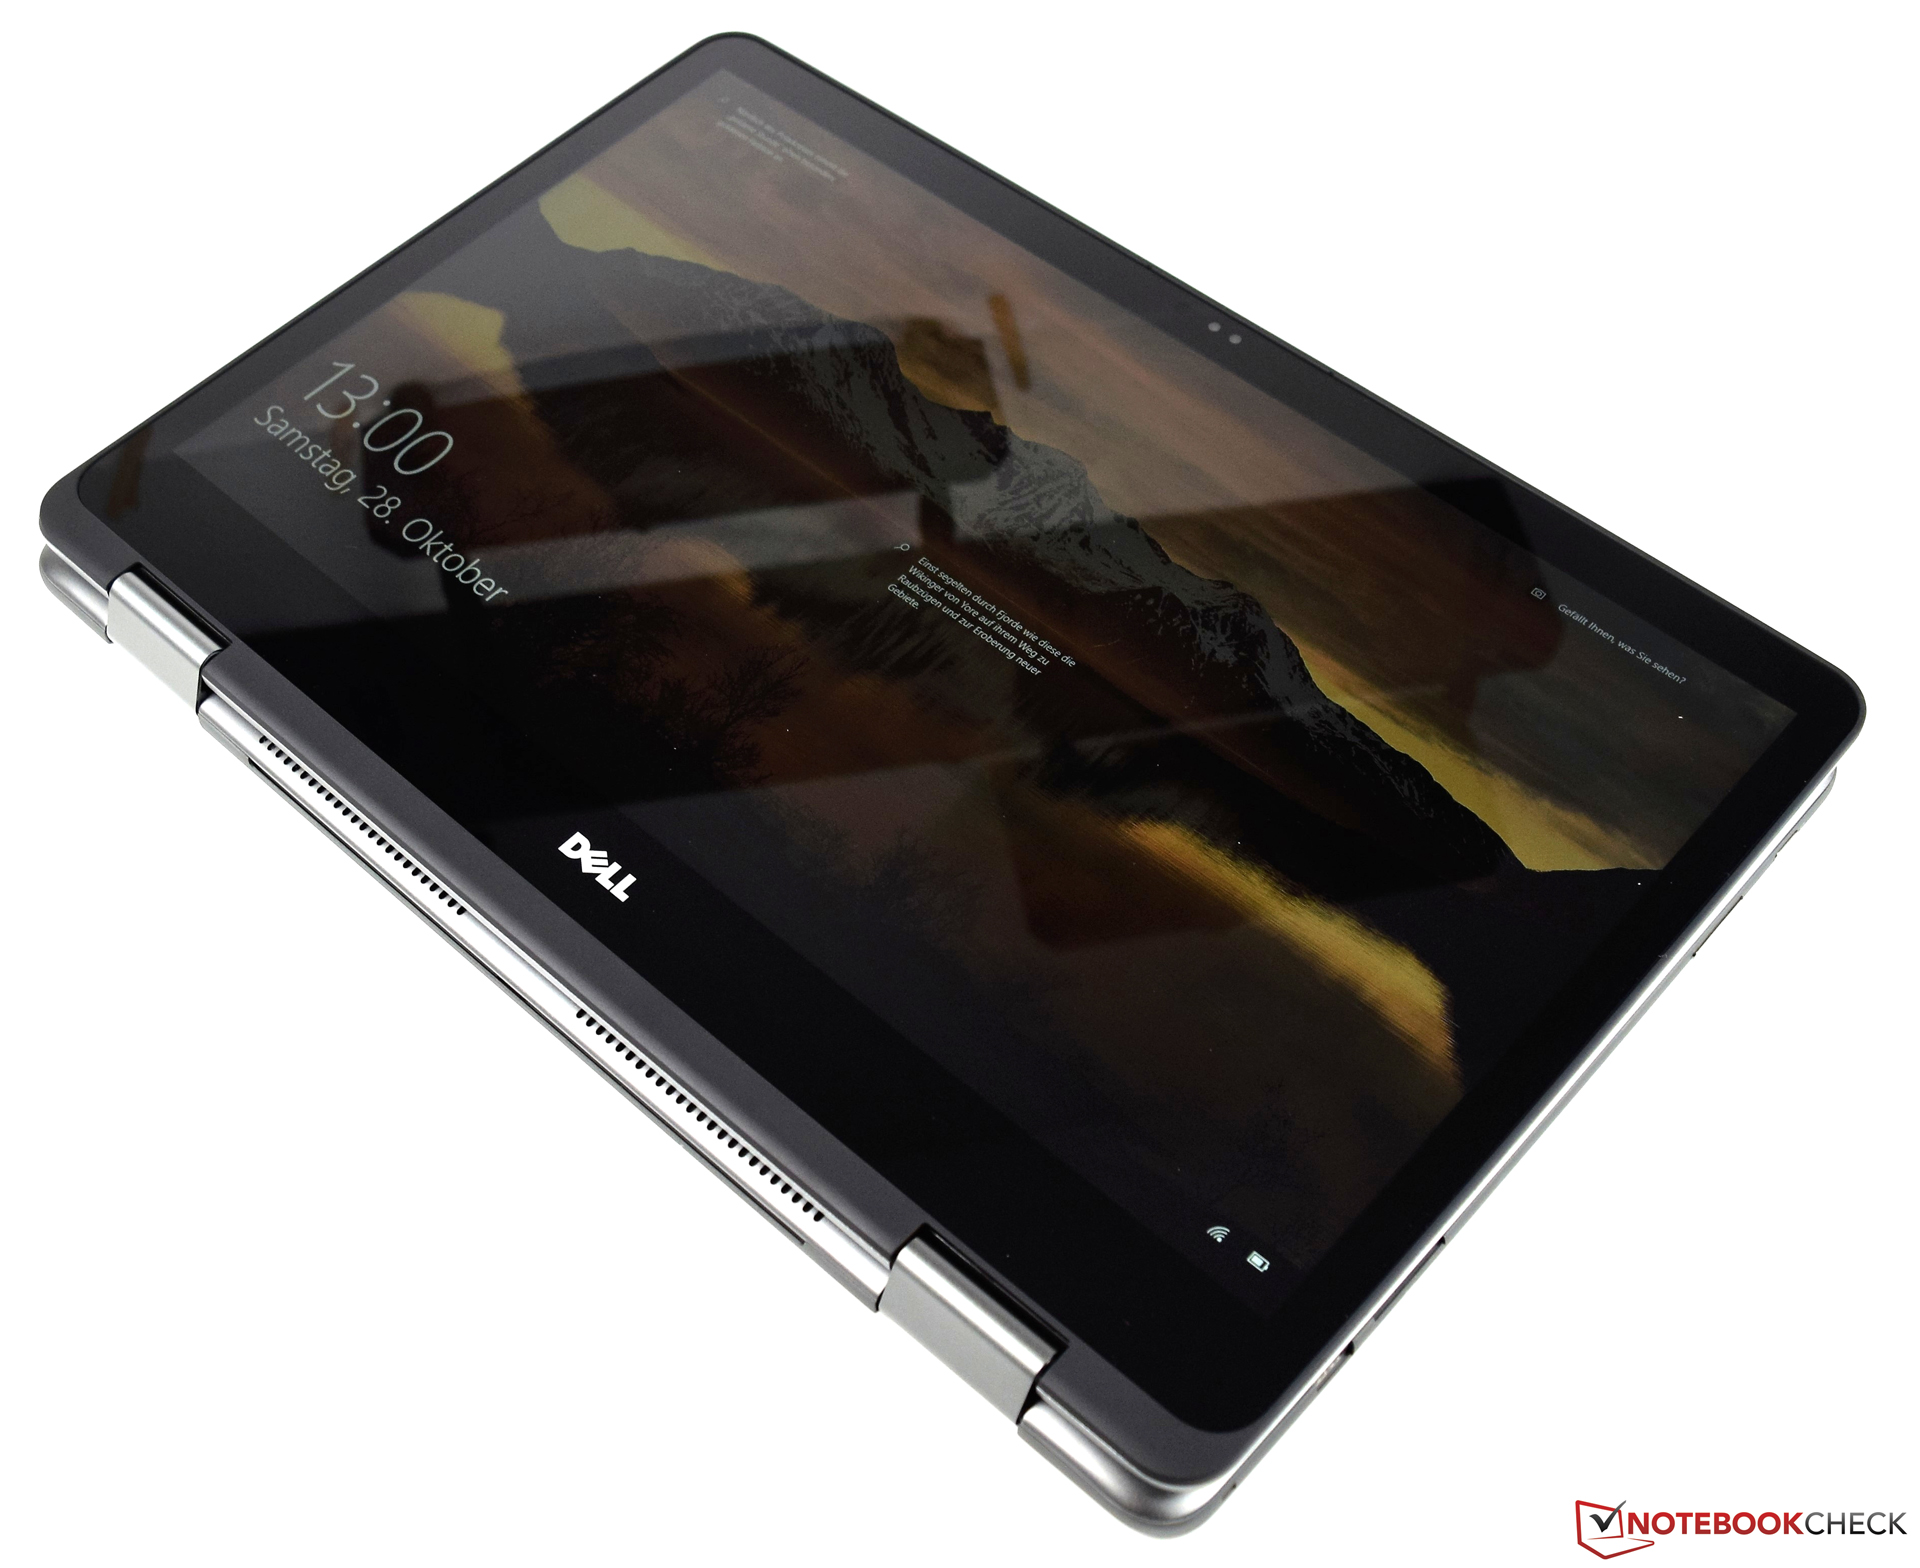
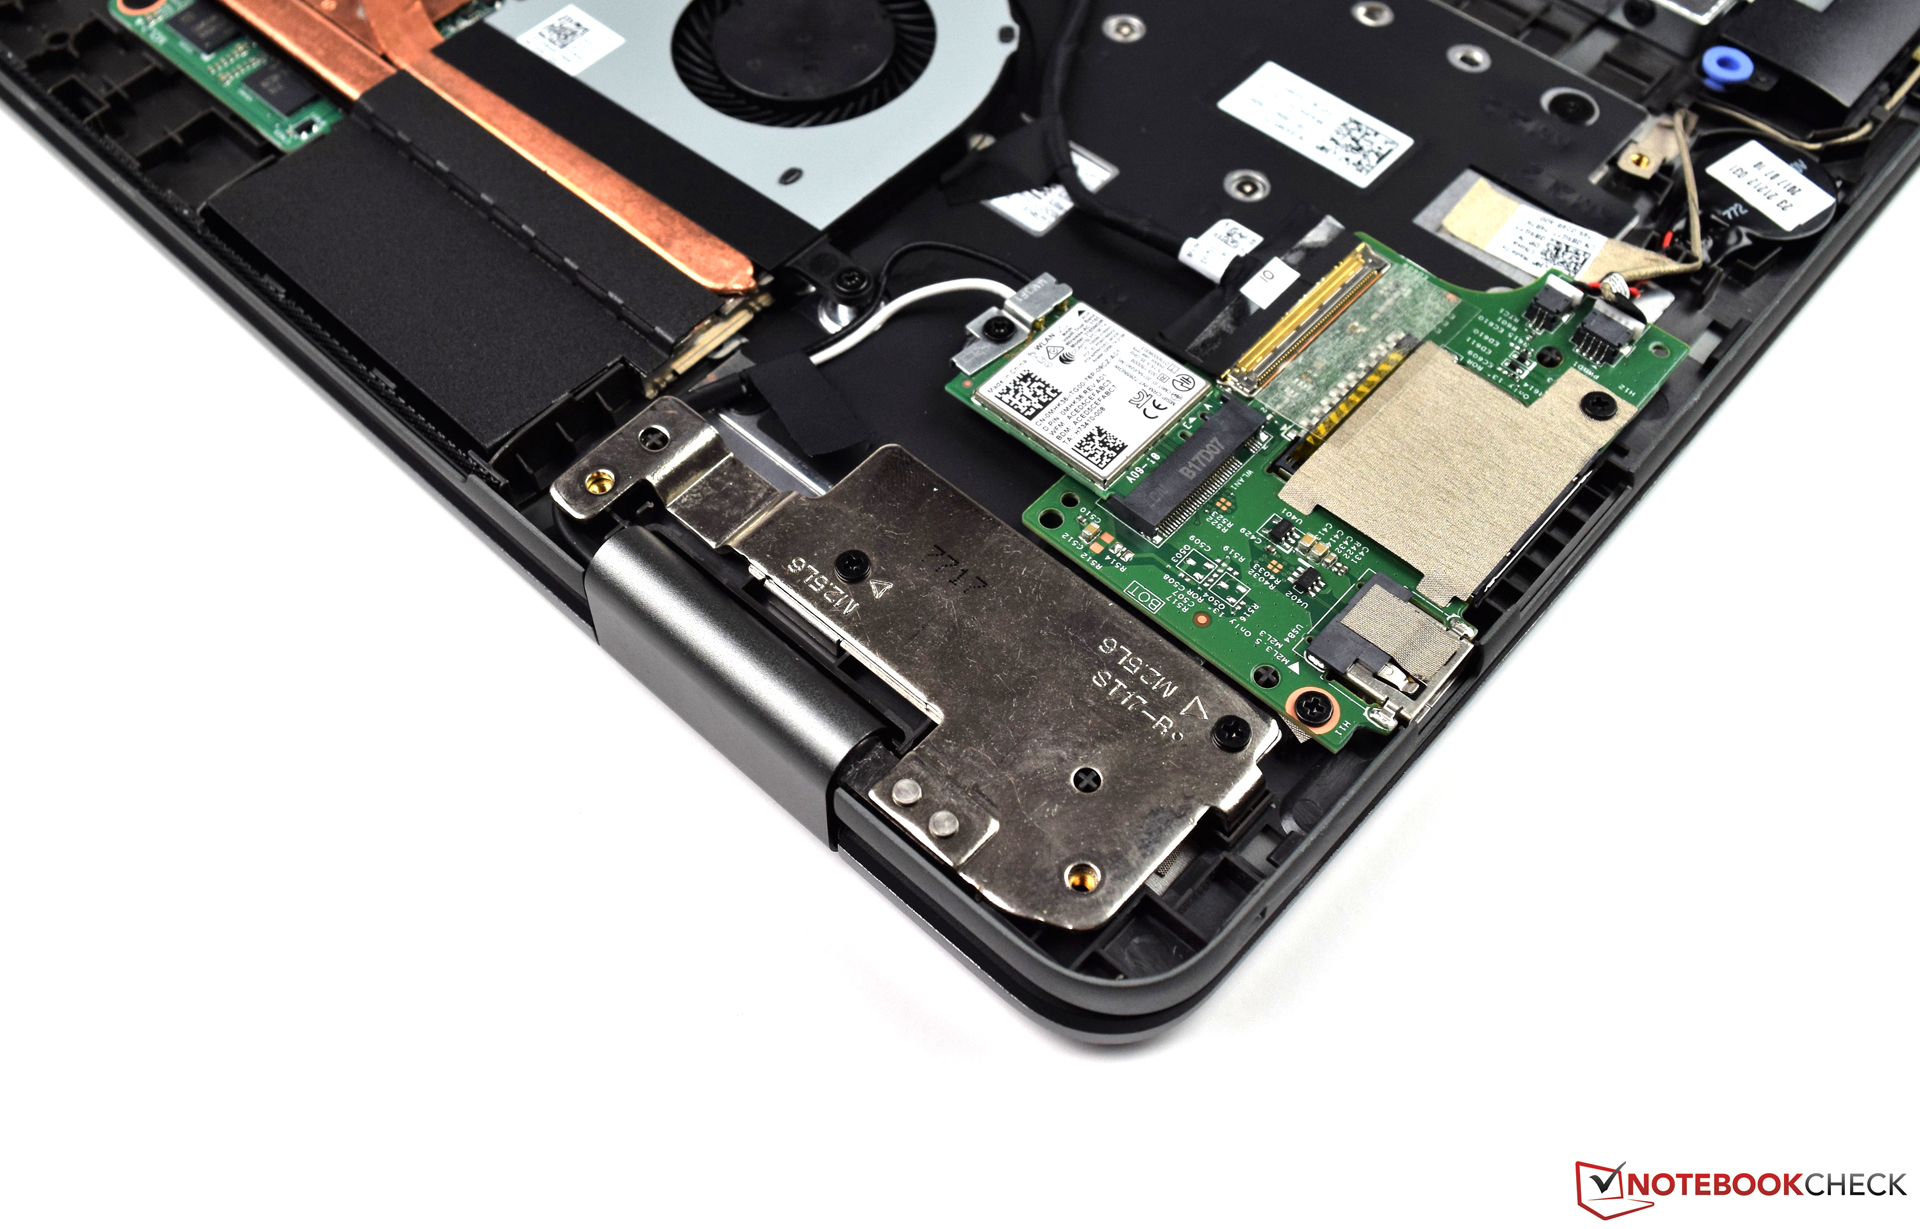
Es cierto que el Dell Inspiron 17 7773 no tiene mucha competencia además del predecesor directo. En nuestra prueba, el convertible en el inusual formato de 17" nos convenció con un muy buen rendimiento. El Intel Core i7-8550U ofrece una base perfecta para aplicaciones exigentes. Los amplios 16 GB de RAM DDR4 también desempeñan un papel importante, así como la combinación de almacenamiento sensato de SSD y HDD. El Dell Inspiron 17 7773 aparece en las tiendas on line por un precio de 1199 euros. En particular, la Nvidia GeForce MX150, que amplía las áreas de uso del convertible, es digna de elogio.
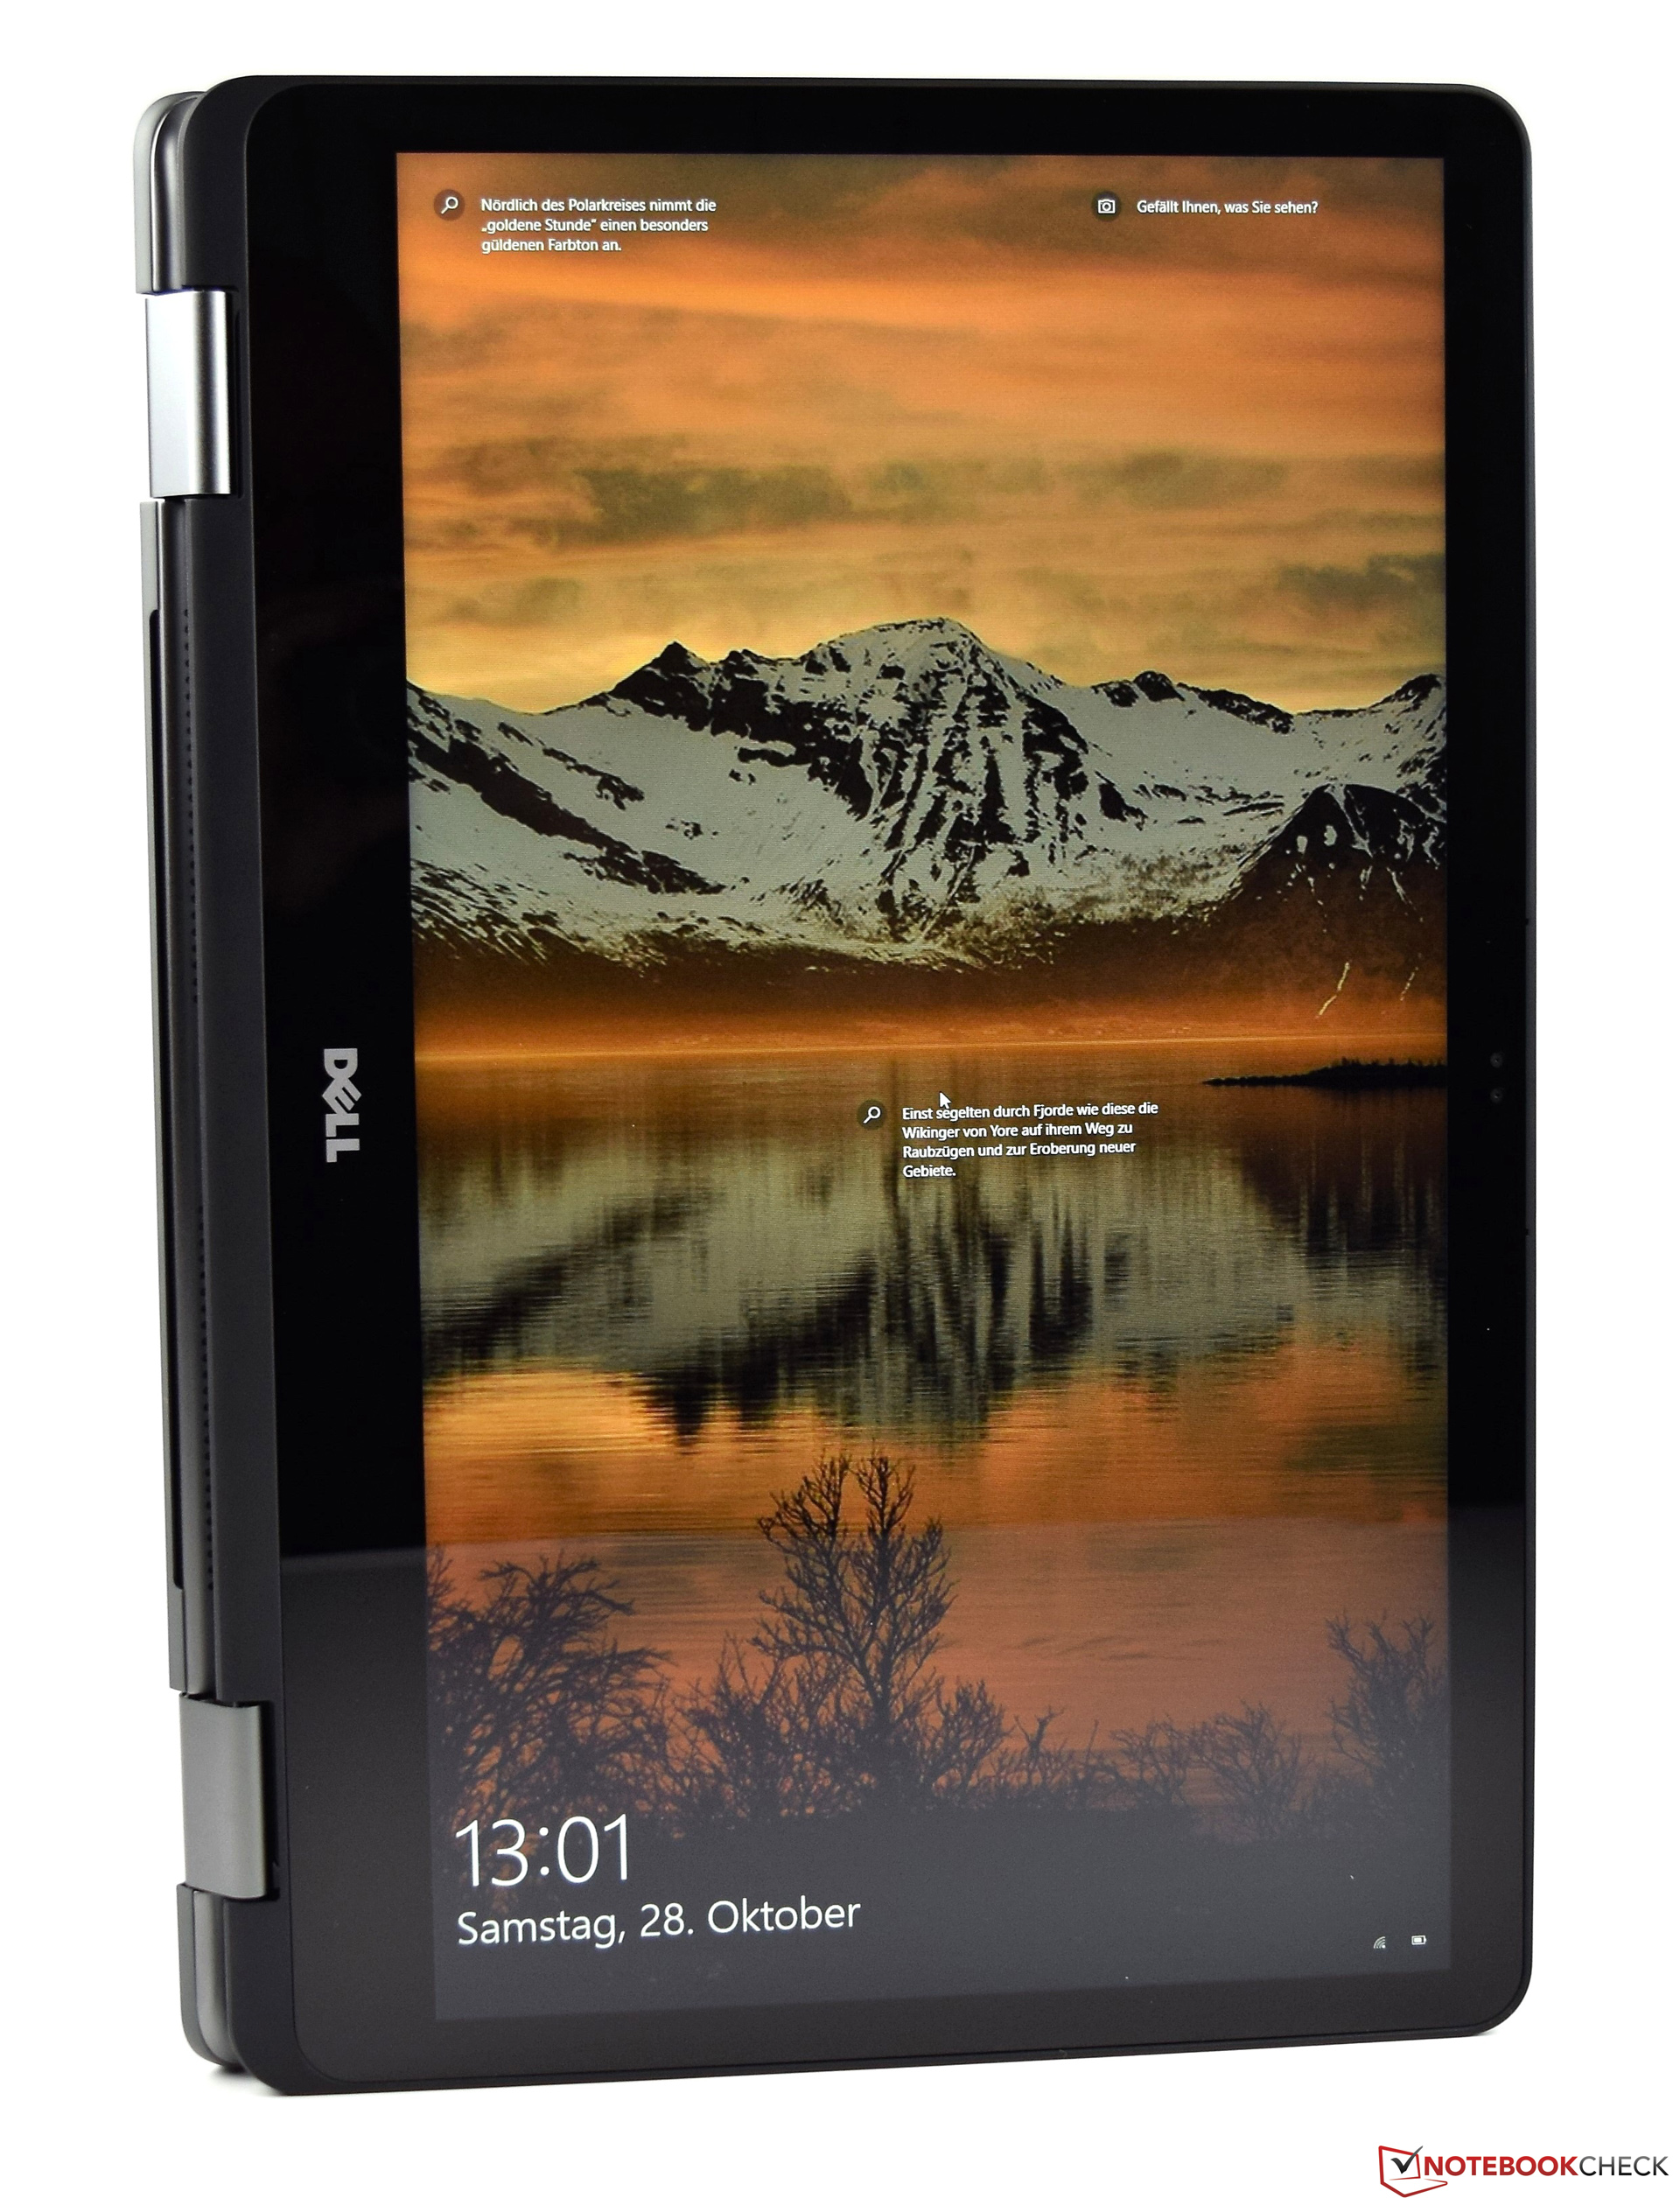
Aunque la Dell Inspiron 17 7773 probablemente no sea para todos, recompensa a los compradores con una porción decente de rendimiento. Además, el convertible gigante es muy flexible en sus usos y casi no tiene competencia.
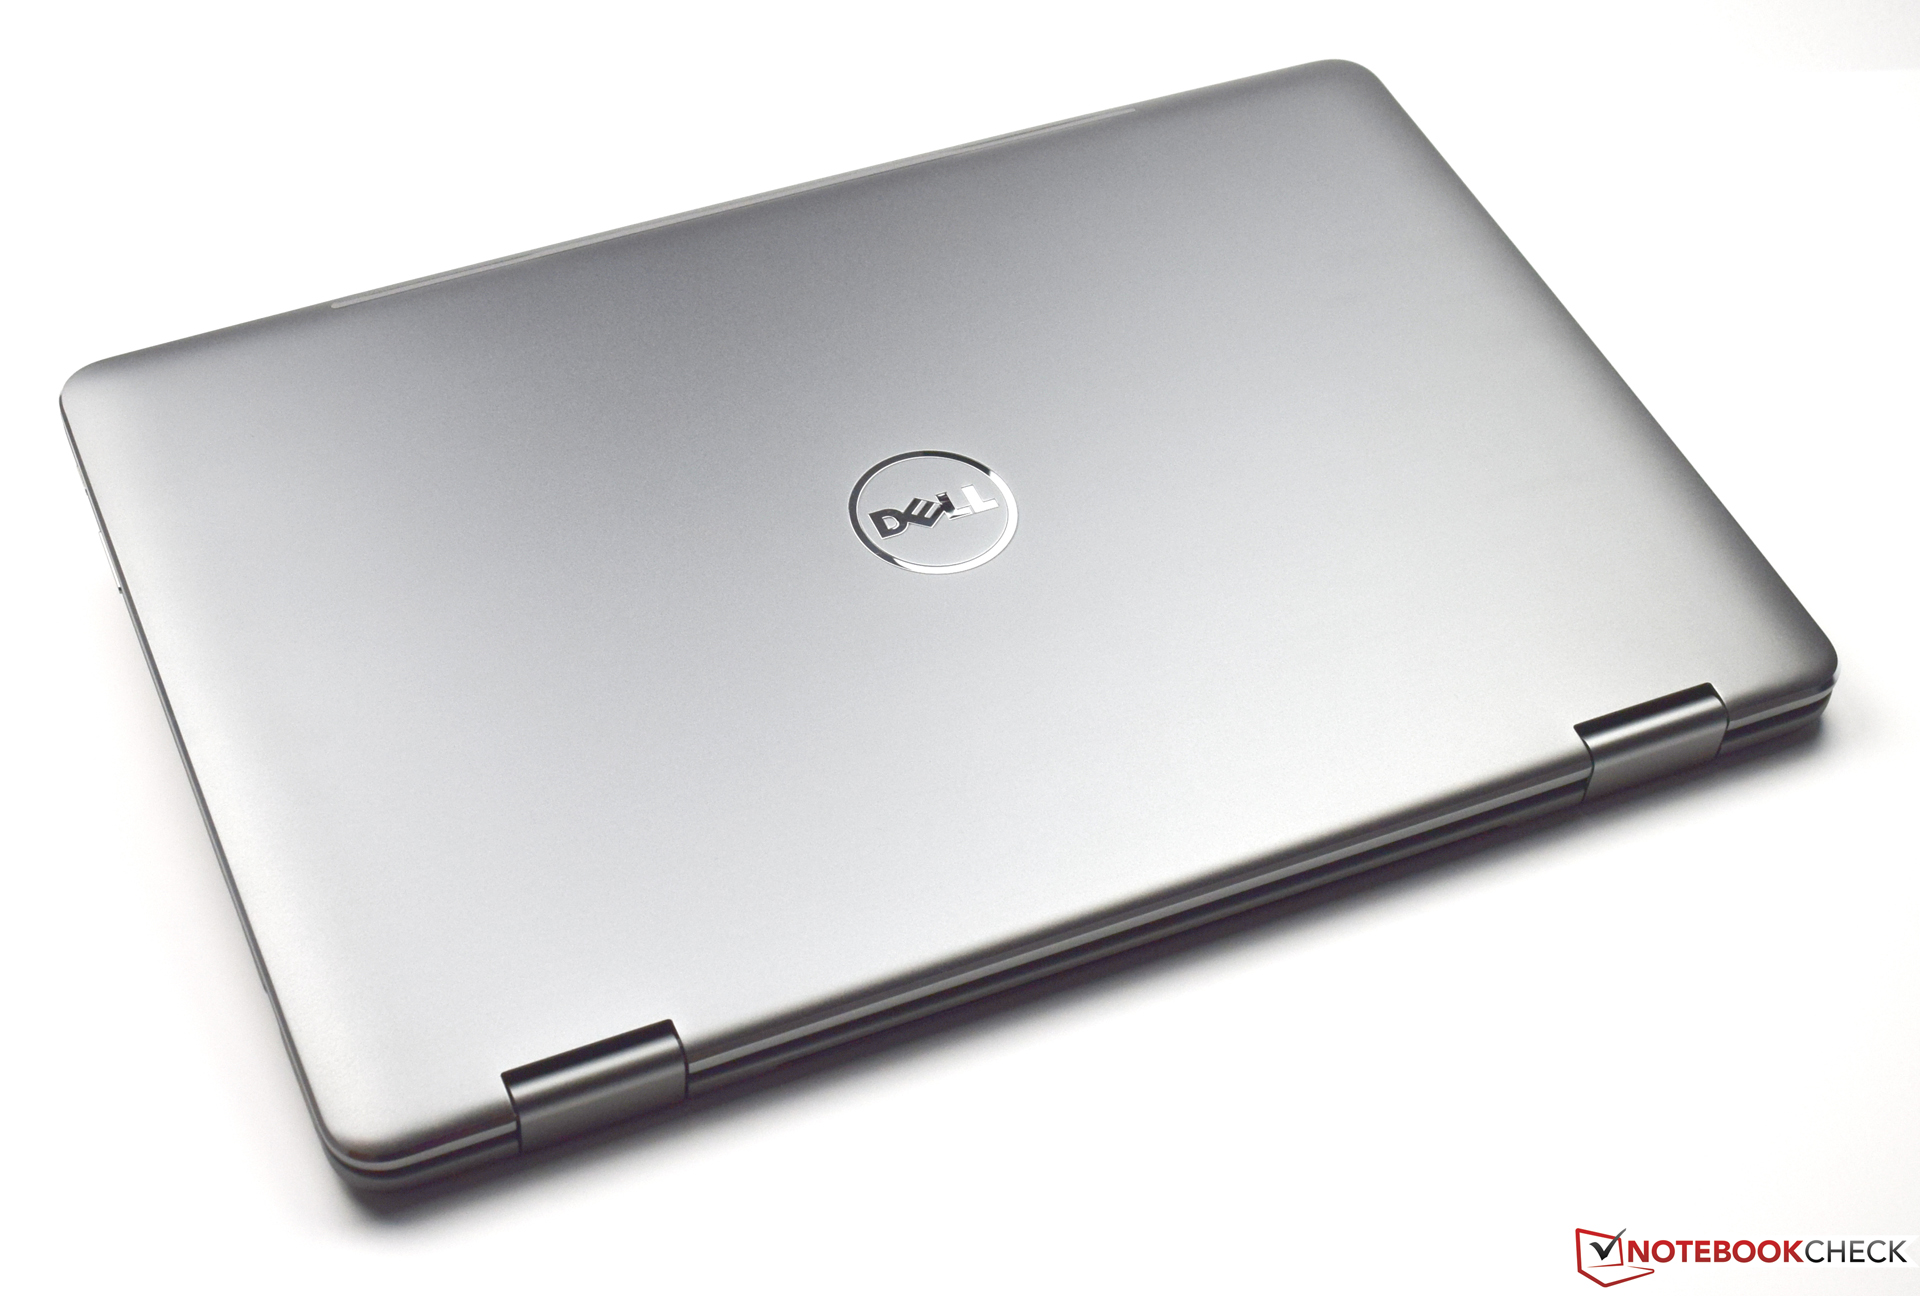
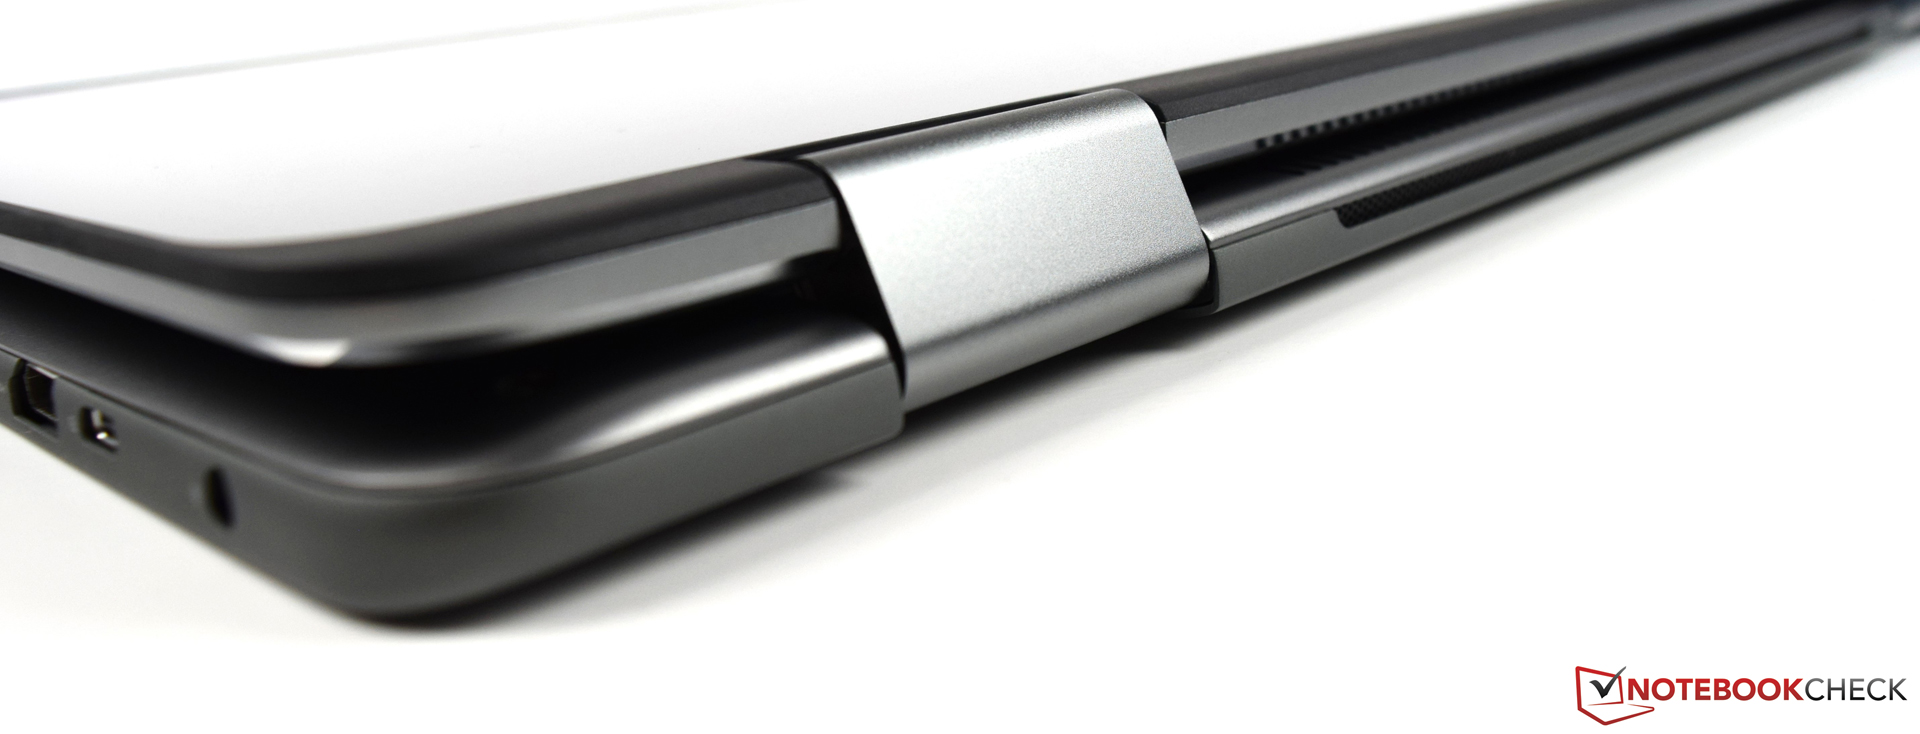
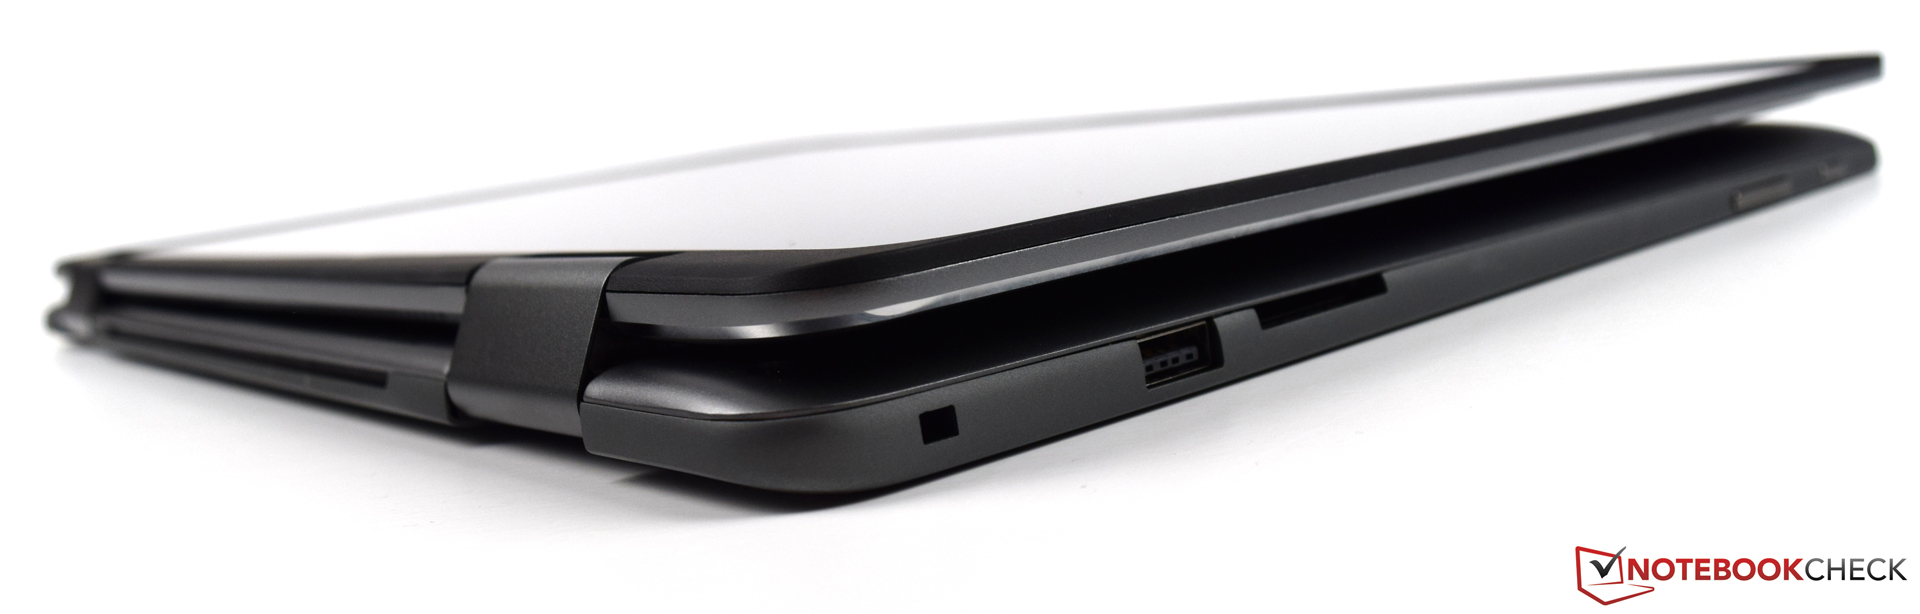
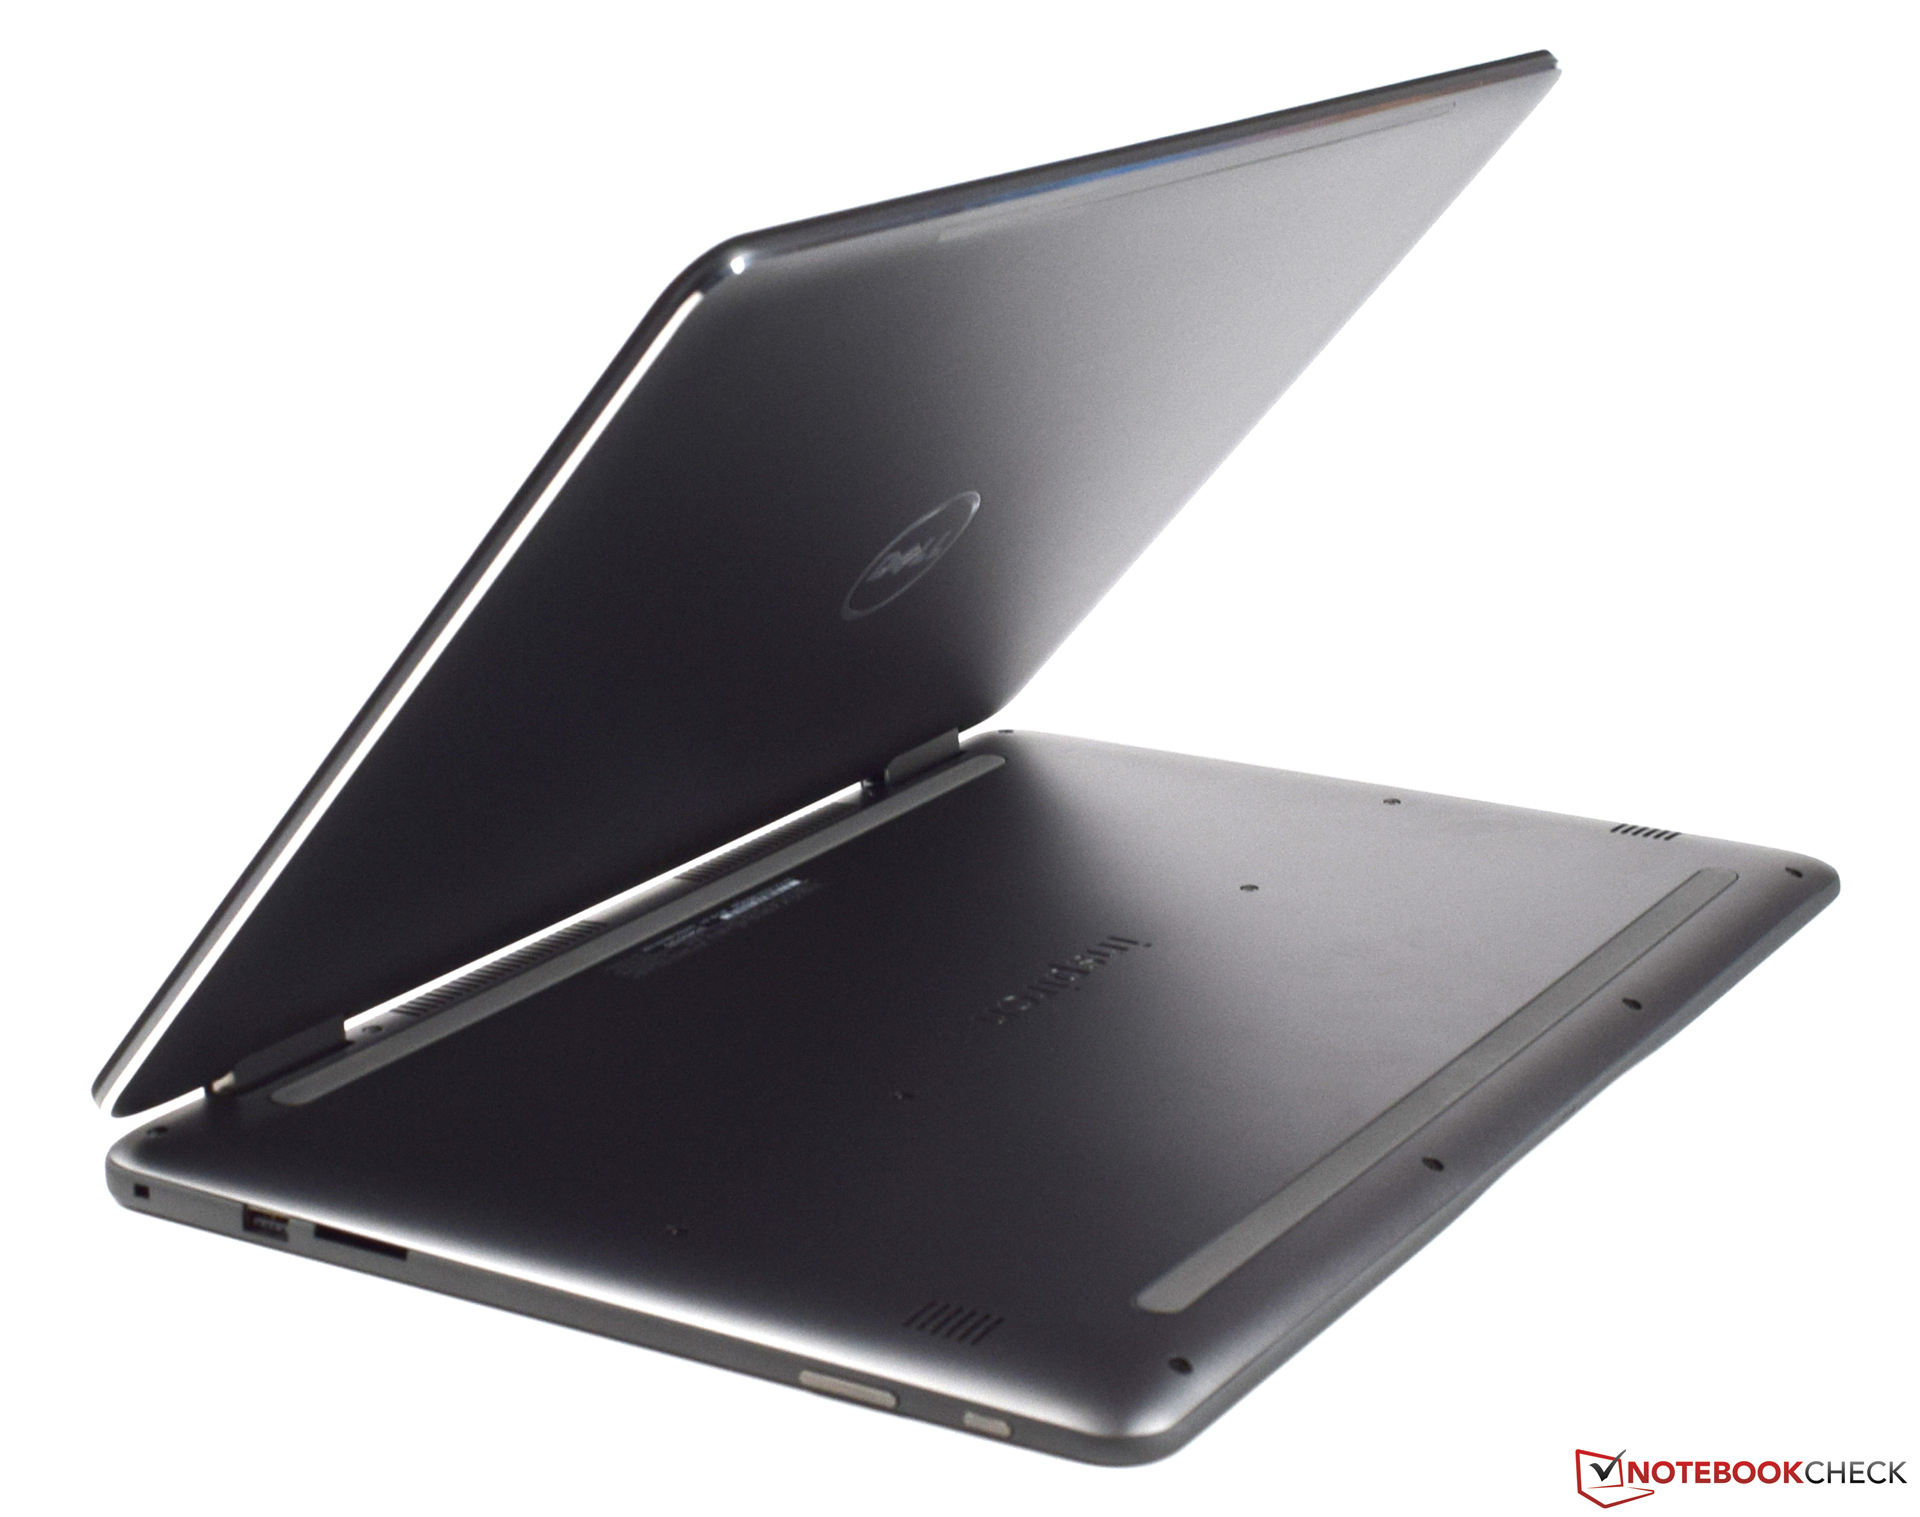
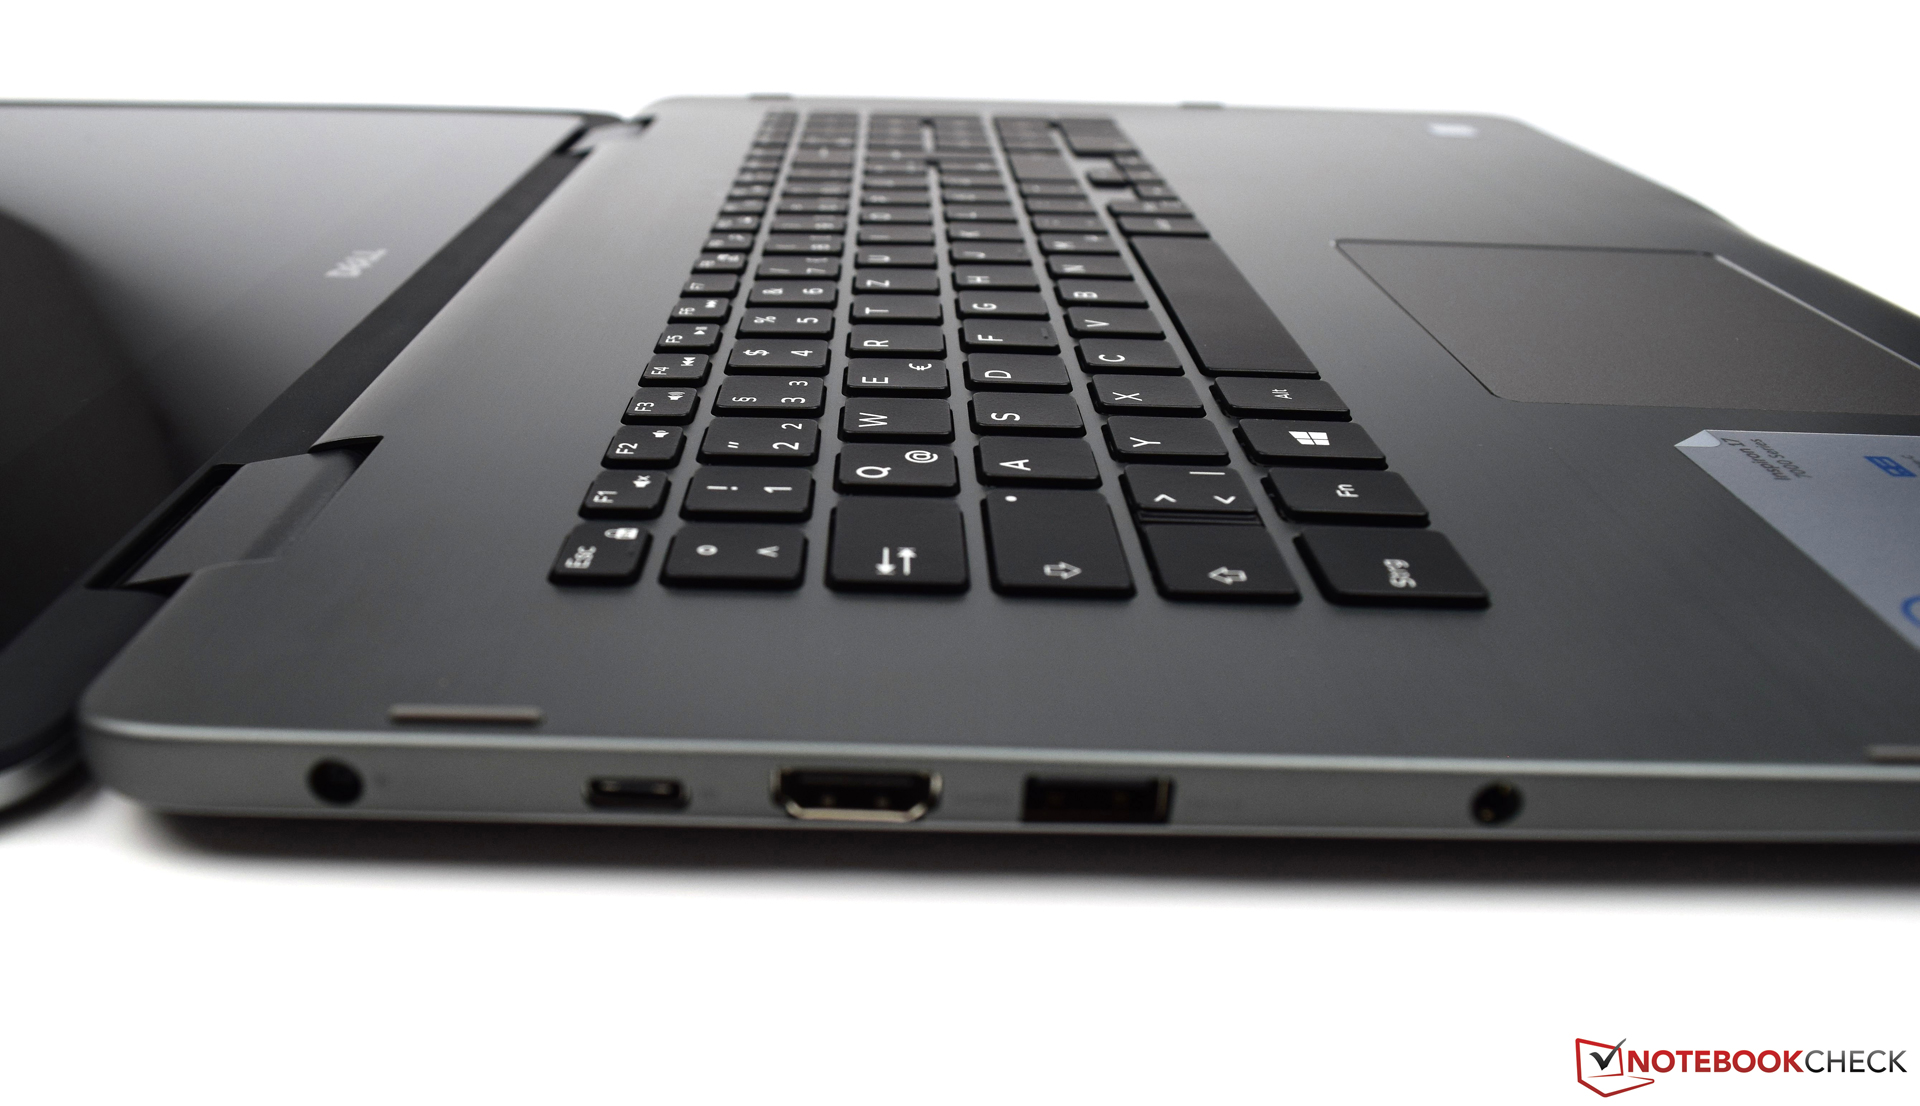
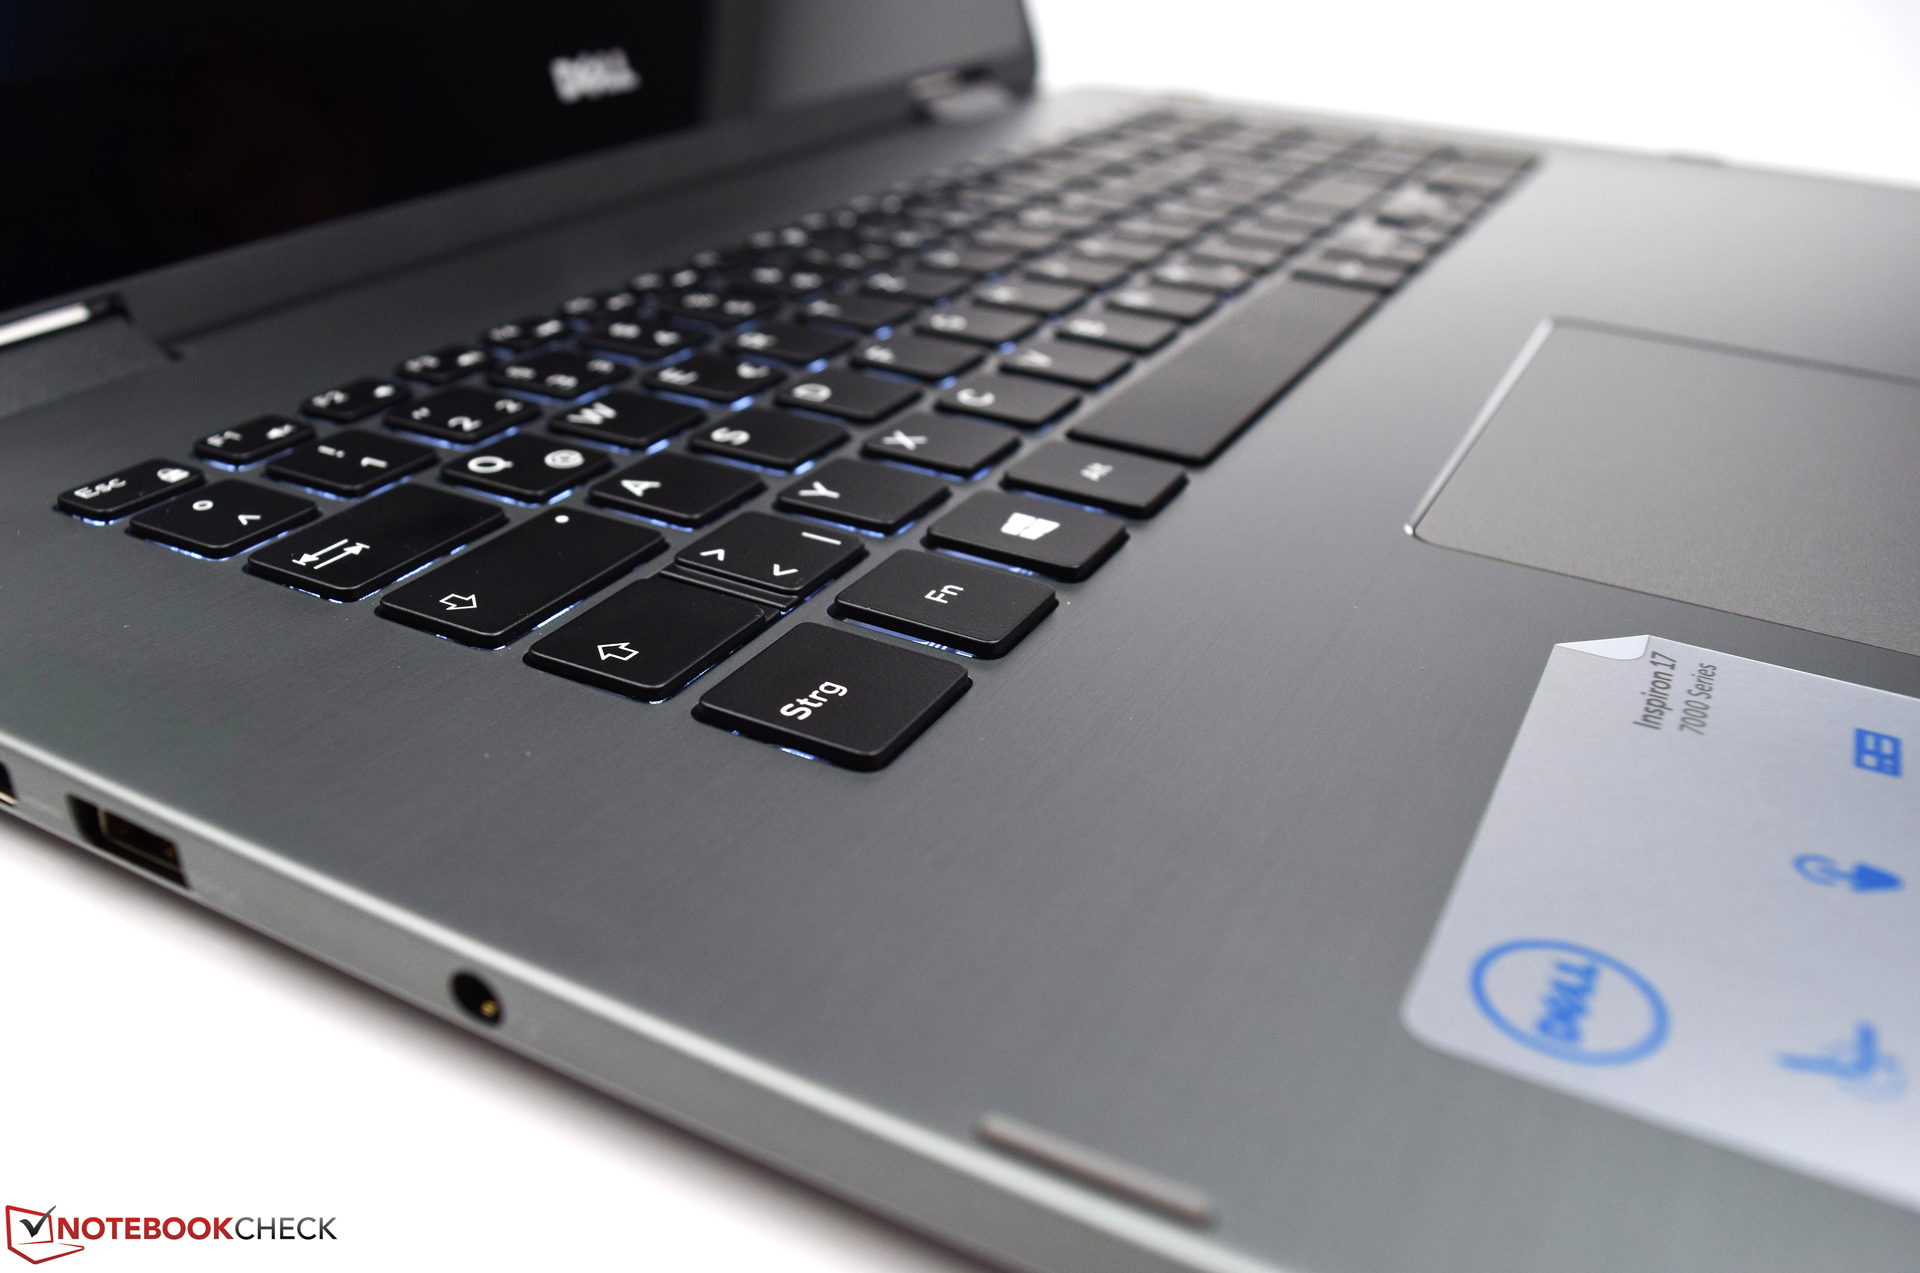
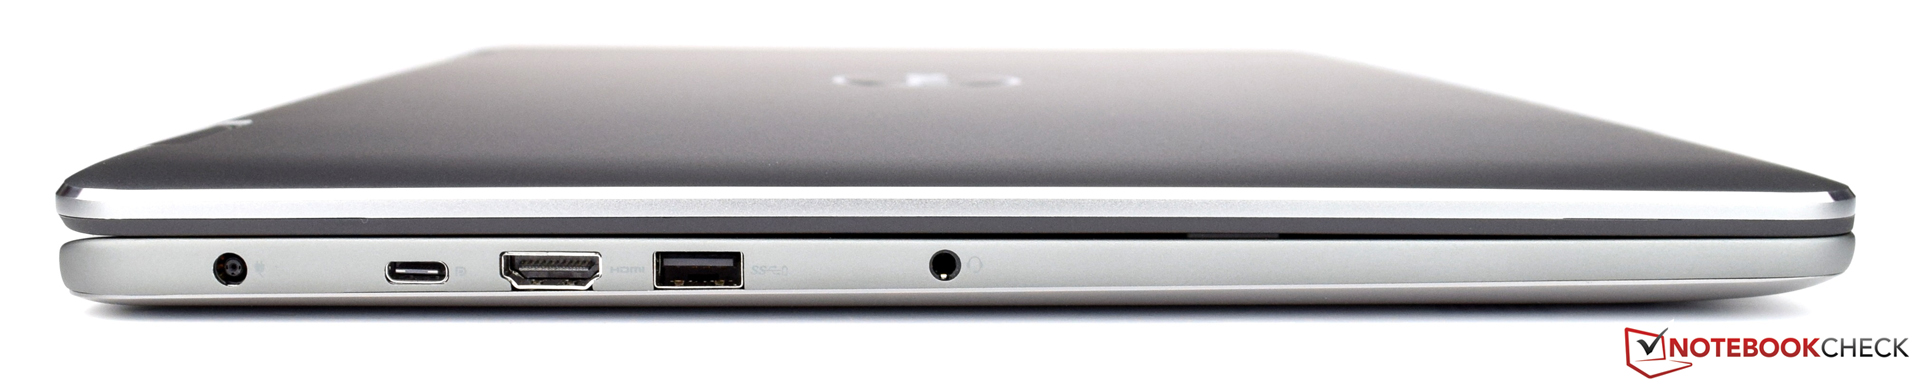
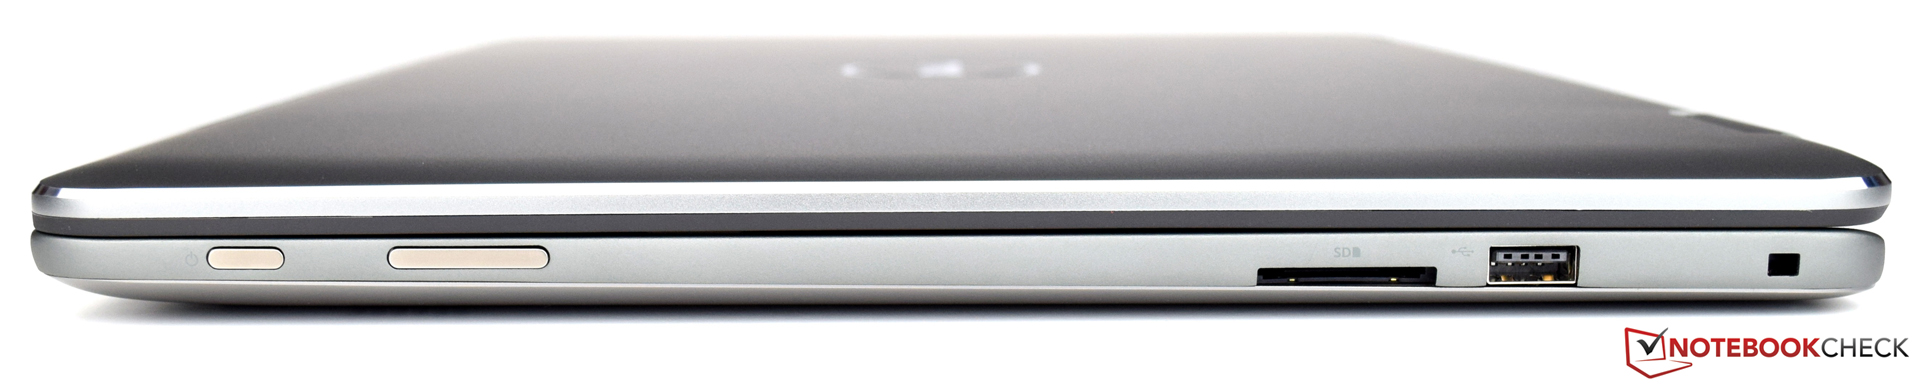
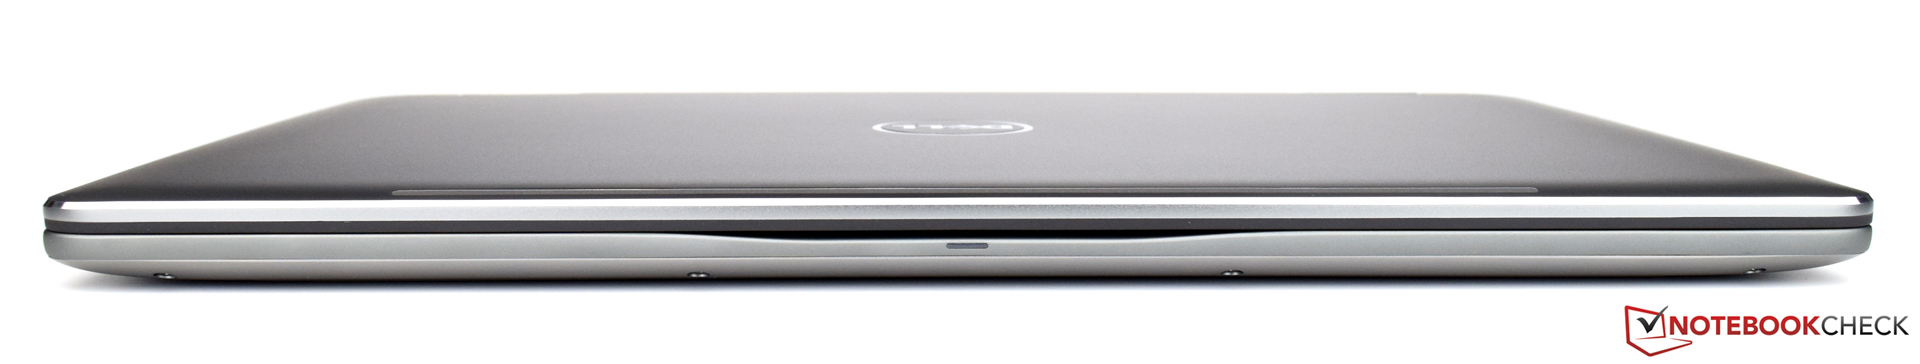
En particular, el diseño elegante y modesto nos convenció en la prueba. La selección de materiales, que proporciona una muy buena estabilidad al dispositivo, es igualmente exitosa. Con la pantalla y el teclado, el fabricante debería tener algunas quejas en serio, con el fin de mejorar las pequeñas pero importantes inconsistencias en la próxima actualización. La tarjeta gráfica que tiende a generar cuello de botella, también destaca negativamente, incluso si su influencia en el rendimiento no es tan grande. Pero en general, el Dell Inspiron 17 7773 es un muy buen dispositivo multimedia con las ventajas de un convertible.
Ésta es una versión acortada del análisis original. Puedes leer el análisis completo en inglés aquí.
Dell Inspiron 17-7773-0043
- 11/06/2017 v6 (old)
Sebastian Bade