Breve análisis del HP Pavilion Power 15t-cb2000 (i7-7700HQ, Radeon RX 550)


| SD Card Reader | |
| average JPG Copy Test (av. of 3 runs) | |
| HP Pavilion 15 Power 1GK62AV | |
| HP Omen 17-w206ng | |
| HP Omen 15-ax213ng | |
| Samsung Notebook 9 NP900X5N-X01US | |
| HP Pavilion Power 15t-cb2000 | |
| maximum AS SSD Seq Read Test (1GB) | |
| HP Pavilion Power 15t-cb2000 | |
| HP Omen 15-ax213ng | |
| HP Omen 17-w206ng | |
| Samsung Notebook 9 NP900X5N-X01US | |
| HP Pavilion 15 Power 1GK62AV | |
| |||||||||||||||||||||||||
iluminación: 88 %
Brillo con batería: 256 cd/m²
Contraste: 1219:1 (Negro: 0.21 cd/m²)
ΔE ColorChecker Calman: 5.2 | ∀{0.5-29.43 Ø4.71}
ΔE Greyscale Calman: 3.5 | ∀{0.09-98 Ø4.96}
59% sRGB (Argyll 1.6.3 3D)
37% AdobeRGB 1998 (Argyll 1.6.3 3D)
40.59% AdobeRGB 1998 (Argyll 3D)
58.9% sRGB (Argyll 3D)
39.28% Display P3 (Argyll 3D)
Gamma: 2.35
CCT: 6576 K
| HP Pavilion Power 15t-cb2000 AUO41ED , IPS, 15.6", 1920x1080 | HP Pavilion 15 Power 1GK62AV ID: AU Optronics AUO41ED, IPS, 15.6", 1920x1080 | HP Omen 15-ax213ng AU Optronics AUO41ED, IPS, 15.6", 1920x1080 | HP Omen 17-w206ng Chi Mei CMN1738, IPS, 17.3", 1920x1080 | Samsung Notebook 9 NP900X5N-X01US ID: BOE06E8, Name: BOE HF NV150FHB-N31, IPS, 15", 1920x1080 | |
|---|---|---|---|---|---|
| Display | -1% | -2% | 65% | 66% | |
| Display P3 Coverage (%) | 39.28 | 38.81 -1% | 38.59 -2% | 67.2 71% | 65.2 66% |
| sRGB Coverage (%) | 58.9 | 57.9 -2% | 58 -2% | 93.1 58% | 97.7 66% |
| AdobeRGB 1998 Coverage (%) | 40.59 | 40.03 -1% | 39.87 -2% | 67.4 66% | 67.2 66% |
| Response Times | 15% | 12% | 19% | 5% | |
| Response Time Grey 50% / Grey 80% * (ms) | 51.6 ? | 38.8 ? 25% | 42 ? 19% | 38 ? 26% | 40.8 ? 21% |
| Response Time Black / White * (ms) | 29.2 ? | 28 ? 4% | 28 ? 4% | 26 ? 11% | 32.4 ? -11% |
| PWM Frequency (Hz) | 200 ? | 208.3 ? | |||
| Screen | 3% | 7% | 17% | 40% | |
| Brightness middle (cd/m²) | 256 | 256.6 0% | 230 -10% | 318 24% | 565.6 121% |
| Brightness (cd/m²) | 241 | 243 1% | 228 -5% | 295 22% | 524 117% |
| Brightness Distribution (%) | 88 | 81 -8% | 88 0% | 79 -10% | 88 0% |
| Black Level * (cd/m²) | 0.21 | 0.19 10% | 0.21 -0% | 0.25 -19% | 0.49 -133% |
| Contrast (:1) | 1219 | 1351 11% | 1095 -10% | 1272 4% | 1154 -5% |
| Colorchecker dE 2000 * | 5.2 | 5 4% | 4.01 23% | 4.7 10% | 2 62% |
| Colorchecker dE 2000 max. * | 19.3 | 20.1 -4% | 7.26 62% | 8.8 54% | 5 74% |
| Greyscale dE 2000 * | 3.5 | 2.7 23% | 3.18 9% | 5 -43% | 2.5 29% |
| Gamma | 2.35 94% | 2.32 95% | 2.52 87% | 2.28 96% | 2.21 100% |
| CCT | 6576 99% | 6599 98% | 6814 95% | 7374 88% | 6896 94% |
| Color Space (Percent of AdobeRGB 1998) (%) | 37 | 36.7 -1% | 37 0% | 61 65% | 61.2 65% |
| Color Space (Percent of sRGB) (%) | 59 | 57.7 -2% | 58 -2% | 93 58% | 97.5 65% |
| Media total (Programa/Opciones) | 6% /
4% | 6% /
6% | 34% /
26% | 37% /
40% |
* ... más pequeño es mejor
Tiempos de respuesta del display
| ↔ Tiempo de respuesta de Negro a Blanco | ||
|---|---|---|
| 29.2 ms ... subida ↗ y bajada ↘ combinada | ↗ 16.8 ms subida | 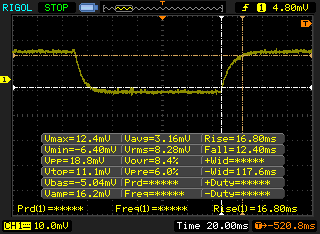 |
| ↘ 12.4 ms bajada | ||
| La pantalla mostró tiempos de respuesta relativamente lentos en nuestros tests pero podría ser demasiado lenta para los jugones. En comparación, todos los dispositivos de prueba van de ##min### (mínimo) a 240 (máximo) ms. » 78 % de todos los dispositivos son mejores. Eso quiere decir que el tiempo de respuesta es peor que la media (19.8 ms) de todos los dispositivos testados. | ||
| ↔ Tiempo de respuesta 50% Gris a 80% Gris | ||
| 51.6 ms ... subida ↗ y bajada ↘ combinada | ↗ 26.4 ms subida | 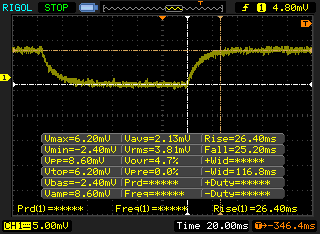 |
| ↘ 25.2 ms bajada | ||
| La pantalla mostró tiempos de respuesta lentos en nuestros tests y podría ser demasiado lenta para los jugones. En comparación, todos los dispositivos de prueba van de ##min### (mínimo) a 636 (máximo) ms. » 88 % de todos los dispositivos son mejores. Eso quiere decir que el tiempo de respuesta es peor que la media (30.9 ms) de todos los dispositivos testados. | ||
Parpadeo de Pantalla / PWM (Pulse-Width Modulation)
| Parpadeo de Pantalla / PWM no detectado | 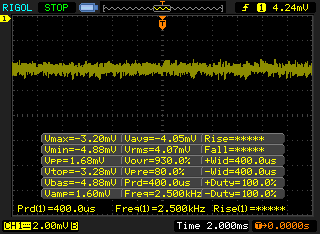 | ||
Comparación: 52 % de todos los dispositivos testados no usaron PWM para atenuar el display. Si se usó, medimos una media de 7744 (mínimo: 5 - máxmo: 343500) Hz. | |||
| wPrime 2.10 - 1024m | |
| Samsung Notebook 9 NP900X5N-X01US | |
| HP Pavilion Power 15t-cb2000 | |
| HP Pavilion 15 Power 1GK62AV | |
* ... más pequeño es mejor
| PCMark 8 | |
| Home Score Accelerated v2 | |
| HP Pavilion Power 15t-cb2000 | |
| HP Omen 17-w206ng | |
| HP Omen 15-ax213ng | |
| HP Pavilion 15 Power 1GK62AV | |
| Samsung Notebook 9 NP900X5N-X01US | |
| Work Score Accelerated v2 | |
| HP Pavilion 15 Power 1GK62AV | |
| Samsung Notebook 9 NP900X5N-X01US | |
| HP Pavilion Power 15t-cb2000 | |
| HP Omen 15-ax213ng | |
| Creative Score Accelerated v2 | |
| HP Omen 15-ax213ng | |
| HP Pavilion 15 Power 1GK62AV | |
| HP Pavilion Power 15t-cb2000 | |
| Samsung Notebook 9 NP900X5N-X01US | |
| PCMark 8 Home Score Accelerated v2 | 4499 puntos | |
| PCMark 8 Creative Score Accelerated v2 | 5151 puntos | |
| PCMark 8 Work Score Accelerated v2 | 4627 puntos | |
| PCMark 10 Score | 3802 puntos | |
ayuda | ||
| HP Pavilion Power 15t-cb2000 HGST Travelstar 7K1000 HTS721010A9E630 | HP Pavilion 15 Power 1GK62AV SK Hynix HFS256G39TND-N210A | HP Omen 15-ax213ng Samsung PM961 MZVLW256HEHP | HP Omen 17-w206ng Samsung PM961 MZVLW256HEHP | Samsung Notebook 9 NP900X5N-X01US Samsung PM961 MZVLW256HEHP | |
|---|---|---|---|---|---|
| CrystalDiskMark 3.0 | 8924% | 24609% | 22337% | 19660% | |
| Read Seq (MB/s) | 105.9 | 491.6 364% | 1657 1465% | 1606 1417% | 1447 1266% |
| Write Seq (MB/s) | 104.7 | 141.7 35% | 1208 1054% | 1176 1023% | 1281 1123% |
| Read 512 (MB/s) | 36.71 | 345.6 841% | 806 2096% | 846 2205% | 651 1673% |
| Write 512 (MB/s) | 49.86 | 142.6 186% | 807 1519% | 805 1515% | 765 1434% |
| Read 4k (MB/s) | 0.473 | 18.83 3881% | 62.6 13135% | 59.9 12564% | 58.3 12226% |
| Write 4k (MB/s) | 0.547 | 76.3 13849% | 176.9 32240% | 155.6 28346% | 131.9 24013% |
| Read 4k QD32 (MB/s) | 0.903 | 348.5 38494% | 650 71882% | 588 65016% | 545 60254% |
| Write 4k QD32 (MB/s) | 0.757 | 104.8 13744% | 557 73480% | 505 66611% | 419.3 55290% |

| 3DMark 11 | |
| 1280x720 Performance GPU | |
| HP Omen 15-ax213ng | |
| HP Omen 17-w206ng | |
| HP Pavilion 15 Power 1GK62AV | |
| HP Pavilion Power 15t-cb2000 | |
| HP Pavilion 17z 1EX13AV | |
| Samsung Notebook 9 NP900X5N-X01US | |
| Asus X555DA-BB11 | |
| HP 15-bw077ax | |
| 1280x720 Performance Combined | |
| HP Omen 17-w206ng | |
| HP Pavilion 15 Power 1GK62AV | |
| HP Omen 15-ax213ng | |
| HP Pavilion Power 15t-cb2000 | |
| Samsung Notebook 9 NP900X5N-X01US | |
| HP Pavilion 17z 1EX13AV | |
| Asus X555DA-BB11 | |
| HP 15-bw077ax | |
| 3DMark | |
| 1280x720 Cloud Gate Standard Graphics | |
| HP Omen 15-ax213ng | |
| HP Pavilion 15 Power 1GK62AV | |
| HP Pavilion Power 15t-cb2000 | |
| Samsung Notebook 9 NP900X5N-X01US | |
| HP Pavilion 17z 1EX13AV | |
| Asus X555DA-BB11 | |
| HP 15-bw077ax | |
| 1920x1080 Fire Strike Graphics | |
| HP Omen 15-ax213ng | |
| HP Pavilion 15 Power 1GK62AV | |
| HP Pavilion Power 15t-cb2000 | |
| Samsung Notebook 9 NP900X5N-X01US | |
| HP Pavilion 17z 1EX13AV | |
| Asus X555DA-BB11 | |
| HP 15-bw077ax | |
| 1920x1080 Ice Storm Extreme Graphics | |
| HP Pavilion 15 Power 1GK62AV | |
| HP Pavilion Power 15t-cb2000 | |
| HP Omen 15-ax213ng | |
| HP Pavilion 17z 1EX13AV | |
| Samsung Notebook 9 NP900X5N-X01US | |
| Asus X555DA-BB11 | |
| 3DMark 06 Standard Score | 23308 puntos | |
| 3DMark 11 Performance | 5704 puntos | |
| 3DMark Ice Storm Standard Score | 92226 puntos | |
| 3DMark Cloud Gate Standard Score | 15004 puntos | |
| 3DMark Fire Strike Score | 3738 puntos | |
| 3DMark Fire Strike Extreme Score | 1775 puntos | |
| 3DMark Time Spy Score | 1302 puntos | |
ayuda | ||
| BioShock Infinite | |
| 1920x1080 Ultra Preset, DX11 (DDOF) (ordenar por valor) | |
| HP Pavilion Power 15t-cb2000 | |
| HP Pavilion 15 Power 1GK62AV | |
| HP Omen 15-ax213ng | |
| Samsung Notebook 9 NP900X5N-X01US | |
| HP Pavilion 17z 1EX13AV | |
| 1366x768 High Preset (ordenar por valor) | |
| HP Pavilion Power 15t-cb2000 | |
| HP Omen 15-ax213ng | |
| Samsung Notebook 9 NP900X5N-X01US | |
| HP 15-bw077ax | |
| HP Pavilion 17z 1EX13AV | |
| 1366x768 Medium Preset (ordenar por valor) | |
| HP Pavilion Power 15t-cb2000 | |
| HP Omen 15-ax213ng | |
| Samsung Notebook 9 NP900X5N-X01US | |
| HP 15-bw077ax | |
| HP Pavilion 17z 1EX13AV | |
| 1280x720 Very Low Preset (ordenar por valor) | |
| HP Pavilion Power 15t-cb2000 | |
| HP Omen 15-ax213ng | |
| Samsung Notebook 9 NP900X5N-X01US | |
| HP 15-bw077ax | |
| HP Pavilion 17z 1EX13AV | |
| Asus X555DA-BB11 | |
| Metro: Last Light | |
| 1920x1080 Very High (DX11) AF:16x (ordenar por valor) | |
| HP Pavilion Power 15t-cb2000 | |
| HP Pavilion 15 Power 1GK62AV | |
| 1366x768 High (DX11) AF:16x (ordenar por valor) | |
| HP Pavilion Power 15t-cb2000 | |
| HP Pavilion 15 Power 1GK62AV | |
| HP 15-bw077ax | |
| 1366x768 Medium (DX10) AF:4x (ordenar por valor) | |
| HP Pavilion Power 15t-cb2000 | |
| HP 15-bw077ax | |
| 1024x768 Low (DX10) AF:4x (ordenar por valor) | |
| HP Pavilion Power 15t-cb2000 | |
| HP 15-bw077ax | |
| Thief | |
| 1920x1080 Very High Preset AA:FXAA & High SS AF:8x (ordenar por valor) | |
| HP Pavilion Power 15t-cb2000 | |
| HP Pavilion 15 Power 1GK62AV | |
| 1366x768 High Preset AA:FXAA & Low SS AF:4x (ordenar por valor) | |
| HP Pavilion Power 15t-cb2000 | |
| HP Pavilion 15 Power 1GK62AV | |
| 1366x768 Normal Preset AA:FX (ordenar por valor) | |
| HP Pavilion Power 15t-cb2000 | |
| 1024x768 Very Low Preset (ordenar por valor) | |
| HP Pavilion Power 15t-cb2000 | |
| The Witcher 3 | |
| 1920x1080 Ultra Graphics & Postprocessing (HBAO+) (ordenar por valor) | |
| HP Pavilion Power 15t-cb2000 | |
| HP Pavilion 15 Power 1GK62AV | |
| HP Omen 15-ax213ng | |
| HP Omen 17-w206ng | |
| 1920x1080 High Graphics & Postprocessing (Nvidia HairWorks Off) (ordenar por valor) | |
| HP Pavilion 15 Power 1GK62AV | |
| HP Omen 15-ax213ng | |
| HP Omen 17-w206ng | |
| 1366x768 Medium Graphics & Postprocessing (ordenar por valor) | |
| HP Pavilion 15 Power 1GK62AV | |
| HP Omen 15-ax213ng | |
| HP Omen 17-w206ng | |
| 1024x768 Low Graphics & Postprocessing (ordenar por valor) | |
| HP Omen 15-ax213ng | |
| HP Omen 17-w206ng | |
| Samsung Notebook 9 NP900X5N-X01US | |
| HP 15-bw077ax | |
| HP Pavilion 17z 1EX13AV | |
| Rise of the Tomb Raider | |
| 1920x1080 Very High Preset AA:FX AF:16x (ordenar por valor) | |
| HP Pavilion Power 15t-cb2000 | |
| HP Pavilion 15 Power 1GK62AV | |
| HP Omen 15-ax213ng | |
| 1920x1080 High Preset AA:FX AF:4x (ordenar por valor) | |
| HP Pavilion Power 15t-cb2000 | |
| HP Pavilion 15 Power 1GK62AV | |
| HP Omen 15-ax213ng | |
| Samsung Notebook 9 NP900X5N-X01US | |
| 1366x768 Medium Preset AF:2x (ordenar por valor) | |
| HP Pavilion Power 15t-cb2000 | |
| HP Omen 15-ax213ng | |
| Samsung Notebook 9 NP900X5N-X01US | |
| HP 15-bw077ax | |
| HP Pavilion 17z 1EX13AV | |
| 1024x768 Lowest Preset (ordenar por valor) | |
| HP Pavilion Power 15t-cb2000 | |
| HP Omen 15-ax213ng | |
| Samsung Notebook 9 NP900X5N-X01US | |
| HP 15-bw077ax | |
| HP Pavilion 17z 1EX13AV | |
| Asus X555DA-BB11 | |
| Batman: Arkham Knight | |
| 1920x1080 High / On AA:SM AF:16x (ordenar por valor) | |
| HP Pavilion Power 15t-cb2000 | |
| HP Pavilion 15 Power 1GK62AV | |
| 1920x1080 High / On (Interactive Smoke & Paper Debris Off) AA:SM AF:8x (ordenar por valor) | |
| HP Pavilion Power 15t-cb2000 | |
| 1366x768 Normal / Off AF:4x (ordenar por valor) | |
| HP Pavilion Power 15t-cb2000 | |
| HP Pavilion 15 Power 1GK62AV | |
| HP 15-bw077ax | |
| 1280x720 Low / Off AF:Trilinear (ordenar por valor) | |
| HP Pavilion Power 15t-cb2000 | |
| HP Pavilion 15 Power 1GK62AV | |
| HP 15-bw077ax | |
| HP Pavilion 17z 1EX13AV | |
| Ashes of the Singularity | |
| 1280x768 low (ordenar por valor) | |
| HP Pavilion Power 15t-cb2000 | |
| HP Pavilion 15 Power 1GK62AV | |
| HP 15-bw077ax | |
| 1920x1080 Standard (ordenar por valor) | |
| HP Pavilion Power 15t-cb2000 | |
| HP Pavilion 15 Power 1GK62AV | |
| 1920x1080 high (ordenar por valor) | |
| HP Pavilion Power 15t-cb2000 | |
| HP Pavilion 15 Power 1GK62AV | |
| Doom | |
| 1920x1080 Ultra Preset AA:SM (ordenar por valor) | |
| HP Pavilion Power 15t-cb2000 | |
| HP Pavilion 15 Power 1GK62AV | |
| 1920x1080 High Preset AA:FX (ordenar por valor) | |
| HP Pavilion Power 15t-cb2000 | |
| HP Pavilion 15 Power 1GK62AV | |
| 1366x768 Medium Preset (ordenar por valor) | |
| HP Pavilion Power 15t-cb2000 | |
| HP Pavilion 15 Power 1GK62AV | |
| 1280x720 Low Preset (ordenar por valor) | |
| HP Pavilion Power 15t-cb2000 | |
| HP Pavilion 15 Power 1GK62AV | |
| HP Pavilion 17z 1EX13AV | |
| bajo | medio | alto | ultra | |
|---|---|---|---|---|
| Tomb Raider (2013) | 289.8 | 149.5 | 114.9 | 51.2 |
| BioShock Infinite (2013) | 183 | 133 | 117 | 67 |
| Metro: Last Light (2013) | 90 | 85.4 | 59.5 | 28.4 |
| Thief (2014) | 65.2 | 58.3 | 55.1 | 29 |
| The Witcher 3 (2015) | 24 | |||
| Batman: Arkham Knight (2015) | 82 | 71 | 39 | 27 |
| Rise of the Tomb Raider (2016) | 91 | 54 | 27 | 21 |
| Ashes of the Singularity (2016) | 41.9 | 25.4 | 22 | |
| Doom (2016) | 56 | 37 | 22 | 21 |
Ruido
| Ocioso |
| 30.8 / 30.9 / 31.1 dB(A) |
| Carga |
| 50.2 / 50.2 dB(A) |
 | ||
30 dB silencioso 40 dB(A) audible 50 dB(A) ruidosamente alto |
||
min: | ||
| HP Pavilion Power 15t-cb2000 Radeon RX 550 (Laptop), i7-7700HQ, HGST Travelstar 7K1000 HTS721010A9E630 | HP Pavilion 15 Power 1GK62AV GeForce GTX 1050 Mobile, i7-7700HQ, SK Hynix HFS256G39TND-N210A | HP Omen 15-ax213ng GeForce GTX 1050 Ti Mobile, i7-7700HQ, Samsung PM961 MZVLW256HEHP | HP Omen 17-w206ng GeForce GTX 1050 Ti Mobile, i7-7700HQ, Samsung PM961 MZVLW256HEHP | Samsung Notebook 9 NP900X5N-X01US GeForce 940MX, i7-7500U, Samsung PM961 MZVLW256HEHP | |
|---|---|---|---|---|---|
| Noise | 2% | -5% | -6% | 12% | |
| apagado / medio ambiente * (dB) | 28.4 | 27.8 2% | 30 -6% | 30 -6% | 28.3 -0% |
| Idle Minimum * (dB) | 30.8 | 32.1 -4% | 32 -4% | 34 -10% | 28.3 8% |
| Idle Average * (dB) | 30.9 | 32.2 -4% | 34 -10% | 35 -13% | 28.3 8% |
| Idle Maximum * (dB) | 31.1 | 32.2 -4% | 36 -16% | 36 -16% | 28.3 9% |
| Load Average * (dB) | 50.2 | 43.3 14% | 48 4% | 47 6% | 38.3 24% |
| Witcher 3 ultra * (dB) | 50.2 | 45 10% | 49 2% | 48 4% | |
| Load Maximum * (dB) | 50.2 | 49.6 1% | 51 -2% | 52 -4% | 38.3 24% |
* ... más pequeño es mejor
(±) La temperatura máxima en la parte superior es de 43.4 °C / 110 F, frente a la media de 36.8 °C / 98 F, que oscila entre 21 y 71 °C para la clase Multimedia.
(-) El fondo se calienta hasta un máximo de 54 °C / 129 F, frente a la media de 39.1 °C / 102 F
(+) En reposo, la temperatura media de la parte superior es de 31.5 °C / 89# F, frente a la media del dispositivo de 31.3 °C / 88 F.
(±) Jugando a The Witcher 3, la temperatura media de la parte superior es de 32.2 °C / 90 F, frente a la media del dispositivo de 31.3 °C / 88 F.
(±) El reposamanos y el touchpad pueden calentarse mucho al tacto con un máximo de 37.8 °C / 100 F.
(-) La temperatura media de la zona del reposamanos de dispositivos similares fue de 28.7 °C / 83.7 F (-9.1 °C / -16.3 F).
HP Pavilion Power 15t-cb2000 análisis de audio
(±) | la sonoridad del altavoz es media pero buena (74.6 dB)
Graves 100 - 315 Hz
(-) | casi sin bajos - de media 16.2% inferior a la mediana
(±) | la linealidad de los graves es media (13.8% delta a frecuencia anterior)
Medios 400 - 2000 Hz
(+) | medios equilibrados - a sólo 4.3% de la mediana
(+) | los medios son lineales (6.8% delta a la frecuencia anterior)
Altos 2 - 16 kHz
(+) | máximos equilibrados - a sólo 3.1% de la mediana
(±) | la linealidad de los máximos es media (8.3% delta a frecuencia anterior)
Total 100 - 16.000 Hz
(±) | la linealidad del sonido global es media (25.4% de diferencia con la mediana)
En comparación con la misma clase
» 90% de todos los dispositivos probados de esta clase eran mejores, 2% similares, 8% peores
» El mejor tuvo un delta de 5%, la media fue 17%, el peor fue ###max##%
En comparación con todos los dispositivos probados
» 78% de todos los dispositivos probados eran mejores, 5% similares, 17% peores
» El mejor tuvo un delta de 4%, la media fue 23%, el peor fue ###max##%
Apple MacBook 12 (Early 2016) 1.1 GHz análisis de audio
(+) | los altavoces pueden reproducir a un volumen relativamente alto (#83.6 dB)
Graves 100 - 315 Hz
(±) | lubina reducida - en promedio 11.3% inferior a la mediana
(±) | la linealidad de los graves es media (14.2% delta a frecuencia anterior)
Medios 400 - 2000 Hz
(+) | medios equilibrados - a sólo 2.4% de la mediana
(+) | los medios son lineales (5.5% delta a la frecuencia anterior)
Altos 2 - 16 kHz
(+) | máximos equilibrados - a sólo 2% de la mediana
(+) | los máximos son lineales (4.5% delta a la frecuencia anterior)
Total 100 - 16.000 Hz
(+) | el sonido global es lineal (10.2% de diferencia con la mediana)
En comparación con la misma clase
» 7% de todos los dispositivos probados de esta clase eran mejores, 2% similares, 90% peores
» El mejor tuvo un delta de 5%, la media fue 18%, el peor fue ###max##%
En comparación con todos los dispositivos probados
» 5% de todos los dispositivos probados eran mejores, 1% similares, 94% peores
» El mejor tuvo un delta de 4%, la media fue 23%, el peor fue ###max##%
| Off / Standby | |
| Ocioso | |
| Carga |
|
Clave:
min: | |
| HP Pavilion Power 15t-cb2000 i7-7700HQ, Radeon RX 550 (Laptop), HGST Travelstar 7K1000 HTS721010A9E630, IPS, 1920x1080, 15.6" | HP Pavilion 15 Power 1GK62AV i7-7700HQ, GeForce GTX 1050 Mobile, SK Hynix HFS256G39TND-N210A, IPS, 1920x1080, 15.6" | HP Omen 15-ax213ng i7-7700HQ, GeForce GTX 1050 Ti Mobile, Samsung PM961 MZVLW256HEHP, IPS, 1920x1080, 15.6" | HP Omen 17-w206ng i7-7700HQ, GeForce GTX 1050 Ti Mobile, Samsung PM961 MZVLW256HEHP, IPS, 1920x1080, 17.3" | Samsung Notebook 9 NP900X5N-X01US i7-7500U, GeForce 940MX, Samsung PM961 MZVLW256HEHP, IPS, 1920x1080, 15" | |
|---|---|---|---|---|---|
| Power Consumption | 10% | 0% | -18% | 41% | |
| Idle Minimum * (Watt) | 18.7 | 9.4 50% | 6 68% | 11 41% | 5 73% |
| Idle Average * (Watt) | 19.6 | 9.7 51% | 11 44% | 18 8% | 11.6 41% |
| Idle Maximum * (Watt) | 21.7 | 16.8 23% | 18 17% | 24 -11% | 12.2 44% |
| Load Average * (Watt) | 60.1 | 76.5 -27% | 81 -35% | 84 -40% | 47.8 20% |
| Witcher 3 ultra * (Watt) | 80.5 | 86.5 -7% | 90 -12% | 101 -25% | 51.9 36% |
| Load Maximum * (Watt) | 80.6 | 105.6 -31% | 146 -81% | 146 -81% | 55.7 31% |
* ... más pequeño es mejor
| HP Pavilion Power 15t-cb2000 i7-7700HQ, Radeon RX 550 (Laptop), 70 Wh | HP Pavilion 15 Power 1GK62AV i7-7700HQ, GeForce GTX 1050 Mobile, 70 Wh | HP Omen 15-ax213ng i7-7700HQ, GeForce GTX 1050 Ti Mobile, 63.3 Wh | HP Omen 17-w206ng i7-7700HQ, GeForce GTX 1050 Ti Mobile, 62 Wh | Samsung Notebook 9 NP900X5N-X01US i7-7500U, GeForce 940MX, 66 Wh | |
|---|---|---|---|---|---|
| Duración de Batería | 30% | 10% | 7% | 79% | |
| Reader / Idle (h) | 10.5 | 16.2 54% | 12.8 22% | 13.3 27% | 27.4 161% |
| WiFi v1.3 (h) | 5.7 | 8 40% | 7.1 25% | 6.3 11% | 10.1 77% |
| Load (h) | 1.9 | 1.8 -5% | 1.6 -16% | 1.6 -16% | 1.9 0% |
Pro
Contra


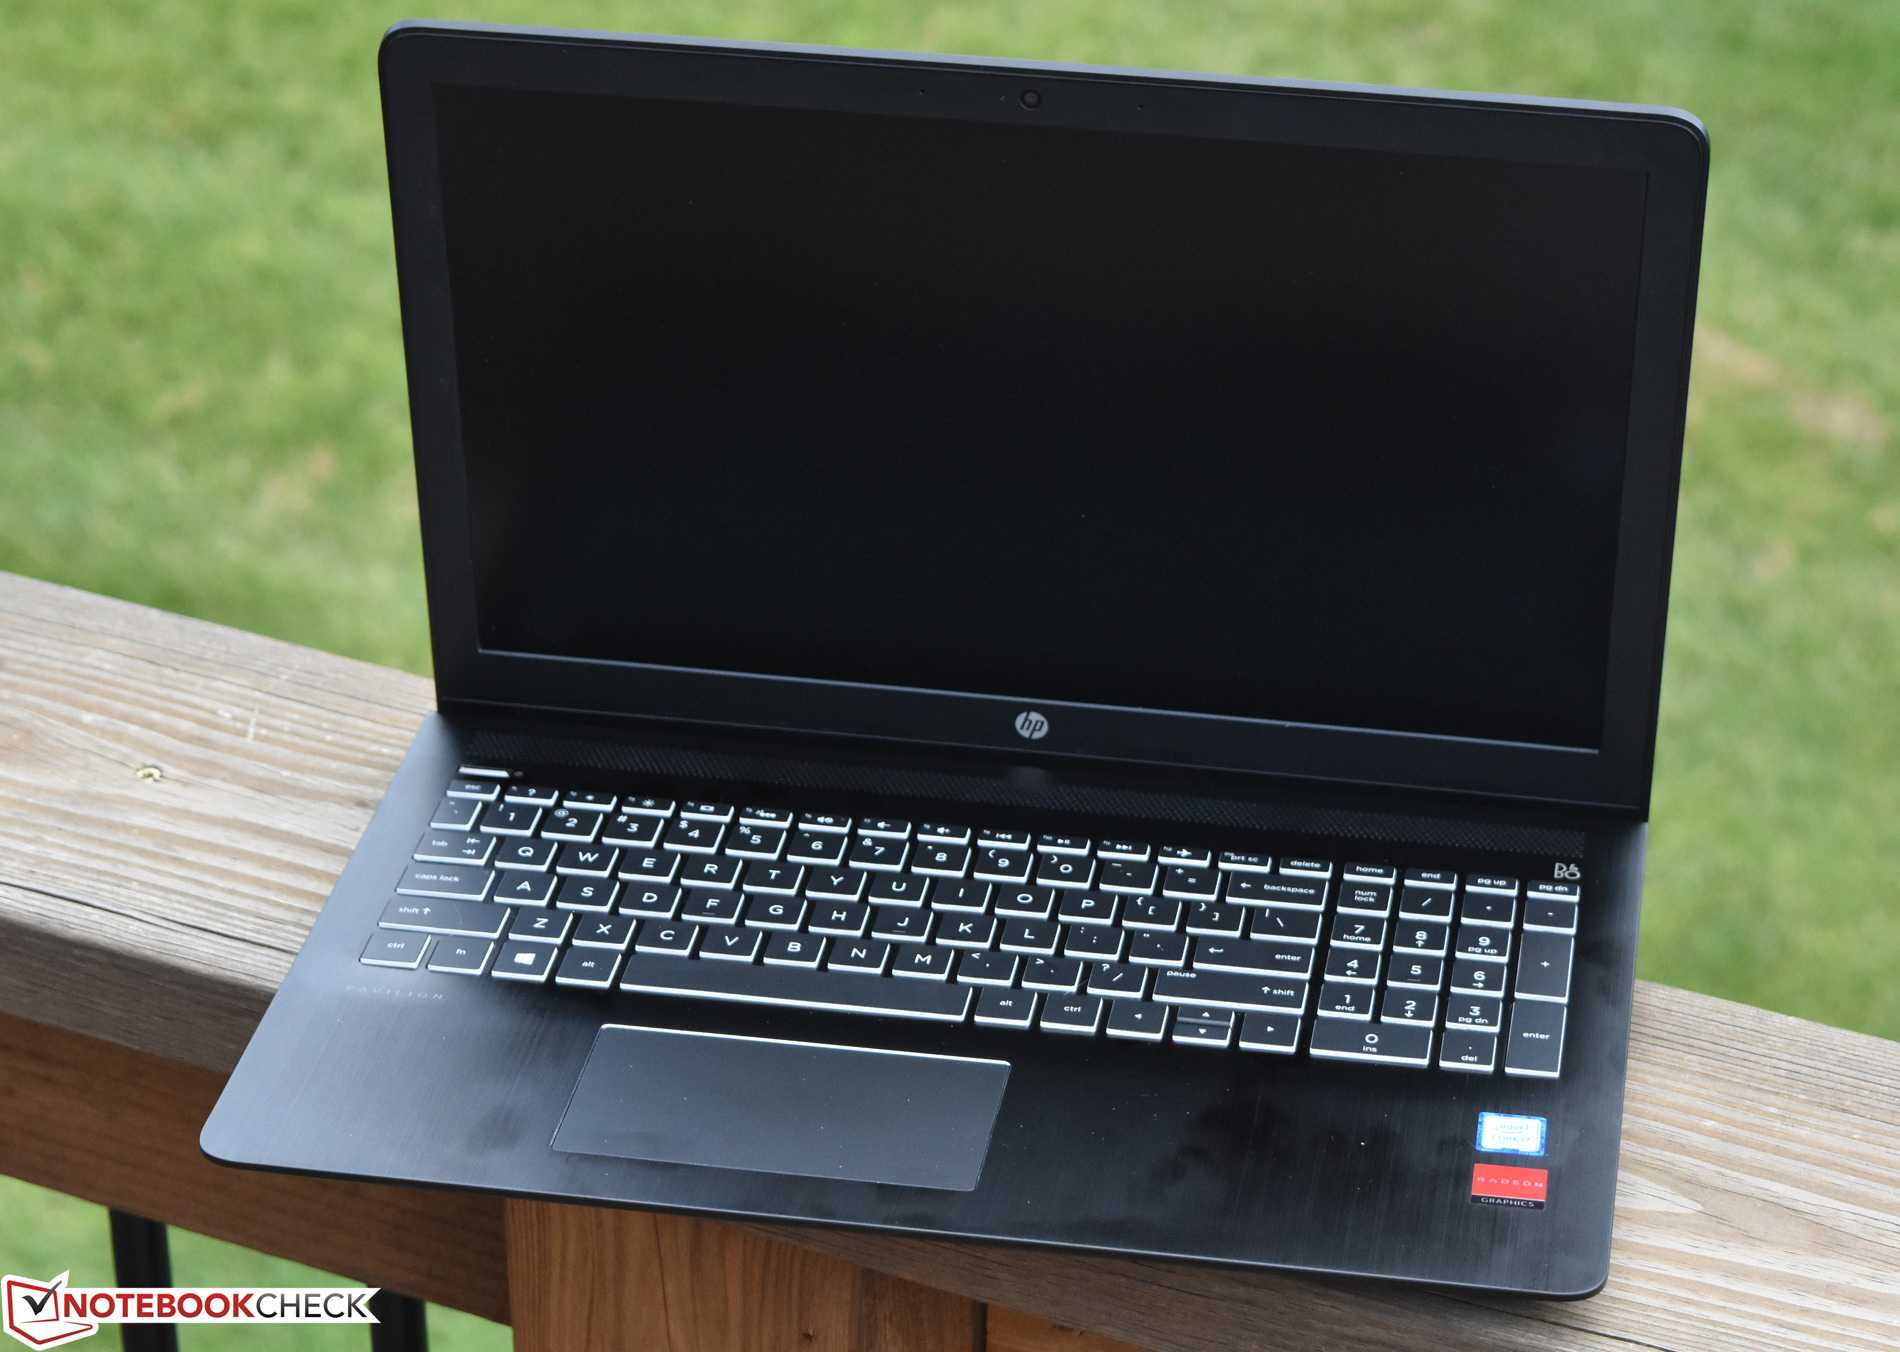
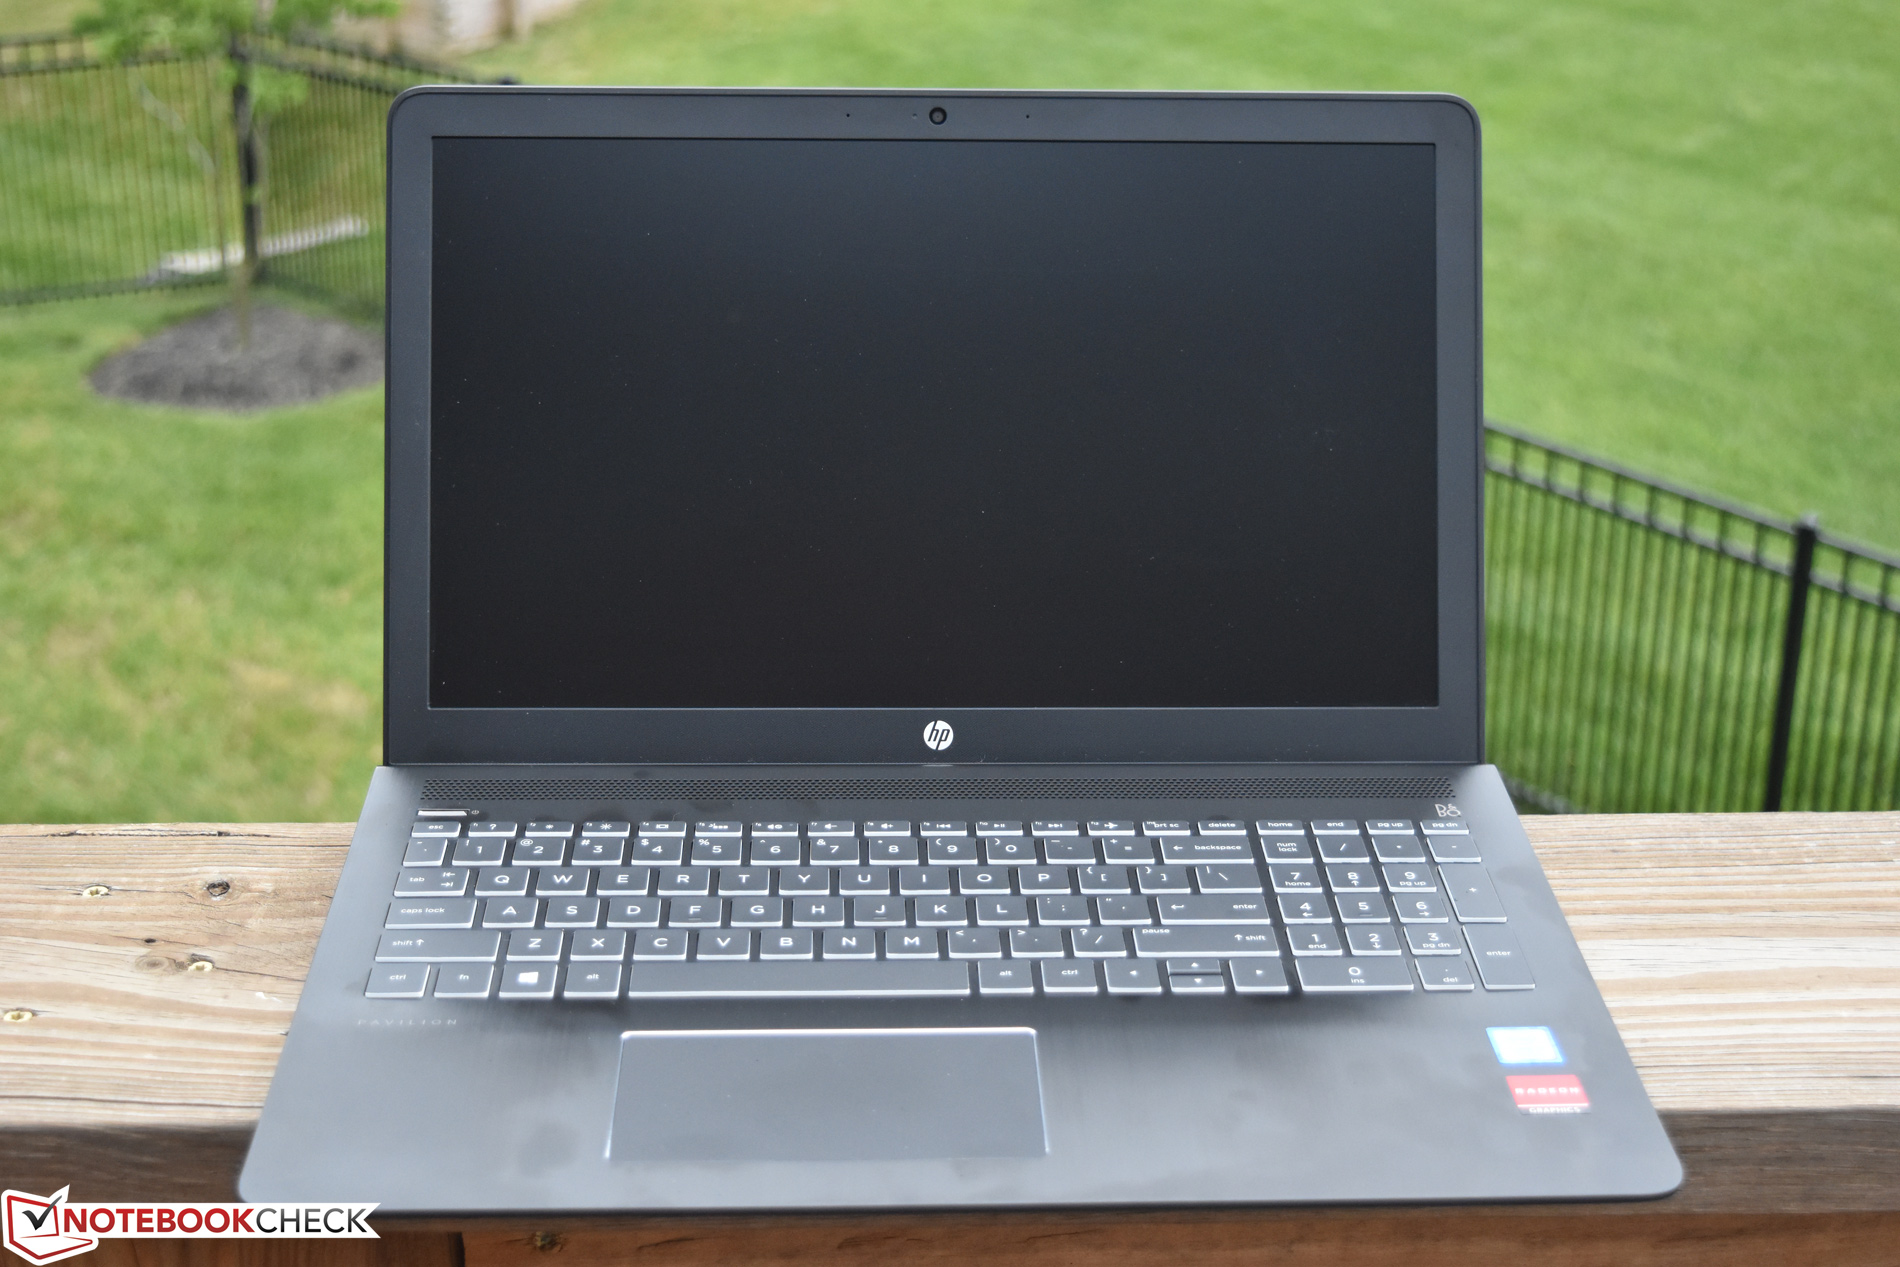
A apenas $880, la configuración de hoy del Pavilion Power 15 es claramente de gama media en prácticamente todos los aspectos. Aparte del popular Core i7-7700HQ, la máquina incluye 8 GB de RAM y dGPU, así como un display FHD antirreflejos bastante decente. También tiene una construcción bastante resistente y una saludable selección de puertos (aunque falta Thunderbolt 3). Dadas las circunstancias funciona bastante bien como máquina gaming básica—siempre que el usuario no se lleve a creer que los juegos del futuro próximo se podrán jugar igual que los de hoy.
El Pavilion Power 15t con gráfica AMD RX 550 funciona bastante bien como máquina gaming básica, pero aún así cuesta recomendarlo sobre la configuración NVIDIA GTX 1050 (con SSD y todo) que analizamos hace un par de semanas—una opción que apenas cuesta $120 más.
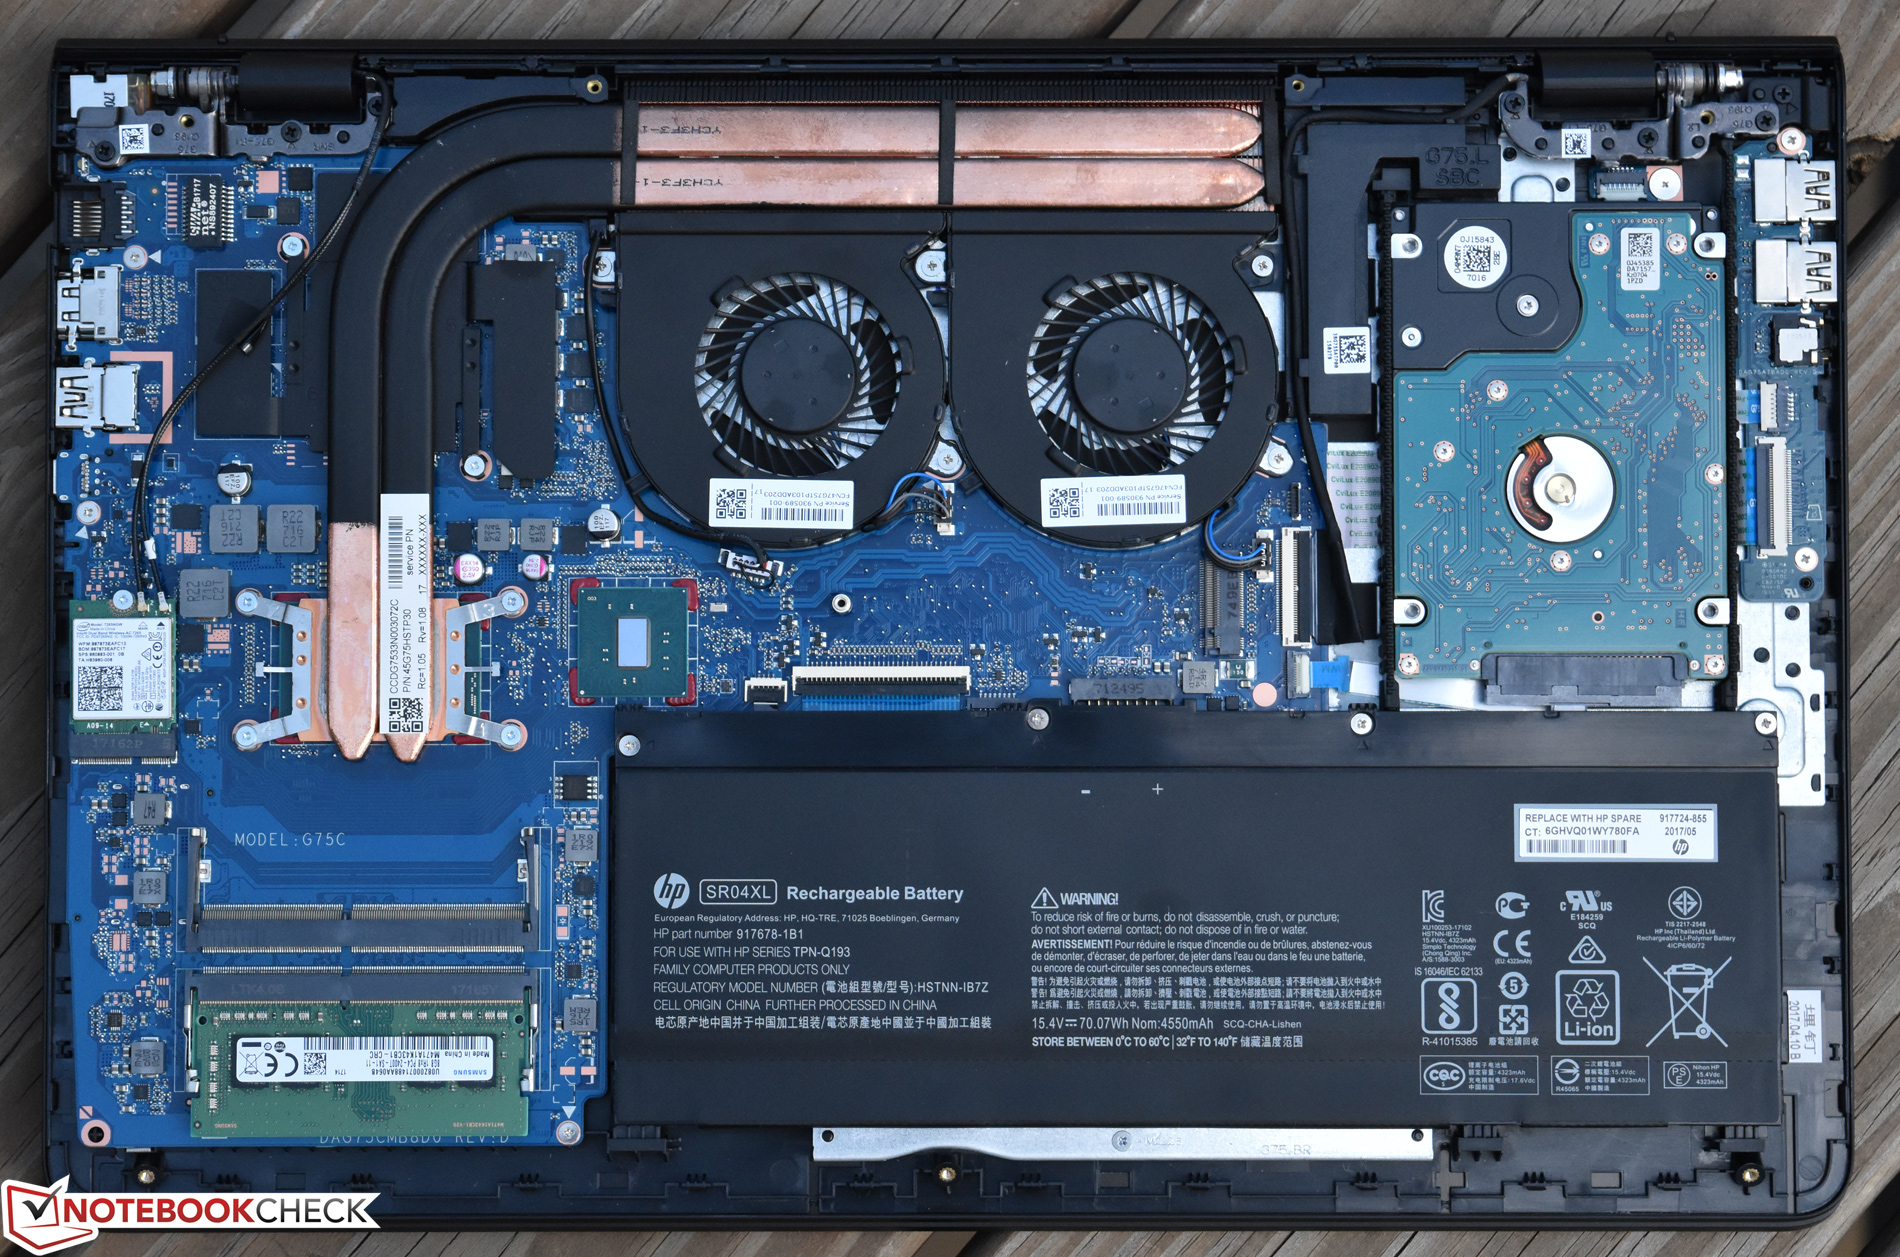
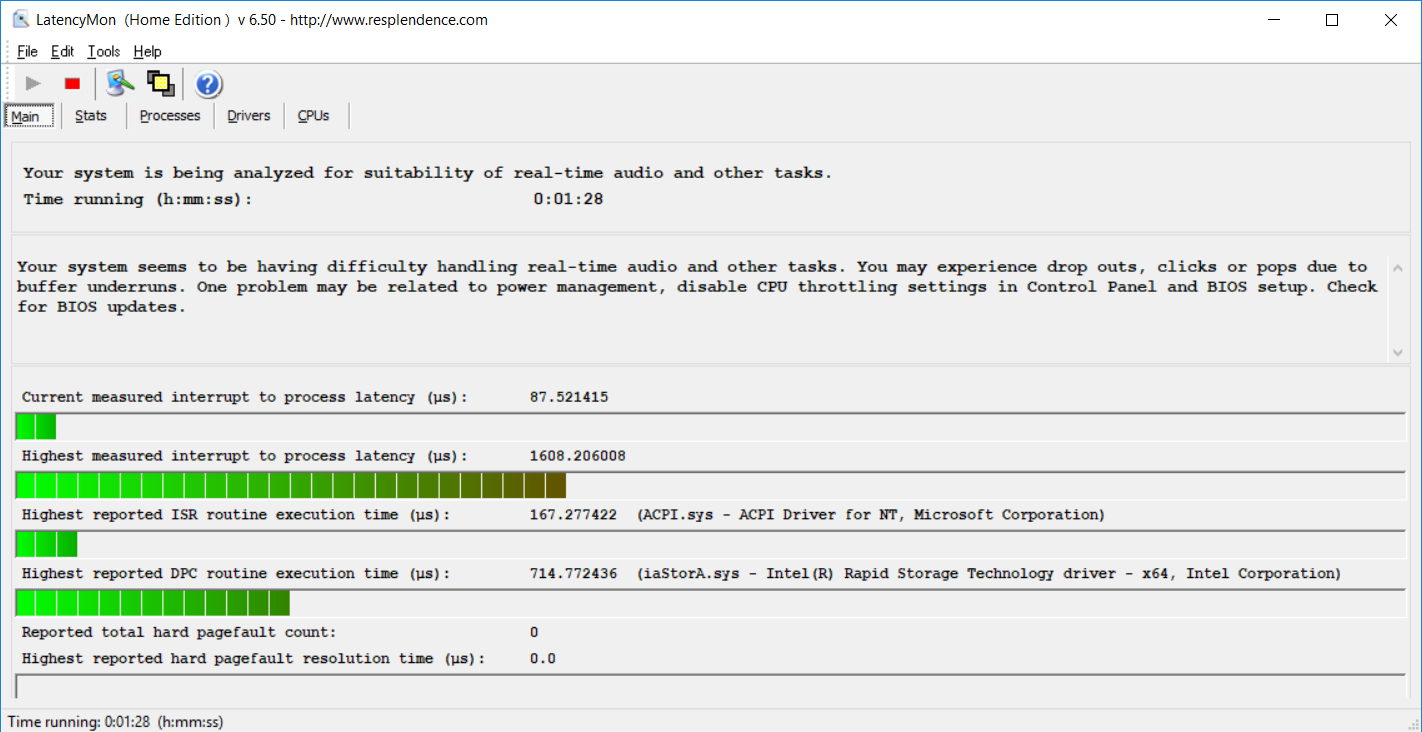
Sin embargo, aunque se puede mejorar, el almacenamiento—un disco de 1 TB 7200 RPM—es un cuello de botella en el funcionamiento general, y la RX 550 no puede competir (ya sea en rendimiento o eficiencia energética) con GPUs NVIDIA Pascal como la GTX 1050. Lo peor, no podemos decir definitivamente qué tan bien debería rendir la máquina en circunstancias ideales gracias a lo que parece ser un problema con el sistema de ventilación de nuestro modelo de pruebas. El rendimiento CPU de nuestro sistema se vio claramente afectado por las restricciones térmicas impuestas por este defecto, con temperaturas que superan los 90º C durante nuestro test de estrés y valores de pruebas desdde el 5% al—en circunstancias extremas—57% menores.
Asumiendo que estos problemas sean específicos de nuestro modelo, la configuración RX 550 sigue siendo difícil de recomendar sobre la configuración NVIDIA GTX 1050 (con SSD y todo) que analizamos hace un par de semanas—una opción que cuesta apenas $120 más. Contactaremos con el distribuidor y actualizaremos nuestro análisis si tenemos la opción de revisitar esta configuración con funcionalidad adecuada.
Ésta es una versión acortada del análisis original. Puedes leer el análisis completo en inglés aquí.
HP Pavilion Power 15t-cb2000
- 07/14/2017 v6 (old)
Steve Schardein
Price comparison
