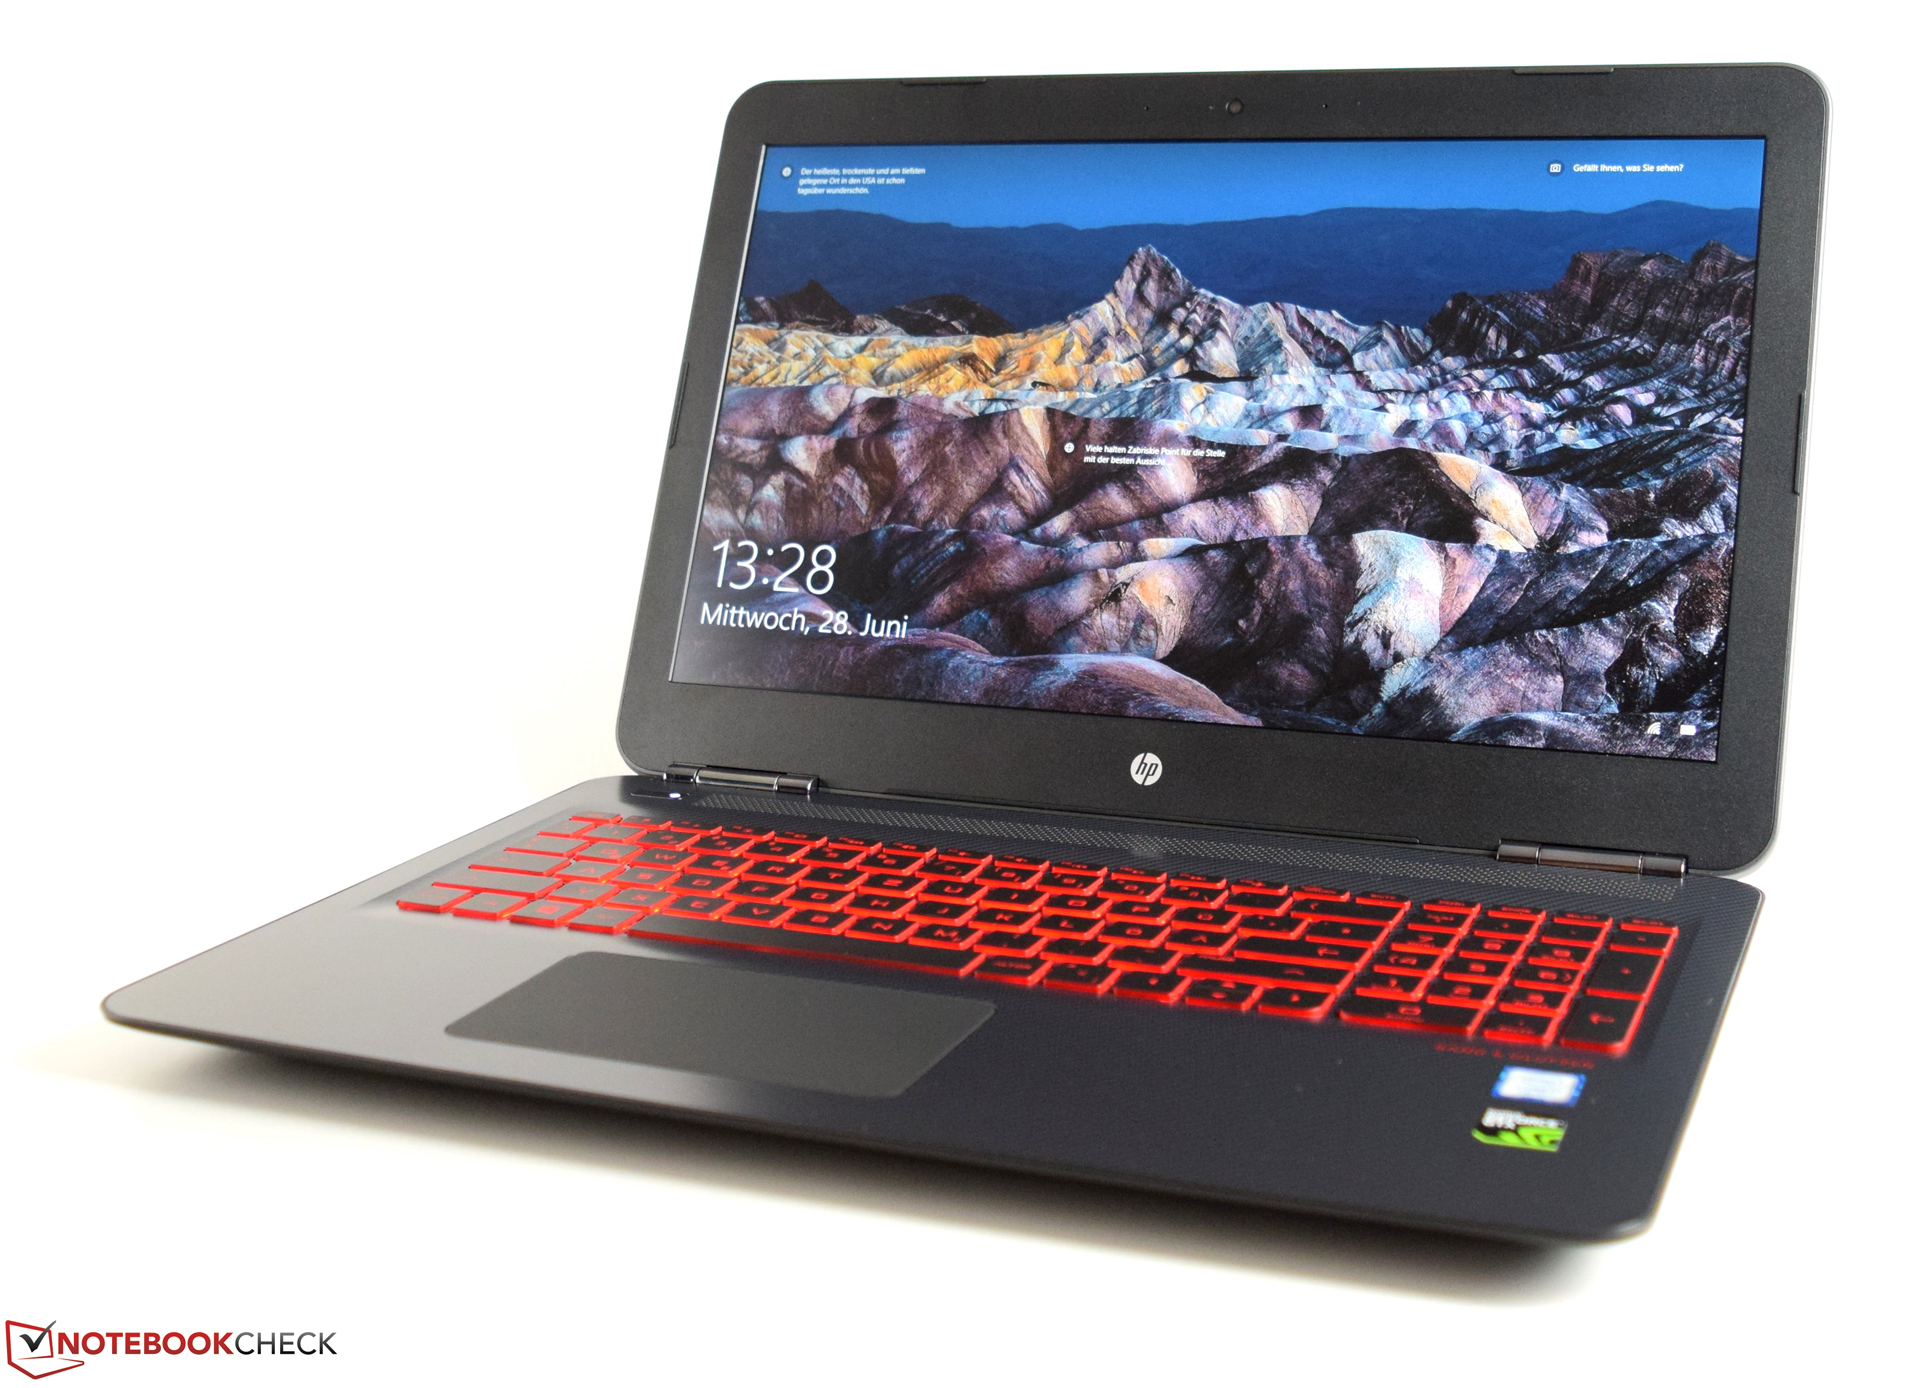
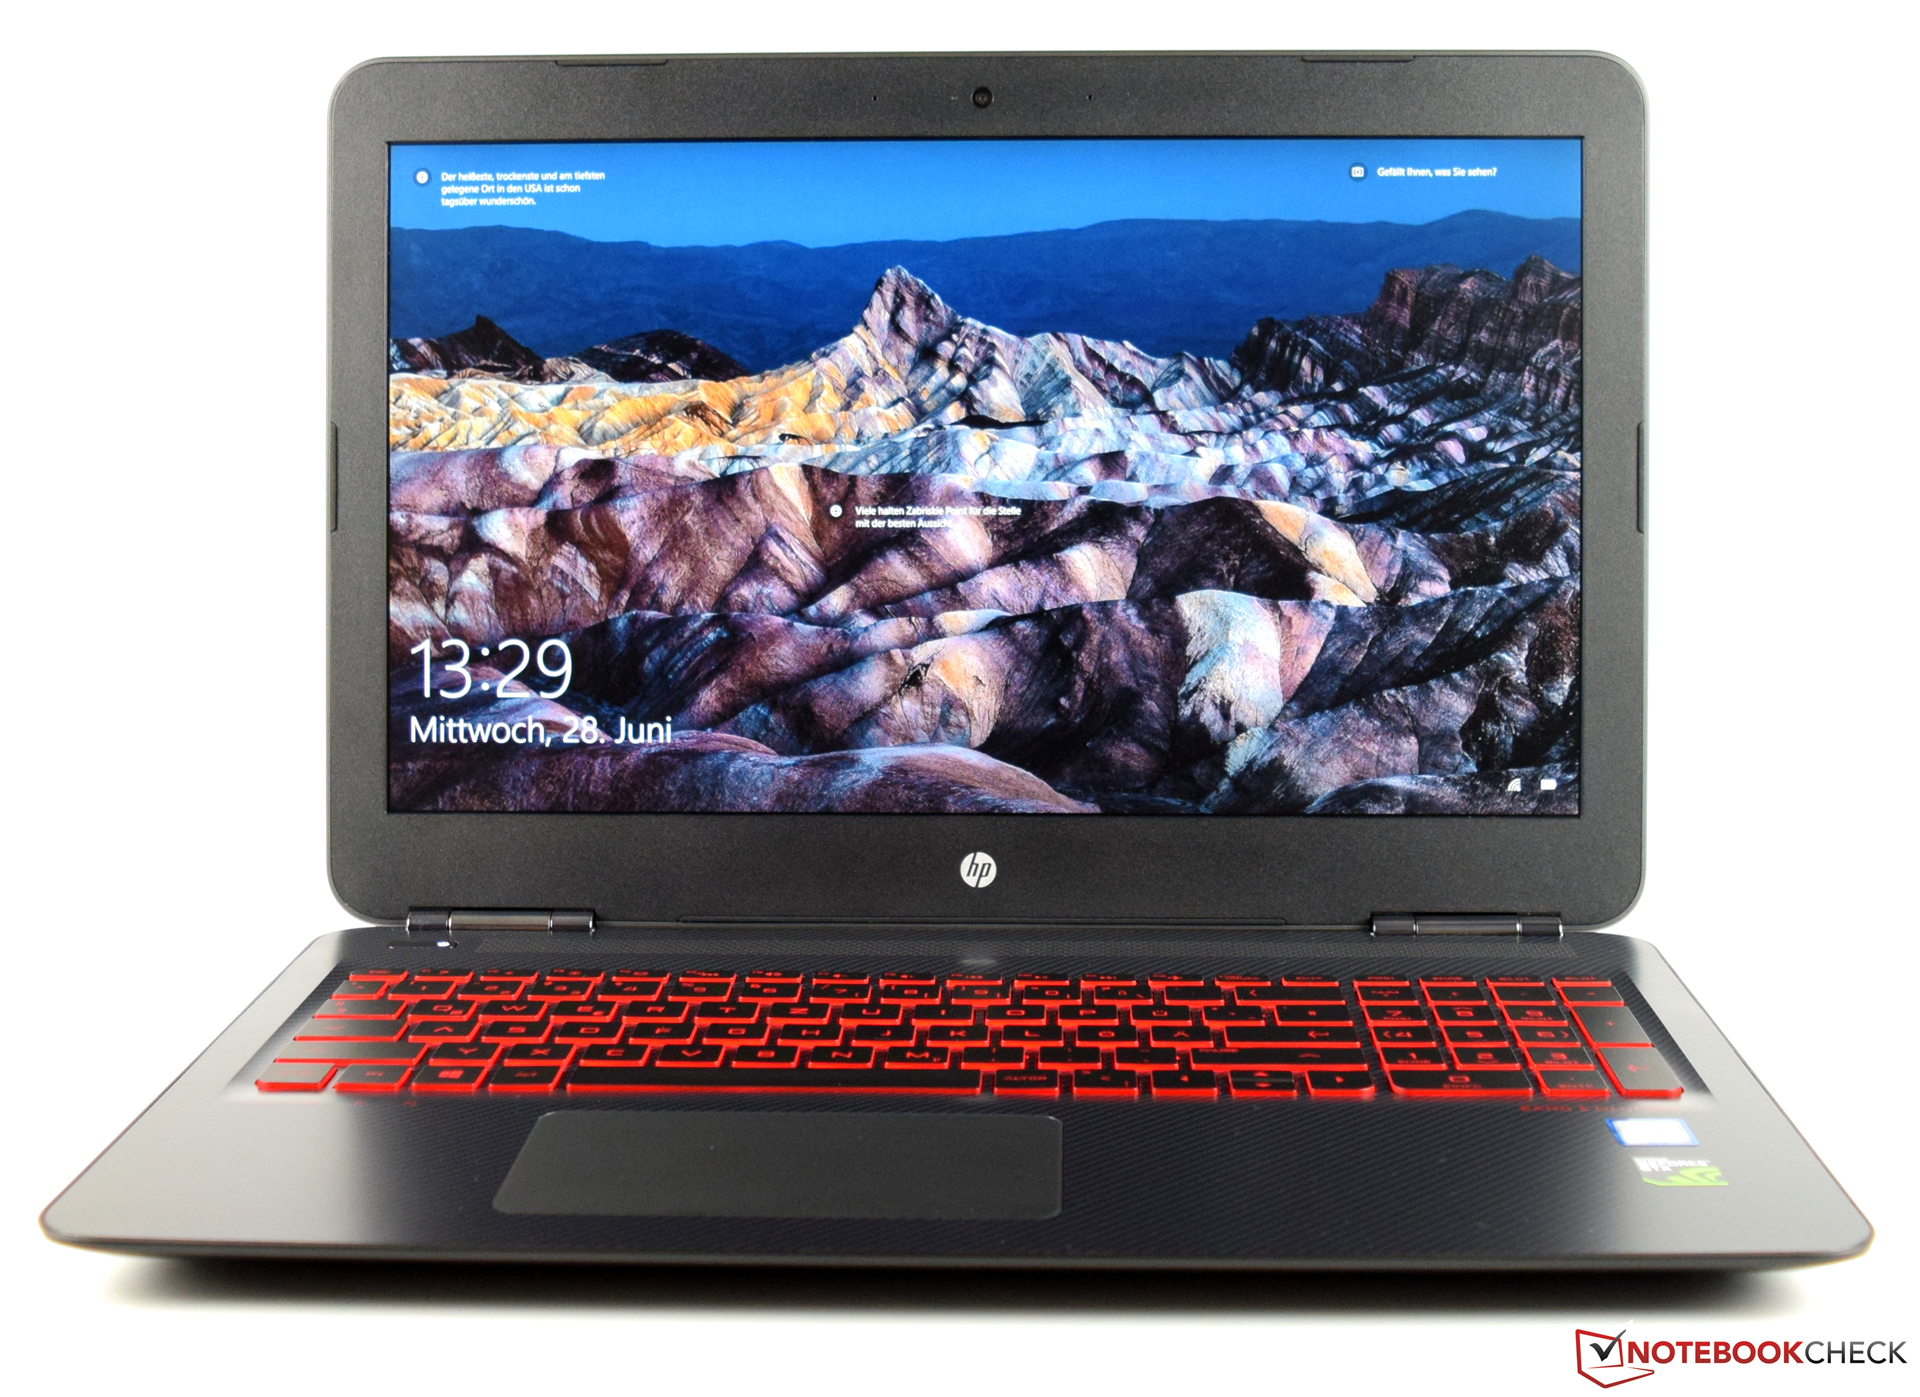
Breve análisis del portátil HP Omen 15t 2017 (7700HQ, GTX 1050 Ti, Full HD)
| SD Card Reader | |
| average JPG Copy Test (av. of 3 runs) | |
| Asus FX502VM-AS73 | |
| HP Omen 15-ax007ng | |
| HP Omen 15-ax213ng | |
| Lenovo Legion Y520-15IKBN-80WK001KUS | |
| Acer Aspire VX5-591G-75C4 VX15 | |
| Dell Inspiron 15 7000 7567 | |
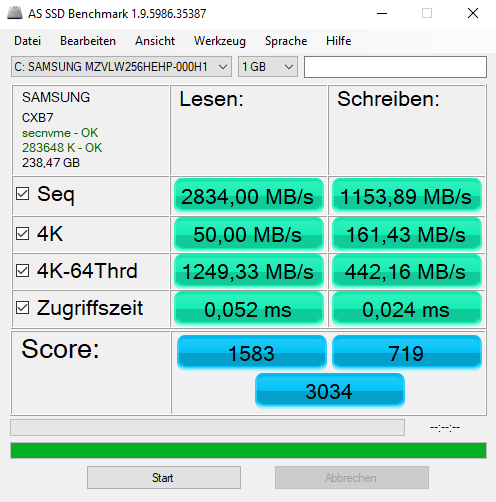
| maximum AS SSD Seq Read Test (1GB) | |
| Lenovo Legion Y520-15IKBN-80WK001KUS | |
| HP Omen 15-ax213ng | |
| Asus FX502VM-AS73 | |
| HP Omen 15-ax007ng | |
| Acer Aspire VX5-591G-75C4 VX15 | |
| Dell Inspiron 15 7000 7567 | |
| Networking | |
| iperf3 transmit AX12 | |
| Acer Aspire VX5-591G-75C4 VX15 | |
| HP Omen 15-ax213ng | |
| Asus FX502VM-AS73 | |
| Dell Inspiron 15 7000 7567 (jseb) | |
| Lenovo Legion Y520-15IKBN-80WK001KUS | |
| iperf3 receive AX12 | |
| HP Omen 15-ax213ng | |
| Asus FX502VM-AS73 | |
| Acer Aspire VX5-591G-75C4 VX15 | |
| Lenovo Legion Y520-15IKBN-80WK001KUS | |
| Dell Inspiron 15 7000 7567 (jseb) | |
| |||||||||||||||||||||||||
iluminación: 88 %
Brillo con batería: 230 cd/m²
Contraste: 1095:1 (Negro: 0.21 cd/m²)
ΔE ColorChecker Calman: 4.01 | ∀{0.5-29.43 Ø4.71}
ΔE Greyscale Calman: 3.18 | ∀{0.09-98 Ø4.96}
58% sRGB (Argyll 1.6.3 3D)
37% AdobeRGB 1998 (Argyll 1.6.3 3D)
39.87% AdobeRGB 1998 (Argyll 3D)
58% sRGB (Argyll 3D)
38.59% Display P3 (Argyll 3D)
Gamma: 2.52
CCT: 6814 K
| HP Omen 15-ax213ng AU Optronics AUO41ED, 1920x1080, 15.6" | HP Omen 15-ax007ng LGD0519, 1920x1080, 15.6" | Acer Aspire VX5-591G-75C4 VX15 LG Philips LGD0550 / LP156WF6-SPK4, 1920x1080, 15.6" | Dell Inspiron 15 7000 7567 AU Optronics AUO38ED B156HTN 28H80, 1920x1080, 15.6" | Lenovo Legion Y520-15IKBN-80WK001KUS LP156WF6-SPK3, 1920x1080, 15.6" | Asus FX502VM-AS73 1920x1080, 15.6" | |
|---|---|---|---|---|---|---|
| Display | 29% | 1% | -6% | -1% | ||
| Display P3 Coverage (%) | 38.59 | 59.9 55% 40.34 5% | 38.88 1% | 36.42 -6% | 38.28 -1% | |
| sRGB Coverage (%) | 58 | 85.9 48% 60.3 4% | 58.2 0% | 54.9 -5% | 56.9 -2% | |
| AdobeRGB 1998 Coverage (%) | 39.87 | 61.6 55% 41.73 5% | 40.2 1% | 37.62 -6% | 39.47 -1% | |
| Response Times | -21% | 33% | -8% | -35% | 26% | |
| Response Time Grey 50% / Grey 80% * (ms) | 42 ? | 55 ? -31% | 22 ? 48% | 36 ? 14% | 58.8 ? -40% | 28.4 ? 32% |
| Response Time Black / White * (ms) | 28 ? | 31 ? -11% | 23 ? 18% | 36 ? -29% | 36 ? -29% | 22.4 ? 20% |
| PWM Frequency (Hz) | 21550 ? | |||||
| Screen | -29% | -14% | -84% | -48% | -46% | |
| Brightness middle (cd/m²) | 230 | 214 -7% | 281 22% | 246 7% | 239 4% | 209.5 -9% |
| Brightness (cd/m²) | 228 | 203 -11% | 257 13% | 235 3% | 244 7% | 205 -10% |
| Brightness Distribution (%) | 88 | 79 -10% | 85 -3% | 75 -15% | 88 0% | 92 5% |
| Black Level * (cd/m²) | 0.21 | 0.28 -33% | 0.32 -52% | 0.55 -162% | 0.35 -67% | 0.69 -229% |
| Contrast (:1) | 1095 | 764 -30% | 878 -20% | 447 -59% | 683 -38% | 304 -72% |
| Colorchecker dE 2000 * | 4.01 | 6.04 -51% | 5.16 -29% | 10.97 -174% | 7.3 -82% | 4.7 -17% |
| Colorchecker dE 2000 max. * | 7.26 | 12 -65% | 9.09 -25% | 24.7 -240% | 19.7 -171% | |
| Greyscale dE 2000 * | 3.18 | 5.91 -86% | 4.57 -44% | 14.25 -348% | 4.9 -54% | 1.8 43% |
| Gamma | 2.52 87% | 2.44 90% | 2.59 85% | 1.83 120% | 2.19 100% | 2.23 99% |
| CCT | 6814 95% | 7362 88% | 6931 94% | 11200 58% | 7332 89% | 6975 93% |
| Color Space (Percent of AdobeRGB 1998) (%) | 37 | 38 3% | 37 0% | 35 -5% | 35 -5% | 36.2 -2% |
| Color Space (Percent of sRGB) (%) | 58 | 60 3% | 58 0% | 55 -5% | 55 -5% | 56.6 -2% |
| Media total (Programa/Opciones) | -7% /
-9% | 7% /
-5% | -33% /
-56% | -42% /
-46% | -7% /
-28% |
* ... más pequeño es mejor
Tiempos de respuesta del display
| ↔ Tiempo de respuesta de Negro a Blanco | ||
|---|---|---|
| 28 ms ... subida ↗ y bajada ↘ combinada | ↗ 16.4 ms subida | 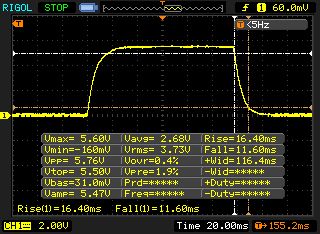 |
| ↘ 11.6 ms bajada | ||
| La pantalla mostró tiempos de respuesta relativamente lentos en nuestros tests pero podría ser demasiado lenta para los jugones. En comparación, todos los dispositivos de prueba van de ##min### (mínimo) a 240 (máximo) ms. » 71 % de todos los dispositivos son mejores. Eso quiere decir que el tiempo de respuesta es peor que la media (19.8 ms) de todos los dispositivos testados. | ||
| ↔ Tiempo de respuesta 50% Gris a 80% Gris | ||
| 42 ms ... subida ↗ y bajada ↘ combinada | ↗ 20.4 ms subida | 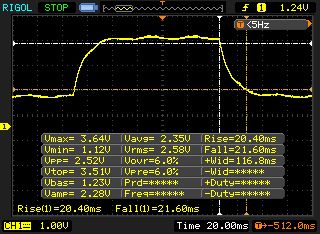 |
| ↘ 21.6 ms bajada | ||
| La pantalla mostró tiempos de respuesta lentos en nuestros tests y podría ser demasiado lenta para los jugones. En comparación, todos los dispositivos de prueba van de ##min### (mínimo) a 636 (máximo) ms. » 67 % de todos los dispositivos son mejores. Eso quiere decir que el tiempo de respuesta es peor que la media (30.9 ms) de todos los dispositivos testados. | ||
Parpadeo de Pantalla / PWM (Pulse-Width Modulation)
| Parpadeo de Pantalla / PWM no detectado |  | ||
Comparación: 52 % de todos los dispositivos testados no usaron PWM para atenuar el display. Si se usó, medimos una media de 7748 (mínimo: 5 - máxmo: 343500) Hz. | |||
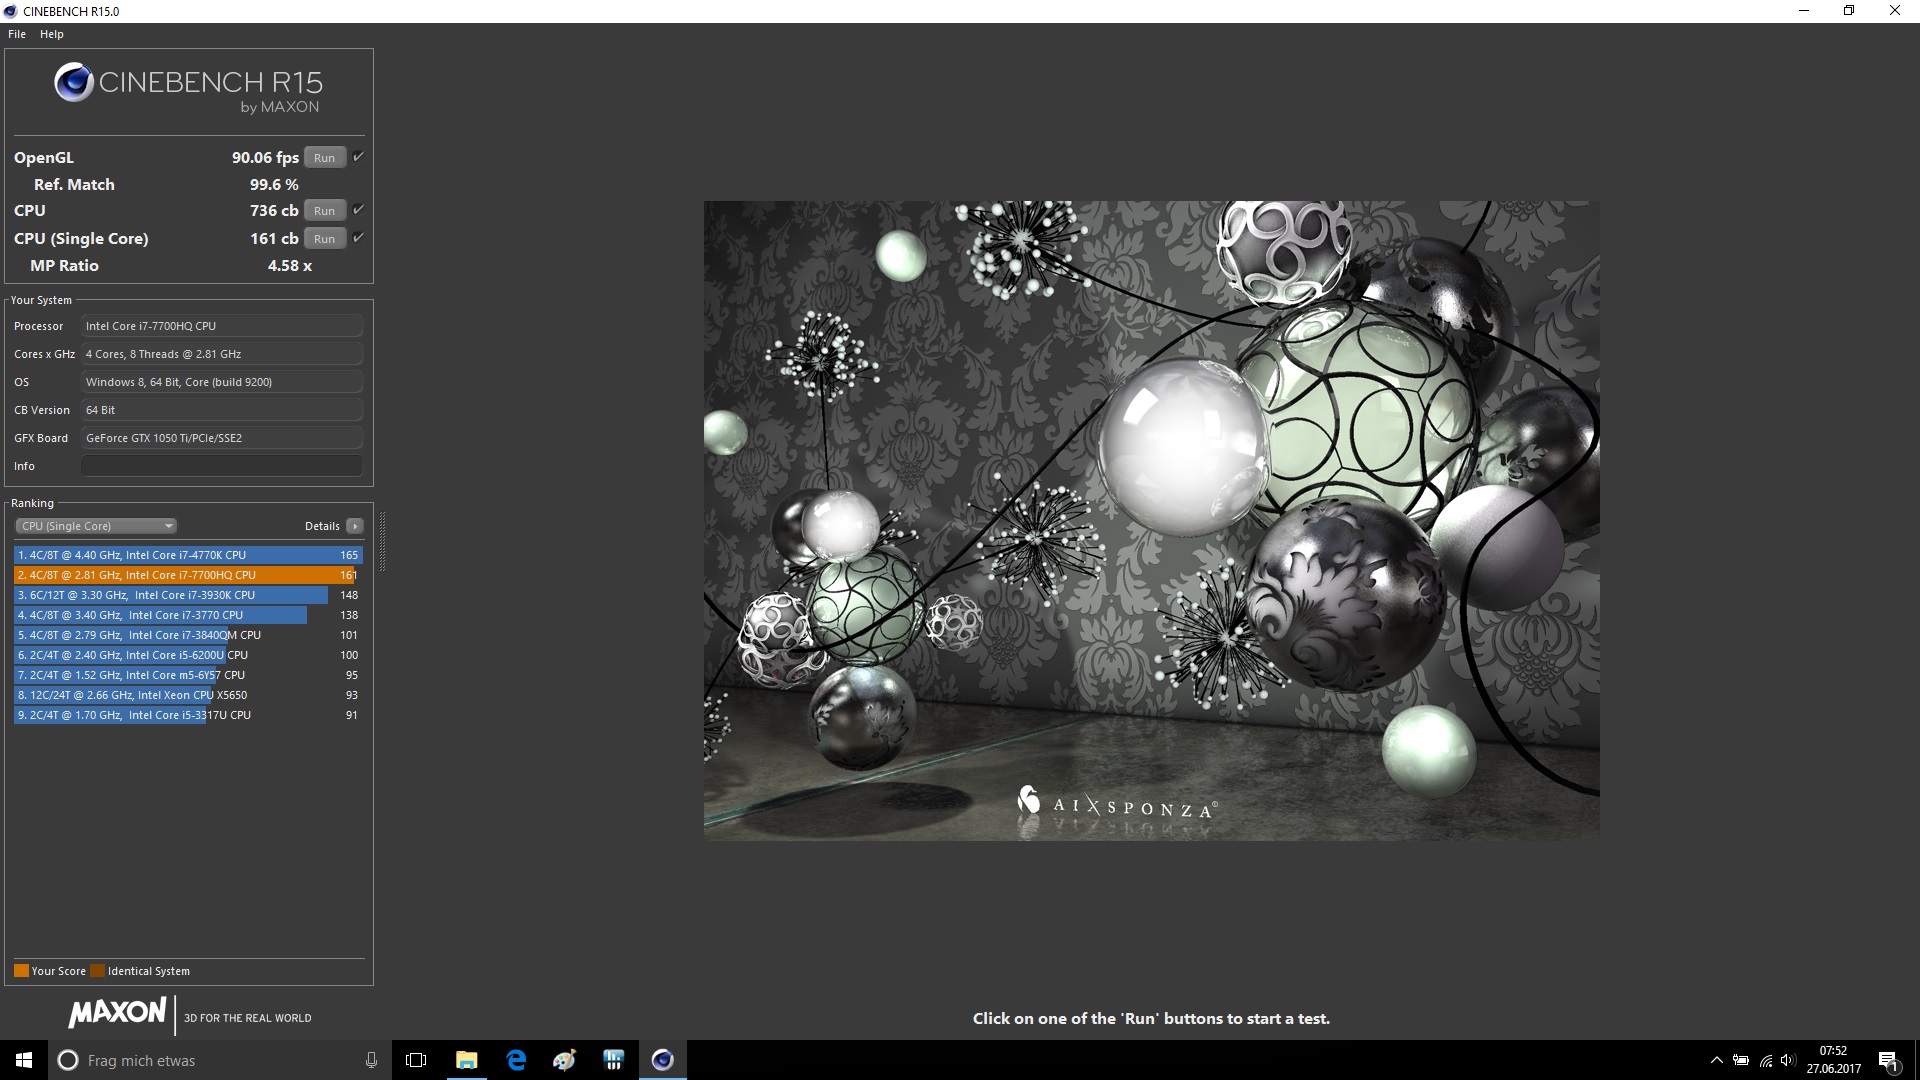
| Cinebench R15 | |
| CPU Single 64Bit | |
| MSI GS63VR 7RF-228US | |
| HP Omen 15-ax213ng | |
| Dell Inspiron 15 7000 7567 | |
| Lenovo Legion Y520-15IKBN-80WK001KUS | |
| Acer Aspire VX5-591G-75C4 VX15 | |
| HP Omen 15-ax007ng | |
| Asus FX502VM-AS73 | |
| CPU Multi 64Bit | |
| MSI GS63VR 7RF-228US | |
| HP Omen 15-ax213ng | |
| Asus FX502VM-AS73 | |
| Dell Inspiron 15 7000 7567 | |
| Acer Aspire VX5-591G-75C4 VX15 | |
| HP Omen 15-ax007ng | |
| Lenovo Legion Y520-15IKBN-80WK001KUS | |
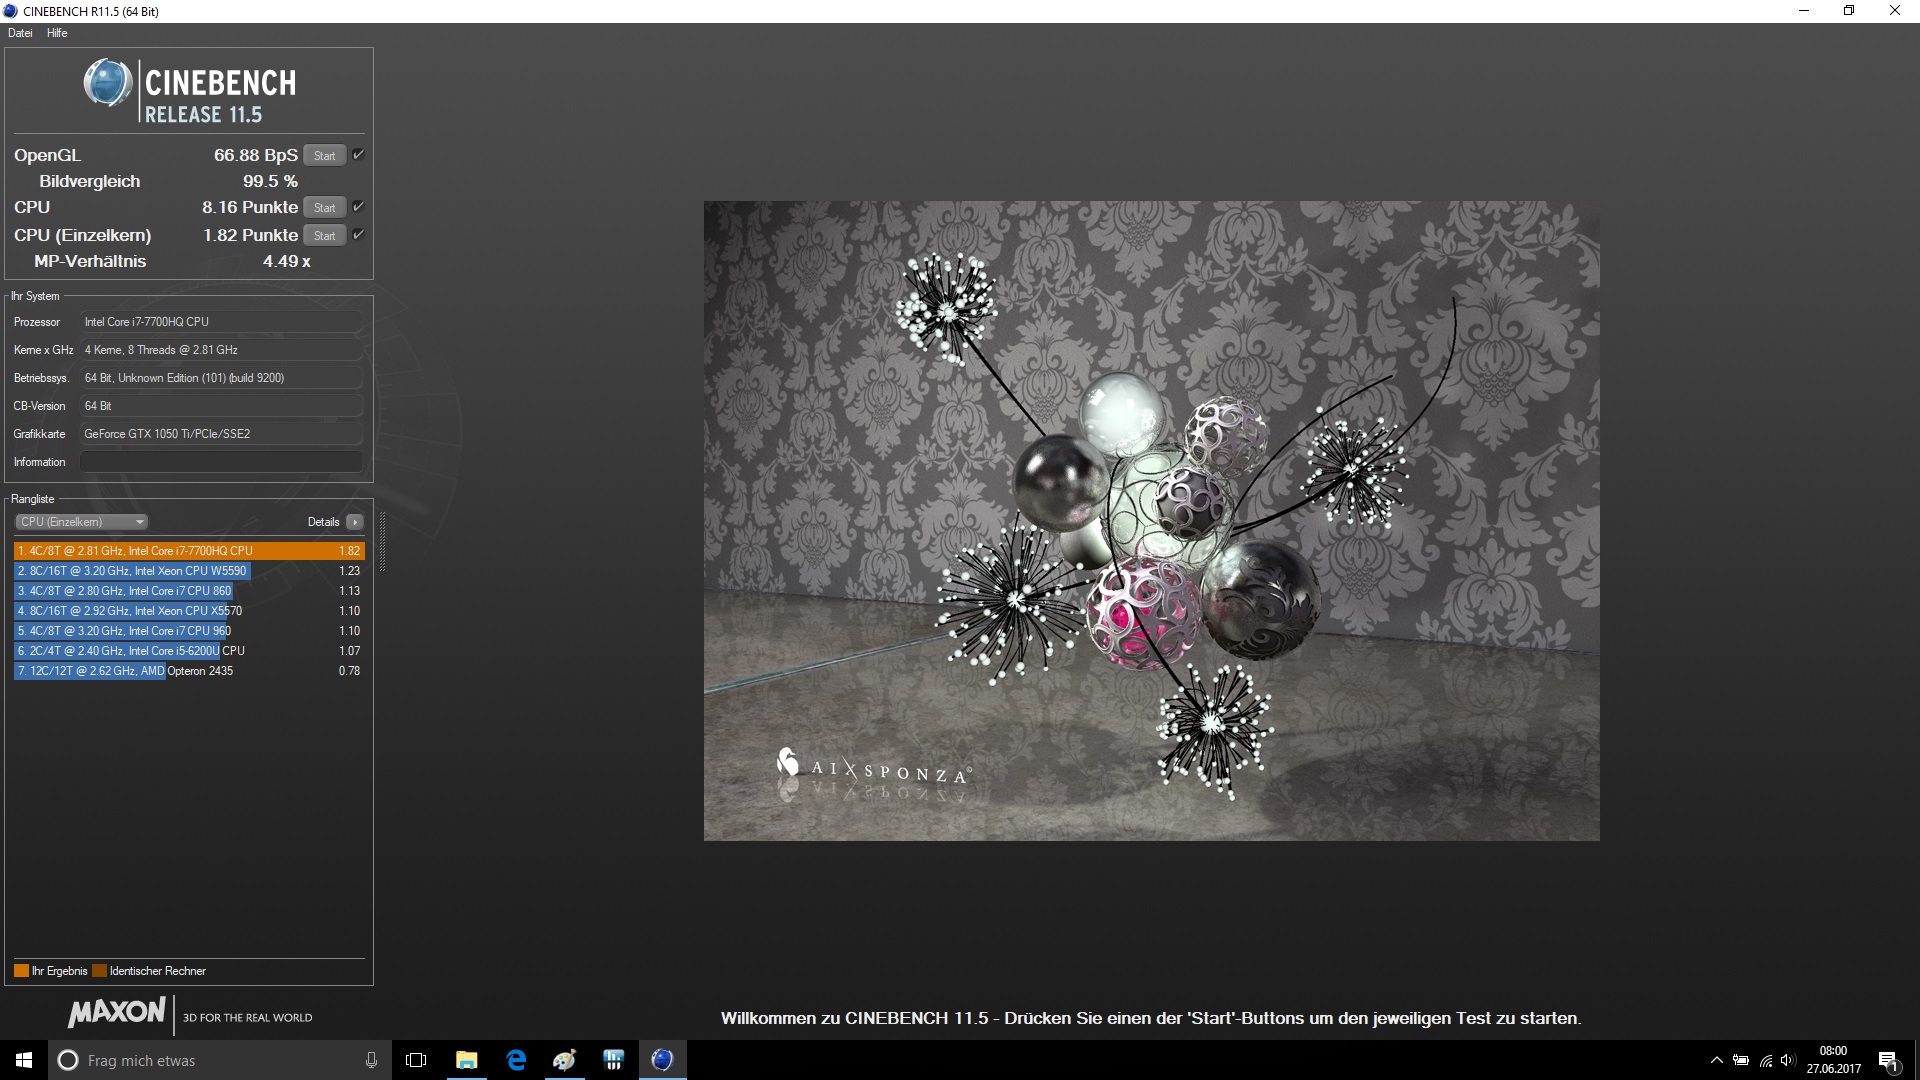
| Cinebench R11.5 | |
| CPU Single 64Bit | |
| HP Omen 15-ax213ng | |
| MSI GS63VR 7RF-228US | |
| Lenovo Legion Y520-15IKBN-80WK001KUS | |
| HP Omen 15-ax007ng | |
| Asus FX502VM-AS73 | |
| CPU Multi 64Bit | |
| MSI GS63VR 7RF-228US | |
| HP Omen 15-ax213ng | |
| Asus FX502VM-AS73 | |
| HP Omen 15-ax007ng | |
| Lenovo Legion Y520-15IKBN-80WK001KUS | |
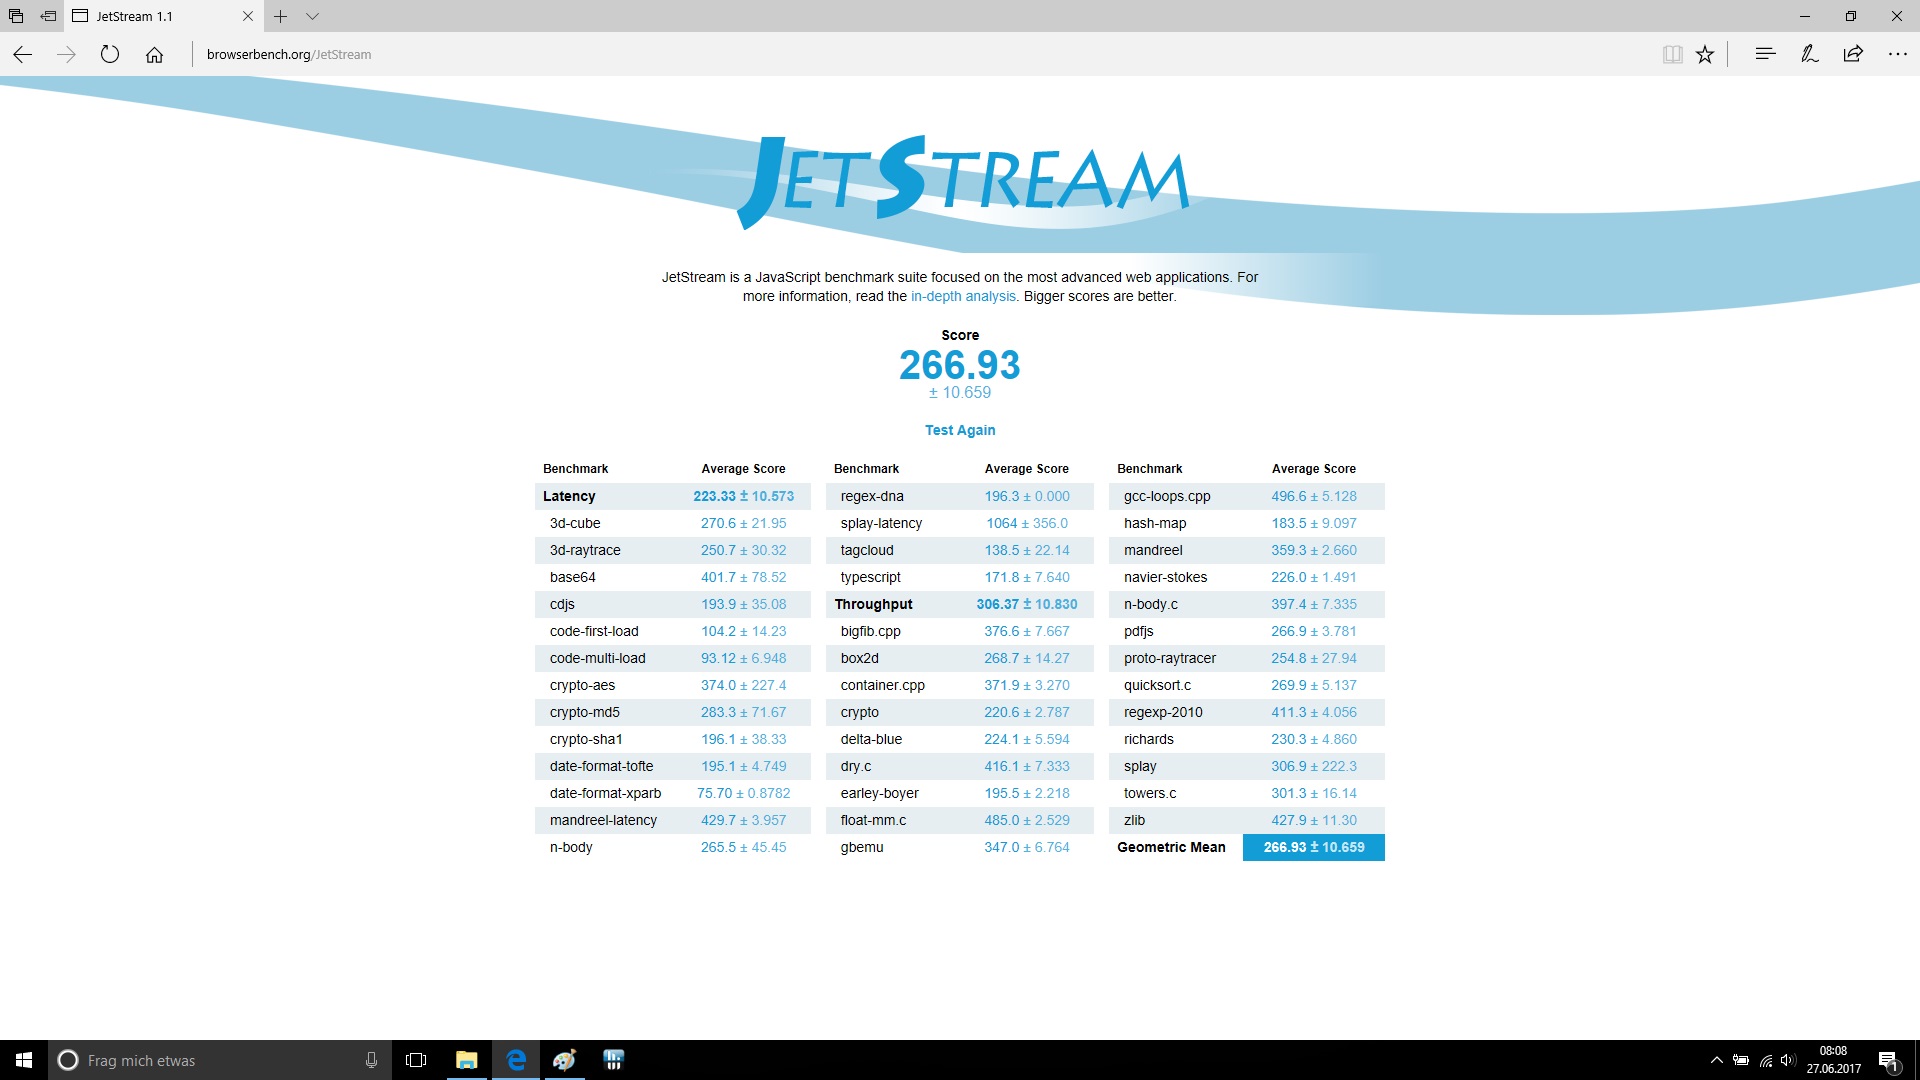
| JetStream 1.1 - 1.1 Total | |
| HP Omen 15-ax213ng | |
| Lenovo Legion Y520-15IKBN-80WK001KUS | |
| Dell Inspiron 15 7000 7567 | |
| MSI GS63VR 7RF-228US | |
| Asus FX502VM-AS73 | |
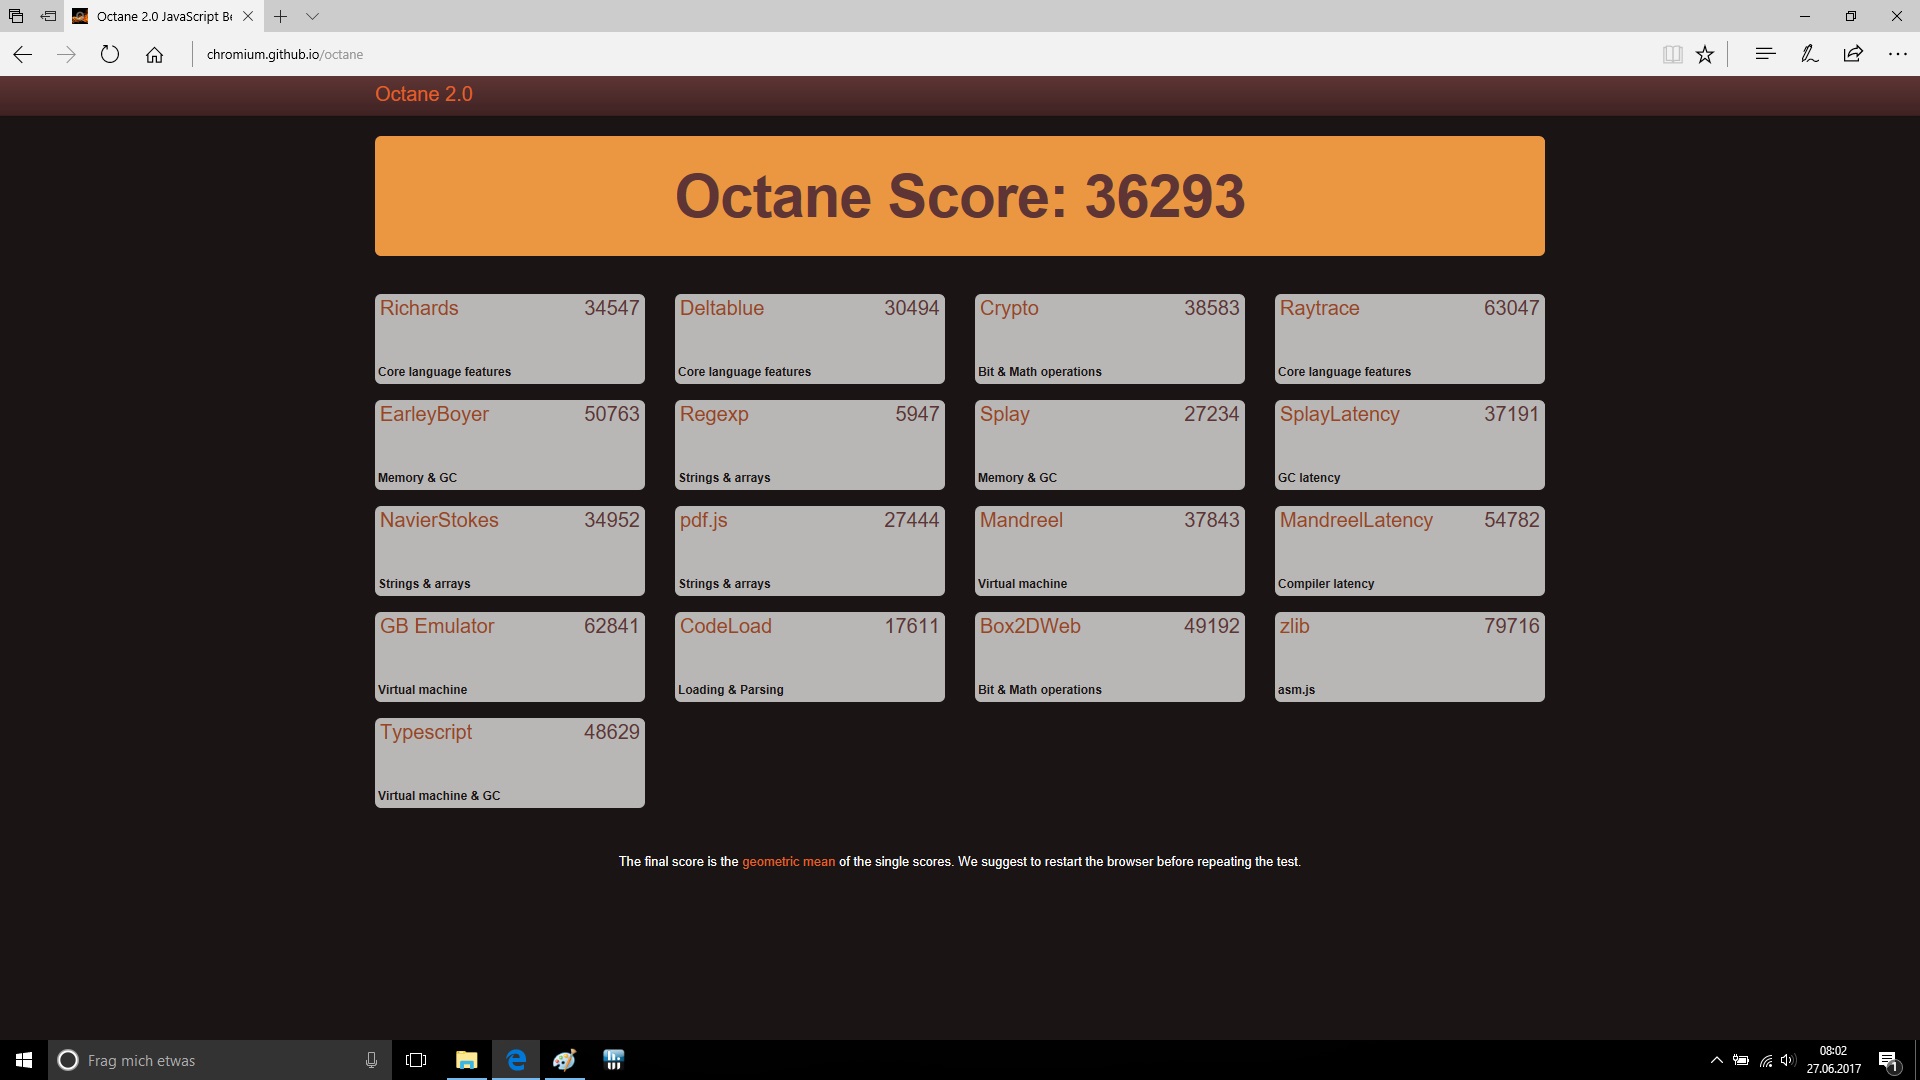
| Octane V2 - Total Score | |
| Dell Inspiron 15 7000 7567 | |
| Asus FX502VM-AS73 | |
| HP Omen 15-ax213ng | |
| Lenovo Legion Y520-15IKBN-80WK001KUS | |
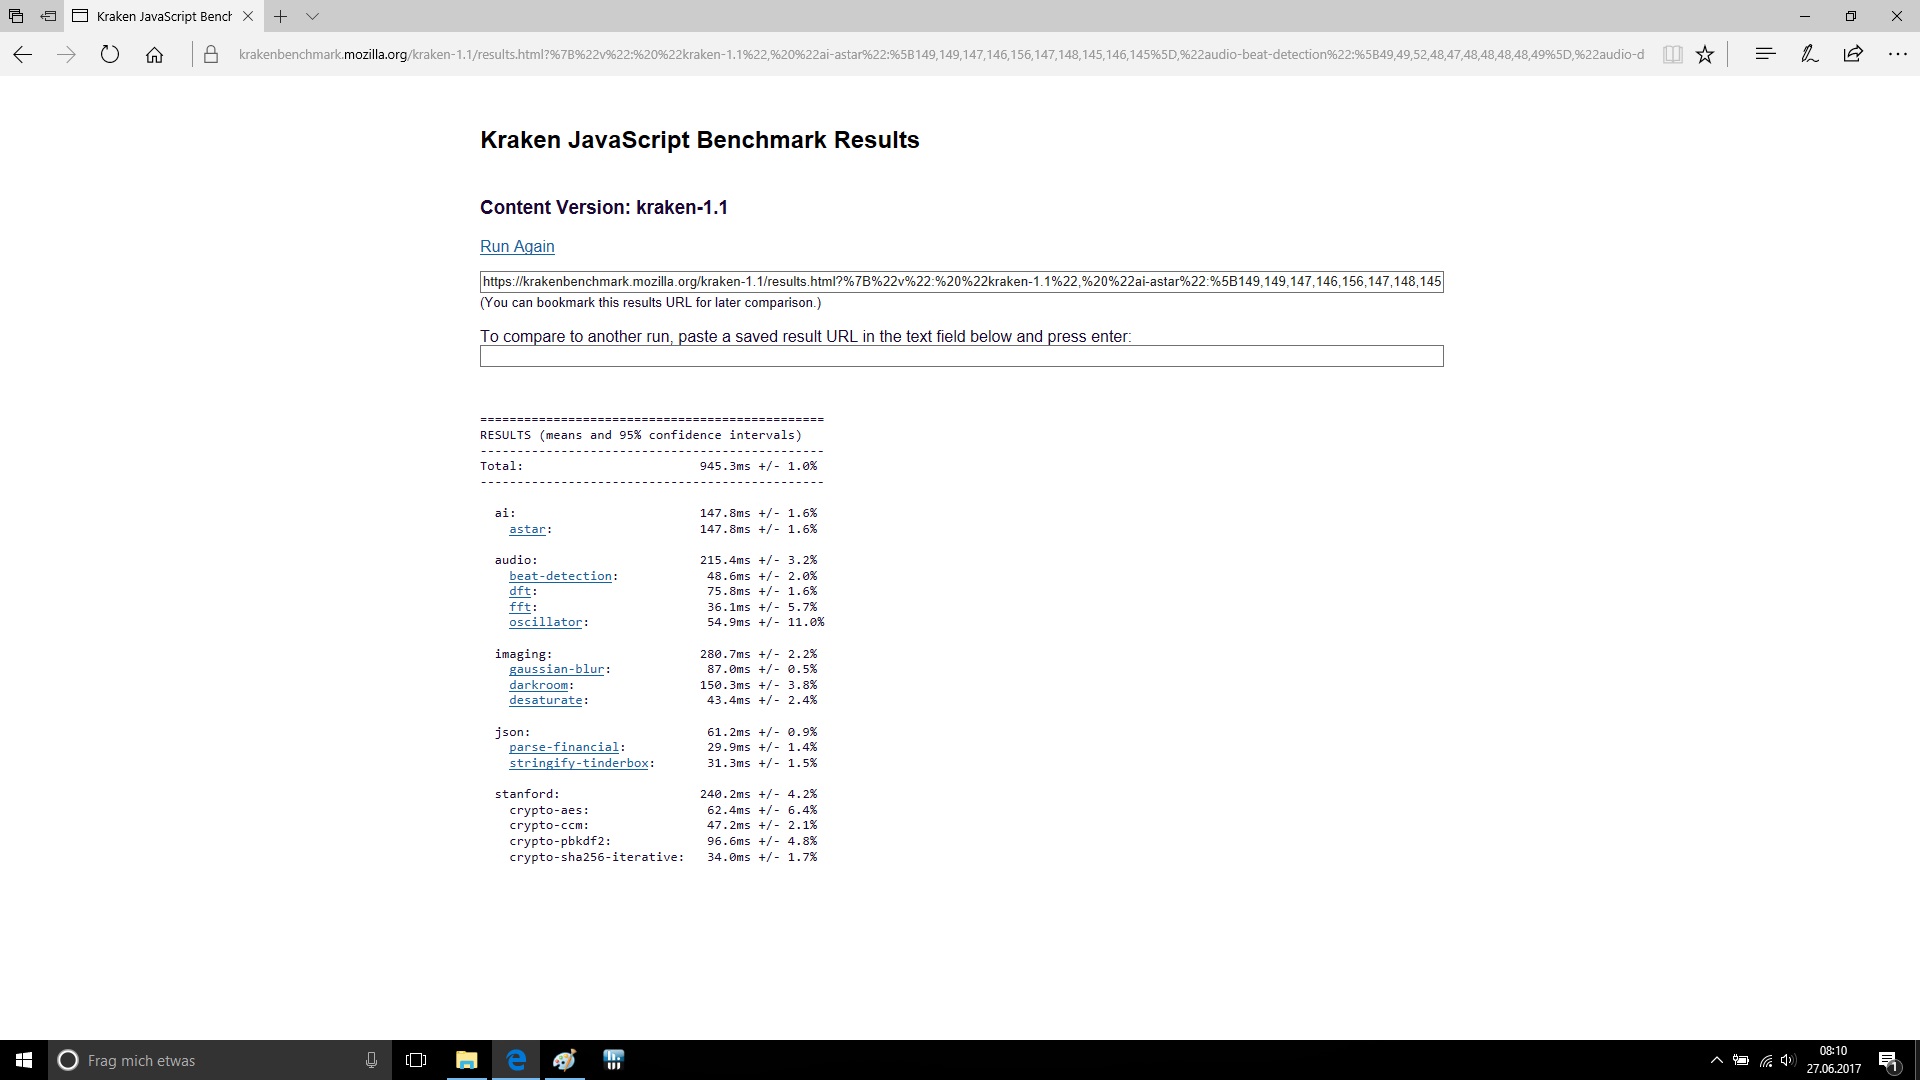
| Mozilla Kraken 1.1 - Total | |
| Acer Aspire VX5-591G-75C4 VX15 | |
| MSI GS63VR 7RF-228US | |
| Dell Inspiron 15 7000 7567 | |
| Lenovo Legion Y520-15IKBN-80WK001KUS | |
| HP Omen 15-ax213ng | |
* ... más pequeño es mejor

| PCMark 8 | |
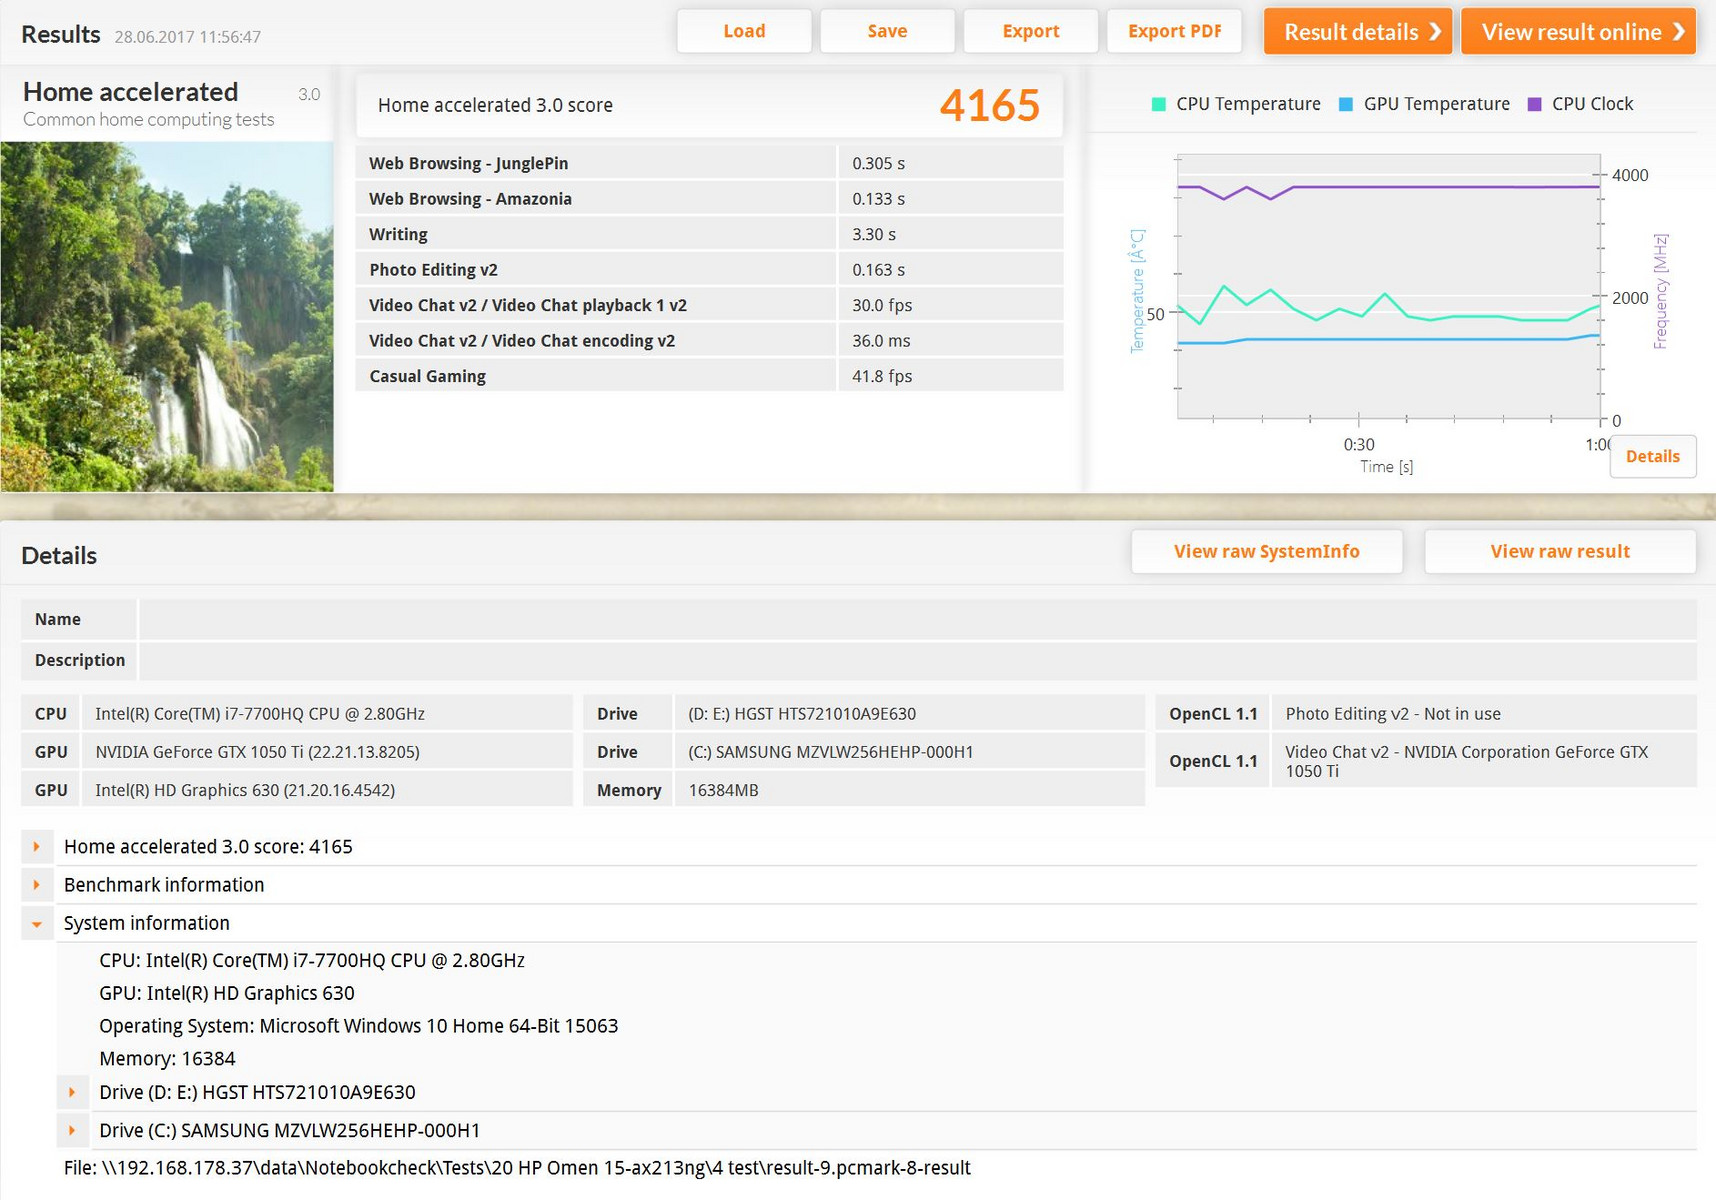
| Home Score Accelerated v2 | |
| Asus FX502VM-AS73 | |
| HP Omen 15-ax213ng | |
| MSI GS63VR 7RF-228US | |
| HP Omen 15-ax007ng | |
| Dell Inspiron 15 7000 7567 | |
| Acer Aspire VX5-591G-75C4 VX15 | |
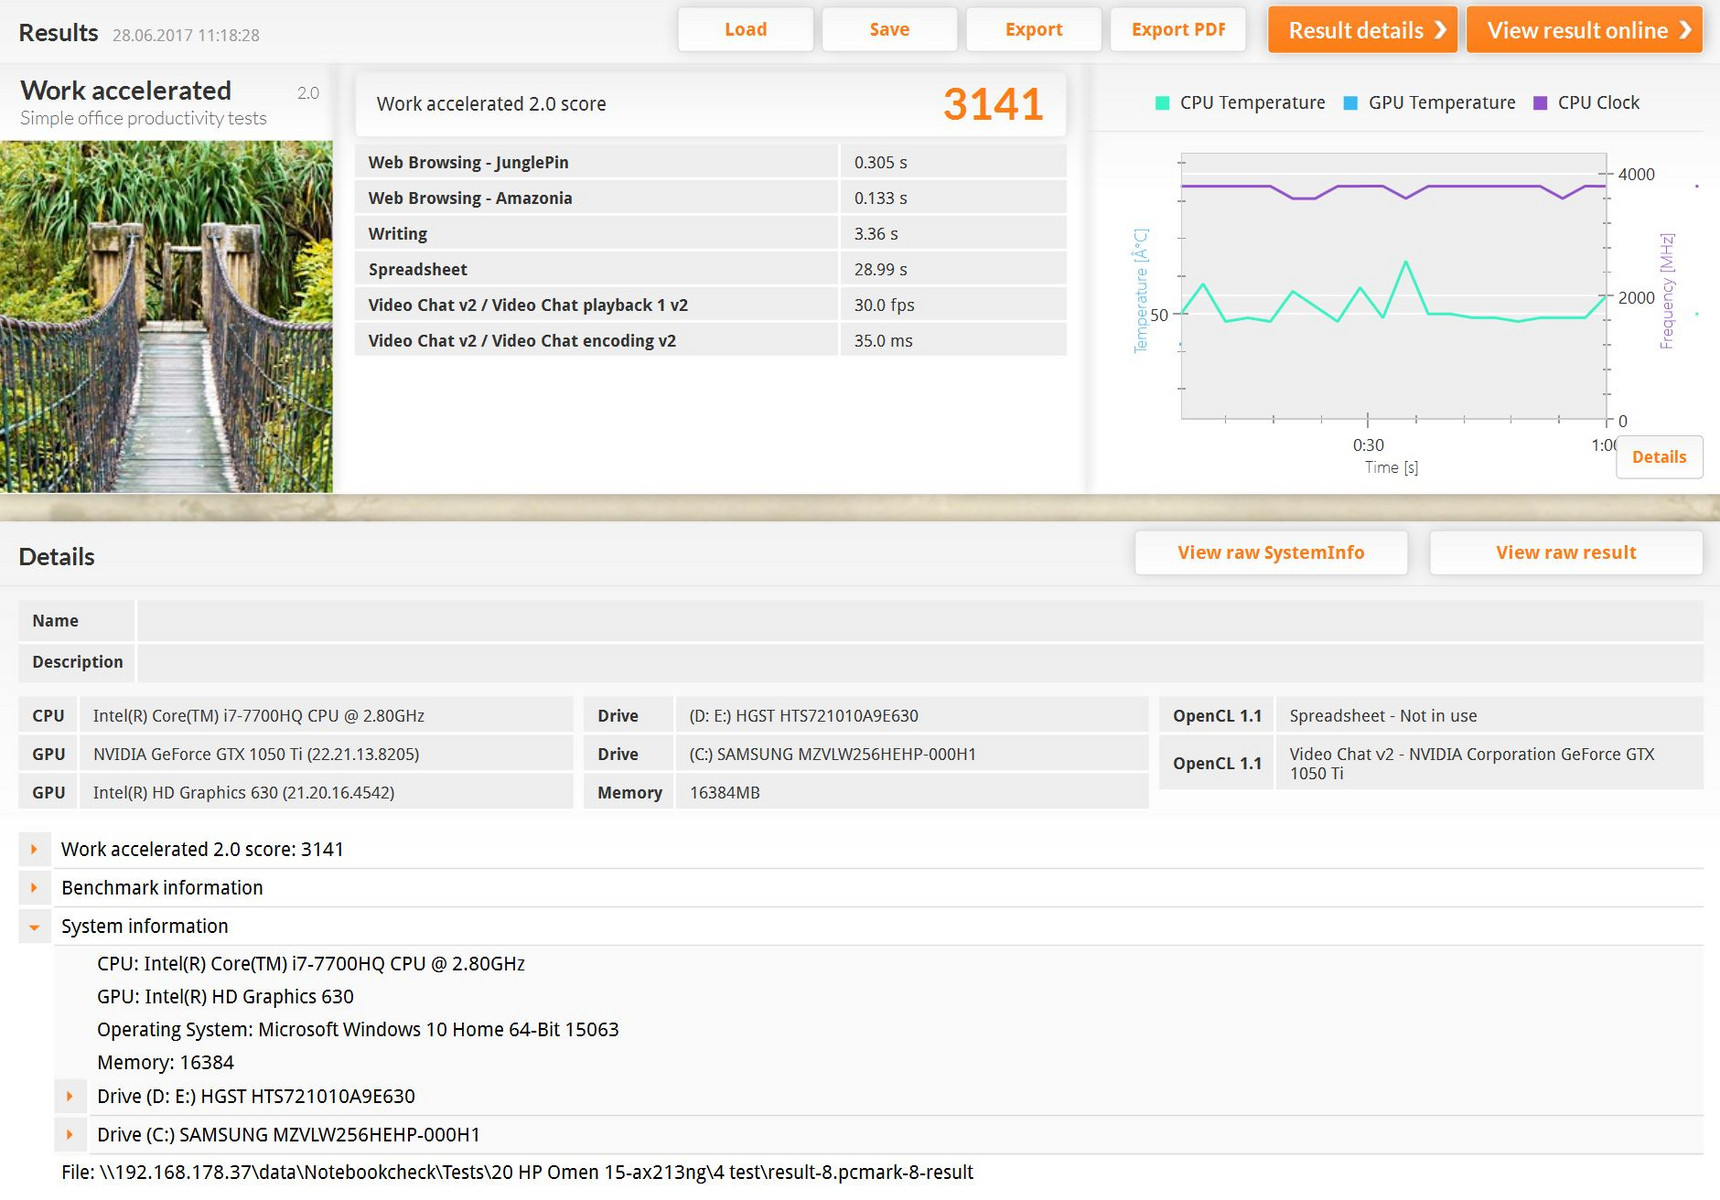
| Work Score Accelerated v2 | |
| MSI GS63VR 7RF-228US | |
| Dell Inspiron 15 7000 7567 | |
| HP Omen 15-ax007ng | |
| Acer Aspire VX5-591G-75C4 VX15 | |
| HP Omen 15-ax213ng | |
| Asus FX502VM-AS73 | |
| Creative Score Accelerated v2 | |
| Asus FX502VM-AS73 | |
| HP Omen 15-ax213ng | |
| MSI GS63VR 7RF-228US | |
| HP Omen 15-ax007ng | |
| PCMark 8 Home Score Accelerated v2 | 4165 puntos | |
| PCMark 8 Creative Score Accelerated v2 | 5402 puntos | |
| PCMark 8 Work Score Accelerated v2 | 3141 puntos | |
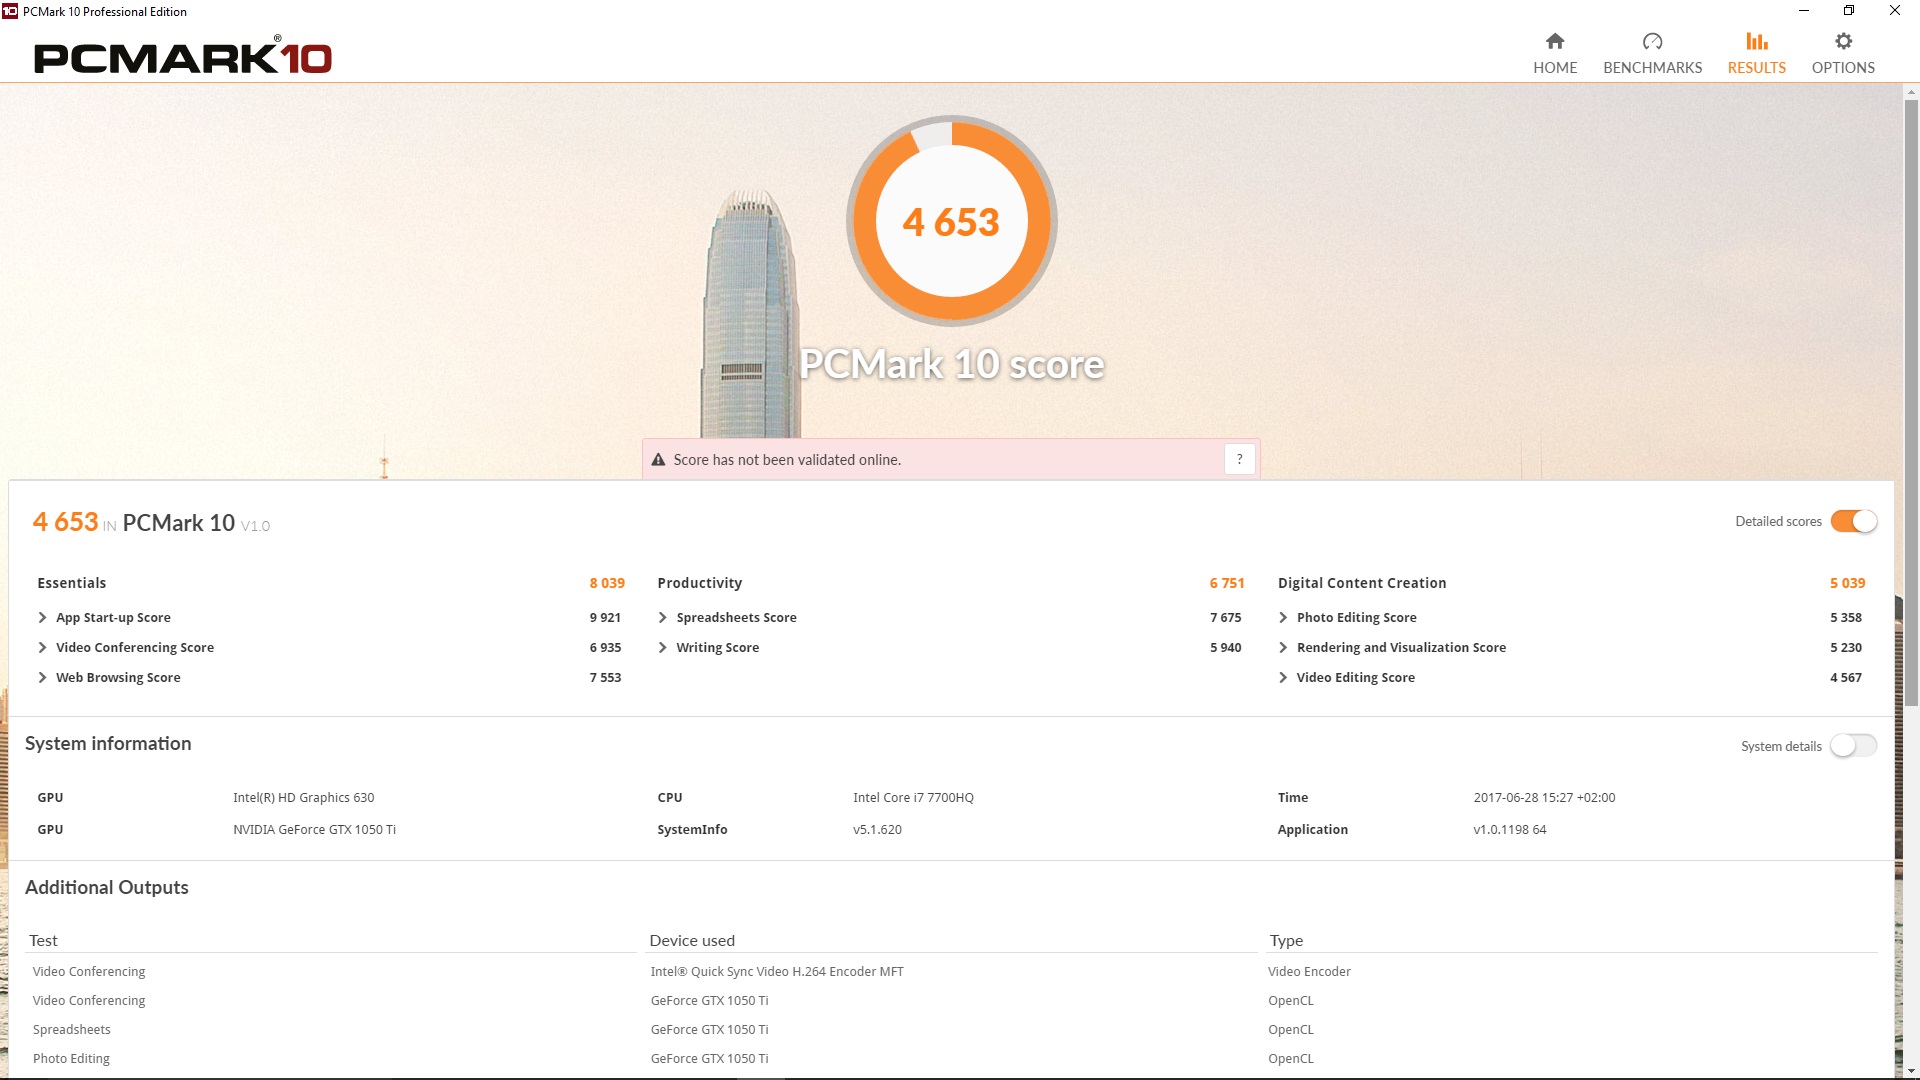
| PCMark 10 Score | 4653 puntos | |
ayuda | ||
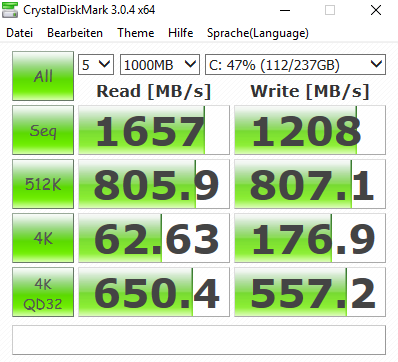
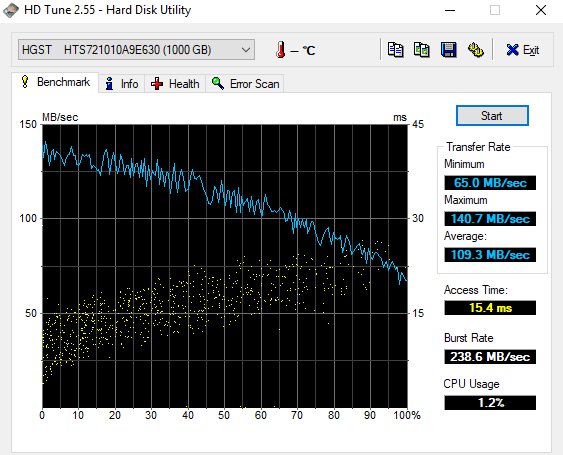
| HP Omen 15-ax213ng Samsung PM961 MZVLW256HEHP | HP Omen 15-ax007ng Adata IM2S3138E-128GM-B | Acer Aspire VX5-591G-75C4 VX15 Toshiba MQ01ABD100 | Dell Inspiron 15 7000 7567 Intel SSDSCKKF256H6 | Lenovo Legion Y520-15IKBN-80WK001KUS Samsung PM961 MZVLW256HEHP | Asus FX502VM-AS73 SK Hynix HFS256G39TND-N210A | MSI GS63VR 7RF-228US Samsung SM961 MZVKW512HMJP m.2 PCI-e | |
|---|---|---|---|---|---|---|---|
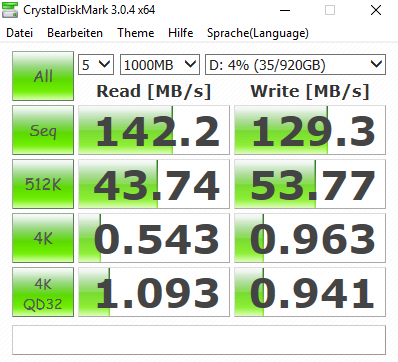
| CrystalDiskMark 3.0 | -65% | -97% | -60% | -6% | -67% | 10% | |
| Read Seq (MB/s) | 1657 | 475.7 -71% | 101.5 -94% | 485.8 -71% | 2170 31% | 503 -70% | 2141 29% |
| Write Seq (MB/s) | 1208 | 169.2 -86% | 100.6 -92% | 422.8 -65% | 1202 0% | 138.2 -89% | 1621 34% |
| Read 512 (MB/s) | 806 | 327.6 -59% | 28.33 -96% | 338.9 -58% | 786 -2% | 343.5 -57% | 499.7 -38% |
| Write 512 (MB/s) | 807 | 169.6 -79% | 28.31 -96% | 304 -62% | 822 2% | 137.8 -83% | 1531 90% |
| Read 4k (MB/s) | 62.6 | 33.14 -47% | 0.327 -99% | 27.11 -57% | 58.9 -6% | 29.36 -53% | 54.2 -13% |
| Write 4k (MB/s) | 176.9 | 81.4 -54% | 0.846 -100% | 85.4 -52% | 146.4 -17% | 70.9 -60% | 158.2 -11% |
| Read 4k QD32 (MB/s) | 650 | 276.8 -57% | 0.718 -100% | 279.6 -57% | 457.7 -30% | 369.9 -43% | 632 -3% |
| Write 4k QD32 (MB/s) | 557 | 168 -70% | 0.893 -100% | 255.1 -54% | 392.9 -29% | 99.7 -82% | 527 -5% |


| 3DMark | |
| 1280x720 Cloud Gate Standard Graphics | |
| Asus FX502VM-AS73 | |
| Lenovo Legion Y520-15IKBN-80WK001KUS | |
| Dell Inspiron 15 7000 7567 | |
| HP Omen 15-ax213ng | |
| Acer Aspire VX5-591G-75C4 VX15 | |
| HP Omen 15-ax007ng | |
| 1920x1080 Fire Strike Graphics | |
| Asus FX502VM-AS73 | |
| HP Omen 15-ax213ng | |
| Acer Aspire VX5-591G-75C4 VX15 | |
| Lenovo Legion Y520-15IKBN-80WK001KUS | |
| Dell Inspiron 15 7000 7567 | |
| HP Omen 15-ax007ng | |
| 3DMark 11 - 1280x720 Performance GPU | |
| Asus FX502VM-AS73 | |
| HP Omen 15-ax213ng | |
| Acer Aspire VX5-591G-75C4 VX15 | |
| Dell Inspiron 15 7000 7567 | |
| HP Omen 15-ax007ng | |
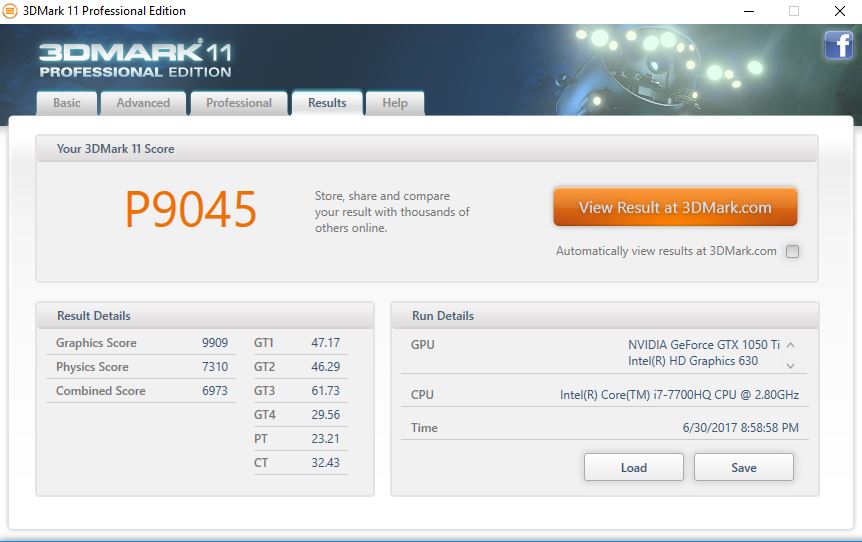
| 3DMark 11 Performance | 9045 puntos | |
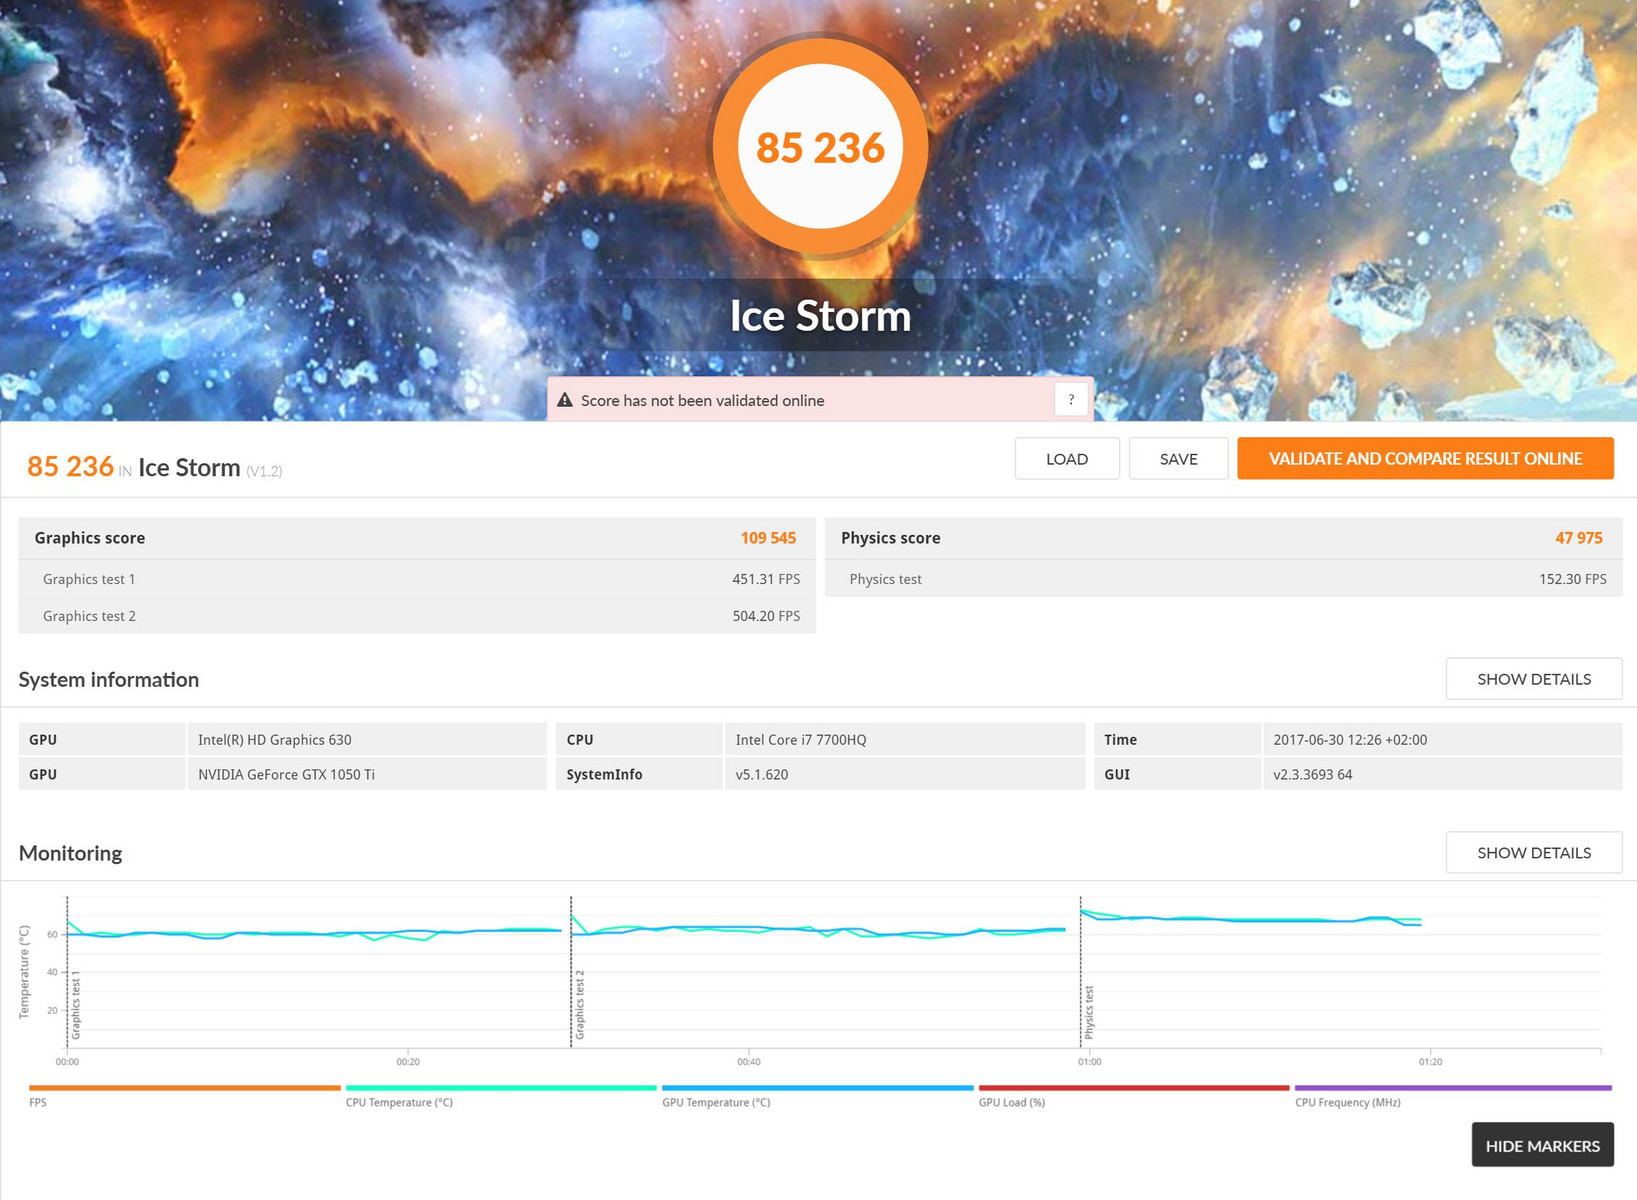
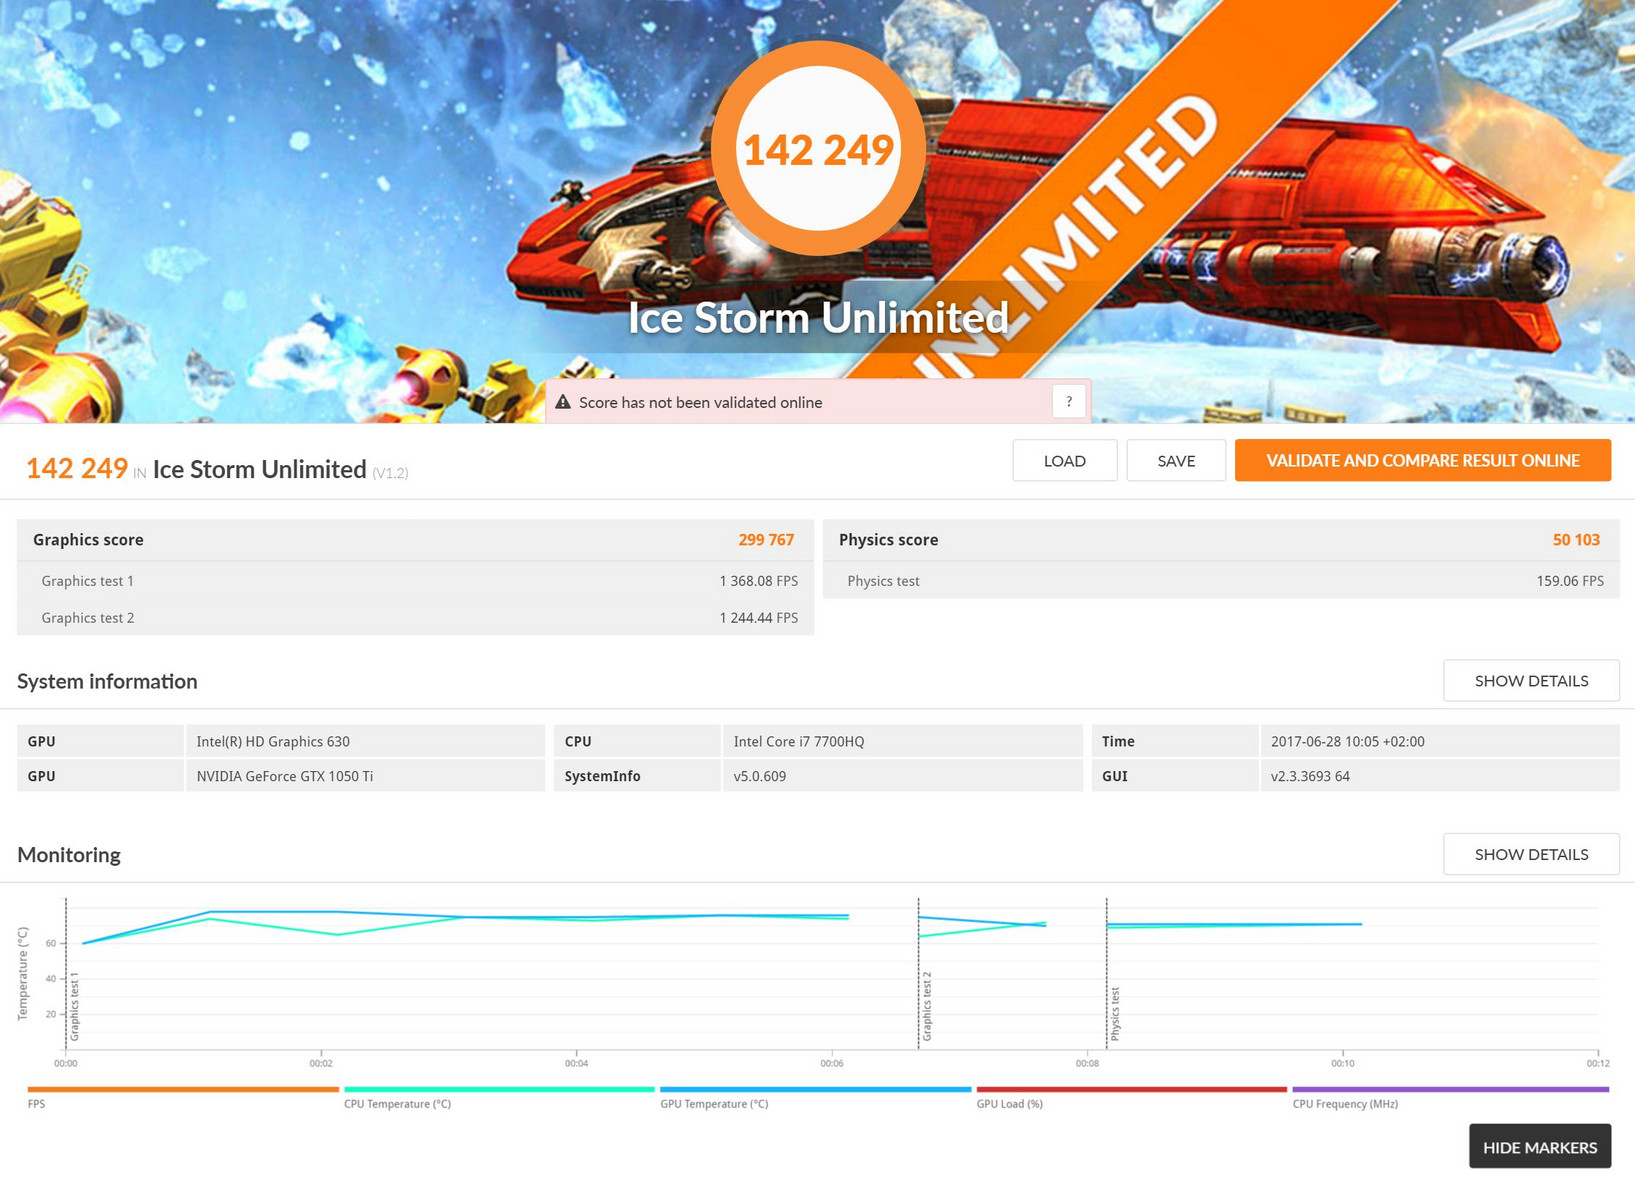
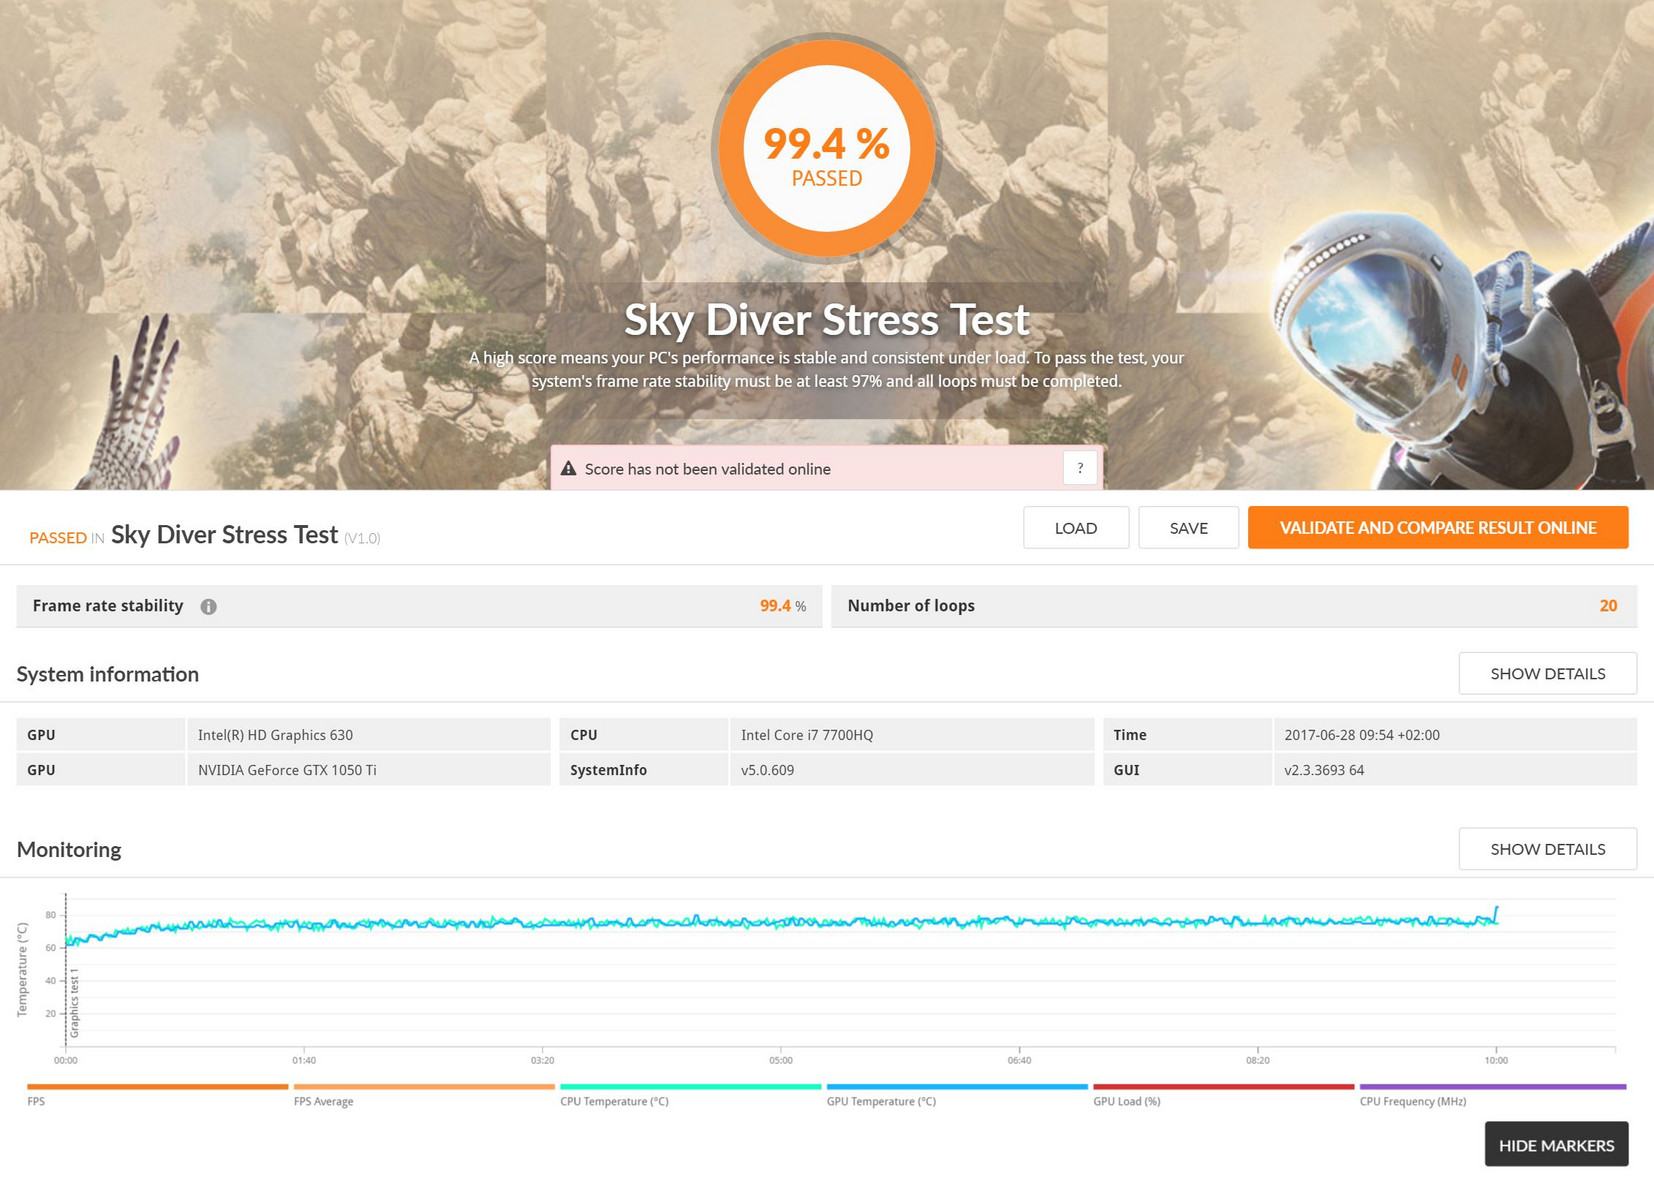
| 3DMark Ice Storm Standard Score | 85236 puntos | |
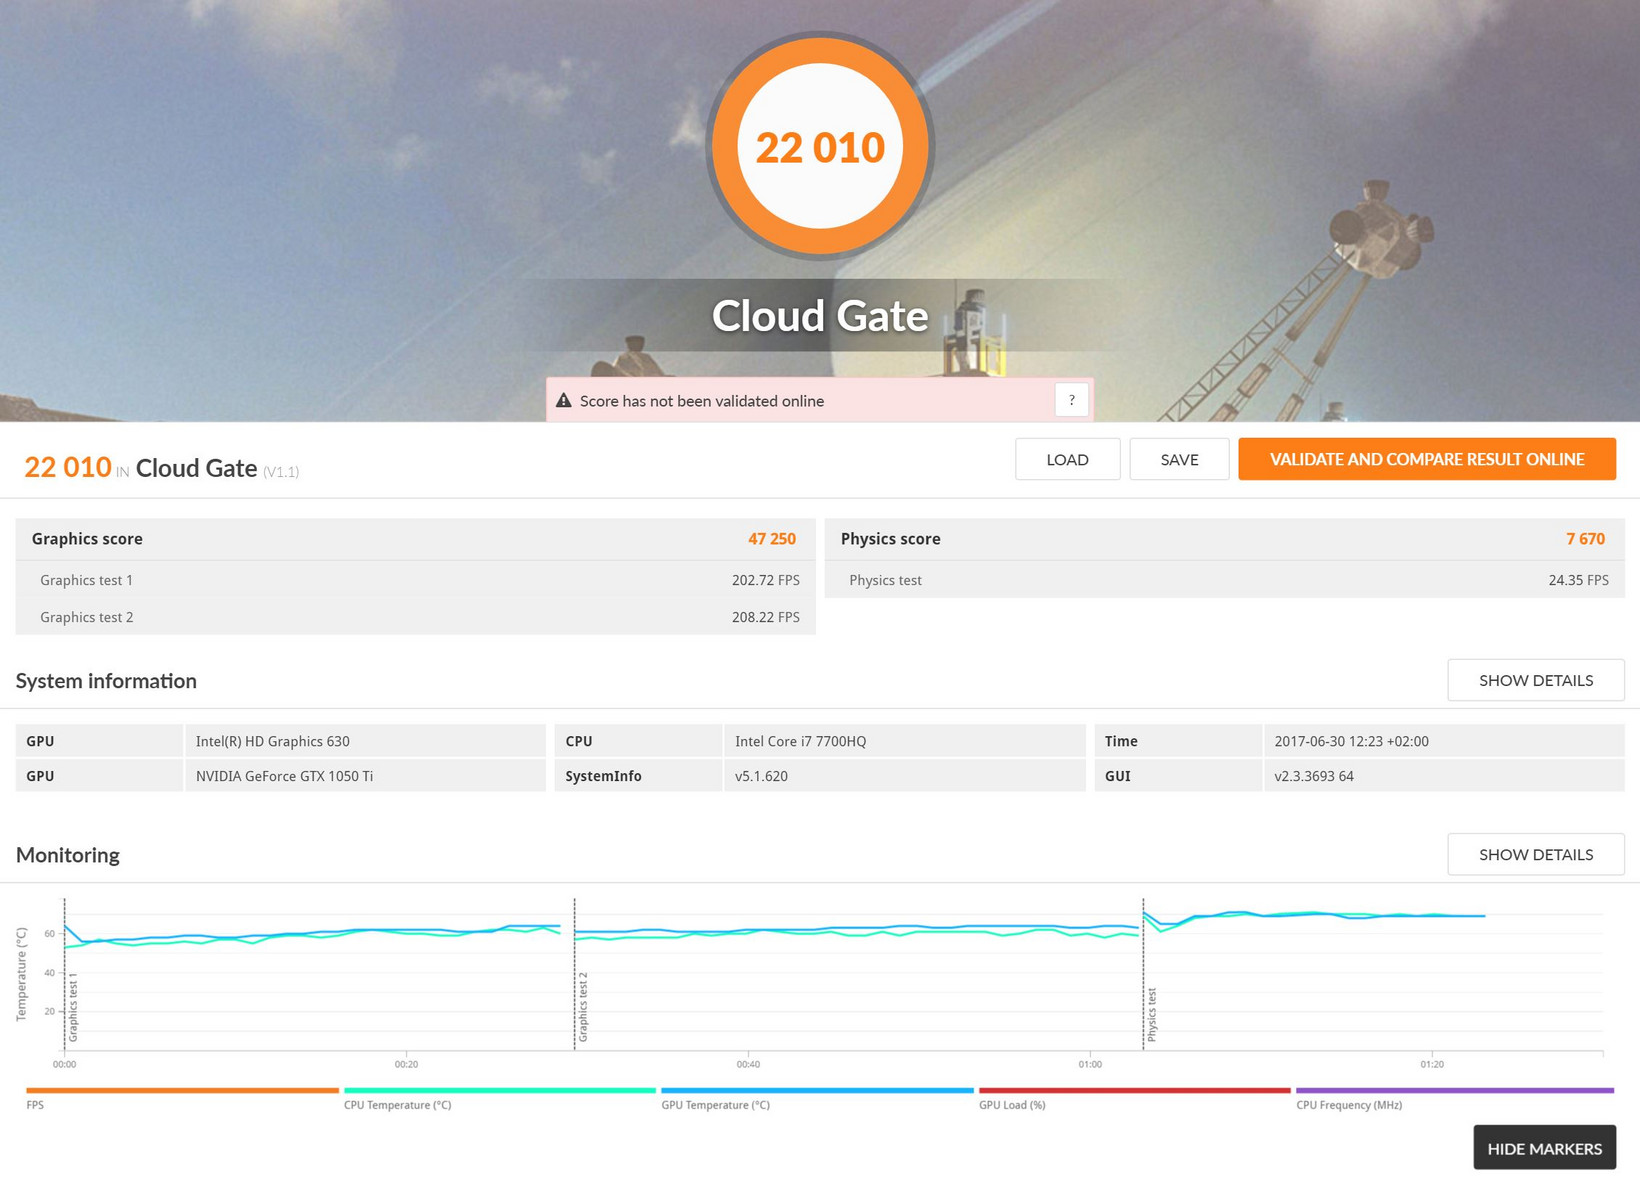
| 3DMark Cloud Gate Standard Score | 22010 puntos | |
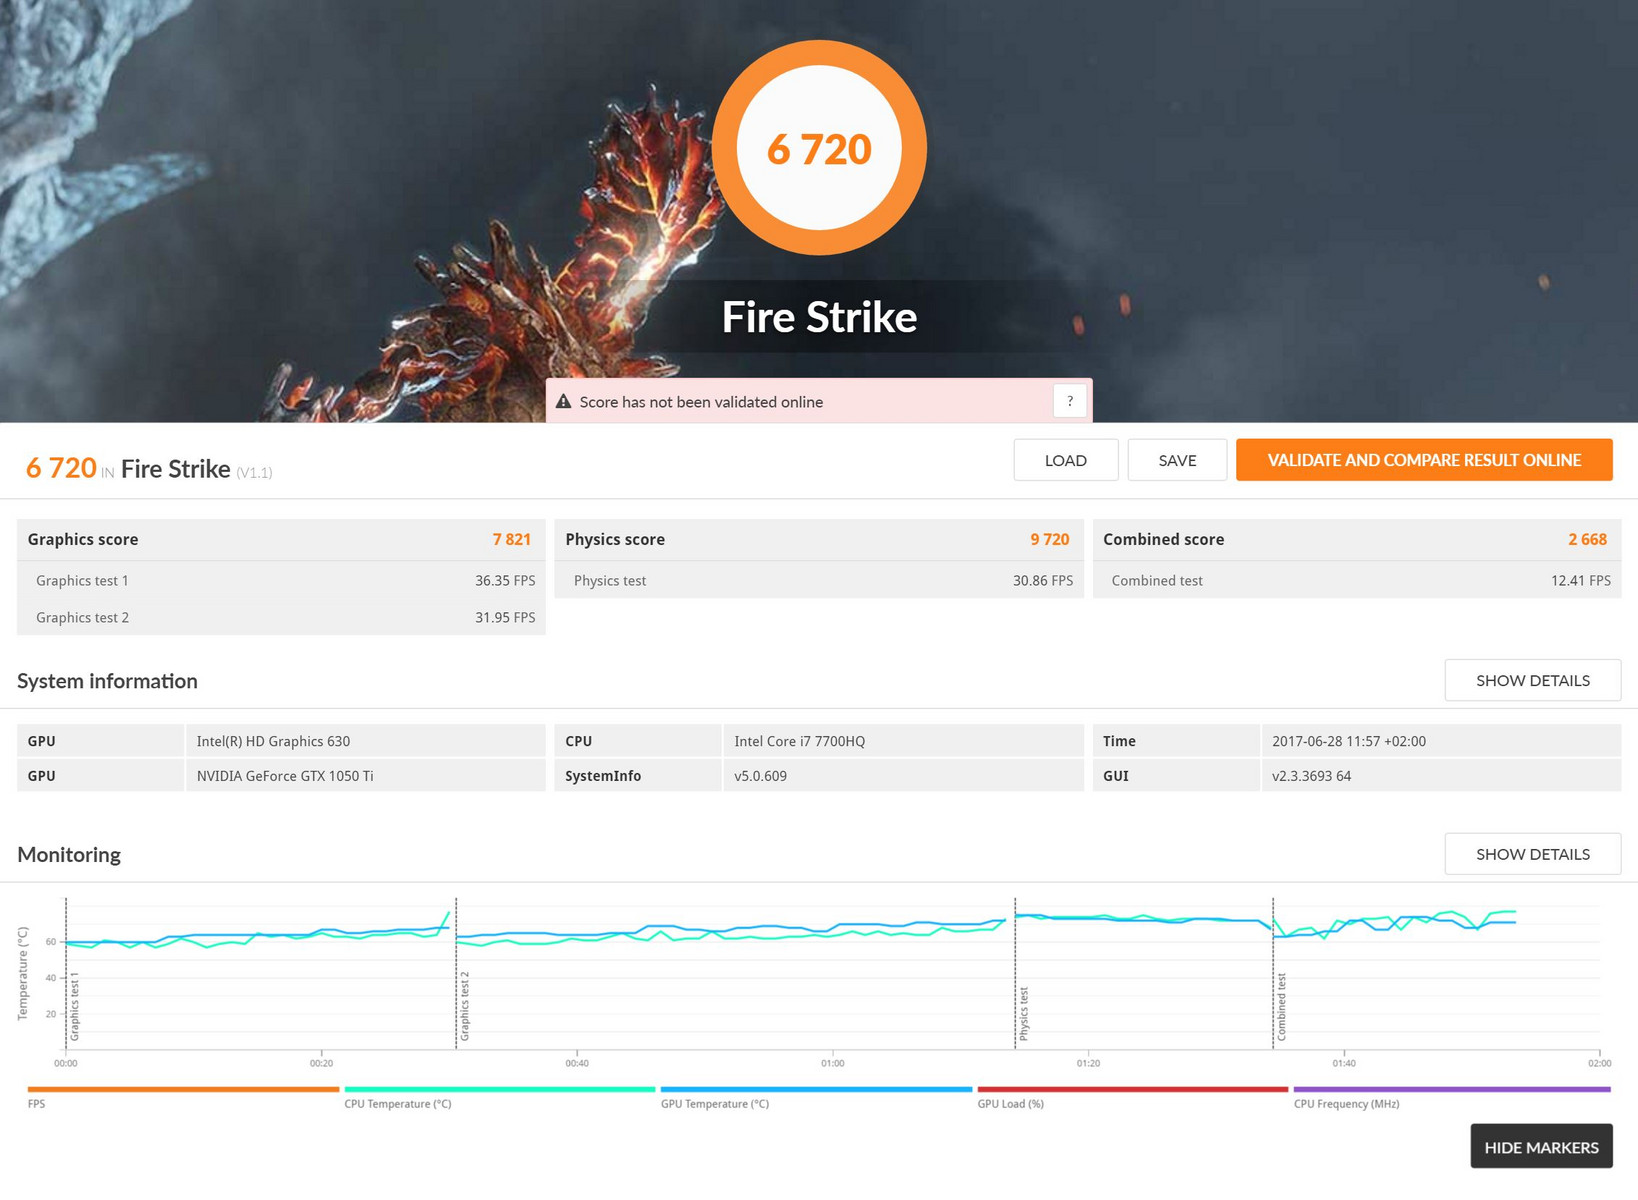
| 3DMark Fire Strike Score | 6720 puntos | |
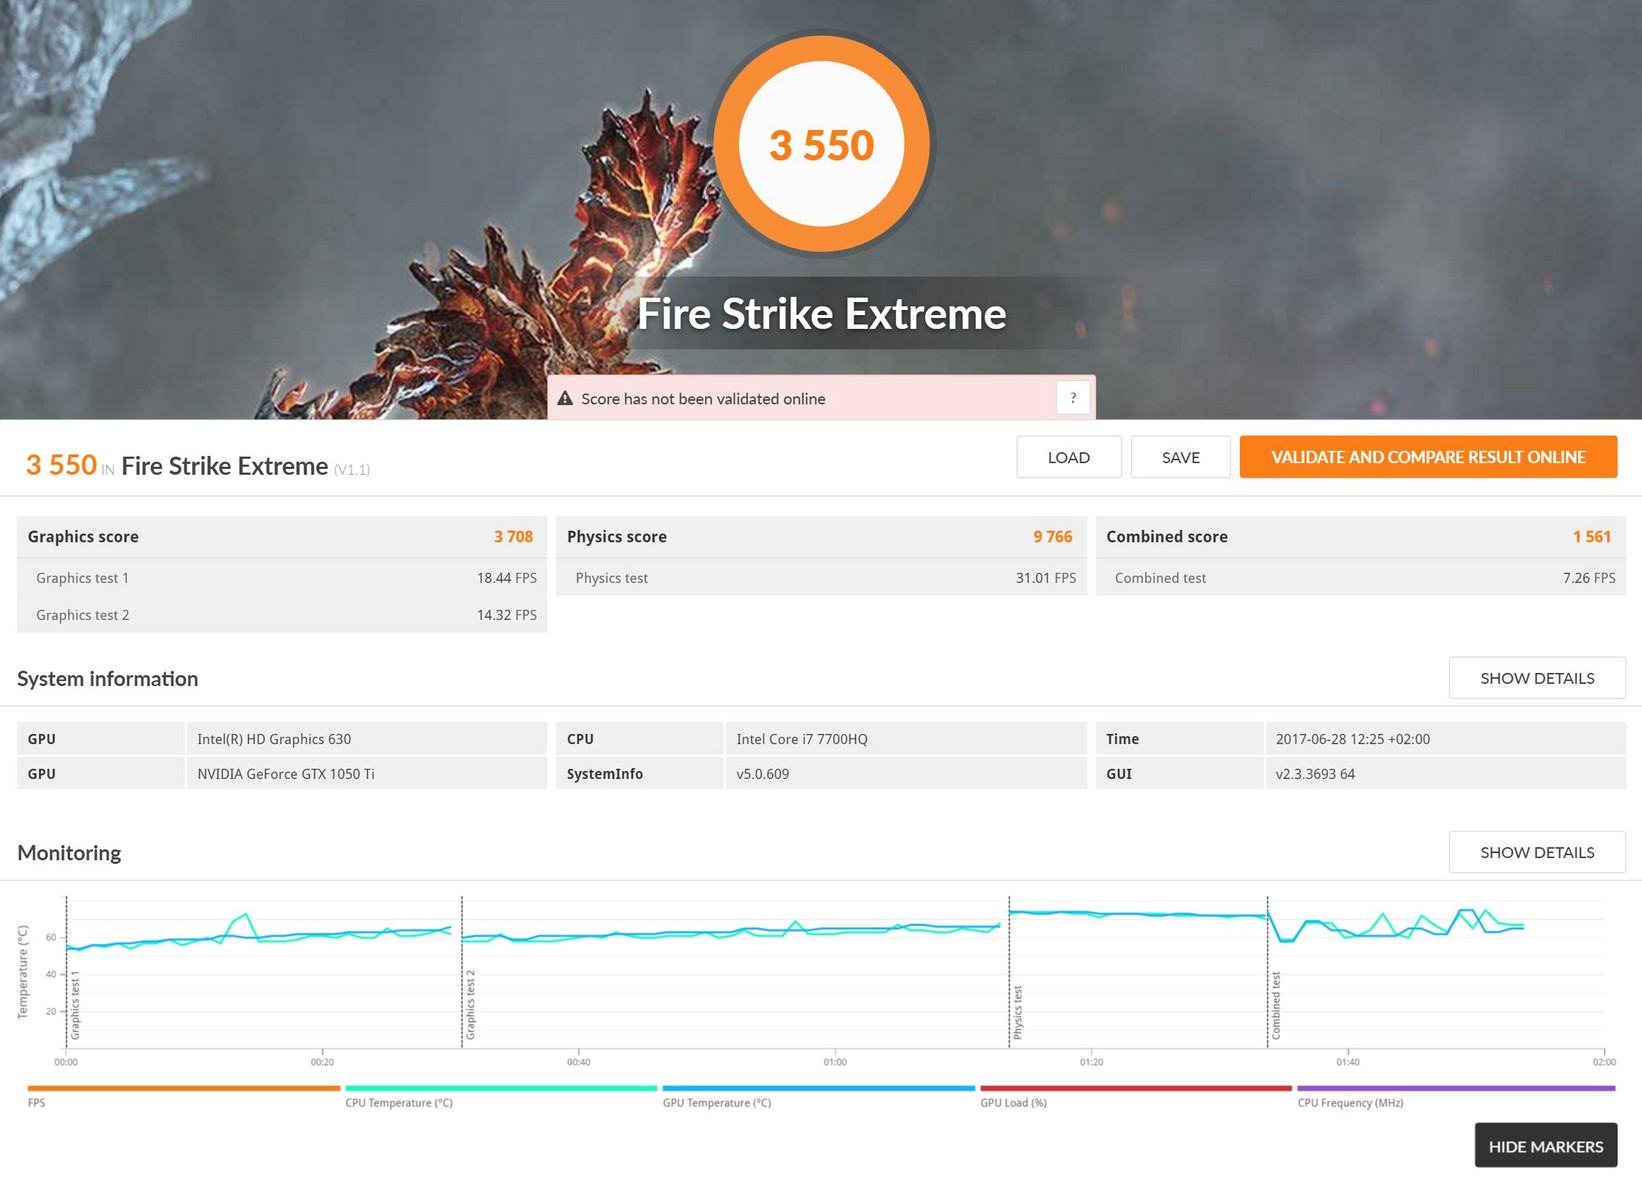
| 3DMark Fire Strike Extreme Score | 3550 puntos | |
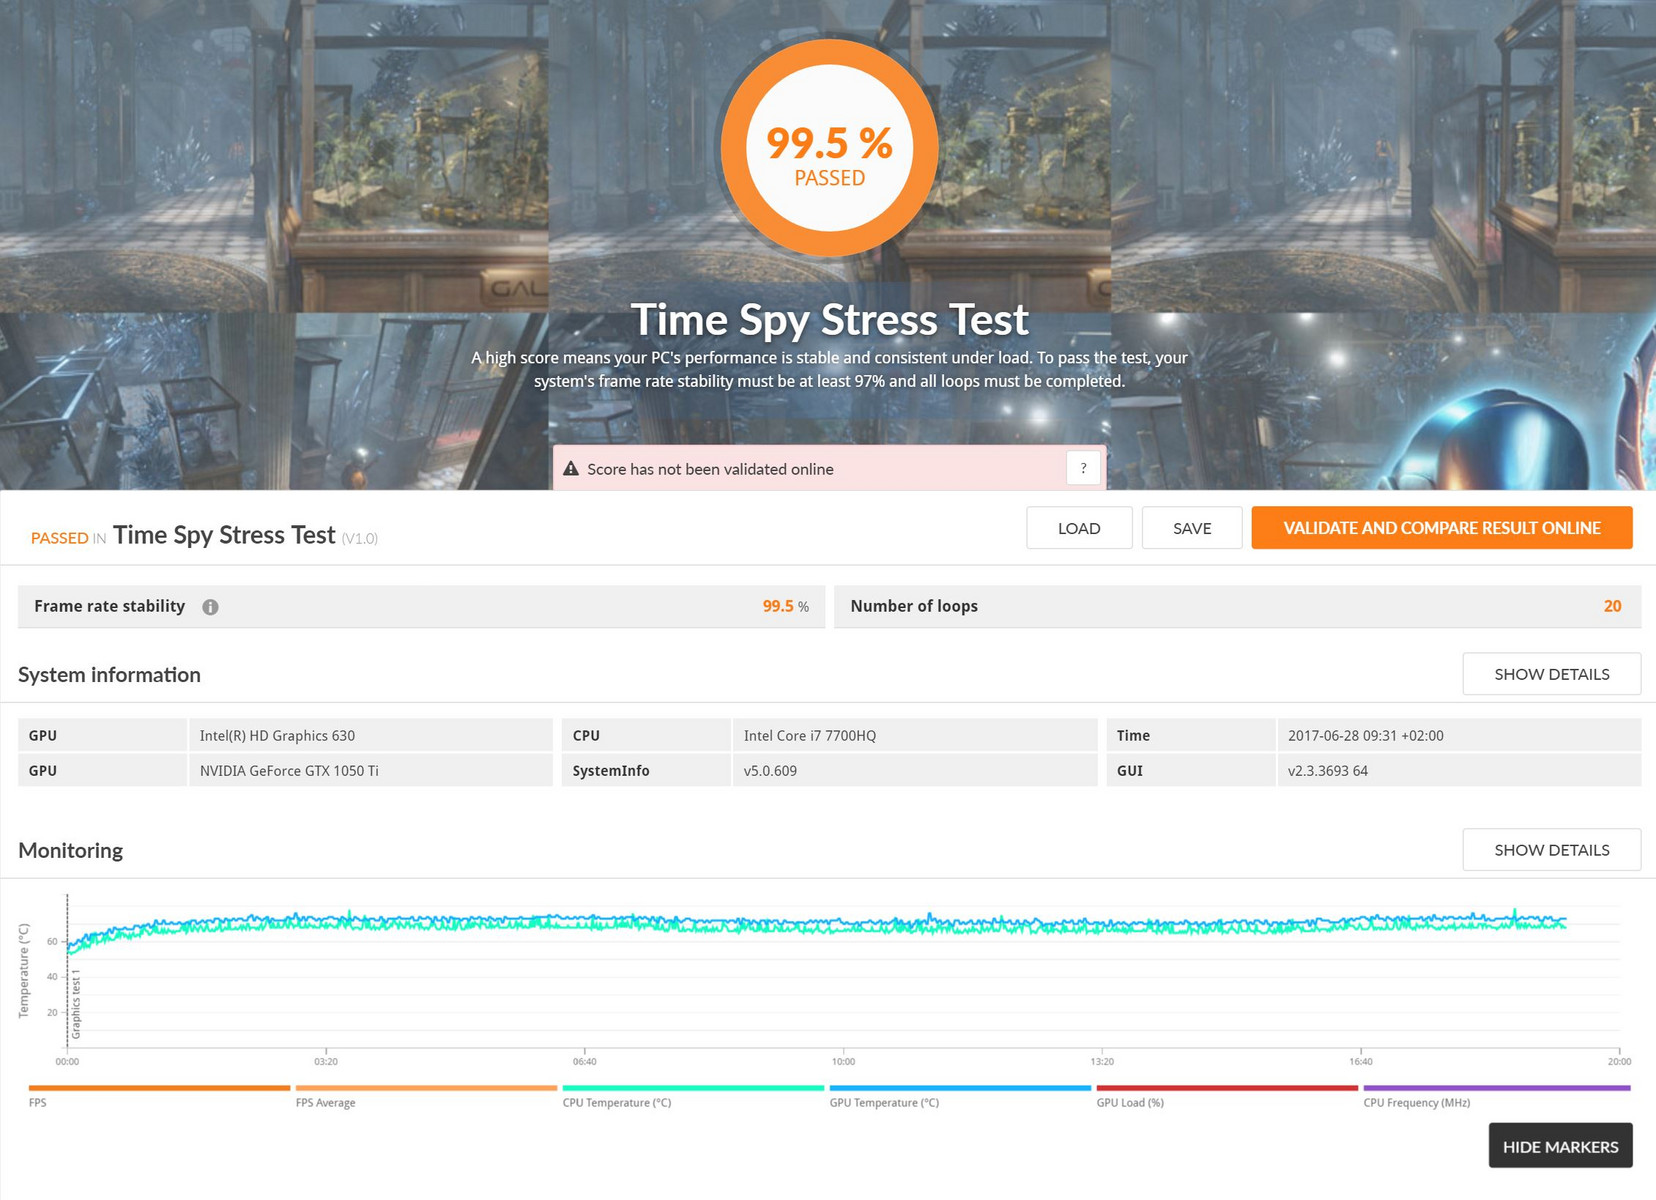
| 3DMark Time Spy Score | 2455 puntos | |
ayuda | ||
| bajo | medio | alto | ultra | |
|---|---|---|---|---|
| BioShock Infinite (2013) | 216 | 176.8 | 163.4 | 70.7 |
| Battlefield 4 (2013) | 180.2 | 176.4 | 146 | 71.3 |
| The Witcher 3 (2015) | 128.1 | 86.2 | 48.3 | 26.6 |
| Rise of the Tomb Raider (2016) | 115.4 | 68.2 | 38.9 | 32.5 |
Ruido
| Ocioso |
| 32 / 34 / 36 dB(A) |
| HDD |
| 34 dB(A) |
| Carga |
| 48 / 51 dB(A) |
 | ||
30 dB silencioso 40 dB(A) audible 50 dB(A) ruidosamente alto |
||
min: | ||
| HP Omen 15-ax213ng GeForce GTX 1050 Ti Mobile, i7-7700HQ | HP Omen 15-ax007ng GeForce GTX 965M, 6700HQ | Acer Aspire VX5-591G-75C4 VX15 GeForce GTX 1050 Ti Mobile, i7-7700HQ | Dell Inspiron 15 7000 7567 GeForce GTX 1050 Ti Mobile, i7-7700HQ | Lenovo Legion Y520-15IKBN-80WK001KUS GeForce GTX 1050 Ti Mobile, i7-7700HQ | Asus FX502VM-AS73 GeForce GTX 1060 Mobile, i7-7700HQ | MSI GS63VR 7RF-228US GeForce GTX 1060 Mobile, i7-7700HQ | |
|---|---|---|---|---|---|---|---|
| Noise | 3% | 11% | 6% | 13% | 6% | 7% | |
| apagado / medio ambiente * (dB) | 30 | 30 -0% | 30.4 -1% | 30.3 -1% | 27.7 8% | 28.7 4% | 28.8 4% |
| Idle Minimum * (dB) | 32 | 32 -0% | 31.4 2% | 30.9 3% | 30.5 5% | 30.6 4% | 33.1 -3% |
| Idle Average * (dB) | 34 | 33 3% | 31.4 8% | 30.9 9% | 30.5 10% | 30.6 10% | 33.1 3% |
| Idle Maximum * (dB) | 36 | 36 -0% | 31.4 13% | 31 14% | 30.6 15% | 31 14% | 34 6% |
| Load Average * (dB) | 48 | 43 10% | 36.8 23% | 46.5 3% | 40 17% | 46.2 4% | 37.2 22% |
| Witcher 3 ultra * (dB) | 49 | 40 18% | 46.1 6% | ||||
| Load Maximum * (dB) | 51 | 49 4% | 41.3 19% | 46.8 8% | 42.6 16% | 52.3 -3% | 47.1 8% |
* ... más pequeño es mejor
| HP Omen 15-ax213ng GeForce GTX 1050 Ti Mobile, i7-7700HQ | HP Omen 15-ax007ng GeForce GTX 965M, 6700HQ | Acer Aspire VX5-591G-75C4 VX15 GeForce GTX 1050 Ti Mobile, i7-7700HQ | Dell Inspiron 15 7000 7567 GeForce GTX 1050 Ti Mobile, i7-7700HQ | Lenovo Legion Y520-15IKBN-80WK001KUS GeForce GTX 1050 Ti Mobile, i7-7700HQ | Asus FX502VM-AS73 GeForce GTX 1060 Mobile, i7-7700HQ | MSI GS63VR 7RF-228US GeForce GTX 1060 Mobile, i7-7700HQ | |
|---|---|---|---|---|---|---|---|
| Heat | 3% | 9% | 21% | 4% | -3% | 1% | |
| Maximum Upper Side * (°C) | 52.4 | 48.5 7% | 47 10% | 43.4 17% | 46.8 11% | 53.2 -2% | |
| Maximum Bottom * (°C) | 54.2 | 59 -9% | 47 13% | 37.7 30% | 55.8 -3% | 56.8 -5% | |
| Idle Upper Side * (°C) | 30.5 | 28.7 6% | 28.4 7% | 24.3 20% | 27.6 10% | 28.8 6% | 28.4 7% |
| Idle Bottom * (°C) | 28.2 | 25.7 9% | 27.1 4% | 23.6 16% | 28.4 -1% | 31.4 -11% | 29.6 -5% |
* ... más pequeño es mejor
(-) La temperatura máxima en la parte superior es de 52.4 °C / 126 F, frente a la media de 36.8 °C / 98 F, que oscila entre 21 y 71 °C para la clase Multimedia.
(-) El fondo se calienta hasta un máximo de 54.2 °C / 130 F, frente a la media de 39.1 °C / 102 F
(+) En reposo, la temperatura media de la parte superior es de 28.5 °C / 83# F, frente a la media del dispositivo de 31.3 °C / 88 F.
(-) Jugando a The Witcher 3, la temperatura media de la parte superior es de 38.9 °C / 102 F, frente a la media del dispositivo de 31.3 °C / 88 F.
(-) El reposamanos y el touchpad pueden calentarse mucho al tacto con un máximo de 45.4 °C / 113.7 F.
(-) La temperatura media de la zona del reposamanos de dispositivos similares fue de 28.7 °C / 83.7 F (-16.7 °C / -30 F).
HP Omen 15-ax213ng análisis de audio
(±) | la sonoridad del altavoz es media pero buena (80 dB)
Graves 100 - 315 Hz
(-) | casi sin bajos - de media 18.2% inferior a la mediana
(±) | la linealidad de los graves es media (11.8% delta a frecuencia anterior)
Medios 400 - 2000 Hz
(+) | medios equilibrados - a sólo 4.3% de la mediana
(+) | los medios son lineales (4.2% delta a la frecuencia anterior)
Altos 2 - 16 kHz
(+) | máximos equilibrados - a sólo 4.2% de la mediana
(+) | los máximos son lineales (5.8% delta a la frecuencia anterior)
Total 100 - 16.000 Hz
(±) | la linealidad del sonido global es media (20.6% de diferencia con la mediana)
En comparación con la misma clase
» 70% de todos los dispositivos probados de esta clase eran mejores, 8% similares, 22% peores
» El mejor tuvo un delta de 5%, la media fue 17%, el peor fue ###max##%
En comparación con todos los dispositivos probados
» 55% de todos los dispositivos probados eran mejores, 8% similares, 37% peores
» El mejor tuvo un delta de 4%, la media fue 23%, el peor fue ###max##%
MSI GS63VR 7RF-228US análisis de audio
(±) | la sonoridad del altavoz es media pero buena (75 dB)
Graves 100 - 315 Hz
(-) | casi sin bajos - de media 25.3% inferior a la mediana
(±) | la linealidad de los graves es media (12.4% delta a frecuencia anterior)
Medios 400 - 2000 Hz
(+) | medios equilibrados - a sólo 3.3% de la mediana
(±) | la linealidad de los medios es media (7% delta respecto a la frecuencia anterior)
Altos 2 - 16 kHz
(±) | máximos más altos - de media 8.1% más altos que la mediana
(±) | la linealidad de los máximos es media (8.6% delta a frecuencia anterior)
Total 100 - 16.000 Hz
(±) | la linealidad del sonido global es media (28.4% de diferencia con la mediana)
En comparación con la misma clase
» 94% de todos los dispositivos probados de esta clase eran mejores, 1% similares, 4% peores
» El mejor tuvo un delta de 6%, la media fue 18%, el peor fue ###max##%
En comparación con todos los dispositivos probados
» 86% de todos los dispositivos probados eran mejores, 3% similares, 12% peores
» El mejor tuvo un delta de 4%, la media fue 23%, el peor fue ###max##%
| Off / Standby | |
| Ocioso | |
| Carga |
|
Clave:
min: | |
| HP Omen 15-ax213ng GeForce GTX 1050 Ti Mobile, i7-7700HQ | HP Omen 15-ax007ng GeForce GTX 965M, 6700HQ | Acer Aspire VX5-591G-75C4 VX15 GeForce GTX 1050 Ti Mobile, i7-7700HQ | Dell Inspiron 15 7000 7567 GeForce GTX 1050 Ti Mobile, i7-7700HQ | Lenovo Legion Y520-15IKBN-80WK001KUS GeForce GTX 1050 Ti Mobile, i7-7700HQ | Asus FX502VM-AS73 GeForce GTX 1060 Mobile, i7-7700HQ | MSI GS63VR 7RF-228US GeForce GTX 1060 Mobile, i7-7700HQ | |
|---|---|---|---|---|---|---|---|
| Power Consumption | -1% | 6% | 26% | 5% | -40% | -51% | |
| Idle Minimum * (Watt) | 6 | 7 -17% | 7 -17% | 4.4 27% | 8.5 -42% | 14.9 -148% | 14.5 -142% |
| Idle Average * (Watt) | 11 | 11 -0% | 10.2 7% | 6.8 38% | 9.1 17% | 15.1 -37% | 17.3 -57% |
| Idle Maximum * (Watt) | 18 | 19 -6% | 14 22% | 8.3 54% | 9.7 46% | 15.2 16% | 17.4 3% |
| Load Average * (Watt) | 81 | 79 2% | 78 4% | 81 -0% | 79.9 1% | 105.8 -31% | 93 -15% |
| Witcher 3 ultra * (Watt) | 90 | 97.7 -9% | 128.8 -43% | ||||
| Load Maximum * (Watt) | 146 | 119 18% | 127 13% | 127 13% | 121.5 17% | 148.8 -2% |
* ... más pequeño es mejor
| HP Omen 15-ax213ng i7-7700HQ, GeForce GTX 1050 Ti Mobile, 63.3 Wh | HP Omen 15-ax007ng 6700HQ, GeForce GTX 965M, 61.5 Wh | Acer Aspire VX5-591G-75C4 VX15 i7-7700HQ, GeForce GTX 1050 Ti Mobile, 52.5 Wh | Dell Inspiron 15 7000 7567 i7-7700HQ, GeForce GTX 1050 Ti Mobile, 74 Wh | Lenovo Legion Y520-15IKBN-80WK001KUS i7-7700HQ, GeForce GTX 1050 Ti Mobile, 45 Wh | Asus FX502VM-AS73 i7-7700HQ, GeForce GTX 1060 Mobile, 64 Wh | MSI GS63VR 7RF-228US i7-7700HQ, GeForce GTX 1060 Mobile, 65 Wh | |
|---|---|---|---|---|---|---|---|
| Duración de Batería | -13% | -34% | 54% | -43% | -39% | -38% | |
| Reader / Idle (h) | 12.8 | 7.8 -39% | 5.4 -58% | 19.6 53% | 8.5 -34% | 6.1 -52% | 6.4 -50% |
| H.264 (h) | 3.3 | 4.1 24% | 7.6 130% | ||||
| WiFi v1.3 (h) | 7.1 | 4.5 -37% | 5 -30% | 10.4 46% | 4 -44% | 4.6 -35% | 3.9 -45% |
| Load (h) | 1.6 | 1.6 0% | 1.4 -13% | 1.4 -13% | 0.8 -50% | 1.1 -31% | 1.3 -19% |
Pro
Contra

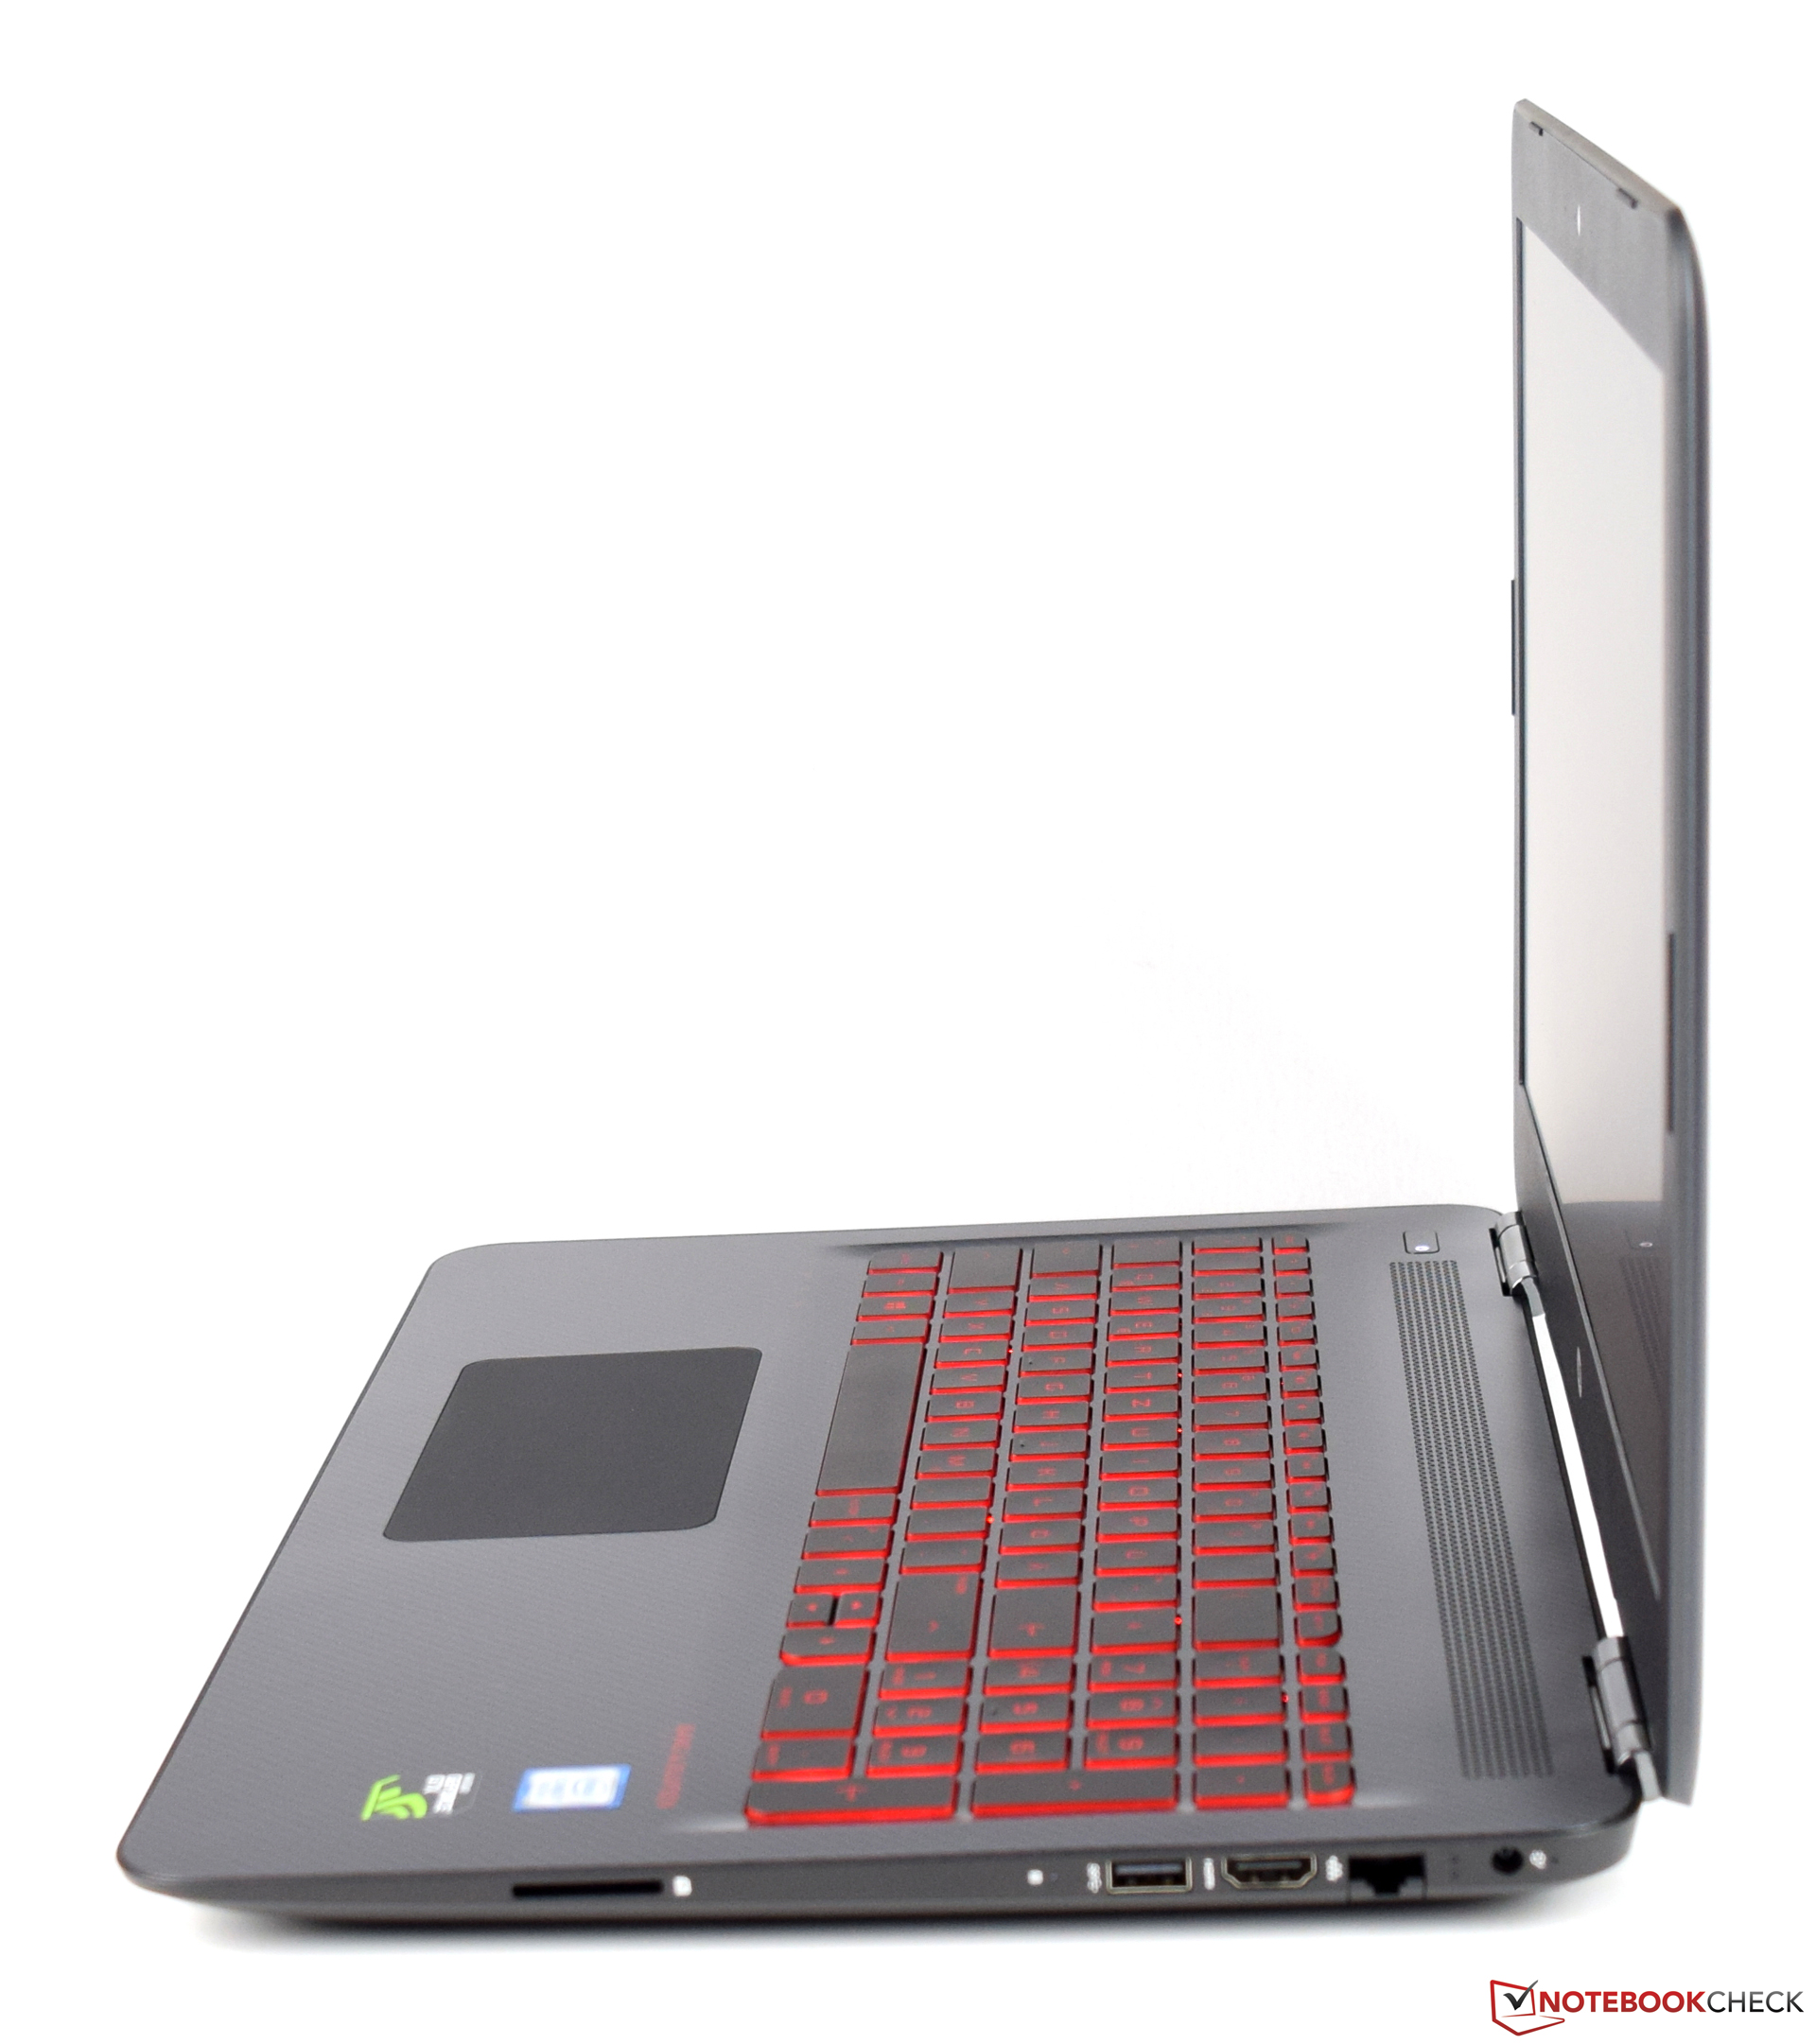
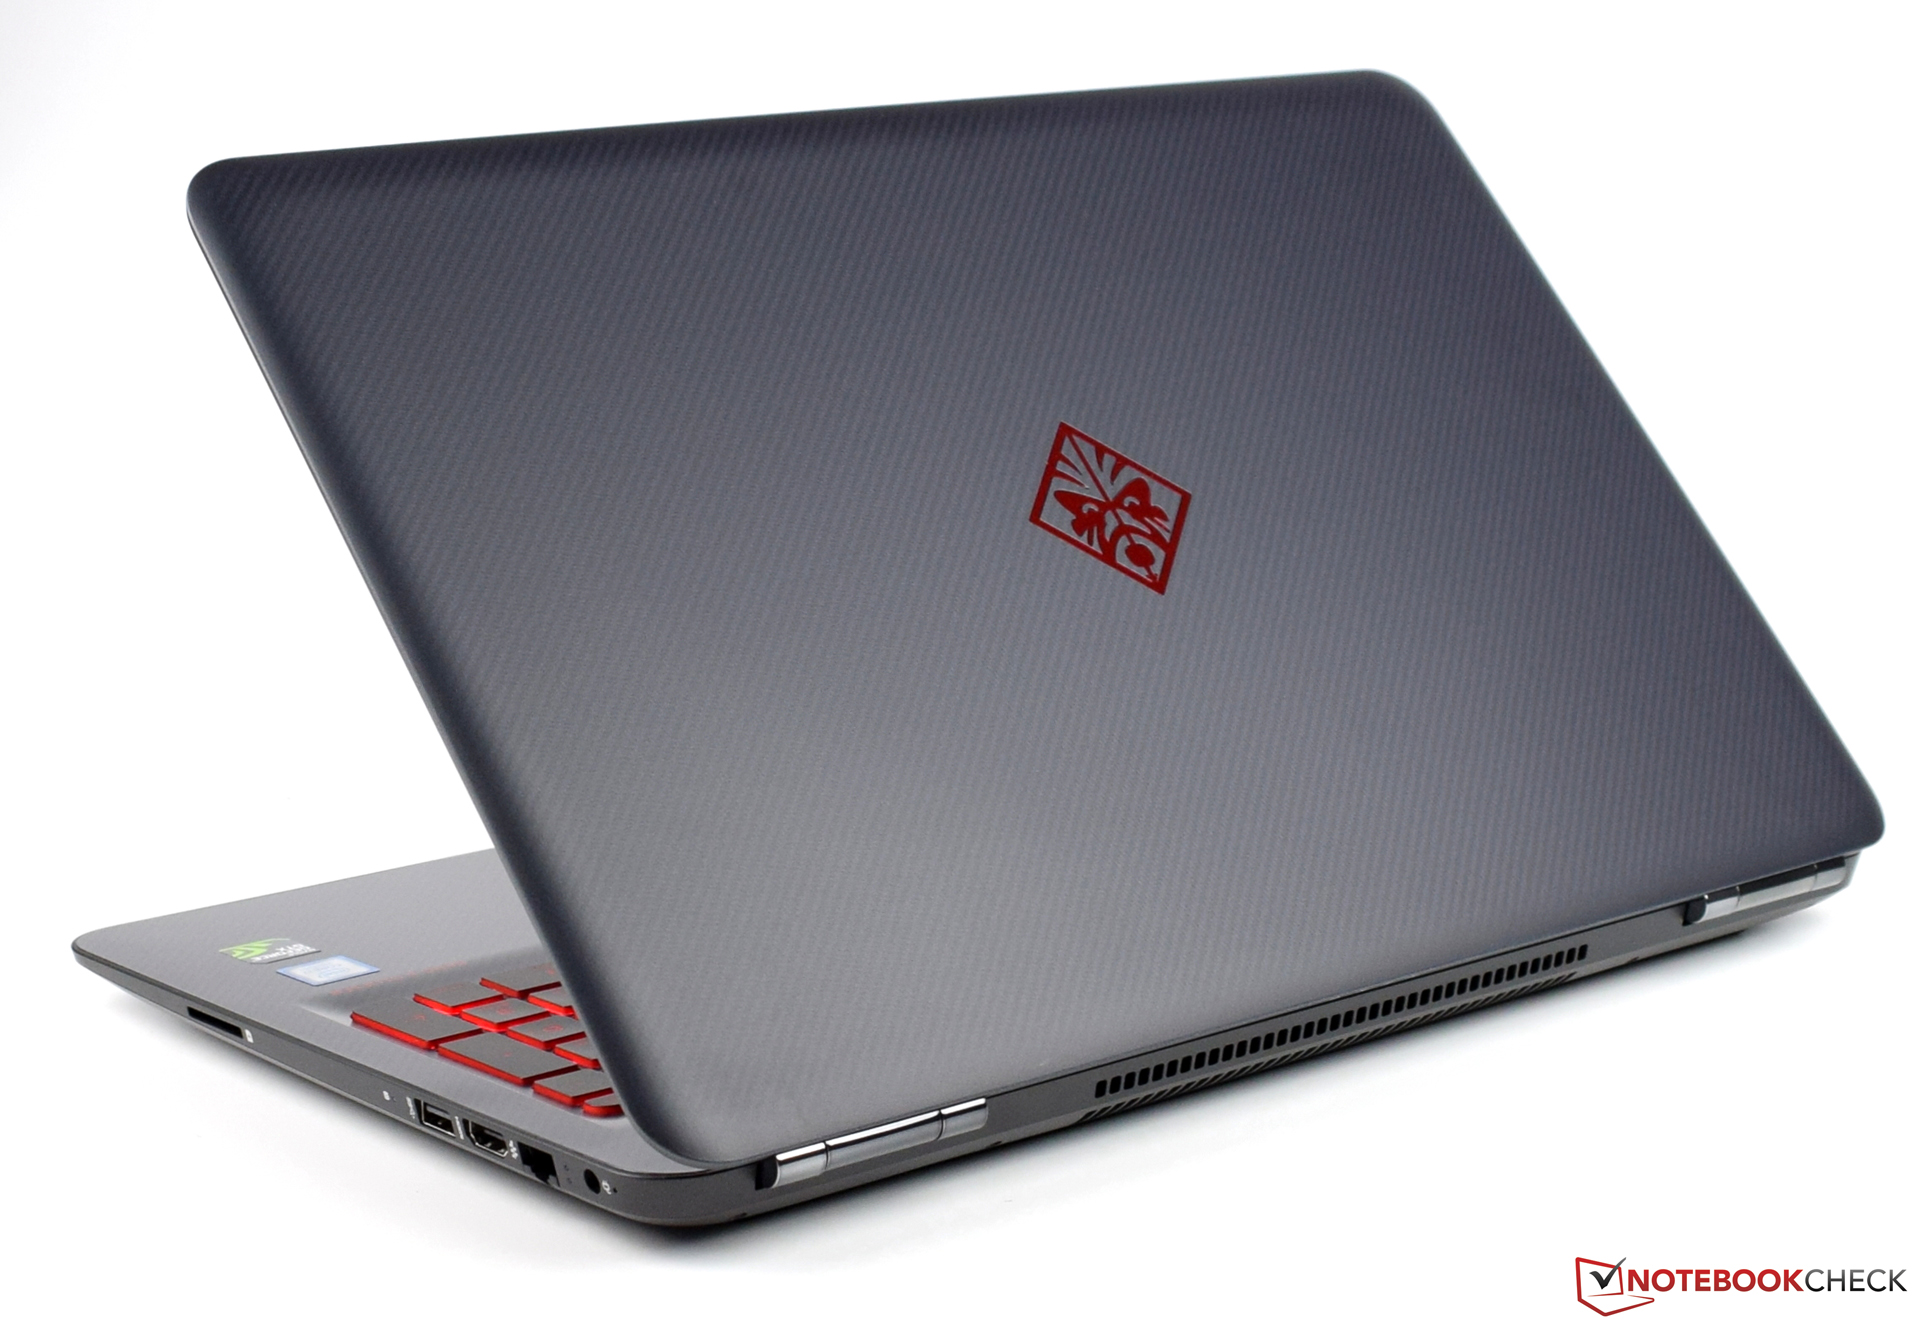
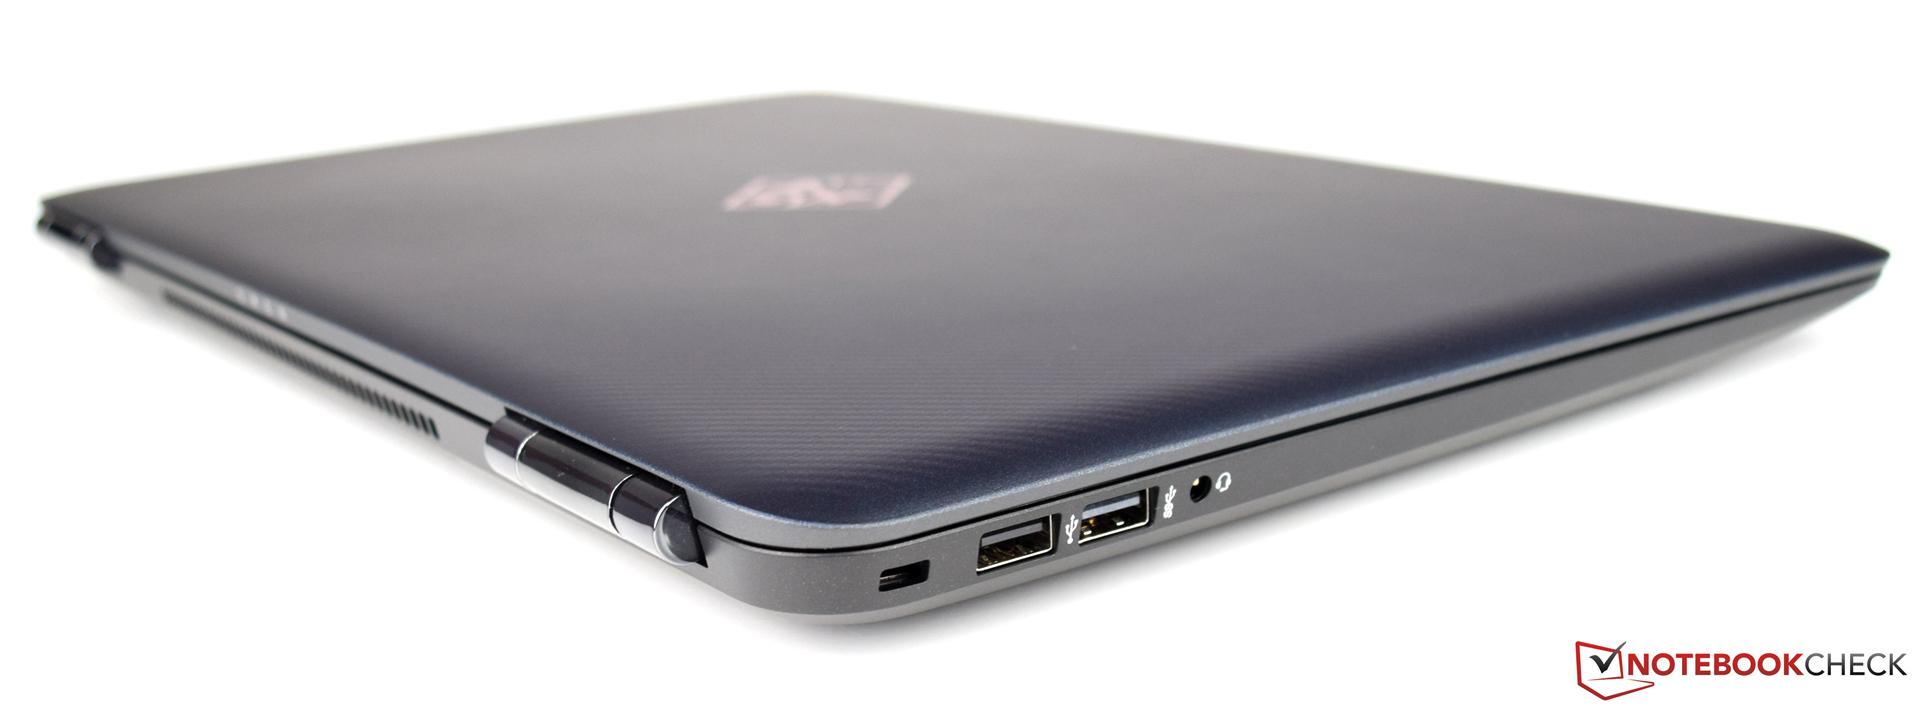
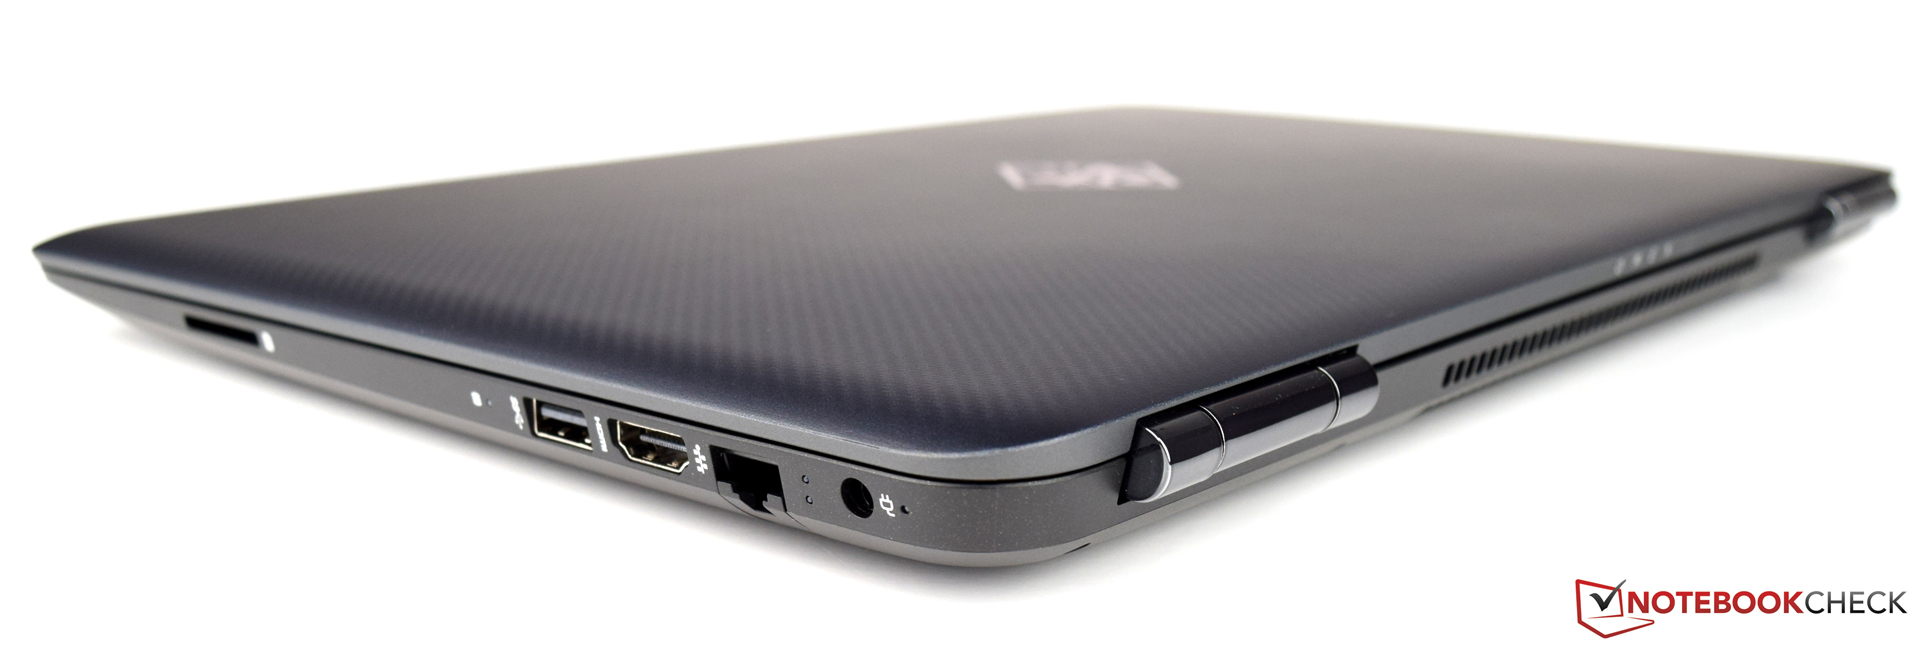
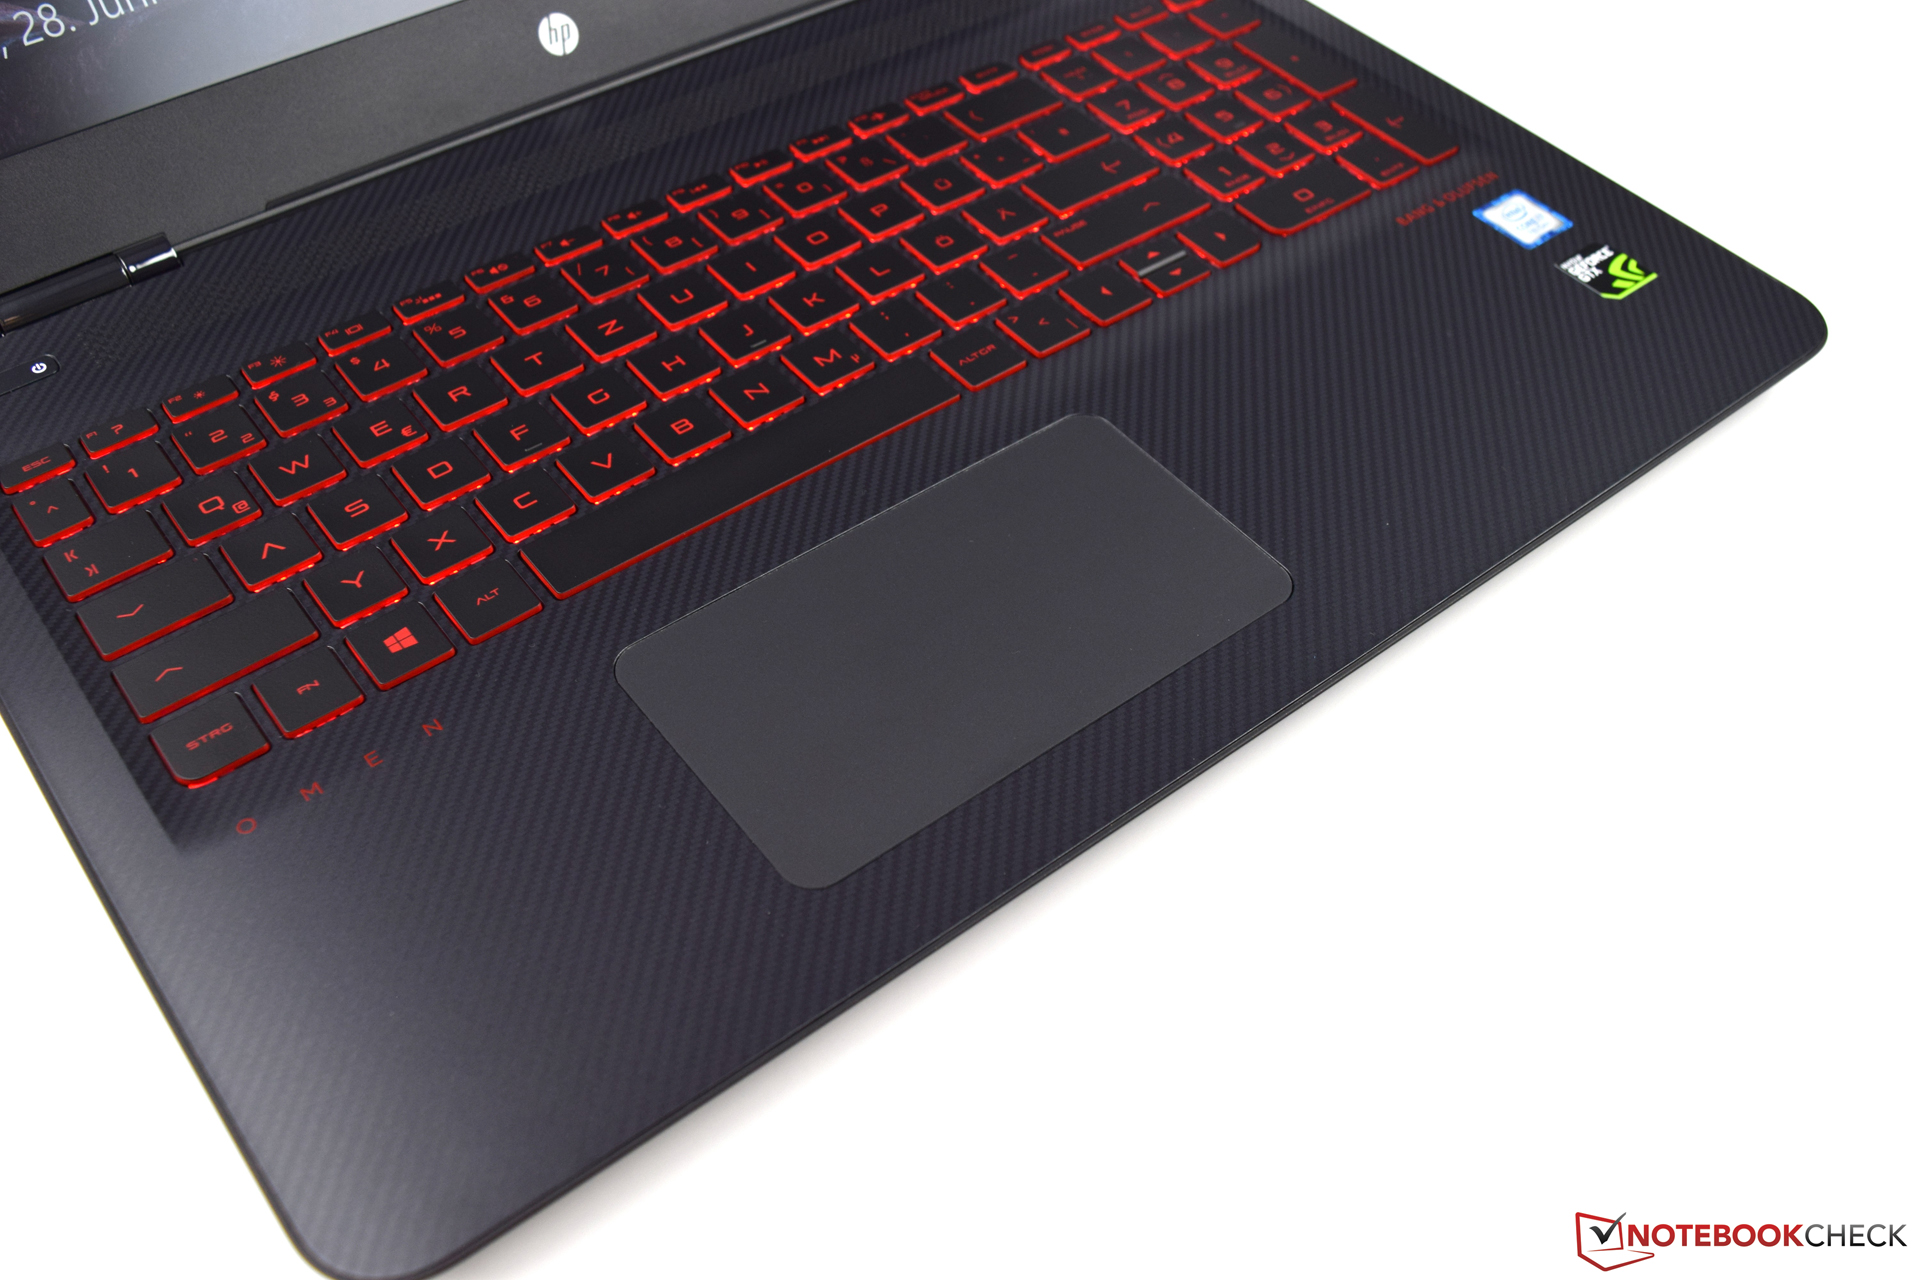
Al HP Omen 15t (2017) no le será fácil, especialmente con la competencia que ya ha ofrecido varios dispositivos con la nueva arquitectura Pascal. El dispositivo de 15" tiene buen diseño, aunque la construcción podría haber sido mejor para un dispositivo de $1500. No podemos comprender como no tiene puertos modernos como DisplayPort o USB 3.1 Gen2. su conectividad no está preparada para el futuro.
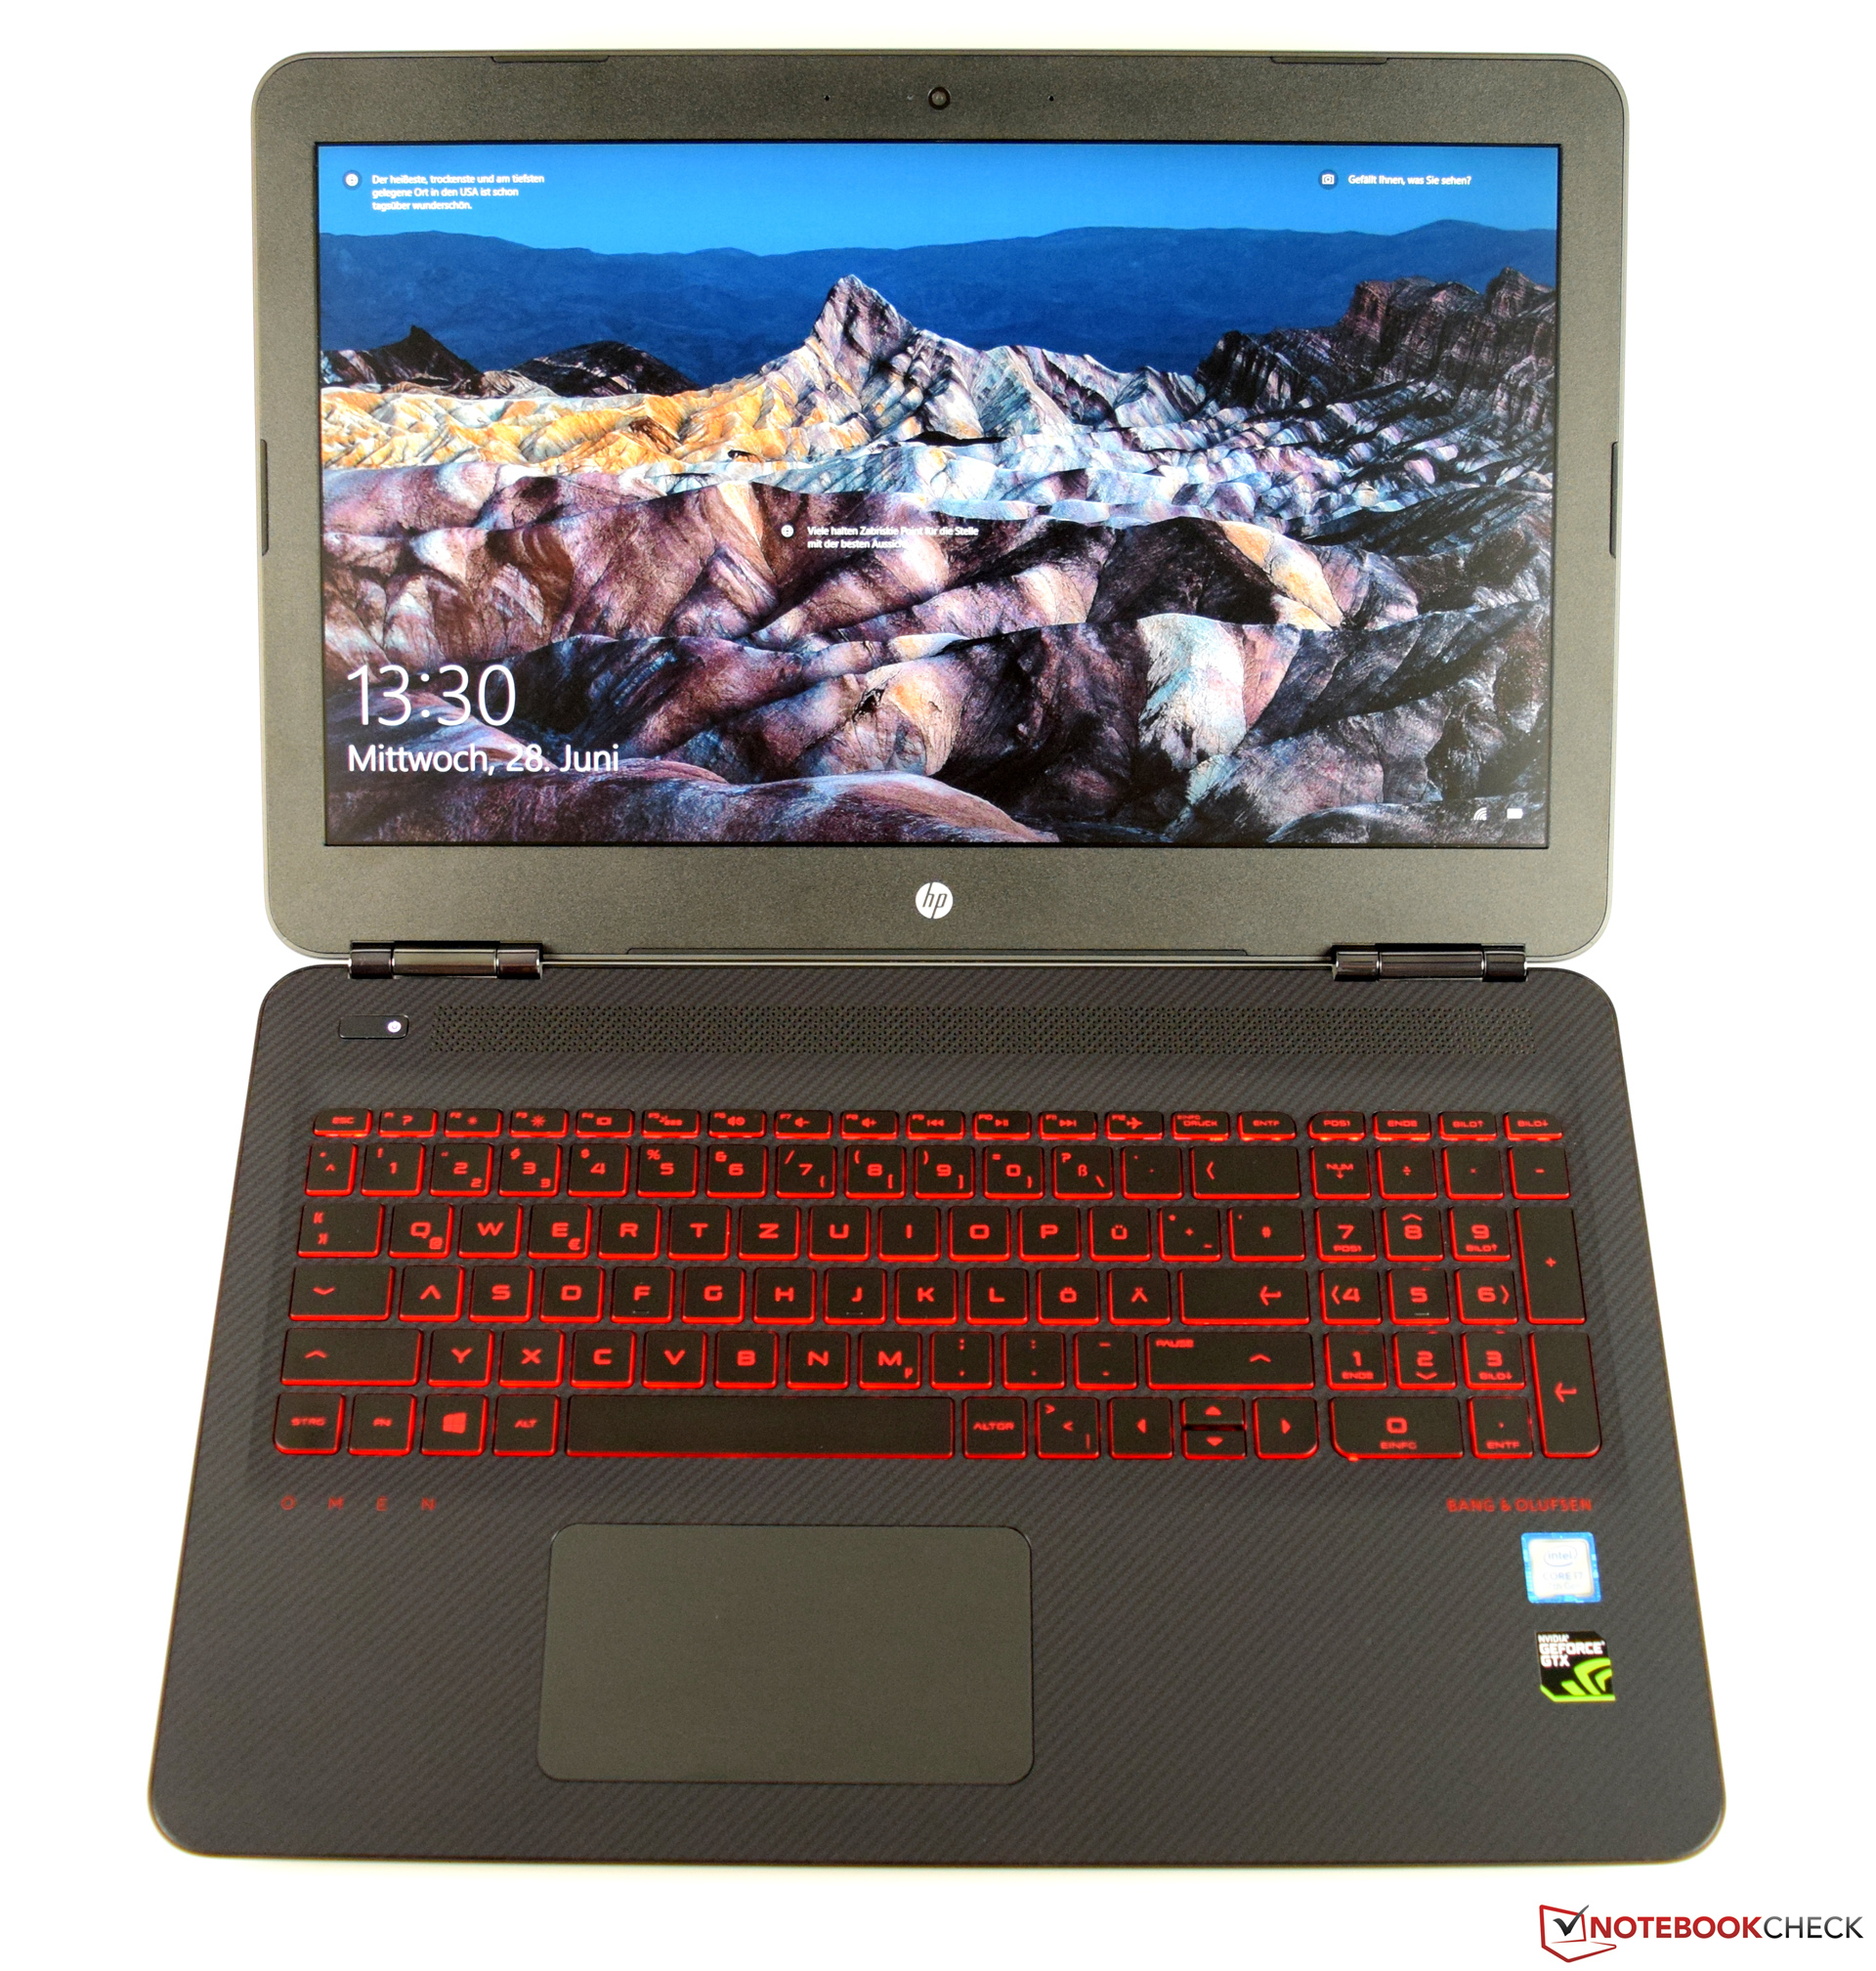
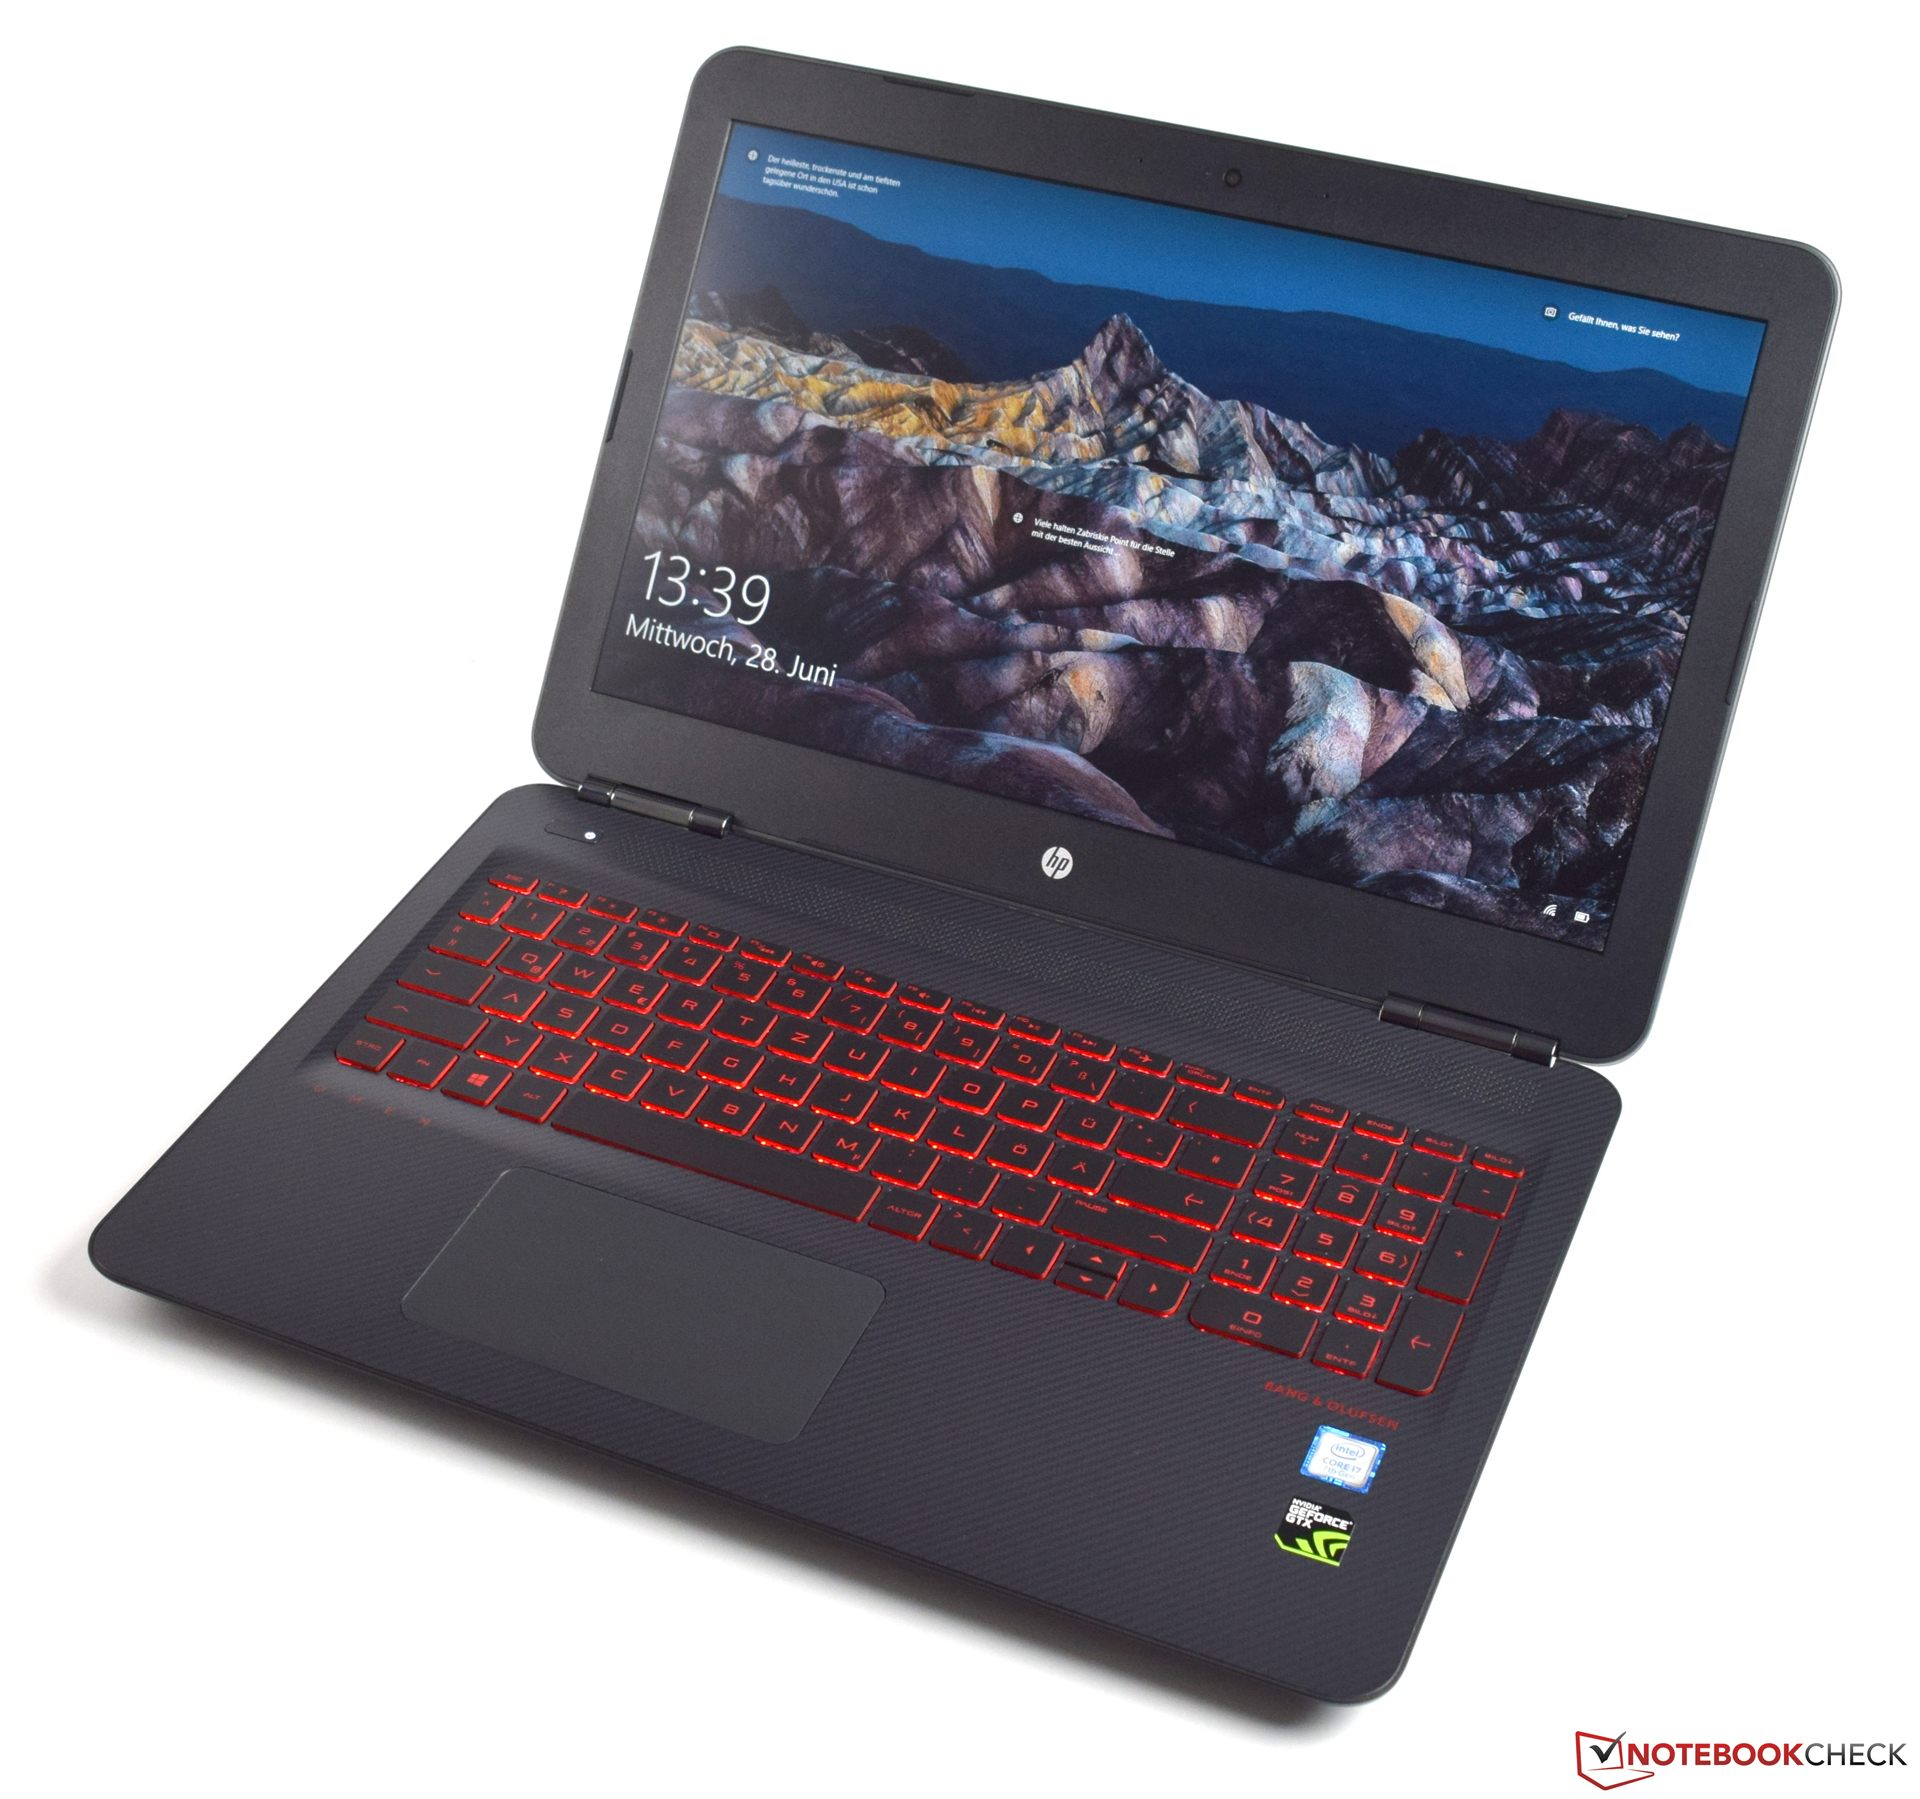
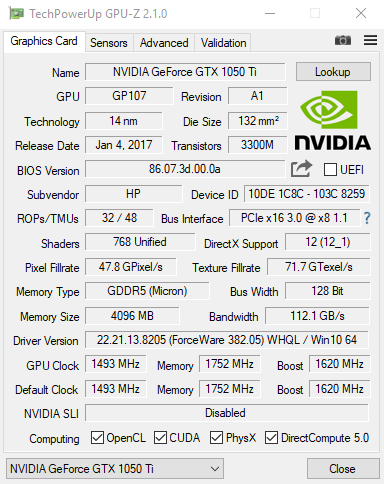
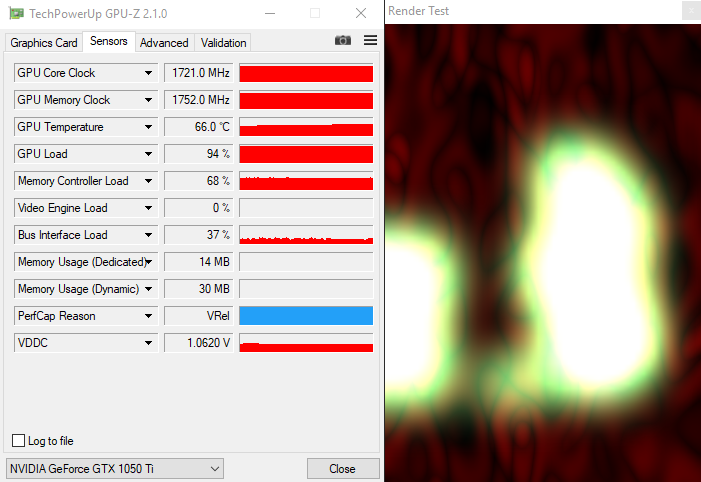
El HP Omen 15t (2017) mostró un rendimiento sólido, que jugó muy a su favor en nuestra evaluación. El dispositivo está equipado con una Nvidia GeForce GTX 1050 Ti y un Intel Core i7-7700HQ fuerte. Esta combinación, ayudada de los 1 GB de RAM permite jugar juegos actuales suavemente aun con gran cantidad de detalles.
Si estabas esperando el HP Omen 15t (2017), te premiará con un rendimiento gaming confiable. como sea, el fabricante ha decidido no actualizar sus puertos y quedarse con lo que conocía
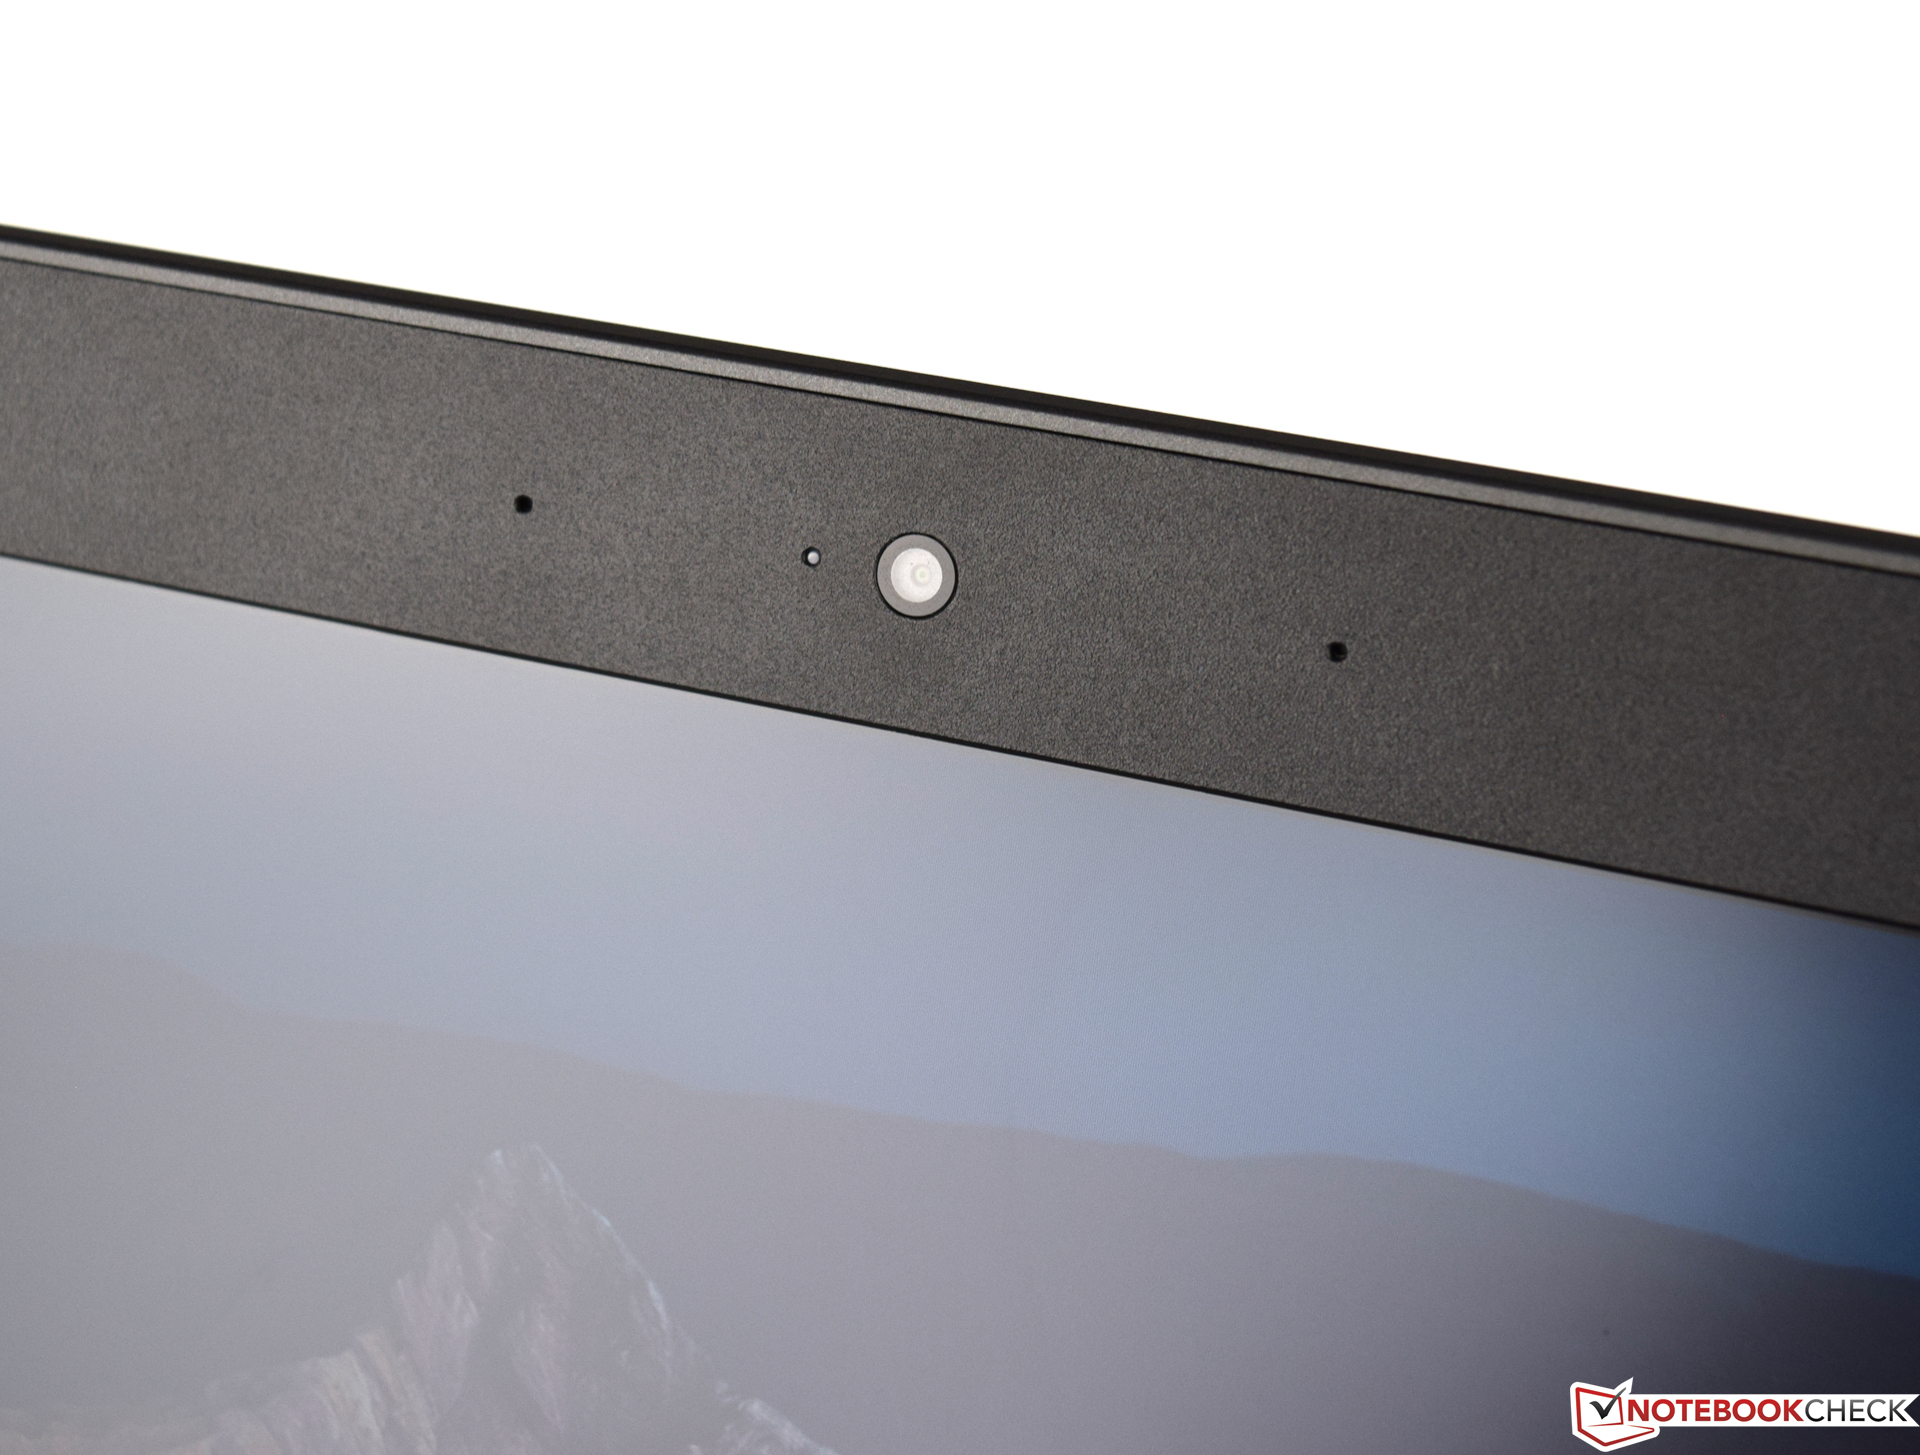
HP tambien ha perdido varios puntos debido a la pantalla, que no es lo suficientemente brillante. La cobertura del espacio de color es igual de decepcionante. Aun así, nos ha gustado el rendimiento del sistema del HP Omen 15, mejorada con su SSD NVMe.
Ésta es una versión acortada del análisis original. Puedes leer el análisis completo en inglés aquí.
HP Omen 15-ax213ng
- 07/03/2017 v6 (old)
Sebastian Bade