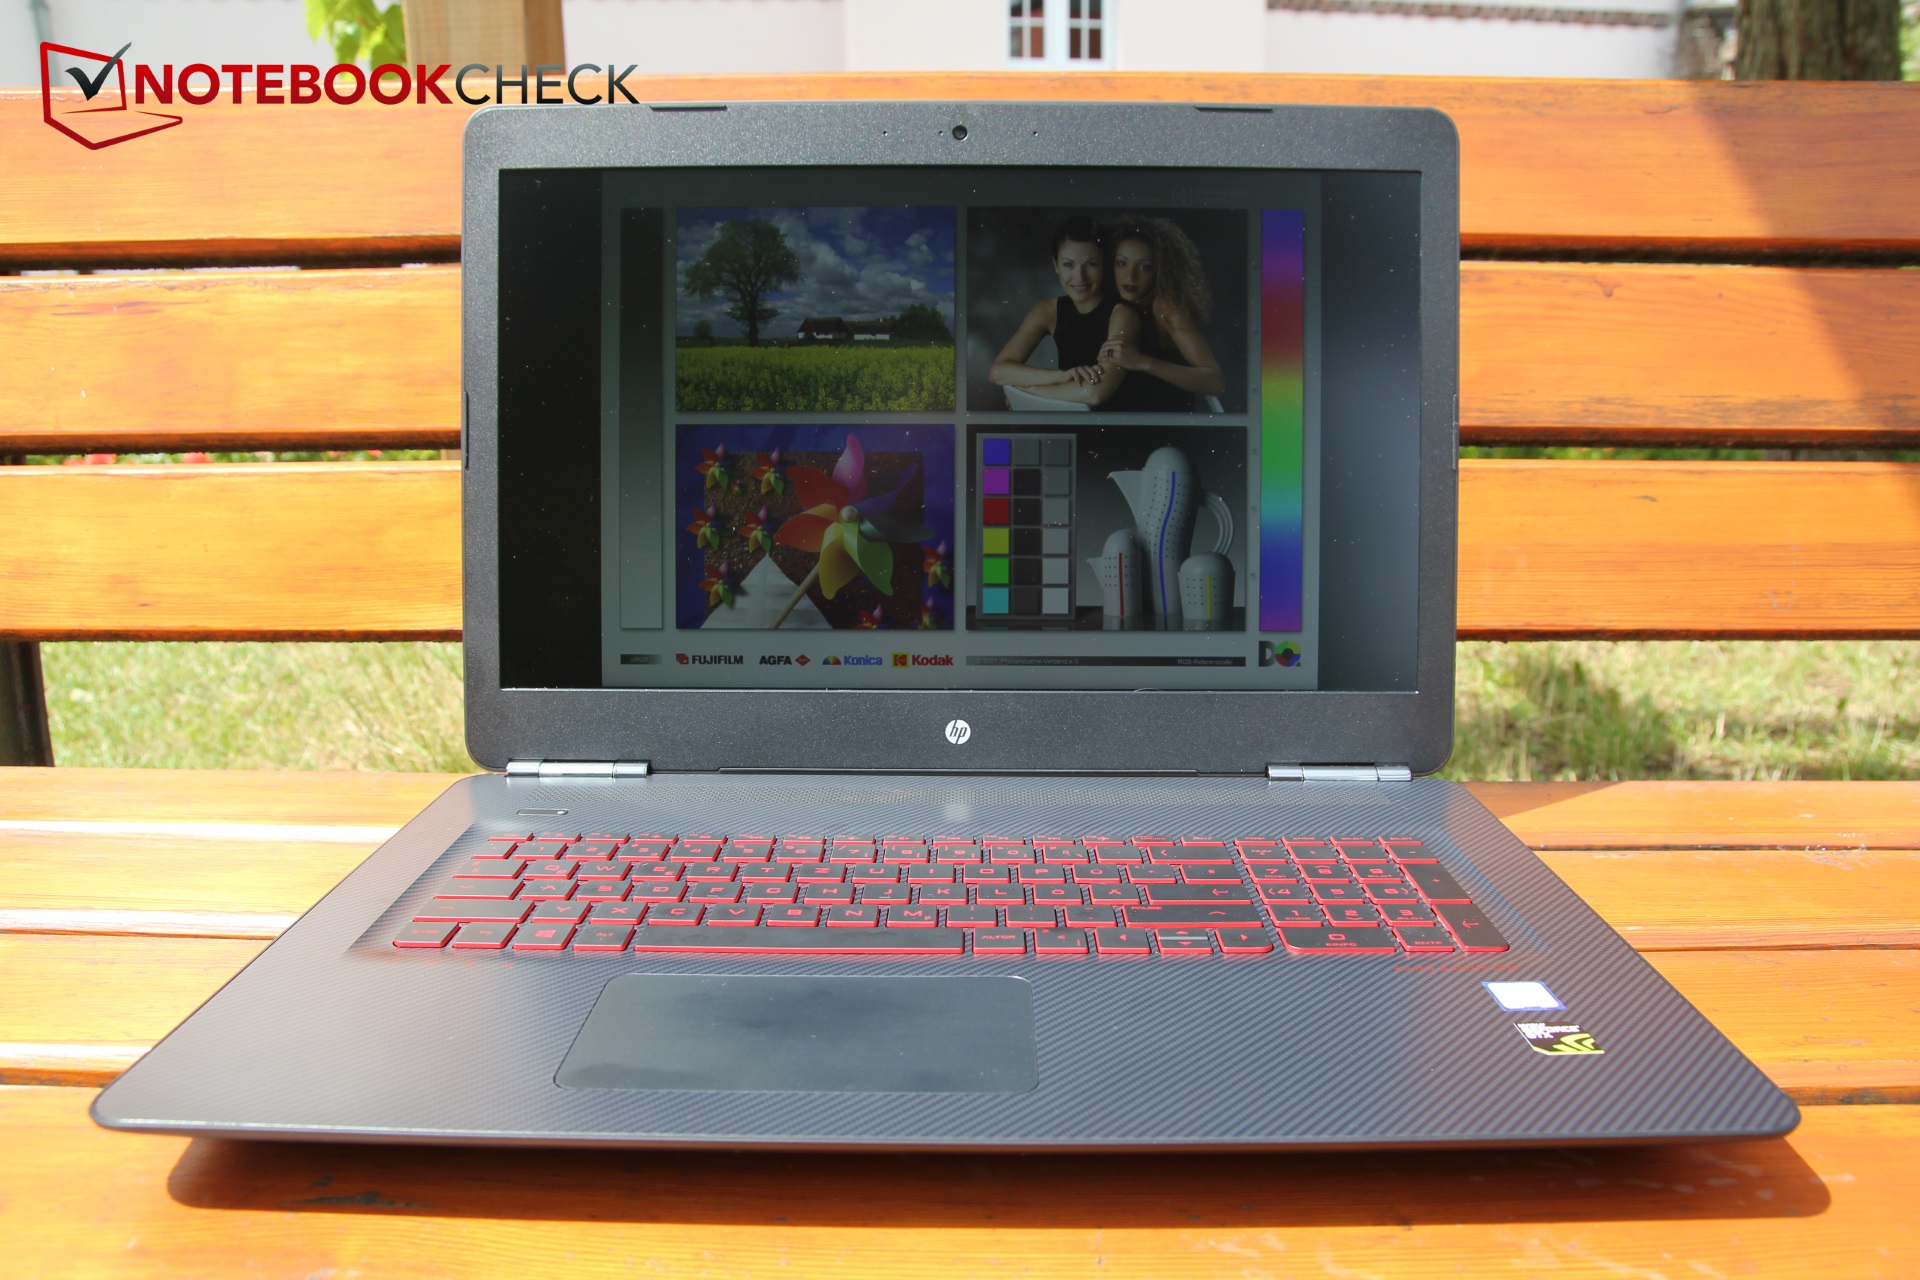
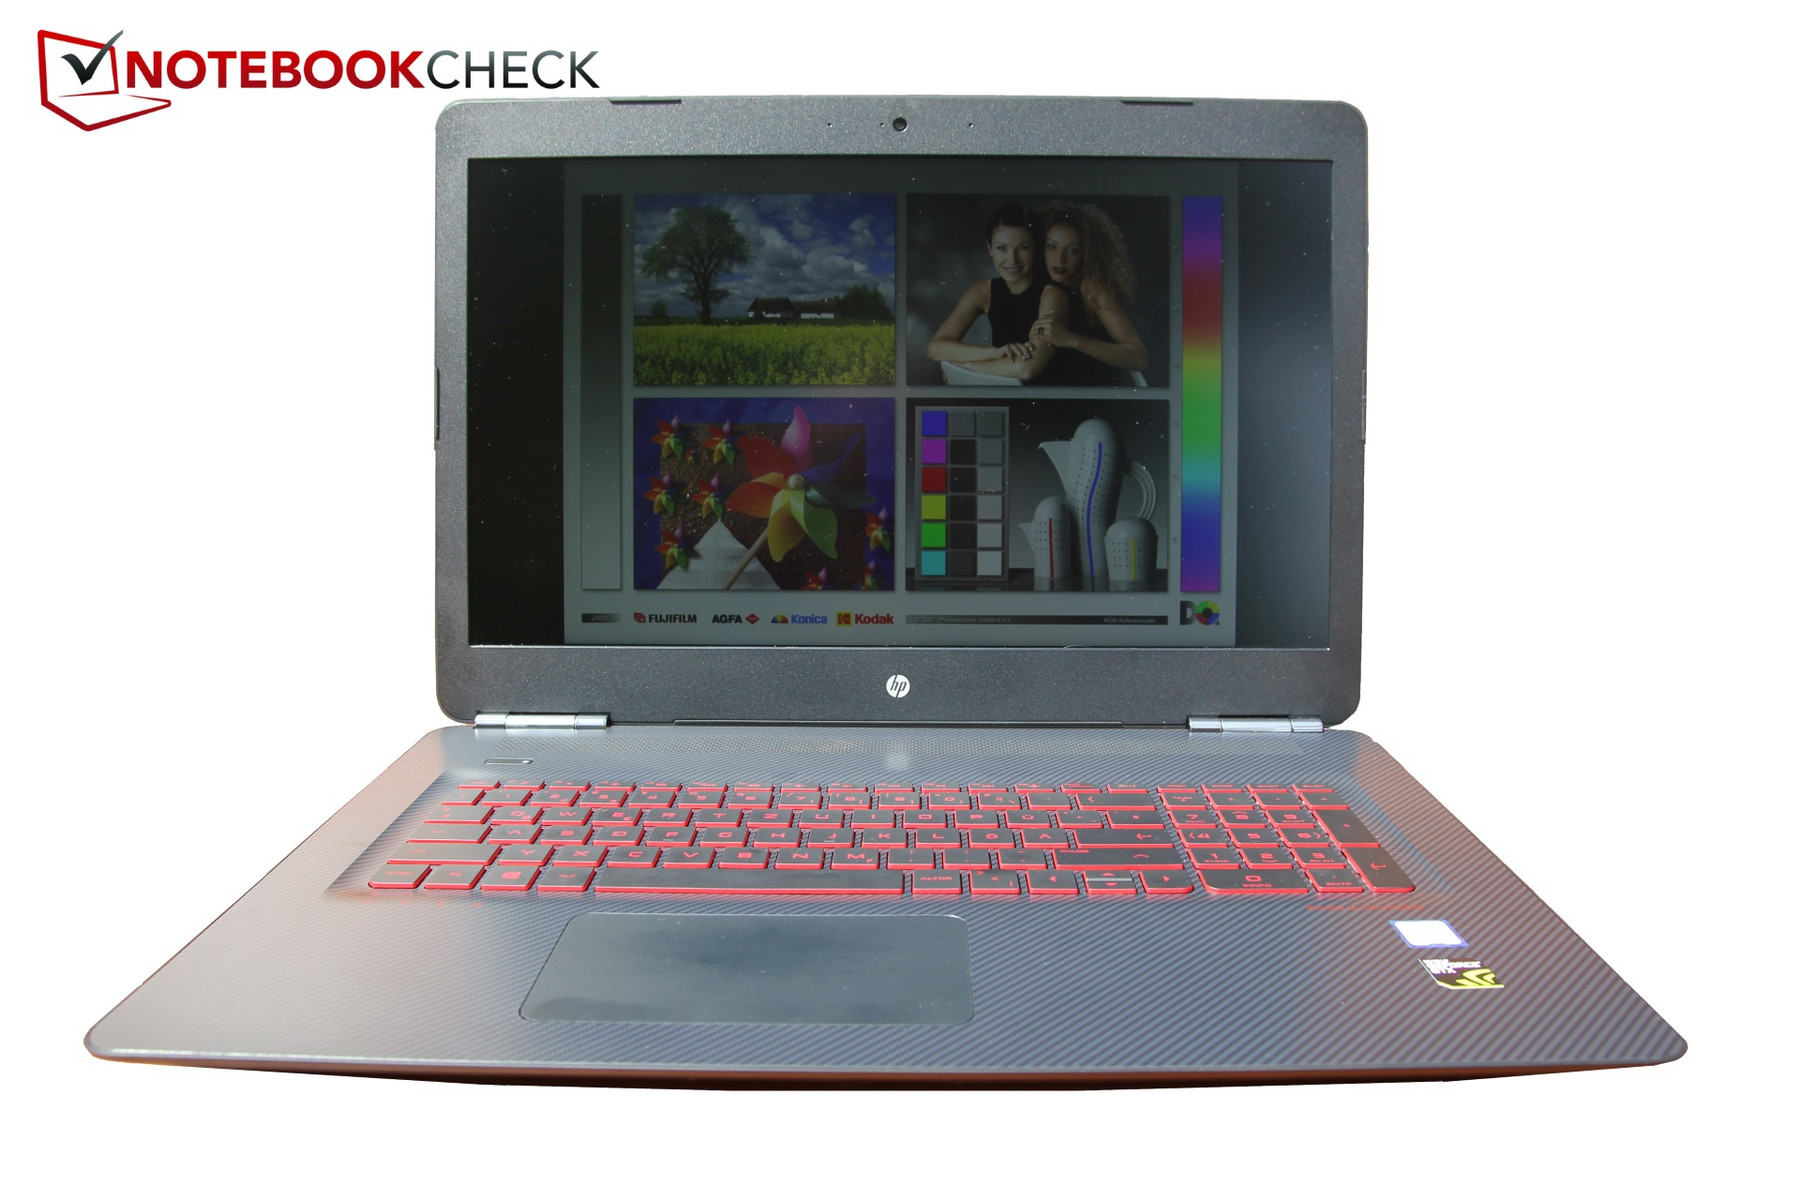
Breve análisis del HP Omen 17 (7700HQ, GTX 1050 Ti, FHD)

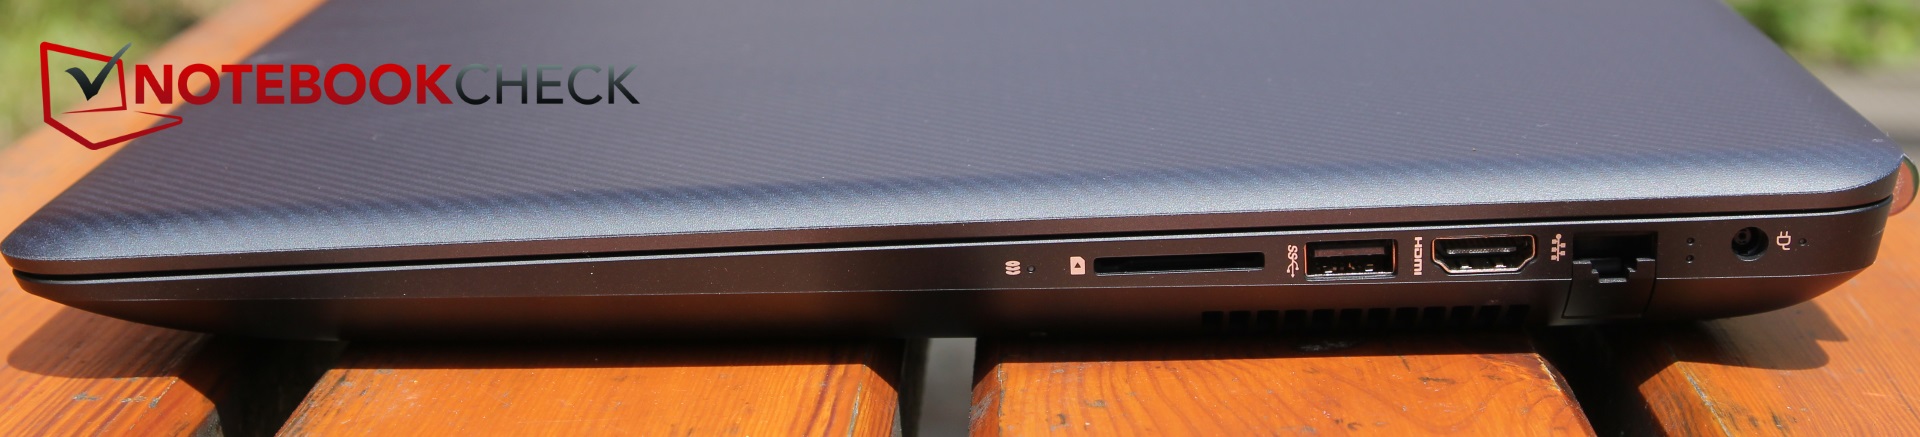
| SD Card Reader | |
| average JPG Copy Test (av. of 3 runs) | |
| Nexoc G739 | |
| HP Omen 17-w110ng | |
| HP Omen 17-w206ng | |
| Asus GL753VE-DS74 | |
| MSI GE72 7RE-046 | |
| Acer Aspire Nitro BE VN7-793G-5811 | |
| maximum AS SSD Seq Read Test (1GB) | |
| Asus GL753VE-DS74 | |
| HP Omen 17-w110ng | |
| Nexoc G739 | |
| HP Omen 17-w206ng | |
| MSI GE72 7RE-046 | |
| Acer Aspire Nitro BE VN7-793G-5811 | |
| |||||||||||||||||||||||||
iluminación: 79 %
Brillo con batería: 318 cd/m²
Contraste: 1272:1 (Negro: 0.25 cd/m²)
ΔE ColorChecker Calman: 4.7 | ∀{0.5-29.43 Ø4.71}
ΔE Greyscale Calman: 5 | ∀{0.09-98 Ø4.96}
93% sRGB (Argyll 1.6.3 3D)
61% AdobeRGB 1998 (Argyll 1.6.3 3D)
67.4% AdobeRGB 1998 (Argyll 3D)
93.1% sRGB (Argyll 3D)
67.2% Display P3 (Argyll 3D)
Gamma: 2.28
CCT: 7374 K
| HP Omen 17-w206ng Chi Mei CMN1738, 1920x1080, 17.3" | Nexoc G739 CMN1738, 1920x1080, 17.3" | HP Omen 17-w110ng LG Philips LGD046E, 1920x1080, 17.3" | Acer Aspire Nitro BE VN7-793G-5811 AU Optronics, 1920x1080, 17.3" | Asus GL753VE-DS74 LG Philips LP173WF4-SPF3, 1920x1080, 17.3" | MSI GE72 7RE-046 N173HHE-G32 (CMN1747), 1920x1080, 17.3" | |
|---|---|---|---|---|---|---|
| Display | -1% | -7% | -6% | 23% | ||
| Display P3 Coverage (%) | 67.2 | 66.7 -1% | 66.6 -1% | 63.1 -6% | 90.7 35% | |
| sRGB Coverage (%) | 93.1 | 91 -2% | 84.1 -10% | 86.5 -7% | 99.9 7% | |
| AdobeRGB 1998 Coverage (%) | 67.4 | 66.4 -1% | 61.5 -9% | 63.3 -6% | 85.2 26% | |
| Response Times | -13% | 6% | -2% | 10% | 47% | |
| Response Time Grey 50% / Grey 80% * (ms) | 38 ? | 45 ? -18% | 37 ? 3% | 38 ? -0% | 36 ? 5% | 27 ? 29% |
| Response Time Black / White * (ms) | 26 ? | 28 ? -8% | 24 ? 8% | 27 ? -4% | 22 ? 15% | 9 ? 65% |
| PWM Frequency (Hz) | 200 ? | 450 ? | ||||
| Screen | 6% | 2% | -2% | 1% | -8% | |
| Brightness middle (cd/m²) | 318 | 312 -2% | 362 14% | 301 -5% | 366 15% | 253 -20% |
| Brightness (cd/m²) | 295 | 304 3% | 342 16% | 270 -8% | 348 18% | 230 -22% |
| Brightness Distribution (%) | 79 | 85 8% | 87 10% | 79 0% | 90 14% | 86 9% |
| Black Level * (cd/m²) | 0.25 | 0.23 8% | 0.31 -24% | 0.38 -52% | 0.35 -40% | 0.24 4% |
| Contrast (:1) | 1272 | 1357 7% | 1168 -8% | 792 -38% | 1046 -18% | 1054 -17% |
| Colorchecker dE 2000 * | 4.7 | 4.19 11% | 4.5 4% | 3.49 26% | 4.4 6% | 5.01 -7% |
| Colorchecker dE 2000 max. * | 8.8 | 8.7 1% | 9.31 -6% | 7.49 15% | 9.7 -10% | 10.4 -18% |
| Greyscale dE 2000 * | 5 | 3.72 26% | 3.48 30% | 1.88 62% | 3 40% | 7.26 -45% |
| Gamma | 2.28 96% | 2.29 96% | 2.23 99% | 2.35 94% | 2.1 105% | 2.09 105% |
| CCT | 7374 88% | 7104 91% | 6144 106% | 6587 99% | 6362 102% | 6329 103% |
| Color Space (Percent of AdobeRGB 1998) (%) | 61 | 59 -3% | 55 -10% | 56 -8% | 56 -8% | 76 25% |
| Color Space (Percent of sRGB) (%) | 93 | 91 -2% | 84 -10% | 86 -8% | 86 -8% | 100 8% |
| Media total (Programa/Opciones) | -3% /
2% | 0% /
0% | -3% /
-3% | 6% /
2% | 21% /
5% |
* ... más pequeño es mejor
Tiempos de respuesta del display
| ↔ Tiempo de respuesta de Negro a Blanco | ||
|---|---|---|
| 26 ms ... subida ↗ y bajada ↘ combinada | ↗ 15.6 ms subida | 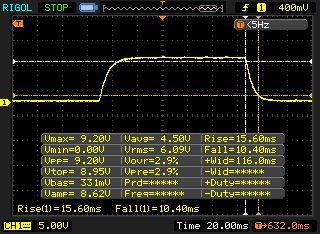 |
| ↘ 10.4 ms bajada | ||
| La pantalla mostró tiempos de respuesta relativamente lentos en nuestros tests pero podría ser demasiado lenta para los jugones. En comparación, todos los dispositivos de prueba van de ##min### (mínimo) a 240 (máximo) ms. » 63 % de todos los dispositivos son mejores. Eso quiere decir que el tiempo de respuesta es peor que la media (19.8 ms) de todos los dispositivos testados. | ||
| ↔ Tiempo de respuesta 50% Gris a 80% Gris | ||
| 38 ms ... subida ↗ y bajada ↘ combinada | ↗ 20 ms subida | 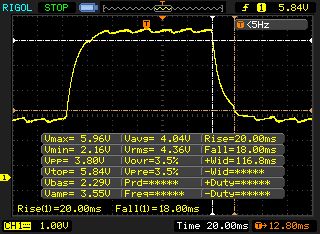 |
| ↘ 18 ms bajada | ||
| La pantalla mostró tiempos de respuesta lentos en nuestros tests y podría ser demasiado lenta para los jugones. En comparación, todos los dispositivos de prueba van de ##min### (mínimo) a 636 (máximo) ms. » 55 % de todos los dispositivos son mejores. Eso quiere decir que el tiempo de respuesta es peor que la media (31 ms) de todos los dispositivos testados. | ||
Parpadeo de Pantalla / PWM (Pulse-Width Modulation)
| Parpadeo de Pantalla / PWM detectado | 200 Hz | ≤ 95 % de brillo | 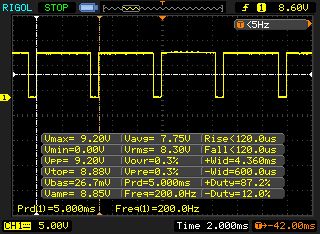 |
La retroiluminación del display parpadea a 200 Hz (seguramente usa PWM - Pulse-Width Modulation) a un brillo del 95 % e inferior. Sobre este nivel de brillo no debería darse parpadeo / PWM. La frecuencia de 200 Hz es relativamente baja, por lo que la gente sensible debería ver parpadeos y padecer fatiga visual por la pantalla (usado al brillo indicado a continuación). Comparación: 52 % de todos los dispositivos testados no usaron PWM para atenuar el display. Si se usó, medimos una media de 7751 (mínimo: 5 - máxmo: 343500) Hz. | |||
| Cinebench R11.5 | |
| CPU Single 64Bit | |
| Nexoc G739 | |
| HP Omen 17-w206ng | |
| HP Omen 17-w110ng | |
| MSI GE72 7RE-046 | |
| Asus GL753VE-DS74 | |
| CPU Multi 64Bit | |
| Nexoc G739 | |
| MSI GE72 7RE-046 | |
| HP Omen 17-w206ng | |
| Asus GL753VE-DS74 | |
| HP Omen 17-w110ng | |
| Cinebench R10 | |
| Rendering Single CPUs 64Bit | |
| HP Omen 17-w206ng | |
| HP Omen 17-w110ng | |
| Rendering Multiple CPUs 64Bit | |
| HP Omen 17-w206ng | |
| HP Omen 17-w110ng | |
| PCMark 8 - Home Score Accelerated v2 | |
| HP Omen 17-w110ng | |
| Nexoc G739 | |
| HP Omen 17-w206ng | |
| Acer Aspire Nitro BE VN7-793G-5811 | |
| Asus GL753VE-DS74 | |
| PCMark 8 Home Score Accelerated v2 | 4216 puntos | |
ayuda | ||
| HP Omen 17-w206ng Samsung PM961 MZVLW256HEHP | Nexoc G739 Samsung PM961 MZVLW256HEHP | HP Omen 17-w110ng Samsung PM951 NVMe MZVLV256 | MSI GE72 7RE-046 Toshiba HG6 THNSNJ256G8NY | Acer Aspire Nitro BE VN7-793G-5811 Seagate Mobile HDD 1TB ST1000LM035 | Asus GL753VE-DS74 Intel SSD 600p SSDPEKKW512G7 | |
|---|---|---|---|---|---|---|
| CrystalDiskMark 3.0 | 3% | -33% | -49% | -95% | -51% | |
| Read Seq (MB/s) | 1606 | 1666 4% | 1156 -28% | 540 -66% | 117.6 -93% | 1049 -35% |
| Write Seq (MB/s) | 1176 | 1192 1% | 294.9 -75% | 495.7 -58% | 109.1 -91% | 584 -50% |
| Read 512 (MB/s) | 846 | 857 1% | 616 -27% | 455.1 -46% | 39.93 -95% | 583 -31% |
| Write 512 (MB/s) | 805 | 827 3% | 294.7 -63% | 481.4 -40% | 98.6 -88% | 458 -43% |
| Read 4k (MB/s) | 59.9 | 60.7 1% | 42.7 -29% | 22.7 -62% | 0.435 -99% | 14.1 -76% |
| Write 4k (MB/s) | 155.6 | 154.5 -1% | 153.3 -1% | 112.9 -27% | 3.152 -98% | 108 -31% |
| Read 4k QD32 (MB/s) | 588 | 636 8% | 600 2% | 372.5 -37% | 1.008 -100% | 57.8 -90% |
| Write 4k QD32 (MB/s) | 505 | 544 8% | 295.3 -42% | 212.9 -58% | 4.705 -99% | 264 -48% |

| 3DMark 11 - 1280x720 Performance GPU | |
| HP Omen 17-w110ng | |
| Acer Aspire Nitro BE VN7-793G-5811 | |
| MSI GE72 7RE-046 | |
| Nexoc G739 | |
| HP Omen 17-w206ng | |
| 3DMark 11 Performance | 9245 puntos | |
ayuda | ||
| bajo | medio | alto | ultra | |
|---|---|---|---|---|
| The Witcher 3 (2015) | 141.3 | 86 | 47.96 | 26 |
Ruido
| Ocioso |
| 34 / 35 / 36 dB(A) |
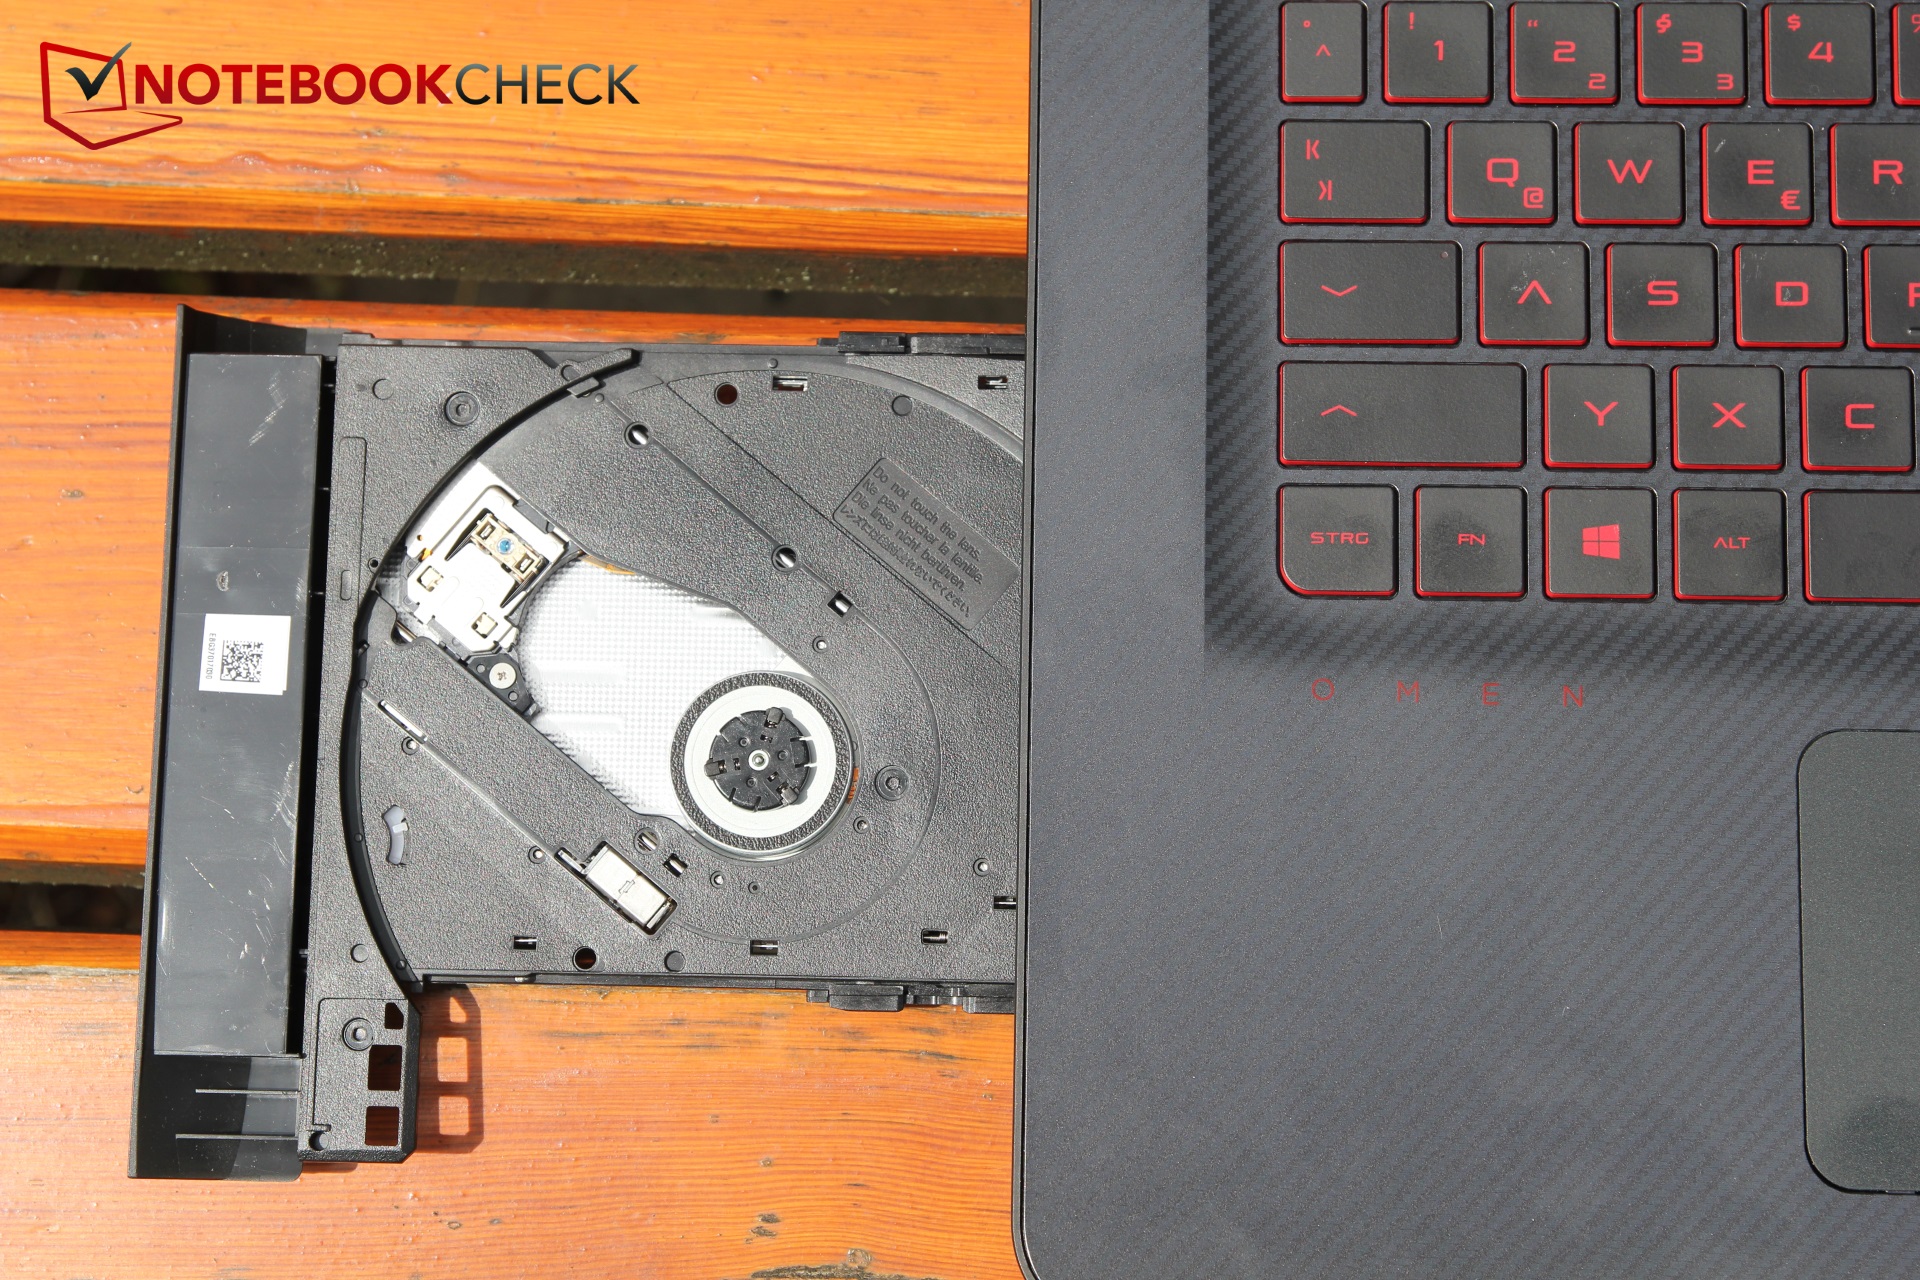
| DVD |
| 38 / dB(A) |
| Carga |
| 47 / 52 dB(A) |
 | ||
30 dB silencioso 40 dB(A) audible 50 dB(A) ruidosamente alto |
||
min: | ||
| HP Omen 17-w206ng GeForce GTX 1050 Ti Mobile, i7-7700HQ | HP Omen 17-w110ng GeForce GTX 1070 Mobile, 6700HQ | Asus GL753VE-DS74 GeForce GTX 1050 Ti Mobile, i7-7700HQ | MSI GE72 7RE-046 GeForce GTX 1050 Ti Mobile, i7-7700HQ | Nexoc G739 GeForce GTX 1050 Ti Mobile, i7-7700HQ | Acer Aspire Nitro BE VN7-793G-5811 GeForce GTX 1050 Ti Mobile, i5-7300HQ | |
|---|---|---|---|---|---|---|
| Noise | 2% | 5% | 3% | 4% | 15% | |
| apagado / medio ambiente * (dB) | 30 | 30 -0% | 29.1 3% | 30 -0% | 30 -0% | 29.7 1% |
| Idle Minimum * (dB) | 34 | 33 3% | 33.3 2% | 34 -0% | 31 9% | 30.2 11% |
| Idle Average * (dB) | 35 | 34 3% | 33.3 5% | 35 -0% | 32 9% | 30.2 14% |
| Idle Maximum * (dB) | 36 | 35 3% | 33.4 7% | 36 -0% | 38 -6% | 30.6 15% |
| Load Average * (dB) | 47 | 45 4% | 42.6 9% | 41 13% | 44 6% | 33.8 28% |
| Witcher 3 ultra * (dB) | 48 | 46.8 2% | 39.5 18% | |||
| Load Maximum * (dB) | 52 | 52 -0% | 46.8 10% | 49 6% | 50 4% | 42.6 18% |
* ... más pequeño es mejor
(-) La temperatura máxima en la parte superior es de 55.6 °C / 132 F, frente a la media de 36.8 °C / 98 F, que oscila entre 21 y 71 °C para la clase Multimedia.
(-) El fondo se calienta hasta un máximo de 57.7 °C / 136 F, frente a la media de 39.1 °C / 102 F
(+) En reposo, la temperatura media de la parte superior es de 29.2 °C / 85# F, frente a la media del dispositivo de 31.3 °C / 88 F.
(-) Jugando a The Witcher 3, la temperatura media de la parte superior es de 43.6 °C / 110 F, frente a la media del dispositivo de 31.3 °C / 88 F.
(-) El reposamanos y el touchpad pueden calentarse mucho al tacto con un máximo de 48.6 °C / 119.5 F.
(-) La temperatura media de la zona del reposamanos de dispositivos similares fue de 28.7 °C / 83.7 F (-19.9 °C / -35.8 F).
| HP Omen 17-w206ng GeForce GTX 1050 Ti Mobile, i7-7700HQ | Asus GL753VE-DS74 GeForce GTX 1050 Ti Mobile, i7-7700HQ | MSI GE72 7RE-046 GeForce GTX 1050 Ti Mobile, i7-7700HQ | Nexoc G739 GeForce GTX 1050 Ti Mobile, i7-7700HQ | Acer Aspire Nitro BE VN7-793G-5811 GeForce GTX 1050 Ti Mobile, i5-7300HQ | HP Omen 17-w110ng GeForce GTX 1070 Mobile, 6700HQ | |
|---|---|---|---|---|---|---|
| Heat | 31% | 8% | 8% | 10% | 7% | |
| Maximum Upper Side * (°C) | 55.6 | 35.8 36% | 45.8 18% | 50.6 9% | 48 14% | 45 19% |
| Maximum Bottom * (°C) | 57.7 | 36.4 37% | 45.2 22% | 50.8 12% | 40.8 29% | 54.3 6% |
| Idle Upper Side * (°C) | 32.2 | 22.2 31% | 31.7 2% | 28.7 11% | 29.9 7% | 29.6 8% |
| Idle Bottom * (°C) | 27.2 | 22.2 18% | 29.9 -10% | 27.1 -0% | 29.8 -10% | 28.6 -5% |
* ... más pequeño es mejor
HP Omen 17-w206ng análisis de audio
(±) | la sonoridad del altavoz es media pero buena (80 dB)
Graves 100 - 315 Hz
(±) | lubina reducida - en promedio 14.6% inferior a la mediana
(±) | la linealidad de los graves es media (10.4% delta a frecuencia anterior)
Medios 400 - 2000 Hz
(+) | medios equilibrados - a sólo 4.4% de la mediana
(+) | los medios son lineales (4.3% delta a la frecuencia anterior)
Altos 2 - 16 kHz
(+) | máximos equilibrados - a sólo 4.7% de la mediana
(+) | los máximos son lineales (5.1% delta a la frecuencia anterior)
Total 100 - 16.000 Hz
(±) | la linealidad del sonido global es media (19.1% de diferencia con la mediana)
En comparación con la misma clase
» 61% de todos los dispositivos probados de esta clase eran mejores, 7% similares, 32% peores
» El mejor tuvo un delta de 5%, la media fue 17%, el peor fue ###max##%
En comparación con todos los dispositivos probados
» 46% de todos los dispositivos probados eran mejores, 7% similares, 47% peores
» El mejor tuvo un delta de 4%, la media fue 23%, el peor fue ###max##%
Acer Aspire V17 Nitro BE VN7-793G-52XN análisis de audio
(±) | la sonoridad del altavoz es media pero buena (72 dB)
Graves 100 - 315 Hz
(±) | lubina reducida - en promedio 5.7% inferior a la mediana
(+) | el bajo es lineal (5% delta a la frecuencia anterior)
Medios 400 - 2000 Hz
(+) | medios equilibrados - a sólo 4.4% de la mediana
(+) | los medios son lineales (6% delta a la frecuencia anterior)
Altos 2 - 16 kHz
(+) | máximos equilibrados - a sólo 3% de la mediana
(±) | la linealidad de los máximos es media (7.2% delta a frecuencia anterior)
Total 100 - 16.000 Hz
(+) | el sonido global es lineal (12.5% de diferencia con la mediana)
En comparación con la misma clase
» 24% de todos los dispositivos probados de esta clase eran mejores, 3% similares, 73% peores
» El mejor tuvo un delta de 5%, la media fue 17%, el peor fue ###max##%
En comparación con todos los dispositivos probados
» 11% de todos los dispositivos probados eran mejores, 2% similares, 86% peores
» El mejor tuvo un delta de 4%, la media fue 23%, el peor fue ###max##%
| Off / Standby | |
| Ocioso | |
| Carga |
|
Clave:
min: | |
| HP Omen 17-w206ng GeForce GTX 1050 Ti Mobile, i7-7700HQ | Nexoc G739 GeForce GTX 1050 Ti Mobile, i7-7700HQ | HP Omen 17-w110ng GeForce GTX 1070 Mobile, 6700HQ | Acer Aspire Nitro BE VN7-793G-5811 GeForce GTX 1050 Ti Mobile, i5-7300HQ | Asus GL753VE-DS74 GeForce GTX 1050 Ti Mobile, i7-7700HQ | MSI GE72 7RE-046 GeForce GTX 1050 Ti Mobile, i7-7700HQ | |
|---|---|---|---|---|---|---|
| Power Consumption | 10% | -36% | 19% | 25% | -6% | |
| Idle Minimum * (Watt) | 11 | 7 36% | 19 -73% | 8.7 21% | 7.5 32% | 14 -27% |
| Idle Average * (Watt) | 18 | 14 22% | 25 -39% | 12.4 31% | 11.3 37% | 20 -11% |
| Idle Maximum * (Watt) | 24 | 23 4% | 31 -29% | 15.4 36% | 11.8 51% | 25 -4% |
| Load Average * (Watt) | 84 | 82 2% | 90 -7% | 73 13% | 82.1 2% | 82 2% |
| Witcher 3 ultra * (Watt) | 101 | 98 3% | 96.3 5% | |||
| Load Maximum * (Watt) | 146 | 163 -12% | 193 -32% | 130 11% | 116.6 20% | 135 8% |
* ... más pequeño es mejor
| HP Omen 17-w206ng GeForce GTX 1050 Ti Mobile, i7-7700HQ, 62 Wh | Nexoc G739 GeForce GTX 1050 Ti Mobile, i7-7700HQ, 62 Wh | HP Omen 17-w110ng GeForce GTX 1070 Mobile, 6700HQ, 95 Wh | Acer Aspire Nitro BE VN7-793G-5811 GeForce GTX 1050 Ti Mobile, i5-7300HQ, 52.5 Wh | Asus GL753VE-DS74 GeForce GTX 1050 Ti Mobile, i7-7700HQ, 48 Wh | MSI GE72 7RE-046 GeForce GTX 1050 Ti Mobile, i7-7700HQ, 51.4 Wh | |
|---|---|---|---|---|---|---|
| Duración de Batería | -5% | -21% | -27% | -41% | -51% | |
| Reader / Idle (h) | 13.3 | 10.2 -23% | 7.2 -46% | 8.7 -35% | ||
| WiFi v1.3 (h) | 6.3 | 4.8 -24% | 4.1 -35% | 4.6 -27% | 3.9 -38% | 3.1 -51% |
| Load (h) | 1.6 | 2.1 31% | 1.9 19% | 0.8 -50% | ||
| H.264 (h) | 5.4 | 3.9 | 3.3 |
Pro
Contra
El Omen 17-w206ng nos dejó ligeramente atónitos y decepcionados. Nuestro instinto nos dice que éste podría haber sido un portátil muy potente si HP no la hubiera fastidiado.
Su diseño es agradable en general, y sus componentes son potentes y están bien equilibrados. Sobre el papel, nos maravillan una CPU rapidísima, 16 GB de RAM, una GPU Pascal, un veloz SSD y un HDD de 1 TB para almacenamiento. Sobre el papel, esto es, ya que en la realidad el Omen no muestra de lo que es capaz.
Un enorme sangrado de pantalla y parpadeo PWM; latencias dpc; y por último pero no menos importante, sus elevadas emisiones de calor y ruido.
Estos severos defectos descalifican prácticamente al Omen 17, y por ello no podemos recomendar el dispositivo a nadie. Las pifias podrían haberse evitado, y el control de calidad de HP ha fallado miserablemente.
Lo que queda es un portátil que, al menos sobre el papel, está equipado adecuadamente y podría haber sido un dispositivo multimedia todoterreno buenísimo. Sin embargo, es incapaz de crear inercia alguna ni de usar todo su potencial.
Por ello, no podemos recomendarle el portátil a nadie.
Ésta es una versión acortada del análisis original. Puedes leer el análisis completo en inglés aquí.
HP Omen 17-w206ng
- 07/02/2017 v6 (old)
Christian Hintze
Price comparison
