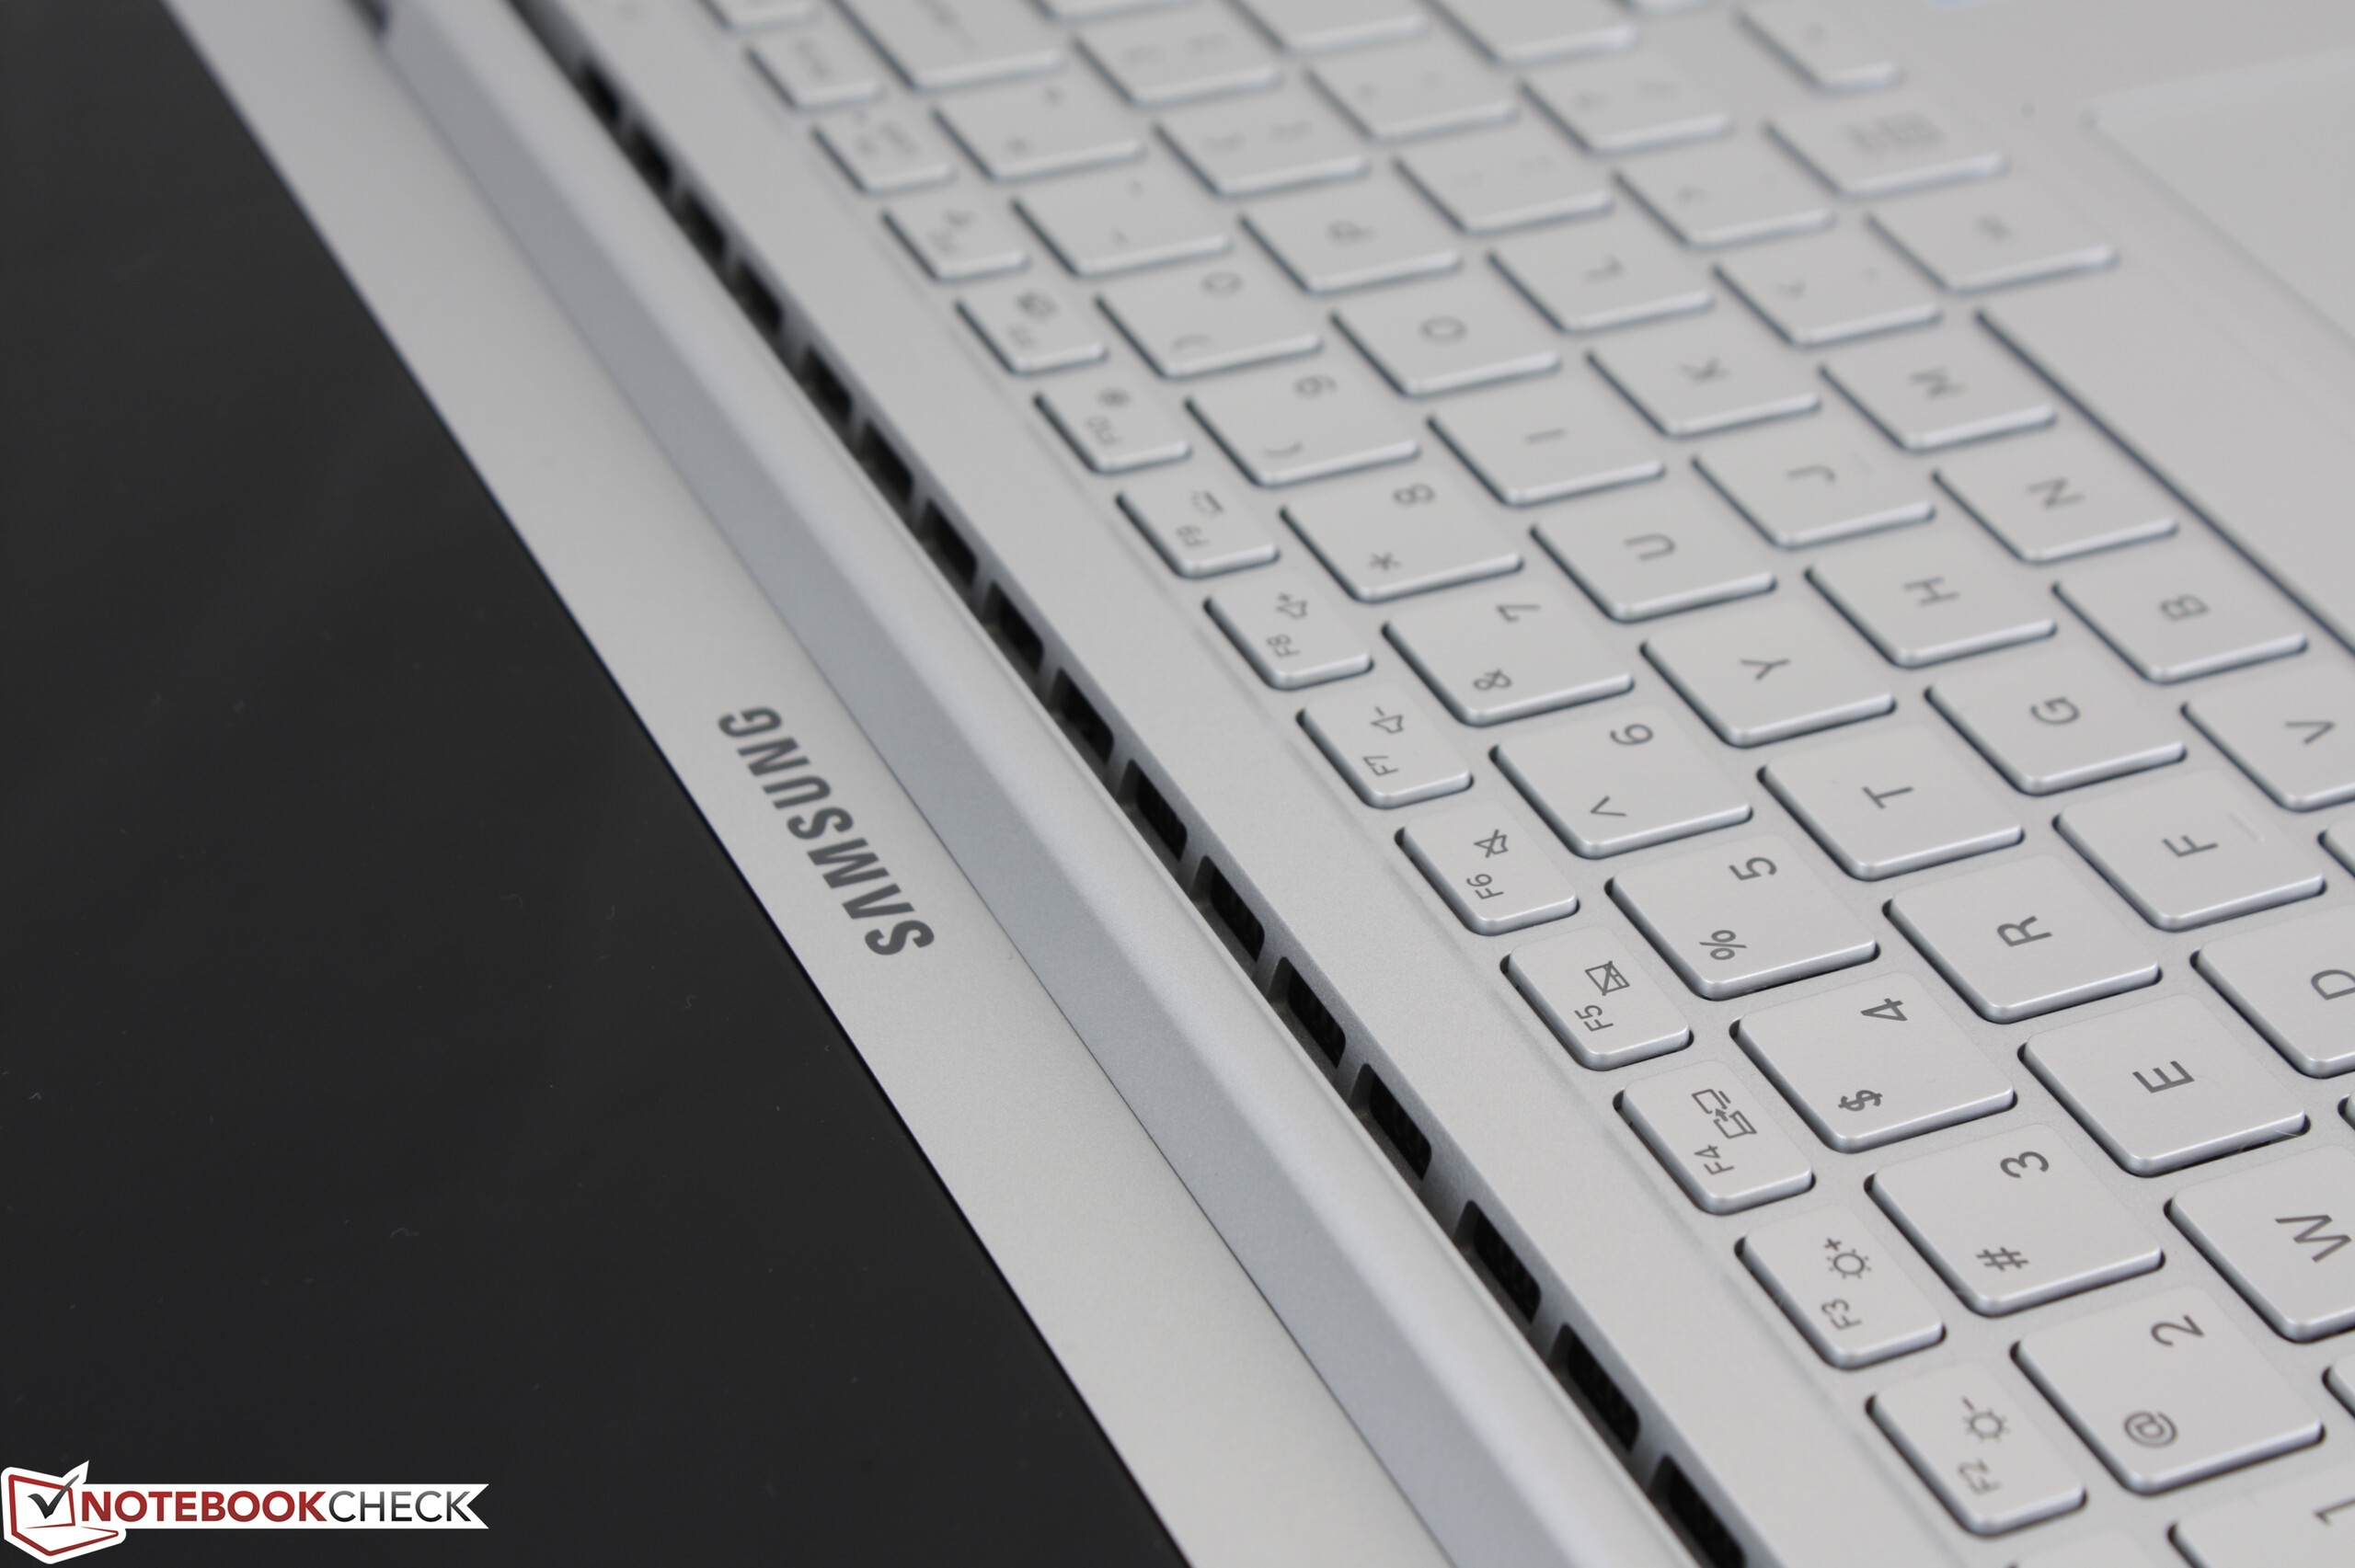
Breve análisis del Samsung Notebook 9 NP900X5N (7500U, FHD, GeForce 940MX)
| SD Card Reader | |
| average JPG Copy Test (av. of 3 runs) | |
| Dell XPS 15 9560 (i7-7700HQ, UHD) | |
| Samsung Notebook 9 NP900X5N-X01US | |
| Dell Latitude 12 5285 2-in-1 | |
| maximum AS SSD Seq Read Test (1GB) | |
| Dell XPS 15 9560 (i7-7700HQ, UHD) | |
| Dell Latitude 12 5285 2-in-1 | |
| Samsung Notebook 9 NP900X5N-X01US | |
| Networking | |
| iperf3 transmit AX12 | |
| Dell XPS 15 9560 (i7-7700HQ, UHD) | |
| Samsung Notebook 9 NP900X5N-X01US | |
| Dell XPS 13 9365-4537 2-in-1 | |
| iperf3 receive AX12 | |
| Samsung Notebook 9 NP900X5N-X01US | |
| Dell XPS 15 9560 (i7-7700HQ, UHD) | |
| Dell XPS 13 9365-4537 2-in-1 | |
| |||||||||||||||||||||||||
iluminación: 88 %
Brillo con batería: 565.6 cd/m²
Contraste: 1154:1 (Negro: 0.49 cd/m²)
ΔE ColorChecker Calman: 2 | ∀{0.5-29.43 Ø4.73}
ΔE Greyscale Calman: 2.5 | ∀{0.09-98 Ø4.97}
97.5% sRGB (Argyll 1.6.3 3D)
61.2% AdobeRGB 1998 (Argyll 1.6.3 3D)
67.2% AdobeRGB 1998 (Argyll 3D)
97.7% sRGB (Argyll 3D)
65.2% Display P3 (Argyll 3D)
Gamma: 2.21
CCT: 6896 K
| Samsung Notebook 9 NP900X5N-X01US ID: BOE06E8, Name: BOE HF NV150FHB-N31, IPS, 15", 1920x1080 | Dell XPS 15 2017 9560 (7300HQ, Full-HD) Sharp SHP1453 LQ156M1, LED IGZO IPS InfinityEdge, 15.6", 1920x1080 | Apple MacBook Pro 15 2016 (2.9 GHz, 460) Apple APPA030, IPS, 15.4", 2880x1800 | HP Spectre x360 15-bl002xx UHD UWVA eDP BrightView WLED-backlit , IPS, 15.6", 3840x2160 | Lenovo ThinkPad T570-20HAS01E00 BOE NV156QUM-N44, IPS, 15.6", 3840x2160 | |
|---|---|---|---|---|---|
| Display | 4% | 28% | -3% | -0% | |
| Display P3 Coverage (%) | 65.2 | 68.9 6% | 99 52% | 67.9 4% | 70 7% |
| sRGB Coverage (%) | 97.7 | 98.9 1% | 100 2% | 88.2 -10% | 91.1 -7% |
| AdobeRGB 1998 Coverage (%) | 67.2 | 70.9 6% | 87.3 30% | 64.4 -4% | 66.7 -1% |
| Response Times | -47% | -43% | -14% | 26% | |
| Response Time Grey 50% / Grey 80% * (ms) | 40.8 ? | 54 ? -32% | 46 ? -13% | 44 ? -8% | 41.6 ? -2% |
| Response Time Black / White * (ms) | 32.4 ? | 52.4 ? -62% | 56 ? -73% | 38.8 ? -20% | 15.2 ? 53% |
| PWM Frequency (Hz) | 208.3 ? | 119000 ? | 1000 ? | 926 ? | |
| Screen | -42% | -3% | -9% | -35% | |
| Brightness middle (cd/m²) | 565.6 | 400 -29% | 420 -26% | 351.5 -38% | 339 -40% |
| Brightness (cd/m²) | 524 | 392 -25% | 401 -23% | 336 -36% | 314 -40% |
| Brightness Distribution (%) | 88 | 89 1% | 90 2% | 83 -6% | 89 1% |
| Black Level * (cd/m²) | 0.49 | 0.26 47% | 0.3 39% | 0.24 51% | 0.36 27% |
| Contrast (:1) | 1154 | 1538 33% | 1400 21% | 1465 27% | 942 -18% |
| Colorchecker dE 2000 * | 2 | 4.9 -145% | 3.33 -67% | 3.3 -65% | 4.2 -110% |
| Colorchecker dE 2000 max. * | 5 | 11 -120% | 5.11 -2% | 7.3 -46% | 7.8 -56% |
| Greyscale dE 2000 * | 2.5 | 7.2 -188% | 2.73 -9% | 1.9 24% | 5.1 -104% |
| Gamma | 2.21 100% | 2.11 104% | 2.48 89% | 2.09 105% | 2.16 102% |
| CCT | 6896 94% | 6911 94% | 6457 101% | 6784 96% | 6569 99% |
| Color Space (Percent of AdobeRGB 1998) (%) | 61.2 | 64.2 5% | 78.09 28% | 64.4 5% | 59.4 -3% |
| Color Space (Percent of sRGB) (%) | 97.5 | 98.9 1% | 99.97 3% | 88.2 -10% | 91 -7% |
| Media total (Programa/Opciones) | -28% /
-33% | -6% /
-2% | -9% /
-9% | -3% /
-20% |
* ... más pequeño es mejor
Tiempos de respuesta del display
| ↔ Tiempo de respuesta de Negro a Blanco | ||
|---|---|---|
| 32.4 ms ... subida ↗ y bajada ↘ combinada | ↗ 17.6 ms subida | 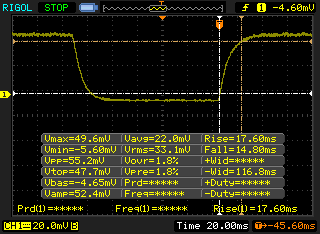 |
| ↘ 14.8 ms bajada | ||
| La pantalla mostró tiempos de respuesta lentos en nuestros tests y podría ser demasiado lenta para los jugones. En comparación, todos los dispositivos de prueba van de ##min### (mínimo) a 240 (máximo) ms. » 88 % de todos los dispositivos son mejores. Eso quiere decir que el tiempo de respuesta es peor que la media (19.9 ms) de todos los dispositivos testados. | ||
| ↔ Tiempo de respuesta 50% Gris a 80% Gris | ||
| 40.8 ms ... subida ↗ y bajada ↘ combinada | ↗ 20.4 ms subida | 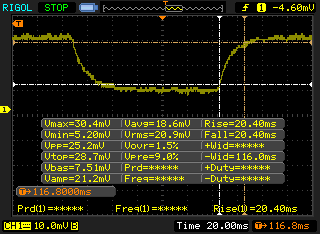 |
| ↘ 20.4 ms bajada | ||
| La pantalla mostró tiempos de respuesta lentos en nuestros tests y podría ser demasiado lenta para los jugones. En comparación, todos los dispositivos de prueba van de ##min### (mínimo) a 636 (máximo) ms. » 64 % de todos los dispositivos son mejores. Eso quiere decir que el tiempo de respuesta es peor que la media (31.1 ms) de todos los dispositivos testados. | ||
Parpadeo de Pantalla / PWM (Pulse-Width Modulation)
| Parpadeo de Pantalla / PWM detectado | 208.3 Hz | ≤ 99 % de brillo | 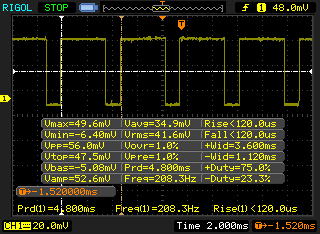 |
La retroiluminación del display parpadea a 208.3 Hz (seguramente usa PWM - Pulse-Width Modulation) a un brillo del 99 % e inferior. Sobre este nivel de brillo no debería darse parpadeo / PWM. La frecuencia de 208.3 Hz es relativamente baja, por lo que la gente sensible debería ver parpadeos y padecer fatiga visual por la pantalla (usado al brillo indicado a continuación). Comparación: 52 % de todos los dispositivos testados no usaron PWM para atenuar el display. Si se usó, medimos una media de 7798 (mínimo: 5 - máxmo: 343500) Hz. | |||
| Cinebench R11.5 | |
| CPU Single 64Bit | |
| Lenovo ThinkPad 13-20J2S00G00 | |
| Samsung Notebook 9 NP900X5N-X01US | |
| Dell Latitude 5280 | |
| Lenovo U31-70 80M5003EGE | |
| Toshiba Portege Z30t-A-10X | |
| Acer TravelMate P449-M-7407 | |
| Lenovo Thinkpad 13-20J1001BUS | |
| CPU Multi 64Bit | |
| Lenovo ThinkPad 13-20J2S00G00 | |
| Samsung Notebook 9 NP900X5N-X01US | |
| Dell Latitude 5280 | |
| Acer TravelMate P449-M-7407 | |
| Lenovo U31-70 80M5003EGE | |
| Lenovo Thinkpad 13-20J1001BUS | |
| Toshiba Portege Z30t-A-10X | |
| Cinebench R10 | |
| Rendering Multiple CPUs 32Bit | |
| Apple MacBook Pro 15 2016 (2.7 GHz, 455) | |
| Samsung Notebook 9 NP900X5N-X01US | |
| Dell Latitude 5280 | |
| Lenovo ThinkPad 13-20J2S00G00 | |
| Lenovo U31-70 80M5003EGE | |
| Acer TravelMate P449-M-7407 | |
| Lenovo Thinkpad 13-20J1001BUS | |
| Toshiba Portege Z30t-A-10X | |
| Rendering Single 32Bit | |
| Samsung Notebook 9 NP900X5N-X01US | |
| Apple MacBook Pro 15 2016 (2.7 GHz, 455) | |
| Dell Latitude 5280 | |
| Lenovo ThinkPad 13-20J2S00G00 | |
| Acer TravelMate P449-M-7407 | |
| Lenovo U31-70 80M5003EGE | |
| Toshiba Portege Z30t-A-10X | |
| Lenovo Thinkpad 13-20J1001BUS | |
| wPrime 2.10 - 1024m | |
| Lenovo Thinkpad 13-20J1001BUS | |
| Acer TravelMate P449-M-7407 | |
| Dell Latitude 5280 | |
| Samsung Notebook 9 NP900X5N-X01US | |
| Apple MacBook Pro 15 2016 (2.7 GHz, 455) | |
* ... más pequeño es mejor
| PCMark 8 | |
| Home Score Accelerated v2 | |
| Apple MacBook Pro 15 2016 (2.9 GHz, 460) | |
| Samsung Notebook 9 NP900X5N-X01US | |
| Dell XPS 15 9560 (i7-7700HQ, UHD) | |
| Work Score Accelerated v2 | |
| Samsung Notebook 9 NP900X5N-X01US | |
| Apple MacBook Pro 15 2016 (2.9 GHz, 460) | |
| Dell XPS 15 9560 (i7-7700HQ, UHD) | |
| Creative Score Accelerated v2 | |
| Dell XPS 15 9560 (i7-7700HQ, UHD) | |
| Apple MacBook Pro 15 2016 (2.9 GHz, 460) | |
| Samsung Notebook 9 NP900X5N-X01US | |
| PCMark 8 Home Score Accelerated v2 | 3852 puntos | |
| PCMark 8 Creative Score Accelerated v2 | 4769 puntos | |
| PCMark 8 Work Score Accelerated v2 | 4928 puntos | |
ayuda | ||
| Samsung Notebook 9 NP900X5N-X01US Samsung PM961 MZVLW256HEHP | Dell XPS 15 9560 (i7-7700HQ, UHD) Lite-On CX2-8B512-Q11 | Apple MacBook Pro 15 2016 (2.9 GHz, 460) Apple SSD SM1024L | HP Spectre x360 15-bl002xx Toshiba XG4 NVMe (THNSN5512GPUK) | Lenovo ThinkPad T570-20HAS01E00 Samsung PM961 NVMe MZVLW512HMJP | |
|---|---|---|---|---|---|
| CrystalDiskMark 3.0 | 8% | -3% | -6% | 5% | |
| Read Seq (MB/s) | 1447 | 1684 16% | 1458 1% | 1266 -13% | 1210 -16% |
| Write Seq (MB/s) | 1281 | 1106 -14% | 1440 12% | 982 -23% | 1134 -11% |
| Read 512 (MB/s) | 651 | 977 50% | 914 40% | 834 28% | 789 21% |
| Write 512 (MB/s) | 765 | 1119 46% | 1058 38% | 714 -7% | 903 18% |
| Read 4k (MB/s) | 58.3 | 45.14 -23% | 9.786 -83% | 40.72 -30% | 58.4 0% |
| Write 4k (MB/s) | 131.9 | 134.1 2% | 10.9 -92% | 139.4 6% | 144.1 9% |
| Read 4k QD32 (MB/s) | 545 | 509 -7% | 679 25% | 527 -3% | 559 3% |
| Write 4k QD32 (MB/s) | 419.3 | 398.1 -5% | 562 34% | 395.2 -6% | 474.4 13% |

| 3DMark 11 | |
| 1280x720 Performance GPU | |
| Intel Skull Canyon NUC6i7KYK | |
| Apple MacBook Pro 13 2016 (2.9 GHz) | |
| Asus AsusPro P4540UQ-FY0056R | |
| HP Spectre x360 15-bl002xx | |
| Samsung Notebook 9 NP900X5N-X01US | |
| HP 15-ba077ng | |
| Dell Latitude 5280 | |
| Apple MacBook 12 (Early 2016) 1.2 GHz | |
| Toshiba Satellite Pro R50-C-16V | |
| 1280x720 Performance Combined | |
| Intel Skull Canyon NUC6i7KYK | |
| HP Spectre x360 15-bl002xx | |
| Apple MacBook Pro 13 2016 (2.9 GHz) | |
| Asus AsusPro P4540UQ-FY0056R | |
| Samsung Notebook 9 NP900X5N-X01US | |
| HP 15-ba077ng | |
| Apple MacBook 12 (Early 2016) 1.2 GHz | |
| Dell Latitude 5280 | |
| Toshiba Satellite Pro R50-C-16V | |
| 3DMark | |
| 1280x720 Cloud Gate Standard Graphics | |
| Intel Skull Canyon NUC6i7KYK | |
| Apple MacBook Pro 13 2016 (2.9 GHz) | |
| HP Spectre x360 15-bl002xx | |
| Asus AsusPro P4540UQ-FY0056R | |
| Samsung Notebook 9 NP900X5N-X01US | |
| HP 15-ba077ng | |
| Apple MacBook 12 (Early 2016) 1.2 GHz | |
| Dell Latitude 5280 | |
| 1920x1080 Fire Strike Graphics | |
| HP Spectre x360 15-bl002xx | |
| Asus AsusPro P4540UQ-FY0056R | |
| Intel Skull Canyon NUC6i7KYK | |
| Apple MacBook Pro 13 2016 (2.9 GHz) | |
| Samsung Notebook 9 NP900X5N-X01US | |
| HP 15-ba077ng | |
| Apple MacBook 12 (Early 2016) 1.2 GHz | |
| Dell Latitude 5280 | |
| 1920x1080 Ice Storm Extreme Graphics | |
| Intel Skull Canyon NUC6i7KYK | |
| Samsung Notebook 9 NP900X5N-X01US | |
| HP 15-ba077ng | |
| Dell Latitude 5280 | |
| HP Spectre x360 15-bl002xx | |
| 3DMark 11 Performance | 2372 puntos | |
| 3DMark Ice Storm Standard Score | 49982 puntos | |
| 3DMark Cloud Gate Standard Score | 6800 puntos | |
| 3DMark Fire Strike Score | 1408 puntos | |
| 3DMark Fire Strike Extreme Score | 722 puntos | |
ayuda | ||
| BioShock Infinite - 1366x768 High Preset | |
| Lenovo ThinkPad T570-20HAS01E00 | |
| Intel Skull Canyon NUC6i7KYK | |
| Apple MacBook Pro 13 2016 (2.9 GHz) | |
| Samsung Notebook 9 NP900X5N-X01US | |
| Dell Latitude 5280 | |
| Toshiba Satellite Pro R50-C-16V | |
| bajo | medio | alto | ultra | |
|---|---|---|---|---|
| BioShock Infinite (2013) | 89.8 | 48.7 | 39.3 | 13.5 |
| The Witcher 3 (2015) | 31 | |||
| Dota 2 Reborn (2015) | 95 | 64 | 24 | |
| Rise of the Tomb Raider (2016) | 37.4 | 20.5 | 10.9 | |
| Overwatch (2016) | 65.2 | 44.8 |
Ruido
| Ocioso |
| 28.3 / 28.3 / 28.3 dB(A) |
| Carga |
| 38.3 / 38.3 dB(A) |
 | ||
30 dB silencioso 40 dB(A) audible 50 dB(A) ruidosamente alto |
||
min: | ||
| Samsung Notebook 9 NP900X5N-X01US GeForce 940MX, i7-7500U, Samsung PM961 MZVLW256HEHP | Dell XPS 15 9560 (i7-7700HQ, UHD) GeForce GTX 1050 Mobile, i7-7700HQ, Lite-On CX2-8B512-Q11 | Apple MacBook Pro 15 2016 (2.9 GHz, 460) Radeon Pro 460, 6920HQ, Apple SSD SM1024L | HP Spectre x360 15-bl002xx GeForce 940MX, i7-7500U, Toshiba XG4 NVMe (THNSN5512GPUK) | Lenovo ThinkPad T570-20HAS01E00 GeForce 940MX, i7-7500U, Samsung PM961 NVMe MZVLW512HMJP | |
|---|---|---|---|---|---|
| Noise | -11% | -6% | -9% | -4% | |
| apagado / medio ambiente * (dB) | 28.3 | 28.4 -0% | 29 -2% | 28.5 -1% | 29.3 -4% |
| Idle Minimum * (dB) | 28.3 | 29 -2% | 30.3 -7% | 28.5 -1% | 29.3 -4% |
| Idle Average * (dB) | 28.3 | 29 -2% | 30.3 -7% | 28.5 -1% | 29.3 -4% |
| Idle Maximum * (dB) | 28.3 | 32.2 -14% | 30.3 -7% | 36.3 -28% | 31.1 -10% |
| Load Average * (dB) | 38.3 | 47.1 -23% | 35.1 8% | 42.7 -11% | 35.2 8% |
| Load Maximum * (dB) | 38.3 | 47.1 -23% | 46 -20% | 42.7 -11% | 41.3 -8% |
| Witcher 3 ultra * (dB) | 52 |
* ... más pequeño es mejor
(±) La temperatura máxima en la parte superior es de 40.4 °C / 105 F, frente a la media de 36.8 °C / 98 F, que oscila entre 21 y 71 °C para la clase Multimedia.
(±) El fondo se calienta hasta un máximo de 42.4 °C / 108 F, frente a la media de 39.1 °C / 102 F
(+) En reposo, la temperatura media de la parte superior es de 22 °C / 72# F, frente a la media del dispositivo de 31.3 °C / 88 F.
(+) El reposamanos y el panel táctil están a una temperatura inferior a la de la piel, con un máximo de 31.6 °C / 88.9 F y, por tanto, son fríos al tacto.
(-) La temperatura media de la zona del reposamanos de dispositivos similares fue de 28.7 °C / 83.7 F (-2.9 °C / -5.2 F).
Samsung Notebook 9 NP900X5N-X01US análisis de audio
(-) | altavoces no muy altos (#58.2 dB)
Graves 100 - 315 Hz
(-) | casi sin bajos - de media 16% inferior a la mediana
(±) | la linealidad de los graves es media (13.2% delta a frecuencia anterior)
Medios 400 - 2000 Hz
(+) | medios equilibrados - a sólo 3.8% de la mediana
(+) | los medios son lineales (6.8% delta a la frecuencia anterior)
Altos 2 - 16 kHz
(+) | máximos equilibrados - a sólo 4.4% de la mediana
(±) | la linealidad de los máximos es media (13.7% delta a frecuencia anterior)
Total 100 - 16.000 Hz
(±) | la linealidad del sonido global es media (29.8% de diferencia con la mediana)
En comparación con la misma clase
» 95% de todos los dispositivos probados de esta clase eran mejores, 2% similares, 3% peores
» El mejor tuvo un delta de 5%, la media fue 17%, el peor fue ###max##%
En comparación con todos los dispositivos probados
» 88% de todos los dispositivos probados eran mejores, 3% similares, 10% peores
» El mejor tuvo un delta de 4%, la media fue 24%, el peor fue ###max##%
Apple MacBook 12 (Early 2016) 1.1 GHz análisis de audio
(+) | los altavoces pueden reproducir a un volumen relativamente alto (#83.6 dB)
Graves 100 - 315 Hz
(±) | lubina reducida - en promedio 11.3% inferior a la mediana
(±) | la linealidad de los graves es media (14.2% delta a frecuencia anterior)
Medios 400 - 2000 Hz
(+) | medios equilibrados - a sólo 2.4% de la mediana
(+) | los medios son lineales (5.5% delta a la frecuencia anterior)
Altos 2 - 16 kHz
(+) | máximos equilibrados - a sólo 2% de la mediana
(+) | los máximos son lineales (4.5% delta a la frecuencia anterior)
Total 100 - 16.000 Hz
(+) | el sonido global es lineal (10.2% de diferencia con la mediana)
En comparación con la misma clase
» 7% de todos los dispositivos probados de esta clase eran mejores, 2% similares, 91% peores
» El mejor tuvo un delta de 5%, la media fue 18%, el peor fue ###max##%
En comparación con todos los dispositivos probados
» 5% de todos los dispositivos probados eran mejores, 1% similares, 94% peores
» El mejor tuvo un delta de 4%, la media fue 24%, el peor fue ###max##%
| Off / Standby | |
| Ocioso | |
| Carga |
|
Clave:
min: | |
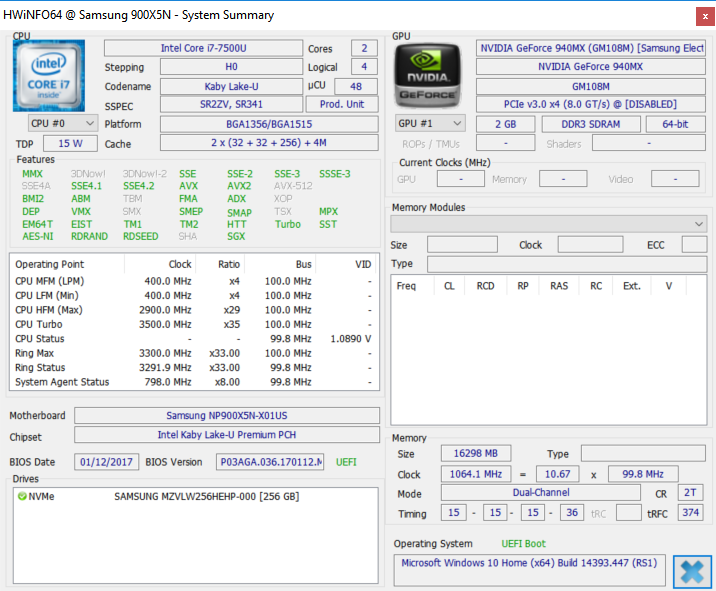
| Samsung Notebook 9 NP900X5N-X01US i7-7500U, GeForce 940MX, Samsung PM961 MZVLW256HEHP, IPS, 1920x1080, 15" | Dell XPS 15 9560 (i7-7700HQ, UHD) i7-7700HQ, GeForce GTX 1050 Mobile, Lite-On CX2-8B512-Q11, IGZO IPS, 3840x2160, 15.6" | Apple MacBook Pro 15 2016 (2.9 GHz, 460) 6920HQ, Radeon Pro 460, Apple SSD SM1024L, IPS, 2880x1800, 15.4" | HP Spectre x360 15-bl002xx i7-7500U, GeForce 940MX, Toshiba XG4 NVMe (THNSN5512GPUK), IPS, 3840x2160, 15.6" | Asus VivoBook S15 S510UA i5-7200U, HD Graphics 620, Toshiba HG6 THNSNJ128G8NY, IPS, 1920x1080, 15.6" | |
|---|---|---|---|---|---|
| Power Consumption | -91% | -12% | -18% | 28% | |
| Idle Minimum * (Watt) | 5 | 11.9 -138% | 3 40% | 8.14 -63% | 4.6 8% |
| Idle Average * (Watt) | 11.6 | 17.1 -47% | 9.9 15% | 10.91 6% | 7.6 34% |
| Idle Maximum * (Watt) | 12.2 | 17.3 -42% | 12.5 -2% | 12.26 -0% | 7.7 37% |
| Load Average * (Watt) | 47.8 | 94.7 -98% | 70.6 -48% | 45.67 4% | 35.1 27% |
| Witcher 3 ultra * (Watt) | 51.9 | 104.8 -102% | |||
| Load Maximum * (Watt) | 55.7 | 122 -119% | 90.8 -63% | 74.94 -35% | 36.2 35% |
* ... más pequeño es mejor
| Samsung Notebook 9 NP900X5N-X01US i7-7500U, GeForce 940MX, 66 Wh | Dell XPS 15 9560 (i7-7700HQ, UHD) i7-7700HQ, GeForce GTX 1050 Mobile, 97 Wh | Apple MacBook Pro 15 2016 (2.9 GHz, 460) 6920HQ, Radeon Pro 460, 76 Wh | HP Spectre x360 15-bl002xx i7-7500U, GeForce 940MX, 79.2 Wh | Asus VivoBook S15 S510UA i5-7200U, HD Graphics 620, 42 Wh | Apple MacBook 13" T7200, Graphics Media Accelerator (GMA) 950, Wh | |
|---|---|---|---|---|---|---|
| Duración de Batería | -30% | -26% | -9% | -52% | -36% | |
| Reader / Idle (h) | 27.4 | 13.9 -49% | 14.4 -47% | 10.2 -63% | 6.5 -76% | |
| WiFi v1.3 (h) | 10.1 | 7.2 -29% | 10.3 2% | 8.9 -12% | 4.3 -57% | |
| Load (h) | 1.9 | 1.7 -11% | 0.9 -53% | 2.5 32% | 1.2 -37% | 2 5% |
Pro
Contra
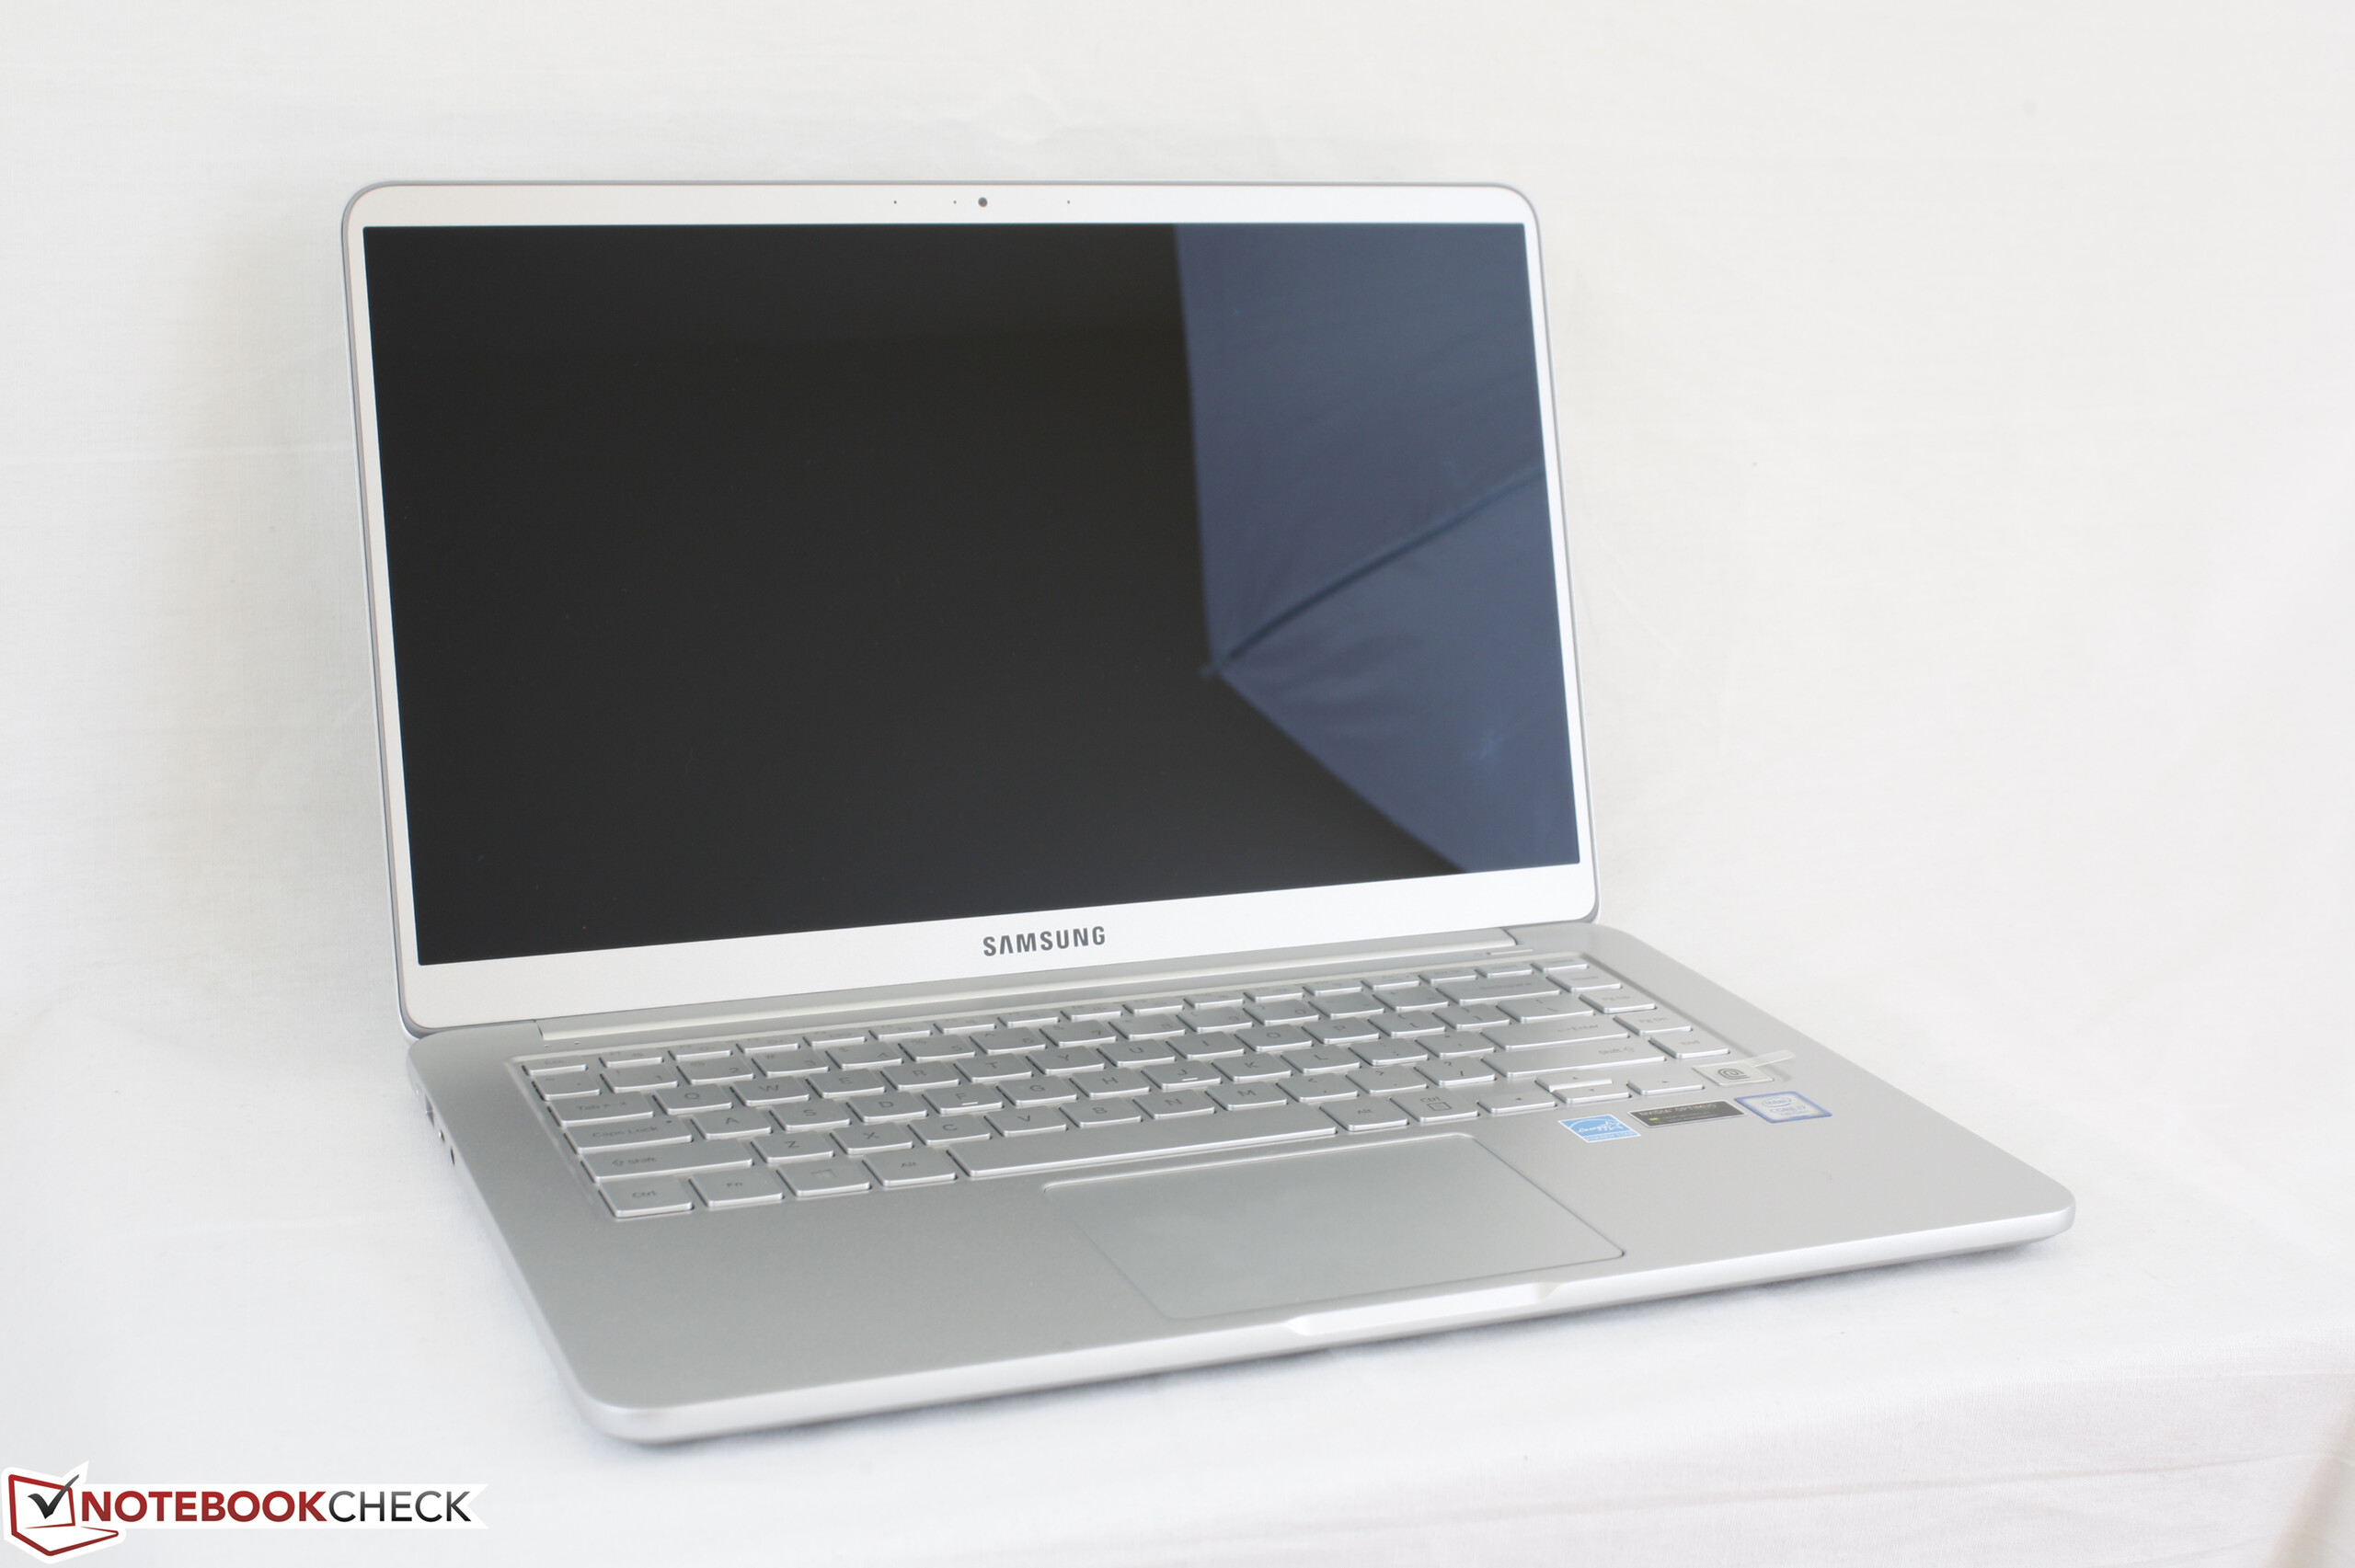
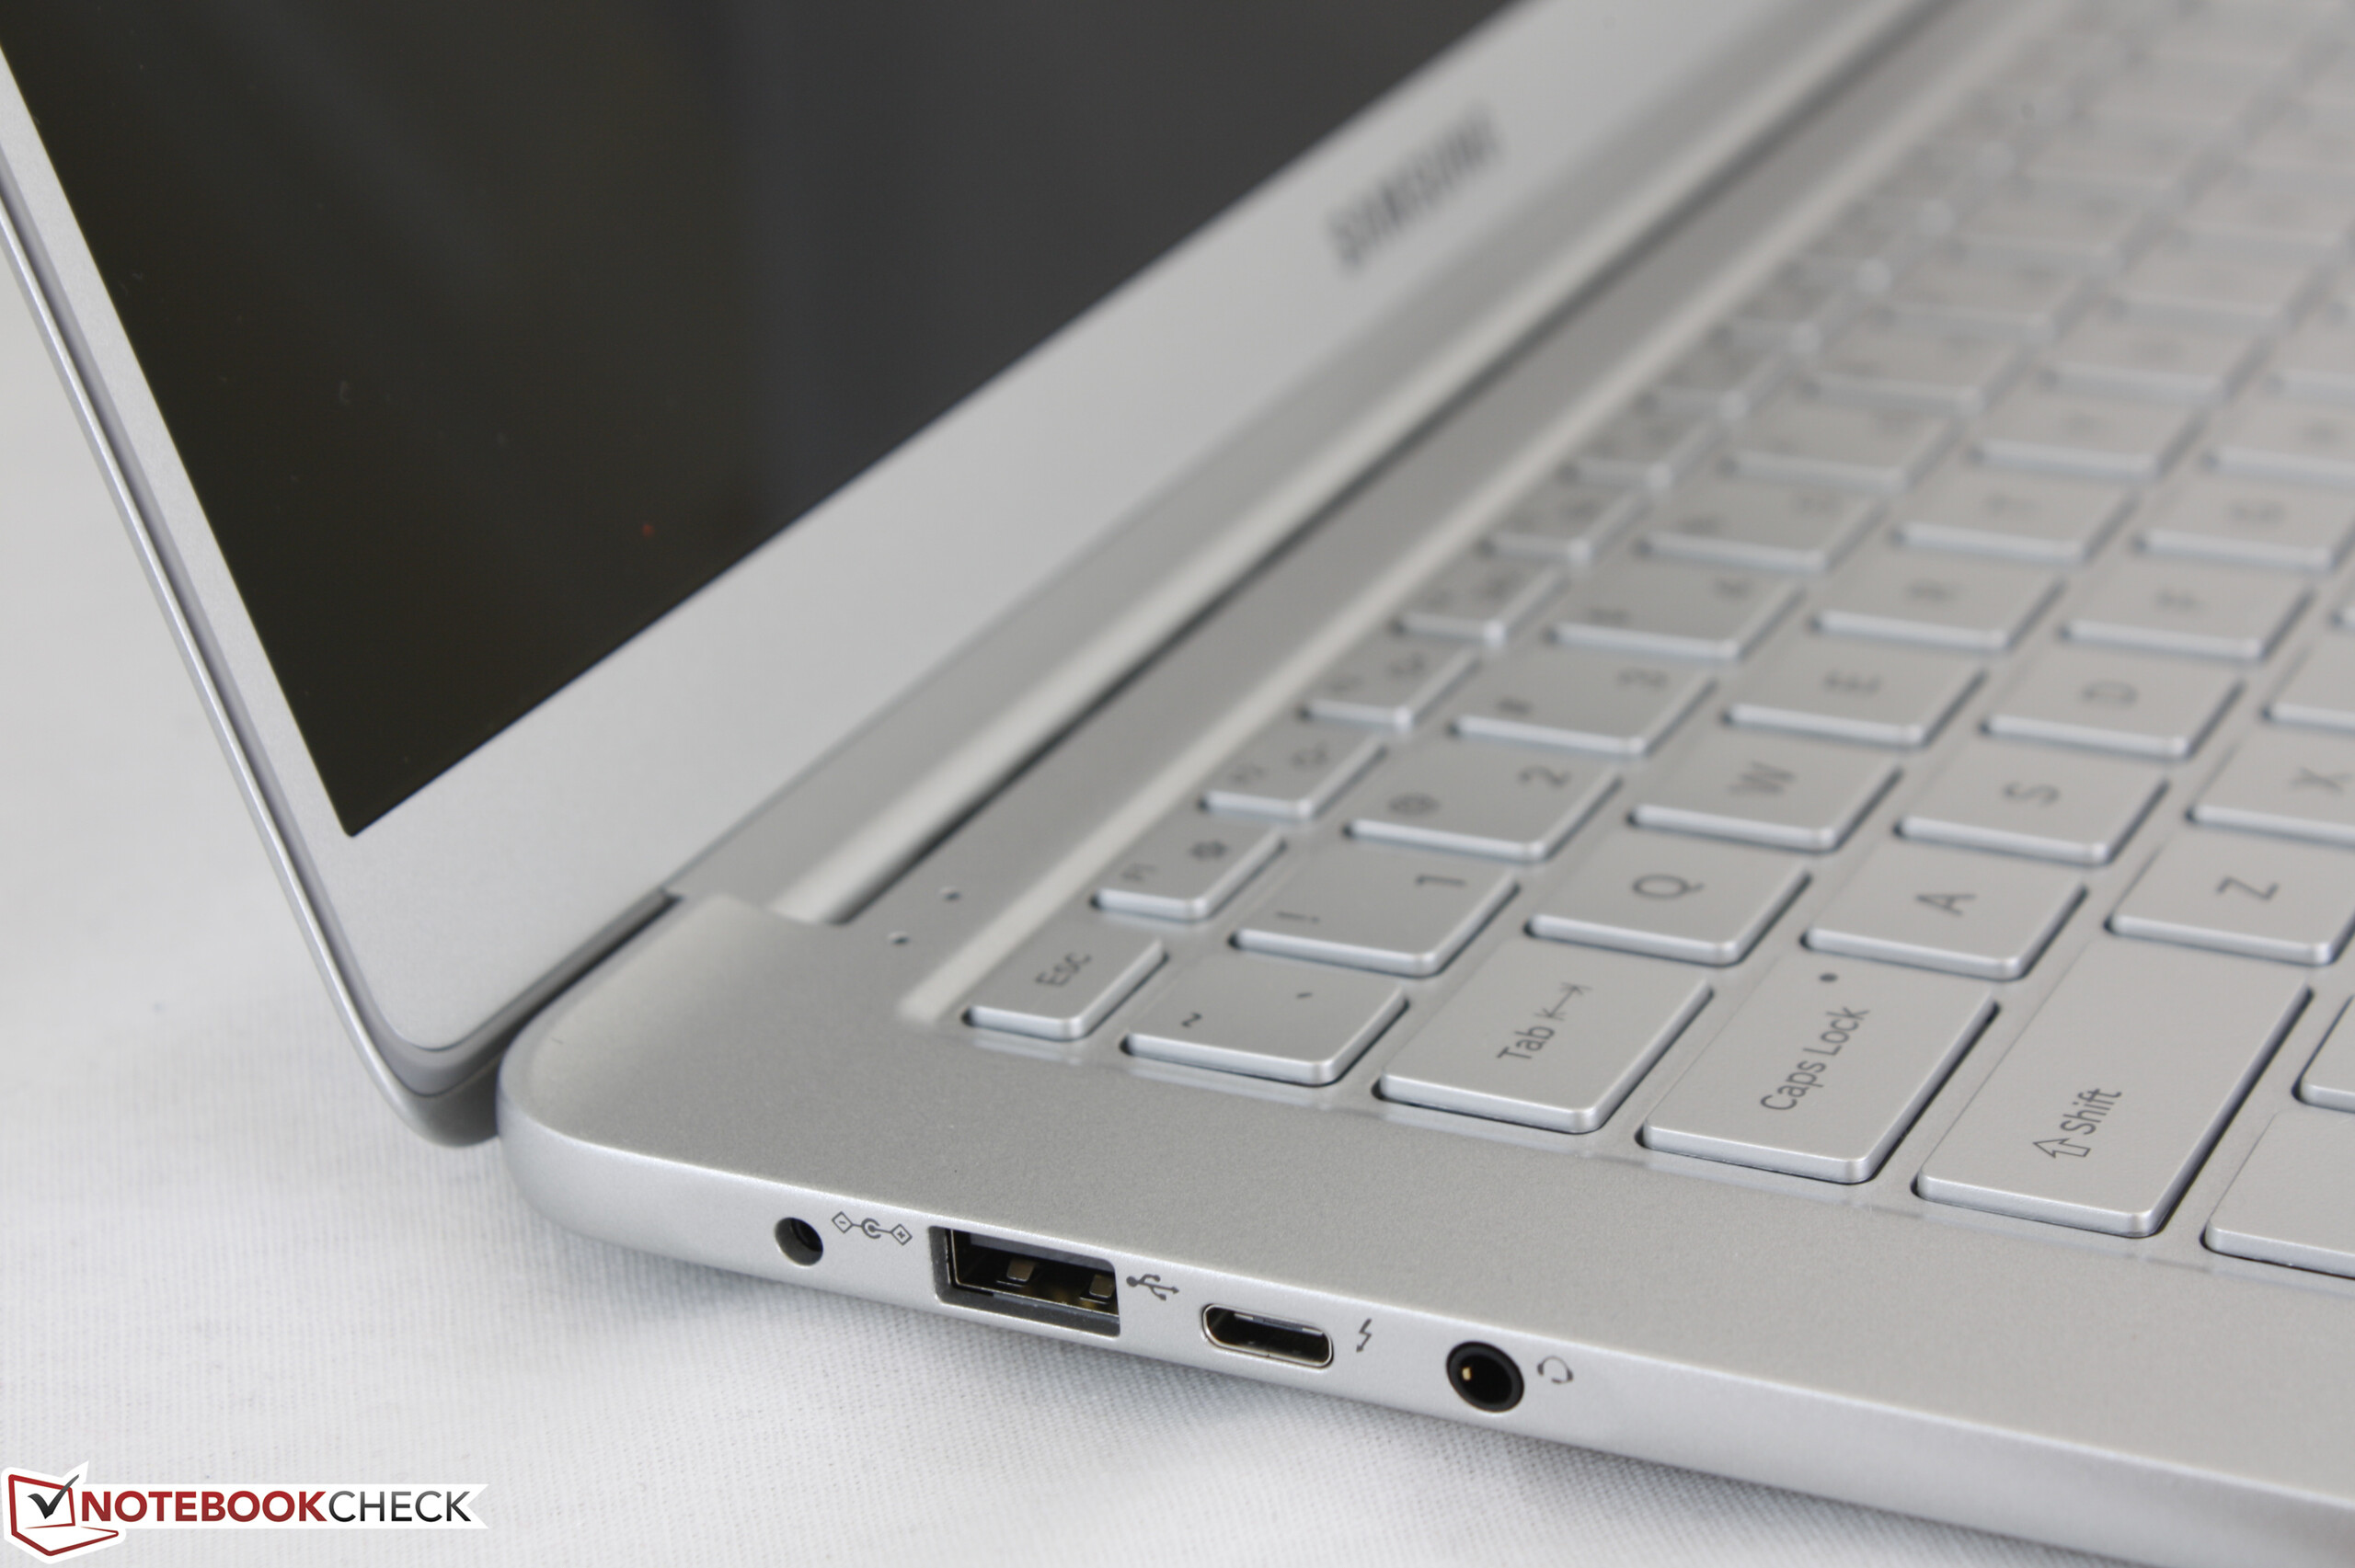
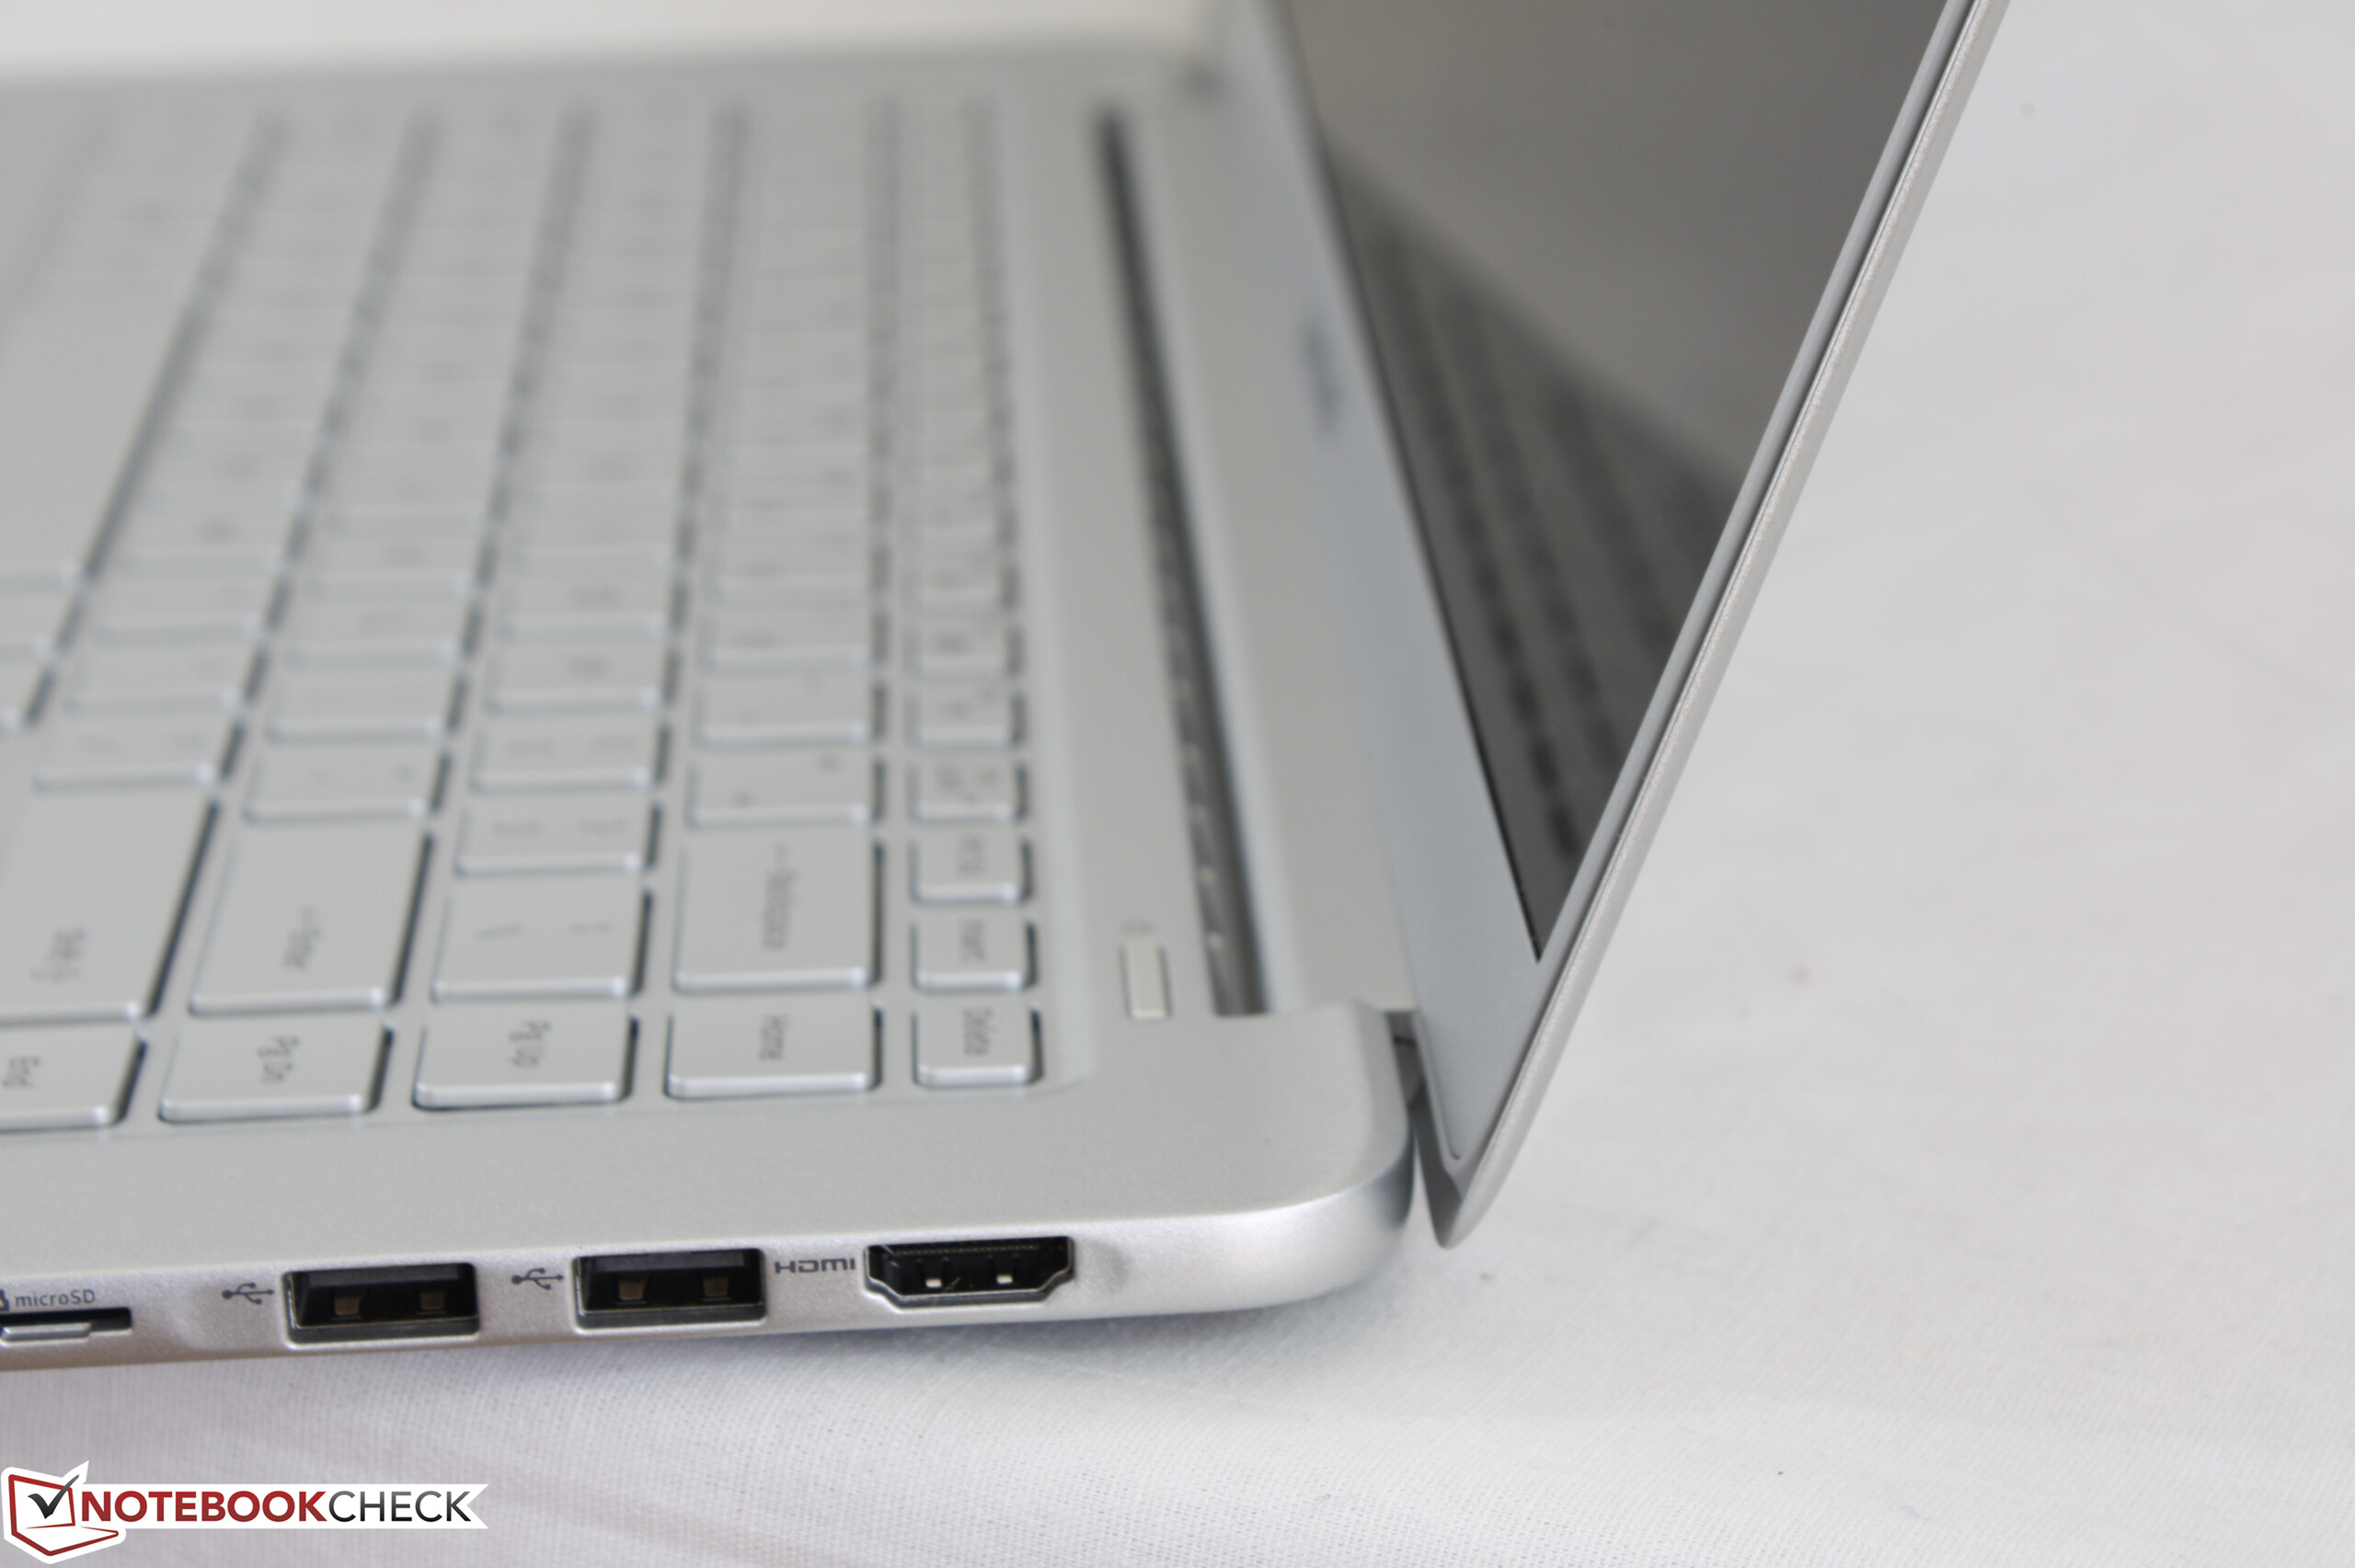
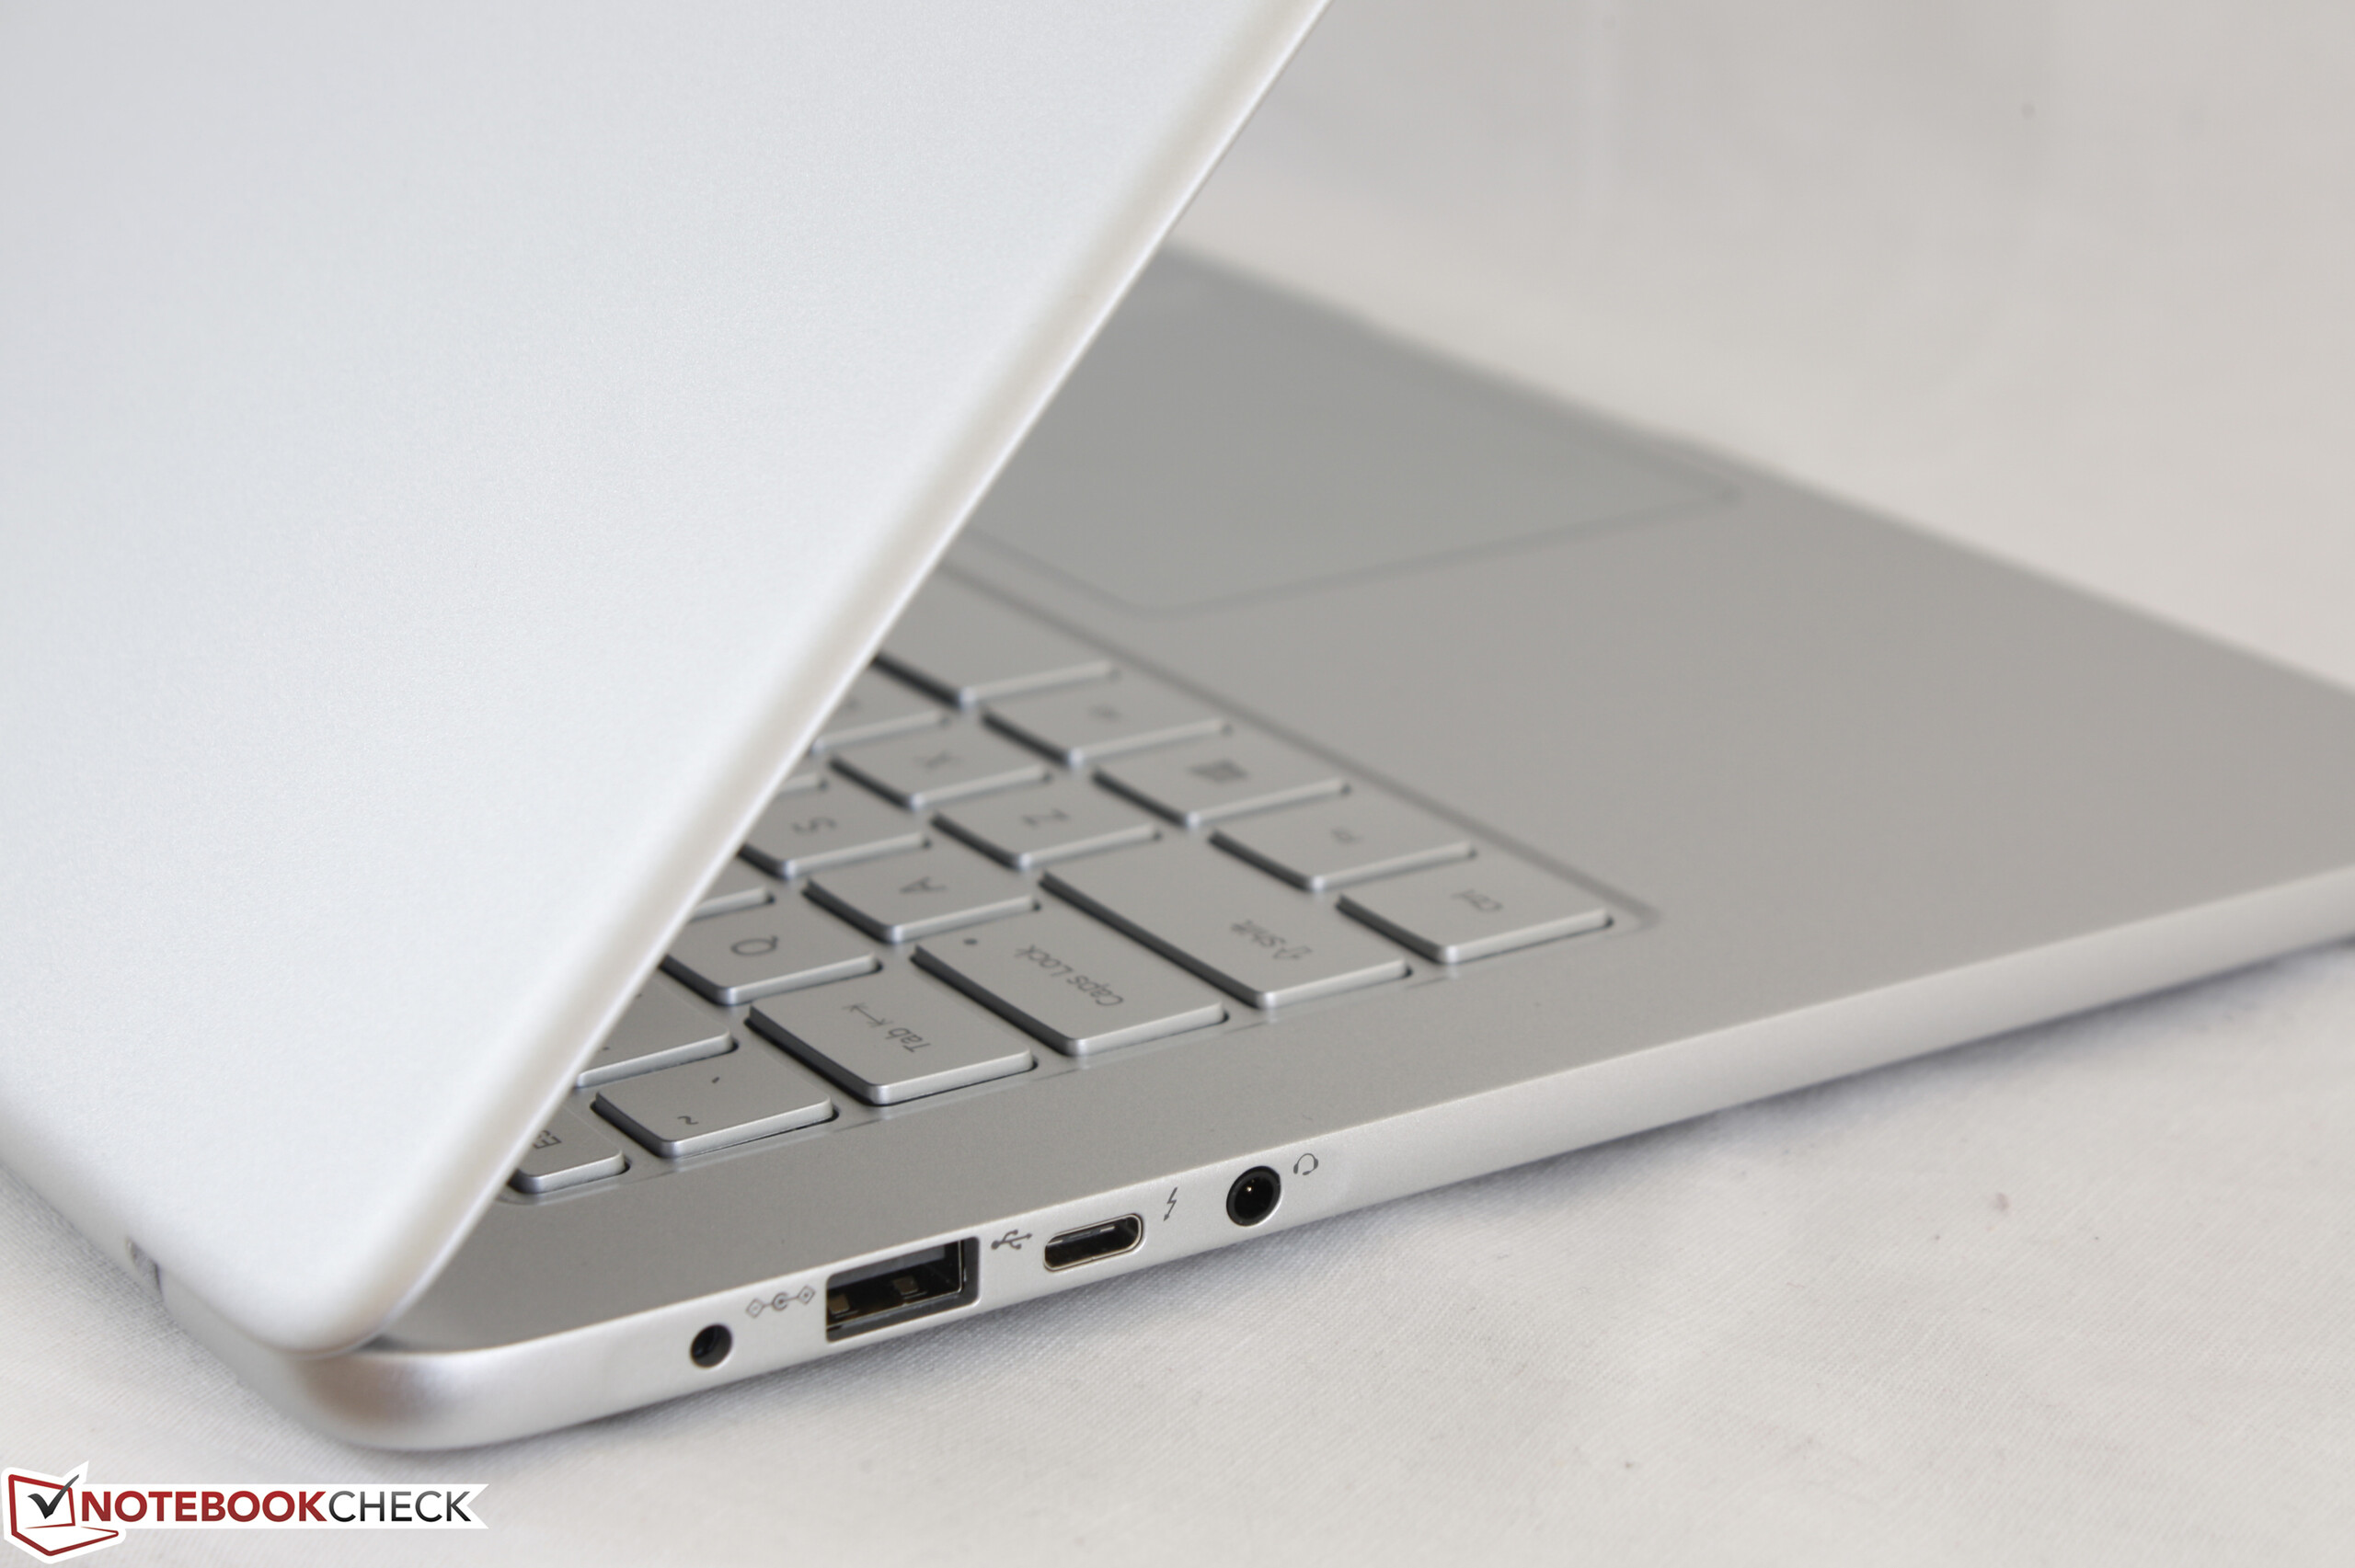
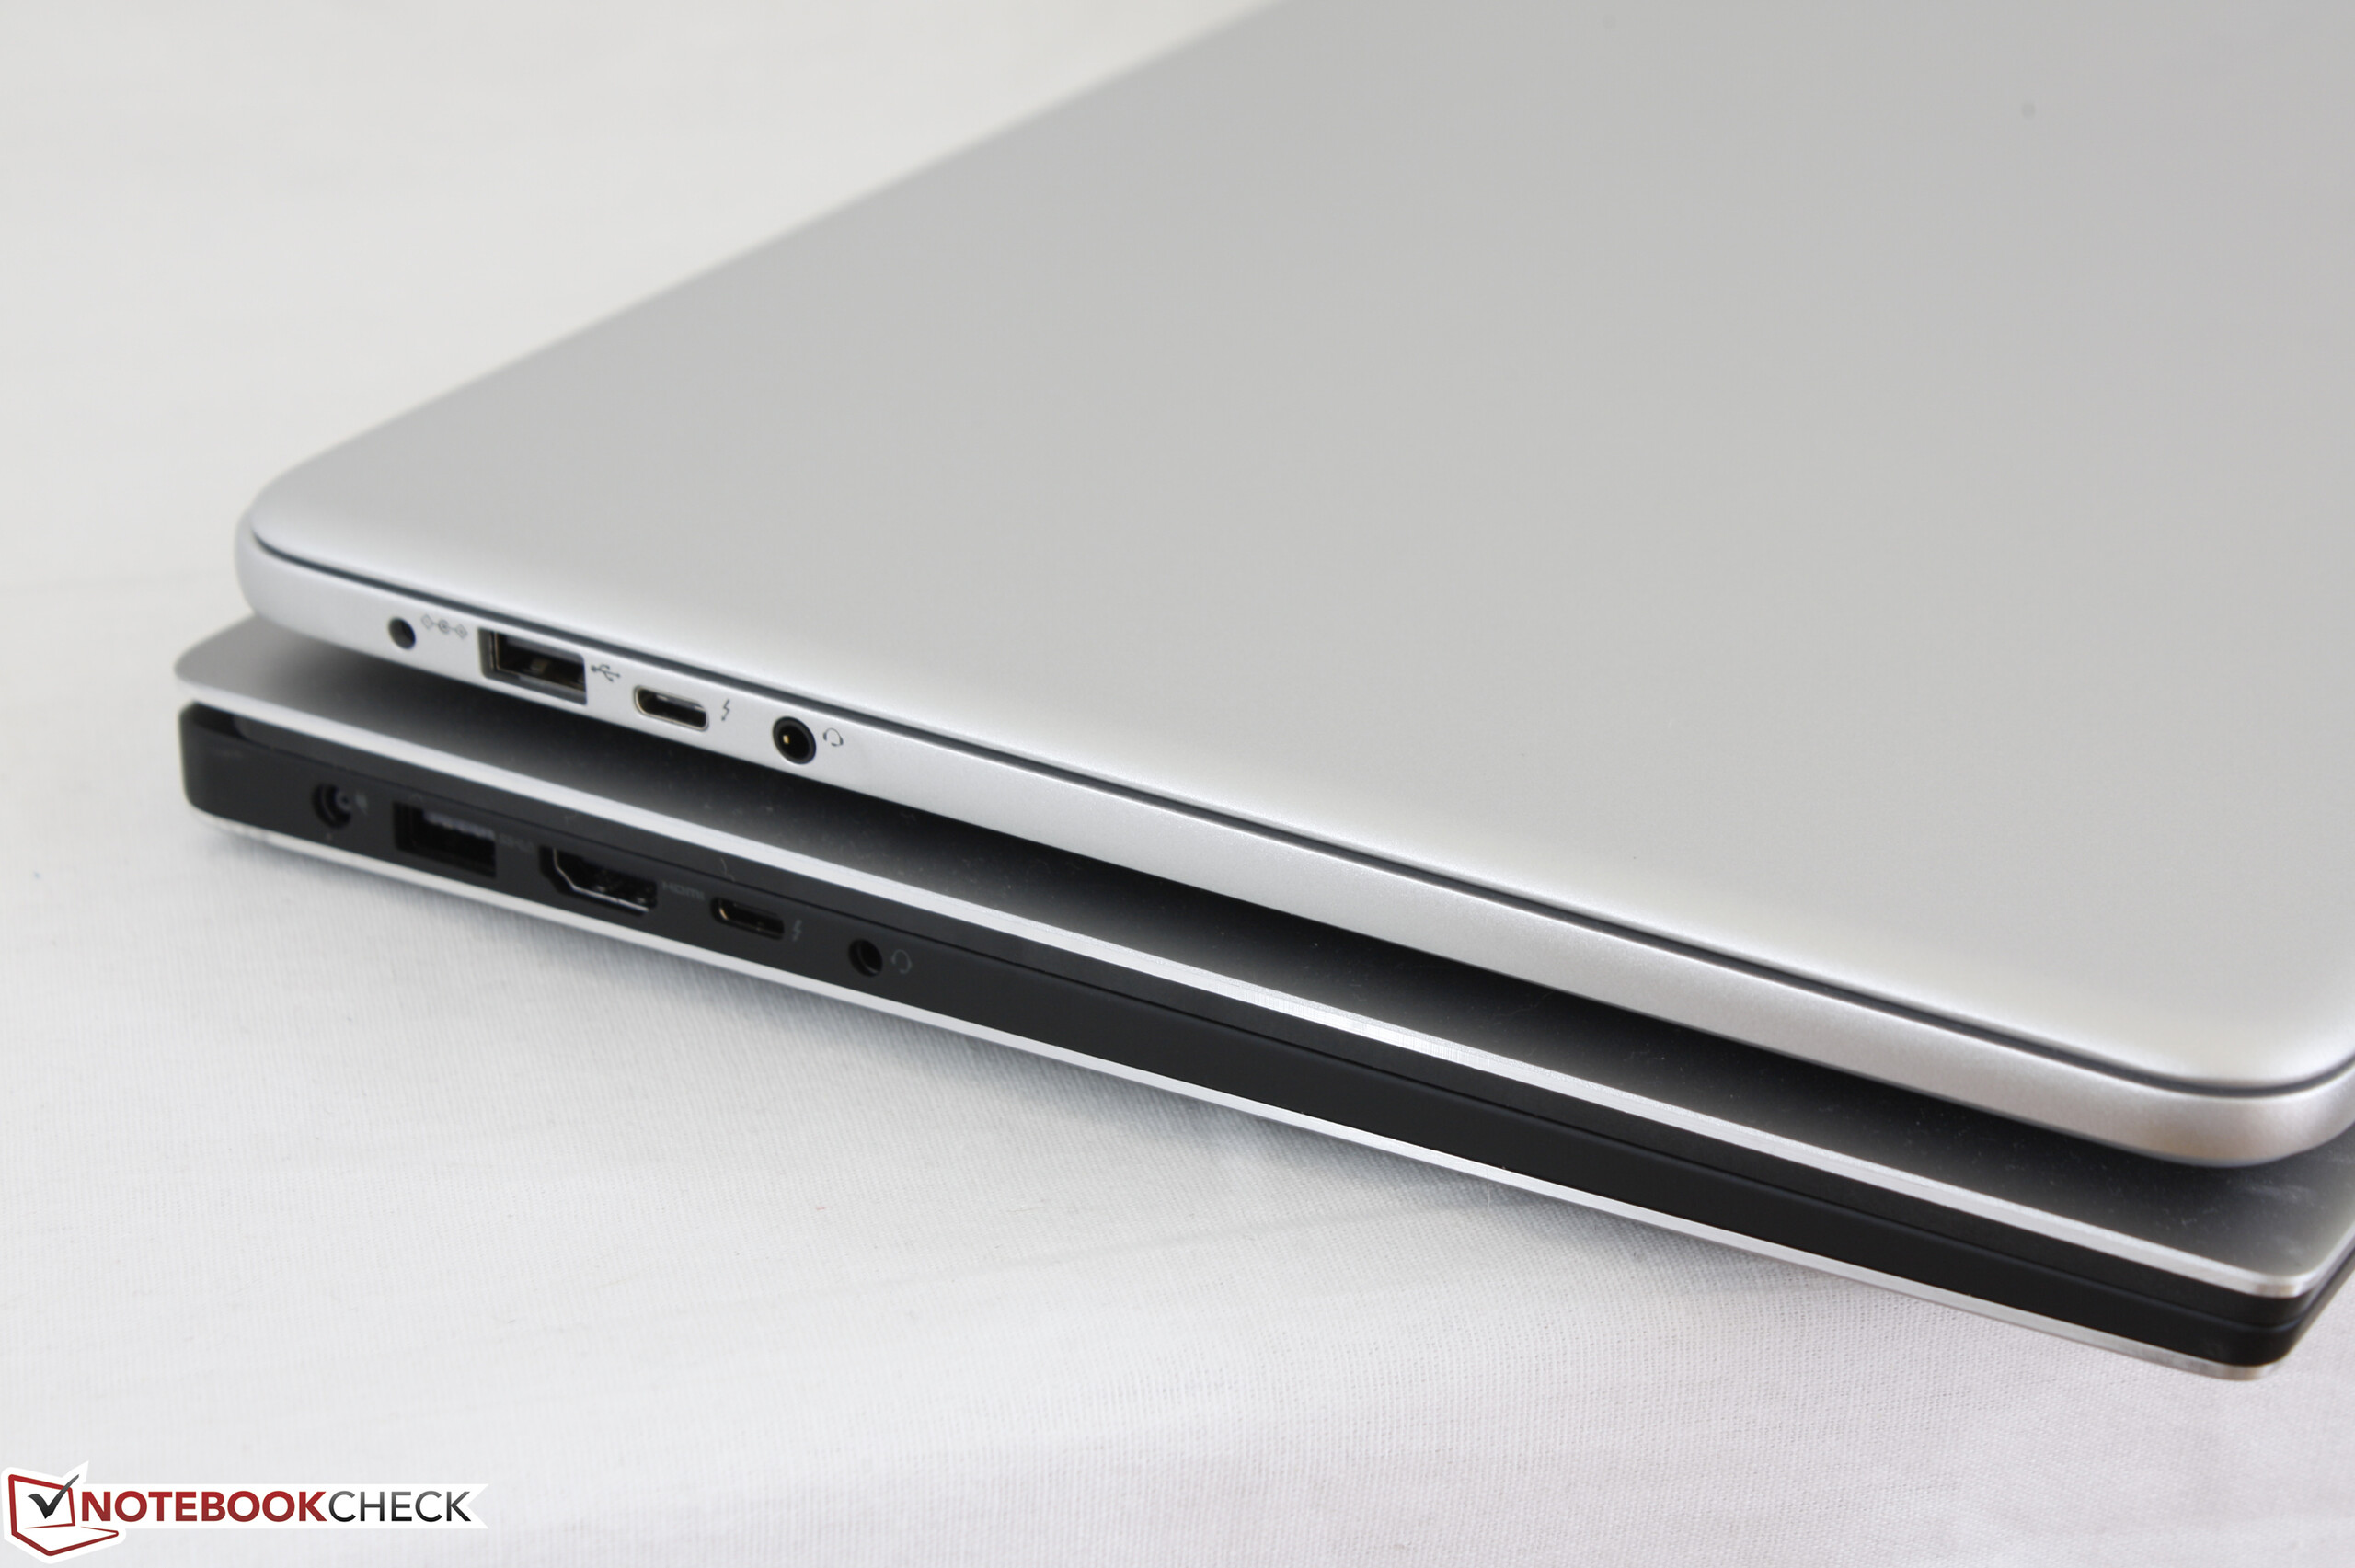
El Notebook 9 NP900X5N sobresale en muchas categorías, pero falla en algunas áreas clave. Elogiamos al fabricante por poder ofrecer un display 1080p tan brillante en un sistema tan ligero y tener opciones de dGPU disponibles. Si brillo, portabilidad, longevidad, conectividad Thunderbolt, y gráficas GeForce son una prioridad, el Notebook 9 resulta una recomendación sencilla especialmente si los usuarios consideran frívolas las opciones de pantalla táctil o las alternativas de 14" les son demasiado pequeñas para su productividad.
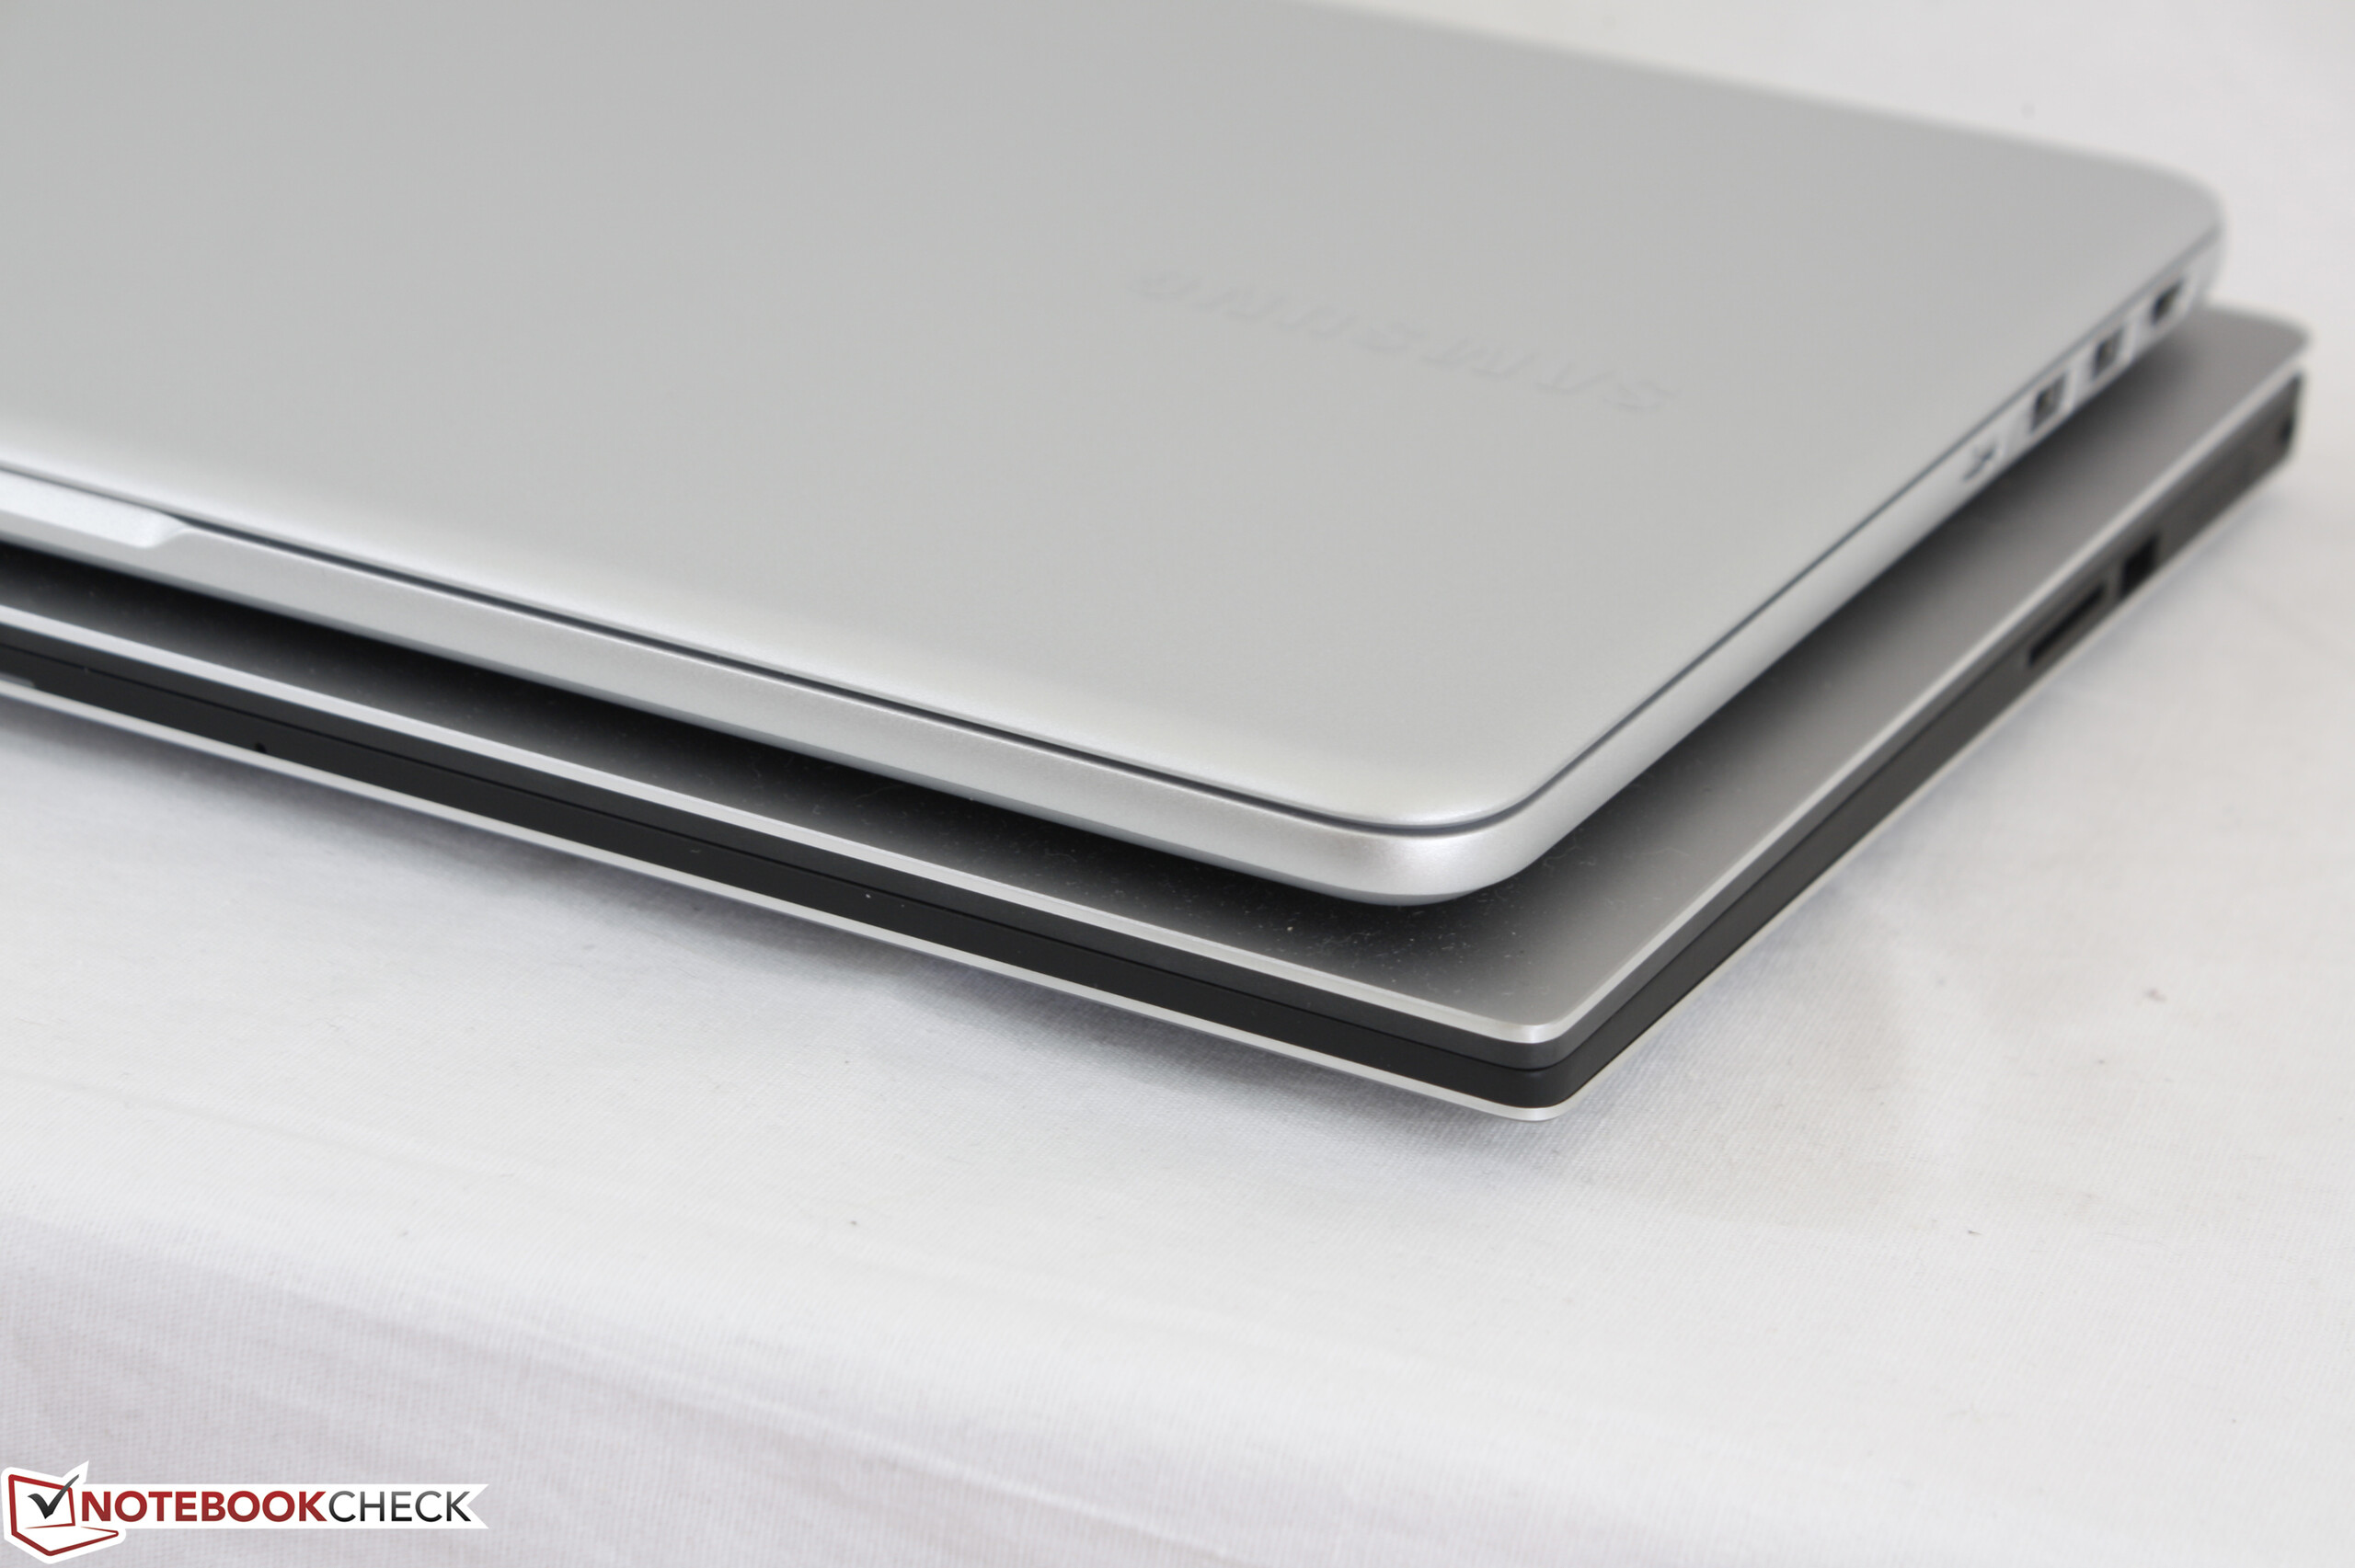
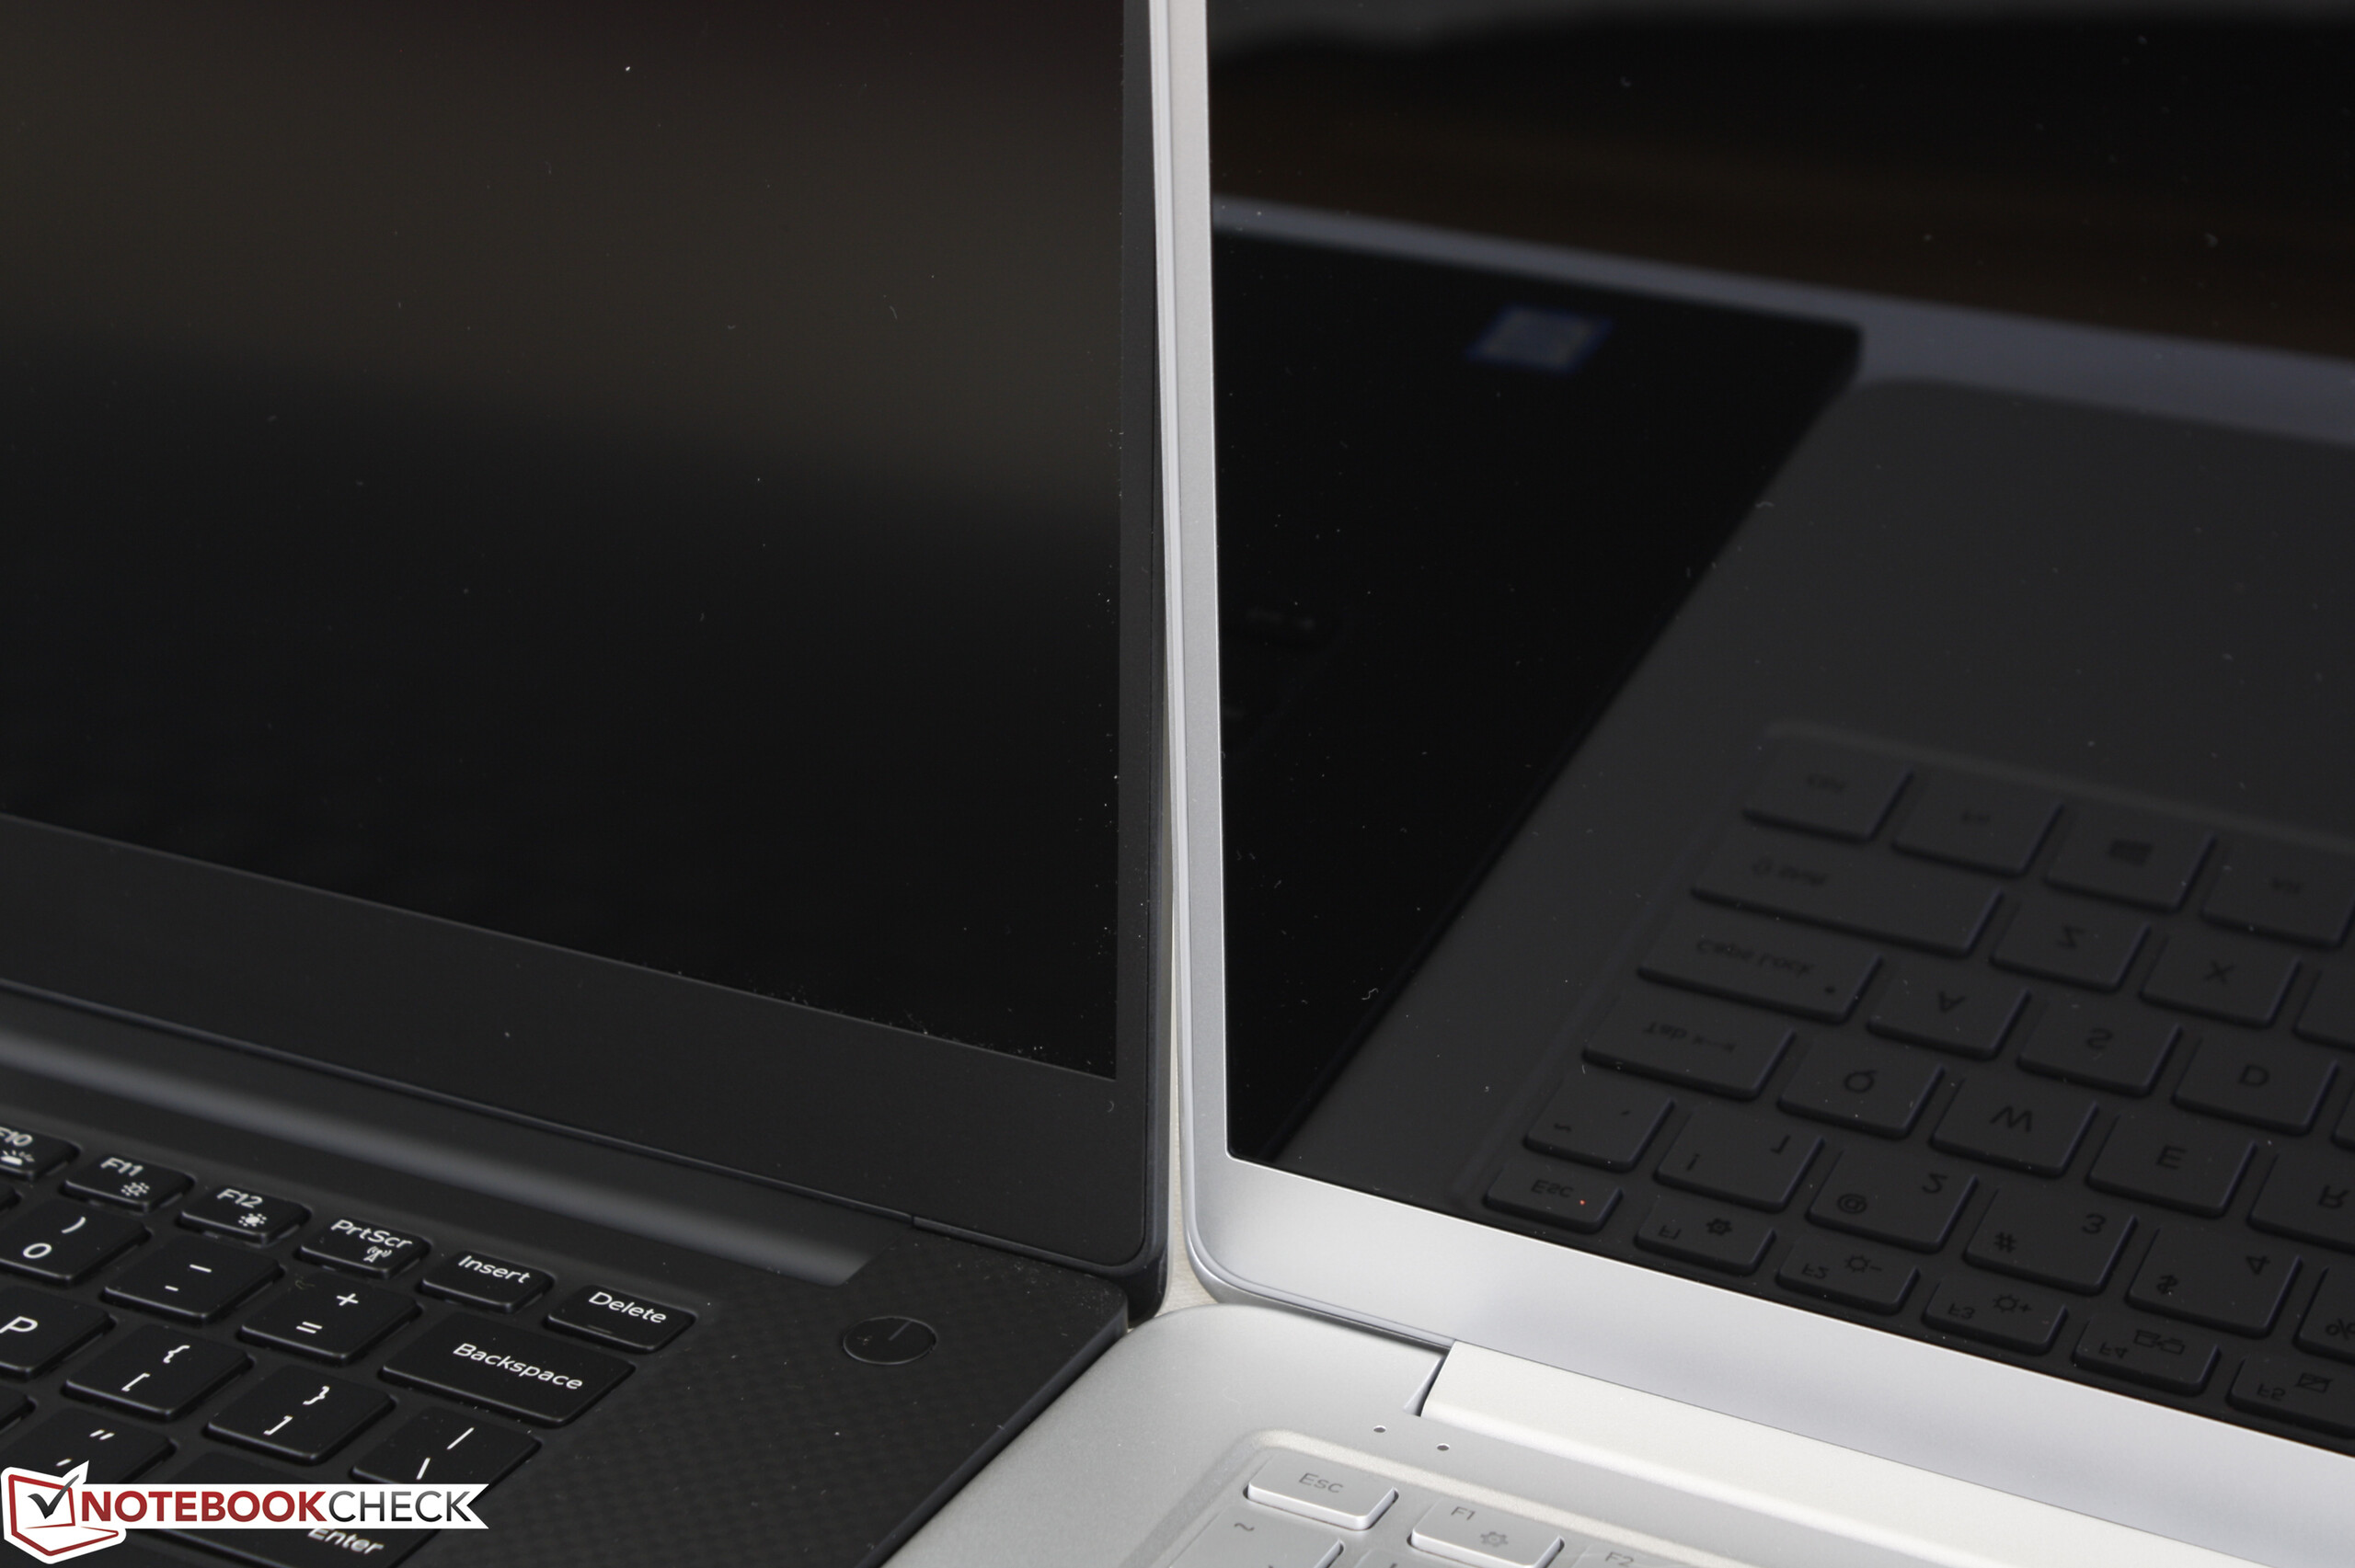
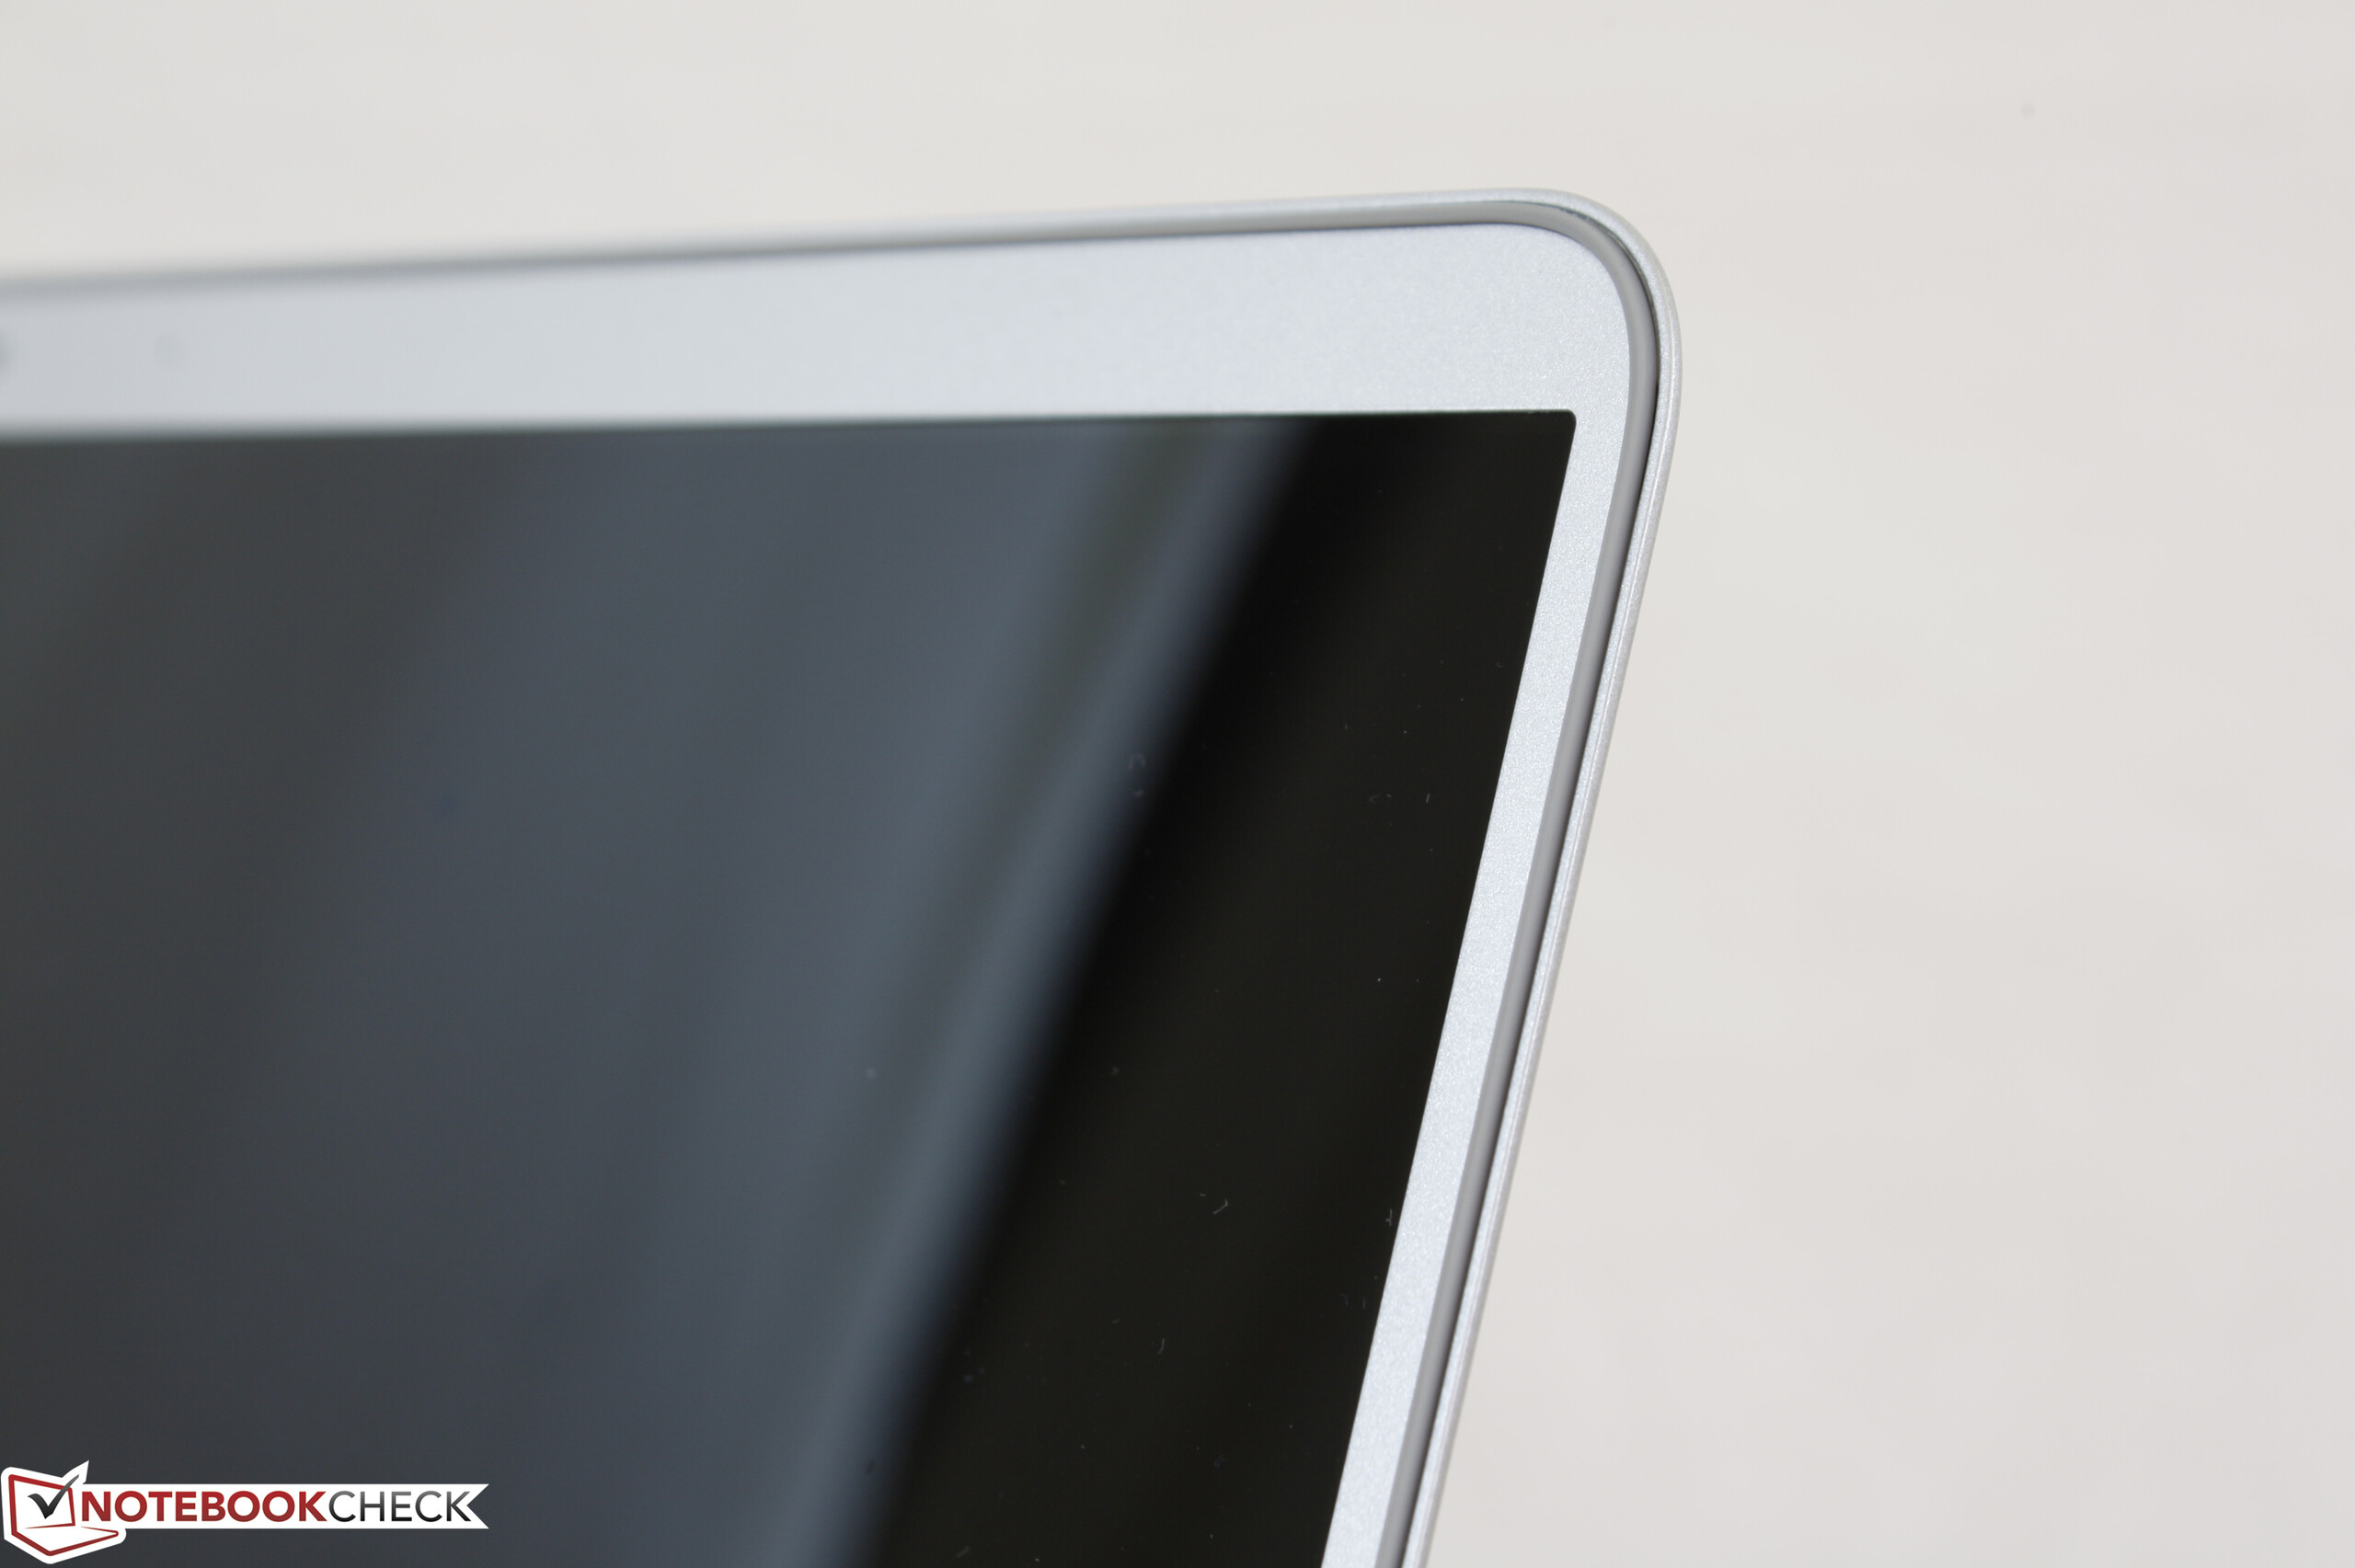
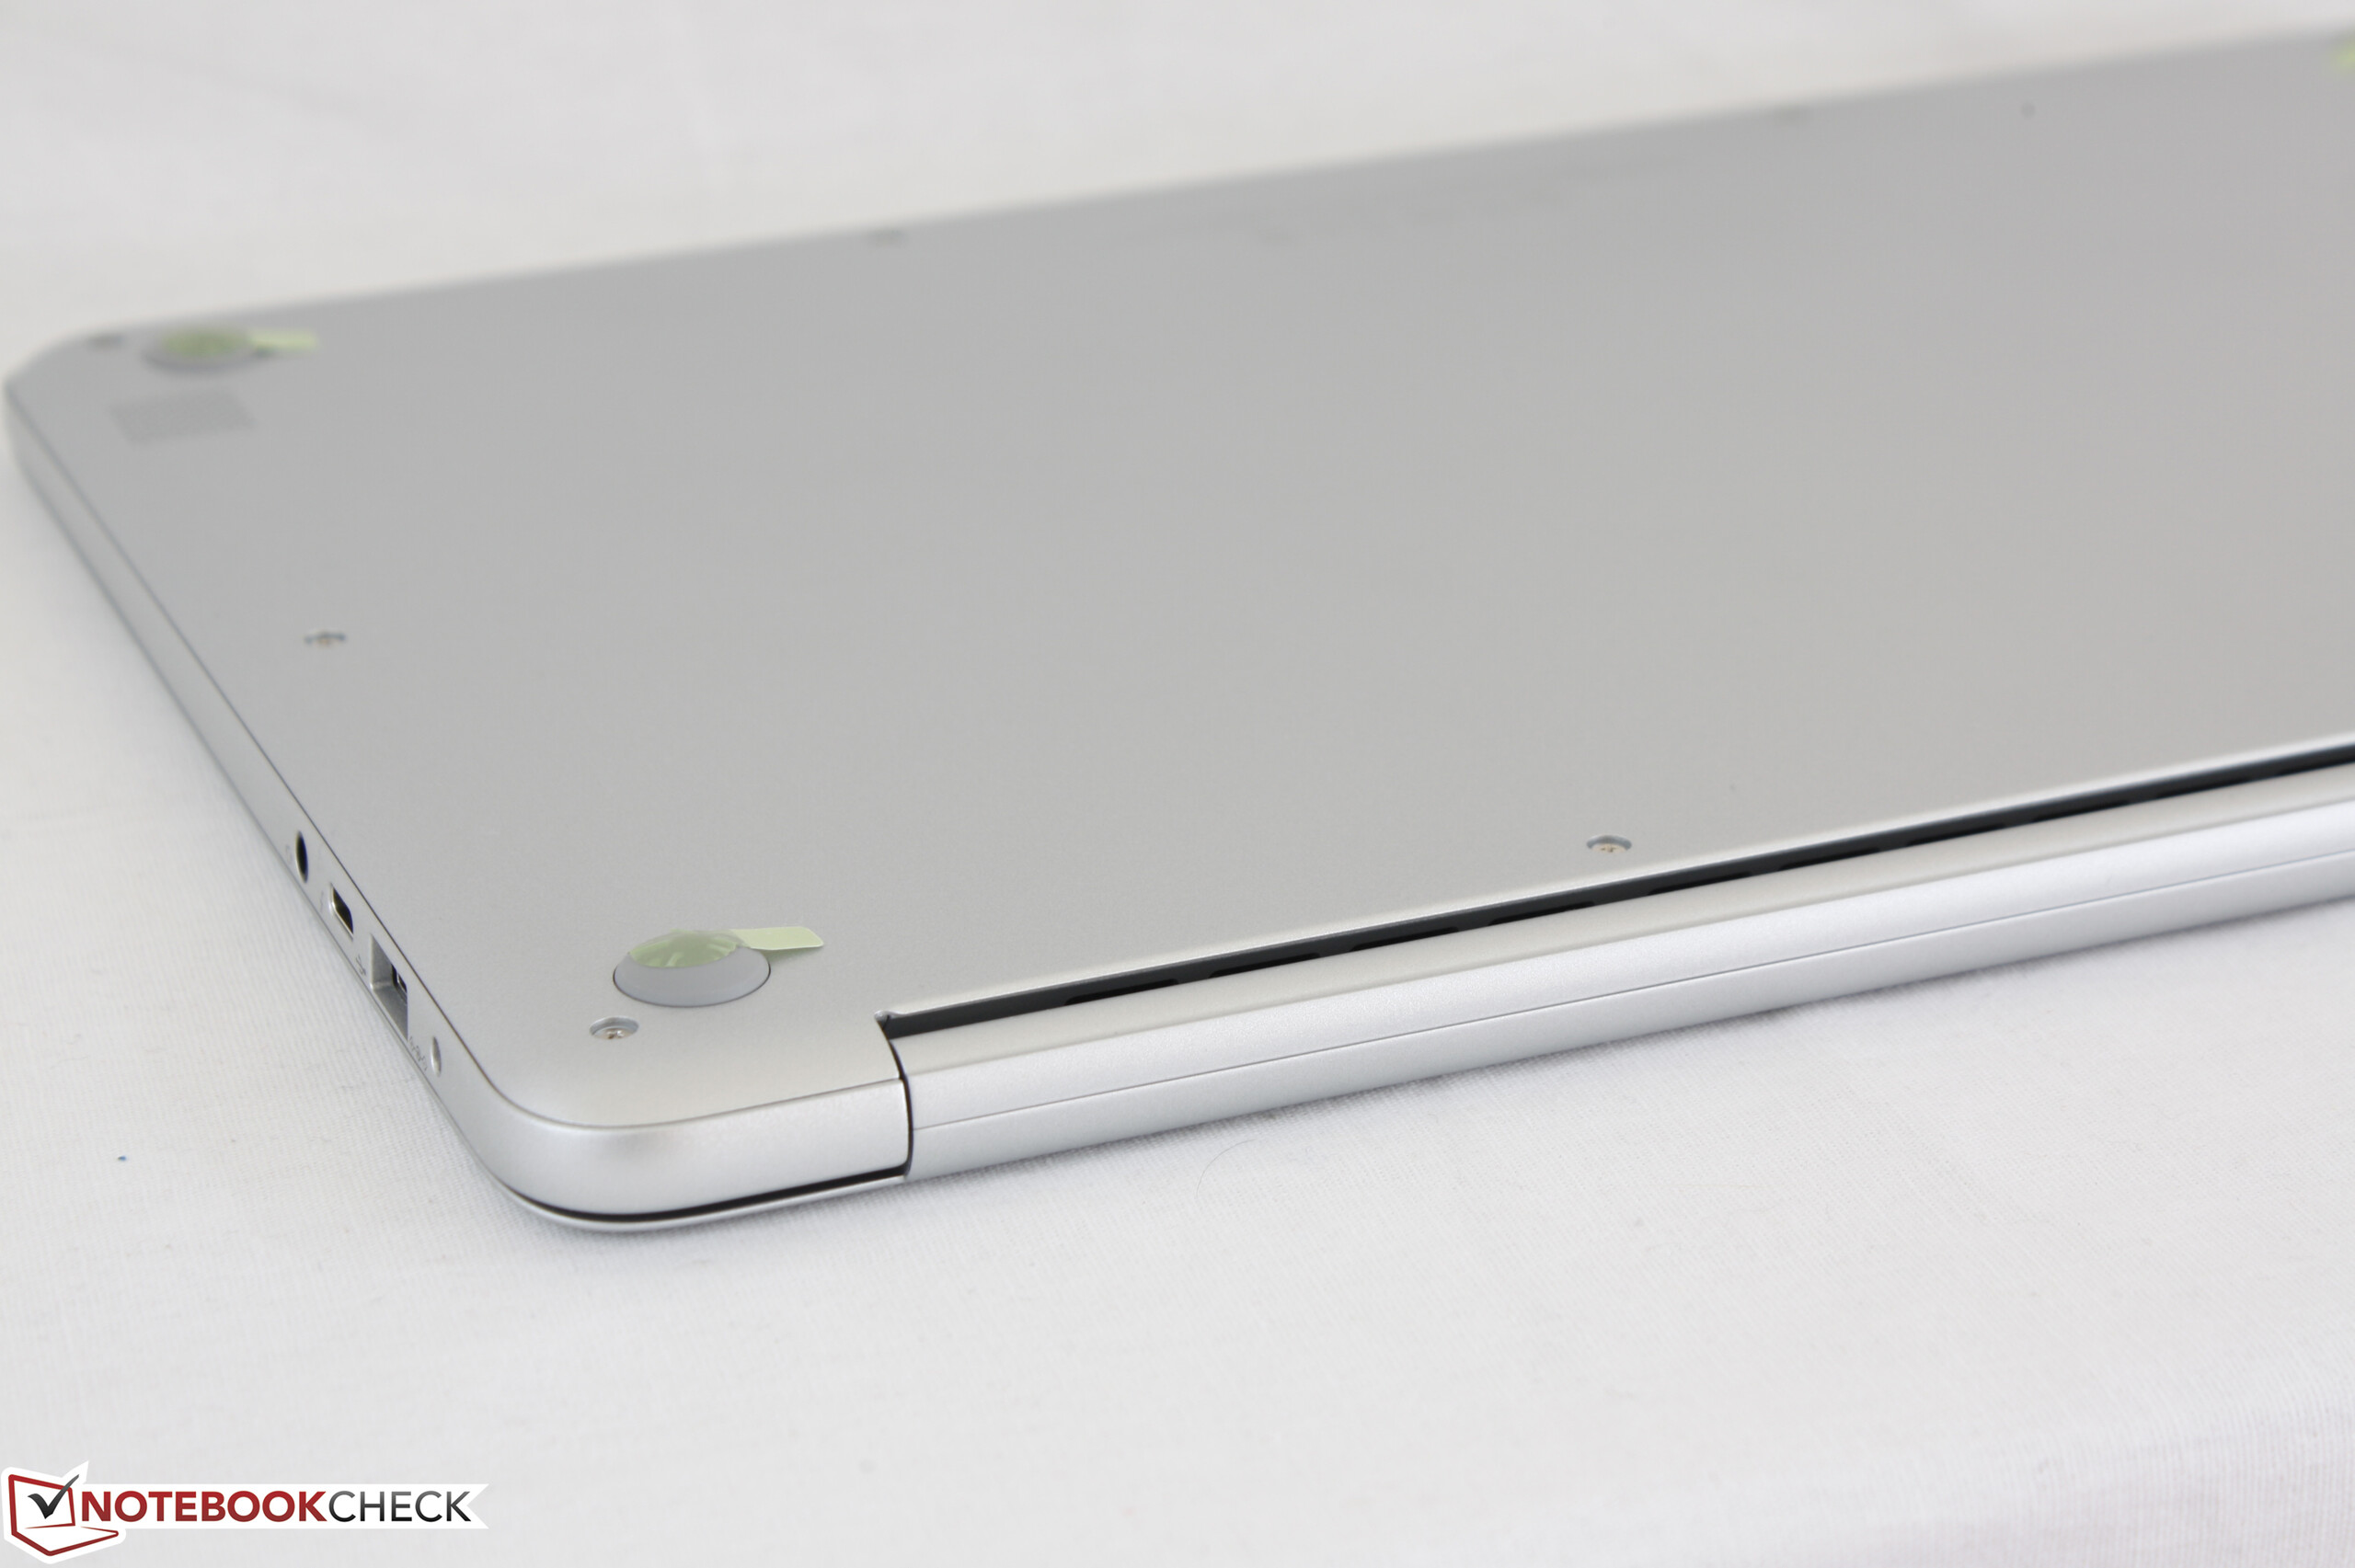
El Samsung dista de la perfección, y la rigidez del chasis es meramente mediocre con algunas elecciones de configuración de display. Por encantador que pueda ser el display de bisel estrecho, es mucho más flexible que los de los competidores. Es raro que el panel lustroso sea obligatorio y no lleve protección Gorilla Glass u opciones de pantalla táctil que típicamente lo acompañan. La presencia de PWM en casi todos los niveles de brillo es otro factor que algunos usuarios pueden querer tener en cuenta antes de comprarlo.
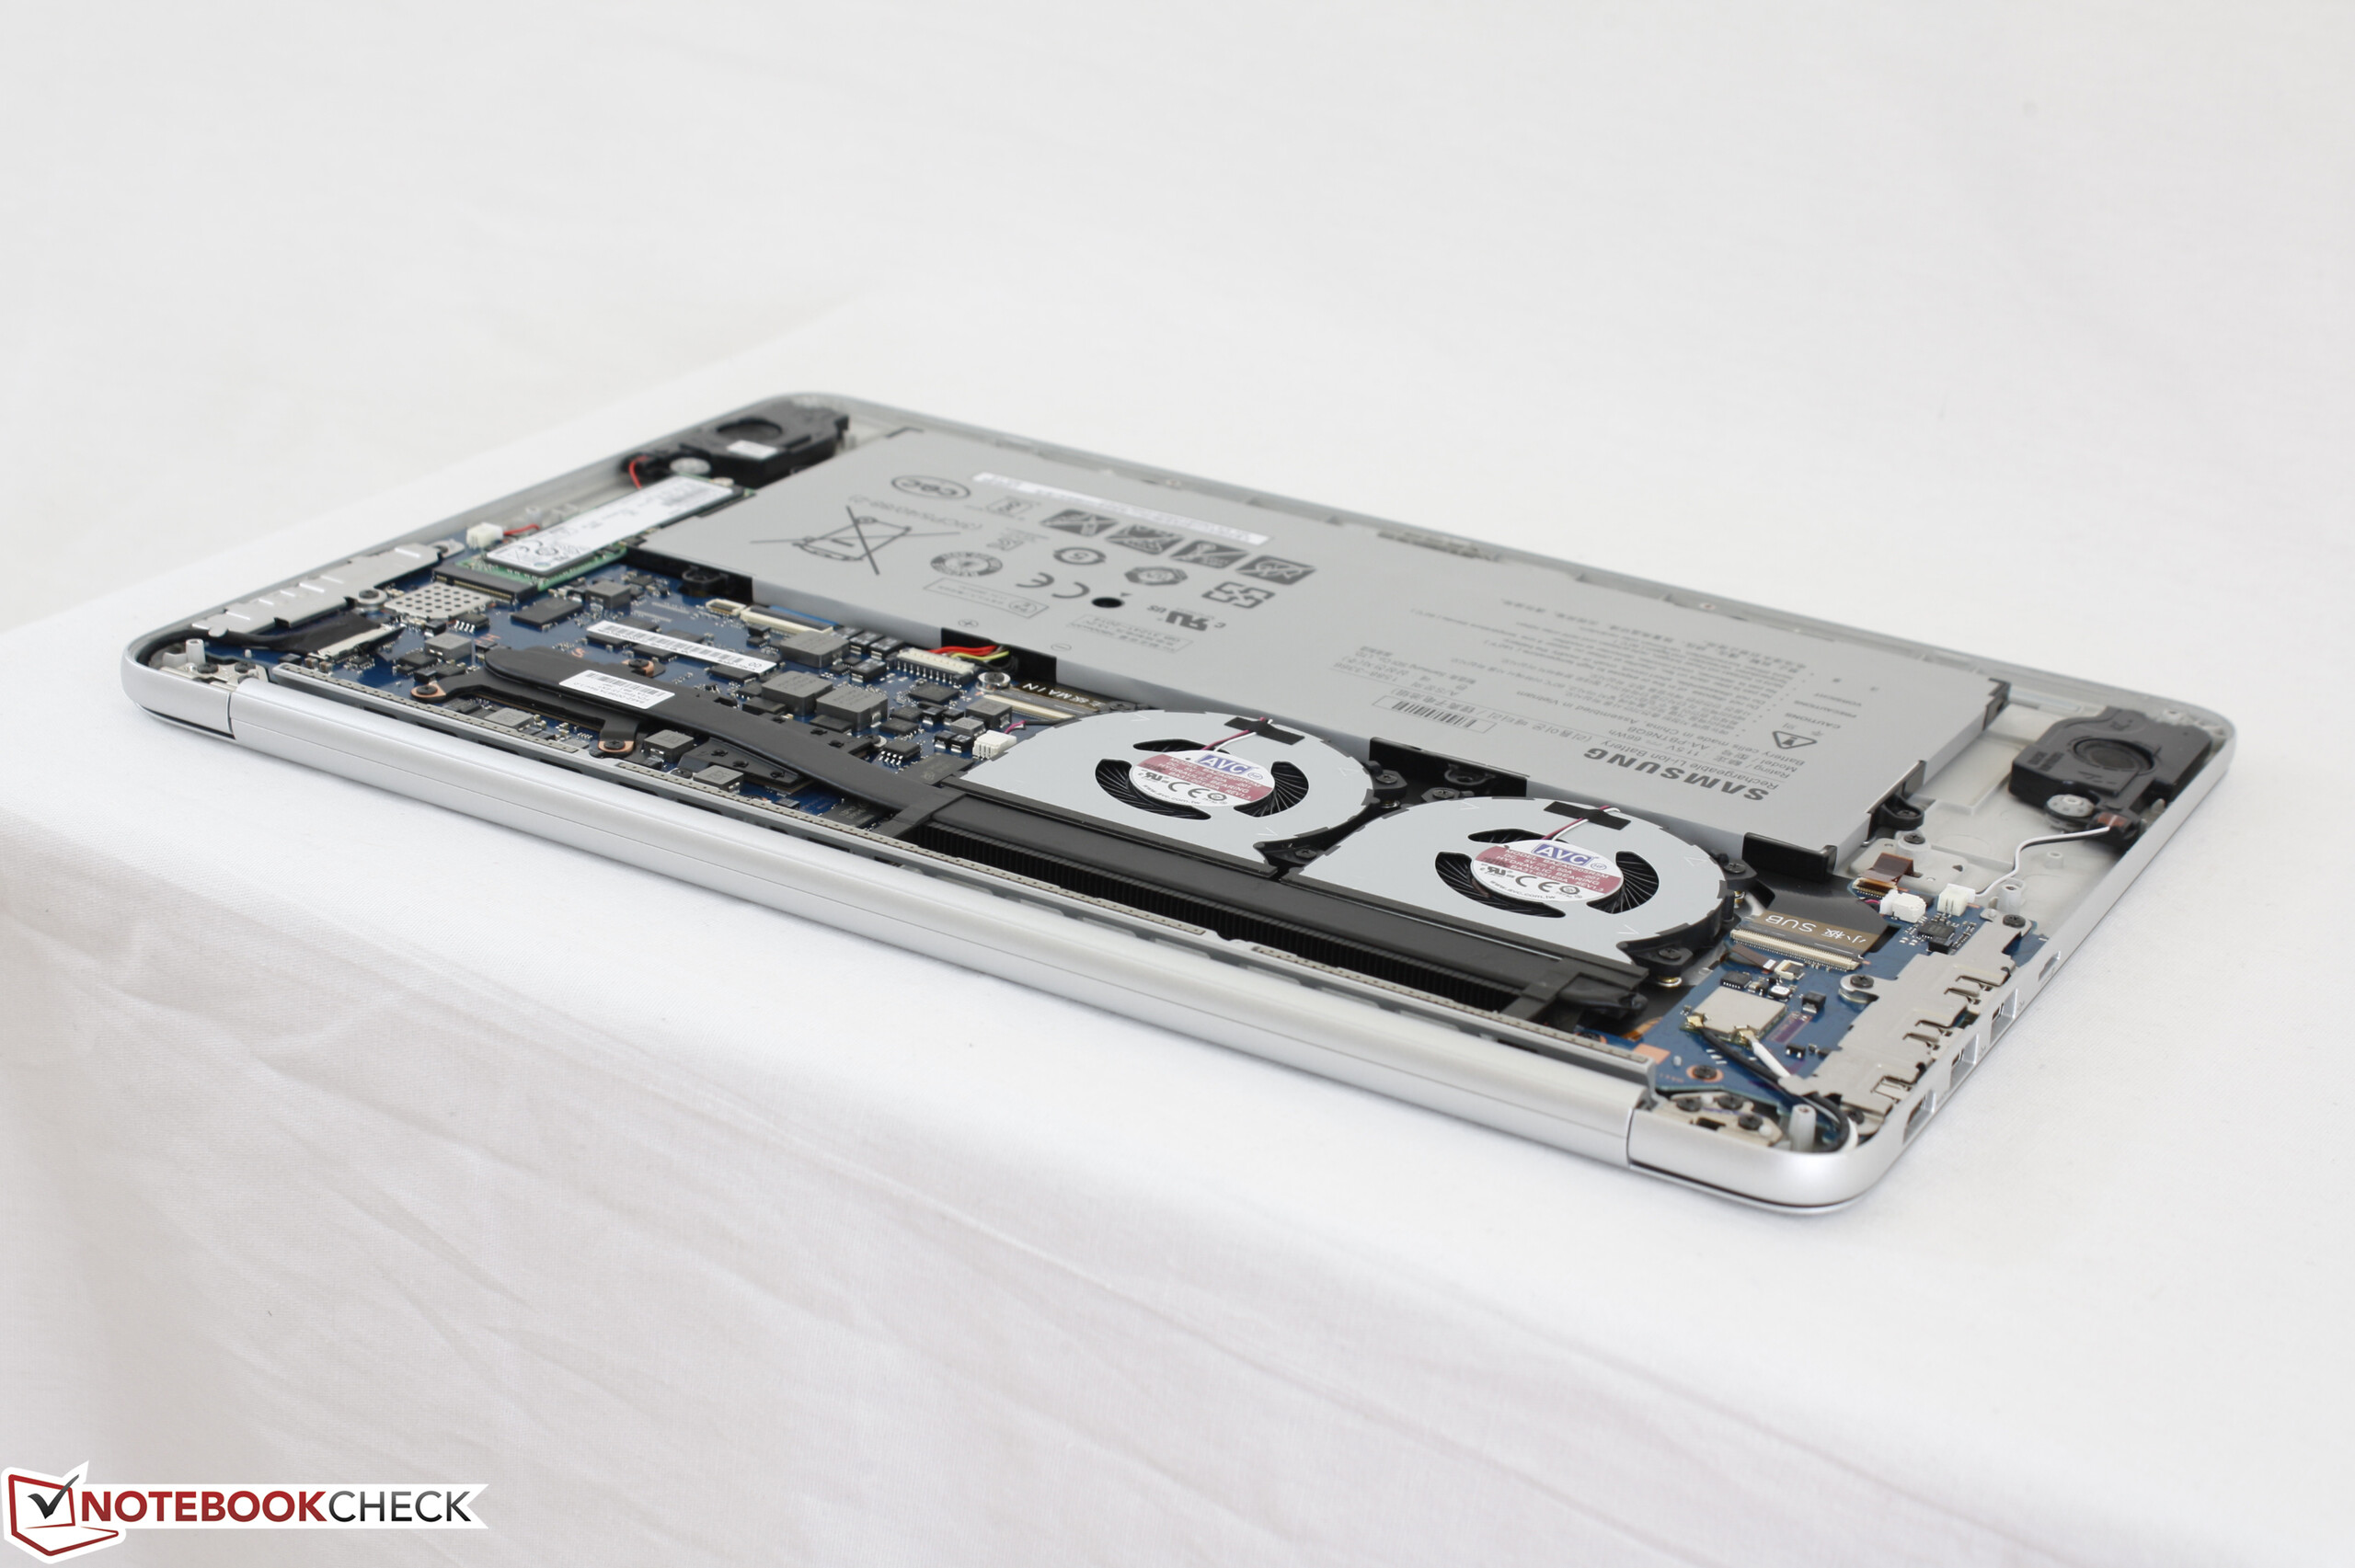
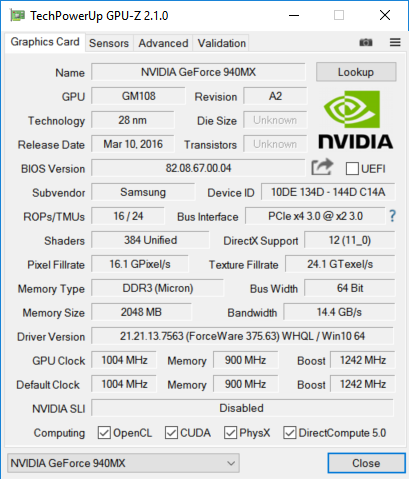
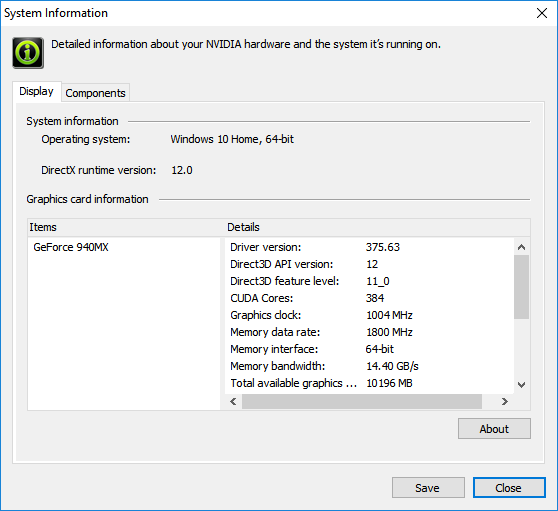
Además, nos decepciona ver que sólo trae la versión DDR3 de la GeForce 940MX en vez de la superior GDDR5, especialmente dado que esta GPU está envejeciendo a pasos agigantados. Nvidia pronto lanzará la GeForce MX150 para portátiles delgados-y-ligeros que en esencia dejarán obsoleta a la serie 940MX.
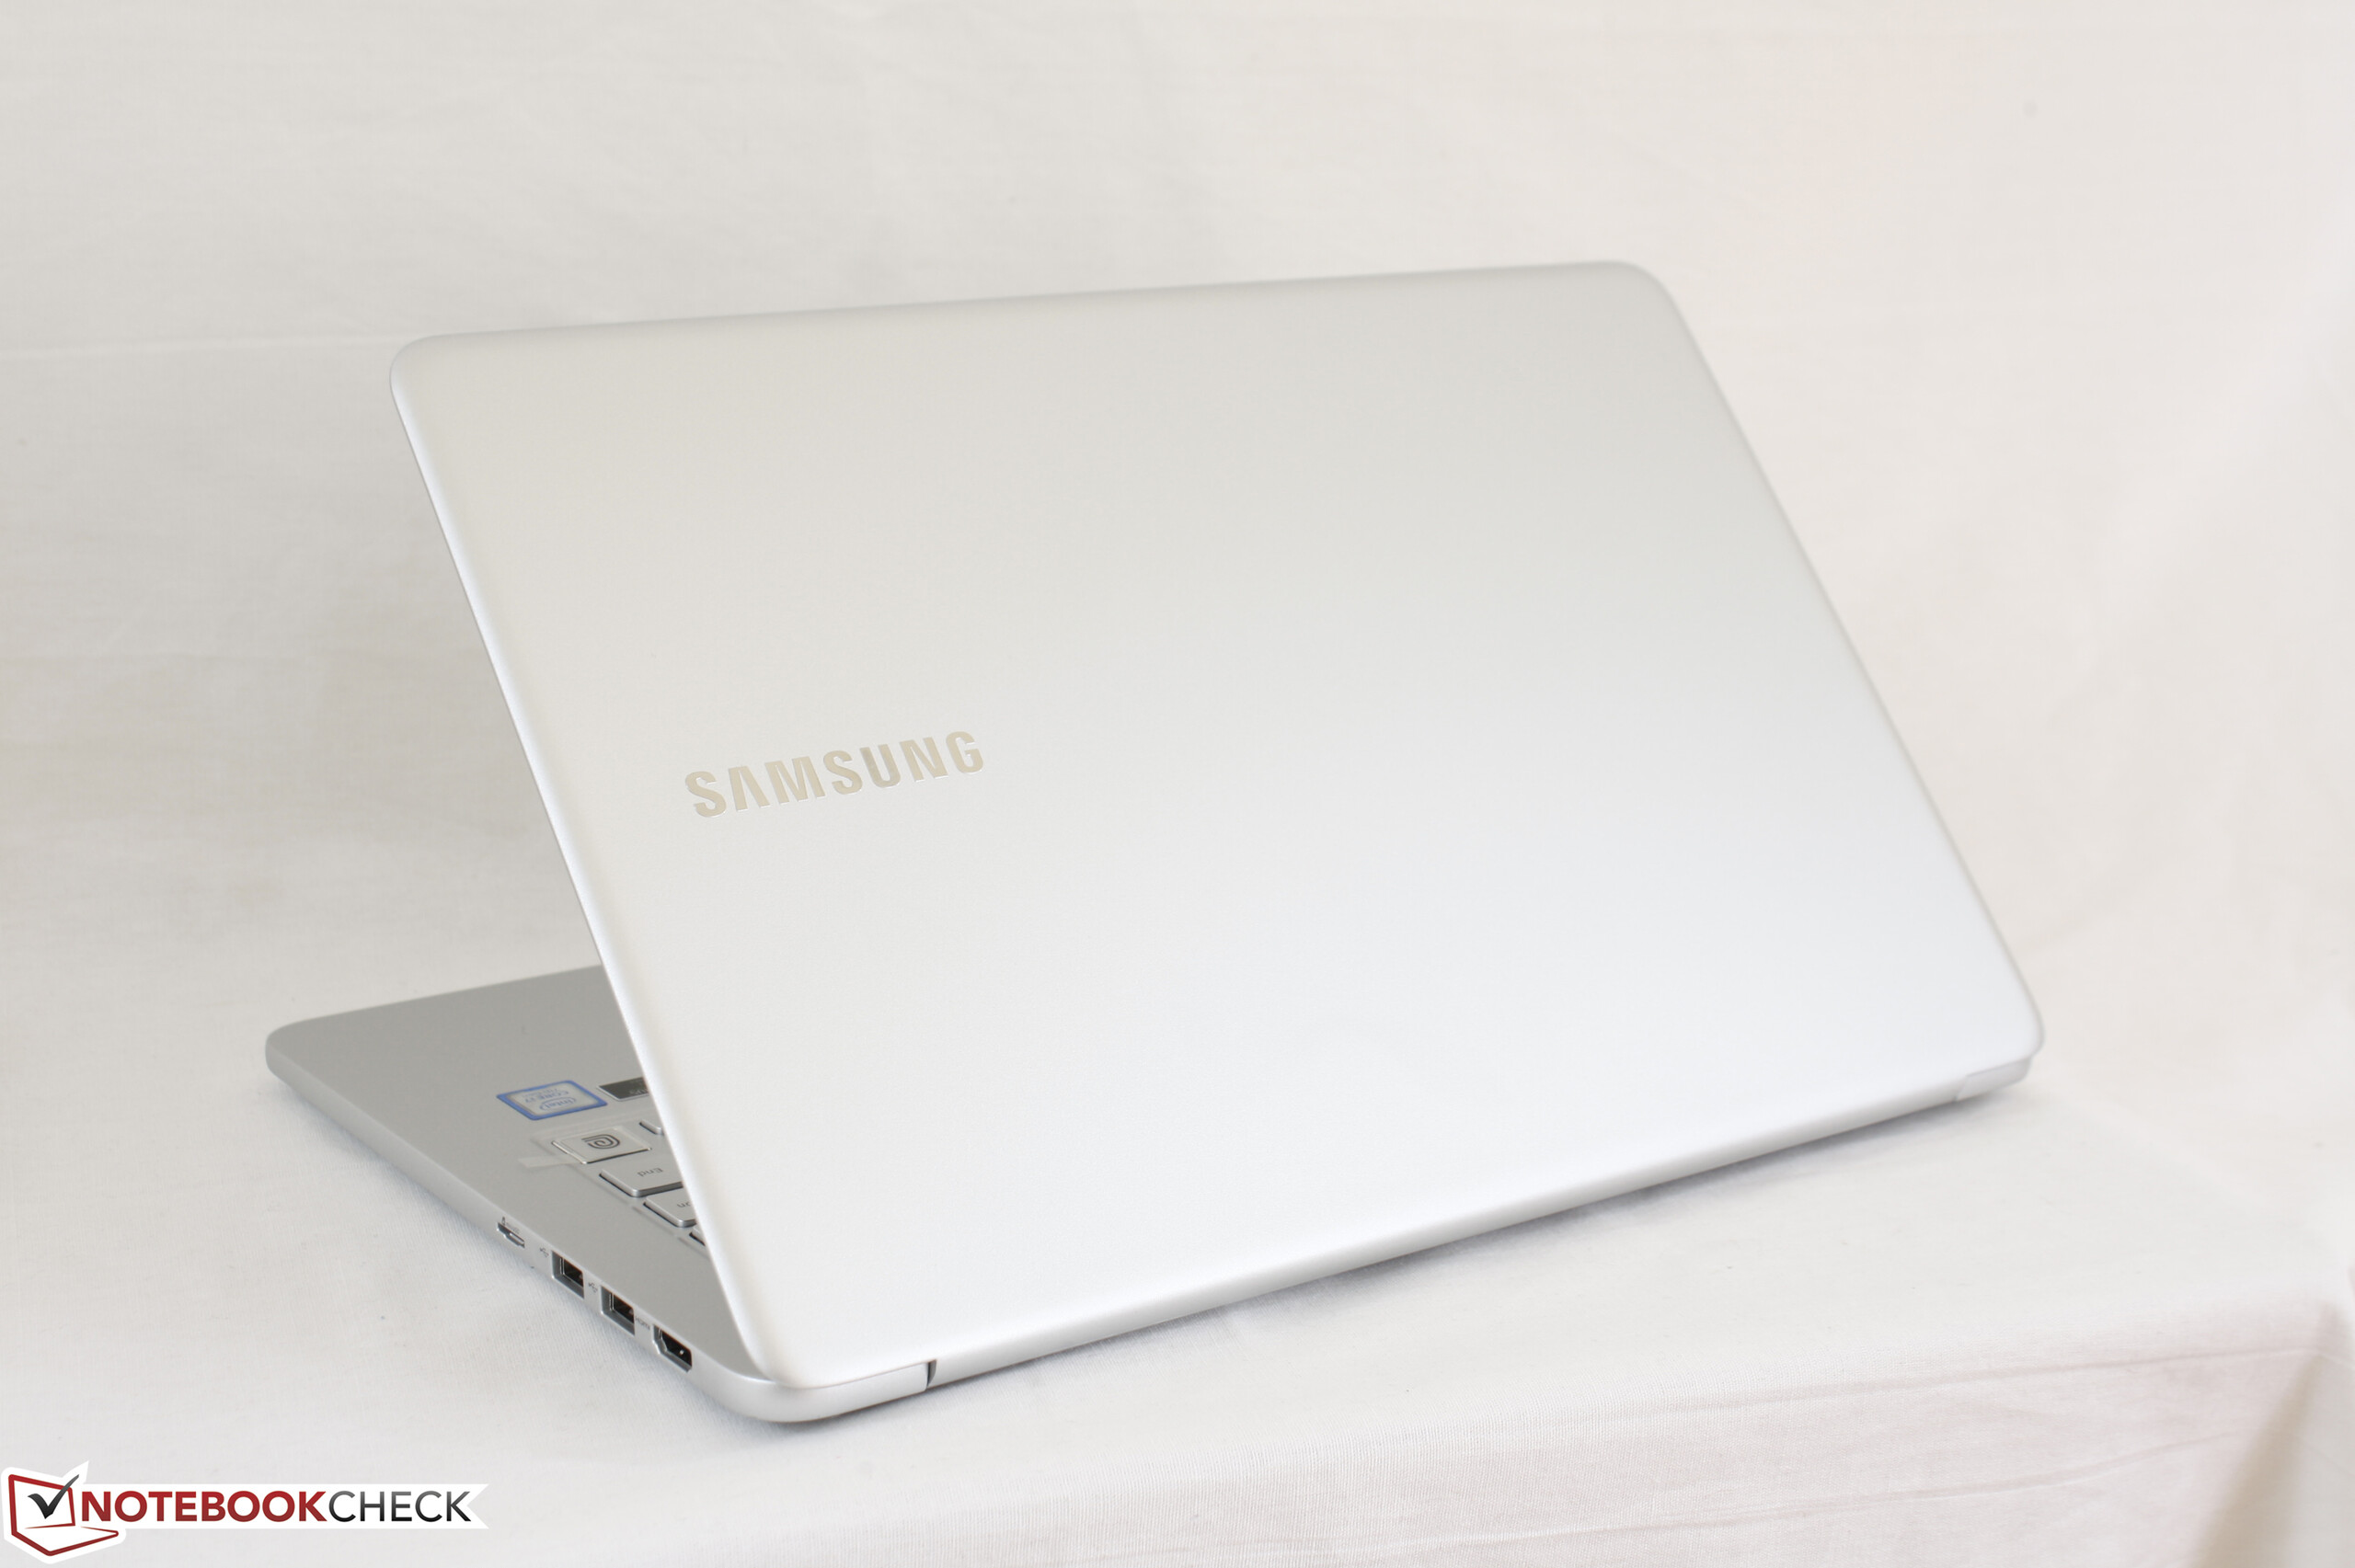
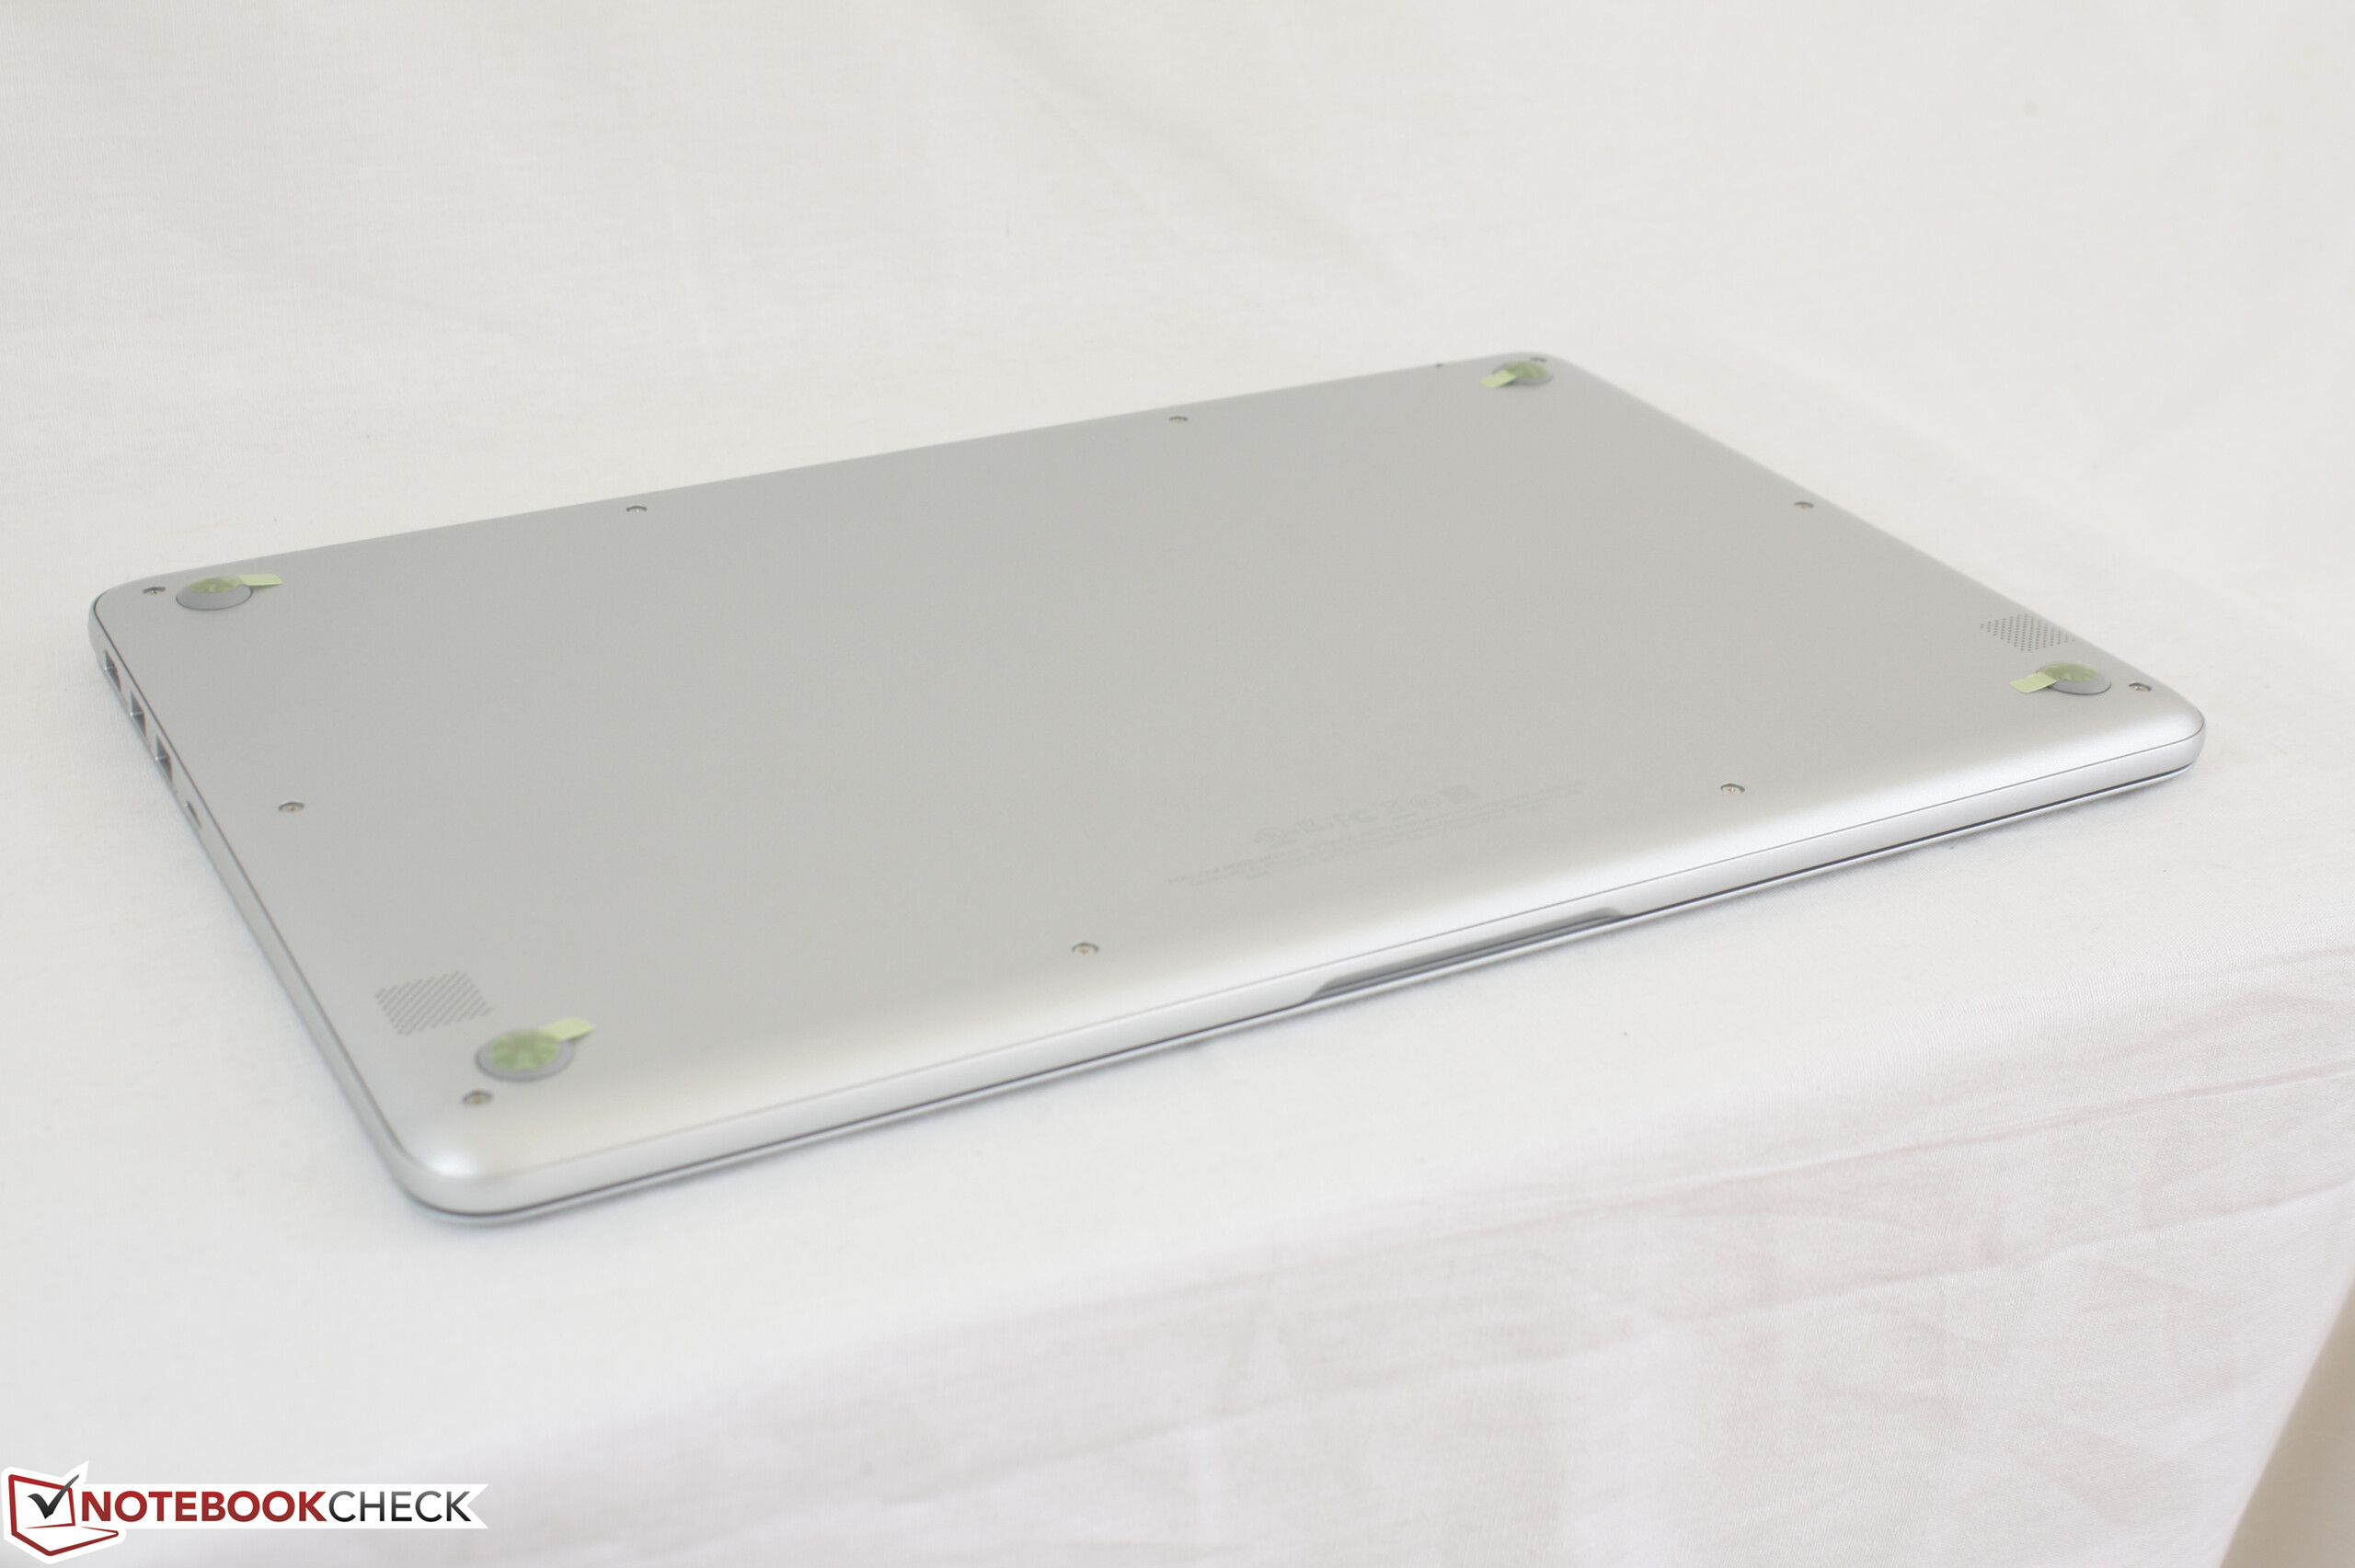
Por último, el sistema es bastante caro con $1400 para nuestra configuración particular. Los pros siguen superando a los contras, mientras que los dueños puedan evitar los golpes y arañazos a la frágil tapa.
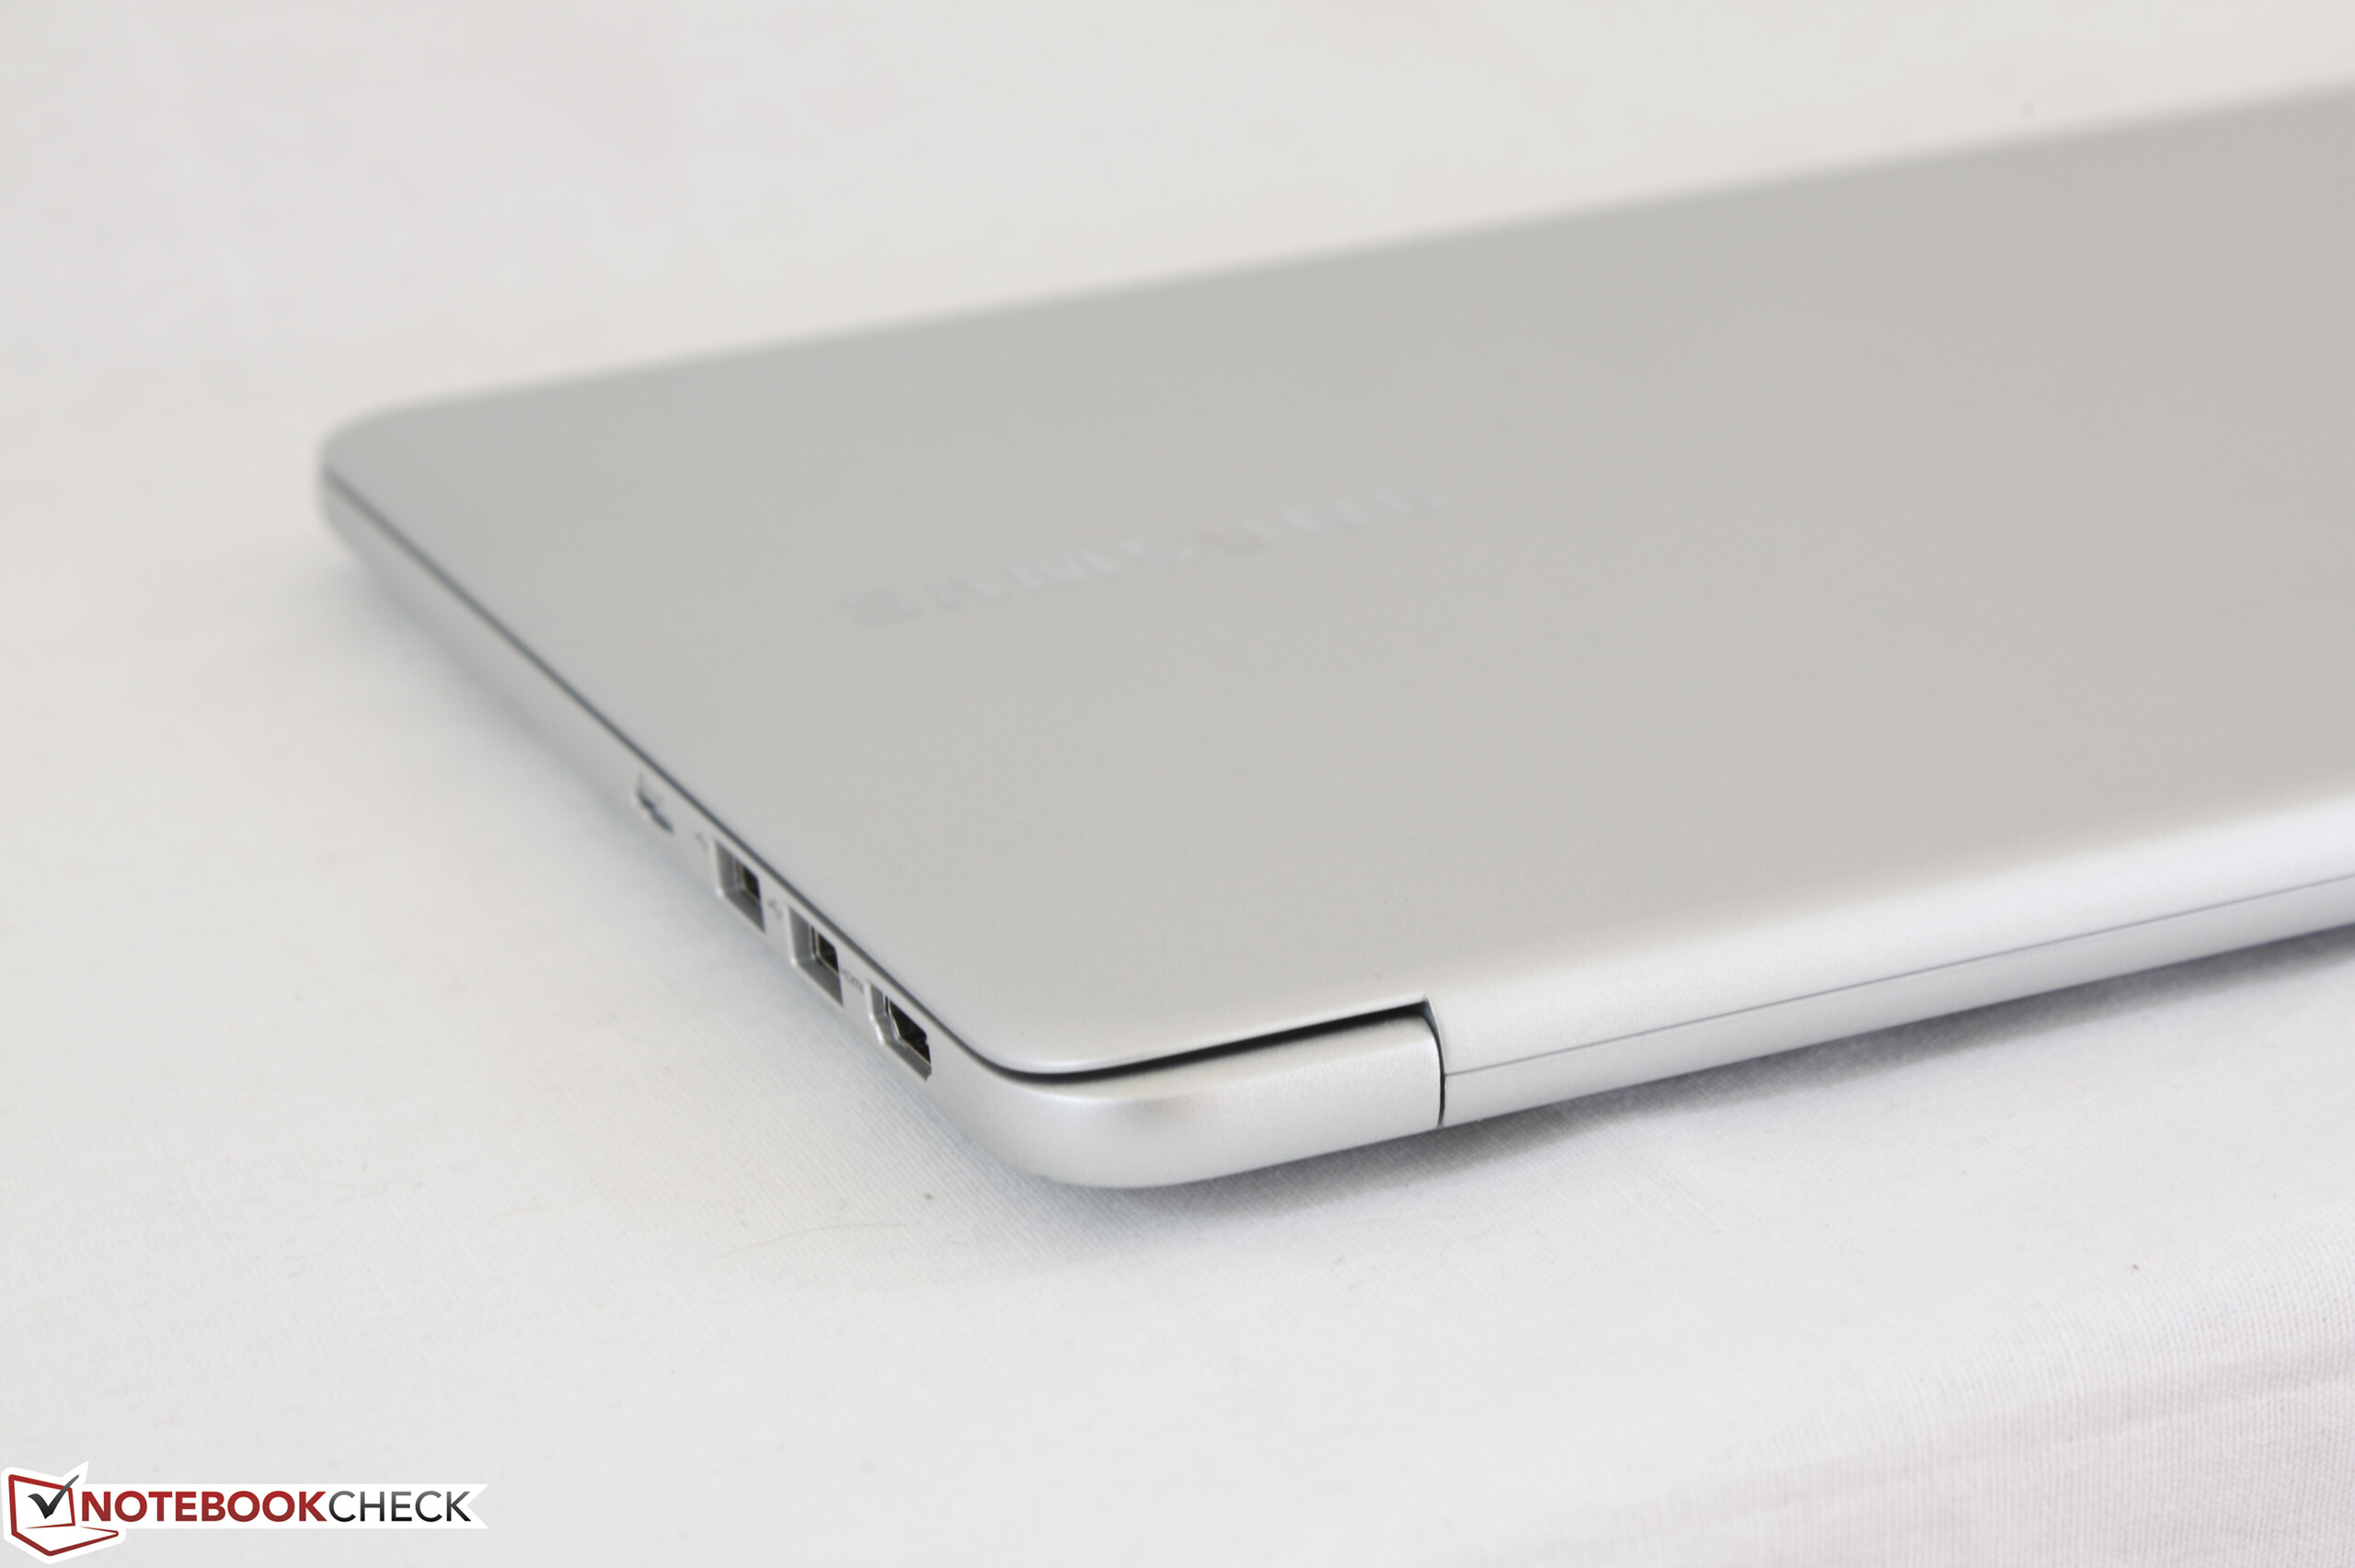
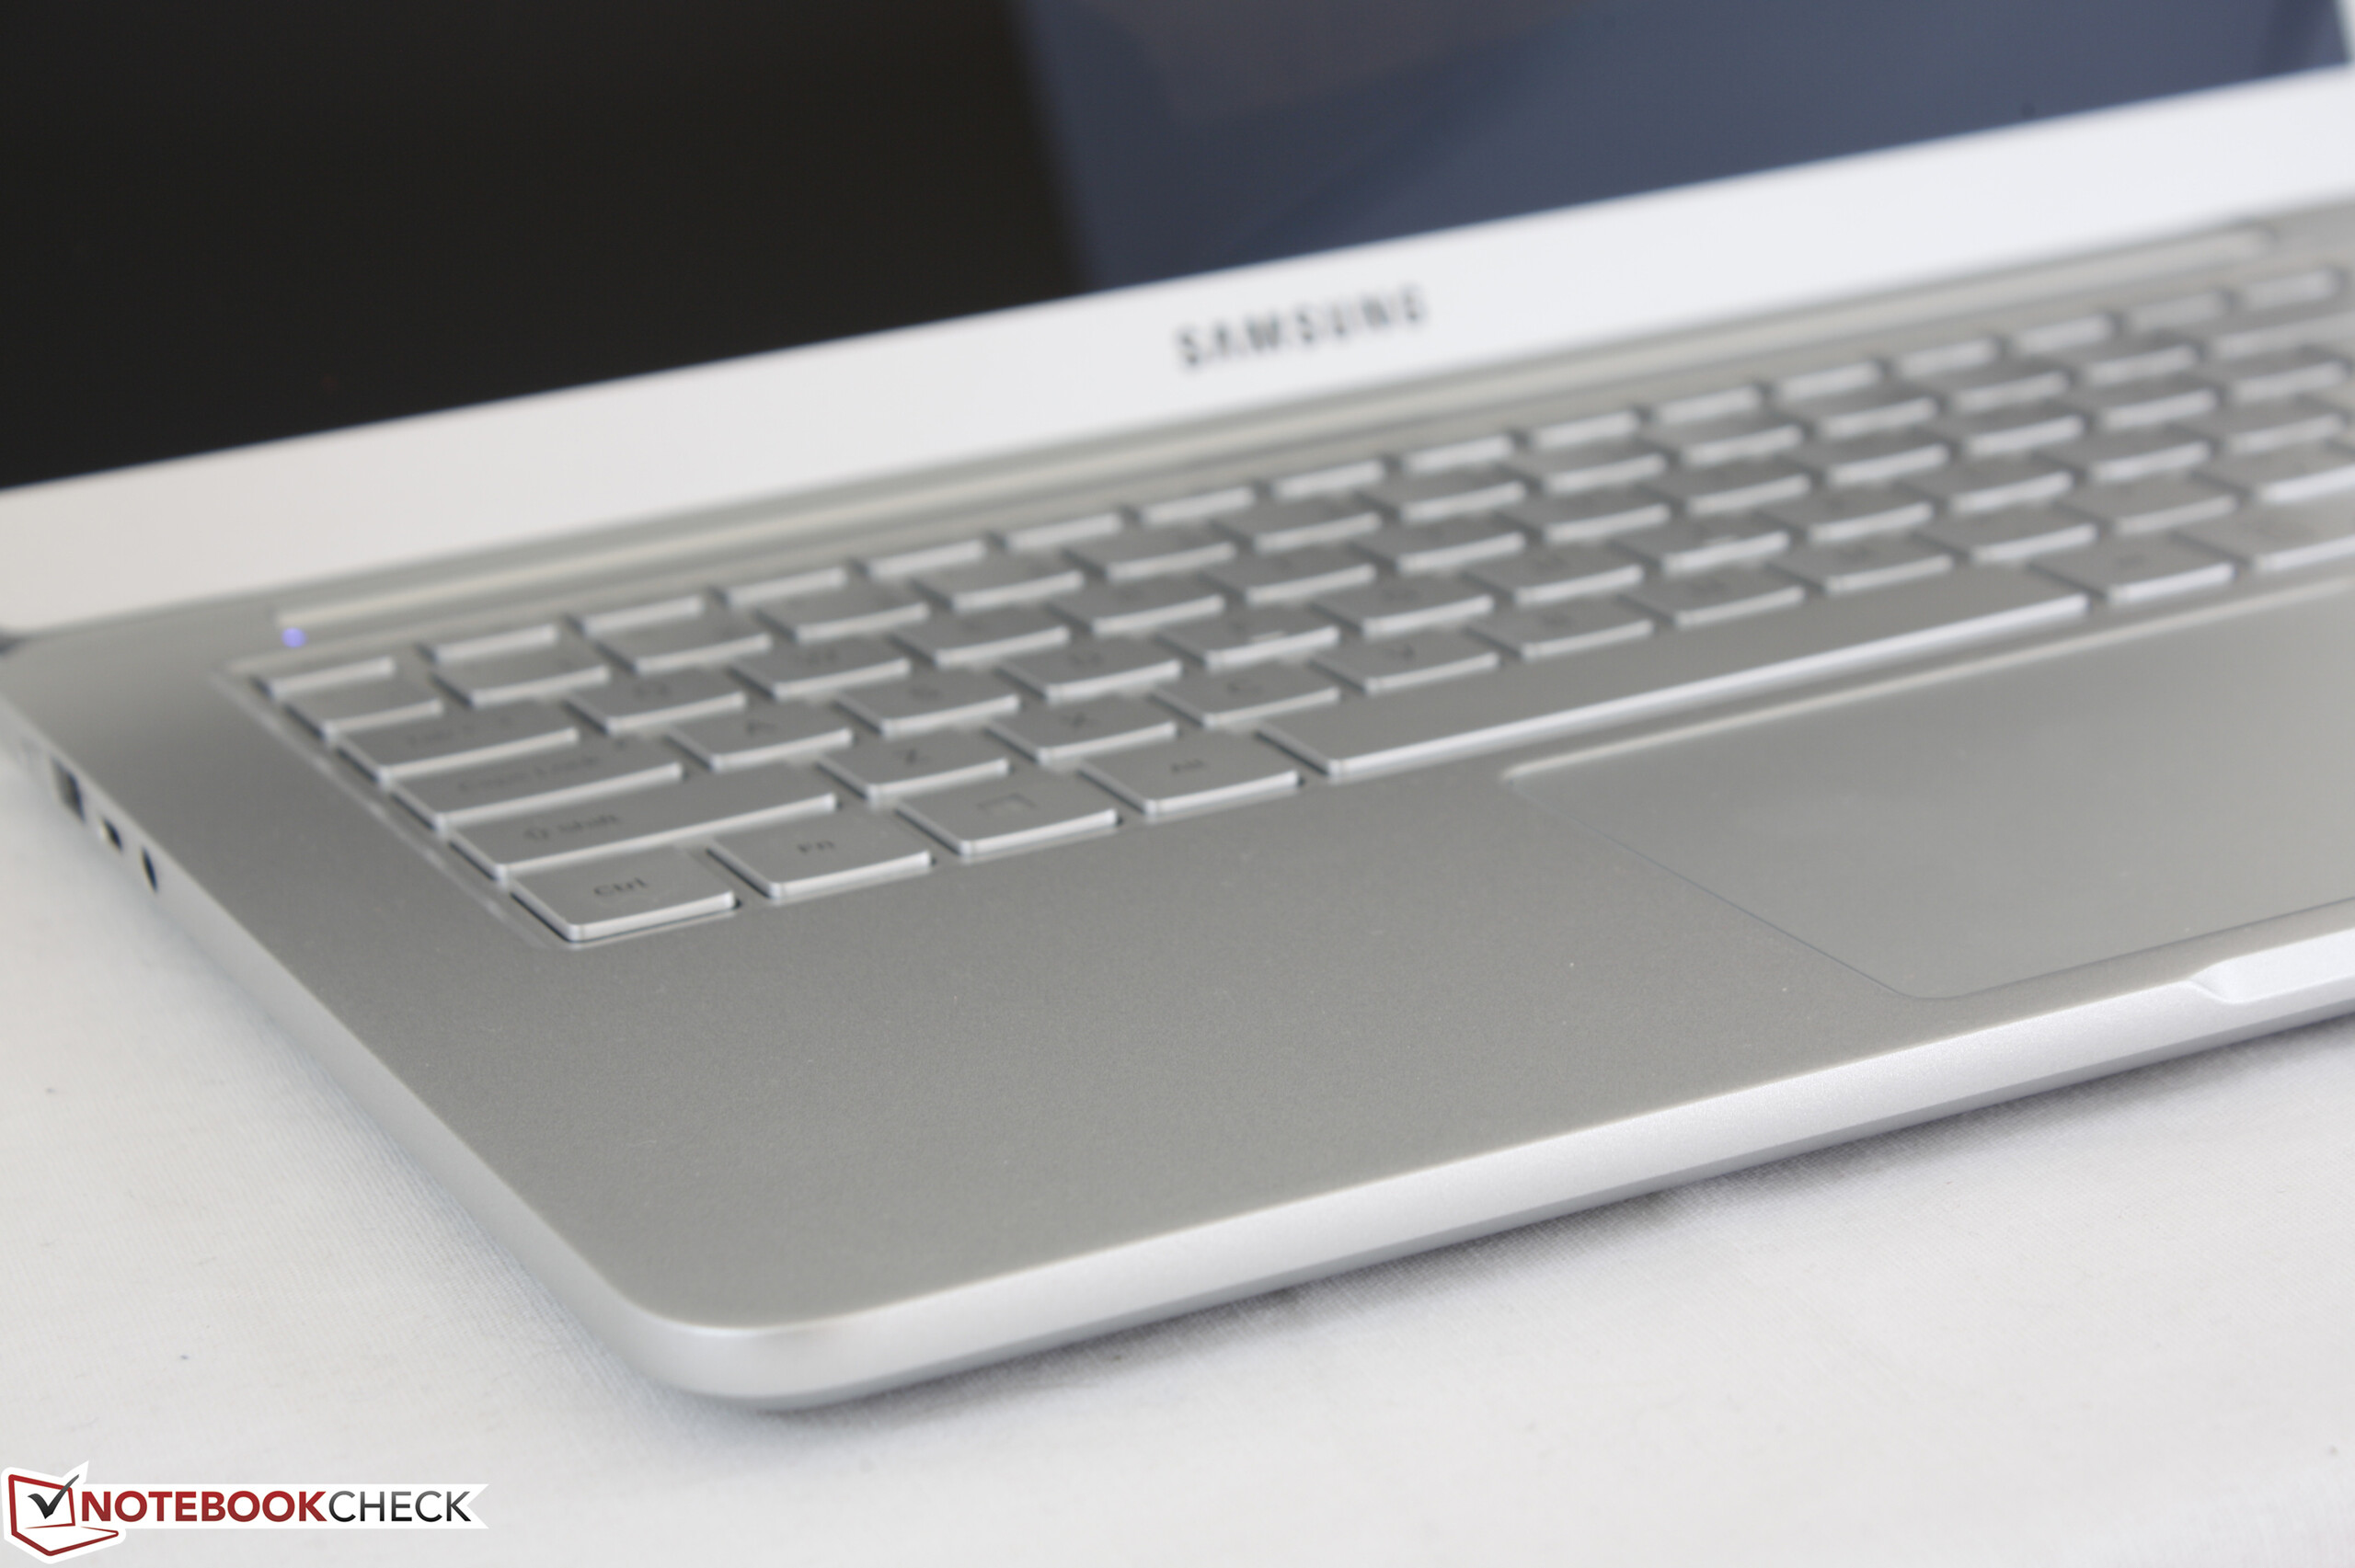
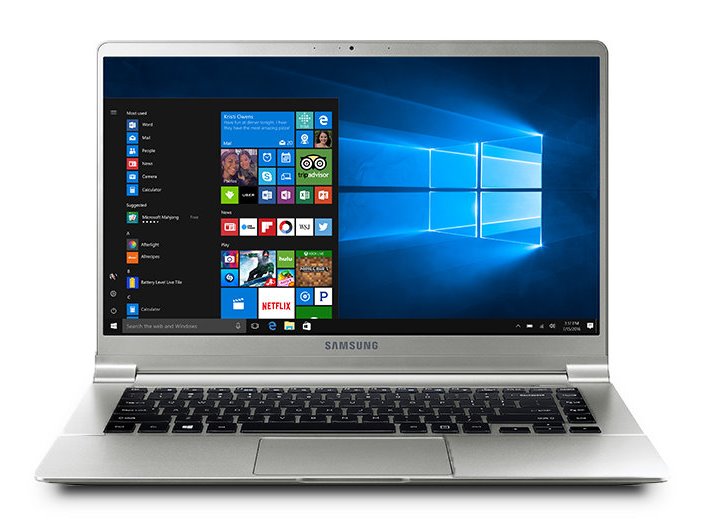
El nuevo Notebook 9 es único debido a su pantalla de 15.0" que ocupa el hueco entre los portátiles de 14" y 15.6". Es sorprendentemente portable y cómodo de usar especialmente para viajeros constantes, pero al chasis le habría venido bien algo más de refuerzo.
Ésta es una versión acortada del análisis original. Puedes leer el análisis completo en inglés aquí.
Samsung Notebook 9 NP900X5N-X01US
- 06/15/2017 v6 (old)
Allen Ngo
Price comparison
