Breve análisis del Lenovo ThinkPad X1 Carbon 20FB-005XUS


| |||||||||||||||||||||||||
iluminación: 89 %
Brillo con batería: 321.7 cd/m²
Contraste: 1094:1 (Negro: 0.294 cd/m²)
ΔE ColorChecker Calman: 3.96 | ∀{0.5-29.43 Ø4.72}
ΔE Greyscale Calman: 3.15 | ∀{0.09-98 Ø4.97}
82.7% sRGB (Argyll 1.6.3 3D)
53.8% AdobeRGB 1998 (Argyll 1.6.3 3D)
60.3% AdobeRGB 1998 (Argyll 3D)
83.1% sRGB (Argyll 3D)
58.9% Display P3 (Argyll 3D)
Gamma: 2.34
CCT: 7082 K
| Lenovo ThinkPad X1 Carbon 20FB-005XUS 14", 1920x1080 | Lenovo ThinkPad X1 Carbon 20FB003RGE 14", 2560x1440 | Lenovo ThinkPad T460s-20FA003GGE 14", 2560x1440 | Lenovo Thinkpad X1 Yoga 20FQ-000QUS 14", 2560x1440 | HP ProBook 440 G3 14", 1920x1080 | |
|---|---|---|---|---|---|
| Display | 13% | 17% | 16% | -31% | |
| Display P3 Coverage (%) | 58.9 | 66.7 13% | 68.7 17% | 68.1 16% | 39.6 -33% |
| sRGB Coverage (%) | 83.1 | 94.7 14% | 98.1 18% | 97.2 17% | 59.1 -29% |
| AdobeRGB 1998 Coverage (%) | 60.3 | 68.4 13% | 70.4 17% | 70.2 16% | 40.94 -32% |
| Response Times | 10% | 10% | 5% | 2% | |
| Response Time Grey 50% / Grey 80% * (ms) | 47.2 ? | 44 ? 7% | 35.6 ? 25% | 38 ? 19% | 46 ? 3% |
| Response Time Black / White * (ms) | 27.6 ? | 24 ? 13% | 29.2 ? -6% | 30.4 ? -10% | 27.6 ? -0% |
| PWM Frequency (Hz) | 220 ? | 220 ? | 219 ? | ||
| Screen | 2% | -15% | -27% | -62% | |
| Brightness middle (cd/m²) | 321.7 | 272 -15% | 257 -20% | 284.7 -12% | 246 -24% |
| Brightness (cd/m²) | 301 | 268 -11% | 248 -18% | 272 -10% | 215 -29% |
| Brightness Distribution (%) | 89 | 95 7% | 94 6% | 89 0% | 84 -6% |
| Black Level * (cd/m²) | 0.294 | 0.32 -9% | 0.26 12% | 0.383 -30% | 0.5 -70% |
| Contrast (:1) | 1094 | 850 -22% | 988 -10% | 743 -32% | 492 -55% |
| Colorchecker dE 2000 * | 3.96 | 2.61 34% | 4.59 -16% | 5.24 -32% | 8.6 -117% |
| Colorchecker dE 2000 max. * | 6.69 | 6.43 4% | 9.72 -45% | 11.22 -68% | |
| Greyscale dE 2000 * | 3.15 | 3.31 -5% | 6.38 -103% | 7.32 -132% | 9.36 -197% |
| Gamma | 2.34 94% | 2.35 94% | 2.51 88% | 2.22 99% | 2.39 92% |
| CCT | 7082 92% | 6360 102% | 6238 104% | 6277 104% | 11226 58% |
| Color Space (Percent of AdobeRGB 1998) (%) | 53.8 | 63 17% | 65 21% | 70.17 30% | 37.8 -30% |
| Color Space (Percent of sRGB) (%) | 82.7 | 95 15% | 98 19% | 94.68 14% | 59.1 -29% |
| Media total (Programa/Opciones) | 8% /
5% | 4% /
-6% | -2% /
-14% | -30% /
-46% |
* ... más pequeño es mejor
Tiempos de respuesta del display
| ↔ Tiempo de respuesta de Negro a Blanco | ||
|---|---|---|
| 27.6 ms ... subida ↗ y bajada ↘ combinada | ↗ 4.4 ms subida | 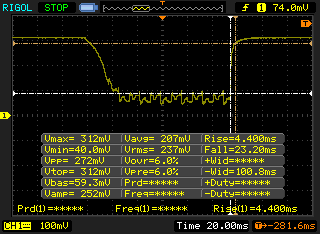 |
| ↘ 23.2 ms bajada | ||
| La pantalla mostró tiempos de respuesta relativamente lentos en nuestros tests pero podría ser demasiado lenta para los jugones. En comparación, todos los dispositivos de prueba van de ##min### (mínimo) a 240 (máximo) ms. » 70 % de todos los dispositivos son mejores. Eso quiere decir que el tiempo de respuesta es peor que la media (19.8 ms) de todos los dispositivos testados. | ||
| ↔ Tiempo de respuesta 50% Gris a 80% Gris | ||
| 47.2 ms ... subida ↗ y bajada ↘ combinada | ↗ 18.8 ms subida | 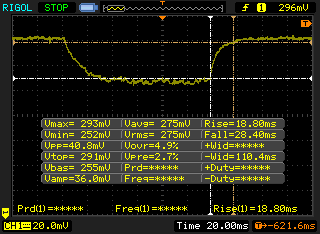 |
| ↘ 28.4 ms bajada | ||
| La pantalla mostró tiempos de respuesta lentos en nuestros tests y podría ser demasiado lenta para los jugones. En comparación, todos los dispositivos de prueba van de ##min### (mínimo) a 636 (máximo) ms. » 82 % de todos los dispositivos son mejores. Eso quiere decir que el tiempo de respuesta es peor que la media (31 ms) de todos los dispositivos testados. | ||
Parpadeo de Pantalla / PWM (Pulse-Width Modulation)
| Parpadeo de Pantalla / PWM no detectado | 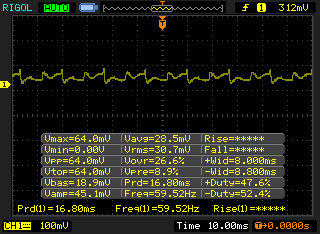 | ||
Comparación: 52 % de todos los dispositivos testados no usaron PWM para atenuar el display. Si se usó, medimos una media de 7753 (mínimo: 5 - máxmo: 343500) Hz. | |||
| Cinebench R15 | |
| CPU Single 64Bit (ordenar por valor) | |
| Lenovo ThinkPad X1 Carbon 20FB-005XUS | |
| Lenovo ThinkPad X1 Carbon 20FB003RGE | |
| Asus GL552VW-DK725T | |
| HP ProBook 430 G3 P4N86EA | |
| Lenovo IdeaPad Z40-59422614 | |
| Toshiba Tecra A50-C1510W10 | |
| CPU Multi 64Bit (ordenar por valor) | |
| Lenovo ThinkPad X1 Carbon 20FB-005XUS | |
| Lenovo ThinkPad X1 Carbon 20FB003RGE | |
| Asus GL552VW-DK725T | |
| HP ProBook 430 G3 P4N86EA | |
| Lenovo IdeaPad Z40-59422614 | |
| Toshiba Tecra A50-C1510W10 | |
| Cinebench R11.5 | |
| CPU Single 64Bit (ordenar por valor) | |
| Lenovo ThinkPad X1 Carbon 20FB-005XUS | |
| Lenovo ThinkPad X1 Carbon 20FB003RGE | |
| Asus GL552VW-DK725T | |
| HP ProBook 430 G3 P4N86EA | |
| Lenovo IdeaPad Z40-59422614 | |
| Toshiba Tecra A50-C1510W10 | |
| CPU Multi 64Bit (ordenar por valor) | |
| Lenovo ThinkPad X1 Carbon 20FB-005XUS | |
| Lenovo ThinkPad X1 Carbon 20FB003RGE | |
| Asus GL552VW-DK725T | |
| HP ProBook 430 G3 P4N86EA | |
| Lenovo IdeaPad Z40-59422614 | |
| Toshiba Tecra A50-C1510W10 | |
| Cinebench R10 | |
| Rendering Multiple CPUs 32Bit (ordenar por valor) | |
| Lenovo ThinkPad X1 Carbon 20FB-005XUS | |
| Lenovo ThinkPad X1 Carbon 20FB003RGE | |
| Asus GL552VW-DK725T | |
| HP ProBook 430 G3 P4N86EA | |
| Lenovo IdeaPad Z40-59422614 | |
| Toshiba Tecra A50-C1510W10 | |
| Rendering Single 32Bit (ordenar por valor) | |
| Lenovo ThinkPad X1 Carbon 20FB-005XUS | |
| Lenovo ThinkPad X1 Carbon 20FB003RGE | |
| Asus GL552VW-DK725T | |
| HP ProBook 430 G3 P4N86EA | |
| Lenovo IdeaPad Z40-59422614 | |
| Toshiba Tecra A50-C1510W10 | |
| wPrime 2.10 - 1024m (ordenar por valor) | |
| Lenovo ThinkPad X1 Carbon 20FB-005XUS | |
| Asus GL552VW-DK725T | |
| HP ProBook 430 G3 P4N86EA | |
| Lenovo IdeaPad Z40-59422614 | |
| Toshiba Tecra A50-C1510W10 | |
| Super Pi Mod 1.5 XS 32M - 32M (ordenar por valor) | |
| Lenovo ThinkPad X1 Carbon 20FB-005XUS | |
| Lenovo ThinkPad X1 Carbon 20FB003RGE | |
| Asus GL552VW-DK725T | |
| HP ProBook 430 G3 P4N86EA | |
| Lenovo IdeaPad Z40-59422614 | |
| Toshiba Tecra A50-C1510W10 | |
| 3DMark 11 - 1280x720 Performance Physics (ordenar por valor) | |
| Lenovo ThinkPad X1 Carbon 20FB-005XUS | |
| Lenovo ThinkPad X1 Carbon 20FB003RGE | |
| Asus GL552VW-DK725T | |
| HP ProBook 430 G3 P4N86EA | |
| Lenovo IdeaPad Z40-59422614 | |
| Toshiba Tecra A50-C1510W10 | |
* ... más pequeño es mejor
| PCMark 8 Home Score Accelerated v2 | 3237 puntos | |
| PCMark 8 Creative Score Accelerated v2 | 3989 puntos | |
| PCMark 8 Work Score Accelerated v2 | 3944 puntos | |
ayuda | ||
| Lenovo ThinkPad X1 Carbon 20FB-005XUS HD Graphics 520, 6300U, Samsung SM951 MZVPV256 m.2 | HP EliteBook 840 G3 T8X41EA HD Graphics 520, 6600U, Samsung SSD 850 EVO 500GB | Lenovo ThinkPad T460s-20FA003GGE HD Graphics 520, 6600U, Samsung SSD SM951a 512GB M.2 PCIe 3.0 x4 NVMe (MZVKV512) | Lenovo Thinkpad X1 Yoga 20FQ-000QUS HD Graphics 520, 6500U, Samsung SSD PM871 MZNLN512HCJH | Dell Latitude 14 7000 Series E7470 HD Graphics 520, 6600U, Samsung SSD PM851 M.2 2280 256GB | |
|---|---|---|---|---|---|
| AS SSD | -31% | 20% | -45% | -57% | |
| Copy Game MB/s (MB/s) | 598 | 791 32% | 236.4 -60% | ||
| Copy Program MB/s (MB/s) | 354.9 | 421.9 19% | 196.5 -45% | ||
| Copy ISO MB/s (MB/s) | 709 | 1135 60% | 258.4 -64% | ||
| Score Total (Points) | 1976 | 1125 -43% | 2439 23% | 1068 -46% | 913 -54% |
| Score Write (Points) | 552 | 436 -21% | 621 13% | 382 -31% | 283 -49% |
| Score Read (Points) | 960 | 447 -53% | 1218 27% | 449 -53% | 417 -57% |
| Access Time Write * (ms) | 0.036 | 0.034 6% | 0.033 8% | 0.046 -28% | 0.04 -11% |
| Access Time Read * (ms) | 0.043 | 0.053 -23% | 0.041 5% | 0.058 -35% | 0.113 -163% |
| 4K-64 Write (MB/s) | 338.3 | 290.8 -14% | 366 8% | 261.9 -23% | 170 -50% |
| 4K-64 Read (MB/s) | 731 | 355.9 -51% | 968 32% | 369.1 -50% | 336.1 -54% |
| 4K Write (MB/s) | 103.7 | 98.6 -5% | 114.4 10% | 75.7 -27% | 85.1 -18% |
| 4K Read (MB/s) | 43.72 | 41.29 -6% | 45.41 4% | 30.35 -31% | 30.91 -29% |
| Seq Write (MB/s) | 1099 | 464 -58% | 1407 28% | 447.5 -59% | 283.7 -74% |
| Seq Read (MB/s) | 1851 | 498.6 -73% | 2039 10% | 490.1 -74% | 495.5 -73% |
* ... más pequeño es mejor

| 3DMark 11 Performance | 1396 puntos | |
| 3DMark Ice Storm Standard Score | 57713 puntos | |
| 3DMark Cloud Gate Standard Score | 5659 puntos | |
| 3DMark Fire Strike Score | 772 puntos | |
ayuda | ||
| bajo | medio | alto | ultra | |
|---|---|---|---|---|
| BioShock Infinite (2013) | 47.6 | 27.1 | 24.8 | 6.6 |
| Lenovo ThinkPad X1 Carbon 20FB-005XUS HD Graphics 520, 6300U, Samsung SM951 MZVPV256 m.2 | Lenovo ThinkPad X1 Carbon 20FB003RGE HD Graphics 520, 6500U, Samsung SSD PM871 MZNLN256HCHP | HP EliteBook 840 G3 T9X59ET#ABD HD Graphics 520, 6500U, Samsung SSD PM851 256 GB MZNTE256HMHP | Lenovo ThinkPad T460s-20FA003GGE HD Graphics 520, 6600U, Samsung SSD SM951a 512GB M.2 PCIe 3.0 x4 NVMe (MZVKV512) | Lenovo Thinkpad X1 Yoga 20FQ-000QUS HD Graphics 520, 6500U, Samsung SSD PM871 MZNLN512HCJH | Dell Latitude 14 7000 Series E7470 HD Graphics 520, 6600U, Samsung SSD PM851 M.2 2280 256GB | |
|---|---|---|---|---|---|---|
| Noise | -2% | -9% | -1% | 0% | -2% | |
| apagado / medio ambiente * (dB) | 28.8 | 29.1 -1% | 31.2 -8% | 29.2 -1% | 28.8 -0% | 31.2 -8% |
| Idle Minimum * (dB) | 28.8 | 29.1 -1% | 31.2 -8% | 29.2 -1% | 28.8 -0% | 31.2 -8% |
| Idle Average * (dB) | 28.9 | 29.1 -1% | 32.1 -11% | 29.2 -1% | 28.8 -0% | 31.2 -8% |
| Idle Maximum * (dB) | 28.9 | 29.1 -1% | 33.1 -15% | 29.2 -1% | 28.8 -0% | 31.2 -8% |
| Load Average * (dB) | 35 | 35.6 -2% | 36.2 -3% | 33.7 4% | 35.2 -1% | 31.9 9% |
| Load Maximum * (dB) | 35.8 | 38.1 -6% | 37.8 -6% | 38.5 -8% | 35.2 2% | 31.9 11% |
* ... más pequeño es mejor
Ruido
| Ocioso |
| 28.8 / 28.9 / 28.9 dB(A) |
| Carga |
| 35 / 35.8 dB(A) |
 | ||
30 dB silencioso 40 dB(A) audible 50 dB(A) ruidosamente alto |
||
min: | ||
(±) La temperatura máxima en la parte superior es de 40 °C / 104 F, frente a la media de 34.3 °C / 94 F, que oscila entre 21.2 y 62.5 °C para la clase Office.
(±) El fondo se calienta hasta un máximo de 42.8 °C / 109 F, frente a la media de 36.8 °C / 98 F
(+) En reposo, la temperatura media de la parte superior es de 24.2 °C / 76# F, frente a la media del dispositivo de 29.5 °C / 85 F.
(+) El reposamanos y el panel táctil están a una temperatura inferior a la de la piel, con un máximo de 24.6 °C / 76.3 F y, por tanto, son fríos al tacto.
(+) La temperatura media de la zona del reposamanos de dispositivos similares fue de 27.5 °C / 81.5 F (+2.9 °C / 5.2 F).
| Lenovo ThinkPad X1 Carbon 20FB-005XUS HD Graphics 520, 6300U, Samsung SM951 MZVPV256 m.2 | Lenovo ThinkPad X1 Carbon 20FB003RGE HD Graphics 520, 6500U, Samsung SSD PM871 MZNLN256HCHP | HP EliteBook 840 G3 T9X59ET#ABD HD Graphics 520, 6500U, Samsung SSD PM851 256 GB MZNTE256HMHP | Lenovo ThinkPad T460s-20FA003GGE HD Graphics 520, 6600U, Samsung SSD SM951a 512GB M.2 PCIe 3.0 x4 NVMe (MZVKV512) | Lenovo Thinkpad X1 Yoga 20FQ-000QUS HD Graphics 520, 6500U, Samsung SSD PM871 MZNLN512HCJH | Dell Latitude 14 7000 Series E7470 HD Graphics 520, 6600U, Samsung SSD PM851 M.2 2280 256GB | |
|---|---|---|---|---|---|---|
| Power Consumption | 4% | 15% | -2% | -19% | -2% | |
| Idle Minimum * (Watt) | 7.6 | 3.8 50% | 3.8 50% | 3.8 50% | 6.82 10% | 5.1 33% |
| Idle Average * (Watt) | 9 | 7.1 21% | 6.3 30% | 7.1 21% | 8.21 9% | 8.5 6% |
| Idle Maximum * (Watt) | 9.6 | 7.7 20% | 6.8 29% | 7.8 19% | 17.55 -83% | 10.1 -5% |
| Load Average * (Watt) | 24.5 | 30.2 -23% | 34.4 -40% | 36.3 -48% | 28.81 -18% | 35.2 -44% |
| Load Maximum * (Watt) | 30.3 | 44.7 -48% | 28.3 7% | 46 -52% | 34.07 -12% | 31 -2% |
* ... más pequeño es mejor
| Off / Standby | |
| Ocioso | |
| Carga |
|
Clave:
min: | |
| Lenovo ThinkPad X1 Carbon 20FB-005XUS 52 Wh | Lenovo ThinkPad X1 Carbon 20FB003RGE 52 Wh | HP EliteBook 840 G3 T9X59ET#ABD 46 Wh | Lenovo ThinkPad T460s-20FA003GGE 49 Wh | Lenovo Thinkpad X1 Yoga 20FQ-000QUS 52 Wh | |
|---|---|---|---|---|---|
| Duración de Batería | 5% | 19% | -20% | 0% | |
| Reader / Idle (h) | 12.9 | 15.7 22% | 17 32% | 13.9 8% | 15.4 19% |
| WiFi v1.3 (h) | 6.9 | 7.2 4% | 7.6 10% | 5.7 -17% | 5.9 -14% |
| Load (h) | 2.1 | 1.9 -10% | 2.4 14% | 1 -52% | 2 -5% |
Pro
Contra
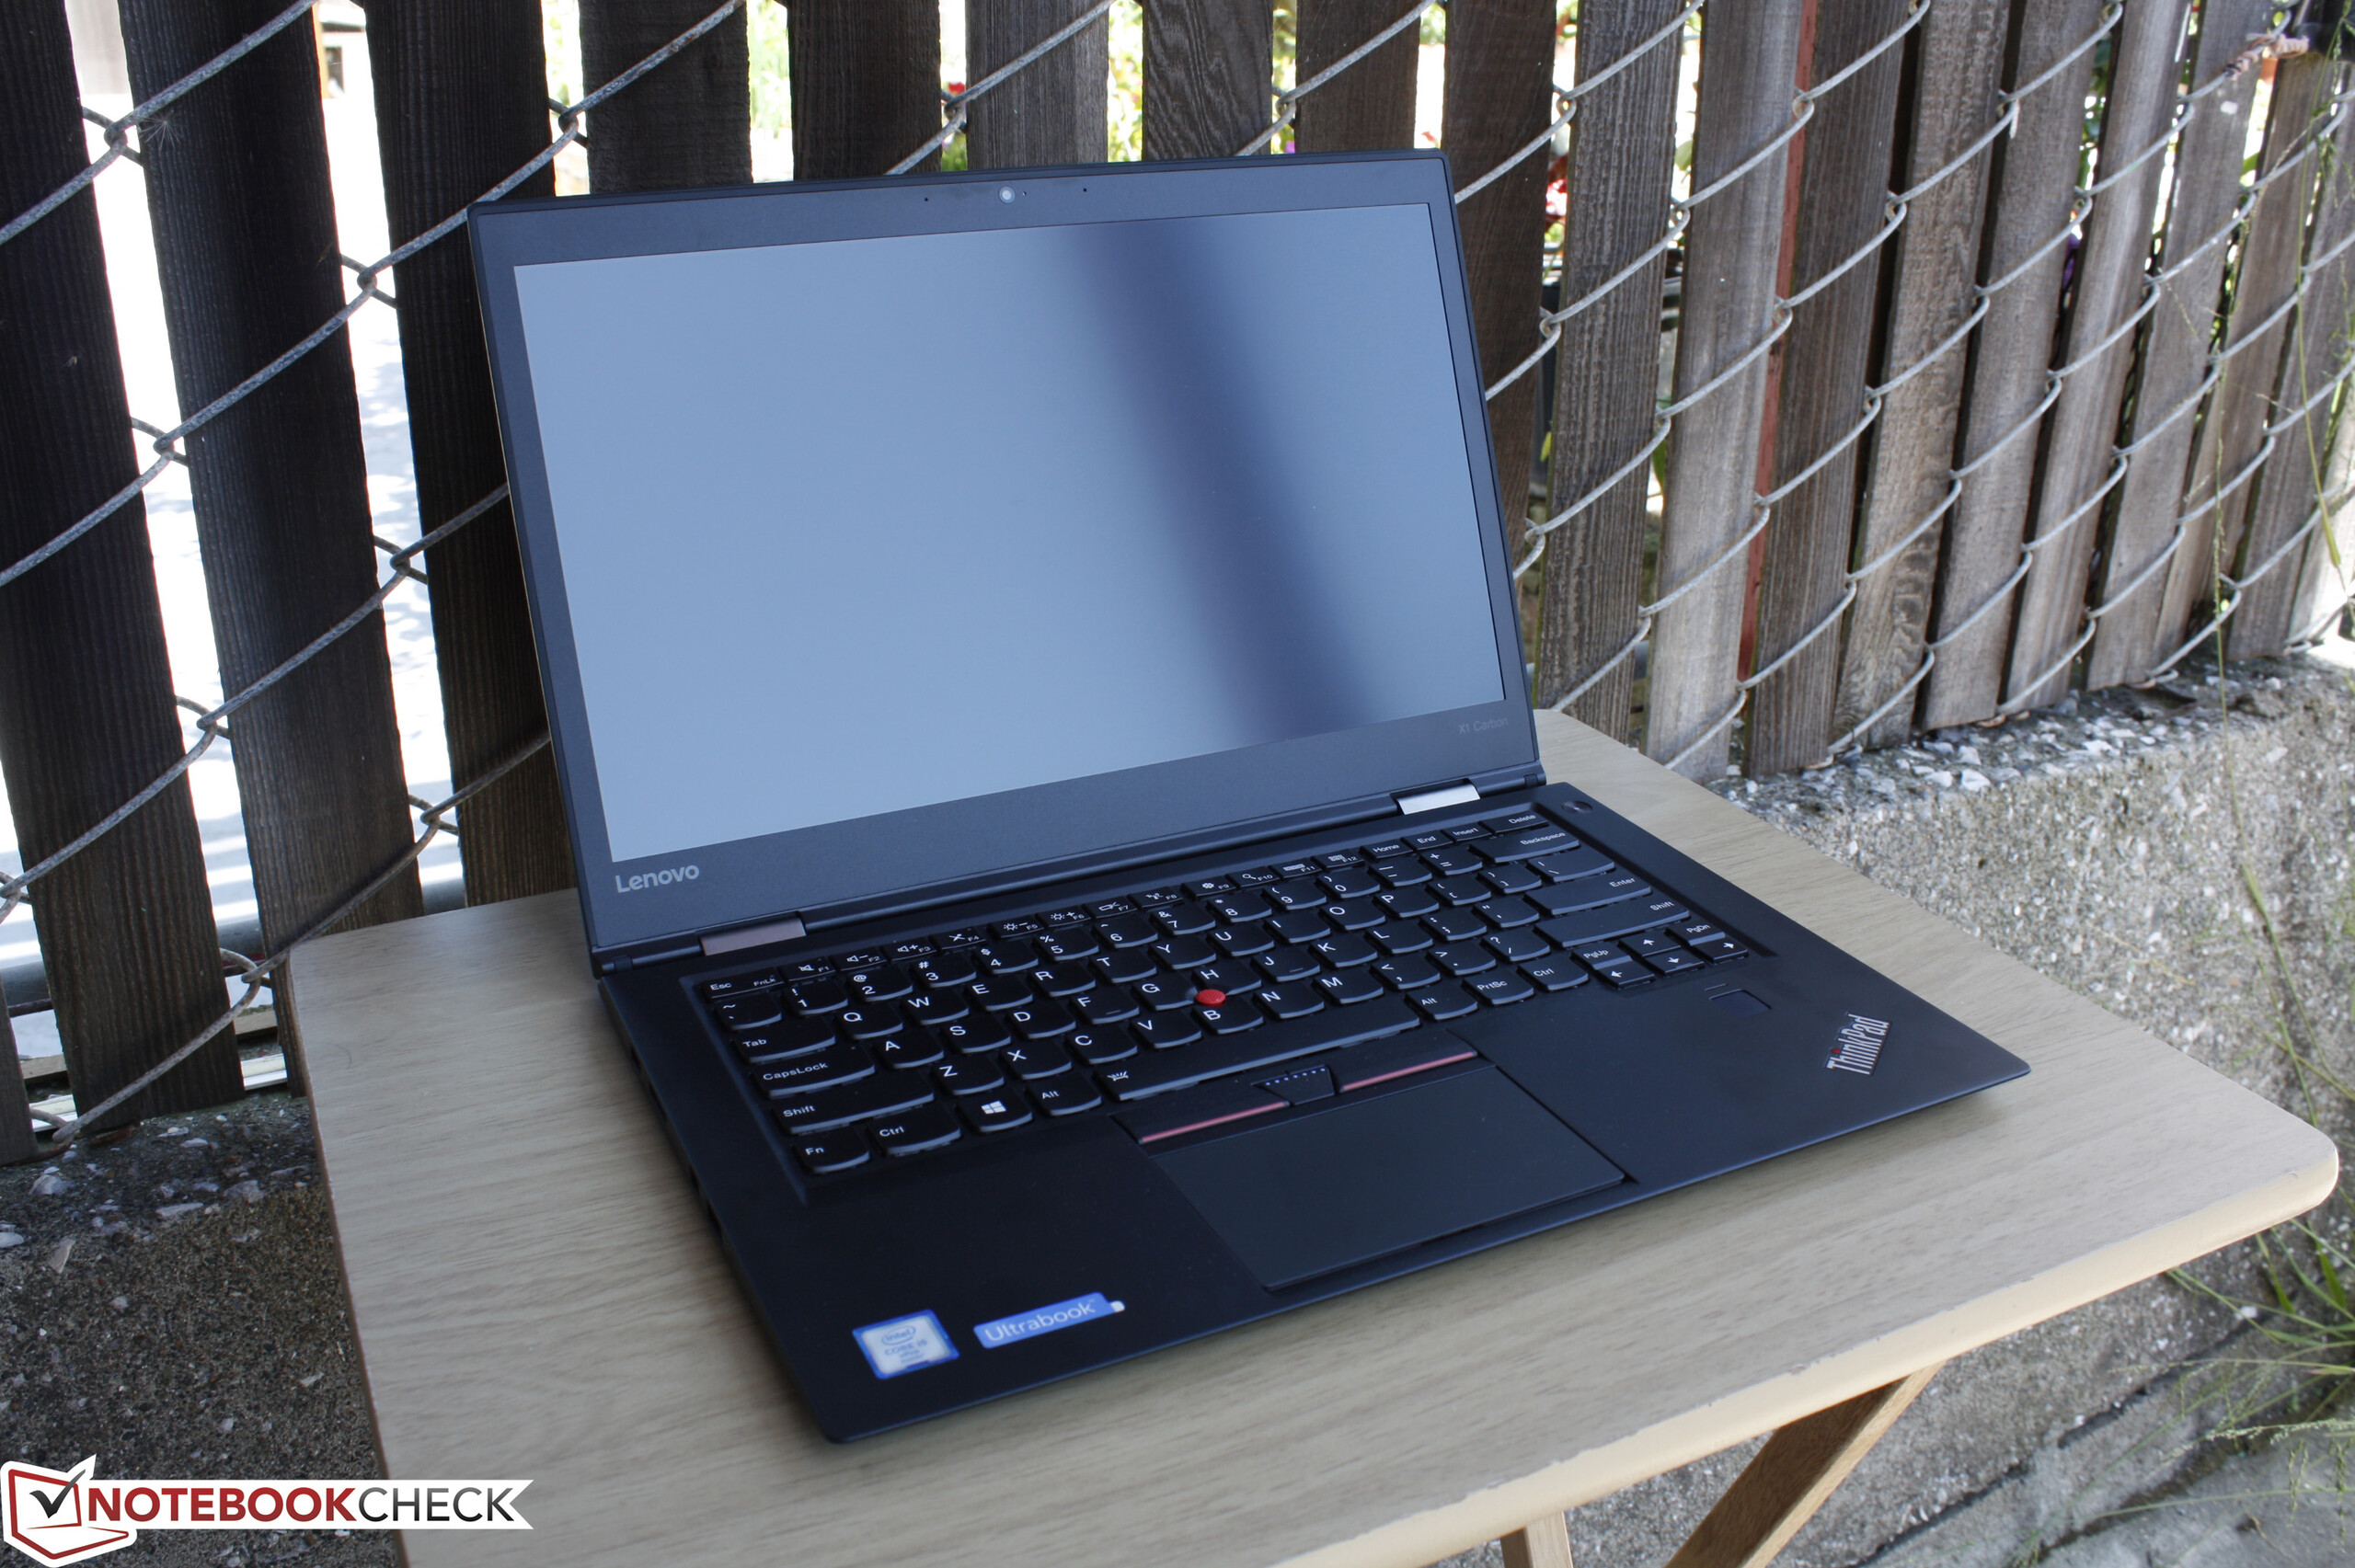
Con potentes alternativas disponibles como el MacBook Air o el XPS 13, Lenovo ha tenido mucha presión para mantener fuerte su serie ThinkPad X1 Carbon. El último modelo parece mejor que nunca como ya detallamos en nuestro anterior análisis de la unidad y sus opciones WWAN seguramente atraerán a muchos compradores interesados.
¿Ofrece la configuración Core i5 FHD batería de más aguante y menos temperatura que la configuración Core i7 WQHD? El aguante de la batería no es significativamente diferente del modelo más caro y mientras que las temperaturas superficiales son algo inferiores, como mucho será un par de grados. Estas diferencias menores entre sendos modelos implican que los usuarios pueden optar por el modelo más caro por su rendimiento más rápido, colores más precisos, y display más denso sin sacrificar mucho en el aguante de batería.
El rendimiento del Core i5 es inferior al esperado, en particular en las operaciones monohilo. Quizá la diferencia más notable sea que la configuración FHD no usa PWM para controlar el brillo a diferencia de la configuración WQHD. Así, los usuarios sensibles al parpadeo de pantalla pueden preferir el modelo FHD en vez de un procesador más rápidos.
Ésta es una versión acortada del análisis original. Puedes leer el análisis completo en inglés aquí.
Lenovo ThinkPad X1 Carbon 20FB-005XUS
- 05/13/2016 v5.1 (old)
Allen Ngo
Price comparison
