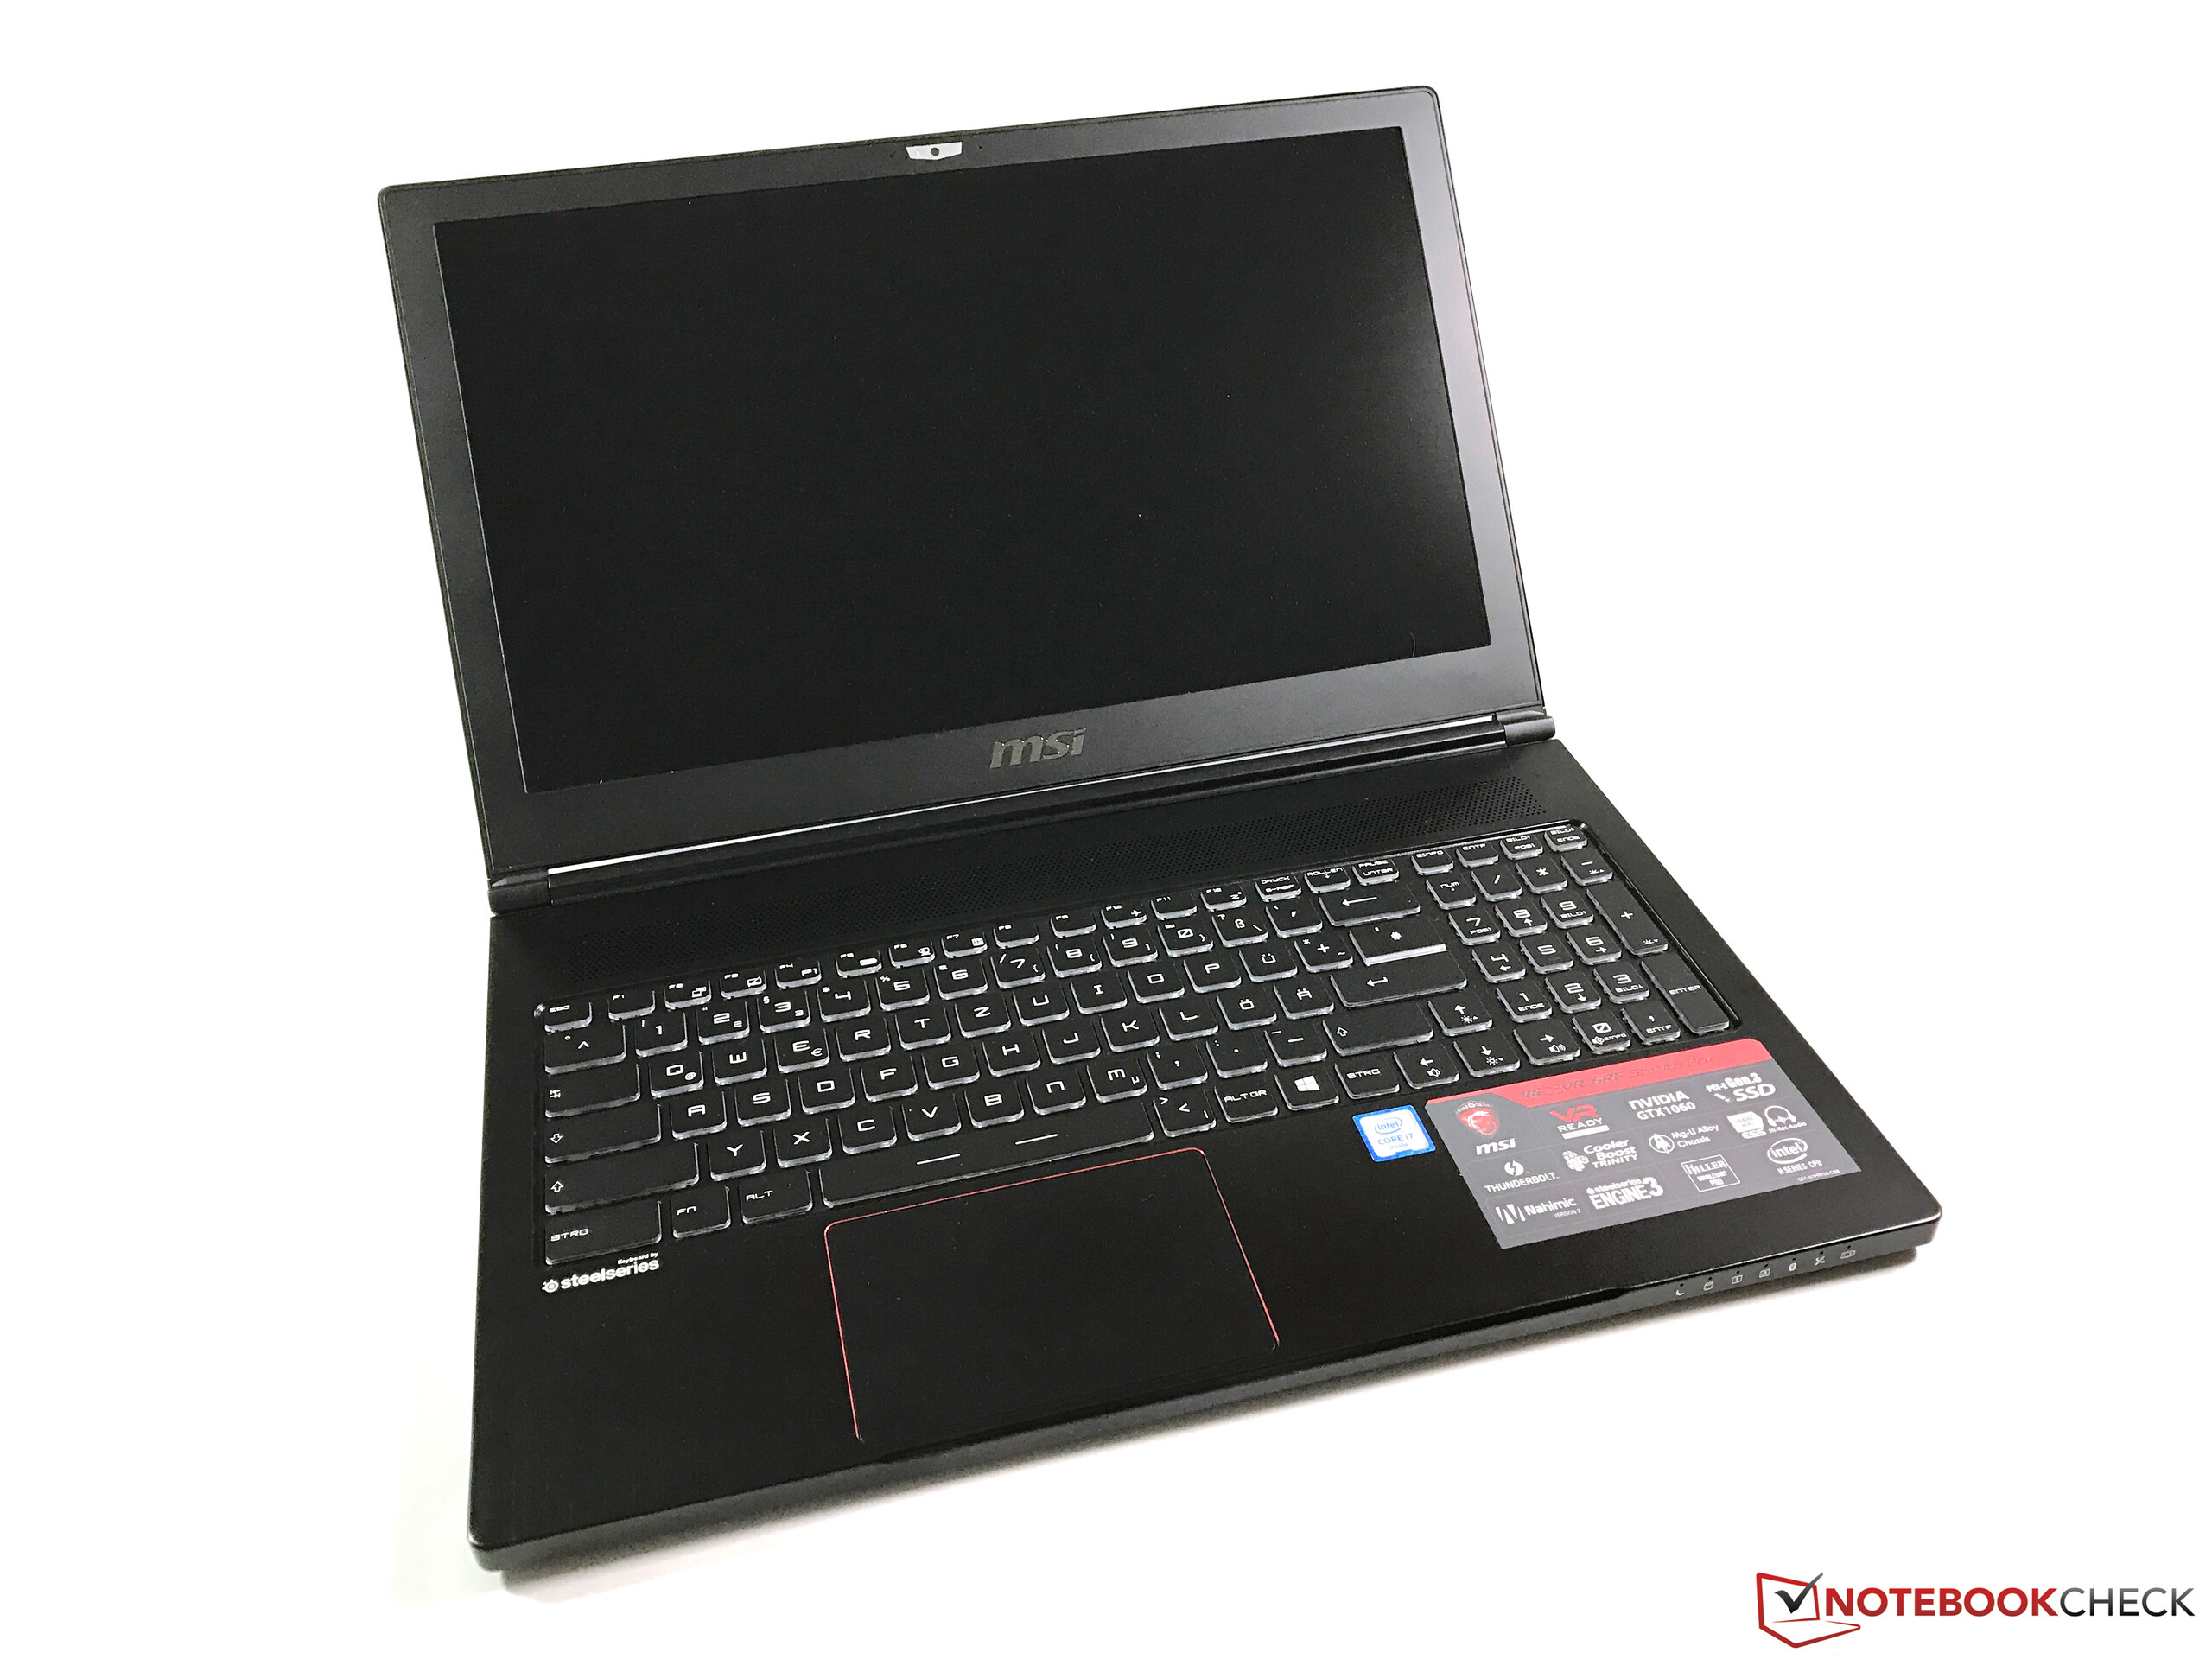
Breve análisis del MSI GS63VR 6RF Stealth Pro

| SD Card Reader | |
| average JPG Copy Test (av. of 3 runs) | |
| MSI GS60-6QE4K16H21 | |
| Schenker XMG P507 | |
| Asus Strix GL502VS-FY032T | |
| Asus G501VW-FY081T | |
| MSI GS63VR-6RF16H22 Stealth Pro | |
| MSI GE62VR 6RF-001US | |
| maximum AS SSD Seq Read Test (1GB) | |
| MSI GS60-6QE4K16H21 | |
| Schenker XMG P507 | |
| Asus Strix GL502VS-FY032T | |
| Asus G501VW-FY081T | |
| MSI GS63VR-6RF16H22 Stealth Pro | |
| MSI GE62VR 6RF-001US | |
| Networking | |
| iperf Server (receive) TCP 1 m | |
| Asus Strix GL502VS-FY032T | |
| Schenker XMG P507 | |
| MSI GS63VR-6RF16H22 Stealth Pro | |
| iperf Client (transmit) TCP 1 m | |
| MSI GS63VR-6RF16H22 Stealth Pro | |
| Asus Strix GL502VS-FY032T | |
| Schenker XMG P507 | |
Parpadeo de Pantalla / PWM (Pulse-Width Modulation)
| Parpadeo de Pantalla / PWM detectado | 202 Hz | ≤ 100 % de brillo | 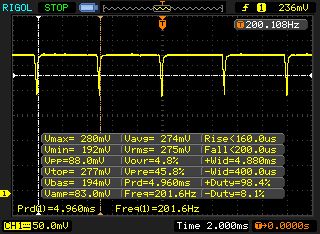 |
La retroiluminación del display parpadea a 202 Hz (seguramente usa PWM - Pulse-Width Modulation) a un brillo del 100 % e inferior. Sobre este nivel de brillo no debería darse parpadeo / PWM. La frecuencia de 202 Hz es relativamente baja, por lo que la gente sensible debería ver parpadeos y padecer fatiga visual por la pantalla (usado al brillo indicado a continuación). Comparación: 52 % de todos los dispositivos testados no usaron PWM para atenuar el display. Si se usó, medimos una media de 7798 (mínimo: 5 - máxmo: 343500) Hz. | |||
| |||||||||||||||||||||||||
iluminación: 84 %
Brillo con batería: 293 cd/m²
Contraste: 888:1 (Negro: 0.33 cd/m²)
ΔE ColorChecker Calman: 3.59 | ∀{0.5-29.43 Ø4.73}
ΔE Greyscale Calman: 3.86 | ∀{0.09-98 Ø4.97}
97% sRGB (Argyll 1.6.3 3D)
63% AdobeRGB 1998 (Argyll 1.6.3 3D)
69.7% AdobeRGB 1998 (Argyll 3D)
97.4% sRGB (Argyll 3D)
67.8% Display P3 (Argyll 3D)
Gamma: 2.53
CCT: 7229 K
| MSI GS63VR-6RF16H22 Stealth Pro Samsung 156HL01-104 (SDC324C) , 1920x1080 | MSI GS60-6QE4K16H21 Samsung 156FL02-P01 (SDC424B), 3840x2160 | Asus G501VW-FY081T Samsung 156HL01-104, 1920x1080 | Asus Strix GL502VS-FY032T LG Philips LP156WF6-SPB6 (LGD046F), 1920x1080 | MSI GE62VR 6RF-001US 1920x1080 | Schenker XMG P507 LG Philips LP156WF6 (LGD046F), 1920x1080 | |
|---|---|---|---|---|---|---|
| Display | -20% | -1% | -11% | -9% | -10% | |
| Display P3 Coverage (%) | 67.8 | 53.1 -22% | 66.8 -1% | 64.5 -5% | 65.6 -3% | 64.5 -5% |
| sRGB Coverage (%) | 97.4 | 80 -18% | 97.3 0% | 83.1 -15% | 84.3 -13% | 83.4 -14% |
| AdobeRGB 1998 Coverage (%) | 69.7 | 54.8 -21% | 68.6 -2% | 60.8 -13% | 61.7 -11% | 61 -12% |
| Response Times | 0% | -50% | 12% | -2% | 12% | |
| Response Time Grey 50% / Grey 80% * (ms) | 40 ? | 50 ? | 38 ? | 36.8 ? | 36 ? | |
| Response Time Black / White * (ms) | 26 ? | 26 ? -0% | 39 ? -50% | 23 ? 12% | 26.4 ? -2% | 23 ? 12% |
| PWM Frequency (Hz) | 202 ? | 1316 ? | 200 ? | |||
| Screen | -39% | -3% | -10% | 6% | -12% | |
| Brightness middle (cd/m²) | 293 | 212 -28% | 341 16% | 315 8% | 302 3% | 288 -2% |
| Brightness (cd/m²) | 279 | 197 -29% | 312 12% | 290 4% | 303 9% | 292 5% |
| Brightness Distribution (%) | 84 | 78 -7% | 83 -1% | 85 1% | 87 4% | 87 4% |
| Black Level * (cd/m²) | 0.33 | 0.49 -48% | 0.32 3% | 0.32 3% | 0.169 49% | 0.3 9% |
| Contrast (:1) | 888 | 433 -51% | 1066 20% | 984 11% | 1787 101% | 960 8% |
| Colorchecker dE 2000 * | 3.59 | 7.8 -117% | 4.23 -18% | 4.88 -36% | 4.61 -28% | 5.1 -42% |
| Colorchecker dE 2000 max. * | 5.79 | 8.02 -39% | 8.88 -53% | 9.98 -72% | 9.44 -63% | |
| Greyscale dE 2000 * | 3.86 | 5.23 -35% | 4.69 -22% | 4.17 -8% | 3.32 14% | 4.43 -15% |
| Gamma | 2.53 87% | 3.05 72% | 2.53 87% | 2.53 87% | 2.24 98% | 2.46 89% |
| CCT | 7229 90% | 6693 97% | 7549 86% | 6683 97% | 6358 102% | 6687 97% |
| Color Space (Percent of AdobeRGB 1998) (%) | 63 | 50 -21% | 63 0% | 55 -13% | 55.4 -12% | 55 -13% |
| Color Space (Percent of sRGB) (%) | 97 | 80 -18% | 97 0% | 83 -14% | 84.4 -13% | 83 -14% |
| Media total (Programa/Opciones) | -20% /
-32% | -18% /
-6% | -3% /
-8% | -2% /
2% | -3% /
-10% |
* ... más pequeño es mejor
Tiempos de respuesta del display
| ↔ Tiempo de respuesta de Negro a Blanco | ||
|---|---|---|
| 26 ms ... subida ↗ y bajada ↘ combinada | ↗ 8 ms subida | 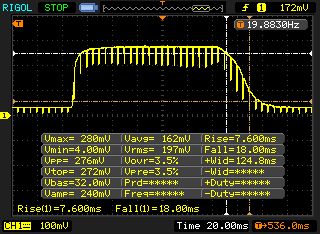 |
| ↘ 18 ms bajada | ||
| La pantalla mostró tiempos de respuesta relativamente lentos en nuestros tests pero podría ser demasiado lenta para los jugones. En comparación, todos los dispositivos de prueba van de ##min### (mínimo) a 240 (máximo) ms. » 62 % de todos los dispositivos son mejores. Eso quiere decir que el tiempo de respuesta es peor que la media (19.9 ms) de todos los dispositivos testados. | ||
| PCMark 8 | |
| Home Score Accelerated v2 | |
| Asus Strix GL502VS-FY032T | |
| MSI GS63VR-6RF16H22 Stealth Pro | |
| MSI GE62VR 6RF-001US | |
| Asus G501VW-FY081T | |
| MSI GS60-6QE4K16H21 | |
| Work Score Accelerated v2 | |
| MSI GE62VR 6RF-001US | |
| Asus Strix GL502VS-FY032T | |
| MSI GS63VR-6RF16H22 Stealth Pro | |
| Asus G501VW-FY081T | |
| PCMark 7 - Score | |
| Schenker XMG P507 | |
| MSI GS60-6QE4K16H21 | |
| MSI GS63VR-6RF16H22 Stealth Pro | |
| Asus G501VW-FY081T | |
| PCMark 7 Score | 5321 puntos | |
| PCMark 8 Home Score Accelerated v2 | 4060 puntos | |
| PCMark 8 Creative Score Accelerated v2 | 5171 puntos | |
| PCMark 8 Work Score Accelerated v2 | 4859 puntos | |
ayuda | ||
| MSI GS63VR-6RF16H22 Stealth Pro Samsung SM951 MZVPV256HDGL m.2 PCI-e | MSI GS60-6QE4K16H21 Hynix HFS256G3MND | Asus G501VW-FY081T Samsung CM871 MZNLF128HCHP | Asus Strix GL502VS-FY032T SanDisk SD8SNAT256G1002 | MSI GE62VR 6RF-001US Samsung SM951 MZVPV512HDGL m.2 PCI-e | Schenker XMG P507 Samsung SM951 MZVPV256HDGL m.2 PCI-e | |
|---|---|---|---|---|---|---|
| CrystalDiskMark 3.0 | -51% | -82% | -65% | 5% | 3% | |
| Read Seq (MB/s) | 1973 | 518 -74% | 447.1 -77% | 485.4 -75% | 1696 -14% | 1857 -6% |
| Write Seq (MB/s) | 1292 | 407.2 -68% | 136 -89% | 312.4 -76% | 1584 23% | 1240 -4% |
| Read 512 (MB/s) | 1279 | 388 -70% | 297.1 -77% | 294.8 -77% | 1044 -18% | 971 -24% |
| Write 512 (MB/s) | 1288 | 392.2 -70% | 86.5 -93% | 287.8 -78% | 1562 21% | 1239 -4% |
| Read 4k (MB/s) | 52.3 | 31.83 -39% | 15.84 -70% | 21.44 -59% | 50.8 -3% | 54.1 3% |
| Write 4k (MB/s) | 153.2 | 96.7 -37% | 31.96 -79% | 75.7 -51% | 139.2 -9% | 167.4 9% |
| Read 4k QD32 (MB/s) | 464.4 | 308.4 -34% | 96.9 -79% | 149.4 -68% | 591 27% | 695 50% |
| Write 4k QD32 (MB/s) | 384.4 | 318 -17% | 20.29 -95% | 256.3 -33% | 422.8 10% | 386.8 1% |

| 3DMark | |
| 1920x1080 Fire Strike Graphics | |
| Asus Strix GL502VS-FY032T | |
| MSI GE62VR 6RF-001US | |
| MSI GS63VR-6RF16H22 Stealth Pro | |
| Schenker XMG P507 | |
| MSI GS60-6QE4K16H21 | |
| Asus G501VW-FY081T | |
| 2560x1440 Time Spy Graphics | |
| MSI GS63VR-6RF16H22 Stealth Pro | |
| Schenker XMG P507 | |
| 3DMark 11 - 1280x720 Performance GPU | |
| Asus Strix GL502VS-FY032T | |
| MSI GE62VR 6RF-001US | |
| MSI GS63VR-6RF16H22 Stealth Pro | |
| Schenker XMG P507 | |
| MSI GS60-6QE4K16H21 | |
| Asus G501VW-FY081T | |
| 3DMark 11 Performance | 12411 puntos | |
| 3DMark Ice Storm Standard Score | 79935 puntos | |
| 3DMark Cloud Gate Standard Score | 21915 puntos | |
| 3DMark Fire Strike Score | 9704 puntos | |
| 3DMark Time Spy Score | 3630 puntos | |
ayuda | ||
| Rise of the Tomb Raider | |
| 1920x1080 Very High Preset AA:FX AF:16x | |
| Asus Strix GL502VS-FY032T | |
| Schenker XMG P507 | |
| MSI GS63VR-6RF16H22 Stealth Pro | |
| MSI GE62VR 6RF-001US | |
| Asus G501VW-FY081T | |
| 1920x1080 High Preset AA:FX AF:4x | |
| Asus Strix GL502VS-FY032T | |
| Schenker XMG P507 | |
| MSI GS63VR-6RF16H22 Stealth Pro | |
| Asus G501VW-FY081T | |
| The Witcher 3 | |
| 1920x1080 High Graphics & Postprocessing (Nvidia HairWorks Off) | |
| Asus Strix GL502VS-FY032T | |
| MSI GS63VR-6RF16H22 Stealth Pro | |
| Schenker XMG P507 | |
| 1920x1080 Ultra Graphics & Postprocessing (HBAO+) | |
| Asus Strix GL502VS-FY032T | |
| MSI GS63VR-6RF16H22 Stealth Pro | |
| Schenker XMG P507 | |
| bajo | medio | alto | ultra | |
|---|---|---|---|---|
| BioShock Infinite (2013) | 101.8 | |||
| The Witcher 3 (2015) | 74.6 | 40.4 | ||
| Rainbow Six Siege (2015) | 107.3 | |||
| Rise of the Tomb Raider (2016) | 65.3 | 55.5 | ||
| Deus Ex Mankind Divided (2016) | 49.1 | 26.9 |
Ruido
| Ocioso |
| 32 / 33 / 34 dB(A) |
| HDD |
| 33 dB(A) |
| Carga |
| 37 / 46 dB(A) |
 | ||
30 dB silencioso 40 dB(A) audible 50 dB(A) ruidosamente alto |
||
min: | ||
| MSI GS63VR-6RF16H22 Stealth Pro GeForce GTX 1060 Mobile, 6700HQ | MSI GS60-6QE4K16H21 GeForce GTX 970M, 6700HQ | Asus G501VW-FY081T GeForce GTX 960M, 6700HQ | Asus Strix GL502VS-FY032T GeForce GTX 1070 Mobile, 6700HQ | MSI GE62VR 6RF-001US GeForce GTX 1060 Mobile, 6700HQ | Schenker XMG P507 GeForce GTX 1060 Mobile, 6700HQ | |
|---|---|---|---|---|---|---|
| Noise | -9% | -1% | -3% | -4% | -6% | |
| apagado / medio ambiente * (dB) | 30 | 31.2 -4% | 30 -0% | 28.2 6% | 30 -0% | |
| Idle Minimum * (dB) | 32 | 35 -9% | 32.1 -0% | 32 -0% | 32.8 -2% | 31 3% |
| Idle Average * (dB) | 33 | 36 -9% | 32.1 3% | 33 -0% | 32.9 -0% | 32 3% |
| Idle Maximum * (dB) | 34 | 37 -9% | 32.1 6% | 34 -0% | 32.9 3% | 38 -12% |
| Load Average * (dB) | 37 | 40 -8% | 43.3 -17% | 39 -5% | 41.6 -12% | 46 -24% |
| Load Maximum * (dB) | 46 | 50 -9% | 44.3 4% | 51 -11% | 55 -20% | 49 -7% |
* ... más pequeño es mejor
(-) La temperatura máxima en la parte superior es de 45.3 °C / 114 F, frente a la media de 40.4 °C / 105 F, que oscila entre 21.2 y 68.8 °C para la clase Gaming.
(-) El fondo se calienta hasta un máximo de 62.6 °C / 145 F, frente a la media de 43.2 °C / 110 F
(+) En reposo, la temperatura media de la parte superior es de 24.2 °C / 76# F, frente a la media del dispositivo de 33.9 °C / 93 F.
(+) Los reposamanos y el panel táctil alcanzan como máximo la temperatura de la piel (32 °C / 89.6 F) y, por tanto, no están calientes.
(-) La temperatura media de la zona del reposamanos de dispositivos similares fue de 28.8 °C / 83.8 F (-3.2 °C / -5.8 F).
| MSI GS63VR-6RF16H22 Stealth Pro GeForce GTX 1060 Mobile, 6700HQ | MSI GS60-6QE4K16H21 GeForce GTX 970M, 6700HQ | Asus G501VW-FY081T GeForce GTX 960M, 6700HQ | Asus Strix GL502VS-FY032T GeForce GTX 1070 Mobile, 6700HQ | MSI GE62VR 6RF-001US GeForce GTX 1060 Mobile, 6700HQ | Schenker XMG P507 GeForce GTX 1060 Mobile, 6700HQ | |
|---|---|---|---|---|---|---|
| Heat | -10% | 8% | -7% | -19% | -8% | |
| Maximum Upper Side * (°C) | 45.3 | 51.4 -13% | 41 9% | 48 -6% | 53.2 -17% | 49.3 -9% |
| Maximum Bottom * (°C) | 62.6 | 68.9 -10% | 48.2 23% | 46.8 25% | 59.4 5% | 52.7 16% |
| Idle Upper Side * (°C) | 25.3 | 27.1 -7% | 26.4 -4% | 33.7 -33% | 35.6 -41% | 32.6 -29% |
| Idle Bottom * (°C) | 27.3 | 30.4 -11% | 26.7 2% | 30.5 -12% | 33.2 -22% | 29.5 -8% |
* ... más pequeño es mejor
MSI GS63VR-6RF16H22 Stealth Pro análisis de audio
(±) | la sonoridad del altavoz es media pero buena (79 dB)
Graves 100 - 315 Hz
(-) | casi sin bajos - de media 21.6% inferior a la mediana
(±) | la linealidad de los graves es media (14.1% delta a frecuencia anterior)
Medios 400 - 2000 Hz
(±) | medias más altas - de media 5.1% más altas que la mediana
(+) | los medios son lineales (6.2% delta a la frecuencia anterior)
Altos 2 - 16 kHz
(+) | máximos equilibrados - a sólo 3.3% de la mediana
(+) | los máximos son lineales (6.6% delta a la frecuencia anterior)
Total 100 - 16.000 Hz
(±) | la linealidad del sonido global es media (21.9% de diferencia con la mediana)
En comparación con la misma clase
» 79% de todos los dispositivos probados de esta clase eran mejores, 6% similares, 16% peores
» El mejor tuvo un delta de 6%, la media fue 18%, el peor fue ###max##%
En comparación con todos los dispositivos probados
» 63% de todos los dispositivos probados eran mejores, 7% similares, 31% peores
» El mejor tuvo un delta de 4%, la media fue 24%, el peor fue ###max##%
Asus Strix GL502VS-FY032T análisis de audio
(±) | la sonoridad del altavoz es media pero buena (77 dB)
Graves 100 - 315 Hz
(-) | casi sin bajos - de media 16.2% inferior a la mediana
(±) | la linealidad de los graves es media (11.9% delta a frecuencia anterior)
Medios 400 - 2000 Hz
(+) | medios equilibrados - a sólo 0.7% de la mediana
(+) | los medios son lineales (3.1% delta a la frecuencia anterior)
Altos 2 - 16 kHz
(+) | máximos equilibrados - a sólo 3.5% de la mediana
(±) | la linealidad de los máximos es media (7.4% delta a frecuencia anterior)
Total 100 - 16.000 Hz
(±) | la linealidad del sonido global es media (16.8% de diferencia con la mediana)
En comparación con la misma clase
» 44% de todos los dispositivos probados de esta clase eran mejores, 11% similares, 46% peores
» El mejor tuvo un delta de 6%, la media fue 18%, el peor fue ###max##%
En comparación con todos los dispositivos probados
» 29% de todos los dispositivos probados eran mejores, 8% similares, 63% peores
» El mejor tuvo un delta de 4%, la media fue 24%, el peor fue ###max##%
Schenker XMG P507 análisis de audio
(±) | la sonoridad del altavoz es media pero buena (75 dB)
Graves 100 - 315 Hz
(-) | casi sin bajos - de media 20.7% inferior a la mediana
(±) | la linealidad de los graves es media (8.8% delta a frecuencia anterior)
Medios 400 - 2000 Hz
(+) | medios equilibrados - a sólo 2.2% de la mediana
(±) | la linealidad de los medios es media (7.6% delta respecto a la frecuencia anterior)
Altos 2 - 16 kHz
(+) | máximos equilibrados - a sólo 2.3% de la mediana
(+) | los máximos son lineales (5.3% delta a la frecuencia anterior)
Total 100 - 16.000 Hz
(±) | la linealidad del sonido global es media (19% de diferencia con la mediana)
En comparación con la misma clase
» 63% de todos los dispositivos probados de esta clase eran mejores, 8% similares, 29% peores
» El mejor tuvo un delta de 6%, la media fue 18%, el peor fue ###max##%
En comparación con todos los dispositivos probados
» 45% de todos los dispositivos probados eran mejores, 7% similares, 48% peores
» El mejor tuvo un delta de 4%, la media fue 24%, el peor fue ###max##%
| Off / Standby | |
| Ocioso | |
| Carga |
|
Clave:
min: | |
| MSI GS63VR-6RF16H22 Stealth Pro GeForce GTX 1060 Mobile, 6700HQ | MSI GS60-6QE4K16H21 GeForce GTX 970M, 6700HQ | Asus G501VW-FY081T GeForce GTX 960M, 6700HQ | Asus Strix GL502VS-FY032T GeForce GTX 1070 Mobile, 6700HQ | MSI GE62VR 6RF-001US GeForce GTX 1060 Mobile, 6700HQ | Schenker XMG P507 GeForce GTX 1060 Mobile, 6700HQ | |
|---|---|---|---|---|---|---|
| Power Consumption | 1% | 41% | -8% | -26% | 17% | |
| Idle Minimum * (Watt) | 18 | 17 6% | 6.9 62% | 20 -11% | 25.4 -41% | 11 39% |
| Idle Average * (Watt) | 22 | 22 -0% | 10.7 51% | 24 -9% | 30.3 -38% | 16 27% |
| Idle Maximum * (Watt) | 30 | 28 7% | 13.2 56% | 29 3% | 31.5 -5% | 21 30% |
| Load Average * (Watt) | 77 | 91 -18% | 82 -6% | 86 -12% | 111.8 -45% | 80 -4% |
| Load Maximum * (Watt) | 165 | 149 10% | 94 43% | 183 -11% | 163.2 1% | 174 -5% |
* ... más pequeño es mejor
| MSI GS63VR-6RF16H22 Stealth Pro 65 Wh | MSI GS60-6QE4K16H21 47 Wh | Asus G501VW-FY081T 60 Wh | Asus Strix GL502VS-FY032T 62 Wh | MSI GE62VR 6RF-001US 51 Wh | Schenker XMG P507 60 Wh | |
|---|---|---|---|---|---|---|
| Duración de Batería | -30% | 31% | -20% | -56% | 35% | |
| Reader / Idle (h) | 6 | 3.6 -40% | 10.2 70% | 4.1 -32% | 2.3 -62% | 6.8 13% |
| H.264 (h) | 4.5 | 5.1 13% | ||||
| WiFi v1.3 (h) | 3.5 | 2.6 -26% | 5.5 57% | 3.3 -6% | 1.7 -51% | 4.6 31% |
| Load (h) | 1.3 | 1 -23% | 1.1 -15% | 1 -23% | 0.6 -54% | 2.1 62% |
Pro
Contra
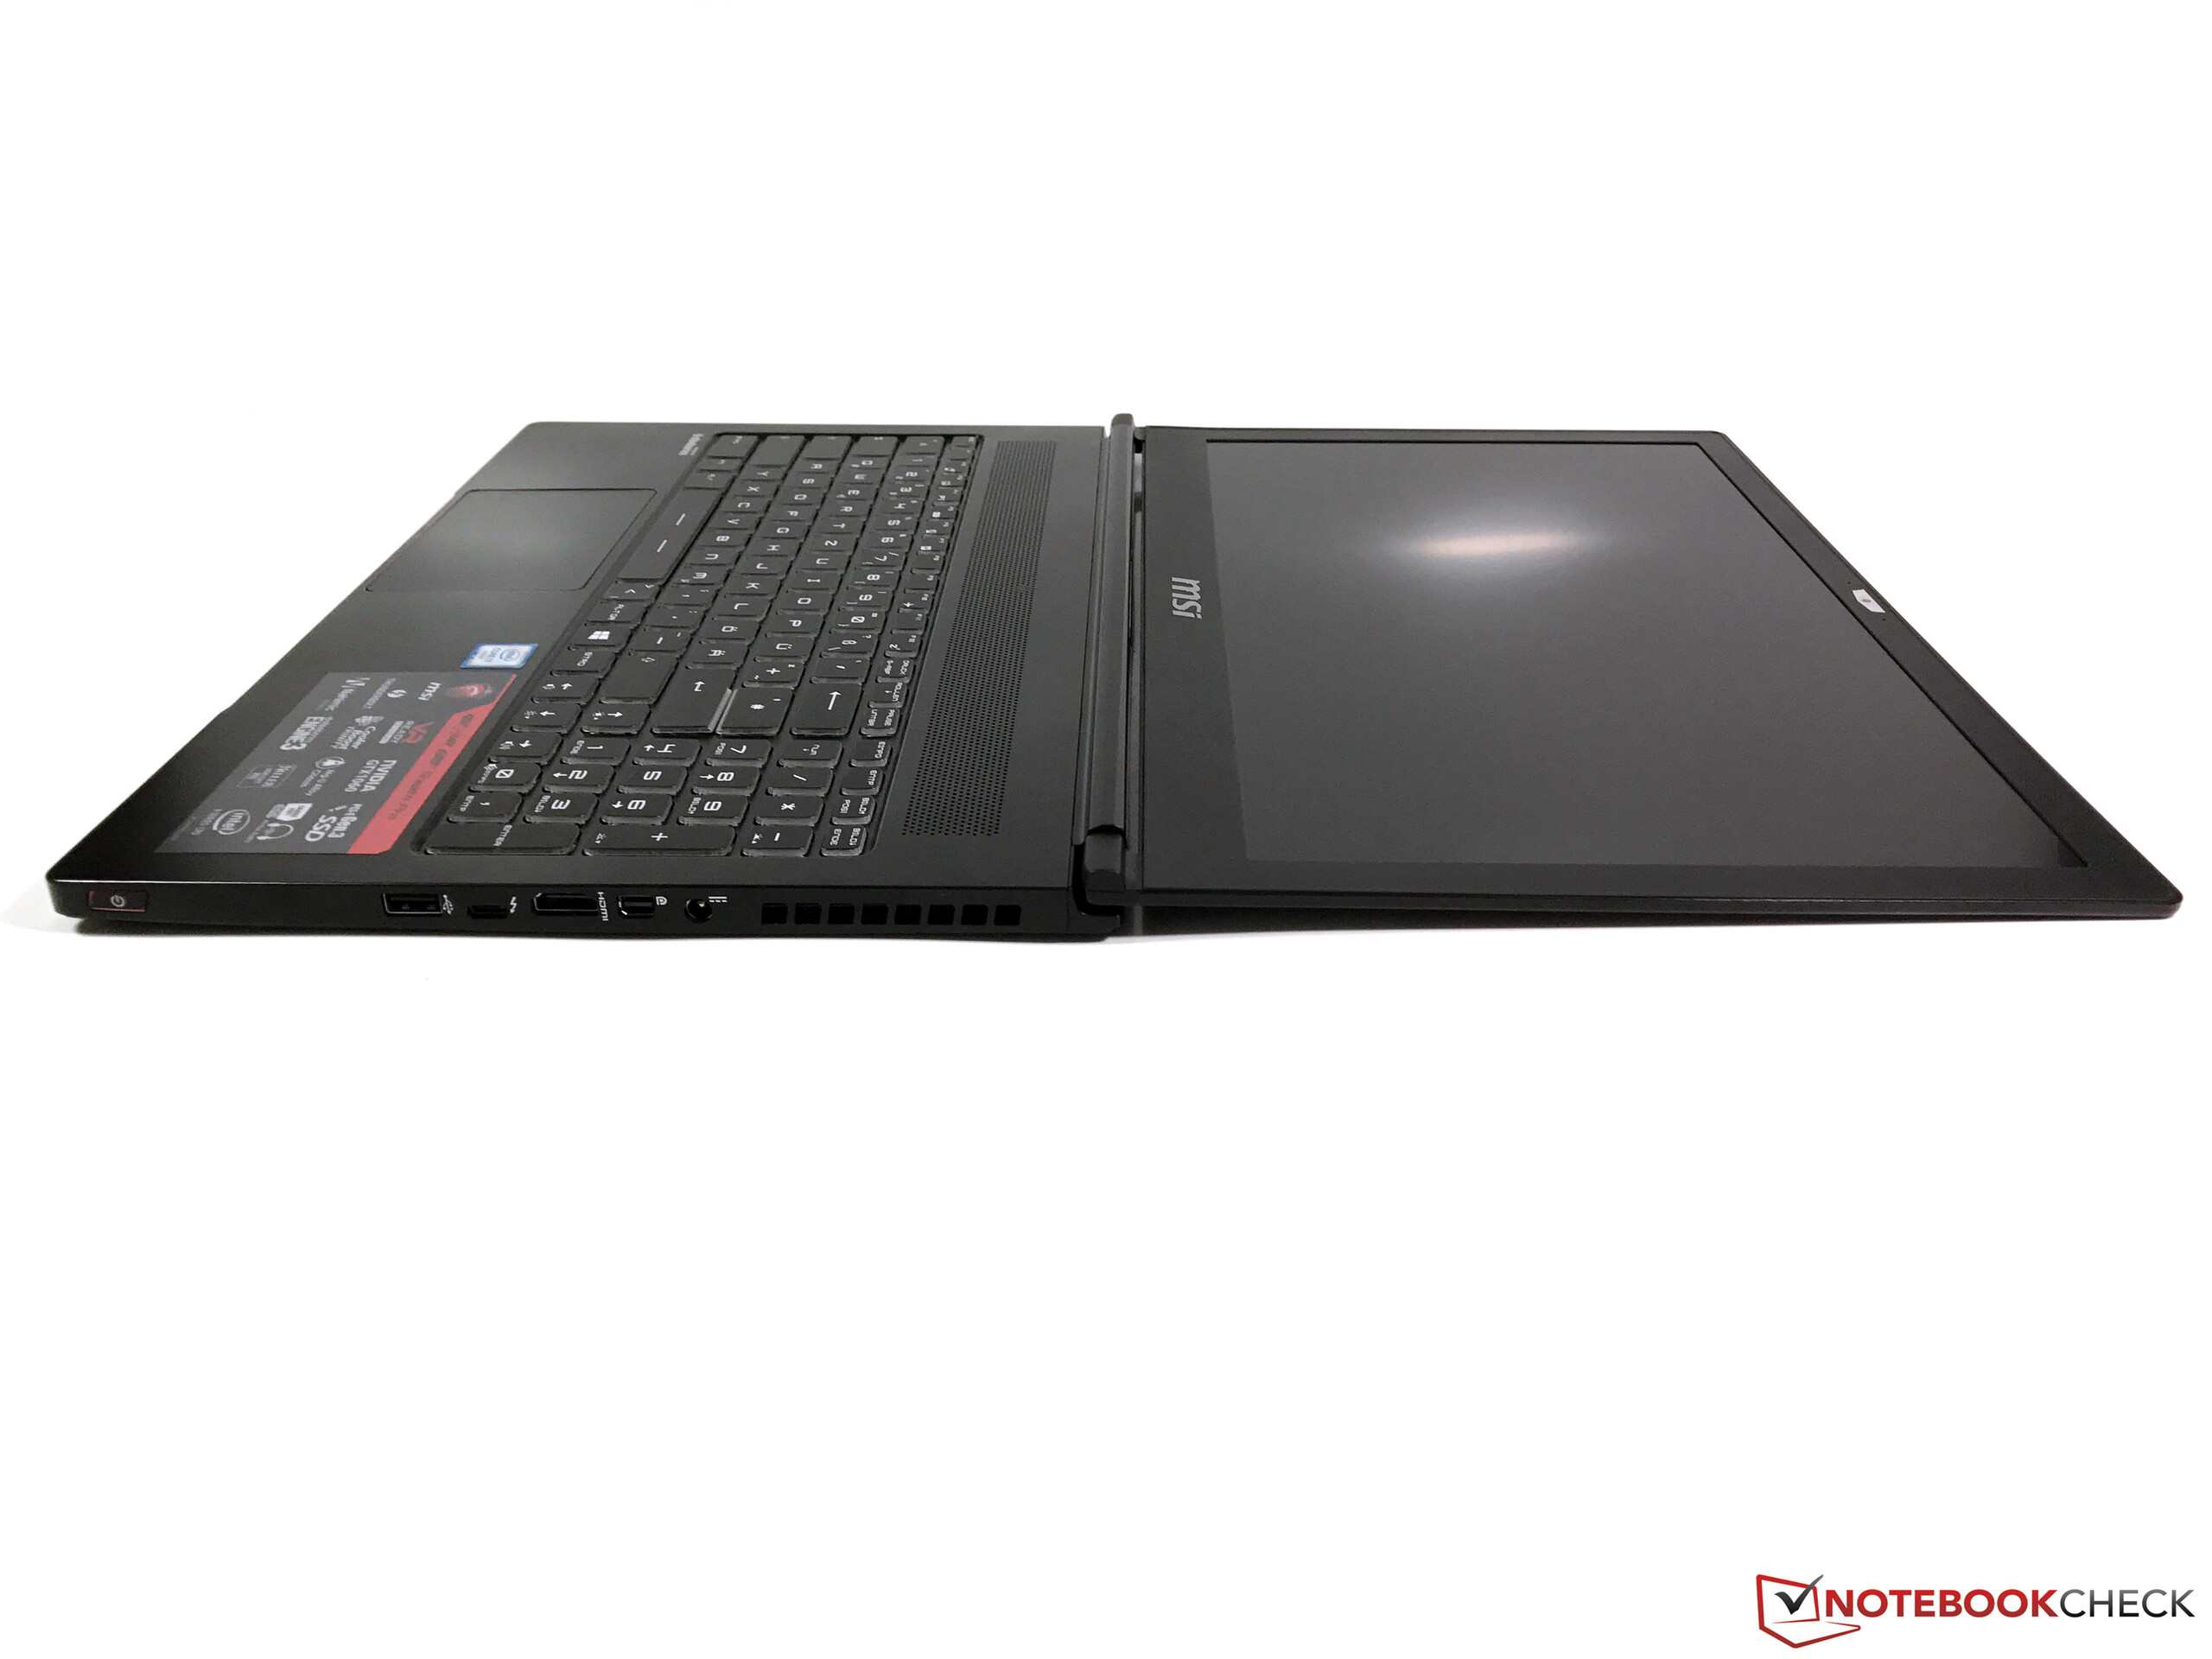
El MSI GS63VR Stealth Pro es una buena evolución del predecesor. El chasis es hasta más delgado que antes y el rendimiento GPU ha aumentado dramáticamente gracias a la nueva generación de gráficas de Nvidia. Las temperaturas siguen siendo bastante altas, pero los valores son menores que los del GS60 en general. El portátil también puede usar el rendimiento de los componentes en la mayoría de escenarios – sólo las cargas extremas y el funcionamiento en batería resultarán en un rendimiento GPU reducido.
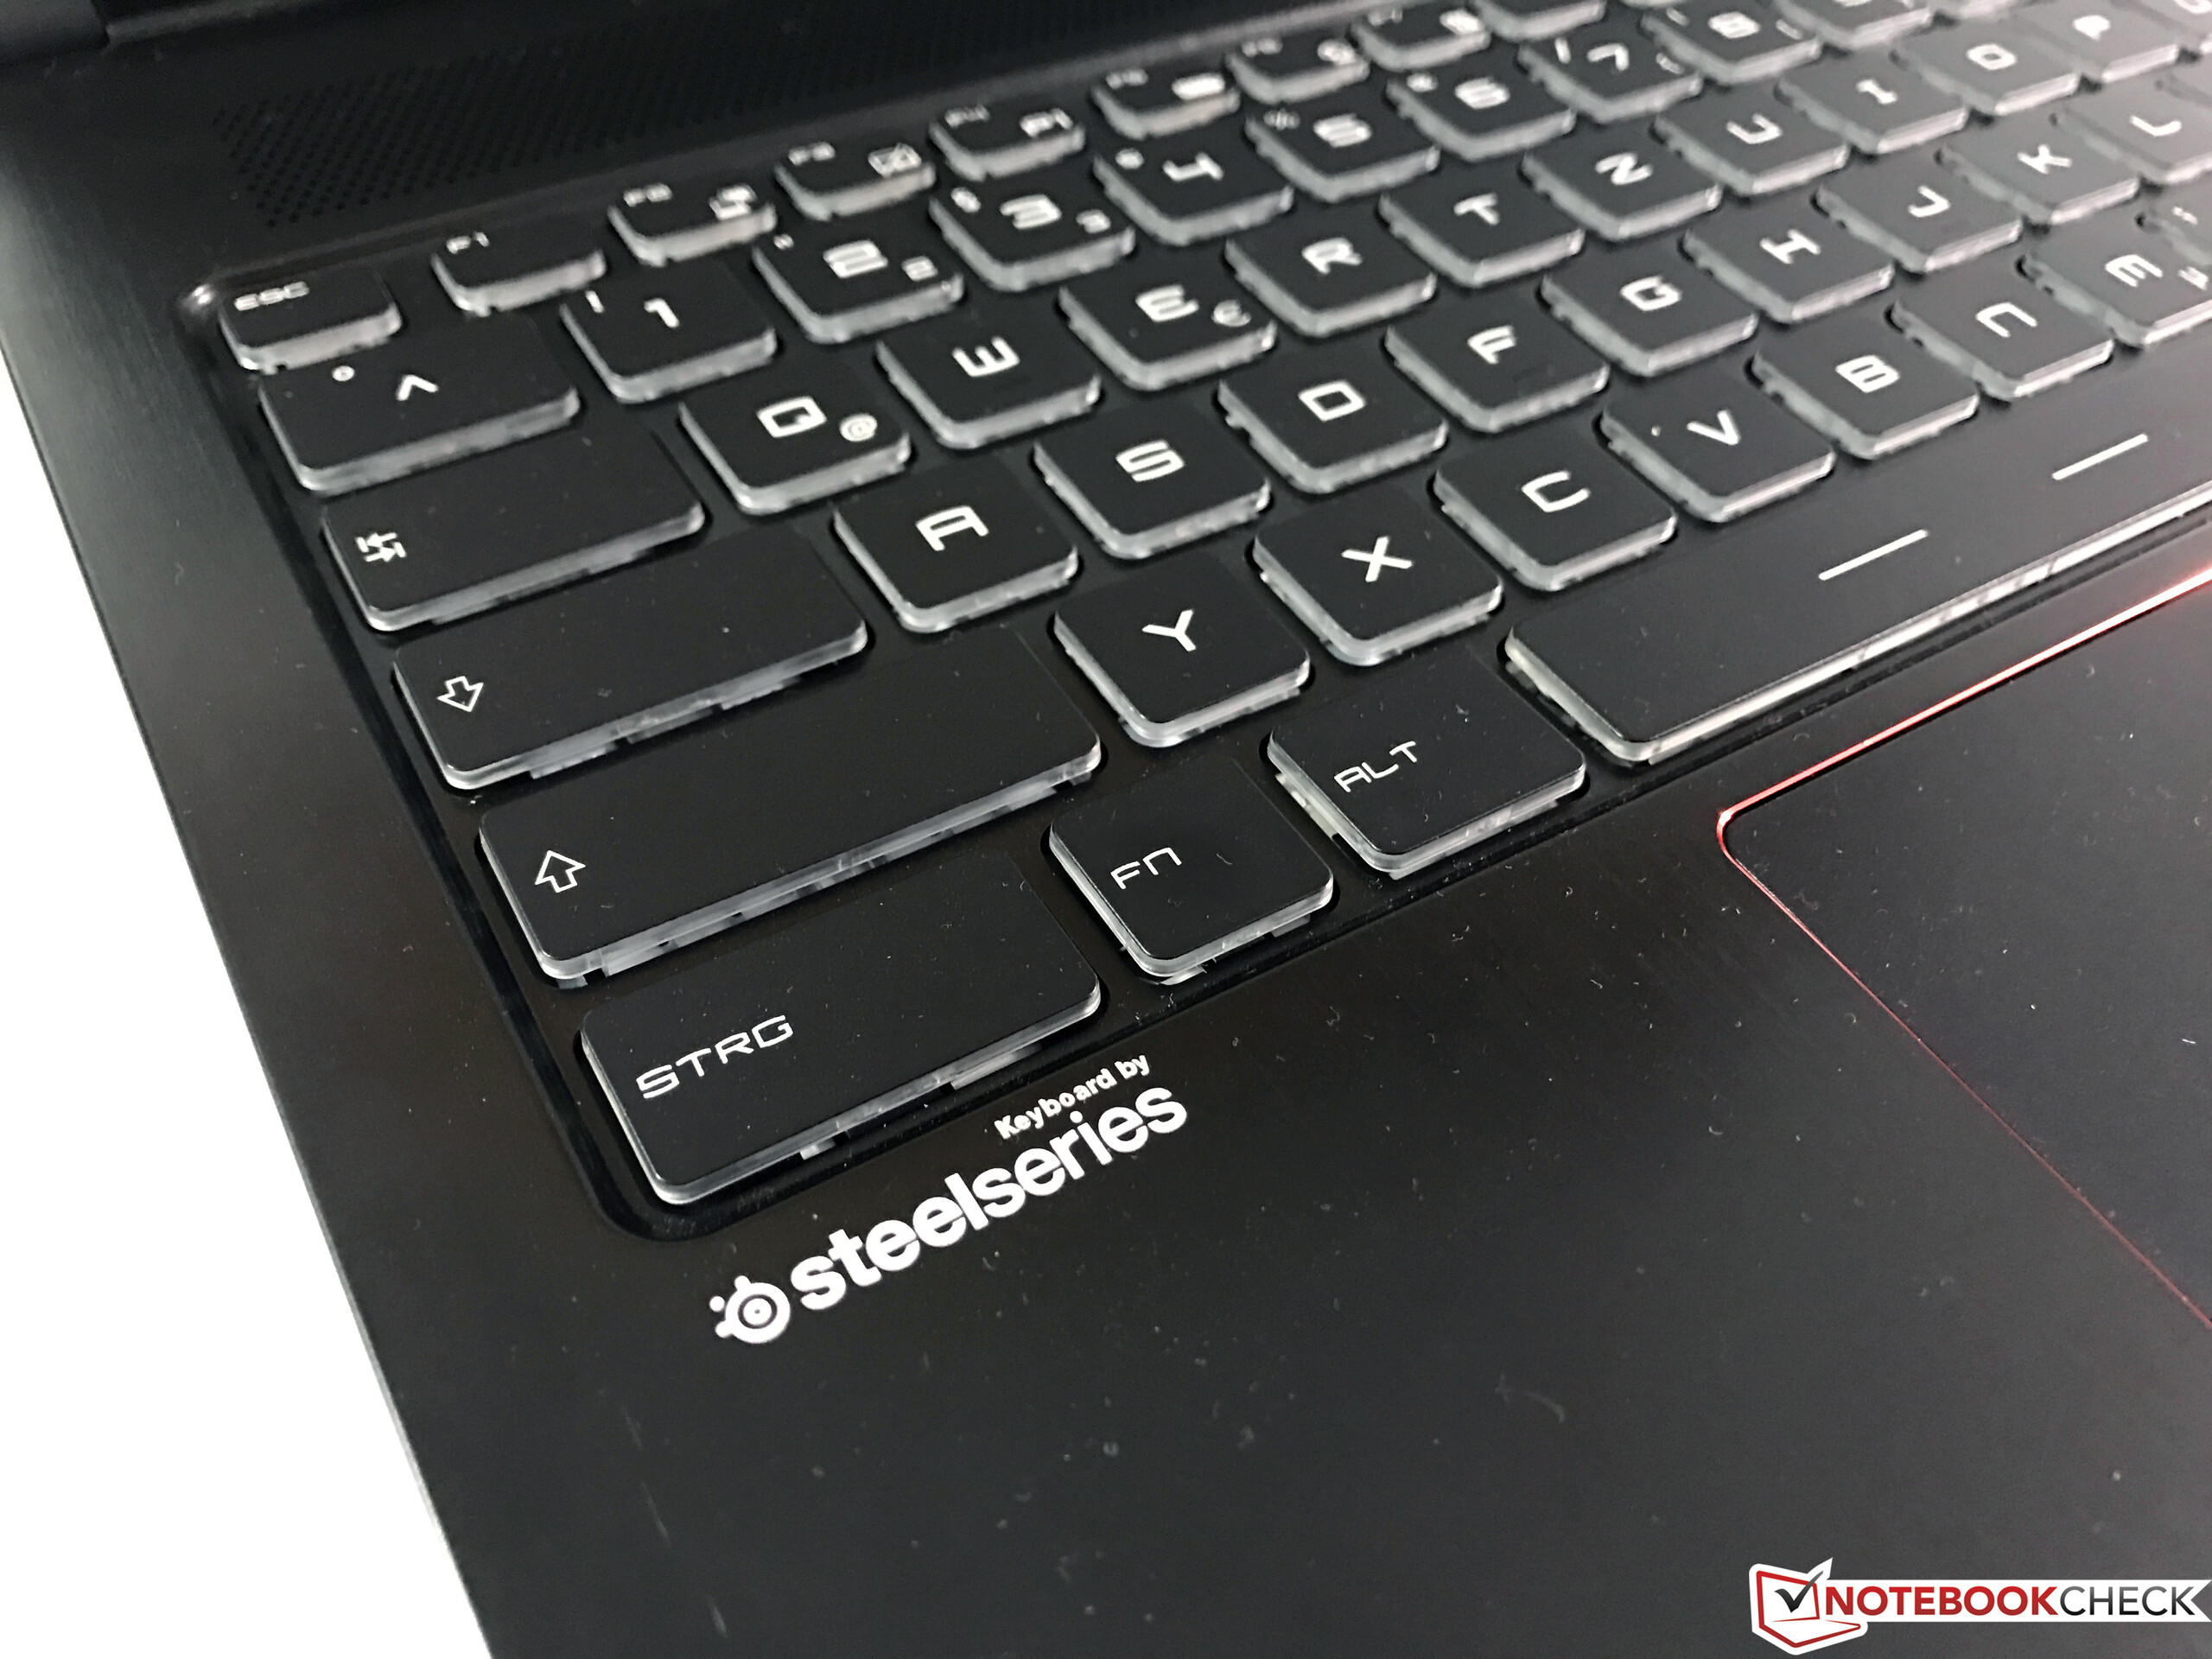
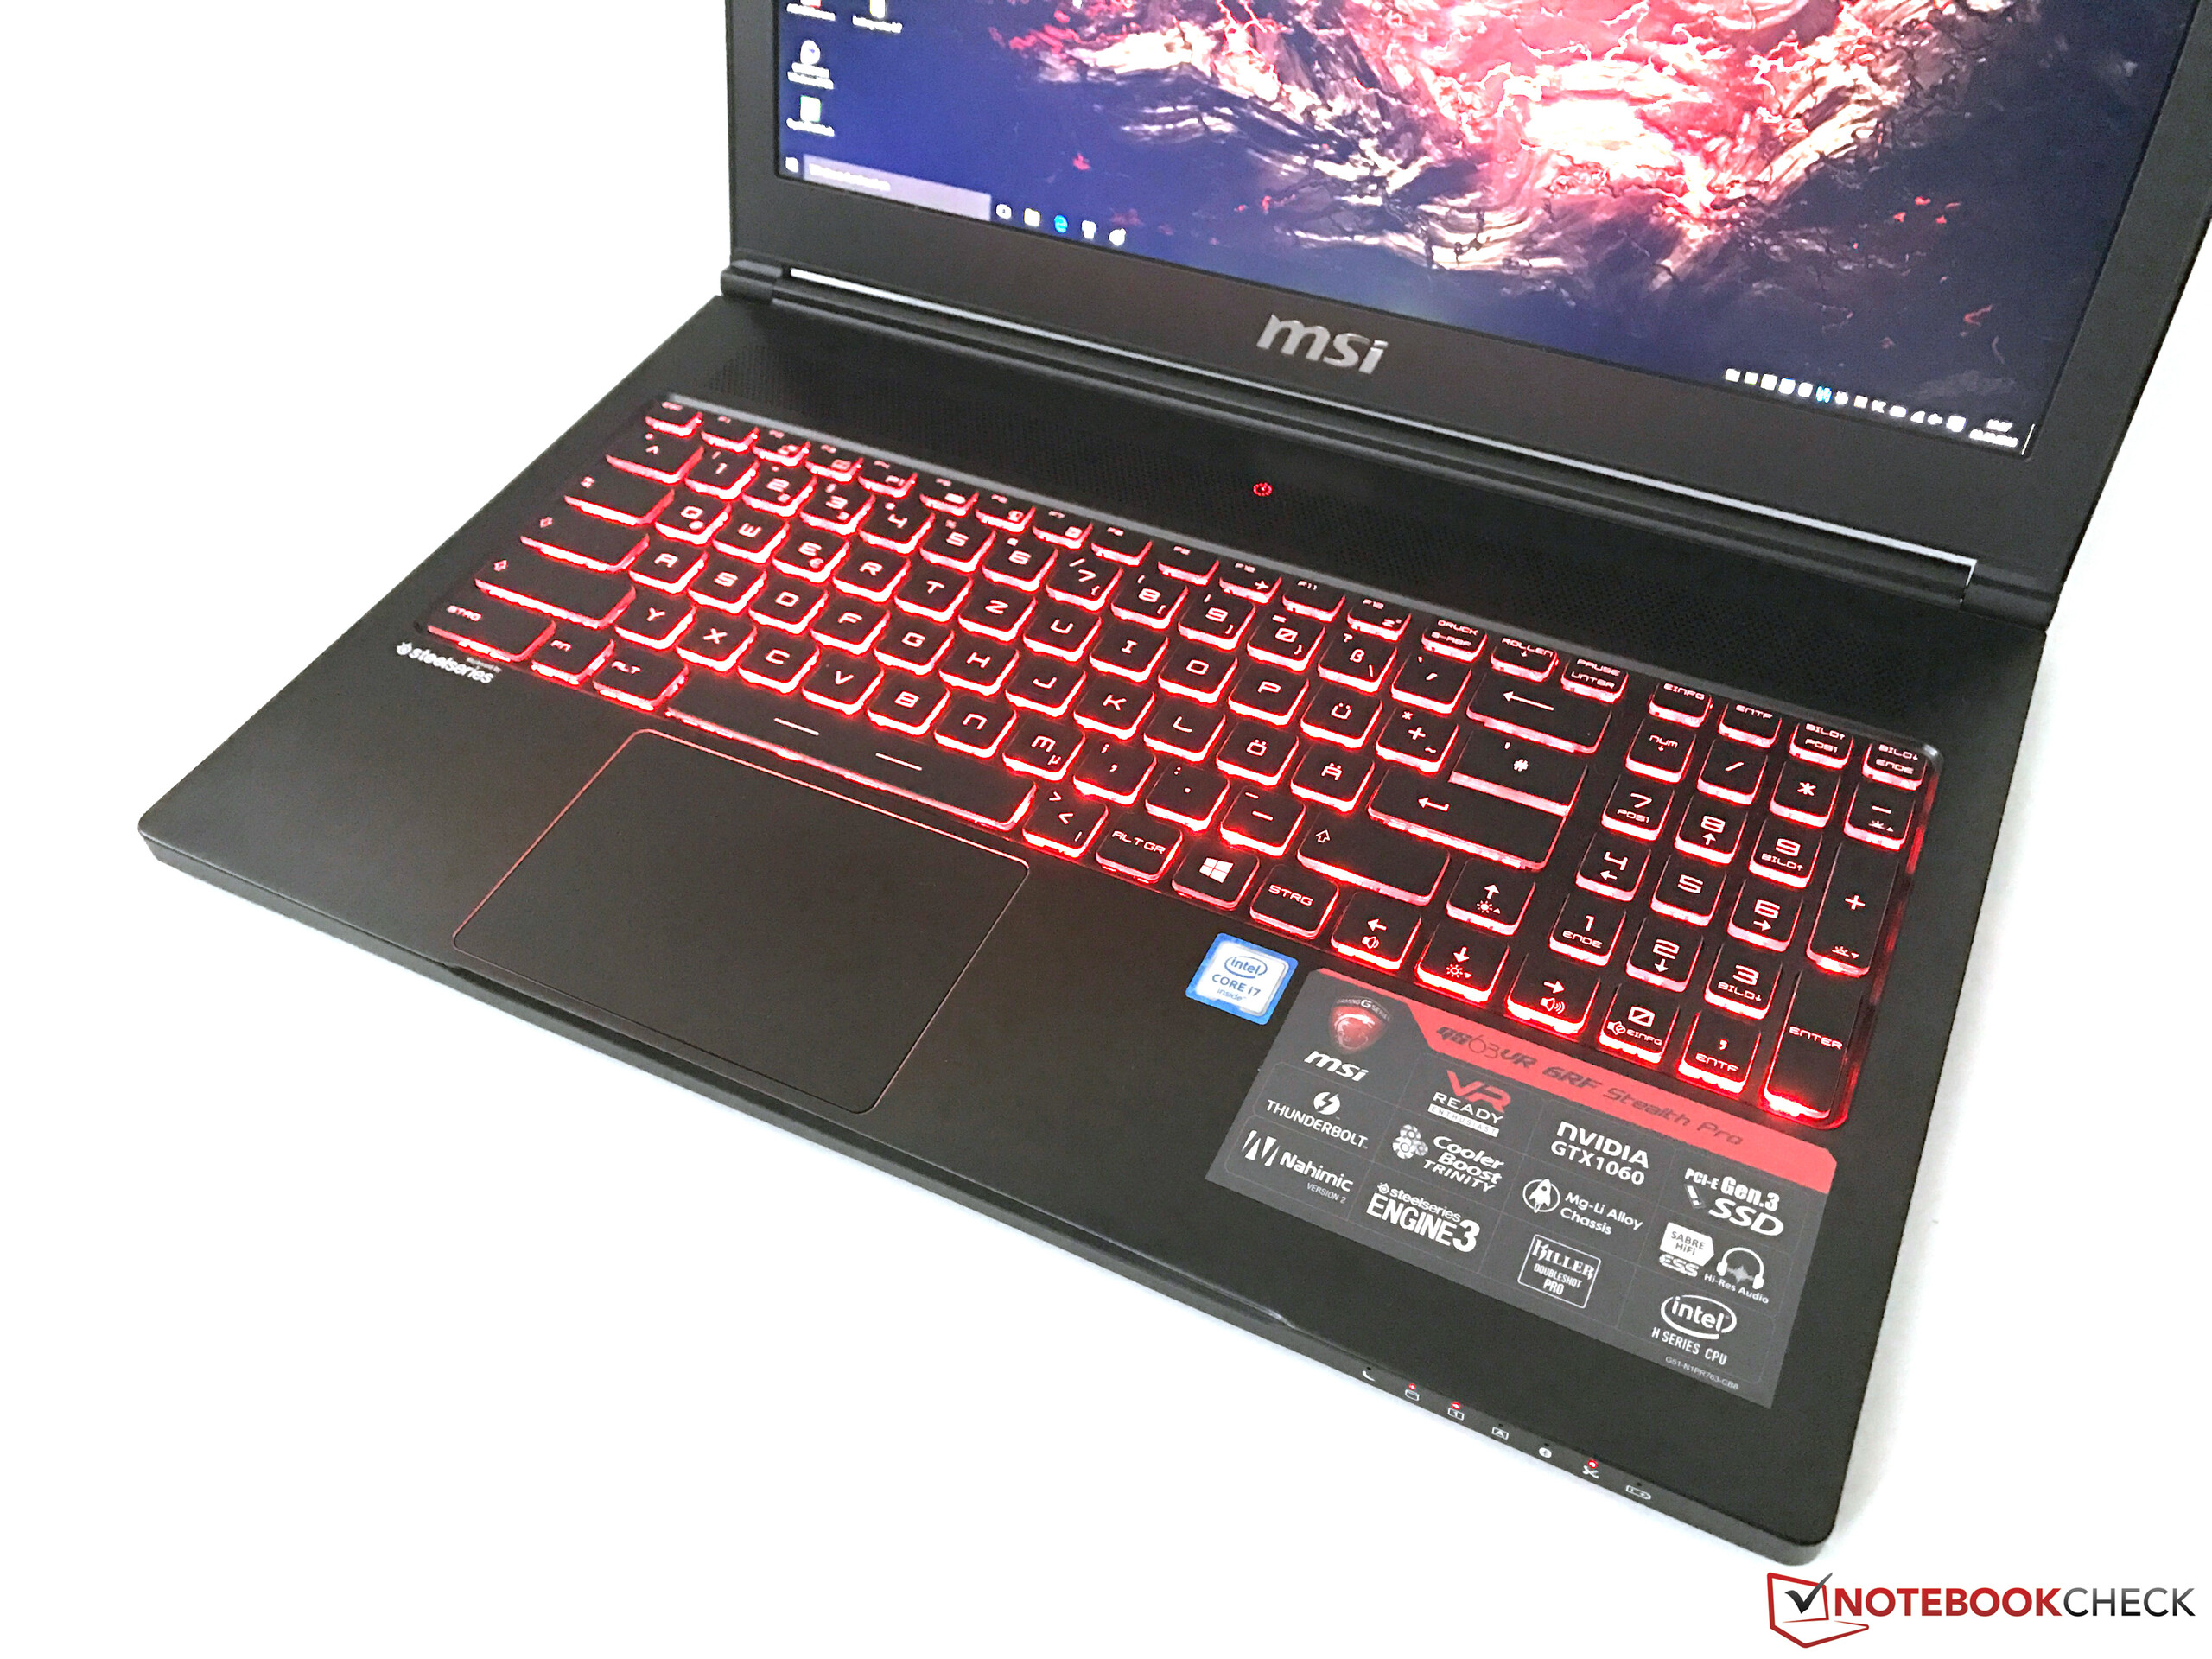
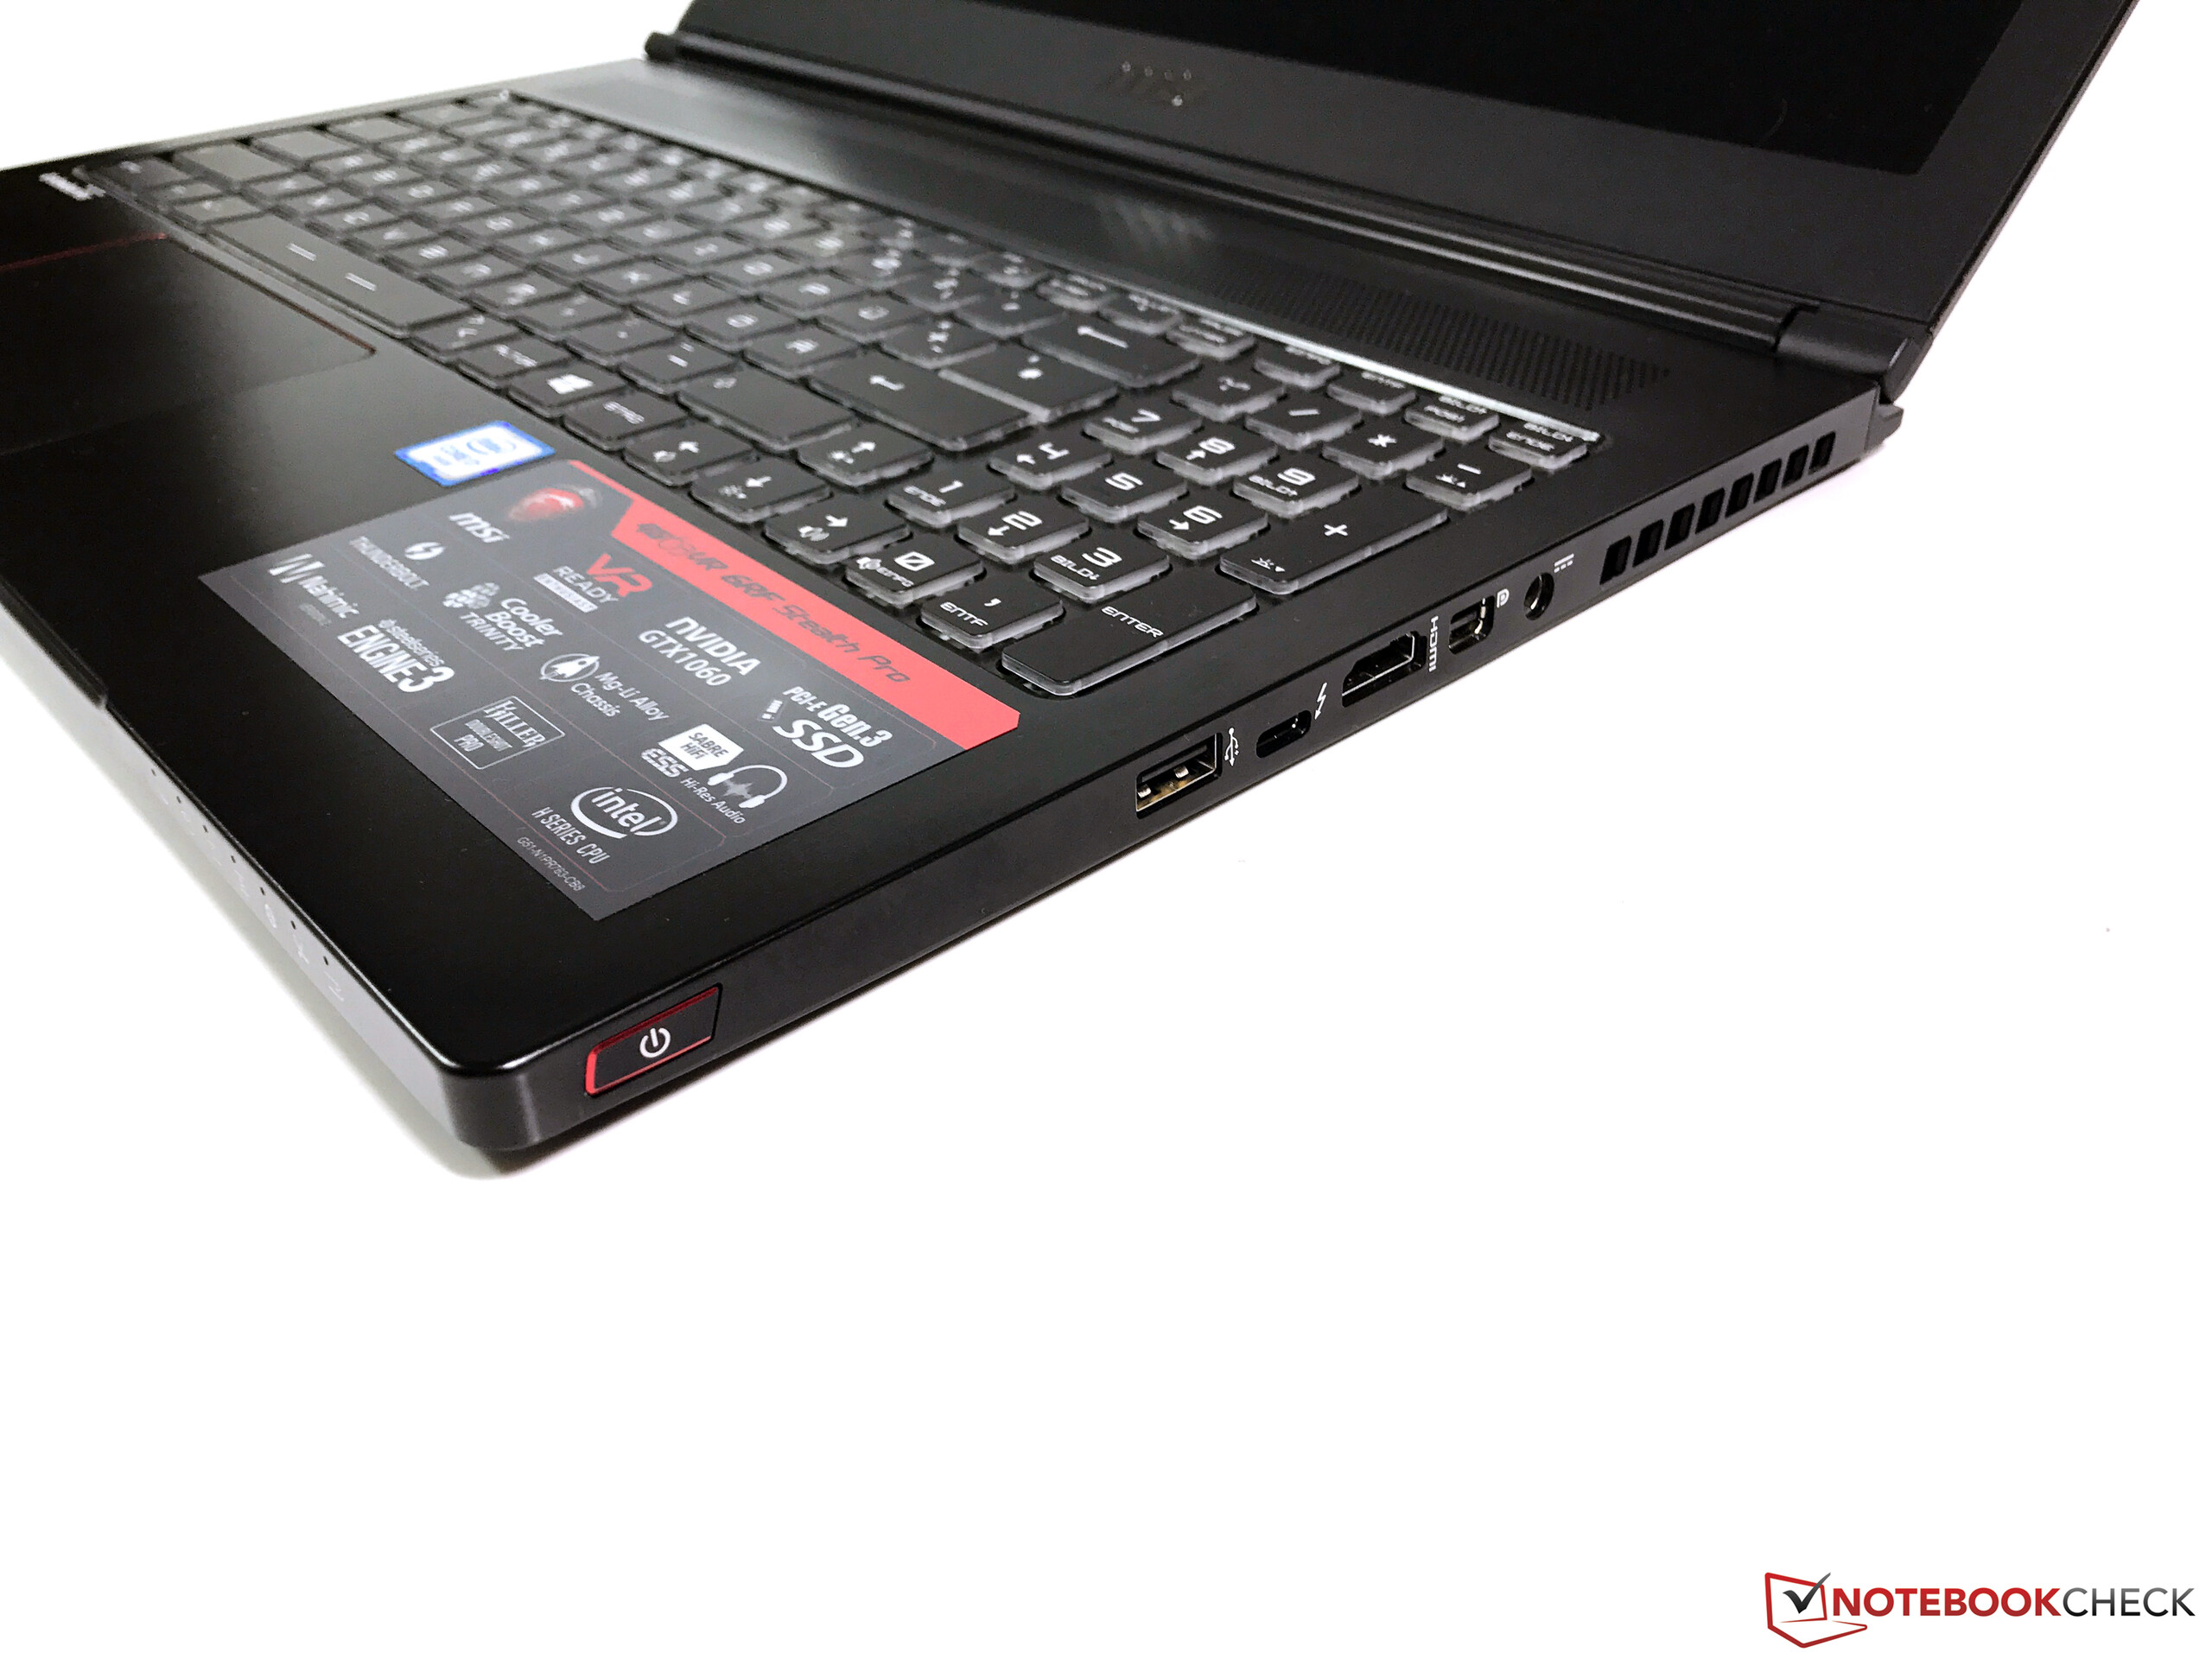
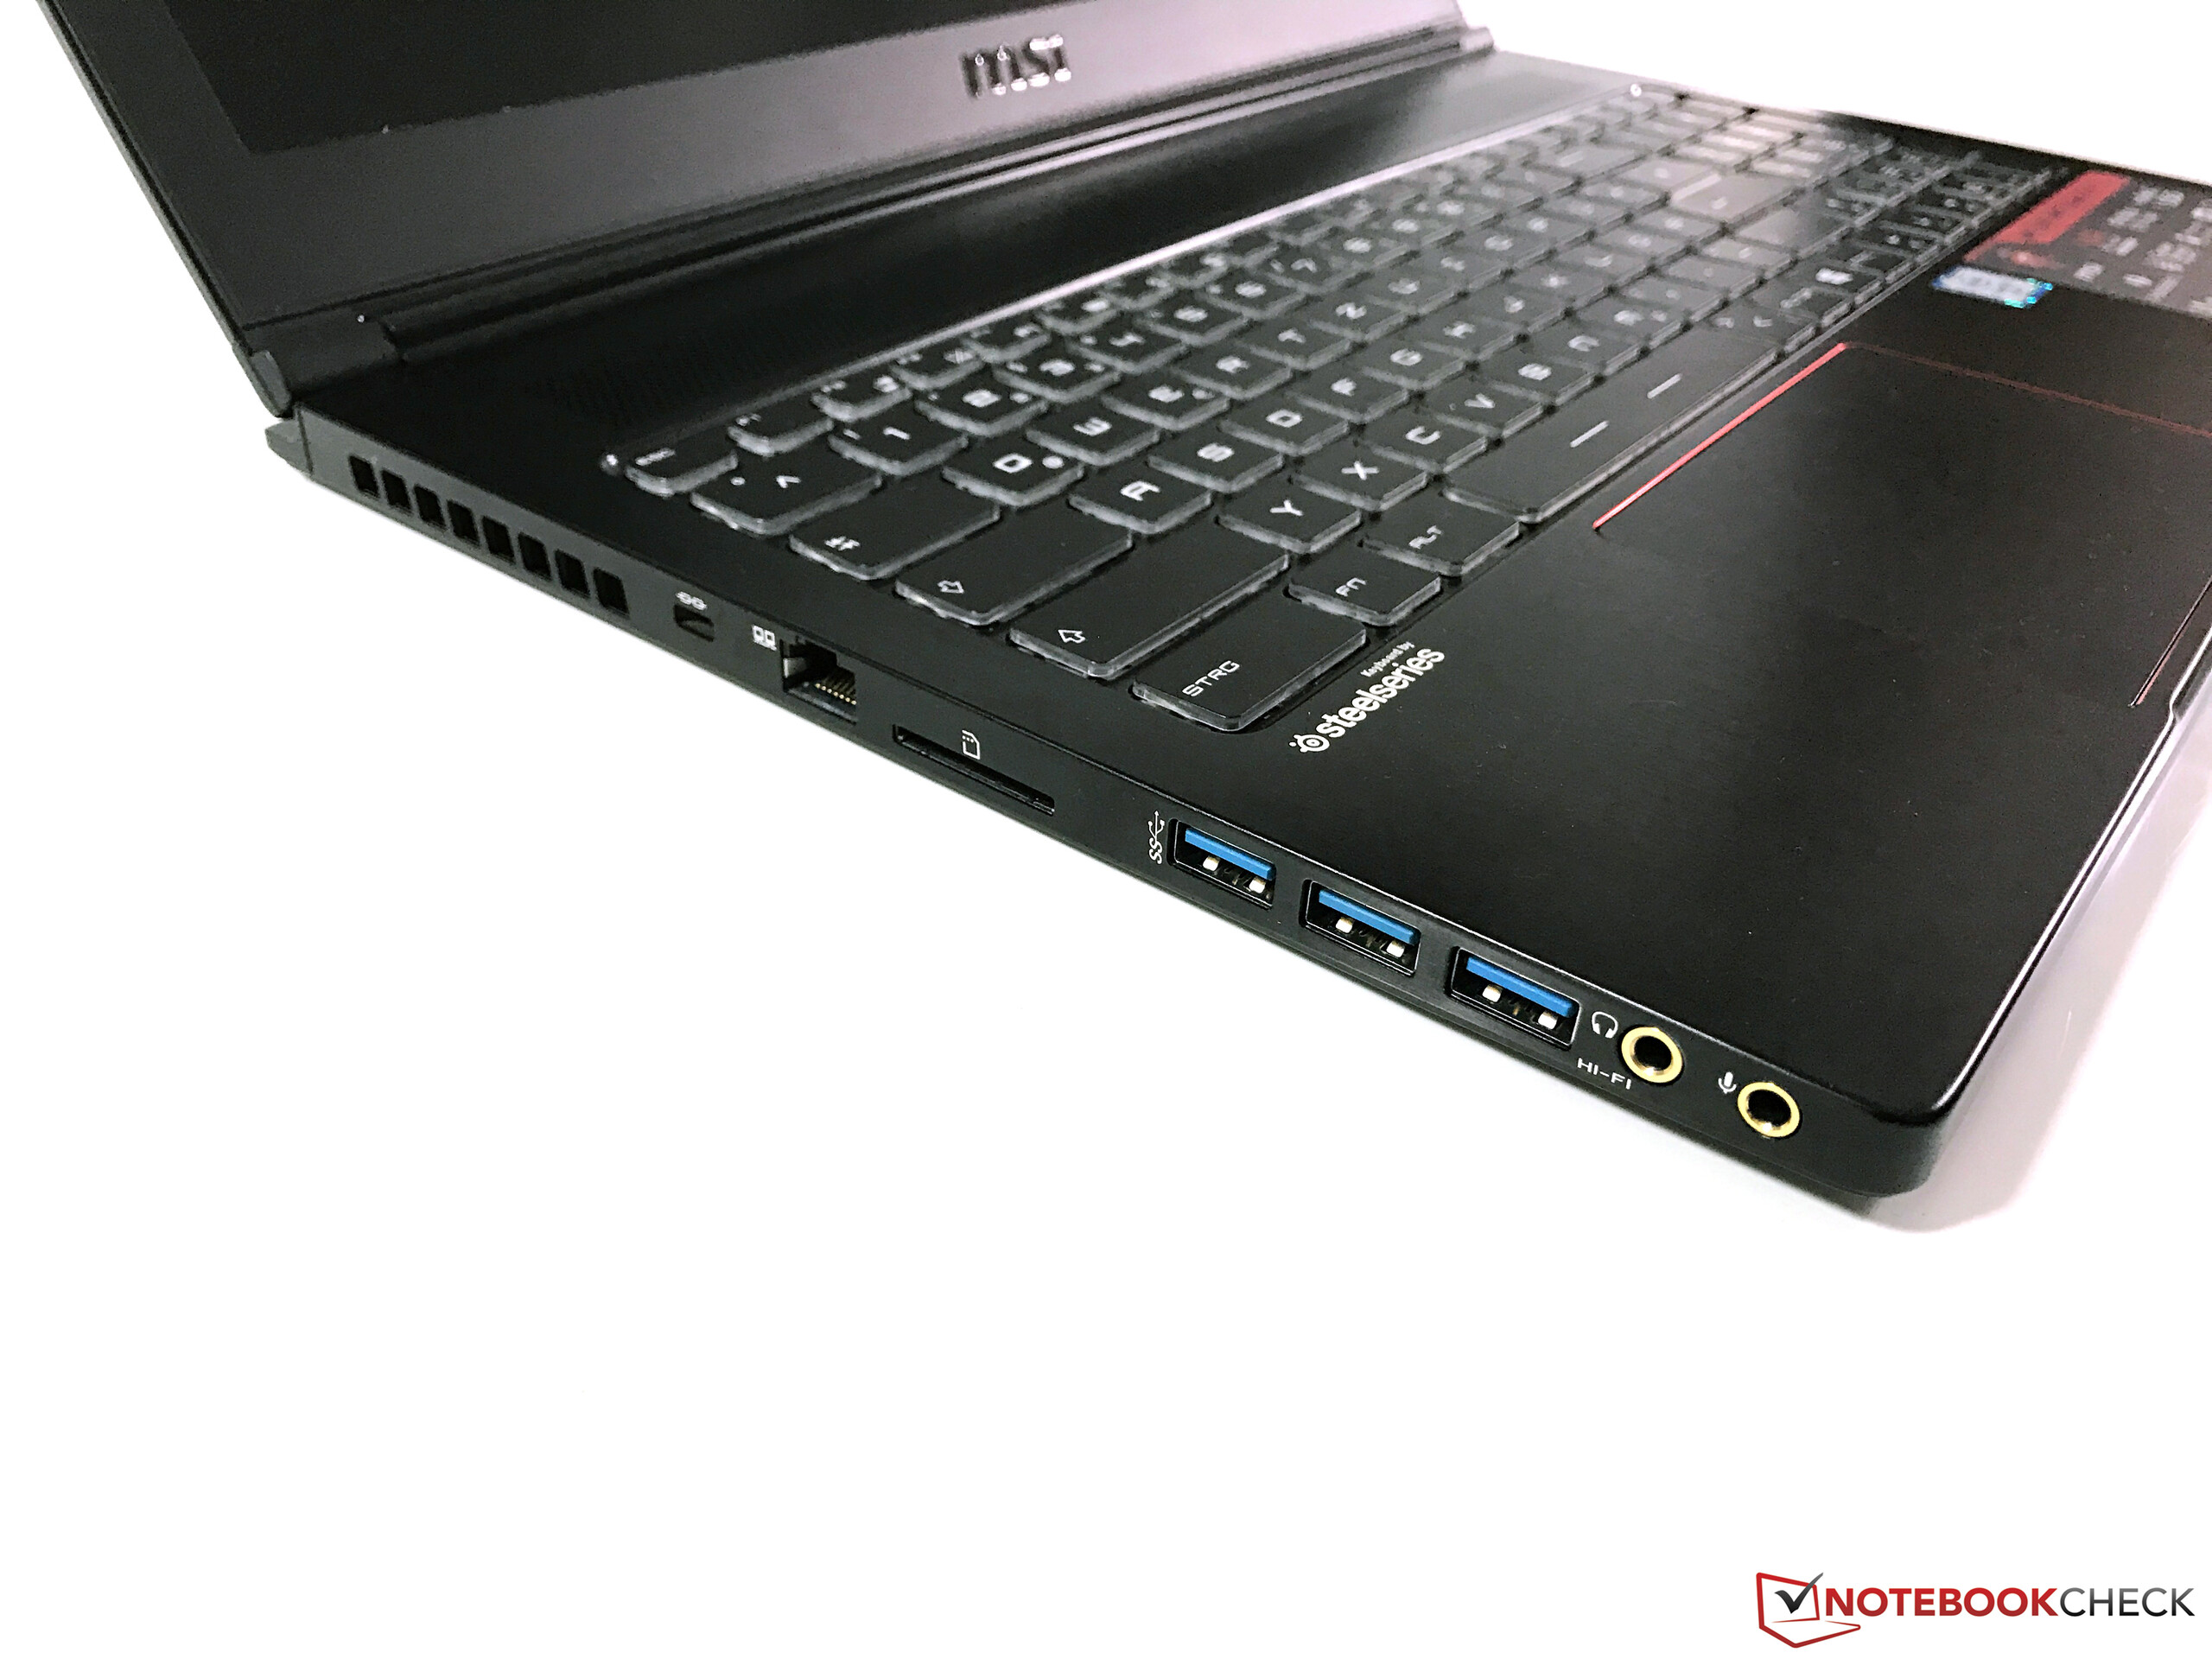
Pero MSI también crea un paquete cómodo: chasis decente, panel Full HD con potencial, puertos modernos, y un buen teclado. Muchos de los añadidos software son útiles para los jugones y las otras especificaciones tampoco son malas.
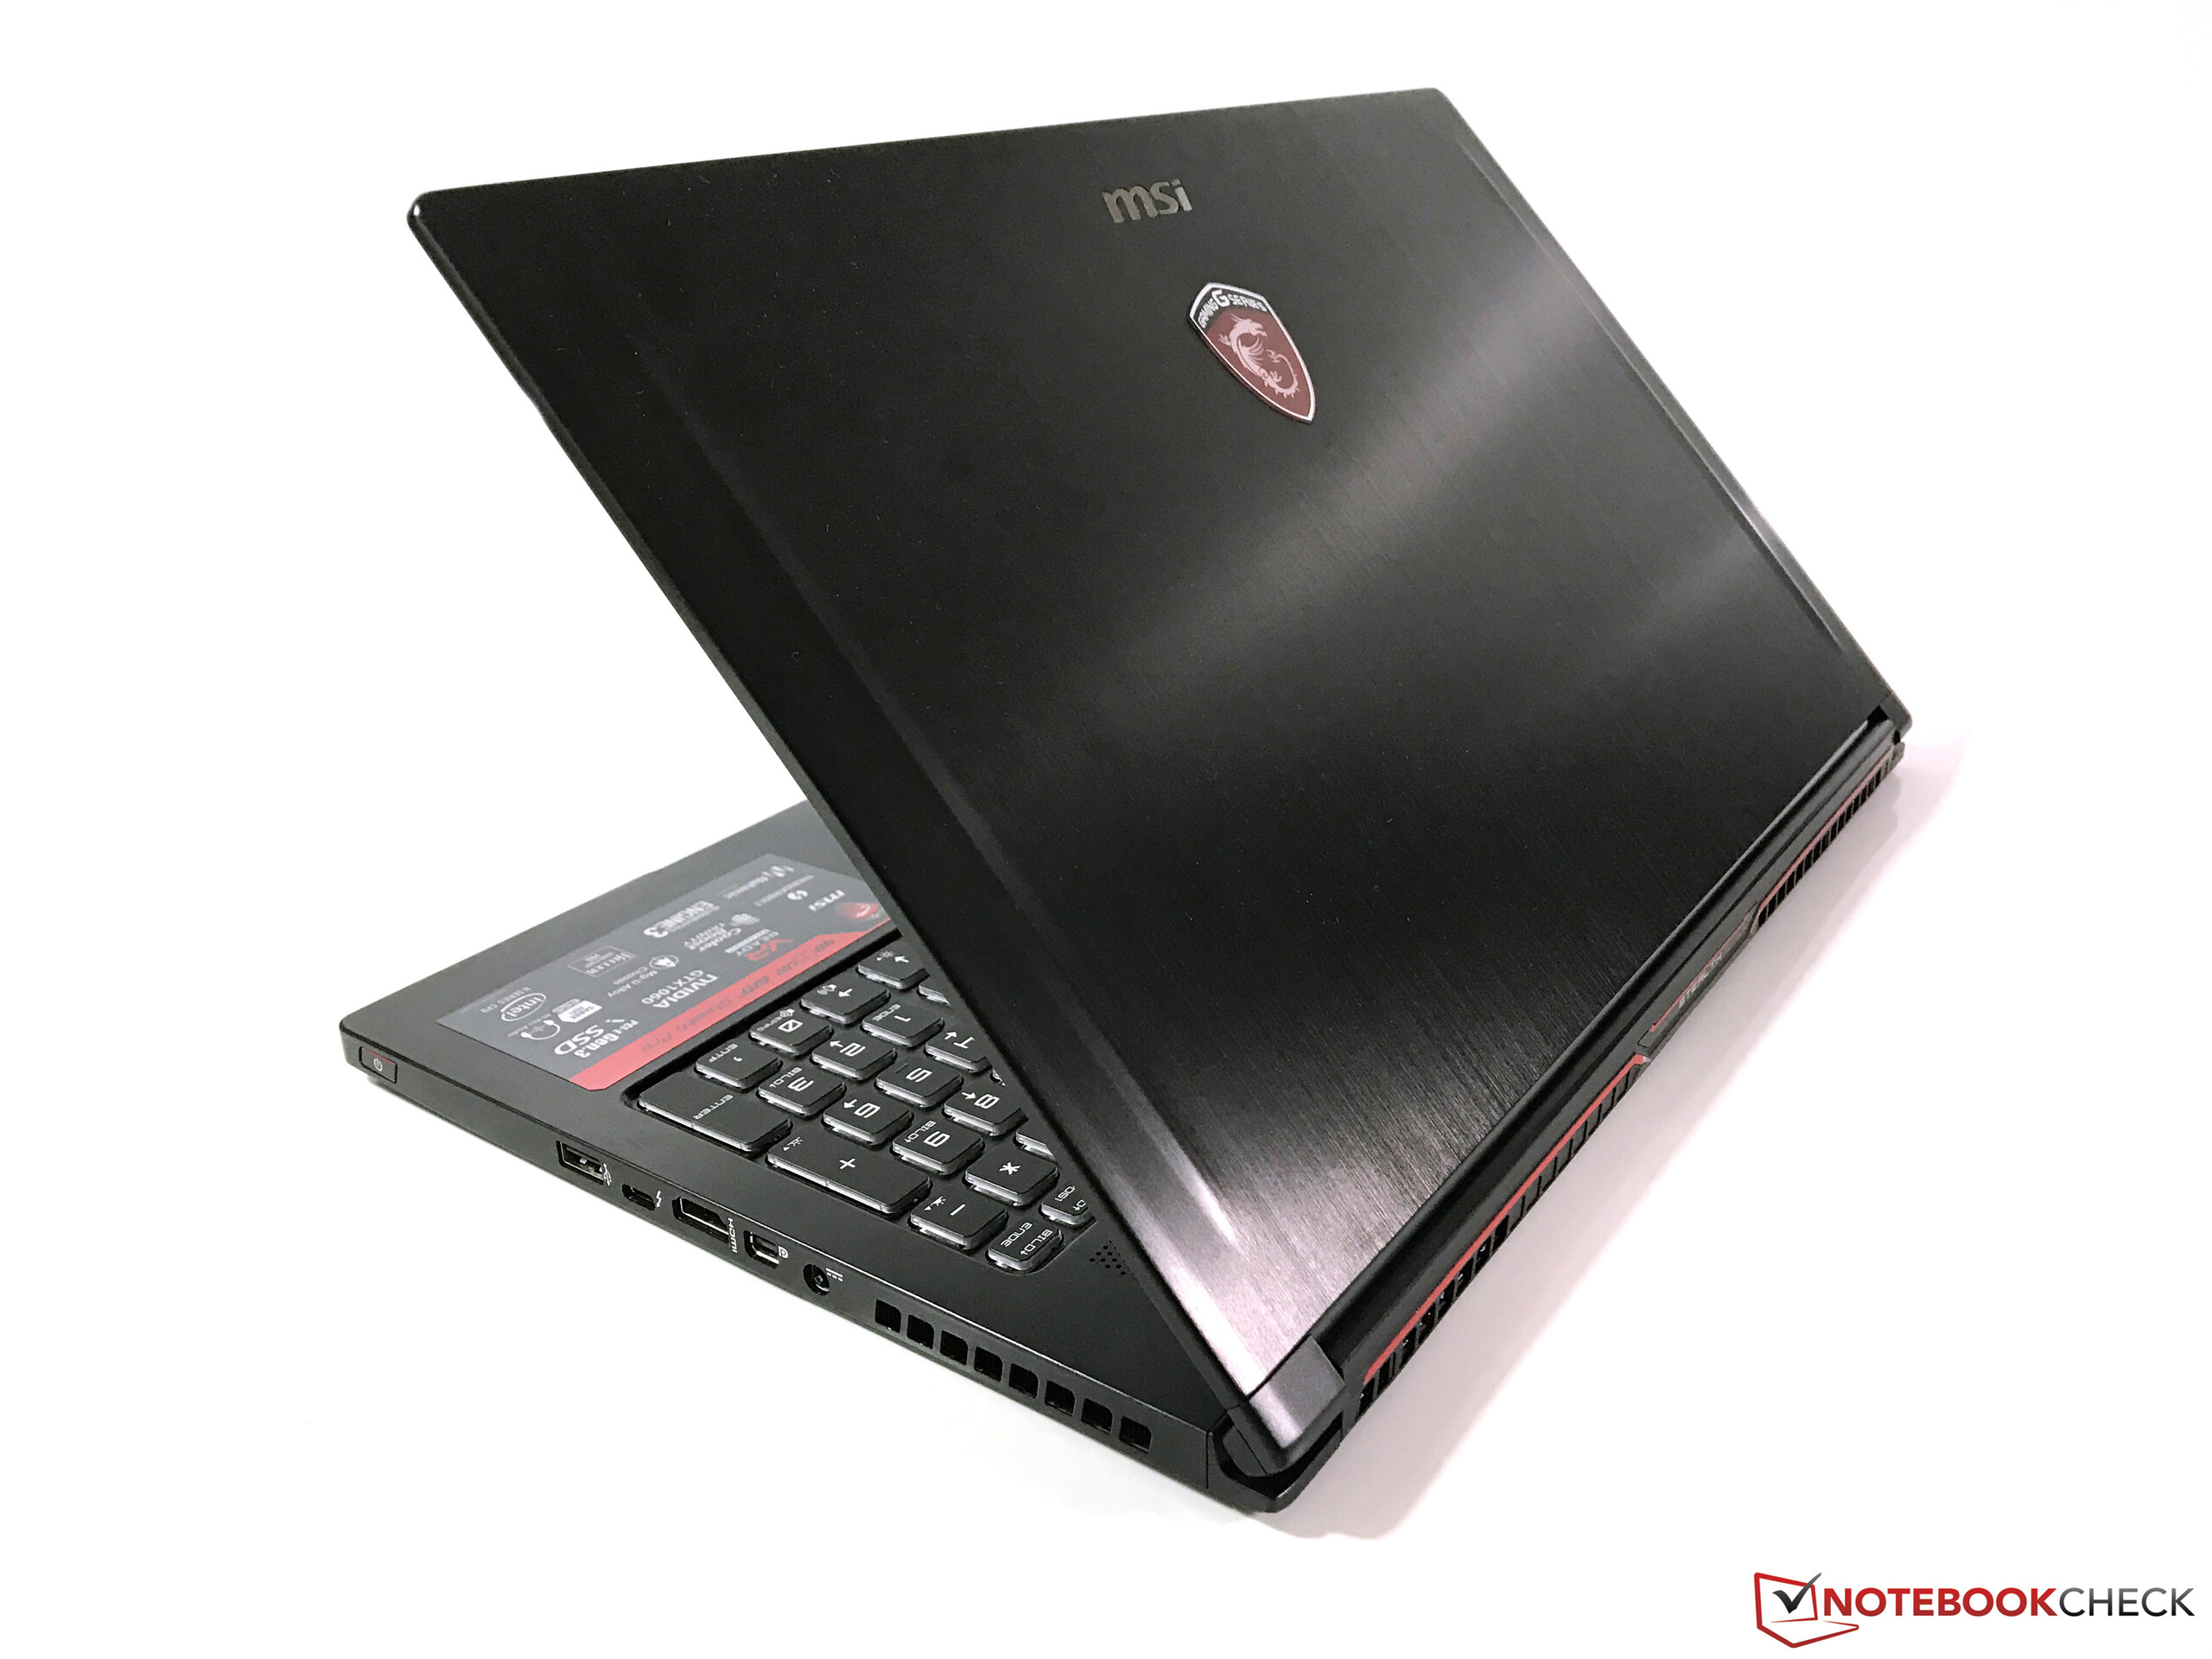
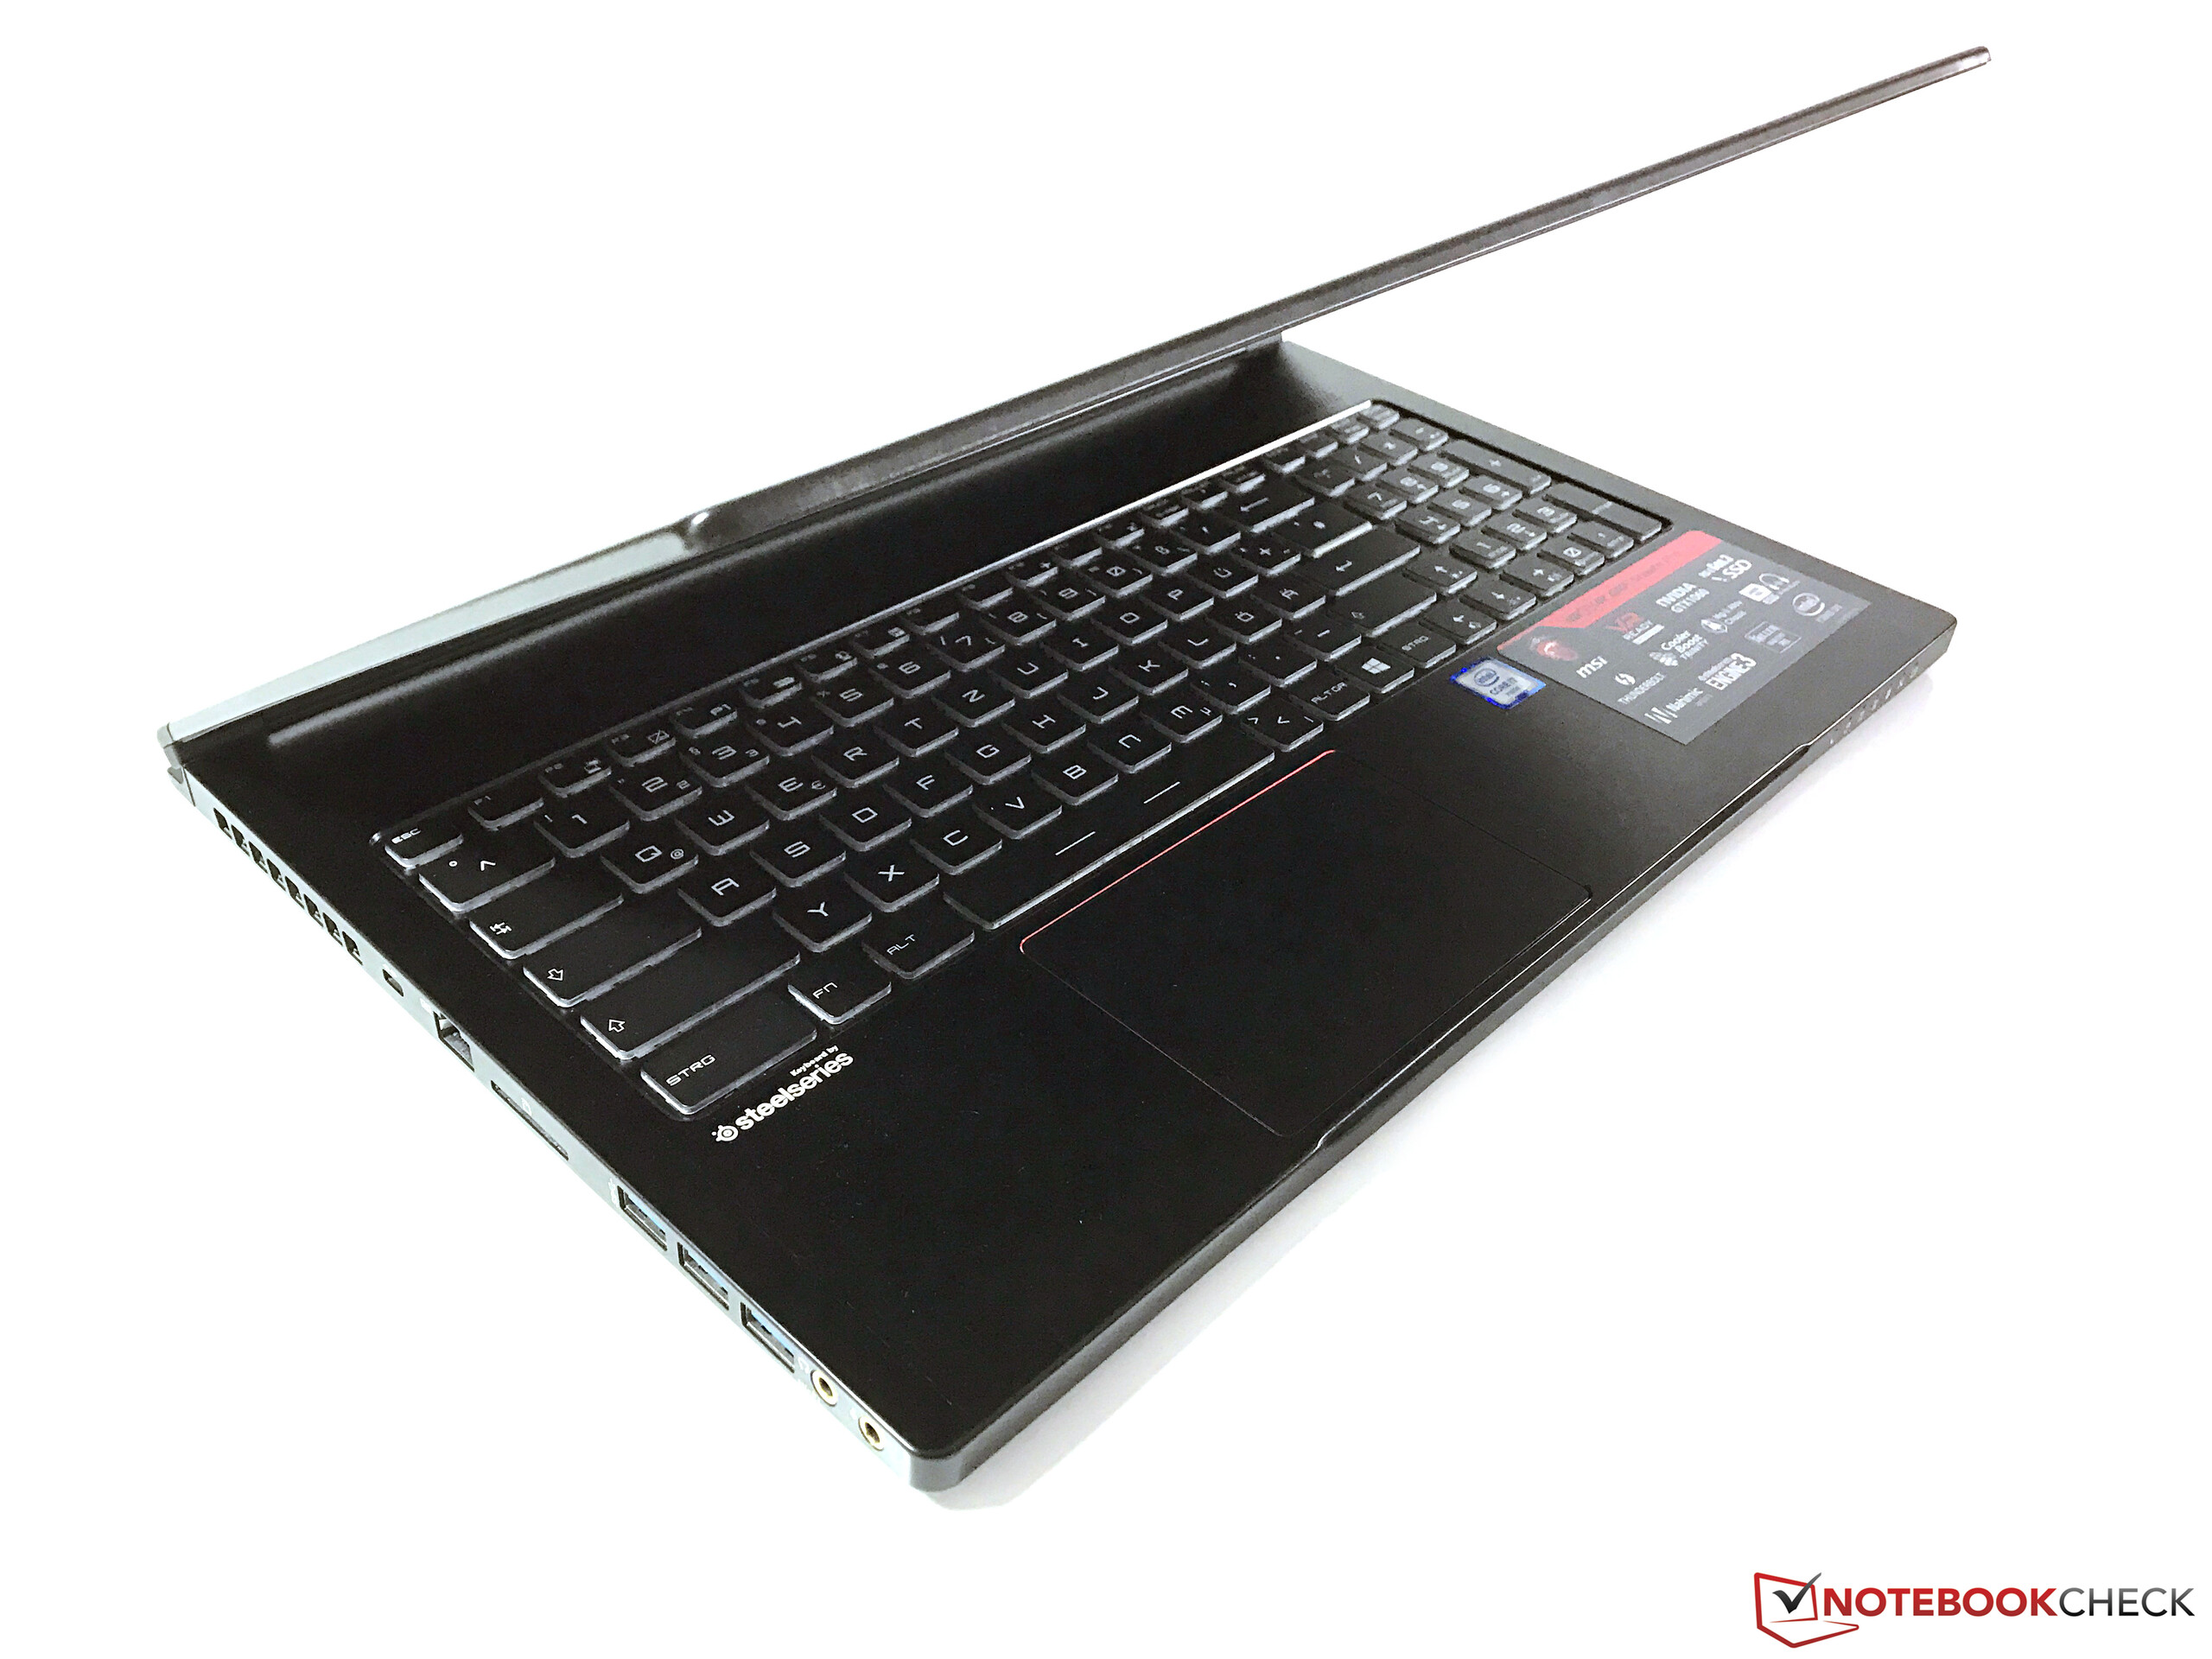
Más rendimiento en un dispositivo delgado no se puede. El MSI GS63VR es uno de los portátiles 15" más delgados del segmento de juegos, pero puede seguirle el ritmo a rivales más voluminosos en términos de rendimiento. Sin embargo, los ventiladores crean ruidos desagradables y el aguante de la batería tampoco es bueno.
El mayor problema aparte de las temperaturas es el desarrollo de ruido. Los ventiladores producen un ruido muy molesto bajo carga y el HDD es audible todo el tiempo en inactivo. Tienes que buscar bien para encontrar otros defectos. La estabilidad del chasis de aluminio podría ser un poquito mejor, el display es bastante oscuro e impreciso de fábrica, el aguante de batería es mediocre a pesar de la gráfica intercambiable, y los altavoces tampoco son un punto fuerte. Una mejor ventilación podría mejorar el rendimiento gráfico aún más. Con todo: si buscas un portátil de juego delgado con mucho rendimiento y sobretodo juegas con un headset, el GS63VR debería estar en tu lista.
Ésta es una versión acortada del análisis original. Puedes leer el análisis completo en inglés aquí.
MSI GS63VR-6RF16H22 Stealth Pro
- 10/18/2016 v5.1 (old)
Andreas Osthoff
Price comparison
