Breve análisis del MSI GS63VR 7RG Stealth Pro (i7-7700HQ, GTX 1070 Max-Q, Full-HD)
| SD Card Reader | |
| average JPG Copy Test (av. of 3 runs) | |
| Aorus X5 v7 (Toshiba Exceria Pro SDXC 64 GB UHS-II) | |
| Eurocom Q5 | |
| MSI GS63VR 7RG-005 (Toshiba Exceria Pro SDXC 64 GB UHS-II) | |
| Gigabyte Aero 15X (Toshiba Exceria Pro SDXC 64 GB UHS-II) | |
| MSI GS63VR-6RF16H22 Stealth Pro (Toshiba Exceria Pro SDXC 64 GB UHS-II) | |
| MSI GS63VR 7RF-228US (Toshiba Exceria Pro SDXC 64 GB UHS-II) | |
| maximum AS SSD Seq Read Test (1GB) | |
| Aorus X5 v7 (Toshiba Exceria Pro SDXC 64 GB UHS-II) | |
| Eurocom Q5 | |
| MSI GS63VR 7RG-005 (Toshiba Exceria Pro SDXC 64 GB UHS-II) | |
| Gigabyte Aero 15X (Toshiba Exceria Pro SDXC 64 GB UHS-II) | |
| MSI GS63VR-6RF16H22 Stealth Pro (Toshiba Exceria Pro SDXC 64 GB UHS-II) | |
| MSI GS63VR 7RF-228US (Toshiba Exceria Pro SDXC 64 GB UHS-II) | |
| Networking | |
| iperf3 transmit AX12 | |
| MSI GS63VR 7RF-228US | |
| MSI GS63VR 7RG-005 | |
| Aorus X5 v7 | |
| Eurocom Q5 | |
| Asus Zephyrus GX501VS | |
| Gigabyte Aero 15X | |
| iperf3 receive AX12 | |
| MSI GS63VR 7RG-005 | |
| Gigabyte Aero 15X | |
| Eurocom Q5 | |
| MSI GS63VR 7RF-228US | |
| Asus Zephyrus GX501VS | |
| Aorus X5 v7 | |
| |||||||||||||||||||||||||
iluminación: 85 %
Brillo con batería: 269 cd/m²
Contraste: 1281:1 (Negro: 0.21 cd/m²)
ΔE ColorChecker Calman: 3 | ∀{0.5-29.43 Ø4.73}
ΔE Greyscale Calman: 3.18 | ∀{0.09-98 Ø4.97}
100% sRGB (Argyll 1.6.3 3D)
77% AdobeRGB 1998 (Argyll 1.6.3 3D)
86.6% AdobeRGB 1998 (Argyll 3D)
100% sRGB (Argyll 3D)
91.6% Display P3 (Argyll 3D)
Gamma: 2.25
CCT: 7274 K
| MSI GS63VR 7RG-005 Chi Mei N156HHE-GA1 (CMN15F4), 1920x1080, 15.6" | Gigabyte Aero 15X Chi Mei N156HCA-EA1 (CMN15D7), 1920x1080, 15.6" | Asus Zephyrus GX501VS ID: AUO42ED, Name: AU Optronics B156HAN04.2, 1920x1080, 15.6" | Eurocom Q5 ID: LGD04D4, Name: LG Philips LP156UD1-SPB1, 3840x2160, 15.6" | Aorus X5 v7 AU Optronics B156ZAN02.3 (AUO23EB), 3840x2160, 15.6" | MSI GS63VR 7RF-228US 3840x2160, 15.6" | MSI GS63VR-6RF16H22 Stealth Pro Samsung 156HL01-104 (SDC324C) , 1920x1080, 15.6" | |
|---|---|---|---|---|---|---|---|
| Display | -21% | -25% | -21% | -20% | -39% | -16% | |
| Display P3 Coverage (%) | 91.6 | 64.7 -29% | 62.1 -32% | 63 -31% | 65.3 -29% | 48.21 -47% | 67.8 -26% |
| sRGB Coverage (%) | 100 | 90.4 -10% | 85.6 -14% | 92.7 -7% | 91.9 -8% | 72.6 -27% | 97.4 -3% |
| AdobeRGB 1998 Coverage (%) | 86.6 | 65.7 -24% | 62.4 -28% | 64.4 -26% | 66.3 -23% | 49.81 -42% | 69.7 -20% |
| Response Times | -323% | -272% | -274% | -312% | -214% | -294% | |
| Response Time Grey 50% / Grey 80% * (ms) | 10.4 ? | 43.2 ? -315% | 33.2 ? -219% | 32.4 ? -212% | 44 ? -323% | 28 ? -169% | |
| Response Time Black / White * (ms) | 6.6 ? | 28.4 ? -330% | 28 ? -324% | 28.8 ? -336% | 26.4 ? -300% | 23.6 ? -258% | 26 ? -294% |
| PWM Frequency (Hz) | 25510 ? | 26000 ? | 1351 ? | 202 ? | |||
| Screen | -40% | -11% | -44% | -21% | -73% | -14% | |
| Brightness middle (cd/m²) | 269 | 338 26% | 307.1 14% | 287.5 7% | 307 14% | 274.2 2% | 293 9% |
| Brightness (cd/m²) | 254 | 324 28% | 309 22% | 279 10% | 297 17% | 263 4% | 279 10% |
| Brightness Distribution (%) | 85 | 88 4% | 86 1% | 87 2% | 92 8% | 92 8% | 84 -1% |
| Black Level * (cd/m²) | 0.21 | 0.34 -62% | 0.35 -67% | 0.65 -210% | 0.3 -43% | 0.44 -110% | 0.33 -57% |
| Contrast (:1) | 1281 | 994 -22% | 877 -32% | 442 -65% | 1023 -20% | 623 -51% | 888 -31% |
| Colorchecker dE 2000 * | 3 | 5.92 -97% | 3.4 -13% | 4.5 -50% | 4.72 -57% | 8 -167% | 3.59 -20% |
| Colorchecker dE 2000 max. * | 5.62 | 11.77 -109% | 8.2 -46% | 8.9 -58% | 8.07 -44% | 14.6 -160% | 5.79 -3% |
| Greyscale dE 2000 * | 3.18 | 7.45 -134% | 1.4 56% | 4.6 -45% | 4.79 -51% | 9.1 -186% | 3.86 -21% |
| Gamma | 2.25 98% | 2.58 85% | 2.19 100% | 2.39 92% | 2.42 91% | 2.24 98% | 2.53 87% |
| CCT | 7274 89% | 6366 102% | 6558 99% | 7393 88% | 7690 85% | 5020 129% | 7229 90% |
| Color Space (Percent of AdobeRGB 1998) (%) | 77 | 59 -23% | 55.6 -28% | 59 -23% | 60 -22% | 45.7 -41% | 63 -18% |
| Color Space (Percent of sRGB) (%) | 100 | 90 -10% | 85 -15% | 92.3 -8% | 92 -8% | 72.1 -28% | 97 -3% |
| Media total (Programa/Opciones) | -128% /
-74% | -103% /
-48% | -113% /
-70% | -118% /
-59% | -109% /
-85% | -108% /
-34% |
* ... más pequeño es mejor
Parpadeo de Pantalla / PWM (Pulse-Width Modulation)
| Parpadeo de Pantalla / PWM detectado | 25510 Hz | ≤ 25 % de brillo | 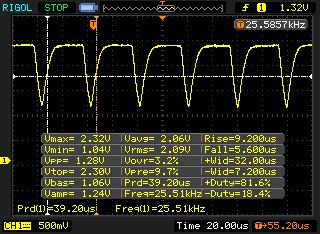 |
La retroiluminación del display parpadea a 25510 Hz (seguramente usa PWM - Pulse-Width Modulation) a un brillo del 25 % e inferior. Sobre este nivel de brillo no debería darse parpadeo / PWM. La frecuencia de 25510 Hz es bastante alta, por lo que la mayoría de gente sensible al parpadeo no debería ver parpadeo o tener fatiga visual. Comparación: 52 % de todos los dispositivos testados no usaron PWM para atenuar el display. Si se usó, medimos una media de 7798 (mínimo: 5 - máxmo: 343500) Hz. | |||
Tiempos de respuesta del display
| ↔ Tiempo de respuesta de Negro a Blanco | ||
|---|---|---|
| 6.6 ms ... subida ↗ y bajada ↘ combinada | ↗ 4.4 ms subida | 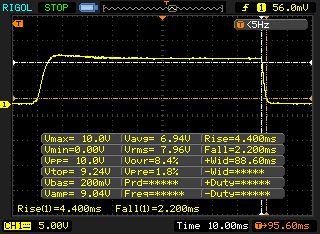 |
| ↘ 2.2 ms bajada | ||
| La pantalla mostró tiempos de respuesta muy rápidos en nuestros tests y debería ser adecuada para juegos frenéticos. En comparación, todos los dispositivos de prueba van de ##min### (mínimo) a 240 (máximo) ms. » 20 % de todos los dispositivos son mejores. Esto quiere decir que el tiempo de respuesta medido es mejor que la media (19.9 ms) de todos los dispositivos testados. | ||
| ↔ Tiempo de respuesta 50% Gris a 80% Gris | ||
| 10.4 ms ... subida ↗ y bajada ↘ combinada | ↗ 6 ms subida | 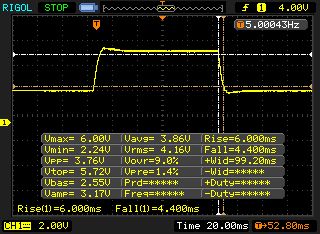 |
| ↘ 4.4 ms bajada | ||
| La pantalla mostró buenos tiempos de respuesta en nuestros tests pero podría ser demasiado lenta para los jugones competitivos. En comparación, todos los dispositivos de prueba van de ##min### (mínimo) a 636 (máximo) ms. » 24 % de todos los dispositivos son mejores. Esto quiere decir que el tiempo de respuesta medido es mejor que la media (31.1 ms) de todos los dispositivos testados. | ||
| Cinebench R10 | |
| Rendering Multiple CPUs 32Bit | |
| Gigabyte Aero 15X | |
| MSI GS63VR 7RG-005 | |
| Asus Zephyrus GX501VS | |
| MSI GS63VR 7RF-228US | |
| Eurocom Q5 | |
| Rendering Single 32Bit | |
| Gigabyte Aero 15X | |
| MSI GS63VR 7RG-005 | |
| Eurocom Q5 | |
| Asus Zephyrus GX501VS | |
| MSI GS63VR 7RF-228US | |
| Geekbench 3 | |
| 32 Bit Multi-Core Score | |
| Gigabyte Aero 15X | |
| MSI GS63VR 7RG-005 | |
| 32 Bit Single-Core Score | |
| Gigabyte Aero 15X | |
| MSI GS63VR 7RG-005 | |
| Geekbench 4.0 | |
| 64 Bit Multi-Core Score | |
| Gigabyte Aero 15X | |
| MSI GS63VR 7RG-005 | |
| 64 Bit Single-Core Score | |
| Gigabyte Aero 15X | |
| MSI GS63VR 7RG-005 | |
| Geekbench 4.4 | |
| 64 Bit Multi-Core Score | |
| Gigabyte Aero 15X | |
| MSI GS63VR 7RG-005 | |
| 64 Bit Single-Core Score | |
| Gigabyte Aero 15X | |
| MSI GS63VR 7RG-005 | |
| JetStream 1.1 - 1.1 Total | |
| Gigabyte Aero 15X (Edge 41) | |
| MSI GS63VR 7RG-005 (Edge 41) | |
| Eurocom Q5 (Edge 40.15063.0.0) | |
| MSI GS63VR 7RF-228US (Edge 38.14393.0.0) | |
| MSI GS63VR-6RF16H22 Stealth Pro (Edge 25.10586.0.0) | |
| Asus Zephyrus GX501VS (Edge 40.15063.0.0) | |
| PCMark 7 Score | 5755 puntos | |
| PCMark 8 Home Score Accelerated v2 | 4193 puntos | |
| PCMark 8 Creative Score Accelerated v2 | 5362 puntos | |
| PCMark 8 Work Score Accelerated v2 | 5176 puntos | |
| PCMark 10 Score | 4542 puntos | |
ayuda | ||

| MSI GS63VR 7RG-005 Samsung SM961 MZVPW256HEGL | Gigabyte Aero 15X Samsung SM961 MZVKW512HMJP m.2 PCI-e | Aorus X5 v7 Toshiba NVMe THNSN5256GPU7 | MSI GS63VR 7RF-228US Samsung SM961 MZVKW512HMJP m.2 PCI-e | MSI GS63VR-6RF16H22 Stealth Pro Samsung SM951 MZVPV256HDGL m.2 PCI-e | |
|---|---|---|---|---|---|
| CrystalDiskMark 3.0 | -7% | 11% | 9% | 17% | |
| Read Seq (MB/s) | 2065 | 1381 -33% | 1479 -28% | 2141 4% | 1973 -4% |
| Write Seq (MB/s) | 1459 | 1546 6% | 1076 -26% | 1621 11% | 1292 -11% |
| Read 512 (MB/s) | 439.4 | 418 -5% | 1086 147% | 499.7 14% | 1279 191% |
| Write 512 (MB/s) | 1283 | 1277 0% | 1101 -14% | 1531 19% | 1288 0% |
| Read 4k (MB/s) | 56.6 | 51.3 -9% | 44 -22% | 54.2 -4% | 52.3 -8% |
| Write 4k (MB/s) | 148.4 | 131 -12% | 137.8 -7% | 158.2 7% | 153.2 3% |
| Read 4k QD32 (MB/s) | 576 | 544 -6% | 697 21% | 632 10% | 464.4 -19% |
| Write 4k QD32 (MB/s) | 480.6 | 480.2 0% | 556 16% | 527 10% | 384.4 -20% |
| 3DMark 06 Standard Score | 26805 puntos | |
| 3DMark 11 Performance | 13513 puntos | |
| 3DMark Ice Storm Standard Score | 121077 puntos | |
| 3DMark Cloud Gate Standard Score | 25810 puntos | |
| 3DMark Fire Strike Score | 11857 puntos | |
| 3DMark Fire Strike Extreme Score | 6272 puntos | |
| 3DMark Time Spy Score | 4396 puntos | |
ayuda | ||
| 3DMark - 1920x1080 Fire Strike Graphics | |
| Aorus X5 v7 | |
| Asus Zephyrus GX501VS | |
| Gigabyte Aero 15X | |
| Eurocom Q5 | |
| MSI GS63VR 7RG-005 | |
| MSI GS63VR-6RF16H22 Stealth Pro | |
| MSI GS63VR 7RF-228US | |
| 3DMark 11 - 1280x720 Performance GPU | |
| Aorus X5 v7 | |
| Asus Zephyrus GX501VS | |
| Gigabyte Aero 15X | |
| Eurocom Q5 | |
| MSI GS63VR 7RG-005 | |
| MSI GS63VR-6RF16H22 Stealth Pro | |
| MSI GS63VR 7RF-228US | |
| The Witcher 3 - 1920x1080 Ultra Graphics & Postprocessing (HBAO+) | |
| Aorus X5 v7 | |
| Gigabyte Aero 15X | |
| Asus Zephyrus GX501VS | |
| MSI GS63VR 7RG-005 | |
| Eurocom Q5 | |
| MSI GS63VR-6RF16H22 Stealth Pro | |
| MSI GS63VR 7RF-228US | |
| BioShock Infinite - 1920x1080 Ultra Preset, DX11 (DDOF) | |
| Asus Zephyrus GX501VS | |
| Eurocom Q5 | |
| Gigabyte Aero 15X | |
| MSI GS63VR 7RG-005 | |
| MSI GS63VR-6RF16H22 Stealth Pro | |
| MSI GS63VR 7RF-228US | |
| ELEX - 1920x1080 Ultra / On AA:SM AF:16x | |
| Gigabyte Aero 15X | |
| MSI GS63VR 7RG-005 | |
| Middle-earth: Shadow of War - 1920x1080 Ultra Preset AA:T | |
| Gigabyte Aero 15X | |
| MSI GS63VR 7RG-005 | |
| bajo | medio | alto | ultra | |
|---|---|---|---|---|
| Tomb Raider (2013) | 407.5 | 376.4 | 339.3 | 179.1 |
| BioShock Infinite (2013) | 239.4 | 173.8 | 161.5 | 109.6 |
| The Witcher 3 (2015) | 175.7 | 140.8 | 90.3 | 50.2 |
| Middle-earth: Shadow of War (2017) | 91 | 82 | 74 | 62 |
| ELEX (2017) | 120.5 | 87.7 | 77.9 | 63.3 |
| Assassin´s Creed Origins (2017) | 63 | 53 | 52 | 44 |
| Call of Duty WWII (2017) | 163.3 | 133.5 | 97.2 | 86 |
| Need for Speed Payback (2017) | 112.4 | 95.9 | 89.9 | 87.2 |
Ruido
| Ocioso |
| 31 / 34 / 35 dB(A) |
| HDD |
| 34 dB(A) |
| Carga |
| 42 / 46 dB(A) |
 | ||
30 dB silencioso 40 dB(A) audible 50 dB(A) ruidosamente alto |
||
min: | ||
| MSI GS63VR 7RG-005 i7-7700HQ, GeForce GTX 1070 Max-Q | Gigabyte Aero 15X i7-7700HQ, GeForce GTX 1070 Max-Q | Asus Zephyrus GX501VS i7-7700HQ, GeForce GTX 1070 Max-Q | Eurocom Q5 i7-7700HQ, GeForce GTX 1070 Max-Q | Aorus X5 v7 i7-7820HK, GeForce GTX 1070 Mobile | MSI GS63VR 7RF-228US i7-7700HQ, GeForce GTX 1060 Mobile | MSI GS63VR-6RF16H22 Stealth Pro 6700HQ, GeForce GTX 1060 Mobile | |
|---|---|---|---|---|---|---|---|
| Noise | -0% | 8% | -1% | -9% | 1% | 3% | |
| apagado / medio ambiente * (dB) | 30 | 30 -0% | 28.5 5% | 29 3% | 30 -0% | 28.8 4% | 30 -0% |
| Idle Minimum * (dB) | 31 | 31 -0% | 28.5 8% | 31.5 -2% | 35 -13% | 33.1 -7% | 32 -3% |
| Idle Average * (dB) | 34 | 32 6% | 28.5 16% | 33.8 1% | 36 -6% | 33.1 3% | 33 3% |
| Idle Maximum * (dB) | 35 | 36 -3% | 30.1 14% | 33.8 3% | 40 -14% | 34 3% | 34 3% |
| Load Average * (dB) | 42 | 39 7% | 35.2 16% | 41.7 1% | 43 -2% | 37.2 11% | 37 12% |
| Witcher 3 ultra * (dB) | 44 | 44 -0% | 41.7 5% | 41.7 5% | 49 -11% | 46.1 -5% | |
| Load Maximum * (dB) | 46 | 52 -13% | 48.8 -6% | 54.2 -18% | 55 -20% | 47.1 -2% | 46 -0% |
* ... más pequeño es mejor
(-) La temperatura máxima en la parte superior es de 47 °C / 117 F, frente a la media de 40.4 °C / 105 F, que oscila entre 21.2 y 68.8 °C para la clase Gaming.
(-) El fondo se calienta hasta un máximo de 63 °C / 145 F, frente a la media de 43.2 °C / 110 F
(+) En reposo, la temperatura media de la parte superior es de 24.1 °C / 75# F, frente a la media del dispositivo de 33.9 °C / 93 F.
(±) Jugando a The Witcher 3, la temperatura media de la parte superior es de 37.9 °C / 100 F, frente a la media del dispositivo de 33.9 °C / 93 F.
(±) El reposamanos y el touchpad pueden calentarse mucho al tacto con un máximo de 38 °C / 100.4 F.
(-) La temperatura media de la zona del reposamanos de dispositivos similares fue de 28.8 °C / 83.8 F (-9.2 °C / -16.6 F).
| MSI GS63VR 7RG-005 i7-7700HQ, GeForce GTX 1070 Max-Q | Gigabyte Aero 15X i7-7700HQ, GeForce GTX 1070 Max-Q | Asus Zephyrus GX501VS i7-7700HQ, GeForce GTX 1070 Max-Q | Eurocom Q5 i7-7700HQ, GeForce GTX 1070 Max-Q | Aorus X5 v7 i7-7820HK, GeForce GTX 1070 Mobile | MSI GS63VR 7RF-228US i7-7700HQ, GeForce GTX 1060 Mobile | MSI GS63VR-6RF16H22 Stealth Pro 6700HQ, GeForce GTX 1060 Mobile | |
|---|---|---|---|---|---|---|---|
| Heat | 2% | -2% | -10% | -13% | -12% | 1% | |
| Maximum Upper Side * (°C) | 47 | 51 -9% | 54.4 -16% | 56.2 -20% | 64 -36% | 45.3 4% | |
| Maximum Bottom * (°C) | 63 | 58 8% | 41.2 35% | 61.2 3% | 56 11% | 62.6 1% | |
| Idle Upper Side * (°C) | 25 | 25 -0% | 31.2 -25% | 27.8 -11% | 29 -16% | 28.4 -14% | 25.3 -1% |
| Idle Bottom * (°C) | 27 | 25 7% | 27.6 -2% | 29.6 -10% | 30 -11% | 29.6 -10% | 27.3 -1% |
* ... más pequeño es mejor
MSI GS63VR 7RG-005 análisis de audio
(+) | los altavoces pueden reproducir a un volumen relativamente alto (#90 dB)
Graves 100 - 315 Hz
(-) | casi sin bajos - de media 21.3% inferior a la mediana
(-) | los graves no son lineales (15.2% delta a la frecuencia anterior)
Medios 400 - 2000 Hz
(±) | medias más altas - de media 11% más altas que la mediana
(±) | la linealidad de los medios es media (10% delta respecto a la frecuencia anterior)
Altos 2 - 16 kHz
(+) | máximos equilibrados - a sólo 3.4% de la mediana
(±) | la linealidad de los máximos es media (9.2% delta a frecuencia anterior)
Total 100 - 16.000 Hz
(±) | la linealidad del sonido global es media (24.2% de diferencia con la mediana)
En comparación con la misma clase
» 87% de todos los dispositivos probados de esta clase eran mejores, 4% similares, 9% peores
» El mejor tuvo un delta de 6%, la media fue 18%, el peor fue ###max##%
En comparación con todos los dispositivos probados
» 73% de todos los dispositivos probados eran mejores, 6% similares, 21% peores
» El mejor tuvo un delta de 4%, la media fue 24%, el peor fue ###max##%
Aorus X5 v7 análisis de audio
(±) | la sonoridad del altavoz es media pero buena (78 dB)
Graves 100 - 315 Hz
(-) | casi sin bajos - de media 19% inferior a la mediana
(±) | la linealidad de los graves es media (10.6% delta a frecuencia anterior)
Medios 400 - 2000 Hz
(+) | medios equilibrados - a sólo 4.2% de la mediana
(+) | los medios son lineales (5.8% delta a la frecuencia anterior)
Altos 2 - 16 kHz
(+) | máximos equilibrados - a sólo 2.1% de la mediana
(+) | los máximos son lineales (5.4% delta a la frecuencia anterior)
Total 100 - 16.000 Hz
(±) | la linealidad del sonido global es media (18.7% de diferencia con la mediana)
En comparación con la misma clase
» 61% de todos los dispositivos probados de esta clase eran mejores, 8% similares, 31% peores
» El mejor tuvo un delta de 6%, la media fue 18%, el peor fue ###max##%
En comparación con todos los dispositivos probados
» 43% de todos los dispositivos probados eran mejores, 8% similares, 50% peores
» El mejor tuvo un delta de 4%, la media fue 24%, el peor fue ###max##%
| Off / Standby | |
| Ocioso | |
| Carga |
|
Clave:
min: | |
| MSI GS63VR 7RG-005 i7-7700HQ, GeForce GTX 1070 Max-Q | Gigabyte Aero 15X i7-7700HQ, GeForce GTX 1070 Max-Q | Asus Zephyrus GX501VS i7-7700HQ, GeForce GTX 1070 Max-Q | Eurocom Q5 i7-7700HQ, GeForce GTX 1070 Max-Q | Aorus X5 v7 i7-7820HK, GeForce GTX 1070 Mobile | MSI GS63VR 7RF-228US i7-7700HQ, GeForce GTX 1060 Mobile | MSI GS63VR-6RF16H22 Stealth Pro 6700HQ, GeForce GTX 1060 Mobile | |
|---|---|---|---|---|---|---|---|
| Power Consumption | 9% | -15% | 12% | -63% | -4% | -25% | |
| Idle Minimum * (Watt) | 12 | 10 17% | 19.1 -59% | 9 25% | 26 -117% | 14.5 -21% | 18 -50% |
| Idle Average * (Watt) | 16 | 13 19% | 20.8 -30% | 13.5 16% | 31 -94% | 17.3 -8% | 22 -38% |
| Idle Maximum * (Watt) | 21 | 20 5% | 21.8 -4% | 13.7 35% | 36 -71% | 17.4 17% | 30 -43% |
| Load Average * (Watt) | 85 | 79 7% | 73.7 13% | 87.8 -3% | 93 -9% | 93 -9% | 77 9% |
| Witcher 3 ultra * (Watt) | 128 | 120 6% | 130.2 -2% | 129 -1% | 176 -38% | 128.8 -1% | |
| Load Maximum * (Watt) | 162 | 165 -2% | 173.1 -7% | 158.6 2% | 240 -48% | 165 -2% |
* ... más pequeño es mejor
| MSI GS63VR 7RG-005 i7-7700HQ, GeForce GTX 1070 Max-Q, 52.4 Wh | Gigabyte Aero 15X i7-7700HQ, GeForce GTX 1070 Max-Q, 94.2 Wh | Asus Zephyrus GX501VS i7-7700HQ, GeForce GTX 1070 Max-Q, 50 Wh | Eurocom Q5 i7-7700HQ, GeForce GTX 1070 Max-Q, 55 Wh | Aorus X5 v7 i7-7820HK, GeForce GTX 1070 Mobile, 94 Wh | MSI GS63VR 7RF-228US i7-7700HQ, GeForce GTX 1060 Mobile, 65 Wh | MSI GS63VR-6RF16H22 Stealth Pro 6700HQ, GeForce GTX 1060 Mobile, 65 Wh | |
|---|---|---|---|---|---|---|---|
| Duración de Batería | 125% | -30% | 9% | -16% | 14% | 11% | |
| Reader / Idle (h) | 5.7 | 13 128% | 3.8 -33% | 7.8 37% | 3.5 -39% | 6.4 12% | 6 5% |
| H.264 (h) | 3.8 | 7.6 100% | 2.7 -29% | 4.5 18% | |||
| WiFi v1.3 (h) | 3.9 | 8.2 110% | 2.5 -36% | 4.3 10% | 2.5 -36% | 3.9 0% | 3.5 -10% |
| Load (h) | 1 | 2.6 160% | 0.8 -20% | 0.8 -20% | 1.4 40% | 1.3 30% | 1.3 30% |
Pro
Contra
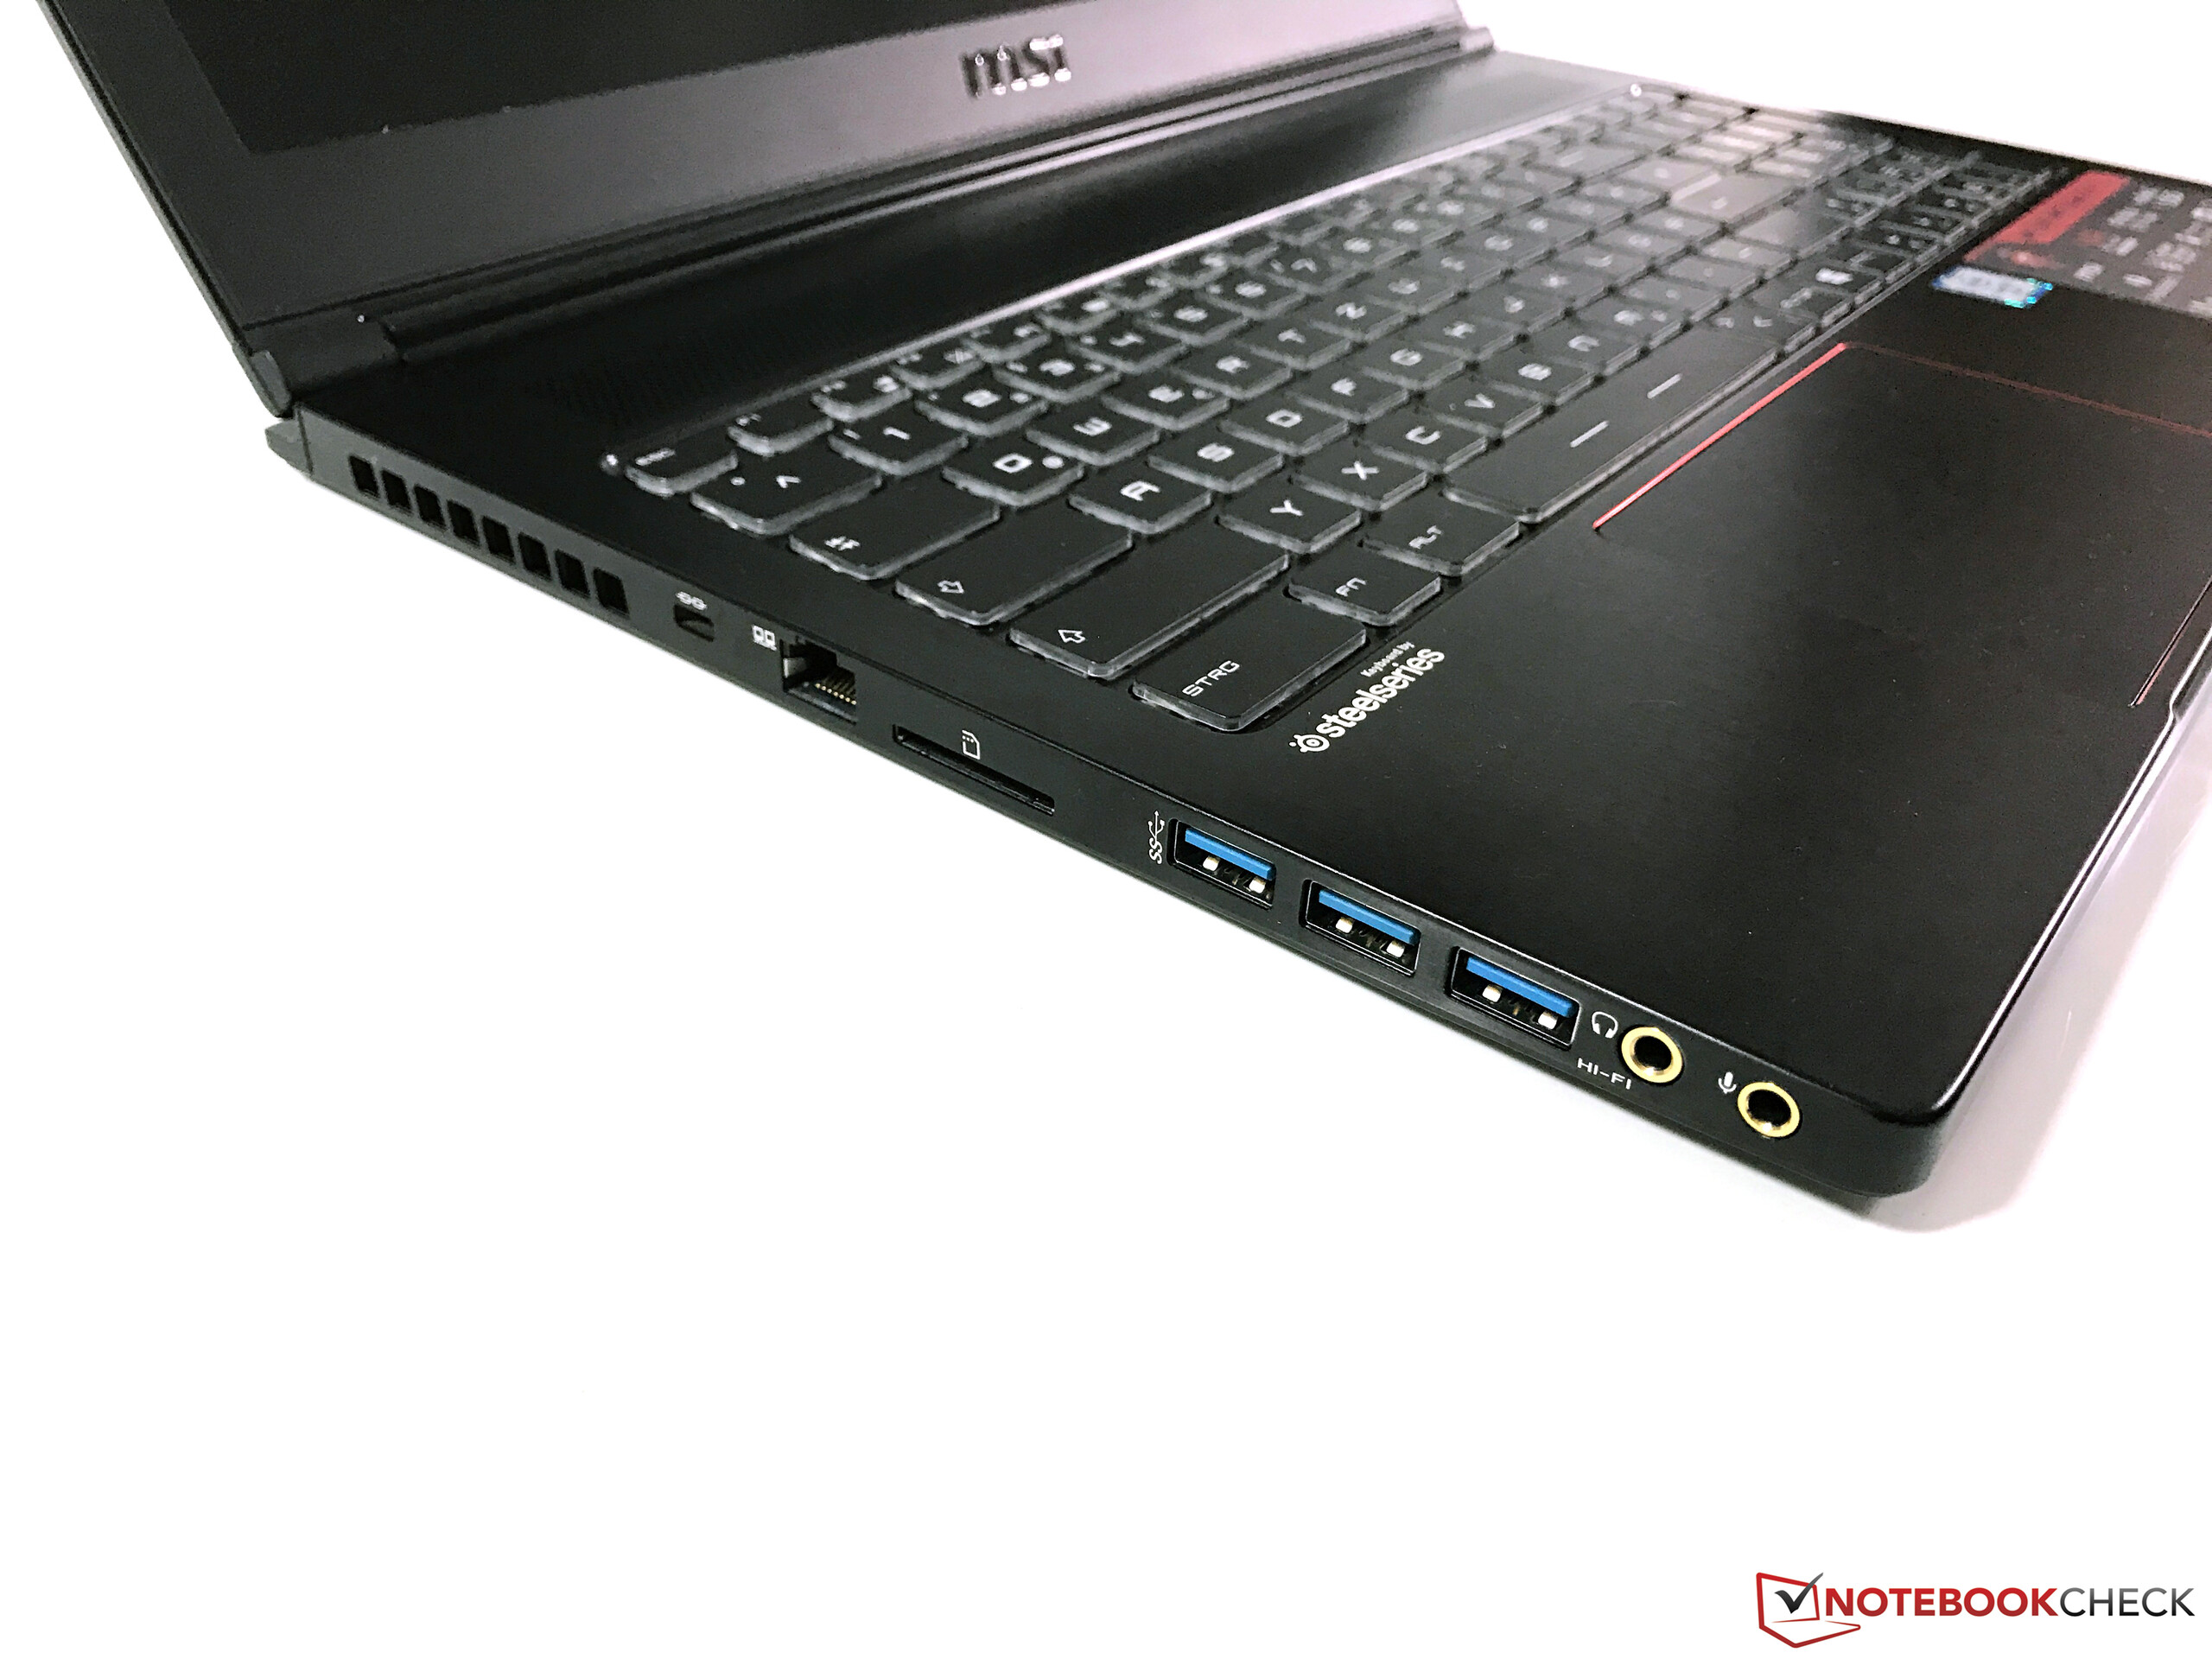
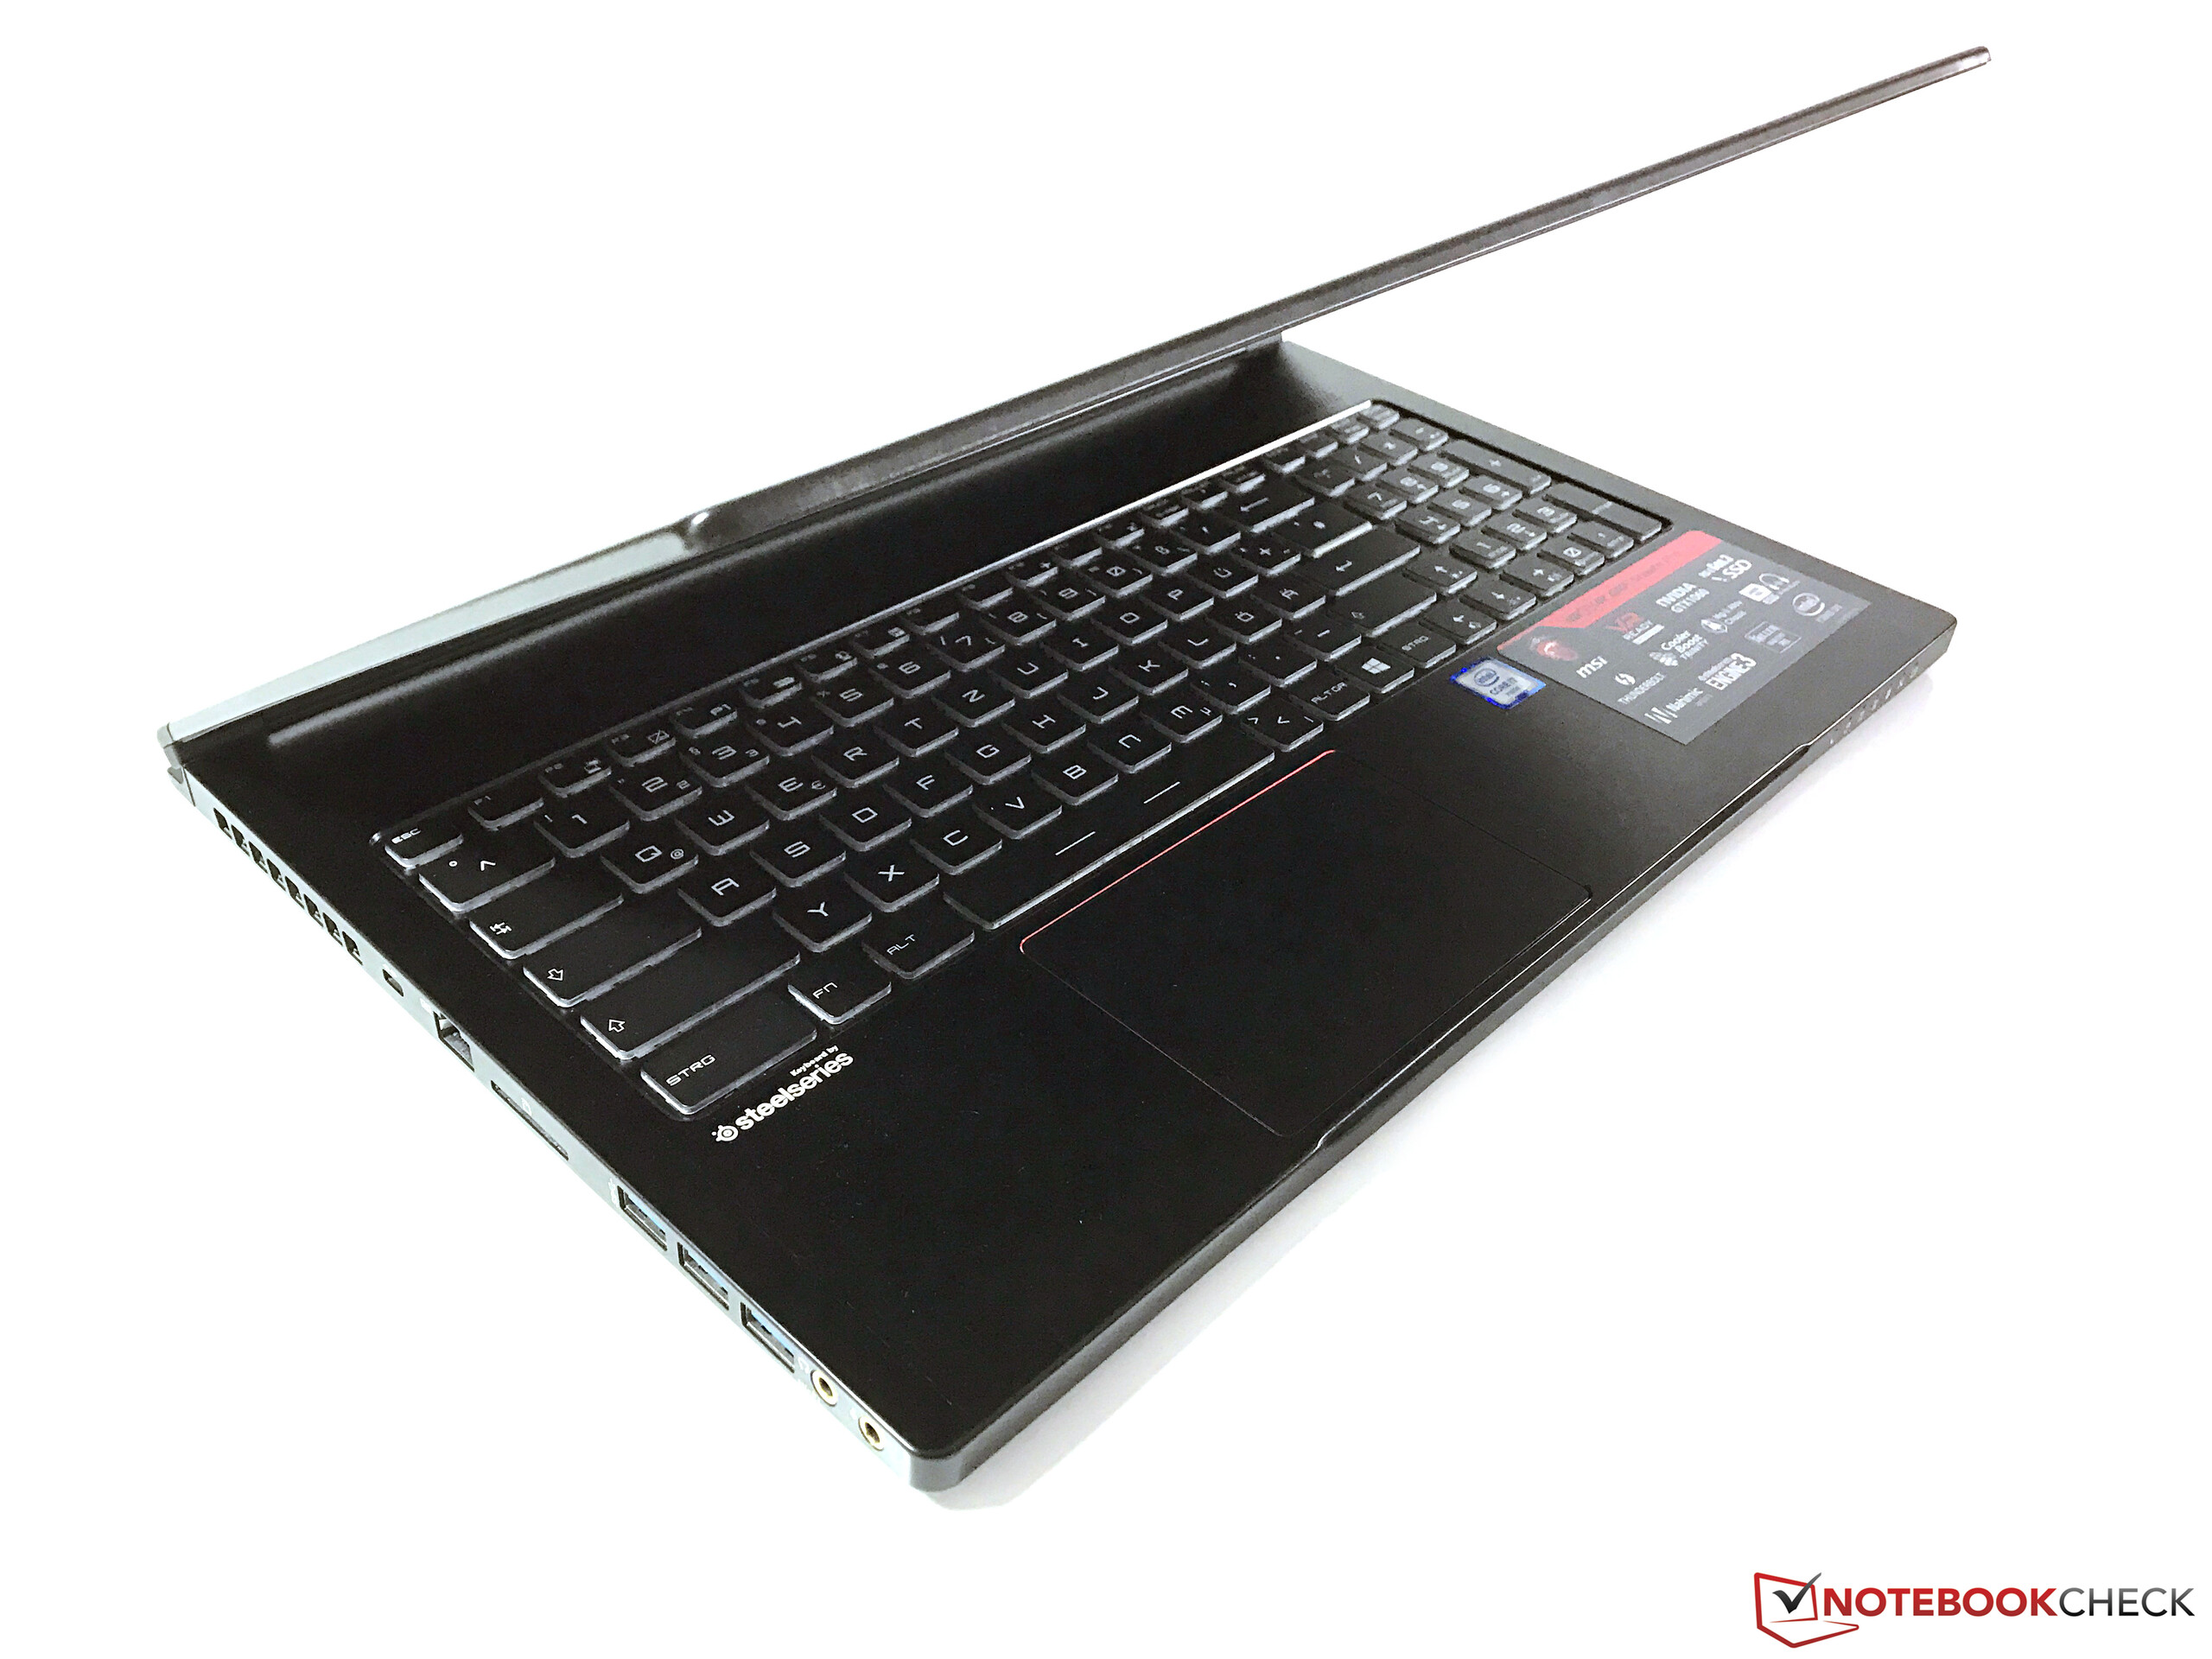
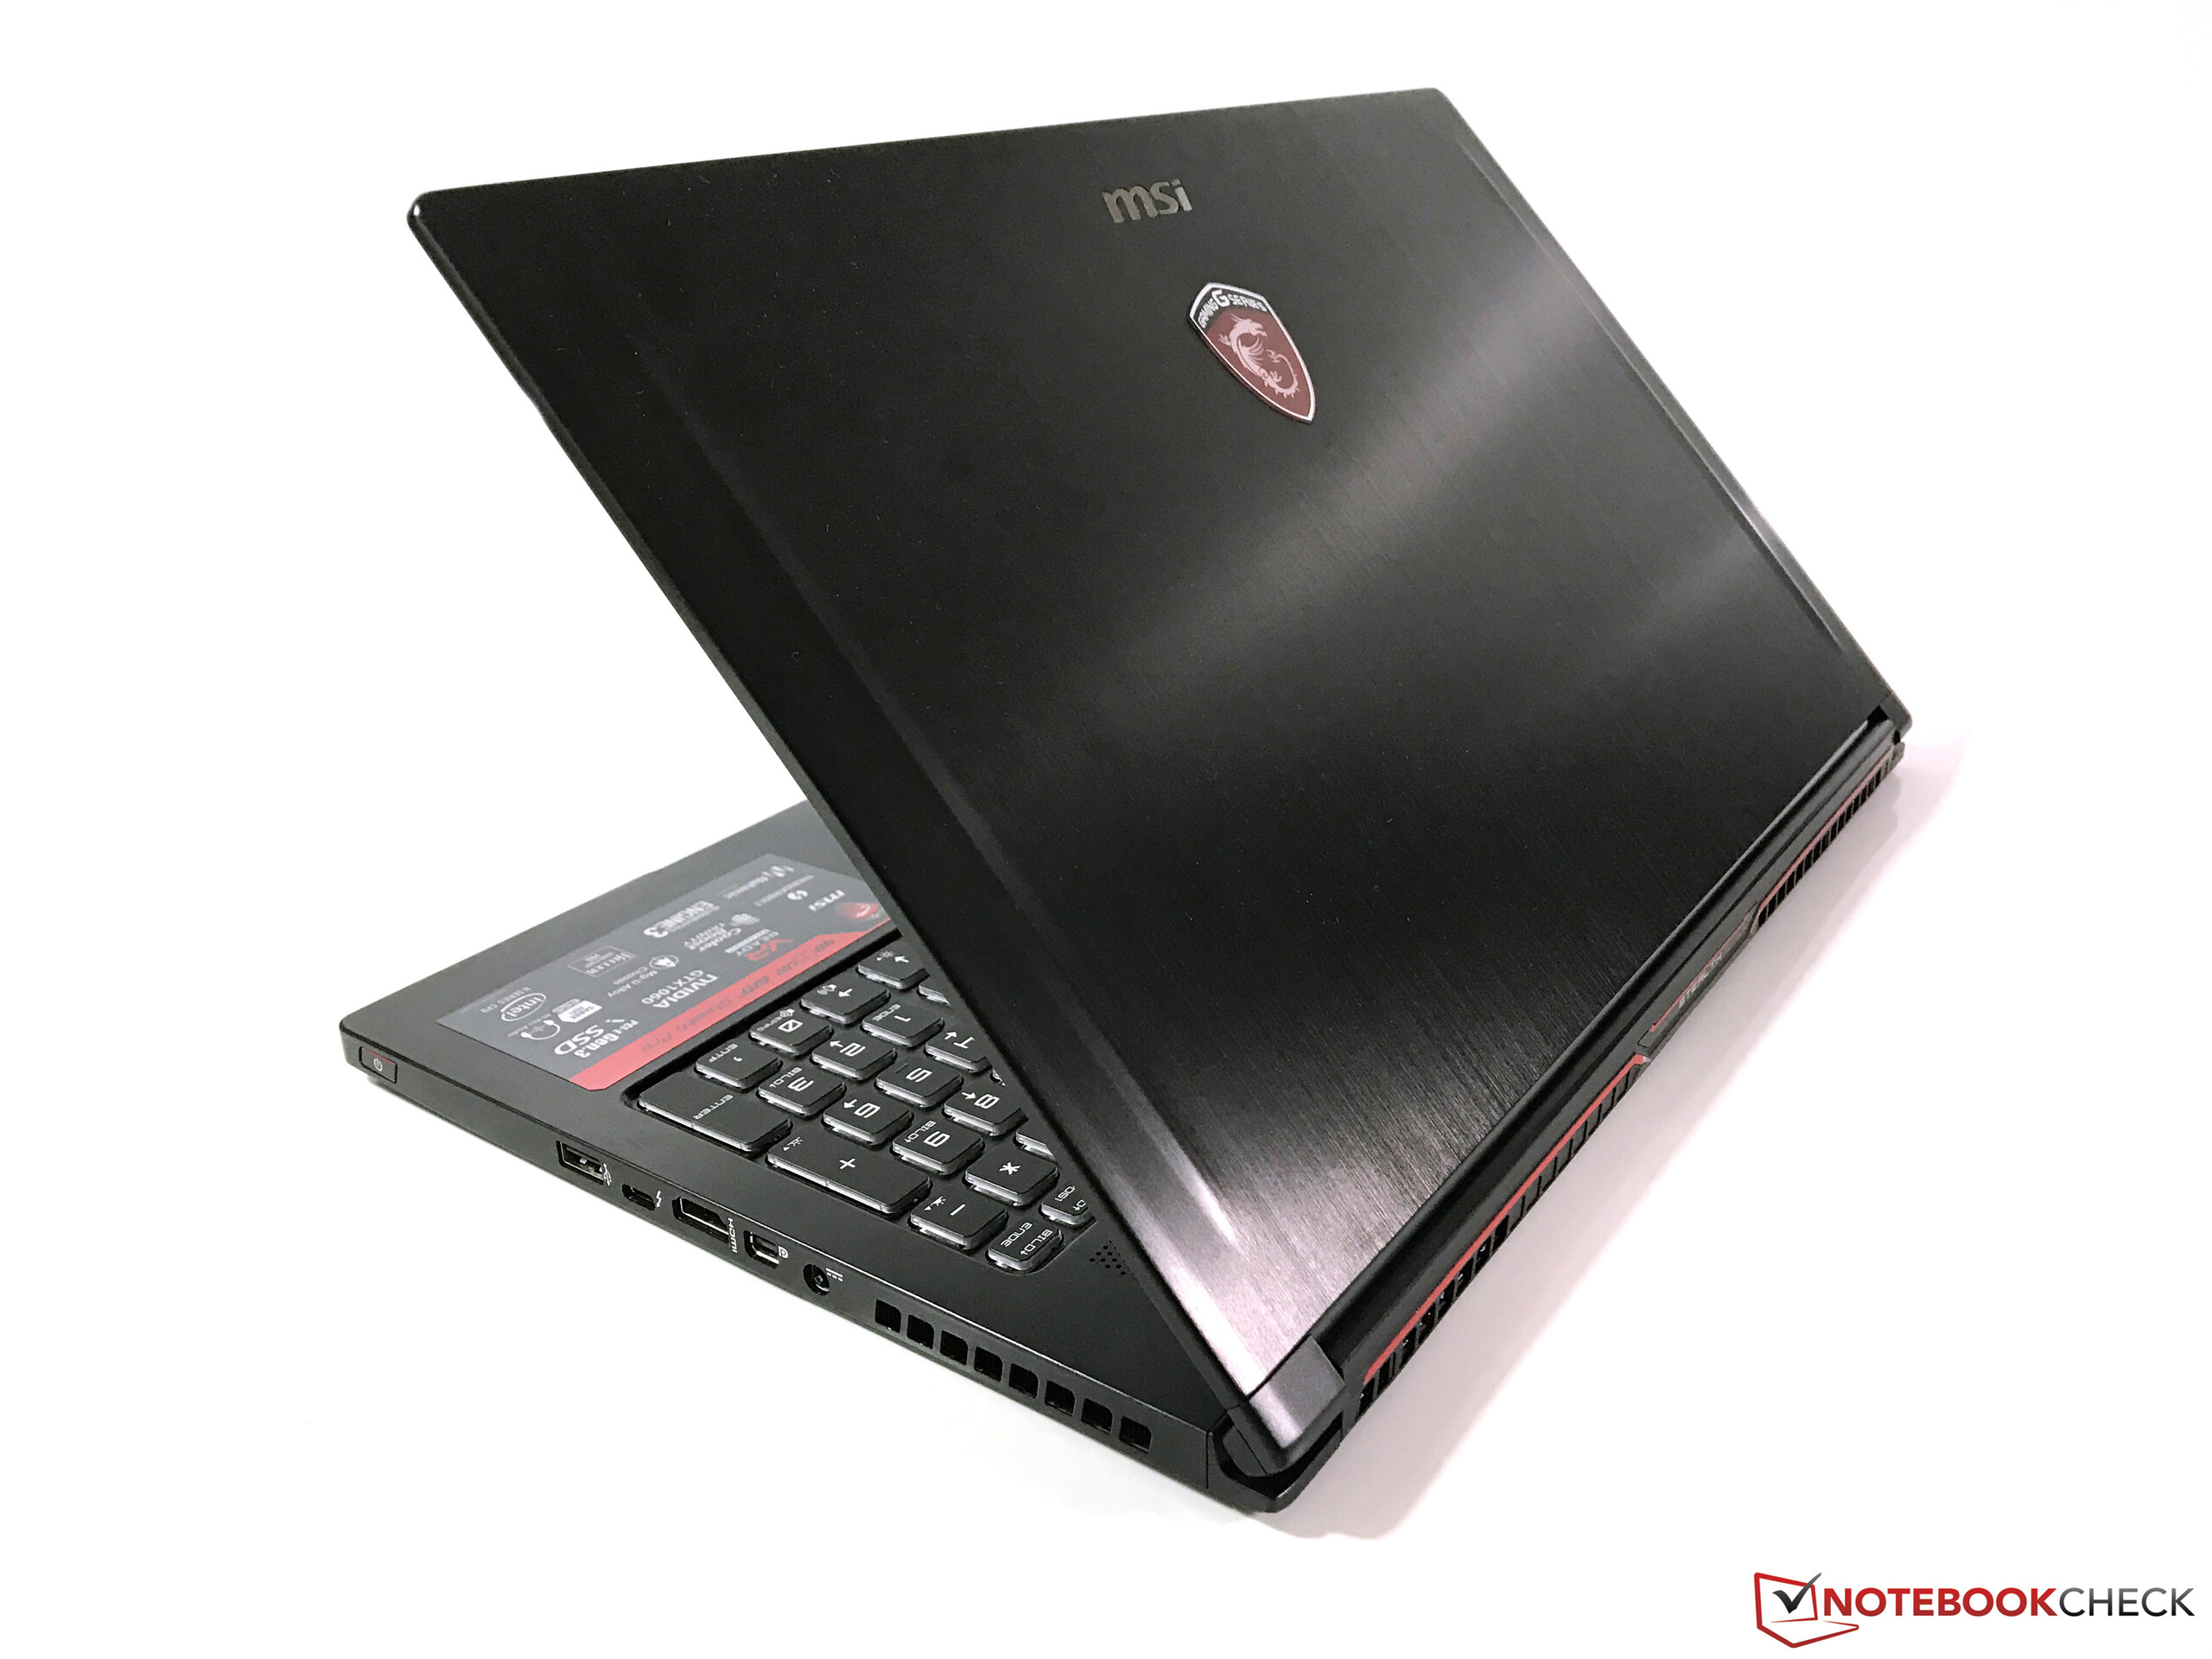
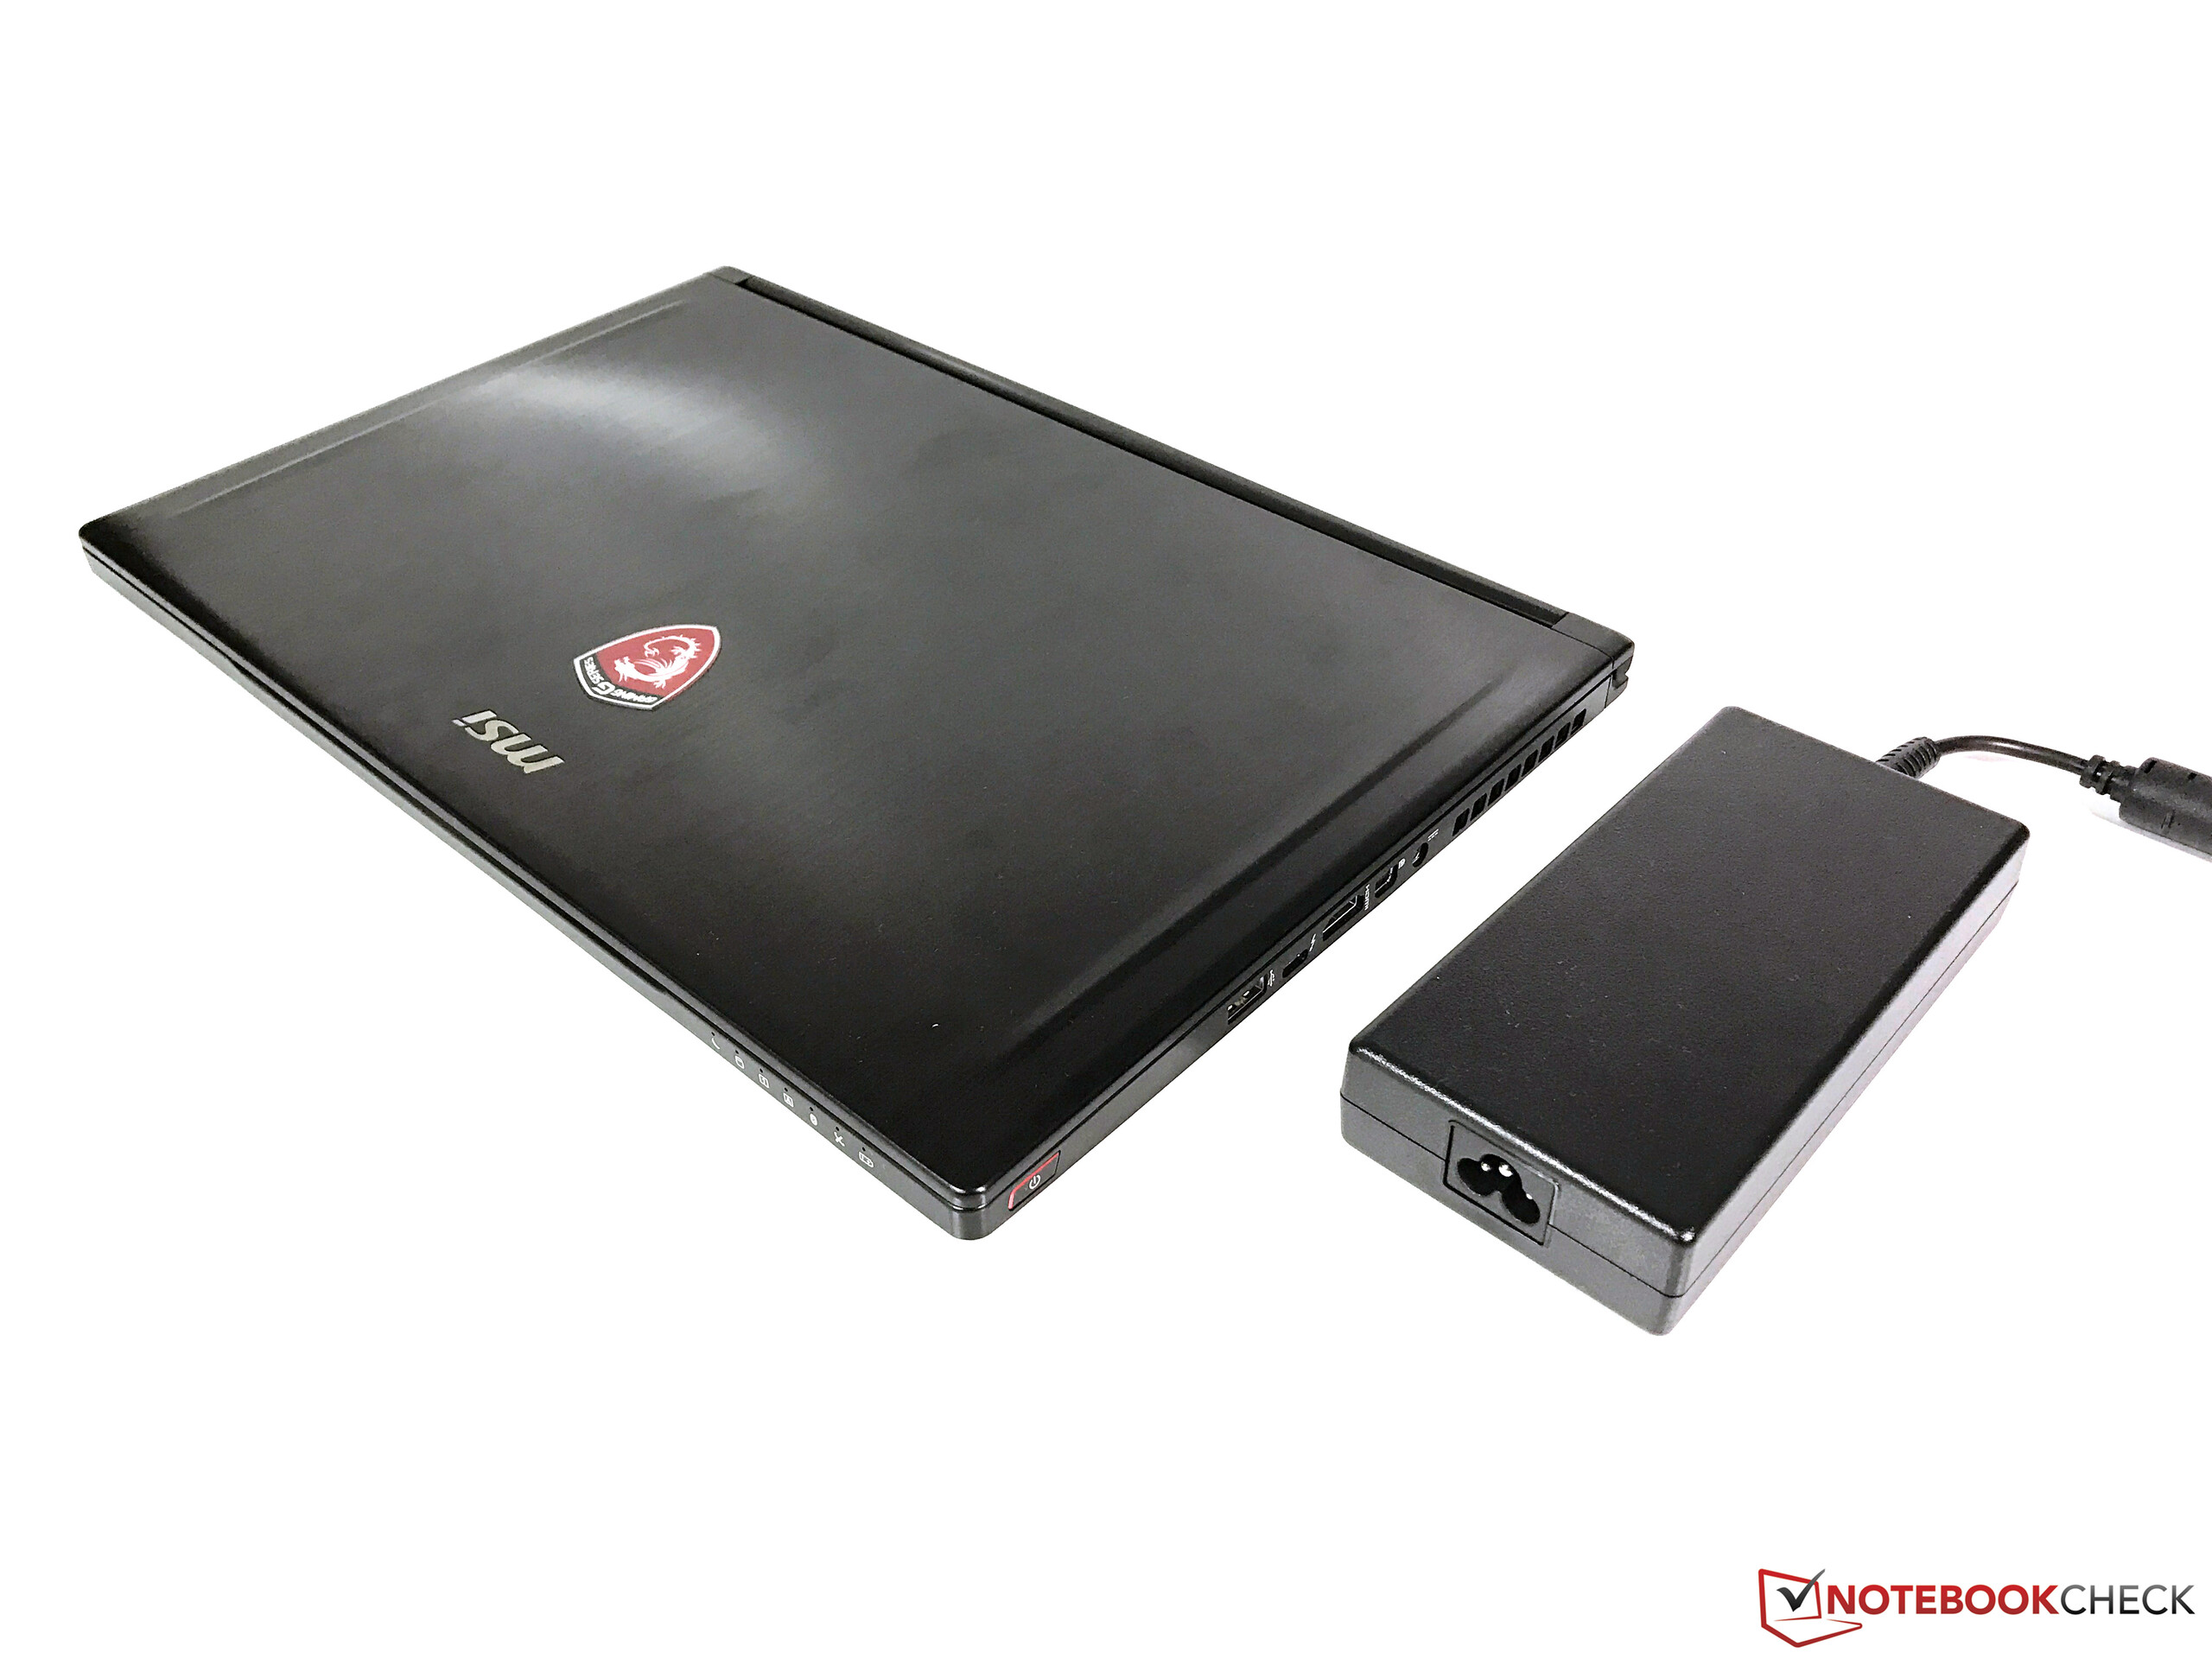
Si uno sostiene el MSI GS63VR en las manos, no tendrá la impresión de que sea un portátil gaming. El delgado y ligero dispositivo se parece más a un portátil ofimático móvil. Lejos de ello - el hardware del dispositivo puede ejecutar todos los juegos recientes con fluidez en la pantalla mate Full HD con ajustes gráficos altos o incluso máximos. Sin embargo, los frame rates quedan algo por deterás de los de portátiles comparables.
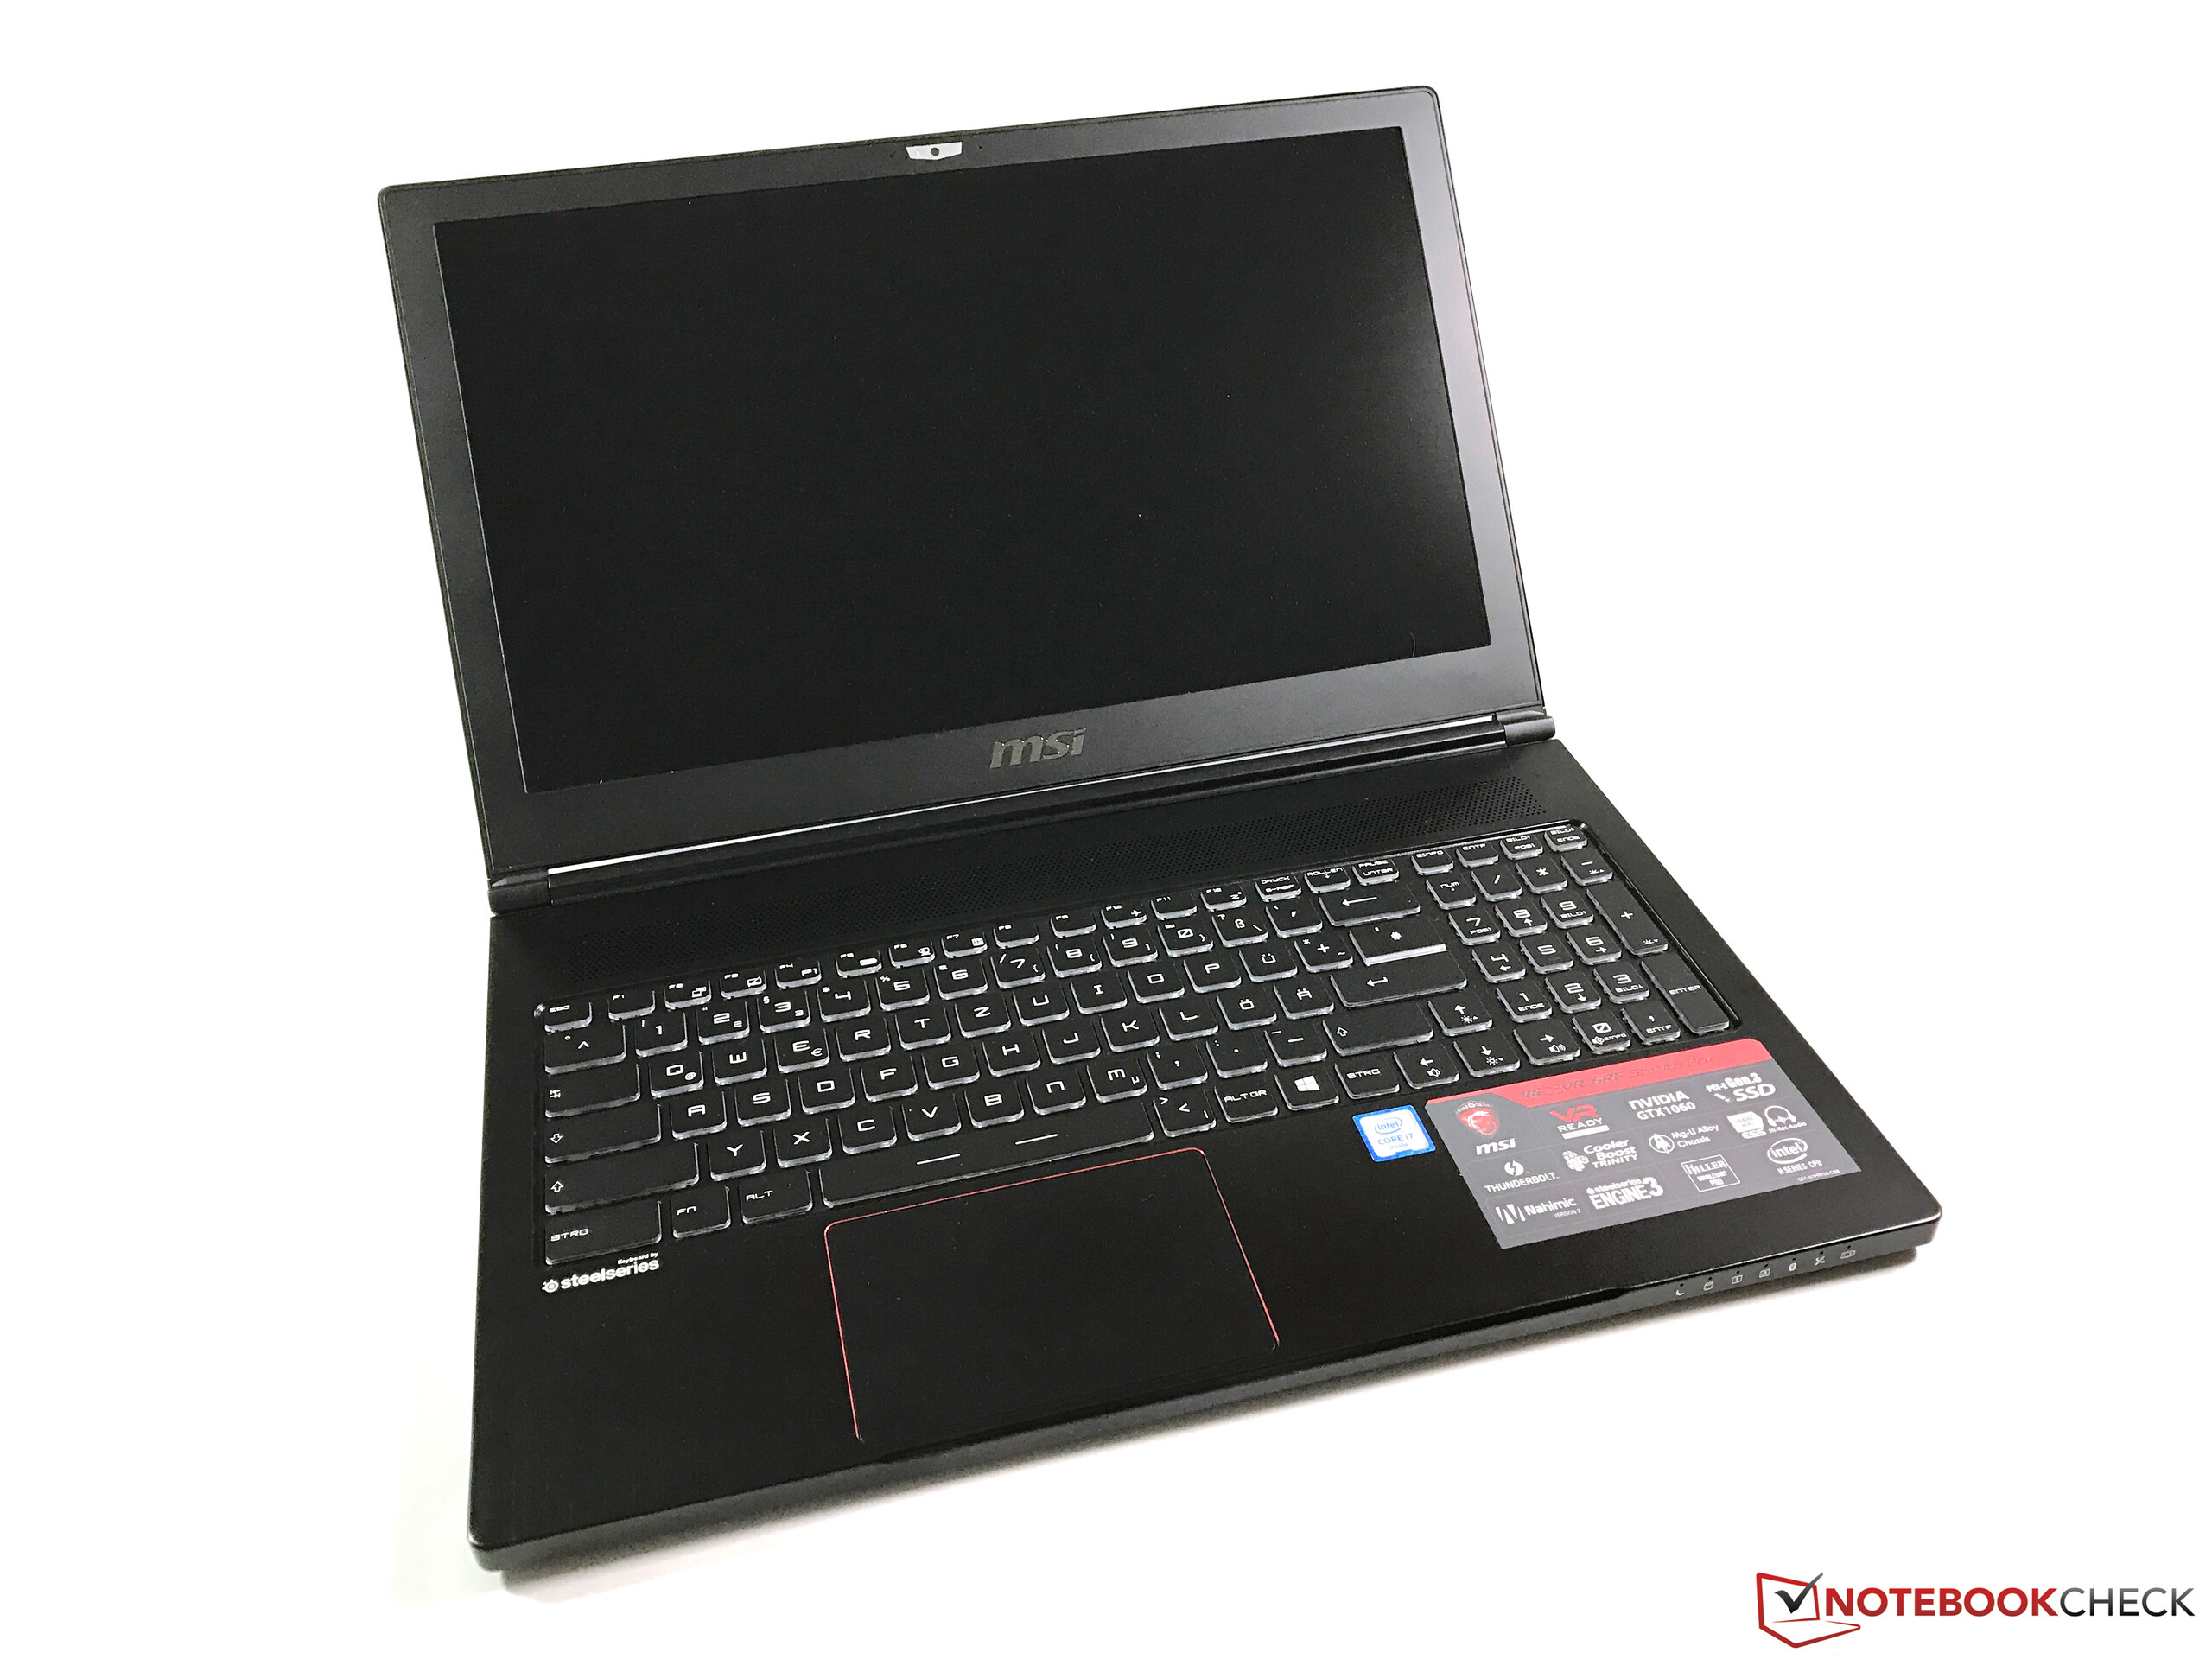
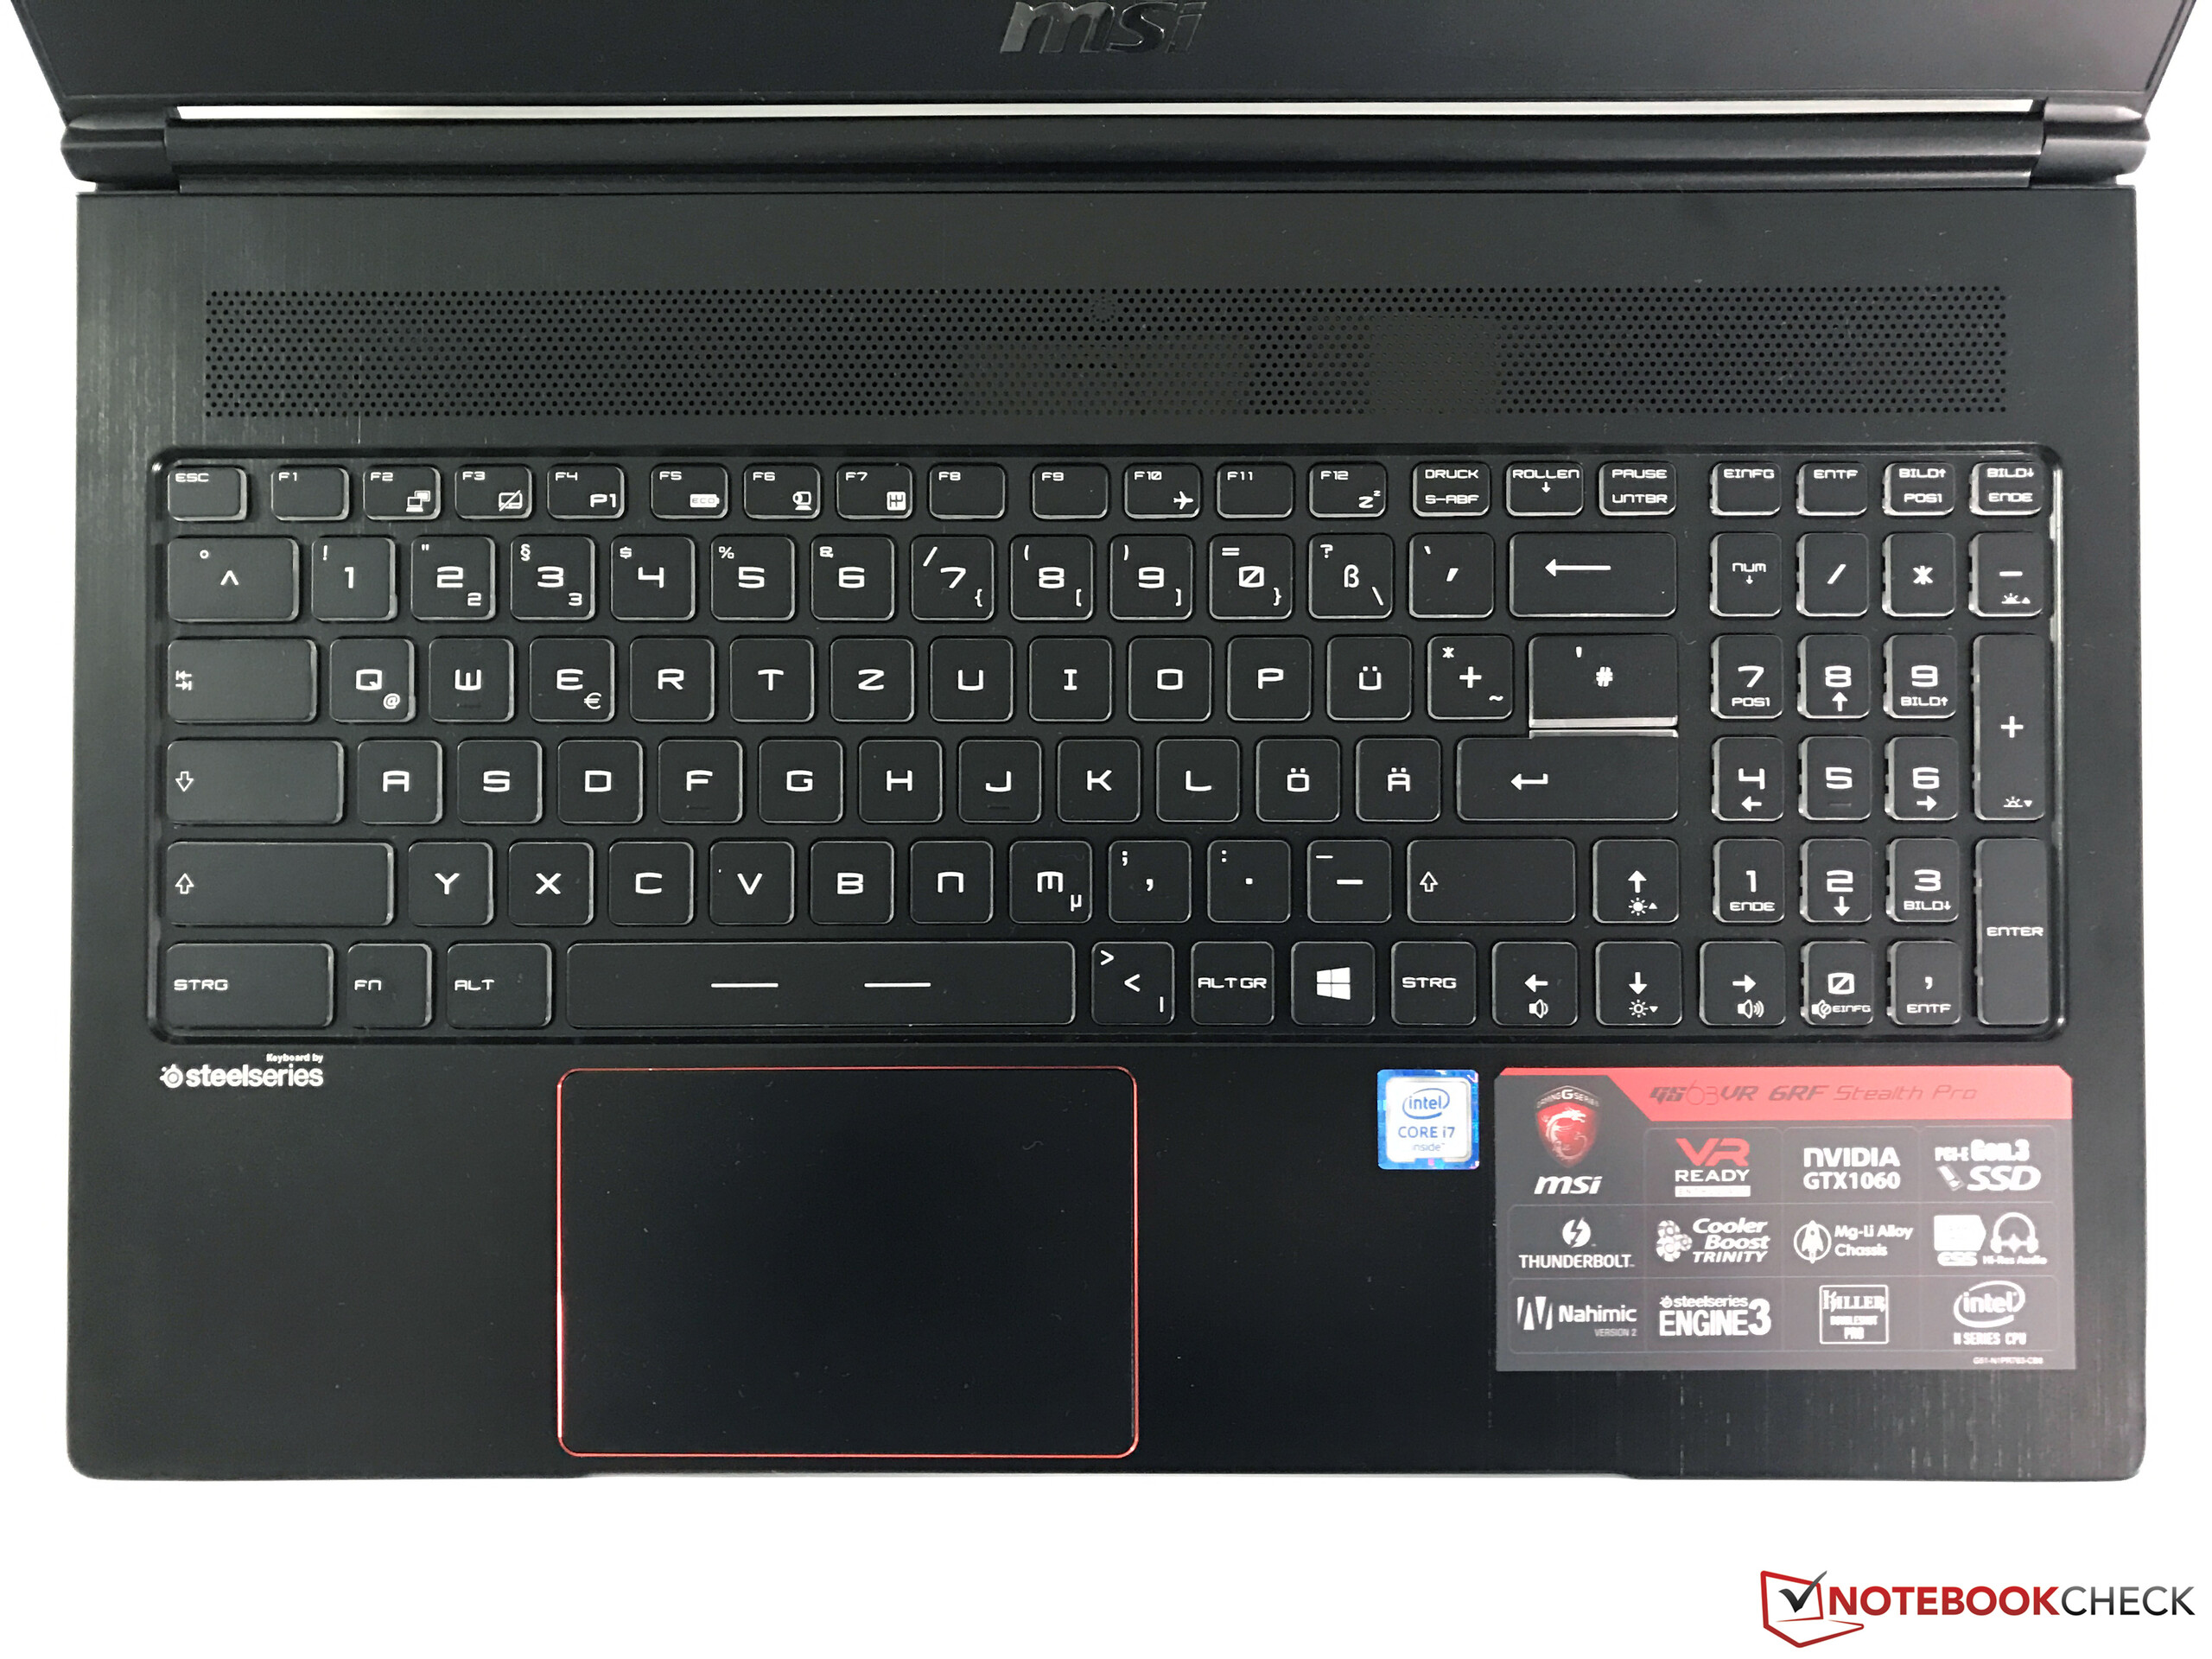
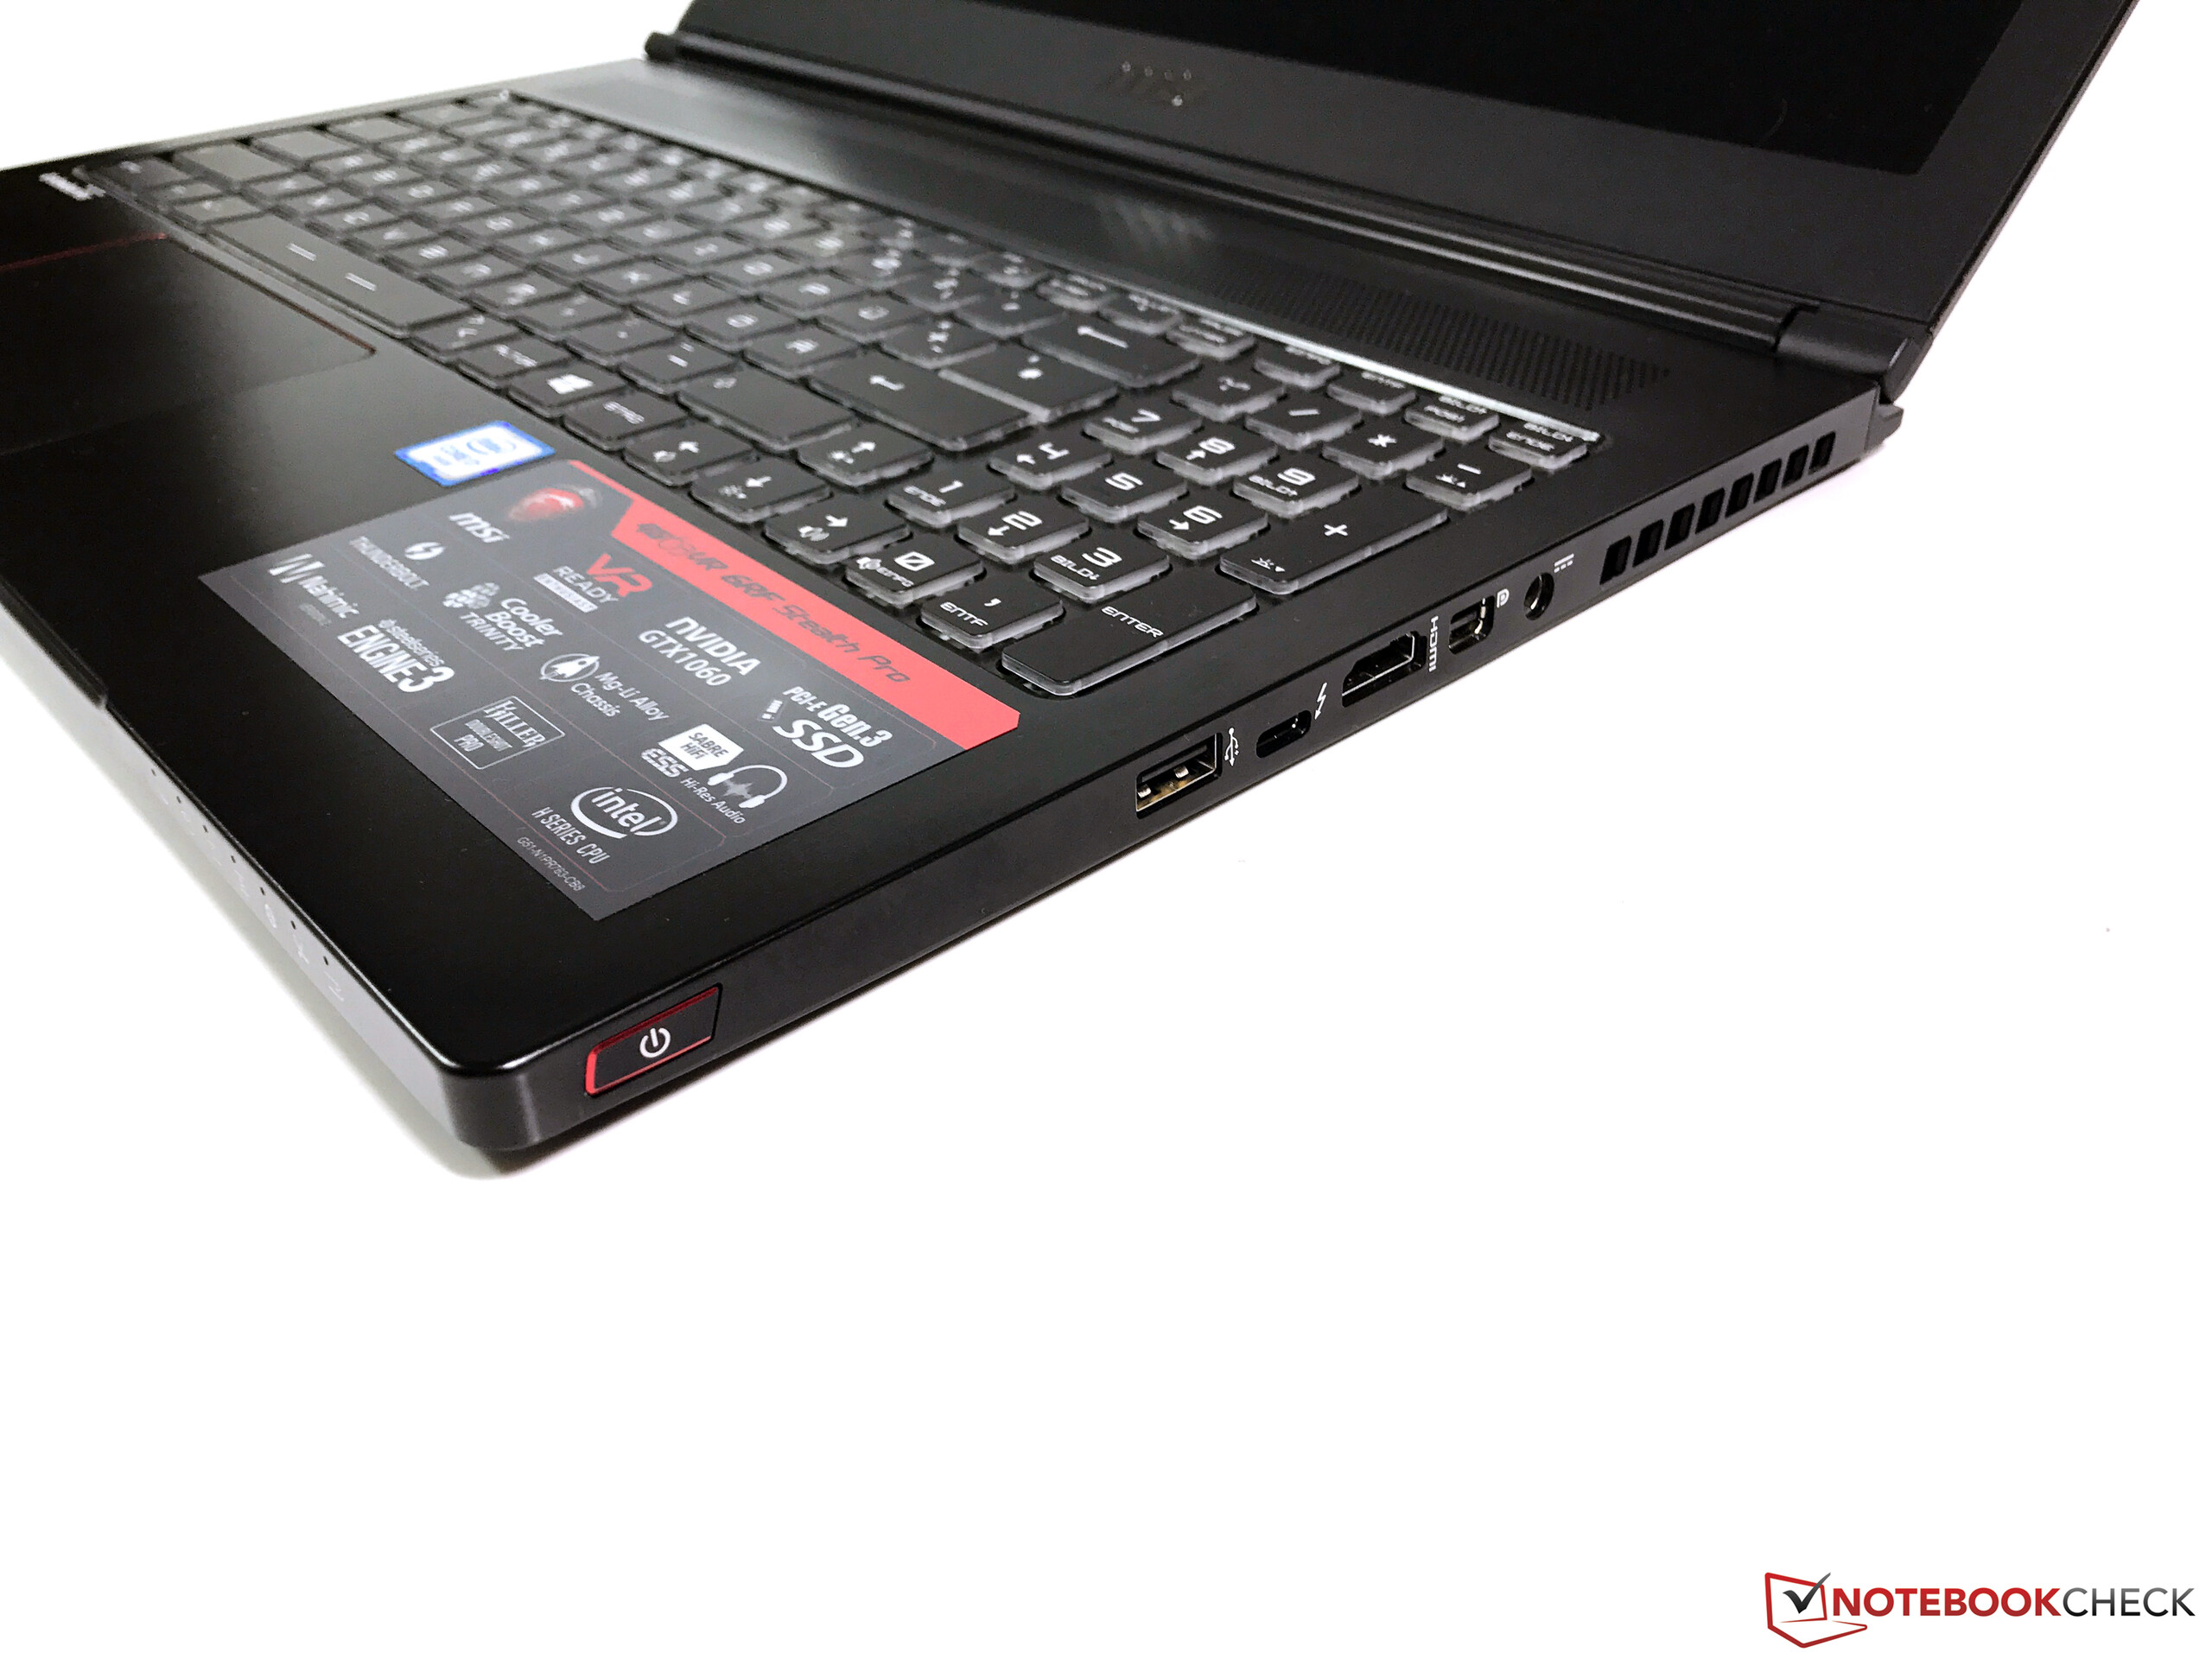
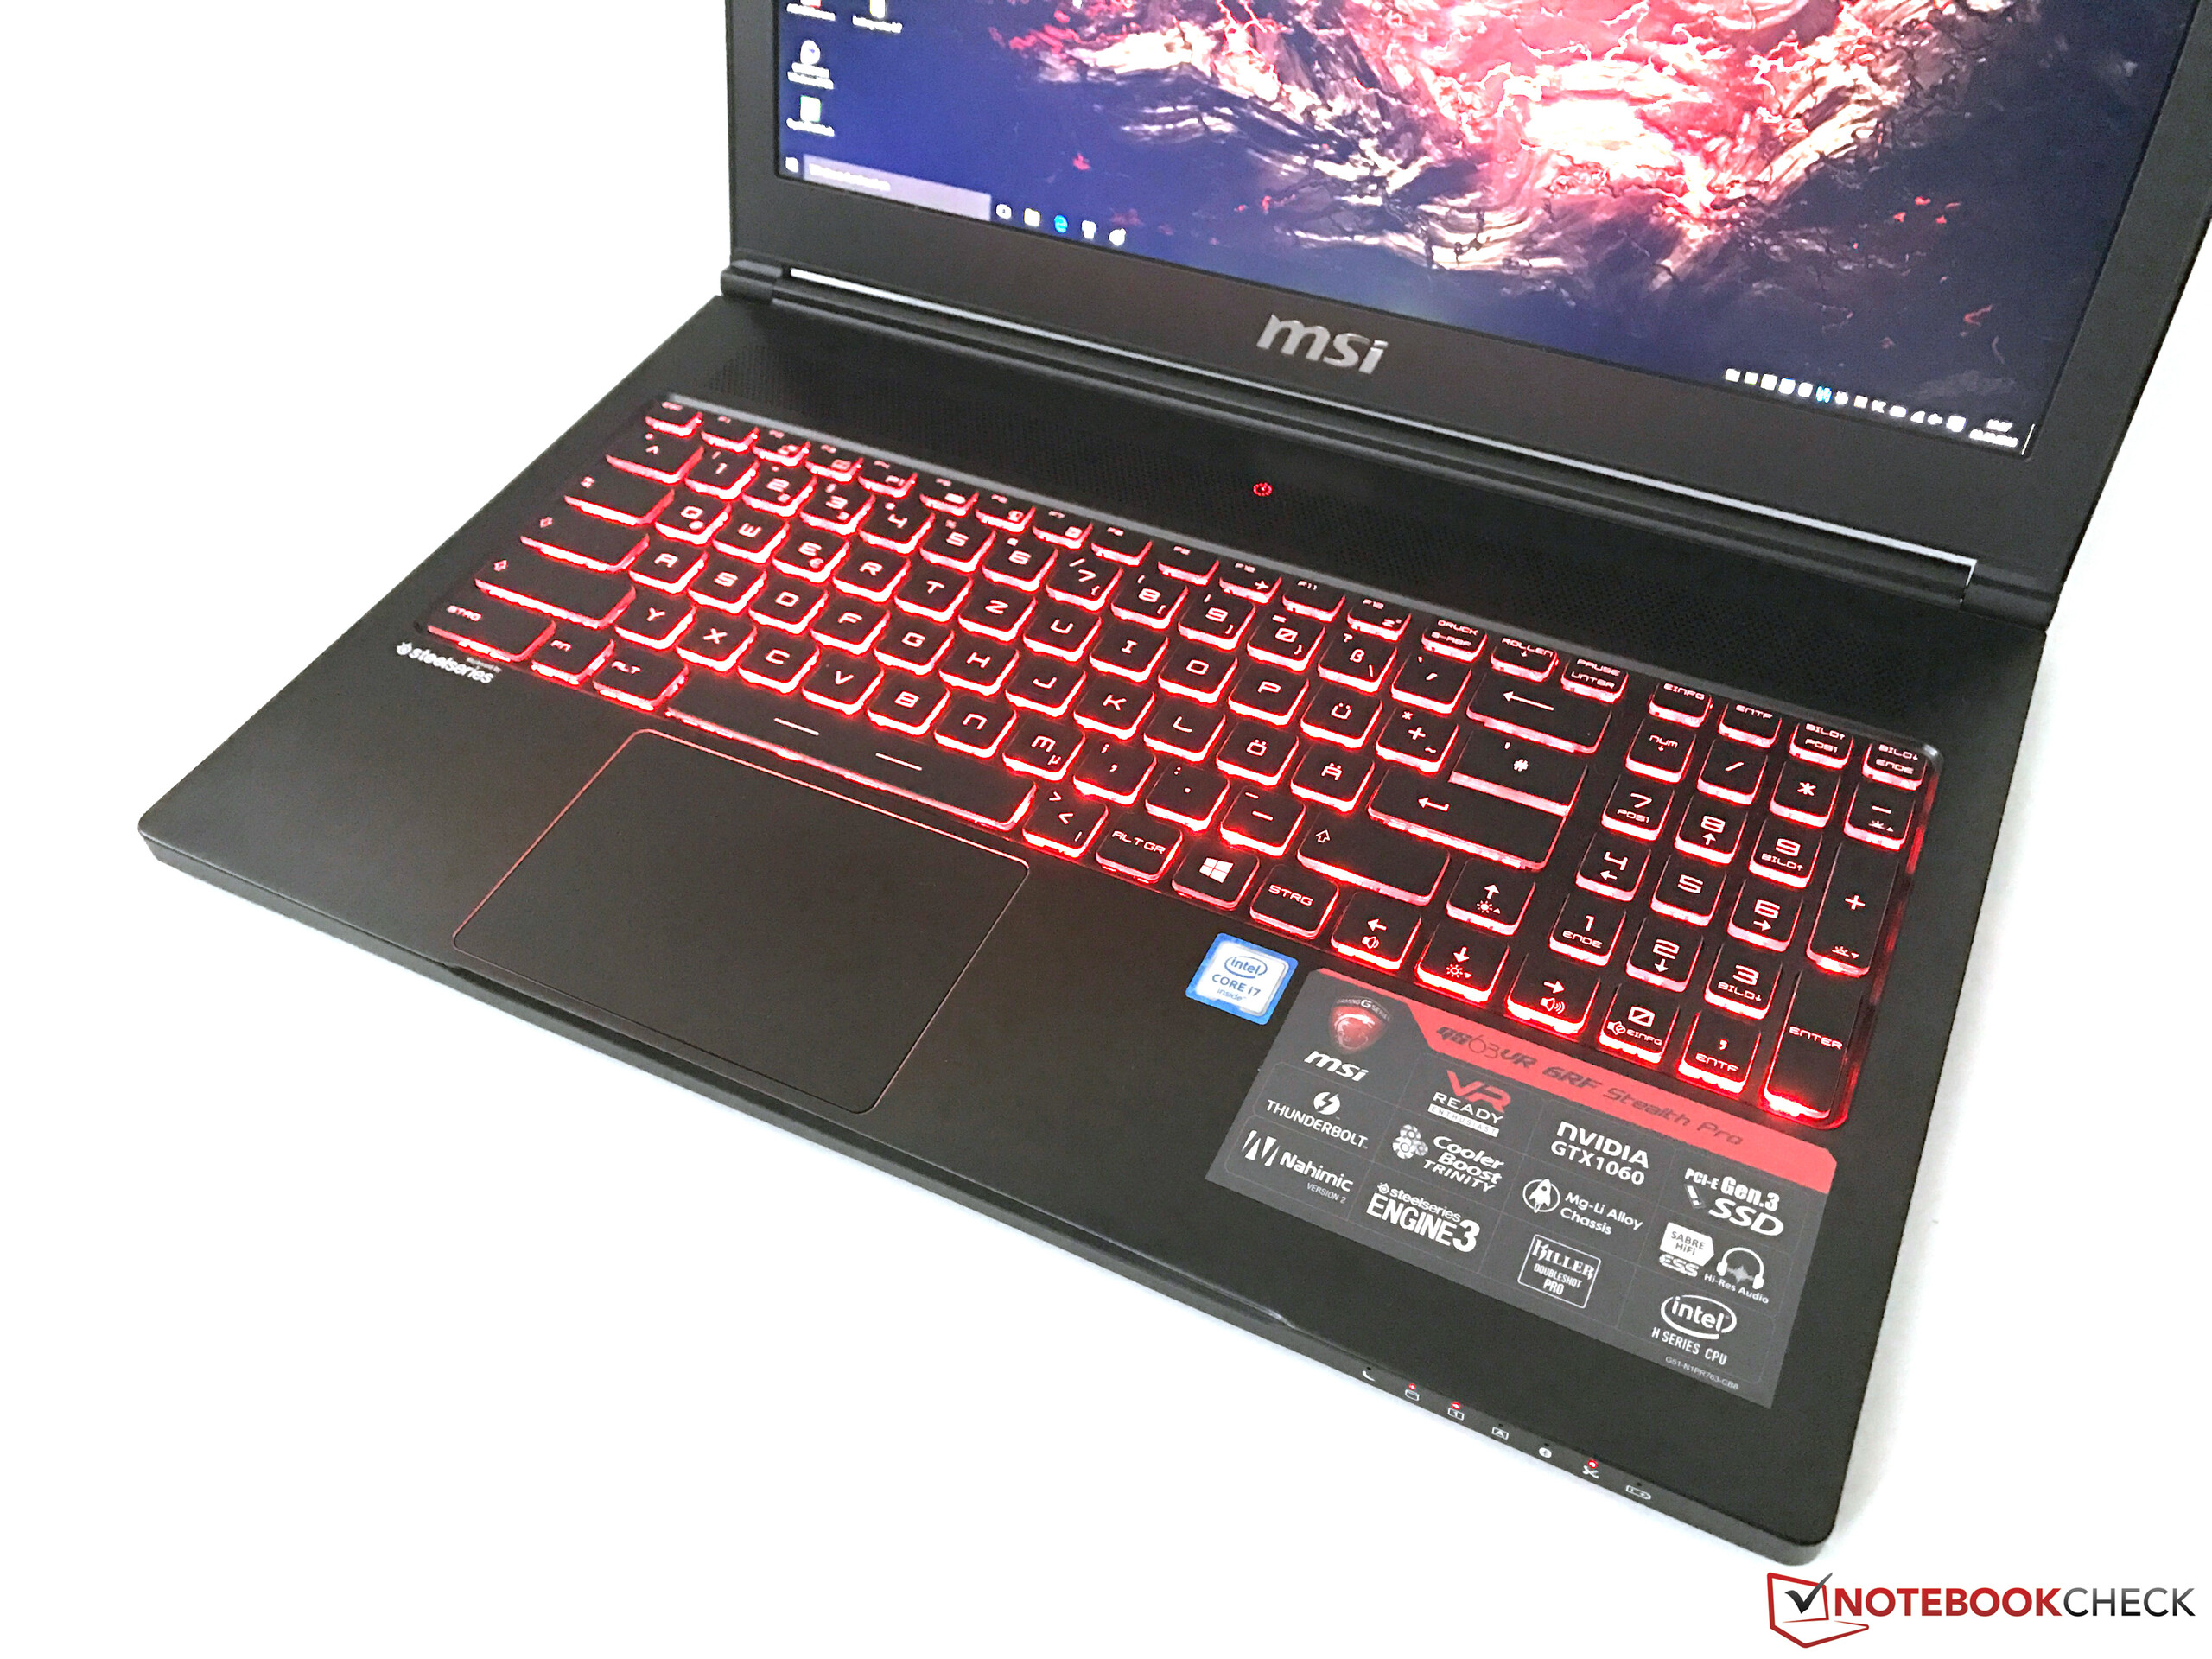
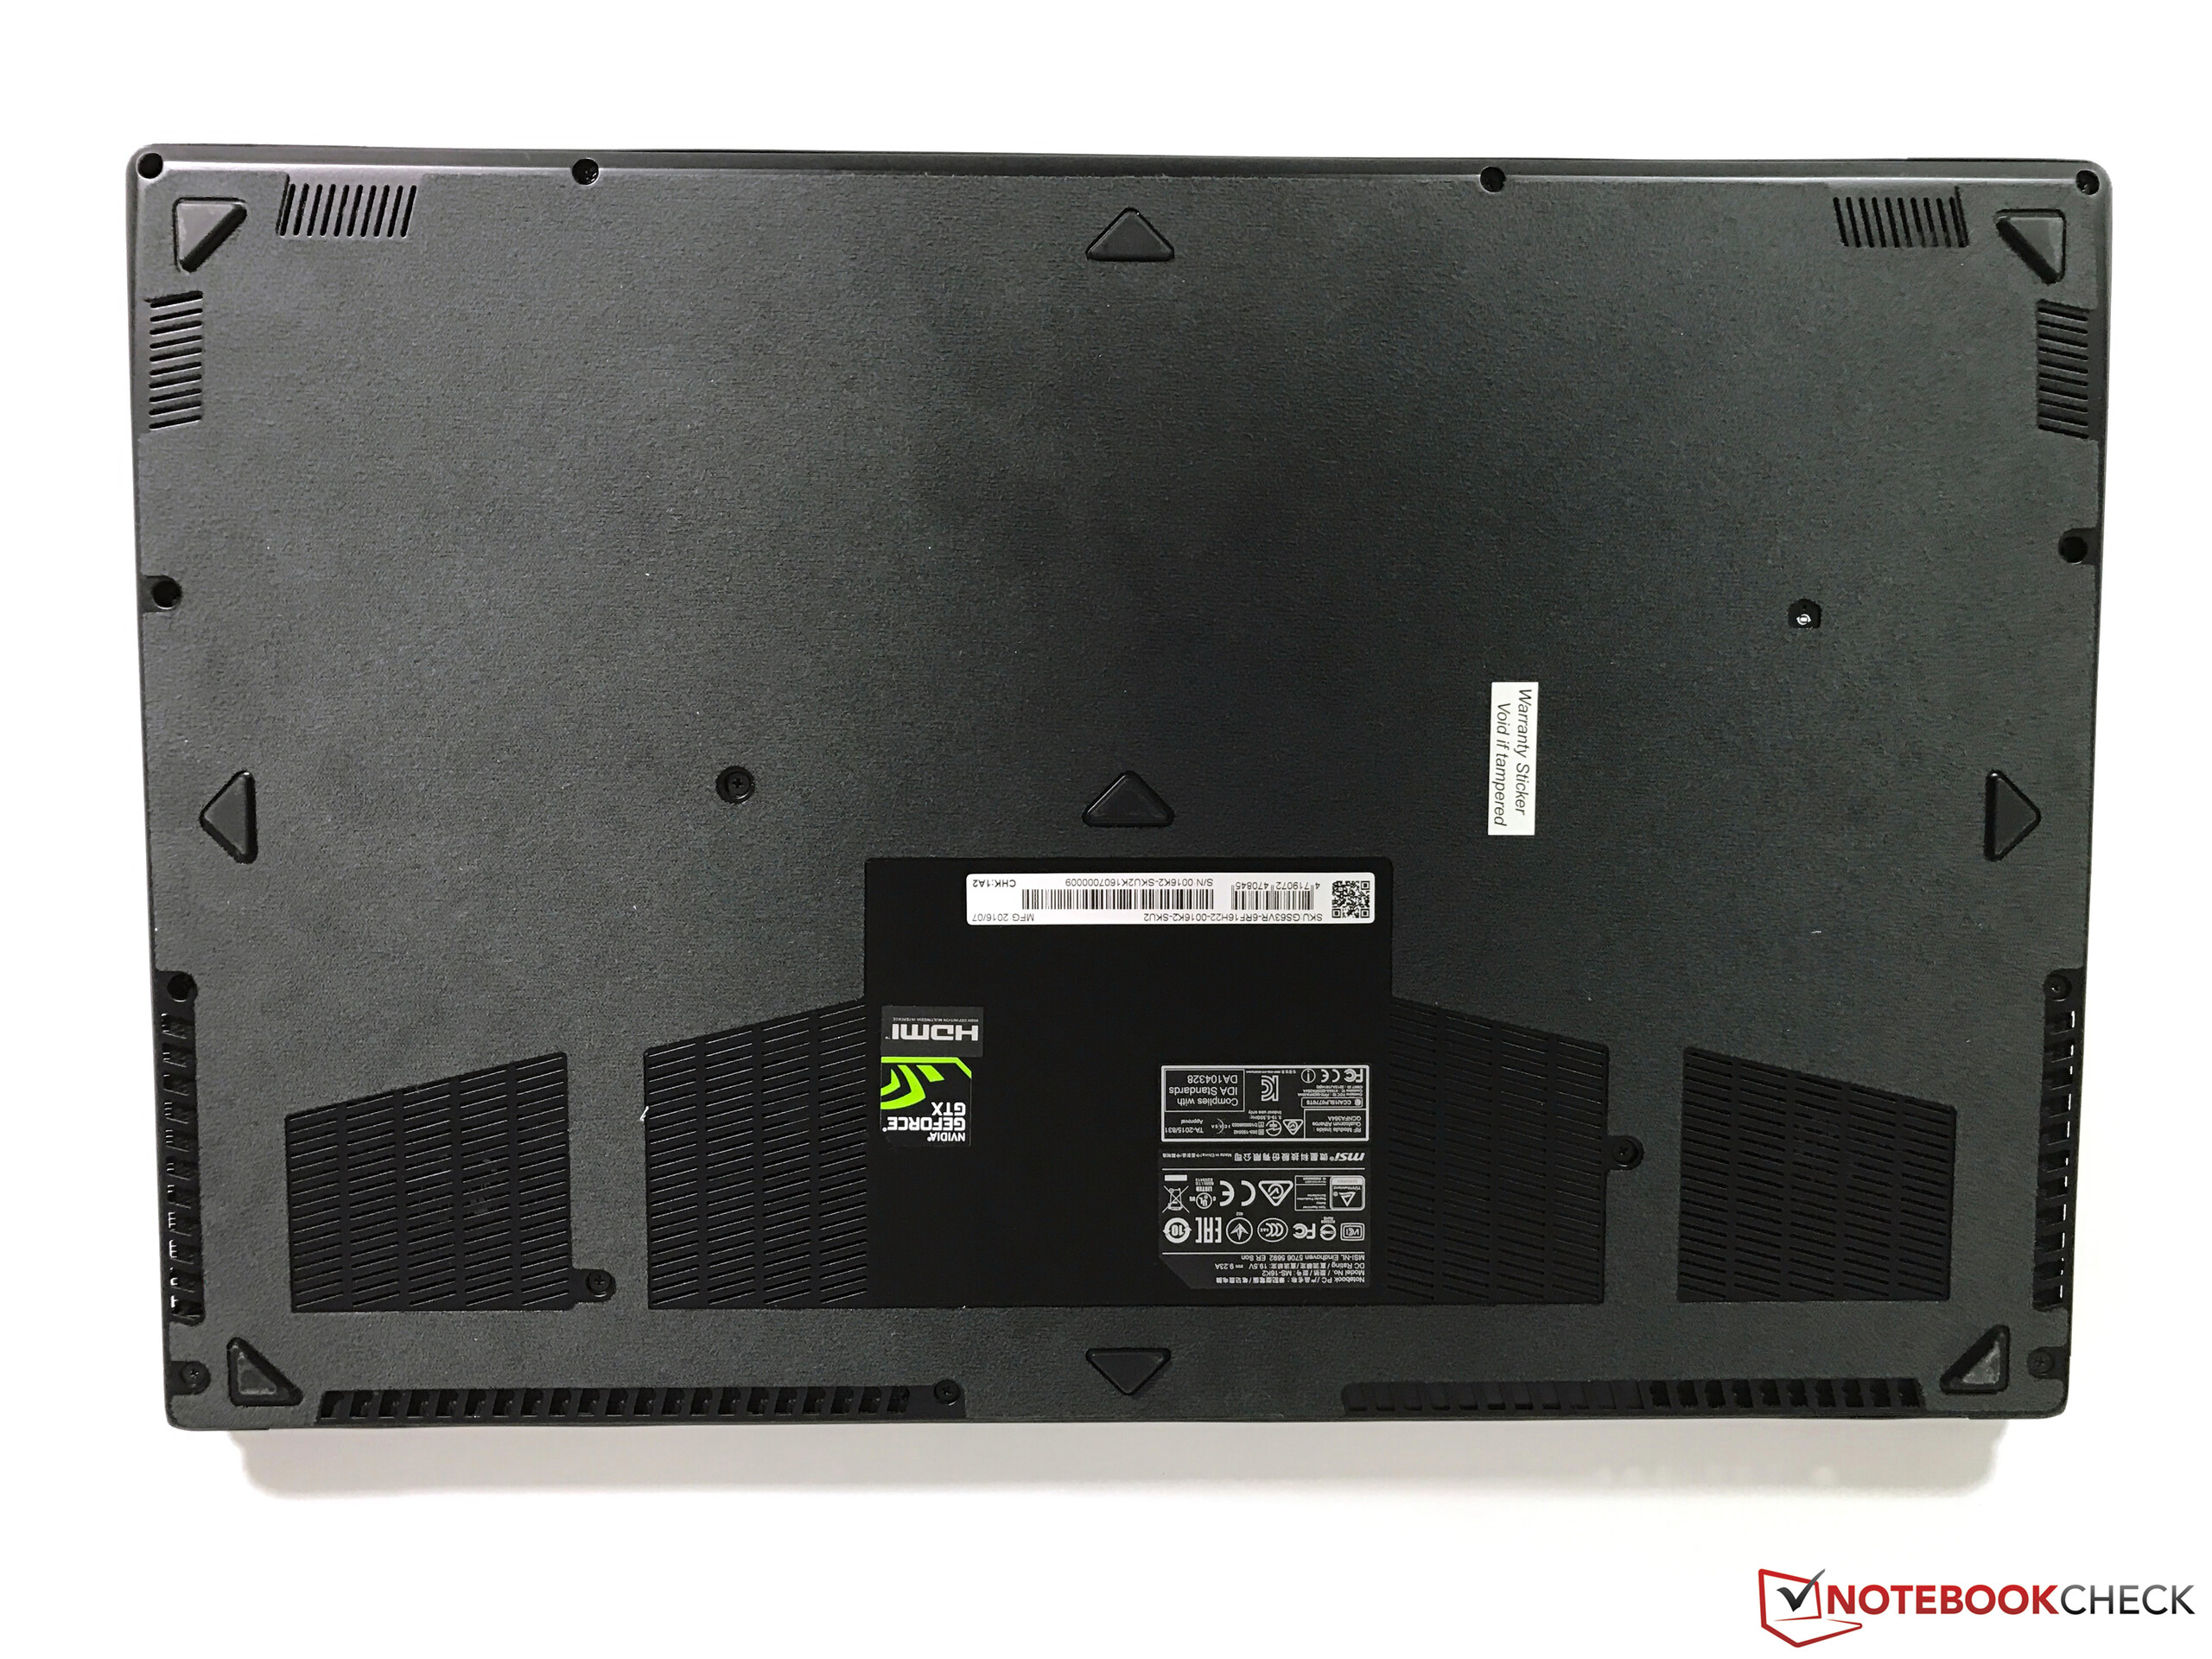
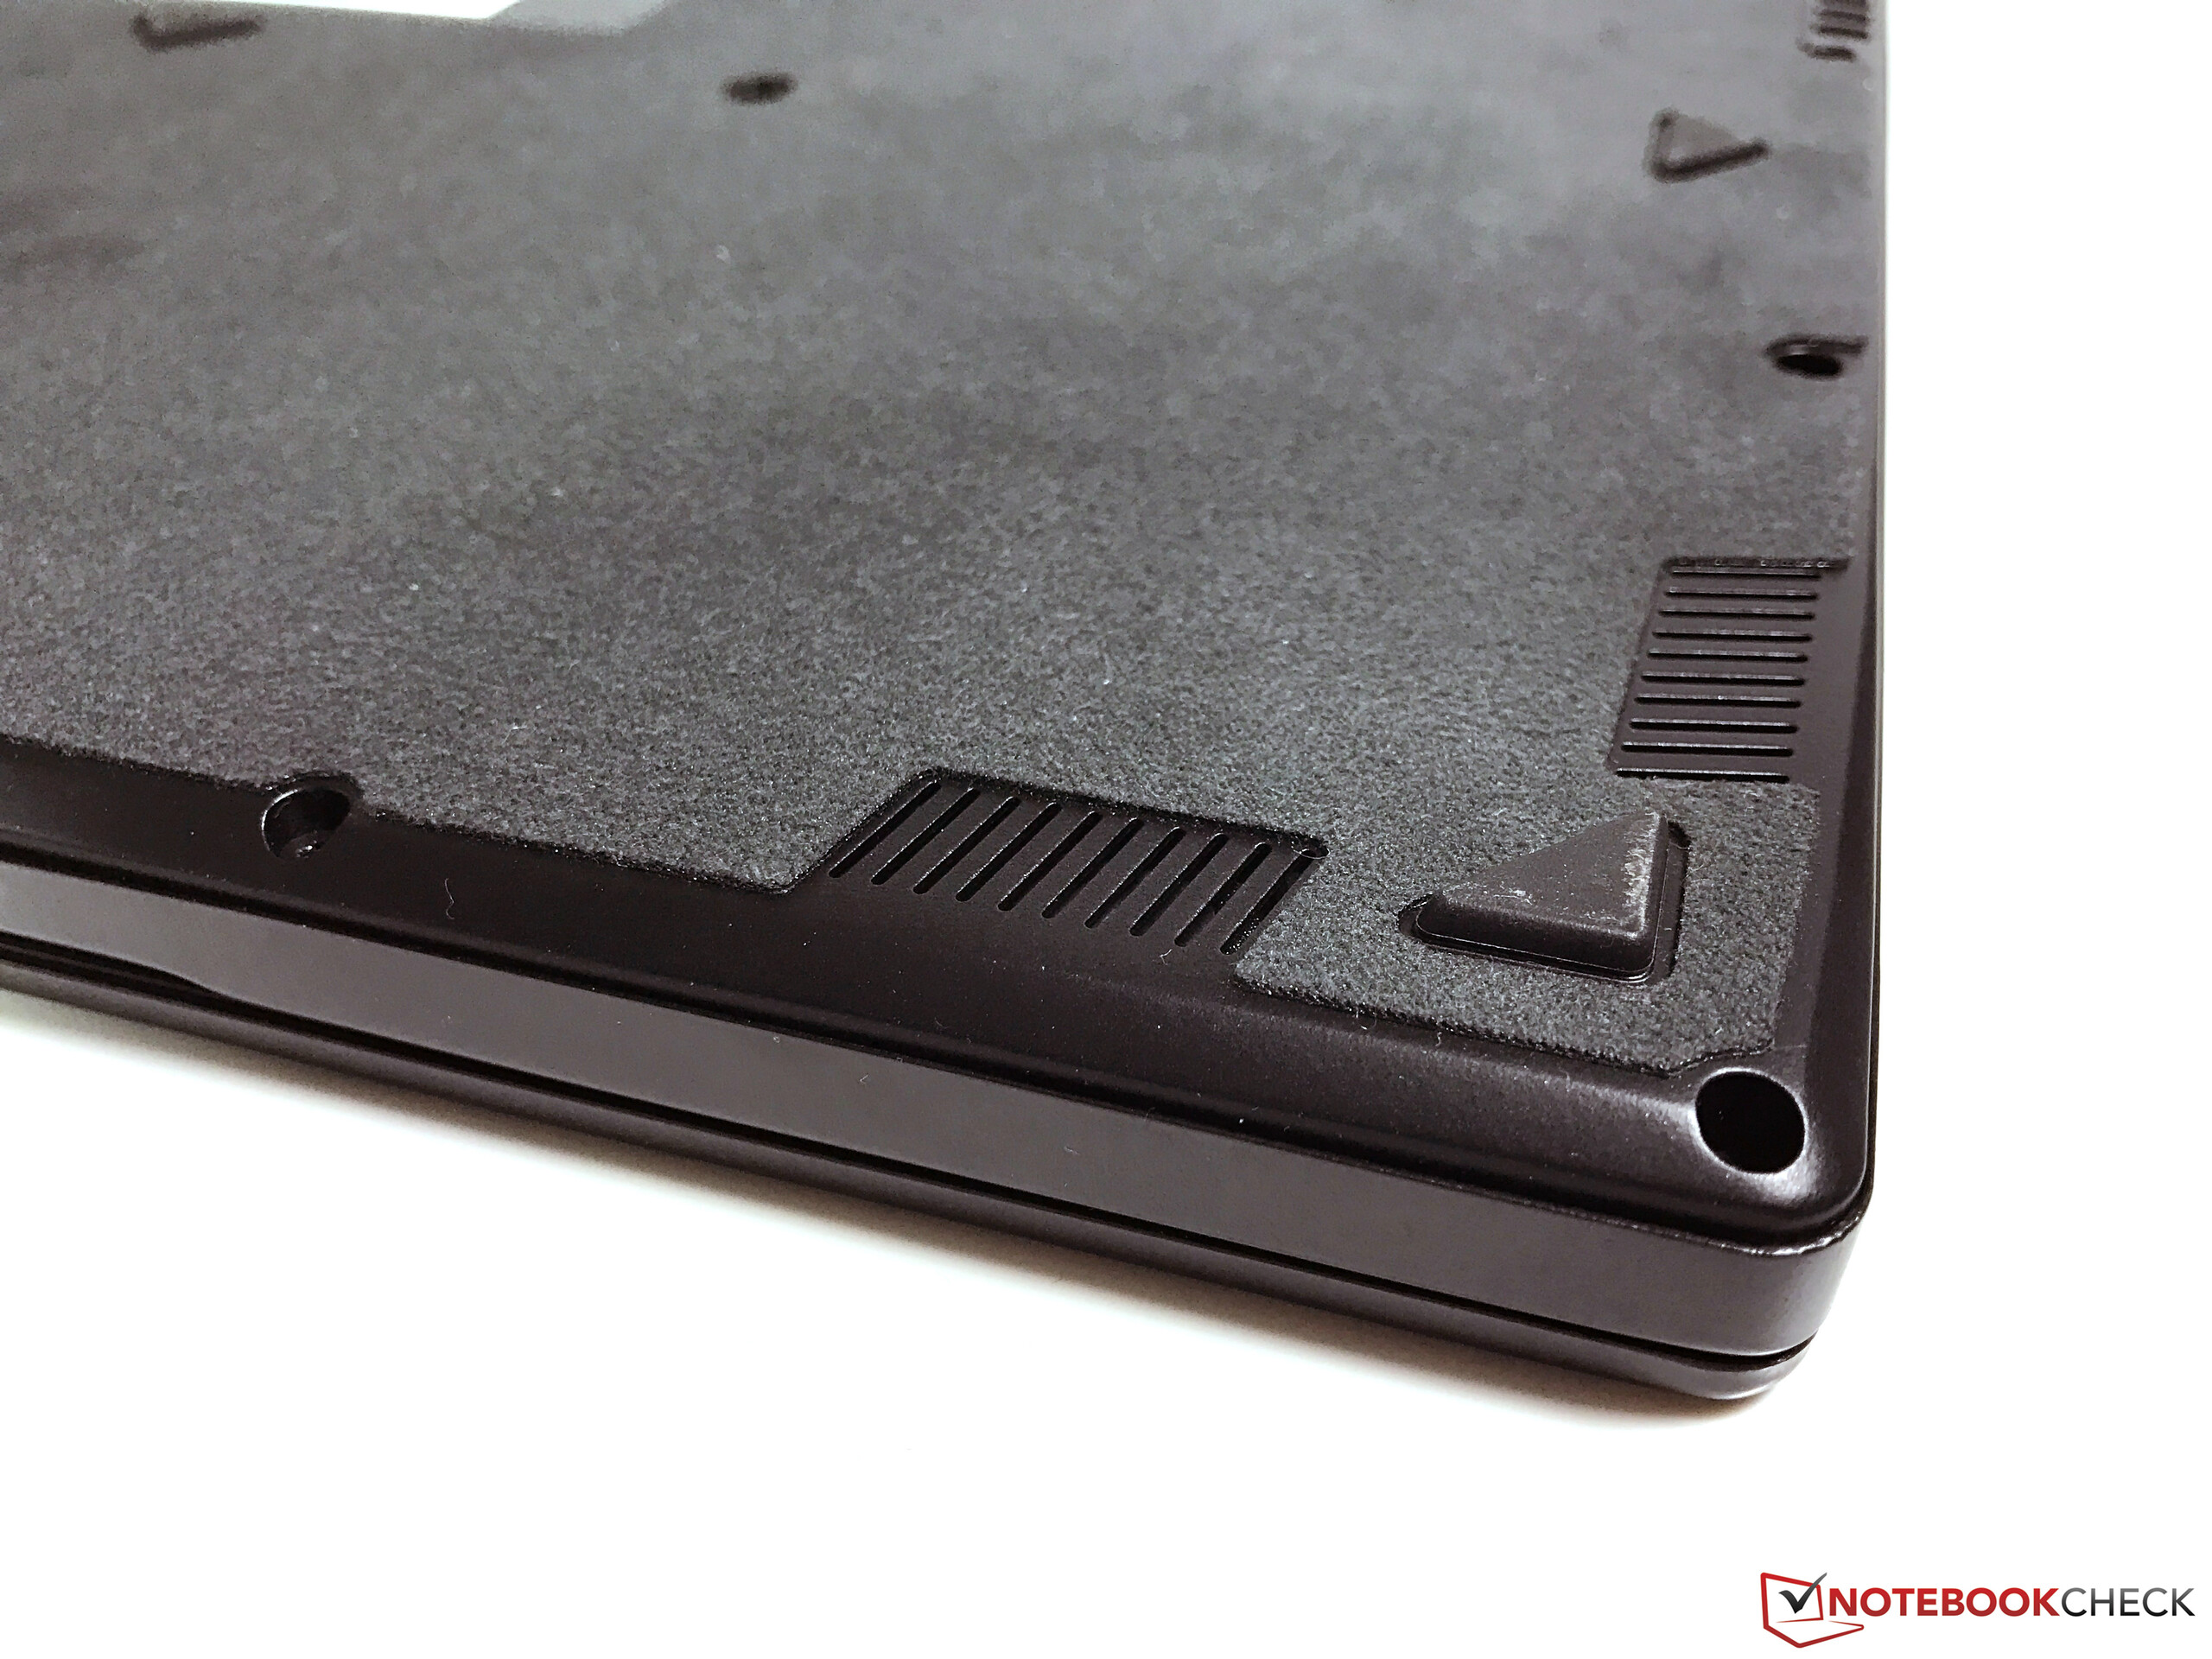
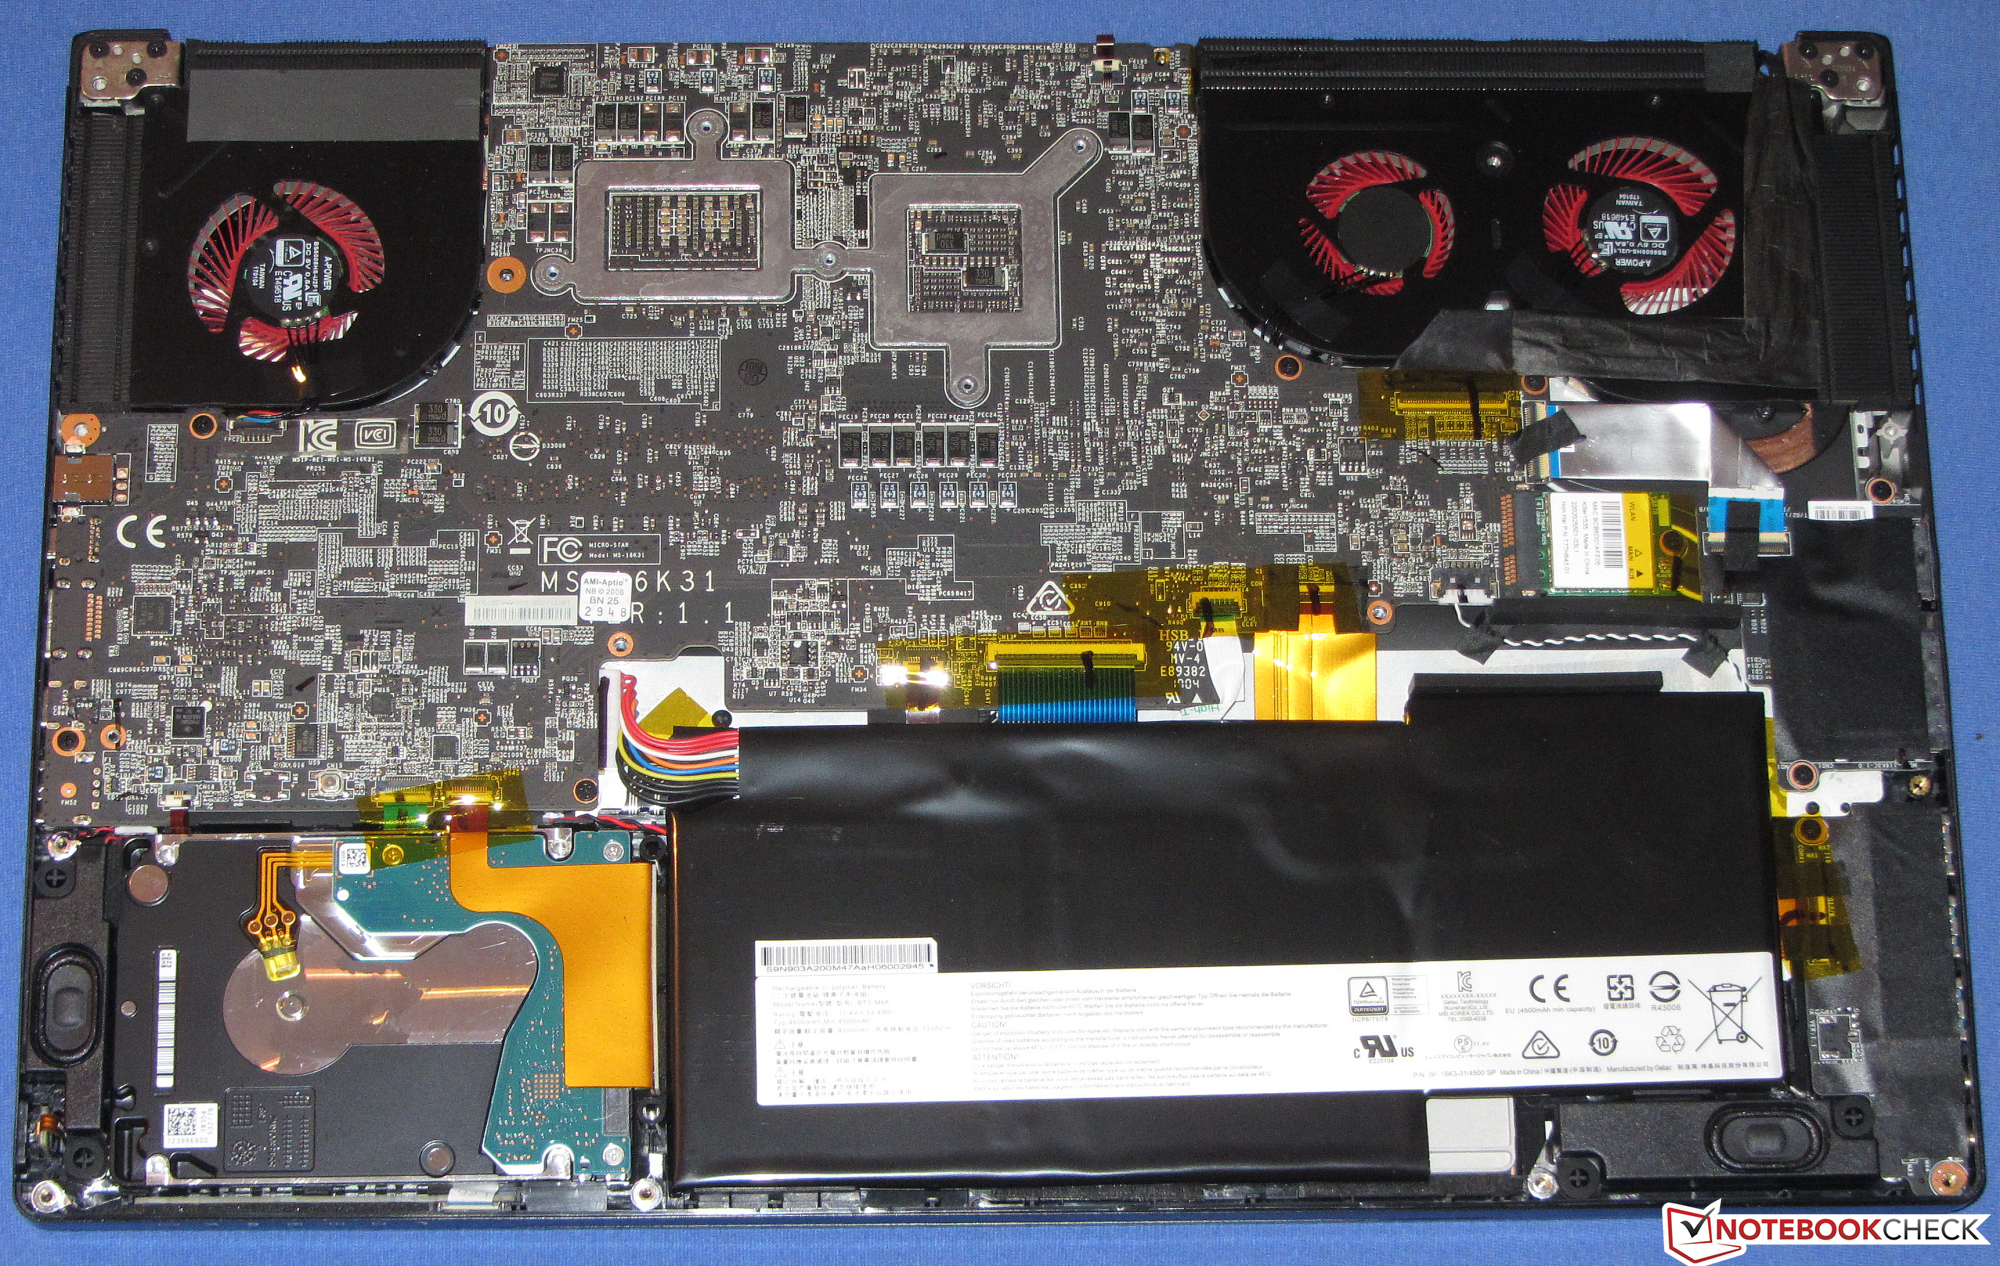
Un velocísimo SSD NVMe posibilita un sistema muy rápido. El SSD es difícil de sustituir. Para hacerlo hay que quitar toda la placa base. Cambiar el HDD 2.5" es mucho más fácil. El buen teclado debería satisfacer a quien guste de escribir mucho. La batería está bien. El veloz lector SD y el puerto Thunderbolt 3 merecen también mención.
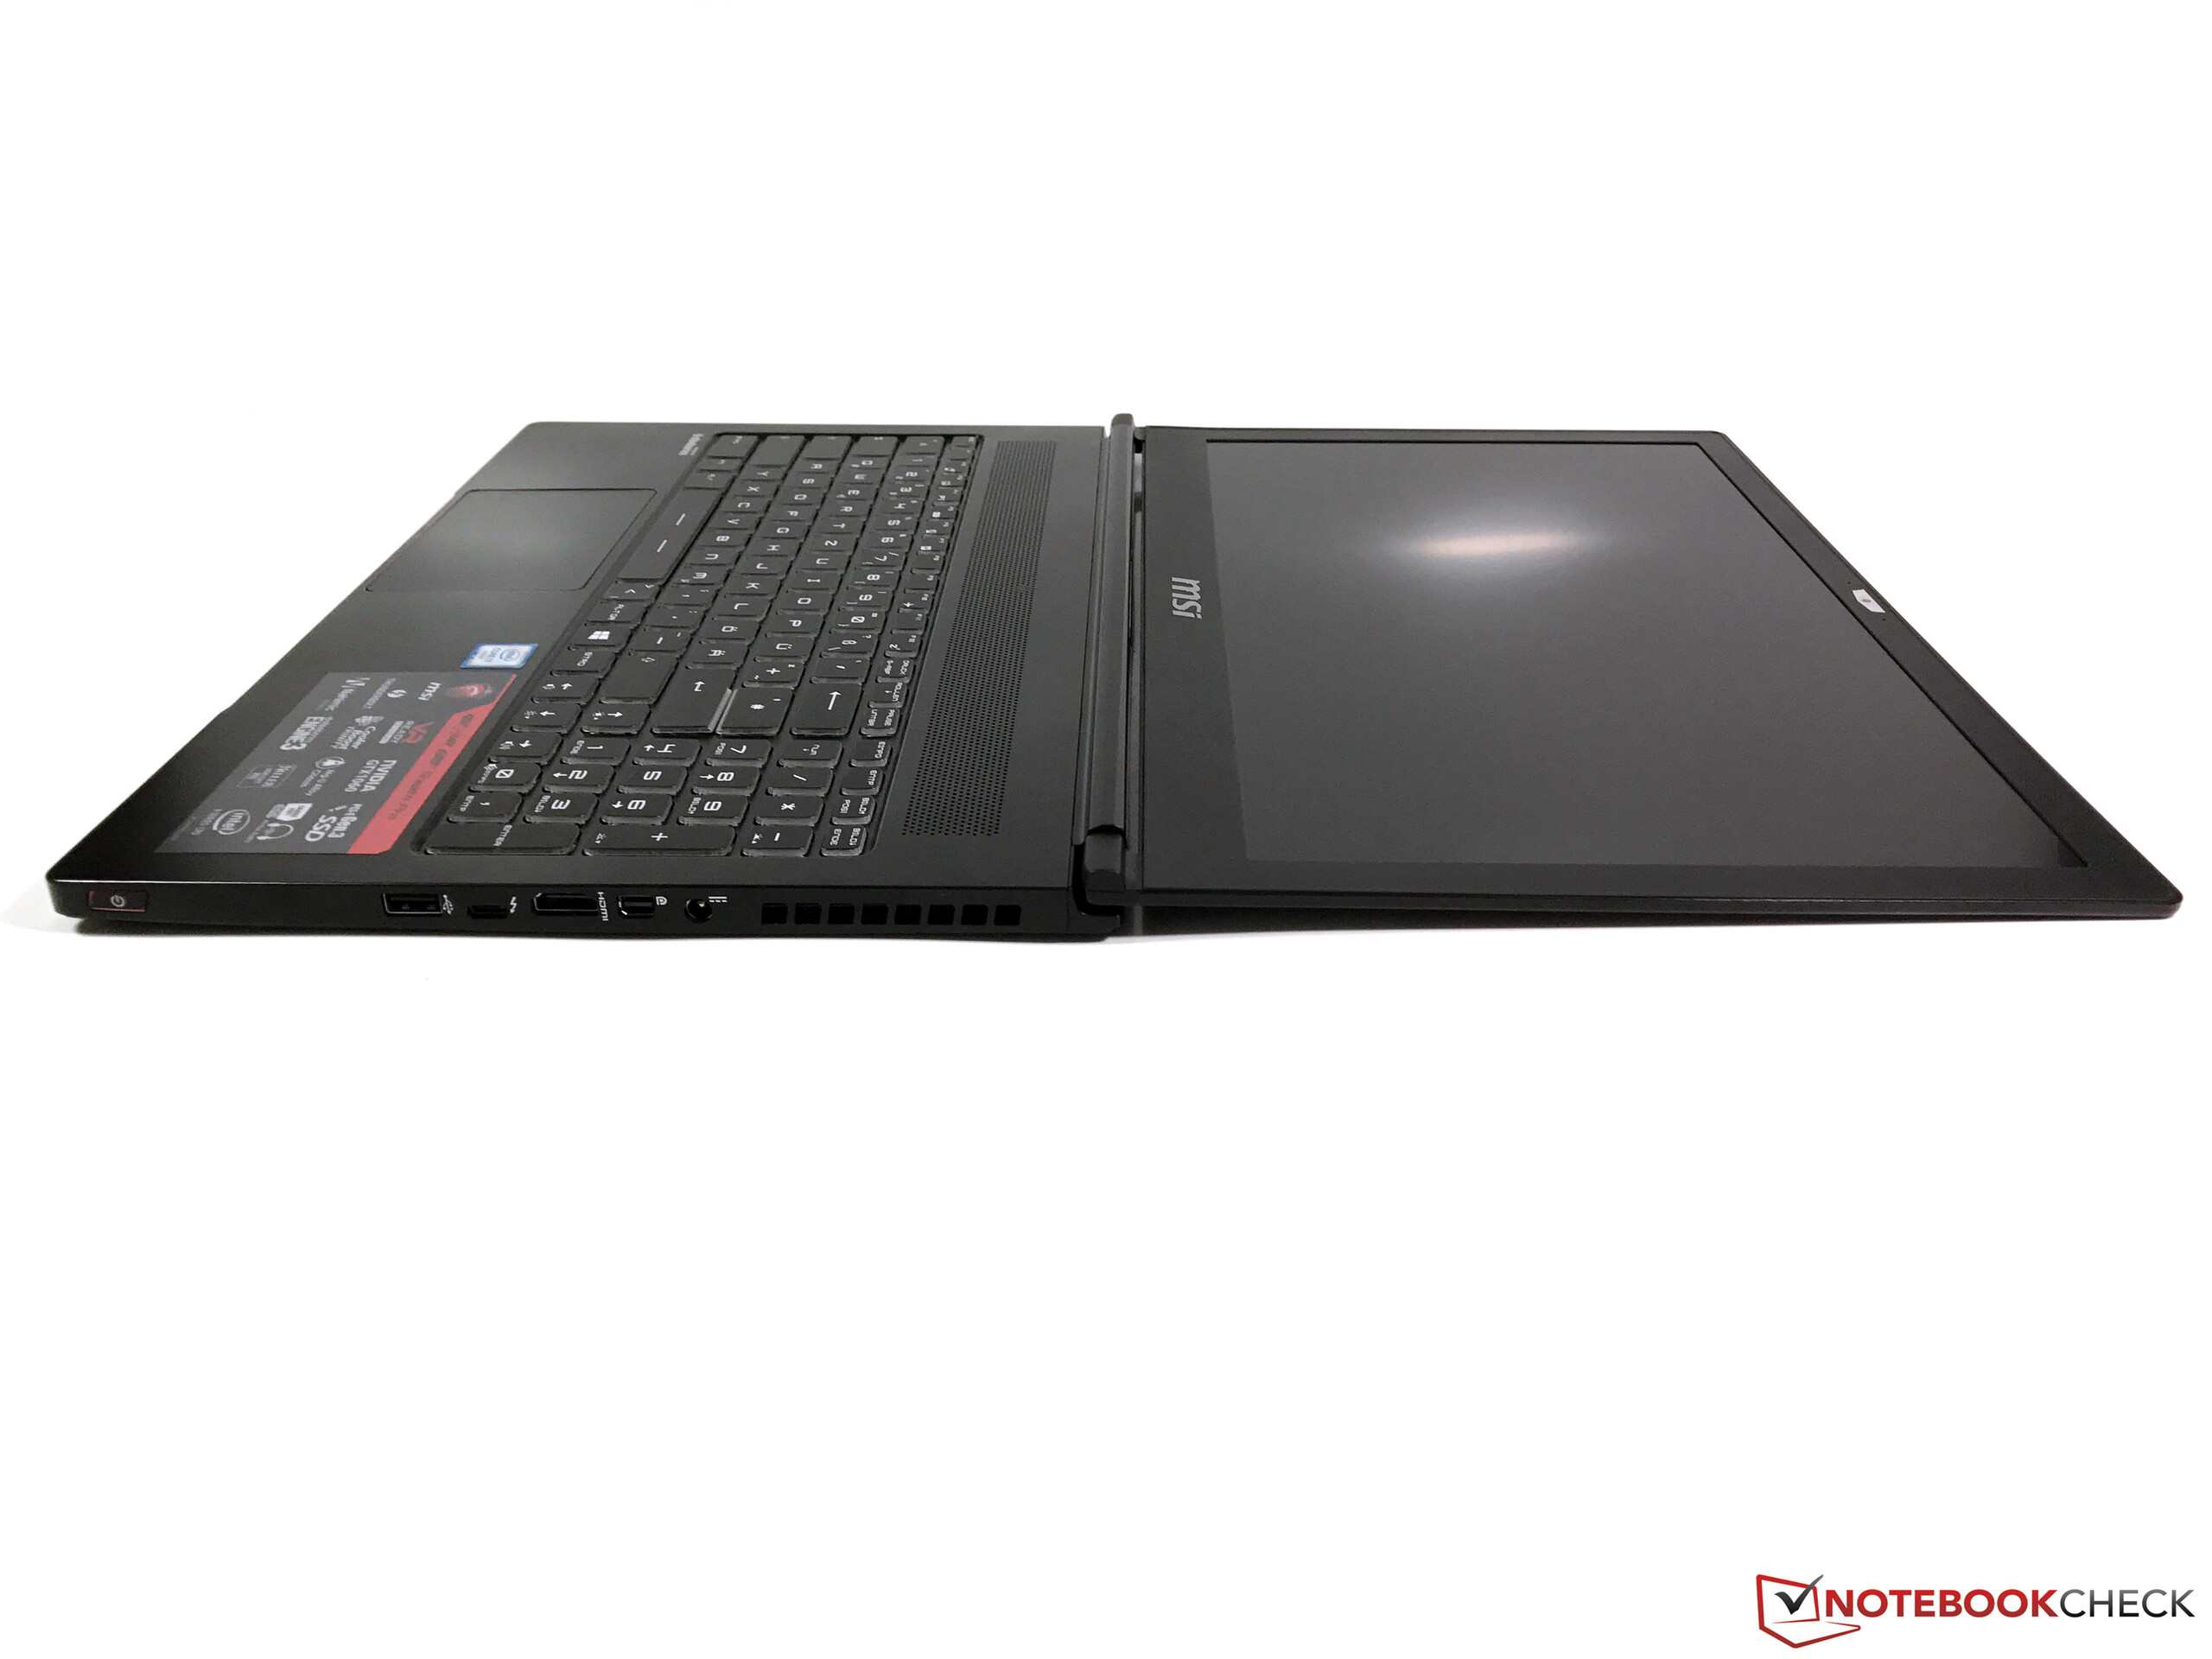
MSI busca tiempos de respuesta rápidos antes que estabilidad de ángulo de visión.
La pantalla mate Full HD deleita con un contraste genial y tiempos de respuesta rápidos. El brillo de un portátil con este precio debería haber sido superior. Lo que tenemos aquí es un display TN con poco ángulo de visión. Sin embargo, MSI usa un panel TN de mejor calidad, que tiene mejor ángulo de visión que muchos modelos que aparecen en los portátiles de menor precio.
Ésta es una versión acortada del análisis original. Puedes leer el análisis completo en inglés aquí.
MSI GS63VR 7RG-005
- 11/17/2017 v6 (old)
Sascha Mölck