Breve análisis del Ultrabook Dell XPS 13-9350 InfinityEdge
| |||||||||||||||||||||||||
iluminación: 88 %
Brillo con batería: 277.5 cd/m²
Contraste: 1453:1 (Negro: 0.191 cd/m²)
ΔE ColorChecker Calman: 4.88 | ∀{0.5-29.43 Ø4.72}
ΔE Greyscale Calman: 4.26 | ∀{0.09-98 Ø4.97}
65.79% sRGB (Argyll 1.6.3 3D)
41.6% AdobeRGB 1998 (Argyll 1.6.3 3D)
45.97% AdobeRGB 1998 (Argyll 3D)
66.8% sRGB (Argyll 3D)
44.53% Display P3 (Argyll 3D)
Gamma: 2.59
CCT: 6562 K
| Dell XPS 13-9350 | Dell XPS 13-9343 | Dell XPS 13-9343 Non-Touch | Apple MacBook Air 13 inch 2015-03 | Microsoft Surface Book Core i5 | |
|---|---|---|---|---|---|
| Display | 54% | 42% | -10% | 48% | |
| Display P3 Coverage (%) | 44.53 | 72 62% | 65.9 48% | 40.1 -10% | 67 50% |
| sRGB Coverage (%) | 66.8 | 96 44% | 89.6 34% | 59.8 -10% | 95.8 43% |
| AdobeRGB 1998 Coverage (%) | 45.97 | 71.6 56% | 66.2 44% | 41.51 -10% | 68.9 50% |
| Response Times | |||||
| Response Time Grey 50% / Grey 80% * (ms) | 48.4 ? | ||||
| Response Time Black / White * (ms) | 32.8 ? | ||||
| PWM Frequency (Hz) | |||||
| Screen | 19% | -5% | -12% | 33% | |
| Brightness middle (cd/m²) | 277.5 | 367.3 32% | 409.7 48% | 329 19% | 430.9 55% |
| Brightness (cd/m²) | 276 | 372 35% | 405 47% | 310 12% | 410 49% |
| Brightness Distribution (%) | 88 | 77 -12% | 93 6% | 82 -7% | 93 6% |
| Black Level * (cd/m²) | 0.191 | 0.178 7% | 0.366 -92% | 0.405 -112% | 0.254 -33% |
| Contrast (:1) | 1453 | 2063 42% | 1119 -23% | 812 -44% | 1696 17% |
| Colorchecker dE 2000 * | 4.88 | 5.92 -21% | 7.67 -57% | 3.96 19% | 2.06 58% |
| Greyscale dE 2000 * | 4.26 | 4.79 -12% | 4.66 -9% | 3.51 18% | 2.22 48% |
| Gamma | 2.59 85% | 2.42 91% | 1.65 133% | 3.83 57% | 2.13 103% |
| CCT | 6562 99% | 7013 93% | 6502 100% | 6711 97% | 6520 100% |
| Color Space (Percent of AdobeRGB 1998) (%) | 41.6 | 63 51% | 59.65 43% | 38.4 -8% | 64 54% |
| Color Space (Percent of sRGB) (%) | 65.79 | 96.4 47% | 59.8 -9% | 96 46% | |
| Colorchecker dE 2000 max. * | 7.51 | ||||
| Media total (Programa/Opciones) | 37% /
28% | 19% /
8% | -11% /
-12% | 41% /
37% |
* ... más pequeño es mejor
| Cinebench R11.5 | |
| CPU Single 64Bit (ordenar por valor) | |
| Dell XPS 13-9350 | |
| Dell XPS 13-9343 | |
| Dell XPS 13-9343 Non-Touch | |
| HP EliteBook Folio 1040 G2 H7W22EA | |
| Apple MacBook Air 13 inch 2015-03 | |
| Microsoft Surface Book Core i5 | |
| Apple MacBook Pro Retina 13 inch 2015-03 | |
| Apple MacBook Pro Retina 13 inch 2015-03 | |
| CPU Multi 64Bit (ordenar por valor) | |
| Dell XPS 13-9350 | |
| Dell XPS 13-9343 | |
| Dell XPS 13-9343 Non-Touch | |
| HP EliteBook Folio 1040 G2 H7W22EA | |
| Apple MacBook Air 13 inch 2015-03 | |
| Microsoft Surface Book Core i5 | |
| Apple MacBook Pro Retina 13 inch 2015-03 | |
| Apple MacBook Pro Retina 13 inch 2015-03 | |
| Cinebench R15 | |
| CPU Single 64Bit (ordenar por valor) | |
| Dell XPS 13-9350 | |
| Dell XPS 13-9343 | |
| Dell XPS 13-9343 Non-Touch | |
| HP EliteBook Folio 1040 G2 H7W22EA | |
| Apple MacBook Air 13 inch 2015-03 | |
| Microsoft Surface Book Core i5 | |
| Apple MacBook Pro Retina 13 inch 2015-03 | |
| CPU Multi 64Bit (ordenar por valor) | |
| Dell XPS 13-9350 | |
| Dell XPS 13-9343 | |
| Dell XPS 13-9343 Non-Touch | |
| HP EliteBook Folio 1040 G2 H7W22EA | |
| Apple MacBook Air 13 inch 2015-03 | |
| Microsoft Surface Book Core i5 | |
| Apple MacBook Pro Retina 13 inch 2015-03 | |
| wPrime 2.10 | |
| 32m (ordenar por valor) | |
| Dell XPS 13-9350 | |
| Dell XPS 13-9343 | |
| Dell XPS 13-9343 Non-Touch | |
| HP EliteBook Folio 1040 G2 H7W22EA | |
| Apple MacBook Air 13 inch 2015-03 | |
| Microsoft Surface Book Core i5 | |
| 1024m (ordenar por valor) | |
| Dell XPS 13-9350 | |
| Dell XPS 13-9343 | |
| Dell XPS 13-9343 Non-Touch | |
| HP EliteBook Folio 1040 G2 H7W22EA | |
| Apple MacBook Air 13 inch 2015-03 | |
| Microsoft Surface Book Core i5 | |
| Super Pi Mod 1.5 XS 32M - 32M (ordenar por valor) | |
| Dell XPS 13-9350 | |
| Dell XPS 13-9343 | |
| Dell XPS 13-9343 Non-Touch | |
| HP EliteBook Folio 1040 G2 H7W22EA | |
| Apple MacBook Air 13 inch 2015-03 | |
| Microsoft Surface Book Core i5 | |
| Apple MacBook Pro Retina 13 inch 2015-03 | |
* ... más pequeño es mejor
| PCMark 7 Score | 4989 puntos | |
| PCMark 8 Home Score Accelerated v2 | 2983 puntos | |
| PCMark 8 Creative Score Accelerated v2 | 3658 puntos | |
| PCMark 8 Work Score Accelerated v2 | 4078 puntos | |
ayuda | ||

| 3DMark 06 Standard Score | 9313 puntos | |
| 3DMark 11 Performance | 1558 puntos | |
| 3DMark Ice Storm Standard Score | 52625 puntos | |
| 3DMark Cloud Gate Standard Score | 5931 puntos | |
| 3DMark Fire Strike Score | 861 puntos | |
ayuda | ||
| bajo | medio | alto | ultra | |
|---|---|---|---|---|
| Metro 2033 (2010) | 31.33 | 19.67 | 9.67 | |
| StarCraft 2 (2010) | 49 | 32 | 21 | |
| BioShock Infinite (2013) | 54.7 | 28.16 | 23.7 | 7.33 |
| 3DMark 06 - 1280x1024 Standard Score AA:0x AF:0x (ordenar por valor) | |
| Dell XPS 13-9350 | |
| Dell XPS 13-9343 | |
| Dell XPS 13-9343 Non-Touch | |
| Apple MacBook Air 13 inch 2015-03 | |
| Microsoft Surface Book Core i5 | |
| Apple MacBook Pro Retina 13 inch 2015-03 | |
| 3DMark 11 | |
| 1280x720 Performance (ordenar por valor) | |
| Dell XPS 13-9350 | |
| Dell XPS 13-9343 | |
| Dell XPS 13-9343 Non-Touch | |
| HP EliteBook Folio 1040 G2 H7W22EA | |
| Apple MacBook Air 13 inch 2015-03 | |
| Microsoft Surface Book Core i5 | |
| Apple MacBook Pro Retina 13 inch 2015-03 | |
| 1280x720 Performance GPU (ordenar por valor) | |
| Dell XPS 13-9350 | |
| Dell XPS 13-9343 Non-Touch | |
| HP EliteBook Folio 1040 G2 H7W22EA | |
| Apple MacBook Air 13 inch 2015-03 | |
| Microsoft Surface Book Core i5 | |
| Apple MacBook Pro Retina 13 inch 2015-03 | |
Ruido
| Ocioso |
| 28.2 / 28.3 / 28.4 dB(A) |
| Carga |
| 30.2 / 30.2 dB(A) |
 | ||
30 dB silencioso 40 dB(A) audible 50 dB(A) ruidosamente alto |
||
min: | ||
| Dell XPS 13-9350 | Dell XPS 13-9343 | Dell XPS 13-9343 Non-Touch | Apple MacBook Air 13 inch 2015-03 | Microsoft Surface Book Core i5 | |
|---|---|---|---|---|---|
| Noise | -19% | -8% | -19% | -15% | |
| Idle Minimum * (dB) | 28.2 | 30.2 -7% | 29 -3% | 29.2 -4% | 29.5 -5% |
| Idle Average * (dB) | 28.3 | 30.3 -7% | 29.1 -3% | 29.2 -3% | 29.6 -5% |
| Idle Maximum * (dB) | 28.4 | 30.4 -7% | 29.2 -3% | 29.2 -3% | 29.7 -5% |
| Load Average * (dB) | 30.2 | 34.4 -14% | 31.1 -3% | 40.2 -33% | 37.5 -24% |
| Load Maximum * (dB) | 30.2 | 48 -59% | 38.4 -27% | 46.3 -53% | 40.9 -35% |
* ... más pequeño es mejor
(-) La temperatura máxima en la parte superior es de 45.2 °C / 113 F, frente a la media de 35.9 °C / 97 F, que oscila entre 21.4 y 59 °C para la clase Subnotebook.
(-) El fondo se calienta hasta un máximo de 45.2 °C / 113 F, frente a la media de 39.2 °C / 103 F
(+) En reposo, la temperatura media de la parte superior es de 27 °C / 81# F, frente a la media del dispositivo de 30.8 °C / 87 F.
(+) El reposamanos y el panel táctil están a una temperatura inferior a la de la piel, con un máximo de 30.8 °C / 87.4 F y, por tanto, son fríos al tacto.
(-) La temperatura media de la zona del reposamanos de dispositivos similares fue de 28.2 °C / 82.8 F (-2.6 °C / -4.6 F).
| Dell XPS 13-9350 | Dell XPS 13-9343 | Dell XPS 13-9343 Non-Touch | Apple MacBook Air 13 inch 2015-03 | Microsoft Surface Book Core i5 | |
|---|---|---|---|---|---|
| Duración de Batería | 5% | 32% | 34% | 10% | |
| Reader / Idle (h) | 13 | 15.2 17% | 21.6 66% | 26.2 102% | 17.8 37% |
| WiFi v1.3 (h) | 7.5 | 10 33% | 10.3 37% | 6.7 -11% | |
| Load (h) | 2.5 | 2.3 -8% | 2.4 -4% | 1.6 -36% | 2.6 4% |
| WiFi (h) | 9.7 |
Pro
Contra
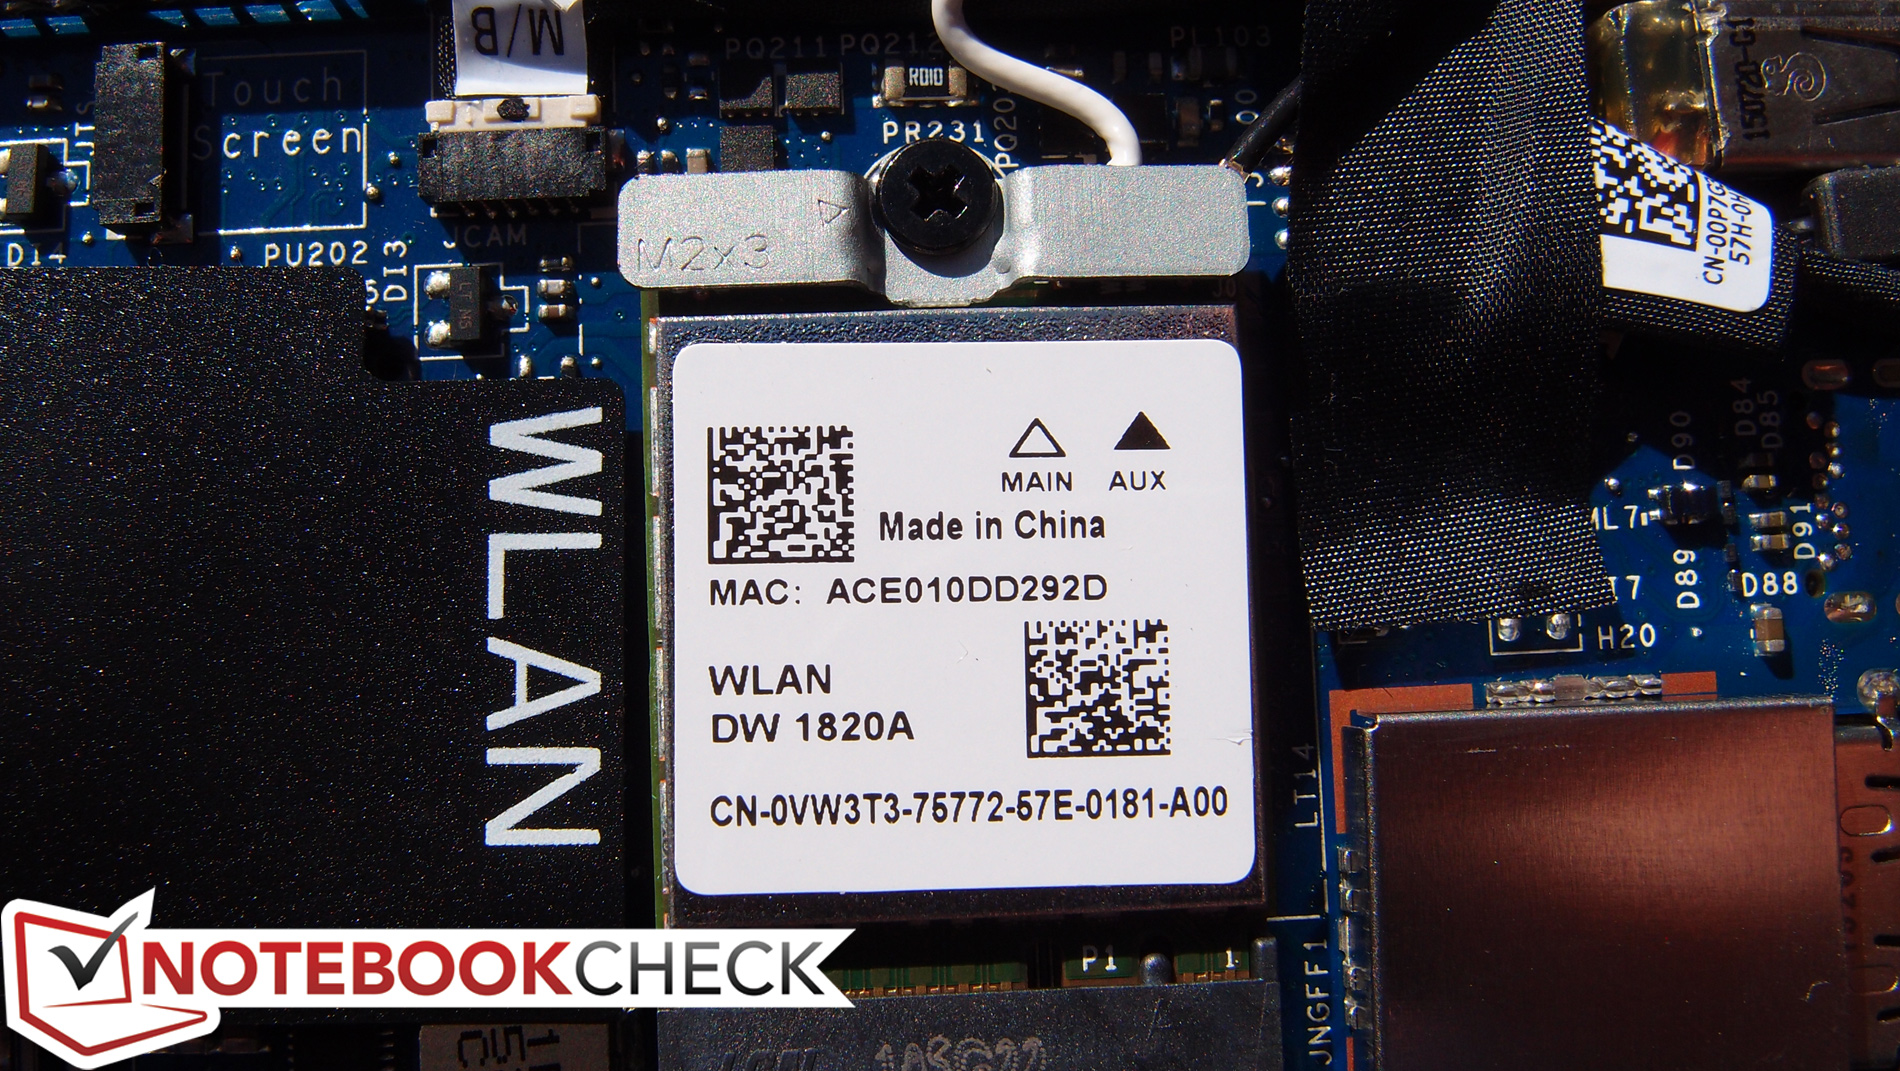
Ocho meses después, el Dell XPS 13 sigue siendo un contendiente de primera por la corona ultraportable, equipado con un chipset y una CPU mejoradas, un almacenamiento NVMe SSD más rápido, configuraciones de memoria mejoradas, gráfica integrada superior, y, además de todo eso, un funcionamiento notablemente más silencioso. No es el Ultrabook más rápido que hemos probado; hay una serie de contendientes modernos—desde el Microsoft Surface Book al Apple MacBook Air 13—que superan sus puntuaciones de rendimiento de sistema por un escaso margen. Pero el hecho es que esas fuertes puntuaciones de rendimiento se basan en unas características equilibradas con maestría que lo hacen tan atractivo. Los ganadores de la categoría ultraportable mainstream no se definen por una victoria absoluta en unas pocas categorías, sino más bien un potente rendimiento equilibrado en toda la tabla.
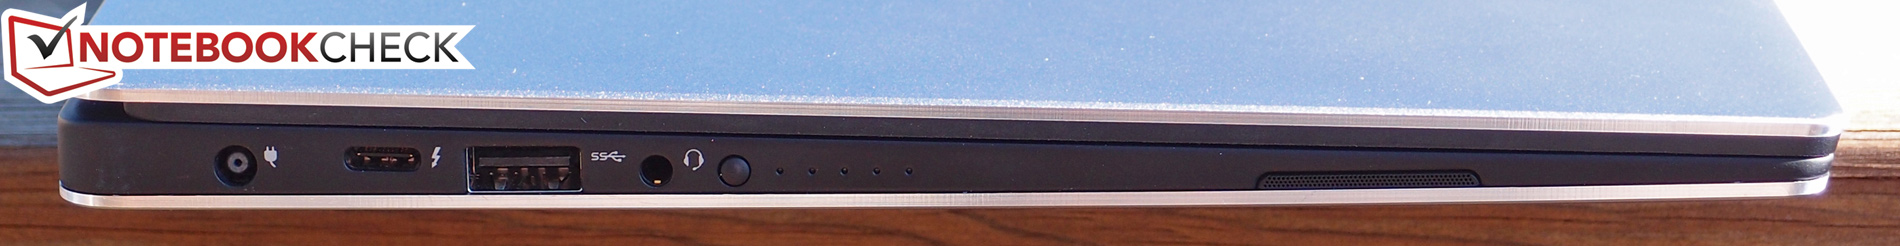
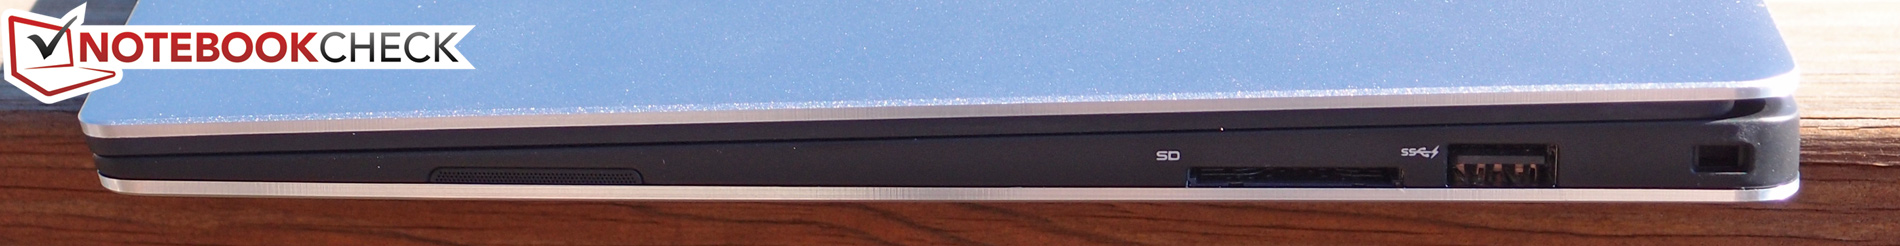
El punto fuerte del Dell XPS 13-9350 está en su delicado equilibrio de todo lo que importa en el mercado ultraportable. Ya pongas el énfasis en la portabilidad, el rendimiento, la versatilidad, la ergonomía, el calor y el ruido, o incluso en la belleza, no hay mucho de qué quejarse.
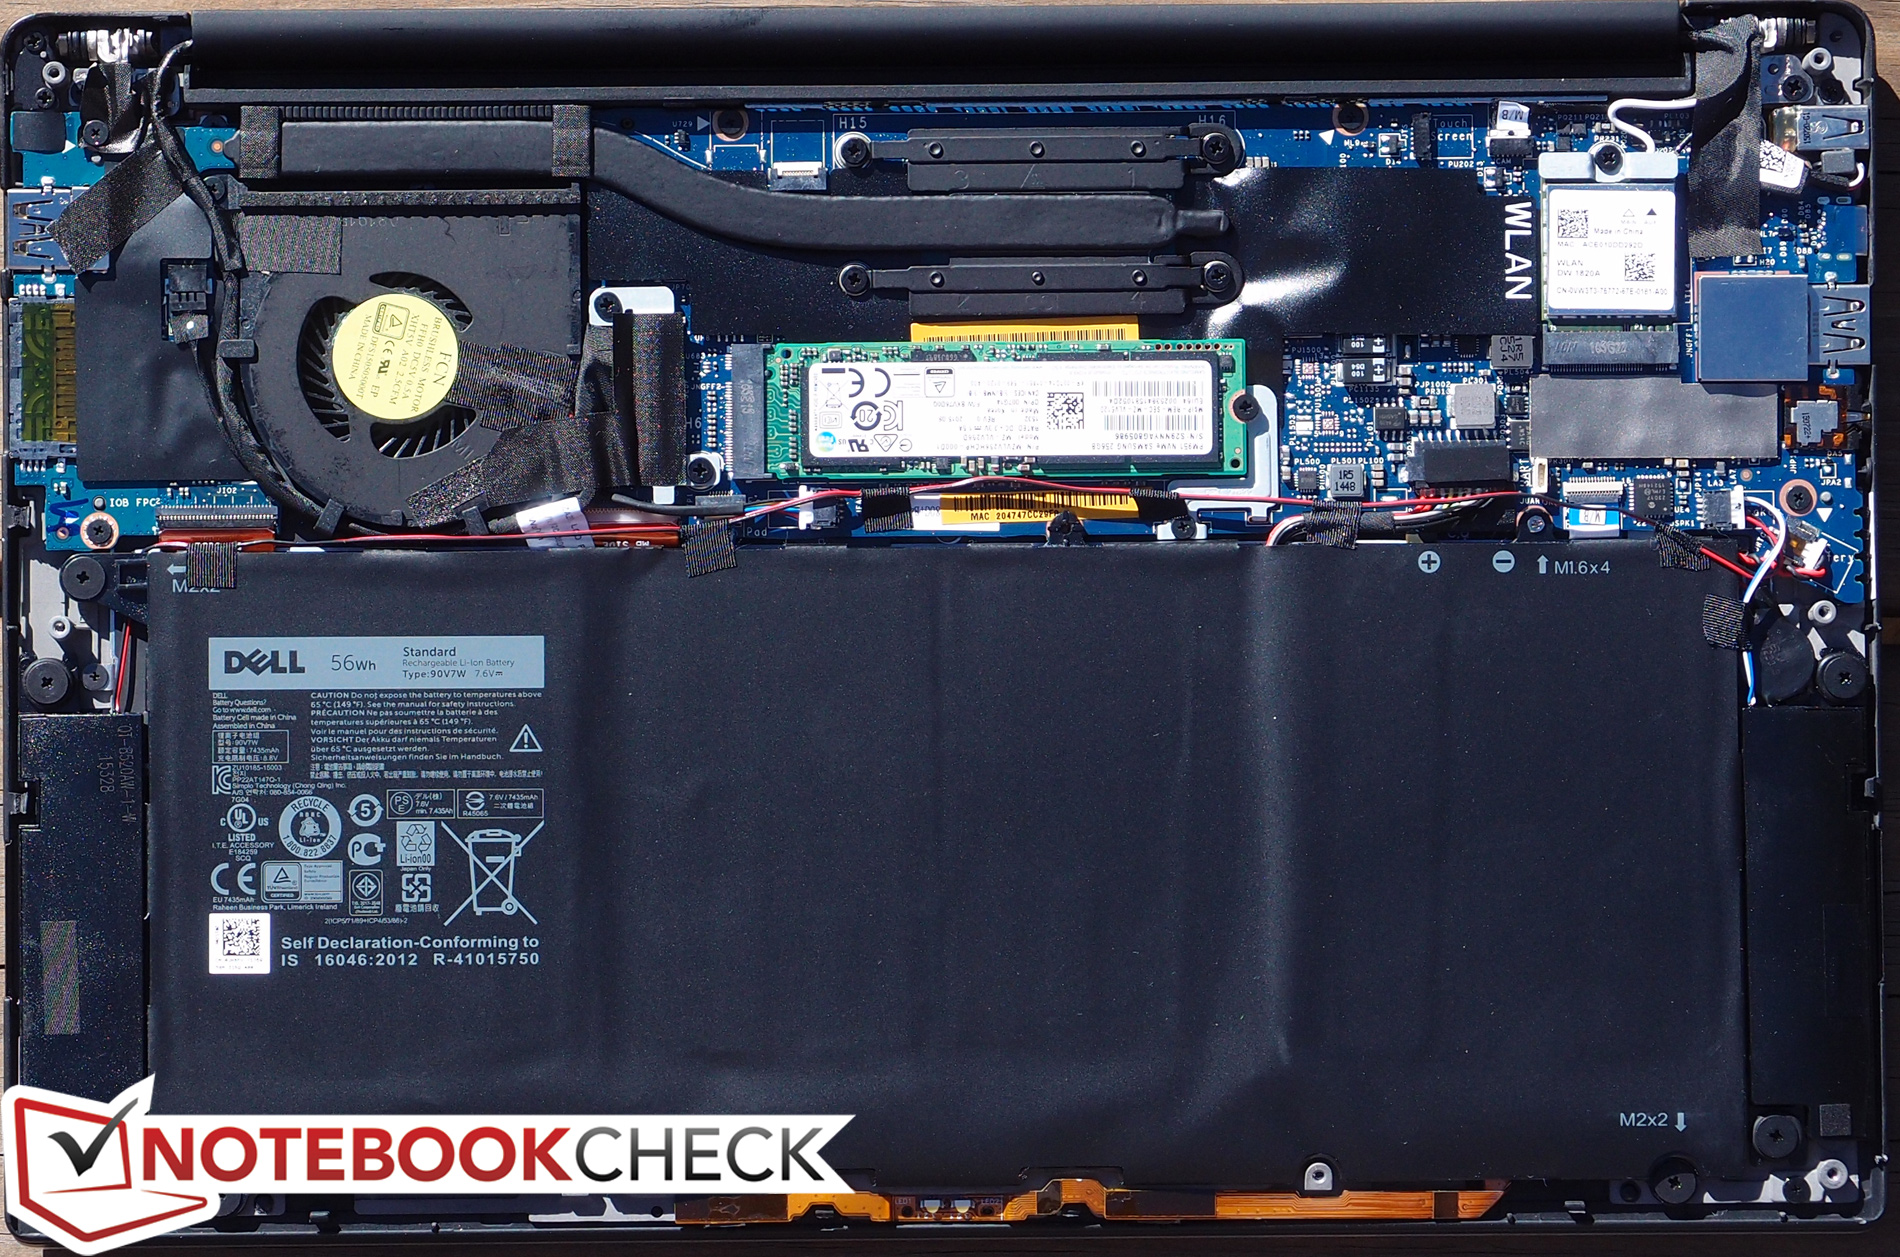
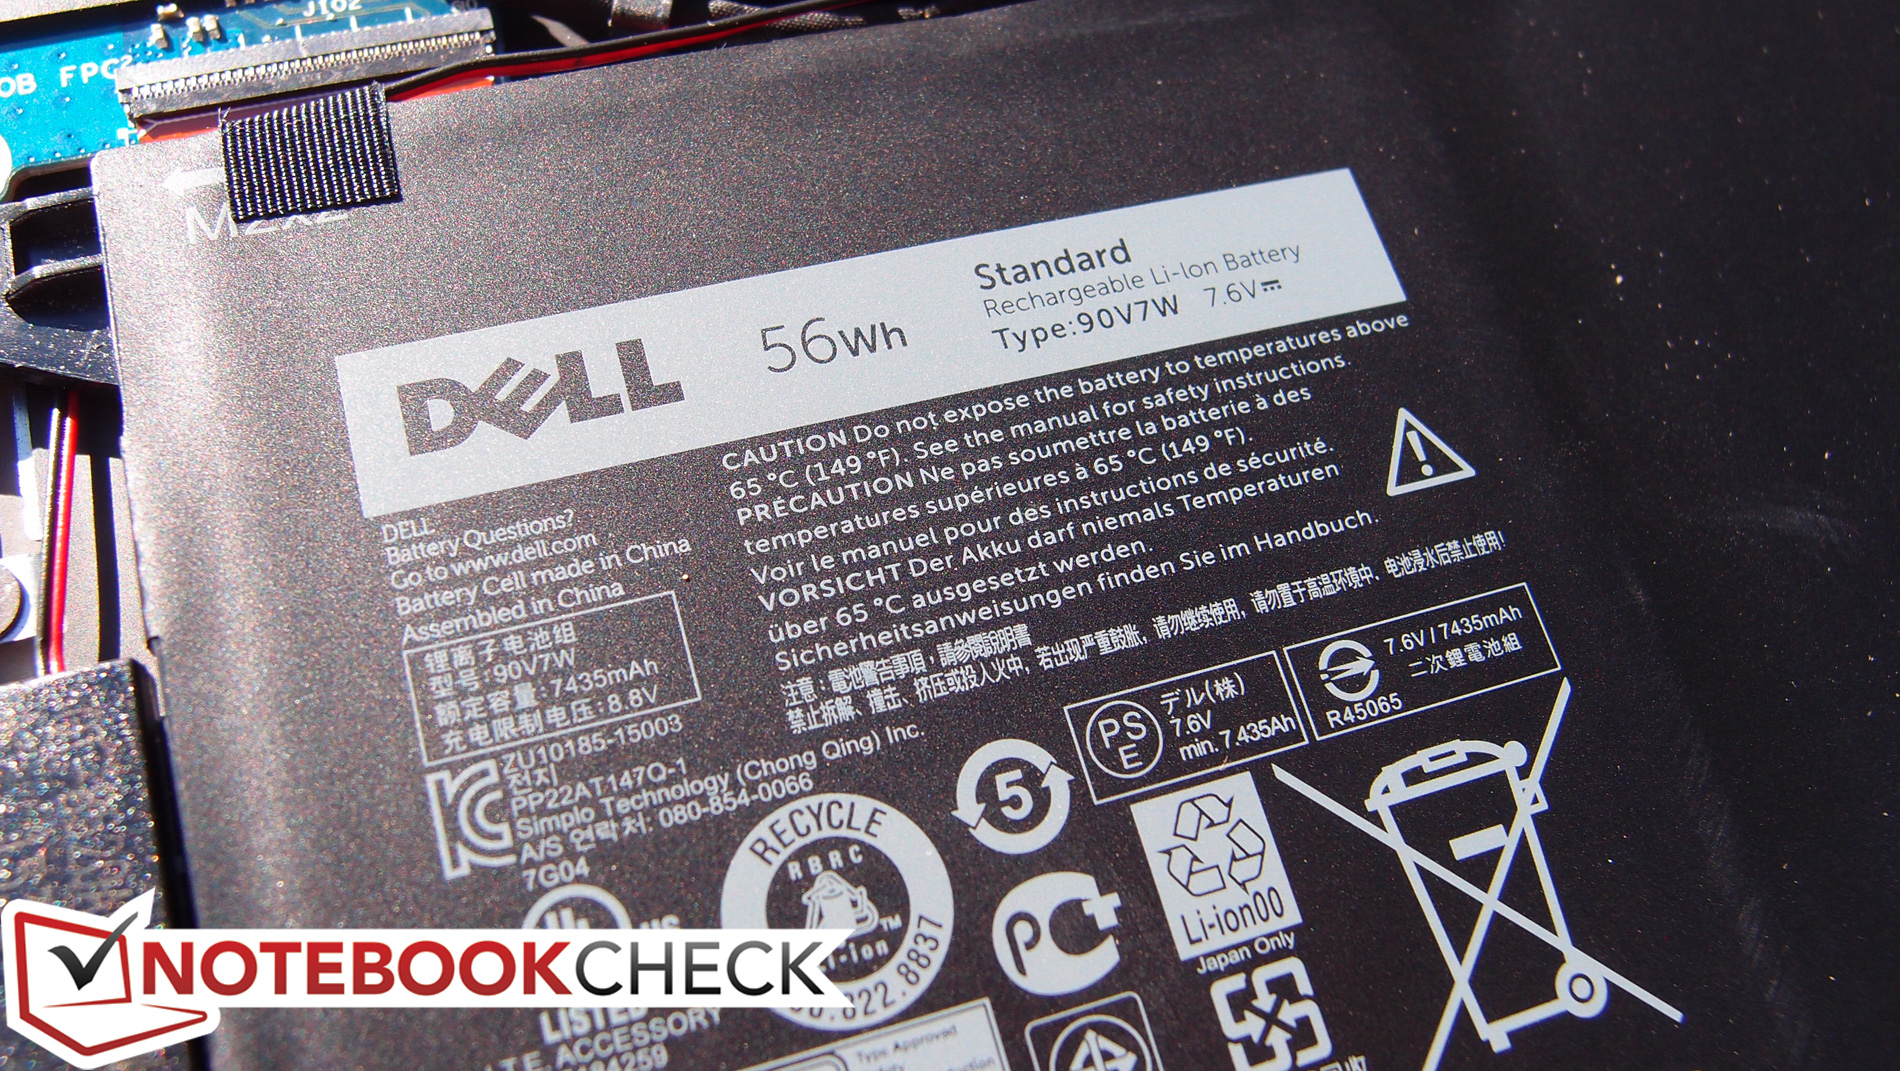
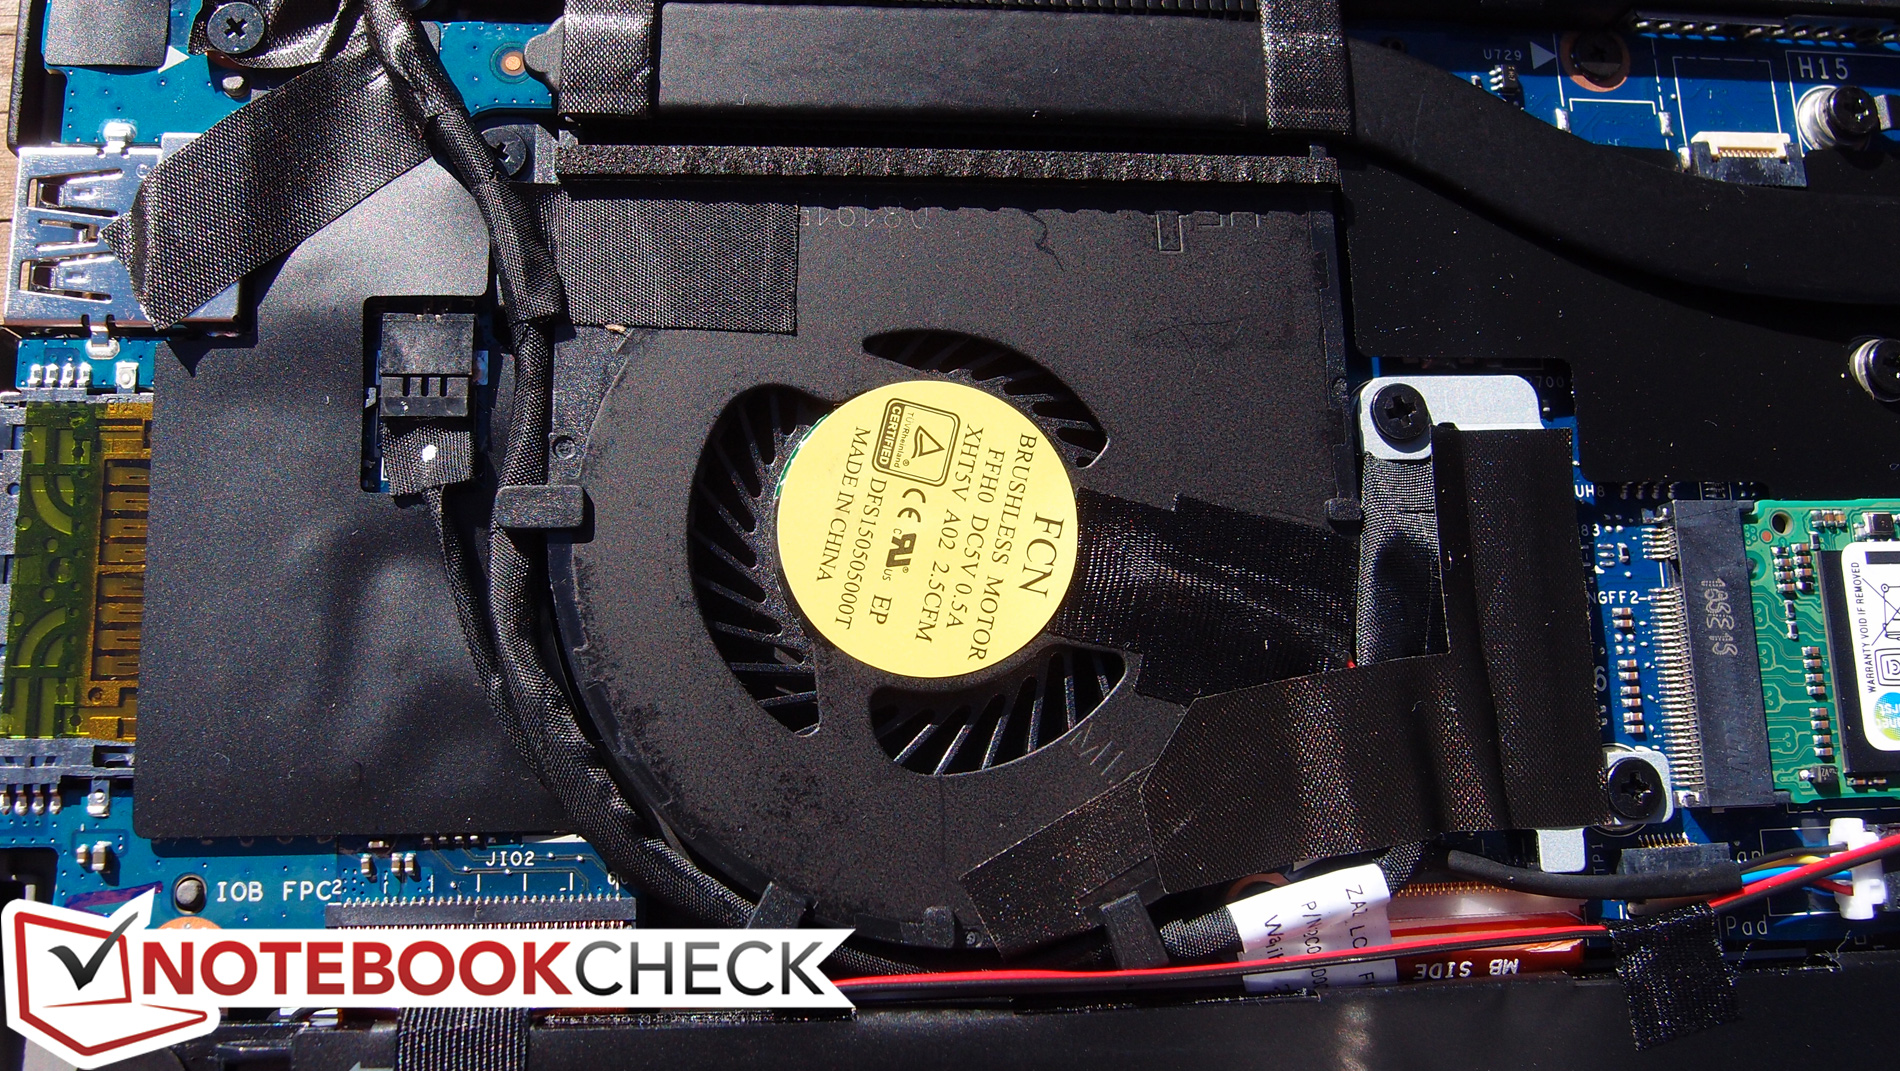
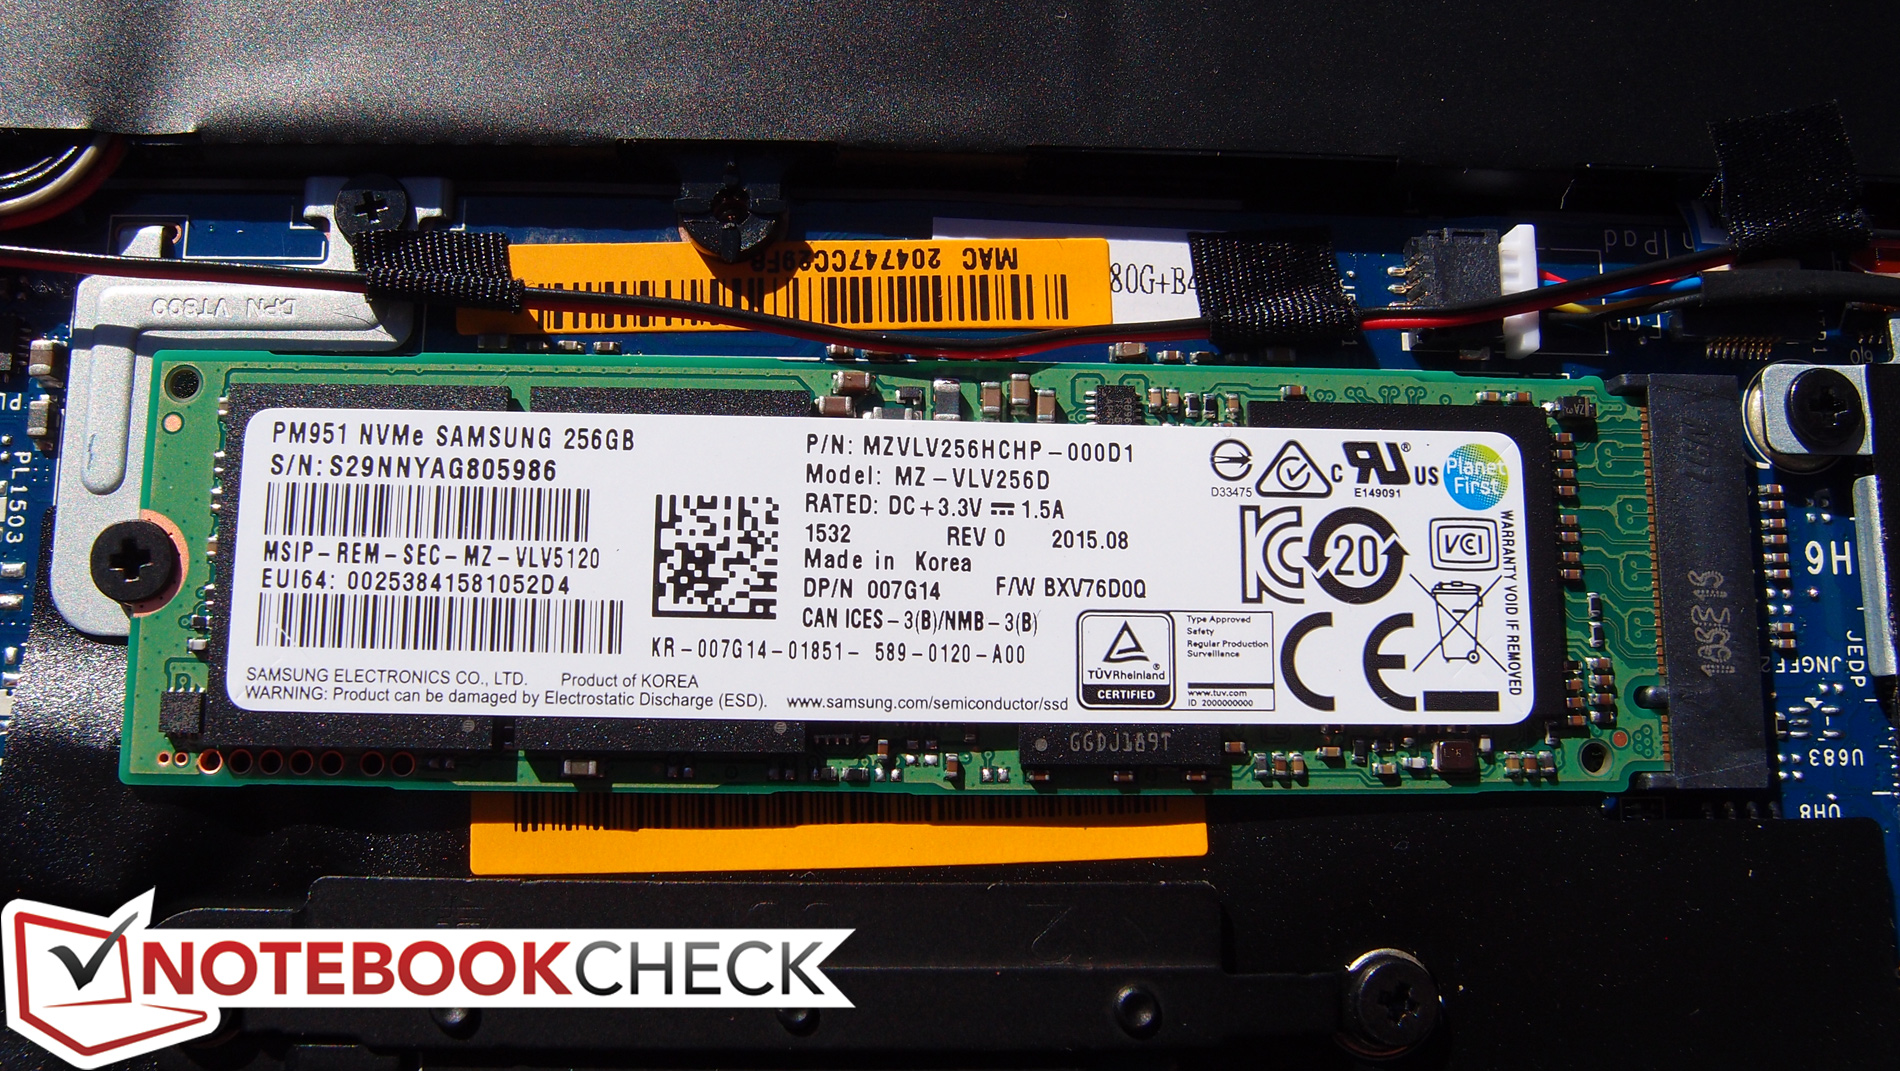
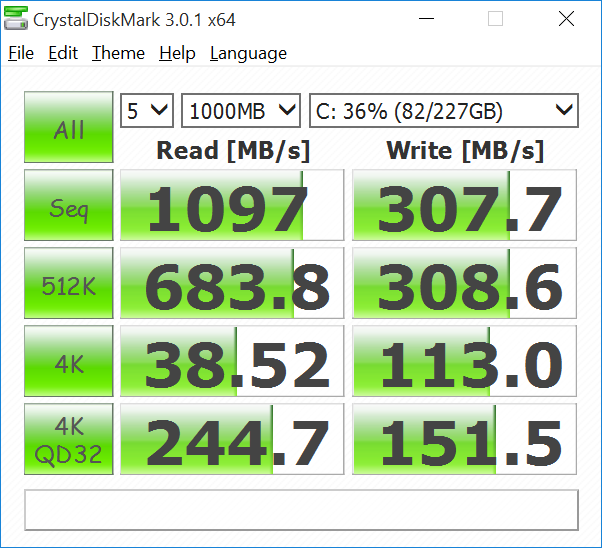
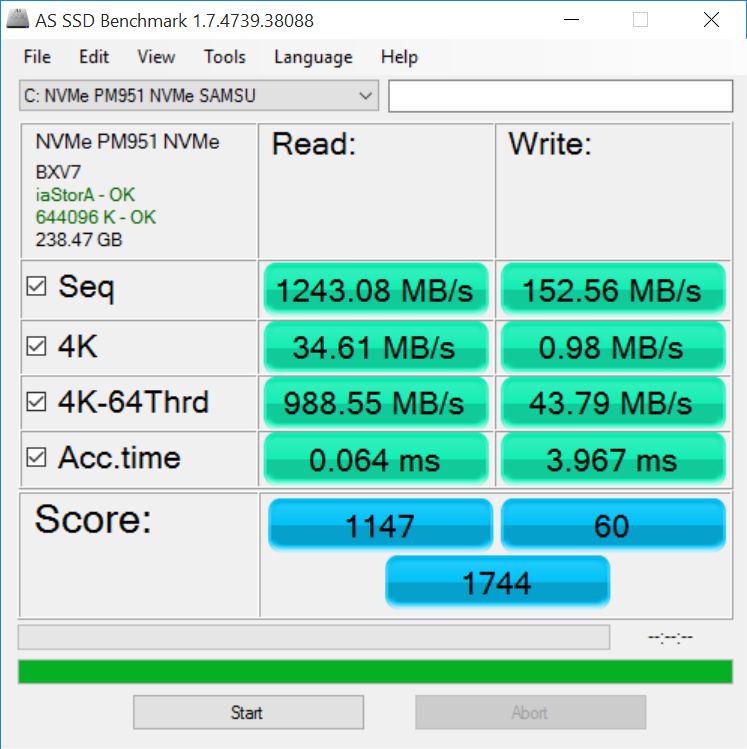
Las quejas que hemos identificado son aún más insignificantes que las de nuestro anterior análisis: una gama de colores escasa para el display, opciones limitadas de mantenimiento y mejoras, y una garantía estándar de envío por correo. Las vleocidades de escritura del Samsung SSD también son lentas para su clase, y es una pena ver el regreso del malignísimo brillo automático CBAC. Sin embargo, no hay ningún otro defecto evidente, incluso tras nuestros procedimientos intensivos de evaluación y testeo.
Así pues, ¿merece la pena? Cada contendiente explorado en este análisis quiere satisfacer casi a cualquier cliente, sin importar lo exigente —pero el Dell XPS 13-9350 definitivamente tiene el diseño más innovador y el mejor equilibrio general entre portabilidad, potencia y valor.
Ésta es una versión acortada del análisis original. Puedes leer el análisis completo en inglés aquí.
Dell XPS 13-9350
- 02/16/2016 v5 (old)
Steve Schardein
Price comparison
