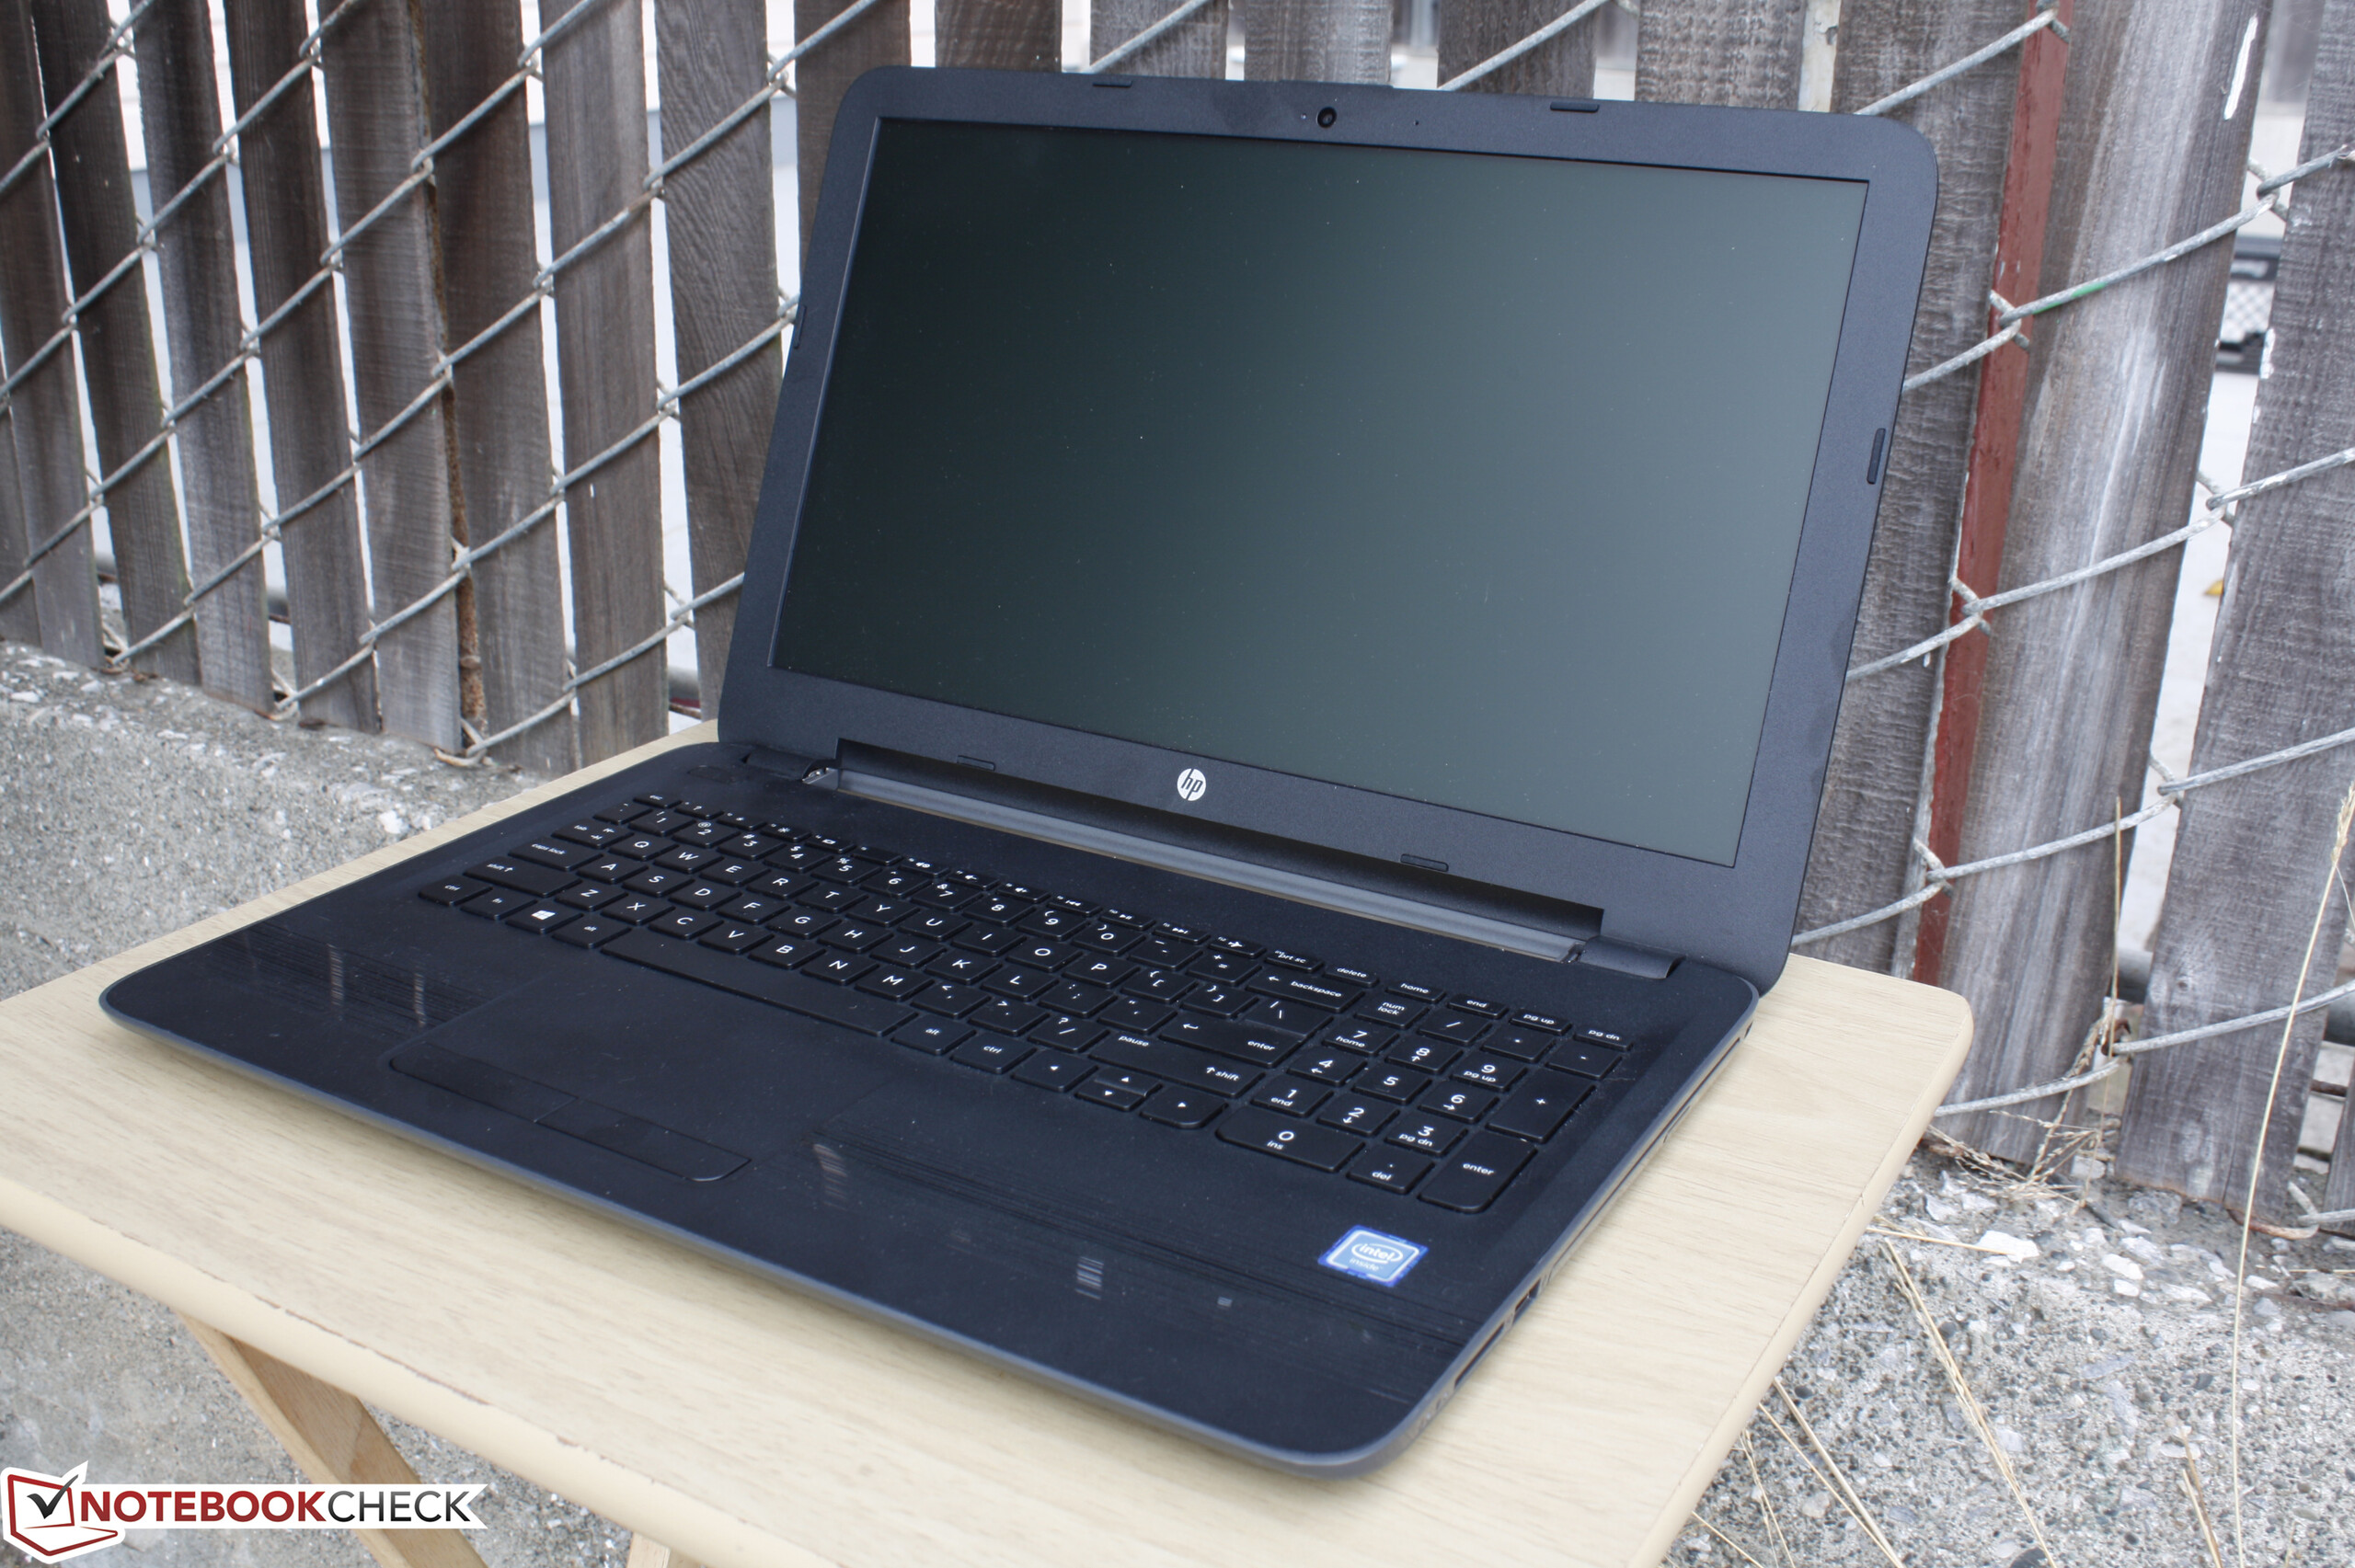
Breve análisis del HP 250 G5 Y1V08UT (Celeron N3060, HD)


| SD Card Reader | |
| average JPG Copy Test (av. of 3 runs) | |
| Dell XPS 15-9550 i7 | |
| Acer Extensa 2520-59CD | |
| HP 250 G5 Y1V08UT | |
| maximum AS SSD Seq Read Test (1GB) | |
| Dell XPS 15-9550 i7 | |
| Acer Extensa 2520-59CD | |
| HP 250 G5 Y1V08UT | |
| Networking | |
| iperf Server (receive) TCP 1 m 512KB | |
| MSI GT72VR 6RD-063US | |
| HP 250 G5 Y1V08UT | |
| iperf Client (transmit) TCP 1 m 512KB | |
| MSI GT72VR 6RD-063US | |
| HP 250 G5 Y1V08UT | |
| |||||||||||||||||||||||||
iluminación: 85 %
Brillo con batería: 199.8 cd/m²
Contraste: 281:1 (Negro: 0.712 cd/m²)
ΔE ColorChecker Calman: 13.24 | ∀{0.5-29.43 Ø4.71}
ΔE Greyscale Calman: 13.33 | ∀{0.09-98 Ø4.96}
53.4% sRGB (Argyll 1.6.3 3D)
33.8% AdobeRGB 1998 (Argyll 1.6.3 3D)
36.6% AdobeRGB 1998 (Argyll 3D)
53.3% sRGB (Argyll 3D)
35.43% Display P3 (Argyll 3D)
Gamma: 1.69
CCT: 15879 K
| HP 250 G5 Y1V08UT LG Philips LGD0504, TN LED, 15.6", 1366x768 | Acer Extensa 2520-59CD ChiMei N156BGE-E32, TN LED, 15.6", 1366x768 | Lenovo B50-10 80QR0013GE Chi Mei N156BGE-EA2, TN LED, 15.6", 1366x768 | Asus F540SA-XX087T Chi Mei N156BGE-E42, TN LED, 15.6", 1366x768 | HP 250 G4 T6P08ES ChiMei, TN LED, 15.6", 1366x768 | HP 250 G5 SP X0N33EA AU Optronics AUO38ED, TN, 15.6", 1920x1080 | |
|---|---|---|---|---|---|---|
| Display | 15% | 13% | 13% | 23% | 3% | |
| Display P3 Coverage (%) | 35.43 | 40.71 15% | 40.21 13% | 40.17 13% | 43.63 23% | 36.51 3% |
| sRGB Coverage (%) | 53.3 | 61.1 15% | 60.1 13% | 60 13% | 65.1 22% | 55 3% |
| AdobeRGB 1998 Coverage (%) | 36.6 | 42.07 15% | 41.56 14% | 41.54 13% | 45.1 23% | 37.72 3% |
| Response Times | -16% | 33% | 42% | 9% | 15% | |
| Response Time Grey 50% / Grey 80% * (ms) | 42.4 ? | 52 ? -23% | 28 ? 34% | 20 ? 53% | 42 ? 1% | 40 ? 6% |
| Response Time Black / White * (ms) | 28.8 ? | 31 ? -8% | 20 ? 31% | 20 ? 31% | 24 ? 17% | 22 ? 24% |
| PWM Frequency (Hz) | 1000 | 200 ? | 200 ? | 806 ? | ||
| Screen | 20% | 29% | 39% | 22% | 18% | |
| Brightness middle (cd/m²) | 199.8 | 211 6% | 245 23% | 215 8% | 220 10% | 219 10% |
| Brightness (cd/m²) | 199 | 200 1% | 230 16% | 200 1% | 203 2% | 222 12% |
| Brightness Distribution (%) | 85 | 83 -2% | 84 -1% | 87 2% | 83 -2% | 85 0% |
| Black Level * (cd/m²) | 0.712 | 0.43 40% | 0.46 35% | 0.26 63% | 0.49 31% | 0.39 45% |
| Contrast (:1) | 281 | 491 75% | 533 90% | 827 194% | 449 60% | 562 100% |
| Colorchecker dE 2000 * | 13.24 | 10.53 20% | 8.34 37% | 13.07 1% | 8.95 32% | 12.67 4% |
| Colorchecker dE 2000 max. * | 21.52 | 17.79 17% | 12.31 43% | 16.06 25% | 15.89 26% | 20.99 2% |
| Greyscale dE 2000 * | 13.33 | 11.85 11% | 9.48 29% | 4.34 67% | 10.59 21% | 13.82 -4% |
| Gamma | 1.69 130% | 2.25 98% | 2.38 92% | 2.48 89% | 2.51 88% | 2.63 84% |
| CCT | 15879 41% | 13758 47% | 10624 61% | 7212 90% | 12049 54% | 15633 42% |
| Color Space (Percent of AdobeRGB 1998) (%) | 33.8 | 39 15% | 38 12% | 38 12% | 41 21% | 35 4% |
| Color Space (Percent of sRGB) (%) | 53.4 | 61 14% | 57 7% | 60 12% | 65 22% | 55 3% |
| Media total (Programa/Opciones) | 6% /
14% | 25% /
26% | 31% /
34% | 18% /
21% | 12% /
14% |
* ... más pequeño es mejor
Tiempos de respuesta del display
| ↔ Tiempo de respuesta de Negro a Blanco | ||
|---|---|---|
| 28.8 ms ... subida ↗ y bajada ↘ combinada | ↗ 10.8 ms subida | 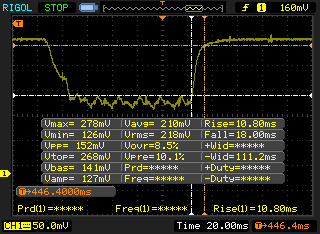 |
| ↘ 18 ms bajada | ||
| La pantalla mostró tiempos de respuesta relativamente lentos en nuestros tests pero podría ser demasiado lenta para los jugones. En comparación, todos los dispositivos de prueba van de ##min### (mínimo) a 240 (máximo) ms. » 76 % de todos los dispositivos son mejores. Eso quiere decir que el tiempo de respuesta es peor que la media (19.8 ms) de todos los dispositivos testados. | ||
| ↔ Tiempo de respuesta 50% Gris a 80% Gris | ||
| 42.4 ms ... subida ↗ y bajada ↘ combinada | ↗ 14.8 ms subida | 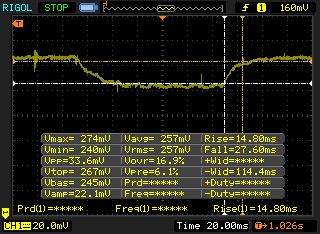 |
| ↘ 27.6 ms bajada | ||
| La pantalla mostró tiempos de respuesta lentos en nuestros tests y podría ser demasiado lenta para los jugones. En comparación, todos los dispositivos de prueba van de ##min### (mínimo) a 636 (máximo) ms. » 70 % de todos los dispositivos son mejores. Eso quiere decir que el tiempo de respuesta es peor que la media (31 ms) de todos los dispositivos testados. | ||
Parpadeo de Pantalla / PWM (Pulse-Width Modulation)
| Parpadeo de Pantalla / PWM no detectado |  | ||
Comparación: 52 % de todos los dispositivos testados no usaron PWM para atenuar el display. Si se usó, medimos una media de 7754 (mínimo: 5 - máxmo: 343500) Hz. | |||
| Cinebench R11.5 | |
| CPU Single 64Bit | |
| HP 250 G4 T6P08ES | |
| Acer Aspire V3-572PG-604M | |
| Microsoft Surface Pro 4, Core m3 | |
| HP 250 G5 Y1V08UT | |
| CPU Multi 64Bit | |
| HP 250 G4 T6P08ES | |
| Acer Aspire V3-572PG-604M | |
| Microsoft Surface Pro 4, Core m3 | |
| HP 250 G5 Y1V08UT | |
| wPrime 2.10 - 1024m | |
| HP 250 G5 Y1V08UT | |
| Microsoft Surface Pro 4, Core m3 | |
| Super Pi Mod 1.5 XS 32M - 32M | |
| HP 250 G5 Y1V08UT | |
| Microsoft Surface Pro 4, Core m3 | |
* ... más pequeño es mejor
| PCMark 8 Home Score Accelerated v2 | 1661 puntos | |
| PCMark 8 Creative Score Accelerated v2 | 1779 puntos | |
| PCMark 8 Work Score Accelerated v2 | 1464 puntos | |
ayuda | ||
| HP 250 G5 Y1V08UT Samsung CM871 MZNLF128HCHP | Acer Extensa 2520-59CD Toshiba MQ01ABF050 | Lenovo B50-10 80QR0013GE Seagate Momentus Thin ST500LT012-1DG142 | Asus F540SA-XX087T Seagate Momentus Thin ST500LT012-1DG142 | HP 250 G4 T6P08ES HGST Travelstar 5K1000 HTS541010A9E680 | HP 250 G5 SP X0N33EA SanDisk Z400s SD8SNAT-256G | |
|---|---|---|---|---|---|---|
| CrystalDiskMark 3.0 | -83% | -84% | -85% | -82% | 141% | |
| Read Seq (MB/s) | 484.4 | 104.7 -78% | 103.5 -79% | 98.3 -80% | 101 -79% | 509 5% |
| Write Seq (MB/s) | 139.2 | 95.7 -31% | 91.1 -35% | 89.8 -35% | 99.6 -28% | 322.1 131% |
| Read 512 (MB/s) | 338.1 | 33 -90% | 33.74 -90% | 20.79 -94% | 38.12 -89% | 321.2 -5% |
| Write 512 (MB/s) | 134.7 | 38.3 -72% | 38.77 -71% | 34.84 -74% | 42.22 -69% | 289.4 115% |
| Read 4k (MB/s) | 17.21 | 0.375 -98% | 0.374 -98% | 0.335 -98% | 0.522 -97% | 20.99 22% |
| Write 4k (MB/s) | 31.52 | 0.782 -98% | 0.649 -98% | 0.619 -98% | 1.29 -96% | 88 179% |
| Read 4k QD32 (MB/s) | 94.6 | 0.675 -99% | 0.818 -99% | 0.789 -99% | 1.116 -99% | 141.3 49% |
| Write 4k QD32 (MB/s) | 31.08 | 0.769 -98% | 0.648 -98% | 0.641 -98% | 1.287 -96% | 228.5 635% |

| 3DMark | |
| 1280x720 Cloud Gate Standard Graphics | |
| Acer Aspire V3-572PG-604M | |
| HP 250 G5 SP X0N33EA | |
| HP 250 G4 T6P08ES | |
| Asus F540SA-XX087T | |
| HP 250 G5 Y1V08UT | |
| Lenovo B50-10 80QR0013GE | |
| Acer One 10 S1002-17HU | |
| 1920x1080 Ice Storm Extreme Graphics | |
| HP 250 G5 Y1V08UT | |
| 1920x1080 Ice Storm Extreme Score | |
| HP 250 G5 Y1V08UT | |
| 1280x720 Cloud Gate Standard Score | |
| Acer Aspire V3-572PG-604M | |
| HP 250 G5 SP X0N33EA | |
| HP 250 G4 T6P08ES | |
| Asus F540SA-XX087T | |
| Lenovo B50-10 80QR0013GE | |
| HP 250 G5 Y1V08UT | |
| Acer One 10 S1002-17HU | |
| 1280x720 Cloud Gate Standard Physics | |
| HP 250 G5 SP X0N33EA | |
| HP 250 G4 T6P08ES | |
| Acer Aspire V3-572PG-604M | |
| Lenovo B50-10 80QR0013GE | |
| Acer One 10 S1002-17HU | |
| Asus F540SA-XX087T | |
| HP 250 G5 Y1V08UT | |
| 1920x1080 Ice Storm Extreme Physics | |
| HP 250 G5 Y1V08UT | |
| 3DMark 11 Performance | 422 puntos | |
| 3DMark Ice Storm Standard Score | 18104 puntos | |
| 3DMark Cloud Gate Standard Score | 1350 puntos | |
ayuda | ||
| bajo | medio | alto | ultra | |
|---|---|---|---|---|
| BioShock Infinite (2013) | 18.1 | 9.6 | ||
| Overwatch (2016) | 15.1 | 9.7 |
Ruido
| Ocioso |
| / / dB(A) |
| Carga |
| / dB(A) |
 | ||
30 dB silencioso 40 dB(A) audible 50 dB(A) ruidosamente alto |
||
min: | ||
| HP 250 G5 Y1V08UT HD Graphics 400 (Braswell), N3060, Samsung CM871 MZNLF128HCHP | Acer Extensa 2520-59CD HD Graphics 520, 6200U, Toshiba MQ01ABF050 | Lenovo B50-10 80QR0013GE HD Graphics (Bay Trail), N3540, Seagate Momentus Thin ST500LT012-1DG142 | Asus F540SA-XX087T HD Graphics (Braswell), N3050, Seagate Momentus Thin ST500LT012-1DG142 | HP 250 G4 T6P08ES Radeon R5 M330, 5200U, HGST Travelstar 5K1000 HTS541010A9E680 | HP 250 G5 SP X0N33EA HD Graphics 520, 6200U, SanDisk Z400s SD8SNAT-256G | |
|---|---|---|---|---|---|---|
| Noise | ||||||
| apagado / medio ambiente * (dB) | 31.2 | 31.2 | 31.2 | 31.2 | 31.6 | |
| Idle Minimum * (dB) | 31.5 | 33.5 | 31.7 | 33.2 | 34.5 | |
| Idle Average * (dB) | 31.9 | 33.5 | 31.7 | 33.2 | 34.5 | |
| Idle Maximum * (dB) | 31.9 | 33.5 | 31.7 | 34.6 | 34.5 | |
| Load Average * (dB) | 34.2 | 33.5 | 37.2 | 45 | 39 | |
| Load Maximum * (dB) | 36.8 | 33.5 | 35.3 | 45.2 | 38.3 |
* ... más pequeño es mejor
(+) La temperatura máxima en la parte superior es de 38 °C / 100 F, frente a la media de 34.3 °C / 94 F, que oscila entre 21.2 y 62.5 °C para la clase Office.
(±) El fondo se calienta hasta un máximo de 42.8 °C / 109 F, frente a la media de 36.8 °C / 98 F
(+) En reposo, la temperatura media de la parte superior es de 24.2 °C / 76# F, frente a la media del dispositivo de 29.5 °C / 85 F.
(+) Los reposamanos y el panel táctil alcanzan como máximo la temperatura de la piel (33.4 °C / 92.1 F) y, por tanto, no están calientes.
(-) La temperatura media de la zona del reposamanos de dispositivos similares fue de 27.5 °C / 81.5 F (-5.9 °C / -10.6 F).
HP 250 G5 Y1V08UT análisis de audio
(±) | la sonoridad del altavoz es media pero buena (78.4 dB)
Graves 100 - 315 Hz
(-) | casi sin bajos - de media 19.1% inferior a la mediana
(±) | la linealidad de los graves es media (14.3% delta a frecuencia anterior)
Medios 400 - 2000 Hz
(+) | medios equilibrados - a sólo 2.2% de la mediana
(+) | los medios son lineales (6.8% delta a la frecuencia anterior)
Altos 2 - 16 kHz
(±) | máximos más altos - de media 5.2% más altos que la mediana
(+) | los máximos son lineales (6.9% delta a la frecuencia anterior)
Total 100 - 16.000 Hz
(±) | la linealidad del sonido global es media (21.5% de diferencia con la mediana)
En comparación con la misma clase
» 54% de todos los dispositivos probados de esta clase eran mejores, 8% similares, 37% peores
» El mejor tuvo un delta de 7%, la media fue 21%, el peor fue ###max##%
En comparación con todos los dispositivos probados
» 61% de todos los dispositivos probados eran mejores, 7% similares, 32% peores
» El mejor tuvo un delta de 4%, la media fue 23%, el peor fue ###max##%
Apple MacBook 12 (Early 2016) 1.1 GHz análisis de audio
(+) | los altavoces pueden reproducir a un volumen relativamente alto (#83.6 dB)
Graves 100 - 315 Hz
(±) | lubina reducida - en promedio 11.3% inferior a la mediana
(±) | la linealidad de los graves es media (14.2% delta a frecuencia anterior)
Medios 400 - 2000 Hz
(+) | medios equilibrados - a sólo 2.4% de la mediana
(+) | los medios son lineales (5.5% delta a la frecuencia anterior)
Altos 2 - 16 kHz
(+) | máximos equilibrados - a sólo 2% de la mediana
(+) | los máximos son lineales (4.5% delta a la frecuencia anterior)
Total 100 - 16.000 Hz
(+) | el sonido global es lineal (10.2% de diferencia con la mediana)
En comparación con la misma clase
» 7% de todos los dispositivos probados de esta clase eran mejores, 2% similares, 90% peores
» El mejor tuvo un delta de 5%, la media fue 18%, el peor fue ###max##%
En comparación con todos los dispositivos probados
» 5% de todos los dispositivos probados eran mejores, 1% similares, 94% peores
» El mejor tuvo un delta de 4%, la media fue 23%, el peor fue ###max##%
| Off / Standby | |
| Ocioso | |
| Carga |
|
Clave:
min: | |
| HP 250 G5 Y1V08UT N3060, HD Graphics 400 (Braswell), Samsung CM871 MZNLF128HCHP, TN LED, 1366x768, 15.6" | Acer Extensa 2520-59CD 6200U, HD Graphics 520, Toshiba MQ01ABF050, TN LED, 1366x768, 15.6" | Lenovo B50-10 80QR0013GE N3540, HD Graphics (Bay Trail), Seagate Momentus Thin ST500LT012-1DG142, TN LED, 1366x768, 15.6" | Asus F540SA-XX087T N3050, HD Graphics (Braswell), Seagate Momentus Thin ST500LT012-1DG142, TN LED, 1366x768, 15.6" | HP 250 G4 T6P08ES 5200U, Radeon R5 M330, HGST Travelstar 5K1000 HTS541010A9E680, TN LED, 1366x768, 15.6" | HP 250 G5 SP X0N33EA 6200U, HD Graphics 520, SanDisk Z400s SD8SNAT-256G, TN, 1920x1080, 15.6" | |
|---|---|---|---|---|---|---|
| Power Consumption | -102% | -28% | -29% | -91% | -44% | |
| Idle Minimum * (Watt) | 3.9 | 5.8 -49% | 4.8 -23% | 3.8 3% | 4 -3% | 3.6 8% |
| Idle Average * (Watt) | 6.4 | 12.6 -97% | 7.5 -17% | 6.9 -8% | 6.5 -2% | 6 6% |
| Idle Maximum * (Watt) | 6.5 | 12.8 -97% | 9.2 -42% | 7.14 -10% | 7 -8% | 6.4 2% |
| Load Average * (Watt) | 11.1 | 27.6 -149% | 16 -44% | 20 -80% | 36 -224% | 26 -134% |
| Load Maximum * (Watt) | 13.8 | 30 -117% | 15.4 -12% | 20.7 -50% | 43.6 -216% | 28.1 -104% |
* ... más pequeño es mejor
| HP 250 G5 Y1V08UT N3060, HD Graphics 400 (Braswell), 41 Wh | Acer Extensa 2520-59CD 6200U, HD Graphics 520, 37 Wh | Lenovo B50-10 80QR0013GE N3540, HD Graphics (Bay Trail), 24 Wh | Asus F540SA-XX087T N3050, HD Graphics (Braswell), 33 Wh | HP 250 G4 T6P08ES 5200U, Radeon R5 M330, 41 Wh | HP 250 G5 SP X0N33EA 6200U, HD Graphics 520, 41 Wh | |
|---|---|---|---|---|---|---|
| Duración de Batería | -16% | -44% | -13% | -22% | -24% | |
| Reader / Idle (h) | 11.9 | 11.1 -7% | 10.6 -11% | |||
| WiFi v1.3 (h) | 6.3 | 5.3 -16% | 3.5 -44% | 5.5 -13% | 5.7 -10% | 5.8 -8% |
| Load (h) | 3.8 | 1.9 -50% | 1.8 -53% |
Pro
Contra
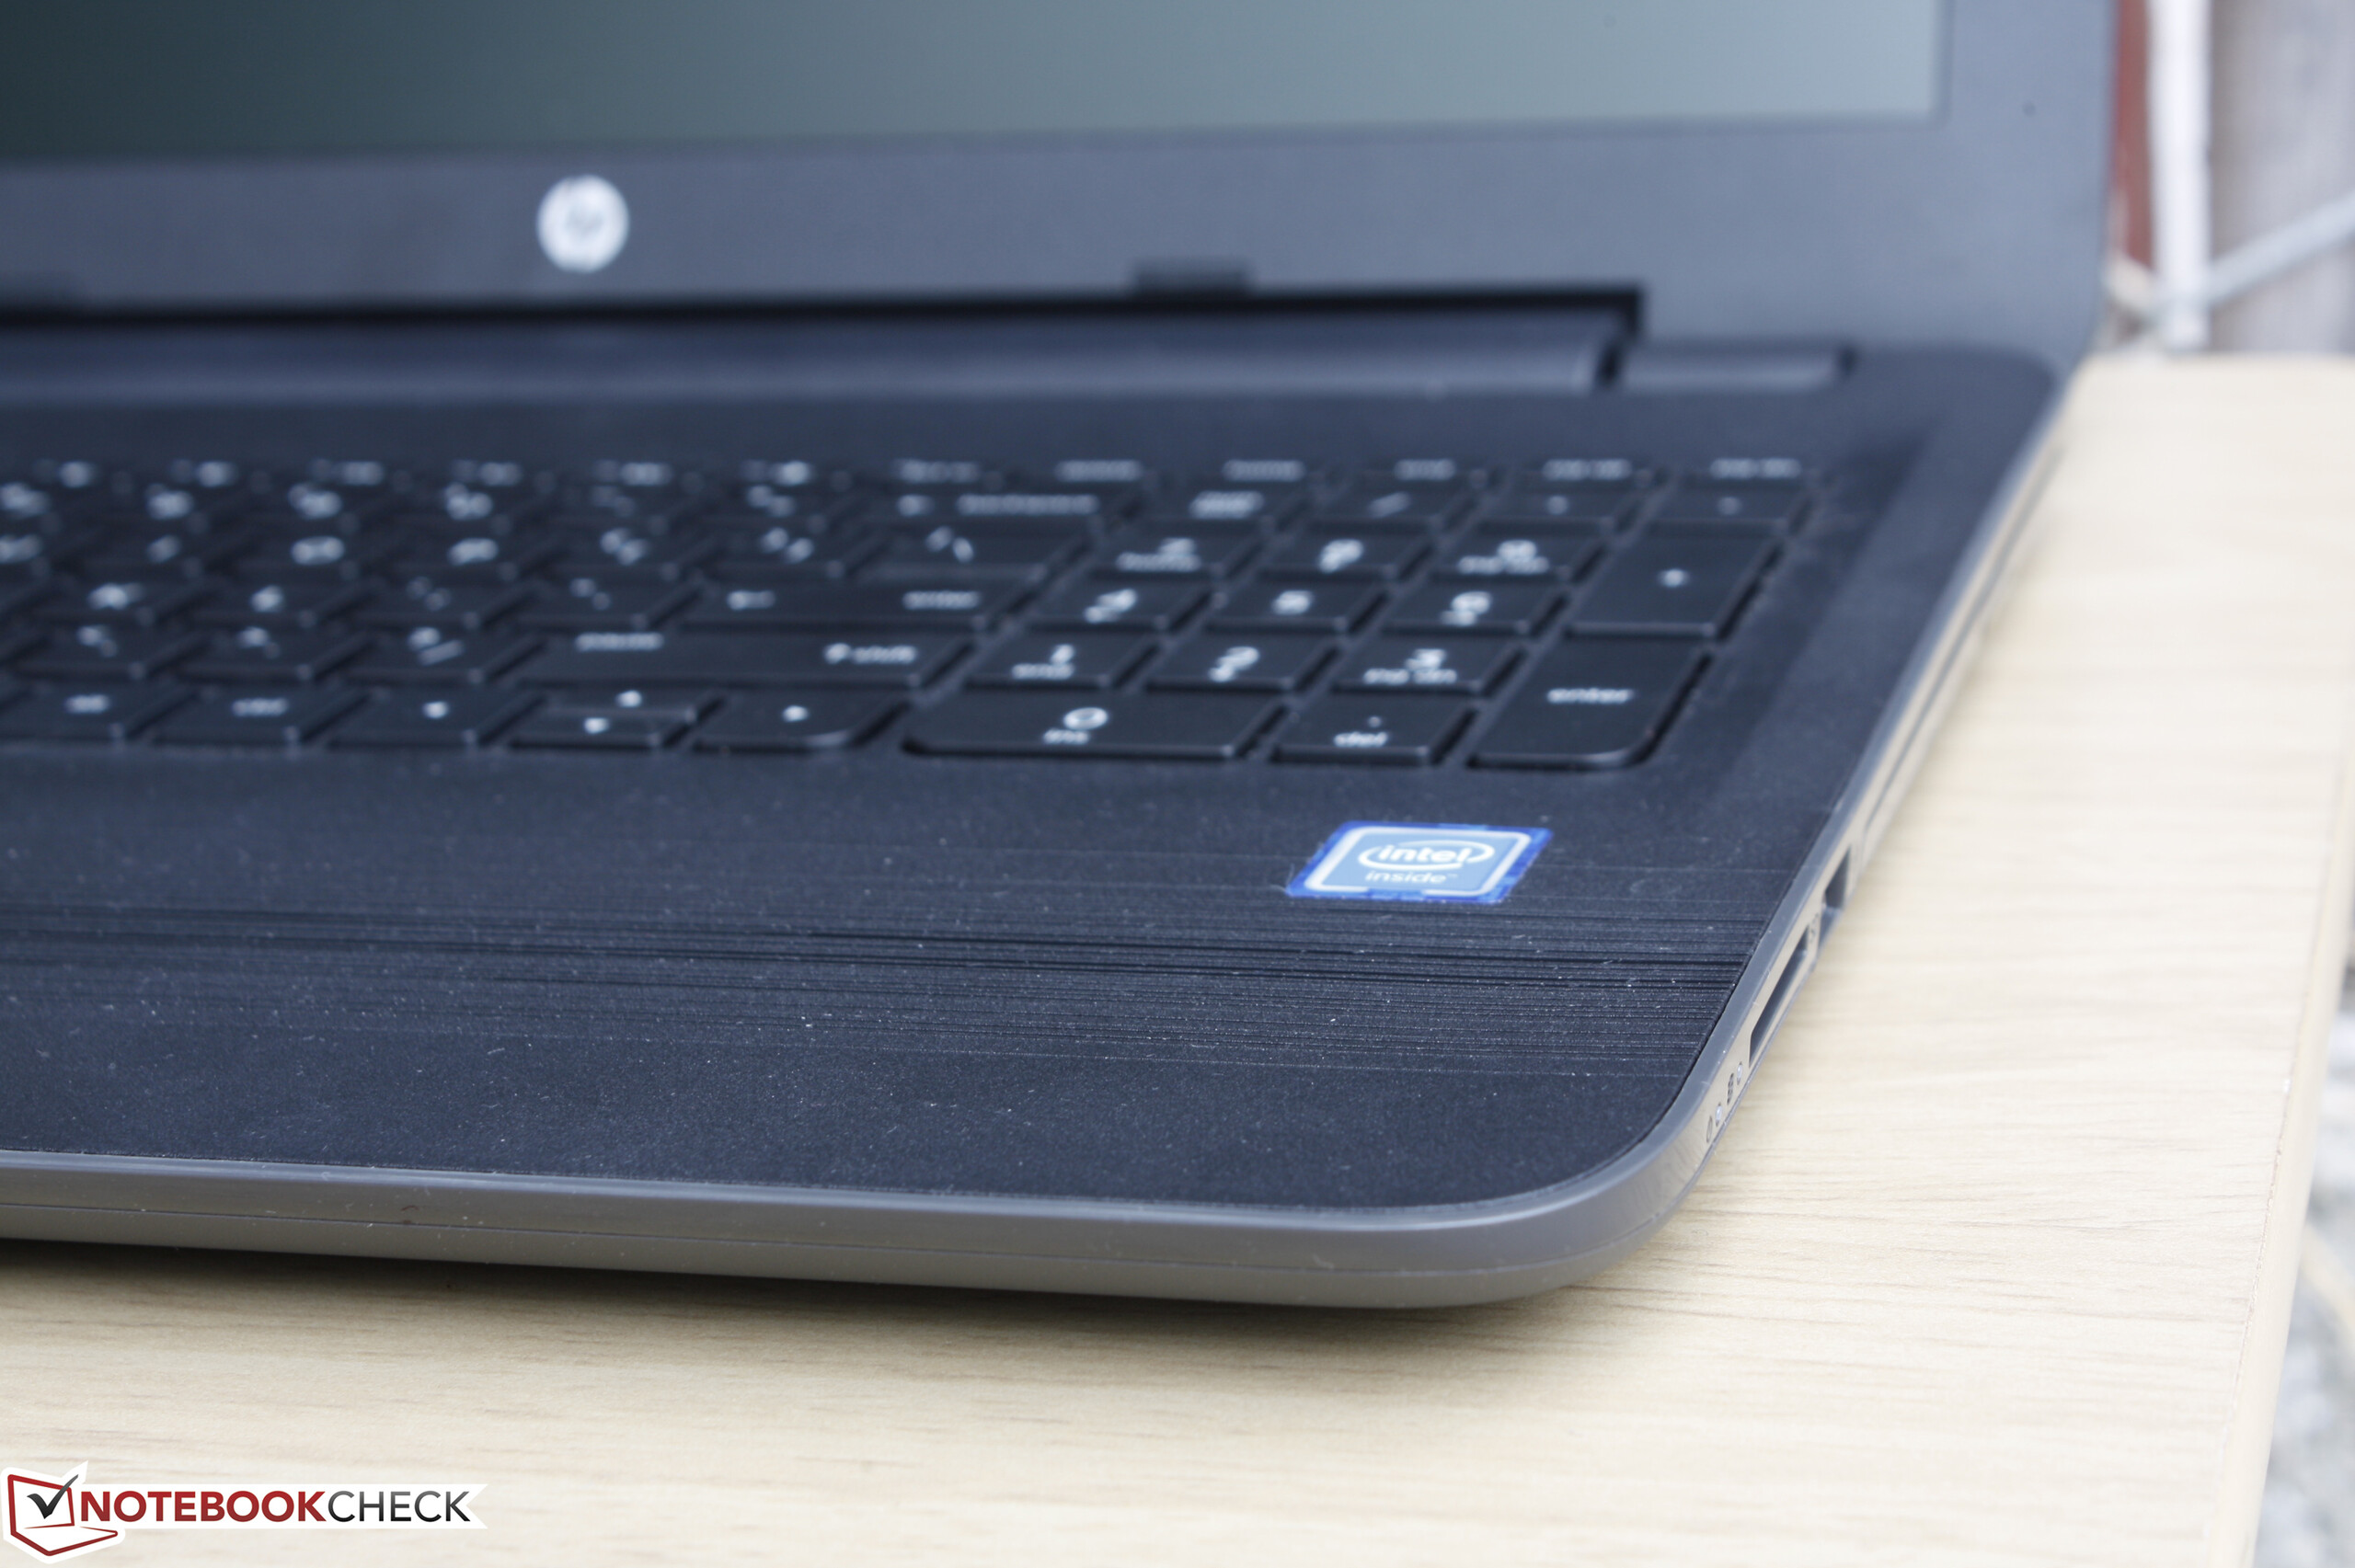
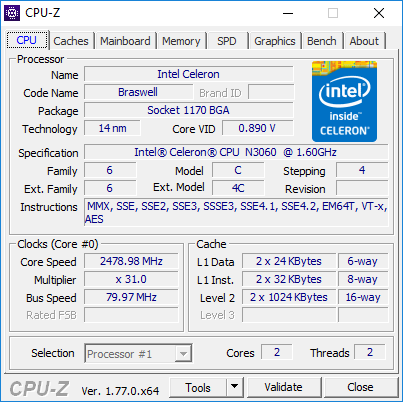
Los portátiles mainstream más antiguos suelen emparejar procesadores capaces con HDDs lentos que suelen ser el cuello de botella del rendimiento de sistema. Nuestra configuración del Celeron N3060 HP es lo mismo pero al revés ya que empareja un procesador muy débil con un veloz SSD. El resultado final es el mismo: Rendimiento lento sólo apto para procesado de textos, navegación, reproducción de vídeos, y otras actividades de poca potencia.
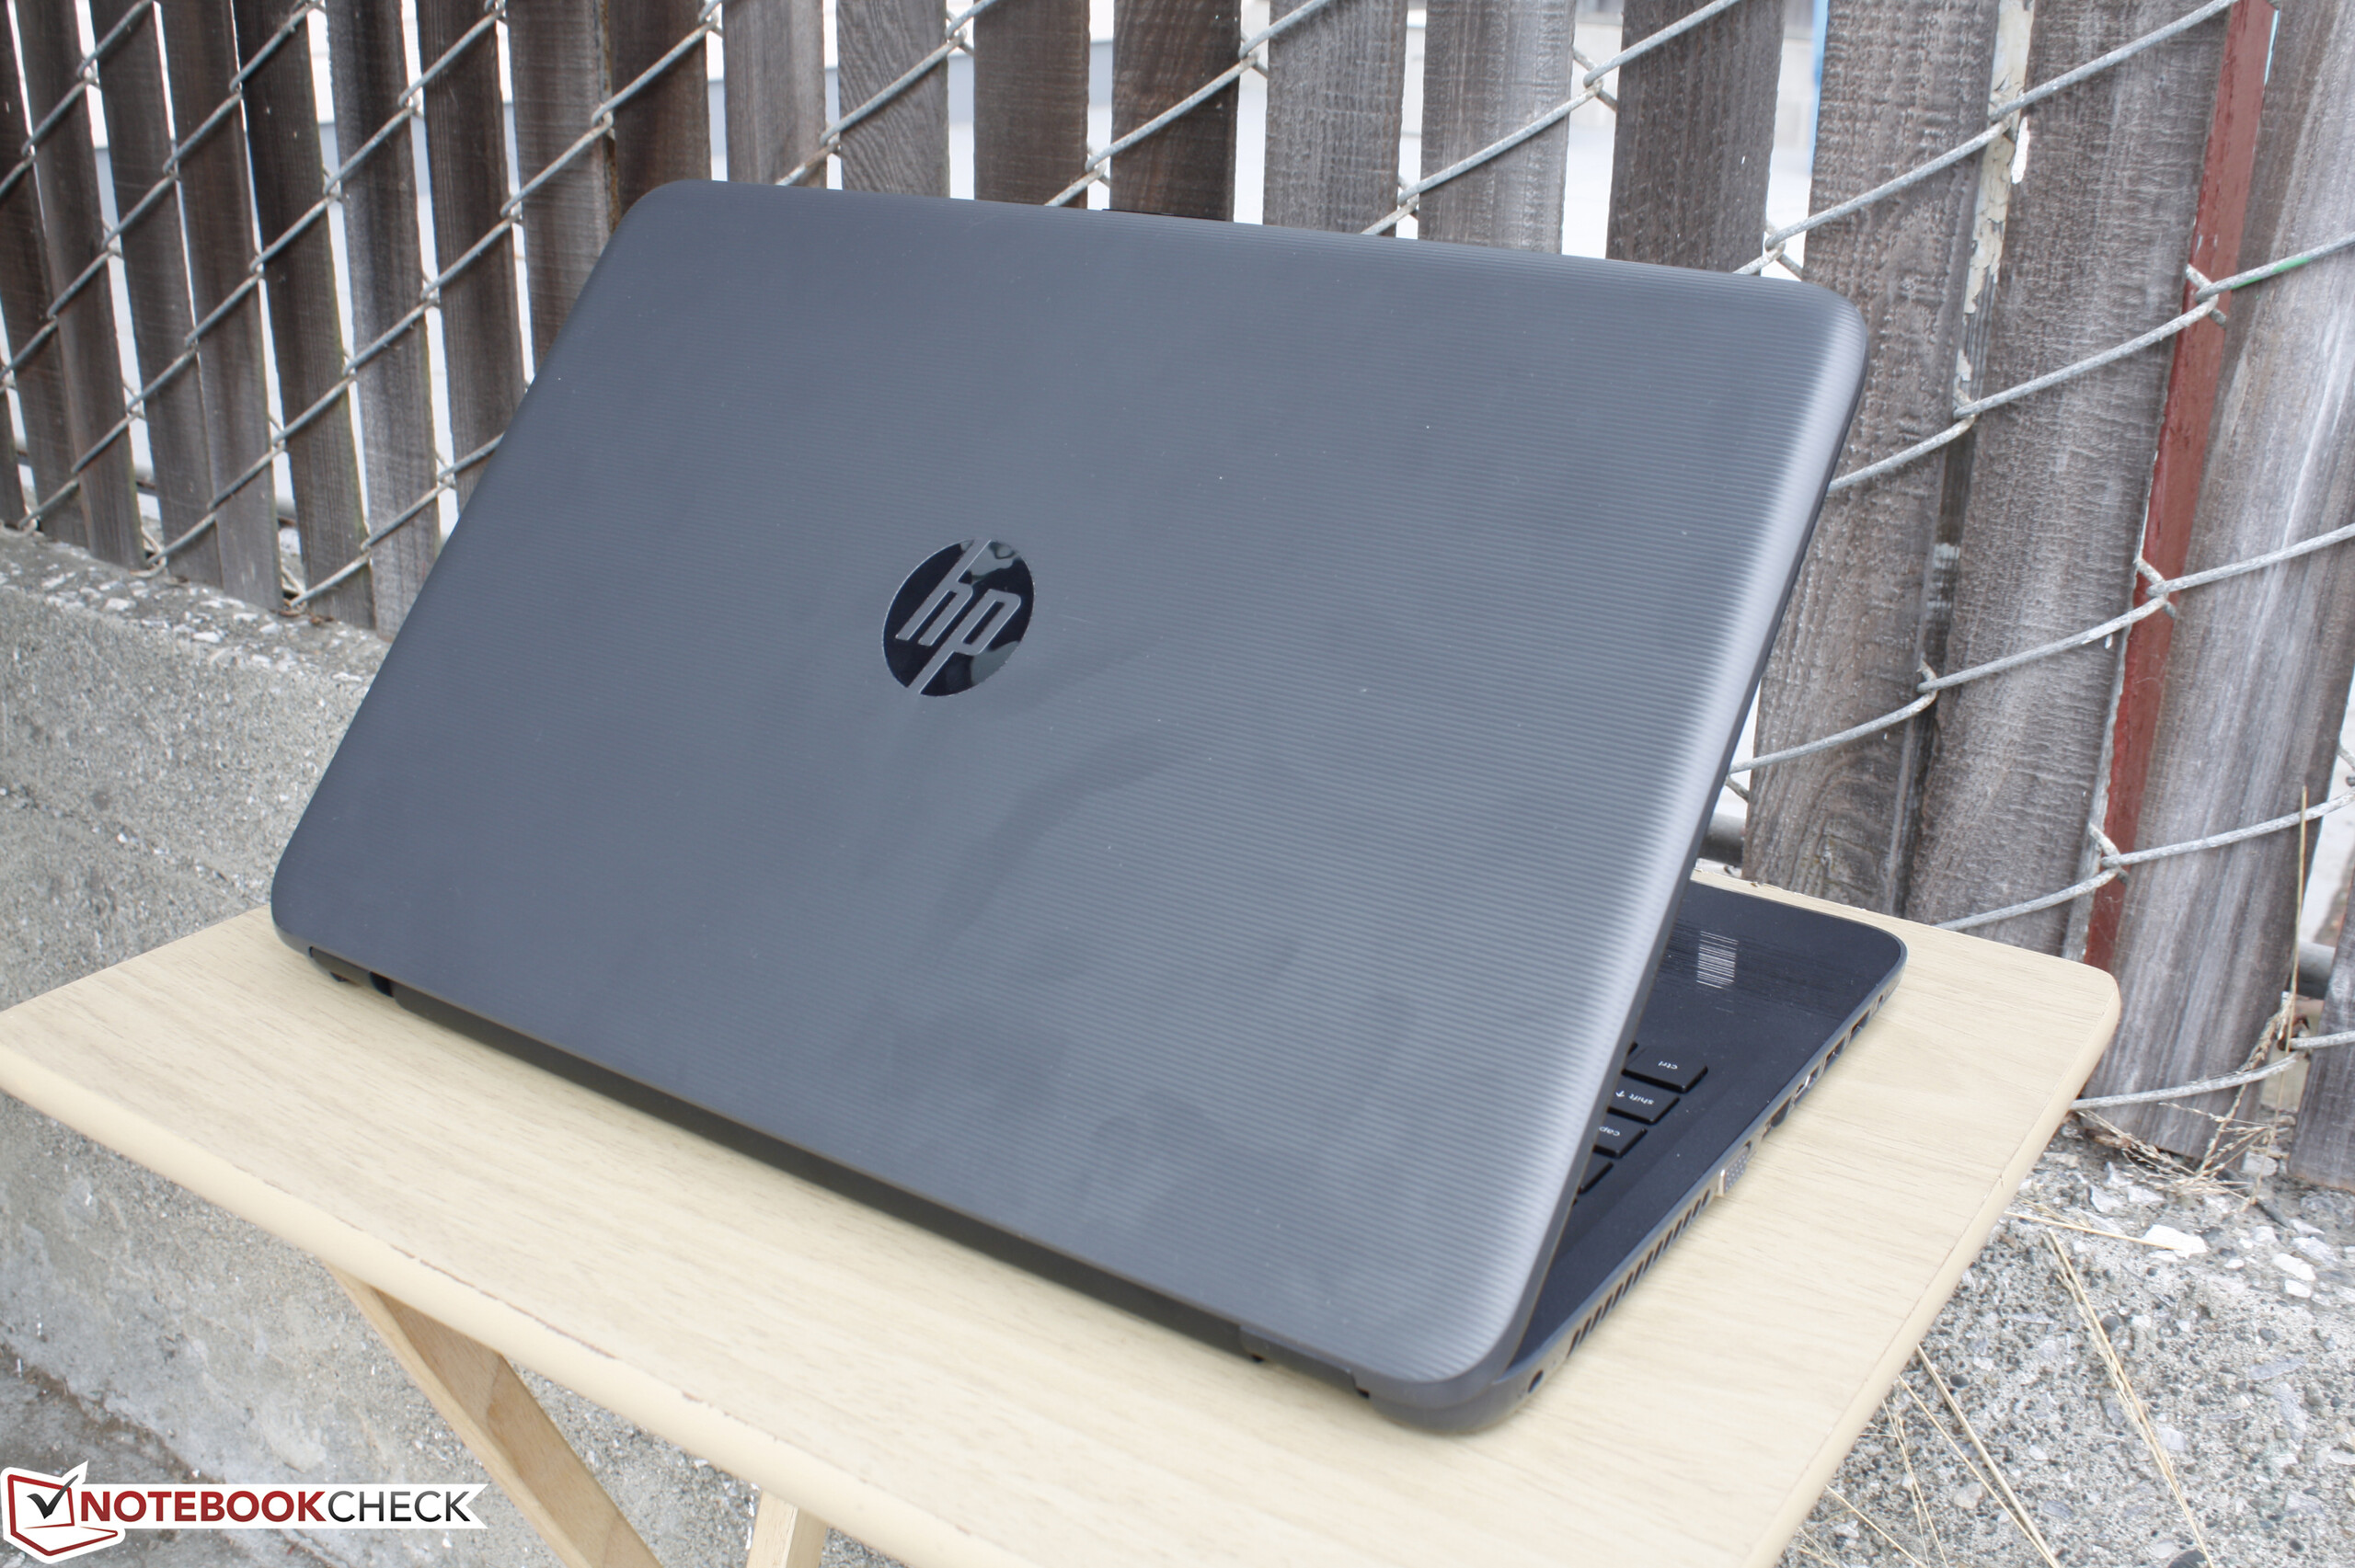
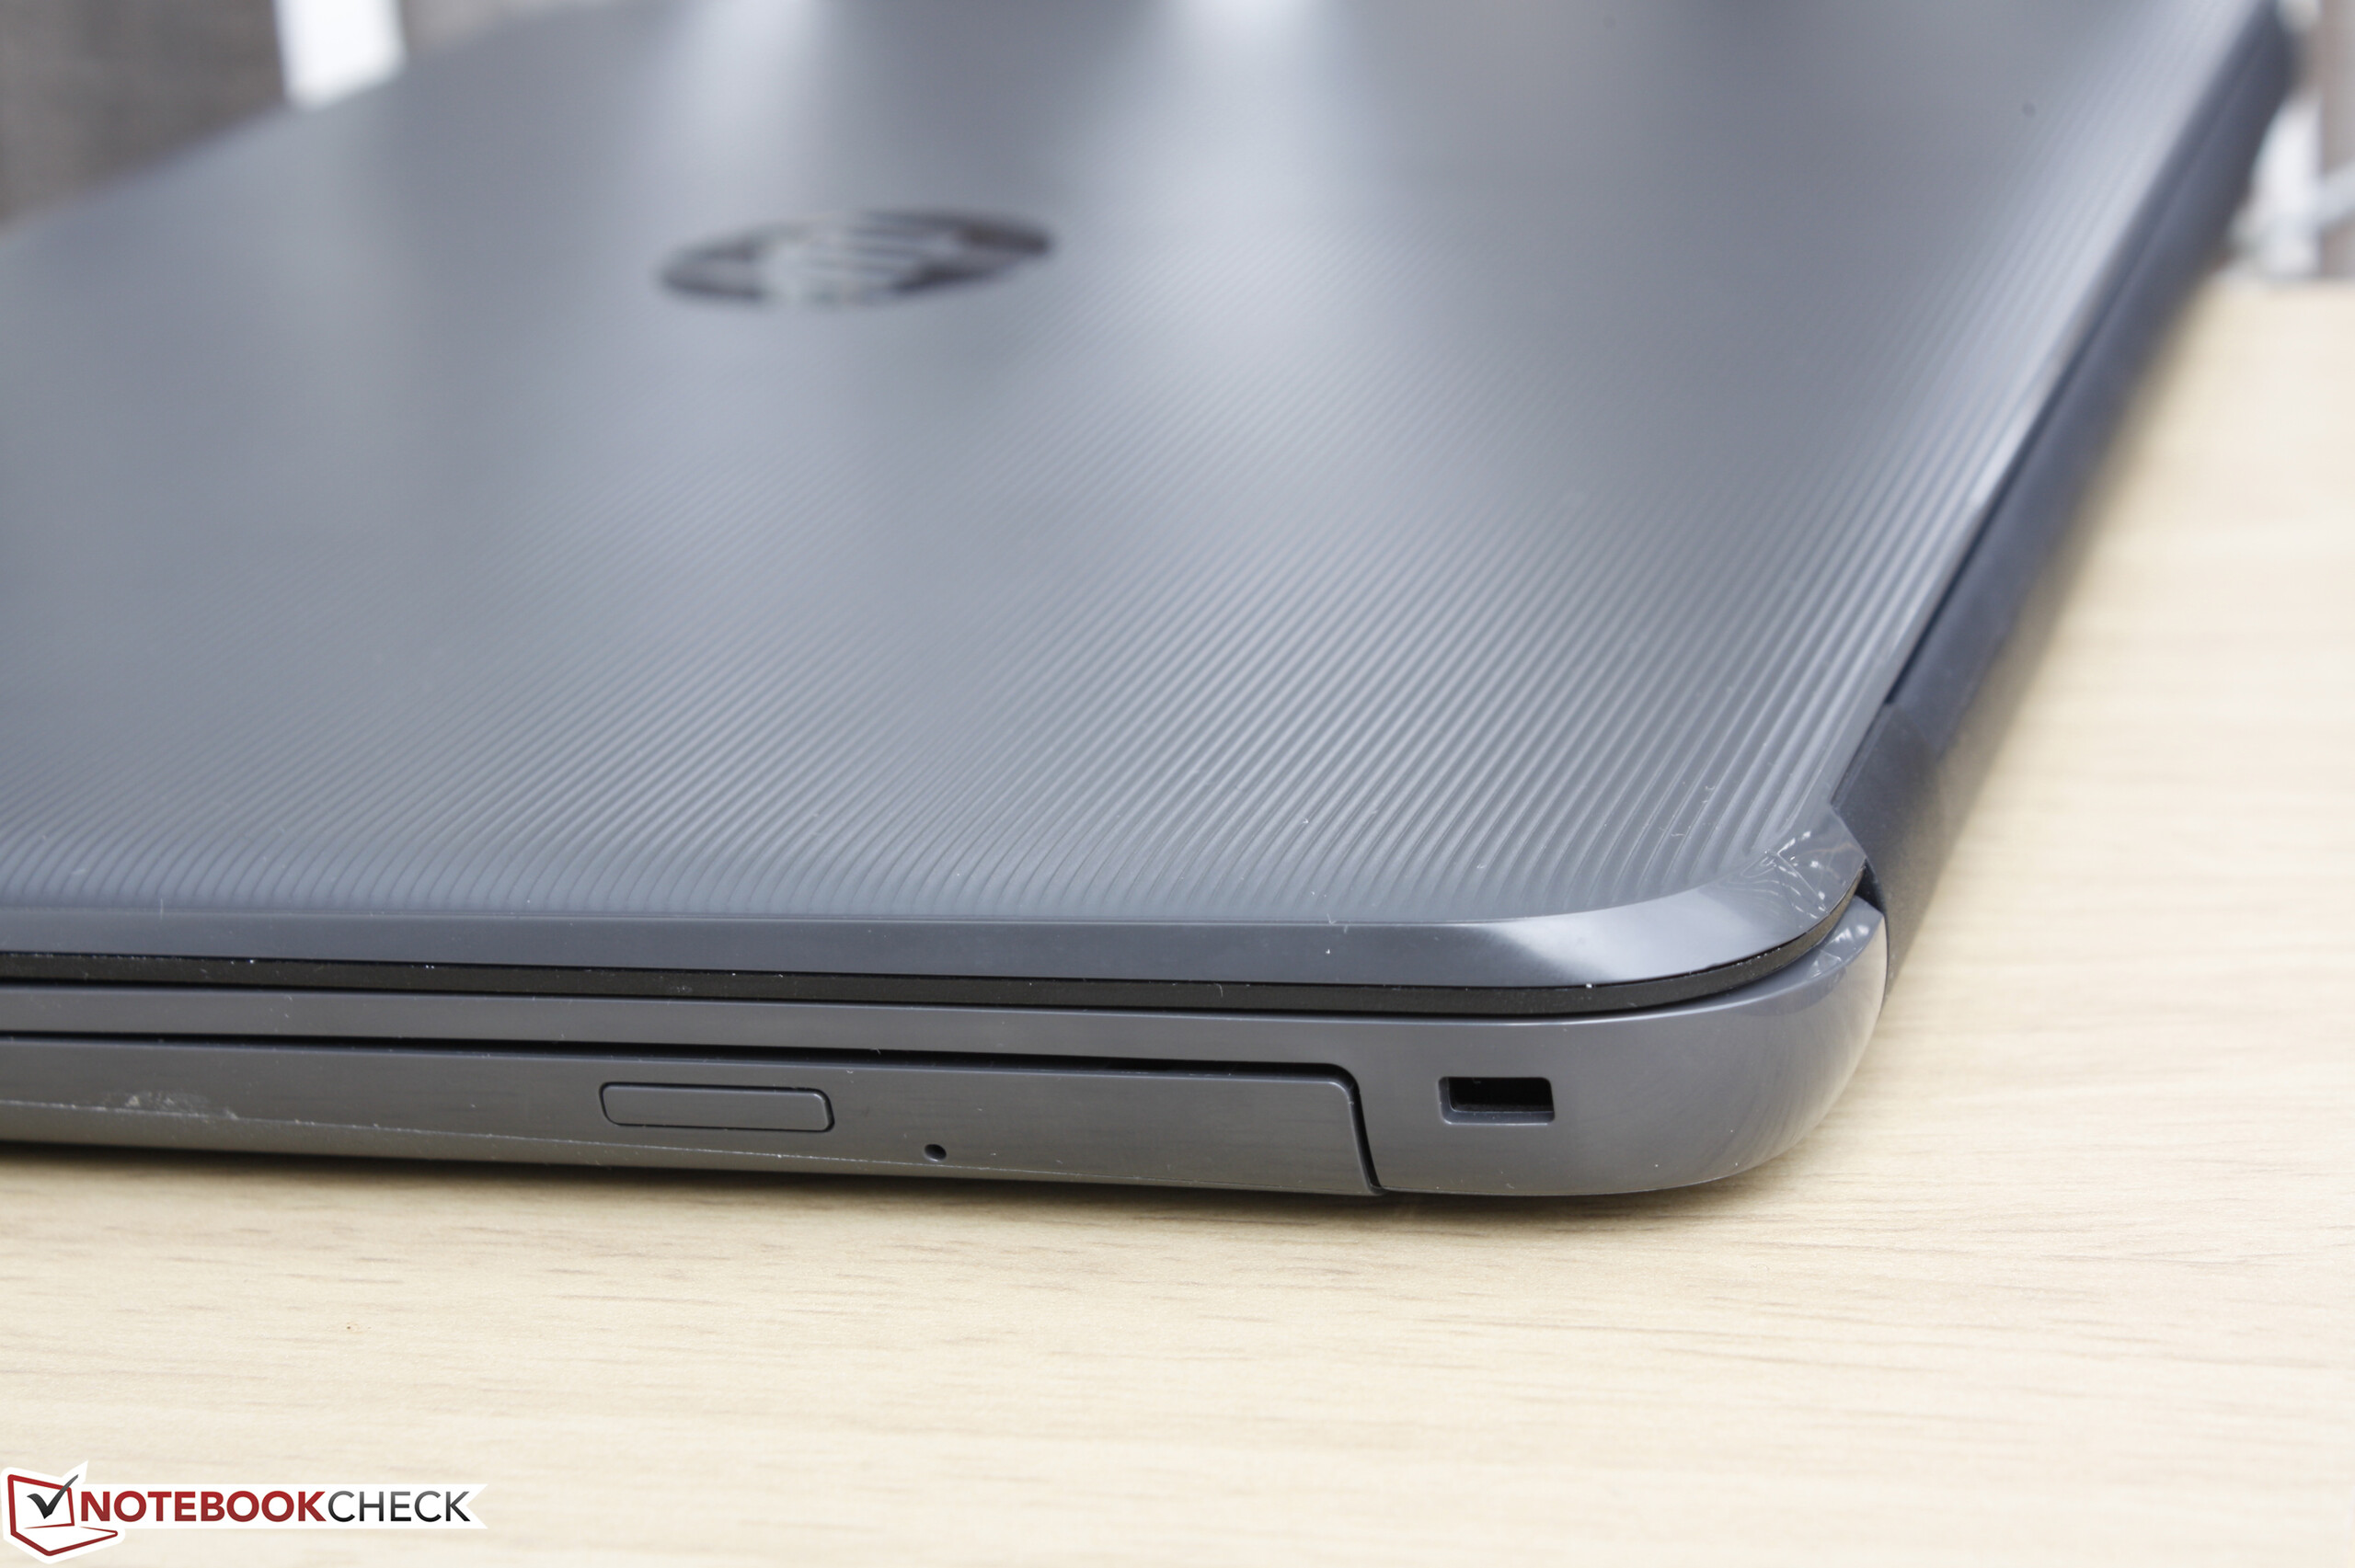
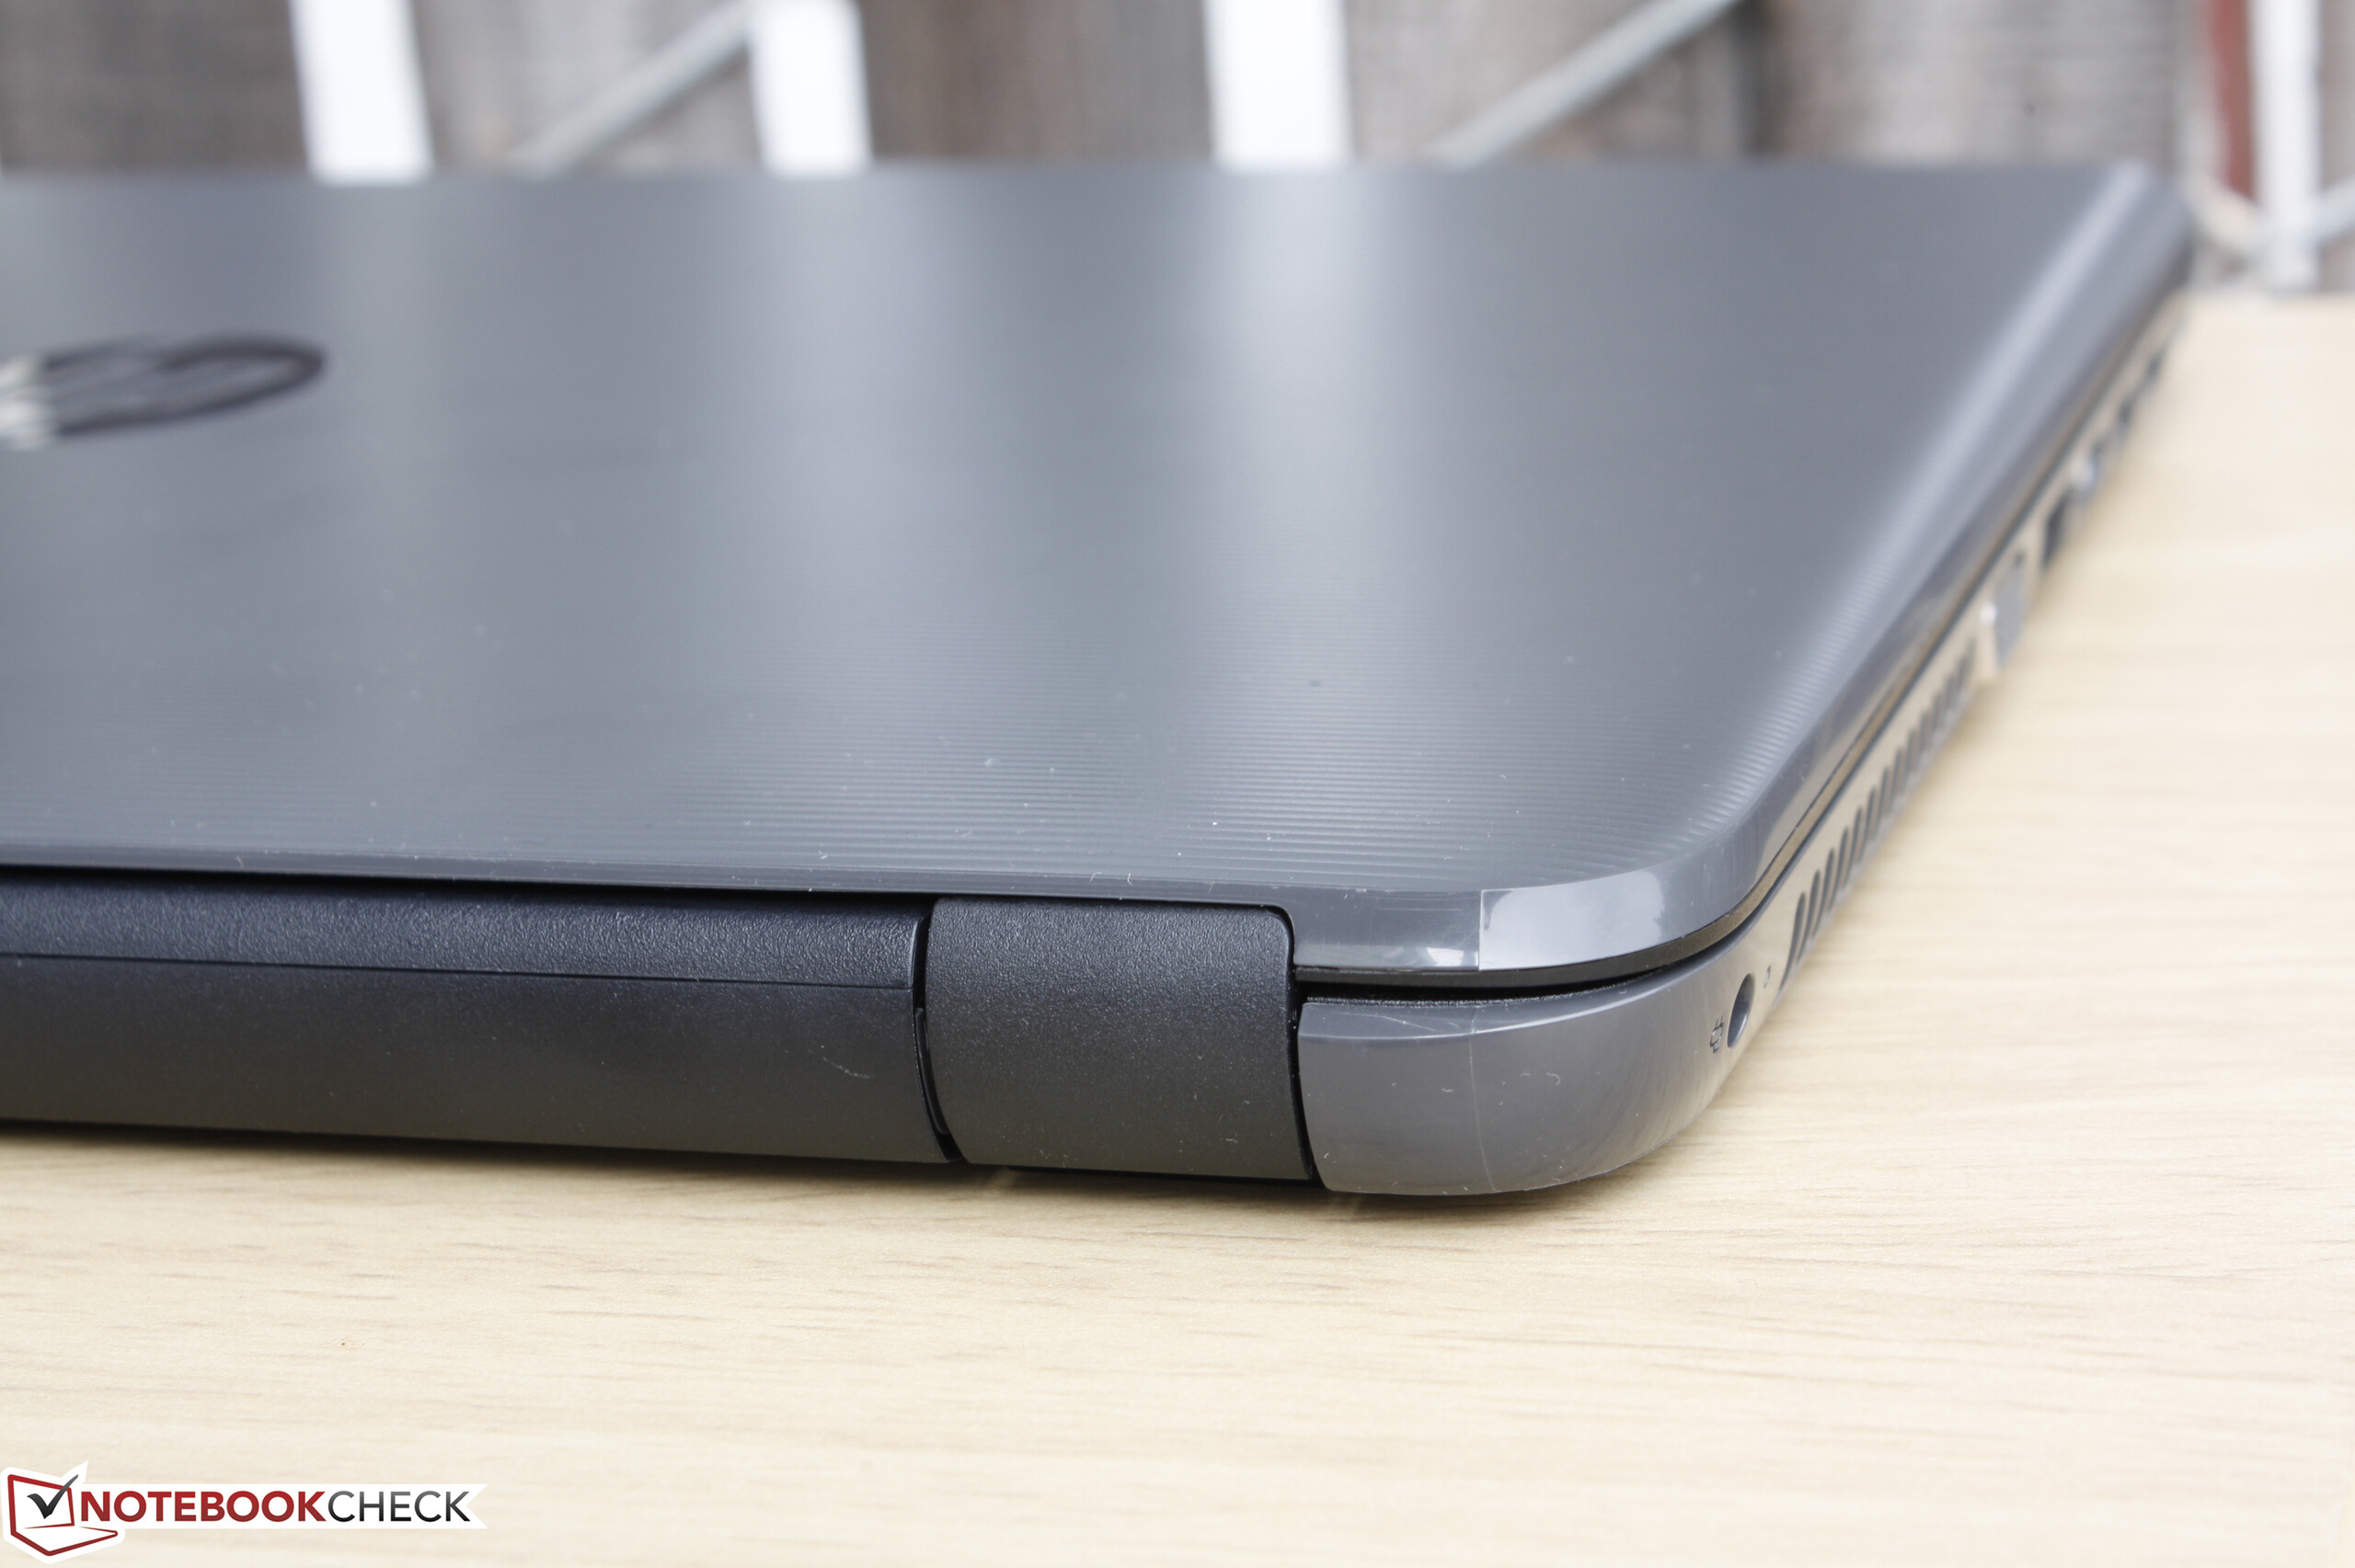
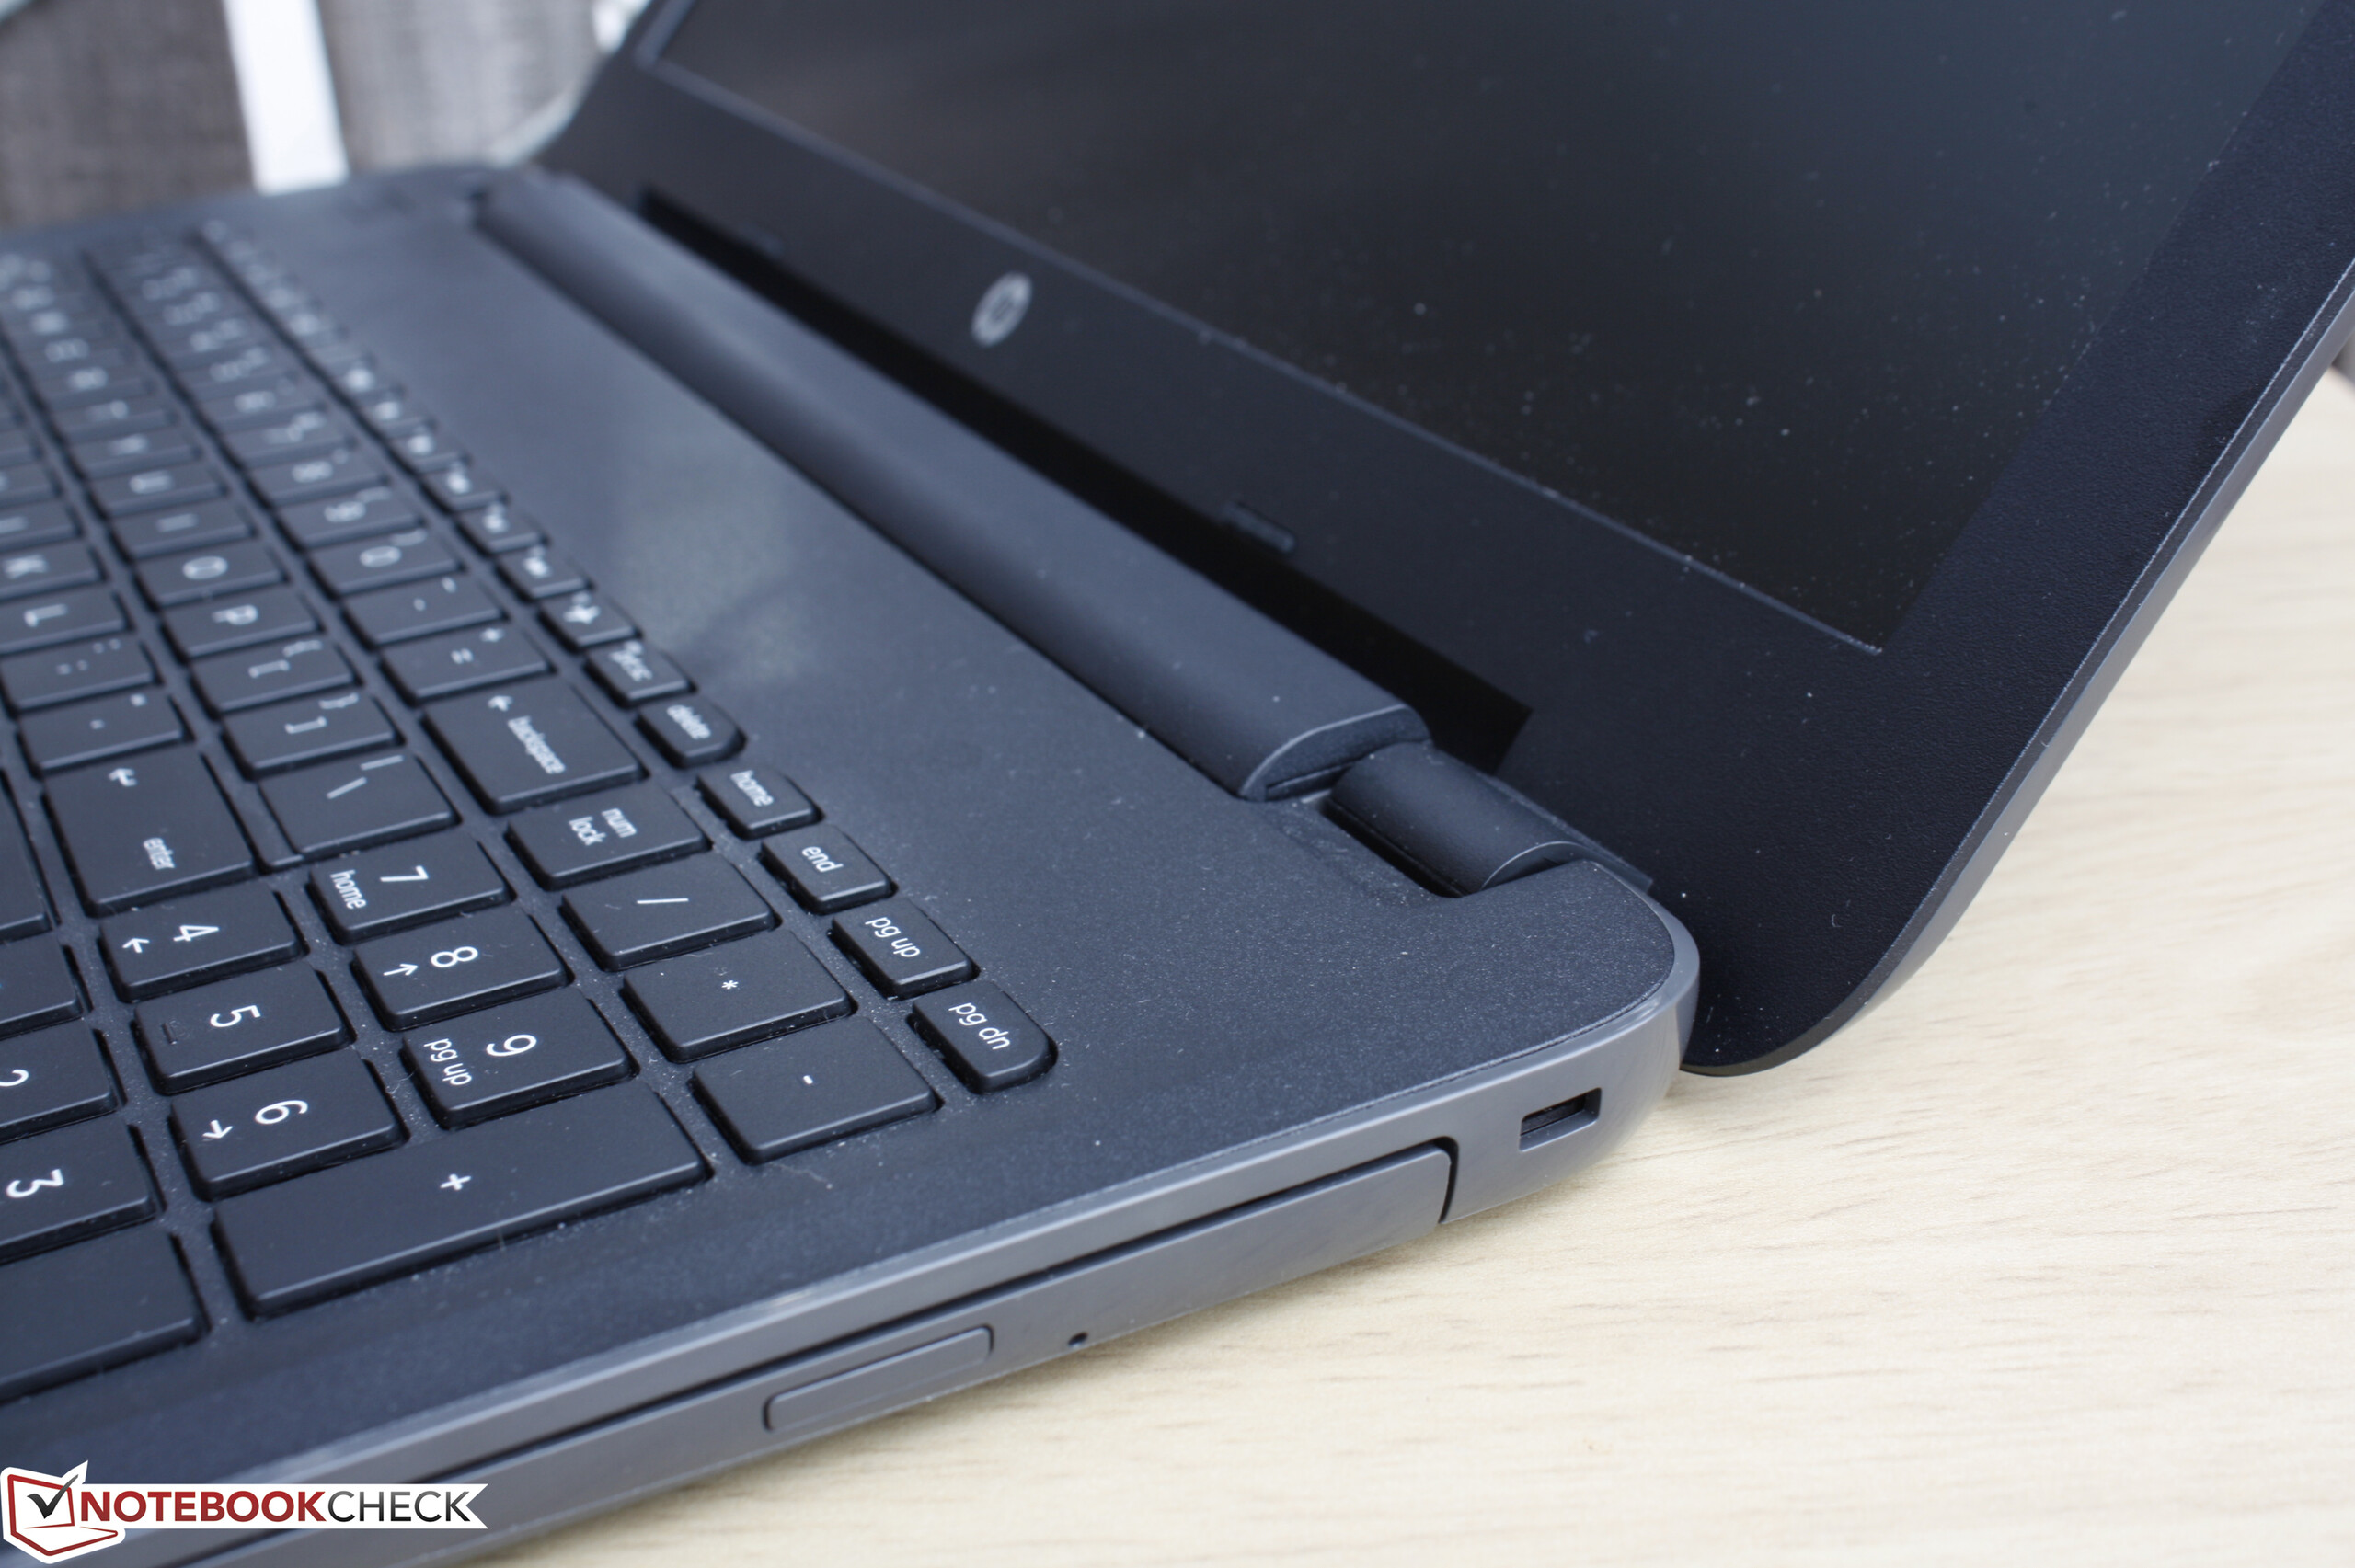
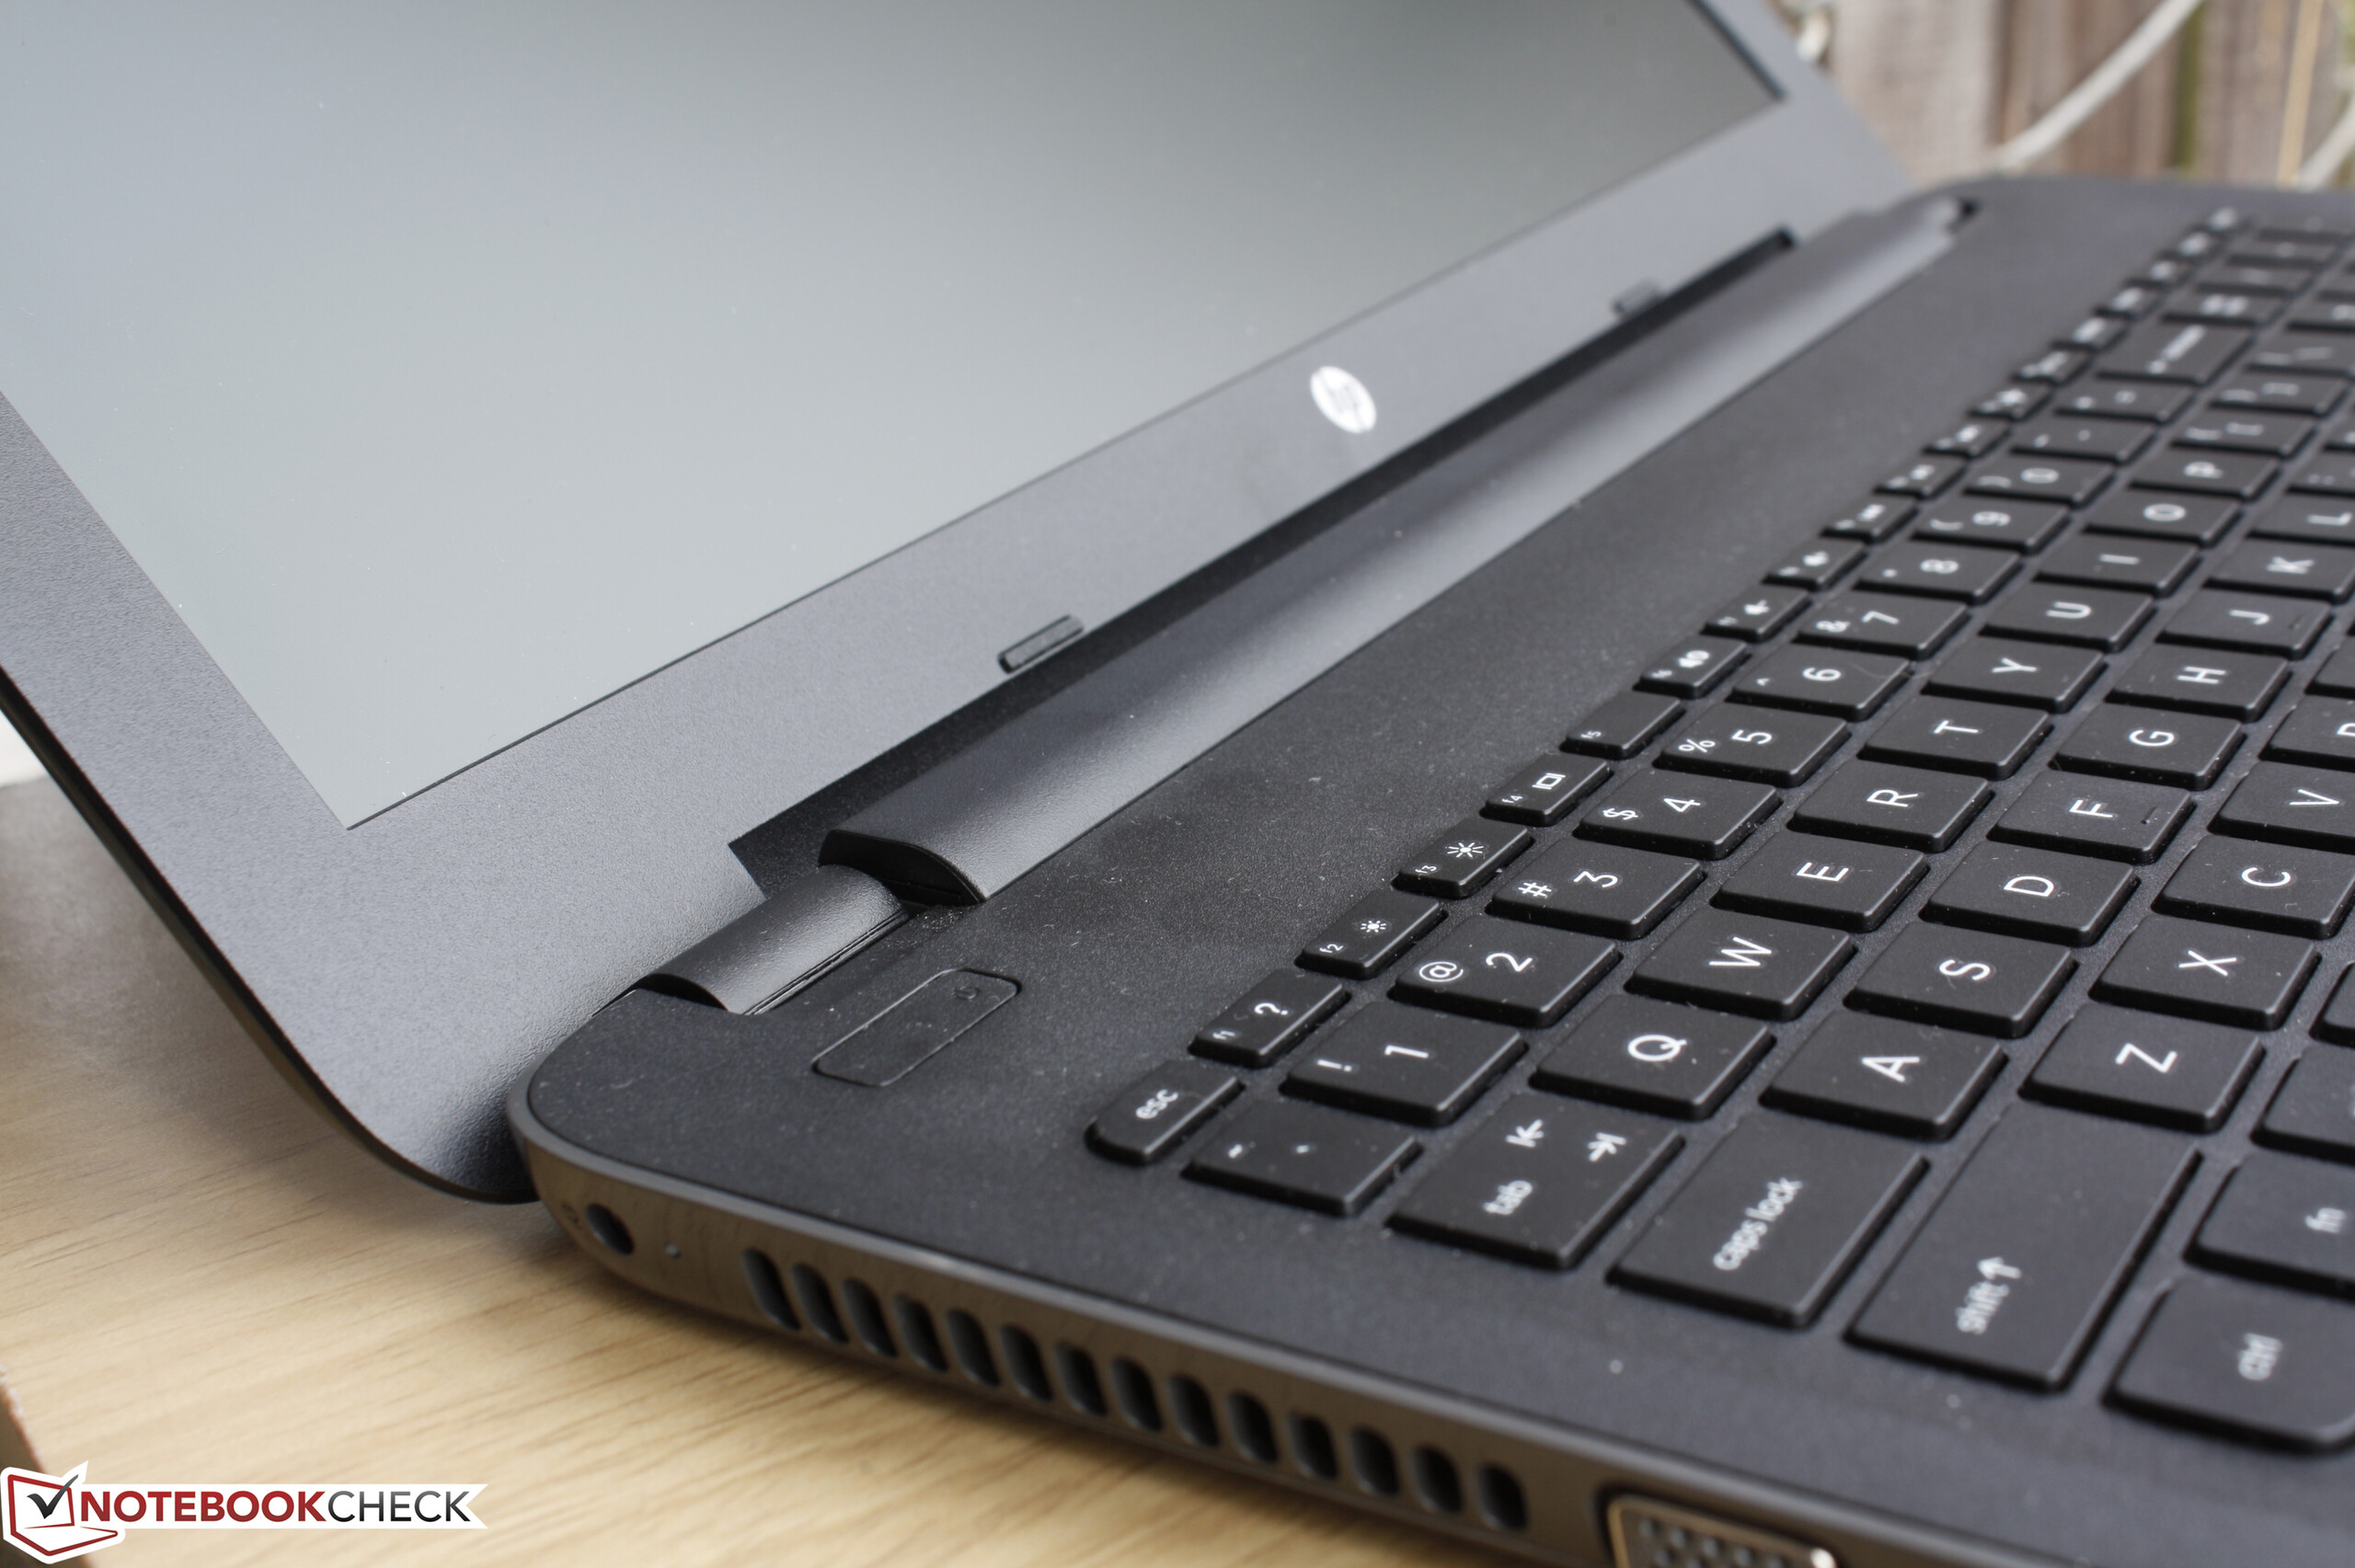
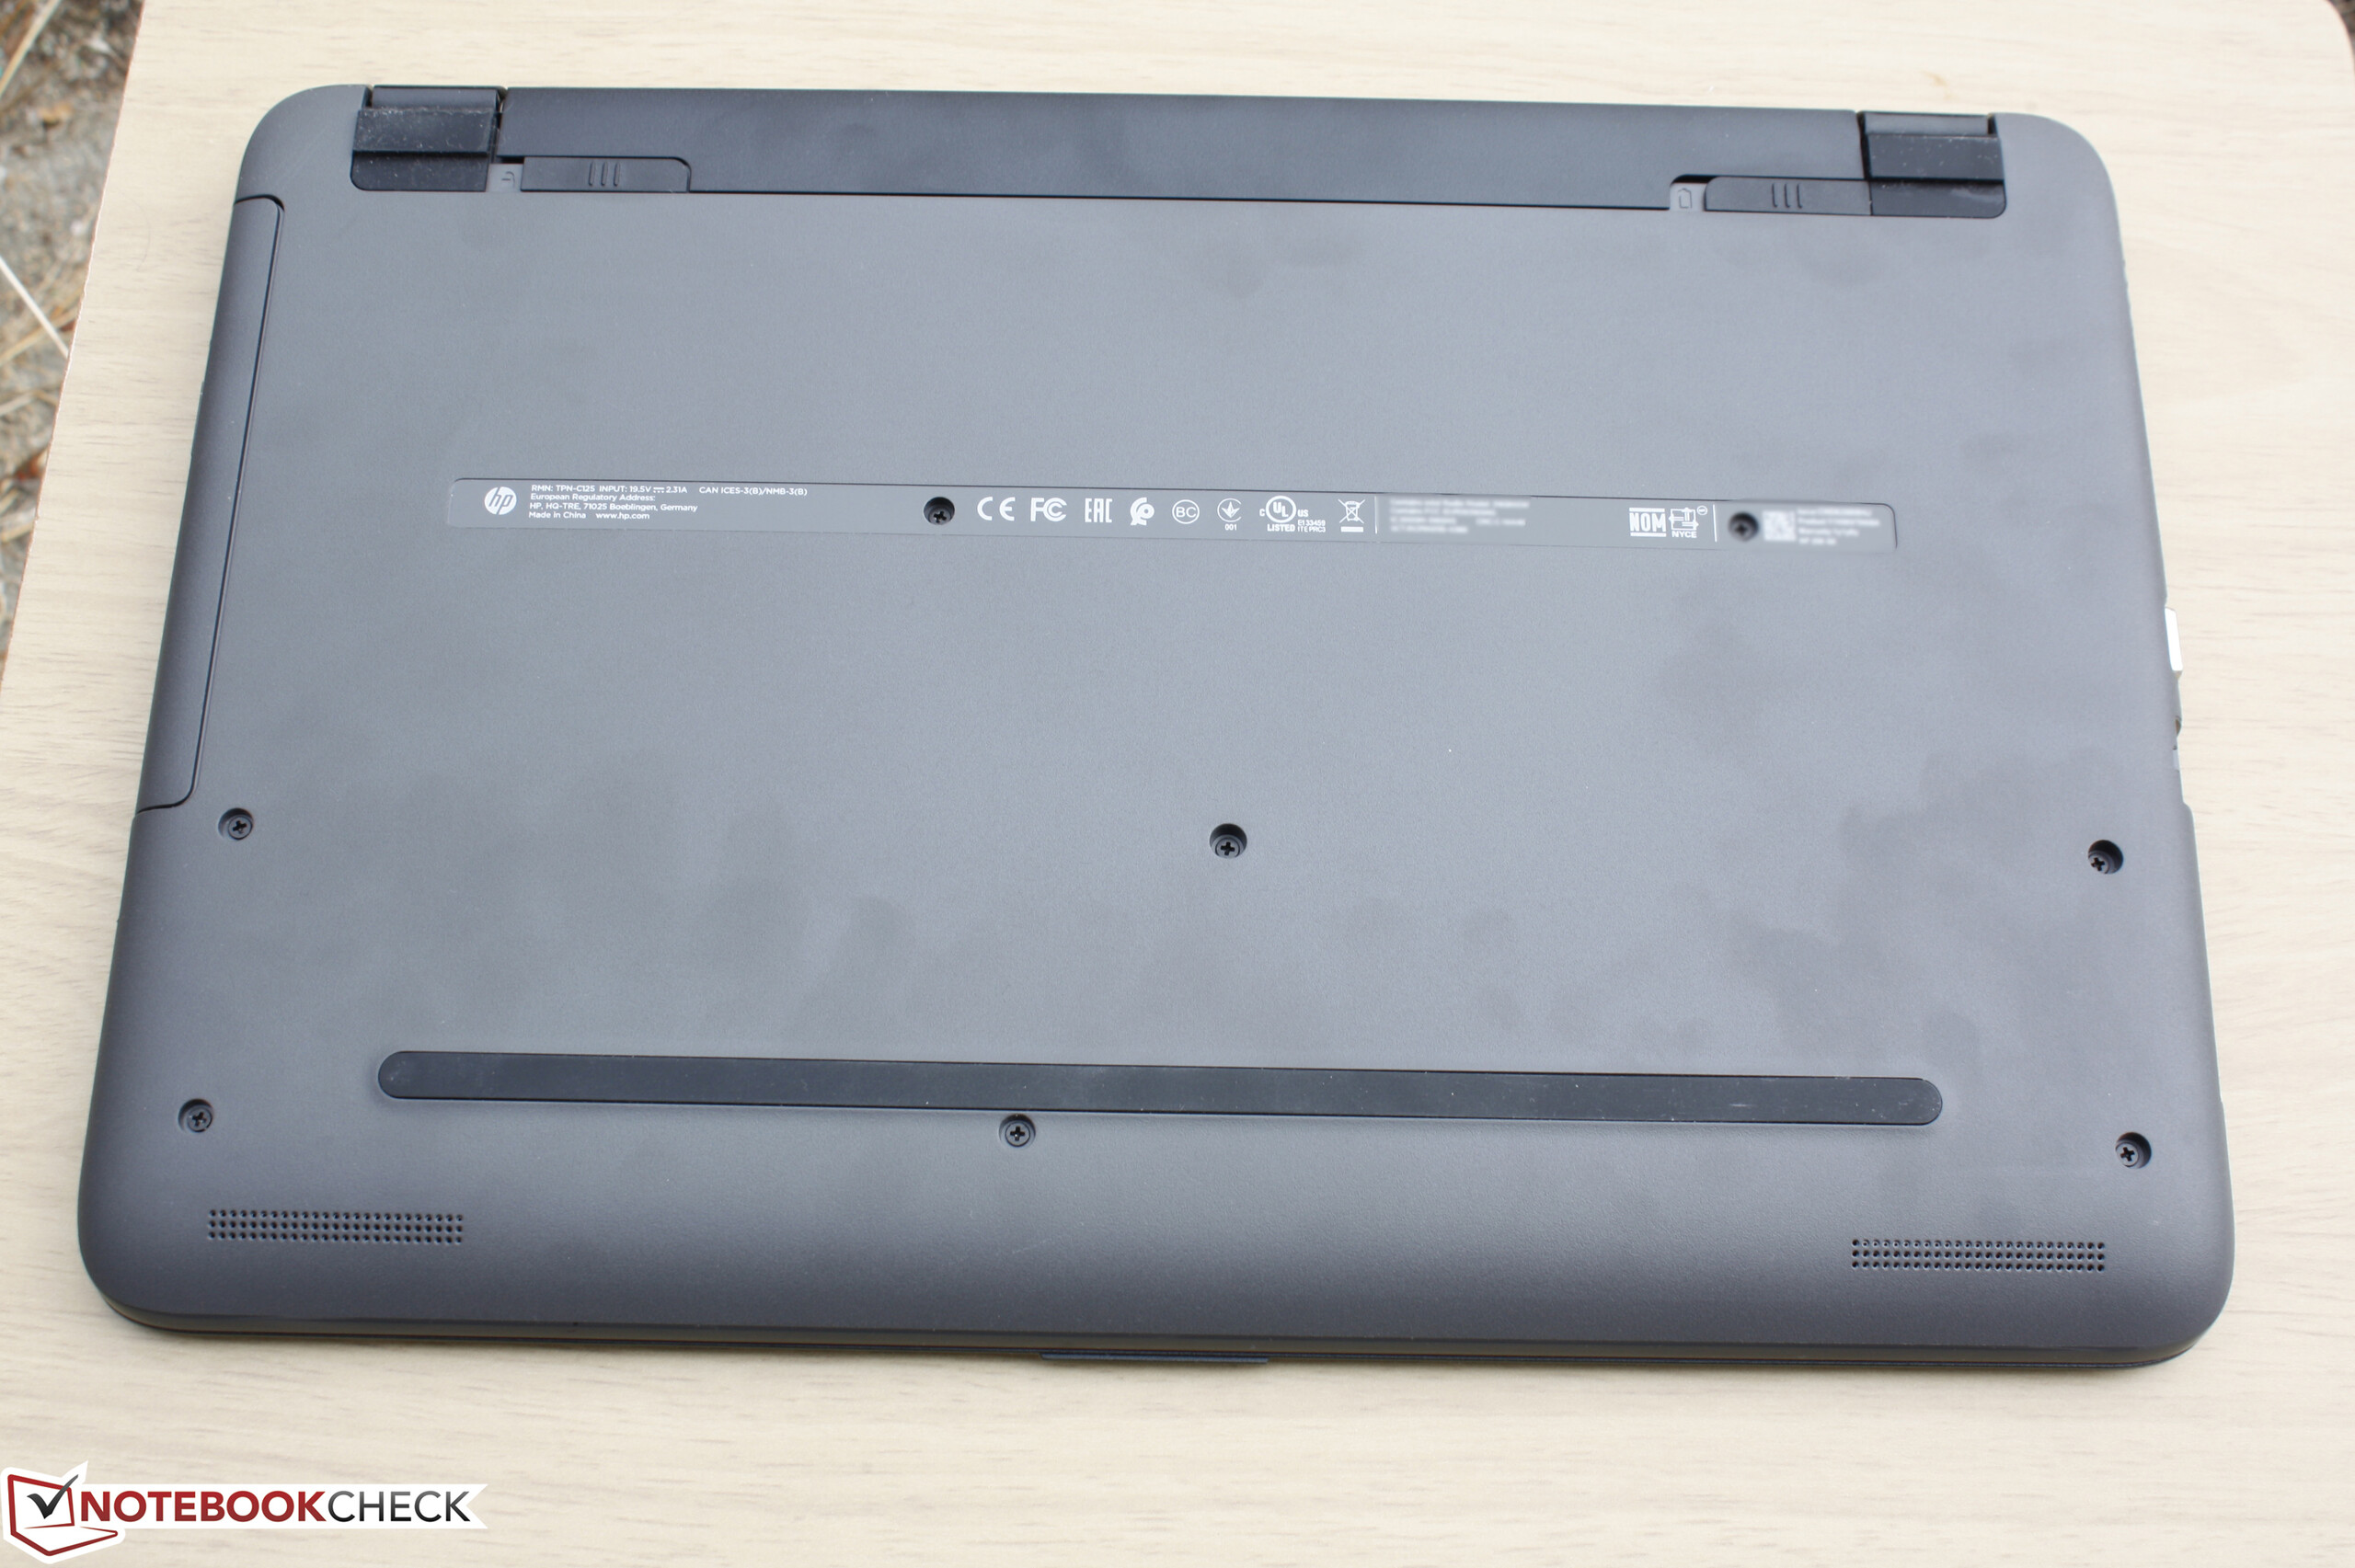
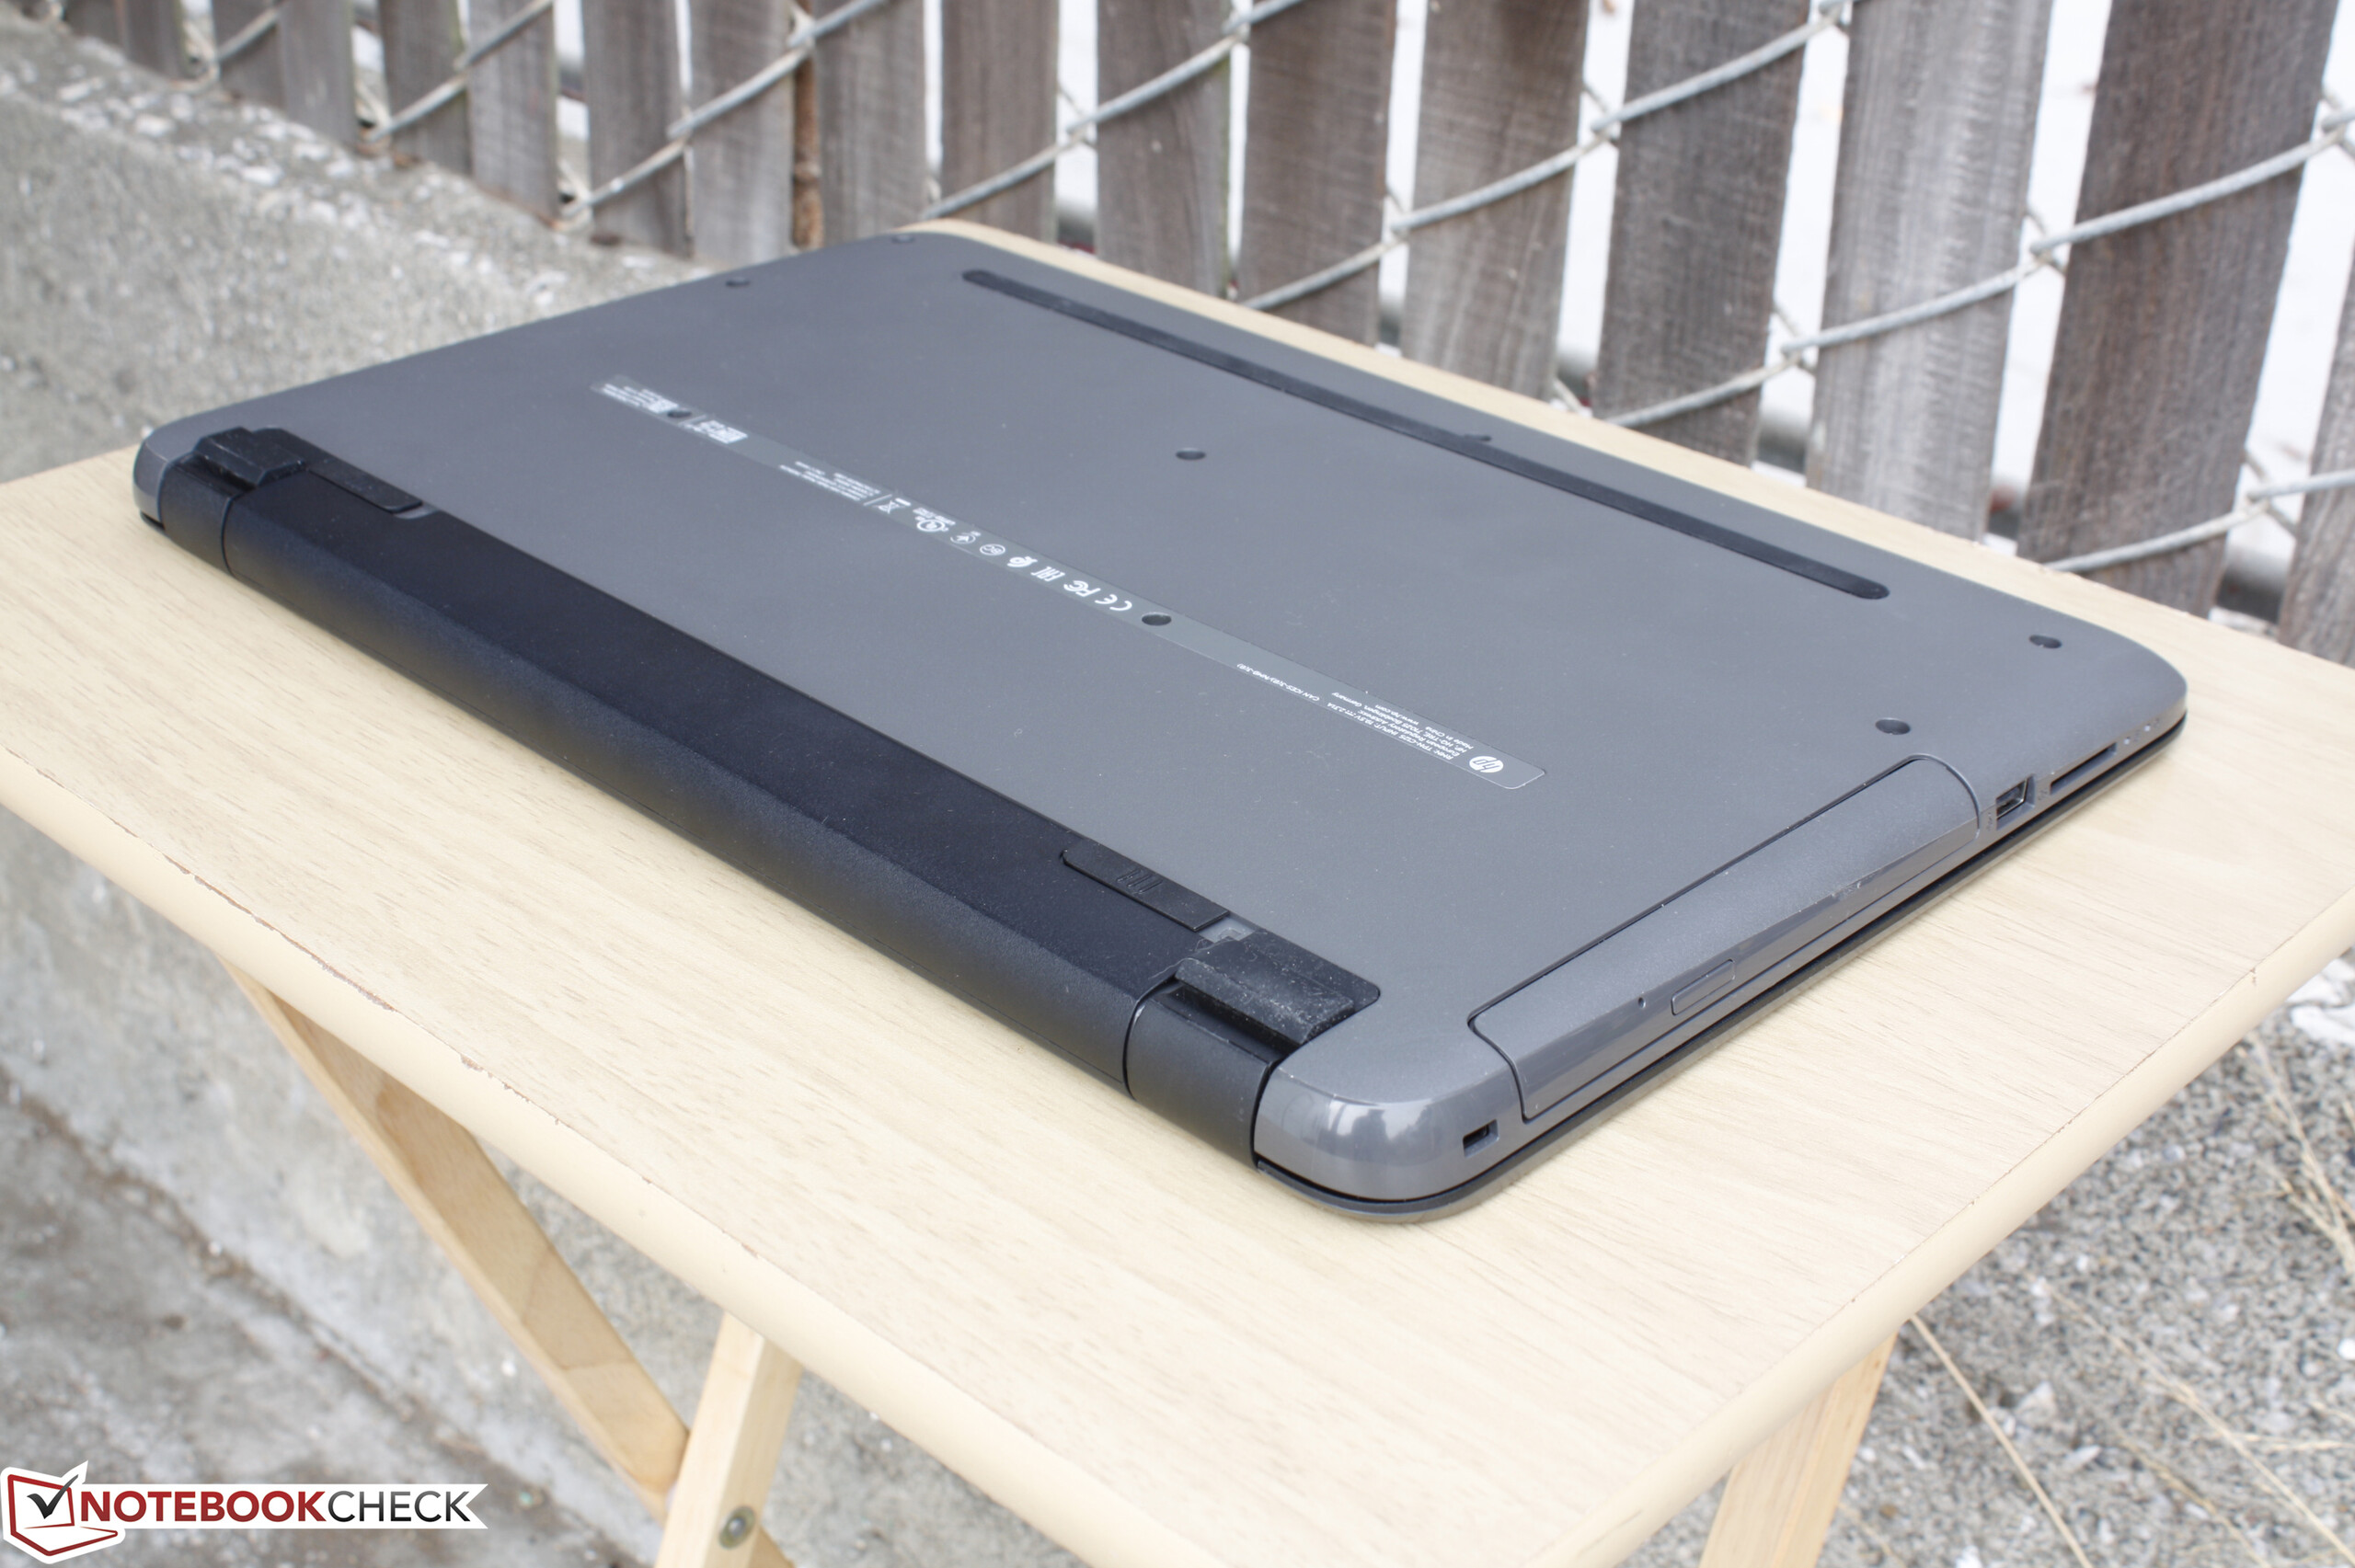
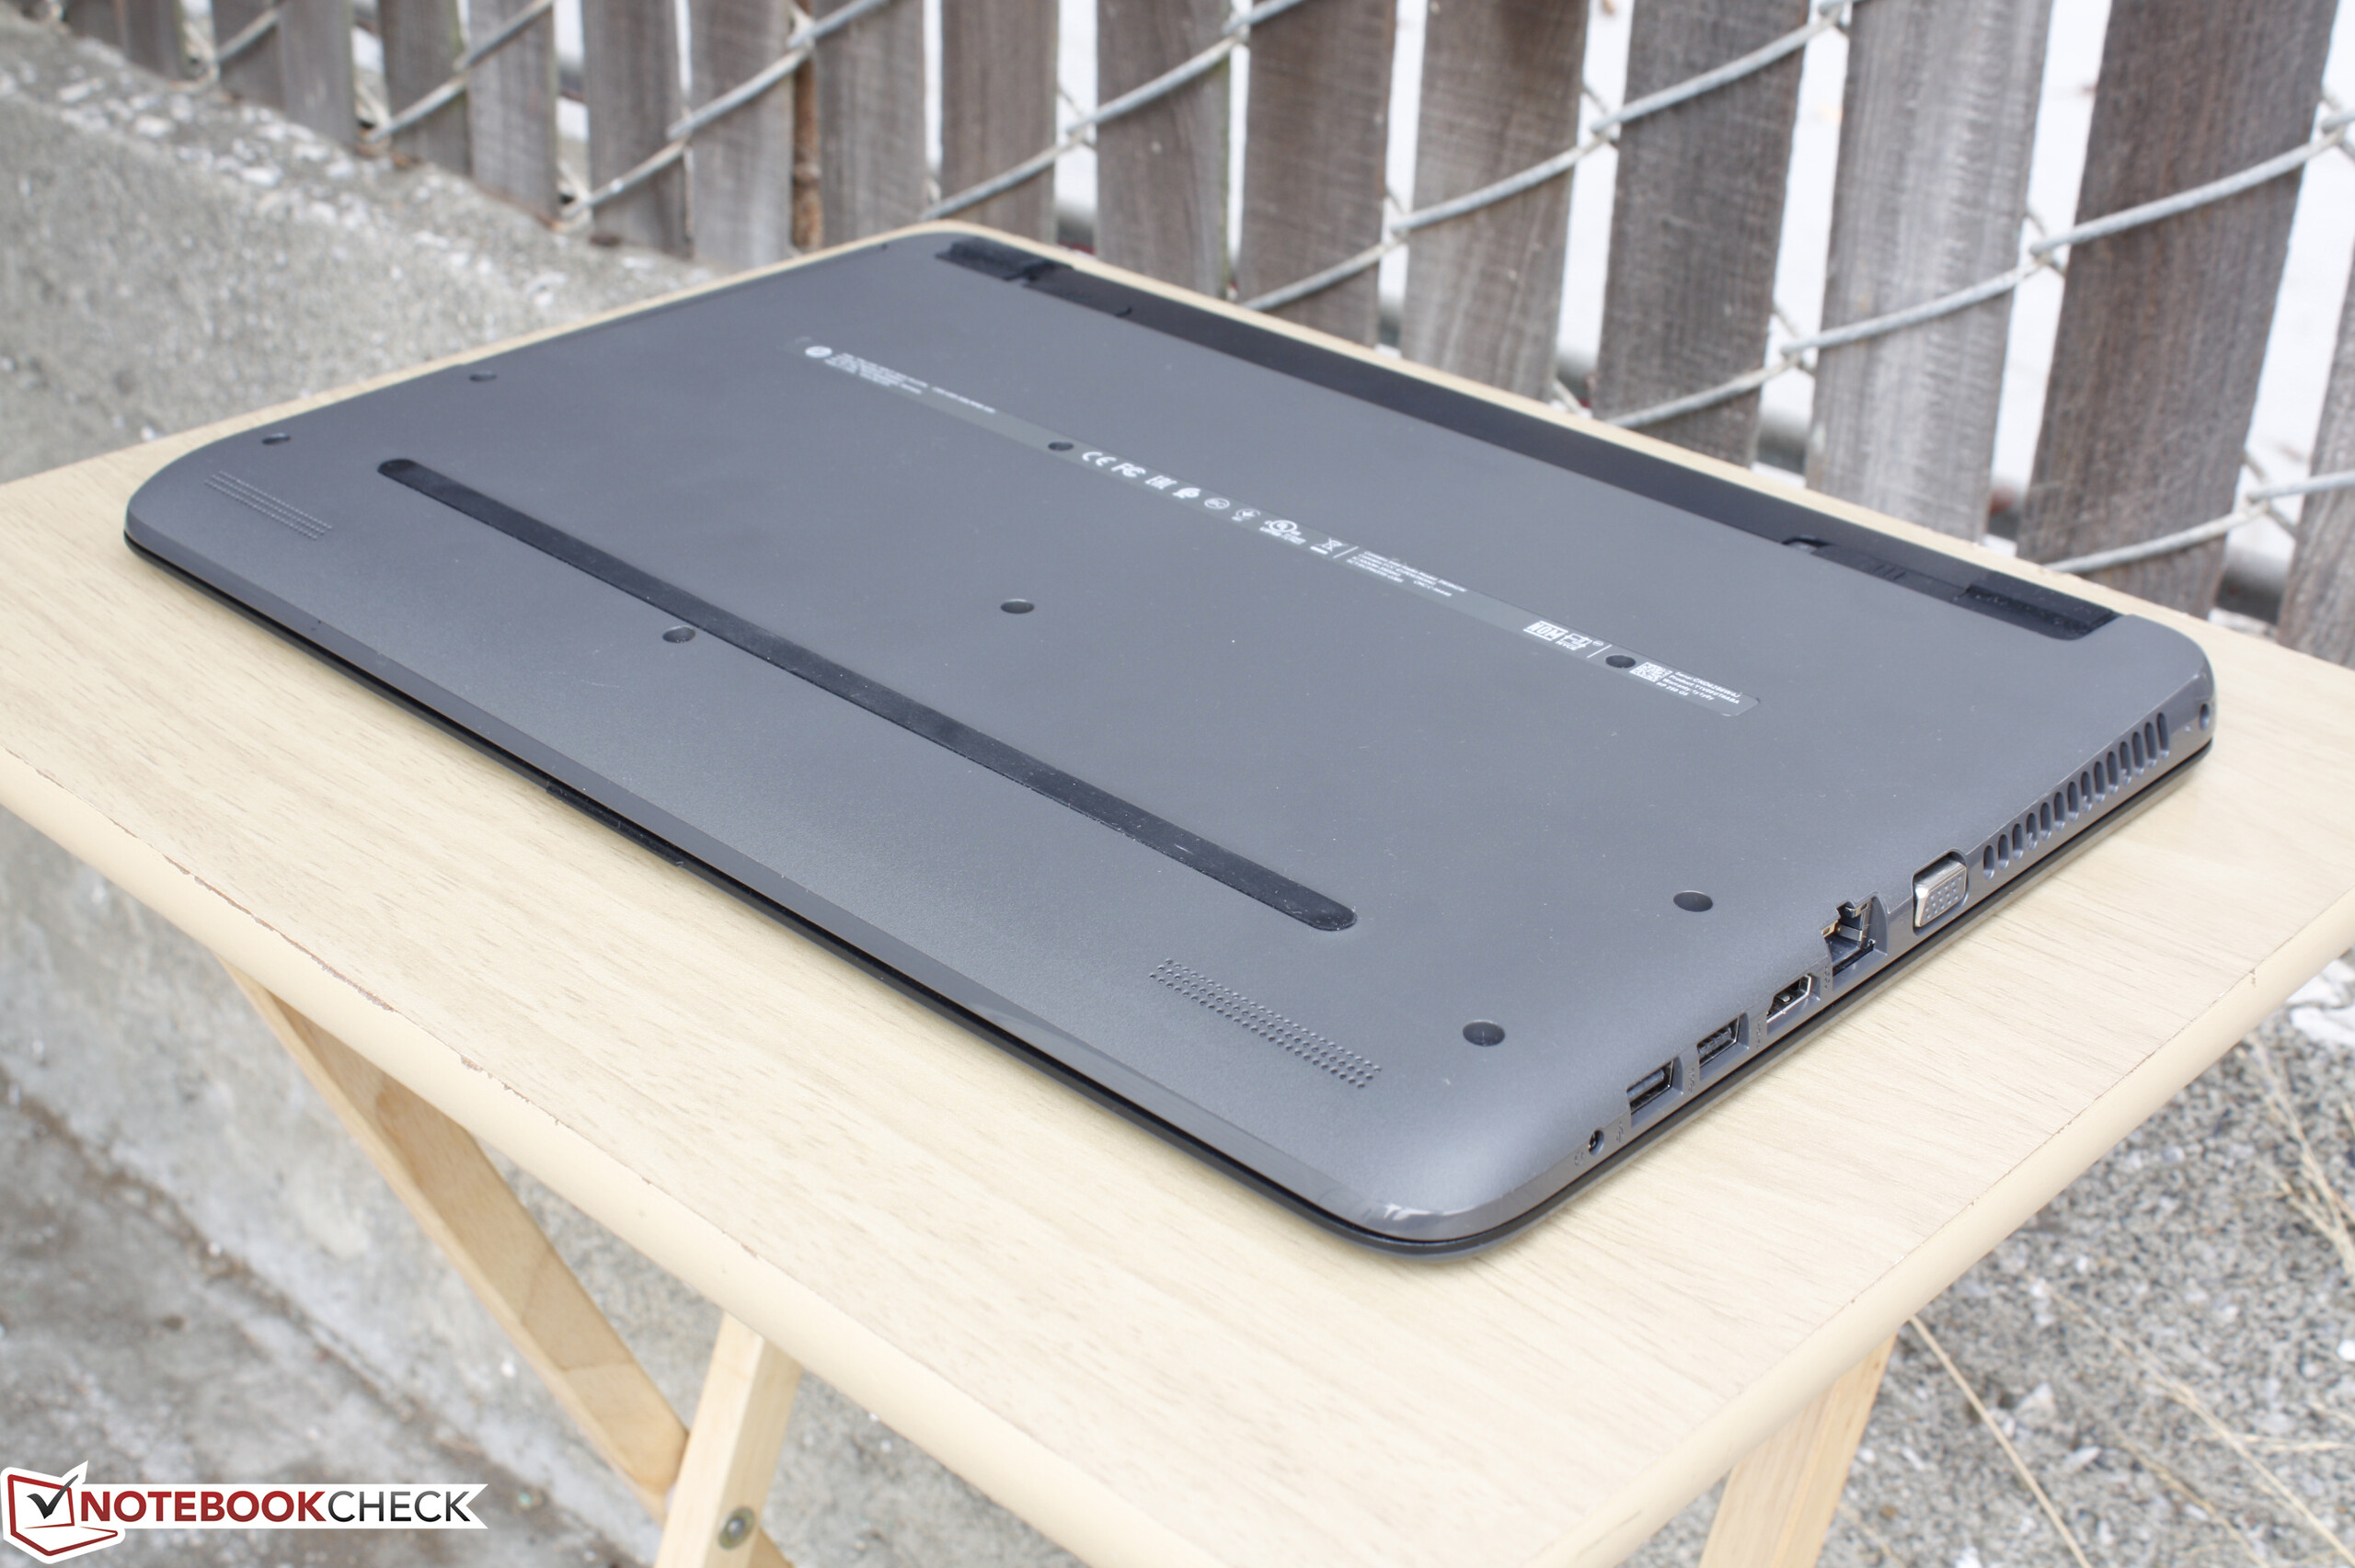
Las ventajas incluyen funcionamiento silencioso, precio inicial bajo, y gran aguante. El chasis mismo es del montón y sugerimos enfáticamente invertir en una configuración más potente con un procesador Core ix y una pantalla FHD para los que se planteen el 250 G5. Un rápido calibrado también es recomendable para sacarle todo el jugo al display y, si el precio es una preocupación, el viejo 250 G4 no es muy diferente y hasta rinde más rápido si se le configura bien.
Evita la configuración más baja con el Celeron N3060 y el HP 250 G5 resulta más fácil de recomendar para las tareas básicas.
Ésta es una versión acortada del análisis original. Puedes leer el análisis completo en inglés aquí.
HP 250 G5 Y1V08UT
- 10/30/2016 v5.1 (old)
Allen Ngo
Price comparison
