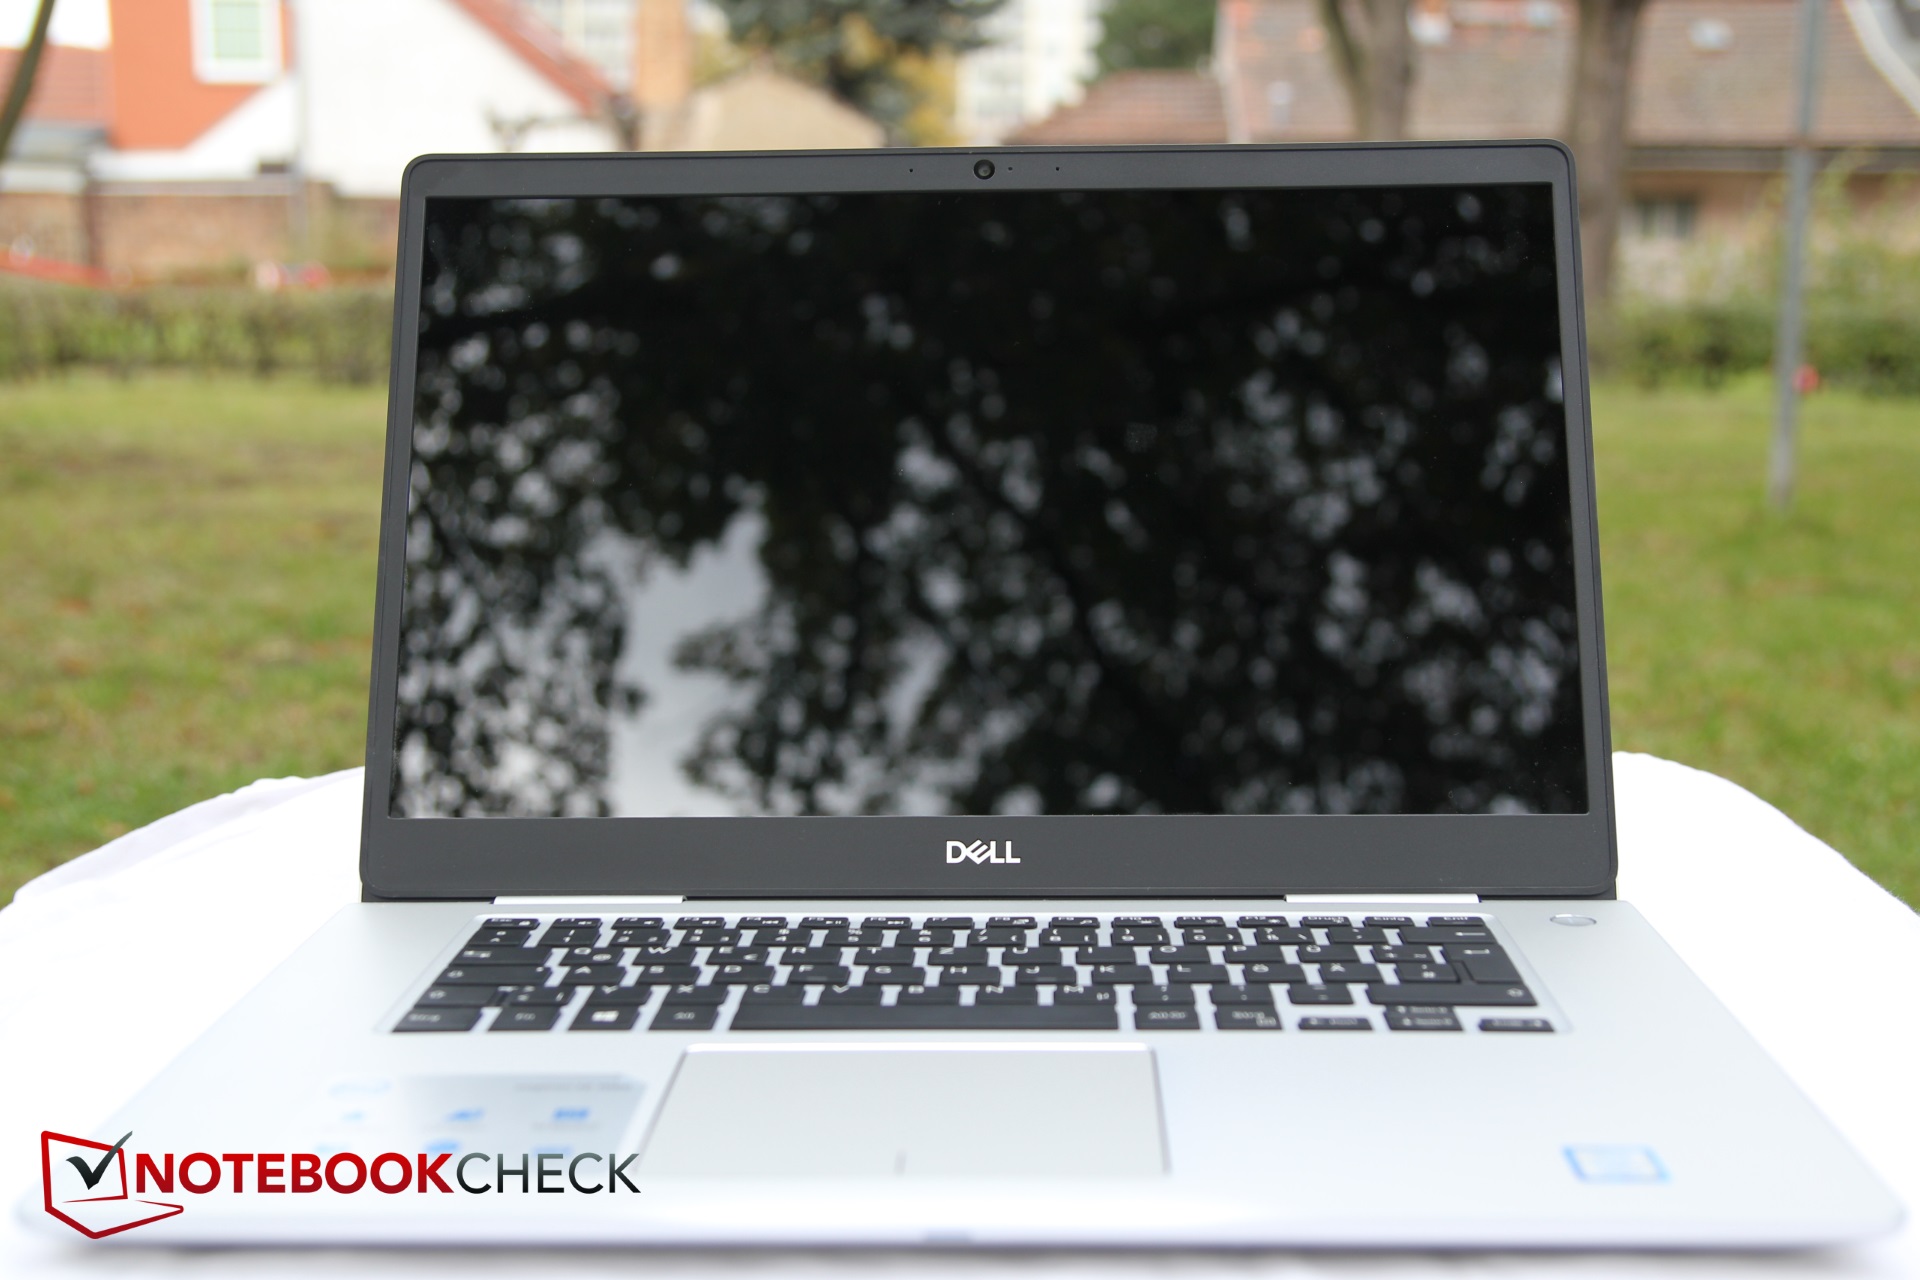
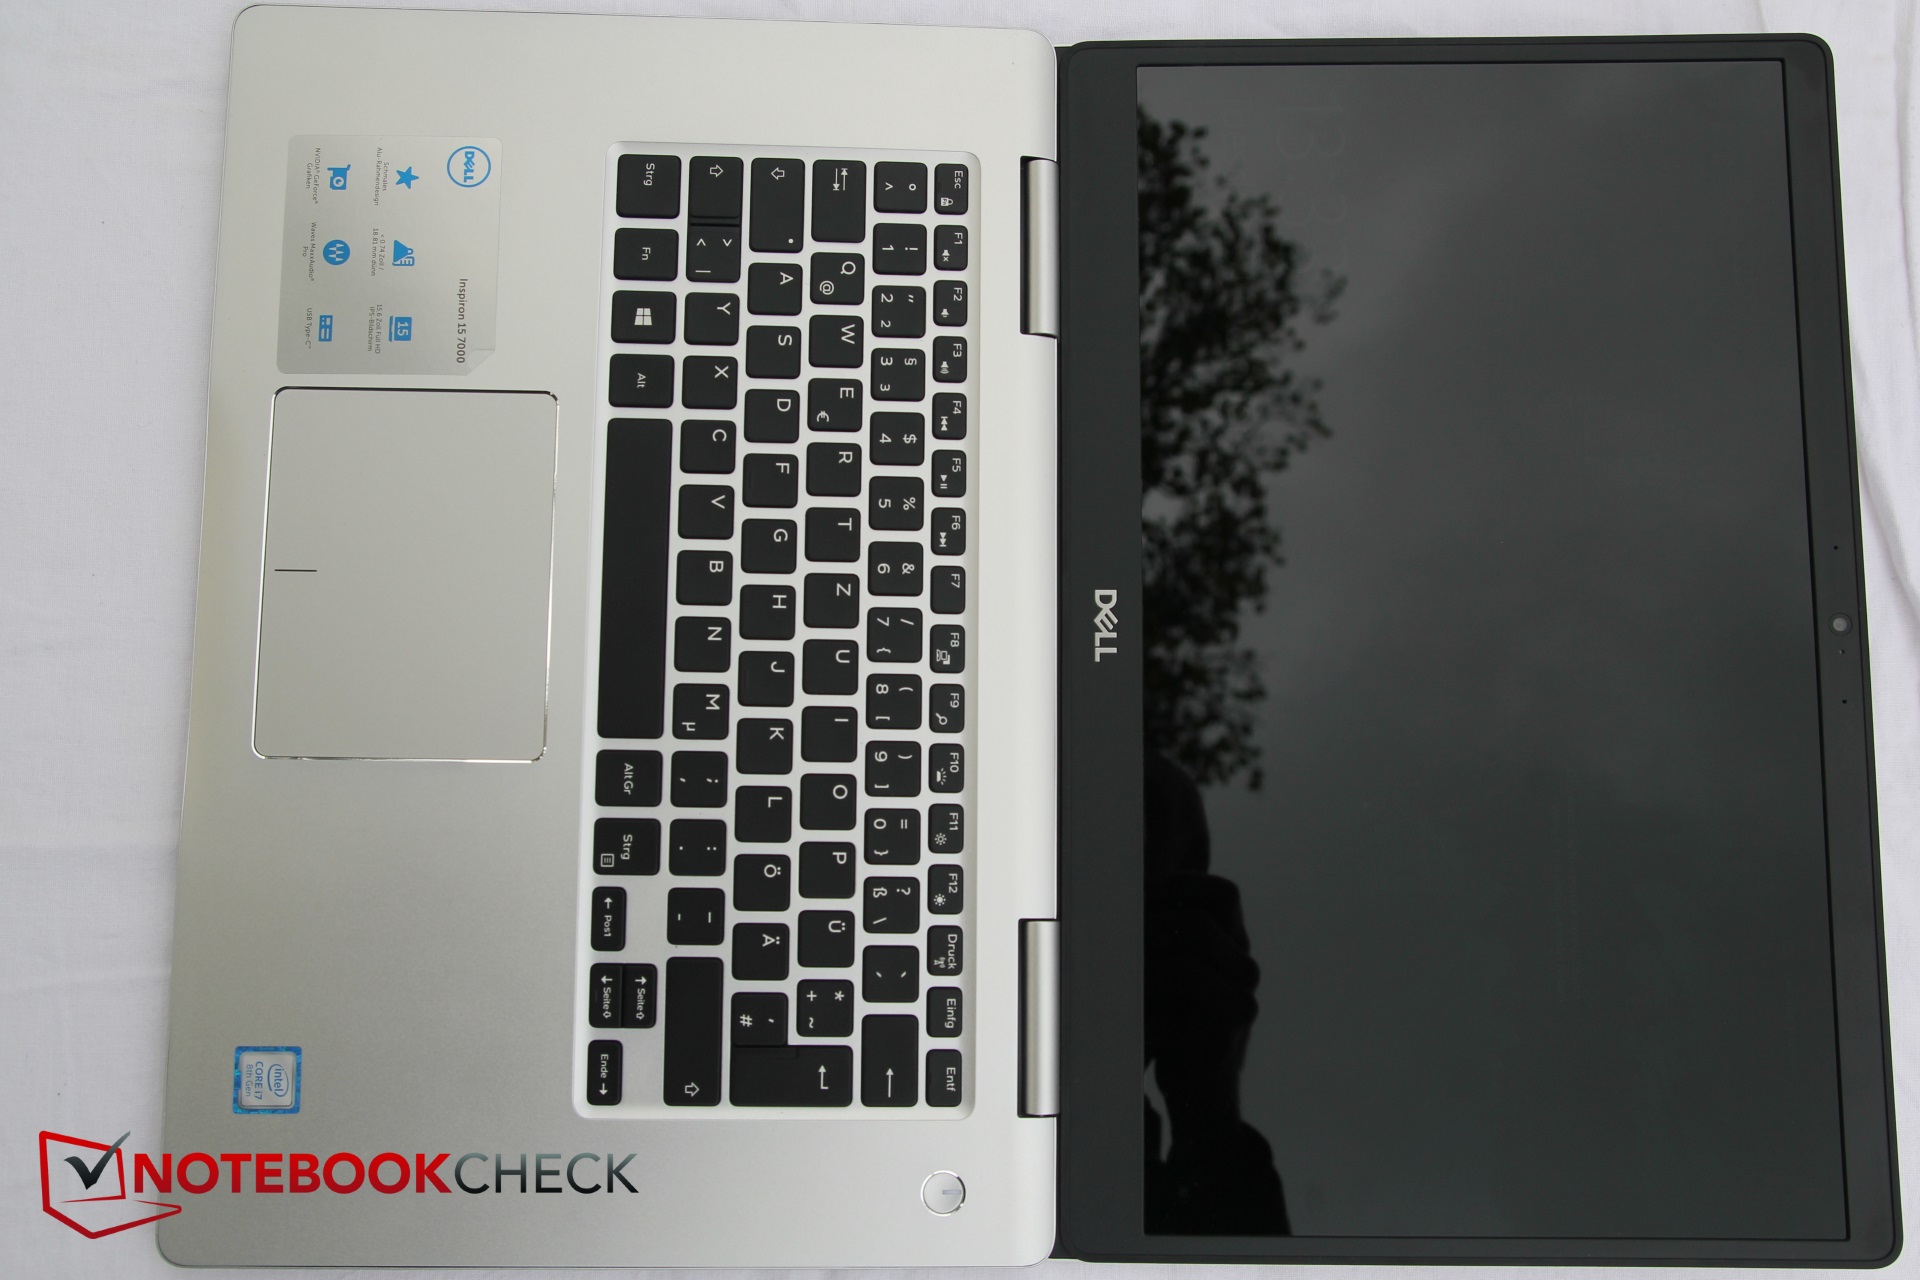
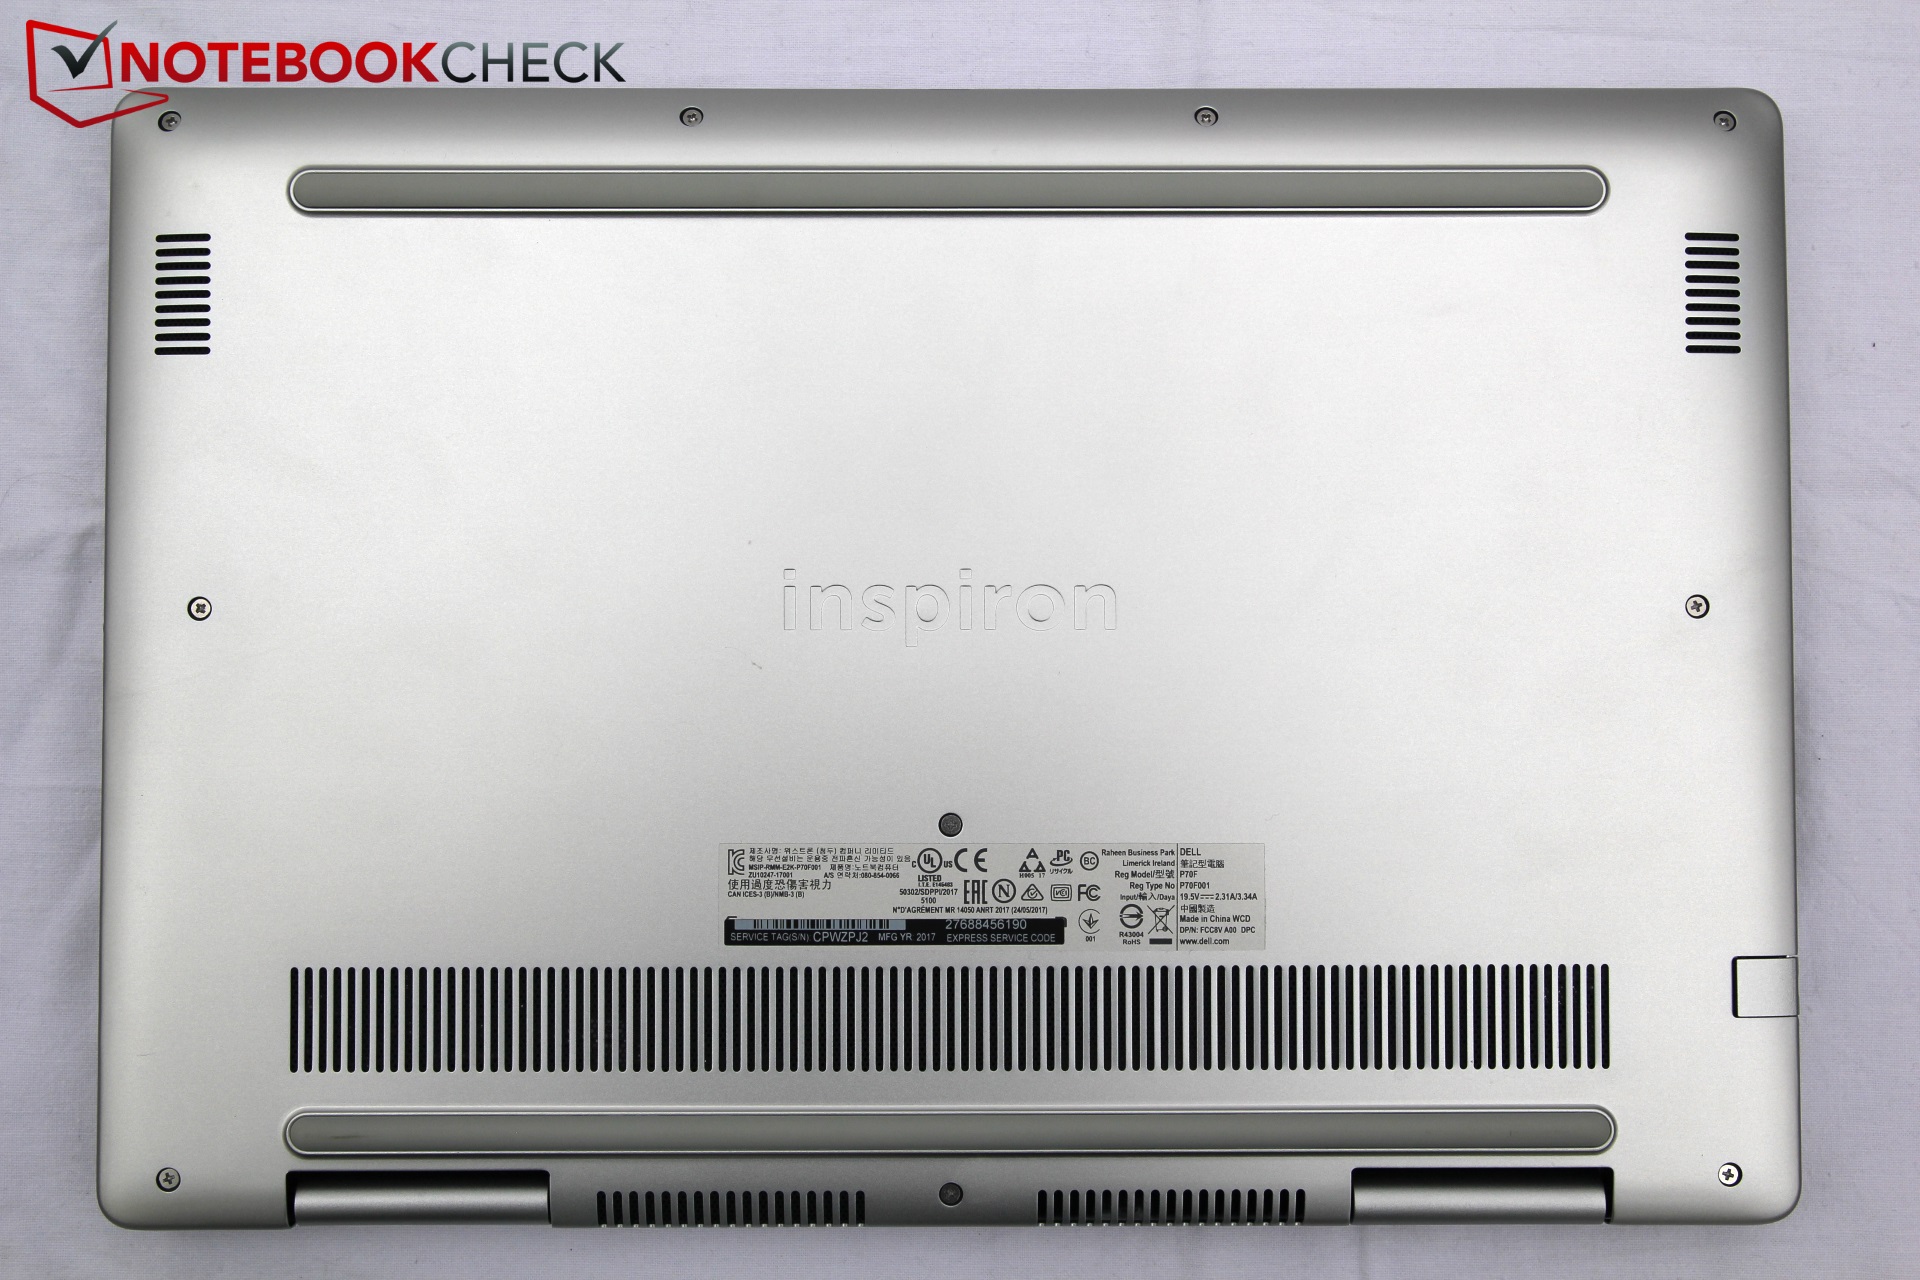
Breve análisis del Dell Inspiron 15 7570 (i7-8550U, 940MX)
| SD Card Reader | |
| average JPG Copy Test (av. of 3 runs) | |
| Acer TravelMate P658-G2-MG-7327 (Toshiba Exceria Pro SDXC 64 GB UHS-II) | |
| Lenovo IdeaPad 510-15IKB 80SV0087GE (Toshiba Exceria Pro SDXC 64 GB UHS-II) | |
| Asus Vivobook S15 S510UQ-BQ189T (Toshiba Exceria Pro SDXC 64 GB UHS-II) | |
| Dell Inspiron 15 7570 (Toshiba Exceria Pro SDXC 64 GB UHS-II) | |
| Dell Inspiron 15 5000 5567-1753 (Toshiba Exceria Pro SDXC 64 GB UHS-II) | |
| maximum AS SSD Seq Read Test (1GB) | |
| Acer TravelMate P658-G2-MG-7327 (Toshiba Exceria Pro SDXC 64 GB UHS-II) | |
| Asus Vivobook S15 S510UQ-BQ189T (Toshiba Exceria Pro SDXC 64 GB UHS-II) | |
| Dell Inspiron 15 7570 (Toshiba Exceria Pro SDXC 64 GB UHS-II) | |
| Dell Inspiron 15 5000 5567-1753 (Toshiba Exceria Pro SDXC 64 GB UHS-II) | |
| Lenovo IdeaPad 510-15IKB 80SV0087GE (Toshiba Exceria Pro SDXC 64 GB UHS-II) | |
| |||||||||||||||||||||||||
iluminación: 91 %
Brillo con batería: 255 cd/m²
Contraste: 1594:1 (Negro: 0.16 cd/m²)
ΔE ColorChecker Calman: 4.74 | ∀{0.5-29.43 Ø4.71}
ΔE Greyscale Calman: 3.44 | ∀{0.09-98 Ø4.96}
60% sRGB (Argyll 1.6.3 3D)
38% AdobeRGB 1998 (Argyll 1.6.3 3D)
41.77% AdobeRGB 1998 (Argyll 3D)
60% sRGB (Argyll 3D)
40.43% Display P3 (Argyll 3D)
Gamma: 2.43
CCT: 7064 K
| Dell Inspiron 15 7570 BOE06B4, , 1920x1080, 15.6" | Asus Vivobook S15 S510UQ-BQ189T AU Optronics B156W02 / AUO B156HAN02.1, , 1920x1080, 15.6" | Acer TravelMate P658-G2-MG-7327 LG Philips LP156WF6-SPP1, , 1920x1080, 15.6" | Lenovo IdeaPad 510-15IKB 80SV0087GE BOE HF NV156FHM-N42, , 1920x1080, 15.6" | Huawei MateBook D 15, i7-7500U 940MX BOE070C, , 1920x1080, 15.6" | Dell Inspiron 15 5000 5567-1753 BOE NT15N41, , 1920x1080, 15.6" | |
|---|---|---|---|---|---|---|
| Display | -3% | 51% | 6% | 3% | -10% | |
| Display P3 Coverage (%) | 40.43 | 38.94 -4% | 64.9 61% | 42.66 6% | 41.79 3% | 36.24 -10% |
| sRGB Coverage (%) | 60 | 58.5 -2% | 85.9 43% | 64.1 7% | 61.5 2% | 54.6 -9% |
| AdobeRGB 1998 Coverage (%) | 41.77 | 40.23 -4% | 62.8 50% | 44.08 6% | 43.17 3% | 37.44 -10% |
| Response Times | 6% | 16% | -14% | -8% | 31% | |
| Response Time Grey 50% / Grey 80% * (ms) | 45 ? | 47 ? -4% | 38 ? 16% | 51 ? -13% | 46.4 ? -3% | 43 ? 4% |
| Response Time Black / White * (ms) | 33 ? | 28 ? 15% | 28 ? 15% | 38 ? -15% | 36.8 ? -12% | 14 ? 58% |
| PWM Frequency (Hz) | 996 ? | 21000 ? | 50 ? | 21190 | ||
| Screen | -1% | -3% | -6% | -45% | -86% | |
| Brightness middle (cd/m²) | 255 | 293 15% | 284 11% | 291 14% | 268 5% | 145 -43% |
| Brightness (cd/m²) | 240 | 275 15% | 276 15% | 265 10% | 258 8% | 144 -40% |
| Brightness Distribution (%) | 91 | 86 -5% | 82 -10% | 86 -5% | 92 1% | 90 -1% |
| Black Level * (cd/m²) | 0.16 | 0.25 -56% | 0.295 -84% | 0.23 -44% | 0.47 -194% | 0.49 -206% |
| Contrast (:1) | 1594 | 1172 -26% | 963 -40% | 1265 -21% | 570 -64% | 296 -81% |
| Colorchecker dE 2000 * | 4.74 | 3.81 20% | 4.07 14% | 4.78 -1% | 5.7 -20% | 9.27 -96% |
| Colorchecker dE 2000 max. * | 7.68 | 6.64 14% | 10.52 -37% | 9.51 -24% | 21.7 -183% | 16.9 -120% |
| Greyscale dE 2000 * | 3.44 | 2.66 23% | 3.13 9% | 3.49 -1% | 4.2 -22% | 12.28 -257% |
| Gamma | 2.43 91% | 2.54 87% | 2.41 91% | 2.58 85% | 2.3 96% | 2.03 108% |
| CCT | 7064 92% | 6541 99% | 7082 92% | 6013 108% | 6820 95% | 10732 61% |
| Color Space (Percent of AdobeRGB 1998) (%) | 38 | 37 -3% | 56 47% | 40 5% | 43.2 14% | 35 -8% |
| Color Space (Percent of sRGB) (%) | 60 | 58 -3% | 86 43% | 64 7% | 61.5 2% | 55 -8% |
| Media total (Programa/Opciones) | 1% /
-0% | 21% /
10% | -5% /
-5% | -17% /
-31% | -22% /
-55% |
* ... más pequeño es mejor
Tiempos de respuesta del display
| ↔ Tiempo de respuesta de Negro a Blanco | ||
|---|---|---|
| 33 ms ... subida ↗ y bajada ↘ combinada | ↗ 18 ms subida | 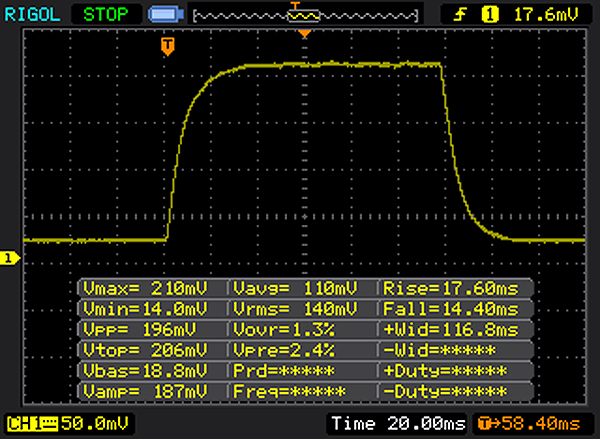 |
| ↘ 15 ms bajada | ||
| La pantalla mostró tiempos de respuesta lentos en nuestros tests y podría ser demasiado lenta para los jugones. En comparación, todos los dispositivos de prueba van de ##min### (mínimo) a 240 (máximo) ms. » 89 % de todos los dispositivos son mejores. Eso quiere decir que el tiempo de respuesta es peor que la media (19.8 ms) de todos los dispositivos testados. | ||
| ↔ Tiempo de respuesta 50% Gris a 80% Gris | ||
| 45 ms ... subida ↗ y bajada ↘ combinada | ↗ 23 ms subida | 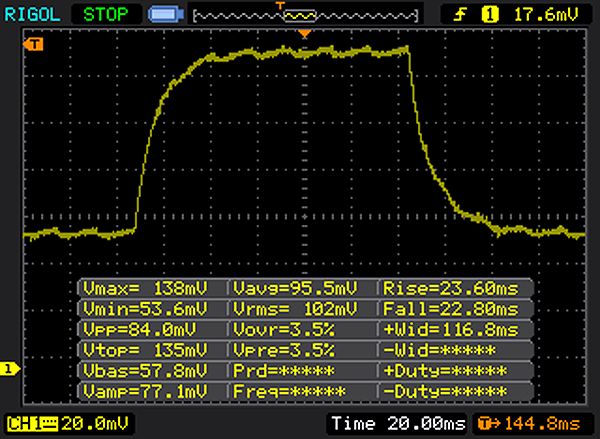 |
| ↘ 22 ms bajada | ||
| La pantalla mostró tiempos de respuesta lentos en nuestros tests y podría ser demasiado lenta para los jugones. En comparación, todos los dispositivos de prueba van de ##min### (mínimo) a 636 (máximo) ms. » 77 % de todos los dispositivos son mejores. Eso quiere decir que el tiempo de respuesta es peor que la media (31 ms) de todos los dispositivos testados. | ||
Parpadeo de Pantalla / PWM (Pulse-Width Modulation)
| Parpadeo de Pantalla / PWM detectado | 996 Hz | ≤ 90 % de brillo | 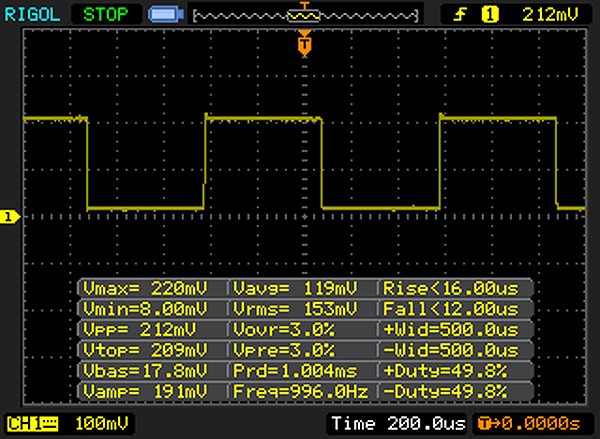 |
La retroiluminación del display parpadea a 996 Hz (seguramente usa PWM - Pulse-Width Modulation) a un brillo del 90 % e inferior. Sobre este nivel de brillo no debería darse parpadeo / PWM. La frecuencia de 996 Hz es bastante alta, por lo que la mayoría de gente sensible al parpadeo no debería ver parpadeo o tener fatiga visual. Comparación: 52 % de todos los dispositivos testados no usaron PWM para atenuar el display. Si se usó, medimos una media de 7754 (mínimo: 5 - máxmo: 343500) Hz. | |||
| Cinebench R11.5 | |
| CPU Single 64Bit | |
| Acer Aspire 5 A517-51G-80L | |
| Dell Inspiron 15 7570 | |
| Huawei MateBook D 15, i7-7500U 940MX | |
| CPU Multi 64Bit | |
| Dell Inspiron 15 7570 | |
| Acer Aspire 5 A517-51G-80L | |
| Huawei MateBook D 15, i7-7500U 940MX | |
| Cinebench R10 | |
| Rendering Single CPUs 64Bit | |
| Acer Aspire 5 A517-51G-80L | |
| Dell Inspiron 15 7570 | |
| Rendering Multiple CPUs 64Bit | |
| Dell Inspiron 15 7570 | |
| Acer Aspire 5 A517-51G-80L | |
| PCMark 8 Home Score Accelerated v2 | 3778 puntos | |
| PCMark 8 Work Score Accelerated v2 | 4987 puntos | |
| PCMark 10 Score | 3701 puntos | |
ayuda | ||
| Dell Inspiron 15 7570 Samsung PM961 NVMe MZVLW512HMJP | Asus Vivobook S15 S510UQ-BQ189T Toshiba SG5 THNSNK128GVN8 | Acer TravelMate P658-G2-MG-7327 Liteonit CV3-8D512 | Lenovo IdeaPad 510-15IKB 80SV0087GE Liteonit CV3-DE256 | Huawei MateBook D 15, i7-7500U 940MX SanDisk SD8SN8U128G1027 | Dell Inspiron 15 5000 5567-1753 SanDisk X400 SED 256GB, SATA (SD8TB8U-256G) | |
|---|---|---|---|---|---|---|
| CrystalDiskMark 3.0 | -66% | -58% | -54% | -56% | -55% | |
| Read Seq (MB/s) | 2013 | 437.6 -78% | 526 -74% | 469.2 -77% | 478.4 -76% | 502 -75% |
| Write Seq (MB/s) | 1015 | 138.6 -86% | 256.9 -75% | 431.5 -57% | 314.9 -69% | 458.1 -55% |
| Read 512 (MB/s) | 1076 | 368.6 -66% | 227.1 -79% | 338.3 -69% | 331.2 -69% | 382.8 -64% |
| Write 512 (MB/s) | 1038 | 138.2 -87% | 246.3 -76% | 297.9 -71% | 181.4 -83% | 385.7 -63% |
| Read 4k (MB/s) | 52.1 | 16.05 -69% | 25.74 -51% | 28.68 -45% | 36.84 -29% | 29.25 -44% |
| Write 4k (MB/s) | 135 | 86.2 -36% | 68.8 -49% | 66.8 -51% | 82.7 -39% | 55.9 -59% |
| Read 4k QD32 (MB/s) | 404.2 | 279.1 -31% | 354.8 -12% | 364.7 -10% | 368.5 -9% | 285.2 -29% |
| Write 4k QD32 (MB/s) | 510 | 121.8 -76% | 248.8 -51% | 245.9 -52% | 123.2 -76% | 239.6 -53% |

| 3DMark | |
| 1280x720 Cloud Gate Standard Graphics | |
| Huawei MateBook D 15, i7-7500U 940MX | |
| Asus Vivobook S15 S510UQ-BQ189T | |
| Dell Inspiron 15 7570 | |
| Dell Inspiron 15 5000 5567-1753 | |
| 1920x1080 Fire Strike Graphics | |
| Huawei MateBook D 15, i7-7500U 940MX | |
| Asus Vivobook S15 S510UQ-BQ189T | |
| Dell Inspiron 15 7570 | |
| Dell Inspiron 15 5000 5567-1753 | |
| 3DMark 11 Performance | 3065 puntos | |
| 3DMark Cloud Gate Standard Score | 10661 puntos | |
| 3DMark Fire Strike Score | 1898 puntos | |
ayuda | ||
| The Witcher 3 | |
| 1024x768 Low Graphics & Postprocessing | |
| Asus Vivobook S15 S510UQ-BQ189T | |
| Huawei MateBook D 15, i7-7500U 940MX | |
| Dell Inspiron 15 5000 5567-1753 | |
| Dell Inspiron 15 7570 | |
| 1366x768 Medium Graphics & Postprocessing | |
| Asus Vivobook S15 S510UQ-BQ189T | |
| Huawei MateBook D 15, i7-7500U 940MX | |
| Dell Inspiron 15 7570 | |
| Dell Inspiron 15 5000 5567-1753 | |
| 1920x1080 High Graphics & Postprocessing (Nvidia HairWorks Off) | |
| Huawei MateBook D 15, i7-7500U 940MX | |
| Dell Inspiron 15 7570 | |
| Dell Inspiron 15 5000 5567-1753 | |
| 1920x1080 Ultra Graphics & Postprocessing (HBAO+) | |
| Dell Inspiron 15 7570 | |
| Huawei MateBook D 15, i7-7500U 940MX | |
| Dell Inspiron 15 5000 5567-1753 | |
| Rise of the Tomb Raider | |
| 1024x768 Lowest Preset | |
| Asus Vivobook S15 S510UQ-BQ189T | |
| Dell Inspiron 15 7570 | |
| Dell Inspiron 15 5000 5567-1753 | |
| Huawei MateBook D 15, i7-7500U 940MX | |
| 1366x768 Medium Preset AF:2x | |
| Asus Vivobook S15 S510UQ-BQ189T | |
| Huawei MateBook D 15, i7-7500U 940MX | |
| Dell Inspiron 15 5000 5567-1753 | |
| Dell Inspiron 15 7570 | |
| 1920x1080 High Preset AA:FX AF:4x | |
| Huawei MateBook D 15, i7-7500U 940MX | |
| Dell Inspiron 15 7570 | |
| Dell Inspiron 15 5000 5567-1753 | |
| 1920x1080 Very High Preset AA:FX AF:16x | |
| Huawei MateBook D 15, i7-7500U 940MX | |
| Dell Inspiron 15 7570 | |
| Dell Inspiron 15 5000 5567-1753 | |
| Doom | |
| 1280x720 Low Preset | |
| Dell Inspiron 15 5000 5567-1753 | |
| Dell Inspiron 15 7570 | |
| 1366x768 Medium Preset | |
| Dell Inspiron 15 5000 5567-1753 | |
| Dell Inspiron 15 7570 | |
| 1920x1080 High Preset AA:FX | |
| Dell Inspiron 15 5000 5567-1753 | |
| Dell Inspiron 15 7570 | |
| bajo | medio | alto | ultra | |
|---|---|---|---|---|
| The Witcher 3 (2015) | 26.34 | 22.22 | 10.64 | 7.12 |
| Rise of the Tomb Raider (2016) | 35.9 | 13.39 | 10.39 | 8.55 |
| Doom (2016) | 13.78 | 11.32 | 6.76 |
| Dell Inspiron 15 7570 GeForce 940MX, i5-8550U, Samsung PM961 NVMe MZVLW512HMJP | Asus Vivobook S15 S510UQ-BQ189T GeForce 940MX, i5-7200U, Toshiba SG5 THNSNK128GVN8 | Acer TravelMate P658-G2-MG-7327 GeForce 940MX, i7-7500U, Liteonit CV3-8D512 | Lenovo IdeaPad 510-15IKB 80SV0087GE GeForce 940MX, i7-7500U, Liteonit CV3-DE256 | Huawei MateBook D 15, i7-7500U 940MX GeForce 940MX, i7-7500U, SanDisk SD8SN8U128G1027 | Dell Inspiron 15 5000 5567-1753 Radeon R7 M445, i7-7500U, SanDisk X400 SED 256GB, SATA (SD8TB8U-256G) | |
|---|---|---|---|---|---|---|
| Noise | -2% | 5% | 0% | 4% | 0% | |
| apagado / medio ambiente * (dB) | 30.3 | 30.6 -1% | 30 1% | 31.6 -4% | 28.8 5% | 30.6 -1% |
| Idle Minimum * (dB) | 30.3 | 31.2 -3% | 30 1% | 32.6 -8% | 30 1% | 30.6 -1% |
| Idle Average * (dB) | 30.3 | 31.2 -3% | 30 1% | 32.6 -8% | 30.2 -0% | 30.6 -1% |
| Idle Maximum * (dB) | 30.3 | 31.2 -3% | 30 1% | 32.6 -8% | 30.2 -0% | 30.6 -1% |
| Load Average * (dB) | 42.6 | 43.3 -2% | 37.3 12% | 35.3 17% | 39 8% | 41.9 2% |
| Load Maximum * (dB) | 42.5 | 43.3 -2% | 38 11% | 37.1 13% | 39 8% | 41.8 2% |
| Witcher 3 ultra * (dB) | 38.7 |
* ... más pequeño es mejor
Ruido
| Ocioso |
| 30.3 / 30.3 / 30.3 dB(A) |
| Carga |
| 42.6 / 42.5 dB(A) |
 | ||
30 dB silencioso 40 dB(A) audible 50 dB(A) ruidosamente alto |
||
min: | ||
| Dell Inspiron 15 7570 GeForce 940MX, i5-8550U, Samsung PM961 NVMe MZVLW512HMJP | Asus Vivobook S15 S510UQ-BQ189T GeForce 940MX, i5-7200U, Toshiba SG5 THNSNK128GVN8 | Acer TravelMate P658-G2-MG-7327 GeForce 940MX, i7-7500U, Liteonit CV3-8D512 | Lenovo IdeaPad 510-15IKB 80SV0087GE GeForce 940MX, i7-7500U, Liteonit CV3-DE256 | Huawei MateBook D 15, i7-7500U 940MX GeForce 940MX, i7-7500U, SanDisk SD8SN8U128G1027 | Dell Inspiron 15 5000 5567-1753 Radeon R7 M445, i7-7500U, SanDisk X400 SED 256GB, SATA (SD8TB8U-256G) | |
|---|---|---|---|---|---|---|
| Heat | 3% | -5% | 10% | -11% | -11% | |
| Maximum Upper Side * (°C) | 42.8 | 38.2 11% | 46.4 -8% | 38.3 11% | 44.8 -5% | 41.6 3% |
| Maximum Bottom * (°C) | 43 | 49 -14% | 51.3 -19% | 36 16% | 50.4 -17% | 51.3 -19% |
| Idle Upper Side * (°C) | 27.8 | 24.7 11% | 26 6% | 24.9 10% | 29.4 -6% | 29.4 -6% |
| Idle Bottom * (°C) | 26.6 | 25.8 3% | 25.7 3% | 25.6 4% | 31 -17% | 32.4 -22% |
* ... más pequeño es mejor
(±) La temperatura máxima en la parte superior es de 42.8 °C / 109 F, frente a la media de 34.3 °C / 94 F, que oscila entre 21.2 y 62.5 °C para la clase Office.
(±) El fondo se calienta hasta un máximo de 43 °C / 109 F, frente a la media de 36.8 °C / 98 F
(+) En reposo, la temperatura media de la parte superior es de 25.5 °C / 78# F, frente a la media del dispositivo de 29.5 °C / 85 F.
(+) El reposamanos y el panel táctil están a una temperatura inferior a la de la piel, con un máximo de 29.5 °C / 85.1 F y, por tanto, son fríos al tacto.
(±) La temperatura media de la zona del reposamanos de dispositivos similares fue de 27.5 °C / 81.5 F (-2 °C / -3.6 F).
Dell Inspiron 15 7570 análisis de audio
(-) | altavoces no muy altos (#67.4 dB)
Graves 100 - 315 Hz
(-) | casi sin bajos - de media 18.2% inferior a la mediana
(±) | la linealidad de los graves es media (13.1% delta a frecuencia anterior)
Medios 400 - 2000 Hz
(+) | medios equilibrados - a sólo 3.5% de la mediana
(±) | la linealidad de los medios es media (8.1% delta respecto a la frecuencia anterior)
Altos 2 - 16 kHz
(+) | máximos equilibrados - a sólo 2.3% de la mediana
(±) | la linealidad de los máximos es media (9.9% delta a frecuencia anterior)
Total 100 - 16.000 Hz
(±) | la linealidad del sonido global es media (20.8% de diferencia con la mediana)
En comparación con la misma clase
» 49% de todos los dispositivos probados de esta clase eran mejores, 9% similares, 42% peores
» El mejor tuvo un delta de 7%, la media fue 21%, el peor fue ###max##%
En comparación con todos los dispositivos probados
» 56% de todos los dispositivos probados eran mejores, 8% similares, 36% peores
» El mejor tuvo un delta de 4%, la media fue 23%, el peor fue ###max##%
Apple MacBook 12 (Early 2016) 1.1 GHz análisis de audio
(+) | los altavoces pueden reproducir a un volumen relativamente alto (#83.6 dB)
Graves 100 - 315 Hz
(±) | lubina reducida - en promedio 11.3% inferior a la mediana
(±) | la linealidad de los graves es media (14.2% delta a frecuencia anterior)
Medios 400 - 2000 Hz
(+) | medios equilibrados - a sólo 2.4% de la mediana
(+) | los medios son lineales (5.5% delta a la frecuencia anterior)
Altos 2 - 16 kHz
(+) | máximos equilibrados - a sólo 2% de la mediana
(+) | los máximos son lineales (4.5% delta a la frecuencia anterior)
Total 100 - 16.000 Hz
(+) | el sonido global es lineal (10.2% de diferencia con la mediana)
En comparación con la misma clase
» 7% de todos los dispositivos probados de esta clase eran mejores, 2% similares, 90% peores
» El mejor tuvo un delta de 5%, la media fue 18%, el peor fue ###max##%
En comparación con todos los dispositivos probados
» 5% de todos los dispositivos probados eran mejores, 1% similares, 94% peores
» El mejor tuvo un delta de 4%, la media fue 23%, el peor fue ###max##%
| Off / Standby | |
| Ocioso | |
| Carga |
|
Clave:
min: | |
| Dell Inspiron 15 7570 i5-8550U, GeForce 940MX, Samsung PM961 NVMe MZVLW512HMJP, IPS, 1920x1080, 15.6" | Asus Vivobook S15 S510UQ-BQ189T i5-7200U, GeForce 940MX, Toshiba SG5 THNSNK128GVN8, IPS, 1920x1080, 15.6" | Acer TravelMate P658-G2-MG-7327 i7-7500U, GeForce 940MX, Liteonit CV3-8D512, IPS, 1920x1080, 15.6" | Lenovo IdeaPad 510-15IKB 80SV0087GE i7-7500U, GeForce 940MX, Liteonit CV3-DE256, IPS, 1920x1080, 15.6" | Huawei MateBook D 15, i7-7500U 940MX i7-7500U, GeForce 940MX, SanDisk SD8SN8U128G1027, IPS, 1920x1080, 15.6" | Dell Inspiron 15 5000 5567-1753 i7-7500U, Radeon R7 M445, SanDisk X400 SED 256GB, SATA (SD8TB8U-256G), TN LED, 1920x1080, 15.6" | |
|---|---|---|---|---|---|---|
| Power Consumption | 2% | -7% | 5% | -6% | 6% | |
| Idle Minimum * (Watt) | 3.6 | 3.6 -0% | 3.9 -8% | 3.9 -8% | 5.14 -43% | 4 -11% |
| Idle Average * (Watt) | 6.7 | 6.8 -1% | 7.9 -18% | 7.4 -10% | 9.07 -35% | 5.4 19% |
| Idle Maximum * (Watt) | 9.2 | 9.5 -3% | 11.3 -23% | 9.5 -3% | 9.33 -1% | 8.3 10% |
| Load Average * (Watt) | 59 | 51.6 13% | 47 20% | 41 31% | 46.76 21% | 54 8% |
| Load Maximum * (Watt) | 58 | 56 3% | 62 -7% | 48 17% | 42.59 27% | 55.4 4% |
| Witcher 3 ultra * (Watt) | 40.18 |
* ... más pequeño es mejor
| Dell Inspiron 15 7570 i5-8550U, GeForce 940MX, 42 Wh | Asus Vivobook S15 S510UQ-BQ189T i5-7200U, GeForce 940MX, 42 Wh | Acer TravelMate P658-G2-MG-7327 i7-7500U, GeForce 940MX, 55 Wh | Lenovo IdeaPad 510-15IKB 80SV0087GE i7-7500U, GeForce 940MX, 30 Wh | Huawei MateBook D 15, i7-7500U 940MX i7-7500U, GeForce 940MX, 43.3 Wh | Dell Inspiron 15 5000 5567-1753 i7-7500U, Radeon R7 M445, 42 Wh | |
|---|---|---|---|---|---|---|
| Duración de Batería | 61% | 367% | 156% | 191% | 103% | |
| Reader / Idle (h) | 4.7 | 7.1 51% | 15.9 238% | 7.8 66% | ||
| H.264 (h) | 4 | 5.3 33% | ||||
| WiFi v1.3 (h) | 1.8 | 4.3 139% | 8.4 367% | 4.6 156% | 7.4 311% | 7 289% |
| Load (h) | 1.3 | 1.2 -8% | 1.6 23% | 1.6 23% |
Pro
Contra
El Inspiron 15 7000 (7570-9726) es un caso difícil. Por un lado, nos gusta el diseño y la manufactura de la resistente carcasa de aluminio. A pesar de la superficie reflectante, el display también queda muy bien en algunas partes, y al menos sobre el papel, el hardware convence con buenos valores, en particular el excelente SSD. Además, el dispositivo siempre permanece cómodamente fresco.
Por otro lado, el Dell Inspiron tiene algunas debilidades, algunas de las cuales no pueden explicarse. Lo peor son el malísimo aguante de batería, y las latencias y caídas registradas. Aparentemente, el dispositivo se pelea con grandes problemas de drivers, ya que el rendimiento gráfico también está fuertemente ralentizado. En el rendimiento de sistema y particularmente en el gráfico, el dispositivo no alcanza el nivel de los competidores y no puede usar todo el potencial que promete el buen hardware. Pero eso sólo no sería tna malo si al menos tuviera movilidad en forma de un buen aguante de batería. Después de todo, el dispositivo es un modelo todoterreno business ligero. Por desgracia, el caso es el opuesto.
Si bien el Dell Inspiron tiene buenos prerrequisitos en la forma de componentes potentes, por desgracia sus sorprendentes debilidades fastidian sus promesas de ser un valor de primera.
El dispositivo puede comprarse por unos 1150 Euros (~$1324; desde $750 en USA). Los usuarios a los que el rendimiento gráfico les resulte menos importante y que busquen un buen portátil para su casa quedarán bien servidos con el Dell Inspiron. Quizá Dell logre aún remediar alguna de las peores debilidades por actualizaciones. Nos gustaría, ya que el dispositivo también sería adecuado para el uso móvil.
Ésta es una versión acortada del análisis original. Puedes leer el análisis completo en inglés aquí.
Dell Inspiron 15 7570
- 11/08/2017 v6 (old)
Christian Hintze