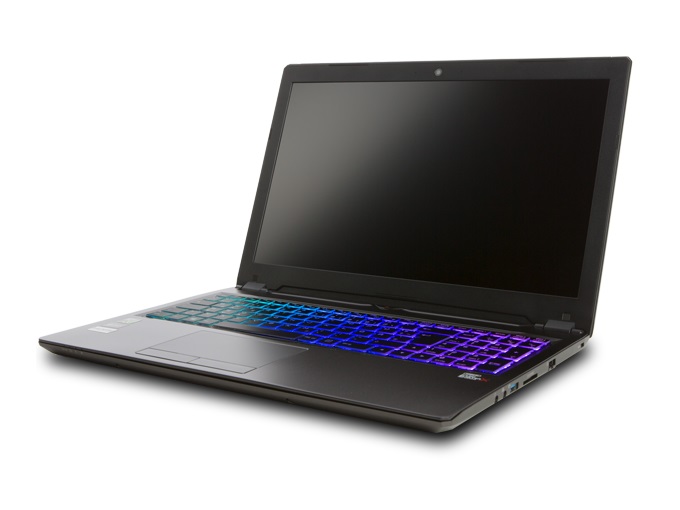
Breve análisis del portátil Guru Fire KS (Clevo P950HP6)
| SD Card Reader | |
| average JPG Copy Test (av. of 3 runs) | |
| Eurocom Q5 | |
| Guru Fire KS (Toshiba Exceria Pro SDXC 64 GB UHS-II) | |
| HP Omen 15-ce002ng (Toshiba Exceria Pro SDXC 64 GB UHS-II) | |
| MSI GS63VR 7RF-228US (Toshiba Exceria Pro SDXC 64 GB UHS-II) | |
| maximum AS SSD Seq Read Test (1GB) | |
| Eurocom Q5 | |
| Guru Fire KS (Toshiba Exceria Pro SDXC 64 GB UHS-II) | |
| HP Omen 15-ce002ng (Toshiba Exceria Pro SDXC 64 GB UHS-II) | |
| MSI GS63VR 7RF-228US (Toshiba Exceria Pro SDXC 64 GB UHS-II) | |
| Networking | |
| iperf3 transmit AX12 | |
| Acer Nitro 5 AN515-51-788E | |
| MSI GS63VR 7RF-228US | |
| Eurocom Q5 | |
| HP Omen 15-ce002ng | |
| Guru Fire KS | |
| iperf3 receive AX12 | |
| HP Omen 15-ce002ng | |
| Eurocom Q5 | |
| MSI GS63VR 7RF-228US | |
| Acer Nitro 5 AN515-51-788E | |
| Guru Fire KS | |
| |||||||||||||||||||||||||
iluminación: 93 %
Brillo con batería: 312 cd/m²
Contraste: 843:1 (Negro: 0.37 cd/m²)
ΔE ColorChecker Calman: 4.16 | ∀{0.5-29.43 Ø4.73}
ΔE Greyscale Calman: 2.53 | ∀{0.09-98 Ø4.97}
83% sRGB (Argyll 1.6.3 3D)
54% AdobeRGB 1998 (Argyll 1.6.3 3D)
60.5% AdobeRGB 1998 (Argyll 3D)
82.8% sRGB (Argyll 3D)
63.4% Display P3 (Argyll 3D)
Gamma: 2.48
CCT: 6667 K
| Guru Fire KS LG Philips LP156WF6 (LGD046F), 1920x1080, 15.6" | Eurocom Q5 ID: LGD04D4, Name: LG Philips LP156UD1-SPB1, 3840x2160, 15.6" | MSI GS63VR 7RF-228US 3840x2160, 15.6" | HP Omen 15-ce002ng AUO42ED, 1920x1080, 15.6" | Acer Nitro 5 AN515-51-788E LG Philips LP156WF6-SPK6, 1920x1080, 15.6" | |
|---|---|---|---|---|---|
| Display | 6% | -18% | 8% | -29% | |
| Display P3 Coverage (%) | 63.4 | 63 -1% | 48.21 -24% | 65.8 4% | 41.7 -34% |
| sRGB Coverage (%) | 82.8 | 92.7 12% | 72.6 -12% | 90.9 10% | 62.2 -25% |
| AdobeRGB 1998 Coverage (%) | 60.5 | 64.4 6% | 49.81 -18% | 66.5 10% | 43.17 -29% |
| Response Times | 11% | 25% | -7% | 20% | |
| Response Time Grey 50% / Grey 80% * (ms) | 40.8 ? | 32.4 ? 21% | 28 ? 31% | 43.2 ? -6% | 35 ? 14% |
| Response Time Black / White * (ms) | 29.2 ? | 28.8 ? 1% | 23.6 ? 19% | 31.2 ? -7% | 22 ? 25% |
| PWM Frequency (Hz) | 21370 ? | 1351 ? | |||
| Screen | -21% | -50% | 12% | -19% | |
| Brightness middle (cd/m²) | 312 | 287.5 -8% | 274.2 -12% | 304 -3% | 276 -12% |
| Brightness (cd/m²) | 304 | 279 -8% | 263 -13% | 289 -5% | 265 -13% |
| Brightness Distribution (%) | 93 | 87 -6% | 92 -1% | 86 -8% | 91 -2% |
| Black Level * (cd/m²) | 0.37 | 0.65 -76% | 0.44 -19% | 0.26 30% | 0.25 32% |
| Contrast (:1) | 843 | 442 -48% | 623 -26% | 1169 39% | 1104 31% |
| Colorchecker dE 2000 * | 4.16 | 4.5 -8% | 8 -92% | 3.46 17% | 5.06 -22% |
| Colorchecker dE 2000 max. * | 10 | 8.9 11% | 14.6 -46% | 7.72 23% | 10.13 -1% |
| Greyscale dE 2000 * | 2.53 | 4.6 -82% | 9.1 -260% | 2.46 3% | 6.25 -147% |
| Gamma | 2.48 89% | 2.39 92% | 2.24 98% | 2.38 92% | 1.76 125% |
| CCT | 6667 97% | 7393 88% | 5020 129% | 6915 94% | 6873 95% |
| Color Space (Percent of AdobeRGB 1998) (%) | 54 | 59 9% | 45.7 -15% | 59 9% | 40 -26% |
| Color Space (Percent of sRGB) (%) | 83 | 92.3 11% | 72.1 -13% | 91 10% | 62 -25% |
| Media total (Programa/Opciones) | -1% /
-11% | -14% /
-33% | 4% /
8% | -9% /
-16% |
* ... más pequeño es mejor
Tiempos de respuesta del display
| ↔ Tiempo de respuesta de Negro a Blanco | ||
|---|---|---|
| 29.2 ms ... subida ↗ y bajada ↘ combinada | ↗ 16.8 ms subida | 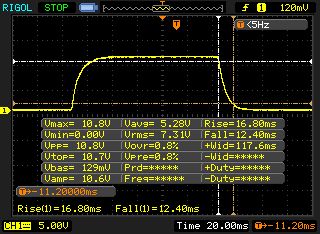 |
| ↘ 12.4 ms bajada | ||
| La pantalla mostró tiempos de respuesta relativamente lentos en nuestros tests pero podría ser demasiado lenta para los jugones. En comparación, todos los dispositivos de prueba van de ##min### (mínimo) a 240 (máximo) ms. » 78 % de todos los dispositivos son mejores. Eso quiere decir que el tiempo de respuesta es peor que la media (19.9 ms) de todos los dispositivos testados. | ||
| ↔ Tiempo de respuesta 50% Gris a 80% Gris | ||
| 40.8 ms ... subida ↗ y bajada ↘ combinada | ↗ 21.2 ms subida | 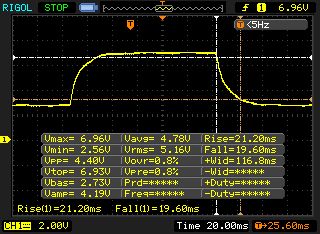 |
| ↘ 19.6 ms bajada | ||
| La pantalla mostró tiempos de respuesta lentos en nuestros tests y podría ser demasiado lenta para los jugones. En comparación, todos los dispositivos de prueba van de ##min### (mínimo) a 636 (máximo) ms. » 64 % de todos los dispositivos son mejores. Eso quiere decir que el tiempo de respuesta es peor que la media (31.1 ms) de todos los dispositivos testados. | ||
Parpadeo de Pantalla / PWM (Pulse-Width Modulation)
| Parpadeo de Pantalla / PWM detectado | 21370 Hz | ≤ 95 % de brillo | 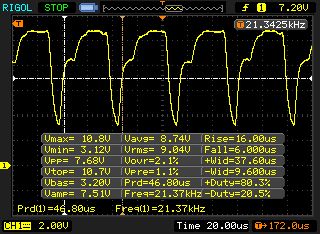 |
La retroiluminación del display parpadea a 21370 Hz (seguramente usa PWM - Pulse-Width Modulation) a un brillo del 95 % e inferior. Sobre este nivel de brillo no debería darse parpadeo / PWM. La frecuencia de 21370 Hz es bastante alta, por lo que la mayoría de gente sensible al parpadeo no debería ver parpadeo o tener fatiga visual. Comparación: 52 % de todos los dispositivos testados no usaron PWM para atenuar el display. Si se usó, medimos una media de 7798 (mínimo: 5 - máxmo: 343500) Hz. | |||
| Cinebench R11.5 | |
| CPU Single 64Bit | |
| HP Omen 15-ce002ng | |
| Guru Fire KS | |
| MSI GS63VR 7RF-228US | |
| Eurocom Q5 | |
| Acer Nitro 5 AN515-51-788E | |
| CPU Multi 64Bit | |
| MSI GS63VR 7RF-228US | |
| HP Omen 15-ce002ng | |
| Eurocom Q5 | |
| Guru Fire KS | |
| Acer Nitro 5 AN515-51-788E | |
| PCMark 8 | |
| Home Score Accelerated v2 | |
| HP Omen 15-ce002ng | |
| Acer Nitro 5 AN515-51-788E | |
| MSI GS63VR 7RF-228US | |
| Eurocom Q5 | |
| Guru Fire KS | |
| Work Score Accelerated v2 | |
| HP Omen 15-ce002ng | |
| MSI GS63VR 7RF-228US | |
| Guru Fire KS | |
| Acer Nitro 5 AN515-51-788E | |
| Eurocom Q5 | |
| PCMark 10 - Score | |
| Eurocom Q5 | |
| HP Omen 15-ce002ng | |
| Guru Fire KS | |
| Acer Nitro 5 AN515-51-788E | |
| PCMark 8 Home Score Accelerated v2 | 3812 puntos | |
| PCMark 8 Work Score Accelerated v2 | 5100 puntos | |
| PCMark 10 Score | 4646 puntos | |
ayuda | ||
| Guru Fire KS Samsung SSD 960 Evo 250GB m.2 NVMe | Eurocom Q5 Samsung SSD 960 Pro 512 GB m.2 | MSI GS63VR 7RF-228US Samsung SM961 MZVKW512HMJP m.2 PCI-e | HP Omen 15-ce002ng Samsung PM961 MZVLW256HEHP | Acer Nitro 5 AN515-51-788E Intel SSD 600p SSDPEKKW256G7 | |
|---|---|---|---|---|---|
| CrystalDiskMark 5.2 / 6 | 33% | -1% | |||
| Read Seq Q32T1 (MB/s) | 3071 | 3381 10% | 3431 12% | ||
| Write Seq Q32T1 (MB/s) | 1463 | 2075 42% | 1246 -15% | ||
| Read 4K Q32T1 (MB/s) | 594 | 575 -3% | 586 -1% | ||
| Write 4K Q32T1 (MB/s) | 493.3 | 498.7 1% | 486 -1% | ||
| Read Seq (MB/s) | 1250 | 2763 121% | 1419 14% | ||
| Write Seq (MB/s) | 1404 | 2073 48% | 1266 -10% | ||
| Read 4K (MB/s) | 45.66 | 57.2 25% | 47.14 3% | ||
| Write 4K (MB/s) | 172.5 | 202.6 17% | 156 -10% |

| 3DMark - 1920x1080 Fire Strike Graphics | |
| Eurocom Q5 | |
| Guru Fire KS | |
| MSI GS63VR 7RF-228US | |
| HP Omen 15-ce002ng | |
| Acer Nitro 5 AN515-51-788E | |
| Acer Nitro 5 AN515-51-788E | |
| 3DMark 11 - 1280x720 Performance GPU | |
| Eurocom Q5 | |
| MSI GS63VR 7RF-228US | |
| Guru Fire KS | |
| HP Omen 15-ce002ng | |
| Acer Nitro 5 AN515-51-788E | |
| Acer Nitro 5 AN515-51-788E | |
| 3DMark 11 Performance | 11559 puntos | |
| 3DMark Ice Storm Standard Score | 117404 puntos | |
| 3DMark Cloud Gate Standard Score | 24328 puntos | |
| 3DMark Fire Strike Score | 9663 puntos | |
ayuda | ||
| The Witcher 3 | |
| 1920x1080 Ultra Graphics & Postprocessing (HBAO+) | |
| Eurocom Q5 | |
| MSI GS63VR 7RF-228US | |
| Guru Fire KS | |
| HP Omen 15-ce002ng | |
| Acer Nitro 5 AN515-51-788E | |
| 1920x1080 High Graphics & Postprocessing (Nvidia HairWorks Off) | |
| MSI GS63VR 7RF-228US | |
| Guru Fire KS | |
| HP Omen 15-ce002ng | |
| Acer Nitro 5 AN515-51-788E | |
| bajo | medio | alto | ultra | |
|---|---|---|---|---|
| The Witcher 3 (2015) | 69.8 | 38.4 | ||
| Rocket League (2017) | 136 | |||
| Dirt 4 (2017) | 96.3 | 54.2 | ||
| Playerunknown's Battlegrounds (PUBG) (2017) | 64.1 | 47.7 | ||
| F1 2017 (2017) | 81 | 60 | ||
| Ark Survival Evolved (2017) | 35.4 | 24 | ||
| FIFA 18 (2017) | 167 | 164 |
Ruido
| Ocioso |
| 31 / 36 / 44 dB(A) |
| HDD |
| 31 dB(A) |
| Carga |
| 48 / 54 dB(A) |
 | ||
30 dB silencioso 40 dB(A) audible 50 dB(A) ruidosamente alto |
||
min: | ||
| Guru Fire KS GeForce GTX 1060 Mobile, i7-7700HQ | Eurocom Q5 GeForce GTX 1070 Max-Q, i7-7700HQ | MSI GS63VR 7RF-228US GeForce GTX 1060 Mobile, i7-7700HQ | HP Omen 15-ce002ng GeForce GTX 1060 Max-Q, i7-7700HQ | Acer Nitro 5 AN515-51-788E GeForce GTX 1050 Ti Mobile, i7-7700HQ | |
|---|---|---|---|---|---|
| Noise | 8% | 9% | 8% | 12% | |
| apagado / medio ambiente * (dB) | 29 | 29 -0% | 28.8 1% | 30 -3% | 30.6 -6% |
| Idle Minimum * (dB) | 31 | 31.5 -2% | 33.1 -7% | 30 3% | 30.6 1% |
| Idle Average * (dB) | 36 | 33.8 6% | 33.1 8% | 33 8% | 30.7 15% |
| Idle Maximum * (dB) | 44 | 33.8 23% | 34 23% | 37 16% | 30.7 30% |
| Load Average * (dB) | 48 | 41.7 13% | 37.2 22% | 41 15% | 43 10% |
| Witcher 3 ultra * (dB) | 48 | 41.7 13% | 46.1 4% | 42 12% | 39.7 17% |
| Load Maximum * (dB) | 54 | 54.2 -0% | 47.1 13% | 50 7% | 45.8 15% |
* ... más pequeño es mejor
(-) La temperatura máxima en la parte superior es de 52 °C / 126 F, frente a la media de 40.4 °C / 105 F, que oscila entre 21.2 y 68.8 °C para la clase Gaming.
(-) El fondo se calienta hasta un máximo de 54 °C / 129 F, frente a la media de 43.2 °C / 110 F
(+) En reposo, la temperatura media de la parte superior es de 26.1 °C / 79# F, frente a la media del dispositivo de 33.9 °C / 93 F.
(-) Jugando a The Witcher 3, la temperatura media de la parte superior es de 40.4 °C / 105 F, frente a la media del dispositivo de 33.9 °C / 93 F.
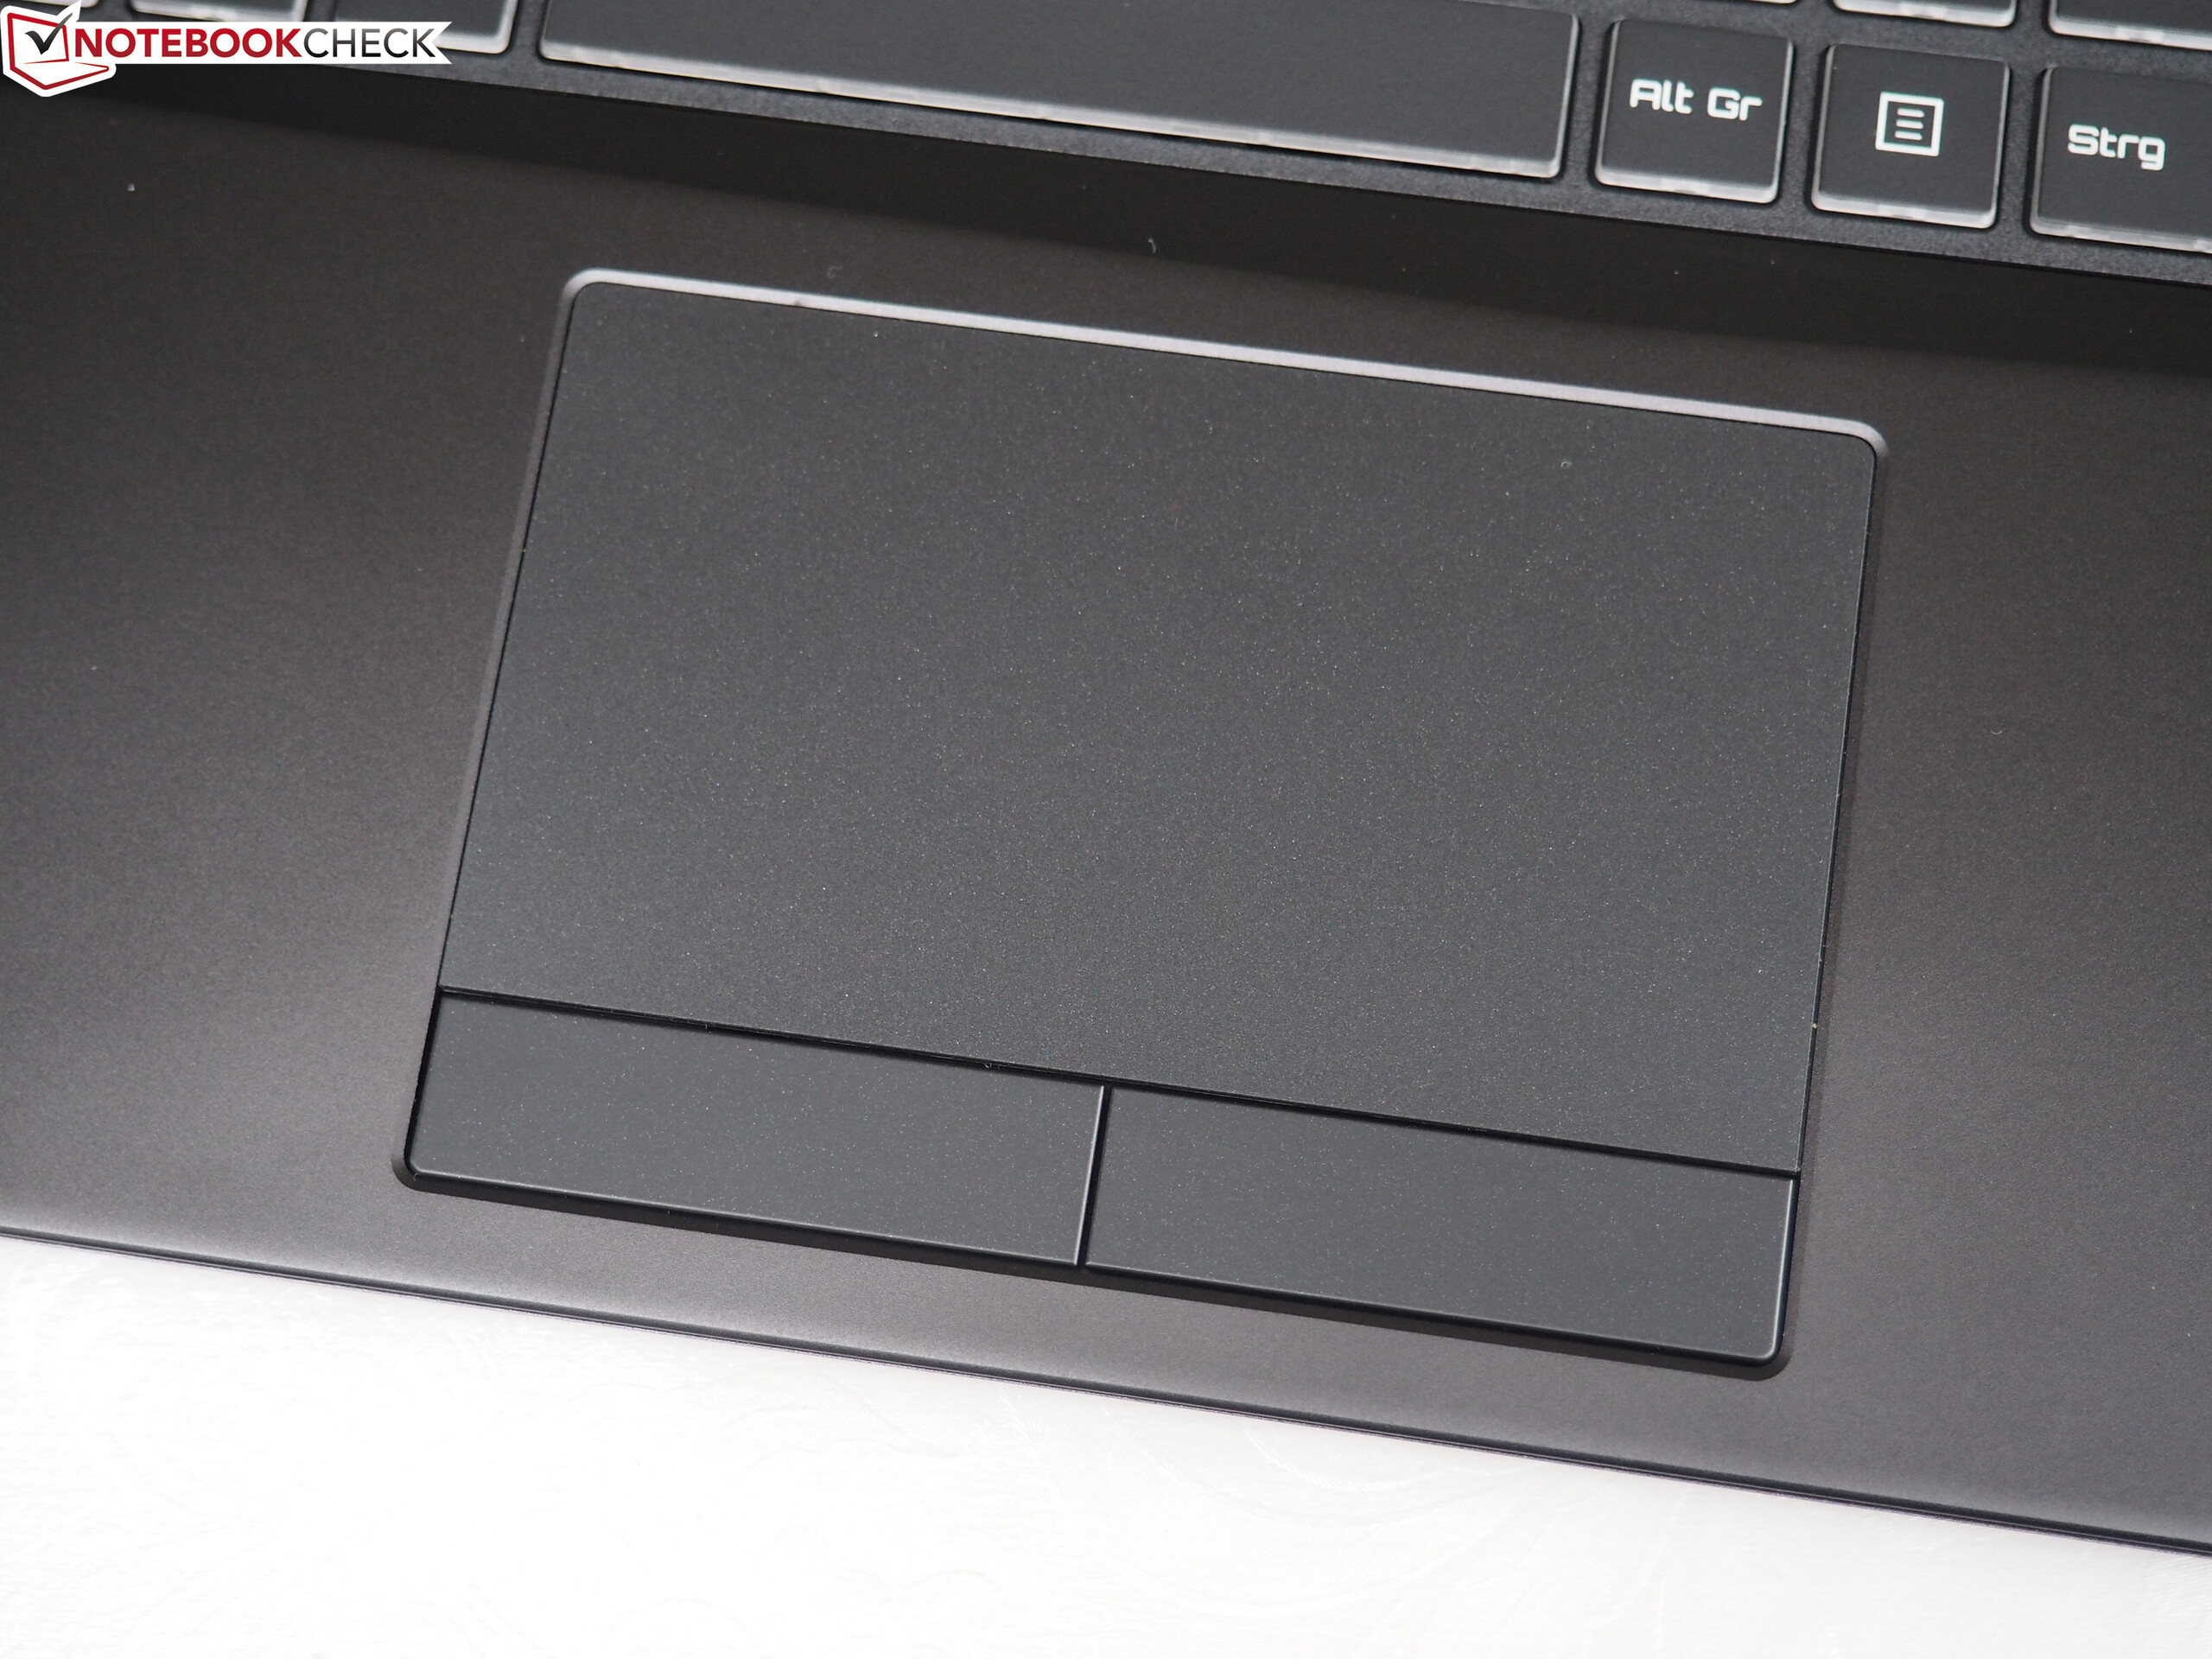
(±) El reposamanos y el touchpad pueden calentarse mucho al tacto con un máximo de 39 °C / 102.2 F.
(-) La temperatura media de la zona del reposamanos de dispositivos similares fue de 28.8 °C / 83.8 F (-10.2 °C / -18.4 F).
| Guru Fire KS GeForce GTX 1060 Mobile, i7-7700HQ | Eurocom Q5 GeForce GTX 1070 Max-Q, i7-7700HQ | MSI GS63VR 7RF-228US GeForce GTX 1060 Mobile, i7-7700HQ | HP Omen 15-ce002ng GeForce GTX 1060 Max-Q, i7-7700HQ | Acer Nitro 5 AN515-51-788E GeForce GTX 1050 Ti Mobile, i7-7700HQ | |
|---|---|---|---|---|---|
| Heat | -3% | 5% | -10% | 16% | |
| Maximum Upper Side * (°C) | 52 | 56.2 -8% | 47 10% | 41.1 21% | |
| Maximum Bottom * (°C) | 54 | 61.2 -13% | 54 -0% | 38.8 28% | |
| Idle Upper Side * (°C) | 28 | 27.8 1% | 28.4 -1% | 36 -29% | 28.7 -2% |
| Idle Bottom * (°C) | 33 | 29.6 10% | 29.6 10% | 40 -21% | 26.9 18% |
* ... más pequeño es mejor
Guru Fire KS análisis de audio
(+) | los altavoces pueden reproducir a un volumen relativamente alto (#84 dB)
Graves 100 - 315 Hz
(-) | casi sin bajos - de media 24.4% inferior a la mediana
(±) | la linealidad de los graves es media (14.4% delta a frecuencia anterior)
Medios 400 - 2000 Hz
(+) | medios equilibrados - a sólo 3.5% de la mediana
(+) | los medios son lineales (4.6% delta a la frecuencia anterior)
Altos 2 - 16 kHz
(+) | máximos equilibrados - a sólo 1.2% de la mediana
(+) | los máximos son lineales (3.8% delta a la frecuencia anterior)
Total 100 - 16.000 Hz
(±) | la linealidad del sonido global es media (17.2% de diferencia con la mediana)
En comparación con la misma clase
» 46% de todos los dispositivos probados de esta clase eran mejores, 11% similares, 42% peores
» El mejor tuvo un delta de 6%, la media fue 18%, el peor fue ###max##%
En comparación con todos los dispositivos probados
» 32% de todos los dispositivos probados eran mejores, 8% similares, 60% peores
» El mejor tuvo un delta de 4%, la media fue 24%, el peor fue ###max##%
MSI GS63VR 7RF-228US análisis de audio
(±) | la sonoridad del altavoz es media pero buena (75 dB)
Graves 100 - 315 Hz
(-) | casi sin bajos - de media 25.3% inferior a la mediana
(±) | la linealidad de los graves es media (12.4% delta a frecuencia anterior)
Medios 400 - 2000 Hz
(+) | medios equilibrados - a sólo 3.3% de la mediana
(±) | la linealidad de los medios es media (7% delta respecto a la frecuencia anterior)
Altos 2 - 16 kHz
(±) | máximos más altos - de media 8.1% más altos que la mediana
(±) | la linealidad de los máximos es media (8.6% delta a frecuencia anterior)
Total 100 - 16.000 Hz
(±) | la linealidad del sonido global es media (28.4% de diferencia con la mediana)
En comparación con la misma clase
» 94% de todos los dispositivos probados de esta clase eran mejores, 1% similares, 5% peores
» El mejor tuvo un delta de 6%, la media fue 18%, el peor fue ###max##%
En comparación con todos los dispositivos probados
» 86% de todos los dispositivos probados eran mejores, 3% similares, 12% peores
» El mejor tuvo un delta de 4%, la media fue 24%, el peor fue ###max##%
| Off / Standby | |
| Ocioso | |
| Carga |
|
Clave:
min: | |
| Guru Fire KS GeForce GTX 1060 Mobile, i7-7700HQ | Eurocom Q5 GeForce GTX 1070 Max-Q, i7-7700HQ | MSI GS63VR 7RF-228US GeForce GTX 1060 Mobile, i7-7700HQ | HP Omen 15-ce002ng GeForce GTX 1060 Max-Q, i7-7700HQ | Acer Nitro 5 AN515-51-788E GeForce GTX 1050 Ti Mobile, i7-7700HQ | |
|---|---|---|---|---|---|
| Power Consumption | -13% | -45% | -60% | 22% | |
| Idle Minimum * (Watt) | 6 | 9 -50% | 14.5 -142% | 18 -200% | 4.1 32% |
| Idle Average * (Watt) | 11 | 13.5 -23% | 17.3 -57% | 23 -109% | 6.9 37% |
| Idle Maximum * (Watt) | 20 | 13.7 31% | 17.4 13% | 30 -50% | 9.5 52% |
| Load Average * (Watt) | 79 | 87.8 -11% | 93 -18% | 85 -8% | 83 -5% |
| Witcher 3 ultra * (Watt) | 107 | 129 -21% | 128.8 -20% | 96 10% | 108 -1% |
| Load Maximum * (Watt) | 153 | 158.6 -4% | 158 -3% | 126 18% |
* ... más pequeño es mejor
| Guru Fire KS GeForce GTX 1060 Mobile, i7-7700HQ, 55 Wh | Eurocom Q5 GeForce GTX 1070 Max-Q, i7-7700HQ, 55 Wh | MSI GS63VR 7RF-228US GeForce GTX 1060 Mobile, i7-7700HQ, 65 Wh | HP Omen 15-ce002ng GeForce GTX 1060 Max-Q, i7-7700HQ, 70 Wh | Acer Nitro 5 AN515-51-788E GeForce GTX 1050 Ti Mobile, i7-7700HQ, 48 Wh | |
|---|---|---|---|---|---|
| Duración de Batería | -36% | -34% | -41% | 5% | |
| Reader / Idle (h) | 10 | 7.8 -22% | 6.4 -36% | 4.3 -57% | 14.9 49% |
| H.264 (h) | 5.4 | 3.7 -31% | 5.2 -4% | ||
| WiFi v1.3 (h) | 5.7 | 4.3 -25% | 3.9 -32% | 3.3 -42% | 6.7 18% |
| Load (h) | 2 | 0.8 -60% | 1.3 -35% | 1.3 -35% | 1.1 -45% |
Pro
Contra
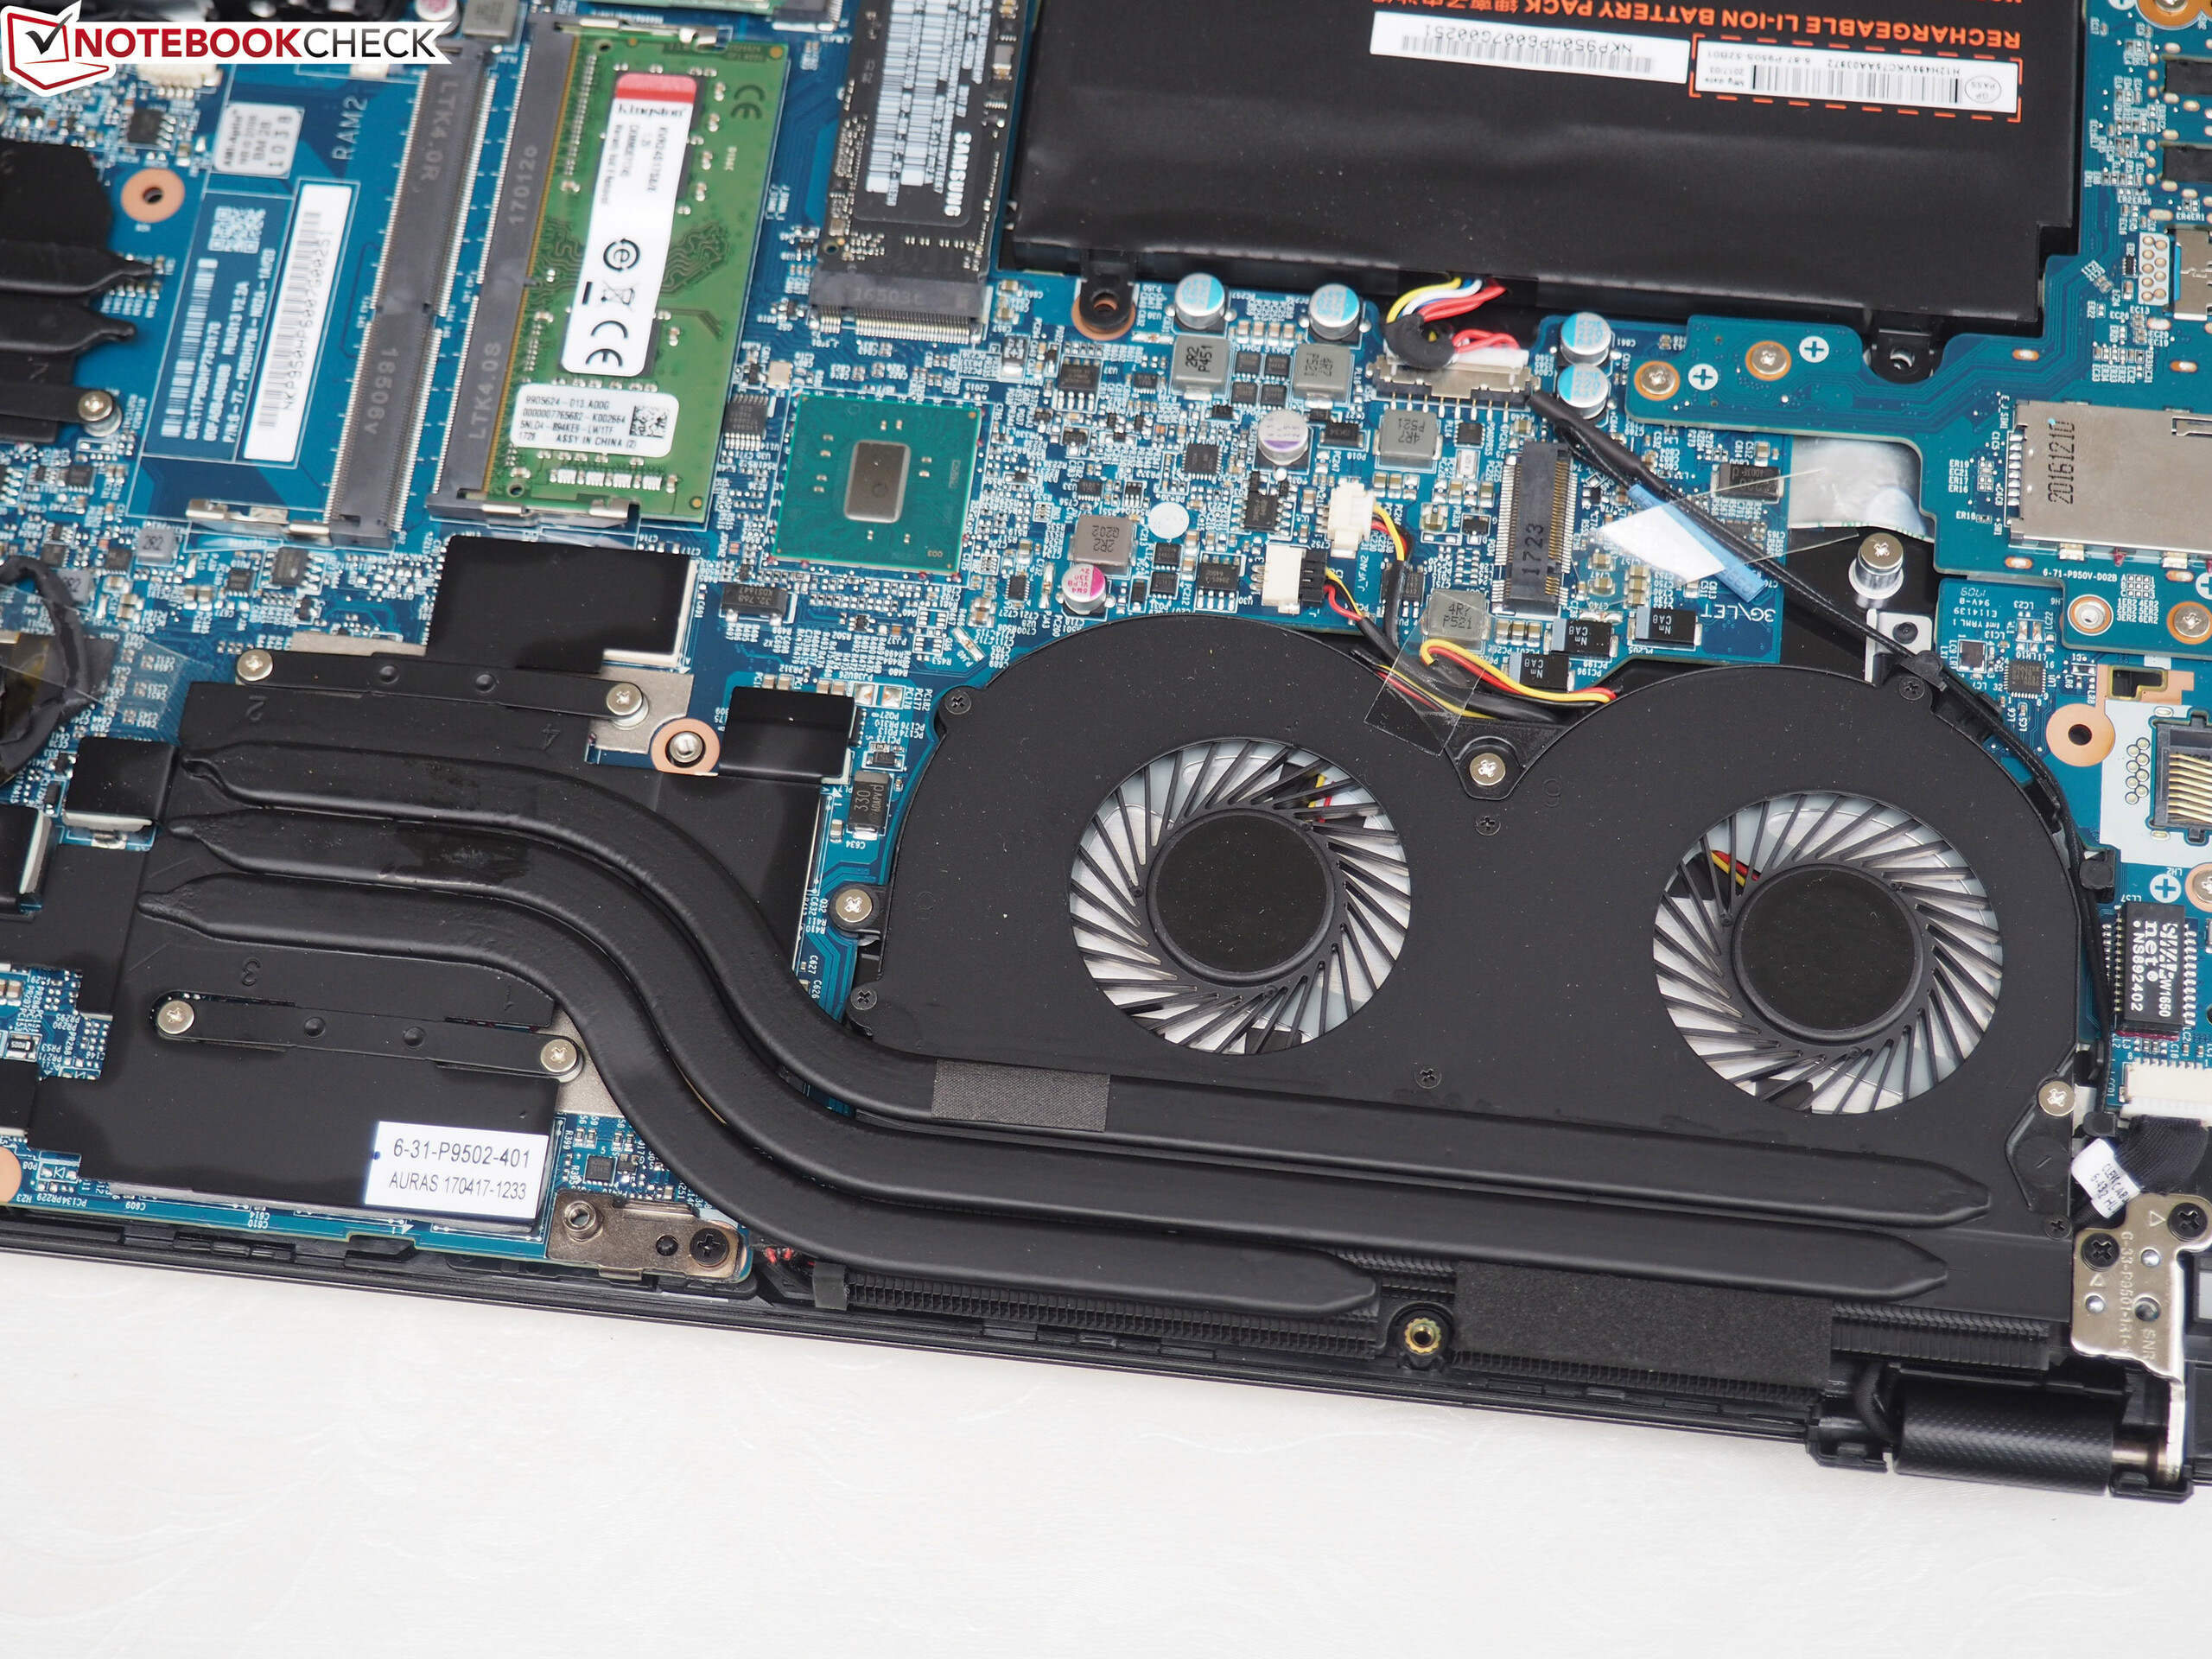
El Guru Fire KS es un portátil gaming bien hecho que tiene algunas dificultades con el funcionamiento de su ventilador.
Ser bastante ruidoso mientras usa el 3D es una cosa. El continuo cambio de rpm al ralentí y el alto nivel de ruido regular son otros y se vuelven bastante molesto después de un tiempo.
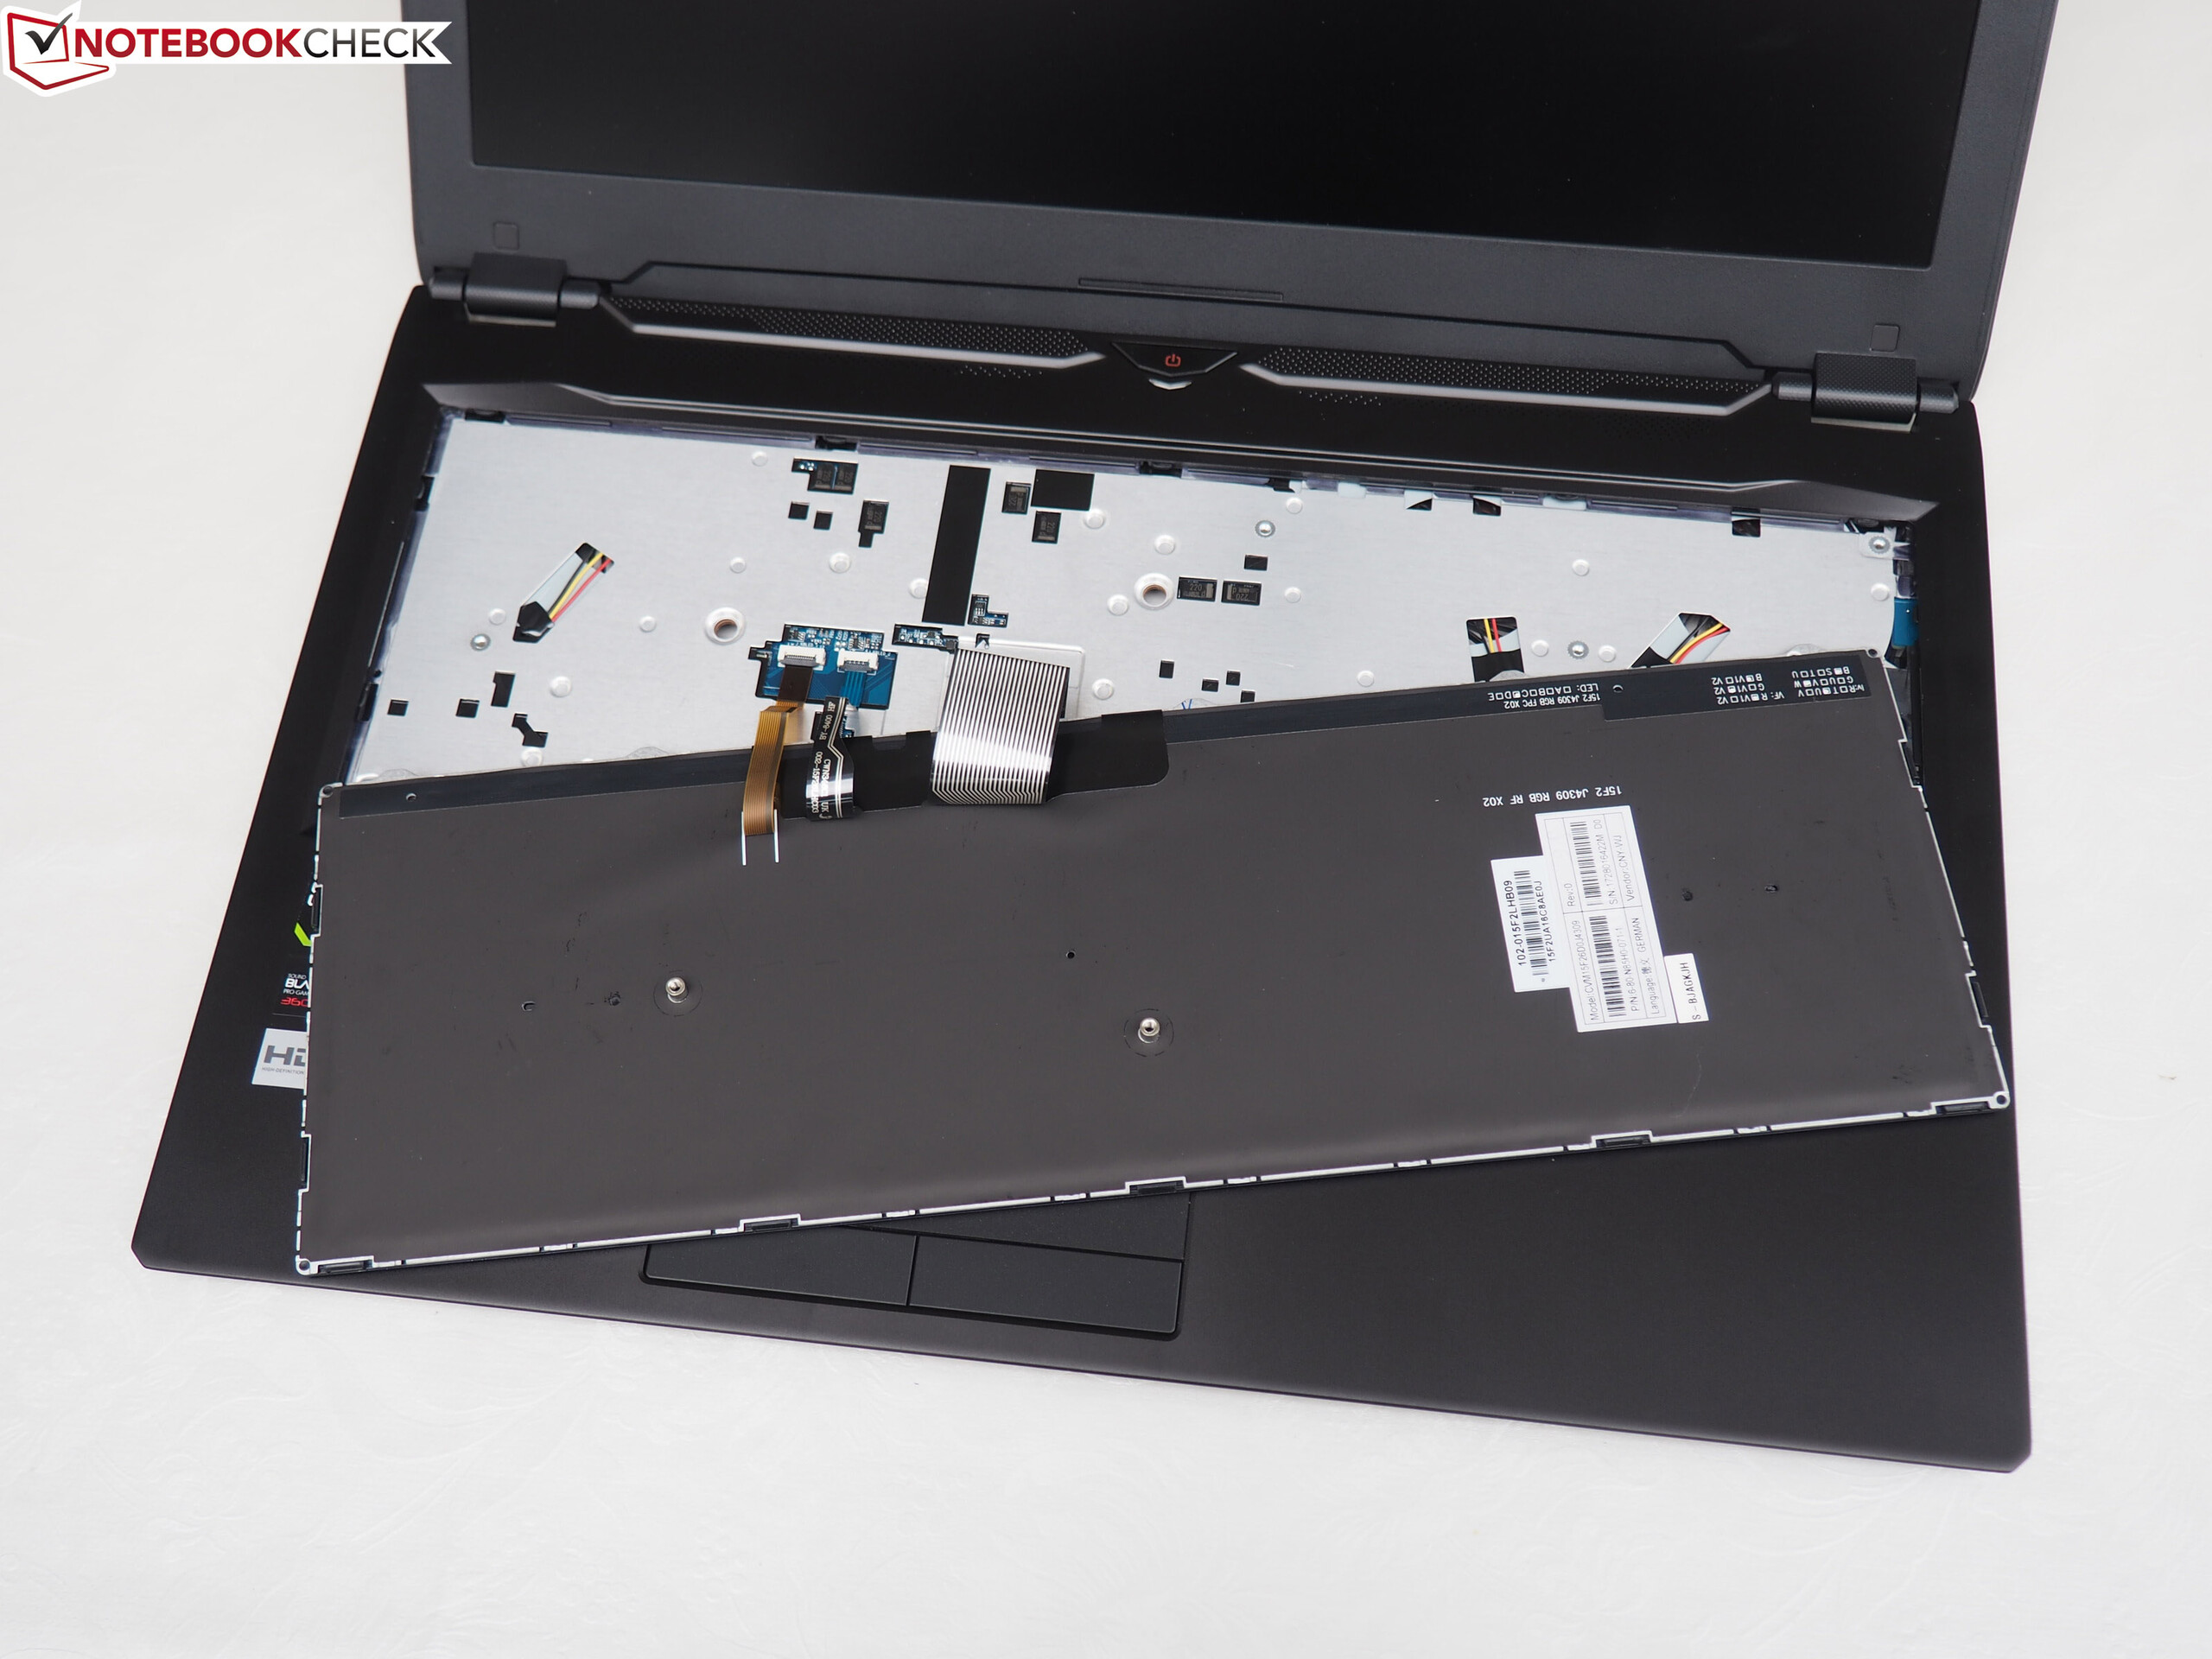
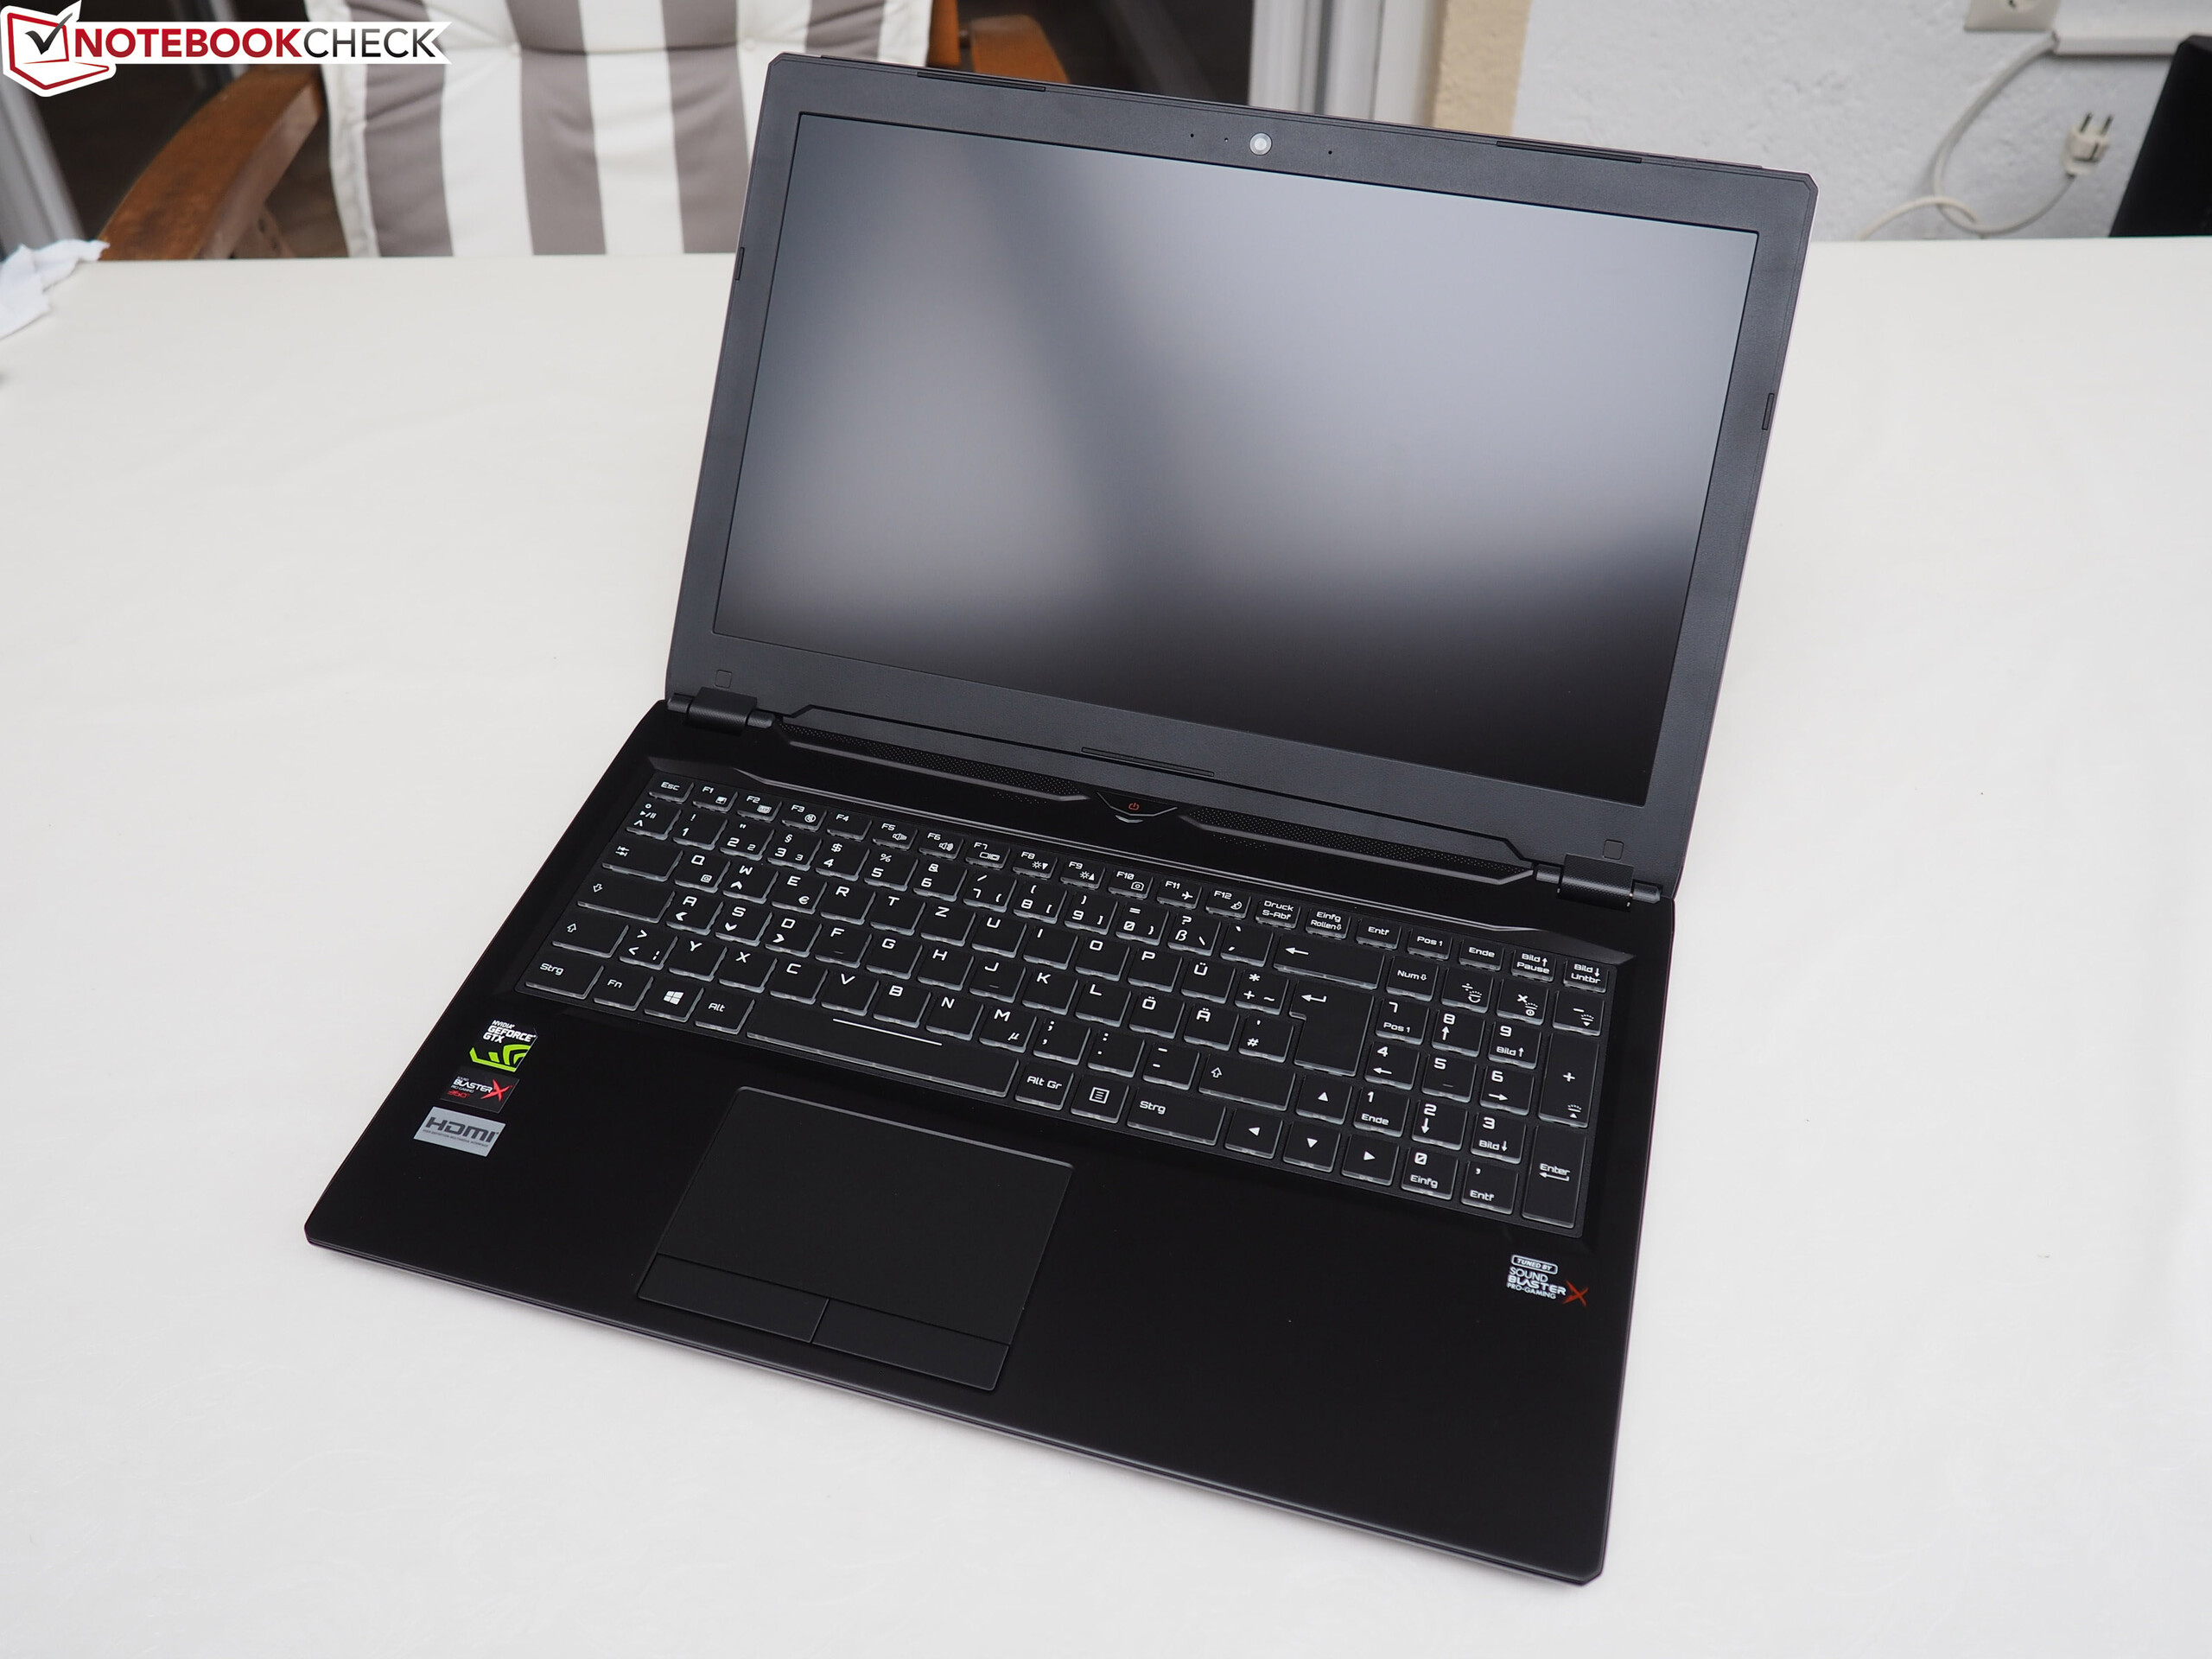
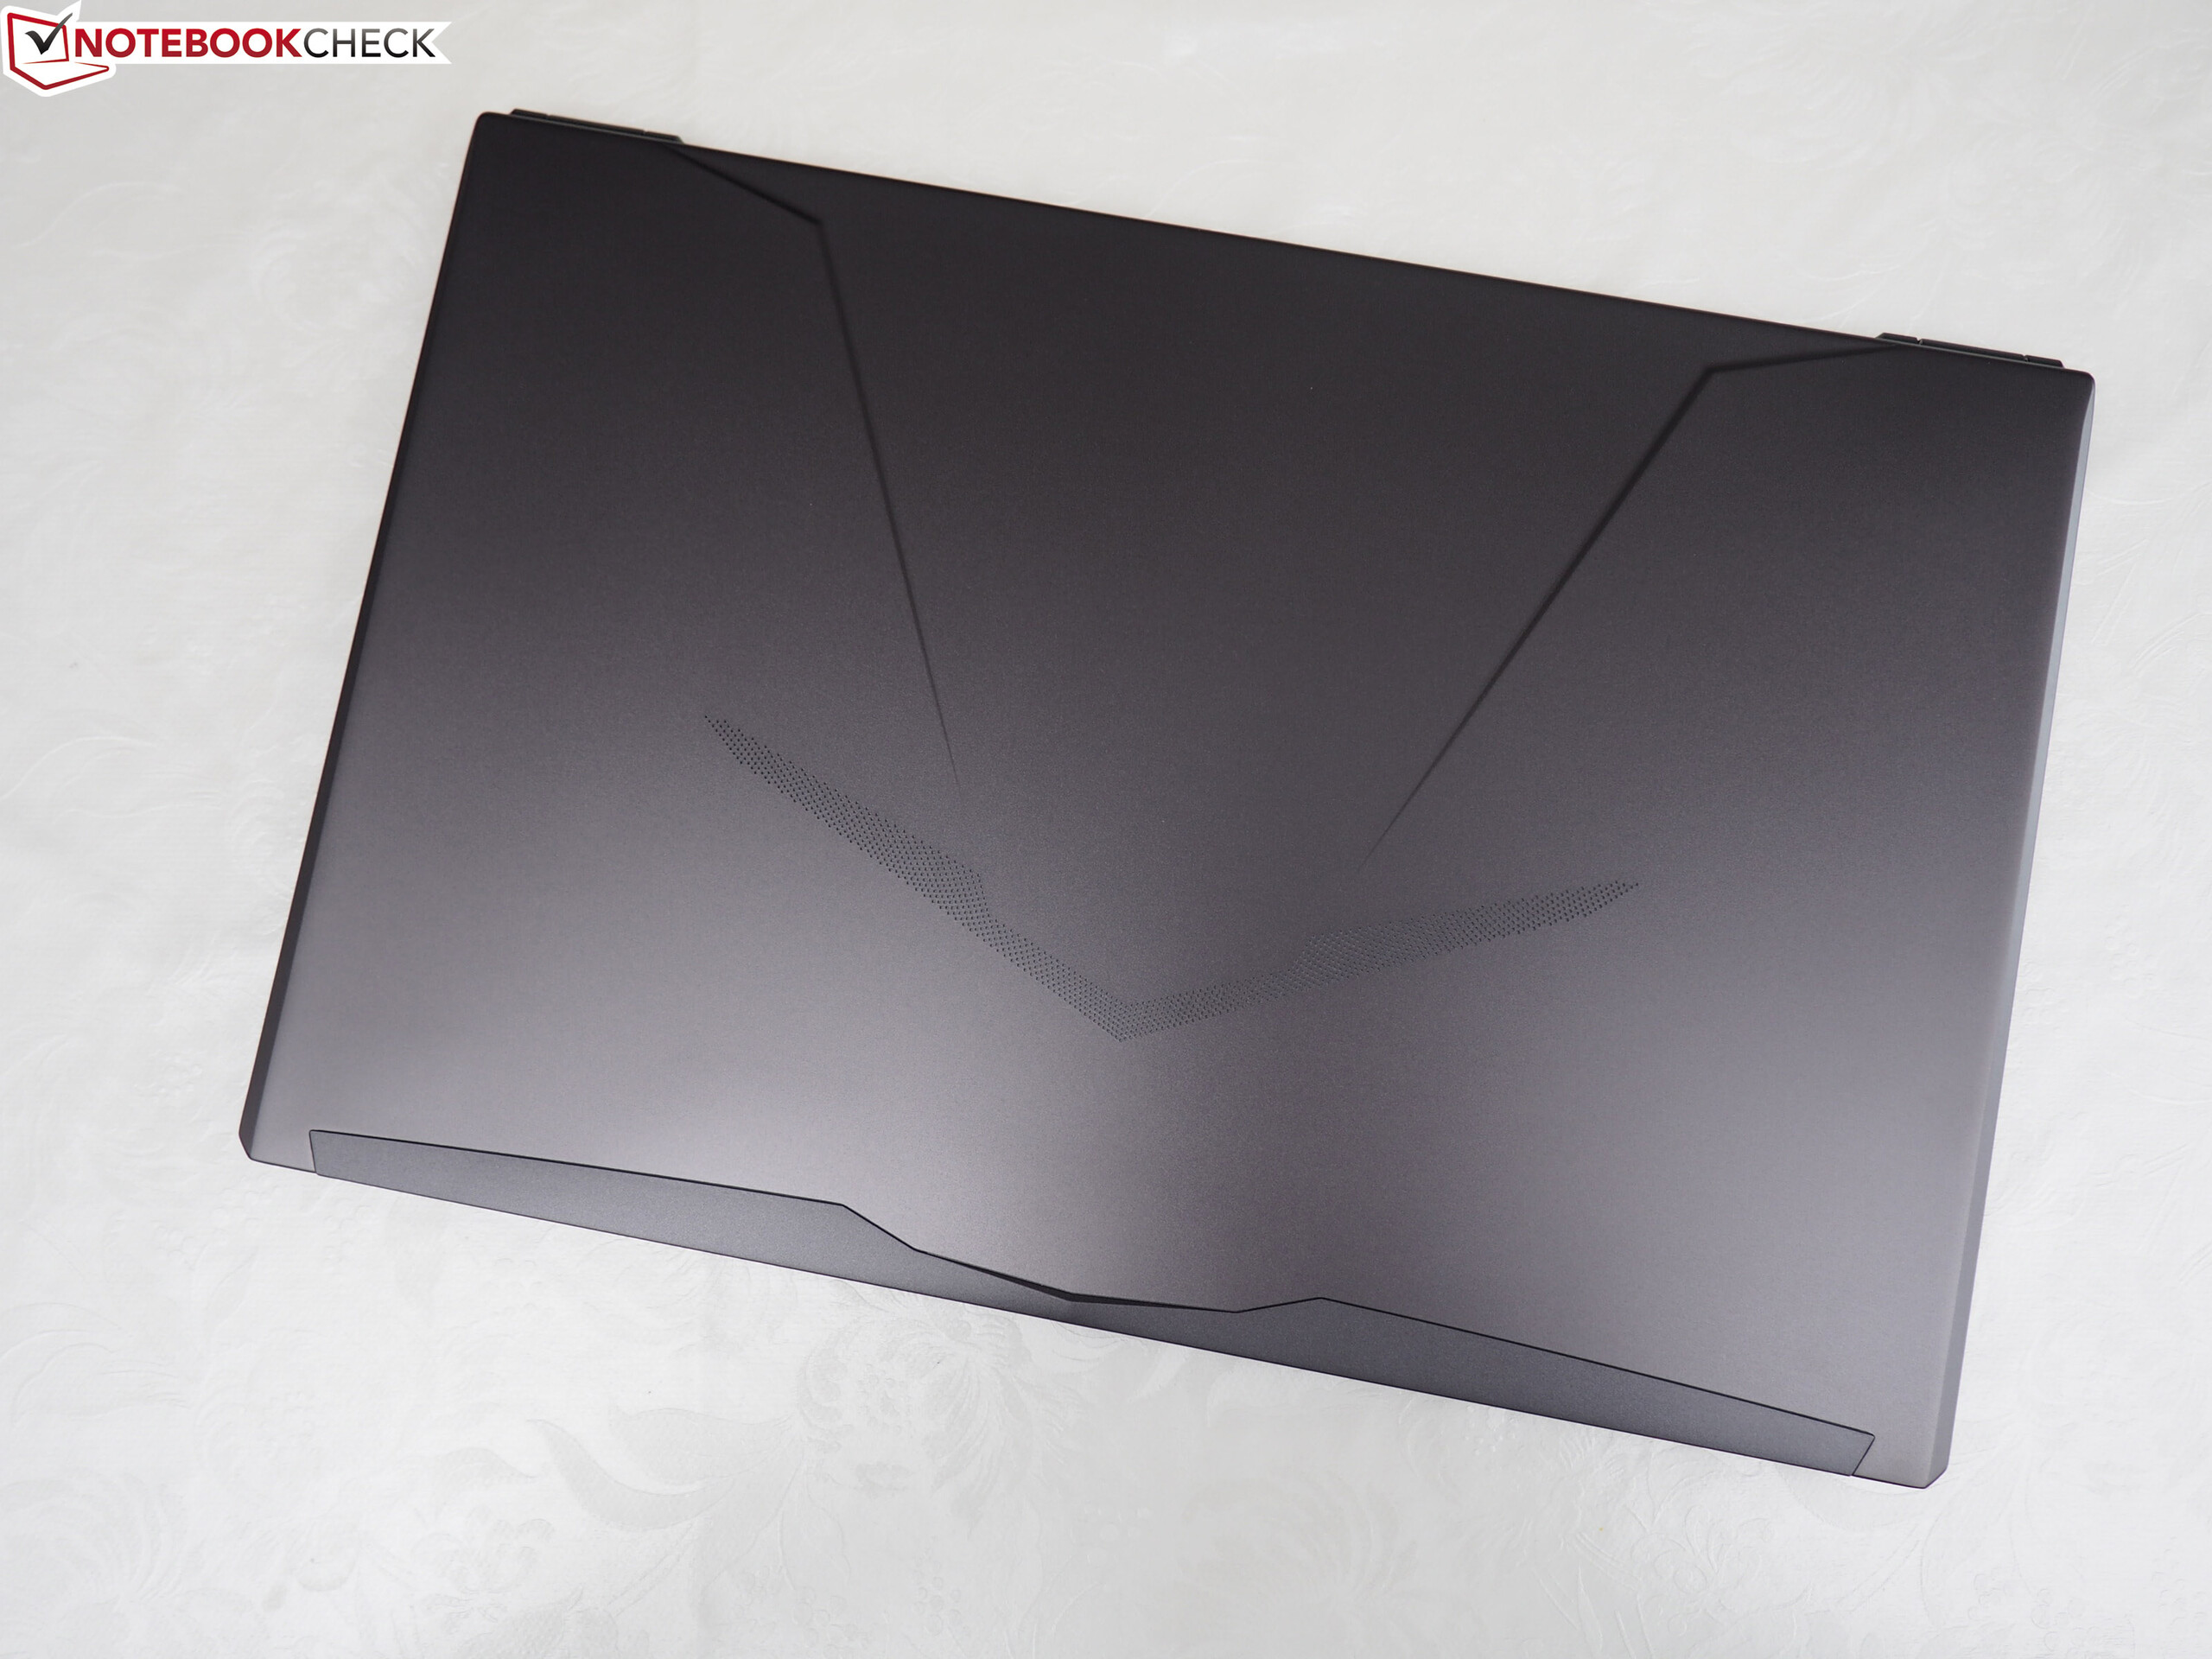
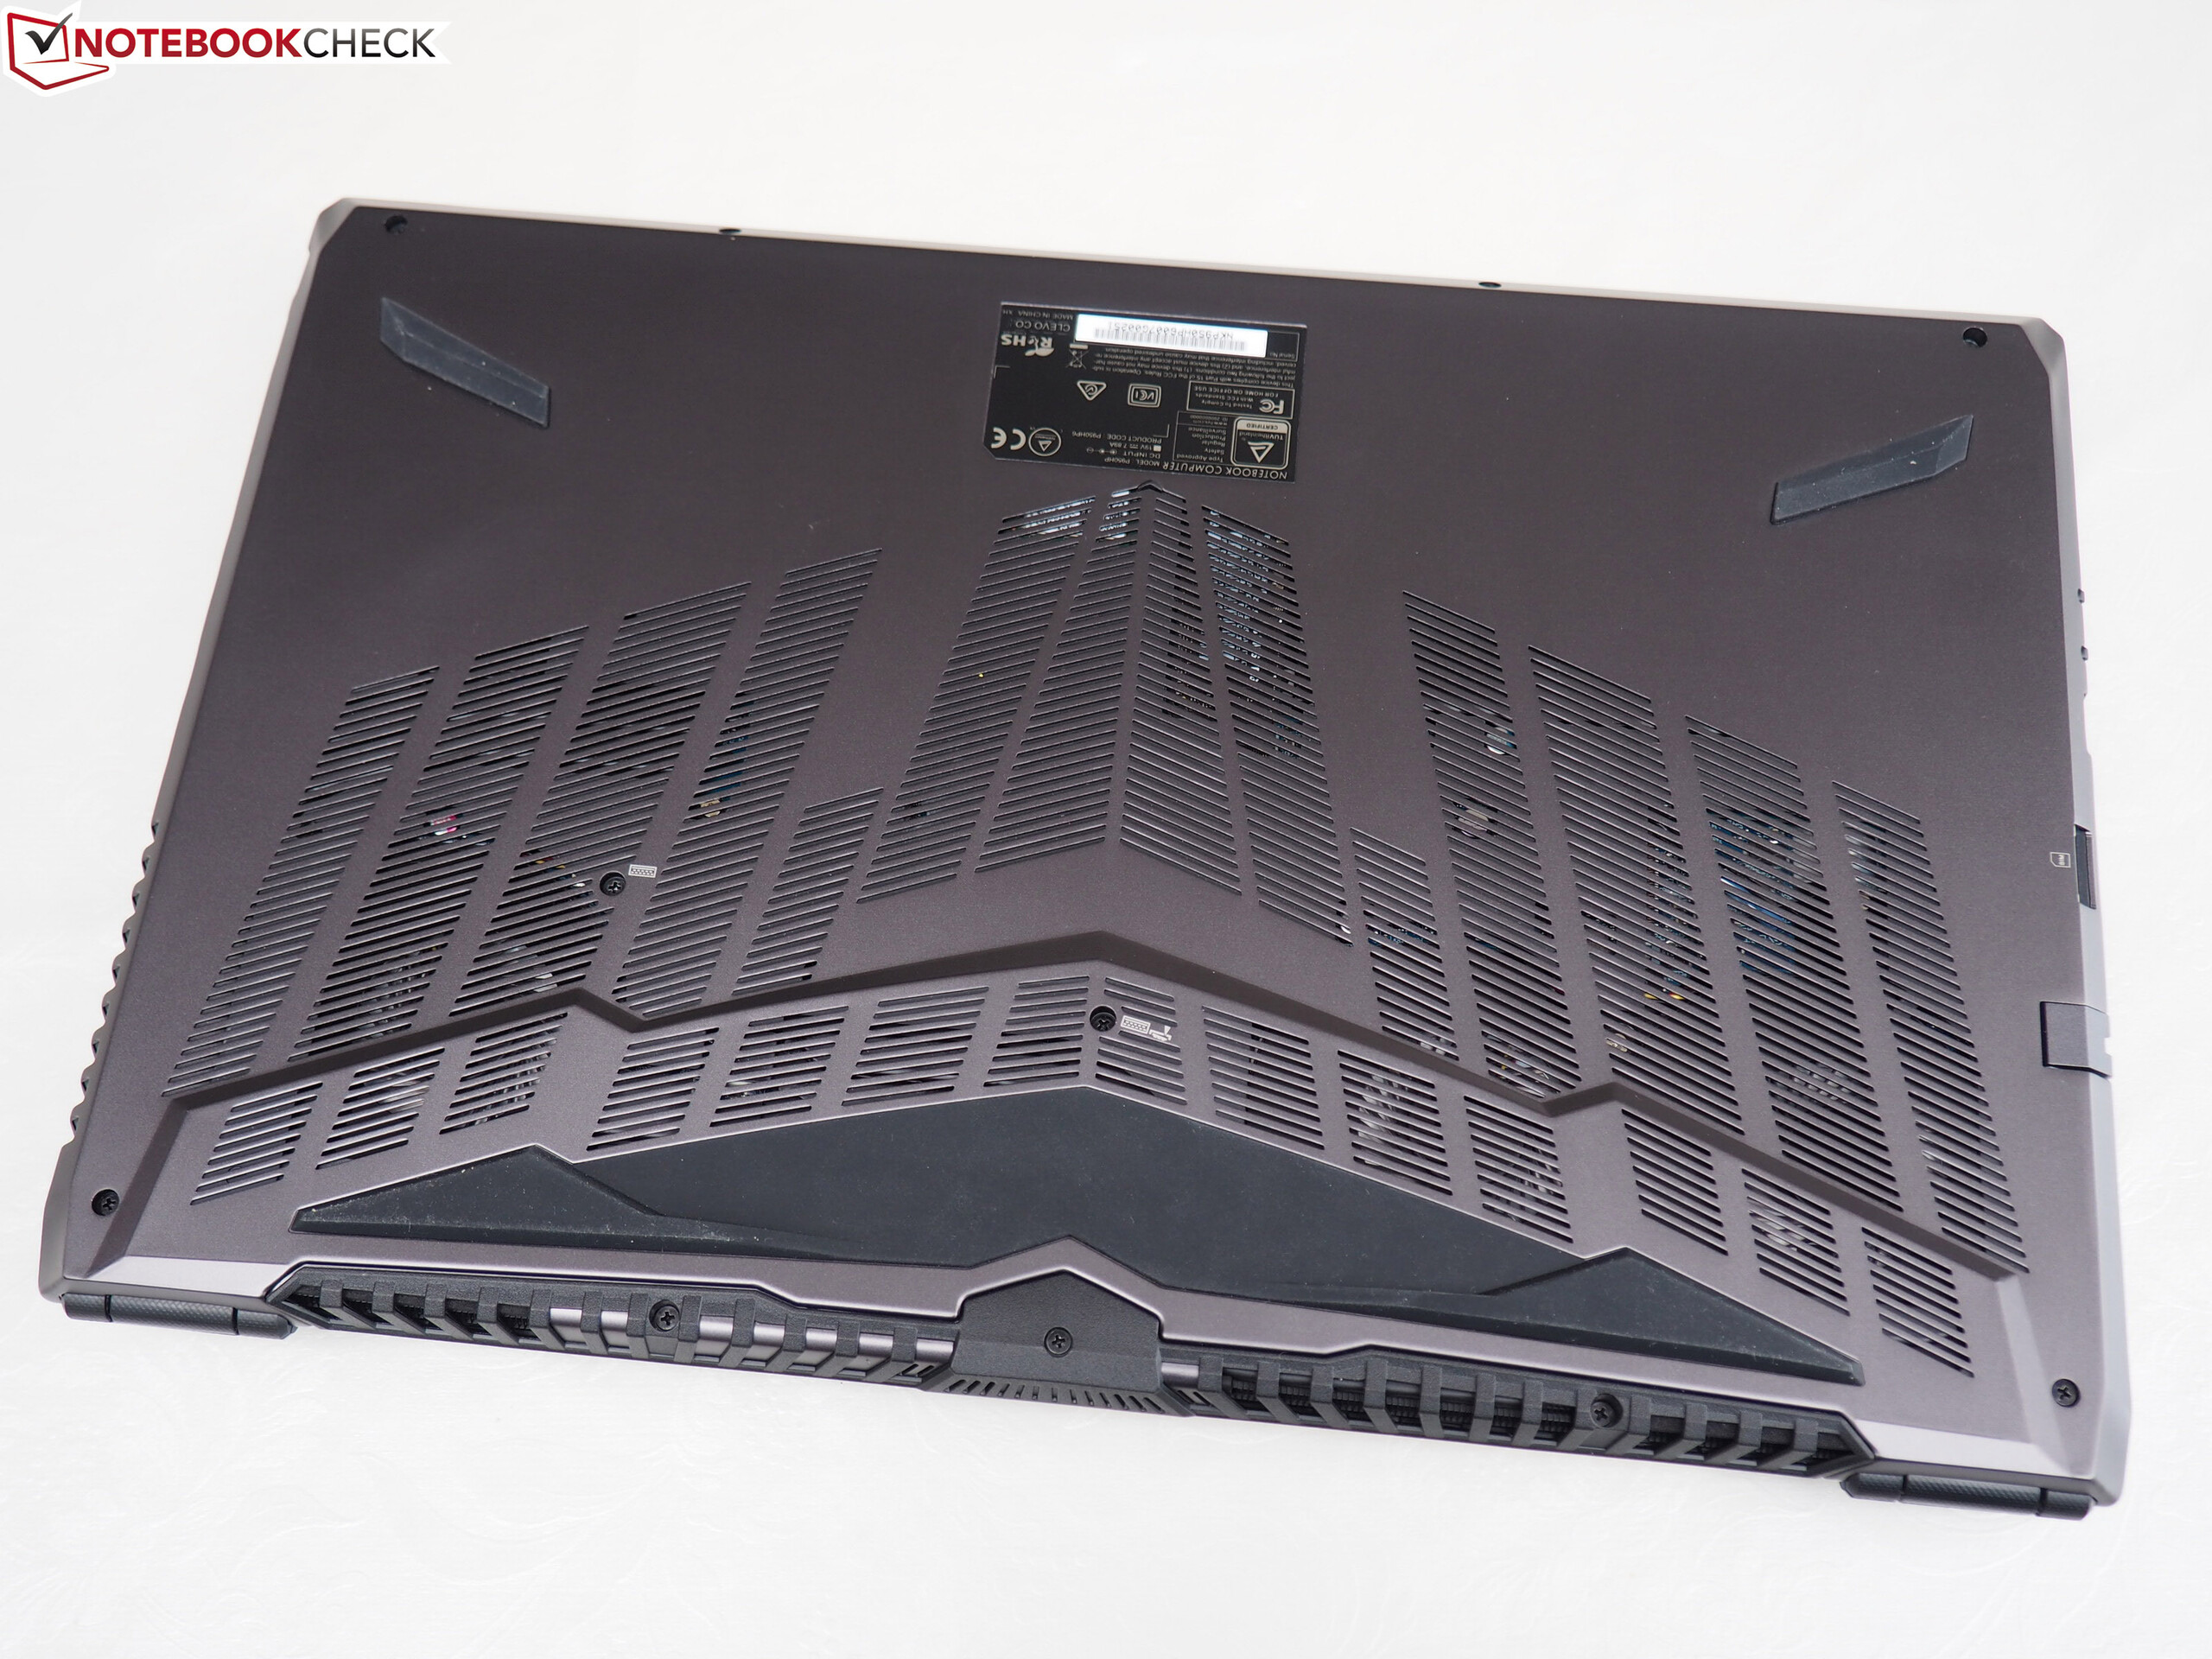
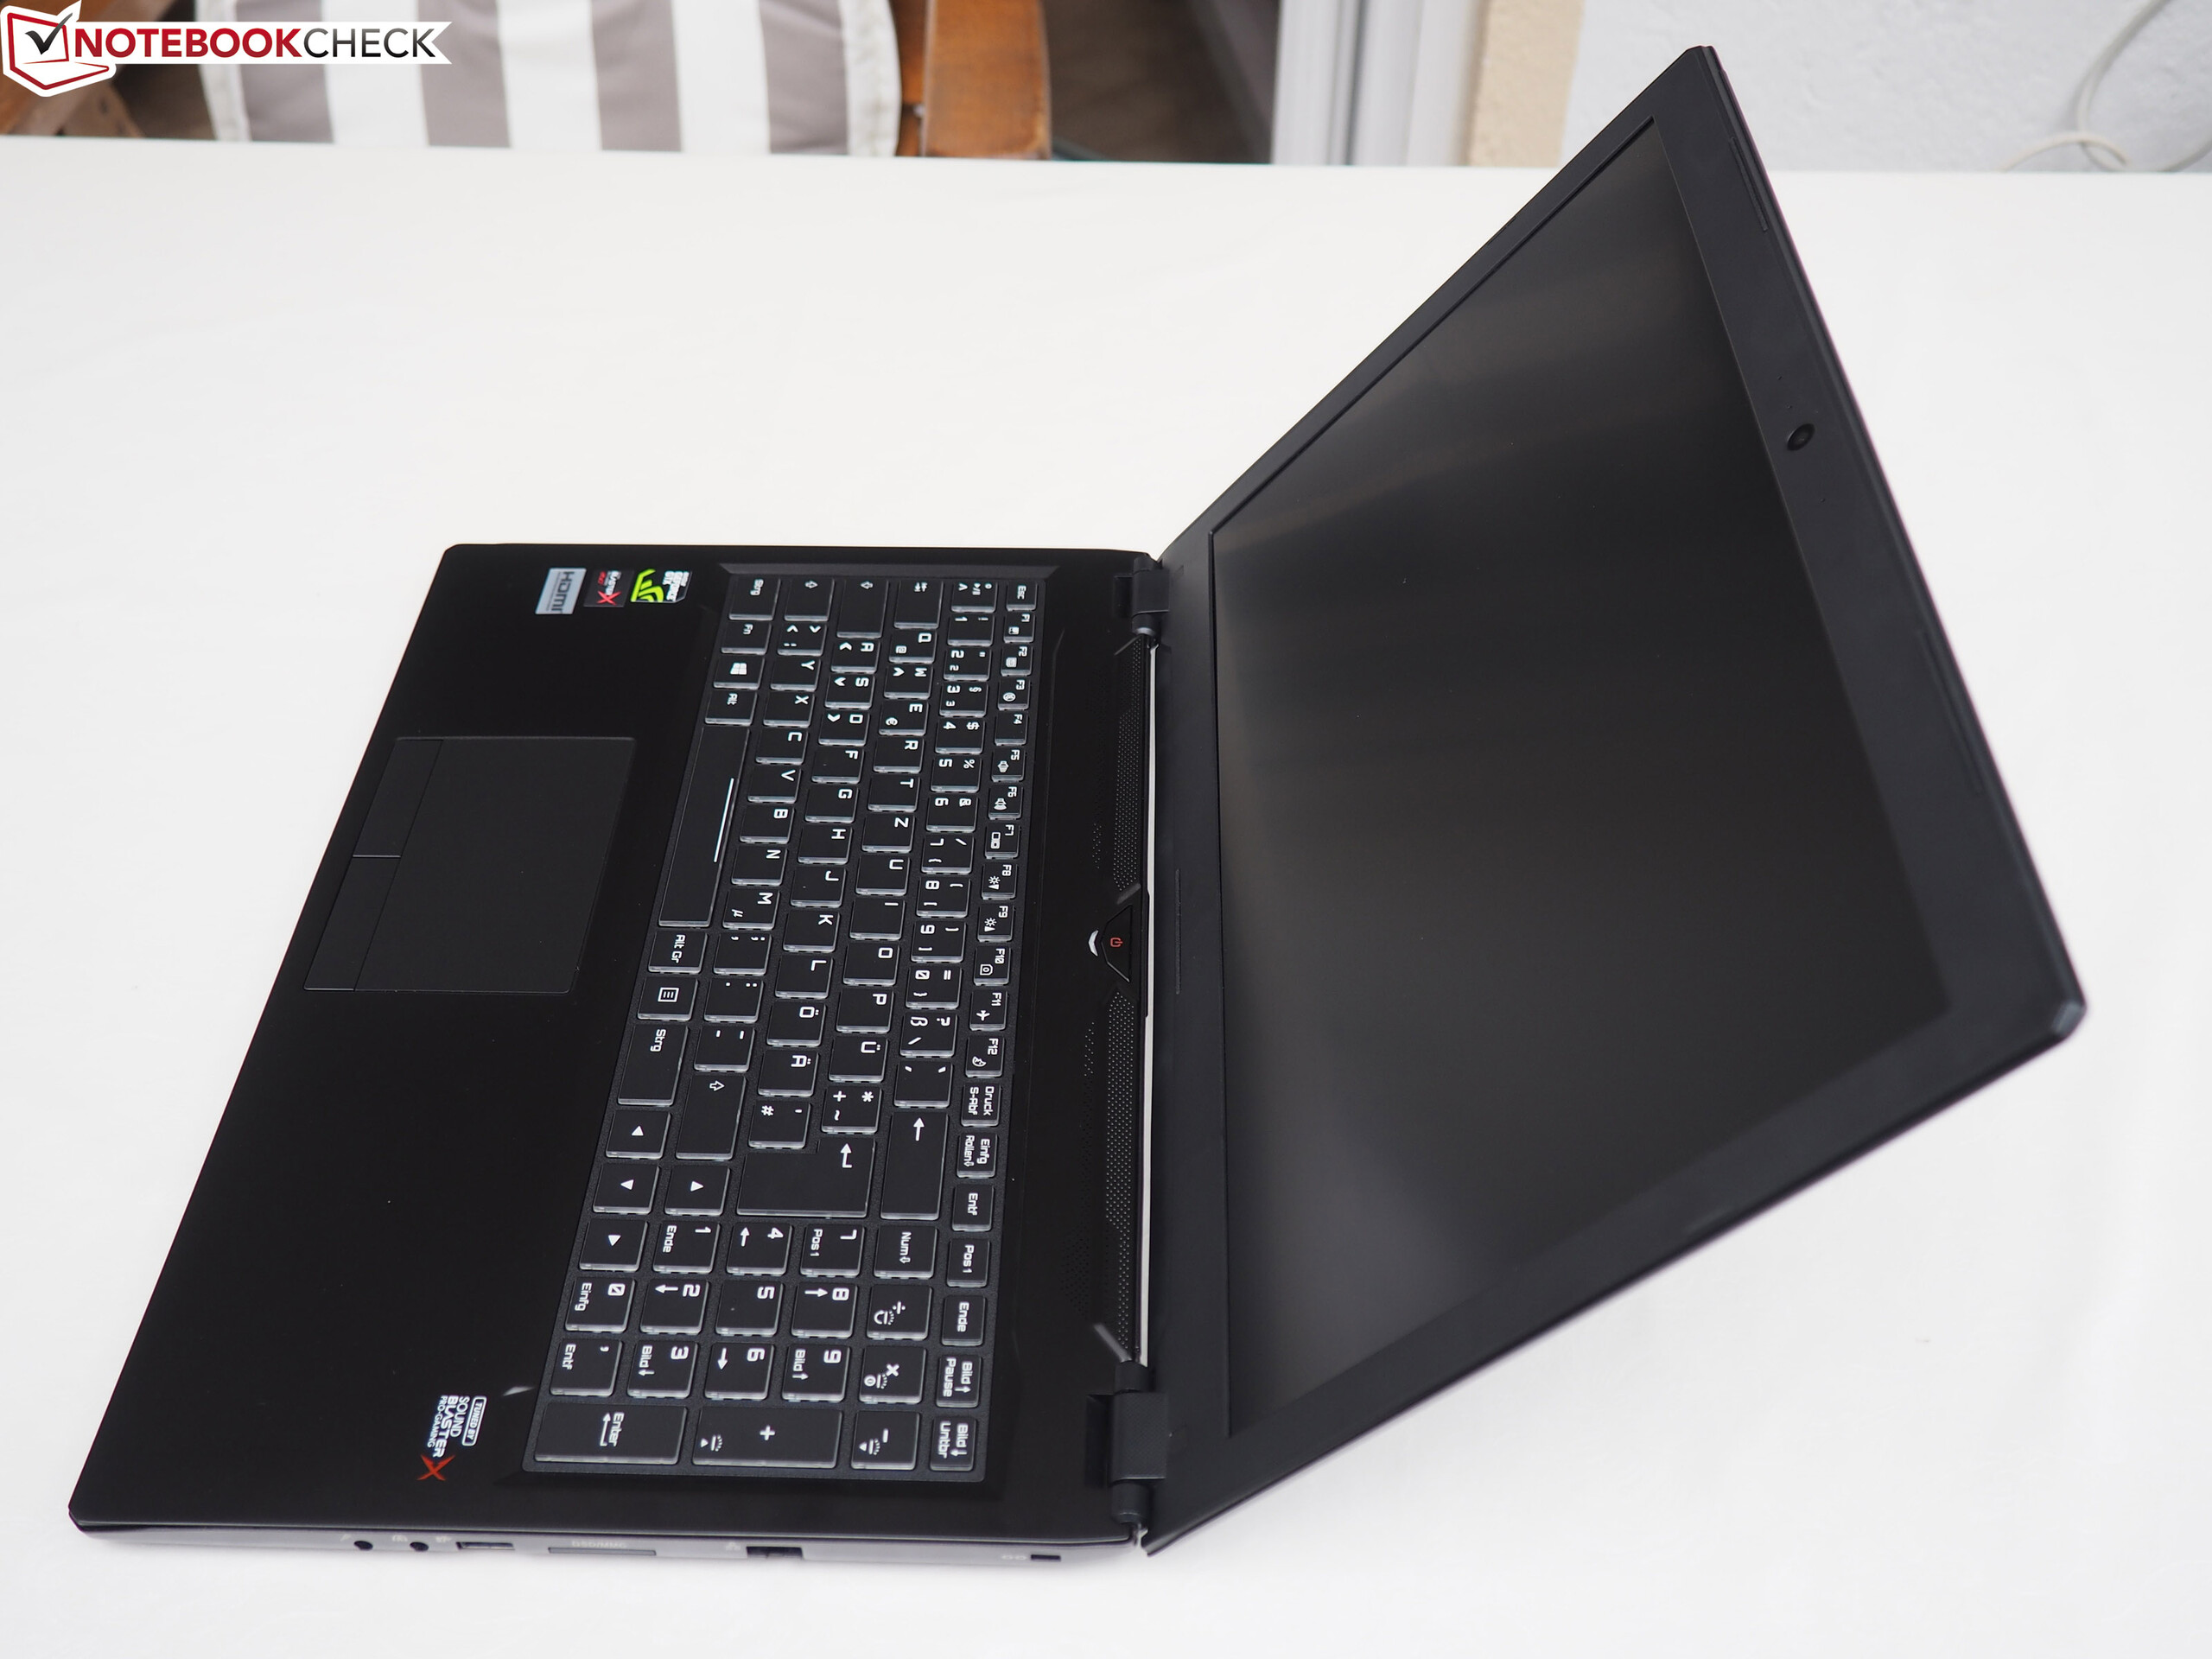
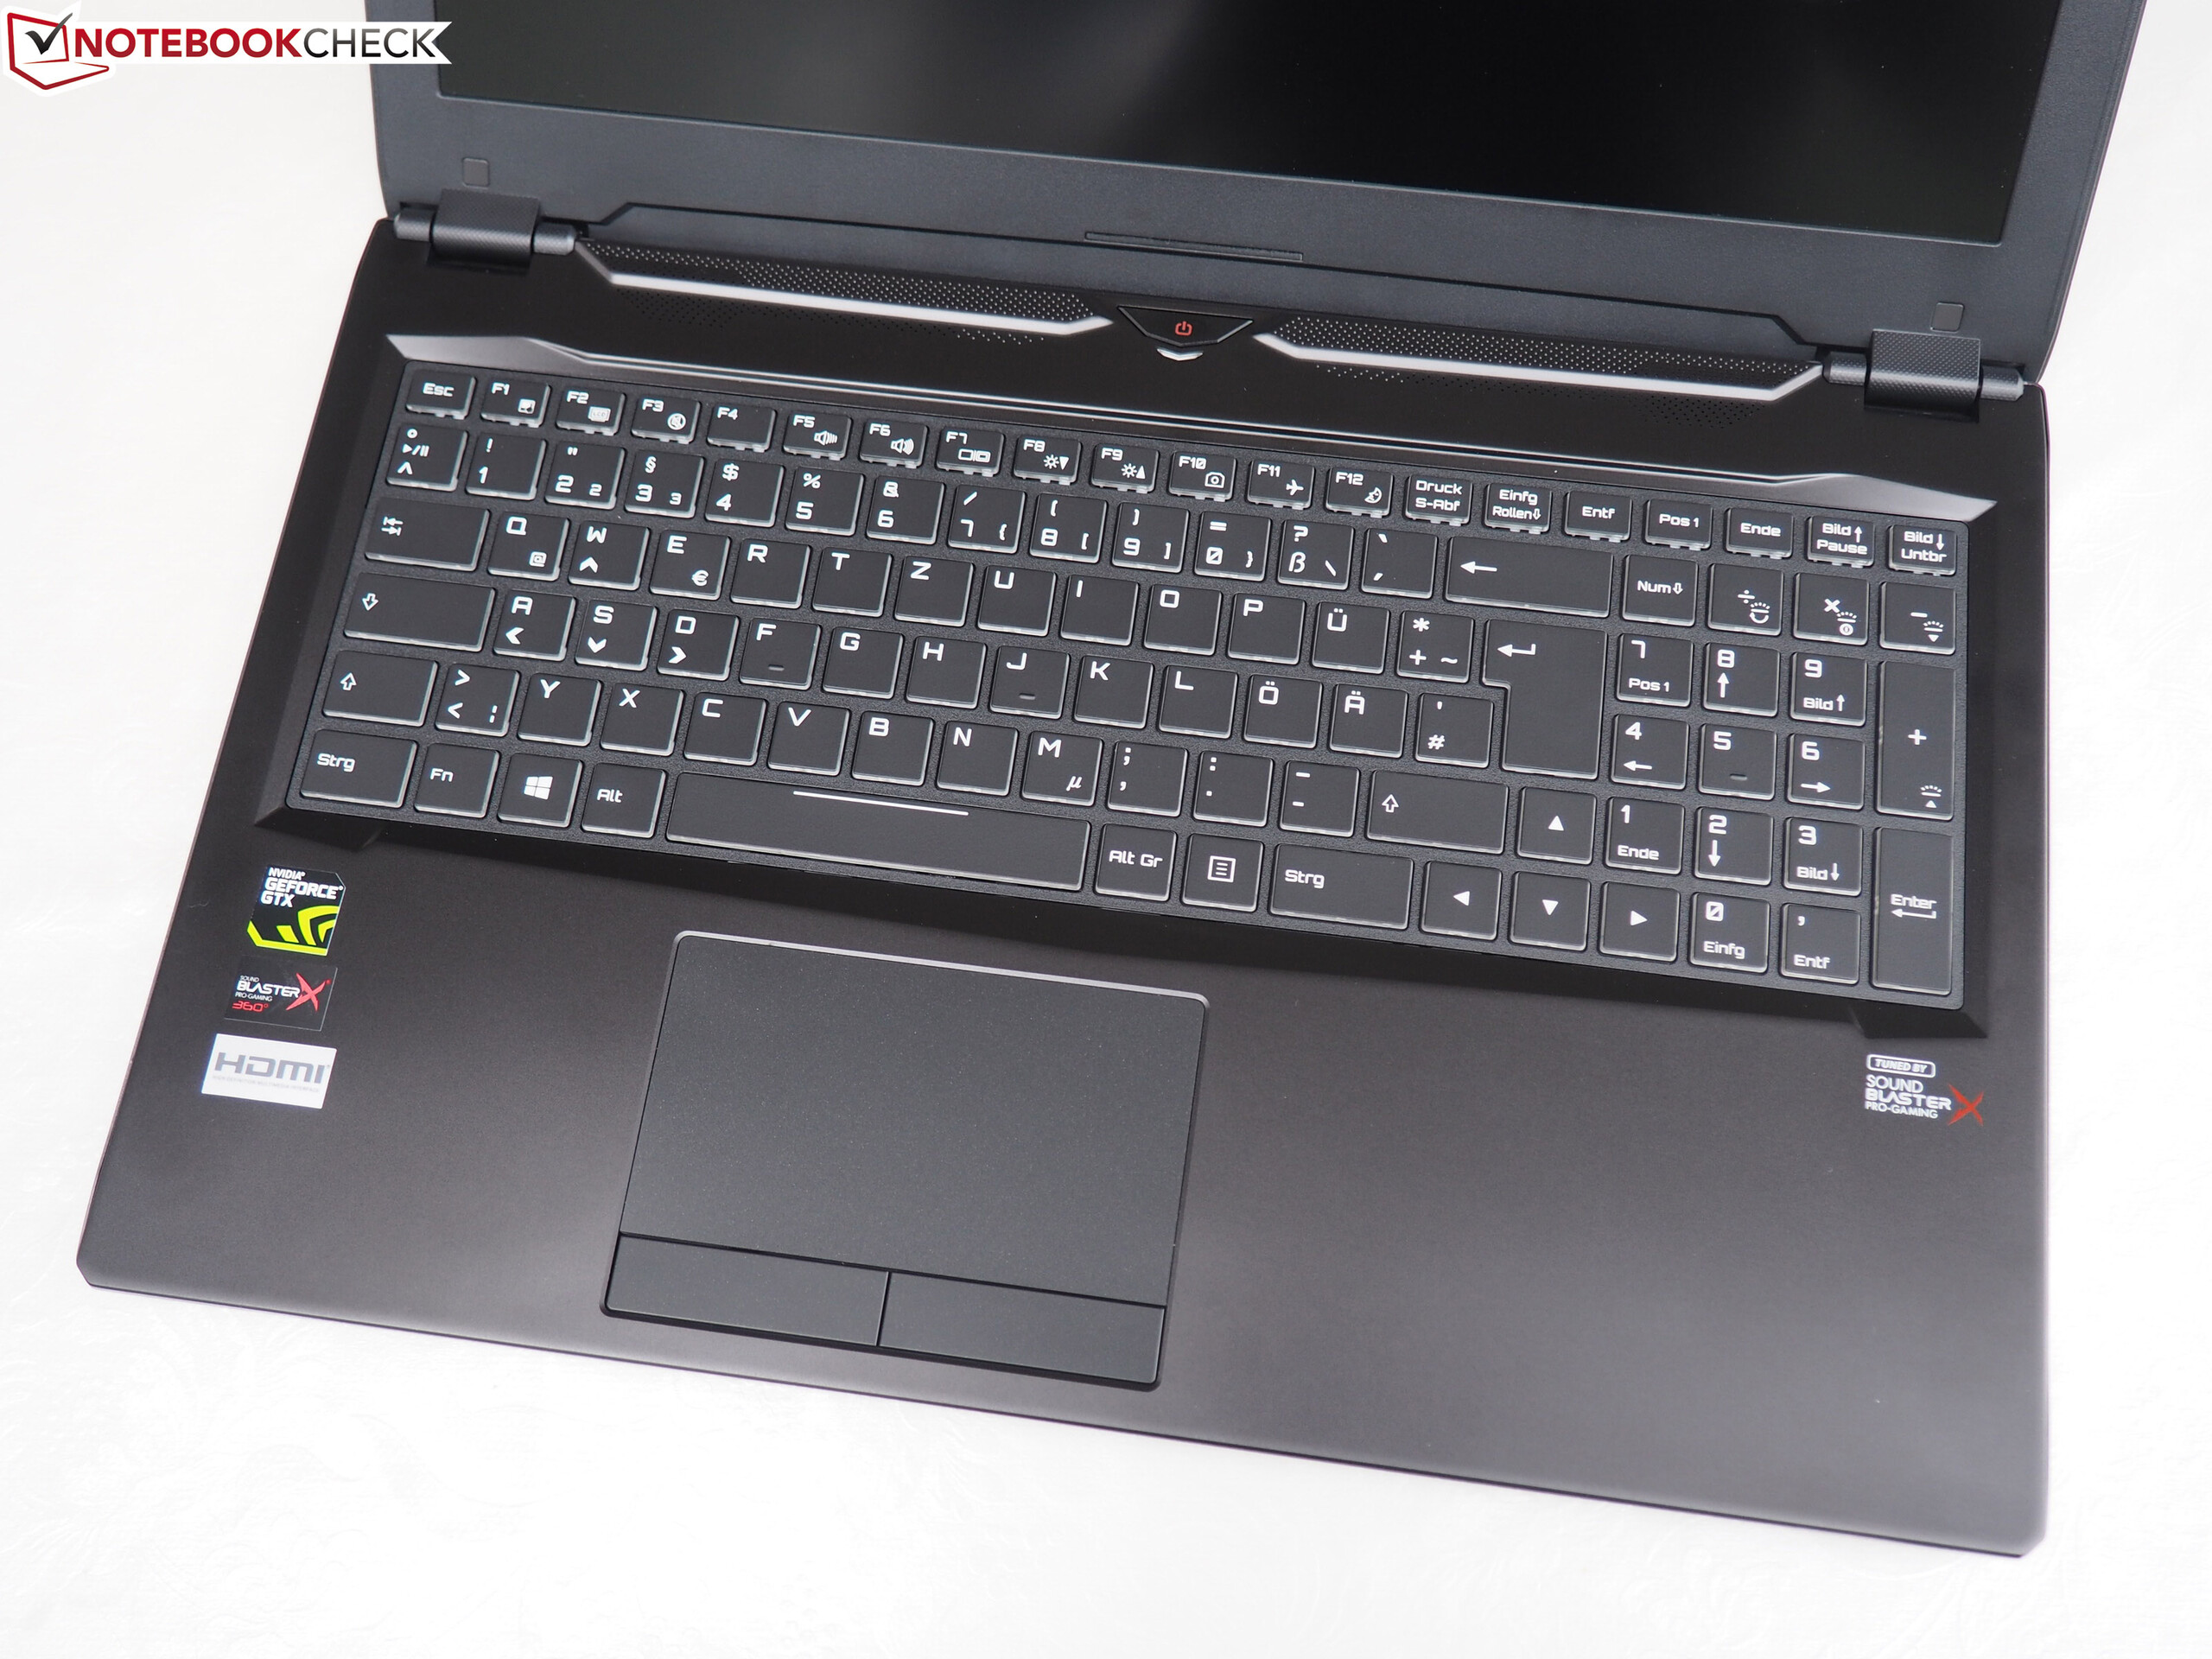
Sin esta deficiencia, valdría la pena pensar si comprar el dispositivo de 15". No sólo la carcasa de metal, sino también los dispositivos de entrada y la pantalla Full-HD son muy buenos, aparte de algunos pequeños detalles. Los mayores argumentos para comprar este dispositivo son la larga duración de la batería y su construcción compacta. Casi no hay portátiles de gama alta que sean cómodos de transportar, por lo que es posible que desee aceptar altas temperaturas de la CPU a cambio de esta ventaja. Pero no olvidemos que el Core i7-7700HQ tendía a hacer cuello de botella durante nuestras pruebas después de un tiempo de exigentes aplicaciones 3D.
En general, el sistema de enfriamiento parece tener pequeños problemas con el equipo de hardware del dispositivo. Si el fabricante de Barebone Clevo tiene dificultades para crear un sistema de enfriamiento adecuado para un portátil gaming ultra delgado con GeForce GTX 1060, podría ser mejor darle al dispositivo un milímetro o dos más o limitarse a un Core i5-7300HQ y GTX 1050 Ti o GTX 1060 Max-Q.
Ésta es una versión acortada del análisis original. Puedes leer el análisis completo en inglés aquí.
Guru Fire KS
- 10/12/2017 v6 (old)
Florian Glaser
Price comparison