Breve análisis del Acer Nitro 5 (7700HQ, GTX 1050 Ti)
| |||||||||||||||||||||||||
iluminación: 91 %
Brillo con batería: 281 cd/m²
Contraste: 1104:1 (Negro: 0.25 cd/m²)
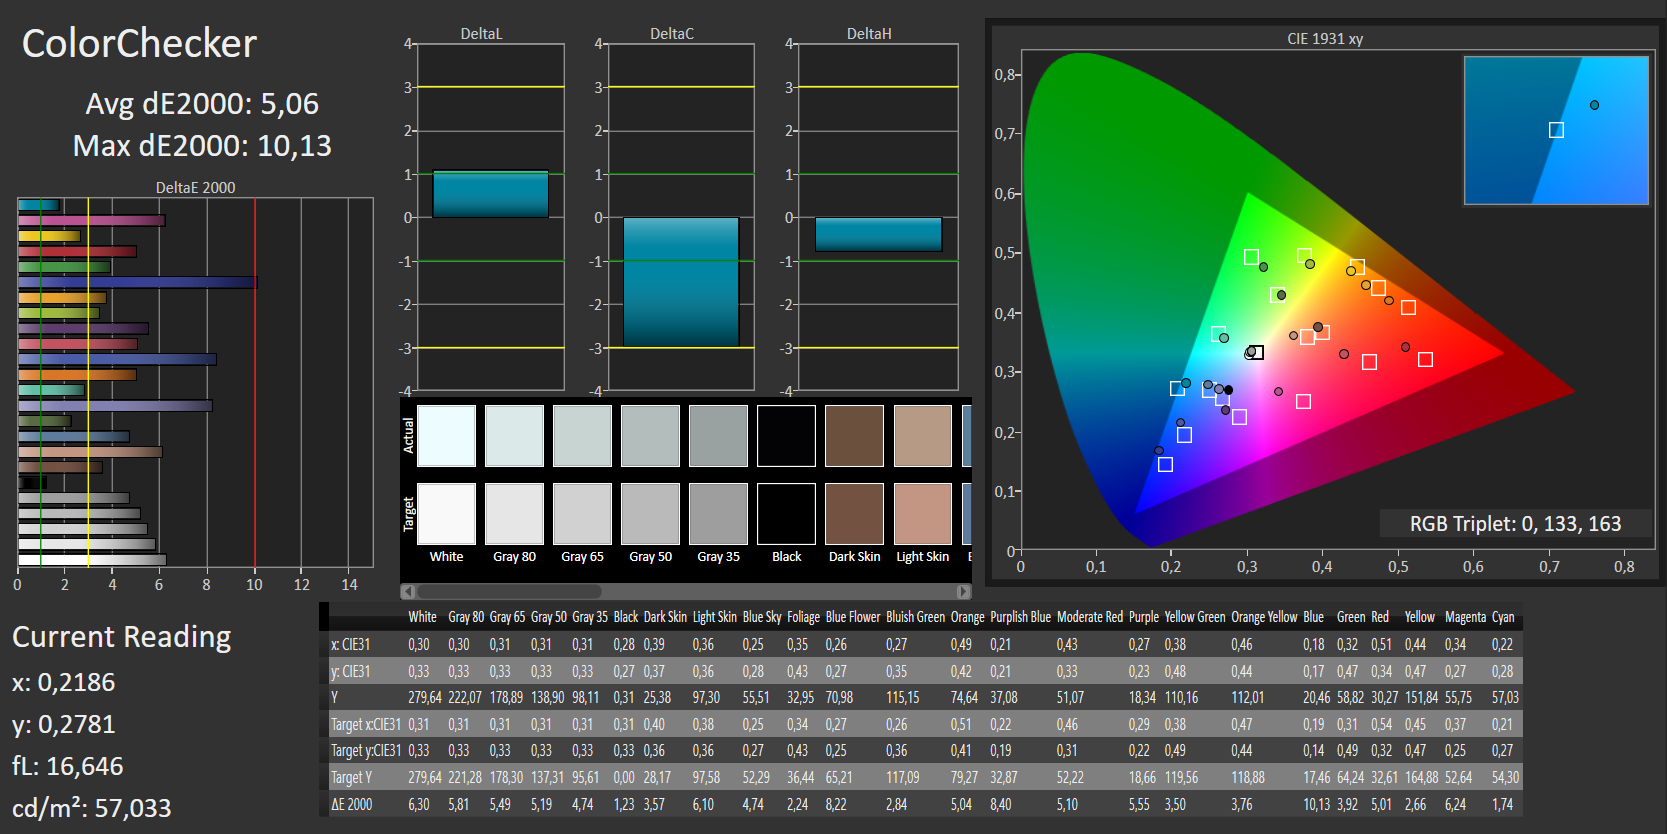
ΔE ColorChecker Calman: 5.06 | ∀{0.5-29.43 Ø4.71}
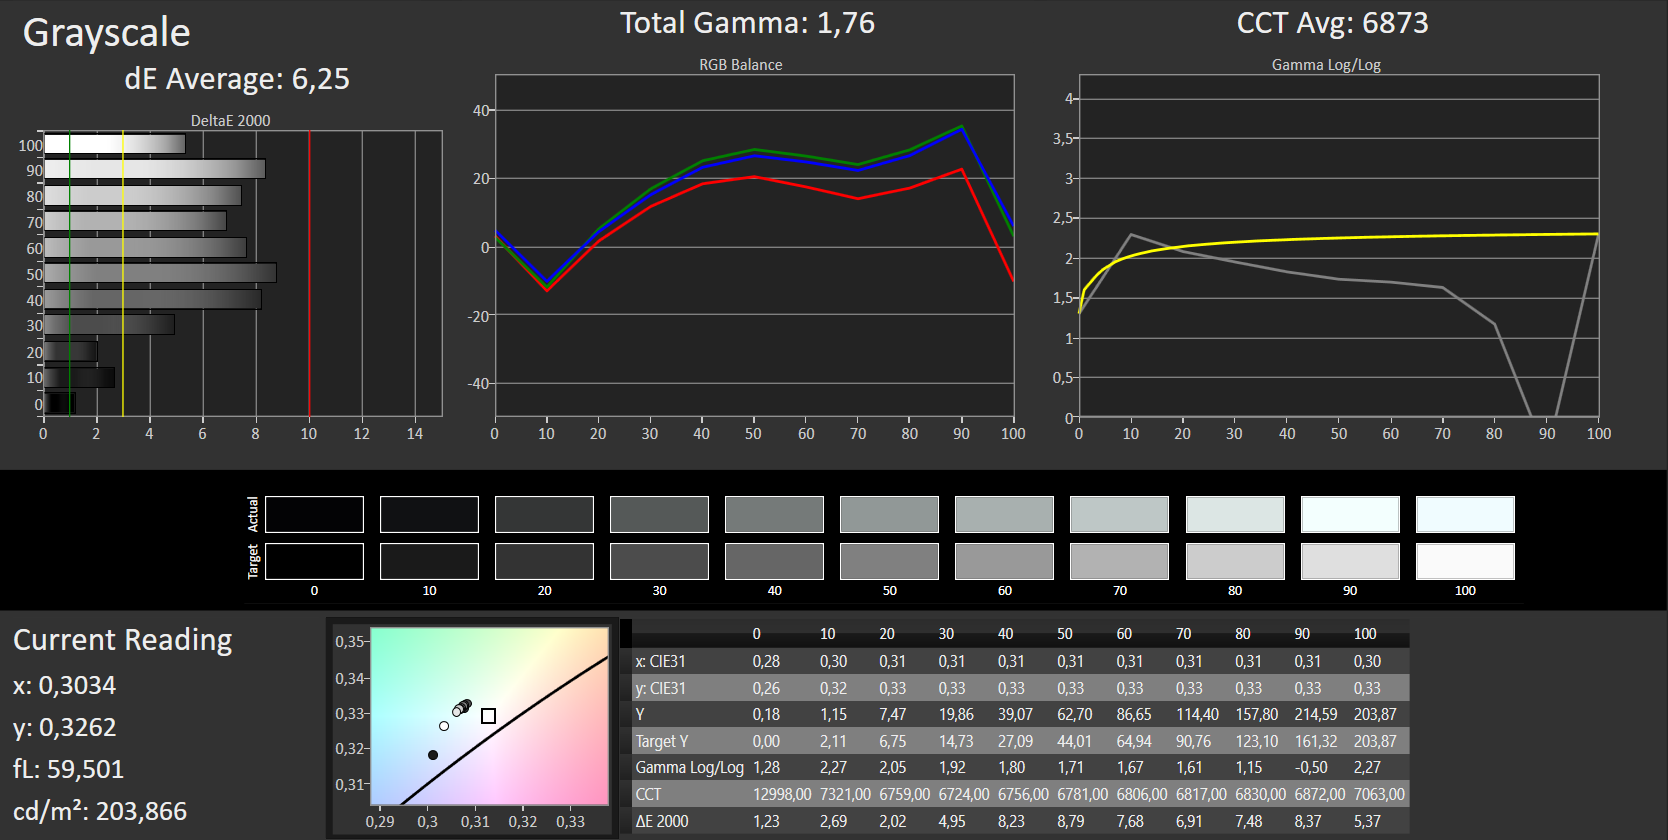
ΔE Greyscale Calman: 6.25 | ∀{0.09-98 Ø4.96}
62% sRGB (Argyll 1.6.3 3D)
40% AdobeRGB 1998 (Argyll 1.6.3 3D)
43.17% AdobeRGB 1998 (Argyll 3D)
62.2% sRGB (Argyll 3D)
41.7% Display P3 (Argyll 3D)
Gamma: 1.76
CCT: 6873 K
| Acer Nitro 5 AN515-51-788E IPS, 1920x1080, 15.6" | HP Omen 15-ax213ng IPS, 1920x1080, 15.6" | Acer Aspire VX5-591G-75C4 VX15 IPS, 1920x1080, 15.6" | Dell Inspiron 15 7000 7567 TN, 1920x1080, 15.6" | Lenovo Legion Y520-15IKBN-80WK001KUS IPS, 1920x1080, 15.6" | Asus FX502VM-AS73 TN LED, 1920x1080, 15.6" | Medion Erazer X6603 AH-IPS, LED, 1920x1080, 15.6" | |
|---|---|---|---|---|---|---|---|
| Display | -7% | -7% | -13% | -9% | -12% | ||
| Display P3 Coverage (%) | 41.7 | 38.59 -7% | 38.88 -7% | 36.42 -13% | 38.28 -8% | 36.82 -12% | |
| sRGB Coverage (%) | 62.2 | 58 -7% | 58.2 -6% | 54.9 -12% | 56.9 -9% | 54.9 -12% | |
| AdobeRGB 1998 Coverage (%) | 43.17 | 39.87 -8% | 40.2 -7% | 37.62 -13% | 39.47 -9% | 38.09 -12% | |
| Response Times | -24% | 16% | -34% | -66% | 9% | -32% | |
| Response Time Grey 50% / Grey 80% * (ms) | 35 ? | 42 ? -20% | 22 ? 37% | 36 ? -3% | 58.8 ? -68% | 28.4 ? 19% | 46 ? -31% |
| Response Time Black / White * (ms) | 22 ? | 28 ? -27% | 23 ? -5% | 36 ? -64% | 36 ? -64% | 22.4 ? -2% | 29 ? -32% |
| PWM Frequency (Hz) | 21550 ? | 2174 ? | |||||
| Screen | 7% | -3% | -54% | -29% | -33% | -15% | |
| Brightness middle (cd/m²) | 276 | 230 -17% | 281 2% | 246 -11% | 239 -13% | 209.5 -24% | 252 -9% |
| Brightness (cd/m²) | 265 | 228 -14% | 257 -3% | 235 -11% | 244 -8% | 205 -23% | 246 -7% |
| Brightness Distribution (%) | 91 | 88 -3% | 85 -7% | 75 -18% | 88 -3% | 92 1% | 94 3% |
| Black Level * (cd/m²) | 0.25 | 0.21 16% | 0.32 -28% | 0.55 -120% | 0.35 -40% | 0.69 -176% | 0.23 8% |
| Contrast (:1) | 1104 | 1095 -1% | 878 -20% | 447 -60% | 683 -38% | 304 -72% | 1096 -1% |
| Colorchecker dE 2000 * | 5.06 | 4.01 21% | 5.16 -2% | 10.97 -117% | 7.3 -44% | 4.7 7% | 7.83 -55% |
| Colorchecker dE 2000 max. * | 10.13 | 7.26 28% | 9.09 10% | 24.7 -144% | 19.7 -94% | 15.5 -53% | |
| Greyscale dE 2000 * | 6.25 | 3.18 49% | 4.57 27% | 14.25 -128% | 4.9 22% | 1.8 71% | 7.11 -14% |
| Gamma | 1.76 125% | 2.52 87% | 2.59 85% | 1.83 120% | 2.19 100% | 2.23 99% | 2.19 100% |
| CCT | 6873 95% | 6814 95% | 6931 94% | 11200 58% | 7332 89% | 6975 93% | 7930 82% |
| Color Space (Percent of AdobeRGB 1998) (%) | 40 | 37 -7% | 37 -7% | 35 -12% | 35 -12% | 36.2 -9% | 35 -12% |
| Color Space (Percent of sRGB) (%) | 62 | 58 -6% | 58 -6% | 55 -11% | 55 -11% | 56.6 -9% | 55 -11% |
| Media total (Programa/Opciones) | -8% /
-0% | 2% /
-1% | -34% /
-42% | -48% /
-35% | -11% /
-22% | -20% /
-17% |
* ... más pequeño es mejor
Parpadeo de Pantalla / PWM (Pulse-Width Modulation)
| Parpadeo de Pantalla / PWM no detectado | ||
Comparación: 52 % de todos los dispositivos testados no usaron PWM para atenuar el display. Si se usó, medimos una media de 7744 (mínimo: 5 - máxmo: 343500) Hz. | ||
Tiempos de respuesta del display
| ↔ Tiempo de respuesta de Negro a Blanco | ||
|---|---|---|
| 22 ms ... subida ↗ y bajada ↘ combinada | ↗ 12 ms subida | 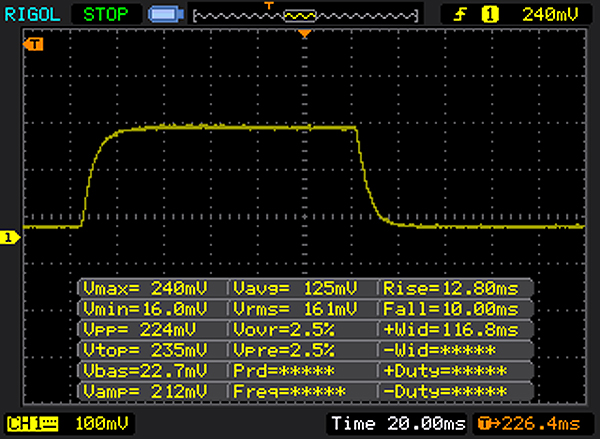 |
| ↘ 10 ms bajada | ||
| La pantalla mostró buenos tiempos de respuesta en nuestros tests pero podría ser demasiado lenta para los jugones competitivos. En comparación, todos los dispositivos de prueba van de ##min### (mínimo) a 240 (máximo) ms. » 49 % de todos los dispositivos son mejores. Eso quiere decir que el tiempo de respuesta es peor que la media (19.8 ms) de todos los dispositivos testados. | ||
| ↔ Tiempo de respuesta 50% Gris a 80% Gris | ||
| 35 ms ... subida ↗ y bajada ↘ combinada | ↗ 16 ms subida | 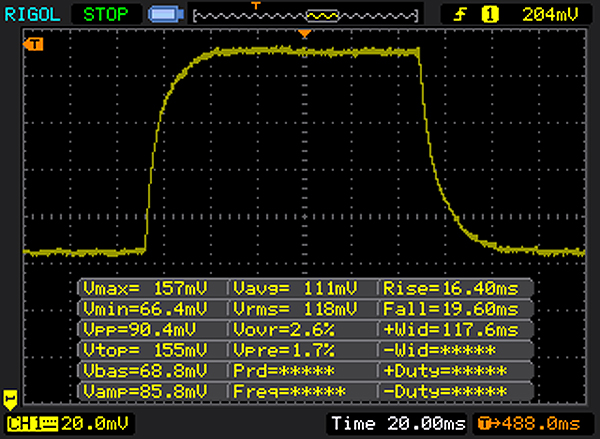 |
| ↘ 19 ms bajada | ||
| La pantalla mostró tiempos de respuesta lentos en nuestros tests y podría ser demasiado lenta para los jugones. En comparación, todos los dispositivos de prueba van de ##min### (mínimo) a 636 (máximo) ms. » 49 % de todos los dispositivos son mejores. Eso quiere decir que el tiempo de respuesta es peor que la media (30.9 ms) de todos los dispositivos testados. | ||
| Cinebench R10 | |
| Rendering Multiple CPUs 32Bit | |
| Acer Nitro 5 AN515-51-788E | |
| Medion Erazer X6603 | |
| Asus FX502VM-AS73 | |
| Rendering Single 32Bit | |
| Acer Nitro 5 AN515-51-788E | |
| Medion Erazer X6603 | |
| Asus FX502VM-AS73 | |
| Geekbench 3 | |
| 32 Bit Multi-Core Score | |
| Acer Nitro 5 AN515-51-788E | |
| 32 Bit Single-Core Score | |
| Acer Nitro 5 AN515-51-788E | |
| Geekbench 4.0 | |
| 64 Bit Multi-Core Score | |
| Acer Nitro 5 AN515-51-788E | |
| 64 Bit Single-Core Score | |
| Acer Nitro 5 AN515-51-788E | |
| Geekbench 4.4 | |
| 64 Bit Multi-Core Score | |
| Acer Nitro 5 AN515-51-788E | |
| 64 Bit Single-Core Score | |
| Acer Nitro 5 AN515-51-788E | |
| JetStream 1.1 - 1.1 Total | |
| Medion Erazer X6603 (Edge 38.14393.1066.0) | |
| HP Omen 15-ax213ng (Edge 40.15063.0.0) | |
| Lenovo Legion Y520-15IKBN-80WK001KUS | |
| Dell Inspiron 15 7000 7567 (EDGE 38.1439.3.00) | |
| Acer Nitro 5 AN515-51-788E (Edge 40) | |
| Asus FX502VM-AS73 (Edge 38.14393.0.0) | |
| PCMark 7 Score | 6346 puntos | |
| PCMark 8 Home Score Accelerated v2 | 4177 puntos | |
| PCMark 8 Creative Score Accelerated v2 | 5291 puntos | |
| PCMark 8 Work Score Accelerated v2 | 5096 puntos | |
| PCMark 10 Score | 4474 puntos | |
ayuda | ||

| Acer Nitro 5 AN515-51-788E Intel SSD 600p SSDPEKKW256G7 | HP Omen 15-ax213ng Samsung PM961 MZVLW256HEHP | Acer Aspire VX5-591G-75C4 VX15 Toshiba MQ01ABD100 | Dell Inspiron 15 7000 7567 Intel SSDSCKKF256H6 | Lenovo Legion Y520-15IKBN-80WK001KUS Samsung PM961 MZVLW256HEHP | Asus FX502VM-AS73 SK Hynix HFS256G39TND-N210A | Medion Erazer X6603 Samsung PM961 MZVLW256HEHP | |
|---|---|---|---|---|---|---|---|
| CrystalDiskMark 3.0 | 75% | -95% | -30% | 64% | -40% | 63% | |
| Read Seq (MB/s) | 945 | 1657 75% | 101.5 -89% | 485.8 -49% | 2170 130% | 503 -47% | 2170 130% |
| Write Seq (MB/s) | 559 | 1208 116% | 100.6 -82% | 422.8 -24% | 1202 115% | 138.2 -75% | 1100 97% |
| Read 512 (MB/s) | 639 | 806 26% | 28.33 -96% | 338.9 -47% | 786 23% | 343.5 -46% | 788 23% |
| Write 512 (MB/s) | 561 | 807 44% | 28.31 -95% | 304 -46% | 822 47% | 137.8 -75% | 831 48% |
| Read 4k (MB/s) | 24.24 | 62.6 158% | 0.327 -99% | 27.11 12% | 58.9 143% | 29.36 21% | 59 143% |
| Write 4k (MB/s) | 122.7 | 176.9 44% | 0.846 -99% | 85.4 -30% | 146.4 19% | 70.9 -42% | 147.2 20% |
| Read 4k QD32 (MB/s) | 288.5 | 650 125% | 0.718 -100% | 279.6 -3% | 457.7 59% | 369.9 28% | 464 61% |
| Write 4k QD32 (MB/s) | 504 | 557 11% | 0.893 -100% | 255.1 -49% | 392.9 -22% | 99.7 -80% | 398.7 -21% |
| 3DMark 06 Standard Score | 27190 puntos | |
| 3DMark 11 Performance | 9084 puntos | |
| 3DMark Ice Storm Standard Score | 124922 puntos | |
| 3DMark Cloud Gate Standard Score | 22182 puntos | |
| 3DMark Fire Strike Score | 6730 puntos | |
| 3DMark Fire Strike Extreme Score | 3554 puntos | |
| 3DMark Time Spy Score | 2446 puntos | |
ayuda | ||
| 3DMark | |
| 1920x1080 Fire Strike Physics | |
| Acer Nitro 5 AN515-51-788E (CoolBoost on) | |
| Acer Nitro 5 AN515-51-788E | |
| 1280x720 Cloud Gate Standard Physics | |
| Acer Nitro 5 AN515-51-788E (CoolBoost on) | |
| Acer Nitro 5 AN515-51-788E | |
| 3DMark 06 - CPU - CPU Score | |
| Acer Nitro 5 AN515-51-788E (CoolBoost on) | |
| Acer Nitro 5 AN515-51-788E | |
| 3DMark 11 - 1280x720 Performance Physics | |
| Acer Nitro 5 AN515-51-788E (CoolBoost on) | |
| Acer Nitro 5 AN515-51-788E | |
| bajo | medio | alto | ultra | |
|---|---|---|---|---|
| Tomb Raider (2013) | 423.3 | 304.5 | 196.3 | 89 |
| BioShock Infinite (2013) | 260.7 | 206.7 | 185.8 | 74.1 |
| The Witcher 3 (2015) | 141.1 | 86.3 | 47.4 | 24.2 |
| Prey (2017) | 142.5 | 102.6 | 82.8 | 66.8 |
| Rocket League (2017) | 247.6 | 178.5 | 111.3 | |
| Dirt 4 (2017) | 249.9 | 114.5 | 59.6 | 36.1 |
| Playerunknown's Battlegrounds (PUBG) (2017) | 126 | 58.8 | 51.5 | 35.9 |
| F1 2017 (2017) | 178 | 91 | 71 | 44 |
| Ark Survival Evolved (2017) | 94.9 | 31.3 | 22.7 | 14.6 |
| BioShock Infinite - 1920x1080 Ultra Preset, DX11 (DDOF) | |
| Asus FX502VM-AS73 | |
| Acer Nitro 5 AN515-51-788E | |
| Lenovo Legion Y520-15IKBN-80WK001KUS | |
| Medion Erazer X6603 | |
| Dell Inspiron 15 7000 7567 | |
| HP Omen 15-ax213ng | |
| The Witcher 3 - 1920x1080 High Graphics & Postprocessing (Nvidia HairWorks Off) | |
| HP Omen 15-ax213ng | |
| Acer Nitro 5 AN515-51-788E | |
| Acer Aspire VX5-591G-75C4 VX15 | |
| Prey - 1920x1080 Very High Preset AA:2TX SM AF:16x | |
| Acer Nitro 5 AN515-51-788E | |
Ruido
| Ocioso |
| 30.6 / 30.7 / 30.7 dB(A) |
| Carga |
| 43 / 45.8 dB(A) |
 | ||
30 dB silencioso 40 dB(A) audible 50 dB(A) ruidosamente alto |
||
min: | ||
| Acer Nitro 5 AN515-51-788E i7-7700HQ, GeForce GTX 1050 Ti Mobile | HP Omen 15-ax213ng i7-7700HQ, GeForce GTX 1050 Ti Mobile | Acer Aspire VX5-591G-75C4 VX15 i7-7700HQ, GeForce GTX 1050 Ti Mobile | Dell Inspiron 15 7000 7567 i7-7700HQ, GeForce GTX 1050 Ti Mobile | Lenovo Legion Y520-15IKBN-80WK001KUS i7-7700HQ, GeForce GTX 1050 Ti Mobile | Asus FX502VM-AS73 i7-7700HQ, GeForce GTX 1060 Mobile | Medion Erazer X6603 i7-7700HQ, GeForce GTX 1050 Ti Mobile | |
|---|---|---|---|---|---|---|---|
| Noise | -11% | 3% | -2% | 3% | -3% | 3% | |
| apagado / medio ambiente * (dB) | 30.6 | 30 2% | 30.4 1% | 30.3 1% | 27.7 9% | 28.7 6% | 30.9 -1% |
| Idle Minimum * (dB) | 30.6 | 32 -5% | 31.4 -3% | 30.9 -1% | 30.5 -0% | 30.6 -0% | 30.9 -1% |
| Idle Average * (dB) | 30.7 | 34 -11% | 31.4 -2% | 30.9 -1% | 30.5 1% | 30.6 -0% | 30.9 -1% |
| Idle Maximum * (dB) | 30.7 | 36 -17% | 31.4 -2% | 31 -1% | 30.6 -0% | 31 -1% | 31.6 -3% |
| Load Average * (dB) | 43 | 48 -12% | 36.8 14% | 46.5 -8% | 40 7% | 46.2 -7% | 38.5 10% |
| Witcher 3 ultra * (dB) | 39.7 | 49 -23% | 40 -1% | ||||
| Load Maximum * (dB) | 45.8 | 51 -11% | 41.3 10% | 46.8 -2% | 42.6 7% | 52.3 -14% | 40.8 11% |
* ... más pequeño es mejor
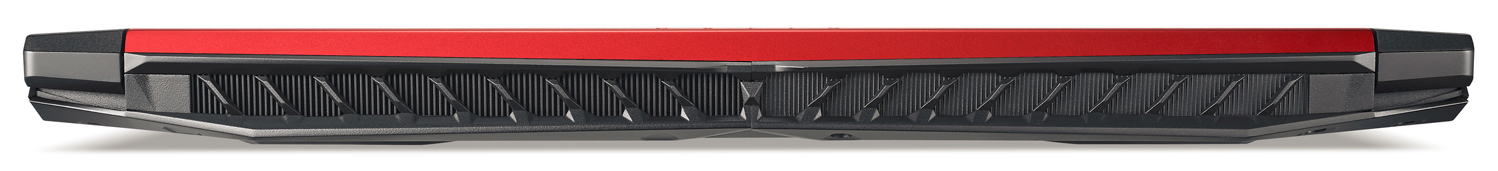
(±) La temperatura máxima en la parte superior es de 41.1 °C / 106 F, frente a la media de 40.4 °C / 105 F, que oscila entre 21.2 y 68.8 °C para la clase Gaming.
(+) El fondo se calienta hasta un máximo de 38.8 °C / 102 F, frente a la media de 43.2 °C / 110 F
(+) En reposo, la temperatura media de la parte superior es de 24.4 °C / 76# F, frente a la media del dispositivo de 33.9 °C / 93 F.
(±) Jugando a The Witcher 3, la temperatura media de la parte superior es de 32.5 °C / 91 F, frente a la media del dispositivo de 33.9 °C / 93 F.
(+) El reposamanos y el panel táctil están a una temperatura inferior a la de la piel, con un máximo de 27.6 °C / 81.7 F y, por tanto, son fríos al tacto.
(±) La temperatura media de la zona del reposamanos de dispositivos similares fue de 28.8 °C / 83.8 F (+1.2 °C / 2.1 F).
| Acer Nitro 5 AN515-51-788E i7-7700HQ, GeForce GTX 1050 Ti Mobile | HP Omen 15-ax213ng i7-7700HQ, GeForce GTX 1050 Ti Mobile | Acer Aspire VX5-591G-75C4 VX15 i7-7700HQ, GeForce GTX 1050 Ti Mobile | Dell Inspiron 15 7000 7567 i7-7700HQ, GeForce GTX 1050 Ti Mobile | Lenovo Legion Y520-15IKBN-80WK001KUS i7-7700HQ, GeForce GTX 1050 Ti Mobile | Asus FX502VM-AS73 i7-7700HQ, GeForce GTX 1060 Mobile | Medion Erazer X6603 i7-7700HQ, GeForce GTX 1050 Ti Mobile | |
|---|---|---|---|---|---|---|---|
| Heat | -20% | -9% | 6% | -15% | -23% | 3% | |
| Maximum Upper Side * (°C) | 41.1 | 52.4 -27% | 47 -14% | 43.4 -6% | 46.8 -14% | 53.2 -29% | 44.3 -8% |
| Maximum Bottom * (°C) | 38.8 | 54.2 -40% | 47 -21% | 37.7 3% | 55.8 -44% | 56.8 -46% | 39.5 -2% |
| Idle Upper Side * (°C) | 28.7 | 30.5 -6% | 28.4 1% | 24.3 15% | 27.6 4% | 28.8 -0% | 24.8 14% |
| Idle Bottom * (°C) | 26.9 | 28.2 -5% | 27.1 -1% | 23.6 12% | 28.4 -6% | 31.4 -17% | 24.6 9% |
* ... más pequeño es mejor
Acer Nitro 5 AN515-51-788E análisis de audio
(-) | altavoces no muy altos (#67.8 dB)
Graves 100 - 315 Hz
(±) | lubina reducida - en promedio 13.5% inferior a la mediana
(±) | la linealidad de los graves es media (12.7% delta a frecuencia anterior)
Medios 400 - 2000 Hz
(+) | medios equilibrados - a sólo 3.8% de la mediana
(±) | la linealidad de los medios es media (10.7% delta respecto a la frecuencia anterior)
Altos 2 - 16 kHz
(+) | máximos equilibrados - a sólo 2.1% de la mediana
(+) | los máximos son lineales (5.8% delta a la frecuencia anterior)
Total 100 - 16.000 Hz
(±) | la linealidad del sonido global es media (18.1% de diferencia con la mediana)
En comparación con la misma clase
» 57% de todos los dispositivos probados de esta clase eran mejores, 8% similares, 35% peores
» El mejor tuvo un delta de 6%, la media fue 18%, el peor fue ###max##%
En comparación con todos los dispositivos probados
» 39% de todos los dispositivos probados eran mejores, 8% similares, 54% peores
» El mejor tuvo un delta de 4%, la media fue 23%, el peor fue ###max##%
Apple MacBook 12 (Early 2016) 1.1 GHz análisis de audio
(+) | los altavoces pueden reproducir a un volumen relativamente alto (#83.6 dB)
Graves 100 - 315 Hz
(±) | lubina reducida - en promedio 11.3% inferior a la mediana
(±) | la linealidad de los graves es media (14.2% delta a frecuencia anterior)
Medios 400 - 2000 Hz
(+) | medios equilibrados - a sólo 2.4% de la mediana
(+) | los medios son lineales (5.5% delta a la frecuencia anterior)
Altos 2 - 16 kHz
(+) | máximos equilibrados - a sólo 2% de la mediana
(+) | los máximos son lineales (4.5% delta a la frecuencia anterior)
Total 100 - 16.000 Hz
(+) | el sonido global es lineal (10.2% de diferencia con la mediana)
En comparación con la misma clase
» 7% de todos los dispositivos probados de esta clase eran mejores, 2% similares, 90% peores
» El mejor tuvo un delta de 5%, la media fue 18%, el peor fue ###max##%
En comparación con todos los dispositivos probados
» 5% de todos los dispositivos probados eran mejores, 1% similares, 94% peores
» El mejor tuvo un delta de 4%, la media fue 23%, el peor fue ###max##%
| Off / Standby | |
| Ocioso | |
| Carga |
|
Clave:
min: | |
| Acer Nitro 5 AN515-51-788E i7-7700HQ, GeForce GTX 1050 Ti Mobile | HP Omen 15-ax213ng i7-7700HQ, GeForce GTX 1050 Ti Mobile | Acer Aspire VX5-591G-75C4 VX15 i7-7700HQ, GeForce GTX 1050 Ti Mobile | Dell Inspiron 15 7000 7567 i7-7700HQ, GeForce GTX 1050 Ti Mobile | Lenovo Legion Y520-15IKBN-80WK001KUS i7-7700HQ, GeForce GTX 1050 Ti Mobile | Asus FX502VM-AS73 i7-7700HQ, GeForce GTX 1060 Mobile | Medion Erazer X6603 i7-7700HQ, GeForce GTX 1050 Ti Mobile | |
|---|---|---|---|---|---|---|---|
| Power Consumption | -32% | -32% | 2% | -21% | -97% | -2% | |
| Idle Minimum * (Watt) | 4.1 | 6 -46% | 7 -71% | 4.4 -7% | 8.5 -107% | 14.9 -263% | 4.7 -15% |
| Idle Average * (Watt) | 6.9 | 11 -59% | 10.2 -48% | 6.8 1% | 9.1 -32% | 15.1 -119% | 7.6 -10% |
| Idle Maximum * (Watt) | 9.5 | 18 -89% | 14 -47% | 8.3 13% | 9.7 -2% | 15.2 -60% | 9.2 3% |
| Load Average * (Watt) | 83 | 81 2% | 78 6% | 81 2% | 79.9 4% | 105.8 -27% | 81 2% |
| Witcher 3 ultra * (Watt) | 108 | 90 17% | 97.7 10% | ||||
| Load Maximum * (Watt) | 126 | 146 -16% | 127 -1% | 127 -1% | 121.5 4% | 148.8 -18% | 112 11% |
* ... más pequeño es mejor
| Acer Nitro 5 AN515-51-788E i7-7700HQ, GeForce GTX 1050 Ti Mobile, 48 Wh | HP Omen 15-ax213ng i7-7700HQ, GeForce GTX 1050 Ti Mobile, 63.3 Wh | Acer Aspire VX5-591G-75C4 VX15 i7-7700HQ, GeForce GTX 1050 Ti Mobile, 52.5 Wh | Dell Inspiron 15 7000 7567 i7-7700HQ, GeForce GTX 1050 Ti Mobile, 74 Wh | Lenovo Legion Y520-15IKBN-80WK001KUS i7-7700HQ, GeForce GTX 1050 Ti Mobile, 45 Wh | Asus FX502VM-AS73 i7-7700HQ, GeForce GTX 1060 Mobile, 64 Wh | Medion Erazer X6603 i7-7700HQ, GeForce GTX 1050 Ti Mobile, 45 Wh | |
|---|---|---|---|---|---|---|---|
| Duración de Batería | 0% | -21% | 40% | -37% | -30% | -38% | |
| Reader / Idle (h) | 14.9 | 12.8 -14% | 5.4 -64% | 19.6 32% | 8.5 -43% | 6.1 -59% | 5.7 -62% |
| H.264 (h) | 5.2 | 3.3 -37% | 7.6 46% | 3.8 -27% | |||
| WiFi v1.3 (h) | 6.7 | 7.1 6% | 5 -25% | 10.4 55% | 4 -40% | 4.6 -31% | 4.3 -36% |
| Load (h) | 1.1 | 1.6 45% | 1.4 27% | 1.4 27% | 0.8 -27% | 1.1 0% | 0.8 -27% |
Pro
Contra
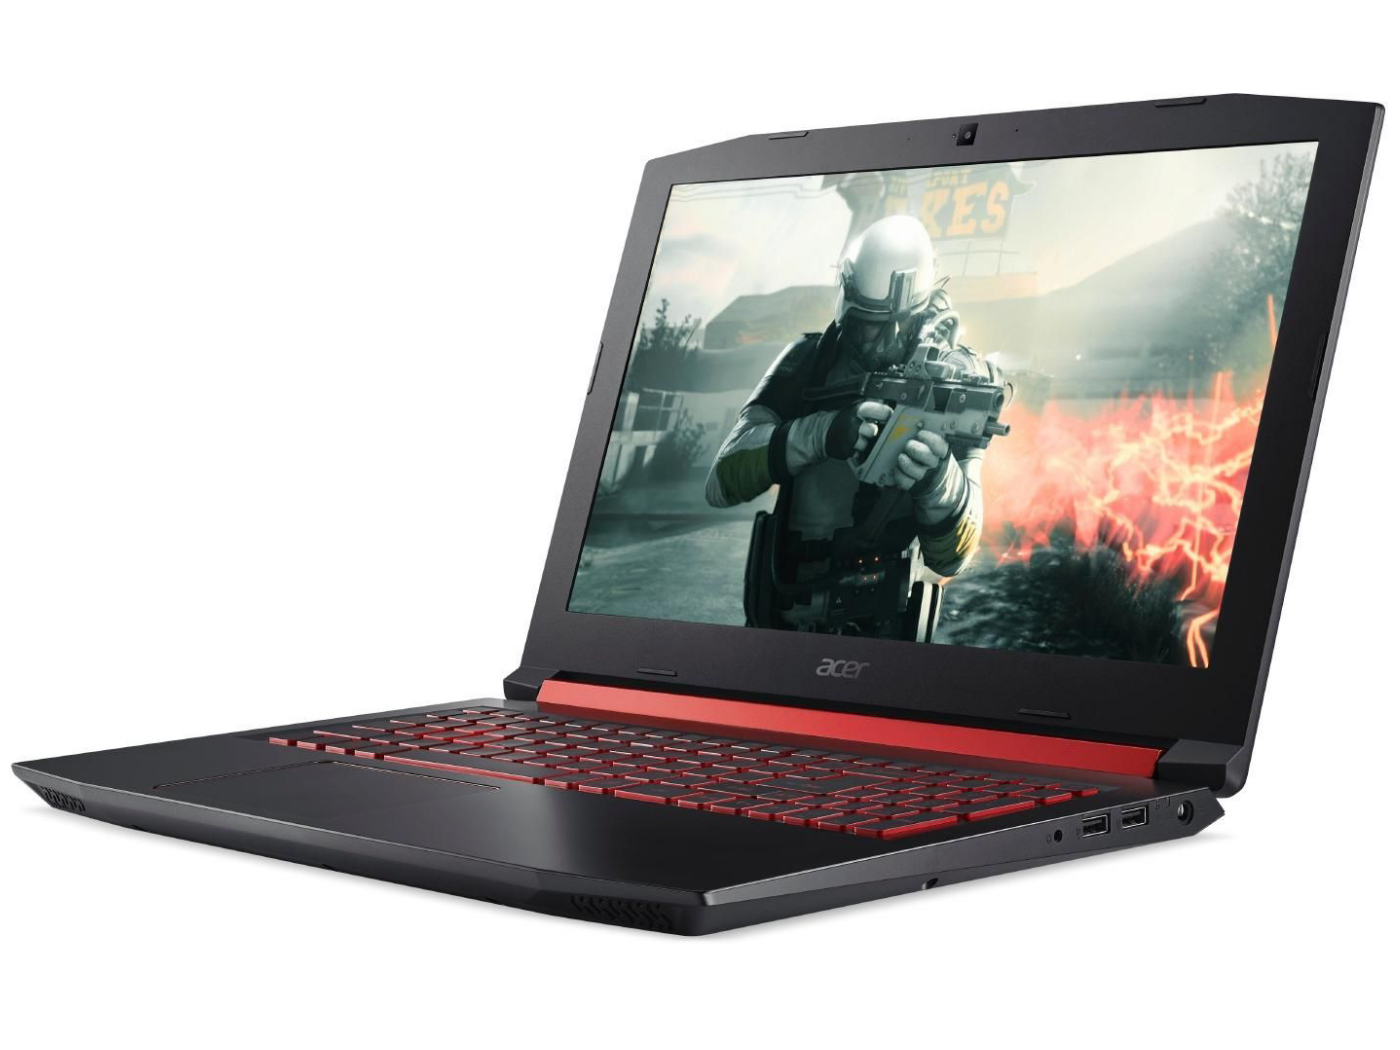
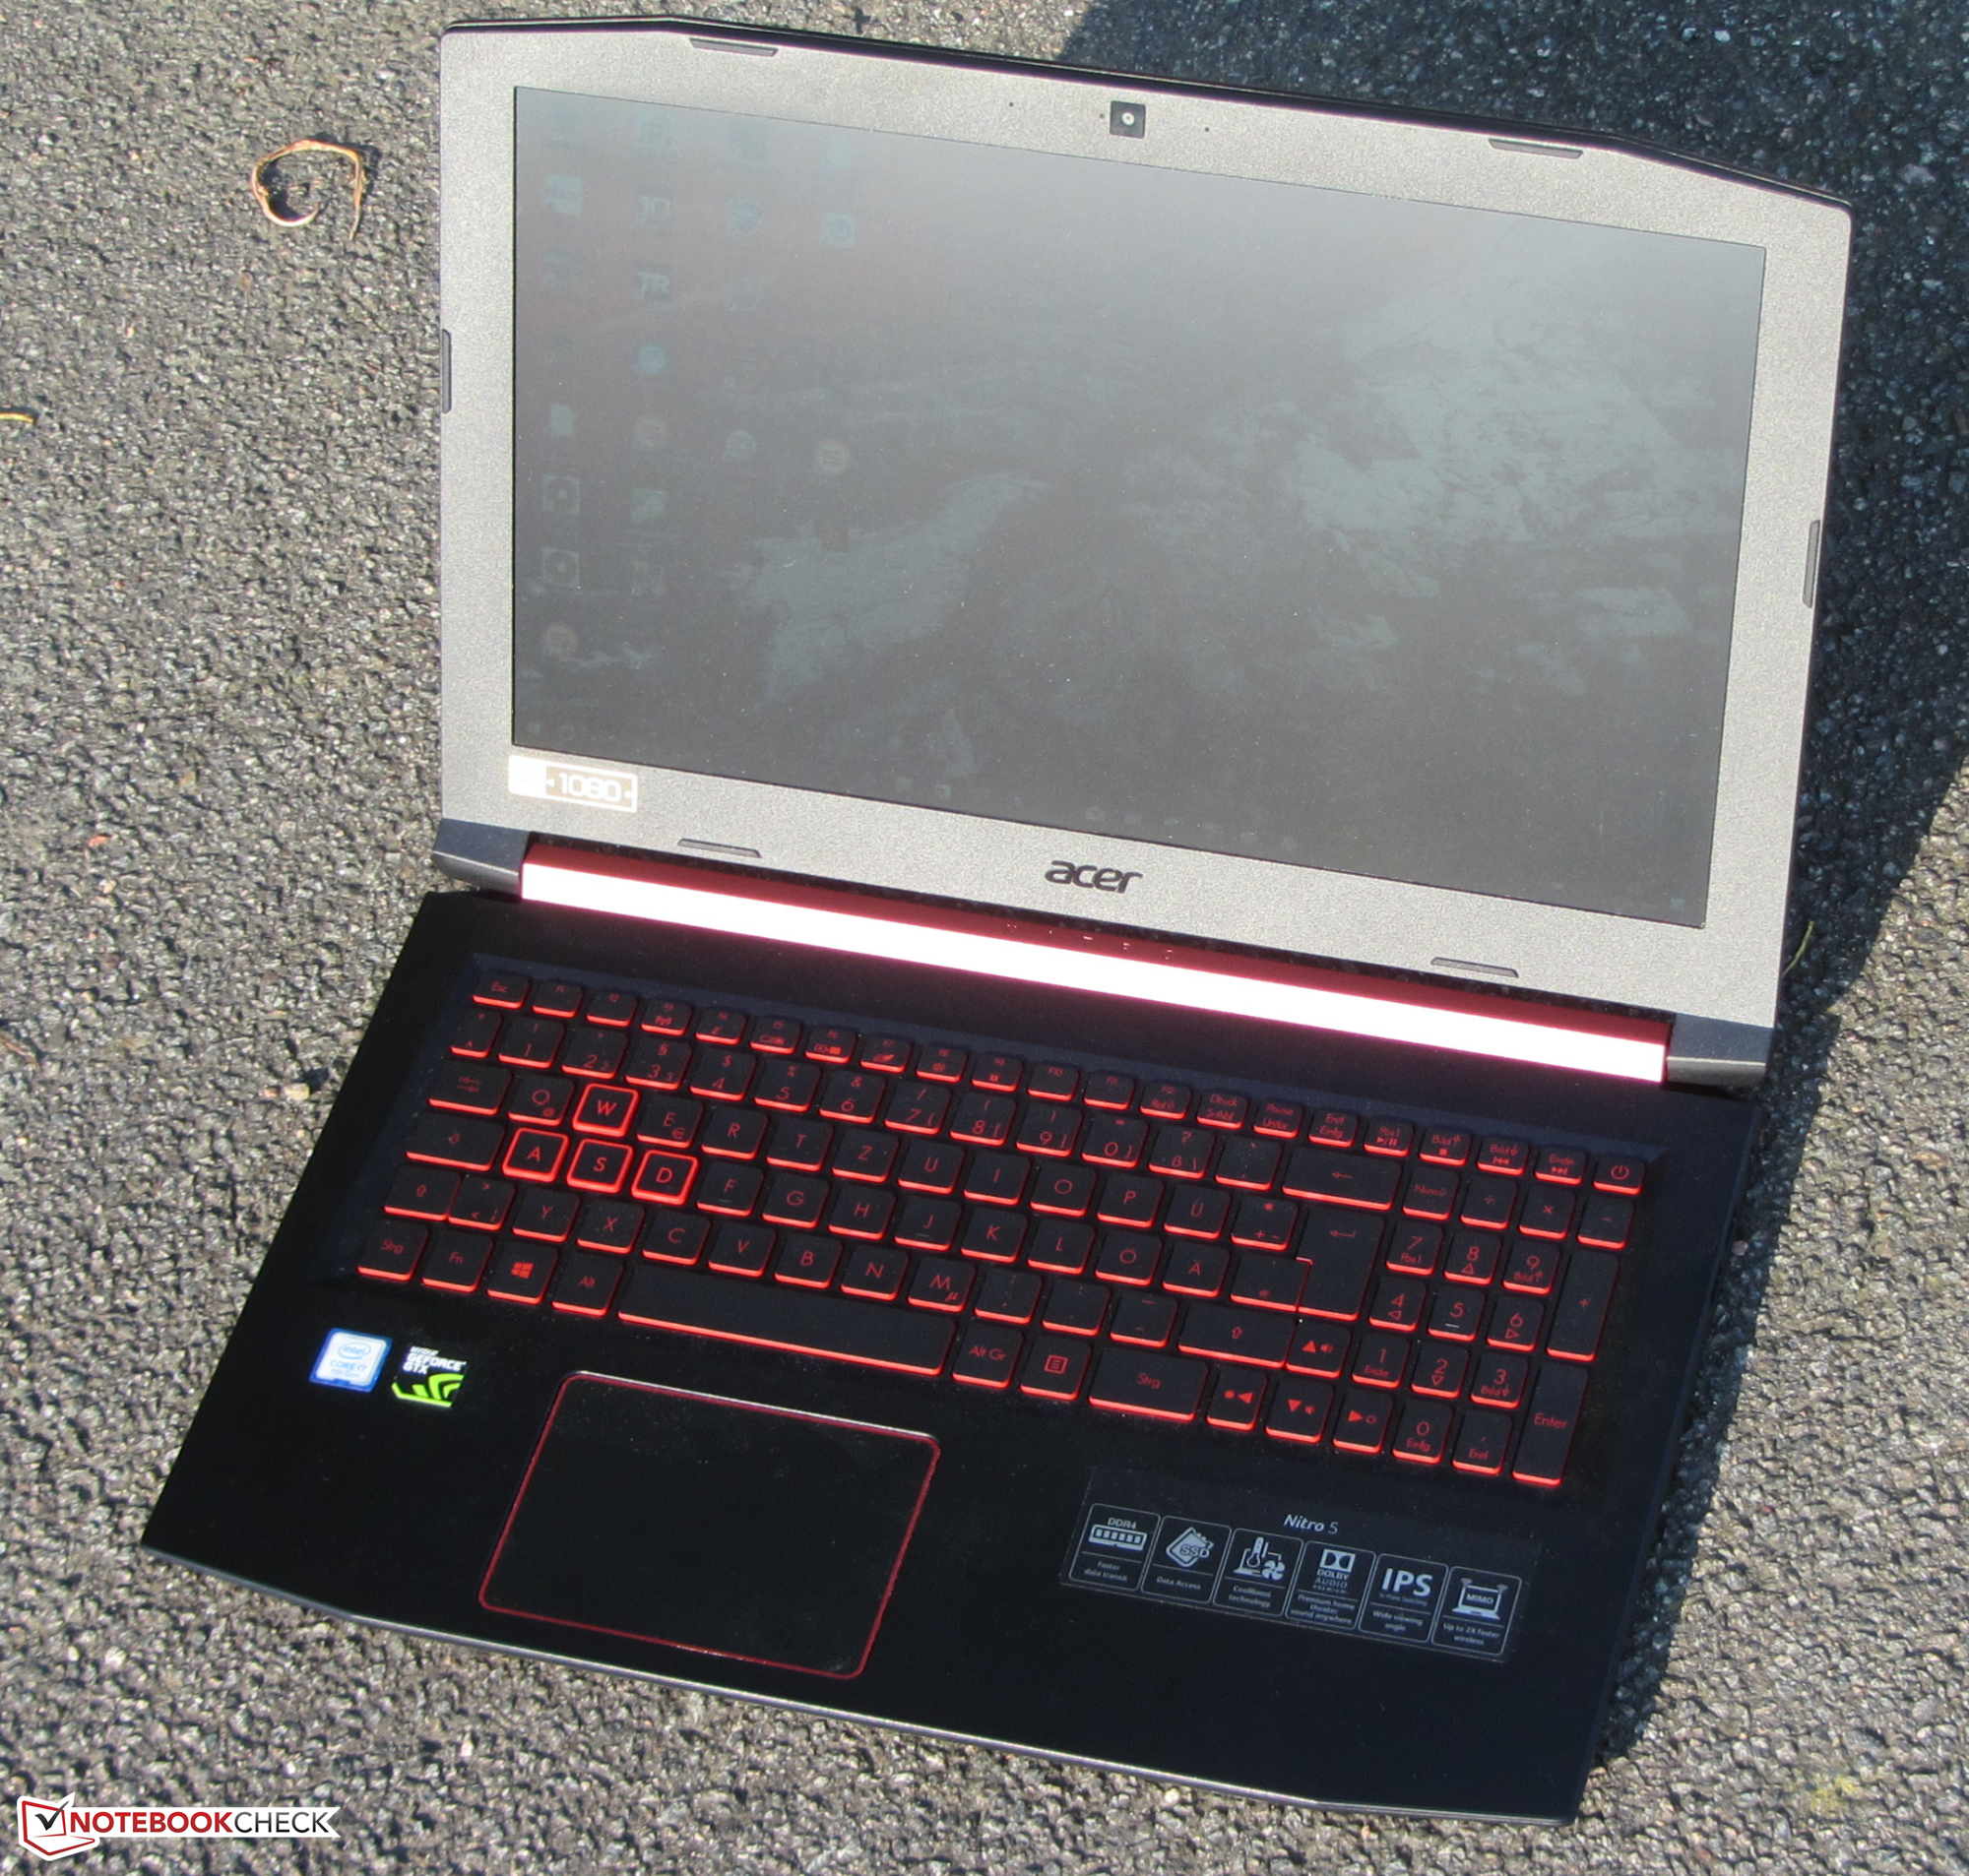
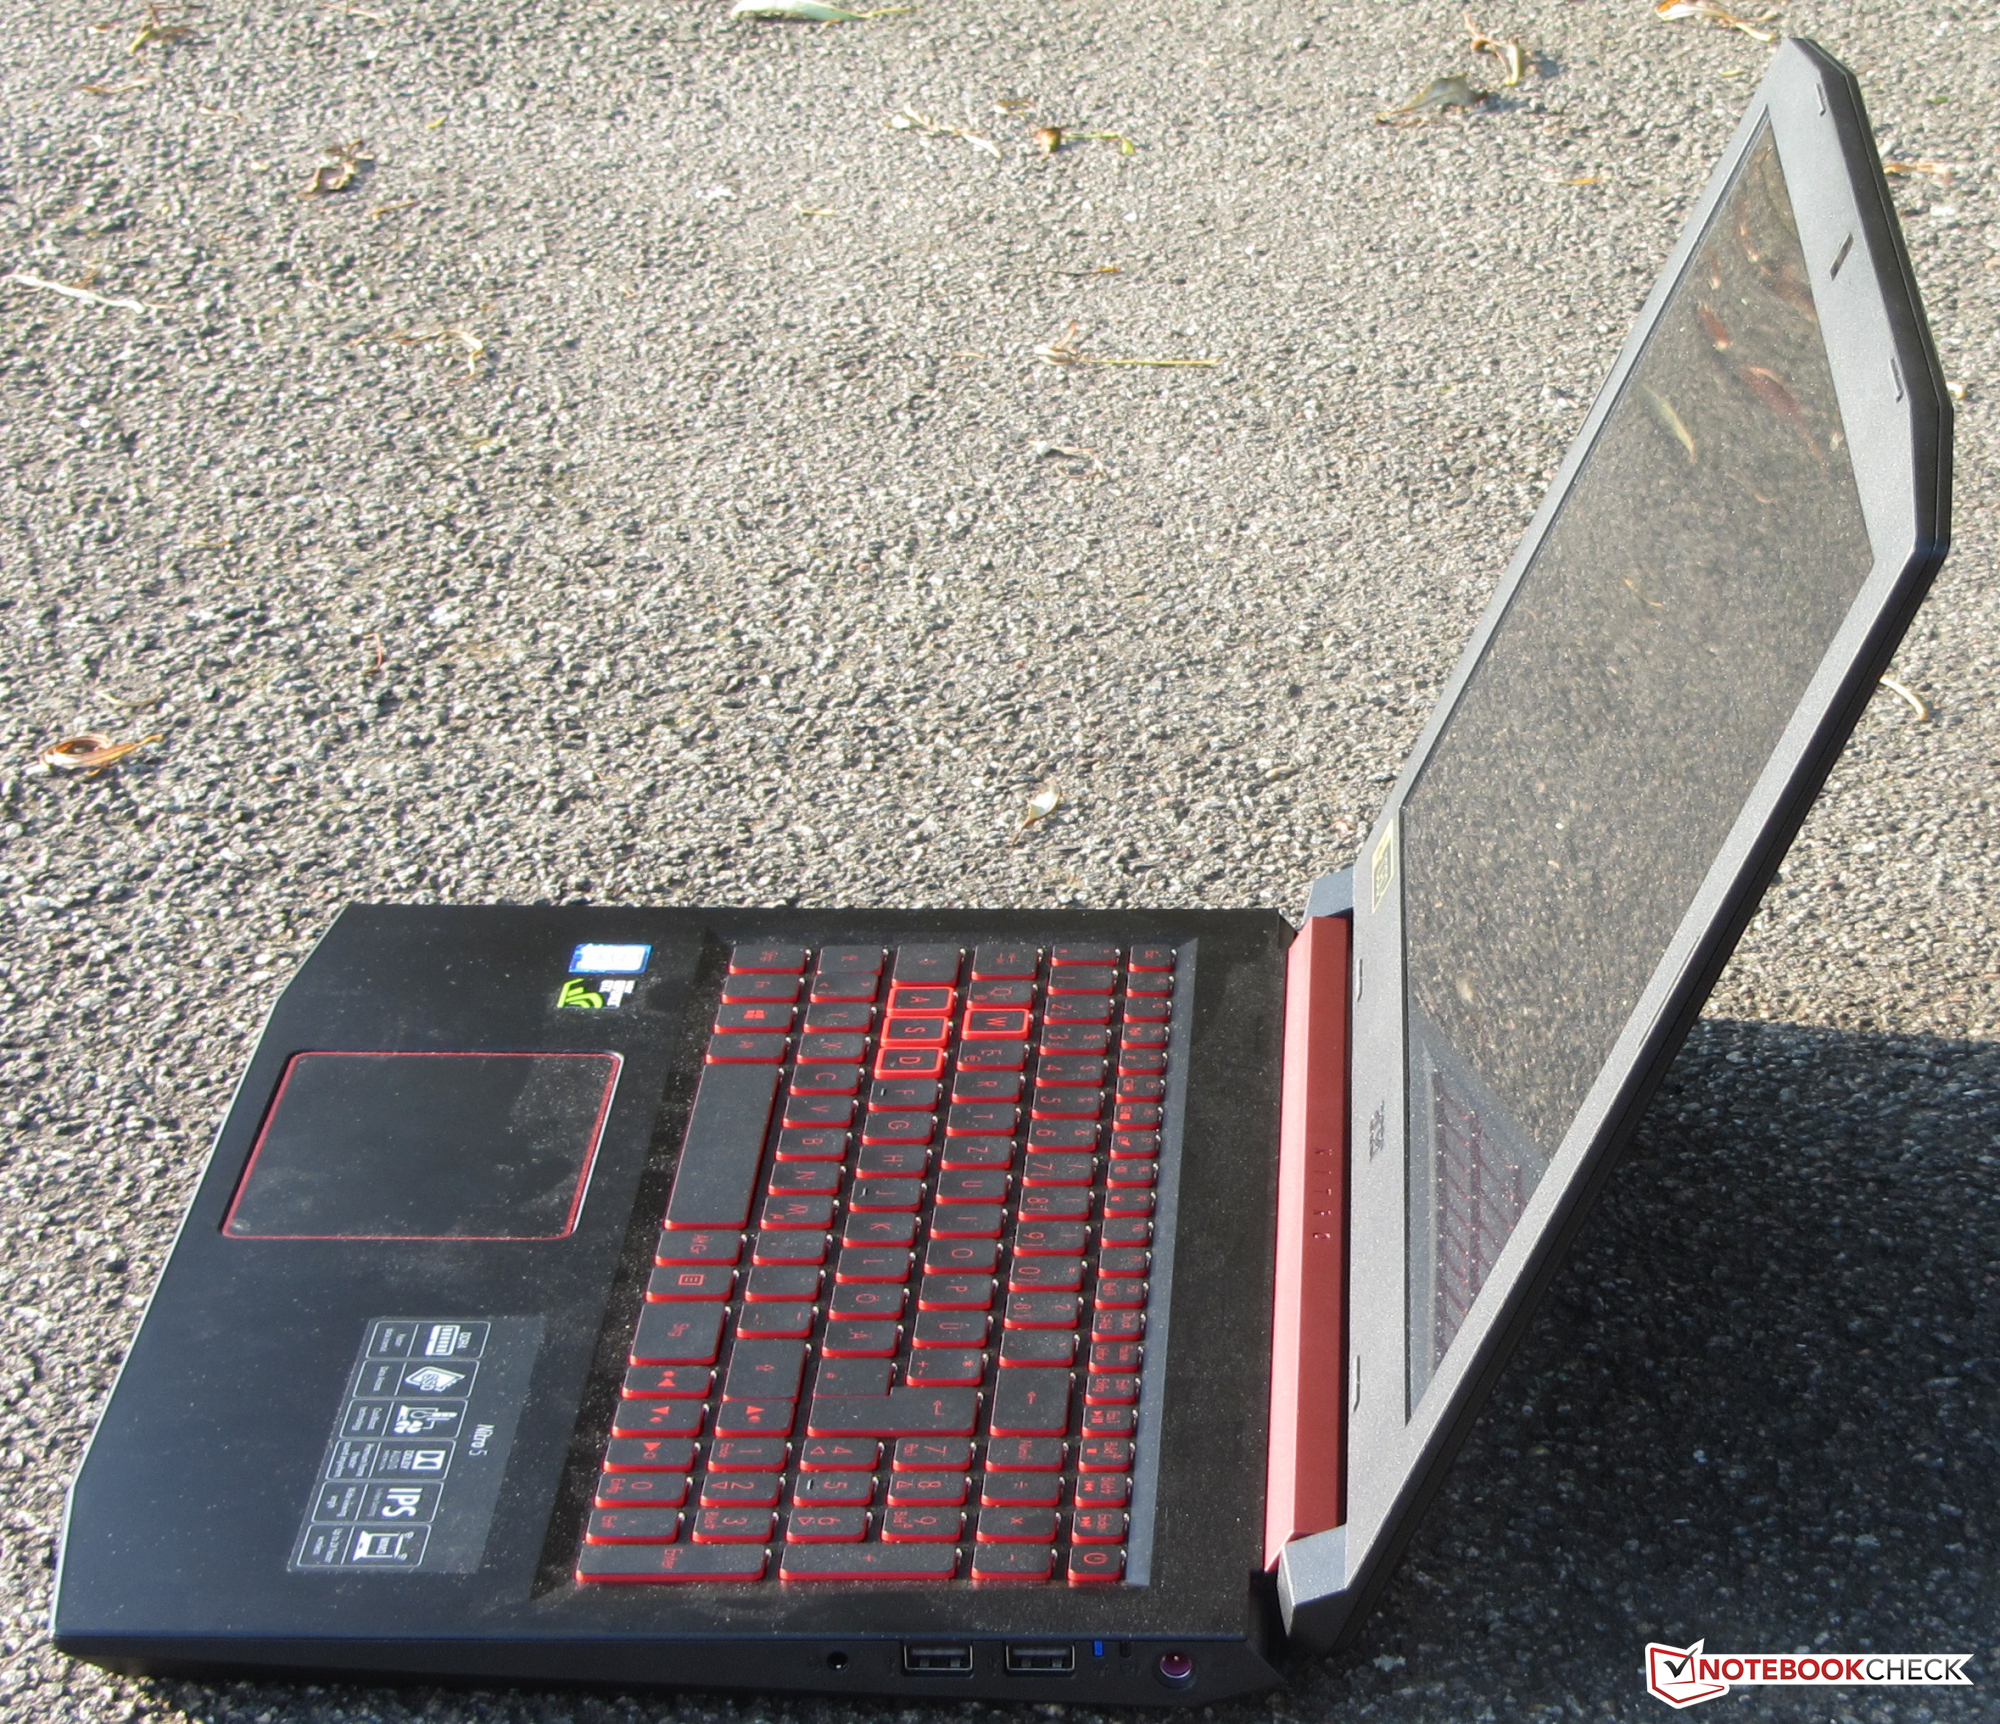
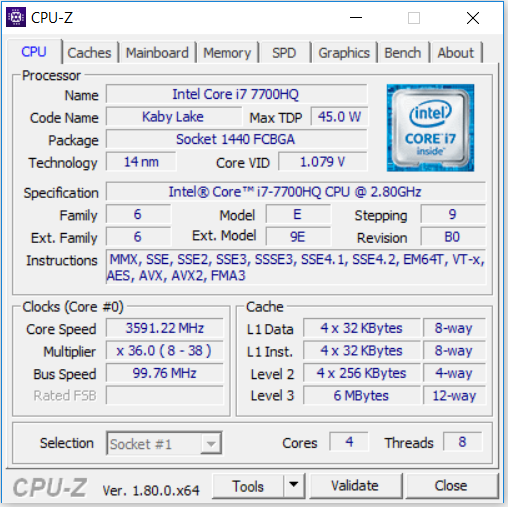
"Portátil potente para el juego casual" - así describe Acer el Nitro 5 - una descripción muy adecuada. El procesador Core i7 usado ofrece bastante potencia de cálculo para todas las áreas de uso importante. Combinado con la GPU GeForce GTX1050 Ti, el dispositivo puede ejecutar todos los juegos actuales en la pantalla mate Full HD. Pero tendrás que pasar sin los ajustes de calidad más altos - la GPU no da para tanto.
El Nitro 5 es un buen todoterreno centrado en los videojuegos.
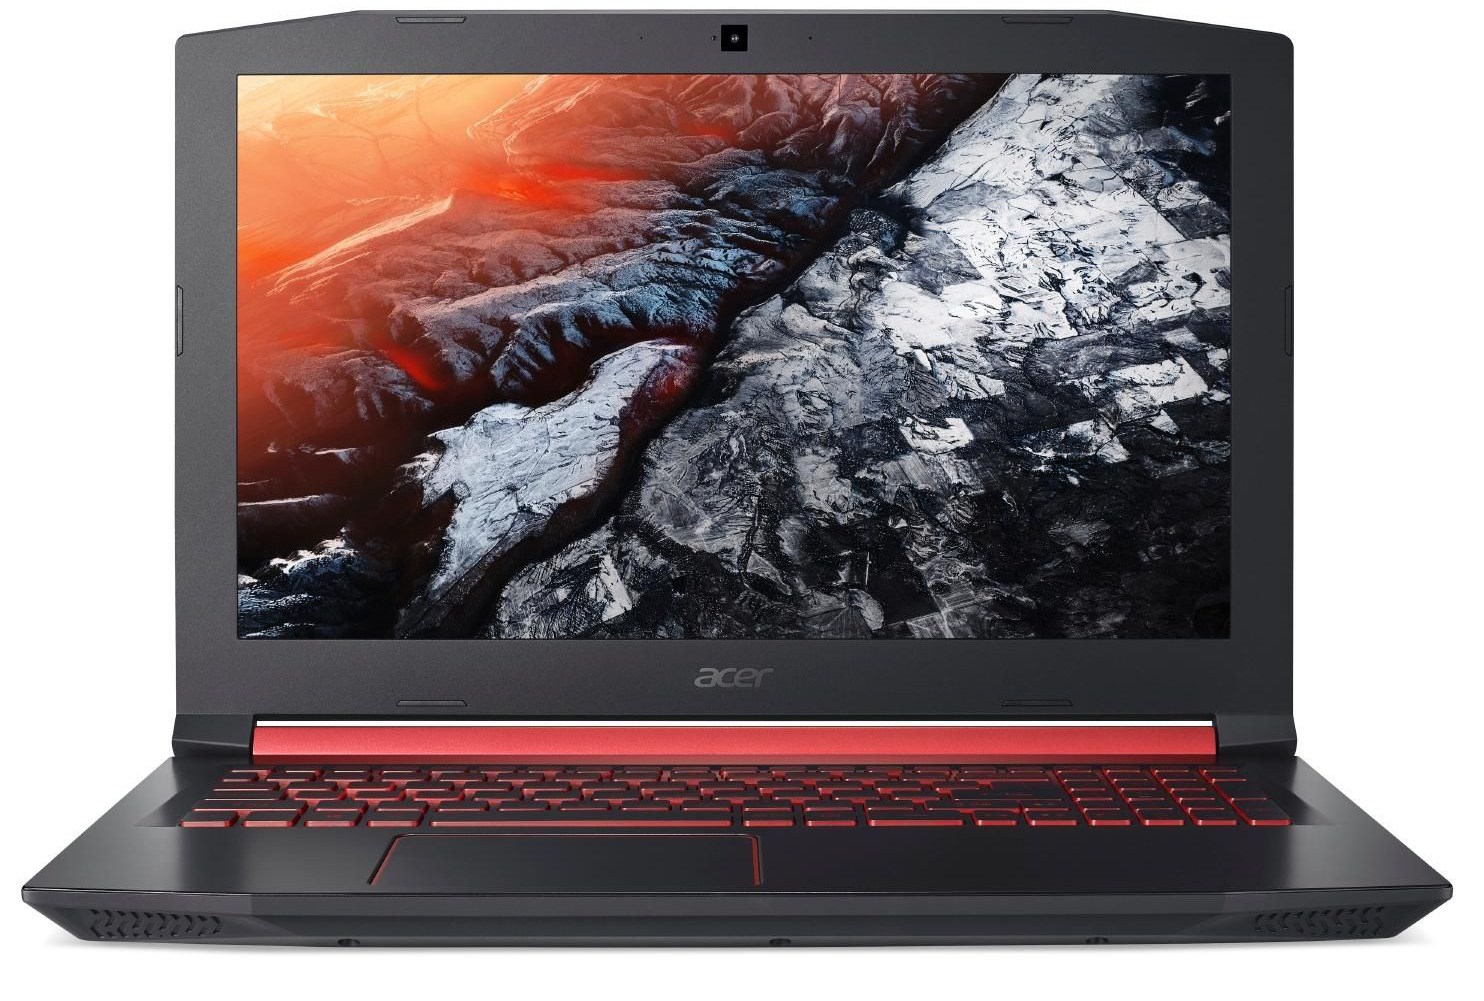
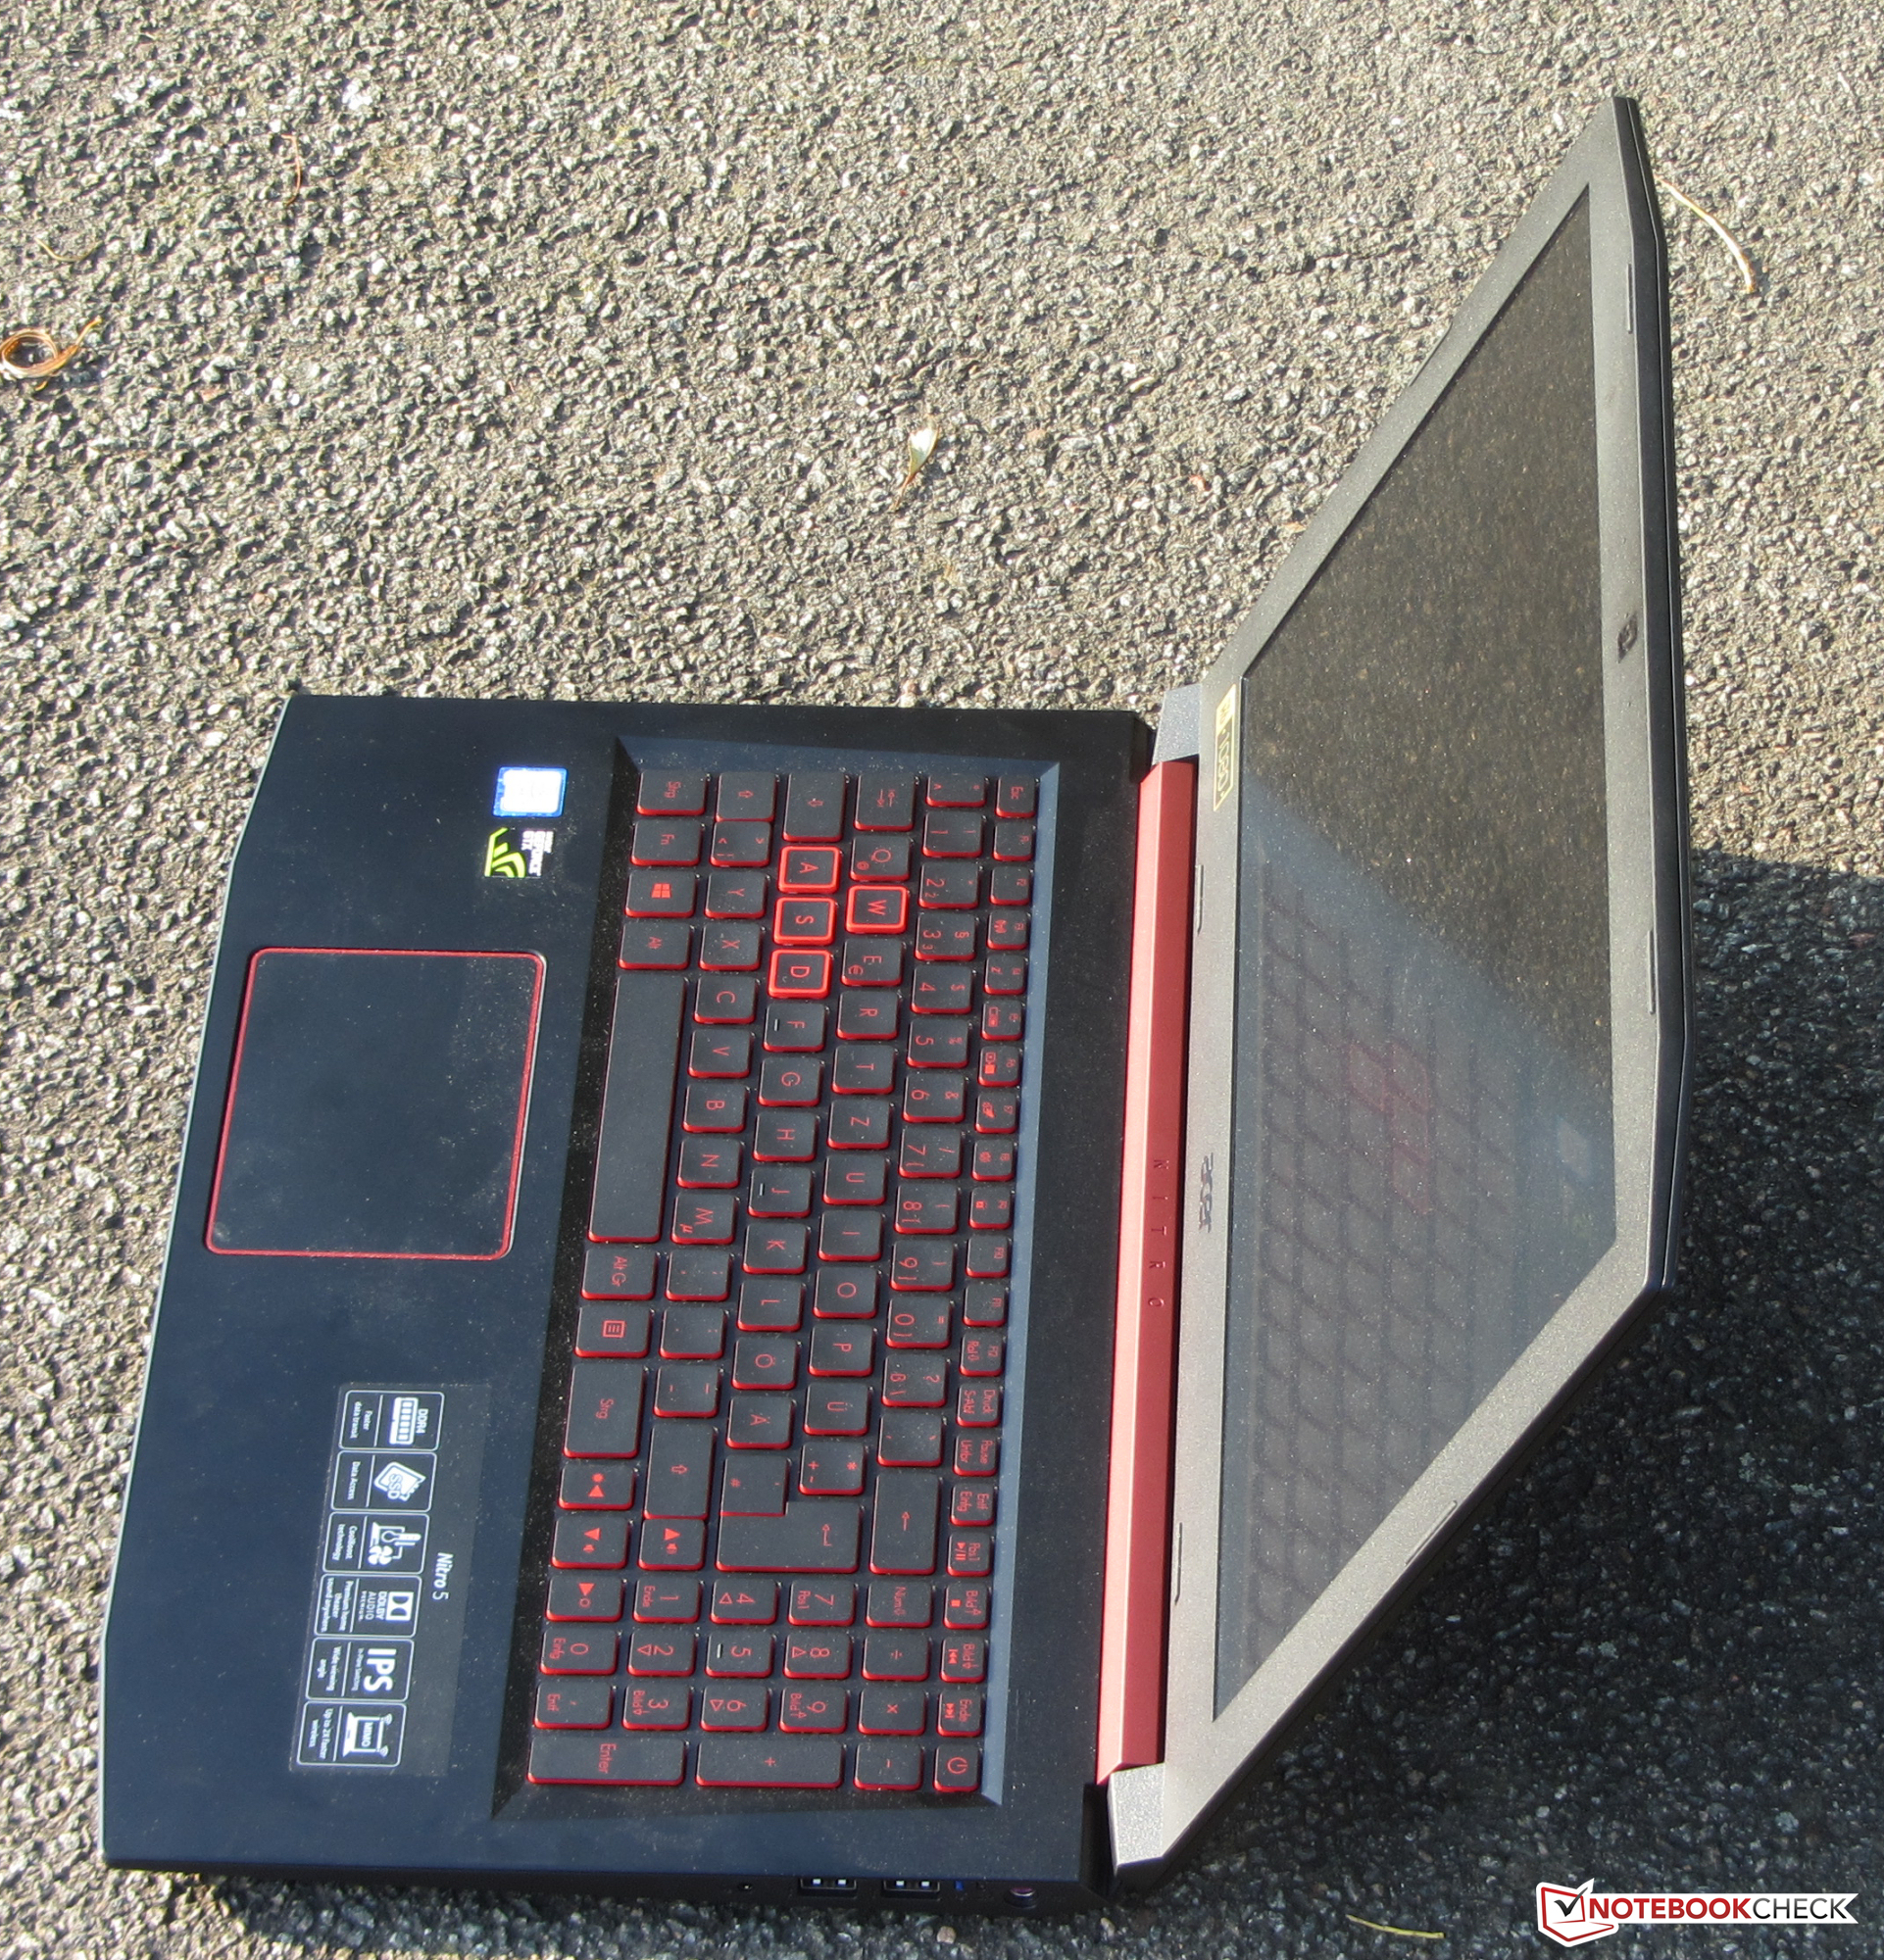
Pero el dispositivo también lo hace bien en las áreas de uso generales (oficina, Internet). Apenas hace ruido bajo carga y en inactivo, y apenas se calienta siquiera bajo carga. Además, el dispositivo tiene un teclado iluminado adecuado para el mecanografiado normal y buen aguante de batería. El veloz SSD asegura un sistema fluido que puede usar un HDD de 2.5" para el almacenamiento.
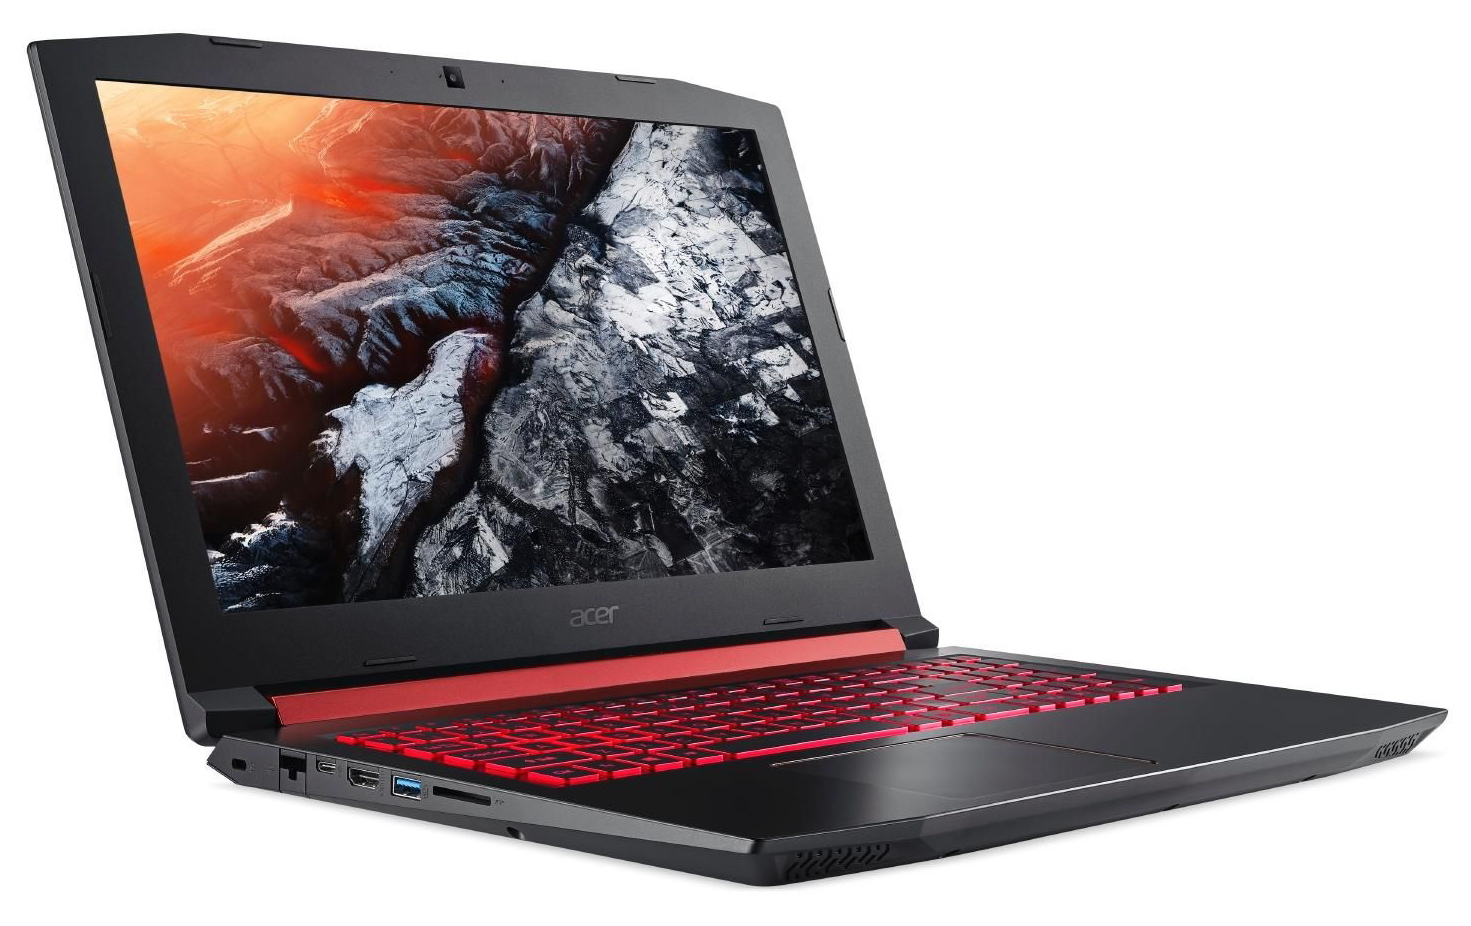
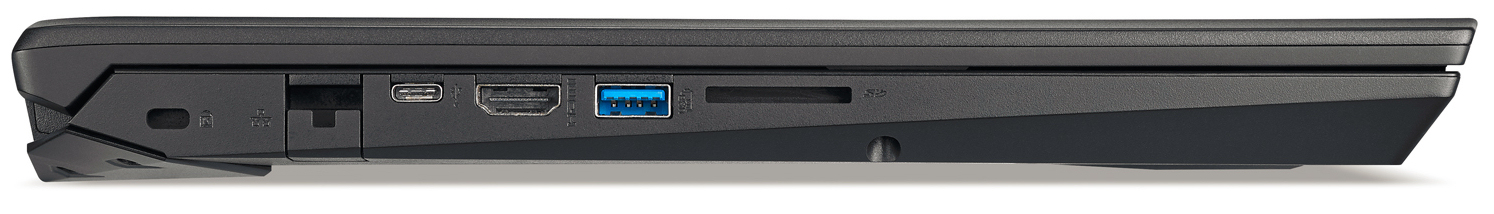
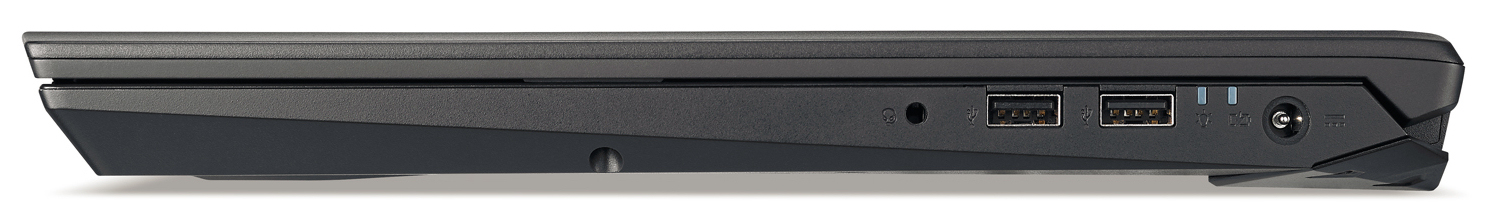
El display mate IPS tiene ángulo de visión estable y buen contraste. El brillo es mejorable, empero. También creemos que el fabricante podría haberse estirado más en la conectividad. Por $1080, debería traer un puerto Thunderbolt 3 y un DisplayPort. El fuerte ruido del ventilador bajo carga también podría mejorarse.
Ésta es una versión acortada del análisis original. Puedes leer el análisis completo en inglés aquí.
Acer Nitro 5 AN515-51-788E
- 08/07/2018 v6 (old)
Sascha Mölck