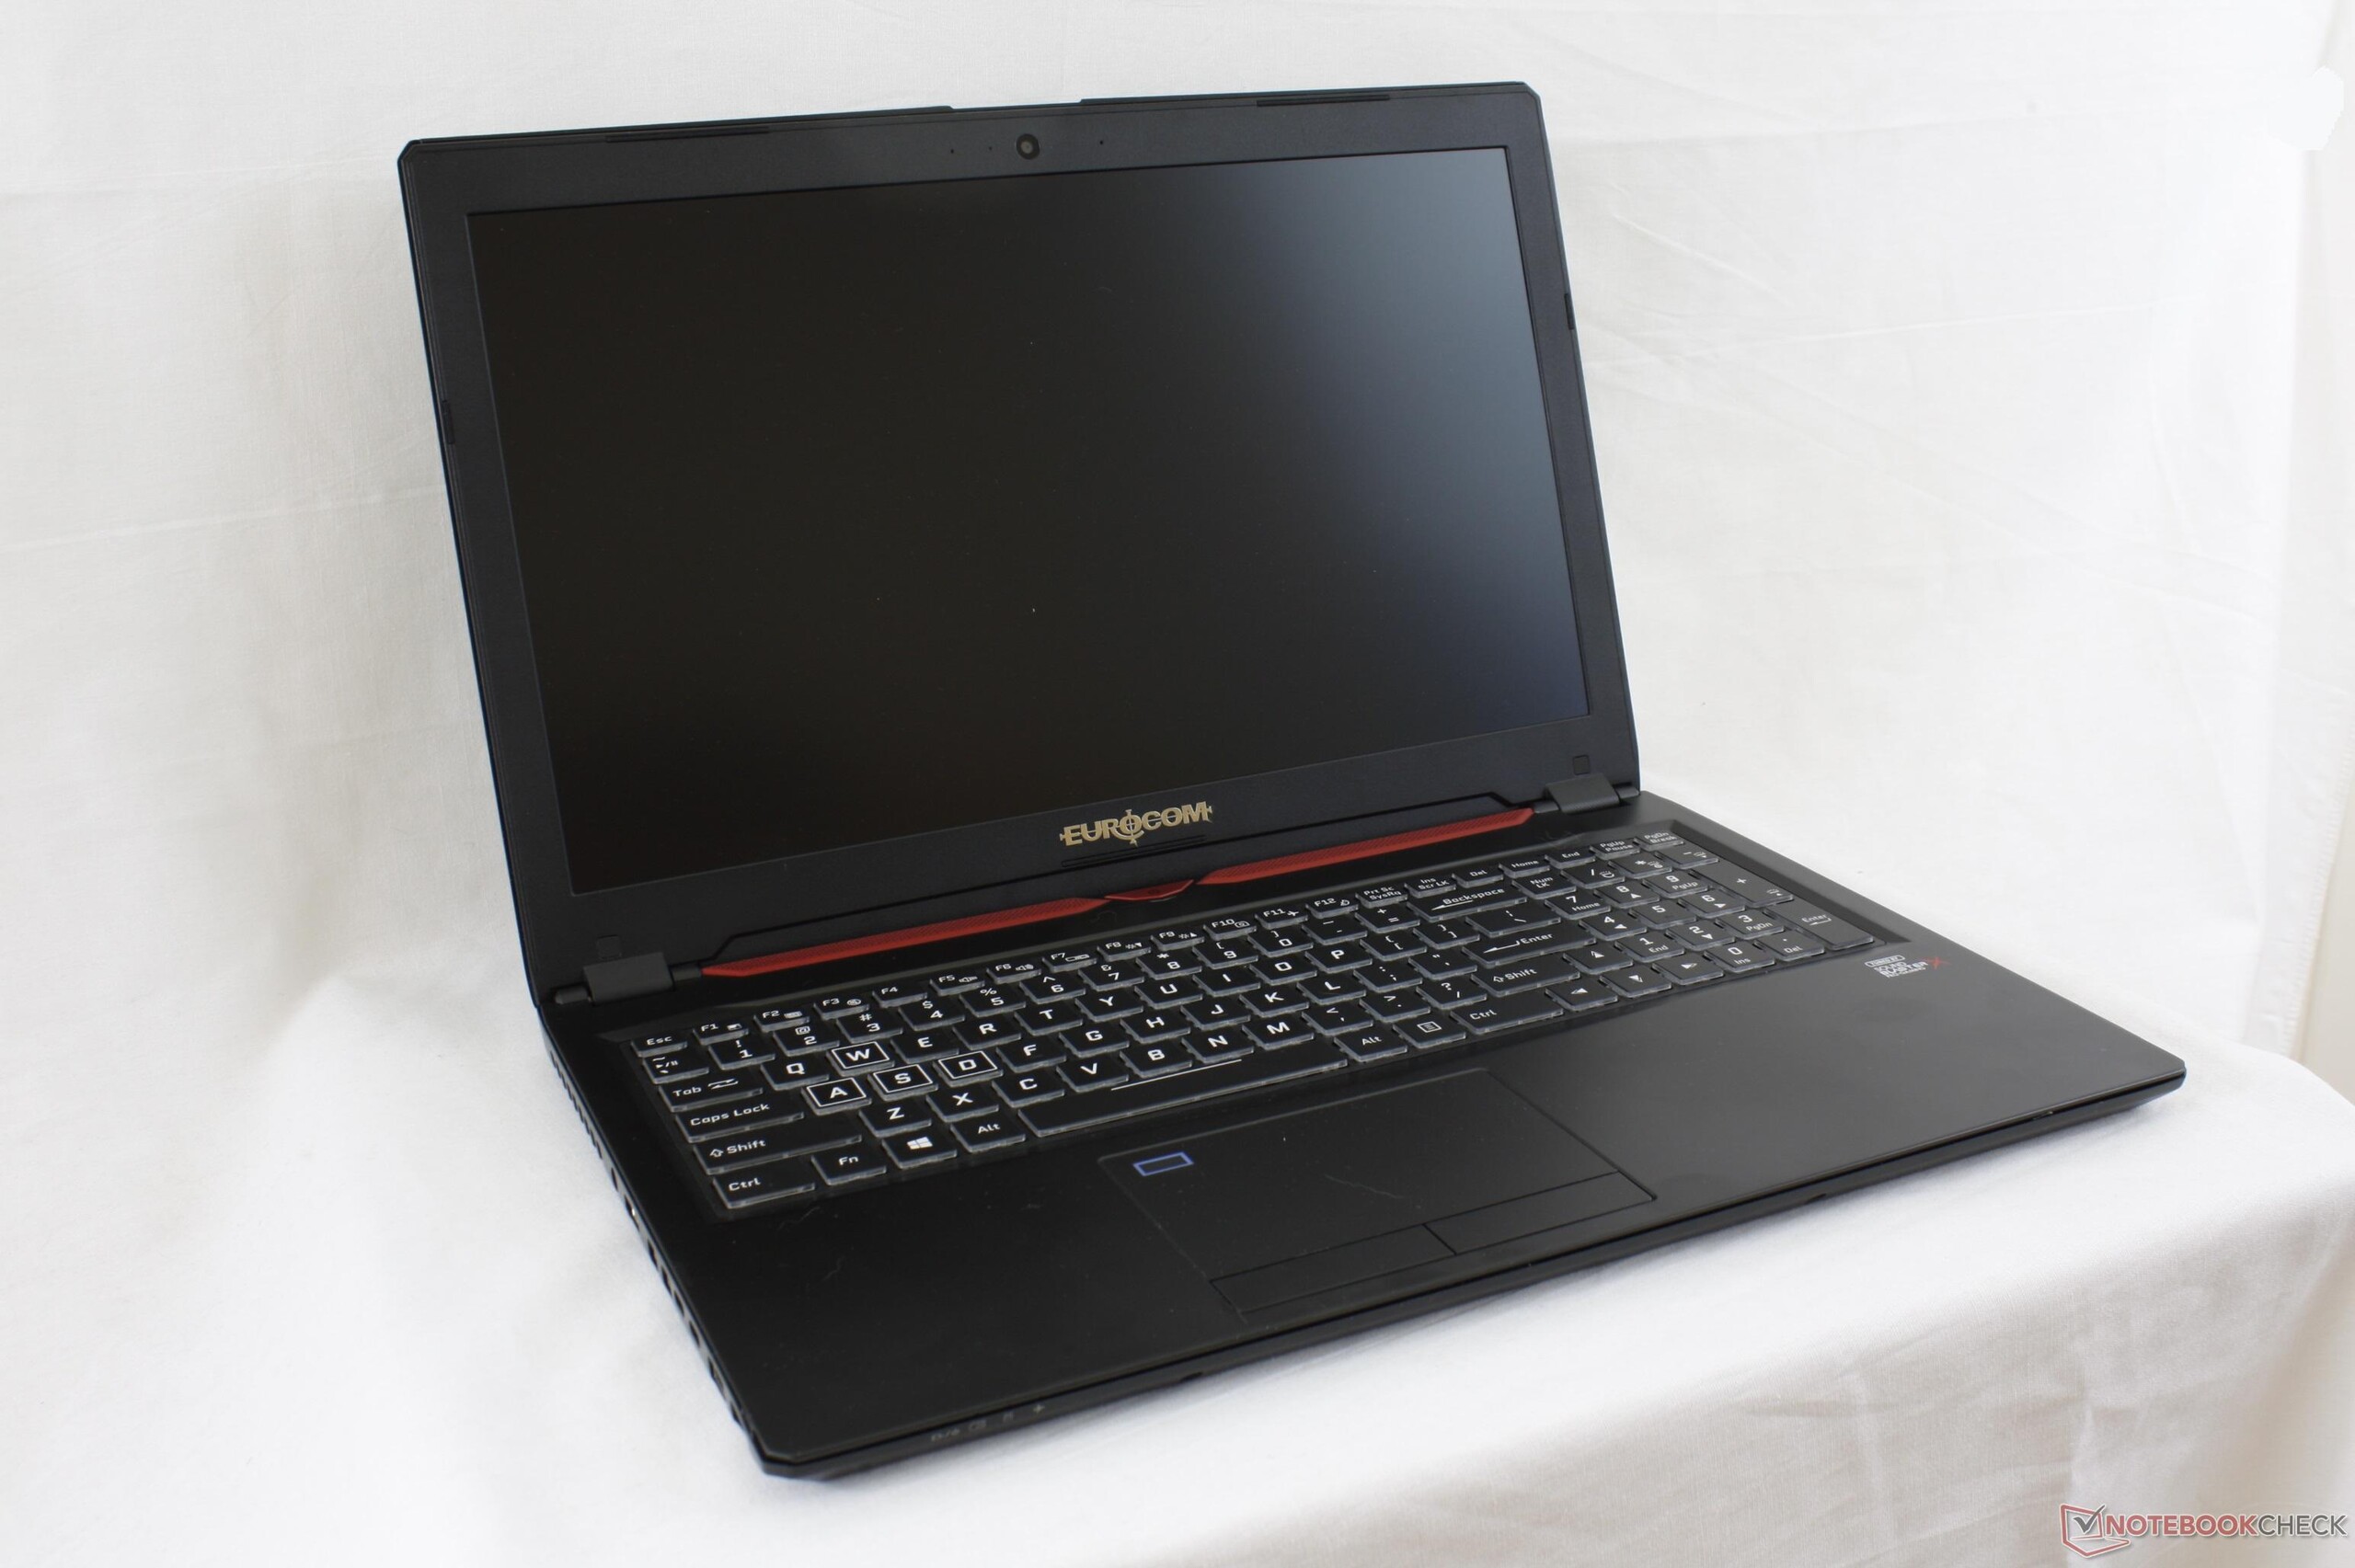
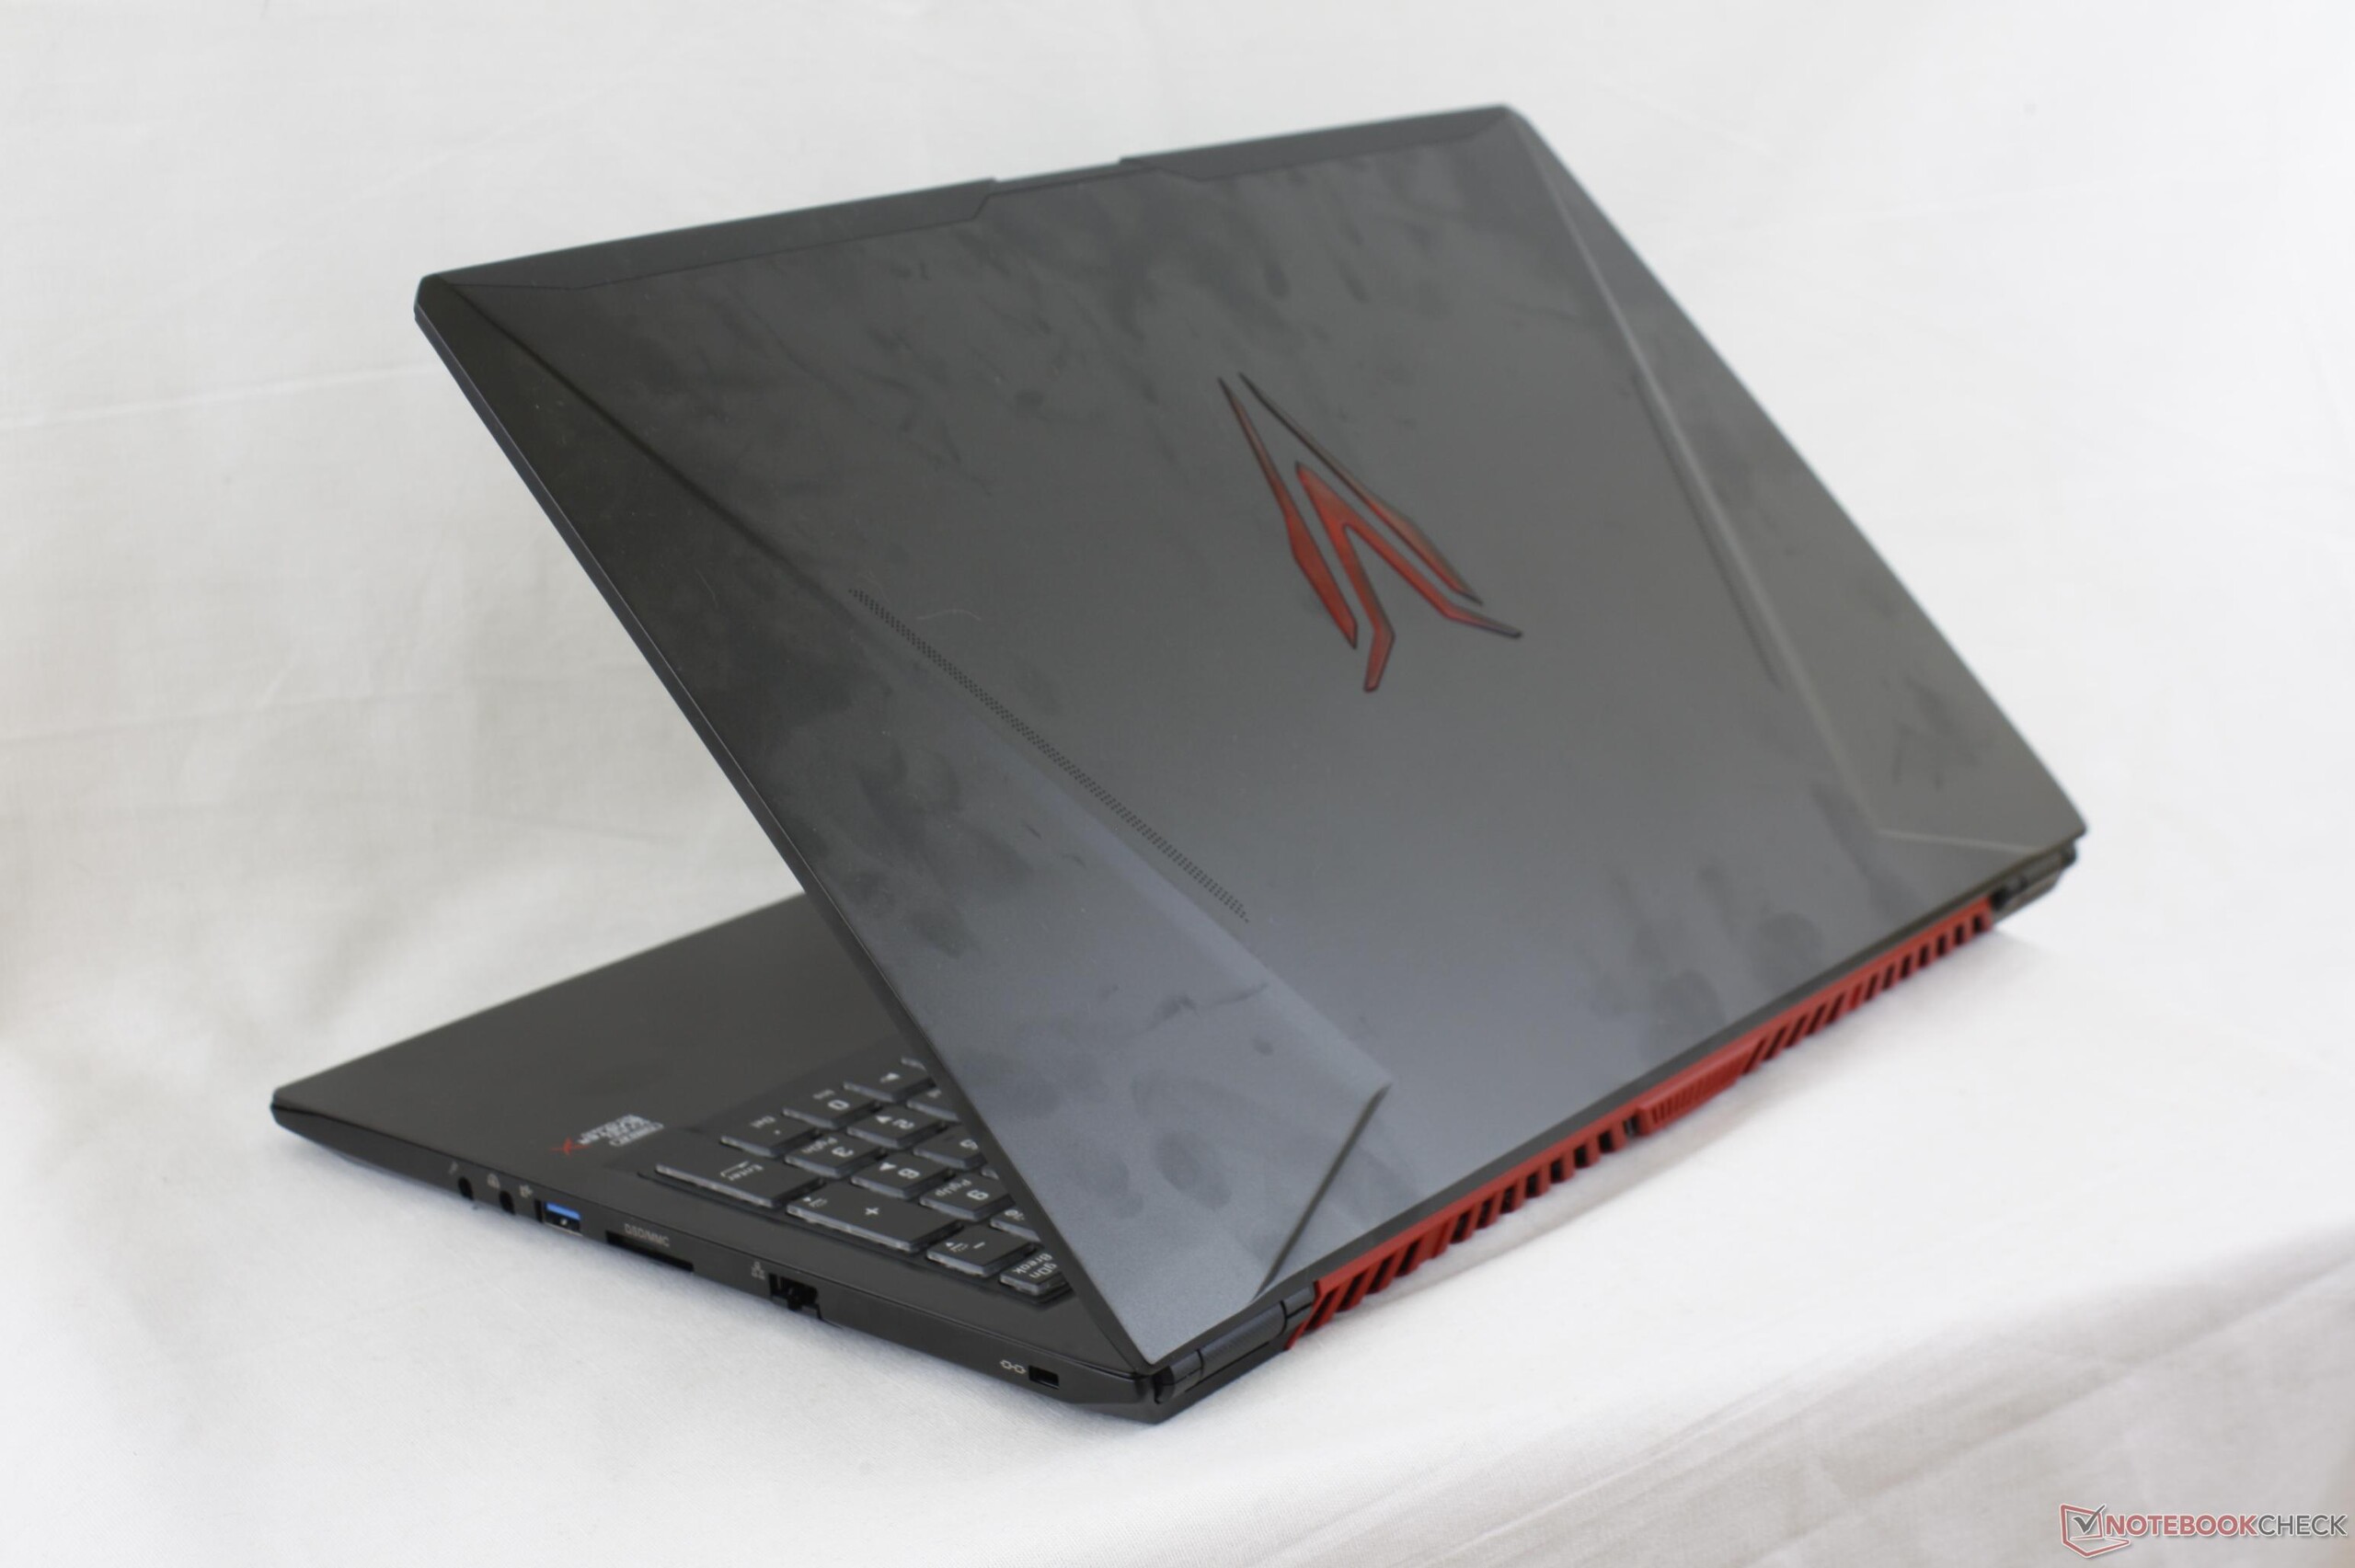
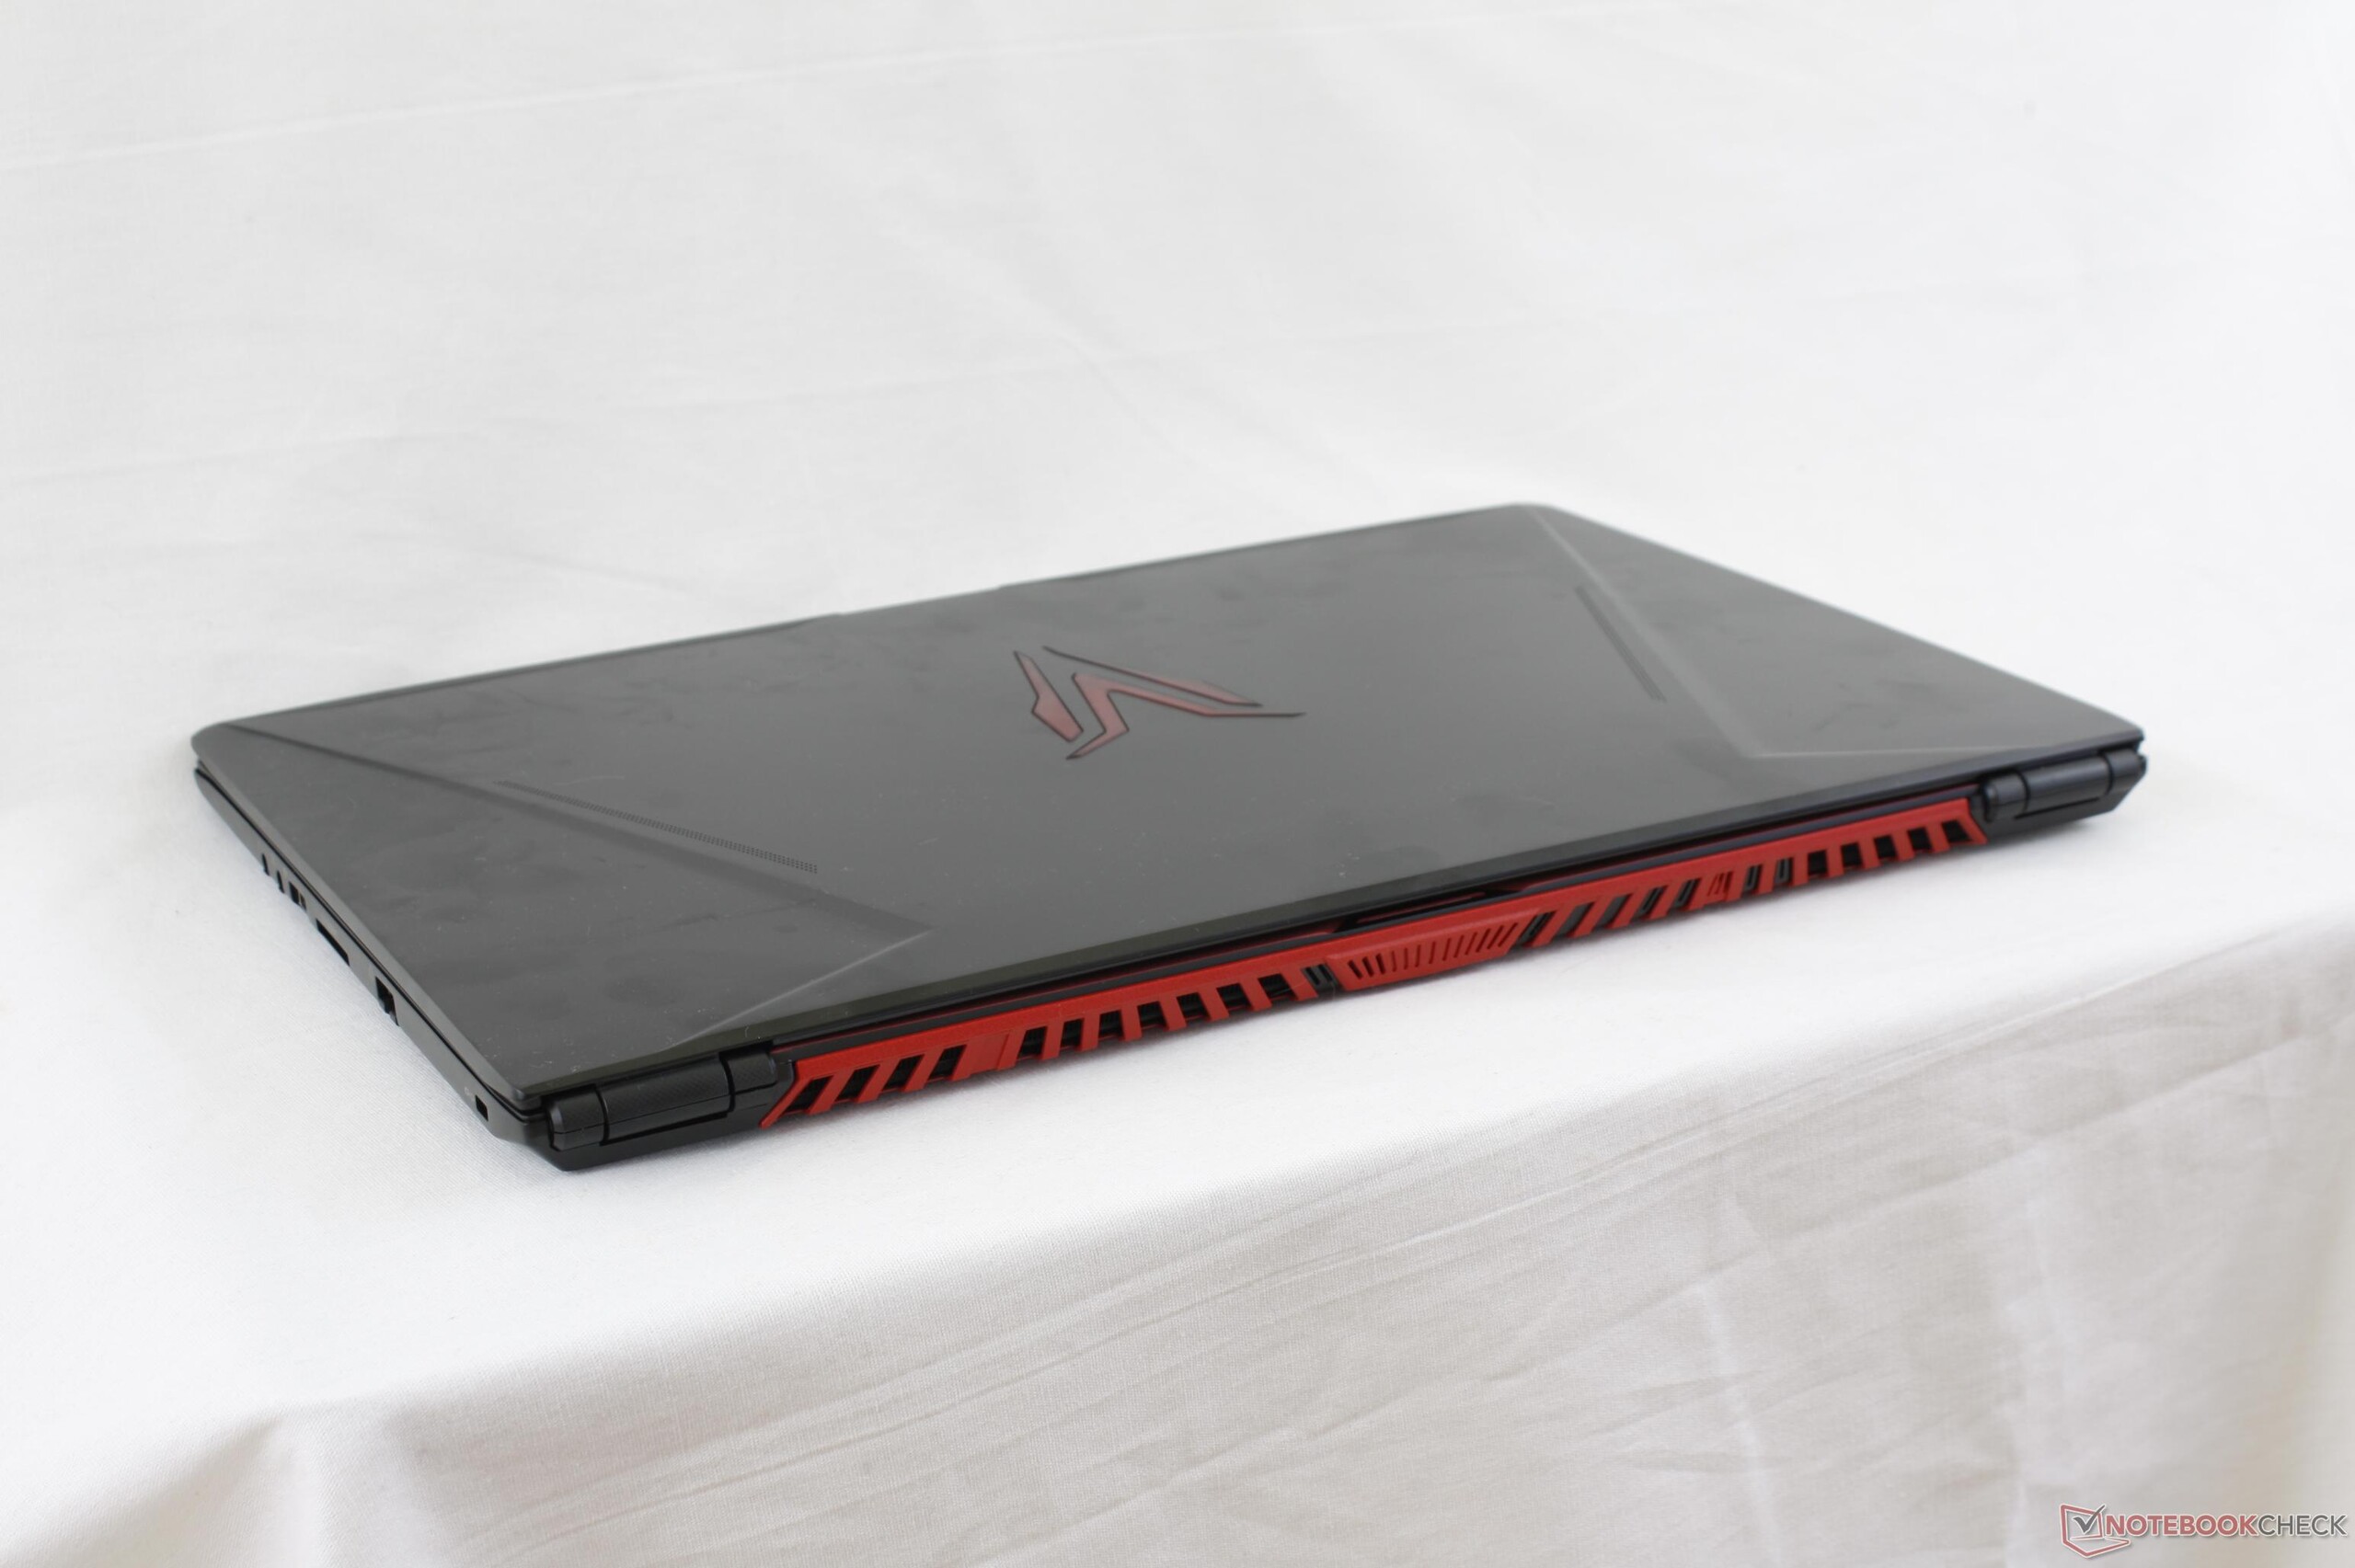
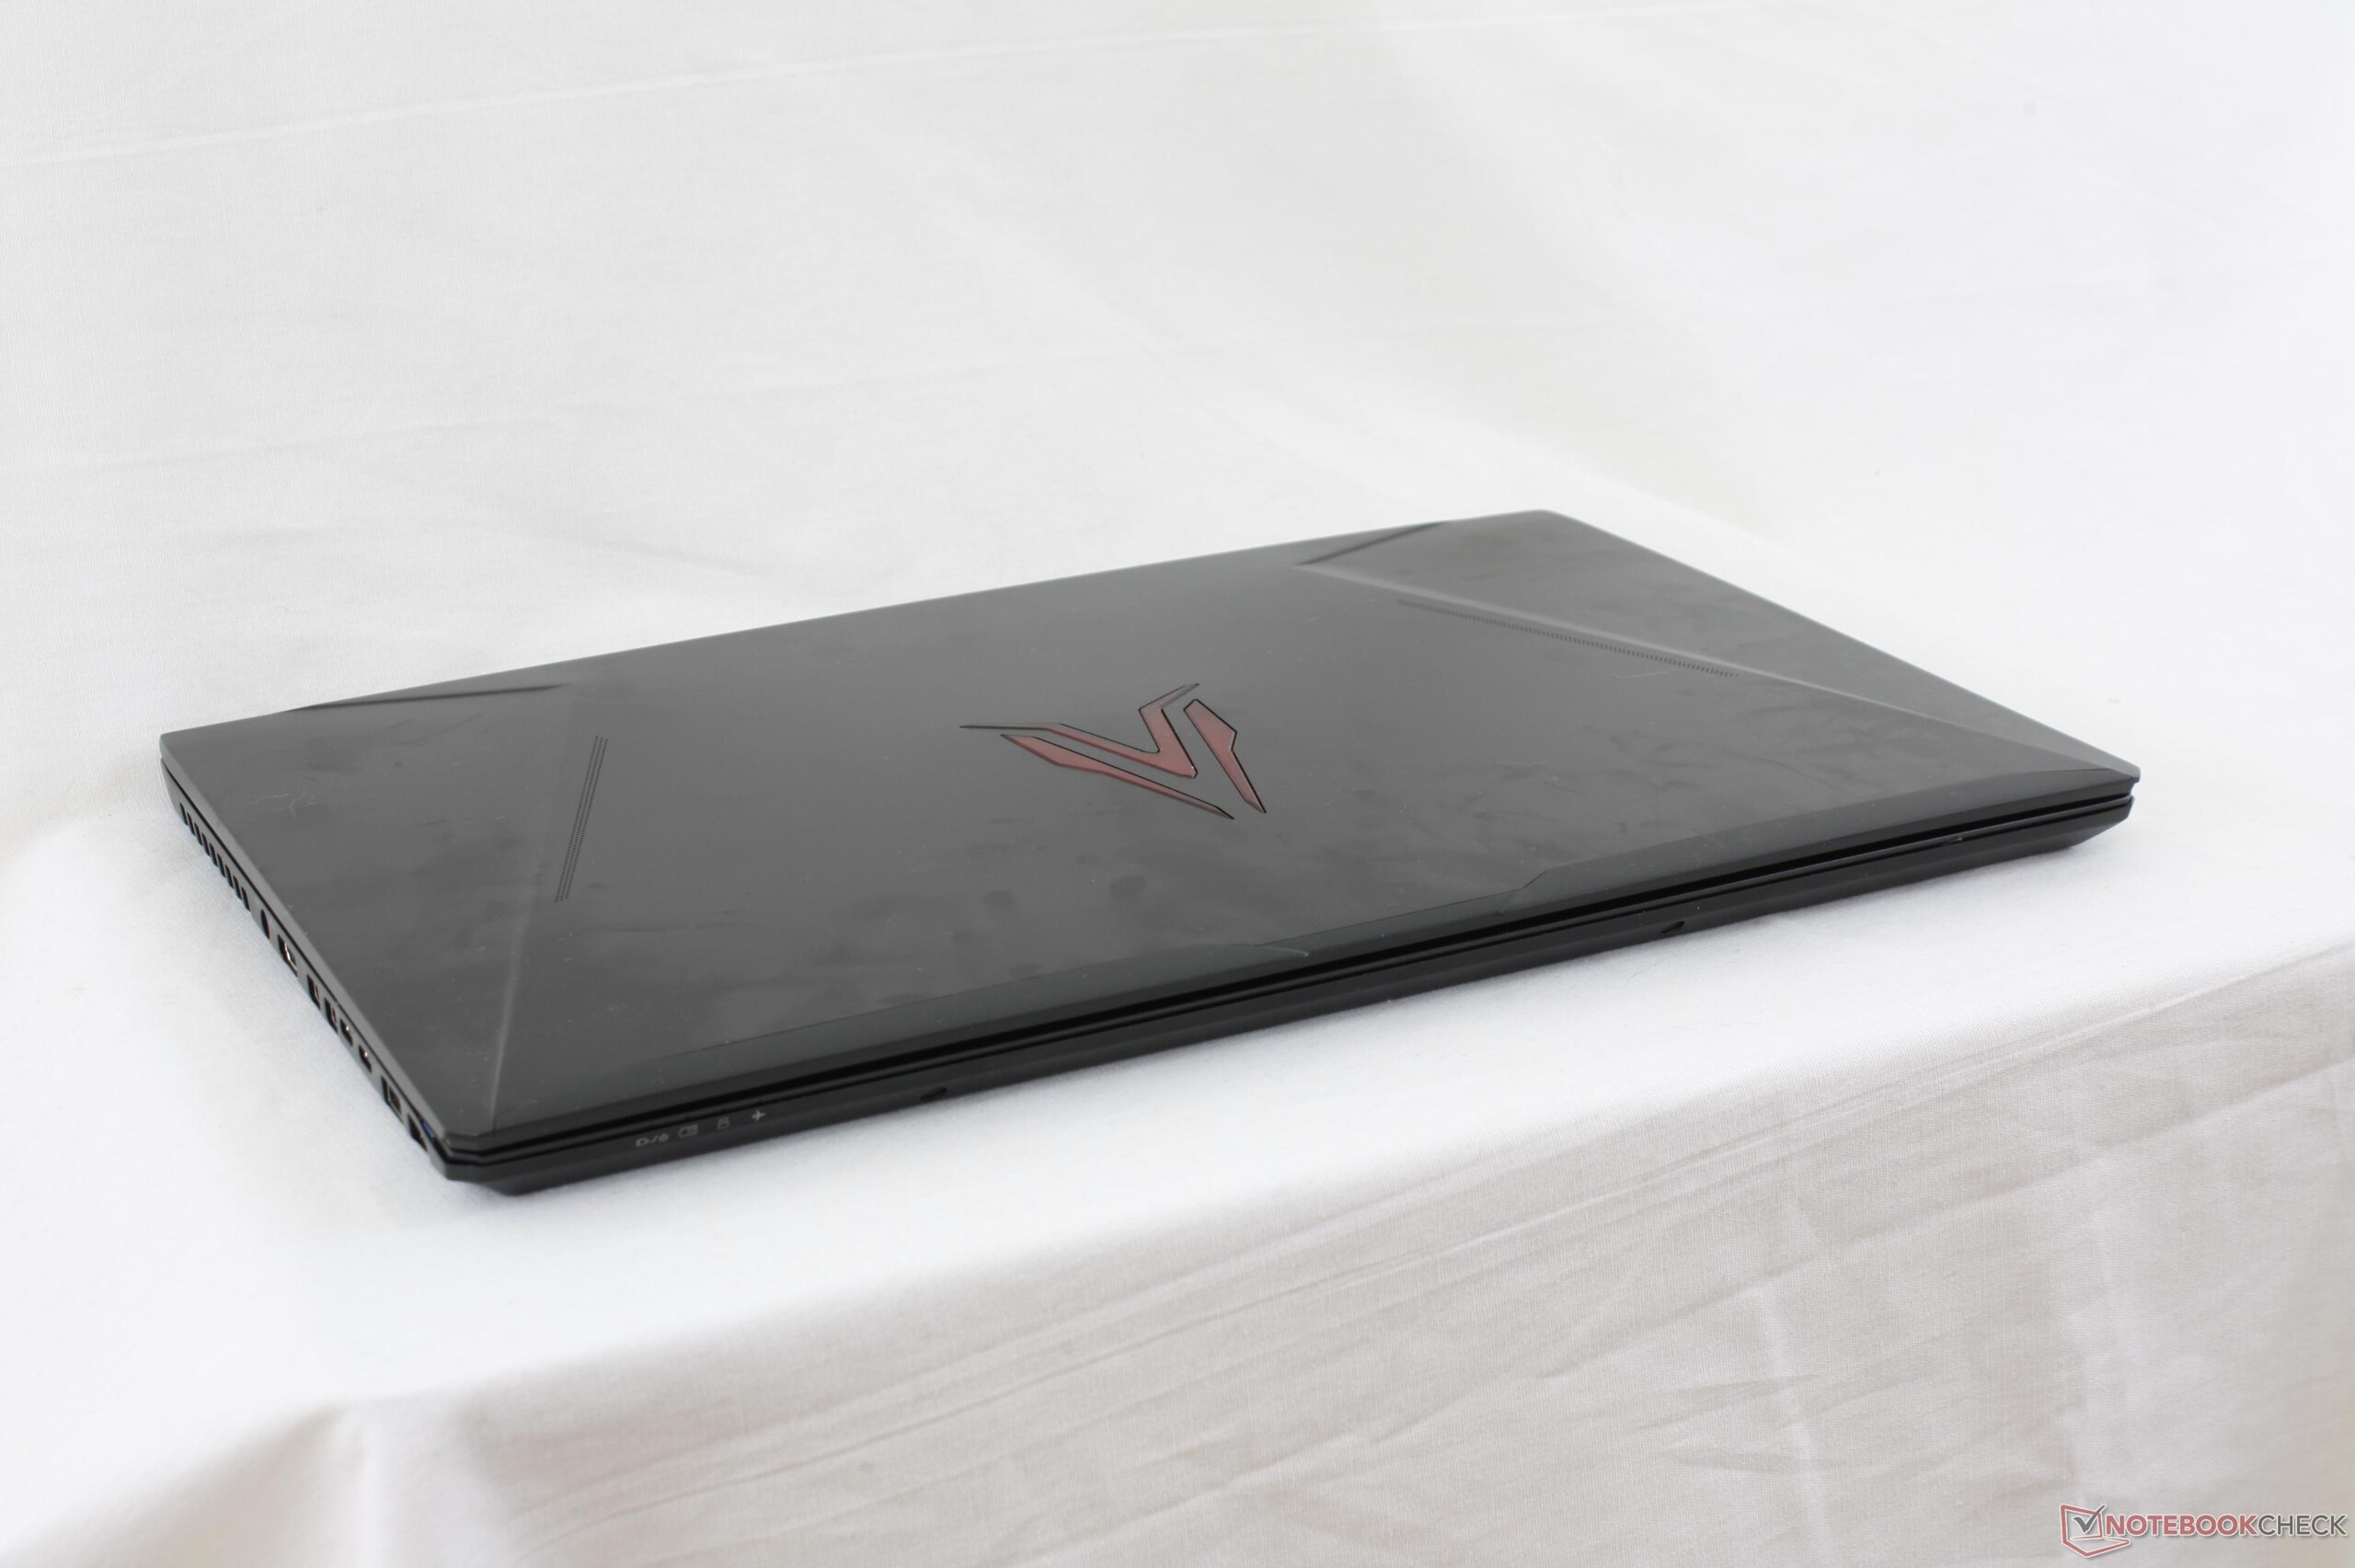
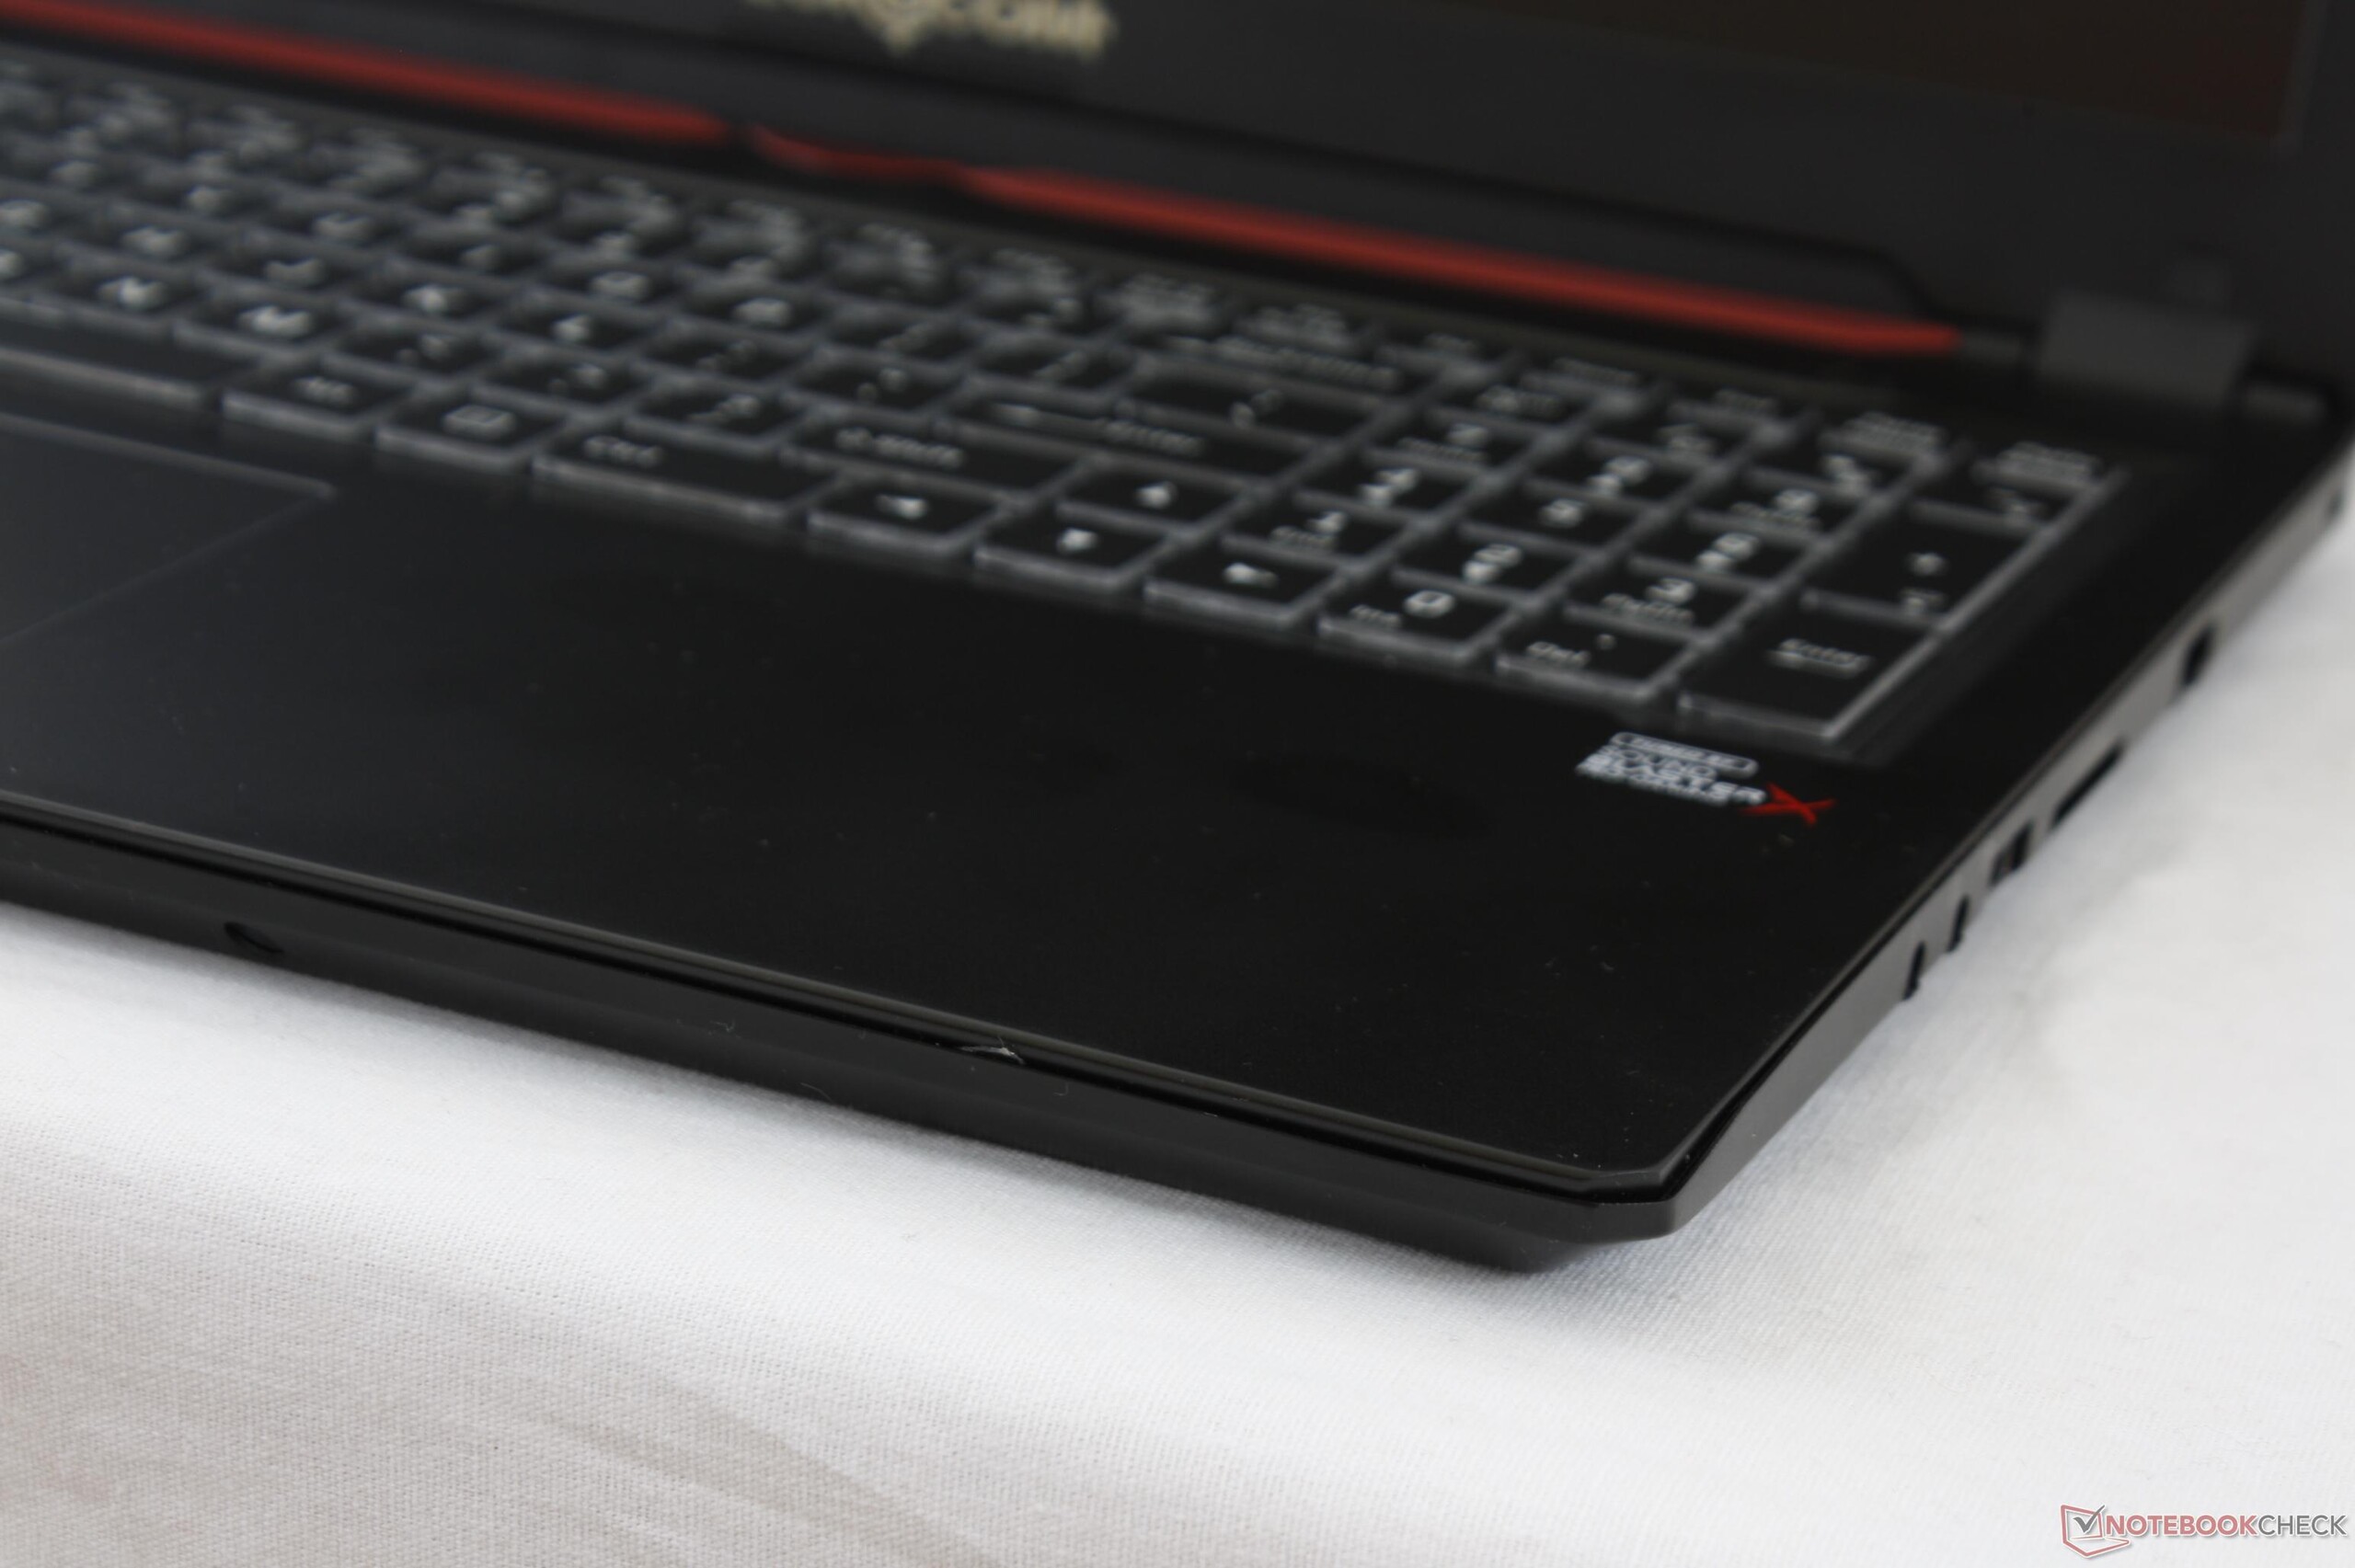
Breve análisis del portátil Eurocom Q5 (Clevo P957HR, i7-7700HQ, GTX 1070 Max-Q)
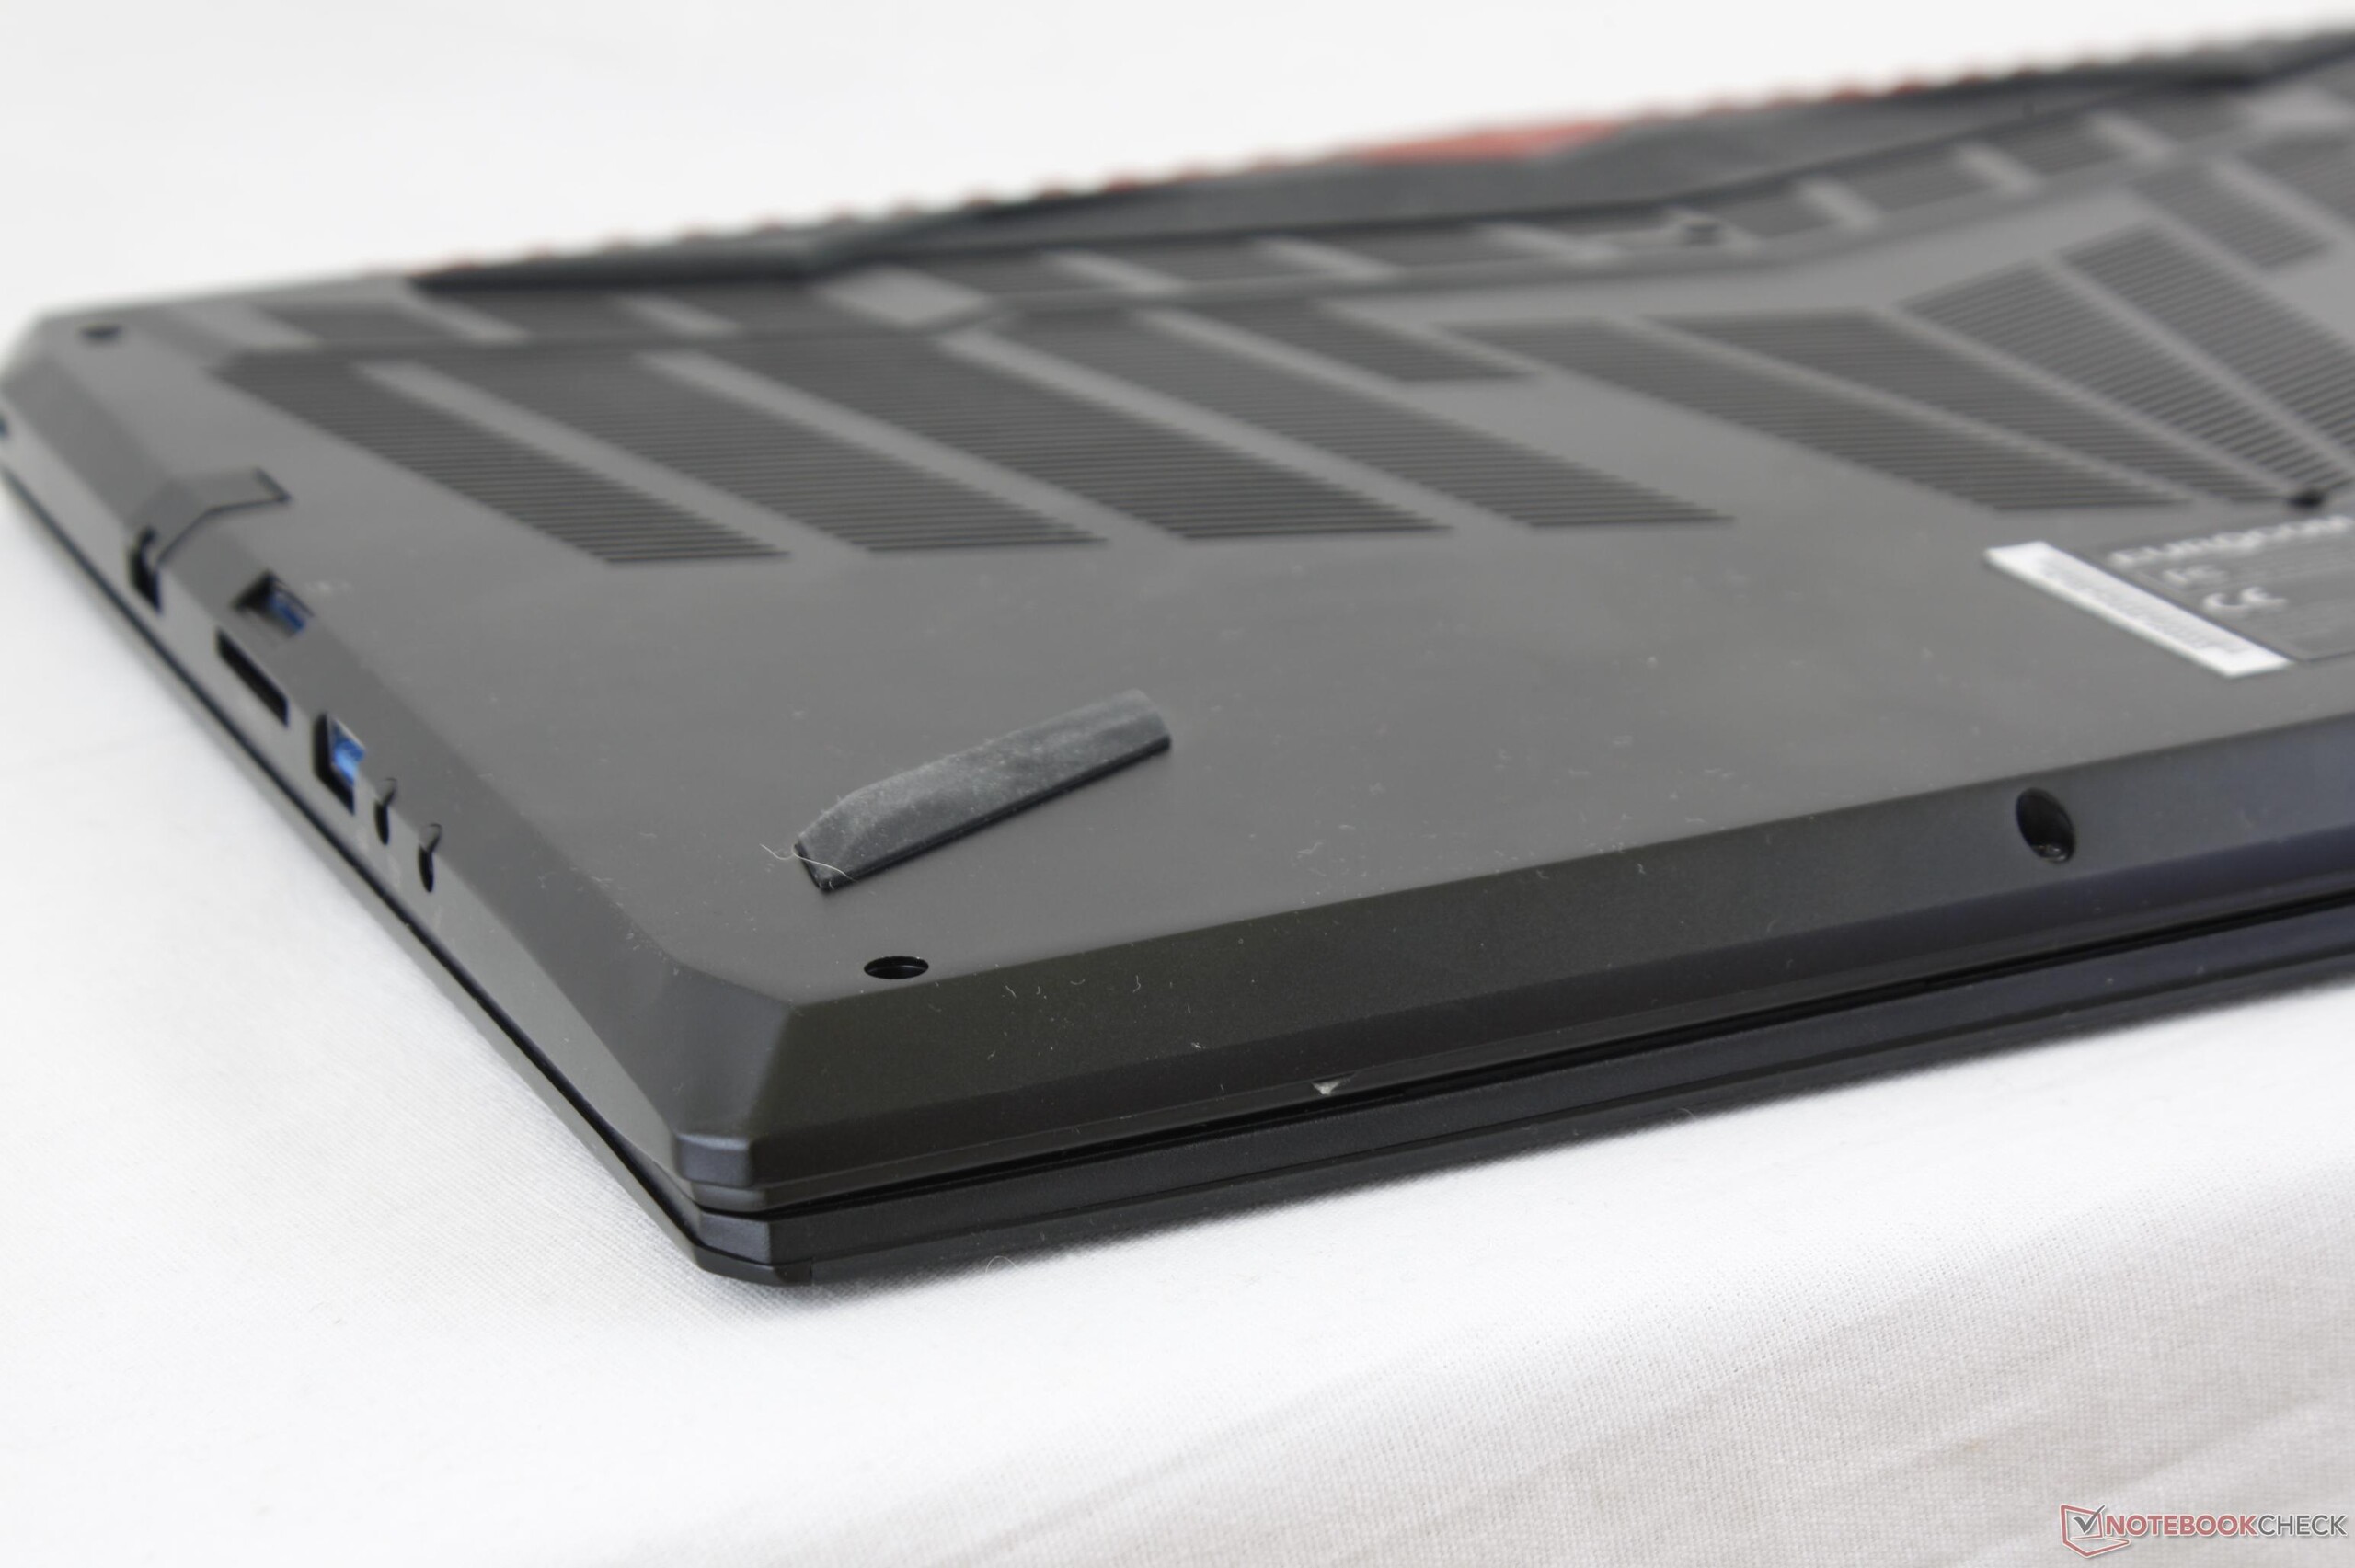


| SD Card Reader | |
| average JPG Copy Test (av. of 3 runs) | |
| Eurocom Q5 | |
| HP Omen 15-ce002ng | |
| MSI GS63VR-6RF16H22 Stealth Pro | |
| maximum AS SSD Seq Read Test (1GB) | |
| Eurocom Q5 | |
| HP Omen 15-ce002ng | |
| MSI GS63VR-6RF16H22 Stealth Pro | |
| Networking | |
| iperf3 transmit AX12 | |
| Alienware 15 R3 | |
| Eurocom Q5 | |
| Asus Zephyrus GX501VS | |
| iperf3 receive AX12 | |
| Alienware 15 R3 | |
| Eurocom Q5 | |
| Asus Zephyrus GX501VS | |
| |||||||||||||||||||||||||
iluminación: 87 %
Brillo con batería: 287.5 cd/m²
Contraste: 442:1 (Negro: 0.65 cd/m²)
ΔE ColorChecker Calman: 4.5 | ∀{0.5-29.43 Ø4.71}
ΔE Greyscale Calman: 4.6 | ∀{0.09-98 Ø4.96}
92.3% sRGB (Argyll 1.6.3 3D)
59% AdobeRGB 1998 (Argyll 1.6.3 3D)
64.4% AdobeRGB 1998 (Argyll 3D)
92.7% sRGB (Argyll 3D)
63% Display P3 (Argyll 3D)
Gamma: 2.39
CCT: 7393 K
| Eurocom Q5 ID: LGD04D4, Name: LG Philips LP156UD1-SPB1, IPS, 15.6", 3840x2160 | Asus Zephyrus GX501VS ID: AUO42ED, Name: AU Optronics B156HAN04.2, IPS, 15.6", 1920x1080 | HP Omen 15-ce002ng AUO42ED, IPS, 15.6", 1920x1080 | MSI GS63VR-6RF16H22 Stealth Pro Samsung 156HL01-104 (SDC324C) , IPS, 15.6", 1920x1080 | Gigabyte P56XT LG Philips LP156WF6 (LGD046F), IPS, 15.6", 1920x1080 | Alienware 15 R3 HPJGK_B156HTN (AUO51ED), TN, 15.6", 1920x1080 | |
|---|---|---|---|---|---|---|
| Display | -4% | 2% | 7% | -3% | 2% | |
| Display P3 Coverage (%) | 63 | 62.1 -1% | 65.8 4% | 67.8 8% | 64.8 3% | 66 5% |
| sRGB Coverage (%) | 92.7 | 85.6 -8% | 90.9 -2% | 97.4 5% | 84.6 -9% | 90.5 -2% |
| AdobeRGB 1998 Coverage (%) | 64.4 | 62.4 -3% | 66.5 3% | 69.7 8% | 61.8 -4% | 66.2 3% |
| Response Times | 1% | -21% | 10% | -1% | 41% | |
| Response Time Grey 50% / Grey 80% * (ms) | 32.4 ? | 33.2 ? -2% | 43.2 ? -33% | 37.2 ? -15% | 25 ? 23% | |
| Response Time Black / White * (ms) | 28.8 ? | 28 ? 3% | 31.2 ? -8% | 26 ? 10% | 24.8 ? 14% | 12 ? 58% |
| PWM Frequency (Hz) | 202 ? | 20000 ? | ||||
| Screen | 25% | 32% | 23% | 6% | -11% | |
| Brightness middle (cd/m²) | 287.5 | 307.1 7% | 304 6% | 293 2% | 301 5% | 386 34% |
| Brightness (cd/m²) | 279 | 309 11% | 289 4% | 279 0% | 280 0% | 382 37% |
| Brightness Distribution (%) | 87 | 86 -1% | 86 -1% | 84 -3% | 87 0% | 93 7% |
| Black Level * (cd/m²) | 0.65 | 0.35 46% | 0.26 60% | 0.33 49% | 0.32 51% | 0.39 40% |
| Contrast (:1) | 442 | 877 98% | 1169 164% | 888 101% | 941 113% | 990 124% |
| Colorchecker dE 2000 * | 4.5 | 3.4 24% | 3.46 23% | 3.59 20% | 6.21 -38% | 10.2 -127% |
| Colorchecker dE 2000 max. * | 8.9 | 8.2 8% | 7.72 13% | 5.79 35% | 10.78 -21% | 15.81 -78% |
| Greyscale dE 2000 * | 4.6 | 1.4 70% | 2.46 47% | 3.86 16% | 6.08 -32% | 11.28 -145% |
| Gamma | 2.39 92% | 2.19 100% | 2.38 92% | 2.53 87% | 2.31 95% | 2.23 99% |
| CCT | 7393 88% | 6558 99% | 6915 94% | 7229 90% | 7375 88% | 11383 57% |
| Color Space (Percent of AdobeRGB 1998) (%) | 59 | 55.6 -6% | 59 0% | 63 7% | 55 -7% | 59 0% |
| Color Space (Percent of sRGB) (%) | 92.3 | 85 -8% | 91 -1% | 97 5% | 84 -9% | 90 -2% |
| Media total (Programa/Opciones) | 7% /
16% | 4% /
19% | 13% /
19% | 1% /
3% | 11% /
-2% |
* ... más pequeño es mejor
Tiempos de respuesta del display
| ↔ Tiempo de respuesta de Negro a Blanco | ||
|---|---|---|
| 28.8 ms ... subida ↗ y bajada ↘ combinada | ↗ 18.8 ms subida | 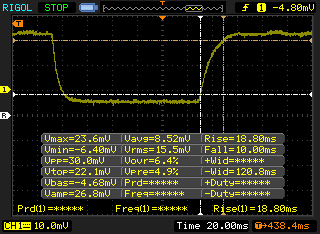 |
| ↘ 10 ms bajada | ||
| La pantalla mostró tiempos de respuesta relativamente lentos en nuestros tests pero podría ser demasiado lenta para los jugones. En comparación, todos los dispositivos de prueba van de ##min### (mínimo) a 240 (máximo) ms. » 76 % de todos los dispositivos son mejores. Eso quiere decir que el tiempo de respuesta es peor que la media (19.8 ms) de todos los dispositivos testados. | ||
| ↔ Tiempo de respuesta 50% Gris a 80% Gris | ||
| 32.4 ms ... subida ↗ y bajada ↘ combinada | ↗ 16 ms subida | 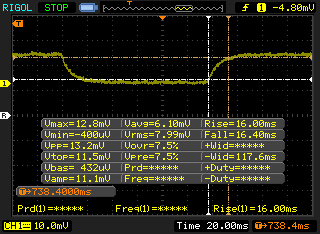 |
| ↘ 16.4 ms bajada | ||
| La pantalla mostró tiempos de respuesta lentos en nuestros tests y podría ser demasiado lenta para los jugones. En comparación, todos los dispositivos de prueba van de ##min### (mínimo) a 636 (máximo) ms. » 44 % de todos los dispositivos son mejores. Eso quiere decir que el tiempo de respuesta es similar al dispositivo testado medio (31 ms). | ||
Parpadeo de Pantalla / PWM (Pulse-Width Modulation)
| Parpadeo de Pantalla / PWM no detectado | 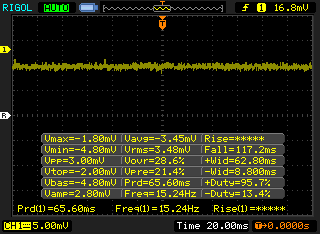 | ||
Comparación: 52 % de todos los dispositivos testados no usaron PWM para atenuar el display. Si se usó, medimos una media de 7757 (mínimo: 5 - máxmo: 343500) Hz. | |||
| wPrime 2.10 - 1024m | |
| Lenovo IdeaPad Y50 | |
| Eurocom Q5 | |
| EVGA SC17 GTX 1070 | |
| Asus Zephyrus GX501VS | |
| Gigabyte P55 V4 | |
| Eurocom Tornado F5 | |
* ... más pequeño es mejor
| PCMark 8 | |
| Home Score Accelerated v2 | |
| Eurocom Tornado F5 | |
| Asus Zephyrus GX501VS | |
| MSI GS63VR-6RF16H22 Stealth Pro | |
| Eurocom Q5 | |
| Work Score Accelerated v2 | |
| Eurocom Tornado F5 | |
| Asus Zephyrus GX501VS | |
| Eurocom Q5 | |
| MSI GS63VR-6RF16H22 Stealth Pro | |
| Creative Score Accelerated v2 | |
| Eurocom Tornado F5 | |
| Asus Zephyrus GX501VS | |
| MSI GS63VR-6RF16H22 Stealth Pro | |
| Eurocom Q5 | |
| PCMark 8 Home Score Accelerated v2 | 3829 puntos | |
| PCMark 8 Creative Score Accelerated v2 | 4926 puntos | |
| PCMark 8 Work Score Accelerated v2 | 4891 puntos | |
| PCMark 10 Score | 5119 puntos | |
ayuda | ||
| Eurocom Q5 Samsung SSD 960 Pro 512 GB m.2 | Asus Zephyrus GX501VS Samsung SM961 MZVPW256HEGL | EVGA SC17 GTX 1070 Samsung SM951 MZVPV256 m.2 | Eurocom Tornado F5 Samsung SSD 960 Pro 512 GB m.2 | Alienware 17 R4 SK Hynix PC300 NVMe 512 GB | |
|---|---|---|---|---|---|
| AS SSD | -5% | -22% | 17% | -53% | |
| Copy Game MB/s (MB/s) | 682 | 719 5% | 1034 52% | 1310 92% | 574 -16% |
| Copy Program MB/s (MB/s) | 301.5 | 383.3 27% | 470 56% | 635 111% | 446.1 48% |
| Copy ISO MB/s (MB/s) | 1967 | 1795 -9% | 1337 -32% | 1614 -18% | 1227 -38% |
| Score Total (Points) | 4001 | 3995 0% | 2328 -42% | 3943 -1% | 2072 -48% |
| Score Write (Points) | 1705 | 1293 -24% | 487 -71% | 1689 -1% | 858 -50% |
| Score Read (Points) | 1529 | 1818 19% | 1238 -19% | 1512 -1% | 831 -46% |
| Access Time Write * (ms) | 0.028 | 0.032 -14% | 0.033 -18% | 0.024 14% | 0.123 -339% |
| Access Time Read * (ms) | 0.036 | 0.047 -31% | 0.049 -36% | 0.03 17% | 0.042 -17% |
| 4K-64 Write (MB/s) | 1366 | 1035 -24% | 260.9 -81% | 1334 -2% | 671 -51% |
| 4K-64 Read (MB/s) | 1231 | 1527 24% | 999 -19% | 1179 -4% | 620 -50% |
| 4K Write (MB/s) | 136.2 | 117.3 -14% | 112.1 -18% | 150.5 10% | 113.4 -17% |
| 4K Read (MB/s) | 49.3 | 50.2 2% | 45.64 -7% | 51 3% | 35.61 -28% |
| Seq Write (MB/s) | 2029 | 1409 -31% | 1144 -44% | 2046 1% | 735 -64% |
| Seq Read (MB/s) | 2493 | 2412 -3% | 1934 -22% | 2819 13% | 1752 -30% |
* ... más pequeño es mejor

| 3DMark | |
| 1920x1080 Fire Strike Graphics | |
| MSI GT75VR 7RF-012 Titan Pro | |
| Asus Zephyrus GX501 | |
| Gigabyte P56XT | |
| Asus Zephyrus GX501VS | |
| Eurocom Q5 | |
| Nvidia GeForce GTX 1060 Founders Edition 6 GB | |
| HP Omen 15-ce002ng | |
| Eurocom P5 Pro Extreme | |
| MSI GP62 7REX-1045US | |
| Dell Inspiron 15 7000 7567 Gaming (Core i5-7300HQ, GTX 1050) | |
| 3840x2160 Fire Strike Ultra Graphics | |
| Asus Zephyrus GX501 | |
| Asus Zephyrus GX501VS | |
| Eurocom Q5 | |
| Nvidia GeForce GTX 1060 Founders Edition 6 GB | |
| MSI GP62 7REX-1045US | |
| Dell Inspiron 15 7000 7567 Gaming (Core i5-7300HQ, GTX 1050) | |
| 3DMark 11 | |
| 1280x720 Performance GPU | |
| MSI GT75VR 7RF-012 Titan Pro | |
| Asus Zephyrus GX501 | |
| Gigabyte P56XT | |
| Asus Zephyrus GX501VS | |
| Eurocom Q5 | |
| Nvidia GeForce GTX 1060 Founders Edition 6 GB | |
| HP Omen 15-ce002ng | |
| Eurocom P5 Pro Extreme | |
| MSI GP62 7REX-1045US | |
| Dell Inspiron 15 7000 7567 Gaming (Core i5-7300HQ, GTX 1050) | |
| 1280x720 Performance Combined | |
| Nvidia GeForce GTX 1060 Founders Edition 6 GB | |
| MSI GT75VR 7RF-012 Titan Pro | |
| Eurocom P5 Pro Extreme | |
| Eurocom Q5 | |
| Gigabyte P56XT | |
| Asus Zephyrus GX501VS | |
| HP Omen 15-ce002ng | |
| Asus Zephyrus GX501 | |
| MSI GP62 7REX-1045US | |
| Dell Inspiron 15 7000 7567 Gaming (Core i5-7300HQ, GTX 1050) | |
| 3DMark 11 Performance | 14947 puntos | |
| 3DMark Cloud Gate Standard Score | 25659 puntos | |
| 3DMark Fire Strike Score | 12028 puntos | |
| 3DMark Fire Strike Extreme Score | 6354 puntos | |
ayuda | ||
| Rise of the Tomb Raider - 1920x1080 Very High Preset AA:FX AF:16x | |
| Aorus X7 DT v6 | |
| Asus Zephyrus GX501 | |
| MSI Gaming Z GeForce GTX 1070 OC Bios Desktop PC | |
| Asus Zephyrus GX501VS | |
| Eurocom Q5 | |
| MSI GS43VR 7RE-069US | |
| Asus Strix GL502VY-DS71 | |
| HP Omen 15-ce002ng | |
| Asus Strix GL502VT-DS74 | |
| BioShock Infinite - 1920x1080 Ultra Preset, DX11 (DDOF) | |
| Aorus X7 DT v6 | |
| MSI Gaming Z GeForce GTX 1070 OC Bios Desktop PC | |
| Aorus X7 v7 | |
| Asus Zephyrus GX501VS | |
| Eurocom Q5 | |
| MSI GS43VR 7RE-069US | |
| Asus Strix GL502VY-DS71 | |
| Asus Strix GL502VT-DS74 | |
| Fallout 4 - 1920x1080 Ultra Preset AA:T AF:16x | |
| Aorus X7 DT v6 | |
| MSI Gaming Z GeForce GTX 1070 OC Bios Desktop PC | |
| Asus Zephyrus GX501VS | |
| Eurocom Q5 | |
| MSI GS43VR 7RE-069US | |
| Asus Strix GL502VY-DS71 | |
| Asus Strix GL502VT-DS74 | |
| bajo | medio | alto | ultra | 4K | |
|---|---|---|---|---|---|
| Guild Wars 2 (2012) | 62.2 | ||||
| BioShock Infinite (2013) | 130.5 | ||||
| Metro: Last Light (2013) | 96.5 | ||||
| Thief (2014) | 95.1 | ||||
| The Witcher 3 (2015) | 46 | ||||
| Batman: Arkham Knight (2015) | 73 | 37 | |||
| Metal Gear Solid V (2015) | 60 | 59 | |||
| Fallout 4 (2015) | 88.4 | 34.3 | |||
| Rise of the Tomb Raider (2016) | 79.7 | 33.6 | |||
| Ashes of the Singularity (2016) | 67 | 65.2 | |||
| Overwatch (2016) | 136.2 | 70.1 | |||
| Mafia 3 (2016) | 51.6 | 20.6 | |||
| Prey (2017) | 138.7 | 48.1 | |||
| Dirt 4 (2017) | 71.8 | 40.5 | |||
| F1 2017 (2017) | 80 | 36 |
Ruido
| Ocioso |
| 31.5 / 33.8 / 33.8 dB(A) |
| Carga |
| 41.7 / 54.2 dB(A) |
 | ||
30 dB silencioso 40 dB(A) audible 50 dB(A) ruidosamente alto |
||
min: | ||
| Eurocom Q5 GeForce GTX 1070 Max-Q, i7-7700HQ, Samsung SSD 960 Pro 512 GB m.2 | Asus Zephyrus GX501VS GeForce GTX 1070 Max-Q, i7-7700HQ, Samsung SM961 MZVPW256HEGL | Gigabyte P56XT GeForce GTX 1070 Mobile, i7-7700HQ, LiteOn CX2-8B256 | Alienware 15 R3 GeForce GTX 1070 Mobile, i7-7700HQ | EVGA SC15 GeForce GTX 1060 Mobile, i7-7700HQ, Toshiba NVMe THNSN5256GPU7 | HP Omen 15-ce002ng GeForce GTX 1060 Max-Q, i7-7700HQ, Samsung PM961 MZVLW256HEHP | |
|---|---|---|---|---|---|---|
| Noise | 9% | -4% | -5% | 4% | 1% | |
| apagado / medio ambiente * (dB) | 29 | 28.5 2% | 30 -3% | 30 -3% | 28 3% | 30 -3% |
| Idle Minimum * (dB) | 31.5 | 28.5 10% | 34 -8% | 31 2% | 31.9 -1% | 30 5% |
| Idle Average * (dB) | 33.8 | 28.5 16% | 35 -4% | 32 5% | 32 5% | 33 2% |
| Idle Maximum * (dB) | 33.8 | 30.1 11% | 39 -15% | 42 -24% | 32 5% | 37 -9% |
| Load Average * (dB) | 41.7 | 35.2 16% | 39 6% | 49 -18% | 36.5 12% | 41 2% |
| Witcher 3 ultra * (dB) | 41.7 | 41.7 -0% | 48 -15% | 40.3 3% | 42 -1% | |
| Load Maximum * (dB) | 54.2 | 48.8 10% | 49 10% | 50 8% | 53.4 1% | 50 8% |
* ... más pequeño es mejor
(-) La temperatura máxima en la parte superior es de 56.2 °C / 133 F, frente a la media de 40.4 °C / 105 F, que oscila entre 21.2 y 68.8 °C para la clase Gaming.
(-) El fondo se calienta hasta un máximo de 61.2 °C / 142 F, frente a la media de 43.2 °C / 110 F
(+) En reposo, la temperatura media de la parte superior es de 27.1 °C / 81# F, frente a la media del dispositivo de 33.9 °C / 93 F.
(-) Jugando a The Witcher 3, la temperatura media de la parte superior es de 41.9 °C / 107 F, frente a la media del dispositivo de 33.9 °C / 93 F.
(±) El reposamanos y el touchpad pueden calentarse mucho al tacto con un máximo de 38.6 °C / 101.5 F.
(-) La temperatura media de la zona del reposamanos de dispositivos similares fue de 28.8 °C / 83.8 F (-9.8 °C / -17.7 F).
Eurocom Q5 análisis de audio
(-) | altavoces no muy altos (#61.7 dB)
Graves 100 - 315 Hz
(-) | casi sin bajos - de media 24% inferior a la mediana
(+) | el bajo es lineal (3.8% delta a la frecuencia anterior)
Medios 400 - 2000 Hz
(±) | medias más altas - de media 6.2% más altas que la mediana
(±) | la linealidad de los medios es media (12.9% delta respecto a la frecuencia anterior)
Altos 2 - 16 kHz
(+) | máximos equilibrados - a sólo 1.5% de la mediana
(+) | los máximos son lineales (5.7% delta a la frecuencia anterior)
Total 100 - 16.000 Hz
(-) | el sonido global no es lineal (35.3% de diferencia con la mediana)
En comparación con la misma clase
» 99% de todos los dispositivos probados de esta clase eran mejores, 0% similares, 1% peores
» El mejor tuvo un delta de 6%, la media fue 18%, el peor fue ###max##%
En comparación con todos los dispositivos probados
» 94% de todos los dispositivos probados eran mejores, 1% similares, 6% peores
» El mejor tuvo un delta de 4%, la media fue 23%, el peor fue ###max##%
Apple MacBook 12 (Early 2016) 1.1 GHz análisis de audio
(+) | los altavoces pueden reproducir a un volumen relativamente alto (#83.6 dB)
Graves 100 - 315 Hz
(±) | lubina reducida - en promedio 11.3% inferior a la mediana
(±) | la linealidad de los graves es media (14.2% delta a frecuencia anterior)
Medios 400 - 2000 Hz
(+) | medios equilibrados - a sólo 2.4% de la mediana
(+) | los medios son lineales (5.5% delta a la frecuencia anterior)
Altos 2 - 16 kHz
(+) | máximos equilibrados - a sólo 2% de la mediana
(+) | los máximos son lineales (4.5% delta a la frecuencia anterior)
Total 100 - 16.000 Hz
(+) | el sonido global es lineal (10.2% de diferencia con la mediana)
En comparación con la misma clase
» 7% de todos los dispositivos probados de esta clase eran mejores, 2% similares, 90% peores
» El mejor tuvo un delta de 5%, la media fue 18%, el peor fue ###max##%
En comparación con todos los dispositivos probados
» 5% de todos los dispositivos probados eran mejores, 1% similares, 94% peores
» El mejor tuvo un delta de 4%, la media fue 23%, el peor fue ###max##%
| Off / Standby | |
| Ocioso | |
| Carga |
|
Clave:
min: | |
| Eurocom Q5 i7-7700HQ, GeForce GTX 1070 Max-Q, Samsung SSD 960 Pro 512 GB m.2, IPS, 3840x2160, 15.6" | Asus Zephyrus GX501VS i7-7700HQ, GeForce GTX 1070 Max-Q, Samsung SM961 MZVPW256HEGL, IPS, 1920x1080, 15.6" | Asus Zephyrus GX501 i7-7700HQ, GeForce GTX 1080 Max-Q, Samsung SSD SM961 1TB M.2 MZVKW1T0HMLH, IPS, 1920x1080, 15.6" | EVGA SC15 i7-7700HQ, GeForce GTX 1060 Mobile, Toshiba NVMe THNSN5256GPU7, , 1920x1080, 15.6" | Gigabyte P56XT i7-7700HQ, GeForce GTX 1070 Mobile, LiteOn CX2-8B256, IPS, 1920x1080, 15.6" | HP Omen 15-ce002ng i7-7700HQ, GeForce GTX 1060 Max-Q, Samsung PM961 MZVLW256HEHP, IPS, 1920x1080, 15.6" | |
|---|---|---|---|---|---|---|
| Power Consumption | -37% | -54% | -61% | -30% | -43% | |
| Idle Minimum * (Watt) | 9 | 19.1 -112% | 18 -100% | 25.8 -187% | 13 -44% | 18 -100% |
| Idle Average * (Watt) | 13.5 | 20.8 -54% | 23 -70% | 26.6 -97% | 17 -26% | 23 -70% |
| Idle Maximum * (Watt) | 13.7 | 21.8 -59% | 31 -126% | 26.7 -95% | 22 -61% | 30 -119% |
| Load Average * (Watt) | 87.8 | 73.7 16% | 79 10% | 80.3 9% | 85 3% | 85 3% |
| Witcher 3 ultra * (Watt) | 129 | 130.2 -1% | 148 -15% | 121.2 6% | 154 -19% | 96 26% |
| Load Maximum * (Watt) | 158.6 | 173.1 -9% | 196 -24% | 159.3 -0% | 208 -31% | 158 -0% |
* ... más pequeño es mejor
| Eurocom Q5 i7-7700HQ, GeForce GTX 1070 Max-Q, 55 Wh | Asus Zephyrus GX501VS i7-7700HQ, GeForce GTX 1070 Max-Q, 50 Wh | HP Omen 15-ce002ng i7-7700HQ, GeForce GTX 1060 Max-Q, 70 Wh | Gigabyte P56XT i7-7700HQ, GeForce GTX 1070 Mobile, 91.2 Wh | EVGA SC15 i7-7700HQ, GeForce GTX 1060 Mobile, 62 Wh | Alienware 15 R3 i7-7700HQ, GeForce GTX 1070 Mobile, 99 Wh | |
|---|---|---|---|---|---|---|
| Duración de Batería | -31% | -2% | 74% | -4% | 32% | |
| Reader / Idle (h) | 7.8 | 3.8 -51% | 4.3 -45% | 9.5 22% | 3.7 -53% | 6.4 -18% |
| WiFi v1.3 (h) | 4.3 | 2.5 -42% | 3.3 -23% | 6.4 49% | 2.8 -35% | 4.4 2% |
| Load (h) | 0.8 | 0.8 0% | 1.3 63% | 2 150% | 1.4 75% | 1.7 113% |
Pro
Contra
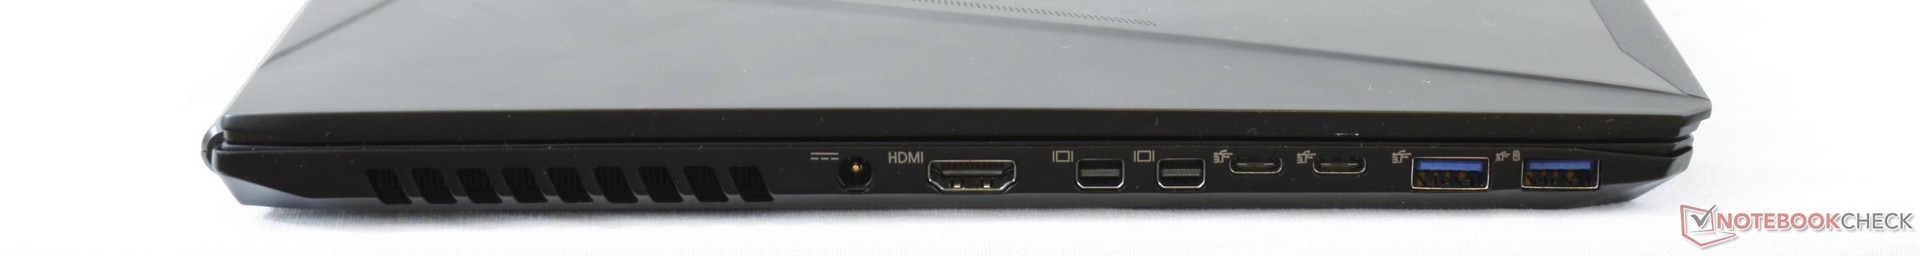
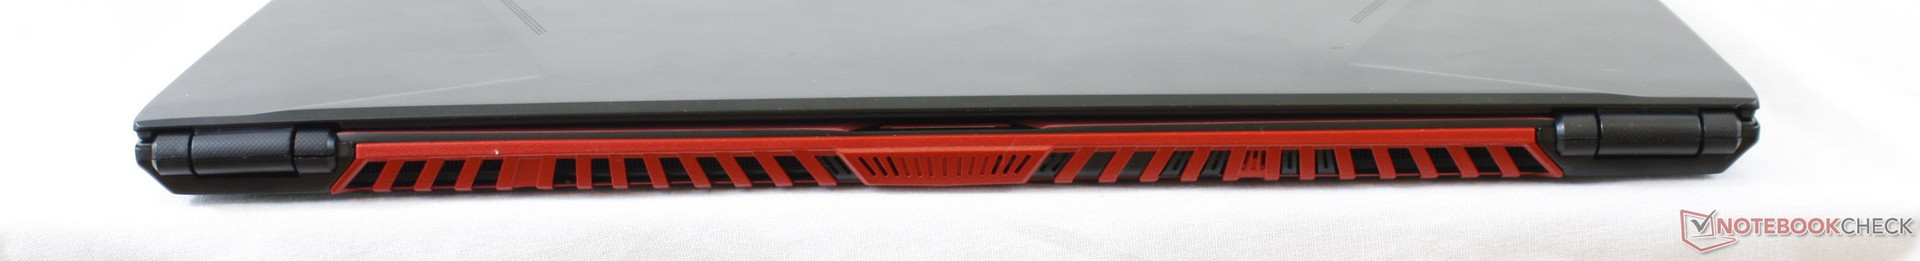
A primera vista, el Q5 es casi todo lo que queremos de un portátil gaming Max-Q. Facilidad de mantenimiento, perfil delgado y atractivo, múltiples opciones de visualización, dos bahías de almacenamiento interno, un montón de puertos, Optimus, e incluso soporte SIM. Sin embargo, si profundizas un poco más en los detalles, verás que el sistema tiene un largo camino por recorrer contra los modelos Max-Q competidores como la Zephyrus.
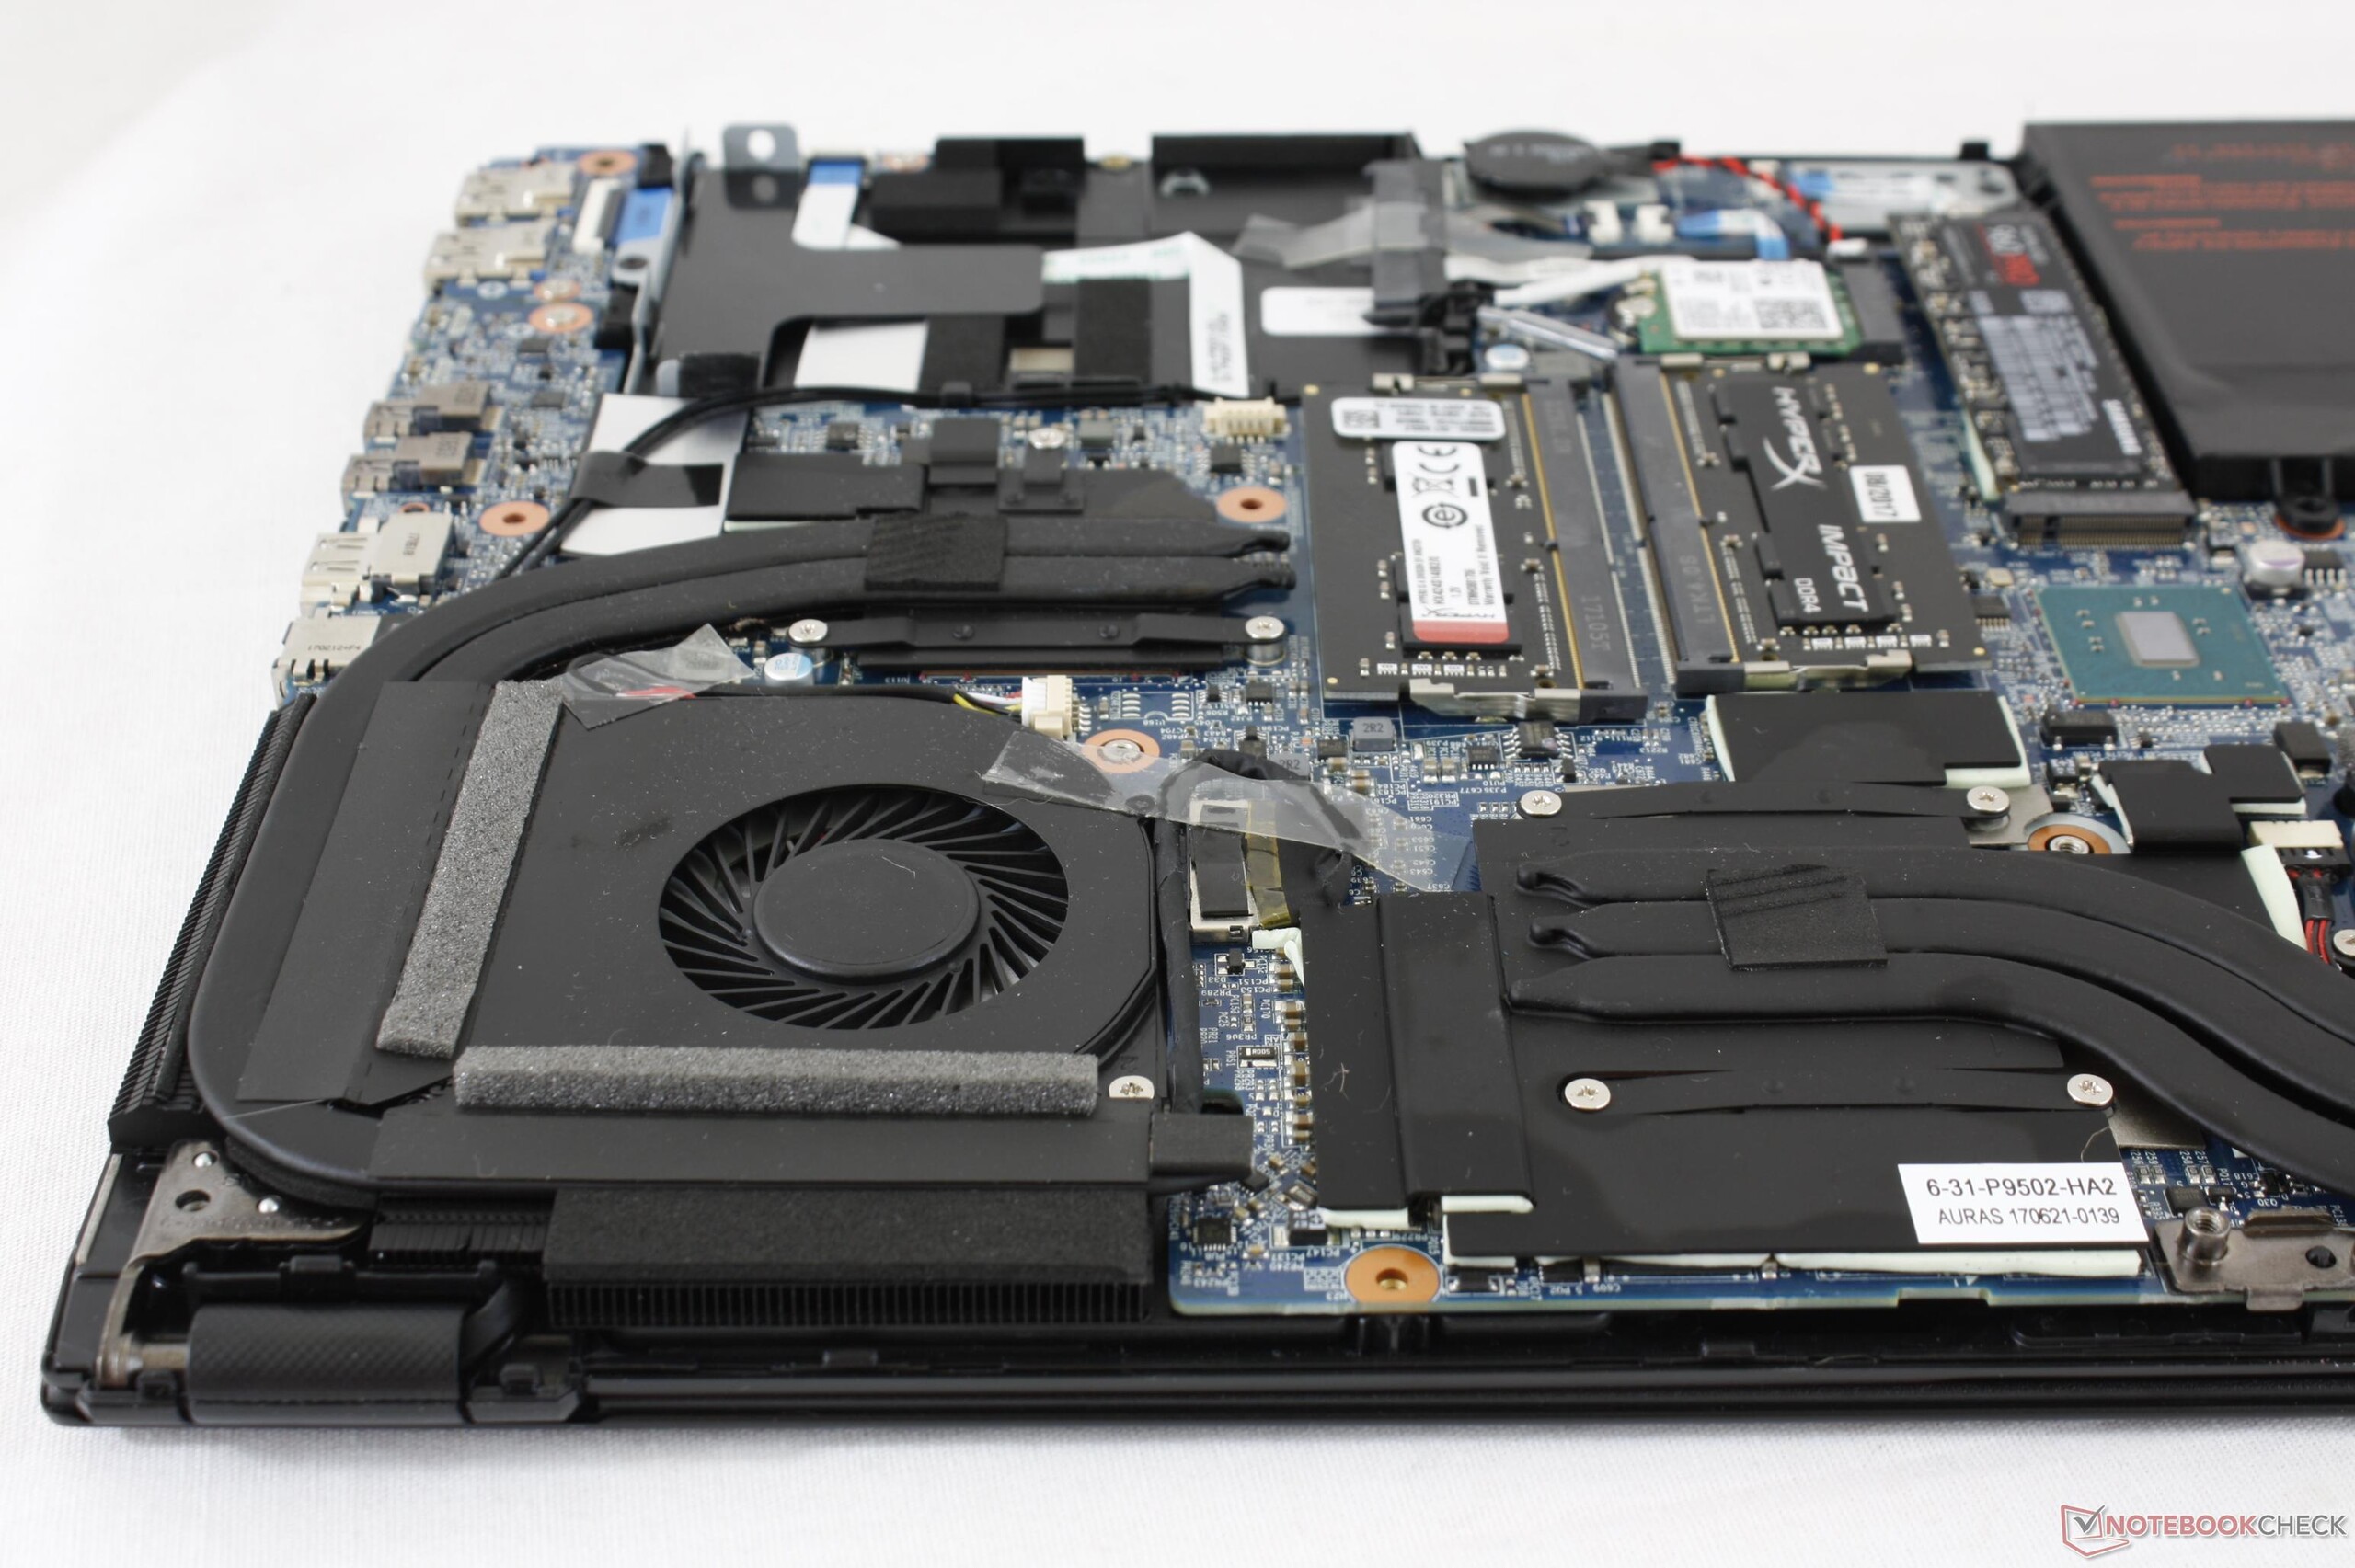
Para empezar, se debe cambiar el modo de ventilador automático preestablecido para cumplir con los estándares de ruido del ventilador Max-Q. Al momento de escribir esto, los usuarios deberían cambiar la velocidad del ventilador manualmente al 55 por ciento para una "verdadera" experiencia de Max-Q. De lo contrario, el Q5 hará tanto ruido como un portátil gaming que no sea Max-Q y que puede estar equipados con una GTX 1070 o algo mejor. Después de todo, ¿por qué comprar un portátil de Max-Q si no funcionará más silencioso que una alternativa ultrafina más potente?
En segundo lugar, las temperaturas del núcleo son más cálidas que las de la Zephyrus cuando se ajustan al 55 por ciento de la velocidad del ventilador. Por lo tanto, cuando se somete a las mismas cargas de juego y con idénticas lecturas de ruido de ventilador, el portátil de Asus seguirá funcionando más fresco.
Por último, la GTX 1070 Max-Q del Q5 es consistentemente más lenta que la misma GPU en la alternativa de Asus. Su velocidad más lenta en combinación con las altas temperaturas de núcleo superiores podrían ser un clavo en el ataúd a los ojos de los gamers hardcore. Si quiere lo mejor que la GTX 1070 Max-Q puede ofrecer, entonces el Q5 no es el portátil para usted. Si las amplias funciones auxiliares y las opciones de conectividad son importantes frente al barebone Zephyrus, sin embargo, entonces el más asequible Q5 podría seguir siendo un atractivo portátil de Max-Q.
Está claro que el Q5 y su solución de refrigeración aún no están completamente optimizados para Max-Q ya que las velocidades de reloj y las temperaturas son desfavorables frente a la competencia. Futuras configuraciones con la GTX 1060 Max-Q menos exigente deberían ir mejor con este chasis en particular. Más allá de eso, las características auxiliares y opciones configurables fuera de la CPU y la GPU son las más abundantes para un portátil superfino Max-Q.
Ésta es una versión acortada del análisis original. Puedes leer el análisis completo en inglés aquí.
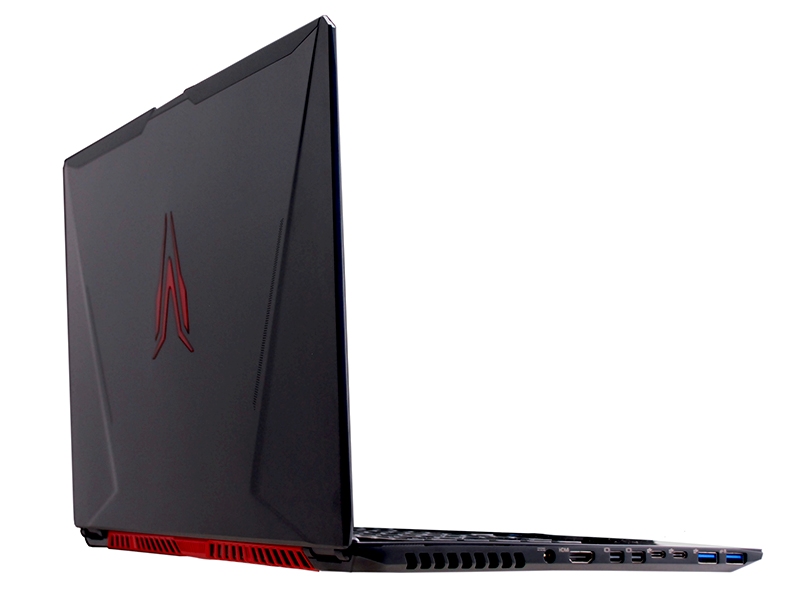
Eurocom Q5
- 09/07/2017 v6 (old)
Allen Ngo
Price comparison
