Breve análisis del HP 15-bw075ax (A12-9720P, Radeon R7)
| SD Card Reader | |
| average JPG Copy Test (av. of 3 runs) | |
| Lenovo Yoga 510-14AST | |
| HP Pavilion 15-aw004ng W8Y60EA | |
| Lenovo B50-10 80QR0013GE | |
| HP 15-bw075ax | |
| HP 15-bw077ax | |
| Asus X555DA-BB11 | |
| maximum AS SSD Seq Read Test (1GB) | |
| Lenovo B50-10 80QR0013GE | |
| Lenovo Yoga 510-14AST | |
| HP Pavilion 15-aw004ng W8Y60EA | |
| HP 15-bw077ax | |
| HP 15-bw075ax | |
| Asus X555DA-BB11 | |
| Networking | |
| iperf3 transmit AX12 | |
| HP 15-bw075ax | |
| HP 15-bw077ax | |
| Lenovo Yoga 510-14AST | |
| Asus X555DA-BB11 | |
| iperf3 receive AX12 | |
| HP 15-bw075ax | |
| HP 15-bw077ax | |
| Asus X555DA-BB11 | |
| Lenovo Yoga 510-14AST | |
| |||||||||||||||||||||||||
iluminación: 81 %
Brillo con batería: 212.9 cd/m²
Contraste: 760:1 (Negro: 0.28 cd/m²)
ΔE ColorChecker Calman: 10.1 | ∀{0.5-29.43 Ø4.71}
ΔE Greyscale Calman: 12 | ∀{0.09-98 Ø4.96}
58% sRGB (Argyll 1.6.3 3D)
37% AdobeRGB 1998 (Argyll 1.6.3 3D)
39.34% AdobeRGB 1998 (Argyll 3D)
57.3% sRGB (Argyll 3D)
38.07% Display P3 (Argyll 3D)
Gamma: 2.16
CCT: 12551 K
| HP 15-bw075ax BOE06A4, TN LED, 15.6", 1366x768 | HP 15-bw077ax BOE BOE06A4, TN LED, 15.6", 1366x768 | Asus X555DA-BB11 TN LED, 15.6", 1920x1080 | Lenovo B50-10 80QR0013GE Chi Mei N156BGE-EA2, TN LED, 15.6", 1366x768 | Lenovo Yoga 510-14AST AU Optronics B140XTN02.E, TN LED, 14", 1366x768 | HP Pavilion 15-aw004ng W8Y60EA Chi Mei, TN LED, 15.6", 1920x1080 | |
|---|---|---|---|---|---|---|
| Display | -8% | 6% | -10% | 6% | ||
| Display P3 Coverage (%) | 38.07 | 35.12 -8% | 40.21 6% | 34.15 -10% | 40.35 6% | |
| sRGB Coverage (%) | 57.3 | 52.7 -8% | 60.1 5% | 51.4 -10% | 60.3 5% | |
| AdobeRGB 1998 Coverage (%) | 39.34 | 36.29 -8% | 41.56 6% | 35.28 -10% | 41.71 6% | |
| Response Times | 9% | 9% | 30% | -37% | 9% | |
| Response Time Grey 50% / Grey 80% * (ms) | 42 ? | 42.4 ? -1% | 42 ? -0% | 28 ? 33% | 70 ? -67% | 41 ? 2% |
| Response Time Black / White * (ms) | 27.2 ? | 22.4 ? 18% | 22.4 ? 18% | 20 ? 26% | 29 ? -7% | 23 ? 15% |
| PWM Frequency (Hz) | 198.4 ? | 198.4 ? | 200 ? | |||
| Screen | -3% | 3% | 2% | -19% | -6% | |
| Brightness middle (cd/m²) | 212.9 | 194.1 -9% | 242.7 14% | 245 15% | 242 14% | 240 13% |
| Brightness (cd/m²) | 206 | 192 -7% | 232 13% | 230 12% | 224 9% | 228 11% |
| Brightness Distribution (%) | 81 | 73 -10% | 88 9% | 84 4% | 88 9% | 89 10% |
| Black Level * (cd/m²) | 0.28 | 0.27 4% | 0.52 -86% | 0.46 -64% | 0.62 -121% | 0.49 -75% |
| Contrast (:1) | 760 | 719 -5% | 467 -39% | 533 -30% | 390 -49% | 490 -36% |
| Colorchecker dE 2000 * | 10.1 | 9.9 2% | 4.9 51% | 8.34 17% | 13.03 -29% | 10.96 -9% |
| Colorchecker dE 2000 max. * | 22.3 | 23.4 -5% | 20.3 9% | 12.31 45% | 18.79 16% | 18.36 18% |
| Greyscale dE 2000 * | 12 | 11.6 3% | 2.7 77% | 9.48 21% | 14.6 -22% | 11.34 5% |
| Gamma | 2.16 102% | 2.16 102% | 2.34 94% | 2.38 92% | 2.22 99% | 2.27 97% |
| CCT | 12551 52% | 11981 54% | 6876 95% | 10624 61% | 18869 34% | 12292 53% |
| Color Space (Percent of AdobeRGB 1998) (%) | 37 | 37 0% | 33.5 -9% | 38 3% | 33 -11% | 39 5% |
| Color Space (Percent of sRGB) (%) | 58 | 58 0% | 52.5 -9% | 57 -2% | 52 -10% | 60 3% |
| Media total (Programa/Opciones) | 3% /
-1% | 1% /
2% | 13% /
6% | -22% /
-20% | 3% /
-1% |
* ... más pequeño es mejor
Tiempos de respuesta del display
| ↔ Tiempo de respuesta de Negro a Blanco | ||
|---|---|---|
| 27.2 ms ... subida ↗ y bajada ↘ combinada | ↗ 22 ms subida | 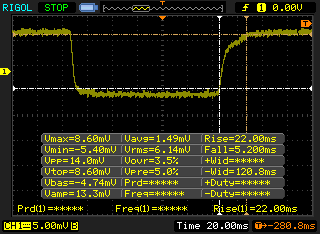 |
| ↘ 5.2 ms bajada | ||
| La pantalla mostró tiempos de respuesta relativamente lentos en nuestros tests pero podría ser demasiado lenta para los jugones. En comparación, todos los dispositivos de prueba van de ##min### (mínimo) a 240 (máximo) ms. » 69 % de todos los dispositivos son mejores. Eso quiere decir que el tiempo de respuesta es peor que la media (19.8 ms) de todos los dispositivos testados. | ||
| ↔ Tiempo de respuesta 50% Gris a 80% Gris | ||
| 42 ms ... subida ↗ y bajada ↘ combinada | ↗ 20.8 ms subida | 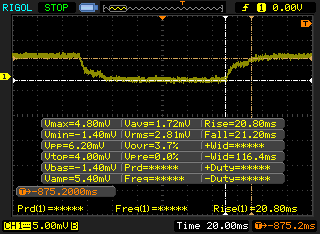 |
| ↘ 21.2 ms bajada | ||
| La pantalla mostró tiempos de respuesta lentos en nuestros tests y podría ser demasiado lenta para los jugones. En comparación, todos los dispositivos de prueba van de ##min### (mínimo) a 636 (máximo) ms. » 67 % de todos los dispositivos son mejores. Eso quiere decir que el tiempo de respuesta es peor que la media (31 ms) de todos los dispositivos testados. | ||
Parpadeo de Pantalla / PWM (Pulse-Width Modulation)
| Parpadeo de Pantalla / PWM detectado | 198.4 Hz | ≤ 99 % de brillo | 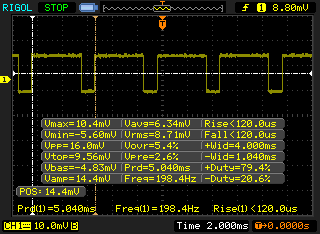 |
La retroiluminación del display parpadea a 198.4 Hz (seguramente usa PWM - Pulse-Width Modulation) a un brillo del 99 % e inferior. Sobre este nivel de brillo no debería darse parpadeo / PWM. La frecuencia de 198.4 Hz es relativamente baja, por lo que la gente sensible debería ver parpadeos y padecer fatiga visual por la pantalla (usado al brillo indicado a continuación). Comparación: 52 % de todos los dispositivos testados no usaron PWM para atenuar el display. Si se usó, medimos una media de 7754 (mínimo: 5 - máxmo: 343500) Hz. | |||
| Cinebench R15 | |
| CPU Single 64Bit | |
| Dell Latitude 5580 | |
| Lenovo ThinkPad L570 20J80020PB | |
| Acer TravelMate P249-M-5452 | |
| Acer Spin 5 SP513-51 | |
| Lenovo Thinkpad 13-20J1001BUS | |
| HP 15-bw075ax | |
| HP Pavilion 15-aw004ng W8Y60EA | |
| HP 15-bw077ax | |
| Asus X555DA-BB11 | |
| Lenovo Yoga 510-14AST | |
| Lenovo B50-10 80QR0013GE | |
| CPU Multi 64Bit | |
| Dell Latitude 5580 | |
| Lenovo ThinkPad L570 20J80020PB | |
| Acer TravelMate P249-M-5452 | |
| Lenovo Thinkpad 13-20J1001BUS | |
| Acer Spin 5 SP513-51 | |
| HP 15-bw075ax | |
| HP Pavilion 15-aw004ng W8Y60EA | |
| Asus X555DA-BB11 | |
| Lenovo B50-10 80QR0013GE | |
| Lenovo Yoga 510-14AST | |
| HP 15-bw077ax | |
| wPrime 2.10 - 1024m | |
| Lenovo Yoga 510-14AST | |
| HP 15-bw077ax | |
| Lenovo Thinkpad 13-20J1001BUS | |
| Lenovo ThinkPad L570 20J80020PB | |
| Asus X555DA-BB11 | |
* ... más pequeño es mejor
| PCMark 8 | |
| Home Score Accelerated v2 | |
| HP Pavilion 15-aw004ng W8Y60EA | |
| HP 15-bw075ax | |
| Lenovo Yoga 510-14AST | |
| Asus X555DA-BB11 | |
| HP 15-bw077ax | |
| Lenovo B50-10 80QR0013GE | |
| Work Score Accelerated v2 | |
| HP Pavilion 15-aw004ng W8Y60EA | |
| Lenovo Yoga 510-14AST | |
| Asus X555DA-BB11 | |
| HP 15-bw077ax | |
| HP 15-bw075ax | |
| Lenovo B50-10 80QR0013GE | |
| Creative Score Accelerated v2 | |
| HP Pavilion 15-aw004ng W8Y60EA | |
| HP 15-bw075ax | |
| Lenovo Yoga 510-14AST | |
| Asus X555DA-BB11 | |
| HP 15-bw077ax | |
| Lenovo B50-10 80QR0013GE | |
| PCMark 8 Home Score Accelerated v2 | 2722 puntos | |
| PCMark 8 Creative Score Accelerated v2 | 3111 puntos | |
| PCMark 8 Work Score Accelerated v2 | 2891 puntos | |
ayuda | ||

| HP 15-bw075ax WDC Scorpio Blue WD10JPVX-60JC3T1 | HP 15-bw077ax WDC Scorpio Blue WD10JPVX-60JC3T1 | Asus X555DA-BB11 Seagate Momentus SpinPoint M8 ST1000LM024 HN-M101MBB | Lenovo B50-10 80QR0013GE Seagate Momentus Thin ST500LT012-1DG142 | Lenovo Yoga 510-14AST | HP Pavilion 15-aw004ng W8Y60EA | |
|---|---|---|---|---|---|---|
| CrystalDiskMark 3.0 | 27% | 22% | 24% | 8206% | 6190% | |
| Read Seq (MB/s) | 63.3 | 91.3 44% | 106.9 69% | 103.5 64% | 434.6 587% | 503 695% |
| Write Seq (MB/s) | 62.2 | 90.2 45% | 97.5 57% | 91.1 46% | 207.7 234% | 316.6 409% |
| Read 512 (MB/s) | 22.96 | 29.02 26% | 32.28 41% | 33.74 47% | 356.3 1452% | 261.9 1041% |
| Write 512 (MB/s) | 32.08 | 39.51 23% | 35.39 10% | 38.77 21% | 195.6 510% | 281.2 777% |
| Read 4k (MB/s) | 0.29 | 0.34 17% | 0.373 29% | 0.374 29% | 26.71 9110% | 17.04 5776% |
| Write 4k (MB/s) | 0.79 | 0.94 19% | 0.636 -19% | 0.649 -18% | 56.8 7090% | 46.55 5792% |
| Read 4k QD32 (MB/s) | 0.68 | 0.83 22% | 0.694 2% | 0.818 20% | 176.3 25826% | 125 18282% |
| Write 4k QD32 (MB/s) | 0.78 | 0.96 23% | 0.682 -13% | 0.648 -17% | 163.3 20836% | 131.4 16746% |
| 3DMark | |
| 1280x720 Cloud Gate Standard Graphics | |
| HP Pavilion 15-aw004ng W8Y60EA | |
| Lenovo Yoga 510-14AST | |
| Asus X555DA-BB11 | |
| HP 15-bw077ax | |
| HP 15-bw075ax | |
| Lenovo B50-10 80QR0013GE | |
| 1920x1080 Fire Strike Graphics | |
| HP Pavilion 15-aw004ng W8Y60EA | |
| Lenovo Yoga 510-14AST | |
| Asus X555DA-BB11 | |
| HP 15-bw075ax | |
| HP 15-bw077ax | |
| 1920x1080 Ice Storm Extreme Graphics | |
| HP Pavilion 15-aw004ng W8Y60EA | |
| Lenovo Yoga 510-14AST | |
| Asus X555DA-BB11 | |
| 3DMark Cloud Gate Standard Score | 3162 puntos | |
| 3DMark Fire Strike Score | 667 puntos | |
ayuda | ||
| BioShock Infinite | |
| 1280x720 Very Low Preset (ordenar por valor) | |
| HP 15-bw075ax | |
| HP 15-bw077ax | |
| Asus X555DA-BB11 | |
| Lenovo B50-10 80QR0013GE | |
| Lenovo Yoga 510-14AST | |
| HP Pavilion 15-aw004ng W8Y60EA | |
| Lenovo ThinkPad L570 20J80020PB | |
| Dell Latitude 5580 | |
| Lenovo Thinkpad 13-20J1001BUS | |
| Acer Spin 5 SP513-51 | |
| Acer TravelMate P249-M-5452 | |
| 1366x768 Medium Preset (ordenar por valor) | |
| HP 15-bw075ax | |
| HP 15-bw077ax | |
| Lenovo B50-10 80QR0013GE | |
| Lenovo Yoga 510-14AST | |
| HP Pavilion 15-aw004ng W8Y60EA | |
| Lenovo ThinkPad L570 20J80020PB | |
| Dell Latitude 5580 | |
| Lenovo Thinkpad 13-20J1001BUS | |
| Acer Spin 5 SP513-51 | |
| Acer TravelMate P249-M-5452 | |
| Alien: Isolation | |
| 1024x768 (Very) Low, Off, Shadow Map 512 AF:1x (ordenar por valor) | |
| HP 15-bw075ax | |
| HP 15-bw077ax | |
| HP Pavilion 15-aw004ng W8Y60EA | |
| 1366x768 Medium, On (AA & SSAO Off), Shadow Map 1024 AF:4x (ordenar por valor) | |
| HP 15-bw075ax | |
| HP 15-bw077ax | |
| HP Pavilion 15-aw004ng W8Y60EA | |
| Metro: Last Light | |
| 1024x768 Low (DX10) AF:4x (ordenar por valor) | |
| HP 15-bw075ax | |
| HP 15-bw077ax | |
| 1366x768 Medium (DX10) AF:4x (ordenar por valor) | |
| HP 15-bw075ax | |
| HP 15-bw077ax | |
| Deus Ex Mankind Divided | |
| 1280x720 Low Preset AF:1x (ordenar por valor) | |
| HP 15-bw075ax | |
| HP Pavilion 15-aw004ng W8Y60EA | |
| 1366x768 Medium Preset AF:2x (ordenar por valor) | |
| HP 15-bw075ax | |
| HP Pavilion 15-aw004ng W8Y60EA | |
| Rise of the Tomb Raider | |
| 1024x768 Lowest Preset (ordenar por valor) | |
| HP 15-bw075ax | |
| HP 15-bw077ax | |
| Asus X555DA-BB11 | |
| Lenovo Yoga 510-14AST | |
| HP Pavilion 15-aw004ng W8Y60EA | |
| Acer Spin 5 SP513-51 | |
| 1366x768 Medium Preset AF:2x (ordenar por valor) | |
| HP 15-bw075ax | |
| HP 15-bw077ax | |
| Lenovo Yoga 510-14AST | |
| HP Pavilion 15-aw004ng W8Y60EA | |
| bajo | medio | alto | ultra | |
|---|---|---|---|---|
| Batman: Arkham City (2011) | 36 | 29 | 15 | |
| The Elder Scrolls V: Skyrim (2011) | 28 | 19 | 13 | |
| BioShock Infinite (2013) | 43 | 26 | ||
| Metro: Last Light (2013) | 16 | 12 | ||
| Company of Heroes 2 (2013) | 11 | 11 | 6 | |
| Batman: Arkham Origins (2013) | 48 | 29 | 15 | |
| Thief (2014) | 13 | 10 | 8 | |
| Alien: Isolation (2014) | 32 | 20 | ||
| Call of Duty: Advanced Warfare (2014) | 16 | |||
| Batman: Arkham Knight (2015) | 9 | 3 | ||
| Rise of the Tomb Raider (2016) | 18 | 11 | ||
| Ashes of the Singularity (2016) | 8 | |||
| Deus Ex Mankind Divided (2016) | 10 | 7 |
Ruido
| Ocioso |
| 30.9 / 31.2 / 32 dB(A) |
| Carga |
| 35 / 36.4 dB(A) |
 | ||
30 dB silencioso 40 dB(A) audible 50 dB(A) ruidosamente alto |
||
min: | ||
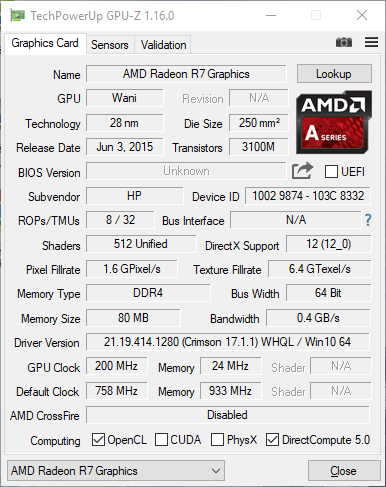
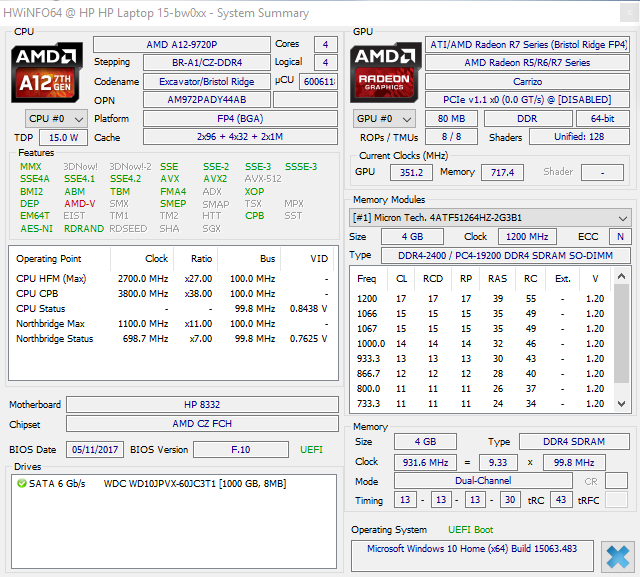
| HP 15-bw075ax Radeon R7 (Bristol Ridge), A12-9720P, WDC Scorpio Blue WD10JPVX-60JC3T1 | HP 15-bw077ax Radeon R5 (Stoney Ridge), A9-9420, WDC Scorpio Blue WD10JPVX-60JC3T1 | Asus X555DA-BB11 Radeon R6 (Carrizo), A10-8700P, Seagate Momentus SpinPoint M8 ST1000LM024 HN-M101MBB | Lenovo B50-10 80QR0013GE HD Graphics (Bay Trail), N3540, Seagate Momentus Thin ST500LT012-1DG142 | Lenovo Yoga 510-14AST Radeon R5 (Stoney Ridge), A9-9410 | HP Pavilion 15-aw004ng W8Y60EA Radeon R8 M445DX, A10-9600P | |
|---|---|---|---|---|---|---|
| Noise | -2% | -1% | -3% | 4% | -9% | |
| apagado / medio ambiente * (dB) | 27.8 | 27.8 -0% | 28.9 -4% | 31.2 -12% | 30.4 -9% | 31.2 -12% |
| Idle Minimum * (dB) | 30.9 | 31.8 -3% | 31.6 -2% | 33.5 -8% | 30.4 2% | 31.7 -3% |
| Idle Average * (dB) | 31.2 | 33.2 -6% | 32 -3% | 33.5 -7% | 30.4 3% | 31.9 -2% |
| Idle Maximum * (dB) | 32 | 34 -6% | 32.4 -1% | 33.5 -5% | 30.4 5% | 31.9 -0% |
| Load Average * (dB) | 35 | 33.3 5% | 33.3 5% | 33.5 4% | 31.3 11% | 41 -17% |
| Load Maximum * (dB) | 36.4 | 36.4 -0% | 35.5 2% | 33.5 8% | 33.3 9% | 42.7 -17% |
* ... más pequeño es mejor
(±) La temperatura máxima en la parte superior es de 40.8 °C / 105 F, frente a la media de 36.8 °C / 98 F, que oscila entre 21 y 71 °C para la clase Multimedia.
(±) El fondo se calienta hasta un máximo de 44.4 °C / 112 F, frente a la media de 39.1 °C / 102 F
(+) En reposo, la temperatura media de la parte superior es de 29.6 °C / 85# F, frente a la media del dispositivo de 31.3 °C / 88 F.
(±) El reposamanos y el touchpad pueden calentarse mucho al tacto con un máximo de 36.8 °C / 98.2 F.
(-) La temperatura media de la zona del reposamanos de dispositivos similares fue de 28.7 °C / 83.7 F (-8.1 °C / -14.5 F).
HP 15-bw075ax análisis de audio
(±) | la sonoridad del altavoz es media pero buena (75 dB)
Graves 100 - 315 Hz
(±) | lubina reducida - en promedio 8.2% inferior a la mediana
(±) | la linealidad de los graves es media (9.4% delta a frecuencia anterior)
Medios 400 - 2000 Hz
(+) | medios equilibrados - a sólo 2.5% de la mediana
(±) | la linealidad de los medios es media (8.1% delta respecto a la frecuencia anterior)
Altos 2 - 16 kHz
(+) | máximos equilibrados - a sólo 2.7% de la mediana
(±) | la linealidad de los máximos es media (7.5% delta a frecuencia anterior)
Total 100 - 16.000 Hz
(+) | el sonido global es lineal (14.8% de diferencia con la mediana)
En comparación con la misma clase
» 35% de todos los dispositivos probados de esta clase eran mejores, 4% similares, 61% peores
» El mejor tuvo un delta de 5%, la media fue 17%, el peor fue ###max##%
En comparación con todos los dispositivos probados
» 20% de todos los dispositivos probados eran mejores, 4% similares, 76% peores
» El mejor tuvo un delta de 4%, la media fue 23%, el peor fue ###max##%
Asus X555DA-BB11 análisis de audio
(±) | la sonoridad del altavoz es media pero buena (76.4 dB)
Graves 100 - 315 Hz
(-) | casi sin bajos - de media 21.4% inferior a la mediana
(±) | la linealidad de los graves es media (13.5% delta a frecuencia anterior)
Medios 400 - 2000 Hz
(±) | medios reducidos - de media 5.1% inferior a la mediana
(±) | la linealidad de los medios es media (14.6% delta respecto a la frecuencia anterior)
Altos 2 - 16 kHz
(±) | máximos más altos - de media 7.2% más altos que la mediana
(±) | la linealidad de los máximos es media (14.6% delta a frecuencia anterior)
Total 100 - 16.000 Hz
(±) | la linealidad del sonido global es media (29% de diferencia con la mediana)
En comparación con la misma clase
» 95% de todos los dispositivos probados de esta clase eran mejores, 1% similares, 4% peores
» El mejor tuvo un delta de 5%, la media fue 17%, el peor fue ###max##%
En comparación con todos los dispositivos probados
» 87% de todos los dispositivos probados eran mejores, 2% similares, 11% peores
» El mejor tuvo un delta de 4%, la media fue 23%, el peor fue ###max##%
| Off / Standby | |
| Ocioso | |
| Carga |
|
Clave:
min: | |
| HP 15-bw075ax A12-9720P, Radeon R7 (Bristol Ridge), WDC Scorpio Blue WD10JPVX-60JC3T1, TN LED, 1366x768, 15.6" | HP 15-bw077ax A9-9420, Radeon R5 (Stoney Ridge), WDC Scorpio Blue WD10JPVX-60JC3T1, TN LED, 1366x768, 15.6" | Asus X555DA-BB11 A10-8700P, Radeon R6 (Carrizo), Seagate Momentus SpinPoint M8 ST1000LM024 HN-M101MBB, TN LED, 1920x1080, 15.6" | Lenovo B50-10 80QR0013GE N3540, HD Graphics (Bay Trail), Seagate Momentus Thin ST500LT012-1DG142, TN LED, 1366x768, 15.6" | Lenovo Yoga 510-14AST A9-9410, Radeon R5 (Stoney Ridge), , TN LED, 1366x768, 14" | HP Pavilion 15-aw004ng W8Y60EA A10-9600P, Radeon R8 M445DX, , TN LED, 1920x1080, 15.6" | |
|---|---|---|---|---|---|---|
| Power Consumption | -19% | -36% | 17% | 15% | -32% | |
| Idle Minimum * (Watt) | 4.2 | 8 -90% | 8.3 -98% | 4.8 -14% | 3.9 7% | 5.5 -31% |
| Idle Average * (Watt) | 6.6 | 9.4 -42% | 8.6 -30% | 7.5 -14% | 7.4 -12% | 8.2 -24% |
| Idle Maximum * (Watt) | 10.4 | 13.9 -34% | 13.1 -26% | 9.2 12% | 9.4 10% | 9.5 9% |
| Load Average * (Watt) | 28.2 | 18.5 34% | 31.2 -11% | 16 43% | 19.2 32% | 44.5 -58% |
| Load Maximum * (Watt) | 37.6 | 23 39% | 43.9 -17% | 15.4 59% | 22.5 40% | 58 -54% |
* ... más pequeño es mejor
| HP 15-bw075ax A12-9720P, Radeon R7 (Bristol Ridge), 31 Wh | HP 15-bw077ax A9-9420, Radeon R5 (Stoney Ridge), 31 Wh | Asus X555DA-BB11 A10-8700P, Radeon R6 (Carrizo), 37 Wh | Lenovo B50-10 80QR0013GE N3540, HD Graphics (Bay Trail), 24 Wh | Lenovo Yoga 510-14AST A9-9410, Radeon R5 (Stoney Ridge), 35 Wh | HP Pavilion 15-aw004ng W8Y60EA A10-9600P, Radeon R8 M445DX, 41 Wh | |
|---|---|---|---|---|---|---|
| Duración de Batería | 6% | -3% | -5% | 72% | 32% | |
| Reader / Idle (h) | 7.8 | 9 15% | 7.3 -6% | 14.1 81% | 9.3 19% | |
| WiFi v1.3 (h) | 3.7 | 3.4 -8% | 2.9 -22% | 3.5 -5% | 5.4 46% | 4.3 16% |
| Load (h) | 1 | 1.1 10% | 1.2 20% | 1.9 90% | 1.6 60% |
Pro
Contra


Si bien el HP 15 (A9) que analizamos recientemente fue un ejercicio de paciencia debido a sus componentes lentos y su funcionamiento indolente, el HP 15 (A12) es una dificultad debido a su inestabilidad. El procesador es mucho más rápido que la dual-core A9 en nuestro modelo anterior, pero debido a un mal soporte de driver, una optimización mediocre del software, o algún otro factor, el sistema es casi inutilizable debido a la altísima posibilidad de que el sistema falle. Tal cual está, no podemos recomendar el HP 15 (A12) hasta que la estabilidad del sistema mejore.
Es una pena, ya que el HP 15 (A12) es una mejora respecto a la versión A9 en todas las pruebas de rendimiento. Si bien nos seguimos quejando de la mala pantalla y del teclado flojo, las entrañas han mejorado mucho (cuando tienen la ocasión de funcionar). Vemos, empero, una ralentización intensa bajo estrés a pesar de la amplia holgura que tiene la APU para exhibir su fuerza.
Aún sin tener en cuenta los fallos de sistema, el HP 15 (A12) sigue siendo un portátil económico olvidable que no trae nada atractivo a las estanterías de la tienda. Como mencionamos con el HP 15 (A9), hay opciones mucho mejores para este precio.
Ésta es una versión acortada del análisis original. Puedes leer el análisis completo en inglés aquí.
HP 15-bw075ax
- 07/15/2017 v6 (old)
Sam Medley
Price comparison
