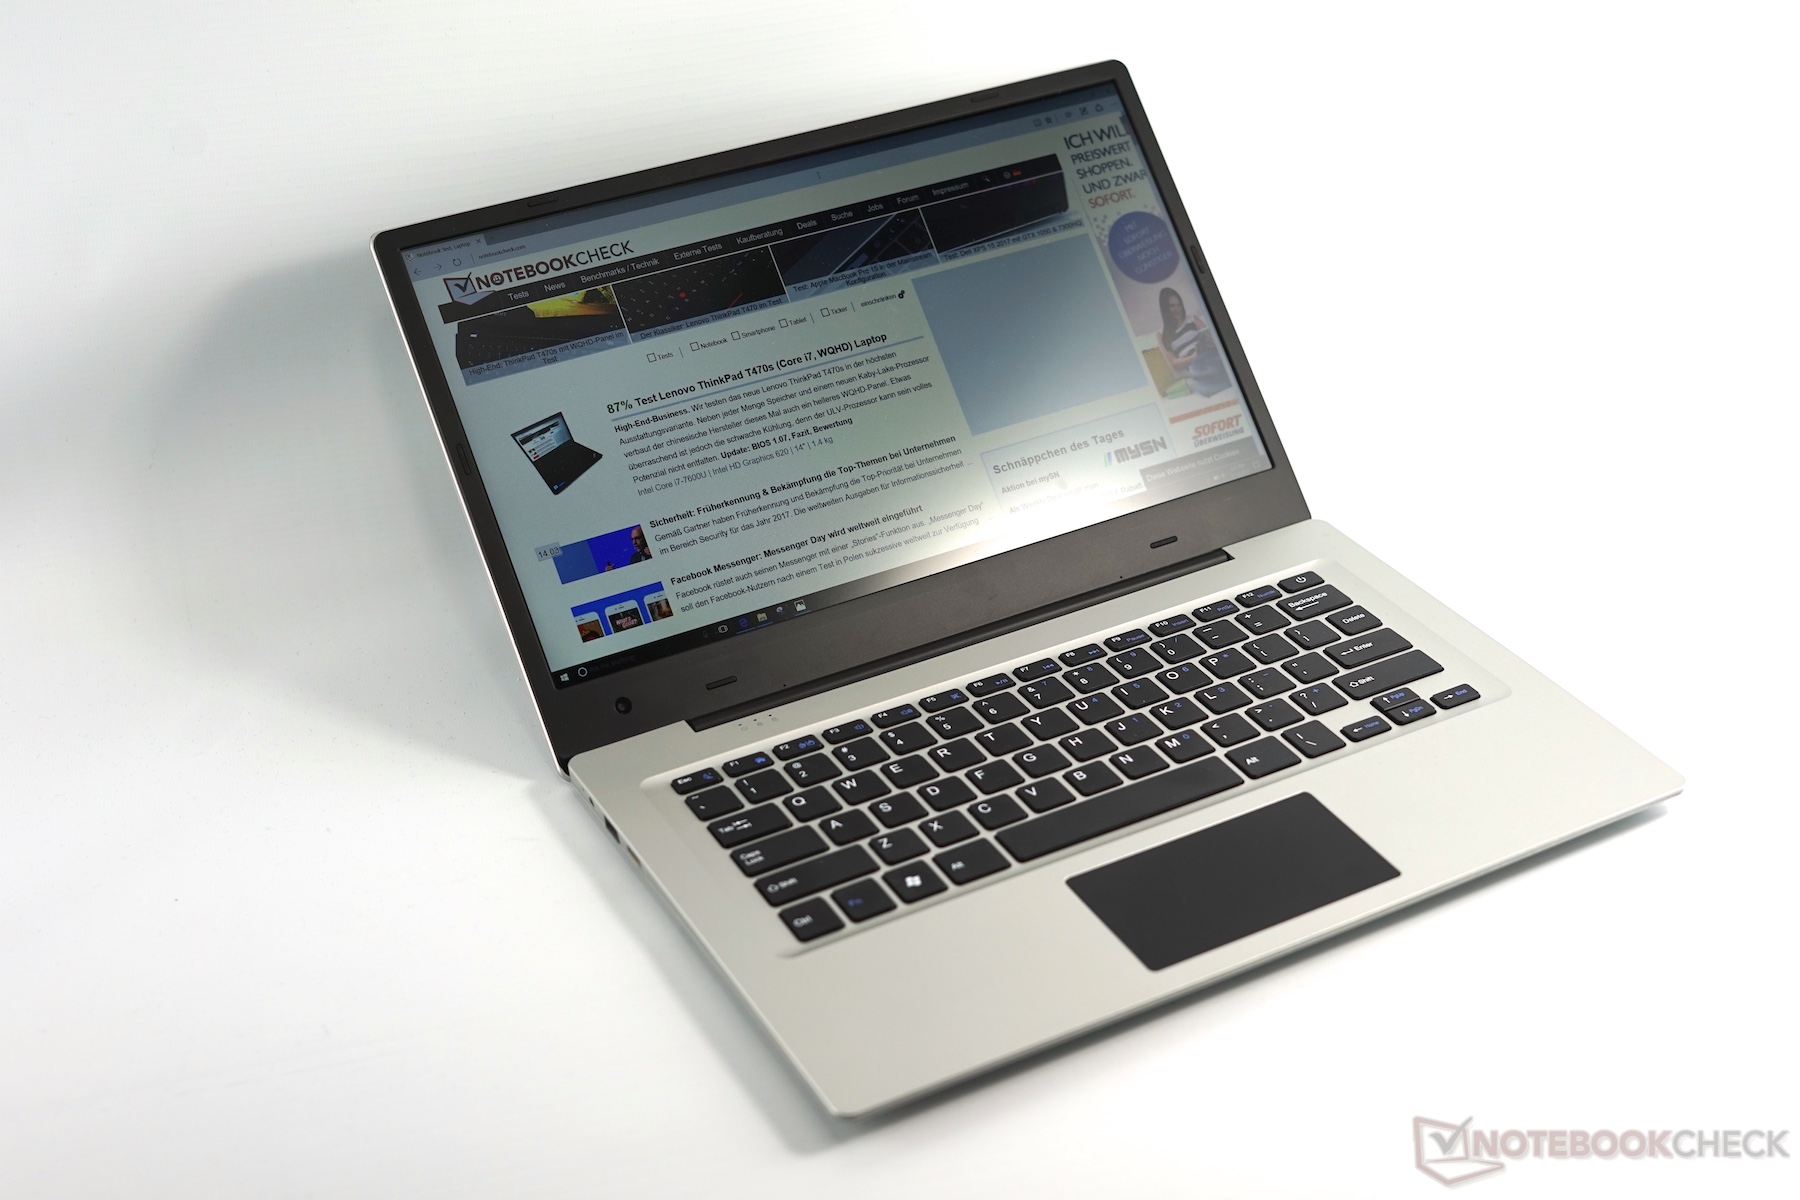
Breve análisis del portátil Jumper EZBook 3 (N3350, FHD)
| SD Card Reader | |
| average JPG Copy Test (av. of 3 runs) | |
| HP Pavilion x360 11t T5M27AV | |
| HP 250 G5 Y1V08UT | |
| Acer Swift 1 SF114-31-P6F6 | |
| Jumper EZbook 3 | |
| Acer Aspire ES1-332-P91H | |
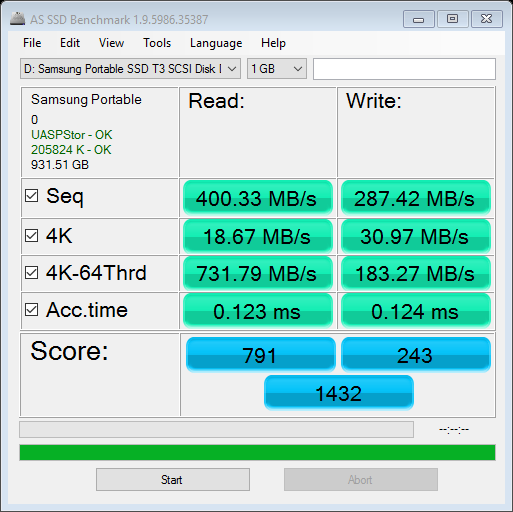
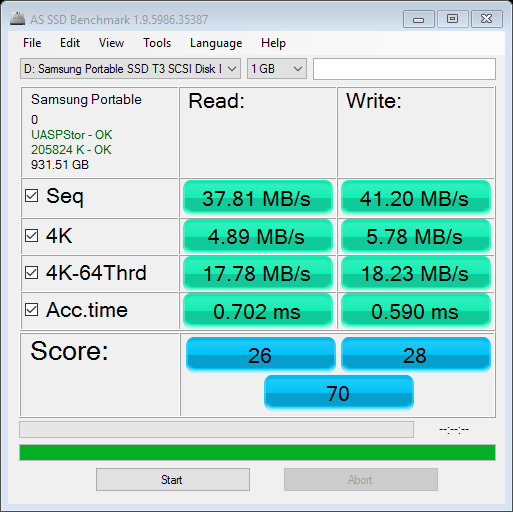
| maximum AS SSD Seq Read Test (1GB) | |
| HP Pavilion x360 11t T5M27AV | |
| Acer Aspire ES1-332-P91H | |
| Acer Swift 1 SF114-31-P6F6 | |
| Jumper EZbook 3 | |
| HP 250 G5 Y1V08UT | |
| Networking | |
| iperf3 transmit AX12 | |
| Asus Zenbook UX3410UA | |
| Chuwi LapBook 14 inch 2017 | |
| Jumper EZbook 3 | |
| Acer Swift 1 SF114-31-P6F6 (jseb) | |
| Chuwi Hi10 Pro | |
| iperf3 receive AX12 | |
| Chuwi LapBook 14 inch 2017 | |
| Asus Zenbook UX3410UA | |
| Jumper EZbook 3 | |
| Acer Swift 1 SF114-31-P6F6 (jseb) | |
| Chuwi Hi10 Pro | |
| |||||||||||||||||||||||||
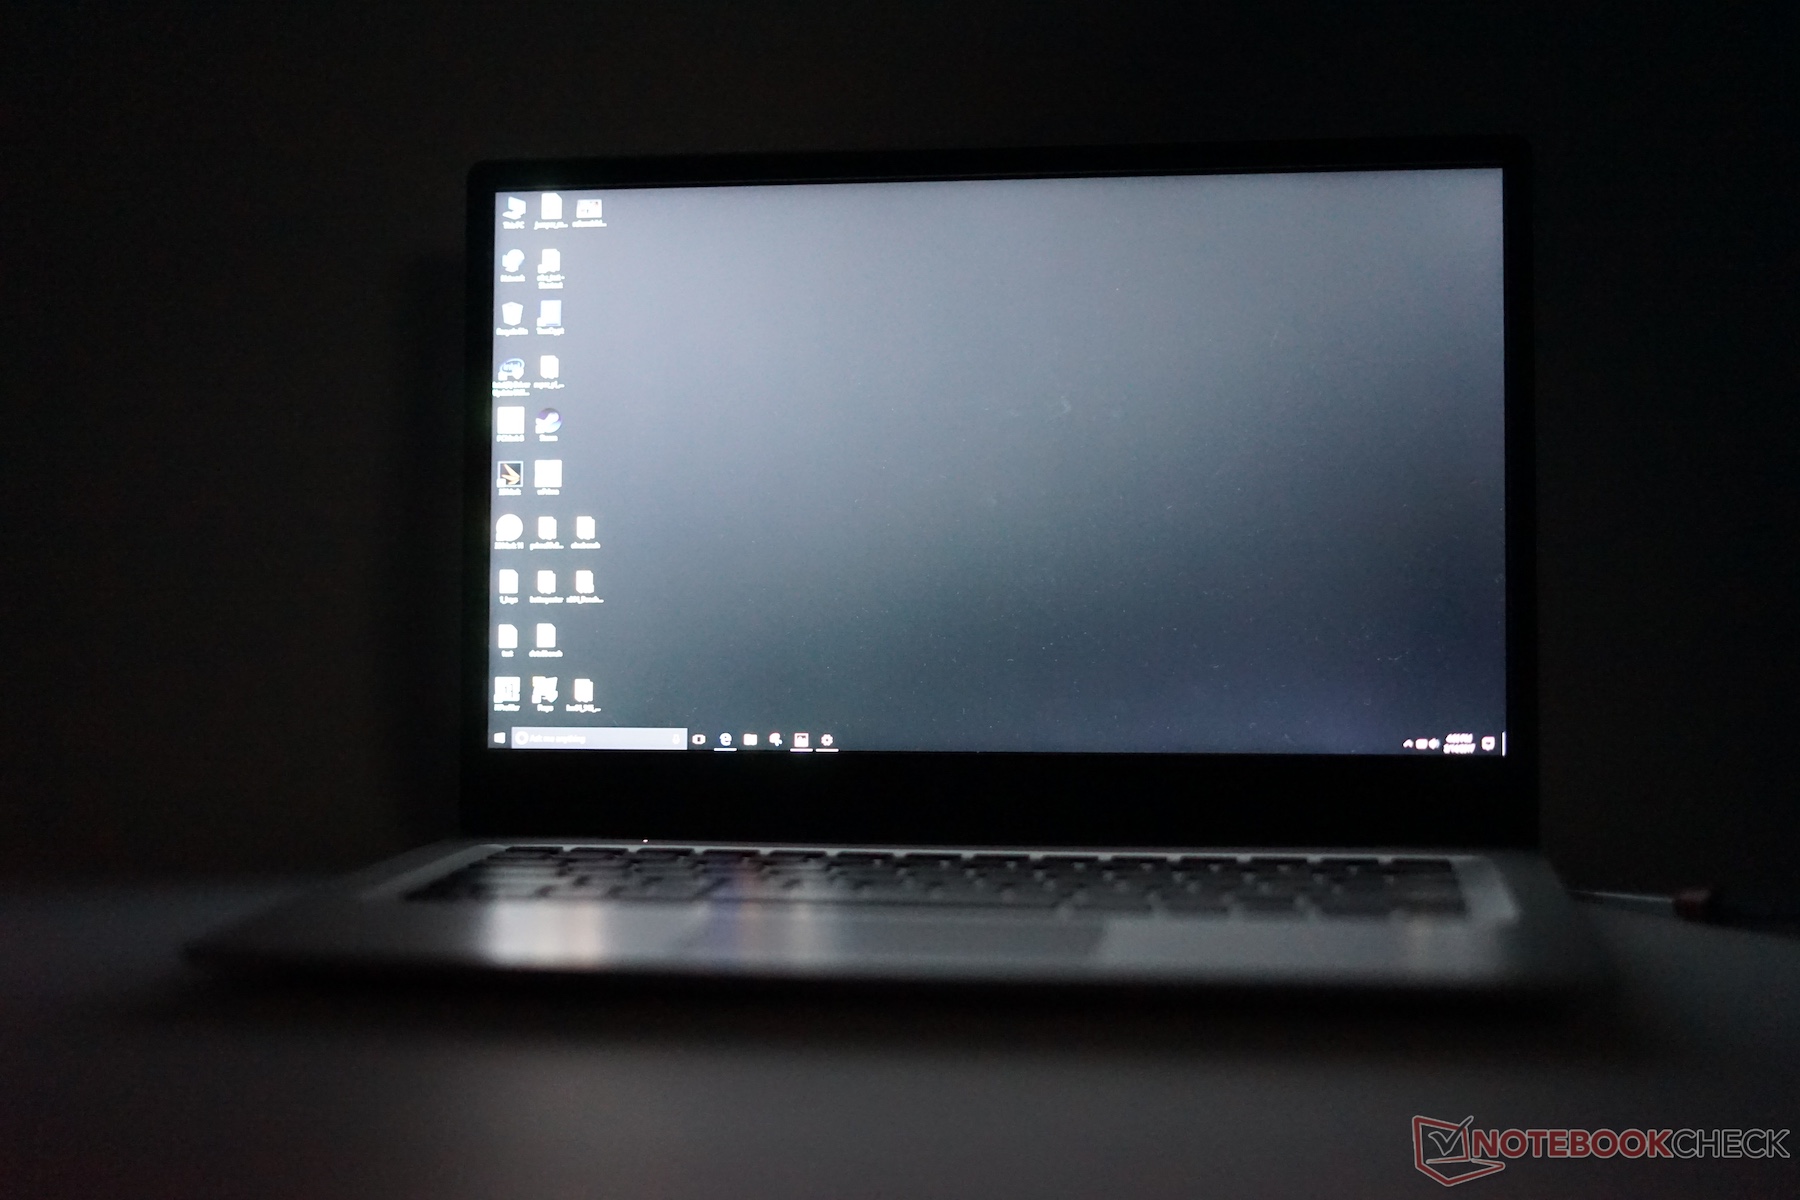
iluminación: 76 %
Brillo con batería: 384 cd/m²
Contraste: 300:1 (Negro: 1.28 cd/m²)
ΔE ColorChecker Calman: 8.7 | ∀{0.5-29.43 Ø4.71}
ΔE Greyscale Calman: 11.1 | ∀{0.09-98 Ø4.96}
53% AdobeRGB 1998 (Argyll 3D)
77.3% sRGB (Argyll 3D)
51.6% Display P3 (Argyll 3D)
Gamma: 2.2
CCT: 12445 K
| Jumper EZbook 3 MS_9003, TN LED, 1920x1080, 14.1" | Acer Swift 1 SF114-31-P6F6 Chi Mei N140BGA-EA3, TN LED, 1366x768, 14" | Apple MacBook 12 (Early 2016) 1.1 GHz APPA027, IPS, 2304x1440, 12" | Teclast Tbook 10s LCD, IPS, 1920x1200, 10.1" | VOYO VBook V3 Chi Mei N116HSE, IPS LED, 1920x1080, 13.3" | Cube i7 Book CDK09 Samsung LTN140W1-L01, IPS, 1920x1080, 10.6" | |
|---|---|---|---|---|---|---|
| Display | -20% | 27% | ||||
| Display P3 Coverage (%) | 51.6 | 40.97 -21% | 66.8 29% | |||
| sRGB Coverage (%) | 77.3 | 61.5 -20% | 95.4 23% | |||
| AdobeRGB 1998 Coverage (%) | 53 | 42.35 -20% | 68 28% | |||
| Response Times | -65% | -76% | -58% | -126% | ||
| Response Time Grey 50% / Grey 80% * (ms) | 46 ? | 32 ? 30% | 41.2 ? 10% | 40 ? 13% | 49 ? -7% | |
| Response Time Black / White * (ms) | 11.6 ? | 30 ? -159% | 30.4 ? -162% | 26.4 ? -128% | 40 ? -245% | |
| PWM Frequency (Hz) | 200 ? | 200 ? | ||||
| Screen | 22% | 64% | 45% | 36% | 51% | |
| Brightness middle (cd/m²) | 384 | 270 -30% | 387 1% | 279 -27% | 195 -49% | 384 0% |
| Brightness (cd/m²) | 341 | 247 -28% | 358 5% | 280 -18% | 200 -41% | 370 9% |
| Brightness Distribution (%) | 76 | 80 5% | 88 16% | 82 8% | 72 -5% | 89 17% |
| Black Level * (cd/m²) | 1.28 | 0.57 55% | 0.47 63% | 0.29 77% | 0.24 81% | 0.37 71% |
| Contrast (:1) | 300 | 474 58% | 823 174% | 962 221% | 813 171% | 1038 246% |
| Colorchecker dE 2000 * | 8.7 | 3.01 65% | 1.6 82% | 6.7 23% | 5 43% | 5.8 33% |
| Colorchecker dE 2000 max. * | 16.7 | 6.33 62% | 4 76% | 10.8 35% | 9.31 44% | 19.8 -19% |
| Greyscale dE 2000 * | 11.1 | 12.73 -15% | 1 91% | 6.8 39% | 5.98 46% | 5.1 54% |
| Gamma | 2.2 100% | 2.36 93% | 2.26 97% | 2.27 97% | 2.17 101% | 2.4 92% |
| CCT | 12445 52% | 14629 44% | 6680 97% | 8466 77% | 6764 96% | 7125 91% |
| Color Space (Percent of AdobeRGB 1998) (%) | 39 | 61.6 | ||||
| Color Space (Percent of sRGB) (%) | 62 | 82.2 | ||||
| Media total (Programa/Opciones) | -21% /
-1% | 5% /
34% | -7% /
24% | -45% /
4% | 51% /
51% |
* ... más pequeño es mejor
Tiempos de respuesta del display
| ↔ Tiempo de respuesta de Negro a Blanco | ||
|---|---|---|
| 11.6 ms ... subida ↗ y bajada ↘ combinada | ↗ 7.7 ms subida | 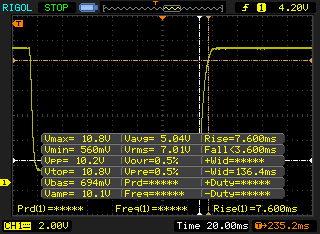 |
| ↘ 3.8 ms bajada | ||
| La pantalla mostró buenos tiempos de respuesta en nuestros tests pero podría ser demasiado lenta para los jugones competitivos. En comparación, todos los dispositivos de prueba van de ##min### (mínimo) a 240 (máximo) ms. » 31 % de todos los dispositivos son mejores. Esto quiere decir que el tiempo de respuesta medido es mejor que la media (19.8 ms) de todos los dispositivos testados. | ||
| ↔ Tiempo de respuesta 50% Gris a 80% Gris | ||
| 46 ms ... subida ↗ y bajada ↘ combinada | ↗ 25 ms subida | 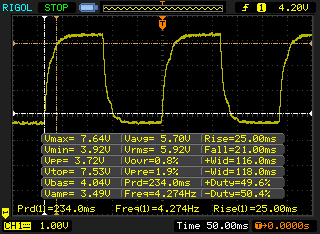 |
| ↘ 21 ms bajada | ||
| La pantalla mostró tiempos de respuesta lentos en nuestros tests y podría ser demasiado lenta para los jugones. En comparación, todos los dispositivos de prueba van de ##min### (mínimo) a 636 (máximo) ms. » 79 % de todos los dispositivos son mejores. Eso quiere decir que el tiempo de respuesta es peor que la media (31 ms) de todos los dispositivos testados. | ||
Parpadeo de Pantalla / PWM (Pulse-Width Modulation)
| Parpadeo de Pantalla / PWM detectado | 200 Hz | ≤ 99 % de brillo | 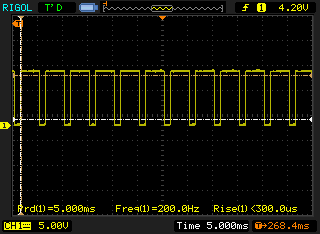 |
La retroiluminación del display parpadea a 200 Hz (seguramente usa PWM - Pulse-Width Modulation) a un brillo del 99 % e inferior. Sobre este nivel de brillo no debería darse parpadeo / PWM. La frecuencia de 200 Hz es relativamente baja, por lo que la gente sensible debería ver parpadeos y padecer fatiga visual por la pantalla (usado al brillo indicado a continuación). Comparación: 52 % de todos los dispositivos testados no usaron PWM para atenuar el display. Si se usó, medimos una media de 7751 (mínimo: 5 - máxmo: 343500) Hz. | |||
| PCMark 8 | |
| Home Score Accelerated v2 | |
| Cube i7 Book CDK09 | |
| Apple MacBook 12 (Early 2016) 1.1 GHz | |
| Acer Swift 1 SF114-31-P6F6 | |
| Acer Aspire ES1-332-P91H | |
| HP 250 G5 Y1V08UT | |
| Jumper EZbook 3 | |
| Teclast Tbook 10s | |
| Work Score Accelerated v2 | |
| Apple MacBook 12 (Early 2016) 1.1 GHz | |
| Acer Aspire ES1-332-P91H | |
| Jumper EZbook 3 | |
| Acer Swift 1 SF114-31-P6F6 | |
| HP 250 G5 Y1V08UT | |
| Teclast Tbook 10s | |
| PCMark 8 Home Score Accelerated v2 | 1592 puntos | |
| PCMark 8 Work Score Accelerated v2 | 2207 puntos | |
| PCMark 10 Score | 1195 puntos | |
ayuda | ||
| Jumper EZbook 3 Toshiba 064G93 64 GB eMMC | Apple MacBook 12 (Early 2016) 1.3 GHz Apple SSD AP0256 | Asus TransformerBook T302CA-FL010T Samsung CM871 MZNLF128HCHP | Acer Swift 1 SF114-31-P6F6 128 GB eMMC Flash | Chuwi Hi12 Hynix HCG8E 64 GB | Acer Aspire ES1-521-87DN Western Digital Scorpio Blue WD5000LPVX | HP Pavilion 11-k103ng x360 Hitachi Travelstar Z5K500 HTS545050A7E680 | |
|---|---|---|---|---|---|---|---|
| CrystalDiskMark 3.0 | 1814% | 265% | 155% | 134% | -32% | -38% | |
| Read Seq (MB/s) | 151 | 821 444% | 428 183% | 166.5 10% | 141 -7% | 109.6 -27% | 106 -30% |
| Write Seq (MB/s) | 50 | 660 1220% | 124.2 148% | 85 70% | 50 0% | 107.5 115% | 106.1 112% |
| Read 512 (MB/s) | 133 | 672 405% | 283.9 113% | 153.8 16% | 132 -1% | 36.63 -72% | 33.53 -75% |
| Write 512 (MB/s) | 41.3 | 737 1685% | 41.49 0% | 75.6 83% | 44.8 8% | 49.35 19% | 39.03 -5% |
| Read 4k (MB/s) | 5.07 | 16.28 221% | 15.95 215% | 13.2 160% | 17.9 253% | 0.419 -92% | 0.407 -92% |
| Write 4k (MB/s) | 2.47 | 24.87 907% | 14.67 494% | 13.04 428% | 11.4 362% | 1.171 -53% | 1.026 -58% |
| Read 4k QD32 (MB/s) | 16.4 | 271.9 1558% | 98.9 503% | 35.12 114% | 35.3 115% | 1.03 -94% | 0.898 -95% |
| Write 4k QD32 (MB/s) | 2.74 | 223.9 8072% | 15.41 462% | 12.66 362% | 12.1 342% | 1.239 -55% | 1.003 -63% |

| 3DMark 11 - 1280x720 Performance GPU | |
| Asus TransformerBook T302CA-FL010T | |
| Asus Vivobook F556UQ-XO626D | |
| Acer Aspire ES1-332-P91H | |
| Acer Swift 1 SF114-31-P6F6 | |
| HP Pavilion x360 11t T5M27AV | |
| Jumper EZbook 3 | |
| Acer Switch One 10 SW1-011-14UQ | |
| 3DMark 06 Standard Score | 3393 puntos | |
| 3DMark 11 Performance | 505 puntos | |
| 3DMark Cloud Gate Standard Score | 2074 puntos | |
ayuda | ||
| World of Warships - 1366x768 Low Preset AF:Trilinear | |
| MSI CX61 2QC 2970M MS-16GD | |
| Acer Aspire ES1-521-87DN | |
| Jumper EZbook 3 | |
| Acer Extensa 2519-C7DC | |
| Chuwi Hi12 | |
| bajo | medio | alto | ultra | |
|---|---|---|---|---|
| World of Warcraft (2005) | 46 | |||
| Diablo III (2012) | 12.7 | |||
| Counter-Strike: GO (2012) | 14 | |||
| Dota 2 Reborn (2015) | 15.9 | |||
| World of Warships (2015) | 19.1 | |||
| Team Fortress 2 (2017) | 21.2 | |||
| X-Plane 11.11 (2018) | 5.3 | |||
| World of Tanks enCore (2018) | 34 (error at the end) | 4 (error at the end) | ||
| Strange Brigade (2018) | 0 el juego no arranca | |||
| League of Legends (2019) | 28.2 | 20.2 | 13.9 | 12.6 |
| Hearthstone (2020) | 23.9 | 24 | 11.2 | |
| Valorant (2020) | 9.09 |
(±) La temperatura máxima en la parte superior es de 41 °C / 106 F, frente a la media de 35.9 °C / 97 F, que oscila entre 21.4 y 59 °C para la clase Subnotebook.
(±) El fondo se calienta hasta un máximo de 42 °C / 108 F, frente a la media de 39.2 °C / 103 F
(+) En reposo, la temperatura media de la parte superior es de 24.2 °C / 76# F, frente a la media del dispositivo de 30.8 °C / 87 F.
(+) Los reposamanos y el panel táctil alcanzan como máximo la temperatura de la piel (32 °C / 89.6 F) y, por tanto, no están calientes.
(-) La temperatura media de la zona del reposamanos de dispositivos similares fue de 28.2 °C / 82.8 F (-3.8 °C / -6.8 F).
Jumper EZbook 3 análisis de audio
(±) | la sonoridad del altavoz es media pero buena (80.4 dB)
Graves 100 - 315 Hz
(-) | casi sin bajos - de media 25.1% inferior a la mediana
(±) | la linealidad de los graves es media (10.6% delta a frecuencia anterior)
Medios 400 - 2000 Hz
(±) | medias más altas - de media 7.2% más altas que la mediana
(±) | la linealidad de los medios es media (10.8% delta respecto a la frecuencia anterior)
Altos 2 - 16 kHz
(±) | máximos más altos - de media 5% más altos que la mediana
(+) | los máximos son lineales (4.4% delta a la frecuencia anterior)
Total 100 - 16.000 Hz
(±) | la linealidad del sonido global es media (27.3% de diferencia con la mediana)
En comparación con la misma clase
» 89% de todos los dispositivos probados de esta clase eran mejores, 3% similares, 9% peores
» El mejor tuvo un delta de 5%, la media fue 18%, el peor fue ###max##%
En comparación con todos los dispositivos probados
» 83% de todos los dispositivos probados eran mejores, 4% similares, 13% peores
» El mejor tuvo un delta de 4%, la media fue 23%, el peor fue ###max##%
Apple MacBook 12 (Early 2016) 1.1 GHz análisis de audio
(+) | los altavoces pueden reproducir a un volumen relativamente alto (#83.6 dB)
Graves 100 - 315 Hz
(±) | lubina reducida - en promedio 11.3% inferior a la mediana
(±) | la linealidad de los graves es media (14.2% delta a frecuencia anterior)
Medios 400 - 2000 Hz
(+) | medios equilibrados - a sólo 2.4% de la mediana
(+) | los medios son lineales (5.5% delta a la frecuencia anterior)
Altos 2 - 16 kHz
(+) | máximos equilibrados - a sólo 2% de la mediana
(+) | los máximos son lineales (4.5% delta a la frecuencia anterior)
Total 100 - 16.000 Hz
(+) | el sonido global es lineal (10.2% de diferencia con la mediana)
En comparación con la misma clase
» 7% de todos los dispositivos probados de esta clase eran mejores, 2% similares, 90% peores
» El mejor tuvo un delta de 5%, la media fue 18%, el peor fue ###max##%
En comparación con todos los dispositivos probados
» 5% de todos los dispositivos probados eran mejores, 1% similares, 94% peores
» El mejor tuvo un delta de 4%, la media fue 23%, el peor fue ###max##%
| Off / Standby | |
| Ocioso | |
| Carga |
|
Clave:
min: | |
| Jumper EZbook 3 Celeron N3350, HD Graphics 500, Toshiba 064G93 64 GB eMMC, TN LED, 1920x1080, 14.1" | Chuwi Hi10 Pro Z8300, HD Graphics (Cherry Trail), 64 GB eMMC Flash, IPS, 1920x1200, 10.1" | HP 250 G5 Y1V08UT N3060, HD Graphics 400 (Braswell), Samsung CM871 MZNLF128HCHP, TN LED, 1366x768, 15.6" | Apple MacBook 12 (Early 2016) 1.3 GHz 6Y75, HD Graphics 515, Apple SSD AP0256, IPS, 2304x1440, 12" | Acer Swift 1 SF114-31-P6F6 N3710, HD Graphics 405 (Braswell), 128 GB eMMC Flash, TN LED, 1366x768, 14" | Acer Aspire ES1-332-P91H Pentium N4200, HD Graphics 505, WDC Slim WD10SPCX-21KHST0, TN LED, 1366x768, 13.3" | HP Pavilion 11-k103ng x360 N3050, HD Graphics (Braswell), Hitachi Travelstar Z5K500 HTS545050A7E680, IPS, 1366x768, 11.6" | |
|---|---|---|---|---|---|---|---|
| Power Consumption | 23% | -3% | -11% | -21% | -32% | -33% | |
| Idle Minimum * (Watt) | 3.18 | 1.4 56% | 3.9 -23% | 2 37% | 4.1 -29% | 4.5 -42% | 5.3 -67% |
| Idle Average * (Watt) | 6.14 | 4.82 21% | 6.4 -4% | 2.06 66% | 8.3 -35% | 7.6 -24% | 7.1 -16% |
| Idle Maximum * (Watt) | 6.4 | 5.43 15% | 6.5 -2% | 6.94 -8% | 8.6 -34% | 8.5 -33% | 8.2 -28% |
| Load Average * (Watt) | 13.3 | 11.61 13% | 11.1 17% | 22.52 -69% | 13.5 -2% | 17.4 -31% | 15.5 -17% |
| Load Maximum * (Watt) | 13.6 | 12.48 8% | 13.8 -1% | 24.87 -83% | 14.5 -7% | 17.6 -29% | 18.9 -39% |
* ... más pequeño es mejor
| Battery Runtime - WiFi Websurfing | |
| Acer Swift 1 SF114-31-P6F6 | |
| Apple MacBook Air 13 inch 2015-03 | |
| Apple MacBook 12 (Early 2016) 1.3 GHz | |
| Jumper EZbook 3 | |
| Xiaomi Mi Notebook Air 13.3 2016 | |
| Acer Swift 3 SF314-51-731X | |
| VOYO VBook V3 | |
Pro
Contra
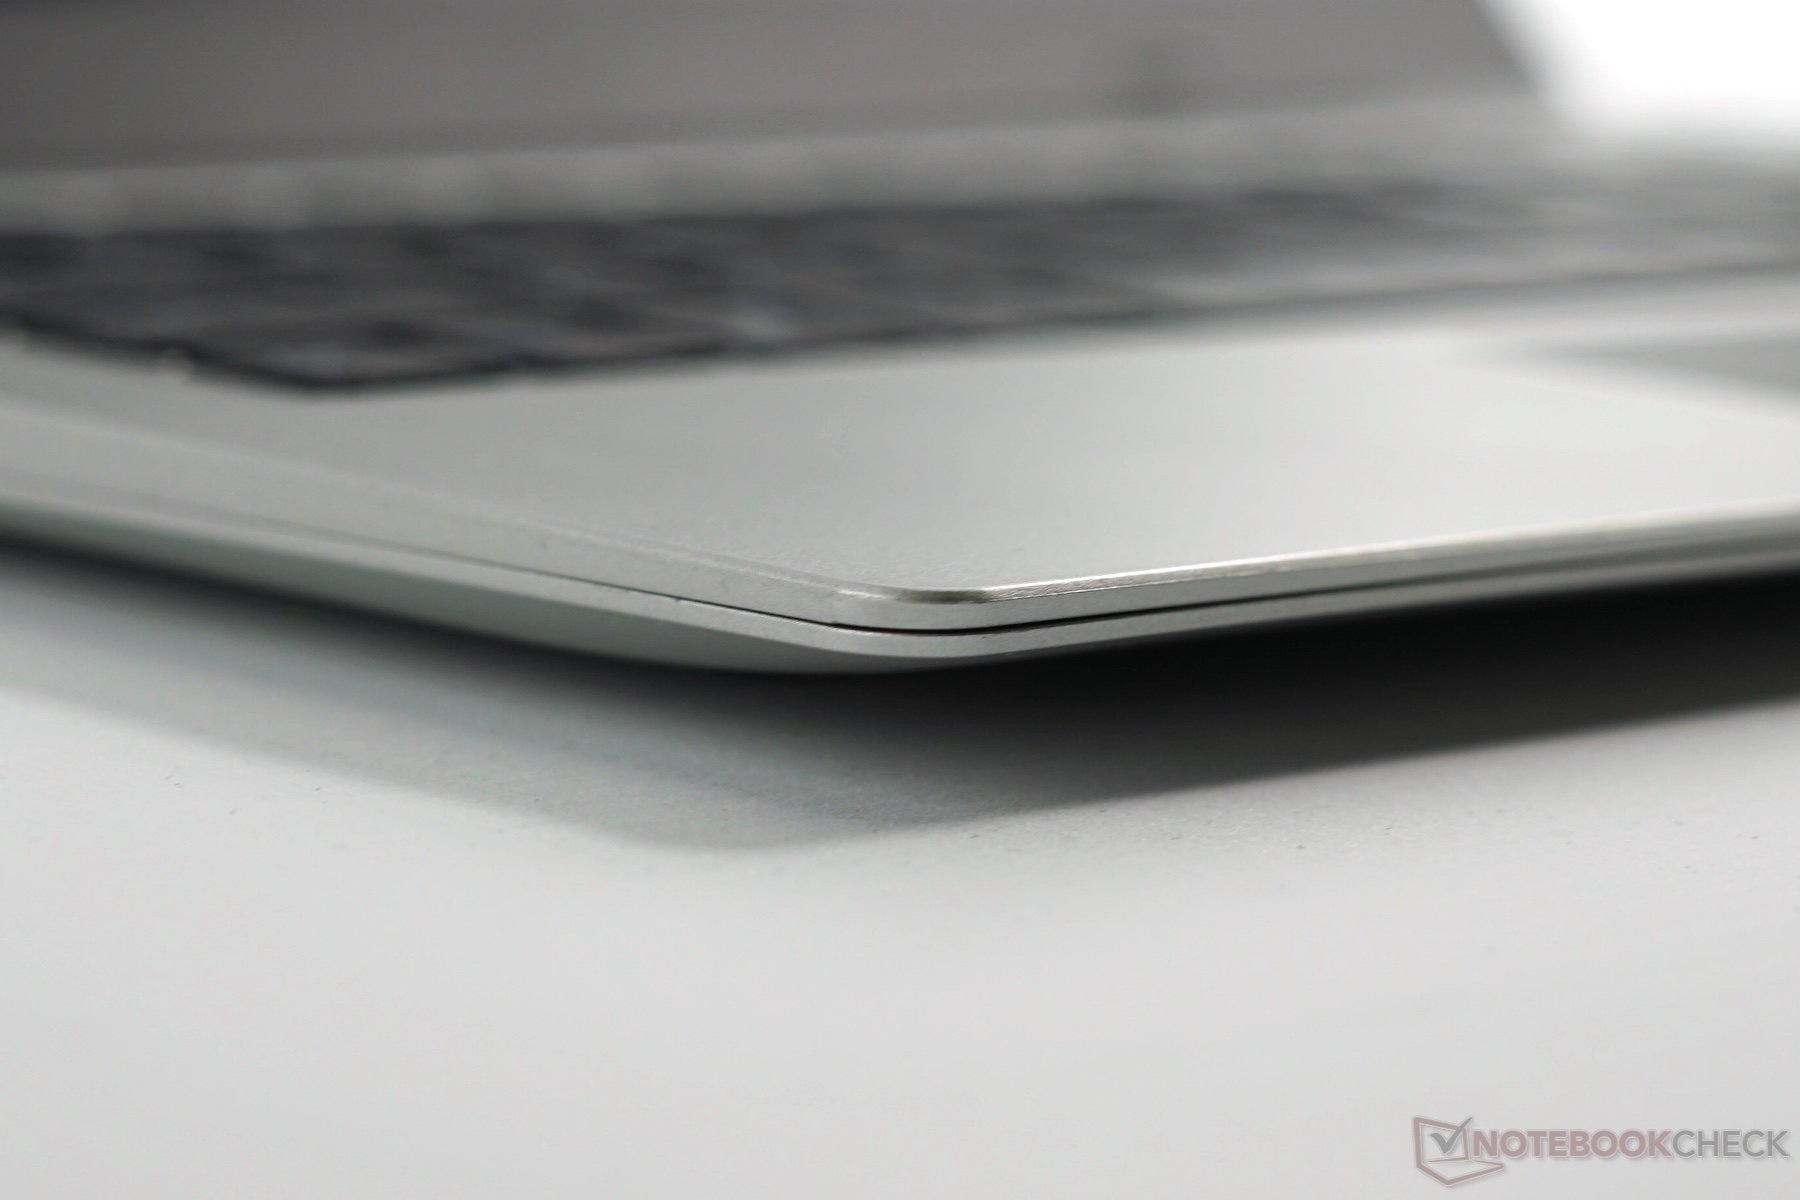
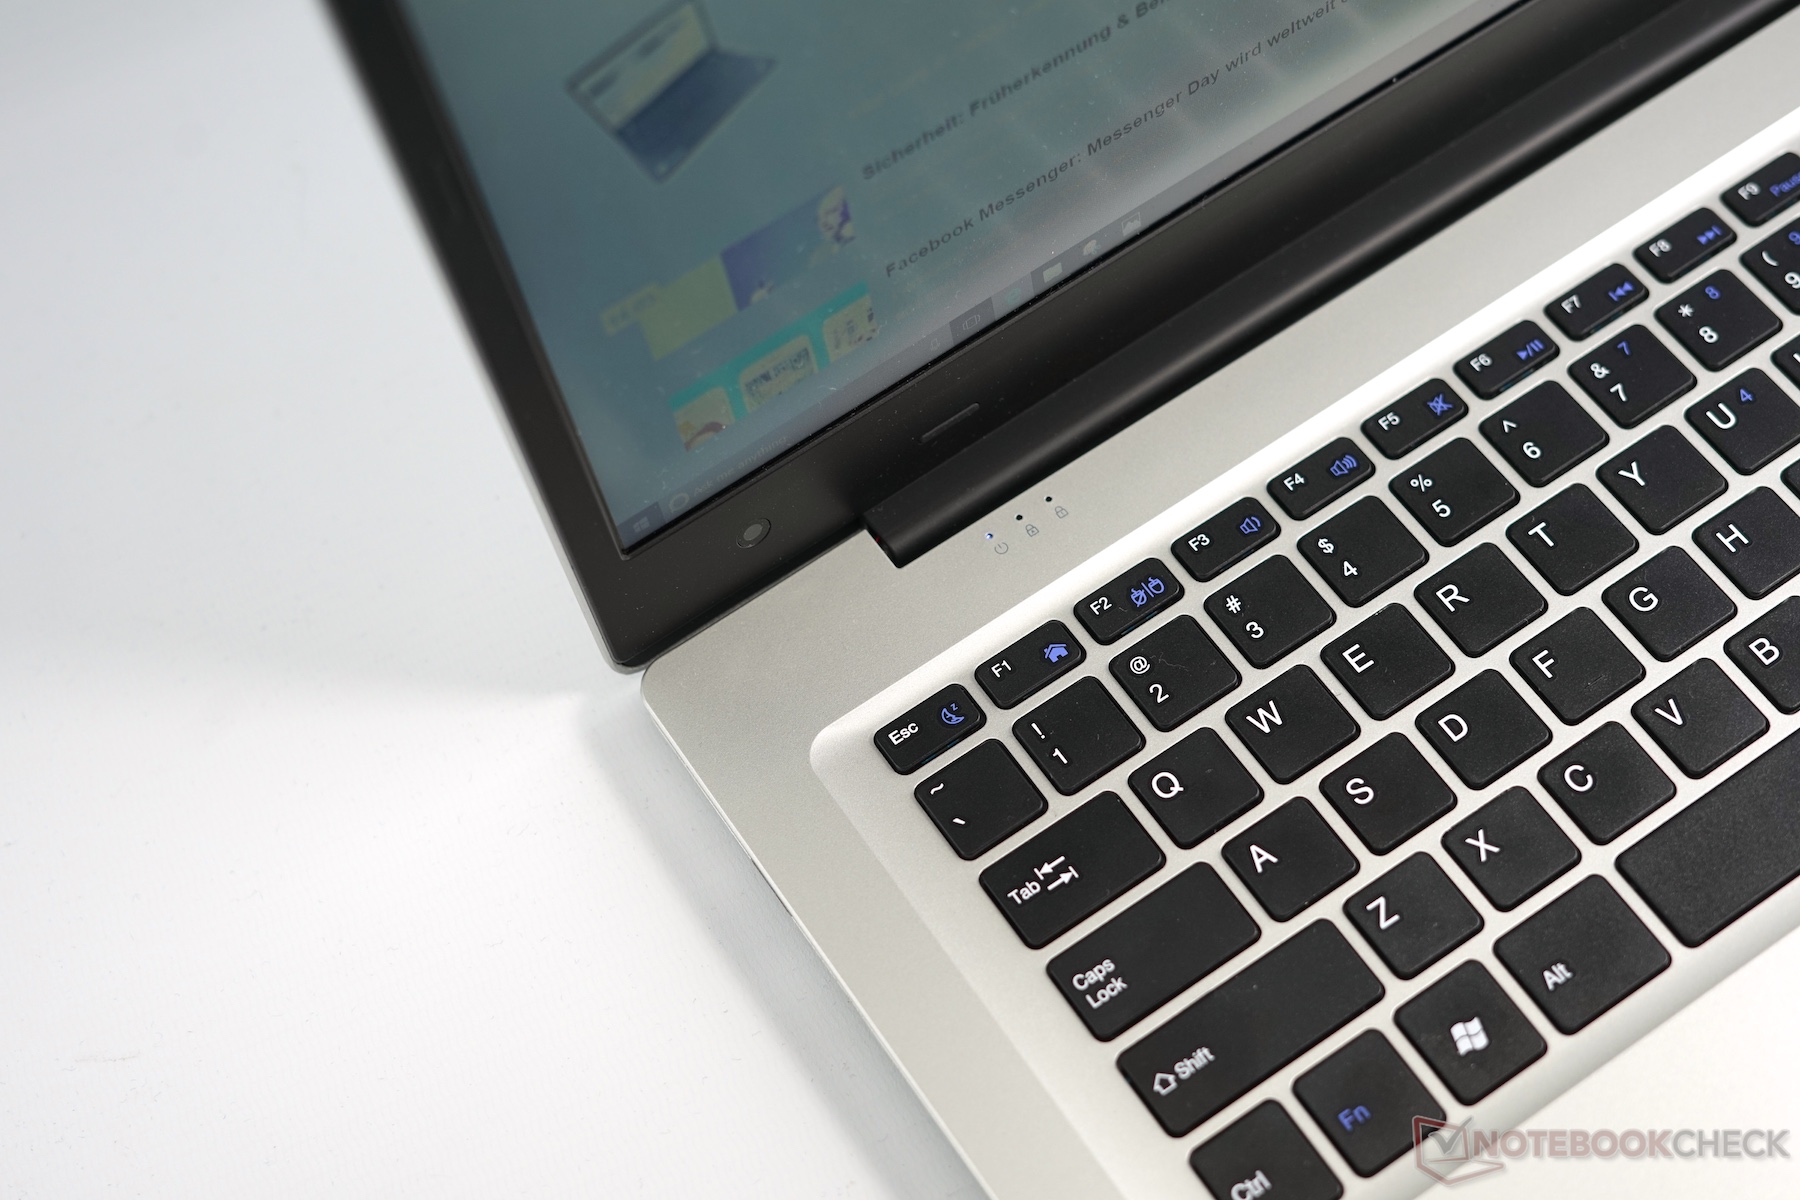
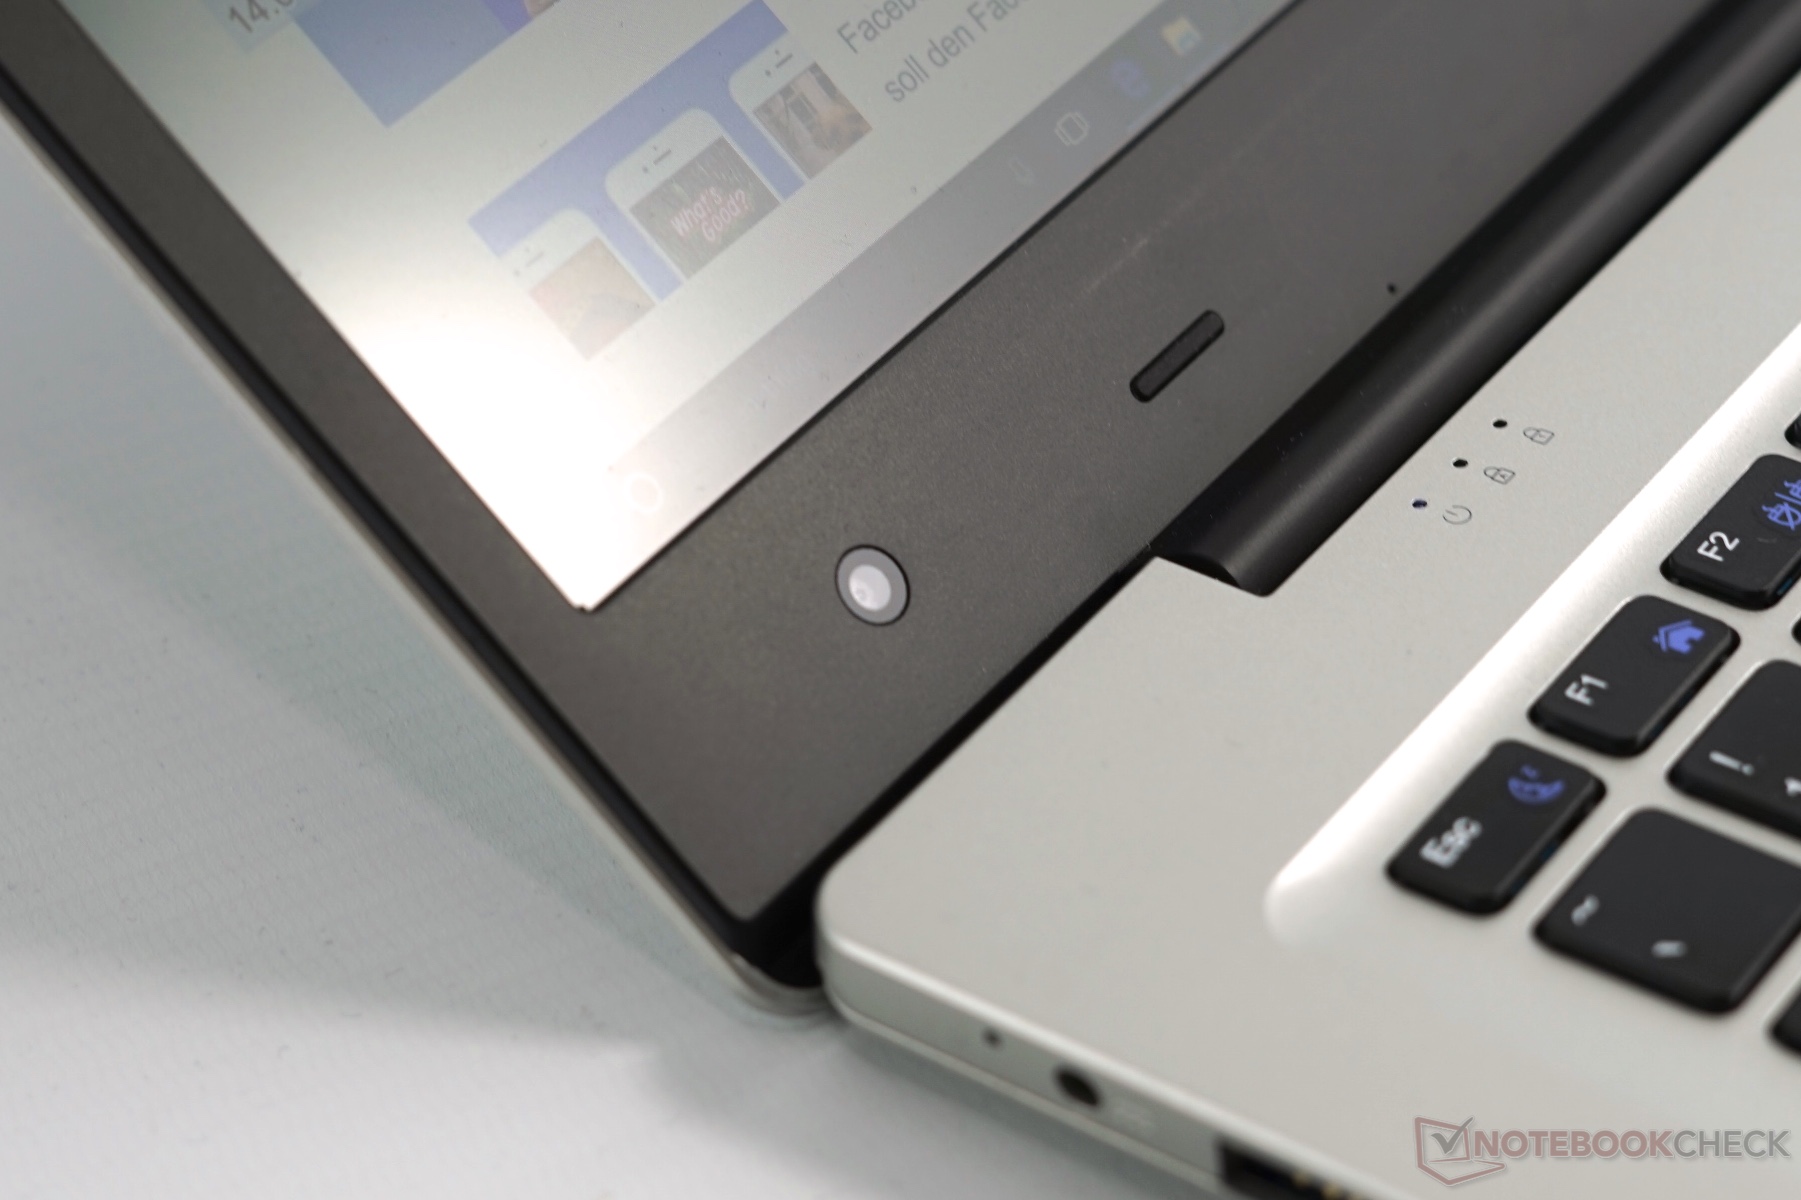
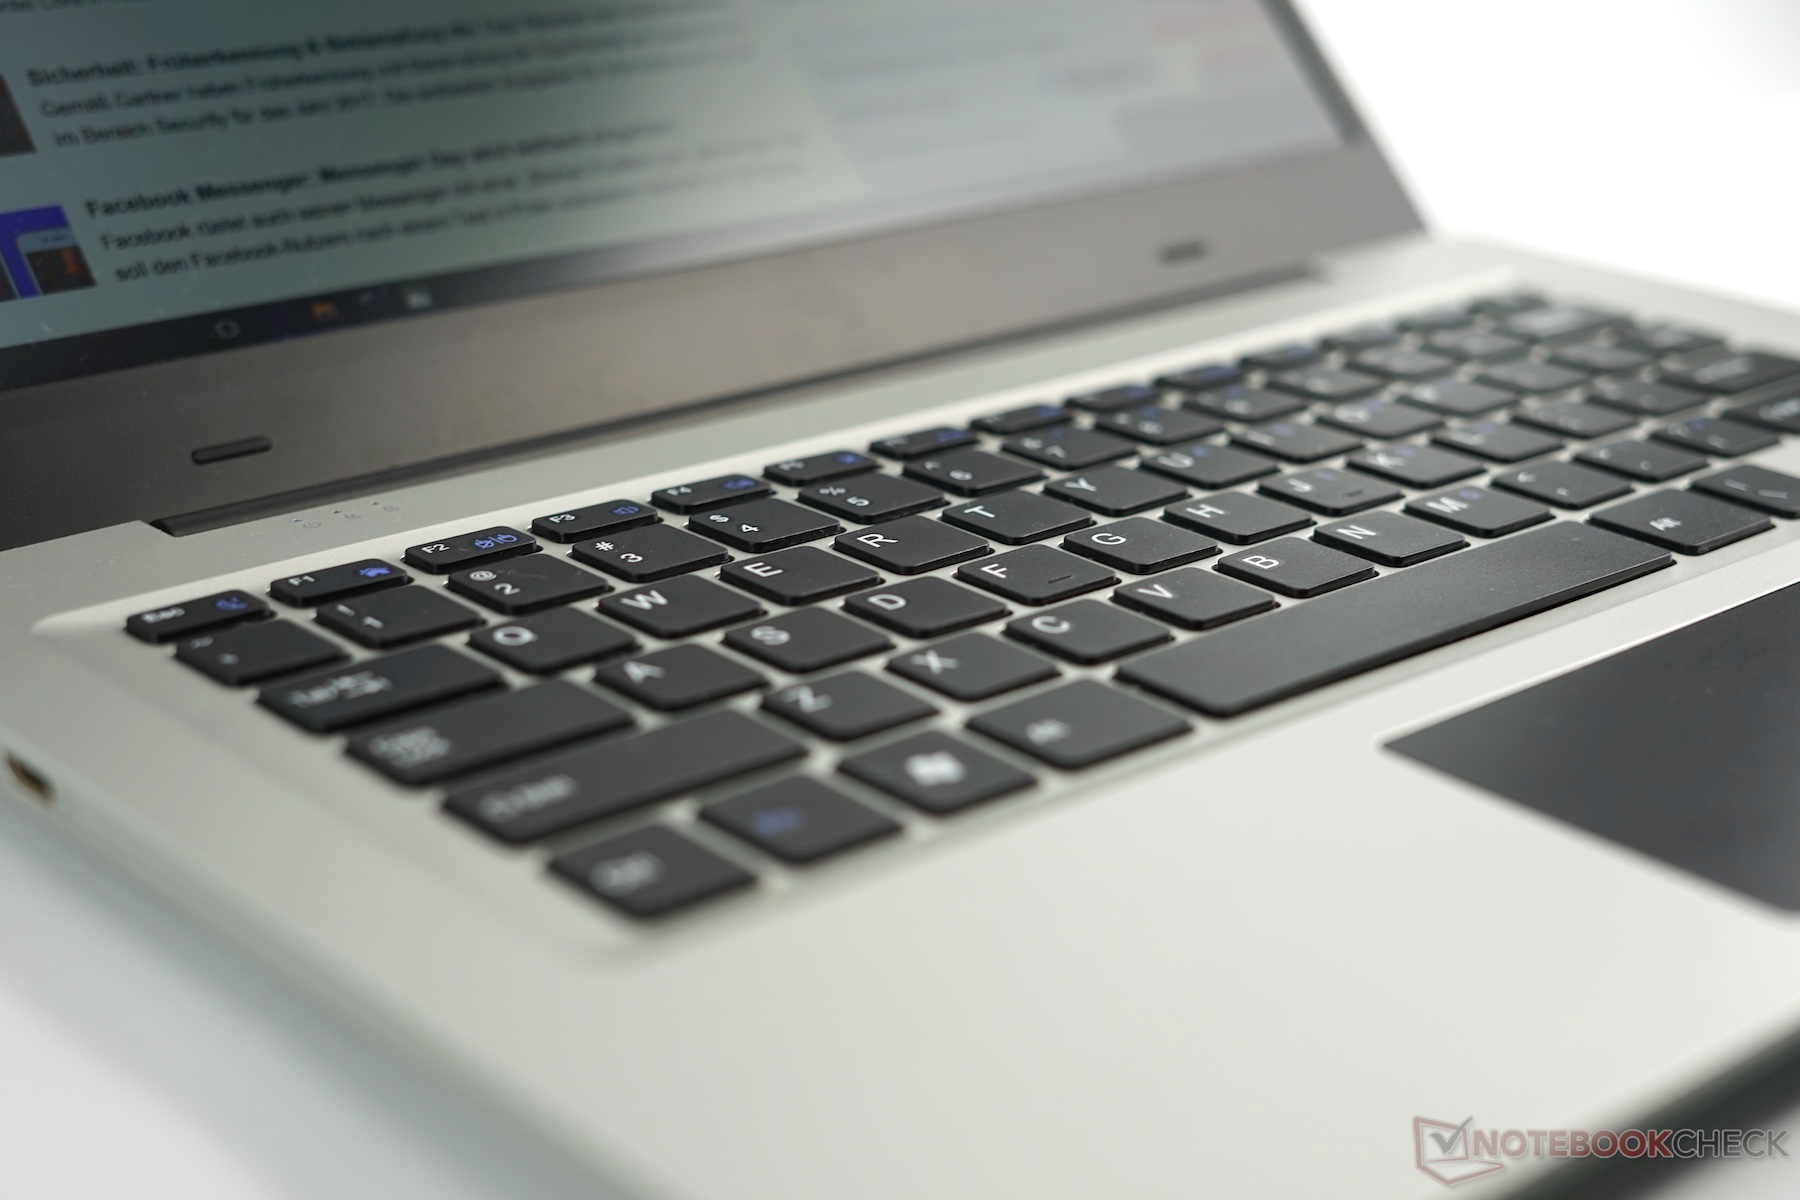
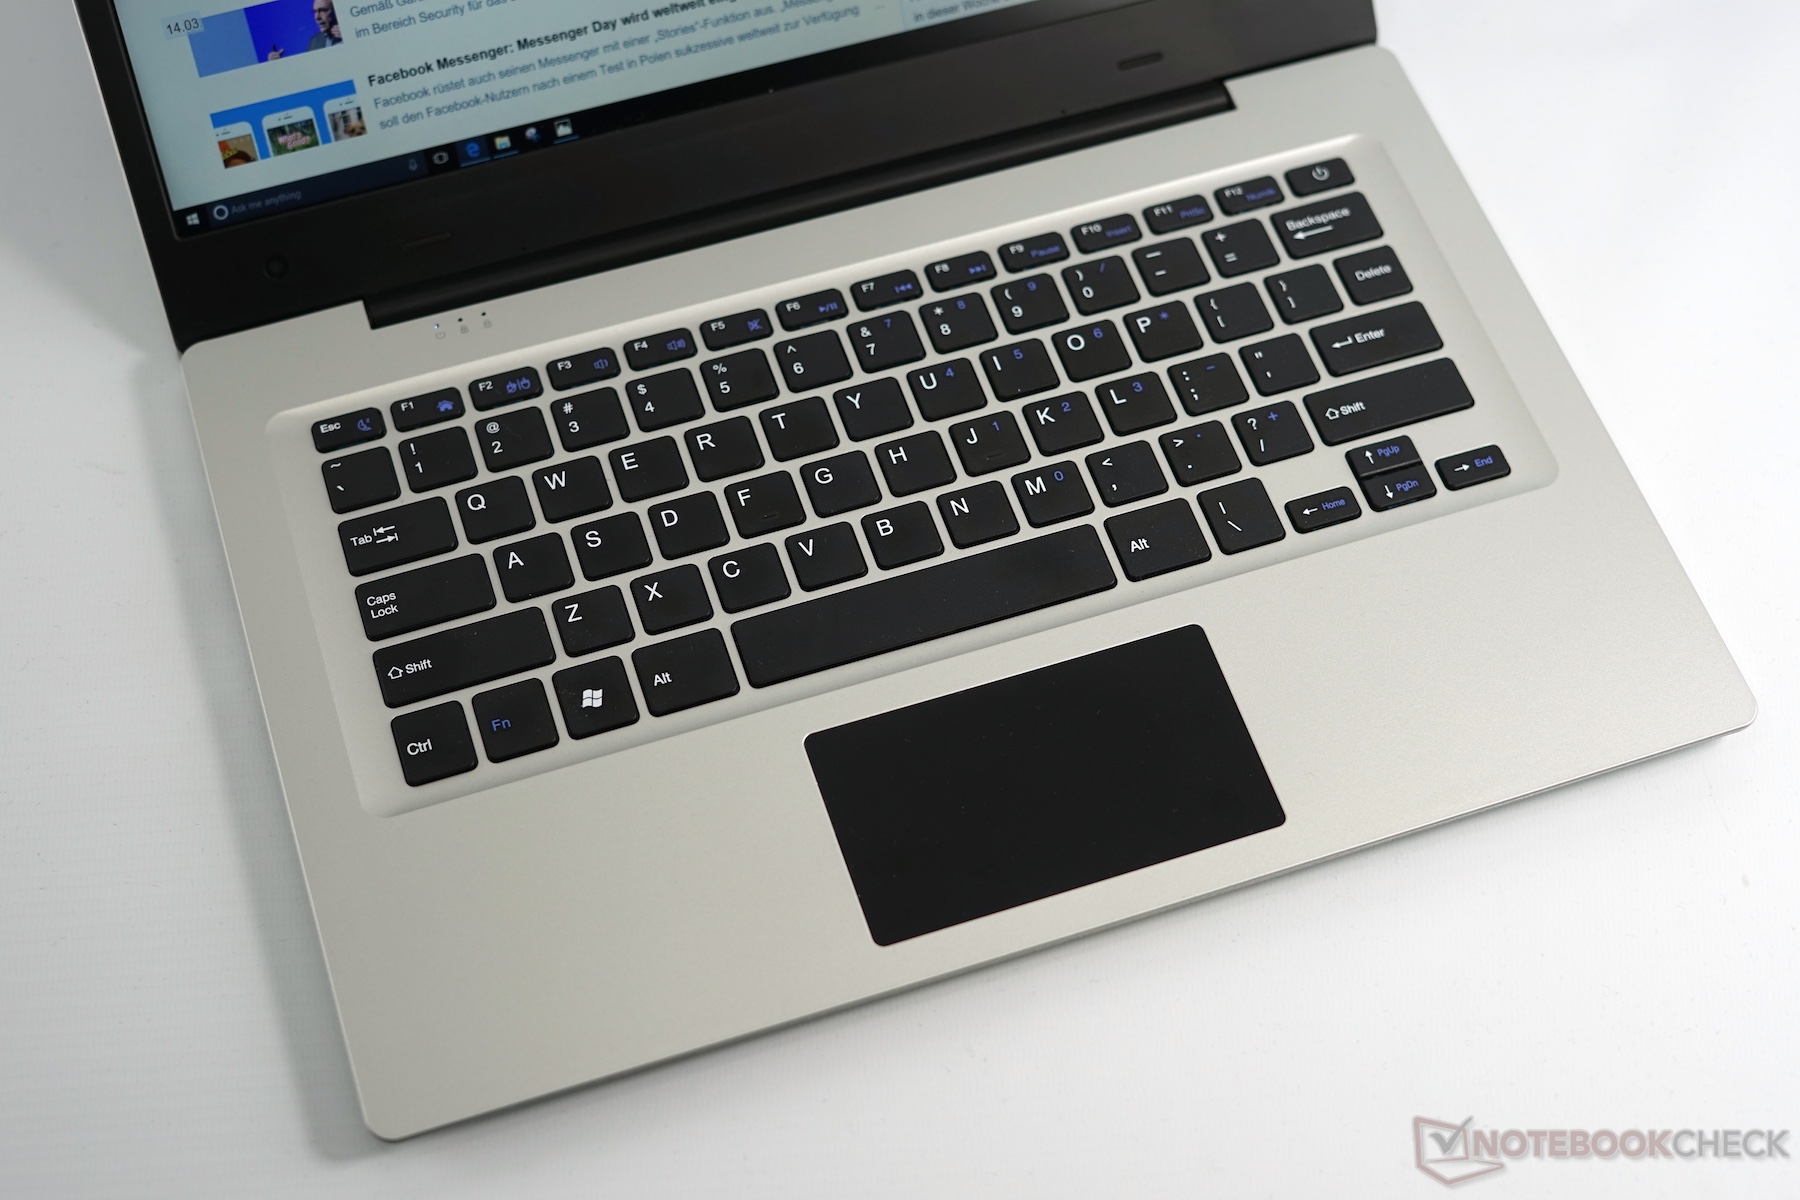
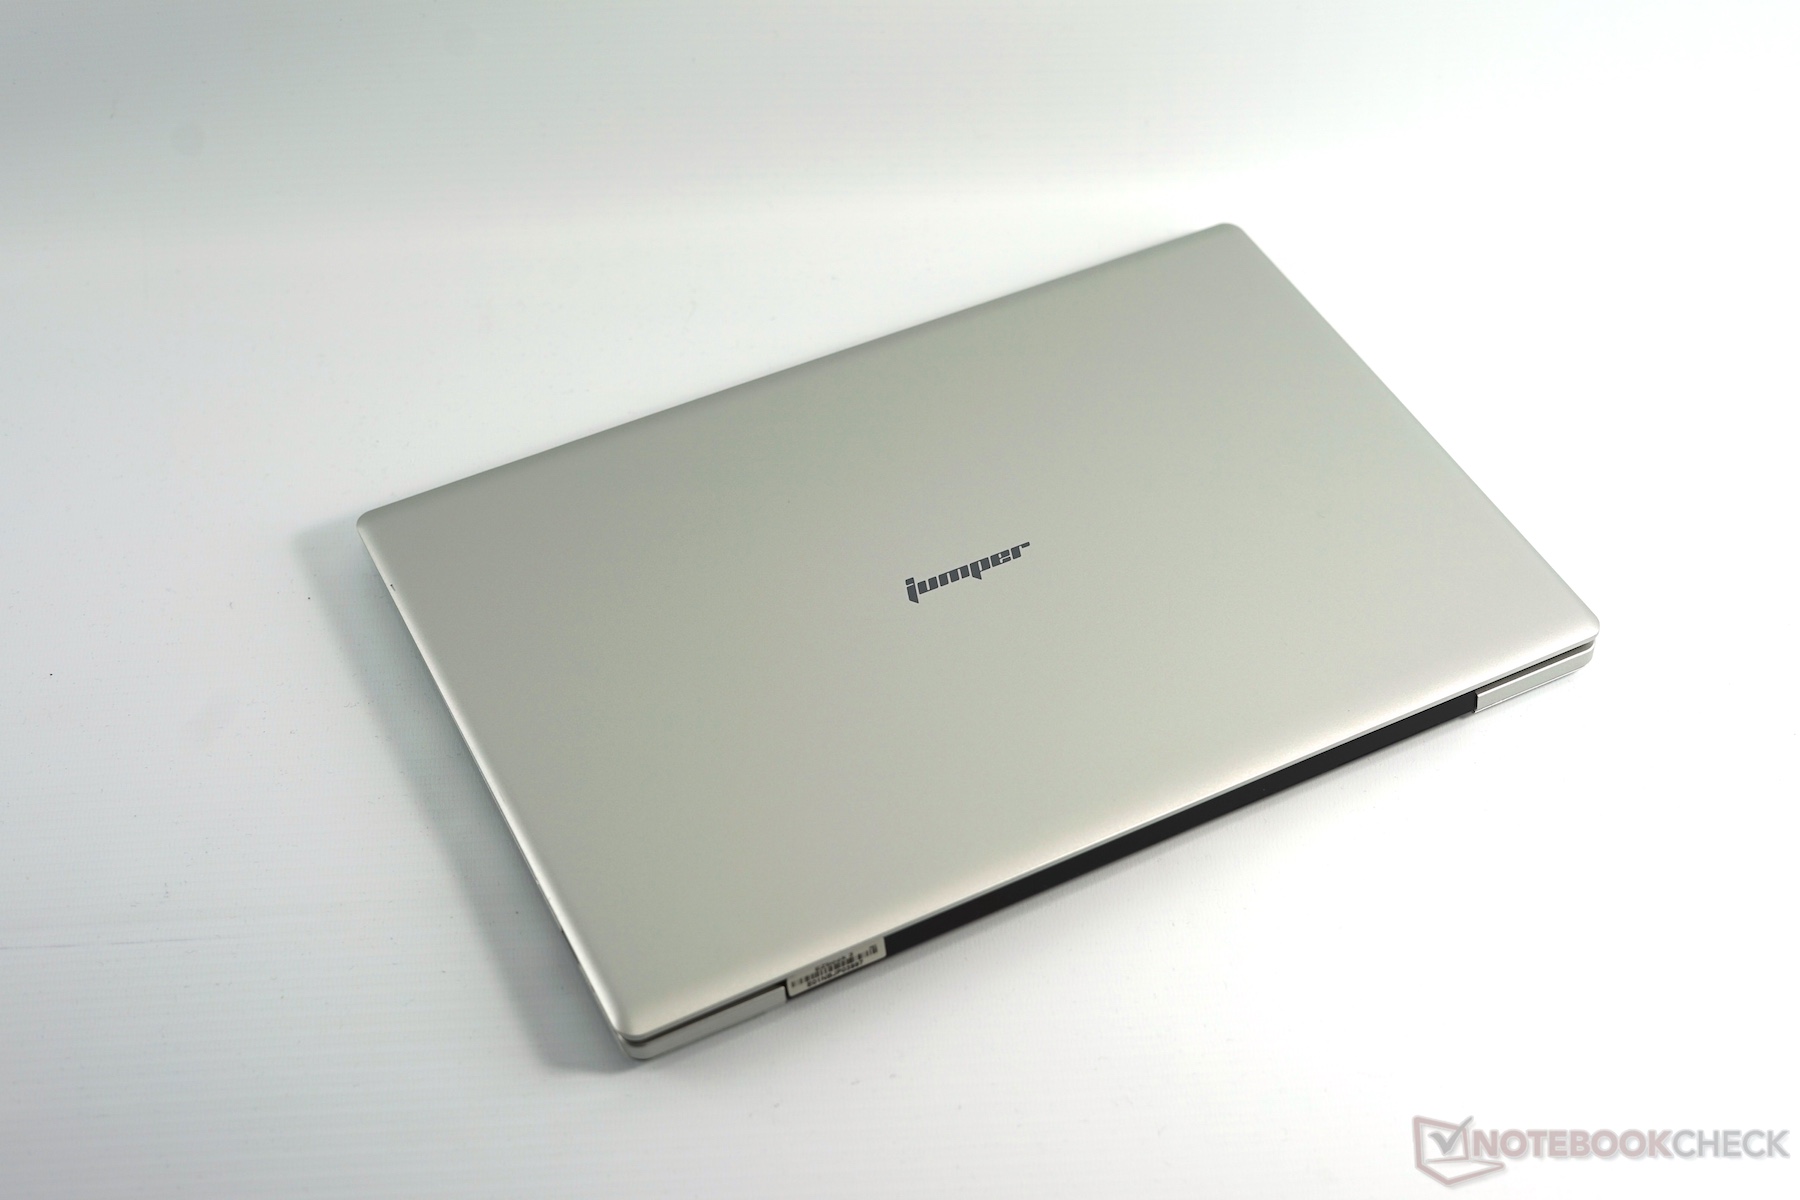
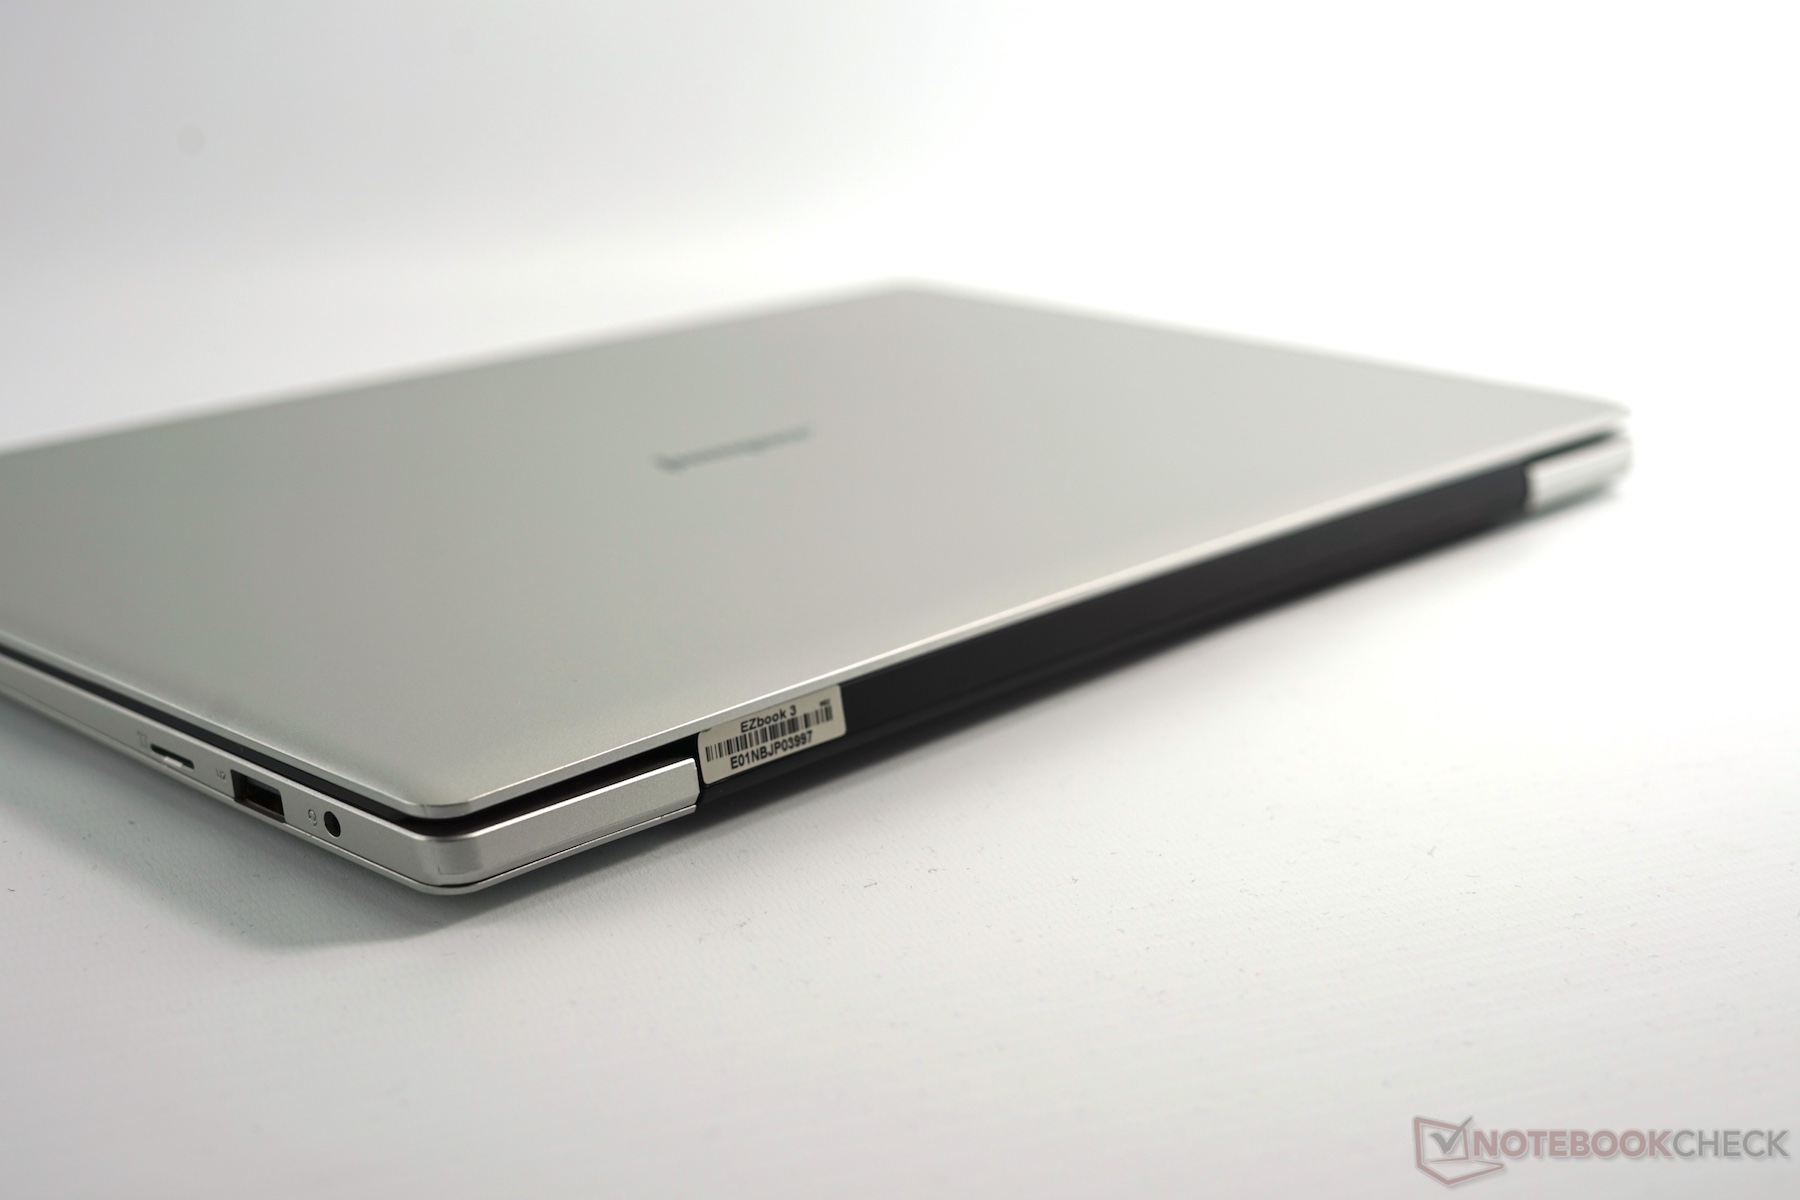
El EZBook es un portátil asequible y ligero con una pantalla brillante y mate, no hace ruido (gracias a la ventilación pasiva) y tiene una bonita apariencia. Como suele ser habitual, ha habido que prescindir de algunas características para reducir el precio. Una construcción y calidad mediocres, escasos ángulos de visualización, PWM a 200 Hz, rendimiento escaso y una corta duración de batería son los inconvenientes que encontrarás. A pesar de que el teclado y el touchpad están muy lejos de los del parecido MacBook Air, funcionan para trabajos ocasionales. Al igual que muchos productos chinos, el EZBook 3 no posee certidicación CE, y el usuario depende casi totalmente de la tienda en la que haya comprado el dispositivo para hacer efectiva la garantía. No hay soporte para drivers. Sin embargo, al menos, es posible usar los drivers de Intel.
El EZBook 3 se encuentra disponible en plateado en Gearbest por 194.25 Euros o desde el almacén europeo por 343 euros. Este precio resultará muy atractivo para los usuarios a los que no les importen los problemas ya mencionados.
Ésta es una versión acortada del análisis original. Puedes leer el análisis completo en inglés aquí.
Jumper EZbook 3
- 03/24/2017 v6 (old)
Klaus Hinum