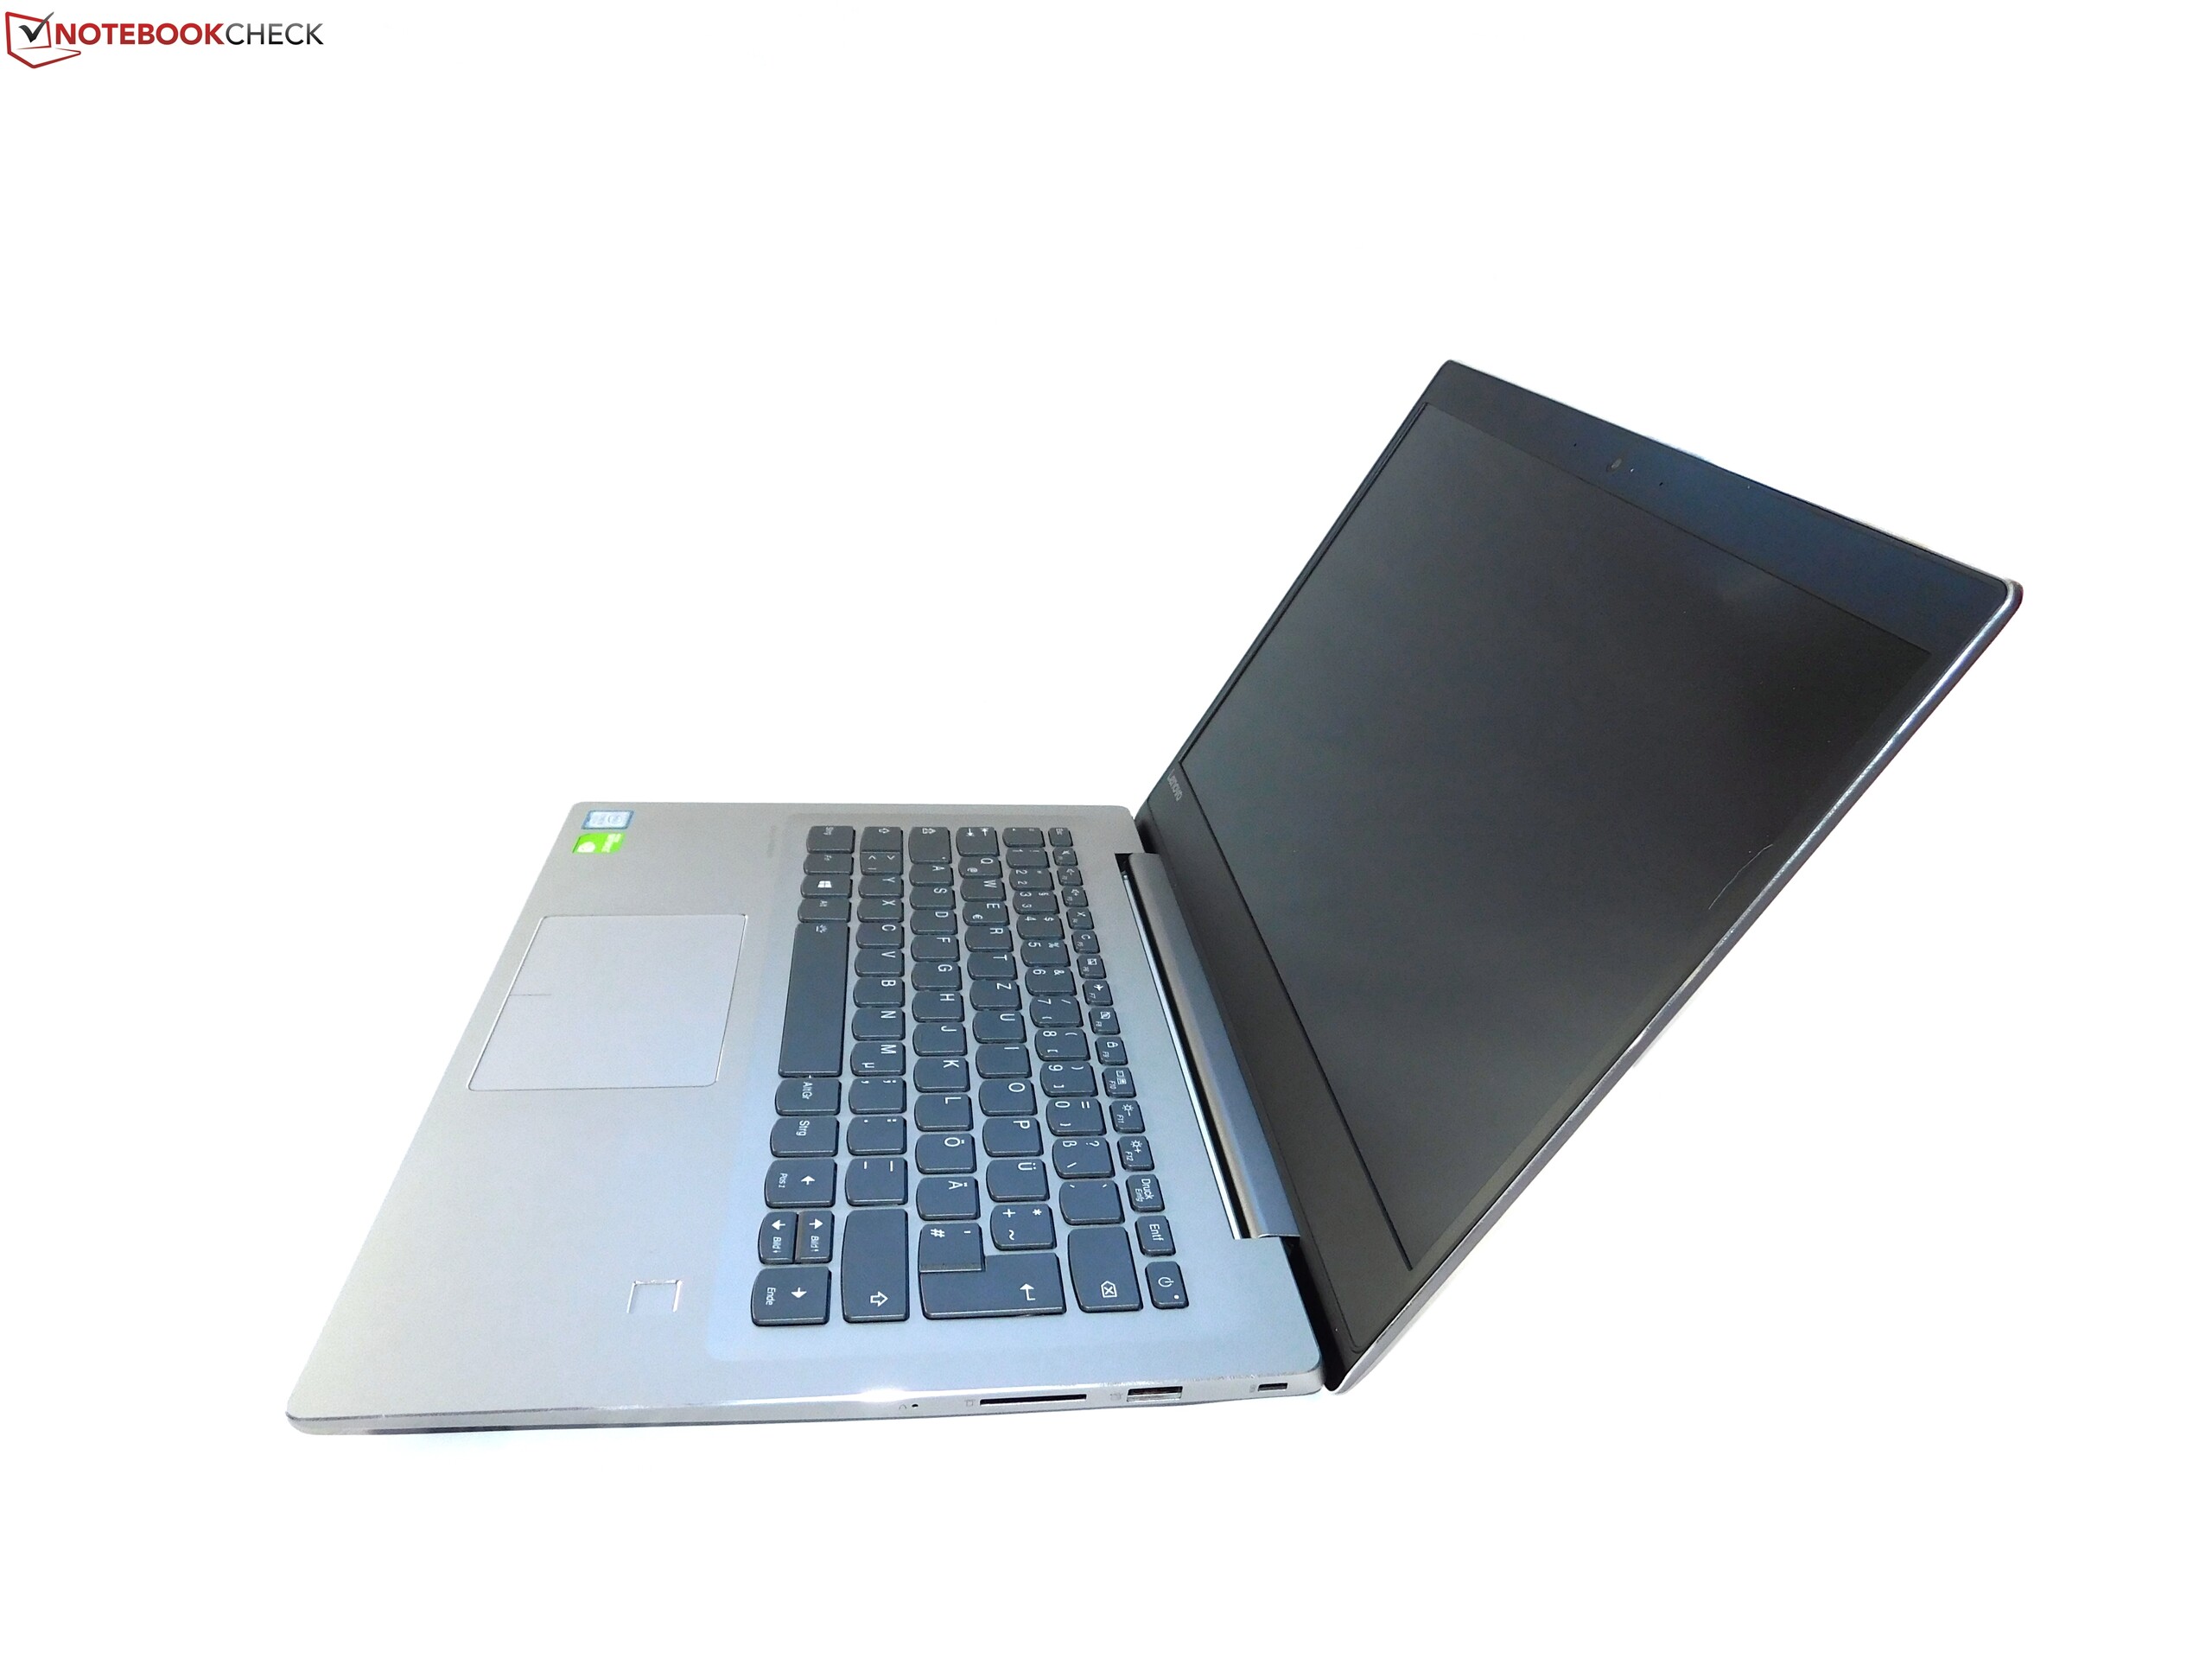
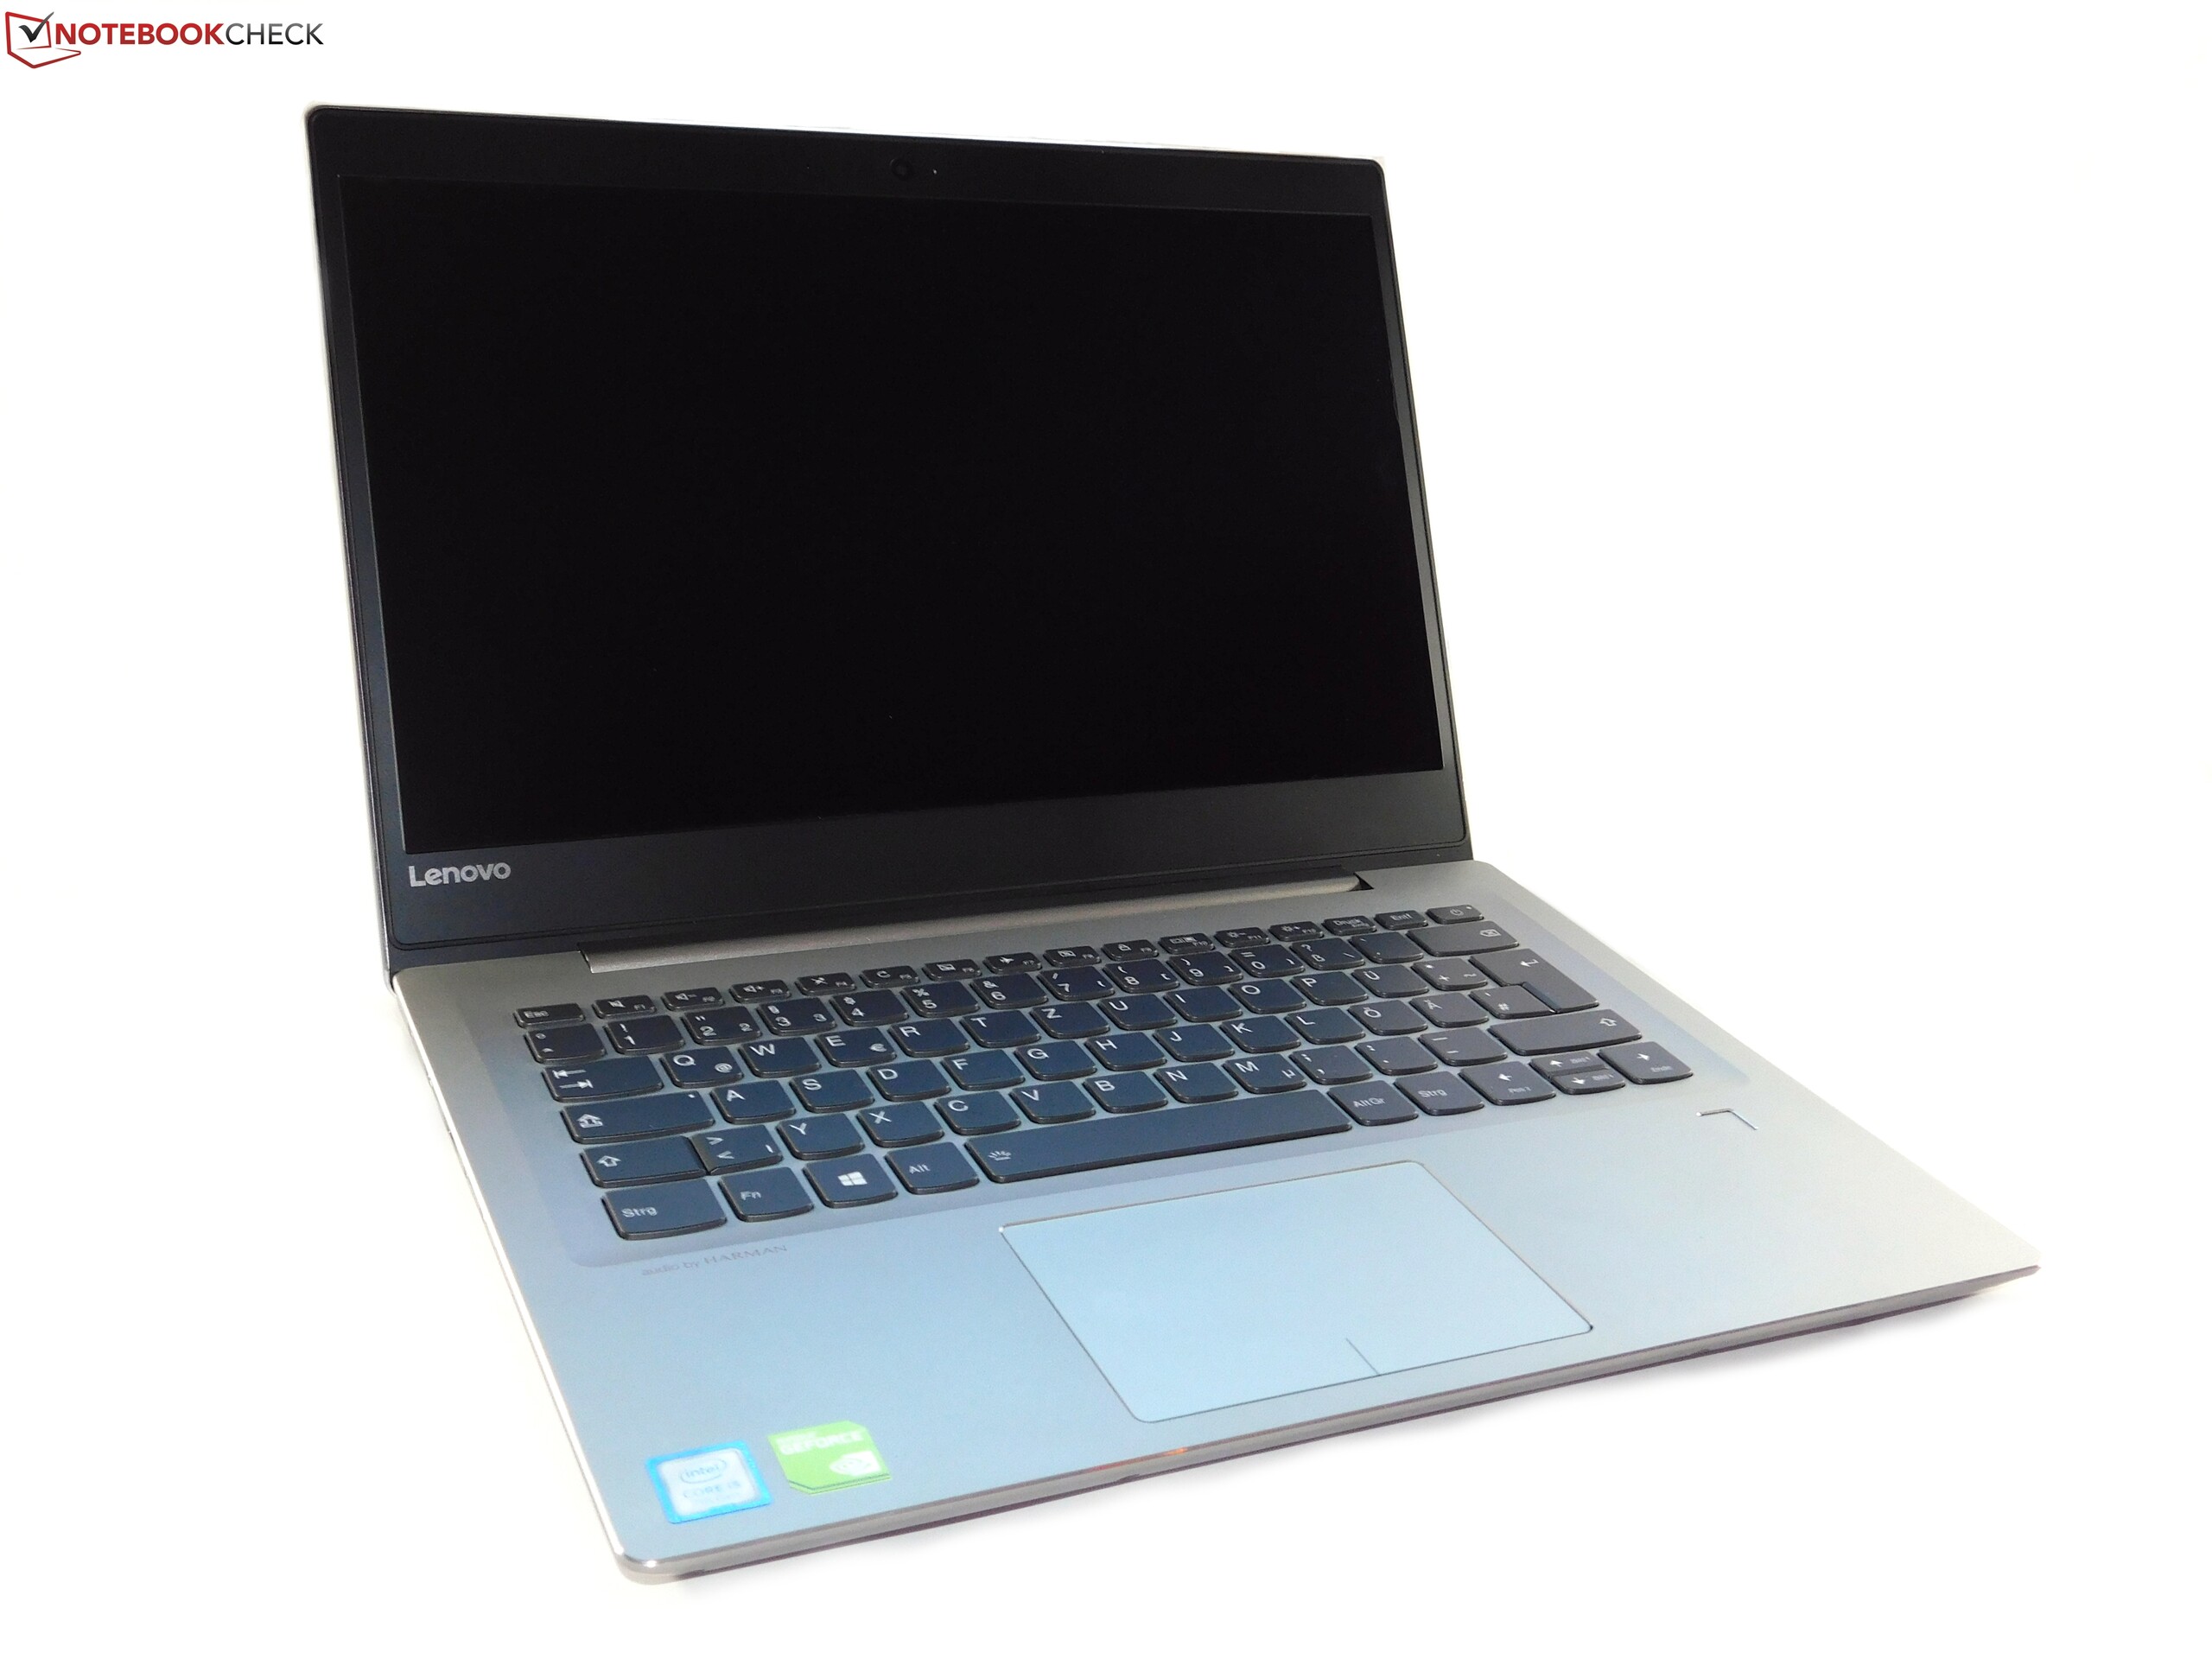
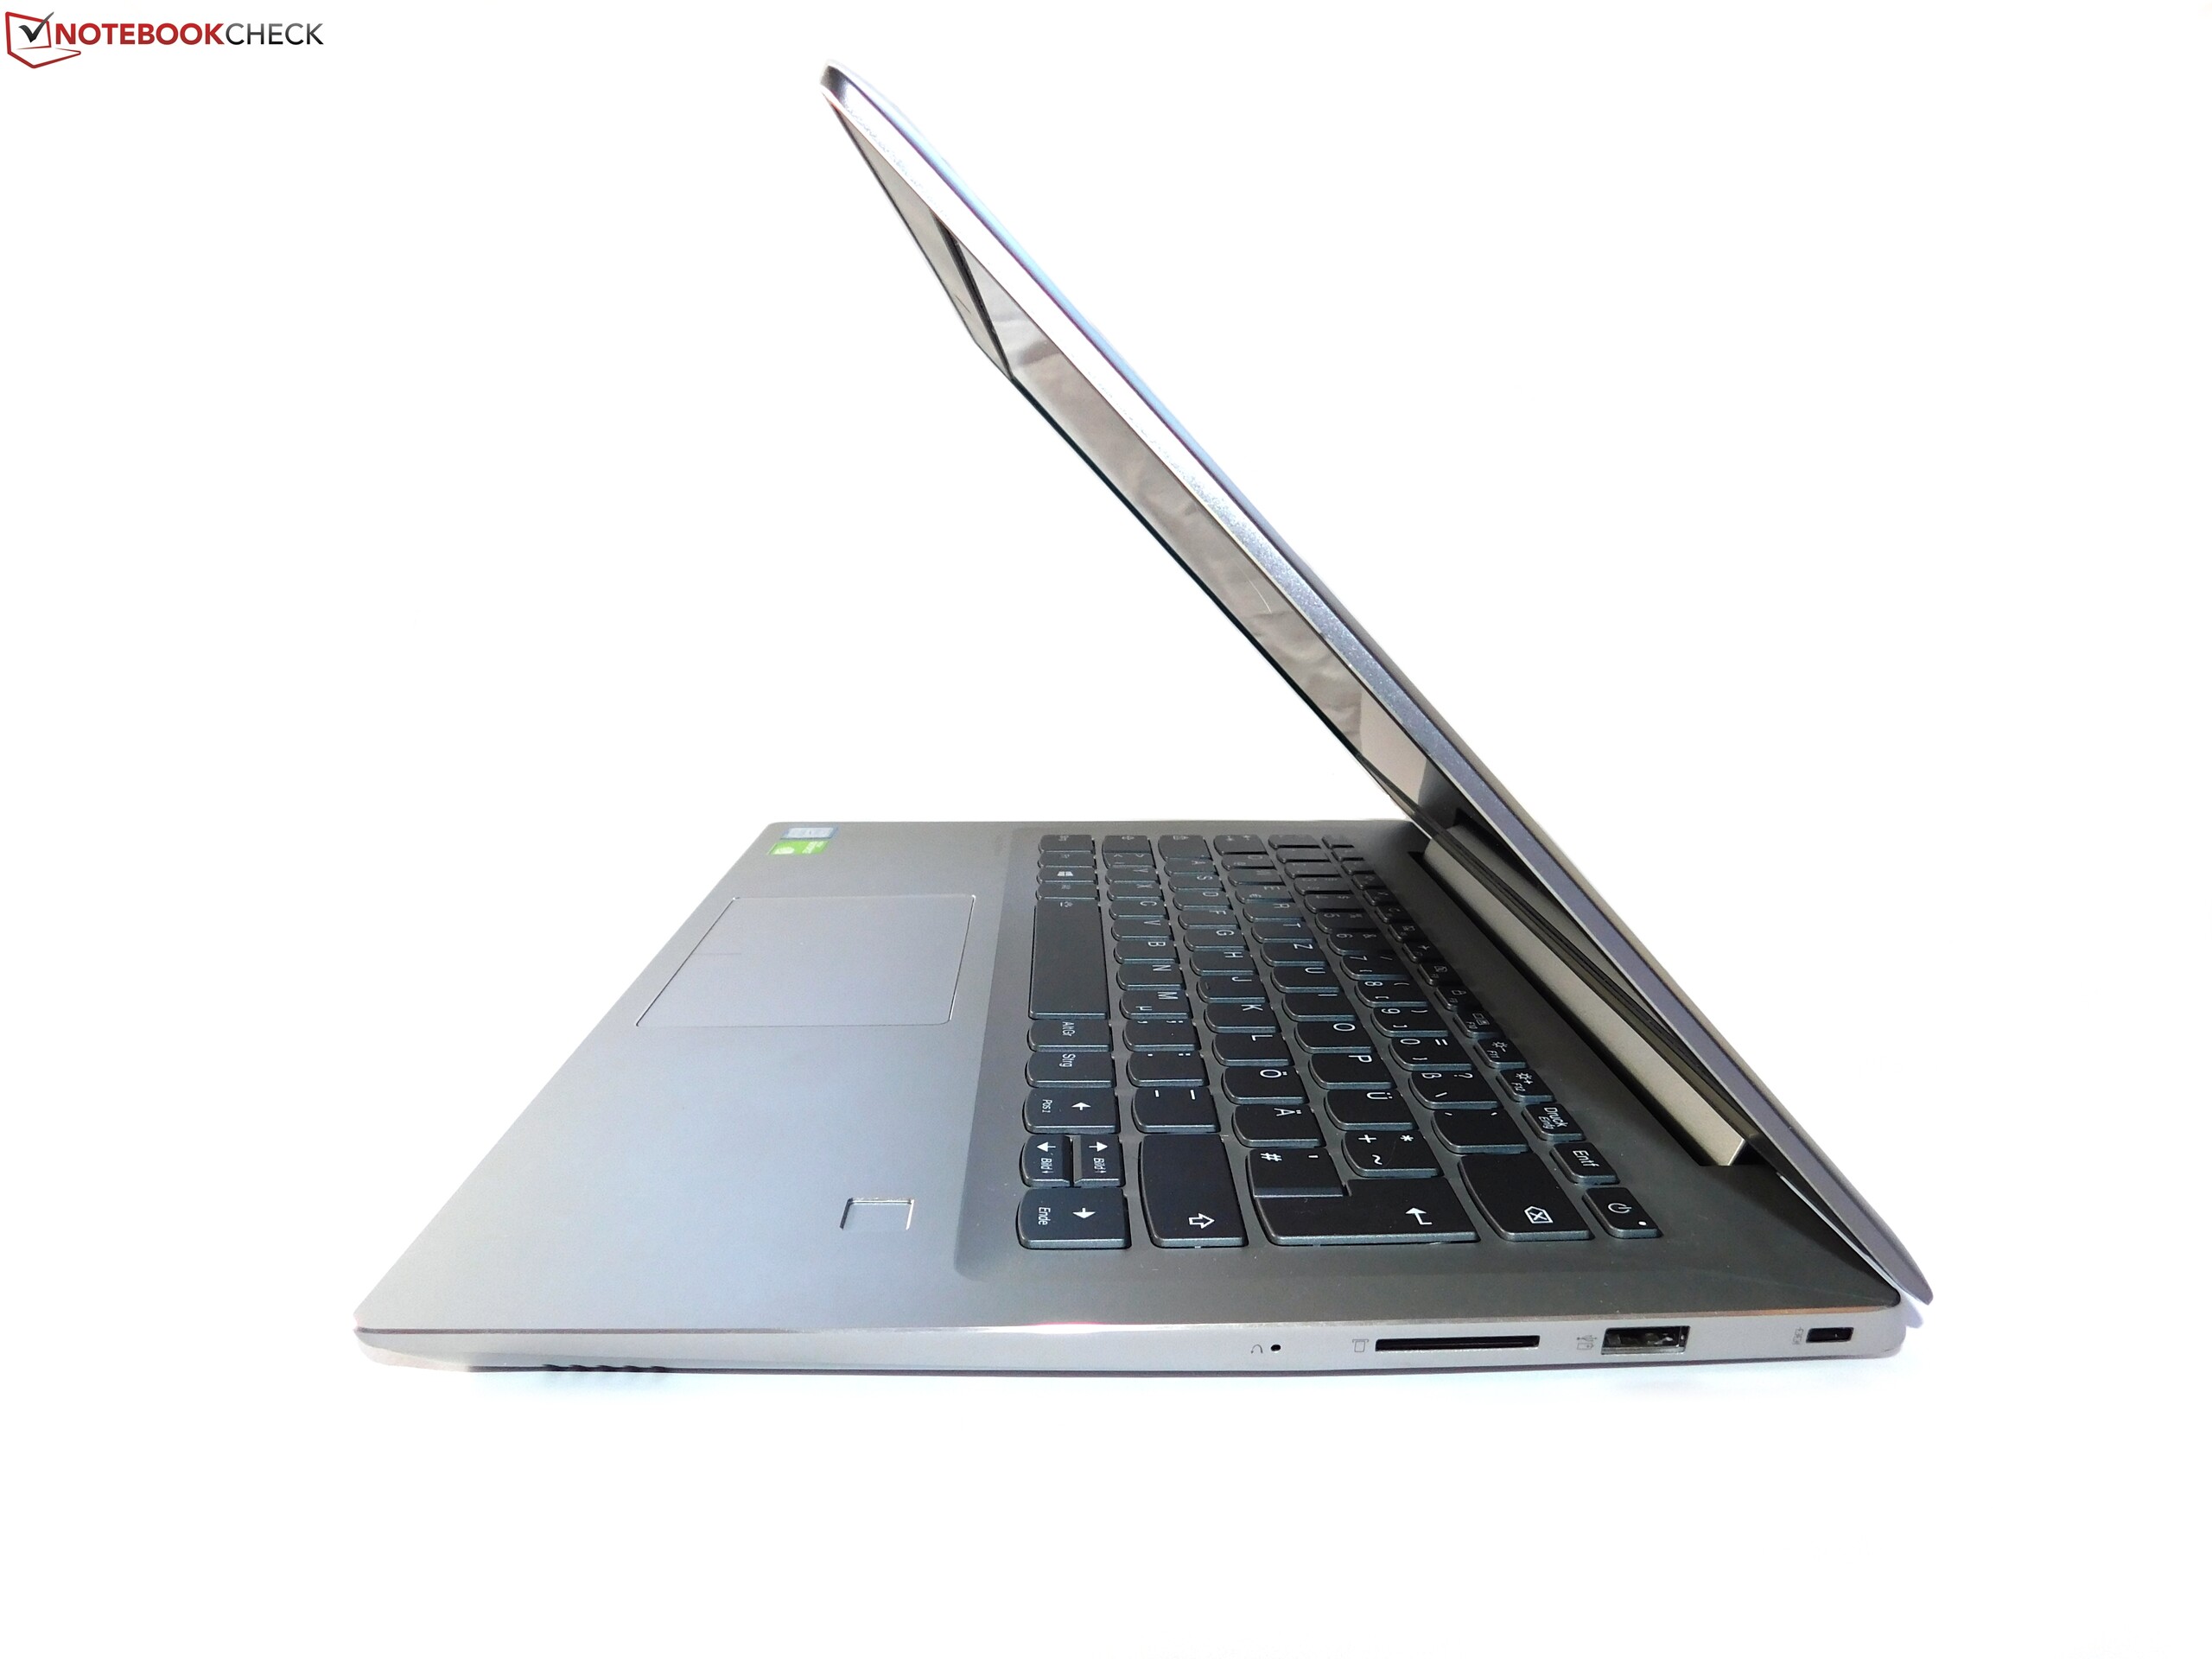
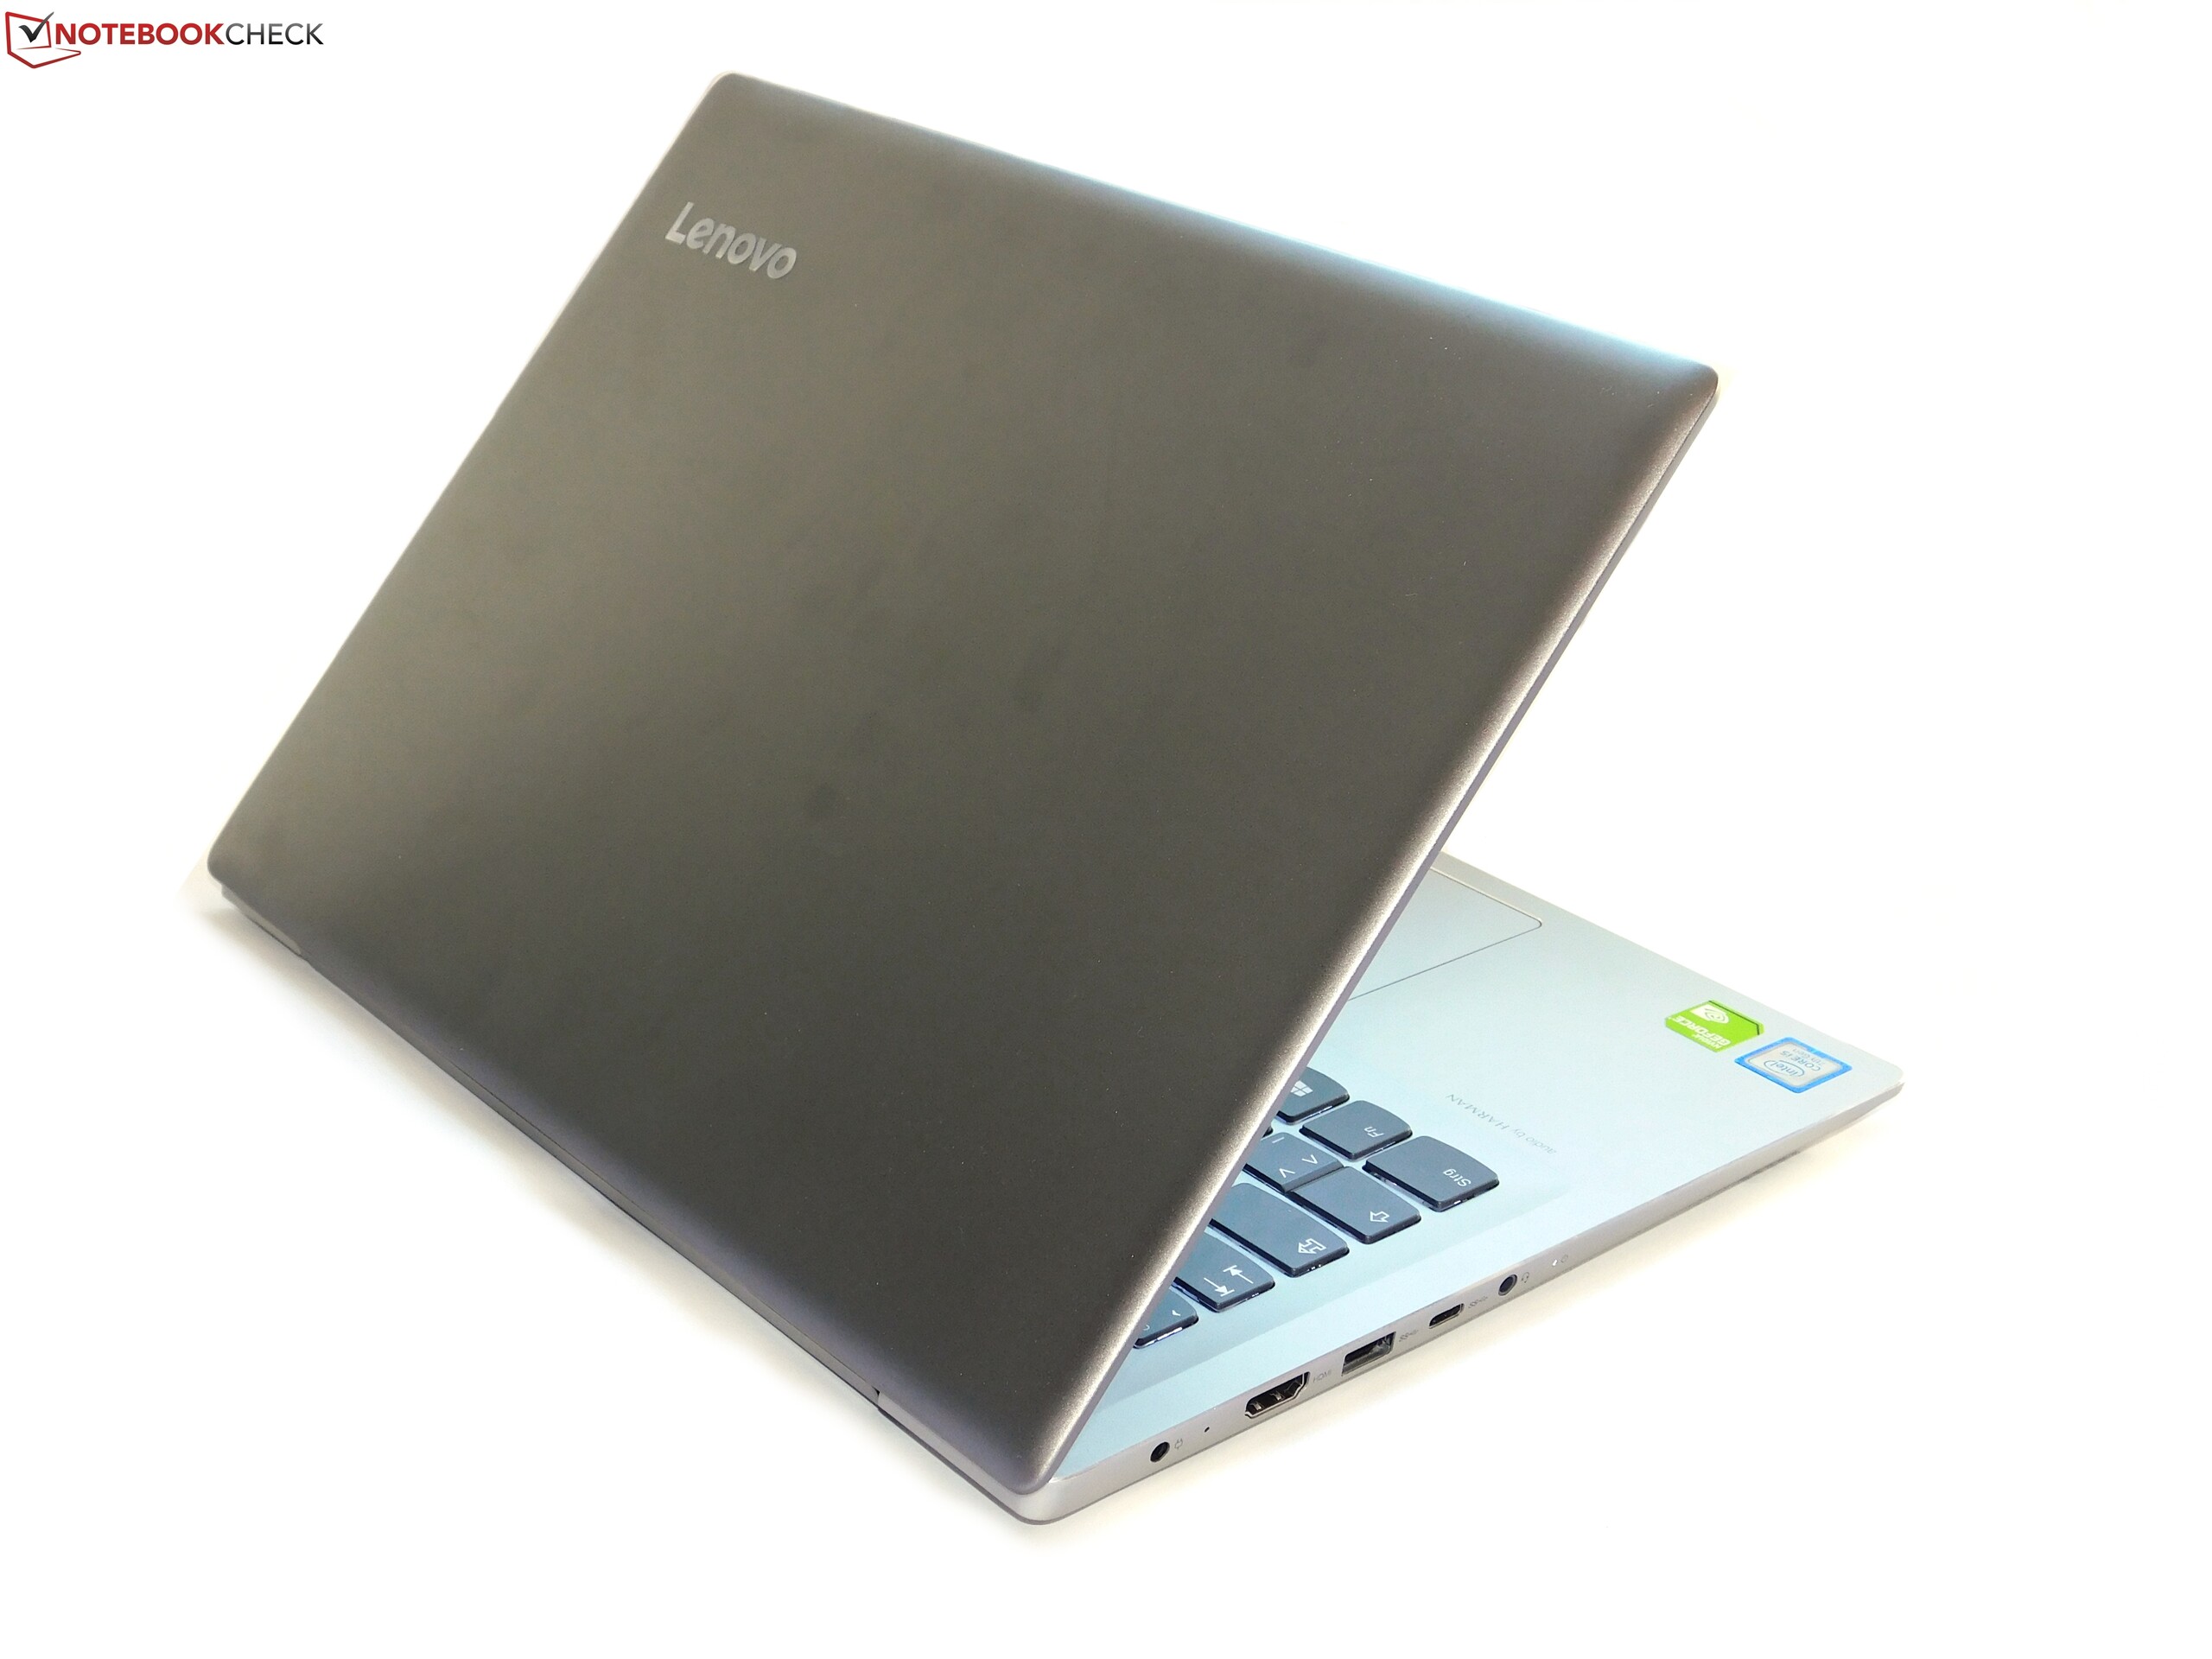
Breve análisis del portátil Lenovo IdeaPad 520s-14IKB (Core i5-7200U, 940MX)
| SD Card Reader | |
| average JPG Copy Test (av. of 3 runs) | |
| Dell XPS 13 9360 FHD i5 (Toshiba Exceria Pro SDXC 64 GB UHS-II) | |
| Lenovo IdeaPad 520s-14IKB 80X200C1GE (Toshiba Exceria Pro SDXC 64 GB UHS-II) | |
| HP Envy 13-ad065nr (Toshiba THN-M401S0640E2) | |
| maximum AS SSD Seq Read Test (1GB) | |
| Dell XPS 13 9360 FHD i5 (Toshiba Exceria Pro SDXC 64 GB UHS-II) | |
| Lenovo IdeaPad 520s-14IKB 80X200C1GE (Toshiba Exceria Pro SDXC 64 GB UHS-II) | |
| HP Envy 13-ad065nr (Toshiba THN-M401S0640E2) | |
| Networking | |
| iperf3 transmit AX12 | |
| Dell XPS 13 9360 FHD i5 | |
| HP Envy 13-ad065nr | |
| Lenovo IdeaPad 520s-14IKB 80X200C1GE | |
| iperf3 receive AX12 | |
| HP Envy 13-ad065nr | |
| Dell XPS 13 9360 FHD i5 | |
| Lenovo IdeaPad 520s-14IKB 80X200C1GE | |
Parpadeo de Pantalla / PWM (Pulse-Width Modulation)
| Parpadeo de Pantalla / PWM detectado | 24510 Hz | ≤ 60 % de brillo | 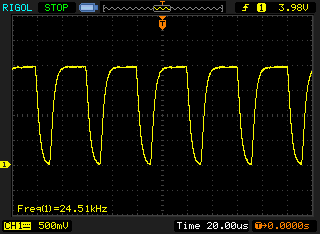 |
La retroiluminación del display parpadea a 24510 Hz (seguramente usa PWM - Pulse-Width Modulation) a un brillo del 60 % e inferior. Sobre este nivel de brillo no debería darse parpadeo / PWM. La frecuencia de 24510 Hz es bastante alta, por lo que la mayoría de gente sensible al parpadeo no debería ver parpadeo o tener fatiga visual. Comparación: 52 % de todos los dispositivos testados no usaron PWM para atenuar el display. Si se usó, medimos una media de 7748 (mínimo: 5 - máxmo: 343500) Hz. | |||
| |||||||||||||||||||||||||
iluminación: 83 %
Brillo con batería: 273 cd/m²
Contraste: 1522:1 (Negro: 0.18 cd/m²)
ΔE ColorChecker Calman: 6.7 | ∀{0.5-29.43 Ø4.71}
ΔE Greyscale Calman: 6.3 | ∀{0.09-98 Ø4.96}
61.5% sRGB (Argyll 1.6.3 3D)
39.6% AdobeRGB 1998 (Argyll 1.6.3 3D)
43.05% AdobeRGB 1998 (Argyll 3D)
61.8% sRGB (Argyll 3D)
41.58% Display P3 (Argyll 3D)
Gamma: 2.04
CCT: 6363 K
| Lenovo IdeaPad 520s-14IKB 80X200C1GE N140HCA-EAC, , 1920x1080, 14" | Asus X302UV-FN016T InfoVision M133NWN1 R3, , 1366x768, 13.3" | Xiaomi Mi Notebook Air 13.3 2016 Samsung LTN133HL09-M01, , 1920x1080, 13.3" | Lenovo IdeaPad 510S-14ISK NV140FHM-N41, , 1920x1080, 14" | Dell XPS 13 9360 FHD i5 Sharp SHP1449 LQ133M1, , 1920x1080, 13.3" | HP Envy 13-ad065nr LG Philips LGD0576, , 1920x1080, 13.3" | |
|---|---|---|---|---|---|---|
| Display | 16% | 57% | 3% | 18% | 45% | |
| Display P3 Coverage (%) | 41.58 | 48.37 16% | 66 59% | 42.88 3% | 48.94 18% | 65.5 58% |
| sRGB Coverage (%) | 61.8 | 72.6 17% | 95.5 55% | 64.1 4% | 73.3 19% | 83.8 36% |
| AdobeRGB 1998 Coverage (%) | 43.05 | 49.98 16% | 67.8 57% | 44.3 3% | 50.5 17% | 61.3 42% |
| Response Times | 1% | -16% | -8% | -6% | 21% | |
| Response Time Grey 50% / Grey 80% * (ms) | 38 ? | 42 ? -11% | 49 ? -29% | 45 ? -18% | 32.8 ? 14% | 28 ? 26% |
| Response Time Black / White * (ms) | 26.4 ? | 23 ? 13% | 27 ? -2% | 26 ? 2% | 33.2 ? -26% | 22.4 ? 15% |
| PWM Frequency (Hz) | 24510 ? | 50 ? | 50 ? | 50 ? | 10200 ? | |
| Screen | -13% | 26% | 3% | 14% | 7% | |
| Brightness middle (cd/m²) | 274 | 218 -20% | 347 27% | 257 -6% | 351.2 28% | 290 6% |
| Brightness (cd/m²) | 256 | 210 -18% | 334 30% | 263 3% | 325 27% | 270 5% |
| Brightness Distribution (%) | 83 | 88 6% | 80 -4% | 90 8% | 89 7% | 78 -6% |
| Black Level * (cd/m²) | 0.18 | 0.5 -178% | 0.27 -50% | 0.24 -33% | 0.195 -8% | 0.32 -78% |
| Contrast (:1) | 1522 | 436 -71% | 1285 -16% | 1071 -30% | 1801 18% | 906 -40% |
| Colorchecker dE 2000 * | 6.7 | 3.89 42% | 3.29 51% | 5.44 19% | 7.4 -10% | 4.8 28% |
| Colorchecker dE 2000 max. * | 14.8 | 7.11 52% | 4.69 68% | 10.93 26% | 9.08 39% | 11.2 24% |
| Greyscale dE 2000 * | 6.3 | 4.9 22% | 3.62 43% | 3.95 37% | 6.71 -7% | 2.8 56% |
| Gamma | 2.04 108% | 2.41 91% | 2.23 99% | 2.29 96% | 2.74 80% | 2.19 100% |
| CCT | 6363 102% | 7860 83% | 7307 89% | 6896 94% | 7222 90% | 6382 102% |
| Color Space (Percent of AdobeRGB 1998) (%) | 39.6 | 46 16% | 62 57% | 40 1% | 50.48 27% | 54.9 39% |
| Color Space (Percent of sRGB) (%) | 61.5 | 73 19% | 95 54% | 64 4% | 73.31 19% | 83.5 36% |
| Media total (Programa/Opciones) | 1% /
-5% | 22% /
27% | -1% /
2% | 9% /
12% | 24% /
16% |
* ... más pequeño es mejor
Tiempos de respuesta del display
| ↔ Tiempo de respuesta de Negro a Blanco | ||
|---|---|---|
| 26.4 ms ... subida ↗ y bajada ↘ combinada | ↗ 14.8 ms subida | 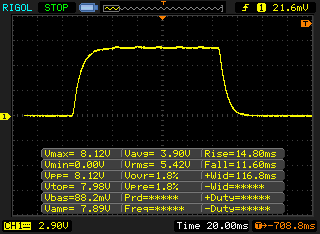 |
| ↘ 11.6 ms bajada | ||
| La pantalla mostró tiempos de respuesta relativamente lentos en nuestros tests pero podría ser demasiado lenta para los jugones. En comparación, todos los dispositivos de prueba van de ##min### (mínimo) a 240 (máximo) ms. » 66 % de todos los dispositivos son mejores. Eso quiere decir que el tiempo de respuesta es peor que la media (19.8 ms) de todos los dispositivos testados. | ||
| ↔ Tiempo de respuesta 50% Gris a 80% Gris | ||
| 38 ms ... subida ↗ y bajada ↘ combinada | ↗ 20 ms subida | 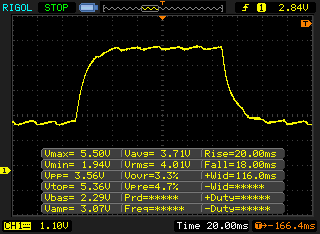 |
| ↘ 18 ms bajada | ||
| La pantalla mostró tiempos de respuesta lentos en nuestros tests y podría ser demasiado lenta para los jugones. En comparación, todos los dispositivos de prueba van de ##min### (mínimo) a 636 (máximo) ms. » 55 % de todos los dispositivos son mejores. Eso quiere decir que el tiempo de respuesta es peor que la media (30.9 ms) de todos los dispositivos testados. | ||
| PCMark 8 | |
| Home Score Accelerated v2 | |
| HP Envy 13-ad065nr | |
| Lenovo IdeaPad 510S-14ISK | |
| Lenovo IdeaPad 520s-14IKB 80X200C1GE | |
| Dell XPS 13 9360 FHD i5 | |
| Asus X302UV-FN016T | |
| Xiaomi Mi Notebook Air 13.3 2016 | |
| Work Score Accelerated v2 | |
| HP Envy 13-ad065nr | |
| Lenovo IdeaPad 520s-14IKB 80X200C1GE | |
| Lenovo IdeaPad 510S-14ISK | |
| Dell XPS 13 9360 FHD i5 | |
| Asus X302UV-FN016T | |
| Xiaomi Mi Notebook Air 13.3 2016 | |
| PCMark 8 Home Score Accelerated v2 | 3554 puntos | |
| PCMark 8 Work Score Accelerated v2 | 4628 puntos | |
| PCMark 10 Score | 2844 puntos | |
ayuda | ||
| Lenovo IdeaPad 520s-14IKB 80X200C1GE Ramaxel RTNTE256PCA8EADL | Lenovo IdeaPad 510S-14ISK Samsung MZYTY256HDHP | Acer TravelMate X349-G2 Intel SSD 600p SSDPEKKW512G7 | HP Pavilion 14-al103ng Western Digital Scorpio Blue WD5000LPCX-24C6HT0 | Xiaomi Mi Notebook Air 13.3 2016 Samsung PM951 NVMe MZVLV256 | Asus X302UV-FN016T Hynix HFS128G3MND | |
|---|---|---|---|---|---|---|
| CrystalDiskMark 3.0 | 29% | 113% | -88% | 76% | -26% | |
| Read Seq (MB/s) | 472.3 | 510 8% | 1818 285% | 113.3 -76% | 1209 156% | 428.2 -9% |
| Write Seq (MB/s) | 254.1 | 458.8 81% | 582 129% | 110.2 -57% | 314 24% | 178.6 -30% |
| Read 512 (MB/s) | 347.8 | 399.7 15% | 1134 226% | 30.83 -91% | 282.6 -19% | |
| Write 512 (MB/s) | 252.8 | 299.3 18% | 586 132% | 47.13 -81% | 179.1 -29% | |
| Read 4k (MB/s) | 24.74 | 35.27 43% | 34.93 41% | 0.34 -99% | 43.4 75% | 6.559 -73% |
| Write 4k (MB/s) | 77.7 | 90.2 16% | 133.4 72% | 0.981 -99% | 153.4 97% | 71.2 -8% |
| Read 4k QD32 (MB/s) | 279.6 | 397.7 42% | 373.7 34% | 0.72 -100% | 487.6 74% | 253 -10% |
| Write 4k QD32 (MB/s) | 244.8 | 257.3 5% | 210.8 -14% | 1.026 -100% | 312.2 28% | 174 -29% |

| 3DMark 11 - 1280x720 Performance GPU | |
| Acer Aspire 5 A515-51G-51RL | |
| Lenovo IdeaPad 520s-14IKB 80X200C1GE | |
| Xiaomi Mi Notebook Air 13.3 2016 | |
| Lenovo IdeaPad 510S-14ISK | |
| Asus X302UV-FN016T | |
| Dell XPS 13 9360 FHD i5 | |
| HP Envy 13-ad065nr | |
| 3DMark | |
| 1280x720 Cloud Gate Standard Graphics | |
| Acer Aspire 5 A515-51G-51RL | |
| Lenovo IdeaPad 520s-14IKB 80X200C1GE | |
| Xiaomi Mi Notebook Air 13.3 2016 | |
| Lenovo IdeaPad 510S-14ISK | |
| Dell XPS 13 9360 FHD i5 | |
| HP Envy 13-ad065nr | |
| Asus X302UV-FN016T | |
| 1920x1080 Fire Strike Graphics | |
| Acer Aspire 5 A515-51G-51RL | |
| Lenovo IdeaPad 520s-14IKB 80X200C1GE | |
| Xiaomi Mi Notebook Air 13.3 2016 | |
| Asus X302UV-FN016T | |
| Lenovo IdeaPad 510S-14ISK | |
| Dell XPS 13 9360 FHD i5 | |
| HP Envy 13-ad065nr | |
| 3DMark 11 Performance | 2700 puntos | |
| 3DMark Cloud Gate Standard Score | 7222 puntos | |
| 3DMark Fire Strike Score | 1936 puntos | |
ayuda | ||
| BioShock Infinite - 1920x1080 Ultra Preset, DX11 (DDOF) | |
| Acer Aspire 5 A515-51G-51RL | |
| Lenovo IdeaPad 520s-14IKB 80X200C1GE | |
| Xiaomi Mi Notebook Air 13.3 2016 | |
| Lenovo IdeaPad 510S-14ISK | |
| Rise of the Tomb Raider - 1366x768 Medium Preset AF:2x | |
| Acer Aspire 5 A515-51G-51RL | |
| Lenovo IdeaPad 520s-14IKB 80X200C1GE | |
| Xiaomi Mi Notebook Air 13.3 2016 | |
| Lenovo IdeaPad 510S-14ISK | |
| bajo | medio | alto | ultra | |
|---|---|---|---|---|
| BioShock Infinite (2013) | 135.8 | 73.4 | 63.8 | 23.49 |
| Company of Heroes 2 (2013) | 39.82 | 32.42 | 19.43 | |
| The Witcher 3 (2015) | 44.21 | 25.01 | 13.45 | 8 |
| Rise of the Tomb Raider (2016) | 45.79 | 25.49 | 13.63 |
Ruido
| Ocioso |
| 29.9 / 29.9 / 30.7 dB(A) |
| Carga |
| 35.1 / 36.2 dB(A) |
 | ||
30 dB silencioso 40 dB(A) audible 50 dB(A) ruidosamente alto |
||
min: | ||
(-) La temperatura máxima en la parte superior es de 49.3 °C / 121 F, frente a la media de 36.8 °C / 98 F, que oscila entre 21 y 71 °C para la clase Multimedia.
(-) El fondo se calienta hasta un máximo de 53.9 °C / 129 F, frente a la media de 39.1 °C / 102 F
(+) En reposo, la temperatura media de la parte superior es de 25.8 °C / 78# F, frente a la media del dispositivo de 31.3 °C / 88 F.
(±) Jugando a The Witcher 3, la temperatura media de la parte superior es de 36.3 °C / 97 F, frente a la media del dispositivo de 31.3 °C / 88 F.
(+) Los reposamanos y el panel táctil alcanzan como máximo la temperatura de la piel (33.6 °C / 92.5 F) y, por tanto, no están calientes.
(-) La temperatura media de la zona del reposamanos de dispositivos similares fue de 28.7 °C / 83.7 F (-4.9 °C / -8.8 F).
Lenovo IdeaPad 520s-14IKB 80X200C1GE análisis de audio
(-) | altavoces no muy altos (#69.5 dB)
Graves 100 - 315 Hz
(±) | lubina reducida - en promedio 12.7% inferior a la mediana
(±) | la linealidad de los graves es media (12.7% delta a frecuencia anterior)
Medios 400 - 2000 Hz
(+) | medios equilibrados - a sólo 3% de la mediana
(±) | la linealidad de los medios es media (9.6% delta respecto a la frecuencia anterior)
Altos 2 - 16 kHz
(+) | máximos equilibrados - a sólo 1.5% de la mediana
(+) | los máximos son lineales (5.8% delta a la frecuencia anterior)
Total 100 - 16.000 Hz
(±) | la linealidad del sonido global es media (16.6% de diferencia con la mediana)
En comparación con la misma clase
» 44% de todos los dispositivos probados de esta clase eran mejores, 7% similares, 50% peores
» El mejor tuvo un delta de 5%, la media fue 17%, el peor fue ###max##%
En comparación con todos los dispositivos probados
» 29% de todos los dispositivos probados eran mejores, 6% similares, 65% peores
» El mejor tuvo un delta de 4%, la media fue 23%, el peor fue ###max##%
Dell XPS 13 9360 FHD i5 análisis de audio
(-) | altavoces no muy altos (#70.3 dB)
Graves 100 - 315 Hz
(±) | lubina reducida - en promedio 6.9% inferior a la mediana
(±) | la linealidad de los graves es media (10.5% delta a frecuencia anterior)
Medios 400 - 2000 Hz
(+) | medios equilibrados - a sólo 3.7% de la mediana
(+) | los medios son lineales (4% delta a la frecuencia anterior)
Altos 2 - 16 kHz
(+) | máximos equilibrados - a sólo 2% de la mediana
(±) | la linealidad de los máximos es media (10.3% delta a frecuencia anterior)
Total 100 - 16.000 Hz
(±) | la linealidad del sonido global es media (18.3% de diferencia con la mediana)
En comparación con la misma clase
» 54% de todos los dispositivos probados de esta clase eran mejores, 7% similares, 40% peores
» El mejor tuvo un delta de 5%, la media fue 18%, el peor fue ###max##%
En comparación con todos los dispositivos probados
» 40% de todos los dispositivos probados eran mejores, 8% similares, 52% peores
» El mejor tuvo un delta de 4%, la media fue 23%, el peor fue ###max##%
| Off / Standby | |
| Ocioso | |
| Carga |
|
Clave:
min: | |
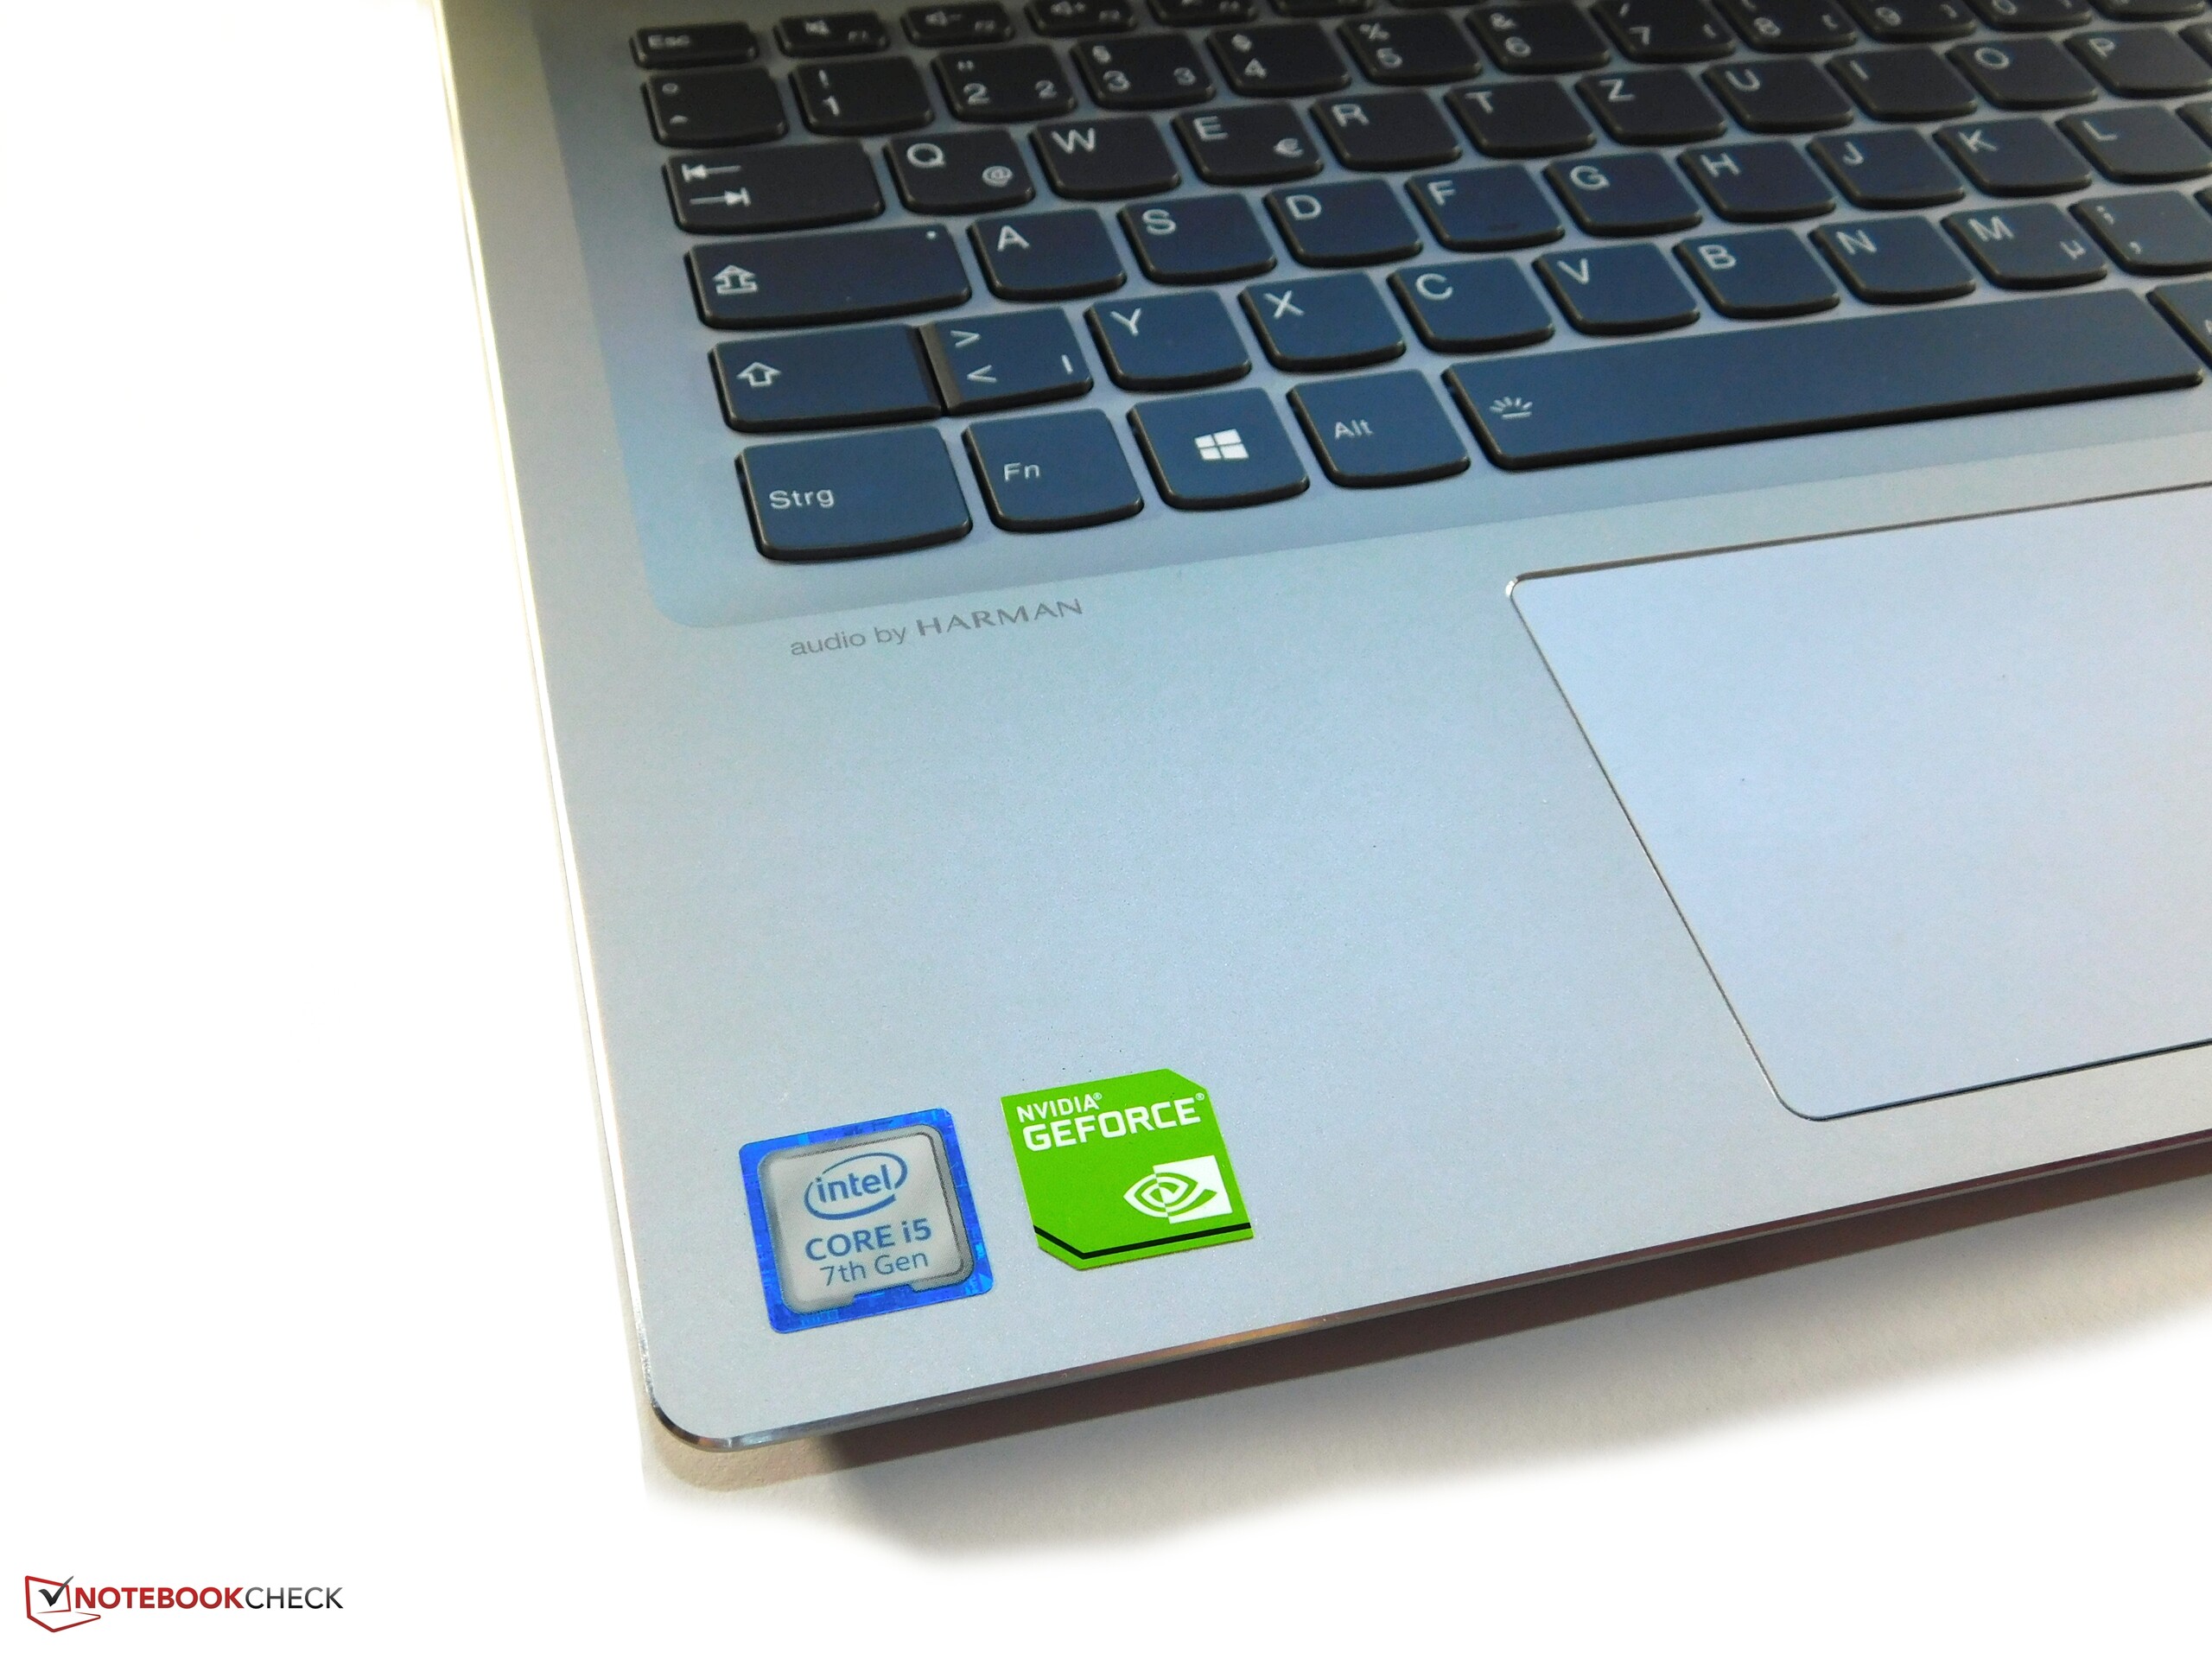
| Lenovo IdeaPad 520s-14IKB 80X200C1GE i5-7200U, GeForce 940MX, Ramaxel RTNTE256PCA8EADL, IPS LED, 1920x1080, 14" | Lenovo IdeaPad 510S-14ISK 6267U, Iris Graphics 550, Samsung MZYTY256HDHP, a-Si TFT-LCD, IPS, LED, 1920x1080, 14" | Xiaomi Mi Notebook Air 13.3 2016 6200U, GeForce 940MX, Samsung PM951 NVMe MZVLV256, IPS, 1920x1080, 13.3" | Dell XPS 13 9360 FHD i5 i5-7200U, HD Graphics 620, Toshiba NVMe THNSN5256GPUK, IPS, 1920x1080, 13.3" | HP Envy 13-ad065nr i5-7200U, HD Graphics 620, SanDisk X400 SD8SN8U-128G-1006, IPS, 1920x1080, 13.3" | Asus X302UV-FN016T 6200U, GeForce 920MX, Hynix HFS128G3MND, TN LED, 1366x768, 13.3" | |
|---|---|---|---|---|---|---|
| Power Consumption | 2% | -6% | 25% | 18% | 18% | |
| Idle Minimum * (Watt) | 3.37 | 3.9 -16% | 4 -19% | 4.1 -22% | 2.8 17% | 3.3 2% |
| Idle Average * (Watt) | 5.2 | 7.1 -37% | 6.6 -27% | 4.2 19% | 5.8 -12% | 5.1 2% |
| Idle Maximum * (Watt) | 7.1 | 8.8 -24% | 7.4 -4% | 5.1 28% | 6.4 10% | 5.2 27% |
| Load Average * (Watt) | 46.2 | 27.6 40% | 41.7 10% | 22.1 52% | 31.3 32% | 29.5 36% |
| Witcher 3 ultra * (Watt) | 38.5 | |||||
| Load Maximum * (Watt) | 57 | 30.2 47% | 52.4 8% | 29.4 48% | 31.7 44% | 44 23% |
* ... más pequeño es mejor
| Lenovo IdeaPad 520s-14IKB 80X200C1GE i5-7200U, GeForce 940MX, 52.5 Wh | Lenovo IdeaPad 510S-14ISK 6267U, Iris Graphics 550, 30 Wh | Xiaomi Mi Notebook Air 13.3 2016 6200U, GeForce 940MX, 40 Wh | Asus X302UV-FN016T 6200U, GeForce 920MX, 38 Wh | Dell XPS 13 9360 FHD i5 i5-7200U, HD Graphics 620, 60 Wh | HP Envy 13-ad065nr i5-7200U, HD Graphics 620, 53.6 Wh | |
|---|---|---|---|---|---|---|
| Duración de Batería | -36% | -28% | -32% | 27% | 21% | |
| Reader / Idle (h) | 14.4 | 10.6 -26% | 12 -17% | 21.6 50% | 24.8 72% | |
| H.264 (h) | 9.3 | 3.9 -58% | 7.1 -24% | |||
| WiFi v1.3 (h) | 9.5 | 6.4 -33% | 6.5 -32% | 6.5 -32% | 11.3 19% | 9.5 0% |
| Load (h) | 2.3 | 1.7 -26% | 1.4 -39% | 2.6 13% | 2.1 -9% |
Pro
Contra

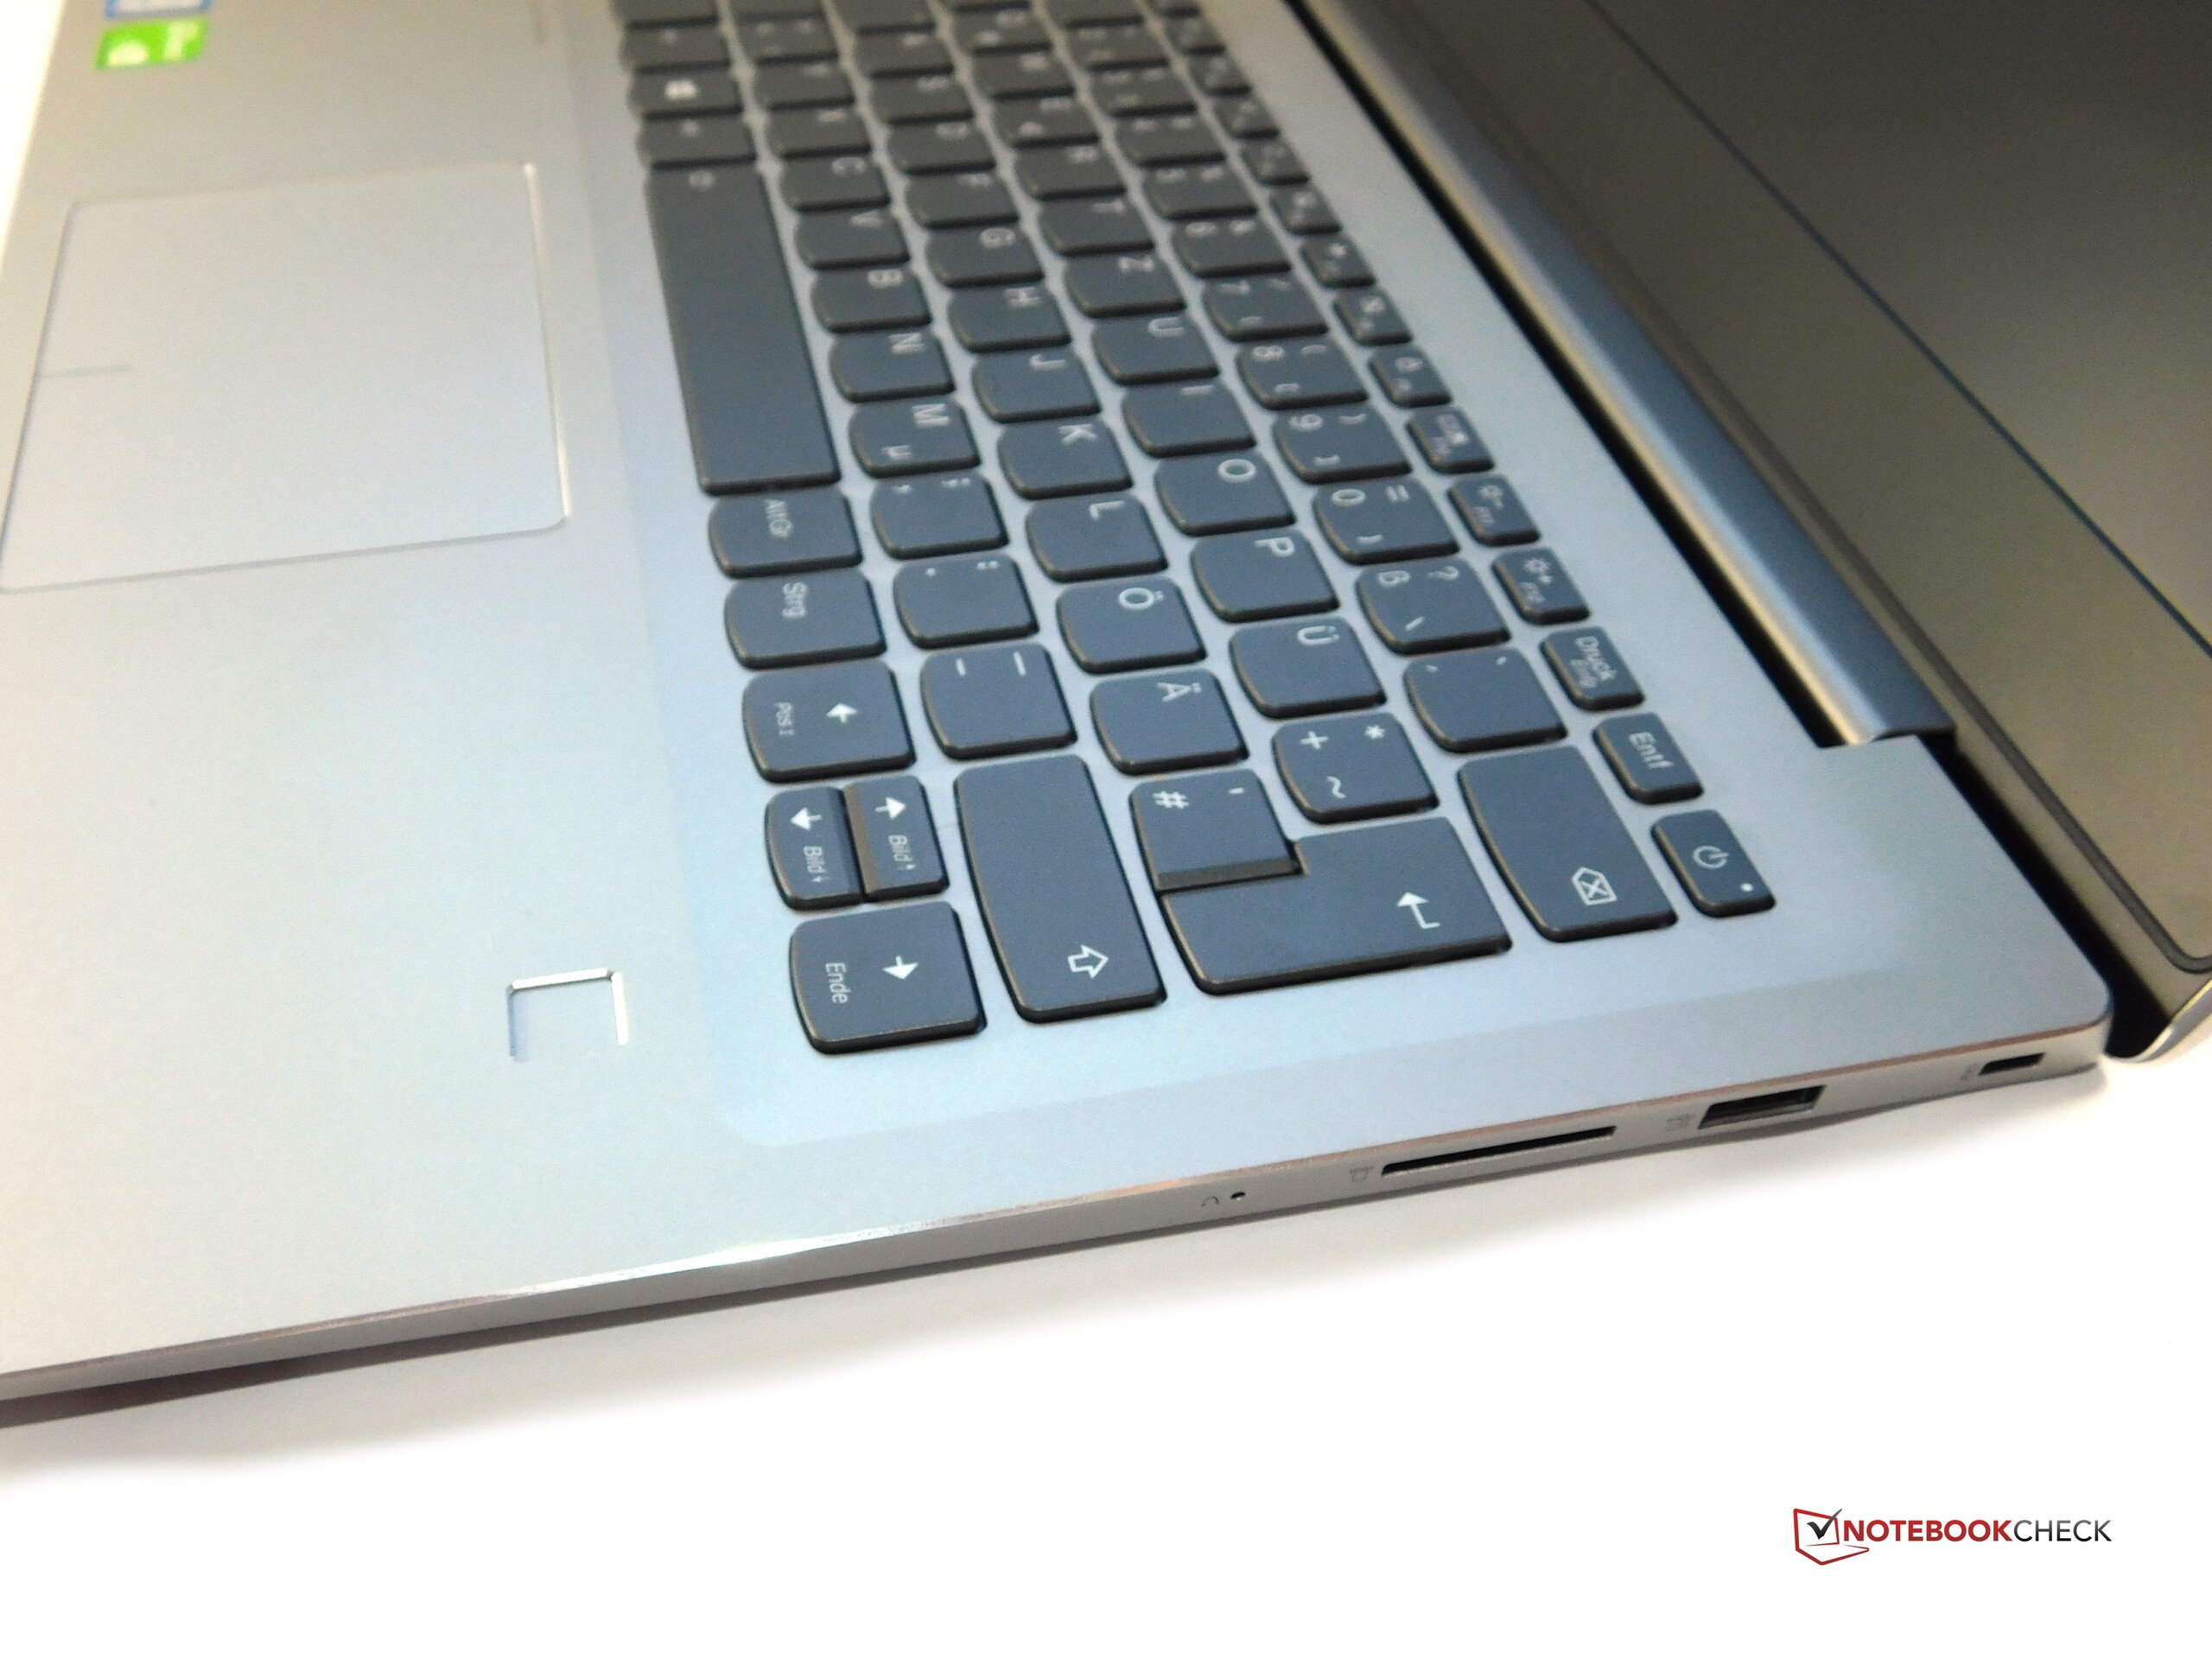
El IdeaPad 520s-14IKB es un buen paquete global que hace muchas cosas bien pero tiene puntos débiles. Sin embargo, esas debilidades pueden ser excusadas en gran medida por el precio. Primero lo positivo: En comparación con su predecesor, el diseño es más atractivo y la carcasa no muestra debilidades en términos de estabilidad y mano de obra. La buena estabilidad también ayuda con la sensación al mecanografíar, por lo que también se puede contar el teclado como un aspecto positivo, al igual que el TouchPad de acuerdo con el estándar de precisión de Microsoft. La duración de la batería es muy buena y claramente ha mejorado en comparación con el predecesor, ya que Lenovo incluyó una batería más grande. El ventilador suele estar apagado y cuando se mueve, lo hace con un zumbido agradable y tranquilo. A pesar de que la pantalla está lejos de ser perfecta (baja cobertura de espacio de color), todavía puede mostrar los buenos ángulos de visión típicos de IPS y un contraste sorprendentemente alto.
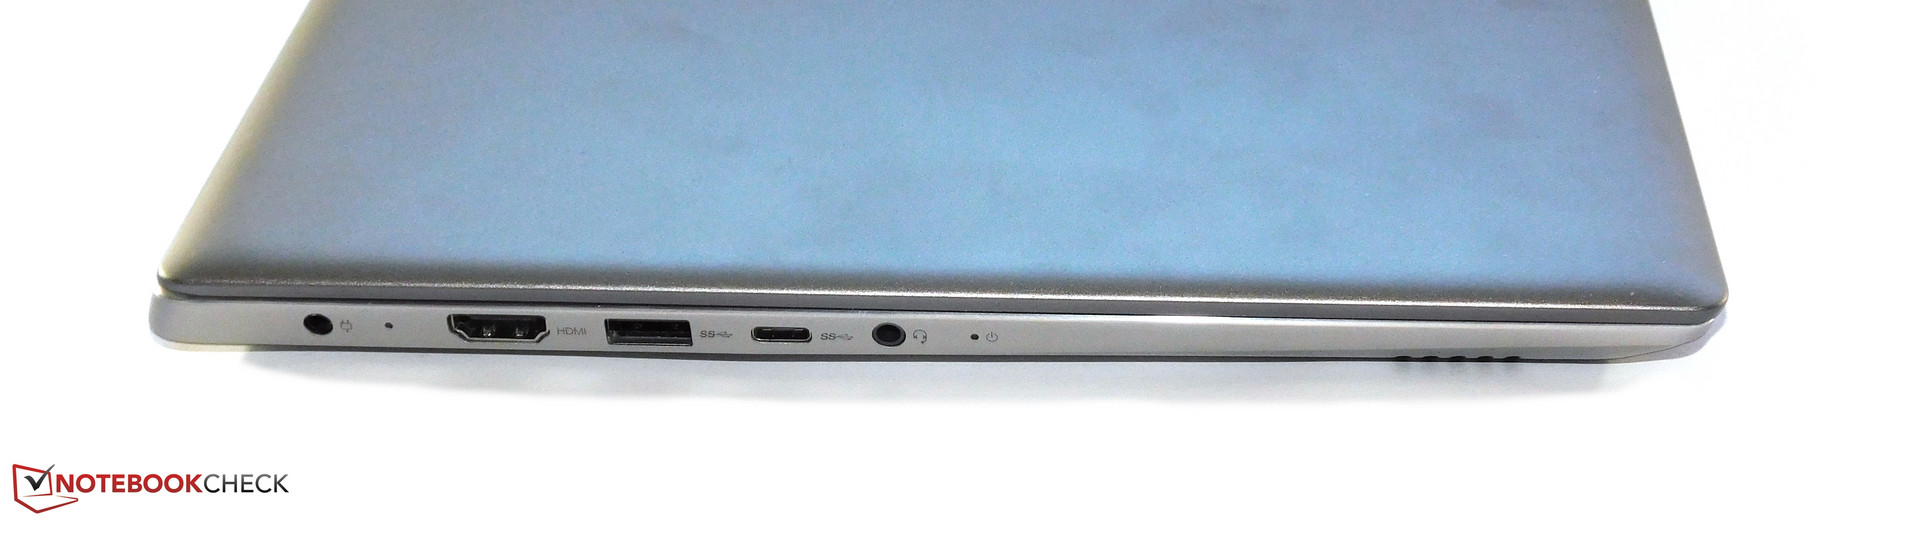
En principio, Lenovo hizo bien lo más importante. Pero hay defectos en los detalles. Por ejemplo, la carcasa se recalienta bajo carga. En general, el enfriamiento no es muy adecuado. A pesar de que es silencioso, muestra fuerte estrangulamiento en la prueba de estrés. Ya en el bucle Cinebench, la CPU no puede mantener su máximo rendimiento. Sigue siendo incomprensible para nosotros que una conexión USB-C incluida ni soporta DisplayPort, ni se puede utilizar para la carga. ¡Qué lástima! También es lamentable que Lenovo sólo construya en una tarjeta 1x1-WLAN.
En general, el IdeaPad 520s es un buen todo terreno, que convence con una buena vida de la batería y un diseño atractivo.
Los puntos negativos no son suficientes para no recomendar el IdeaPad 520s-14IKB. Simplemente es un Ultrabook relativamente exitoso, que podría ser interesante para los estudiantes en particular, con su buena vida de batería, el dGPU, y el cómodo teclado. Si lo comparas, por ejemplo, con el popular Dell XPS 13, el IdeaPad es más grande y pesado, pero sigue siendo muy portátil y casi adecuada para juegos con la GPU GeForce. También es mucho más barato.
Tenemos que mencionar un pequeño pero a la recomendación, ya que en el momento de la prueba, el IdeaPad 520s-14IKB ya estaba obsoleto. Una nueva versión del mismo portátil con Core i5-8250U y GeForce MX150 sería mucho más atractiva. Sin embargo, también tendríamos que preguntarnos cómo podría manejar el enfriamiento con componentes más nuevos.
Ésta es una versión acortada del análisis original. Puedes leer el análisis completo en inglés aquí.
Lenovo IdeaPad 520s-14IKB 80X200C1GE
- 09/05/2017 v6 (old)
Benjamin Herzig