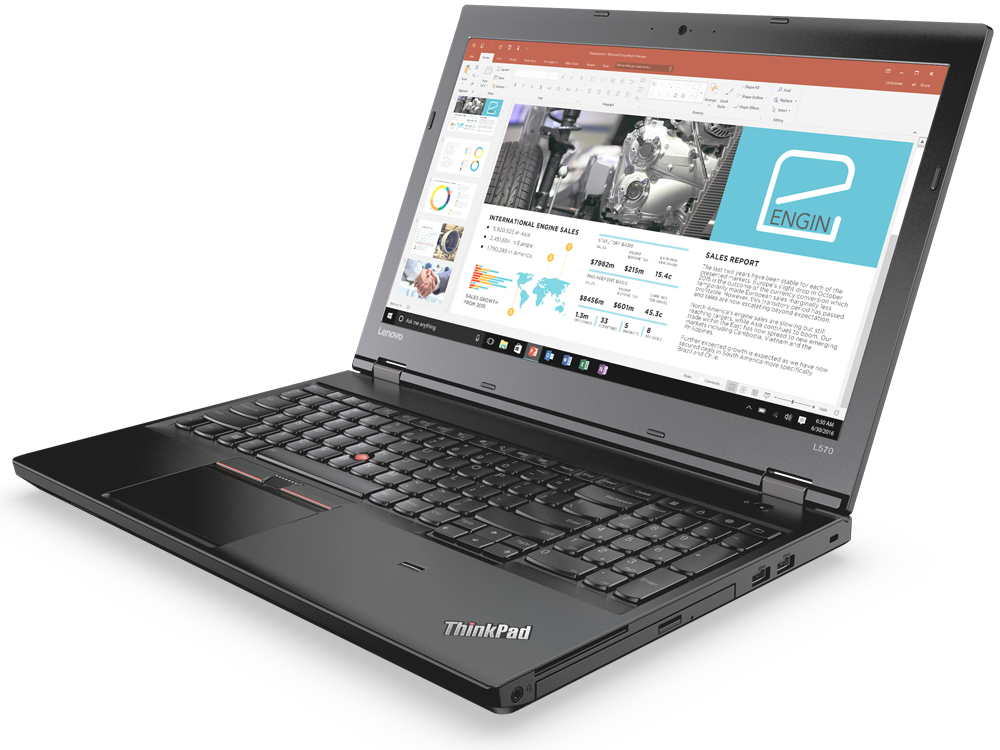
Breve análisis del portátil Lenovo ThinkPad L570 (7200U, Full HD)
| SD Card Reader | |
| average JPG Copy Test (av. of 3 runs) | |
| Dell Latitude 15 E5570 | |
| Lenovo ThinkPad L560-20F10026GE | |
| HP ProBook 450 G4 Y8B60EA | |
| Lenovo Thinkpad L570 20J9S01600 | |
| HP Probook 650 G3 Z2W44ET | |
| Lenovo ThinkPad E570-20H6S00000 | |
| Dell Vostro 15-5568 | |
| maximum AS SSD Seq Read Test (1GB) | |
| HP ProBook 450 G4 Y8B60EA | |
| HP Probook 650 G3 Z2W44ET | |
| Lenovo ThinkPad E570-20H6S00000 | |
| Lenovo ThinkPad L560-20F10026GE | |
| Dell Vostro 15-5568 | |
| Networking | |
| iperf3 transmit AX12 | |
| Lenovo Thinkpad L570 20J9S01600 | |
| HP Probook 650 G3 Z2W44ET (jseb) | |
| Lenovo ThinkPad E570-20H6S00000 | |
| Dell Vostro 15-5568 | |
| iperf3 receive AX12 | |
| HP Probook 650 G3 Z2W44ET (jseb) | |
| Lenovo ThinkPad E570-20H6S00000 | |
| Lenovo Thinkpad L570 20J9S01600 | |
| Dell Vostro 15-5568 | |
| |||||||||||||||||||||||||
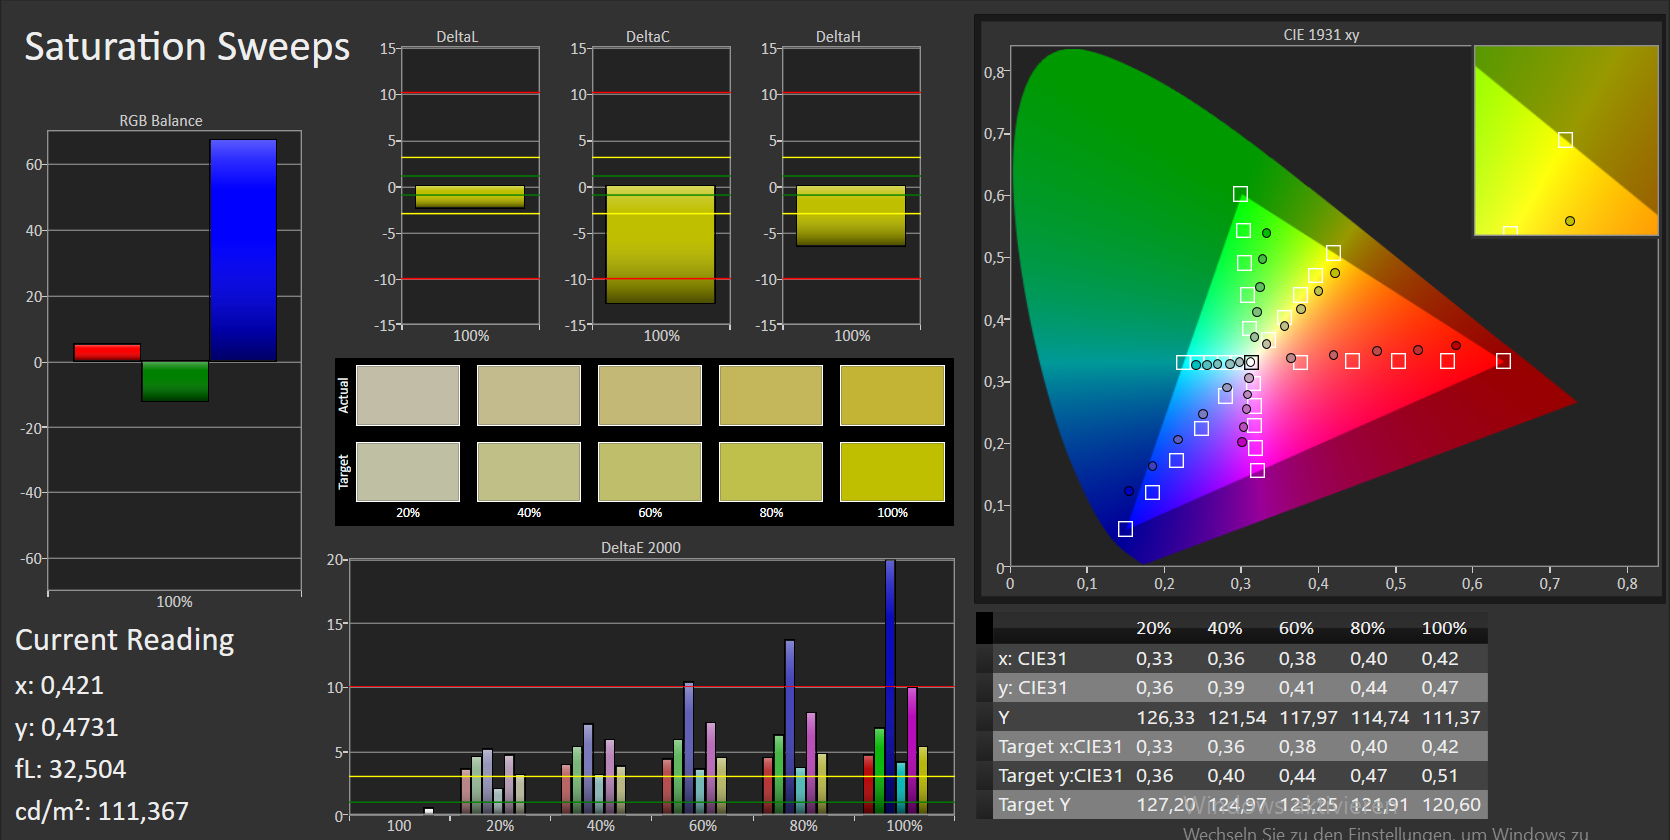
iluminación: 85 %
Brillo con batería: 272 cd/m²
Contraste: 613:1 (Negro: 0.45 cd/m²)
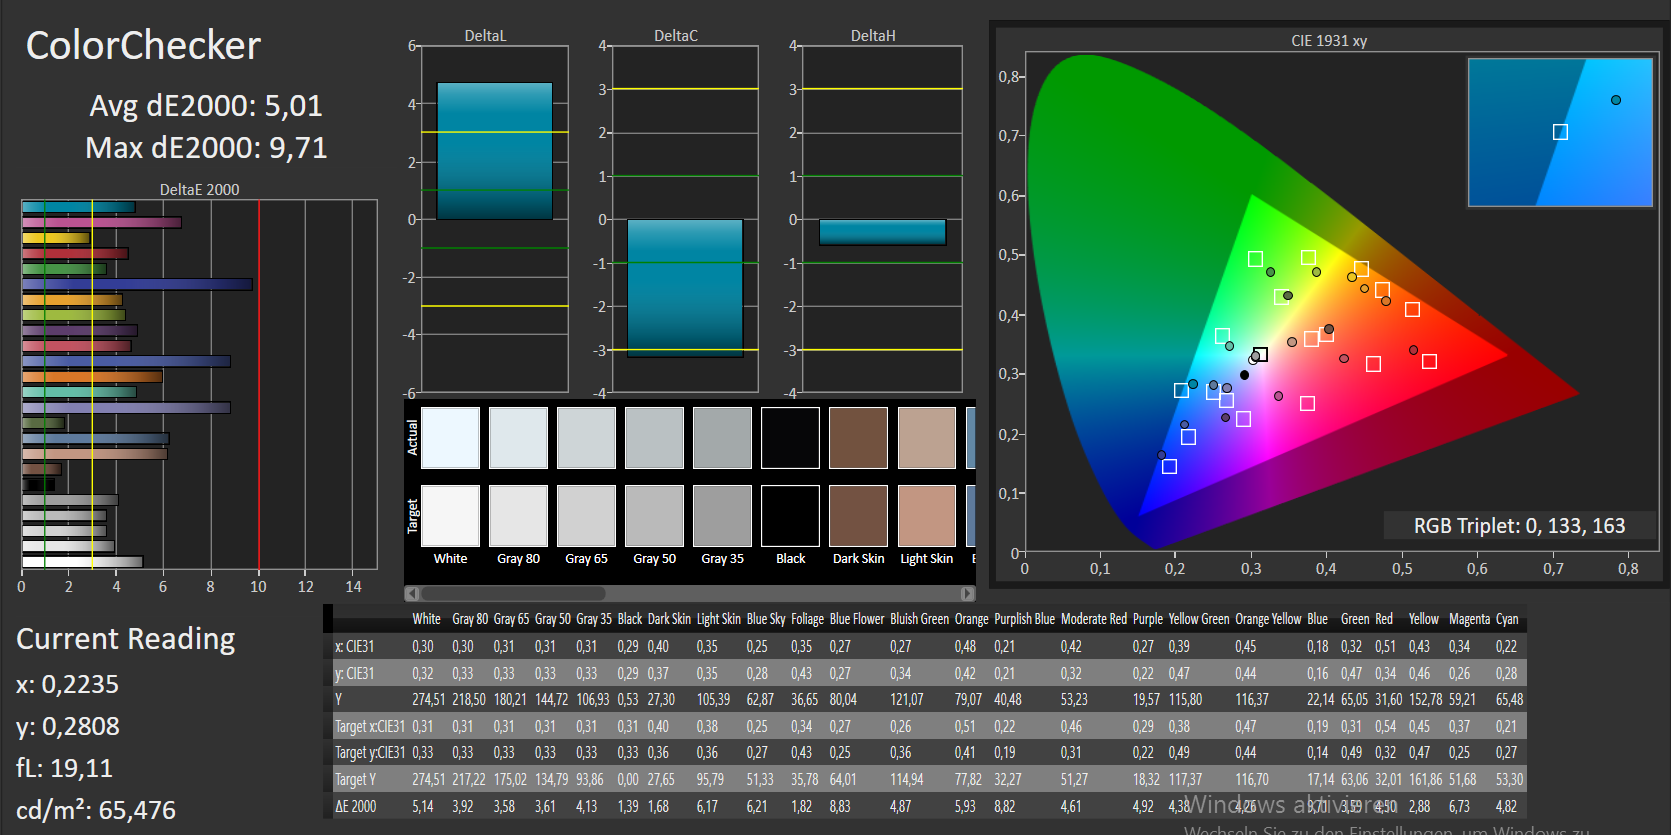
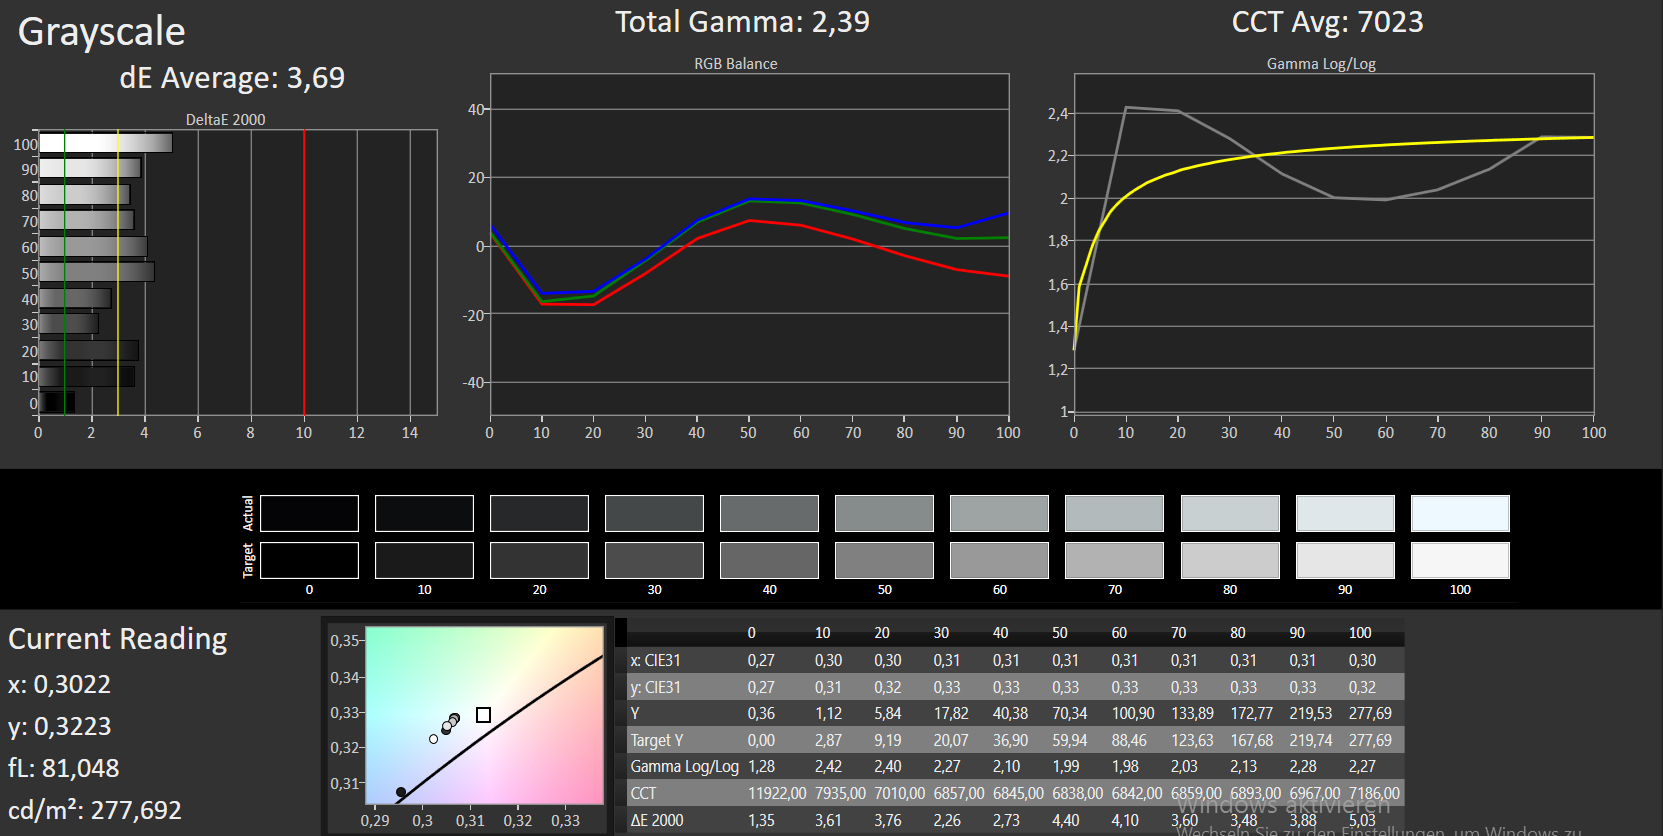
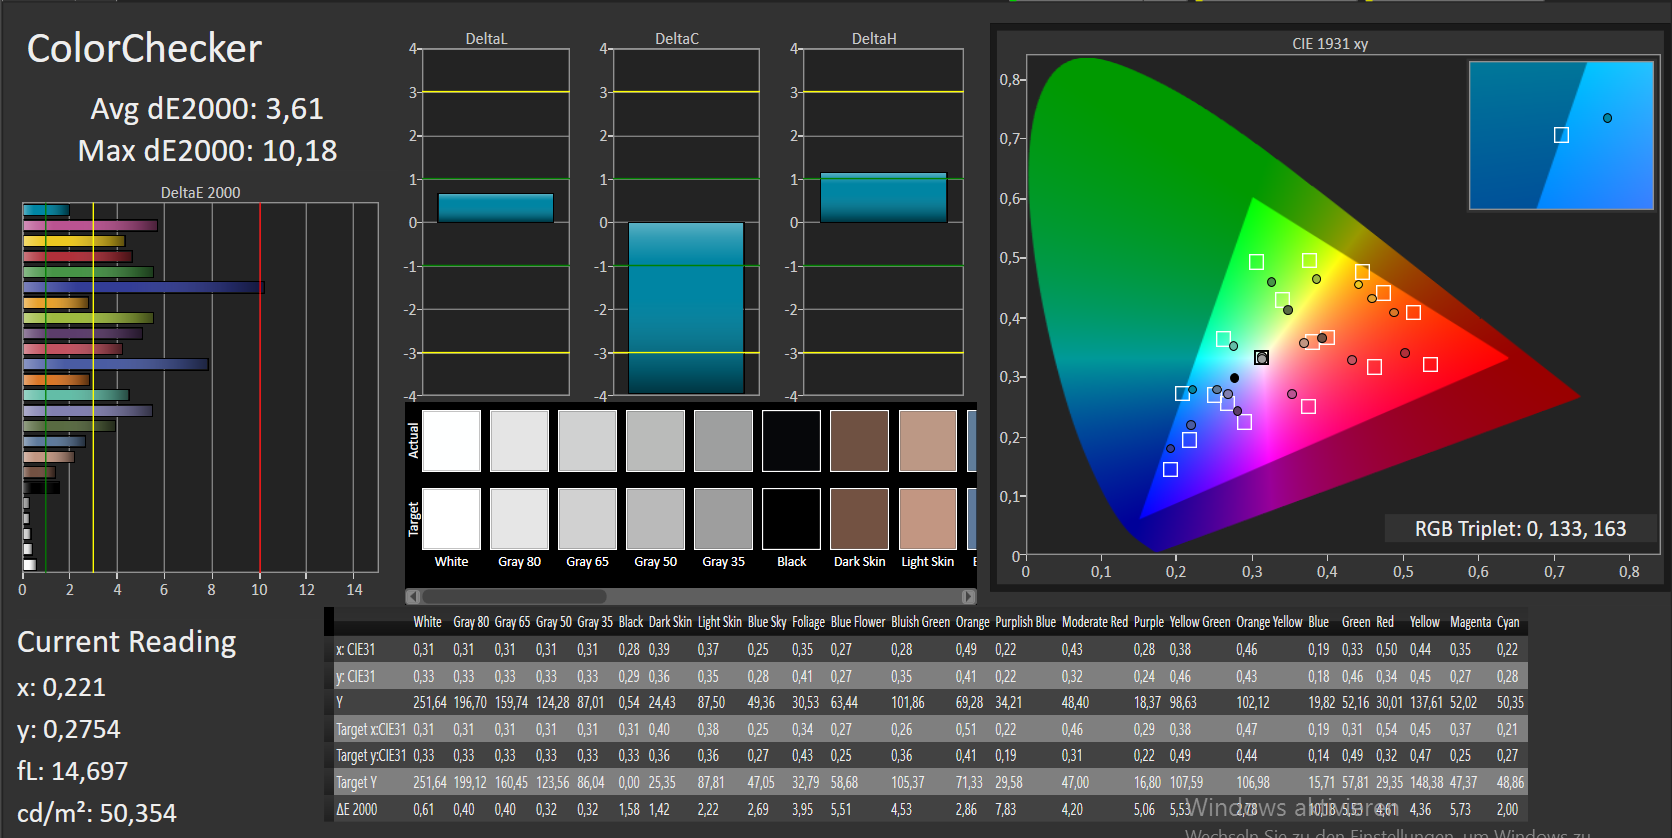
ΔE ColorChecker Calman: 5.01 | ∀{0.5-29.43 Ø4.73}
ΔE Greyscale Calman: 3.69 | ∀{0.09-98 Ø4.97}
56.3% sRGB (Argyll 1.6.3 3D)
36% AdobeRGB 1998 (Argyll 1.6.3 3D)
38.97% AdobeRGB 1998 (Argyll 3D)
56.4% sRGB (Argyll 3D)
37.68% Display P3 (Argyll 3D)
Gamma: 2.39
CCT: 7023 K
| Lenovo Thinkpad L570 20J9S01600 IPS, 1920x1080, 15.6" | Lenovo ThinkPad L560-20F10026GE AH-IPS, 1920x1080, 15.6" | HP Probook 650 G3 Z2W44ET TN LED, 1920x1080, 15.6" | Dell Latitude 15 E5570 TN LED, 1366x768, 15.6" | Lenovo ThinkPad E570-20H6S00000 IPS LED, 1920x1080, 15.6" | HP ProBook 450 G4 Y8B60EA TN LED, 1920x1080, 15.6" | Dell Vostro 15-5568 TN LED, 1920x1080, 15.6" | |
|---|---|---|---|---|---|---|---|
| Display | 3% | 45% | 7% | 3% | 6% | ||
| Display P3 Coverage (%) | 37.68 | 39 4% | 55.2 46% | 40.48 7% | 38.65 3% | 39.89 6% | |
| sRGB Coverage (%) | 56.4 | 58.3 3% | 81.1 44% | 60.9 8% | 58 3% | 59.5 5% | |
| AdobeRGB 1998 Coverage (%) | 38.97 | 40.33 3% | 57 46% | 41.82 7% | 39.94 2% | 41.24 6% | |
| Response Times | -73% | -67% | -77% | -69% | -96% | -79% | |
| Response Time Grey 50% / Grey 80% * (ms) | 43 ? | 39.2 ? 9% | 38 ? 12% | 47 ? -9% | 44.8 ? -4% | 51 ? -19% | 47.6 ? -11% |
| Response Time Black / White * (ms) | 11 ? | 28 ? -155% | 27 ? -145% | 27 ? -145% | 25.6 ? -133% | 30 ? -173% | 27.2 ? -147% |
| PWM Frequency (Hz) | 200 ? | 50 ? | |||||
| Screen | -18% | -35% | -41% | 10% | -46% | -44% | |
| Brightness middle (cd/m²) | 276 | 262 -5% | 351 27% | 228 -17% | 242 -12% | 214 -22% | 229 -17% |
| Brightness (cd/m²) | 252 | 250 -1% | 345 37% | 236 -6% | 243 -4% | 201 -20% | 222 -12% |
| Brightness Distribution (%) | 85 | 92 8% | 95 12% | 90 6% | 75 -12% | 77 -9% | 82 -4% |
| Black Level * (cd/m²) | 0.45 | 0.29 36% | 0.65 -44% | 0.56 -24% | 0.24 47% | 0.43 4% | 0.56 -24% |
| Contrast (:1) | 613 | 903 47% | 540 -12% | 407 -34% | 1008 64% | 498 -19% | 409 -33% |
| Colorchecker dE 2000 * | 5.01 | 8.49 -69% | 11.02 -120% | 10.02 -100% | 4.65 7% | 10.68 -113% | 10.36 -107% |
| Colorchecker dE 2000 max. * | 9.71 | 17.99 -85% | 17.68 -82% | 15.93 -64% | 9.64 1% | 18.07 -86% | 14.95 -54% |
| Greyscale dE 2000 * | 3.69 | 8.11 -120% | 13.14 -256% | 10.66 -189% | 3.39 8% | 11.32 -207% | 10.9 -195% |
| Gamma | 2.39 92% | 2.37 93% | 2.7 81% | 2.48 89% | 2.7 81% | 2.26 97% | 2.21 100% |
| CCT | 7023 93% | 6300 103% | 16626 39% | 11800 55% | 6246 104% | 12204 53% | 10084 64% |
| Color Space (Percent of AdobeRGB 1998) (%) | 36 | 37.07 3% | 52 44% | 39 8% | 36.69 2% | 38 6% | 37.69 5% |
| Color Space (Percent of sRGB) (%) | 56.3 | 57.94 3% | 81 44% | 61 8% | 57.66 2% | 59 5% | 57.92 3% |
| Media total (Programa/Opciones) | -29% /
-21% | -19% /
-23% | -37% /
-36% | -19% /
-2% | -45% /
-42% | -62% /
-50% |
* ... más pequeño es mejor
Parpadeo de Pantalla / PWM (Pulse-Width Modulation)
| Parpadeo de Pantalla / PWM no detectado | ≤ 90 % de brillo | |
Comparación: 52 % de todos los dispositivos testados no usaron PWM para atenuar el display. Si se usó, medimos una media de 7794 (mínimo: 5 - máxmo: 343500) Hz. | ||
Tiempos de respuesta del display
| ↔ Tiempo de respuesta de Negro a Blanco | ||
|---|---|---|
| 11 ms ... subida ↗ y bajada ↘ combinada | ↗ 7 ms subida | 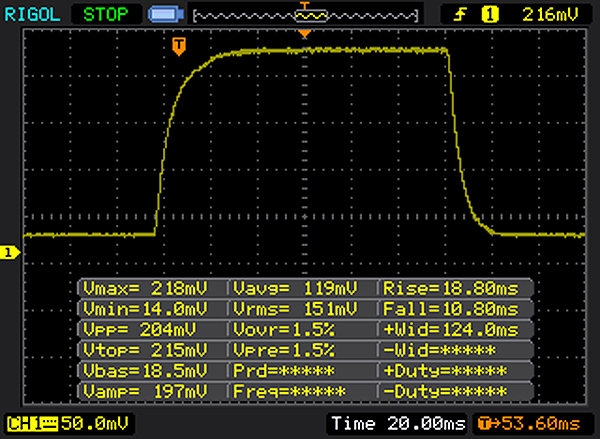 |
| ↘ 4 ms bajada | ||
| La pantalla mostró buenos tiempos de respuesta en nuestros tests pero podría ser demasiado lenta para los jugones competitivos. En comparación, todos los dispositivos de prueba van de ##min### (mínimo) a 240 (máximo) ms. » 29 % de todos los dispositivos son mejores. Esto quiere decir que el tiempo de respuesta medido es mejor que la media (19.9 ms) de todos los dispositivos testados. | ||
| ↔ Tiempo de respuesta 50% Gris a 80% Gris | ||
| 43 ms ... subida ↗ y bajada ↘ combinada | ↗ 24 ms subida | 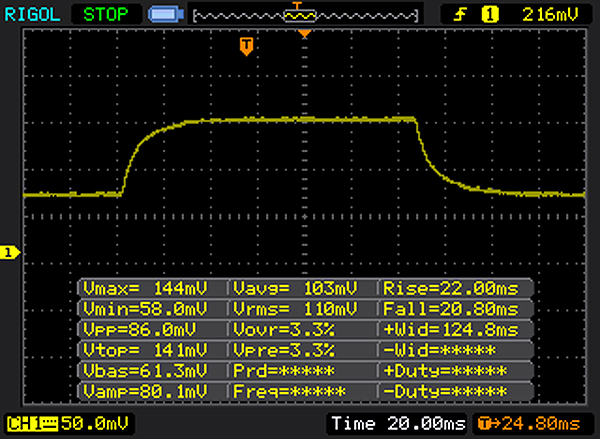 |
| ↘ 19 ms bajada | ||
| La pantalla mostró tiempos de respuesta lentos en nuestros tests y podría ser demasiado lenta para los jugones. En comparación, todos los dispositivos de prueba van de ##min### (mínimo) a 636 (máximo) ms. » 71 % de todos los dispositivos son mejores. Eso quiere decir que el tiempo de respuesta es peor que la media (31.1 ms) de todos los dispositivos testados. | ||
| Cinebench R10 | |
| Rendering Multiple CPUs 32Bit | |
| Lenovo Thinkpad L570 20J9S01600 | |
| HP Probook 650 G3 Z2W44ET | |
| Dell Latitude 15 E5570 | |
| Lenovo ThinkPad L560-20F10026GE | |
| Rendering Single 32Bit | |
| Lenovo Thinkpad L570 20J9S01600 | |
| HP Probook 650 G3 Z2W44ET | |
| Dell Latitude 15 E5570 | |
| Lenovo ThinkPad L560-20F10026GE | |
| Geekbench 3 | |
| 32 Bit Multi-Core Score | |
| Lenovo Thinkpad L570 20J9S01600 | |
| HP Probook 650 G3 Z2W44ET | |
| Dell Latitude 15 E5570 | |
| 32 Bit Single-Core Score | |
| Lenovo Thinkpad L570 20J9S01600 | |
| Dell Latitude 15 E5570 | |
| HP Probook 650 G3 Z2W44ET | |
| Geekbench 4.0 | |
| 64 Bit Multi-Core Score | |
| Lenovo Thinkpad L570 20J9S01600 | |
| HP Probook 650 G3 Z2W44ET | |
| 64 Bit Single-Core Score | |
| Lenovo Thinkpad L570 20J9S01600 | |
| HP Probook 650 G3 Z2W44ET | |
| Geekbench 4.4 | |
| 64 Bit Multi-Core Score | |
| Lenovo Thinkpad L570 20J9S01600 | |
| 64 Bit Single-Core Score | |
| Lenovo Thinkpad L570 20J9S01600 | |
| PCMark 7 Score | 5464 puntos | |
| PCMark 8 Home Score Accelerated v2 | 3520 puntos | |
| PCMark 8 Creative Score Accelerated v2 | 3293 puntos | |
| PCMark 8 Work Score Accelerated v2 | 4600 puntos | |
ayuda | ||

| Lenovo Thinkpad L570 20J9S01600 Samsung PM961 NVMe MZVLW512HMJP | Lenovo ThinkPad L560-20F10026GE WDC Slim WD10SPCX-21KHST0 | HP Probook 650 G3 Z2W44ET Hitachi Travelstar Z7K500 HTS725050A7E630 | Dell Latitude 15 E5570 Samsung SSD PM871 MZ7LN128HCHP | Lenovo ThinkPad E570-20H6S00000 Toshiba THNSF5256GPUK | HP Spectre x360 13-ac033dx Samsung PM961 NVMe MZVLW512HMJP | Lenovo ThinkPad X1 Carbon 2017-20HQS03P00 Samsung PM961 NVMe MZVLW512HMJP | HP Spectre 13-v131ng Samsung PM961 NVMe MZVLW512HMJP | Lenovo ThinkPad T470-20HD002HGE Samsung PM961 NVMe MZVLW512HMJP | HP ProBook 450 G4 Y8B60EA SanDisk SD8SNAT256G1002 | Dell Vostro 15-5568 SanDisk X400 256GB, SATA (SD8SB8U-256G) | |
|---|---|---|---|---|---|---|---|---|---|---|---|
| CrystalDiskMark 3.0 | -96% | -97% | -59% | -28% | 8% | 16% | -6% | -6% | -55% | ||
| Read Seq (MB/s) | 1412 | 113.6 -92% | 109.4 -92% | 474.7 -66% | 1140 -19% | 2065 46% | 1827 29% | 1090 -23% | 1155 -18% | 497.8 -65% | |
| Write Seq (MB/s) | 1110 | 111.7 -90% | 99.9 -91% | 155 -86% | 468.1 -58% | 1550 40% | 1383 25% | 1088 -2% | 1076 -3% | 466.8 -58% | |
| Read 512 (MB/s) | 833 | 39.65 -95% | 16.34 -98% | 393.6 -53% | 759 -9% | 865 4% | 814 -2% | 753 -10% | 811 -3% | 363.4 -56% | |
| Write 512 (MB/s) | 920 | 55.3 -94% | 43.45 -95% | 119.7 -87% | 414 -55% | 1229 34% | 1098 19% | 911 -1% | 862 -6% | 368.5 -60% | |
| Read 4k (MB/s) | 56.8 | 0.488 -99% | 0.337 -99% | 34 -40% | 34.3 -40% | 54.7 -4% | 61 7% | 57.5 1% | 55.5 -2% | 29.02 -49% | |
| Write 4k (MB/s) | 138.9 | 1.022 -99% | 0.866 -99% | 96.6 -30% | 123.4 -11% | 139.4 0% | 172.2 24% | 140.2 1% | 134.6 -3% | 56 -60% | |
| Read 4k QD32 (MB/s) | 539 | 1.367 -100% | 0.826 -100% | 383.3 -29% | 530 -2% | 518 -4% | 601 12% | 497.1 -8% | 496.2 -8% | 296 -45% | |
| Write 4k QD32 (MB/s) | 444.8 | 1.036 -100% | 0.859 -100% | 100.2 -77% | 319.2 -28% | 225.6 -49% | 495.6 11% | 416 -6% | 425.4 -4% | 229.4 -48% |
| 3DMark 06 Standard Score | 7810 puntos | |
| 3DMark 11 Performance | 1550 puntos | |
| 3DMark Ice Storm Standard Score | 52860 puntos | |
| 3DMark Cloud Gate Standard Score | 5745 puntos | |
| 3DMark Fire Strike Score | 764 puntos | |
| 3DMark Fire Strike Extreme Score | 343 puntos | |
ayuda | ||
| bajo | medio | alto | ultra | |
|---|---|---|---|---|
| Tomb Raider (2013) | 62.7 | 31.4 | 18.4 | 9.7 |
| BioShock Infinite (2013) | 40.3 | 23.9 | 19.8 | 6.9 |
| Battlefield 4 (2013) | 31 | 23 | 15.6 | 6.2 |
Ruido
| Ocioso |
| 30.3 / 30.3 / 30.3 dB(A) |
| DVD |
| 38.2 / dB(A) |
| Carga |
| 33.2 / 33.1 dB(A) |
 | ||
30 dB silencioso 40 dB(A) audible 50 dB(A) ruidosamente alto |
||
min: | ||
| Lenovo Thinkpad L570 20J9S01600 i5-7200U, HD Graphics 620 | Lenovo ThinkPad L560-20F10026GE 6200U, HD Graphics 520 | HP Probook 650 G3 Z2W44ET i5-7200U, HD Graphics 620 | Dell Latitude 15 E5570 6300U, HD Graphics 520 | Lenovo ThinkPad E570-20H6S00000 i5-7200U, GeForce GTX 950M | HP ProBook 450 G4 Y8B60EA i7-7500U, GeForce 930MX | Dell Vostro 15-5568 i5-7200U, HD Graphics 620 | |
|---|---|---|---|---|---|---|---|
| Noise | 0% | -3% | -7% | -1% | -11% | 0% | |
| apagado / medio ambiente * (dB) | 30.3 | 29.4 3% | 30.7 -1% | 31.2 -3% | 29 4% | 31.6 -4% | 29 4% |
| Idle Minimum * (dB) | 30.3 | 30.1 1% | 31.5 -4% | 31.2 -3% | 29 4% | 32.6 -8% | 29 4% |
| Idle Average * (dB) | 30.3 | 30.1 1% | 31.5 -4% | 33.2 -10% | 29 4% | 32.6 -8% | 29 4% |
| Idle Maximum * (dB) | 30.3 | 30.1 1% | 31.5 -4% | 34.3 -13% | 29 4% | 33 -9% | 29 4% |
| Load Average * (dB) | 33.2 | 33.4 -1% | 34.6 -4% | 36.6 -10% | 34.3 -3% | 38.9 -17% | 33.9 -2% |
| Load Maximum * (dB) | 33.1 | 34.7 -5% | 33.3 -1% | 34.7 -5% | 40.1 -21% | 38.9 -18% | 37 -12% |
* ... más pequeño es mejor
(+) La temperatura máxima en la parte superior es de 36.1 °C / 97 F, frente a la media de 34.3 °C / 94 F, que oscila entre 21.2 y 62.5 °C para la clase Office.
(+) El fondo se calienta hasta un máximo de 33.1 °C / 92 F, frente a la media de 36.8 °C / 98 F
(+) En reposo, la temperatura media de la parte superior es de 22.6 °C / 73# F, frente a la media del dispositivo de 29.5 °C / 85 F.
(+) El reposamanos y el panel táctil están a una temperatura inferior a la de la piel, con un máximo de 28 °C / 82.4 F y, por tanto, son fríos al tacto.
(±) La temperatura media de la zona del reposamanos de dispositivos similares fue de 27.5 °C / 81.5 F (-0.5 °C / -0.9 F).
| Lenovo Thinkpad L570 20J9S01600 i5-7200U, HD Graphics 620 | Lenovo ThinkPad L560-20F10026GE 6200U, HD Graphics 520 | HP Probook 650 G3 Z2W44ET i5-7200U, HD Graphics 620 | Dell Latitude 15 E5570 6300U, HD Graphics 520 | Lenovo ThinkPad E570-20H6S00000 i5-7200U, GeForce GTX 950M | HP ProBook 450 G4 Y8B60EA i7-7500U, GeForce 930MX | Dell Vostro 15-5568 i5-7200U, HD Graphics 620 | |
|---|---|---|---|---|---|---|---|
| Heat | -20% | 3% | -33% | -21% | -24% | -18% | |
| Maximum Upper Side * (°C) | 36.1 | 37.2 -3% | 31.9 12% | 37.3 -3% | 46.6 -29% | 44.3 -23% | 38 -5% |
| Maximum Bottom * (°C) | 33.1 | 36 -9% | 32.1 3% | 41.5 -25% | 49.1 -48% | 46.3 -40% | 39 -18% |
| Idle Upper Side * (°C) | 23.7 | 30.7 -30% | 23.5 1% | 34.2 -44% | 24.6 -4% | 27.8 -17% | 25.7 -8% |
| Idle Bottom * (°C) | 24.1 | 32.8 -36% | 25.3 -5% | 38.8 -61% | 25.1 -4% | 27.7 -15% | 33.8 -40% |
* ... más pequeño es mejor
Lenovo Thinkpad L570 20J9S01600 análisis de audio
(-) | altavoces no muy altos (#70 dB)
Graves 100 - 315 Hz
(±) | lubina reducida - en promedio 13.2% inferior a la mediana
(+) | el bajo es lineal (4.8% delta a la frecuencia anterior)
Medios 400 - 2000 Hz
(+) | medios equilibrados - a sólo 4.1% de la mediana
(+) | los medios son lineales (4.1% delta a la frecuencia anterior)
Altos 2 - 16 kHz
(+) | máximos equilibrados - a sólo 1.4% de la mediana
(+) | los máximos son lineales (2.5% delta a la frecuencia anterior)
Total 100 - 16.000 Hz
(±) | la linealidad del sonido global es media (15.2% de diferencia con la mediana)
En comparación con la misma clase
» 14% de todos los dispositivos probados de esta clase eran mejores, 4% similares, 82% peores
» El mejor tuvo un delta de 7%, la media fue 21%, el peor fue ###max##%
En comparación con todos los dispositivos probados
» 21% de todos los dispositivos probados eran mejores, 4% similares, 74% peores
» El mejor tuvo un delta de 4%, la media fue 24%, el peor fue ###max##%
Apple MacBook 12 (Early 2016) 1.1 GHz análisis de audio
(+) | los altavoces pueden reproducir a un volumen relativamente alto (#83.6 dB)
Graves 100 - 315 Hz
(±) | lubina reducida - en promedio 11.3% inferior a la mediana
(±) | la linealidad de los graves es media (14.2% delta a frecuencia anterior)
Medios 400 - 2000 Hz
(+) | medios equilibrados - a sólo 2.4% de la mediana
(+) | los medios son lineales (5.5% delta a la frecuencia anterior)
Altos 2 - 16 kHz
(+) | máximos equilibrados - a sólo 2% de la mediana
(+) | los máximos son lineales (4.5% delta a la frecuencia anterior)
Total 100 - 16.000 Hz
(+) | el sonido global es lineal (10.2% de diferencia con la mediana)
En comparación con la misma clase
» 7% de todos los dispositivos probados de esta clase eran mejores, 2% similares, 91% peores
» El mejor tuvo un delta de 5%, la media fue 18%, el peor fue ###max##%
En comparación con todos los dispositivos probados
» 5% de todos los dispositivos probados eran mejores, 1% similares, 94% peores
» El mejor tuvo un delta de 4%, la media fue 24%, el peor fue ###max##%
| Off / Standby | |
| Ocioso | |
| Carga |
|
Clave:
min: | |
| Lenovo Thinkpad L570 20J9S01600 i5-7200U, HD Graphics 620 | Lenovo ThinkPad L560-20F10026GE 6200U, HD Graphics 520 | HP Probook 650 G3 Z2W44ET i5-7200U, HD Graphics 620 | Dell Latitude 15 E5570 6300U, HD Graphics 520 | Lenovo ThinkPad E570-20H6S00000 i5-7200U, GeForce GTX 950M | HP ProBook 450 G4 Y8B60EA i7-7500U, GeForce 930MX | Dell Vostro 15-5568 i5-7200U, HD Graphics 620 | |
|---|---|---|---|---|---|---|---|
| Power Consumption | -11% | 2% | -5% | -32% | -23% | -4% | |
| Idle Minimum * (Watt) | 4 | 5 -25% | 4 -0% | 4.5 -13% | 2.8 30% | 3.8 5% | 3.3 17% |
| Idle Average * (Watt) | 7.4 | 7.9 -7% | 6.9 7% | 7.6 -3% | 6.3 15% | 6.6 11% | 6.8 8% |
| Idle Maximum * (Watt) | 7.7 | 8.6 -12% | 7.6 1% | 8.7 -13% | 6.9 10% | 11.3 -47% | 7.7 -0% |
| Load Average * (Watt) | 30.6 | 27.5 10% | 29 5% | 28.5 7% | 51.6 -69% | 38 -24% | 30.9 -1% |
| Load Maximum * (Watt) | 28.2 | 33.7 -20% | 28.7 -2% | 29.2 -4% | 69.7 -147% | 45 -60% | 40.3 -43% |
* ... más pequeño es mejor
| Lenovo Thinkpad L570 20J9S01600 i5-7200U, HD Graphics 620, 48 Wh | Lenovo ThinkPad L560-20F10026GE 6200U, HD Graphics 520, 48 Wh | HP Probook 650 G3 Z2W44ET i5-7200U, HD Graphics 620, 48 Wh | Dell Latitude 15 E5570 6300U, HD Graphics 520, 62 Wh | Lenovo ThinkPad E570-20H6S00000 i5-7200U, GeForce GTX 950M, 41 Wh | HP ProBook 450 G4 Y8B60EA i7-7500U, GeForce 930MX, 45 Wh | Dell Vostro 15-5568 i5-7200U, HD Graphics 620, 42 Wh | |
|---|---|---|---|---|---|---|---|
| Duración de Batería | -31% | -5% | 15% | -11% | -13% | -14% | |
| Reader / Idle (h) | 19.4 | 11.6 -40% | 12.8 -34% | 20.5 6% | 14.7 -24% | 12.4 -36% | 16.9 -13% |
| H.264 (h) | 8.2 | 4.6 -44% | 6.7 -18% | 9.5 16% | 8.5 4% | ||
| WiFi v1.3 (h) | 8.9 | 6.8 -24% | 7.8 -12% | 10.5 18% | 7.7 -13% | 8.6 -3% | 6 -33% |
| Load (h) | 2.1 | 1.8 -14% | 3 43% | 2.5 19% | 2.2 5% | 2.1 0% | 1.8 -14% |
Pro
Contra
Comparado con su predecesor, el ThinkPad L570 es sobre todo una actualización a Kaby Lake. Los procesadores Kaby Lake ofrecen una ligera mejora de rendimiento en comparación con la gama Skylake, pero proporciona mejoras en otras areas: la duración de batería es significativamente mayor y aguanta sin problema un día entero en la universidad.
Kaby Lake ofrece una gran mejora en la duración de batería.
Al igual que debería ocurrir con las herramientas de trabajo, el dispositivo apenas se calienta y funciona en silencio. El sistema de refrigeración no se activa sin motivo aparente, que era una de las mayores críticas que recibió el ThinkPad L560.
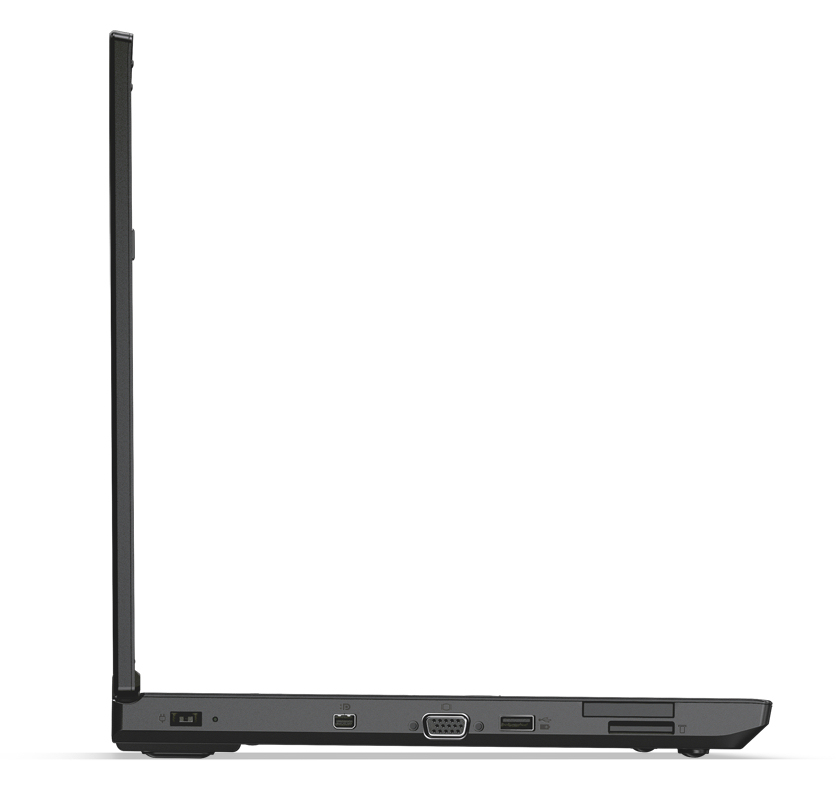
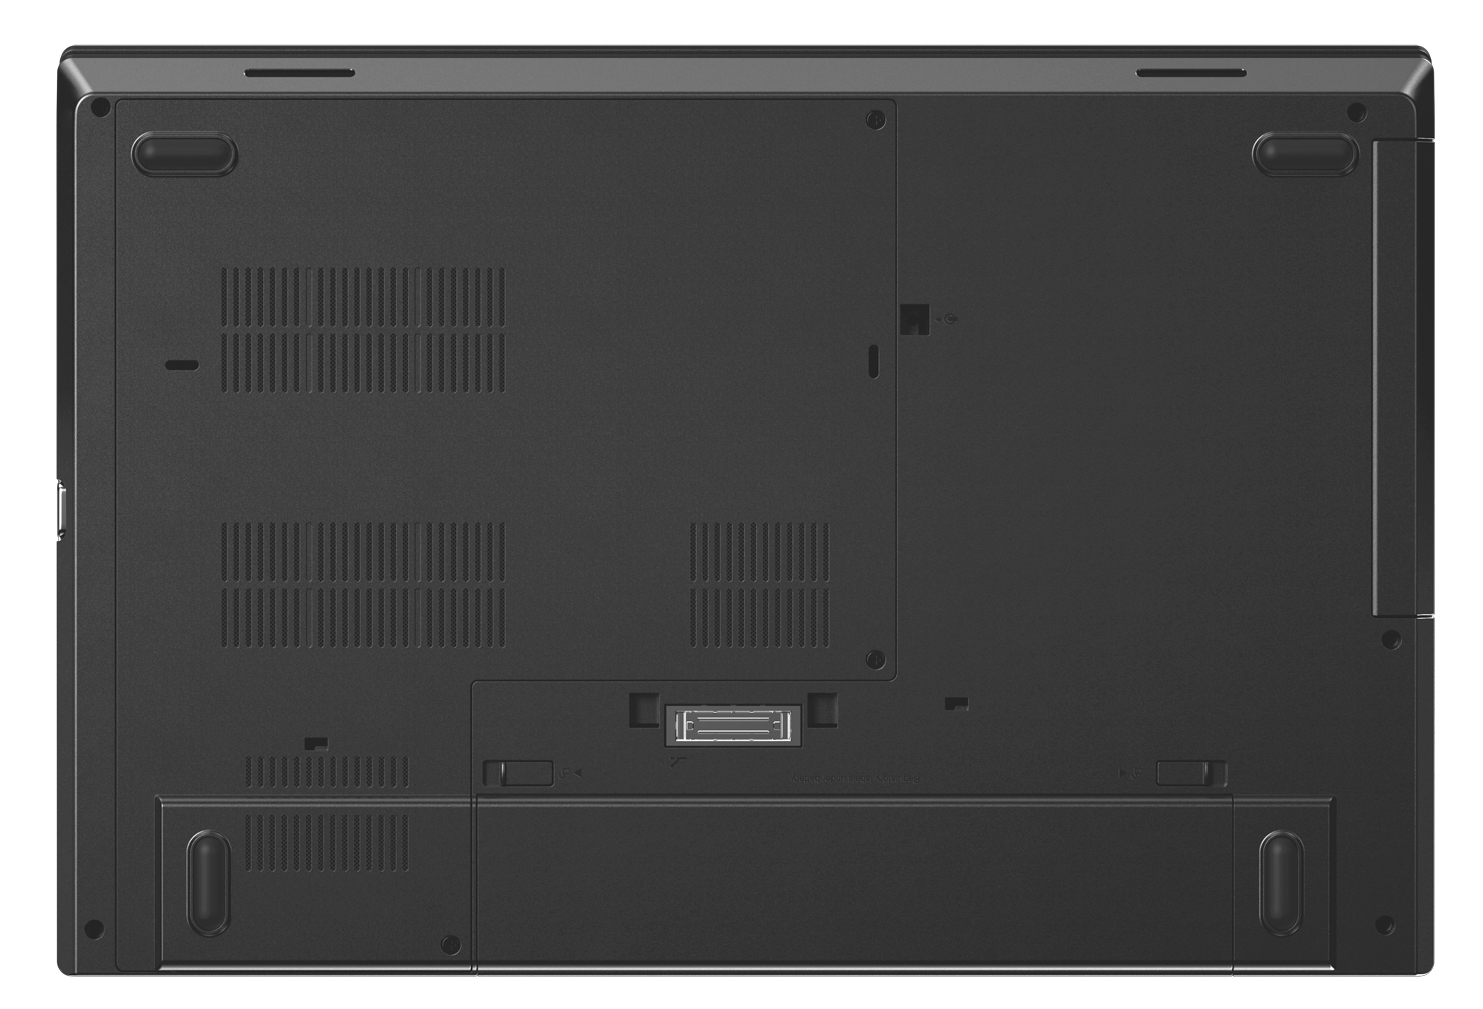
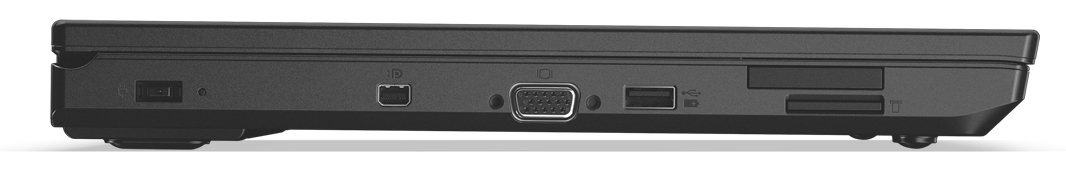
Un SSD NVMe asegura un sistema rápido y ágil. Gracias a la cubierta de mantenimiento, cambiar el SSD no debería ser un problema. El ThinkPad ofrece más opciones de ampliación: puede montarse una ranura M.2 2242 adicional y un modem LTE (el sistema ya dispone de antenas) o un SSD secundario.
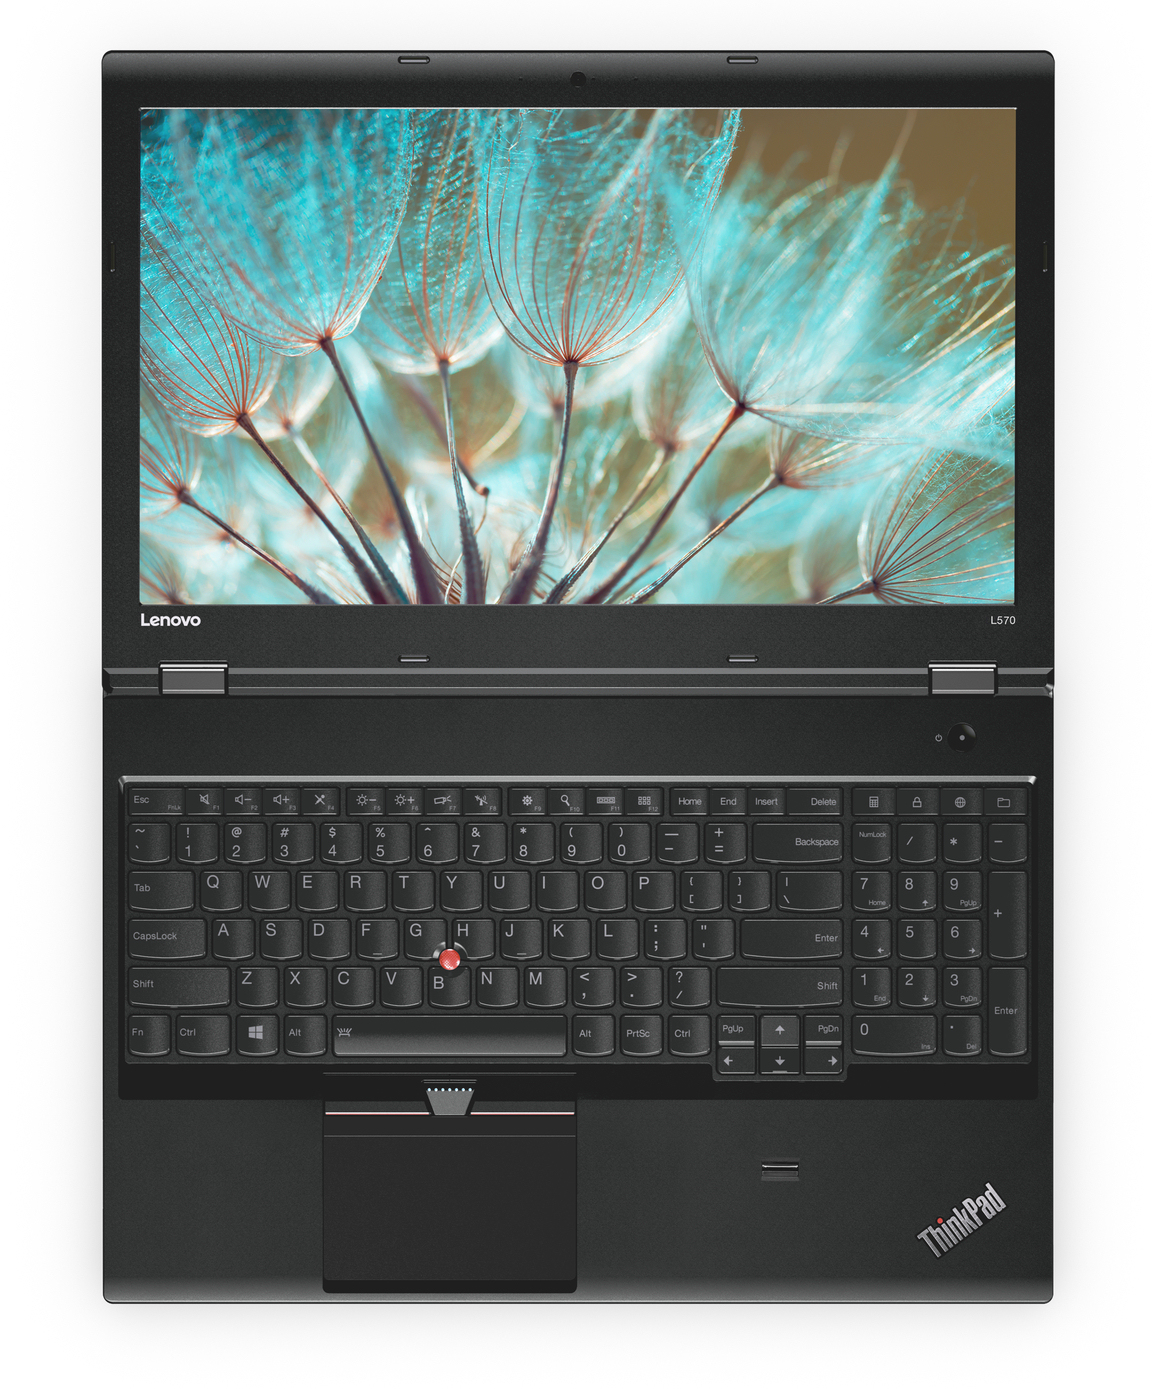
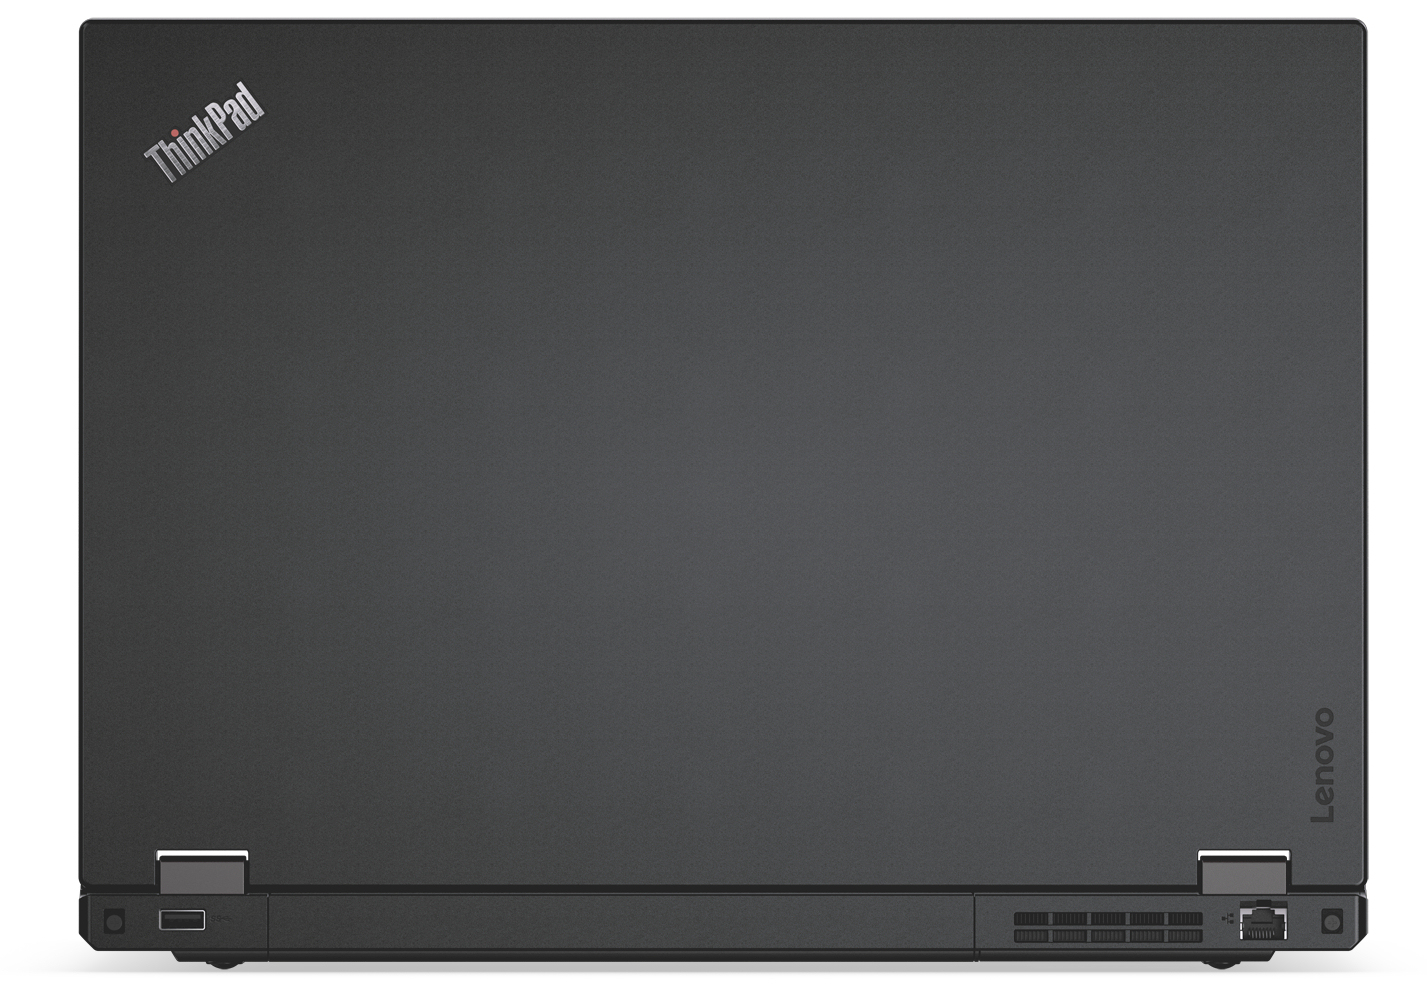
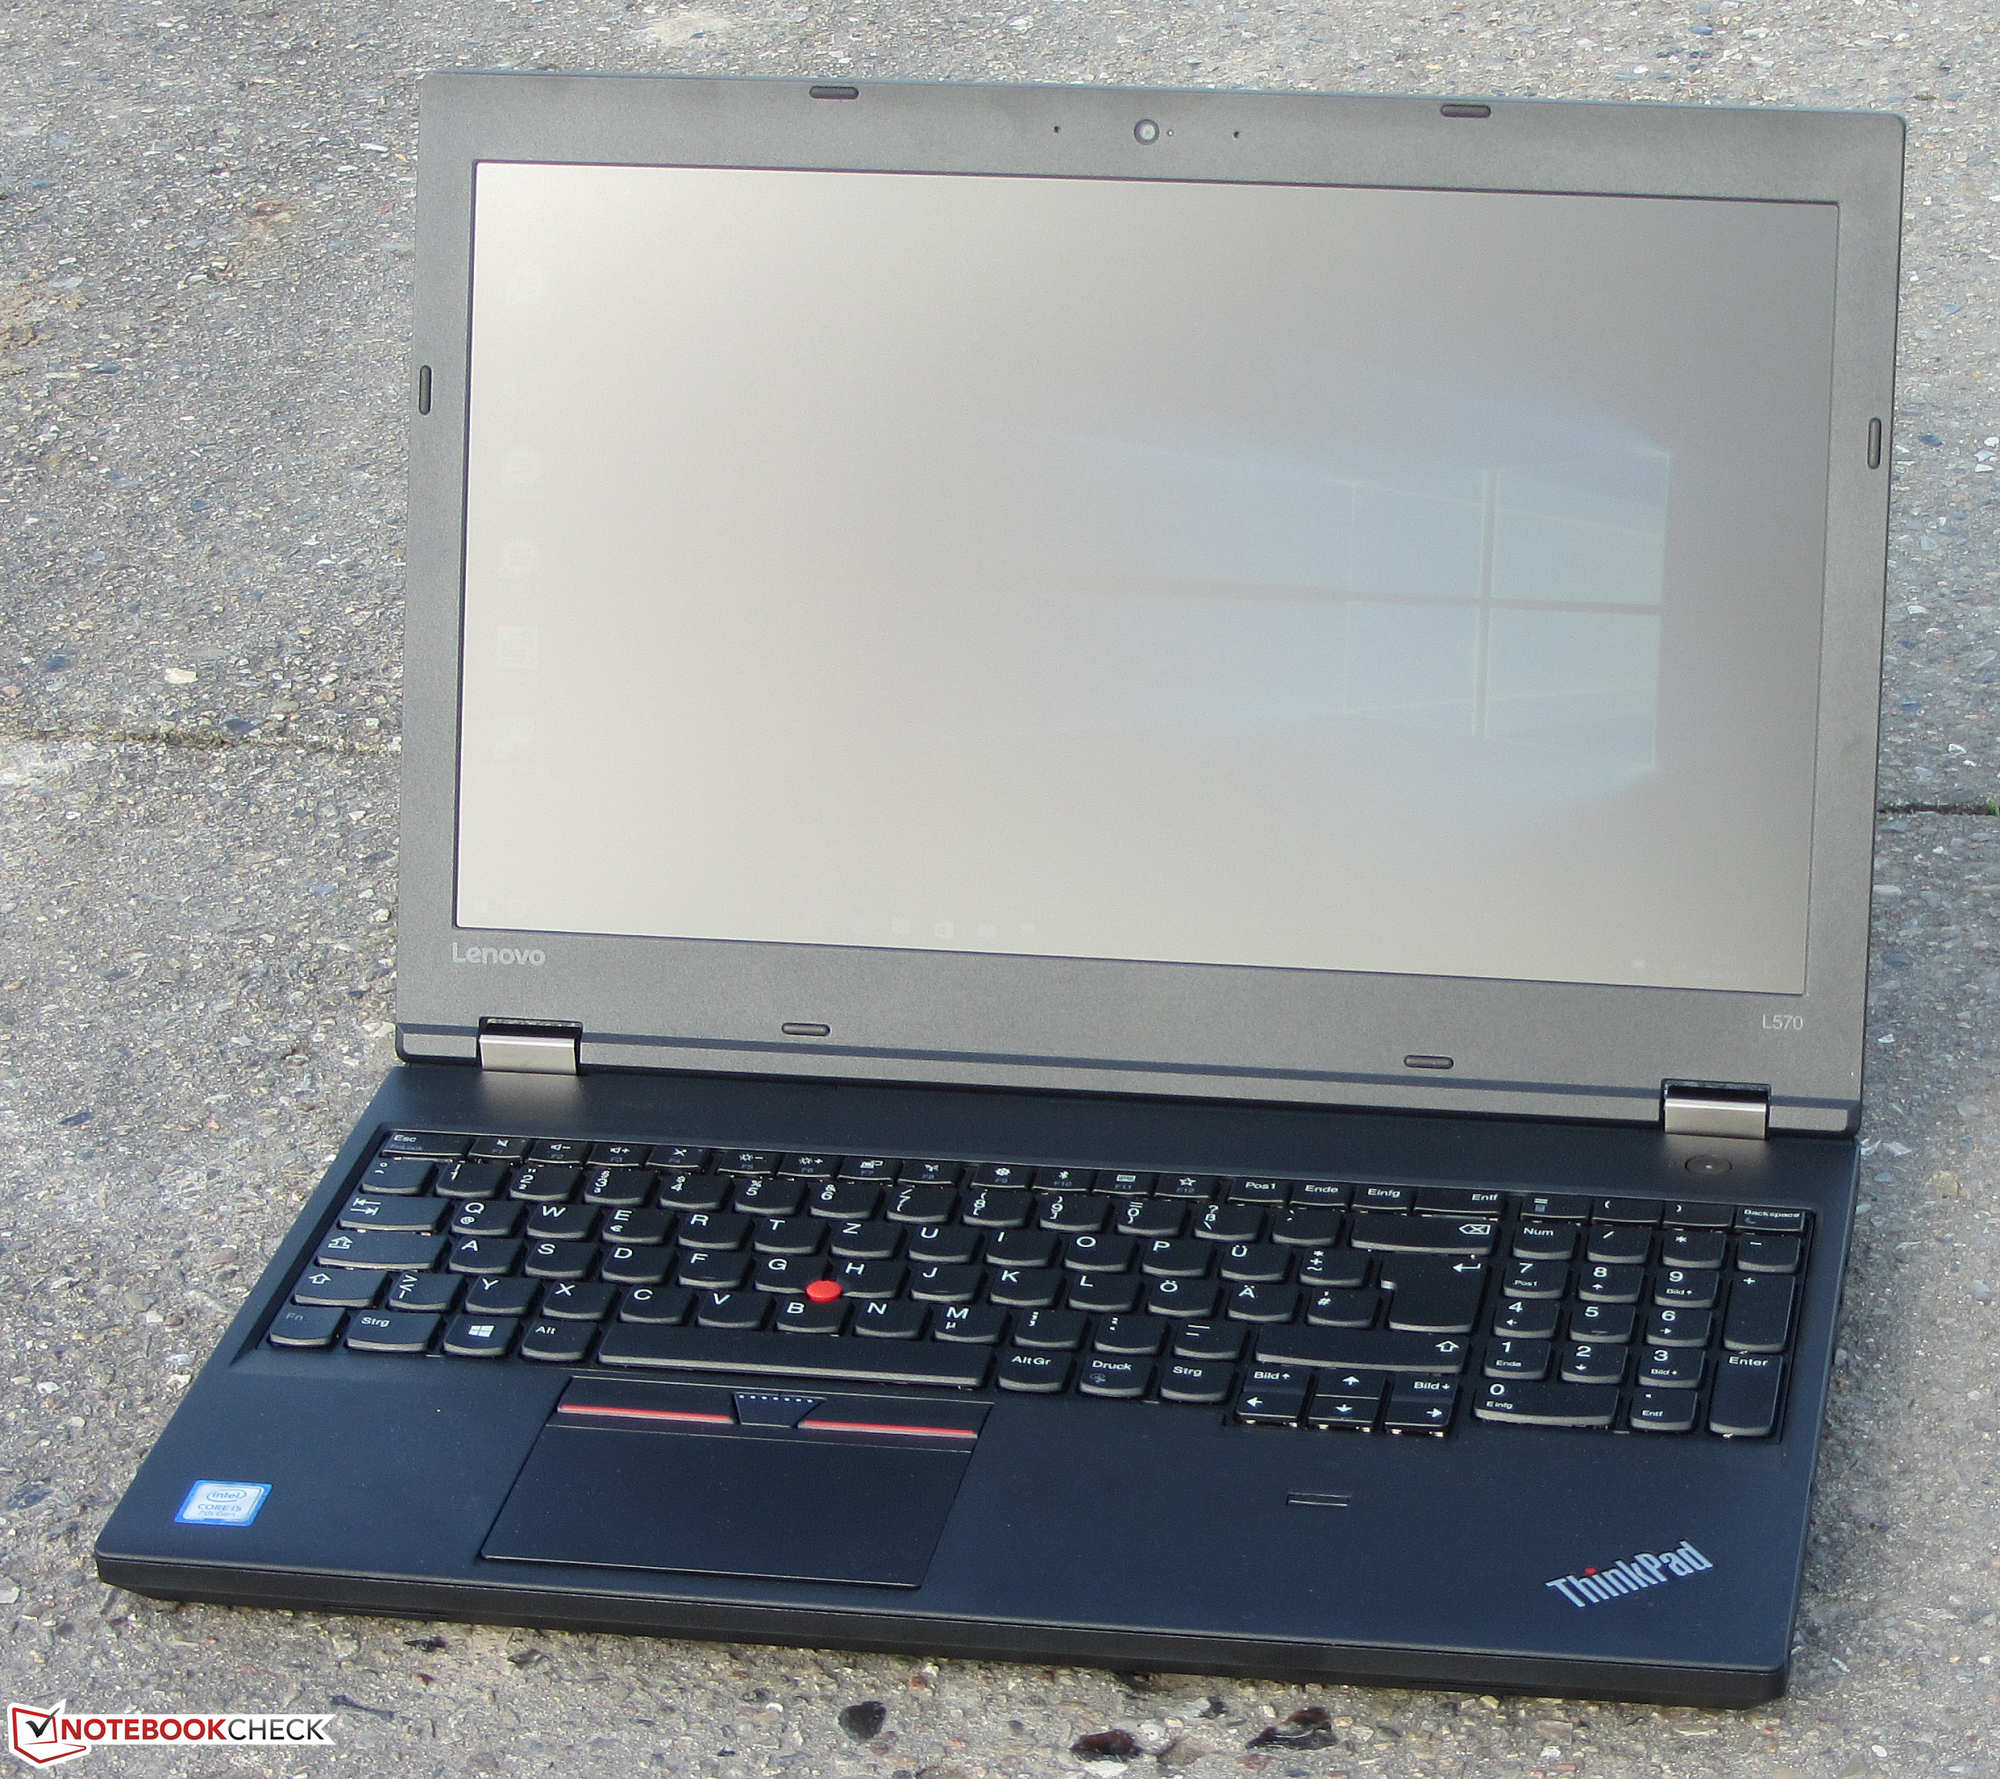
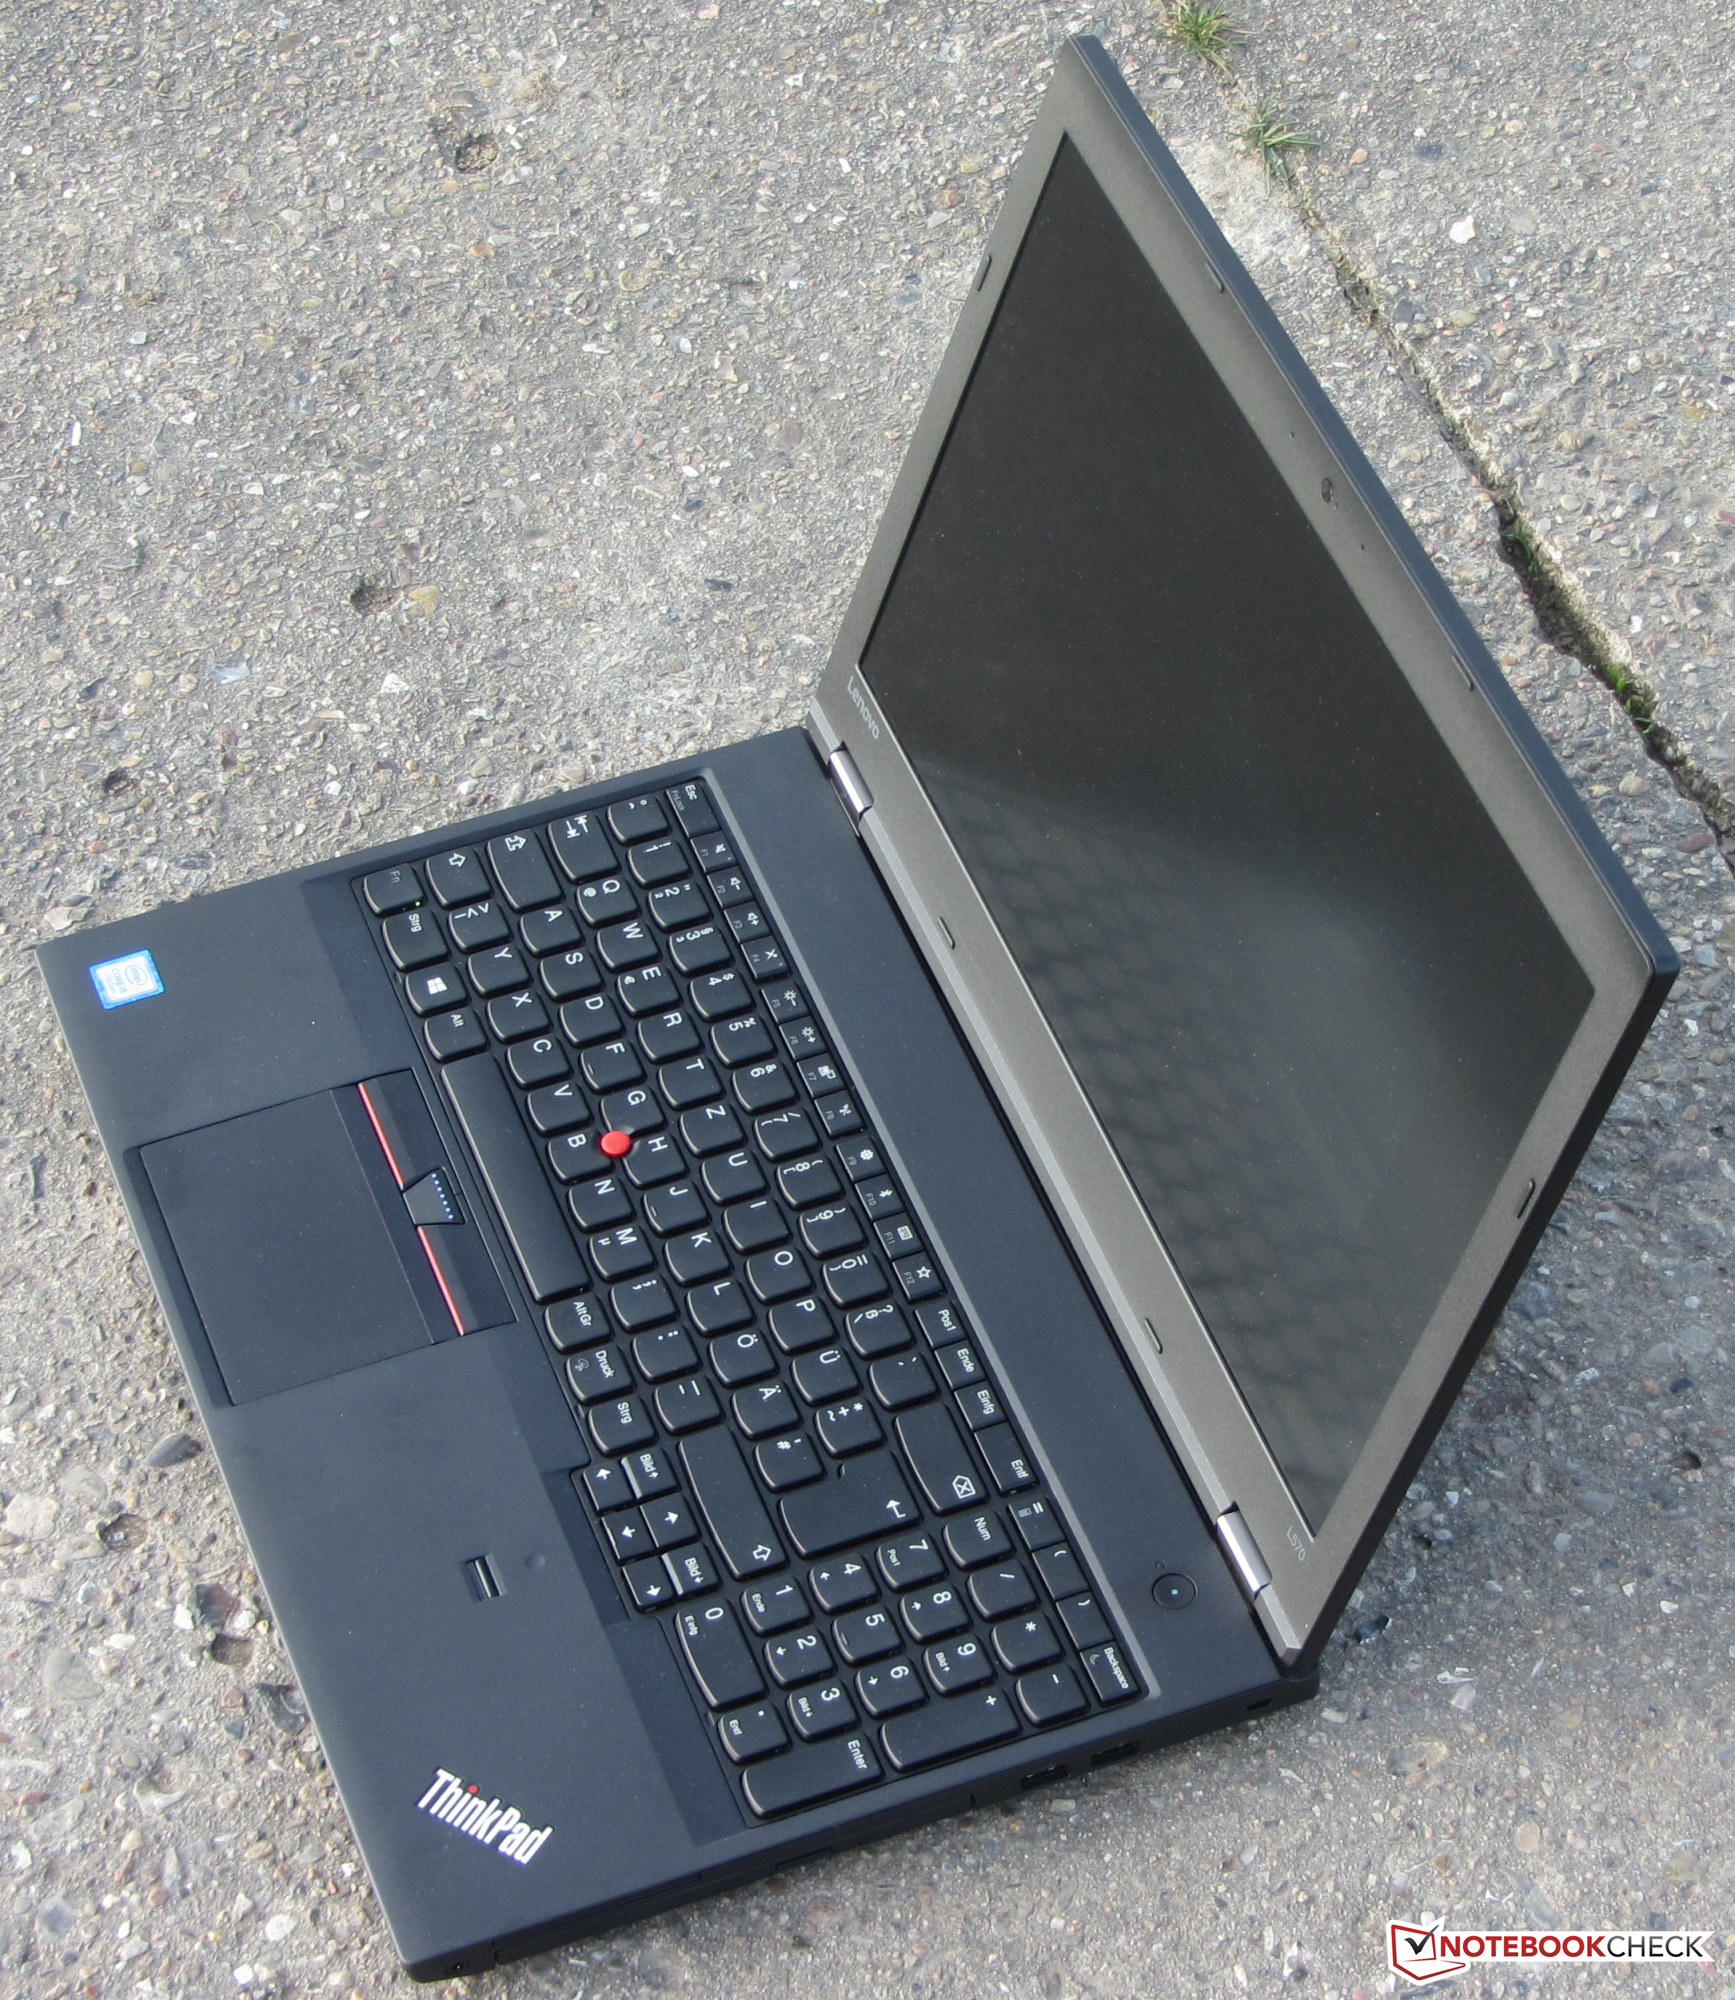
No se han hecho cambios en la carcasa; tiene la misma que el ThinkPad L560. Lenovo podría haber hecho un poco más en este aspecto. La carcasa no es la más estable del mundo. Como herramienta de trabajo, el ThinkPad debería ofrecer más. Después de todo, se puede dar por supuesto que el dispositivo se usara en movilidad. El teclado, el clickpad y el trackpoint son de alta calidad, como suele ocurrir con los dispositivos de Lenovo. Aunque hemos echado en falta retroiluminación en el teclado, un fallo que ya ocurría en su antecesor.
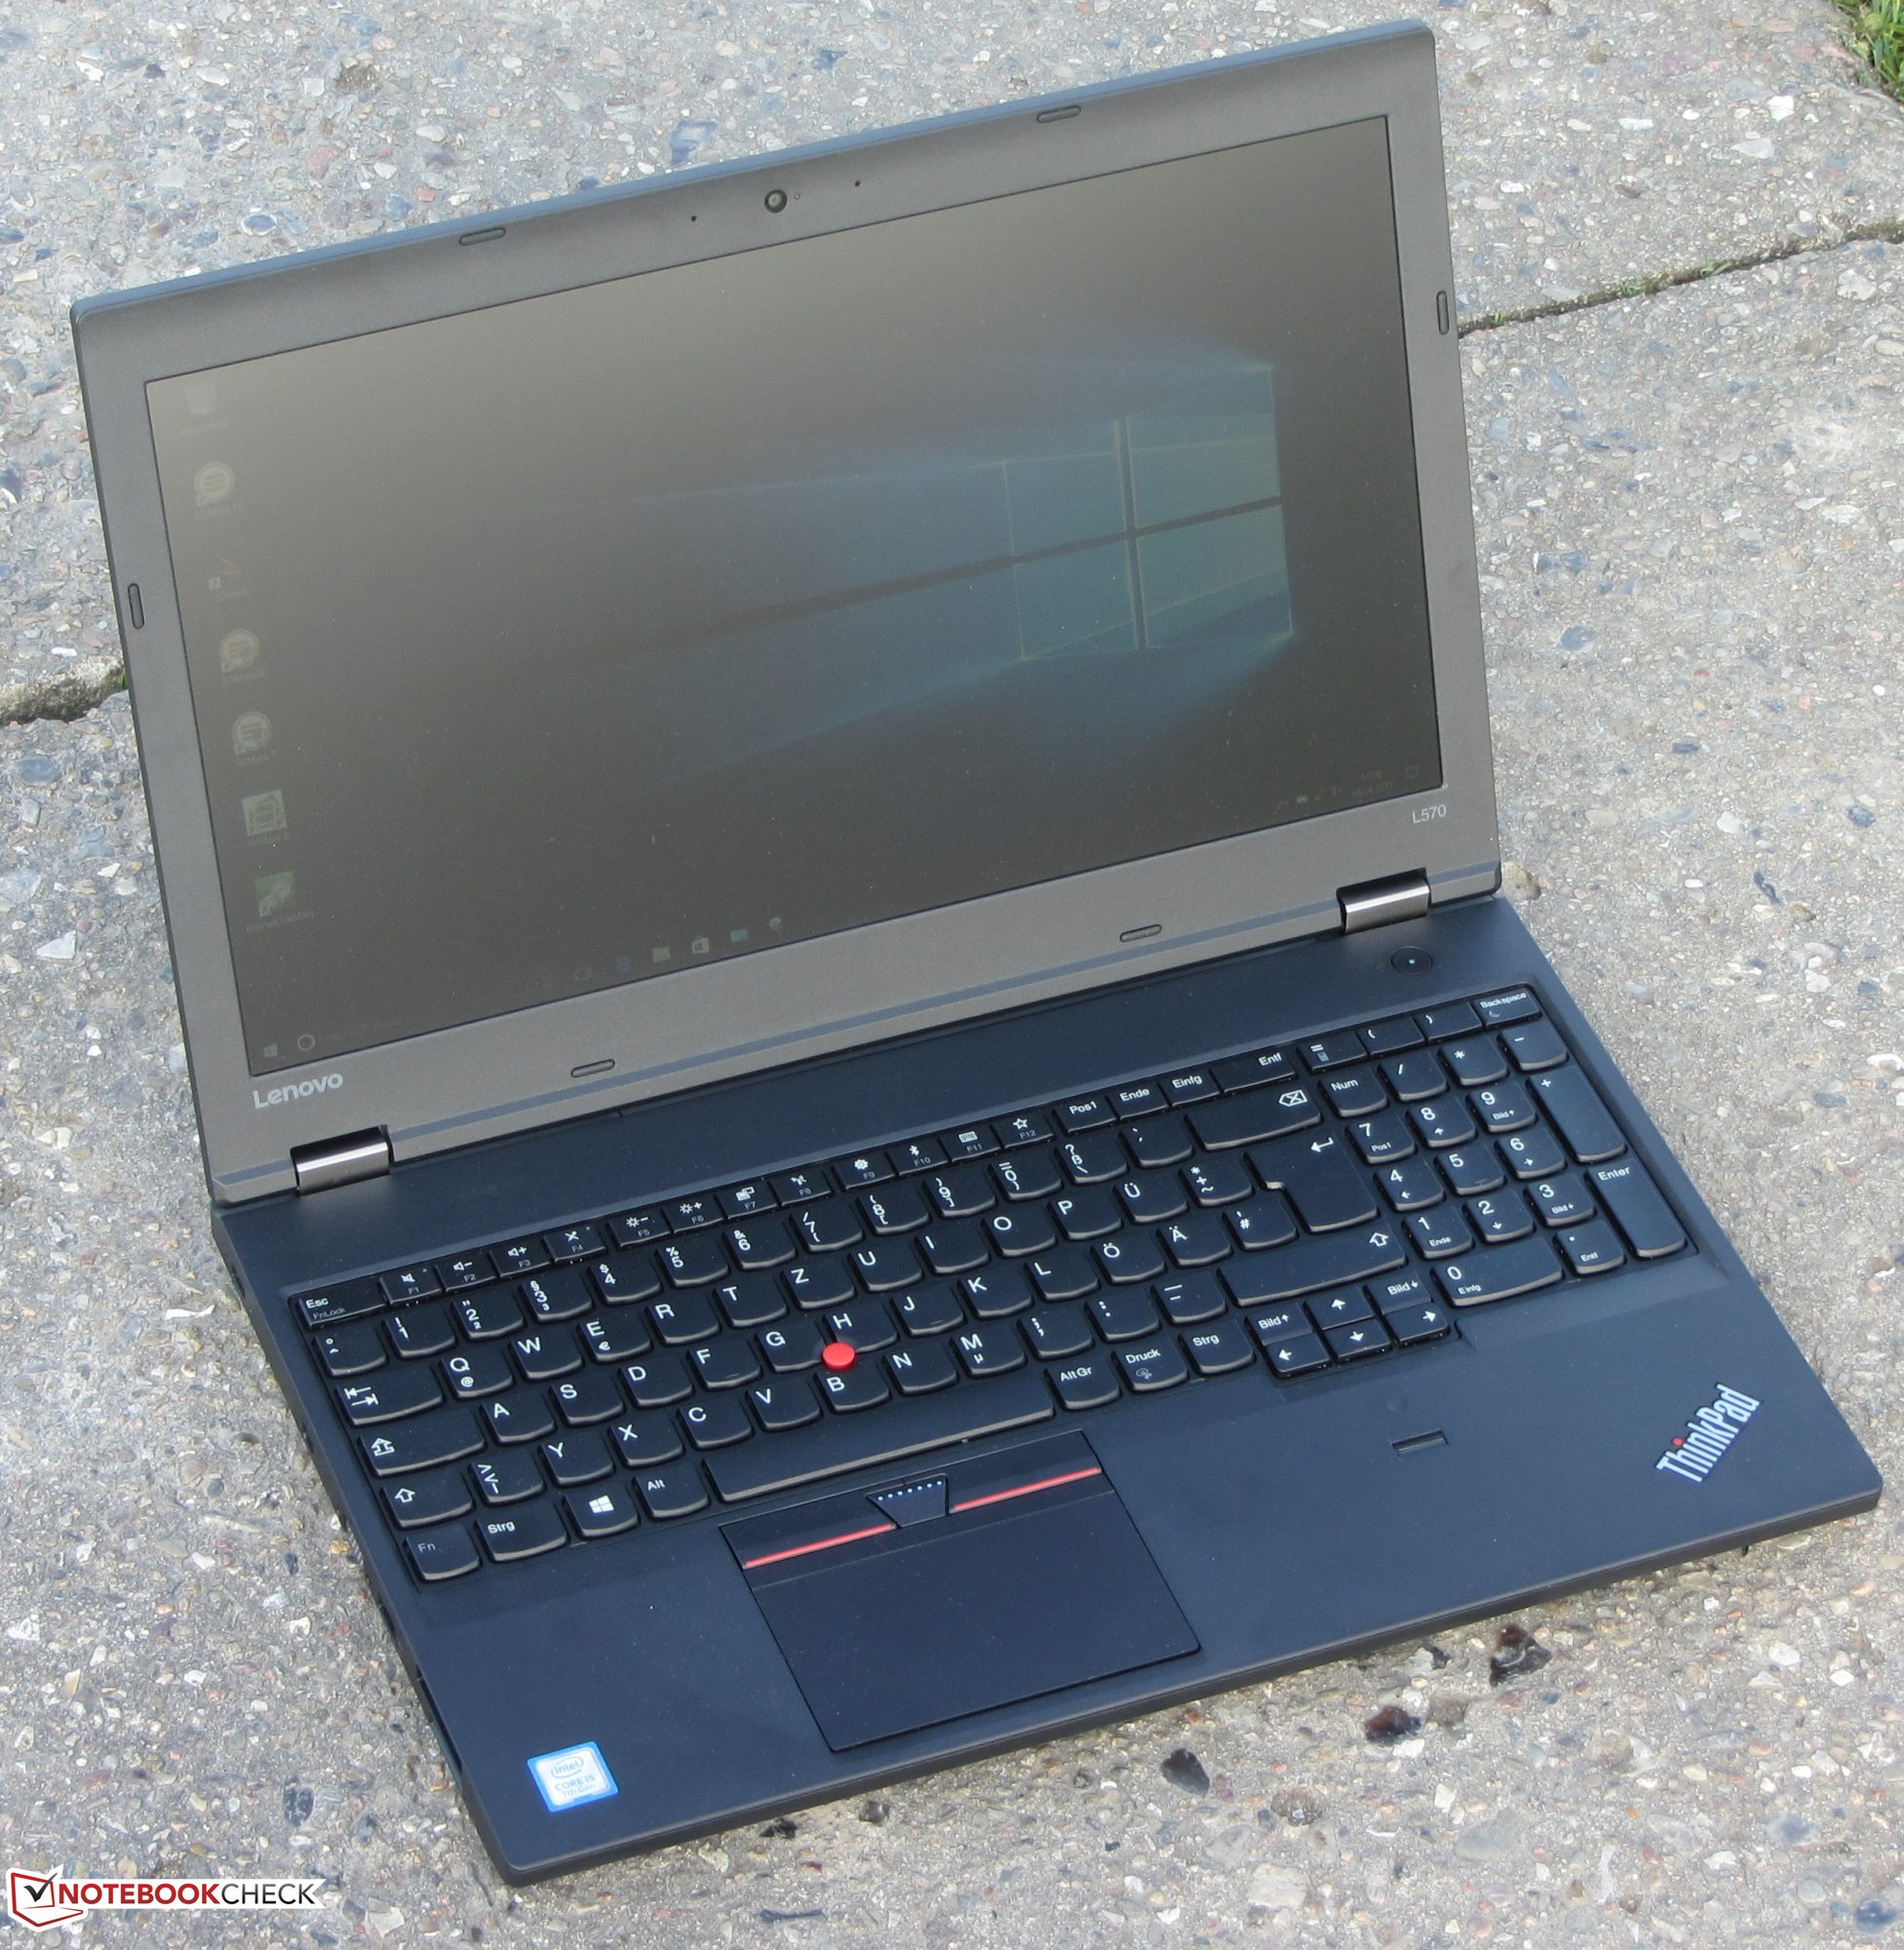
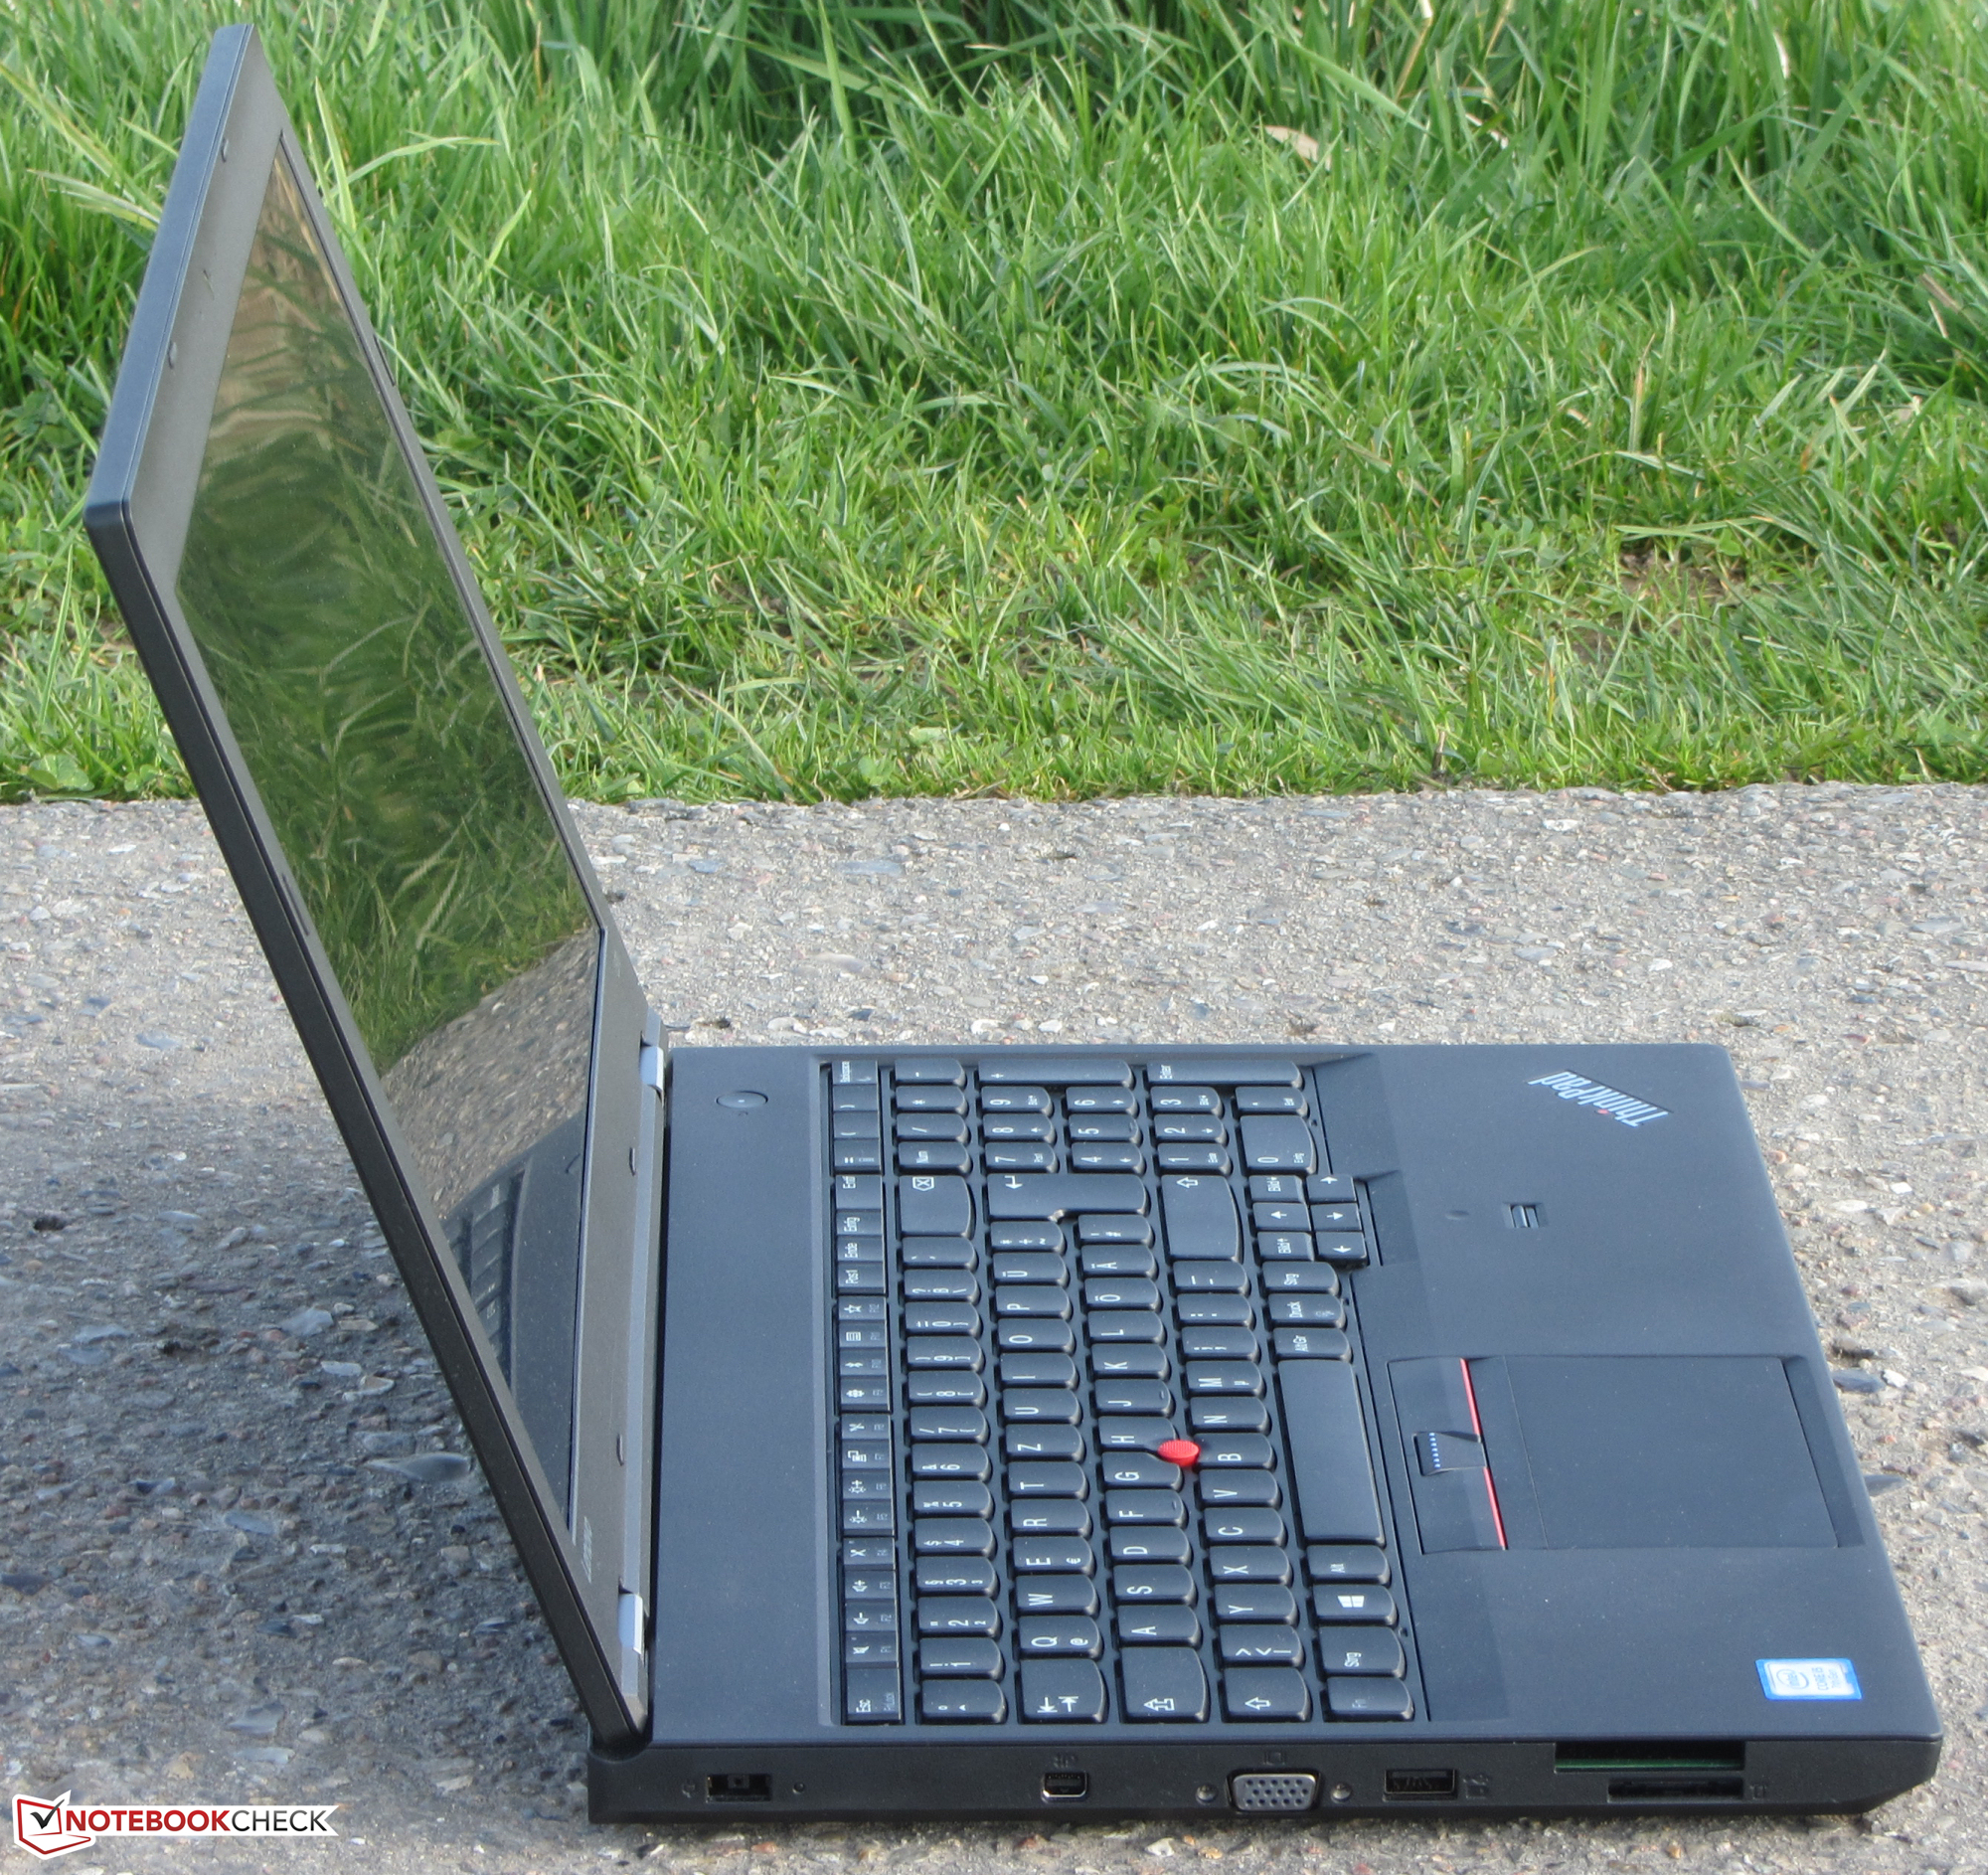
El ThinkPad presenta una pantalla full HD con buenos ángulos de visualización y una superficie mate. El brillo y el contraste están en la media, pero son muy bajos para un portátil de este precio.
Ésta es una versión acortada del análisis original. Puedes leer el análisis completo en inglés aquí.
Lenovo Thinkpad L570 20J9S01600
- 04/14/2017 v6 (old)
Sascha Mölck