Latitude 5320 en revisión: Dell estropea el reemplazo del ratón

La serie Latitude 5000 de Dell está representada por portátiles empresariales de gama media. El nuevo vástago se llama Latitude 5320, es el sucesor del Latitude 5310 y casi no ha cambiado externamente en comparación con el predecesor. Dell sustituye principalmente los procesadores Comet Lake por los modelos Tiger Lake. Sin embargo, también hay cambios significativos en la conectividad, incluyendo la aparición de Thunderbolt 4. Sin embargo, algunas rebajas no gustarán a todos los compradores. Palabras clave: clickpad y memoria de trabajo.
El campo de competidores entre 800 y algo más de 1000 euros es grande. Los ThinkPads de Lenovo de la serie L son los principales competidores para el Latitude con equipos empresariales. Los ThinkBooks no ofrecen tanta conectividad pero podrían ser una alternativa para los clientes con presupuesto debido a sus precios más bajos. ¿Puede el Latitude 5320 mantenerse en esta dura competencia? Nuestra prueba ofrece la respuesta.
Posibles contendientes en la comparación
Valoración | Fecha | Modelo | Peso | Altura | Tamaño | Resolución | Precio |
|---|---|---|---|---|---|---|---|
| 84.1 % v7 (old) | 03/2022 | Dell Latitude 5320-TM4V2 i5-1135G7, Iris Xe G7 80EUs | 1.3 kg | 17 mm | 13.30" | 1920x1080 | |
| 87.2 % v7 (old) | 01/2021 | Dell Latitude 5310-23VP6 i5-10310U, UHD Graphics 620 | 1.3 kg | 19.7 mm | 13.30" | 1920x1080 | |
| 87.8 % v7 (old) | Lenovo ThinkBook 13s G3 20YA0005GE R7 5800U, Vega 8 | 1.3 kg | 14.9 mm | 13.30" | 1920x1200 | ||
| 87.5 % v7 (old) | 03/2022 | Lenovo ThinkPad L13 Gen2-21AB000PGE R5 PRO 5650U, Vega 7 | 1.4 kg | 17.6 mm | 13.30" | 1920x1080 | |
| 85.6 % v7 (old) | 12/2021 | Lenovo ThinkPad L14 G2-20X1003WGE i5-1135G7, Iris Xe G7 80EUs | 1.7 kg | 19 mm | 14.00" | 1920x1080 | |
| 85.3 % v7 (old) | 01/2022 | Acer TravelMate P4 TMP414-51-59MR i5-1135G7, Iris Xe G7 80EUs | 1.4 kg | 17.9 mm | 14.00" | 1920x1080 | |
| 83.6 % v7 (old) | Lenovo ThinkBook 14 G2 ITL 20VDS02G00 i3-1115G4, UHD Graphics Xe G4 48EUs | 1.5 kg | 17.9 mm | 14.00" | 1920x1080 |
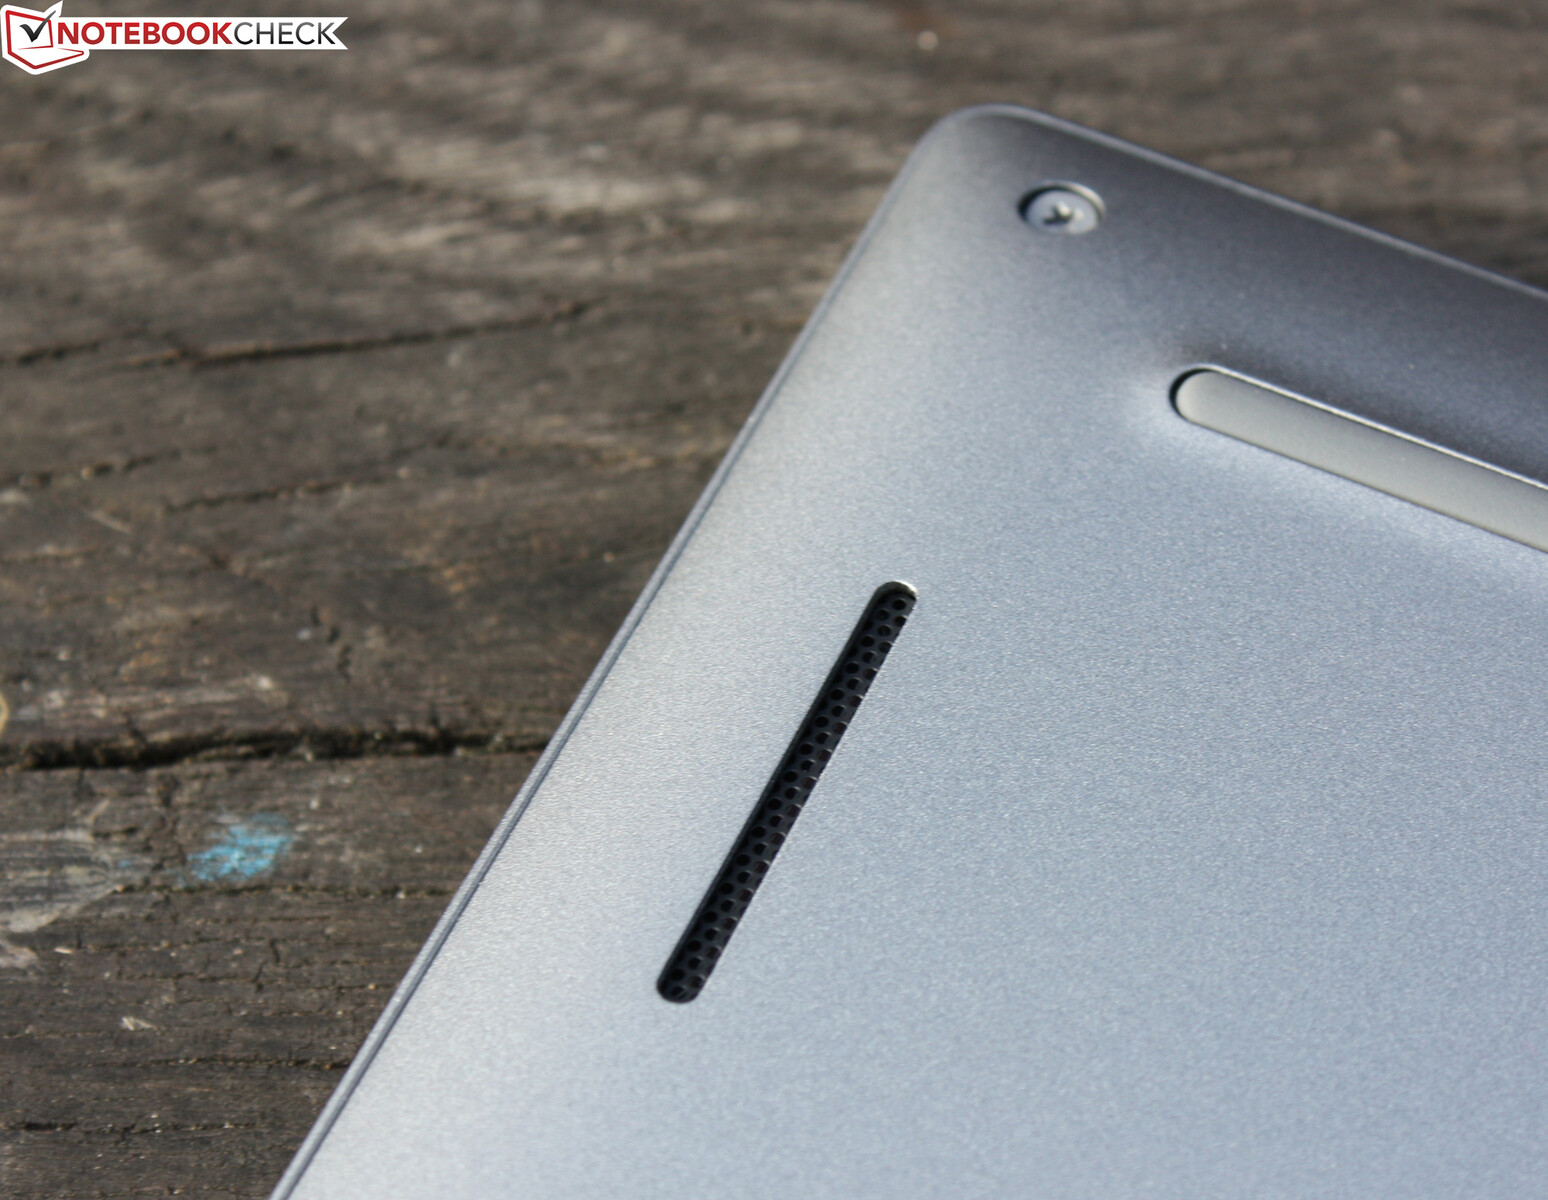
Funda - La funda del portátil podría ser más estable
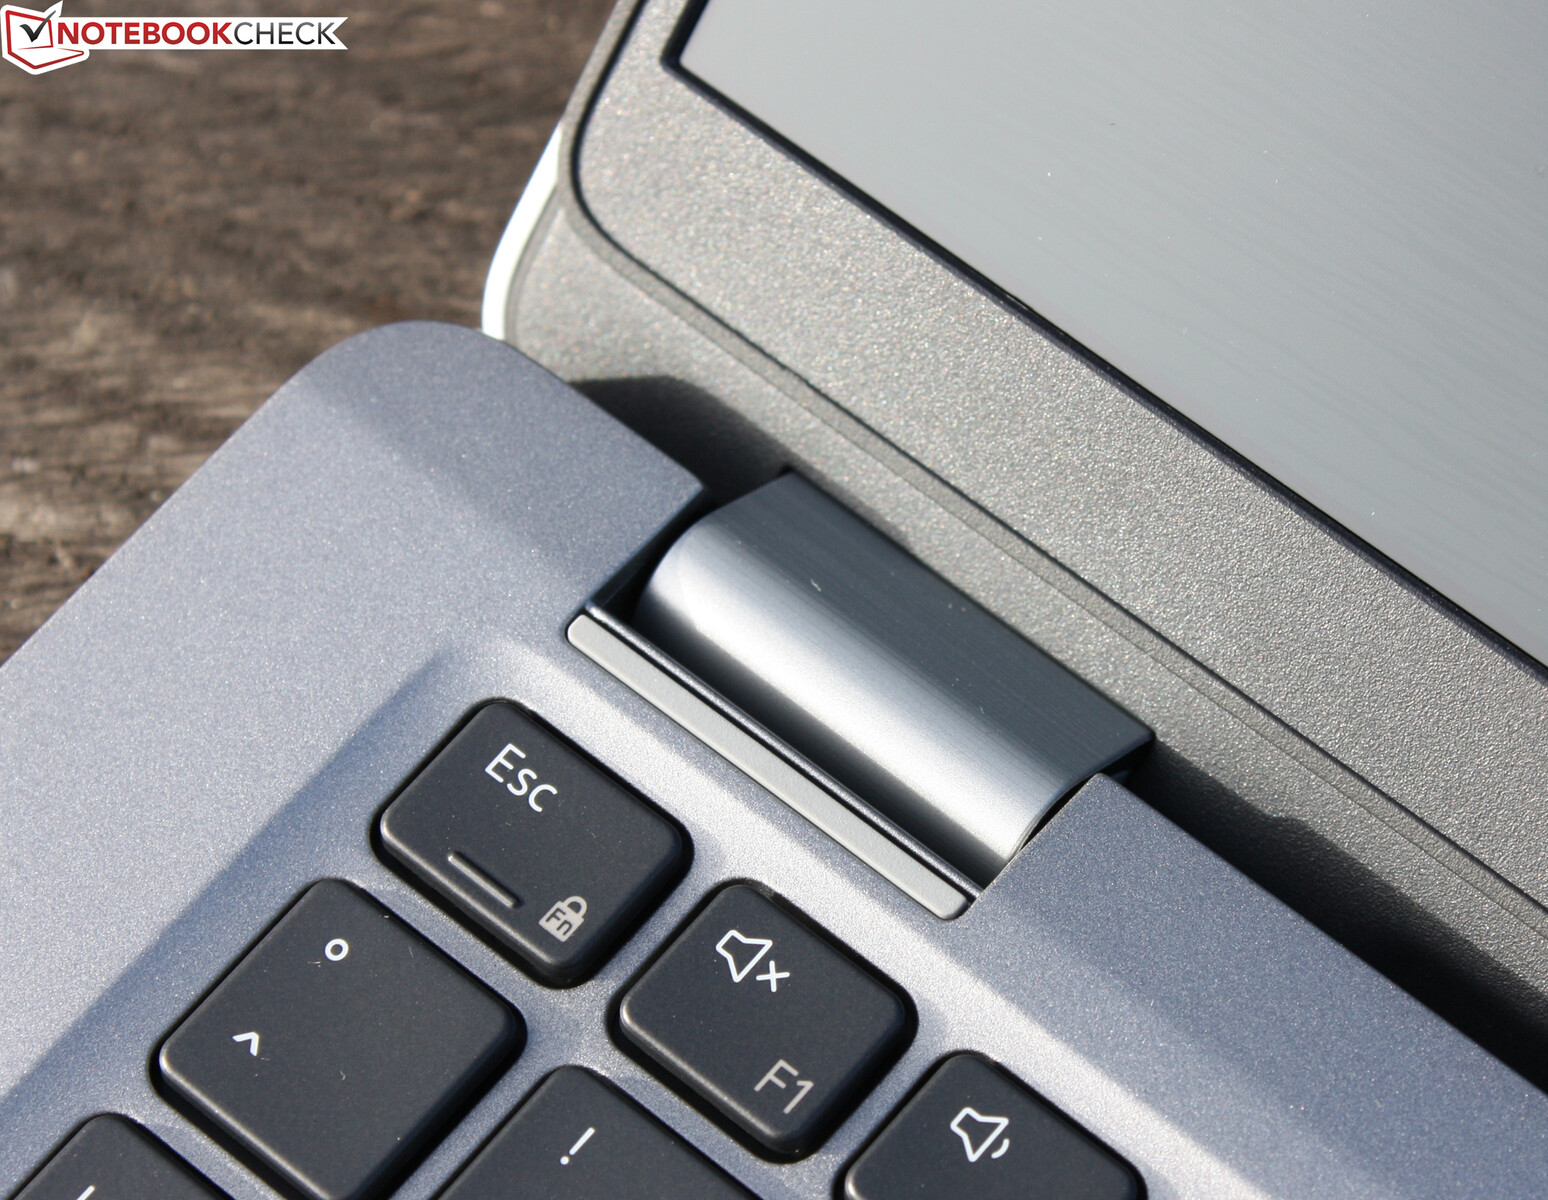
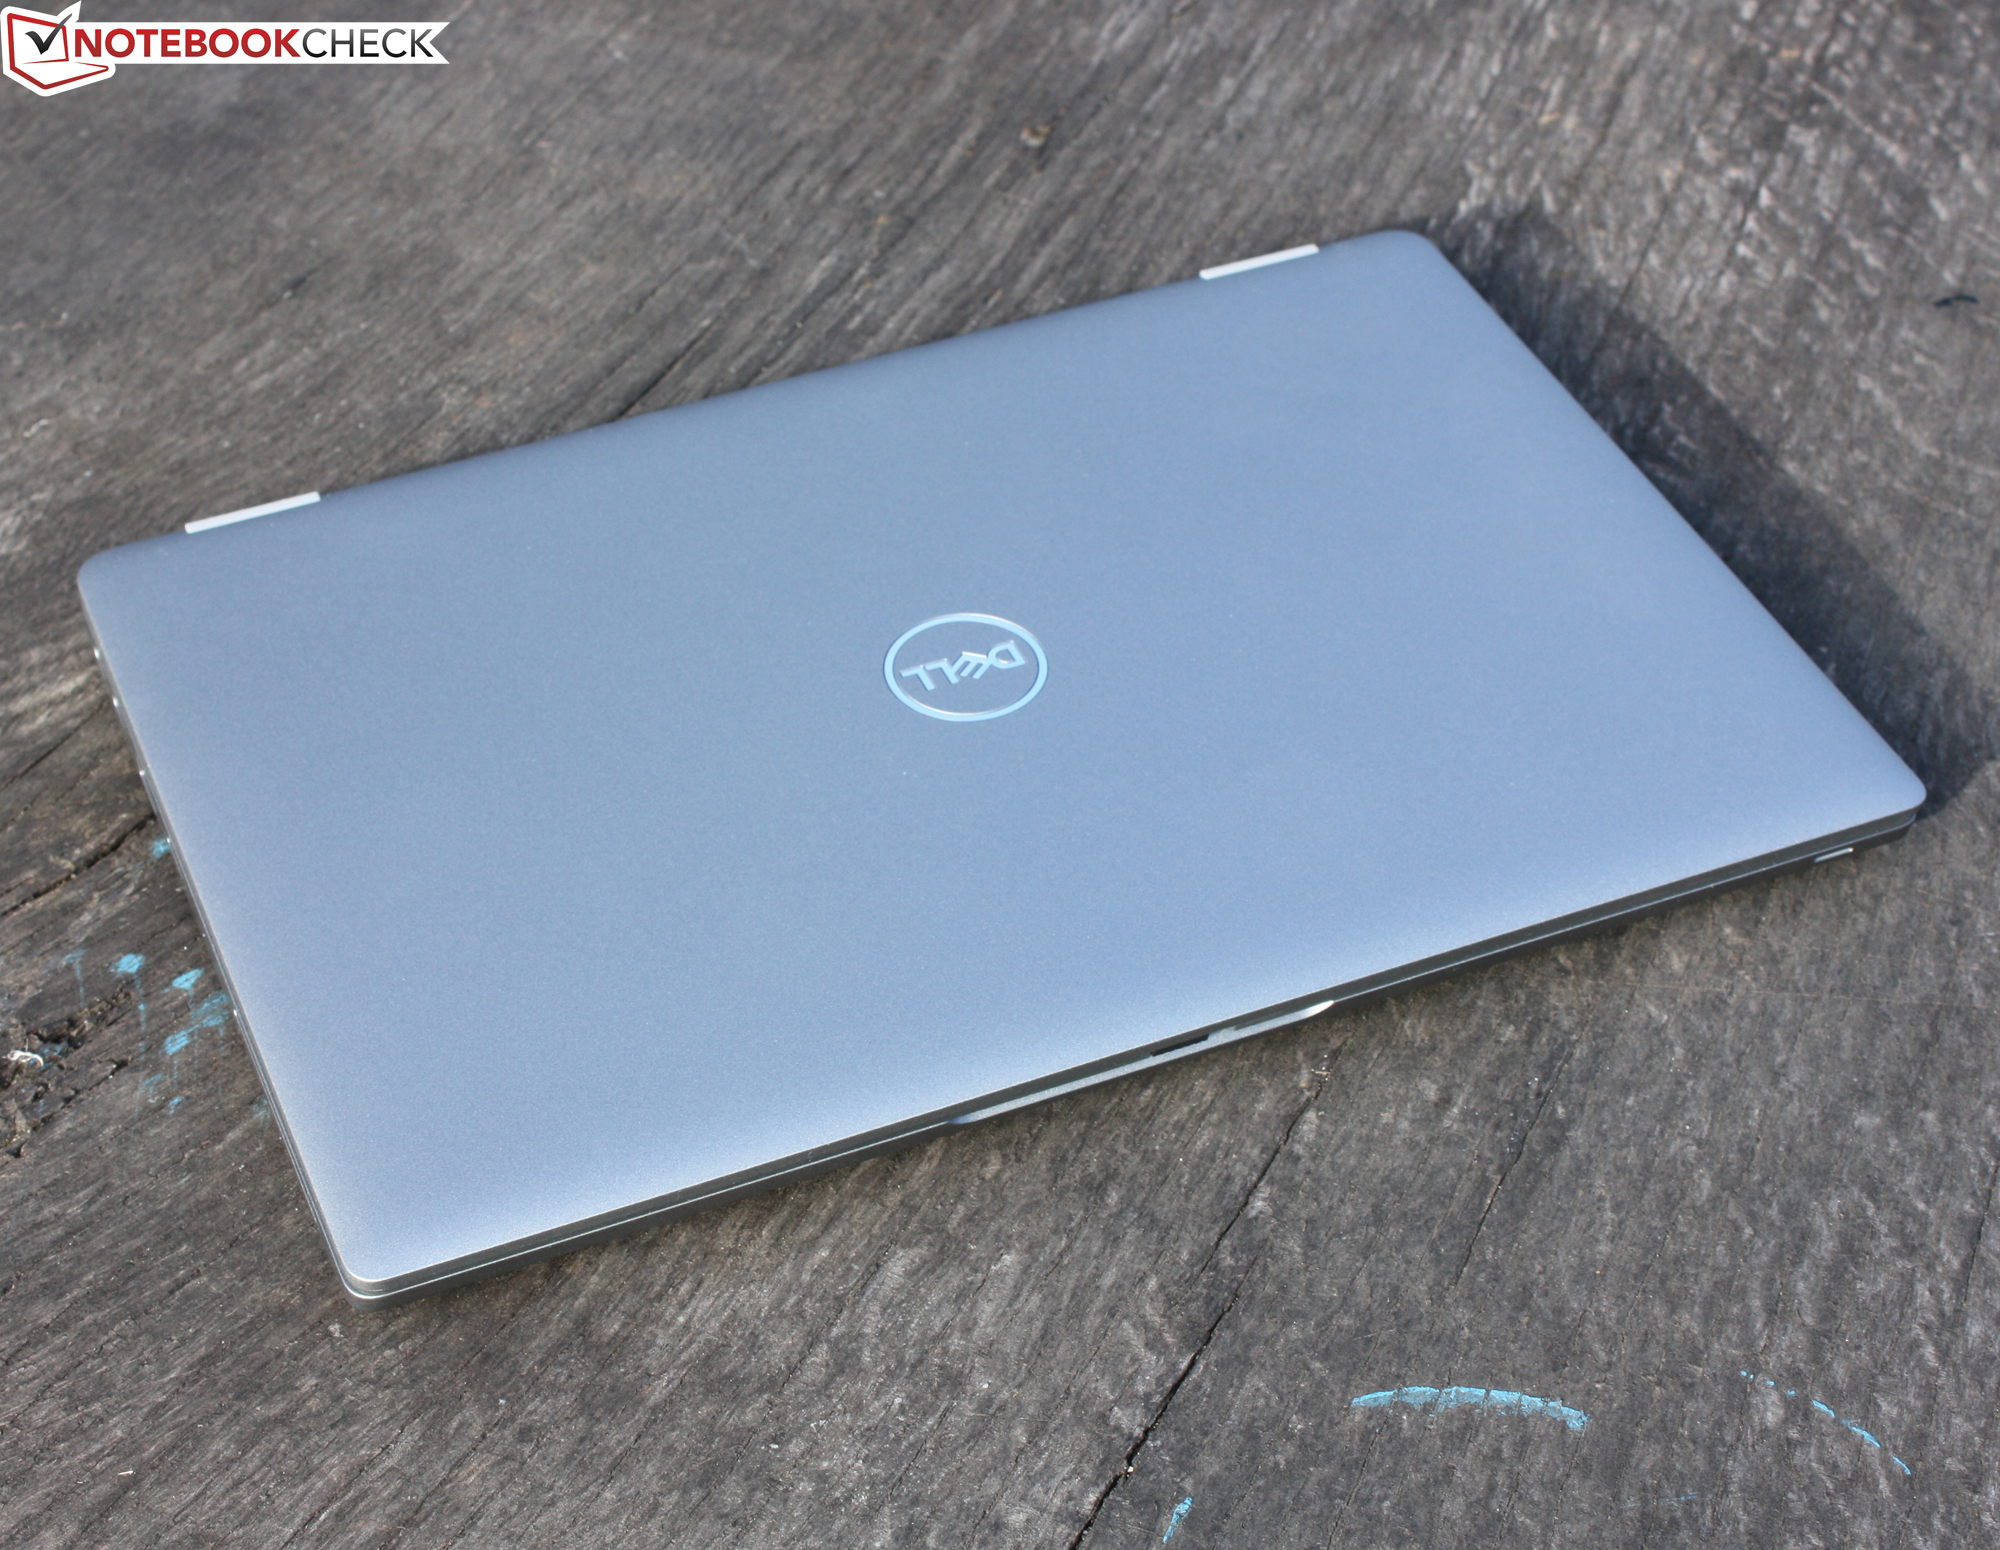
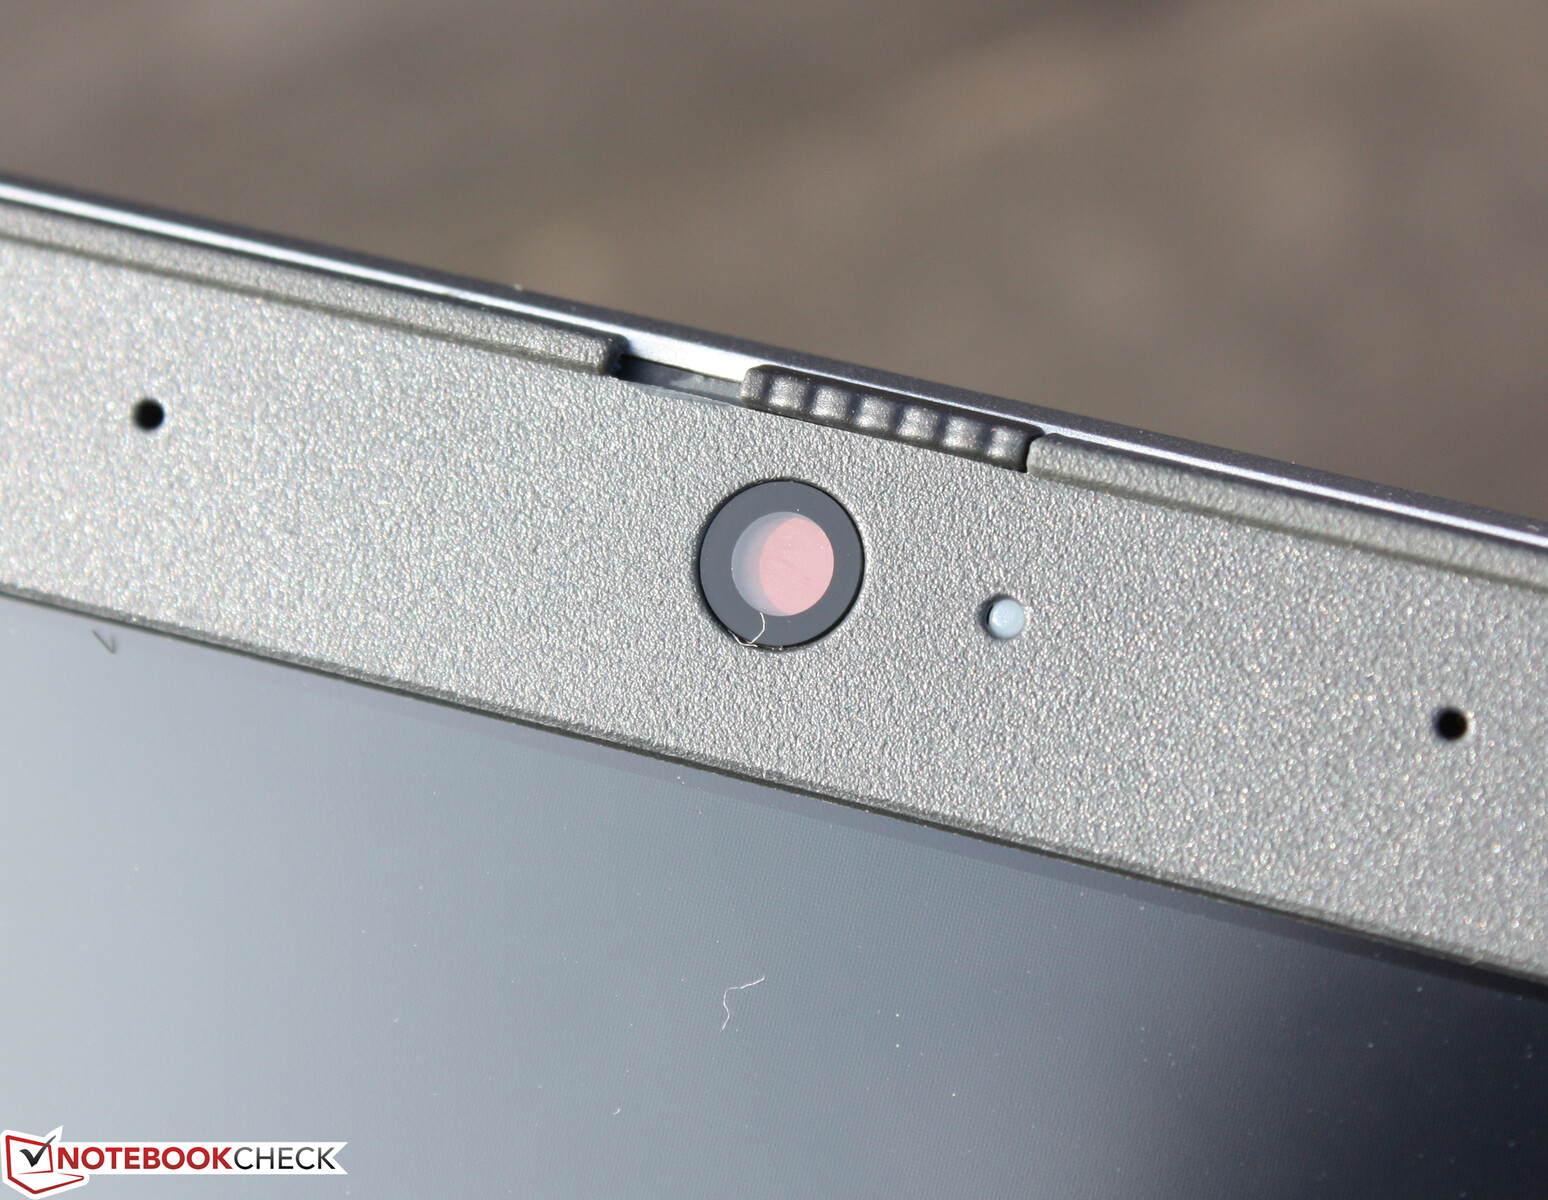
La tecnología del Latitude 5320 se ha introducido en una elegante carcasa metálica sin florituras. El chasis gris plateado y su lenguaje de diseño son idénticos a los de su predecesor. Sin embargo, se han cambiado los puertos y se ha omitido el botón de encendido independiente de la unidad base. El bisel negro de la pantalla es bastante ancho en la parte superior, donde se encuentra la cámara web, resultado de la pantalla panorámica. El borde circunferencial de goma dura alrededor del marco de la pantalla, que se apoya limpiamente en la base, está bien hecho. Esto evita que la arena o la suciedad entren en el hueco durante el transporte.
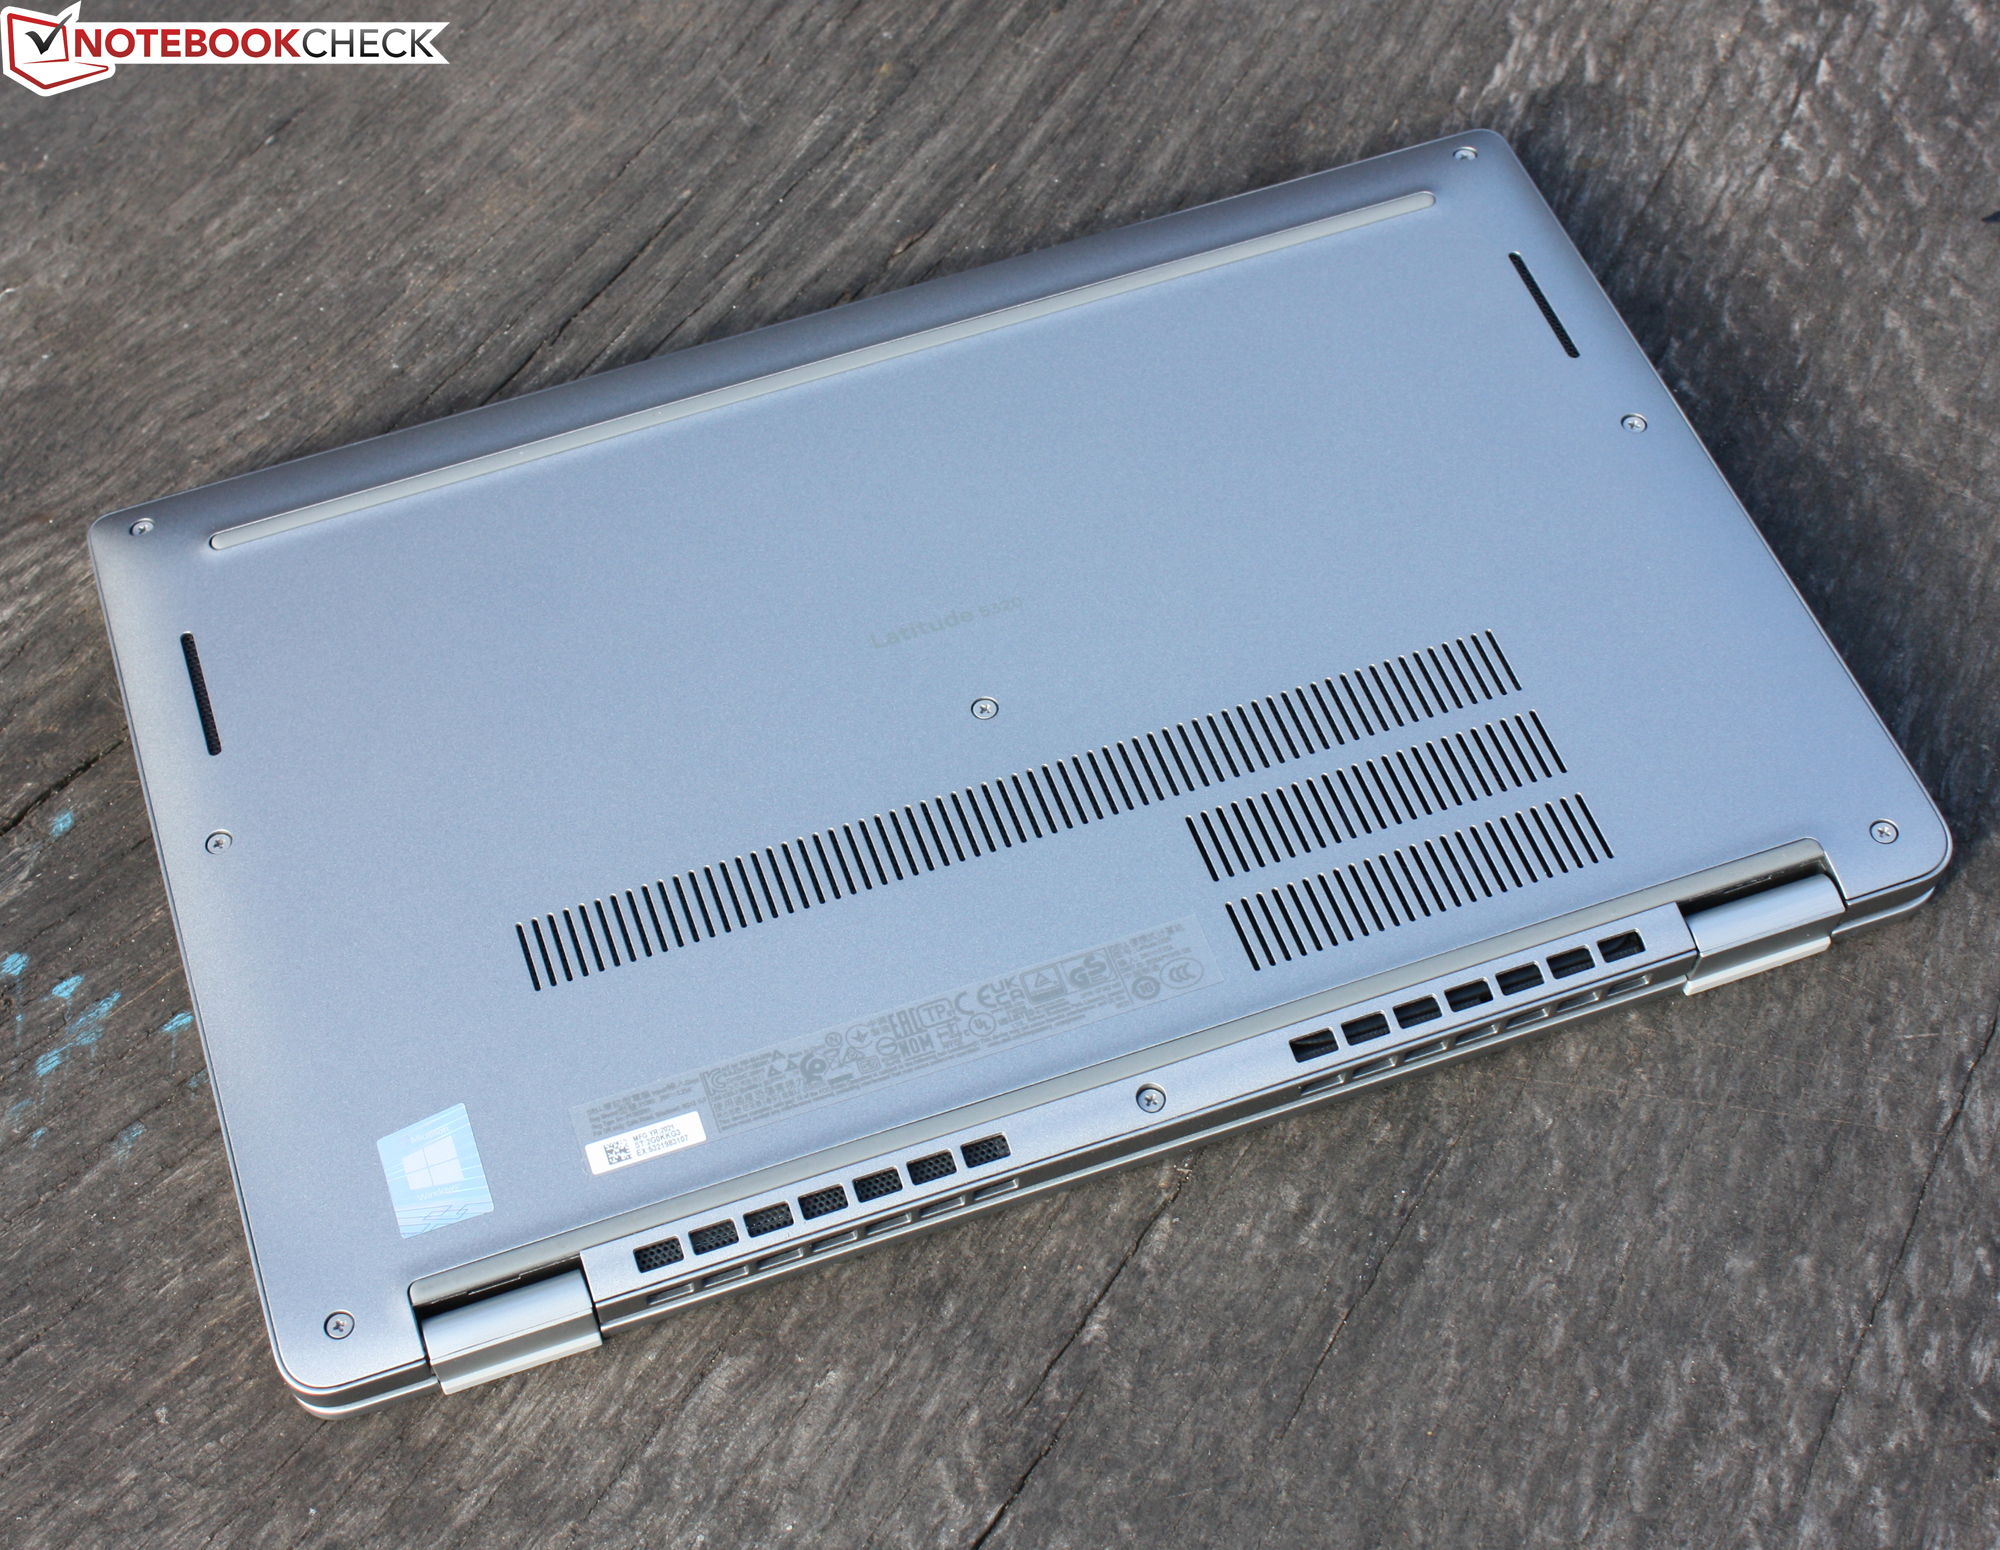
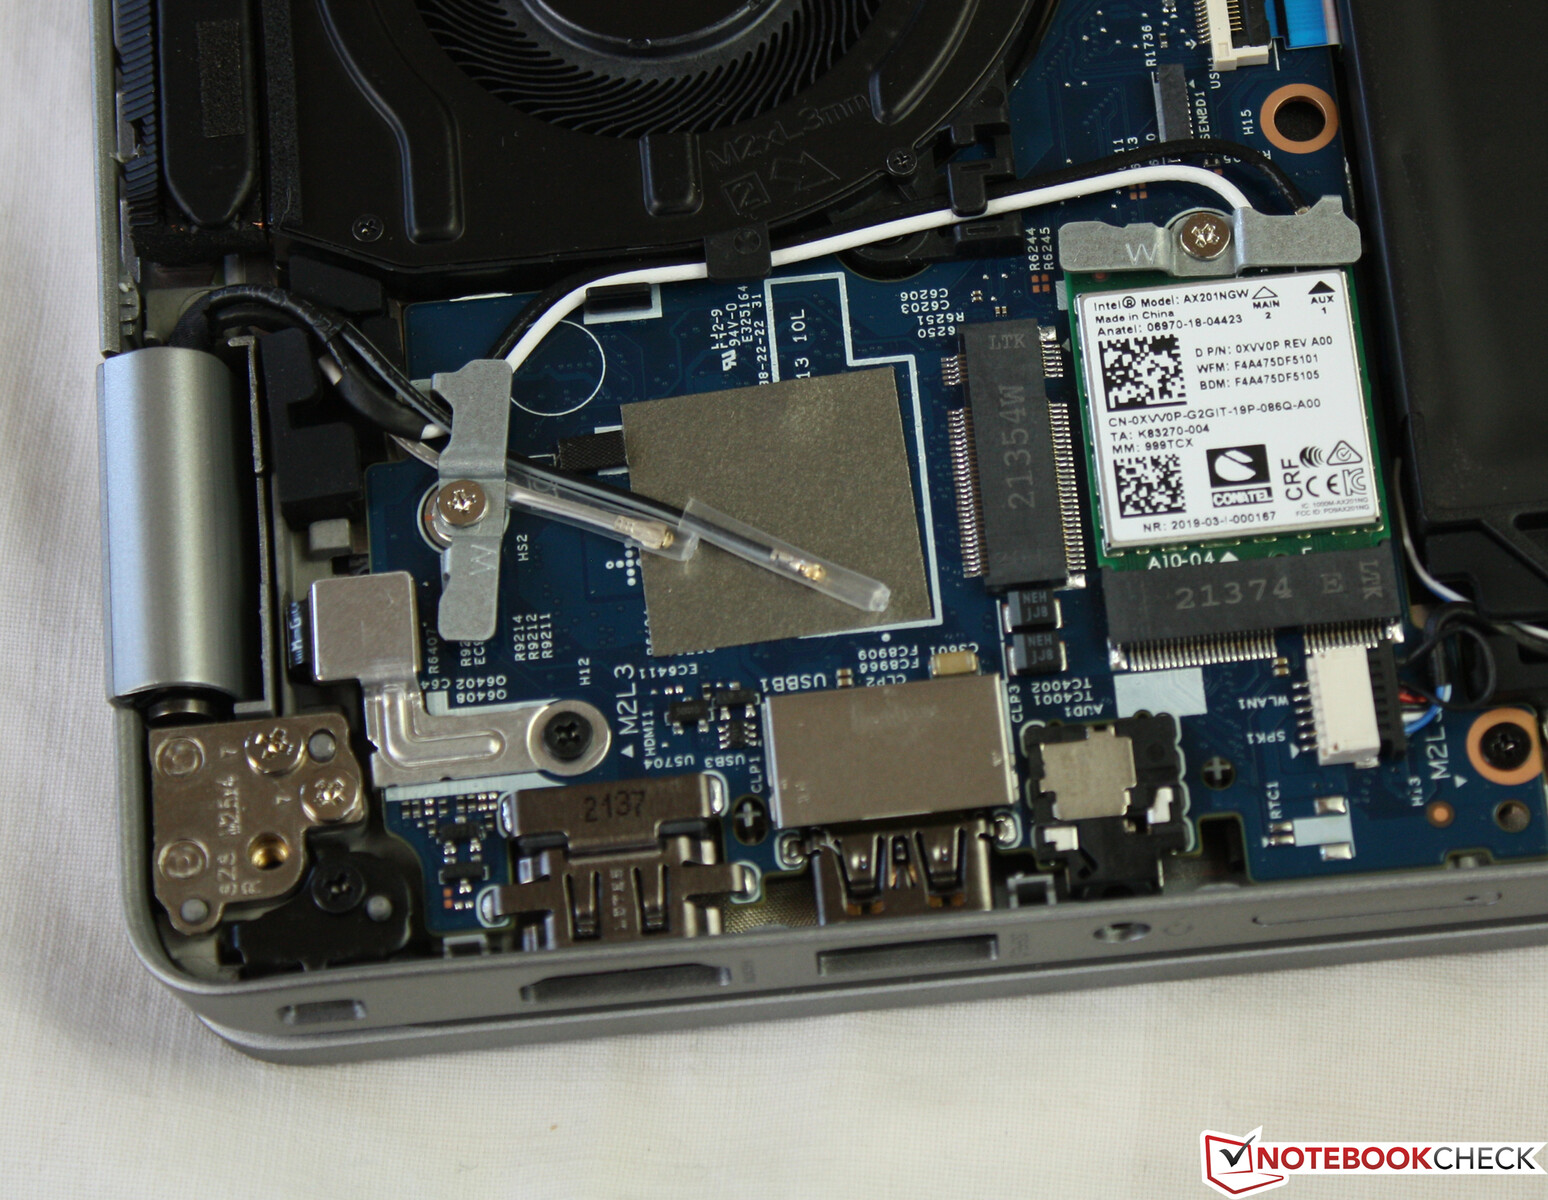
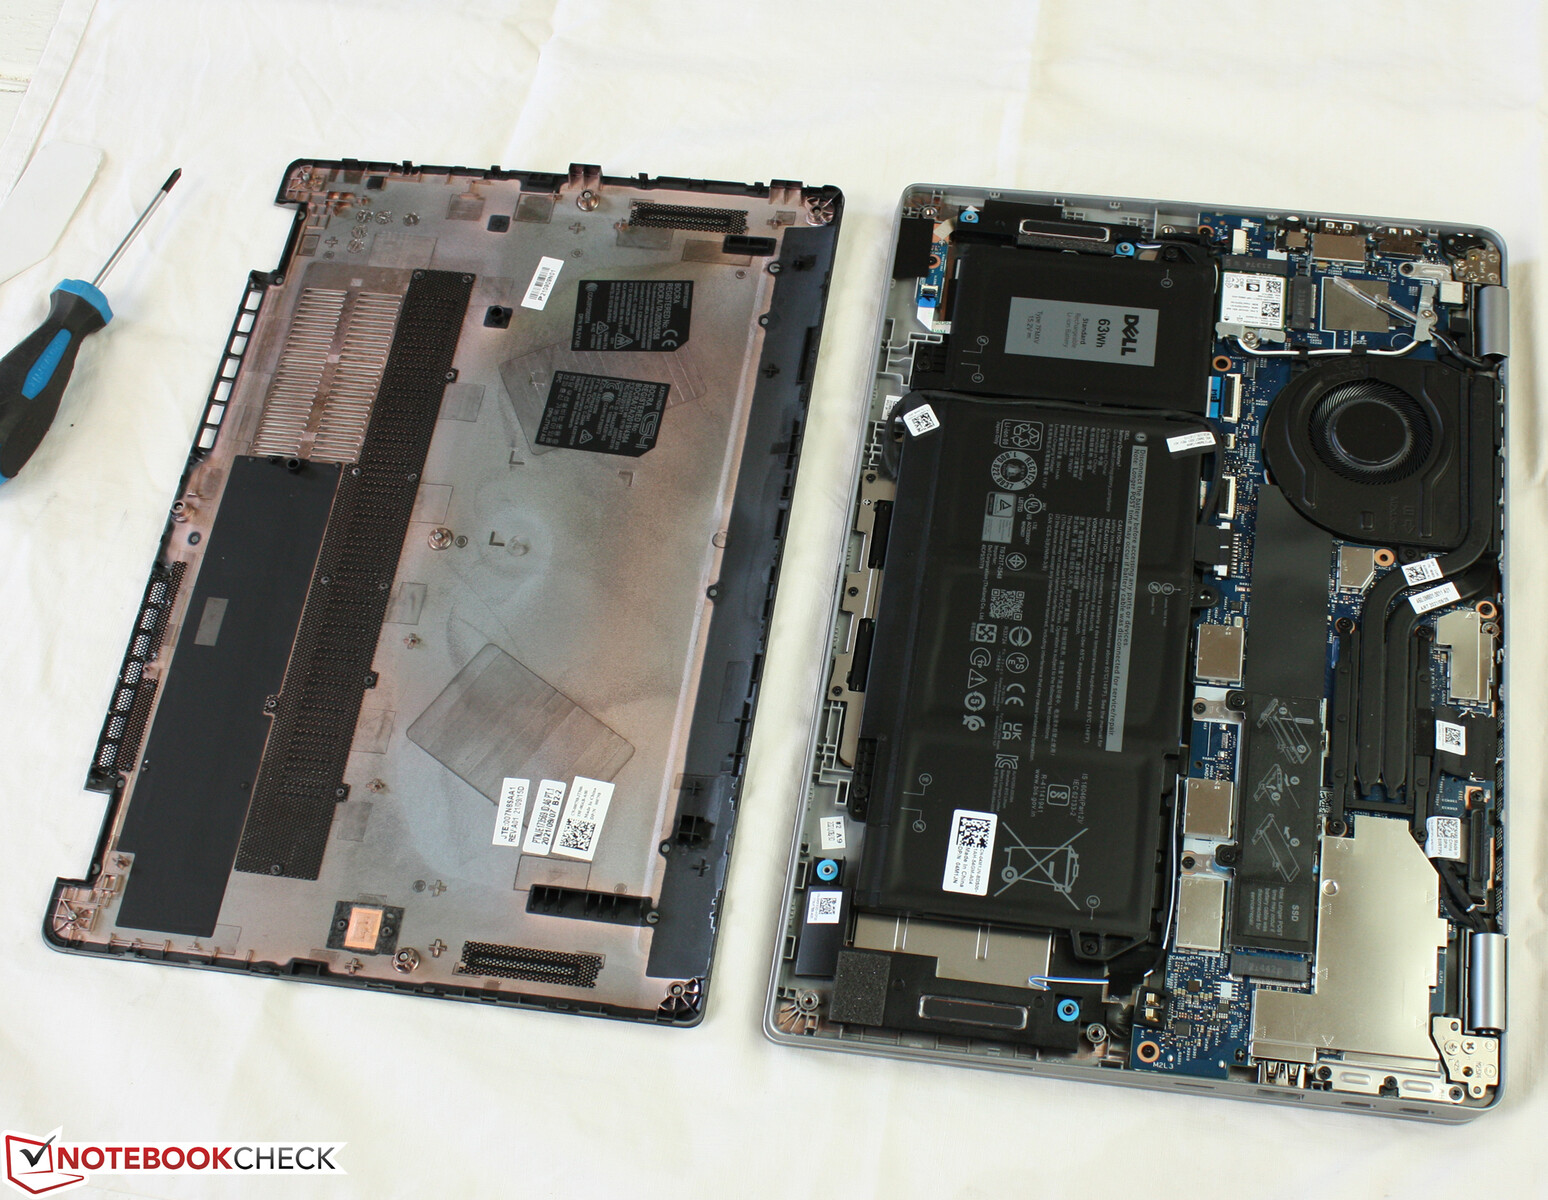
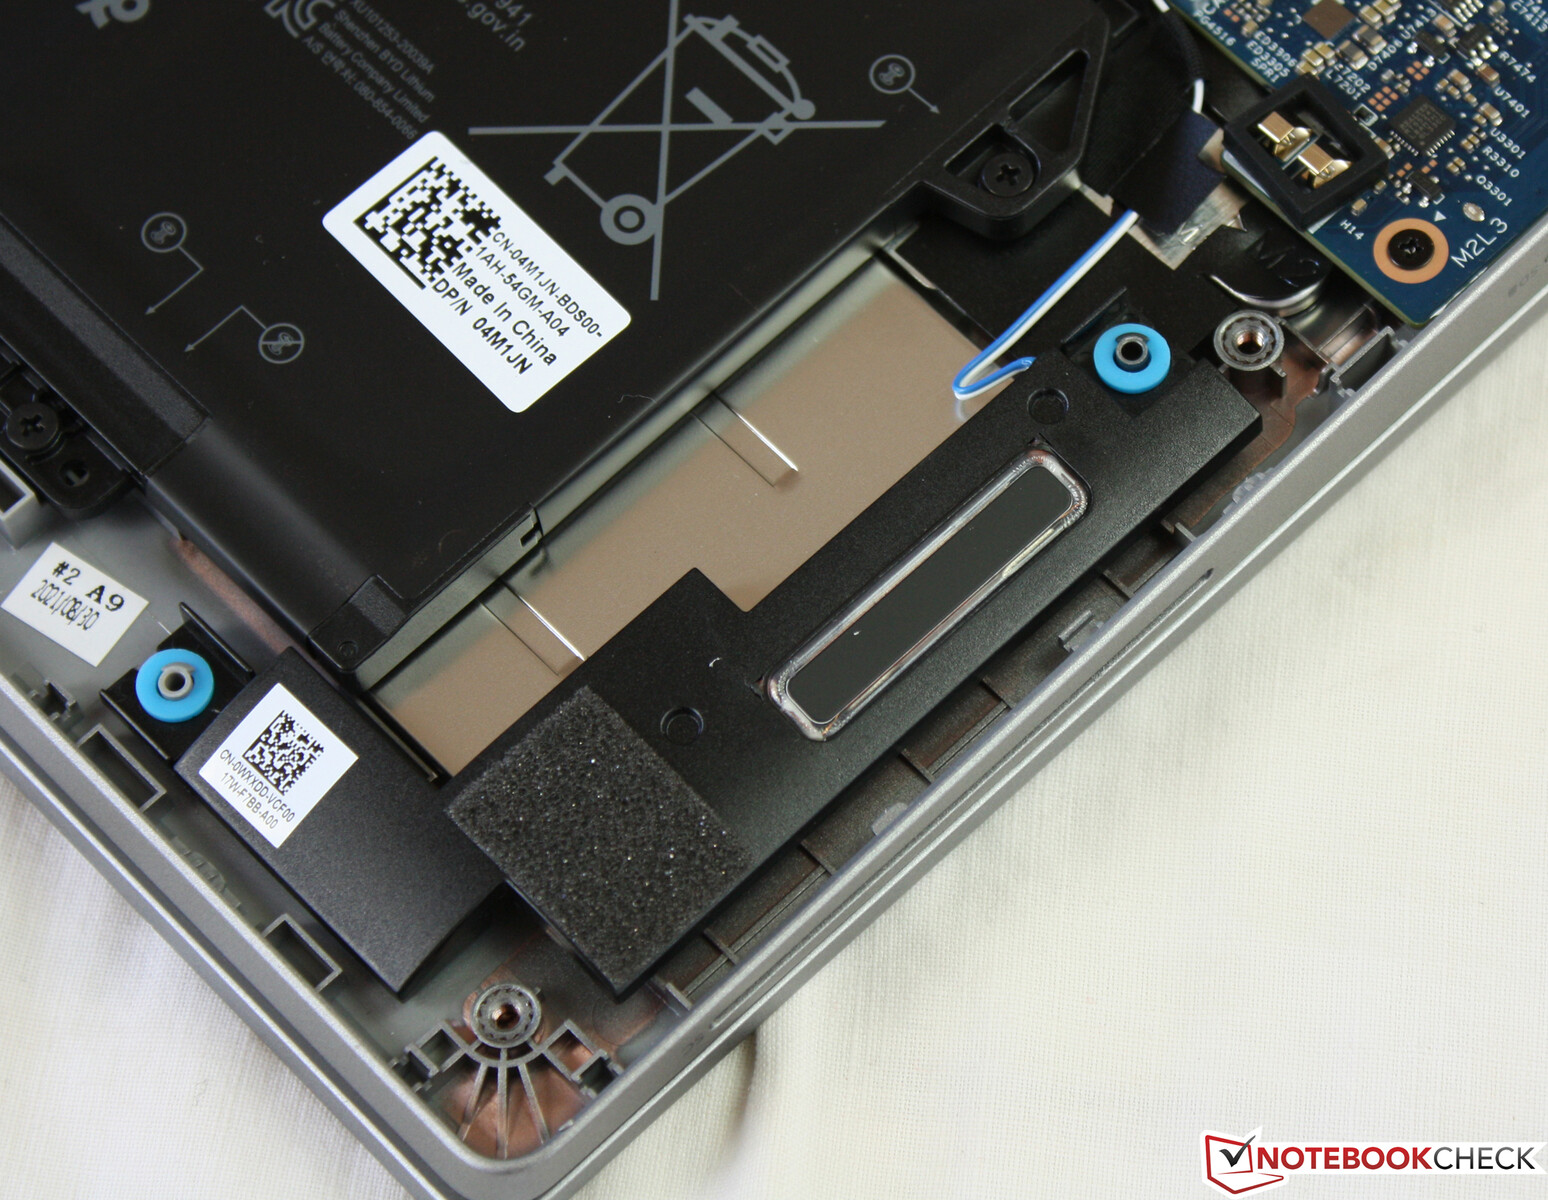
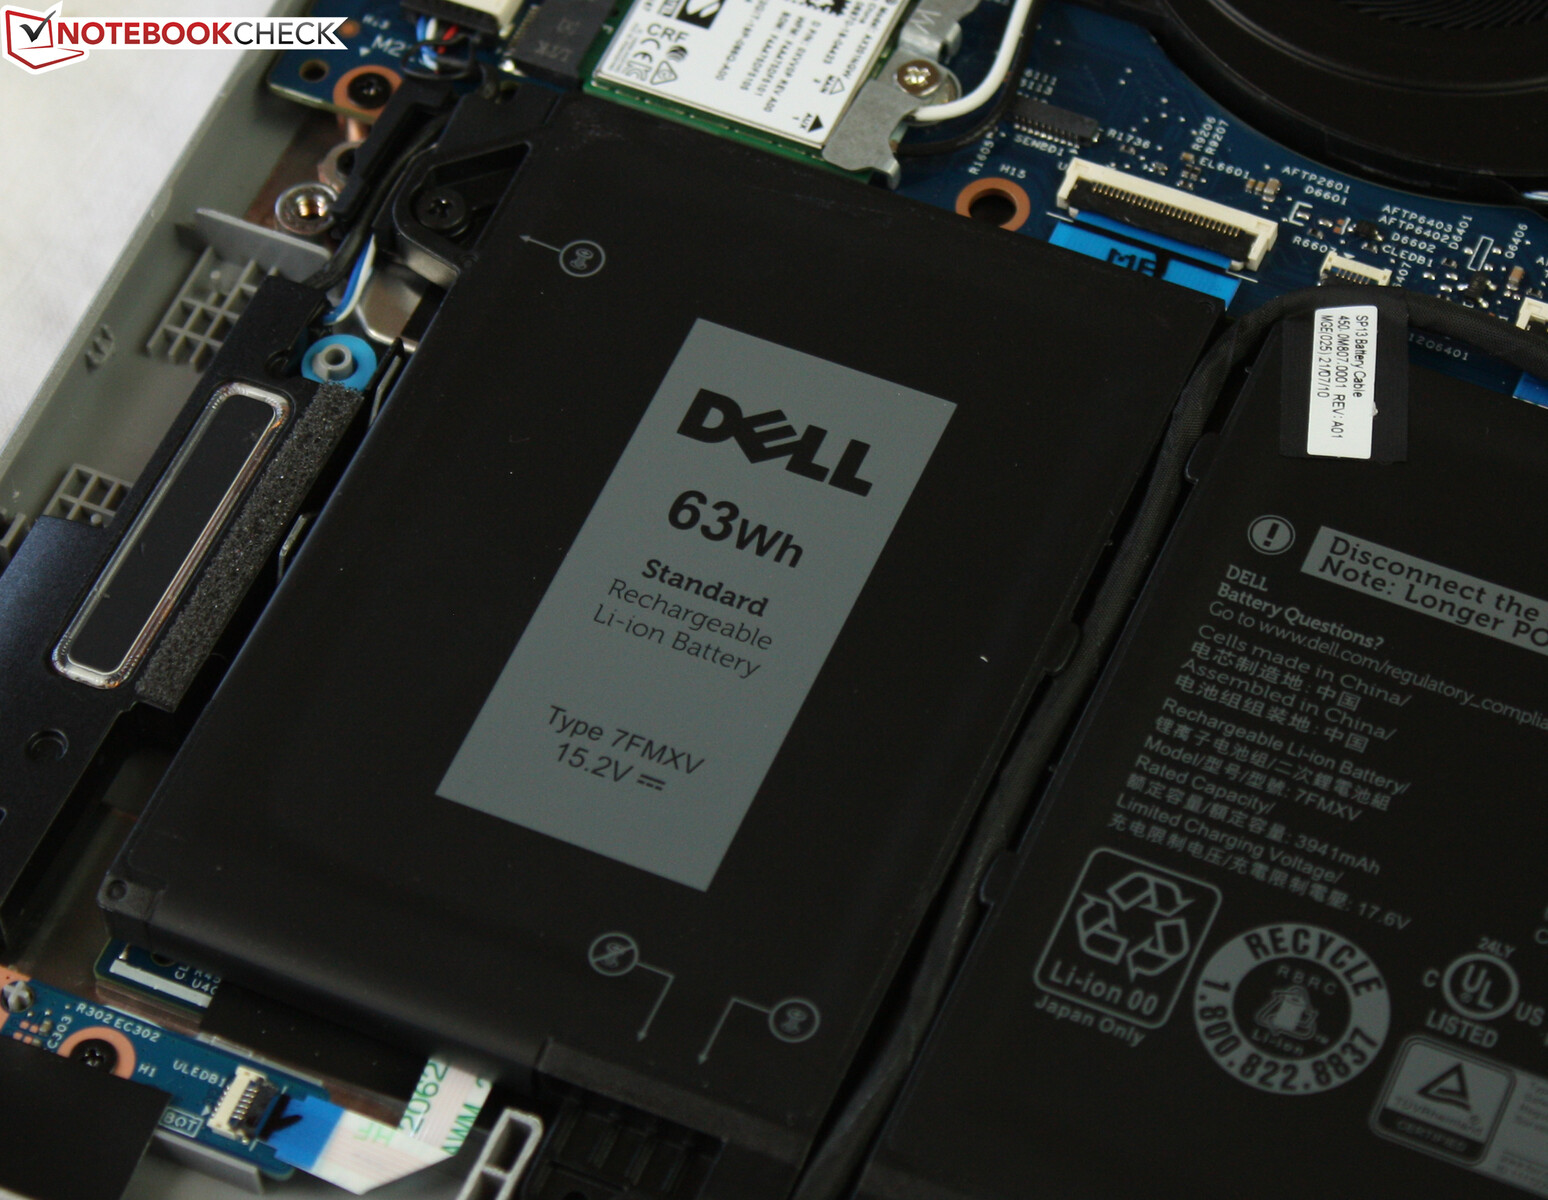
Dell también apuesta por las superficies mate en todo el conjunto. No hay escotilla de mantenimiento, la batería está instalada de forma permanente pero puede ser reemplazada. Se puede acceder a las entrañas después de quitar la cubierta inferior - más sobre esto más adelante.
El Latitude está bien fabricado. Los huecos son correctos, no hay salientes de material ni bordes afilados. Hay margen de mejora en cuanto a la estabilidad. La unidad de la base es rígida, pero se puede doblar hasta cierto punto, lo que va en detrimento del reclamo de la prima. Consideramos que la tapa es más estable: sus gruesos bordes proporcionan una gran rigidez. La presión sobre la parte trasera no provoca ninguna ondulación en el cuadro.
Las bisagras extremadamente ajustadas mantienen la tapa firmemente en su posición, pero la apertura con una sola mano no es posible. El ángulo máximo de apertura es de 180 grados. La tapa levanta ligeramente la base al abrirla y se desliza por debajo. No se raya porque tiene patas de goma en el borde inferior.
Dentro de nuestro campo de comparación, el Latitude es uno de los dispositivos más compactos. El ThinkBook 13s y el Dell XPS 13 9305 están a la par, pero el 13s es aún más delgado. En términos de peso, está en gran medida a la par con la mayoría de los rivales.
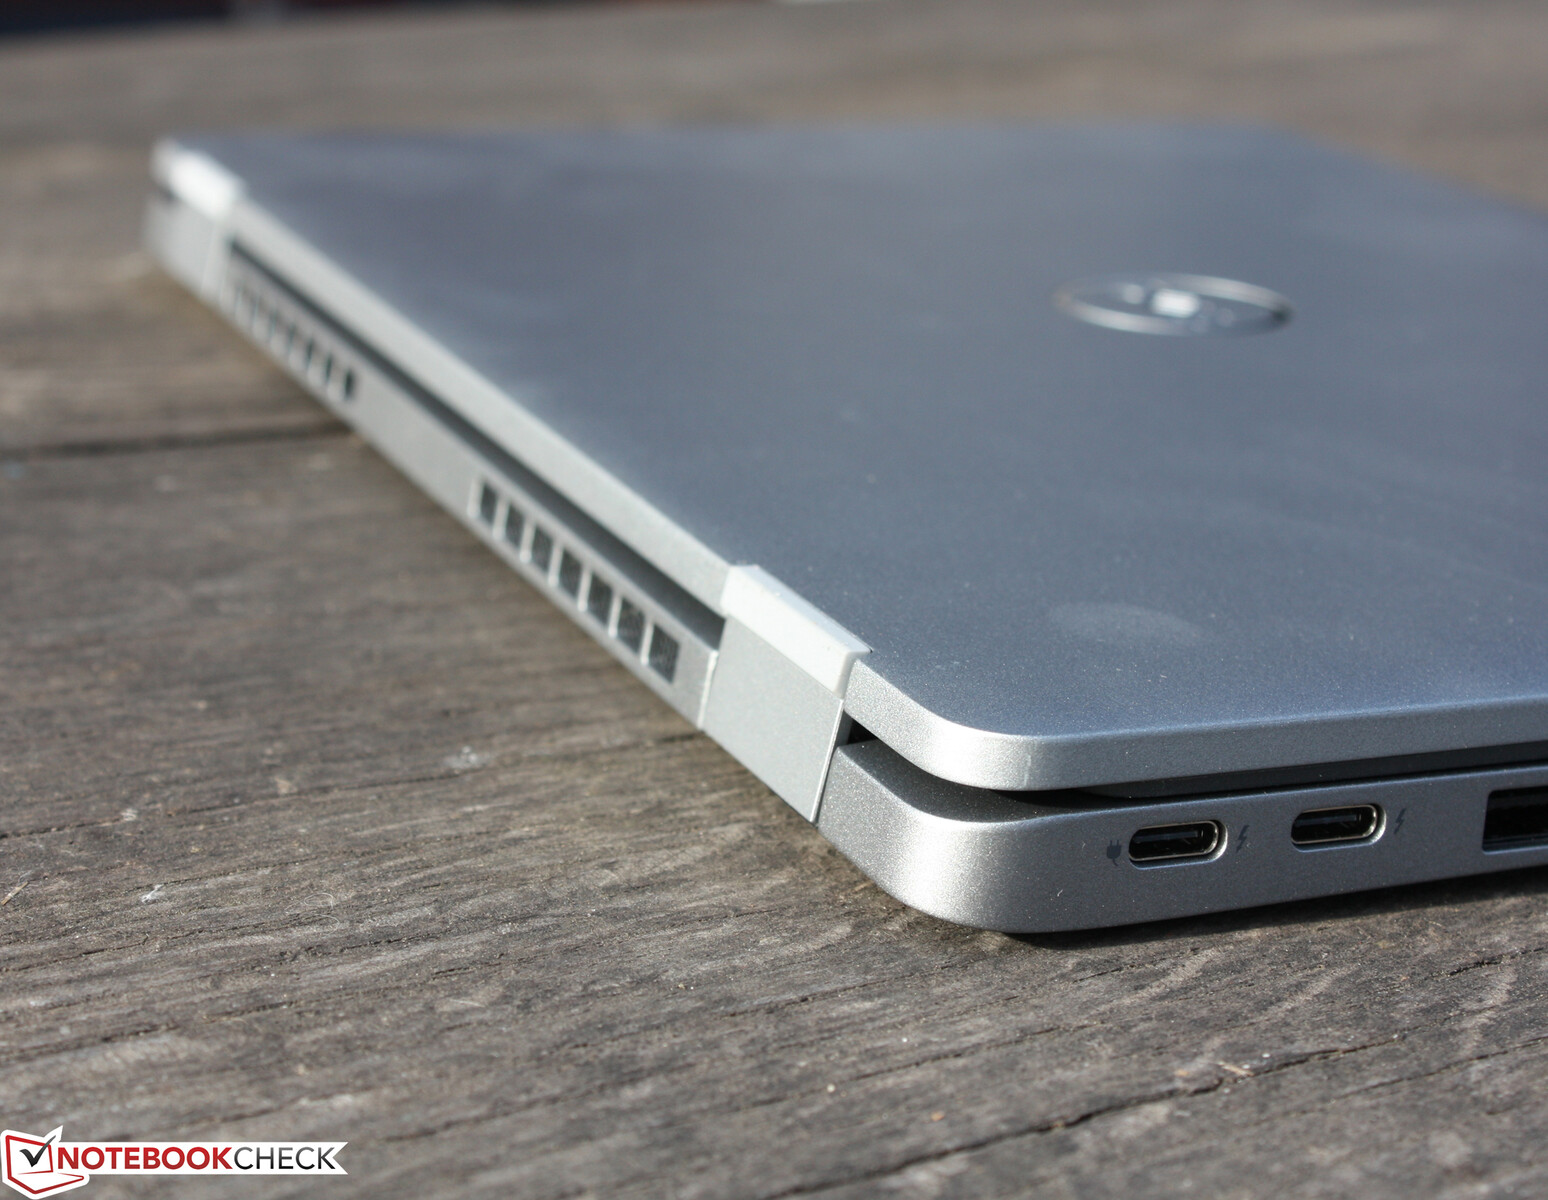
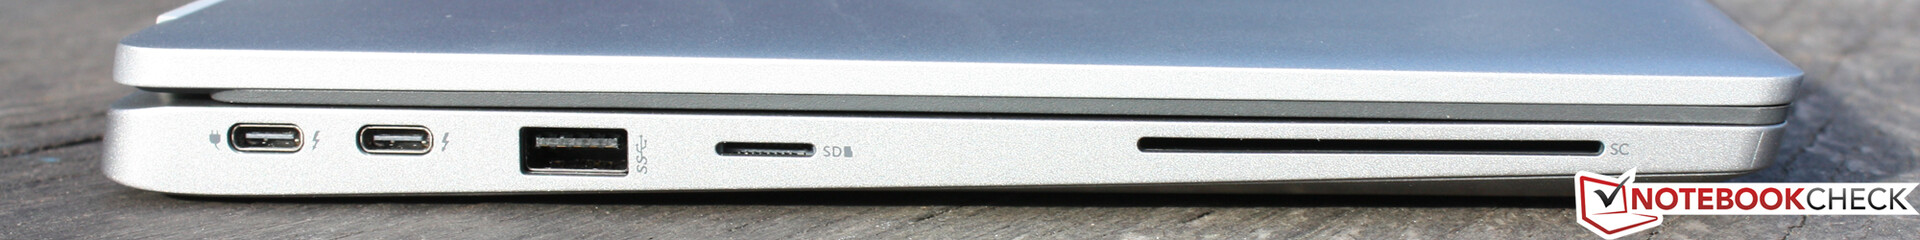
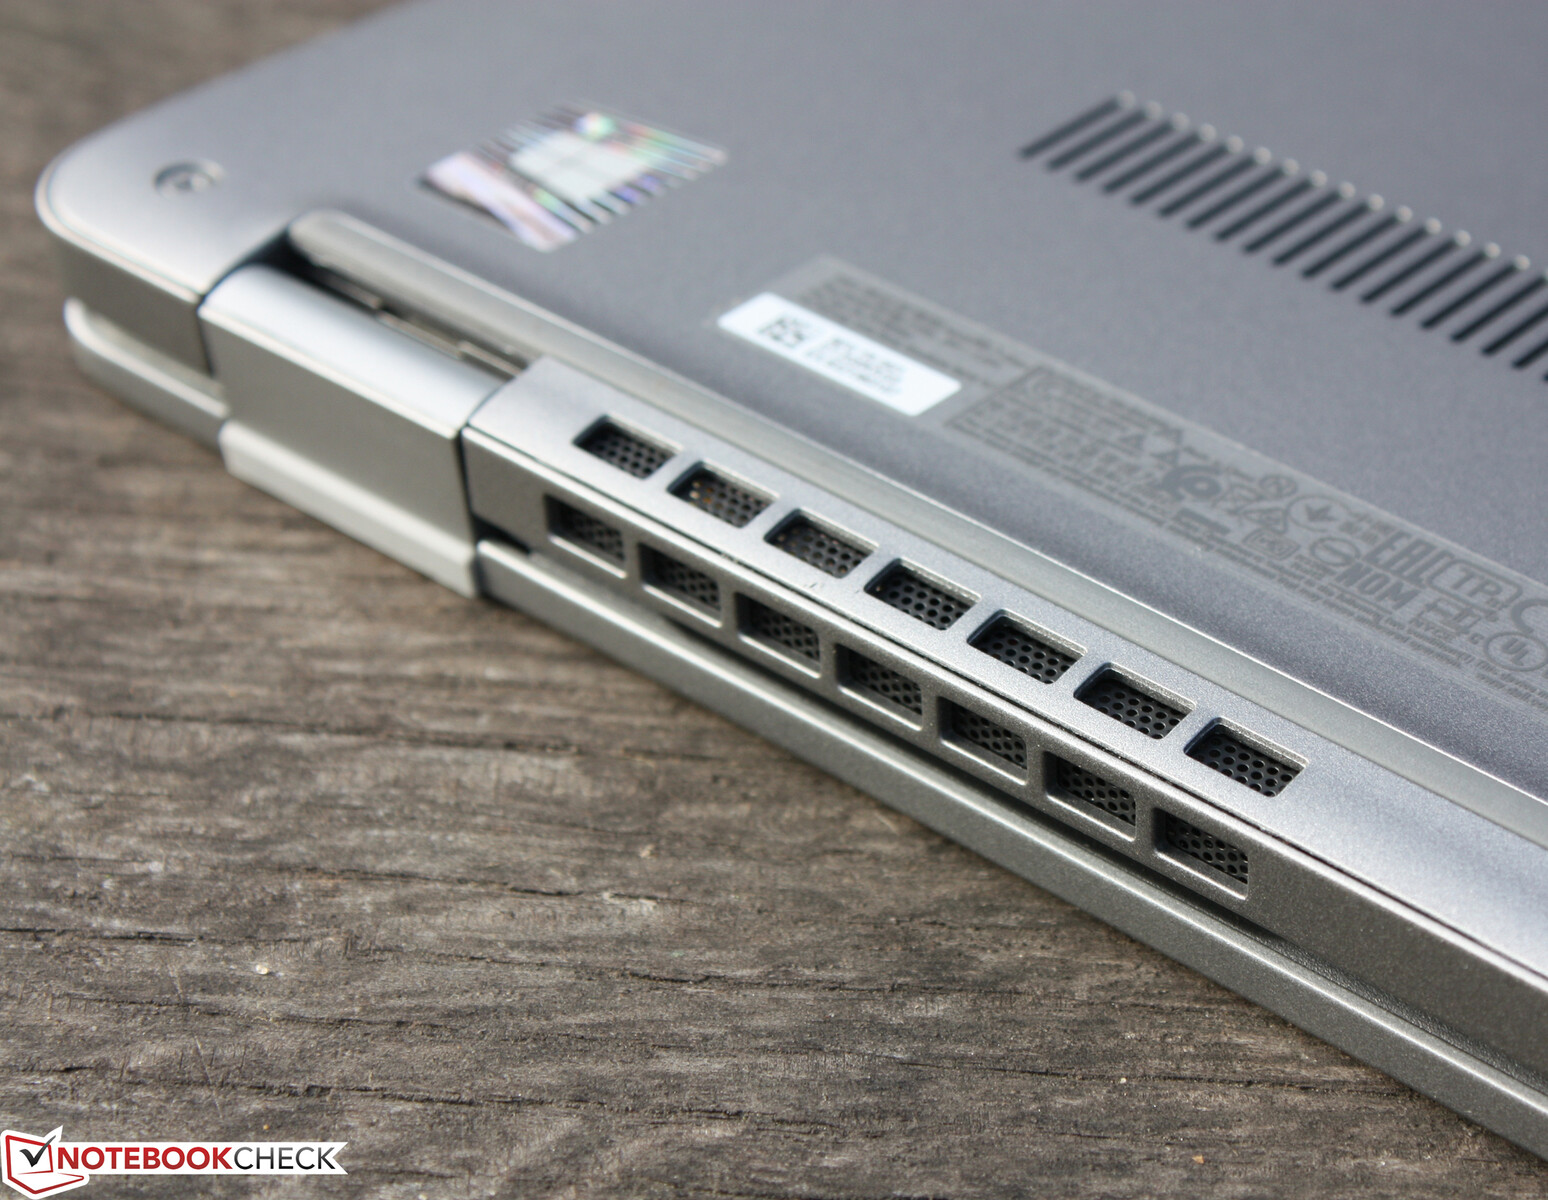
Equipo - 2x Thunderbolt 4 de serie
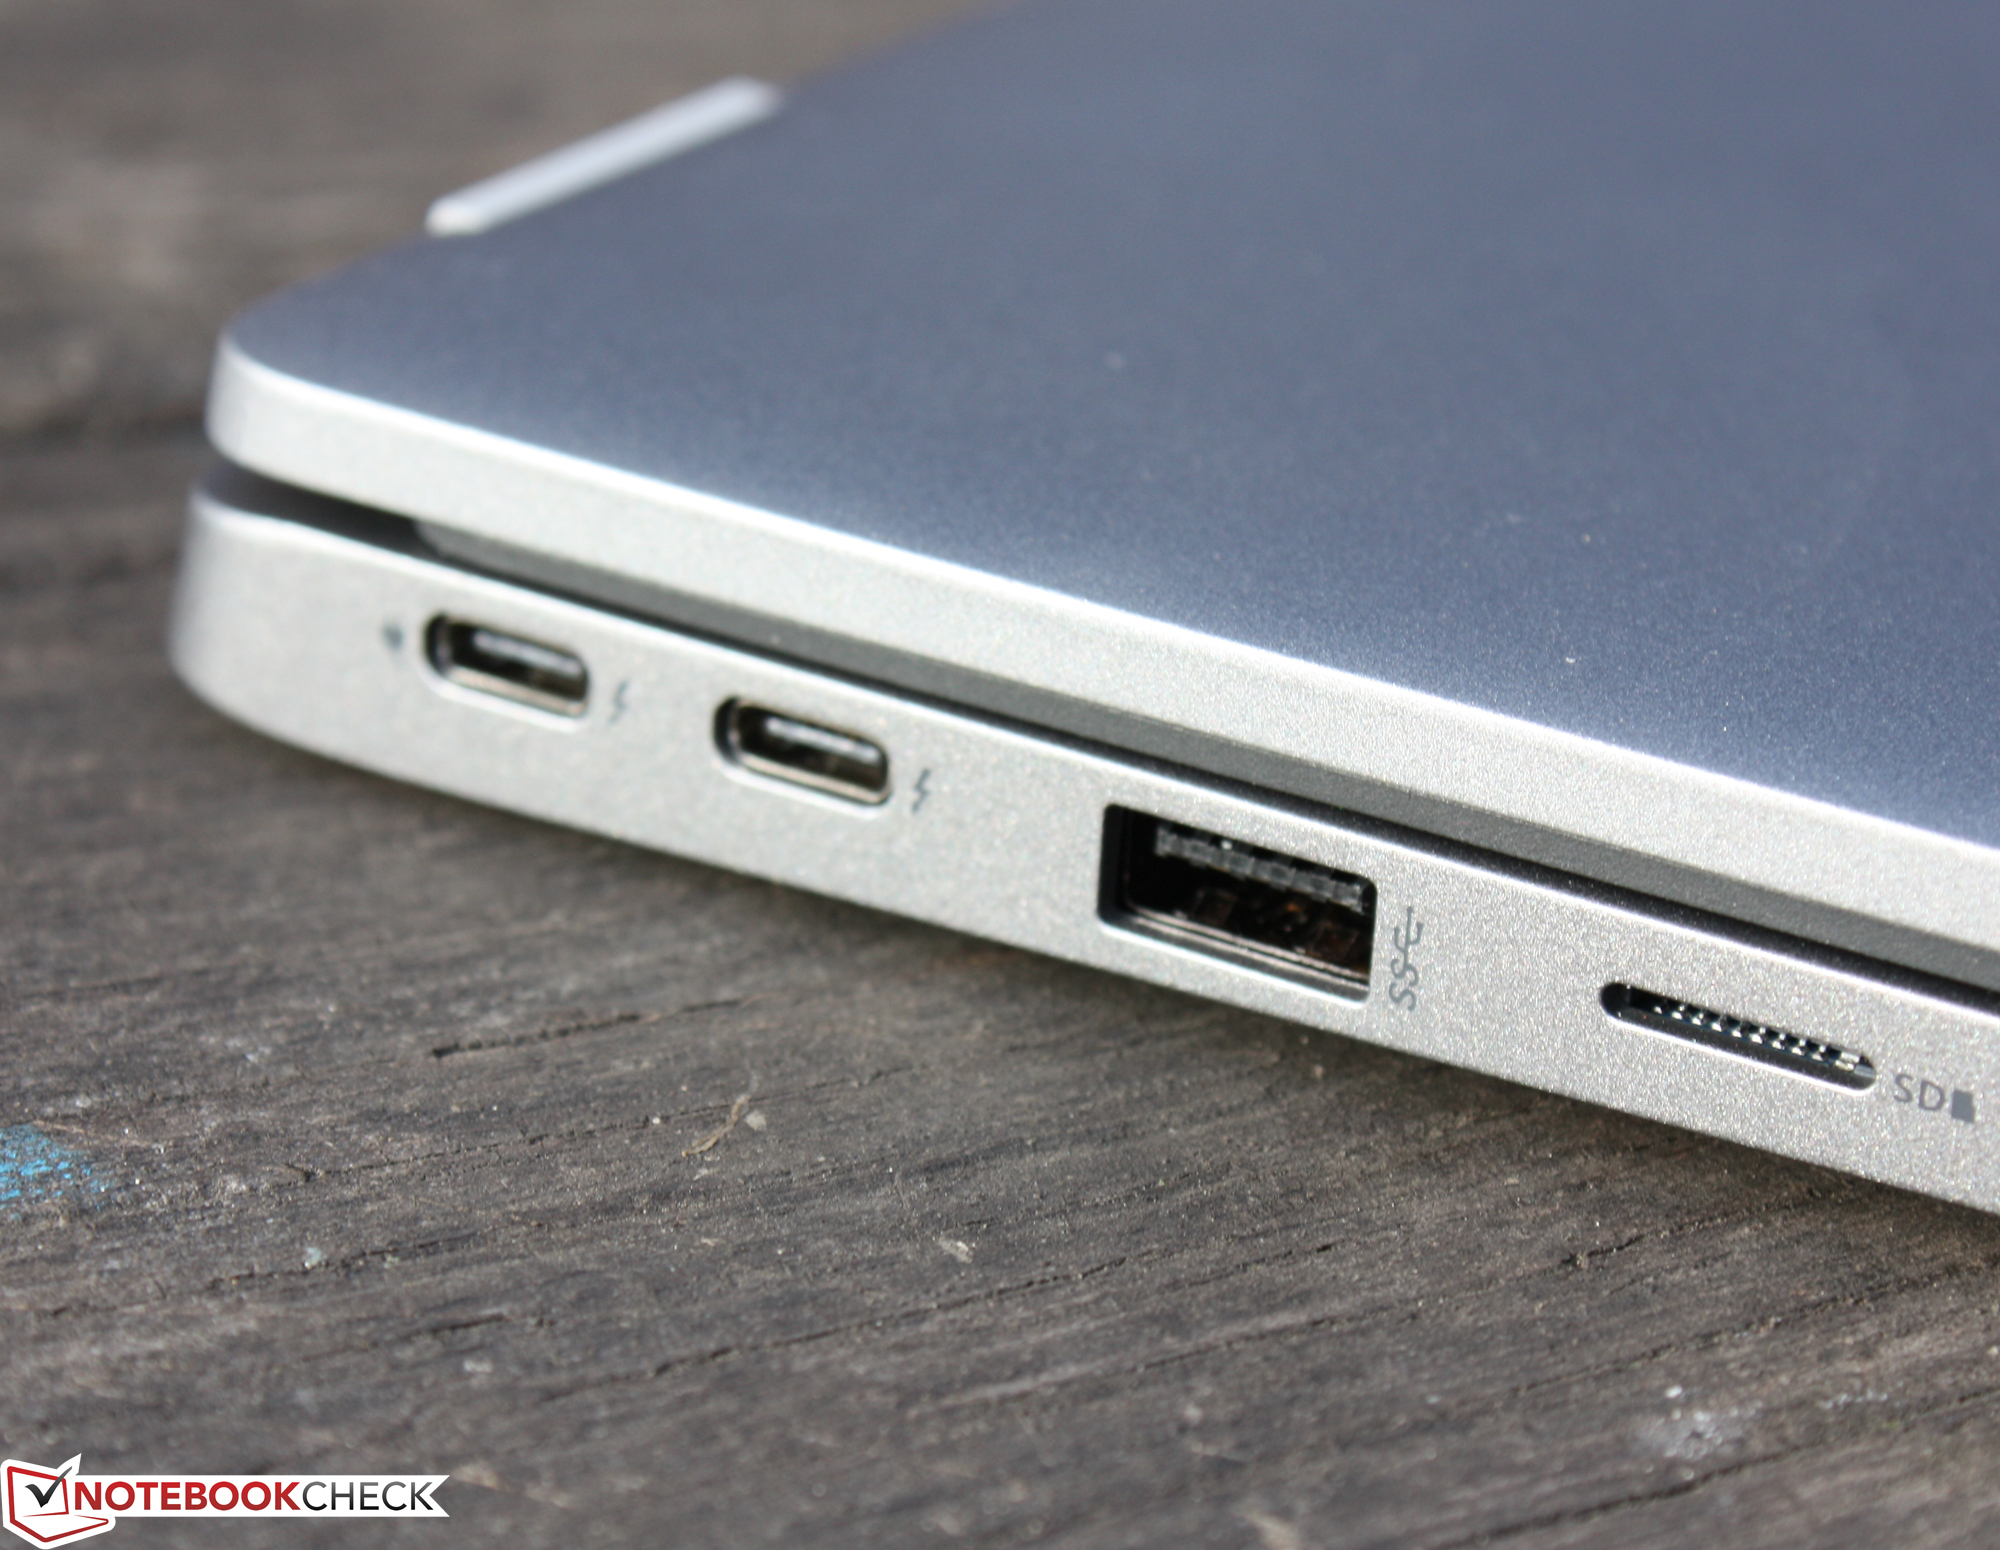
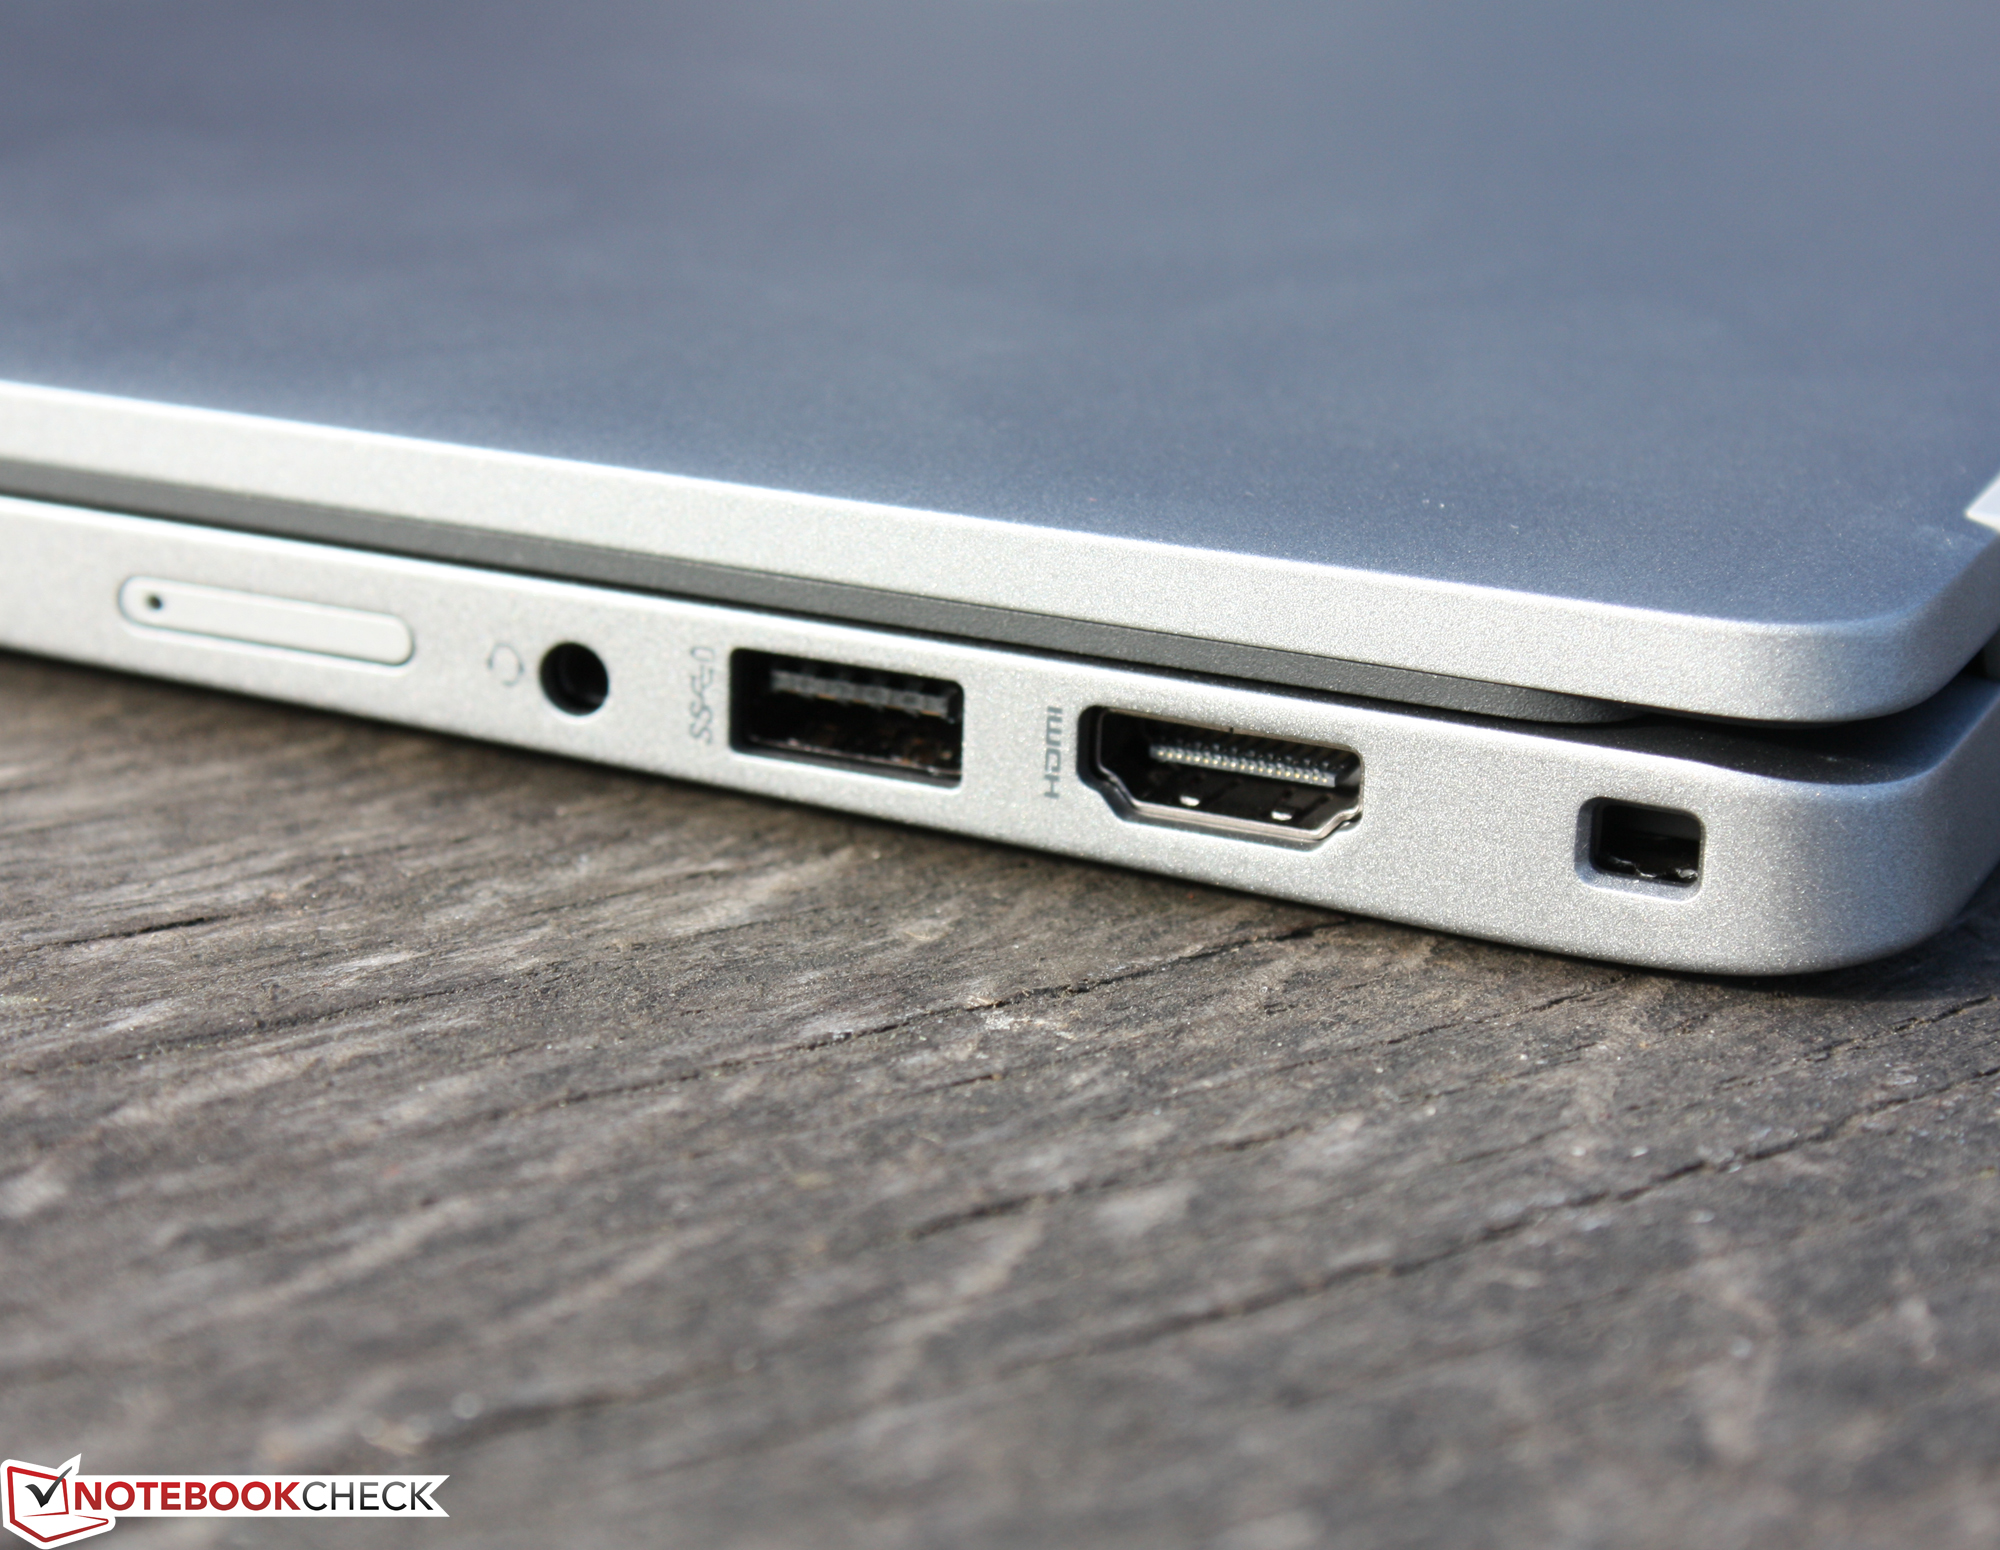
En comparación con el predecesor de 2020, hay cambios significativos, como la eliminación del conector de alimentación de tipo hueco en favor del USB Type-C con soporte de Power Delivery. Además, se omiten las teclas de ratón dedicadas y la memoria de trabajo reemplazable. Tampoco hay ya Ethernet RJ45, pero sí dos puertos Thunderbolt con USB 4.0 y DisplayPort. Un puerto Thunderbolt 3 era opcional antes, pero ahora el TB4 es estándar.
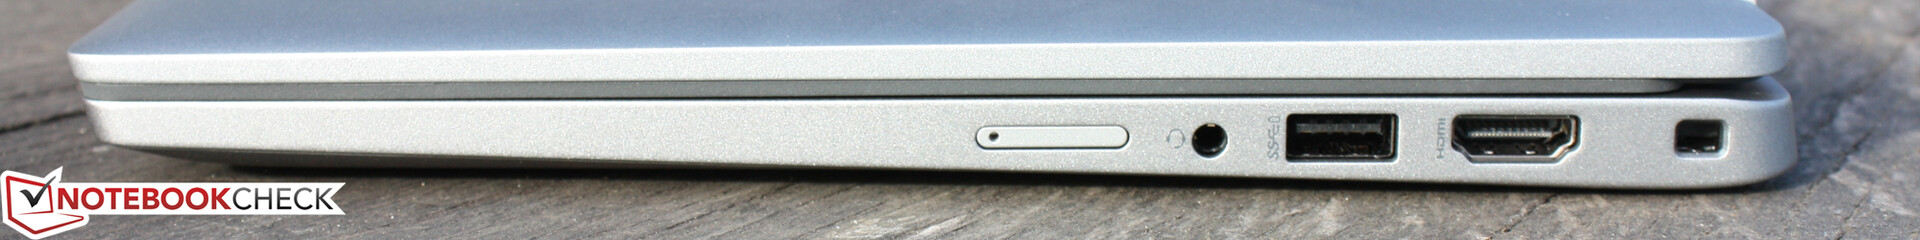
Lector de tarjetas SD
El lector de tarjetas microSD incorporado es uno de los más rápidos de su clase, con velocidades de transferencia de 191 MB/s (copiando grandes bloques de datos) y 205 MB/s (transfiriendo 250 archivos de imagen jpg de unos 5 MB cada uno). Determinamos las tasas de datos utilizando una tarjeta de referencia (Angelbird AV PRO V60 microSD 128 GB).
| SD Card Reader | |
| average JPG Copy Test (av. of 3 runs) | |
| Dell Latitude 5320-TM4V2 (AV Pro SD microSD 128 GB V60) | |
| Dell XPS 13 9305 Core i5 FHD | |
| Media de la clase Subnotebook (23.7 - 188, n=9, últimos 2 años) | |
| Lenovo ThinkPad L13 Gen2-21AB000PGE | |
| Lenovo ThinkPad L14 G2-20X1003WGE (AV Pro V60) | |
| Lenovo ThinkBook 14 G2 ITL 20VDS02G00 (AV Pro V60) | |
| Acer TravelMate P4 TMP414-51-59MR (AV Pro SD microSD 128 GB V60) | |
| maximum AS SSD Seq Read Test (1GB) | |
| Dell Latitude 5320-TM4V2 (AV Pro SD microSD 128 GB V60) | |
| Dell XPS 13 9305 Core i5 FHD | |
| Media de la clase Subnotebook (24.9 - 195, n=8, últimos 2 años) | |
| Lenovo ThinkBook 14 G2 ITL 20VDS02G00 (AV Pro V60) | |
| Lenovo ThinkPad L13 Gen2-21AB000PGE | |
| Lenovo ThinkPad L14 G2-20X1003WGE (AV Pro V60) | |
| Acer TravelMate P4 TMP414-51-59MR (AV Pro SD microSD 128 GB V60) | |
Comunicación
El chip WLAN (Intel AX201) es compatible con los estándares WLAN 802.11a/b/g/n/ac/ax. Las velocidades de transmisión determinadas en condiciones óptimas (sin otros dispositivos WLAN en las inmediaciones, corta distancia entre el portátil y el PC servidor) son normales o excelentes. En todas las mediciones de control se produjo la caída indicada. Las conexiones de red por cable ya no son posibles por primera vez, el predecesor aún tenía un RJ45 emergente.
Dell ofrece un módem LTE opcional para el Latitude - nuestro dispositivo de pruebas viene sin módem. Sin embargo, se podría reequipar, las antenas LTE y la ranura para la tarjeta SIM (eSim) están disponibles.
| Networking | |
| iperf3 transmit AX12 | |
| Lenovo ThinkBook 13s G3 20YA0005GE | |
| Medio Intel Wi-Fi 6 AX201 (49.8 - 1775, n=324) | |
| Dell XPS 13 9305 Core i5 FHD | |
| Lenovo ThinkPad L14 G2-20X1003WGE | |
| Acer TravelMate P4 TMP414-51-59MR | |
| Lenovo ThinkPad L13 Gen2-21AB000PGE | |
| Dell Latitude 5320-TM4V2 | |
| Lenovo ThinkBook 14 G2 ITL 20VDS02G00 | |
| Lenovo ThinkBook 14 G2 ITL 20VDS02G00 | |
| iperf3 receive AX12 | |
| Dell XPS 13 9305 Core i5 FHD | |
| Dell Latitude 5320-TM4V2 | |
| Medio Intel Wi-Fi 6 AX201 (136 - 1743, n=324) | |
| Lenovo ThinkBook 13s G3 20YA0005GE | |
| Acer TravelMate P4 TMP414-51-59MR | |
| Lenovo ThinkPad L13 Gen2-21AB000PGE | |
| Lenovo ThinkBook 14 G2 ITL 20VDS02G00 | |
| Lenovo ThinkBook 14 G2 ITL 20VDS02G00 | |
| Lenovo ThinkPad L14 G2-20X1003WGE | |
Cámara web
La cámara web (0,9 MP; máx. 1280 x 720) no produce imágenes convincentes, al igual que las cámaras de la competencia. Además, la precisión del color es deficiente. Con una desviación de casi 32, el objetivo (DeltaE inferior a 3) se pierde claramente.


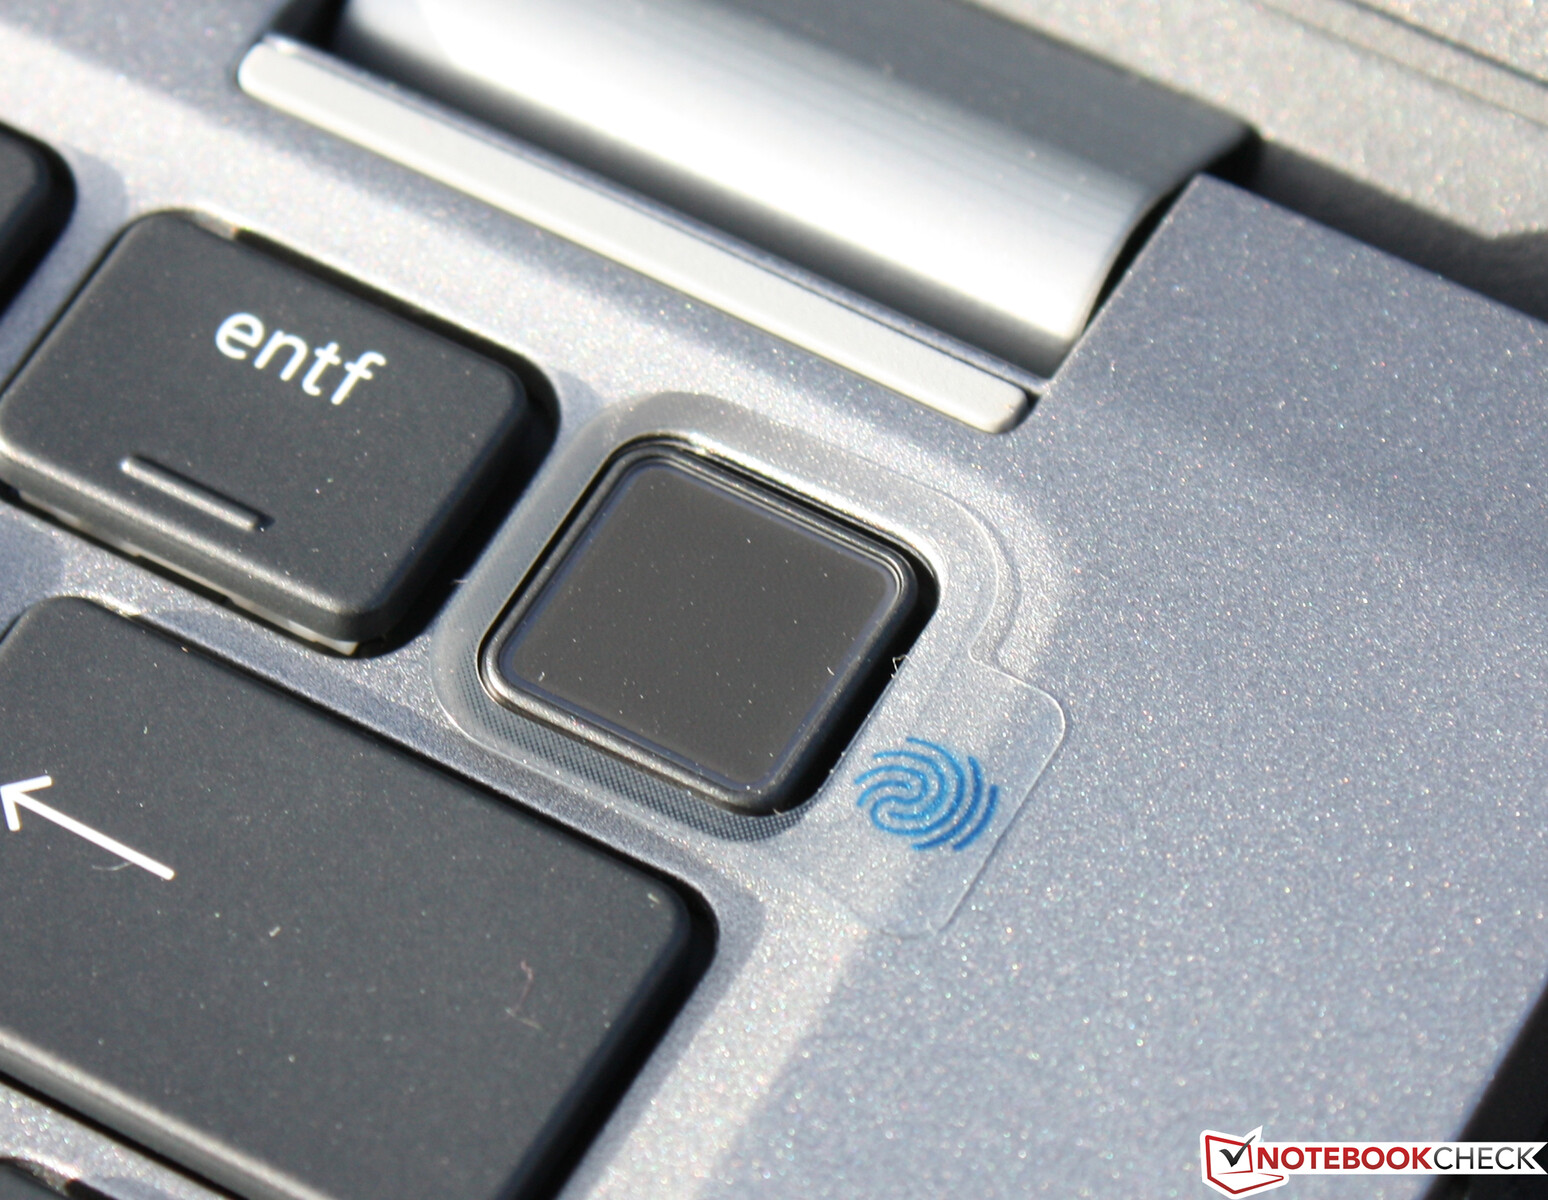
Seguridad
Nuestra variante de configuración viene con una tarjeta inteligente y un lector de huellas dactilares para la seguridad del acceso biométrico. El lector de huellas dactilares está incrustado en el botón de encendido, que se encuentra por primera vez en el bloque del teclado. La proximidad a la tecla de borrado conlleva teóricamente el riesgo de un apagado involuntario. Sin embargo, esto nunca ha ocurrido en la práctica porque el encendido requiere un punto de presión más fuerte.
Accesorios
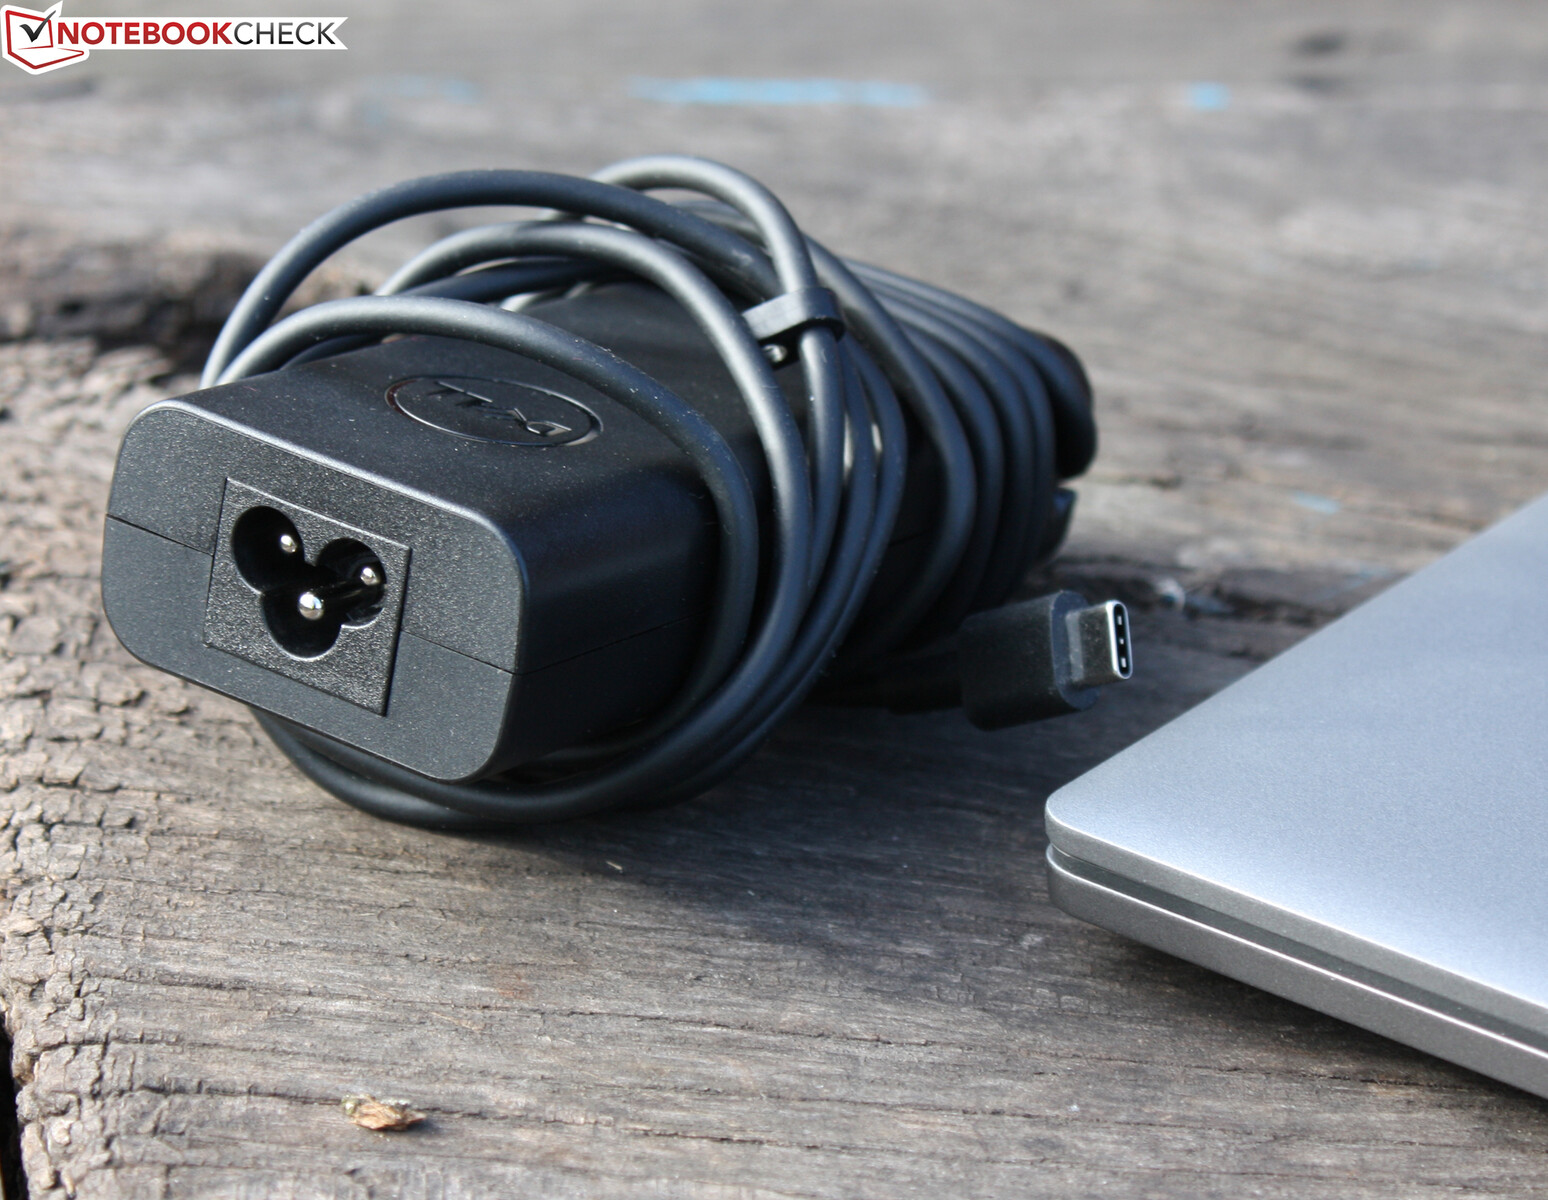
El portátil viene con los documentos habituales: una guía de inicio rápido e información sobre la garantía. Además, hay un adaptador de corriente Type-C de 65W. Dell tiene preparados interesantes accesorios. Las bases Thunderbolt WD19TBS o TB16 tienen un montón de puertos en el escritorio de casa y se conectan al portátil con un único cable. El portátil también se carga a través de este cable.
Mantenimiento
Se puede acceder al hardware después de retirar la carcasa inferior. Se aflojan todos los tornillos de la parte inferior del aparato. Al levantar el panel, hay que empezar por la zona de las bisagras. Entonces tienes acceso al SSD, la batería, el módulo WLAN, el módem LTE (opcional, preparado con antenas), y el ventilador. No hay ranuras de memoria, la RAM es onboard.
BIOS
La BIOS del ordenador ofrece amplias opciones de configuración en materia de seguridad, gestión, hardware y energía. Se pueden configurar detalles como el número de núcleos activos de la CPU. También es posible establecer el brillo máximo de la pantalla tanto para el funcionamiento con la red eléctrica como con la batería. Una funcionalidad tan amplia no suele encontrarse en los portátiles.
Garantía
El Latitude tiene un año de garantía in situ. Dell ofrece amplias opciones de ampliación. Por ejemplo, un soporte Pro de cuatro años con servicio in situ al siguiente día laborable está disponible por unos 370 euros.
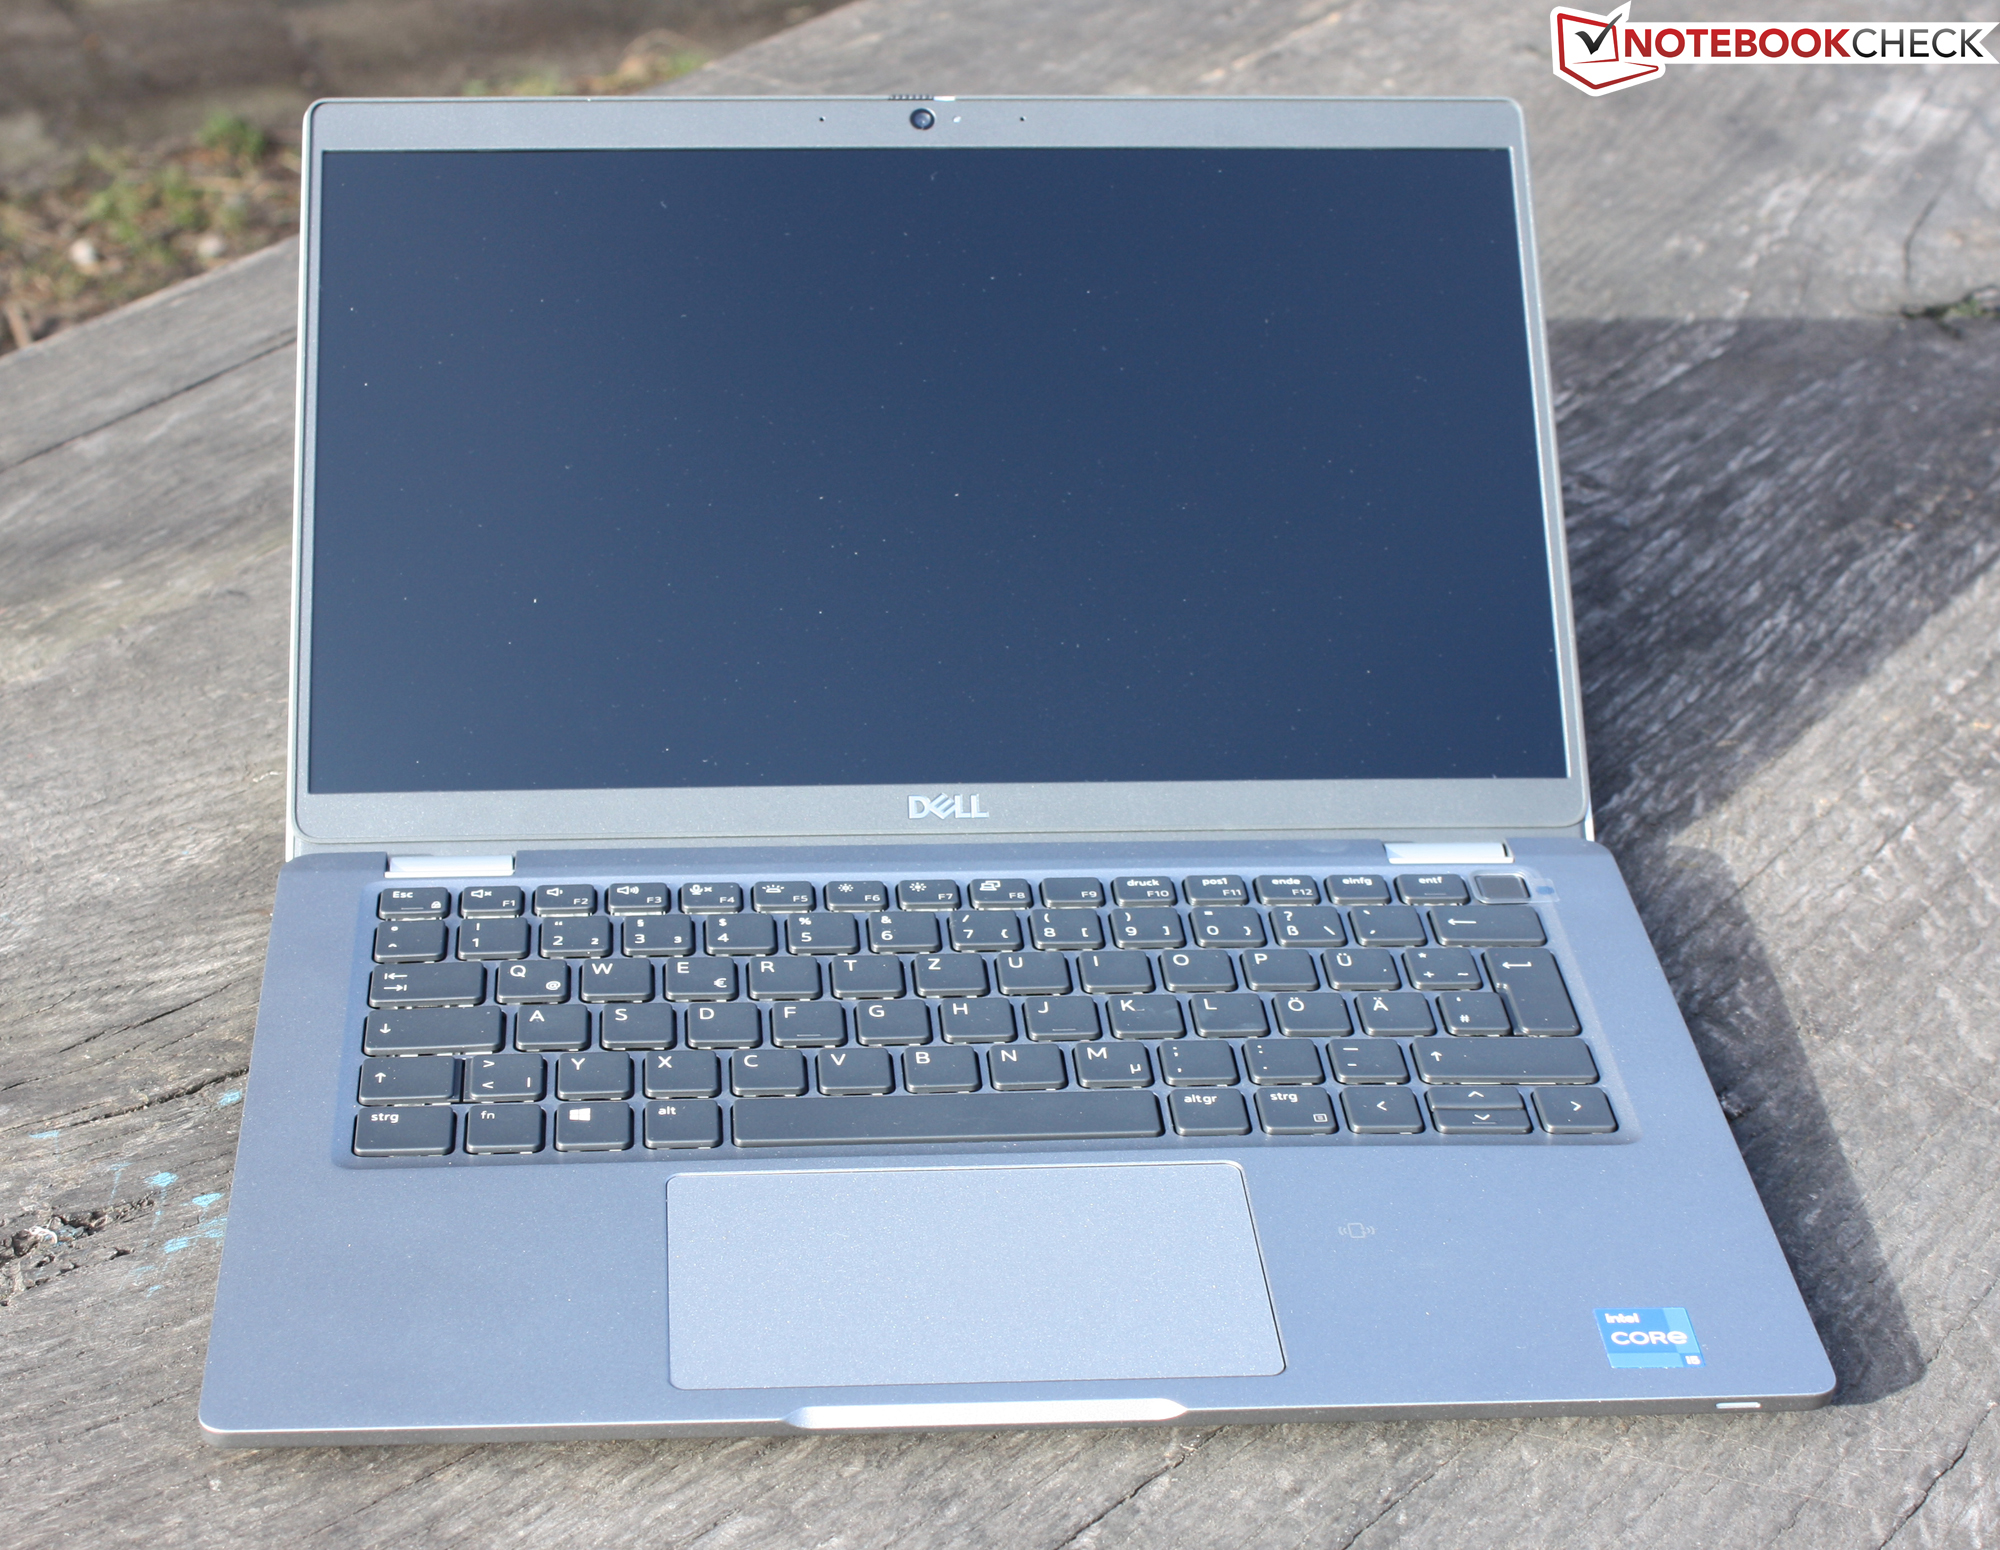
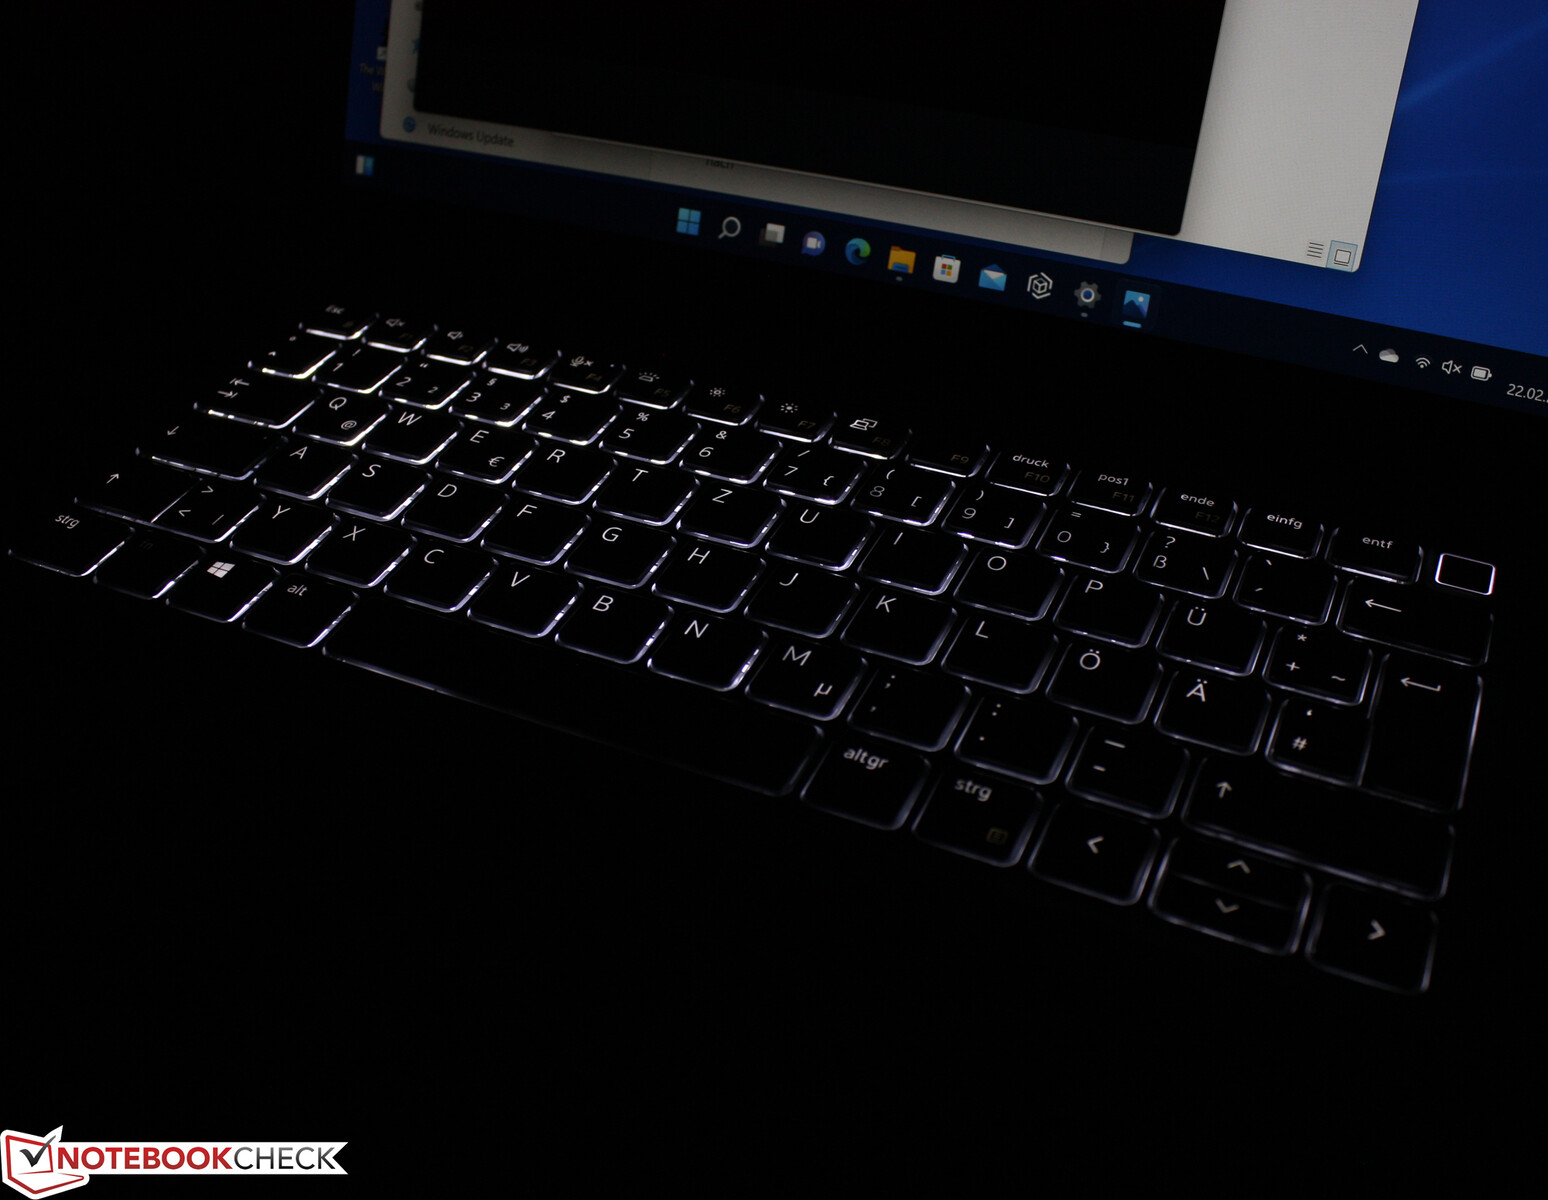
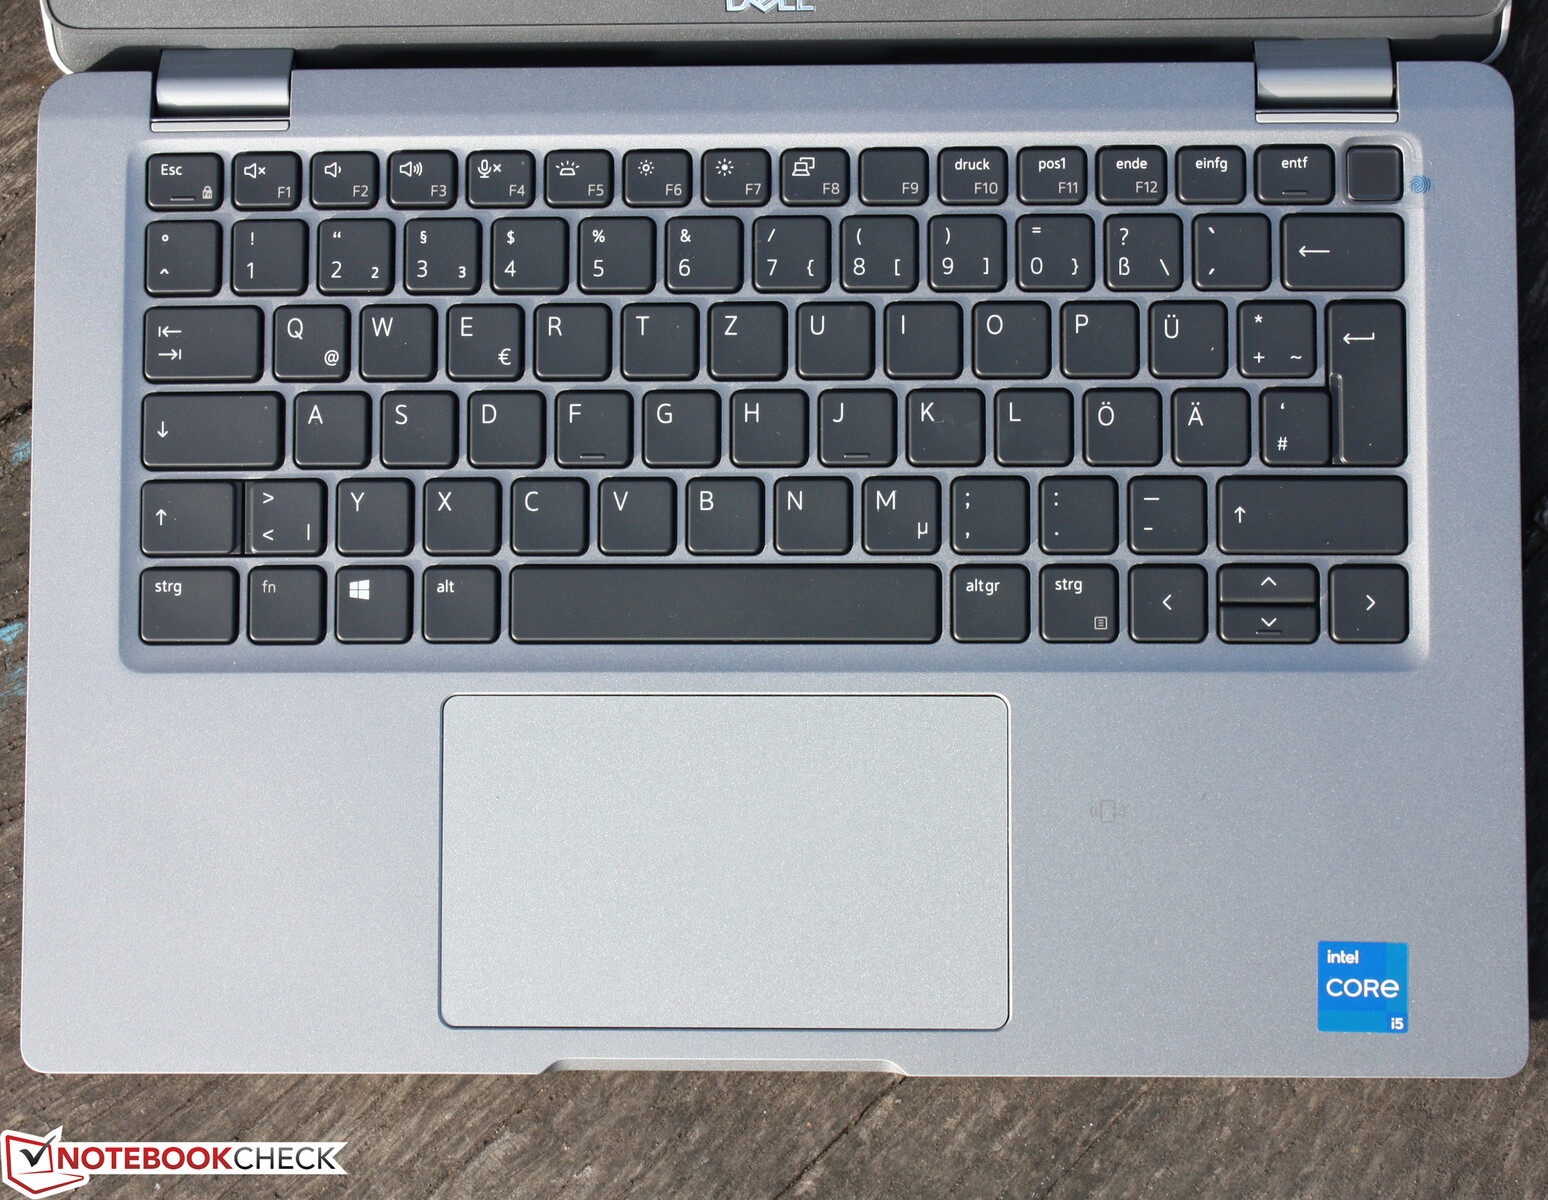
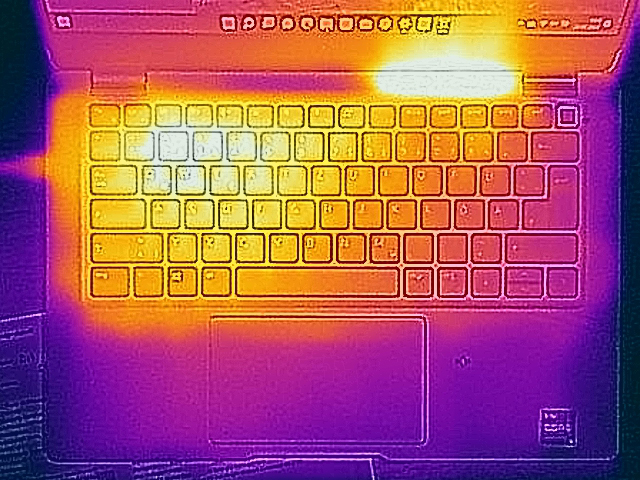
Dispositivos de entrada: el portátil de Dell ya no tiene teclas táctiles
Dell equipa el Latitude con un teclado iluminado. Las teclas planas y romas ofrecen un trazo claro y un punto de presión característico. Esto va acompañado de una agradable resistencia de las teclas. El trazo es una mezcla de esponjoso y moderadamente firme - el mayor inconveniente de este teclado.
Teclado
Durante la escritura, el teclado cede ligeramente en el centro y en la derecha. La iluminación de las teclas ofrece dos niveles de brillo que se seleccionan mediante un botón de función. En general, el teclado dejó una buena impresión, especialmente por la buena retroalimentación, que está asegurada por un rico recorrido y punto de presión.
Teclado táctil
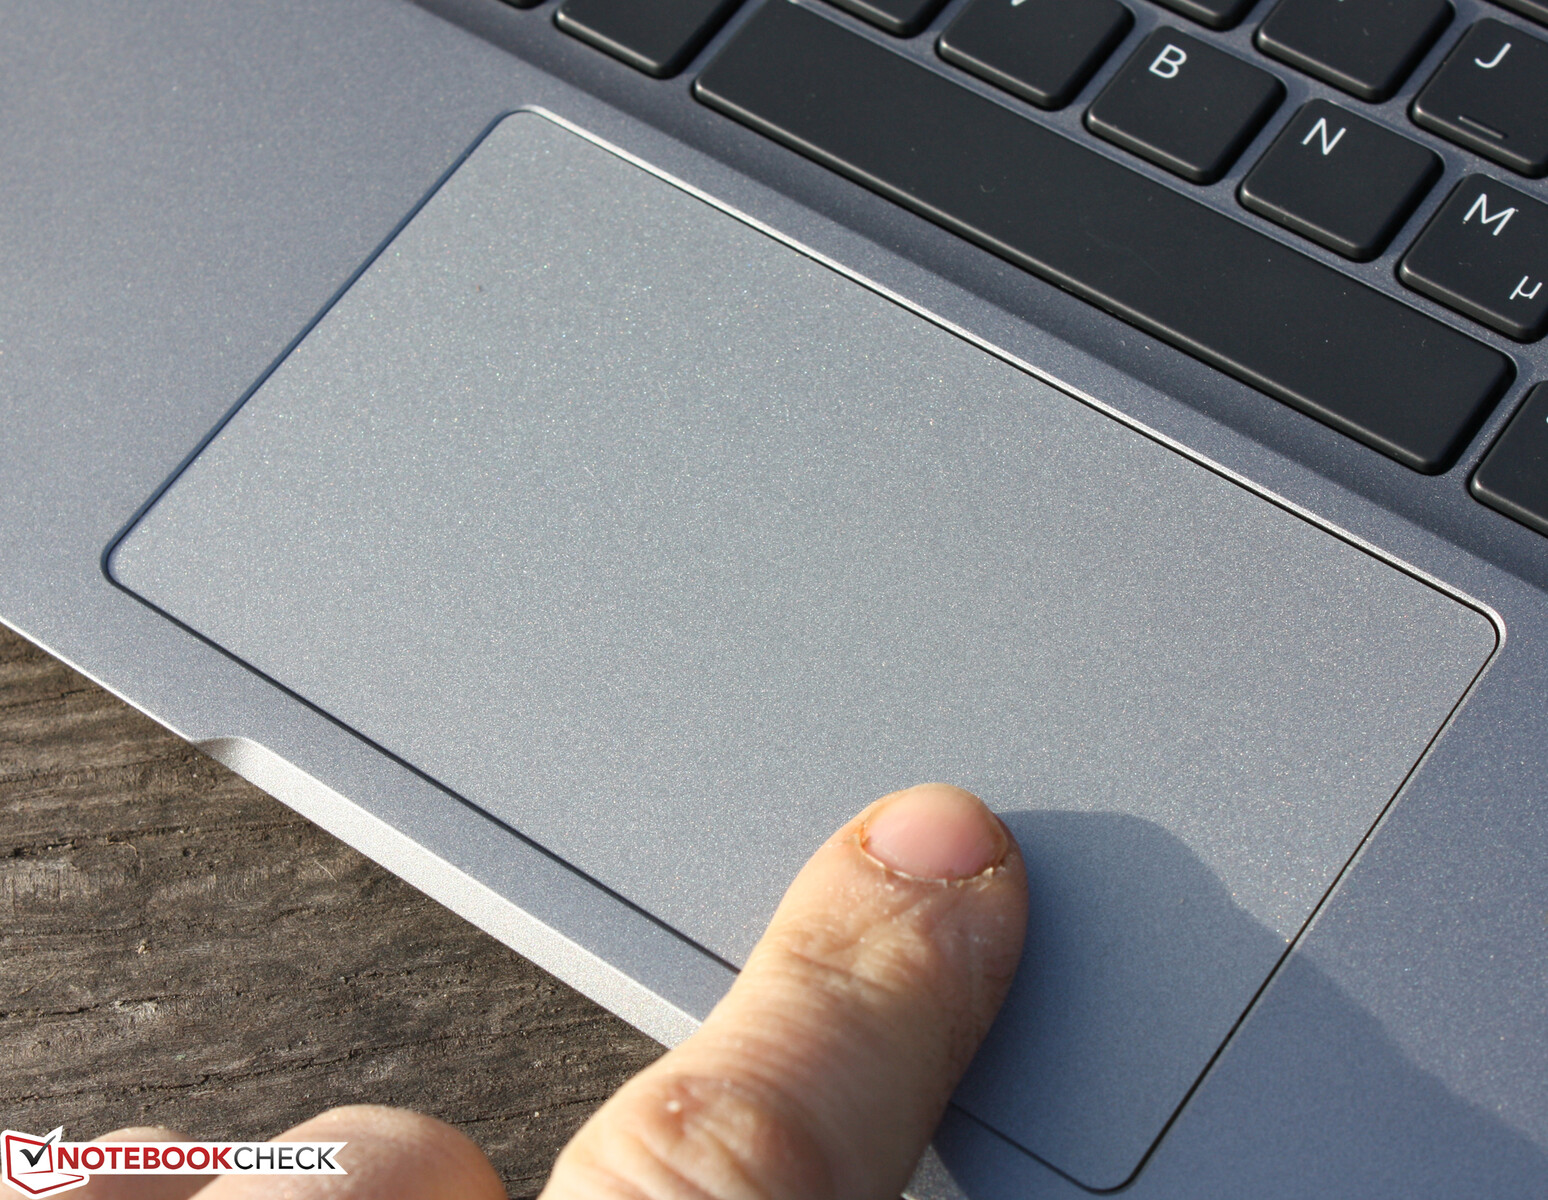
Un clickpad multitáctil sirve de sustituto del ratón y ocupa una superficie de unos 11,7 x 6,7 cm. El teclado táctil del 5110 era más pequeño. Así, se dispone de mucho espacio para utilizar el control gestual. El pad también responde a las entradas en las esquinas. La superficie es mate, el dedo siempre tiene una fricción notable.
Desafortunadamente, casi no hay recorrido en el pad, lo que resulta en un punto de presión insatisfactorio. Puede ser una preferencia personal, al probador no le gustó nada el clickpad debido a la pobre retroalimentación, la operación fue casi desagradable. En cualquier caso, Dell no se ha hecho ningún favor omitiendo las teclas físicas.
Pantalla - Posición débil para el negocio de la pantalla
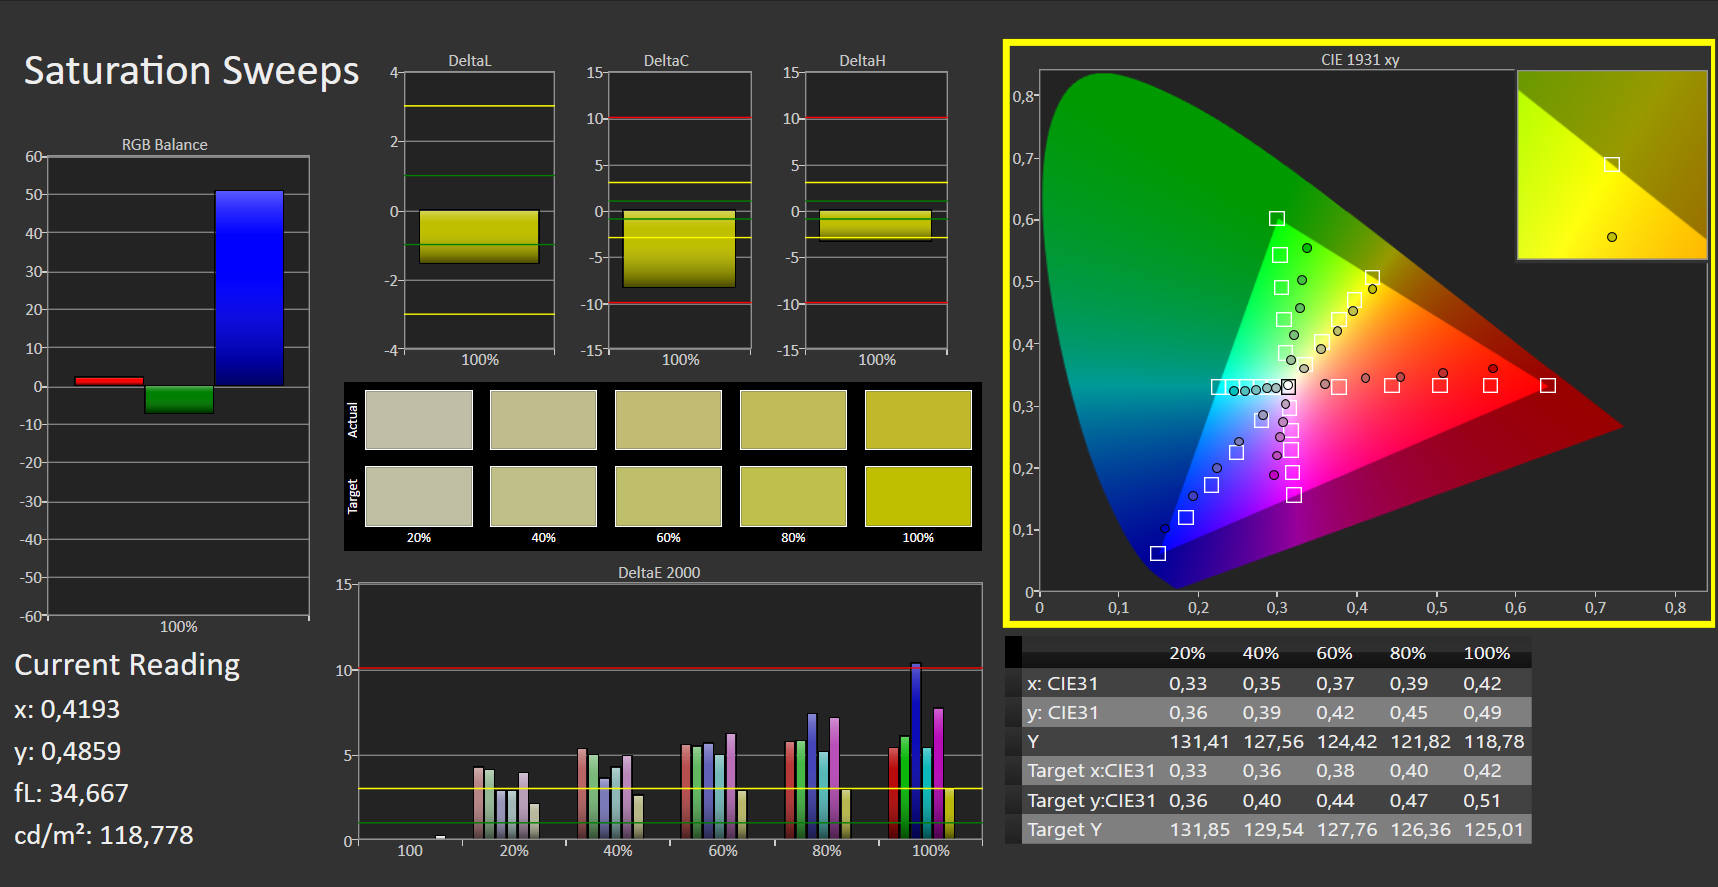
La pantalla mate de 13,3 pulgadas del Latitude funciona con una resolución nativa de 1920 x 1080 píxeles. El modelo de panel sólo puede leerse como un producto Dell. El brillo (248 cd/m²) y el contraste (1,083:1) son demasiado bajos - teniendo en cuenta el nivel de precio del portátil. Consideramos que los valores superiores a 300 cd/m² y 1,000:1 son buenos. Los rivales tienen pantallas más brillantes y a menudo también de mayor contraste a bordo. Dell ofrece una variante multitáctil/no reflectante de la pantalla, que entonces se supone que tiene un nivel de brillo de 300 en vez de 250 cd/m². Positivo: La pantalla no muestra parpadeo PWM en ningún ajuste de brillo.
| |||||||||||||||||||||||||
iluminación: 97 %
Brillo con batería: 270 cd/m²
Contraste: 1083:1 (Negro: 0.23 cd/m²)
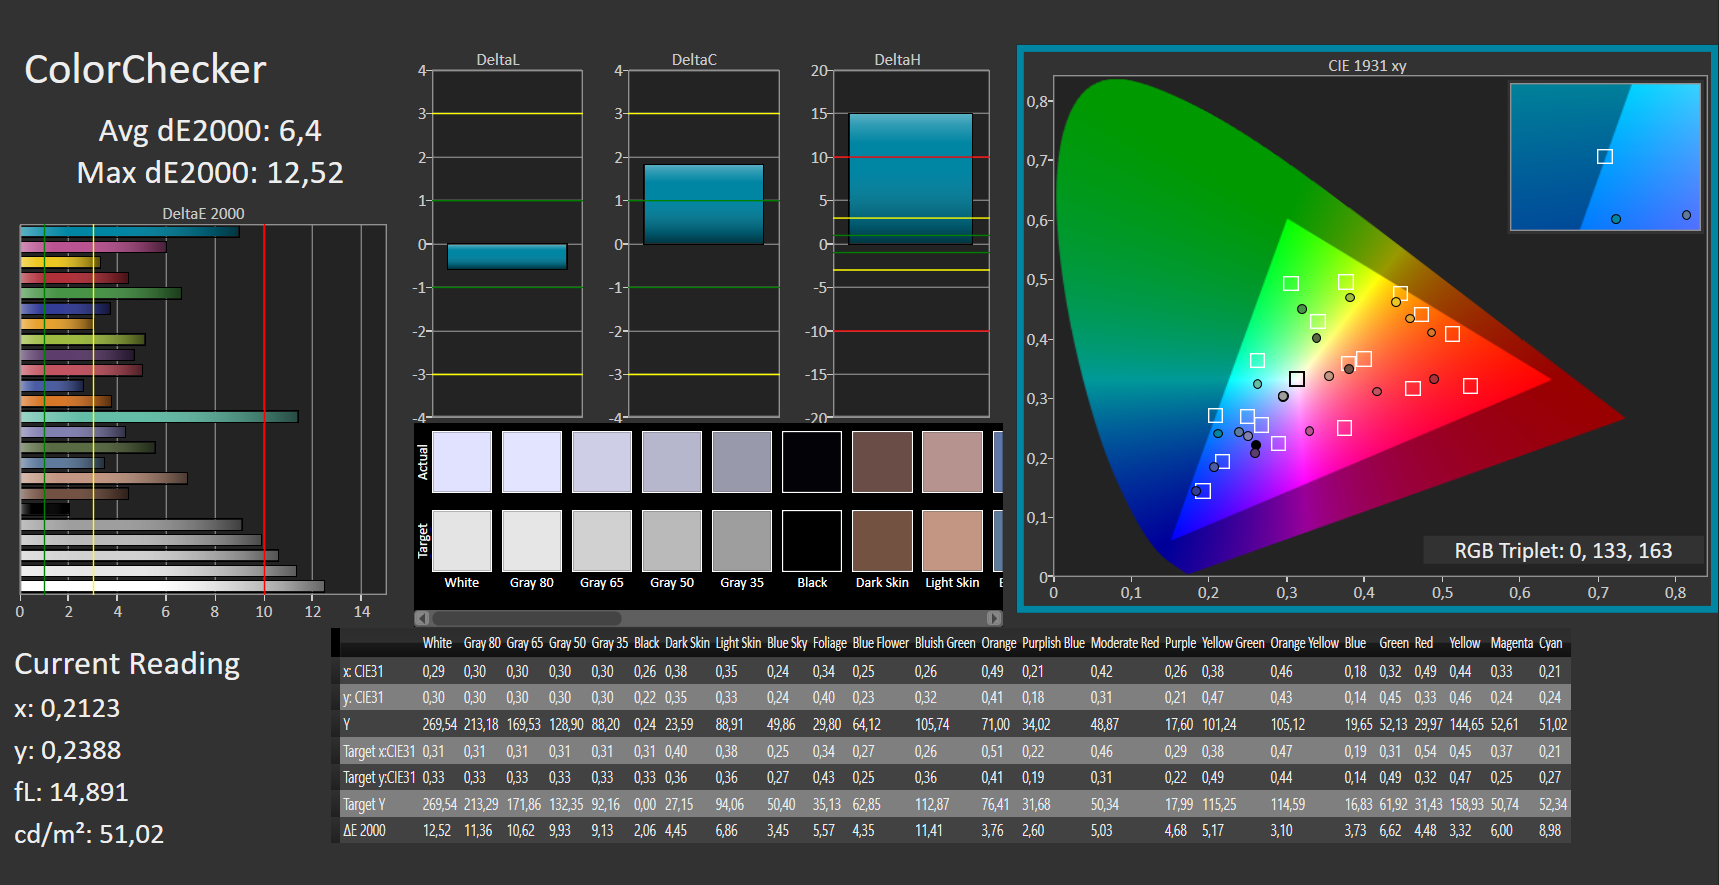
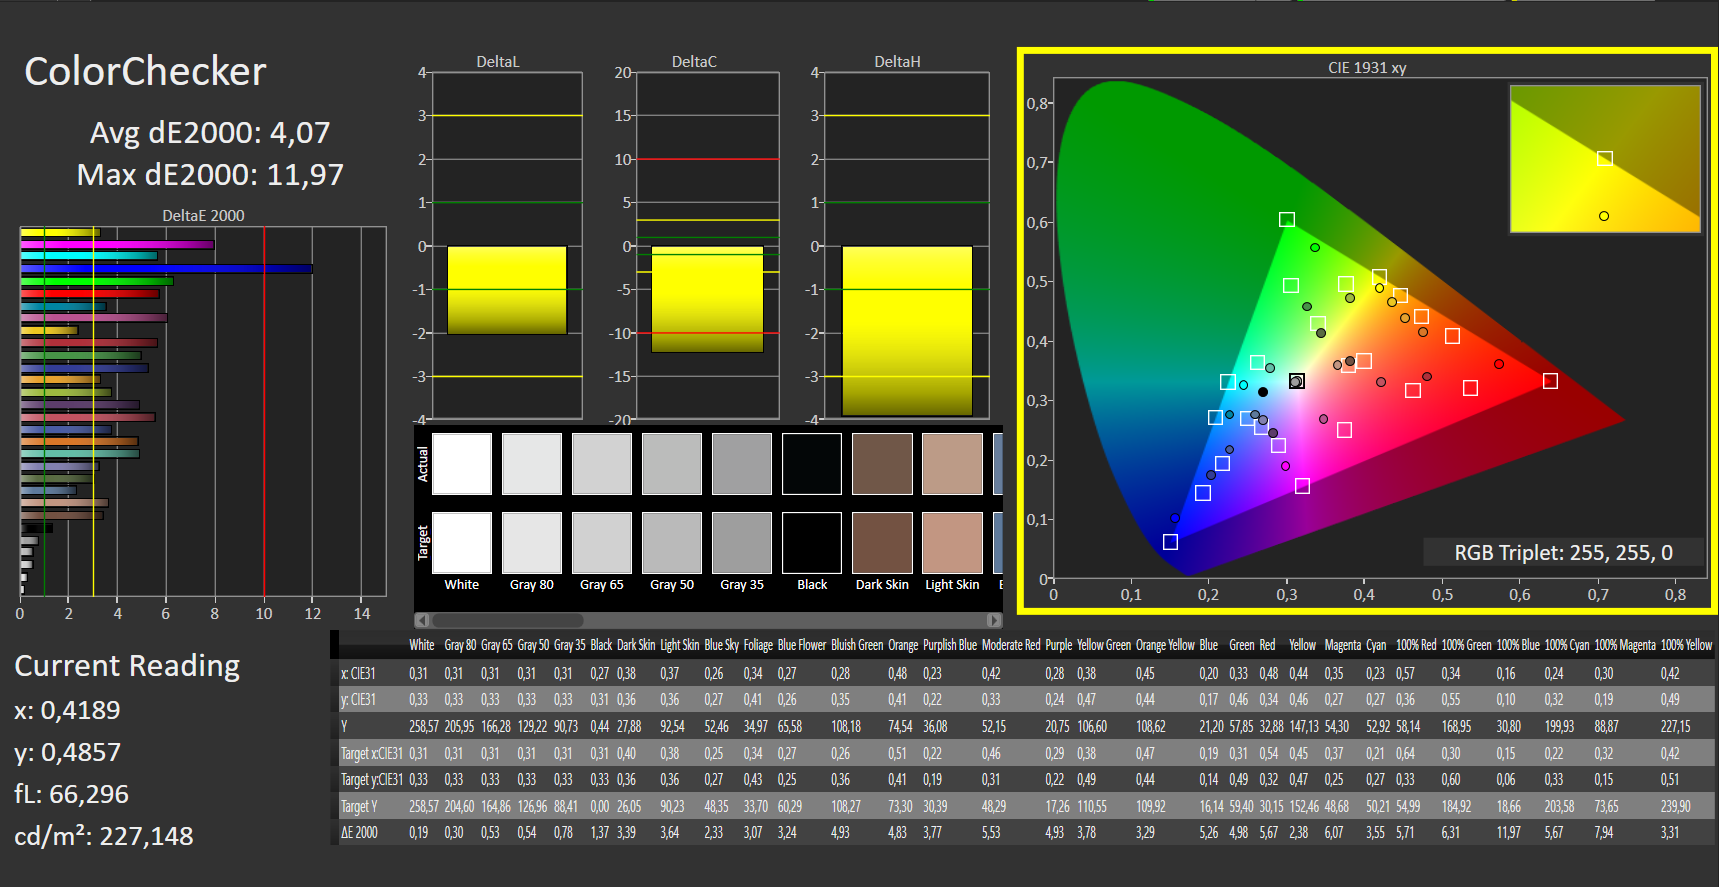
ΔE ColorChecker Calman: 6.4 | ∀{0.5-29.43 Ø4.71}
calibrated: 4.07
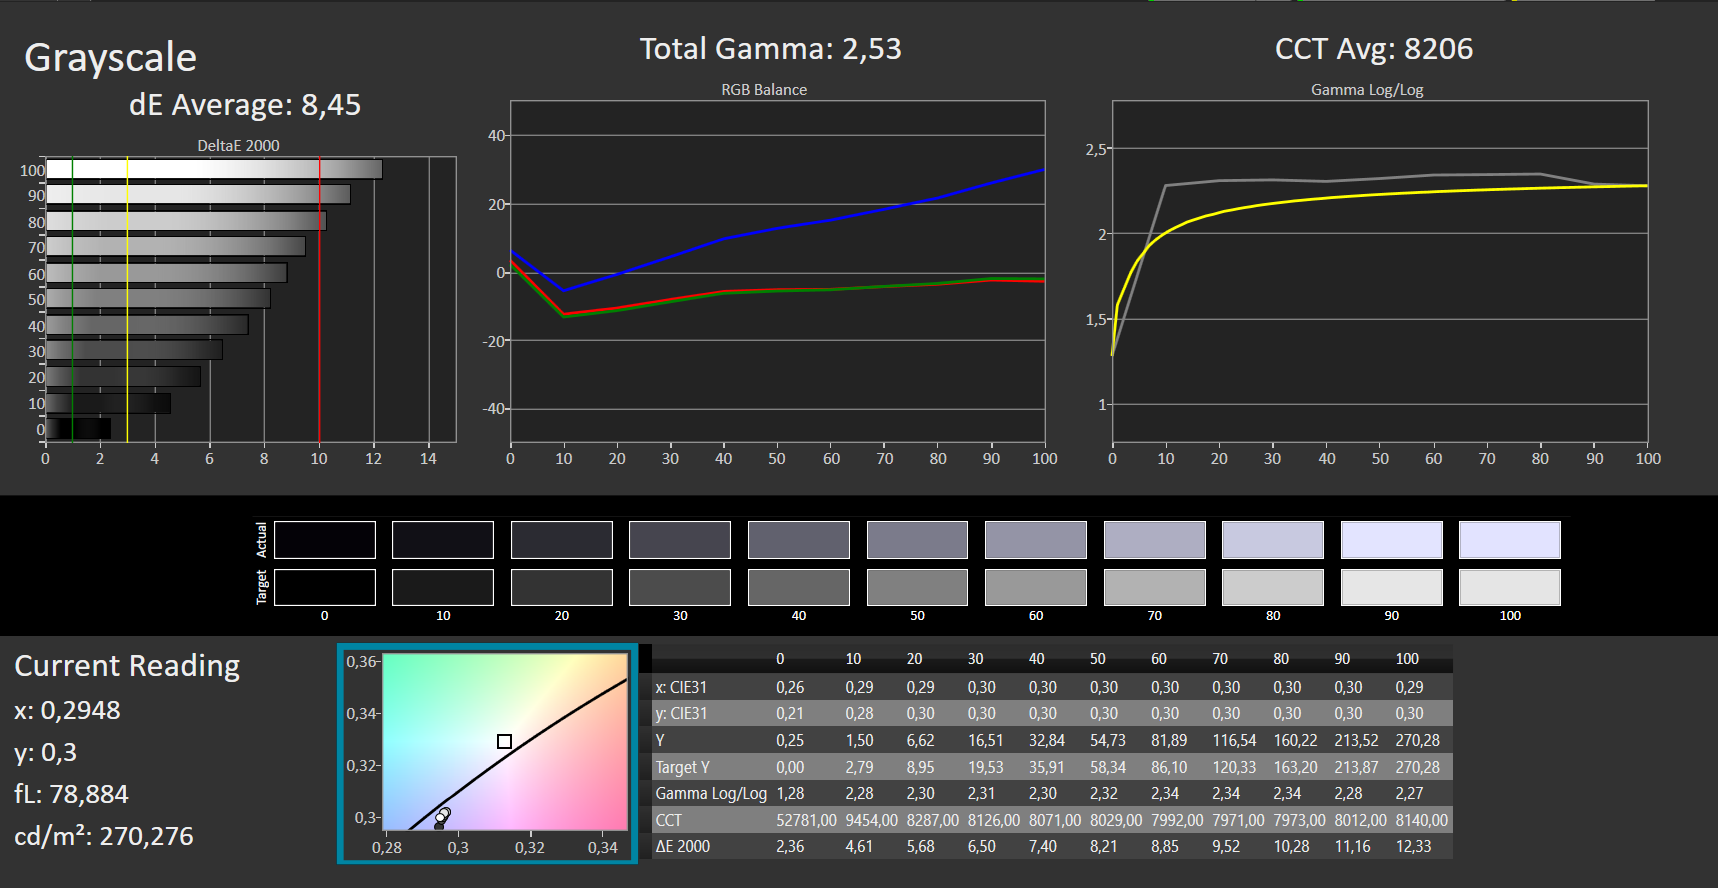
ΔE Greyscale Calman: 8.45 | ∀{0.09-98 Ø4.96}
40.6% AdobeRGB 1998 (Argyll 3D)
59.2% sRGB (Argyll 3D)
39.3% Display P3 (Argyll 3D)
Gamma: 2.53
CCT: 8206 K
| Dell Latitude 5320-TM4V2 Dell 1337L02, IPS, 1920x1080, 13.3" | Dell Latitude 5310-23VP6 Chi Mei CMN1382, IPS, 1920x1080, 13.3" | Lenovo ThinkBook 13s G3 20YA0005GE M133NW4JR0, IPS, 1920x1200, 13.3" | Dell XPS 13 9305 Core i5 FHD Sharp SHP14AE, IPS, 1920x1080, 13.3" | Lenovo ThinkPad L13 Gen2-21AB000PGE IVO M133NWF4 RA, IPS, 1920x1080, 13.3" | Lenovo ThinkBook 14 G2 ITL 20VDS02G00 AU Optronics B140HAN04.E, a-Si IPS LED, 1920x1080, 14" | |
|---|---|---|---|---|---|---|
| Display | 70% | 68% | 66% | -5% | -5% | |
| Display P3 Coverage (%) | 39.3 | 67.5 72% | 67.5 72% | 66.3 69% | 37.47 -5% | 37.2 -5% |
| sRGB Coverage (%) | 59.2 | 99 67% | 97.1 64% | 97.1 64% | 56.3 -5% | 55.5 -6% |
| AdobeRGB 1998 Coverage (%) | 40.6 | 69.2 70% | 68.8 69% | 67.1 65% | 38.7 -5% | 38.4 -5% |
| Response Times | 9% | -31% | -23% | -25% | -14% | |
| Response Time Grey 50% / Grey 80% * (ms) | 36 ? | 36 ? -0% | 53.2 ? -48% | 55 ? -53% | 49.2 ? -37% | 45.9 ? -27% |
| Response Time Black / White * (ms) | 29 ? | 24 ? 17% | 32.8 ? -13% | 27 ? 7% | 32.8 ? -13% | 29 ? -0% |
| PWM Frequency (Hz) | 2500 ? | 996 ? | ||||
| Screen | 37% | 49% | 40% | 20% | 8% | |
| Brightness middle (cd/m²) | 249 | 383 54% | 379 52% | 486 95% | 294 18% | 386 55% |
| Brightness (cd/m²) | 248 | 364 47% | 356 44% | 446 80% | 273 10% | 348 40% |
| Brightness Distribution (%) | 97 | 84 -13% | 88 -9% | 77 -21% | 87 -10% | 83 -14% |
| Black Level * (cd/m²) | 0.23 | 0.34 -48% | 0.23 -0% | 0.4 -74% | 0.275 -20% | 0.29 -26% |
| Contrast (:1) | 1083 | 1126 4% | 1648 52% | 1215 12% | 1069 -1% | 1331 23% |
| Colorchecker dE 2000 * | 6.4 | 2.24 65% | 1.6 75% | 2.54 60% | 3.81 40% | 6.3 2% |
| Colorchecker dE 2000 max. * | 12.52 | 3.32 73% | 2.7 78% | 4.34 65% | 6.22 50% | 18.3 -46% |
| Colorchecker dE 2000 calibrated * | 4.07 | 0.72 82% | 1 75% | 1.04 74% | 3.29 19% | 4.1 -1% |
| Greyscale dE 2000 * | 8.45 | 2.42 71% | 2 76% | 2.34 72% | 2.28 73% | 5.4 36% |
| Gamma | 2.53 87% | 2.65 83% | 2.25 98% | 2.28 96% | 2.48 89% | 2.55 86% |
| CCT | 8206 79% | 6776 96% | 6835 95% | 6864 95% | 6820 95% | 5894 110% |
| Color Space (Percent of AdobeRGB 1998) (%) | 56 | 62 | ||||
| Color Space (Percent of sRGB) (%) | 99 | 97 | ||||
| Media total (Programa/Opciones) | 39% /
40% | 29% /
42% | 28% /
37% | -3% /
8% | -4% /
2% |
* ... más pequeño es mejor
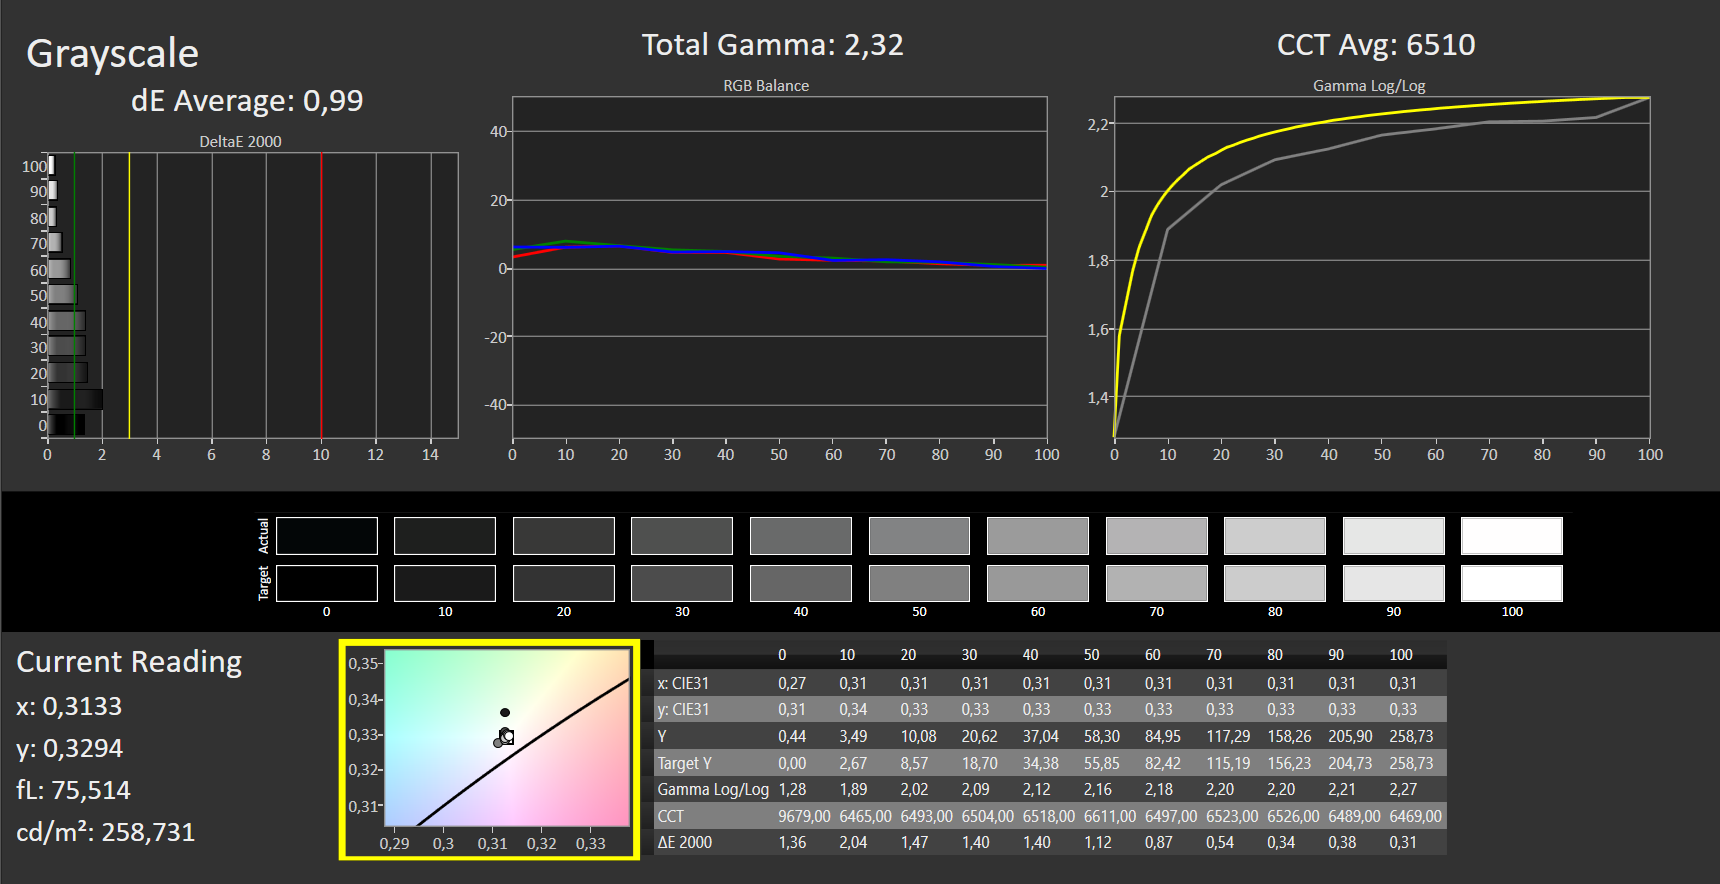
La pantalla muestra una mala reproducción del color en su estado de entrega. Con una desviación de color DeltaE-2000 de 8, no se alcanza el objetivo (DeltaE inferior a 3). Al menos la pobre DeltaE puede ser eliminada a través de la calibración, y el valor de la escala de grises se reduce de 8 a 1 en el proceso. Como propietario de una 5320, podrías probar nuestro perfil de color enlazado en el cuadro anterior, así obtendrás colores más precisos incluso sin un fotoespectrómetro. Para los colores, el DeltaE sólo mejora de 6 a 4.
La pantalla no sufre de un tinte azulado, que ya no es común en los paneles IPS. Los espacios de color AdobeRGB (40%) y sRGB (59%) no se reproducen completamente. El predecesor con su panel Chi Mei tenía unos índices mucho mejores aquí, y el brillo también era significativamente mayor. Este es también el caso de todos los demás contendientes, aunque en parte tengan espacios de color igualmente pobres (ThinkPad L13 Gen2, ThinkBook 14 G2 ITL).
Tiempos de respuesta del display
| ↔ Tiempo de respuesta de Negro a Blanco | ||
|---|---|---|
| 29 ms ... subida ↗ y bajada ↘ combinada | ↗ 13 ms subida |  |
| ↘ 16 ms bajada | ||
| La pantalla mostró tiempos de respuesta relativamente lentos en nuestros tests pero podría ser demasiado lenta para los jugones. En comparación, todos los dispositivos de prueba van de ##min### (mínimo) a 240 (máximo) ms. » 77 % de todos los dispositivos son mejores. Eso quiere decir que el tiempo de respuesta es peor que la media (19.8 ms) de todos los dispositivos testados. | ||
| ↔ Tiempo de respuesta 50% Gris a 80% Gris | ||
| 36 ms ... subida ↗ y bajada ↘ combinada | ↗ 19 ms subida |  |
| ↘ 17 ms bajada | ||
| La pantalla mostró tiempos de respuesta lentos en nuestros tests y podría ser demasiado lenta para los jugones. En comparación, todos los dispositivos de prueba van de ##min### (mínimo) a 636 (máximo) ms. » 51 % de todos los dispositivos son mejores. Eso quiere decir que el tiempo de respuesta es peor que la media (30.9 ms) de todos los dispositivos testados. | ||
Parpadeo de Pantalla / PWM (Pulse-Width Modulation)
| Parpadeo de Pantalla / PWM no detectado |  | ||
Comparación: 52 % de todos los dispositivos testados no usaron PWM para atenuar el display. Si se usó, medimos una media de 7748 (mínimo: 5 - máxmo: 343500) Hz. | |||
Dell equipa el 5320 con un panel IPS que tiene ángulos de visión estables. Así, la pantalla puede leerse desde cualquier posición. En exteriores, la lectura de la pantalla es un problema debido al bajo brillo, al menos cuando brilla el sol. El revestimiento antirreflectante ayuda, pero la luminancia máxima de 249 cd/m² en el centro de la pantalla es simplemente demasiado baja para una buena legibilidad.
Rendimiento - Core i5 más lento de lo esperado
El Latitude 5320 de Dell es uno de los portátiles empresariales de gama media. El procesador de bajo voltaje instalado ofrece suficiente potencia de cálculo para aplicaciones de oficina e Internet. Nuestro dispositivo de pruebas está disponible en diferentes configuraciones por entre 900 y 1250 euros. Nuestro modelo con Core i5, pequeño SSD de 256 GB y pantalla no táctil es la configuración más pequeña. Llamativo: Dell no ofrece una versión Core i7 en las tiendas, pero sí en la tienda interna (i7-1185G7).
Condiciones de la prueba
Ejecutamos todas las pruebas en modo Ultra Performance (Dell Power Manager/Temperature Management). Usamos el modo optimizado para la duración de la batería y para las mediciones de temperatura en reposo.
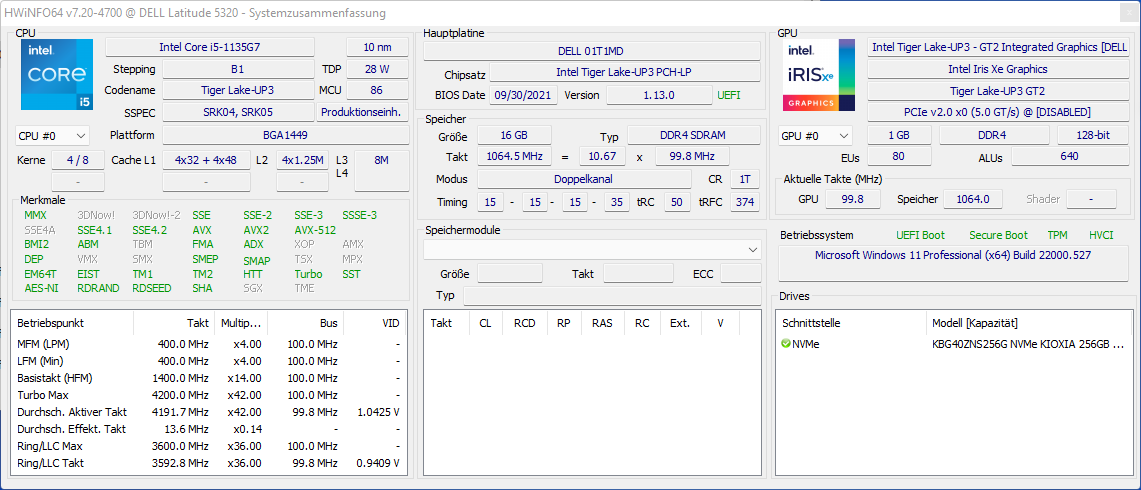
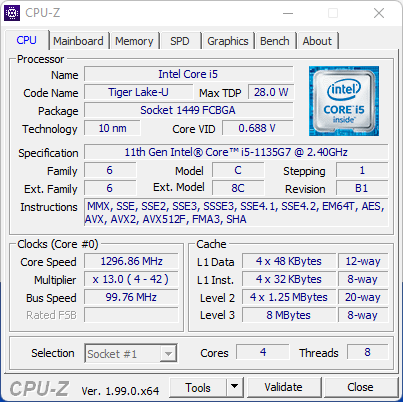
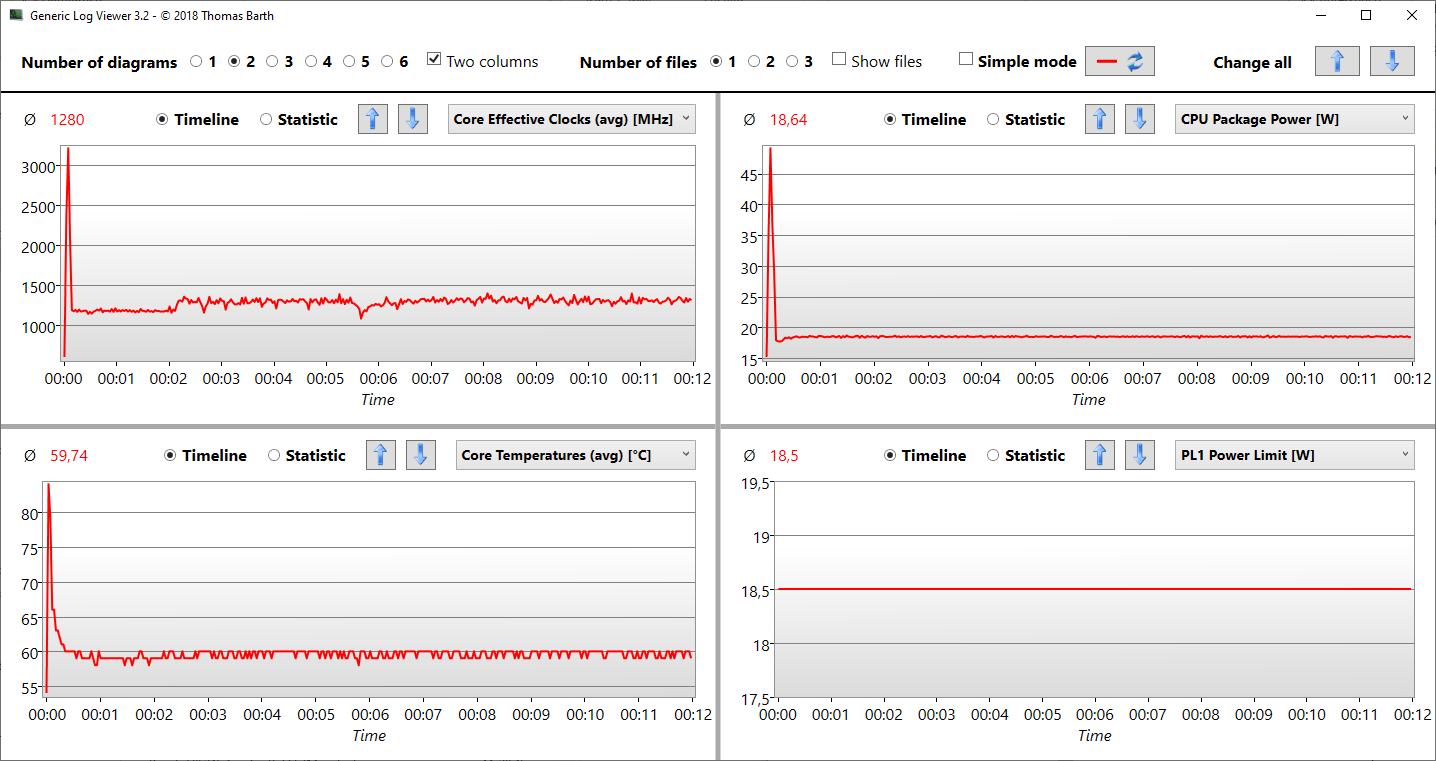
Procesador
El procesador Intel Core i5-1135G7 es un procesador de cuatro núcleos de la generación Tiger Lake de Intel con un reloj base de 2,4 GHz y un reloj Turbo de hasta 4,2 GHz. El rendimiento está entre un 5 y un 10% por debajo del nivel medio, como muestran todos los benchmarks de CPU.
El hecho de que el Core i5-1135G7 puede hacer más, lo demuestra el Lenovo ThinkPad L14 G2 877 puntos en lugar de sólo 660 en la primera ejecución, y esta diferencia no disminuye significativamente con el tiempo.
El rendimiento constante en el bucle es sorprendente. Sin embargo, el SoC se permite 3,6 GHz y casi 100 grados Celsius durante unos segundos en la primera ejecución. Después, el reloj se ralentiza hasta los 2,0 GHz, la temperatura baja considerablemente y se mantiene en torno a los 65 grados Celsius durante el resto de la ejecución. El bucle continúa a una velocidad constante de 2,6 GHz a lo largo del tiempo.
¿Qué hacen PL1 y PL2 bajo la carga de Cinebench en todos los núcleos? Mientras que el paquete de la CPU se permite 37 vatios durante un tiempo muy corto (unos pocos segundos) al principio, es un continuo de 18 vatios durante el curso de la prueba (duración de PL1).
Lo desconectamos después de 15 minutos: la potencia del paquete baja a 16 vatios y la velocidad de reloj desciende a 2,3 GHz. Por tanto, no se puede aprovechar todo el rendimiento del procesador en modo batería.
Si el rendimiento de otros portátiles puede seguir el ritmo aquí se puede ver en nuestra Lista de pruebas de CPU.
Cinebench R15 multi endurance test
Cinebench R23: Multi Core | Single Core
Cinebench R20: CPU (Multi Core) | CPU (Single Core)
Cinebench R15: CPU Multi 64Bit | CPU Single 64Bit
Blender: v2.79 BMW27 CPU
7-Zip 18.03: 7z b 4 | 7z b 4 -mmt1
Geekbench 5.5: Multi-Core | Single-Core
HWBOT x265 Benchmark v2.2: 4k Preset
LibreOffice : 20 Documents To PDF
R Benchmark 2.5: Overall mean
| CPU Performance rating | |
| Media de la clase Subnotebook | |
| Lenovo ThinkBook 13s G3 20YA0005GE | |
| Lenovo ThinkPad L13 Gen2-21AB000PGE | |
| Lenovo ThinkPad L14 G2-20X1003WGE | |
| Medio Intel Core i5-1135G7 | |
| Acer TravelMate P4 TMP414-51-59MR | |
| Dell XPS 13 9305 Core i5 FHD -2! | |
| Dell Latitude 5320-TM4V2 -1! | |
| Lenovo ThinkBook 14 G2 ITL 20VDS02G00 | |
| Dell Latitude 5310-23VP6 -2! | |
| Cinebench R23 / Multi Core | |
| Media de la clase Subnotebook (1555 - 21812, n=60, últimos 2 años) | |
| Lenovo ThinkBook 13s G3 20YA0005GE | |
| Lenovo ThinkPad L13 Gen2-21AB000PGE | |
| Dell XPS 13 9305 Core i5 FHD | |
| Lenovo ThinkPad L14 G2-20X1003WGE | |
| Acer TravelMate P4 TMP414-51-59MR | |
| Medio Intel Core i5-1135G7 (2786 - 6136, n=55) | |
| Dell Latitude 5320-TM4V2 | |
| Lenovo ThinkBook 14 G2 ITL 20VDS02G00 | |
| Cinebench R23 / Single Core | |
| Media de la clase Subnotebook (358 - 2213, n=61, últimos 2 años) | |
| Lenovo ThinkBook 13s G3 20YA0005GE | |
| Acer TravelMate P4 TMP414-51-59MR | |
| Lenovo ThinkPad L13 Gen2-21AB000PGE | |
| Lenovo ThinkPad L14 G2-20X1003WGE | |
| Medio Intel Core i5-1135G7 (1062 - 1373, n=53) | |
| Lenovo ThinkBook 14 G2 ITL 20VDS02G00 | |
| Dell XPS 13 9305 Core i5 FHD | |
| Dell Latitude 5320-TM4V2 | |
| Cinebench R20 / CPU (Multi Core) | |
| Media de la clase Subnotebook (579 - 8541, n=57, últimos 2 años) | |
| Lenovo ThinkBook 13s G3 20YA0005GE | |
| Lenovo ThinkPad L13 Gen2-21AB000PGE | |
| Lenovo ThinkPad L14 G2-20X1003WGE | |
| Dell XPS 13 9305 Core i5 FHD | |
| Medio Intel Core i5-1135G7 (979 - 2382, n=62) | |
| Acer TravelMate P4 TMP414-51-59MR | |
| Dell Latitude 5320-TM4V2 | |
| Lenovo ThinkBook 14 G2 ITL 20VDS02G00 | |
| Dell Latitude 5310-23VP6 | |
| Cinebench R20 / CPU (Single Core) | |
| Media de la clase Subnotebook (128 - 832, n=57, últimos 2 años) | |
| Lenovo ThinkBook 13s G3 20YA0005GE | |
| Acer TravelMate P4 TMP414-51-59MR | |
| Lenovo ThinkPad L13 Gen2-21AB000PGE | |
| Lenovo ThinkPad L14 G2-20X1003WGE | |
| Lenovo ThinkBook 14 G2 ITL 20VDS02G00 | |
| Medio Intel Core i5-1135G7 (375 - 527, n=62) | |
| Dell XPS 13 9305 Core i5 FHD | |
| Dell Latitude 5320-TM4V2 | |
| Dell Latitude 5310-23VP6 | |
| Cinebench R15 / CPU Multi 64Bit | |
| Media de la clase Subnotebook (327 - 3345, n=57, últimos 2 años) | |
| Lenovo ThinkBook 13s G3 20YA0005GE | |
| Lenovo ThinkBook 13s G3 20YA0005GE | |
| Lenovo ThinkPad L13 Gen2-21AB000PGE | |
| Lenovo ThinkPad L14 G2-20X1003WGE | |
| Acer TravelMate P4 TMP414-51-59MR | |
| Medio Intel Core i5-1135G7 (431 - 941, n=65) | |
| Dell XPS 13 9305 Core i5 FHD | |
| Dell Latitude 5320-TM4V2 | |
| Dell Latitude 5310-23VP6 | |
| Lenovo ThinkBook 14 G2 ITL 20VDS02G00 | |
| Cinebench R15 / CPU Single 64Bit | |
| Media de la clase Subnotebook (72.4 - 322, n=57, últimos 2 años) | |
| Lenovo ThinkBook 13s G3 20YA0005GE | |
| Lenovo ThinkPad L13 Gen2-21AB000PGE | |
| Lenovo ThinkPad L14 G2-20X1003WGE | |
| Medio Intel Core i5-1135G7 (141.4 - 205, n=61) | |
| Dell Latitude 5320-TM4V2 | |
| Lenovo ThinkBook 14 G2 ITL 20VDS02G00 | |
| Dell Latitude 5310-23VP6 | |
| Acer TravelMate P4 TMP414-51-59MR | |
| Blender / v2.79 BMW27 CPU | |
| Lenovo ThinkBook 14 G2 ITL 20VDS02G00 | |
| Dell Latitude 5310-23VP6 | |
| Medio Intel Core i5-1135G7 (499 - 1044, n=60) | |
| Acer TravelMate P4 TMP414-51-59MR | |
| Dell XPS 13 9305 Core i5 FHD | |
| Dell Latitude 5320-TM4V2 | |
| Lenovo ThinkPad L14 G2-20X1003WGE | |
| Lenovo ThinkPad L13 Gen2-21AB000PGE | |
| Lenovo ThinkBook 13s G3 20YA0005GE | |
| Media de la clase Subnotebook (159 - 2271, n=58, últimos 2 años) | |
| 7-Zip 18.03 / 7z b 4 | |
| Media de la clase Subnotebook (11668 - 77867, n=57, últimos 2 años) | |
| Lenovo ThinkBook 13s G3 20YA0005GE | |
| Lenovo ThinkPad L13 Gen2-21AB000PGE | |
| Dell XPS 13 9305 Core i5 FHD | |
| Lenovo ThinkPad L14 G2-20X1003WGE | |
| Dell Latitude 5320-TM4V2 | |
| Acer TravelMate P4 TMP414-51-59MR | |
| Medio Intel Core i5-1135G7 (14745 - 24873, n=62) | |
| Dell Latitude 5310-23VP6 | |
| Lenovo ThinkBook 14 G2 ITL 20VDS02G00 | |
| 7-Zip 18.03 / 7z b 4 -mmt1 | |
| Media de la clase Subnotebook (2643 - 6699, n=59, últimos 2 años) | |
| Lenovo ThinkBook 13s G3 20YA0005GE | |
| Lenovo ThinkPad L13 Gen2-21AB000PGE | |
| Acer TravelMate P4 TMP414-51-59MR | |
| Medio Intel Core i5-1135G7 (3924 - 4921, n=62) | |
| Lenovo ThinkPad L14 G2-20X1003WGE | |
| Lenovo ThinkBook 14 G2 ITL 20VDS02G00 | |
| Dell XPS 13 9305 Core i5 FHD | |
| Dell Latitude 5320-TM4V2 | |
| Dell Latitude 5310-23VP6 | |
| Geekbench 5.5 / Multi-Core | |
| Media de la clase Subnotebook (2557 - 17218, n=49, últimos 2 años) | |
| Lenovo ThinkBook 13s G3 20YA0005GE | |
| Lenovo ThinkPad L13 Gen2-21AB000PGE | |
| Dell XPS 13 9305 Core i5 FHD | |
| Medio Intel Core i5-1135G7 (3475 - 5472, n=58) | |
| Dell Latitude 5320-TM4V2 | |
| Acer TravelMate P4 TMP414-51-59MR | |
| Lenovo ThinkPad L14 G2-20X1003WGE | |
| Dell Latitude 5310-23VP6 | |
| Lenovo ThinkBook 14 G2 ITL 20VDS02G00 | |
| Geekbench 5.5 / Single-Core | |
| Media de la clase Subnotebook (726 - 2224, n=49, últimos 2 años) | |
| Lenovo ThinkBook 13s G3 20YA0005GE | |
| Medio Intel Core i5-1135G7 (1147 - 1428, n=58) | |
| Dell XPS 13 9305 Core i5 FHD | |
| Acer TravelMate P4 TMP414-51-59MR | |
| Lenovo ThinkPad L13 Gen2-21AB000PGE | |
| Dell Latitude 5320-TM4V2 | |
| Lenovo ThinkPad L14 G2-20X1003WGE | |
| Lenovo ThinkBook 14 G2 ITL 20VDS02G00 | |
| Dell Latitude 5310-23VP6 | |
| HWBOT x265 Benchmark v2.2 / 4k Preset | |
| Media de la clase Subnotebook (0.97 - 25.1, n=57, últimos 2 años) | |
| Lenovo ThinkBook 13s G3 20YA0005GE | |
| Lenovo ThinkPad L13 Gen2-21AB000PGE | |
| Lenovo ThinkPad L14 G2-20X1003WGE | |
| Medio Intel Core i5-1135G7 (3.57 - 7.6, n=57) | |
| Acer TravelMate P4 TMP414-51-59MR | |
| Dell Latitude 5310-23VP6 | |
| Lenovo ThinkBook 14 G2 ITL 20VDS02G00 | |
| LibreOffice / 20 Documents To PDF | |
| Dell Latitude 5310-23VP6 | |
| Dell XPS 13 9305 Core i5 FHD | |
| Dell Latitude 5320-TM4V2 | |
| Lenovo ThinkPad L13 Gen2-21AB000PGE | |
| Media de la clase Subnotebook (39.9 - 220, n=56, últimos 2 años) | |
| Medio Intel Core i5-1135G7 (44.2 - 62.9, n=60) | |
| Acer TravelMate P4 TMP414-51-59MR | |
| Lenovo ThinkPad L14 G2-20X1003WGE | |
| Lenovo ThinkBook 13s G3 20YA0005GE | |
| Lenovo ThinkBook 14 G2 ITL 20VDS02G00 | |
| R Benchmark 2.5 / Overall mean | |
| Dell Latitude 5310-23VP6 | |
| Lenovo ThinkBook 14 G2 ITL 20VDS02G00 | |
| Dell Latitude 5320-TM4V2 | |
| Dell XPS 13 9305 Core i5 FHD | |
| Lenovo ThinkPad L14 G2-20X1003WGE | |
| Medio Intel Core i5-1135G7 (0.619 - 0.727, n=59) | |
| Acer TravelMate P4 TMP414-51-59MR | |
| Lenovo ThinkPad L13 Gen2-21AB000PGE | |
| Lenovo ThinkBook 13s G3 20YA0005GE | |
| Media de la clase Subnotebook (0.4024 - 1.456, n=58, últimos 2 años) | |
* ... más pequeño es mejor
AIDA64: FP32 Ray-Trace | FPU Julia | CPU SHA3 | CPU Queen | FPU SinJulia | FPU Mandel | CPU AES | CPU ZLib | FP64 Ray-Trace | CPU PhotoWorxx
| Performance rating | |
| Lenovo ThinkBook 13s G3 20YA0005GE | |
| Media de la clase Subnotebook | |
| Lenovo ThinkPad L13 Gen2-21AB000PGE | |
| Medio Intel Core i5-1135G7 | |
| Lenovo ThinkPad L14 G2-20X1003WGE | |
| Acer TravelMate P4 TMP414-51-59MR | |
| Dell Latitude 5320-TM4V2 | |
| Dell Latitude 5310-23VP6 | |
| Lenovo ThinkBook 14 G2 ITL 20VDS02G00 | |
| AIDA64 / FP32 Ray-Trace | |
| Media de la clase Subnotebook (1135 - 32888, n=58, últimos 2 años) | |
| Lenovo ThinkBook 13s G3 20YA0005GE | |
| Lenovo ThinkPad L13 Gen2-21AB000PGE | |
| Medio Intel Core i5-1135G7 (4313 - 7952, n=45) | |
| Acer TravelMate P4 TMP414-51-59MR | |
| Lenovo ThinkPad L14 G2-20X1003WGE | |
| Dell Latitude 5320-TM4V2 | |
| Dell Latitude 5310-23VP6 | |
| Lenovo ThinkBook 14 G2 ITL 20VDS02G00 | |
| AIDA64 / FPU Julia | |
| Lenovo ThinkBook 13s G3 20YA0005GE | |
| Media de la clase Subnotebook (5218 - 123315, n=58, últimos 2 años) | |
| Lenovo ThinkPad L13 Gen2-21AB000PGE | |
| Medio Intel Core i5-1135G7 (19402 - 32283, n=45) | |
| Lenovo ThinkPad L14 G2-20X1003WGE | |
| Dell Latitude 5310-23VP6 | |
| Acer TravelMate P4 TMP414-51-59MR | |
| Dell Latitude 5320-TM4V2 | |
| Lenovo ThinkBook 14 G2 ITL 20VDS02G00 | |
| AIDA64 / CPU SHA3 | |
| Media de la clase Subnotebook (444 - 5287, n=58, últimos 2 años) | |
| Lenovo ThinkBook 13s G3 20YA0005GE | |
| Medio Intel Core i5-1135G7 (1316 - 2172, n=45) | |
| Lenovo ThinkPad L14 G2-20X1003WGE | |
| Acer TravelMate P4 TMP414-51-59MR | |
| Dell Latitude 5320-TM4V2 | |
| Lenovo ThinkPad L13 Gen2-21AB000PGE | |
| Dell Latitude 5310-23VP6 | |
| Lenovo ThinkBook 14 G2 ITL 20VDS02G00 | |
| AIDA64 / CPU Queen | |
| Lenovo ThinkBook 13s G3 20YA0005GE | |
| Lenovo ThinkPad L13 Gen2-21AB000PGE | |
| Media de la clase Subnotebook (10579 - 95002, n=48, últimos 2 años) | |
| Dell Latitude 5310-23VP6 | |
| Acer TravelMate P4 TMP414-51-59MR | |
| Lenovo ThinkPad L14 G2-20X1003WGE | |
| Medio Intel Core i5-1135G7 (39000 - 46951, n=45) | |
| Dell Latitude 5320-TM4V2 | |
| Lenovo ThinkBook 14 G2 ITL 20VDS02G00 | |
| AIDA64 / FPU SinJulia | |
| Lenovo ThinkBook 13s G3 20YA0005GE | |
| Lenovo ThinkPad L13 Gen2-21AB000PGE | |
| Media de la clase Subnotebook (744 - 18418, n=58, últimos 2 años) | |
| Dell Latitude 5310-23VP6 | |
| Acer TravelMate P4 TMP414-51-59MR | |
| Medio Intel Core i5-1135G7 (3497 - 4445, n=45) | |
| Lenovo ThinkPad L14 G2-20X1003WGE | |
| Dell Latitude 5320-TM4V2 | |
| Lenovo ThinkBook 14 G2 ITL 20VDS02G00 | |
| AIDA64 / FPU Mandel | |
| Lenovo ThinkBook 13s G3 20YA0005GE | |
| Media de la clase Subnotebook (3341 - 65433, n=58, últimos 2 años) | |
| Lenovo ThinkPad L13 Gen2-21AB000PGE | |
| Medio Intel Core i5-1135G7 (12569 - 19635, n=45) | |
| Acer TravelMate P4 TMP414-51-59MR | |
| Lenovo ThinkPad L14 G2-20X1003WGE | |
| Dell Latitude 5320-TM4V2 | |
| Dell Latitude 5310-23VP6 | |
| Lenovo ThinkBook 14 G2 ITL 20VDS02G00 | |
| AIDA64 / CPU AES | |
| Lenovo ThinkBook 13s G3 20YA0005GE | |
| Lenovo ThinkPad L14 G2-20X1003WGE | |
| Acer TravelMate P4 TMP414-51-59MR | |
| Medio Intel Core i5-1135G7 (28988 - 67977, n=45) | |
| Media de la clase Subnotebook (638 - 96917, n=58, últimos 2 años) | |
| Lenovo ThinkBook 14 G2 ITL 20VDS02G00 | |
| Dell Latitude 5320-TM4V2 | |
| Lenovo ThinkPad L13 Gen2-21AB000PGE | |
| Dell Latitude 5310-23VP6 | |
| AIDA64 / CPU ZLib | |
| Media de la clase Subnotebook (164.9 - 1379, n=58, últimos 2 años) | |
| Lenovo ThinkBook 13s G3 20YA0005GE | |
| Lenovo ThinkPad L13 Gen2-21AB000PGE | |
| Lenovo ThinkPad L14 G2-20X1003WGE | |
| Acer TravelMate P4 TMP414-51-59MR | |
| Dell Latitude 5310-23VP6 | |
| Medio Intel Core i5-1135G7 (265 - 373, n=51) | |
| Dell Latitude 5320-TM4V2 | |
| Lenovo ThinkBook 14 G2 ITL 20VDS02G00 | |
| AIDA64 / FP64 Ray-Trace | |
| Media de la clase Subnotebook (610 - 17495, n=58, últimos 2 años) | |
| Lenovo ThinkBook 13s G3 20YA0005GE | |
| Lenovo ThinkPad L13 Gen2-21AB000PGE | |
| Medio Intel Core i5-1135G7 (2226 - 4291, n=45) | |
| Acer TravelMate P4 TMP414-51-59MR | |
| Lenovo ThinkPad L14 G2-20X1003WGE | |
| Dell Latitude 5320-TM4V2 | |
| Dell Latitude 5310-23VP6 | |
| Lenovo ThinkBook 14 G2 ITL 20VDS02G00 | |
| AIDA64 / CPU PhotoWorxx | |
| Media de la clase Subnotebook (6569 - 85600, n=58, últimos 2 años) | |
| Medio Intel Core i5-1135G7 (9004 - 45366, n=45) | |
| Dell Latitude 5320-TM4V2 | |
| Lenovo ThinkBook 13s G3 20YA0005GE | |
| Lenovo ThinkPad L13 Gen2-21AB000PGE | |
| Dell Latitude 5310-23VP6 | |
| Acer TravelMate P4 TMP414-51-59MR | |
| Lenovo ThinkBook 14 G2 ITL 20VDS02G00 | |
| Lenovo ThinkPad L14 G2-20X1003WGE | |
Rendimiento del sistema
El rendimiento del sistema está en un nivel inferior a la media. La mayoría de los competidores son más rápidos aquí, especialmente aquellos con AMD (¡40%!). El modelo de pruebas está a la par con un Lenovo ThinkBook 14 G2 ITL, que tiene un Tiger Lake Core i3. Especialmente el campo de la productividad está por debajo de la media para el Latitude 5320.
En el uso práctico, todas las tareas diarias pudieron ser completadas casi sin demoras, no hubo conspicuidades. Por lo tanto, es un rendimiento inferior medible, pero no tangible.
CrossMark: Overall | Productivity | Creativity | Responsiveness
| PCMark 10 / Score | |
| Media de la clase Subnotebook (4920 - 9939, n=46, últimos 2 años) | |
| Lenovo ThinkBook 13s G3 20YA0005GE | |
| Lenovo ThinkPad L13 Gen2-21AB000PGE | |
| Dell XPS 13 9305 Core i5 FHD | |
| Acer TravelMate P4 TMP414-51-59MR | |
| Medio Intel Core i5-1135G7, Intel Iris Xe Graphics G7 80EUs (4026 - 4952, n=53) | |
| Lenovo ThinkPad L14 G2-20X1003WGE | |
| Dell Latitude 5320-TM4V2 | |
| Lenovo ThinkBook 14 G2 ITL 20VDS02G00 | |
| Dell Latitude 5310-23VP6 | |
| PCMark 10 / Essentials | |
| Media de la clase Subnotebook (8552 - 11646, n=46, últimos 2 años) | |
| Lenovo ThinkBook 13s G3 20YA0005GE | |
| Lenovo ThinkPad L13 Gen2-21AB000PGE | |
| Dell XPS 13 9305 Core i5 FHD | |
| Medio Intel Core i5-1135G7, Intel Iris Xe Graphics G7 80EUs (8149 - 9917, n=53) | |
| Dell Latitude 5320-TM4V2 | |
| Acer TravelMate P4 TMP414-51-59MR | |
| Lenovo ThinkBook 14 G2 ITL 20VDS02G00 | |
| Lenovo ThinkPad L14 G2-20X1003WGE | |
| Dell Latitude 5310-23VP6 | |
| PCMark 10 / Productivity | |
| Media de la clase Subnotebook (5435 - 16606, n=46, últimos 2 años) | |
| Lenovo ThinkBook 13s G3 20YA0005GE | |
| Lenovo ThinkPad L13 Gen2-21AB000PGE | |
| Dell Latitude 5310-23VP6 | |
| Lenovo ThinkBook 14 G2 ITL 20VDS02G00 | |
| Acer TravelMate P4 TMP414-51-59MR | |
| Dell XPS 13 9305 Core i5 FHD | |
| Lenovo ThinkPad L14 G2-20X1003WGE | |
| Medio Intel Core i5-1135G7, Intel Iris Xe Graphics G7 80EUs (5040 - 6619, n=53) | |
| Dell Latitude 5320-TM4V2 | |
| PCMark 10 / Digital Content Creation | |
| Media de la clase Subnotebook (5722 - 13779, n=46, últimos 2 años) | |
| Lenovo ThinkBook 13s G3 20YA0005GE | |
| Lenovo ThinkPad L13 Gen2-21AB000PGE | |
| Acer TravelMate P4 TMP414-51-59MR | |
| Dell XPS 13 9305 Core i5 FHD | |
| Lenovo ThinkPad L14 G2-20X1003WGE | |
| Dell Latitude 5320-TM4V2 | |
| Medio Intel Core i5-1135G7, Intel Iris Xe Graphics G7 80EUs (3548 - 5255, n=53) | |
| Lenovo ThinkBook 14 G2 ITL 20VDS02G00 | |
| Dell Latitude 5310-23VP6 | |
| CrossMark / Overall | |
| Media de la clase Subnotebook (365 - 2356, n=60, últimos 2 años) | |
| Lenovo ThinkBook 13s G3 20YA0005GE | |
| Medio Intel Core i5-1135G7, Intel Iris Xe Graphics G7 80EUs (1058 - 1293, n=11) | |
| Acer TravelMate P4 TMP414-51-59MR | |
| Dell Latitude 5320-TM4V2 | |
| Lenovo ThinkBook 14 G2 ITL 20VDS02G00 | |
| CrossMark / Productivity | |
| Media de la clase Subnotebook (364 - 2277, n=60, últimos 2 años) | |
| Lenovo ThinkBook 13s G3 20YA0005GE | |
| Medio Intel Core i5-1135G7, Intel Iris Xe Graphics G7 80EUs (1148 - 1332, n=11) | |
| Acer TravelMate P4 TMP414-51-59MR | |
| Lenovo ThinkBook 14 G2 ITL 20VDS02G00 | |
| Dell Latitude 5320-TM4V2 | |
| CrossMark / Creativity | |
| Media de la clase Subnotebook (372 - 2743, n=60, últimos 2 años) | |
| Lenovo ThinkBook 13s G3 20YA0005GE | |
| Medio Intel Core i5-1135G7, Intel Iris Xe Graphics G7 80EUs (895 - 1263, n=11) | |
| Dell Latitude 5320-TM4V2 | |
| Acer TravelMate P4 TMP414-51-59MR | |
| Lenovo ThinkBook 14 G2 ITL 20VDS02G00 | |
| CrossMark / Responsiveness | |
| Media de la clase Subnotebook (312 - 1854, n=60, últimos 2 años) | |
| Medio Intel Core i5-1135G7, Intel Iris Xe Graphics G7 80EUs (923 - 1320, n=11) | |
| Lenovo ThinkBook 13s G3 20YA0005GE | |
| Lenovo ThinkBook 14 G2 ITL 20VDS02G00 | |
| Acer TravelMate P4 TMP414-51-59MR | |
| Dell Latitude 5320-TM4V2 | |
| PCMark 10 Score | 4325 puntos | |
ayuda | ||
| AIDA64 / Memory Copy | |
| Media de la clase Subnotebook (14554 - 131023, n=58, últimos 2 años) | |
| Medio Intel Core i5-1135G7 (17443 - 63889, n=45) | |
| Lenovo ThinkBook 13s G3 20YA0005GE | |
| Lenovo ThinkPad L13 Gen2-21AB000PGE | |
| Dell Latitude 5320-TM4V2 | |
| Dell Latitude 5310-23VP6 | |
| Lenovo ThinkPad L14 G2-20X1003WGE | |
| Acer TravelMate P4 TMP414-51-59MR | |
| Lenovo ThinkBook 14 G2 ITL 20VDS02G00 | |
| AIDA64 / Memory Read | |
| Media de la clase Subnotebook (15948 - 127174, n=58, últimos 2 años) | |
| Medio Intel Core i5-1135G7 (19716 - 63705, n=45) | |
| Dell Latitude 5320-TM4V2 | |
| Lenovo ThinkPad L13 Gen2-21AB000PGE | |
| Lenovo ThinkBook 13s G3 20YA0005GE | |
| Acer TravelMate P4 TMP414-51-59MR | |
| Lenovo ThinkPad L14 G2-20X1003WGE | |
| Lenovo ThinkBook 14 G2 ITL 20VDS02G00 | |
| Dell Latitude 5310-23VP6 | |
| AIDA64 / Memory Write | |
| Media de la clase Subnotebook (15709 - 135141, n=58, últimos 2 años) | |
| Medio Intel Core i5-1135G7 (18722 - 66778, n=45) | |
| Dell Latitude 5320-TM4V2 | |
| Lenovo ThinkBook 13s G3 20YA0005GE | |
| Lenovo ThinkPad L13 Gen2-21AB000PGE | |
| Acer TravelMate P4 TMP414-51-59MR | |
| Lenovo ThinkPad L14 G2-20X1003WGE | |
| Dell Latitude 5310-23VP6 | |
| Lenovo ThinkBook 14 G2 ITL 20VDS02G00 | |
| AIDA64 / Memory Latency | |
| Lenovo ThinkPad L13 Gen2-21AB000PGE | |
| Lenovo ThinkBook 13s G3 20YA0005GE | |
| Dell Latitude 5310-23VP6 | |
| Media de la clase Subnotebook (6.1 - 159.9, n=56, últimos 2 años) | |
| Lenovo ThinkBook 14 G2 ITL 20VDS02G00 | |
| Lenovo ThinkPad L14 G2-20X1003WGE | |
| Acer TravelMate P4 TMP414-51-59MR | |
| Dell Latitude 5320-TM4V2 | |
| Medio Intel Core i5-1135G7 (68.3 - 107, n=51) | |
* ... más pequeño es mejor
Latencias del CPD
Sólo pudimos determinar bajas interrupciones en la prueba DPC de LatencyMon con nuestro Latitude 5320. Los controladores ACPI de nuestro dispositivo fueron la razón de esto. La prueba DPC indica la configuración actual del controlador.
| DPC Latencies / LatencyMon - interrupt to process latency (max), Web, Youtube, Prime95 | |
| Acer TravelMate P4 TMP414-51-59MR | |
| Lenovo ThinkBook 14 G2 ITL 20VDS02G00 | |
| Lenovo ThinkPad L14 G2-20X1003WGE | |
| Dell Latitude 5320-TM4V2 | |
| Lenovo ThinkPad L13 Gen2-21AB000PGE | |
| Lenovo ThinkBook 13s G3 20YA0005GE | |
| Dell XPS 13 9305 Core i5 FHD | |
* ... más pequeño es mejor
Almacenamiento
La unidad de sistema de nuestra unidad de análisis es un SSD de 256 GB de Kioxia (antigua división de SSD de Toshiba), que se conecta a través de la interfaz M.2 PCIe 3. El rendimiento del SSD es casi un 40% inferior al de la competencia. Esta podría ser la razón de la baja puntuación en PCMark 10.
Hay más pruebas de rendimiento de este y otros SSDs en nuestra sección de tecnología.

| Drive Performance rating - Percent | |
| Media de la clase Subnotebook | |
| Lenovo ThinkPad L14 G2-20X1003WGE | |
| Dell XPS 13 9305 Core i5 FHD | |
| Lenovo ThinkPad L13 Gen2-21AB000PGE | |
| Lenovo ThinkBook 13s G3 20YA0005GE | |
| Lenovo ThinkBook 14 G2 ITL 20VDS02G00 | |
| Acer TravelMate P4 TMP414-51-59MR | |
| Medio Toshiba KBG40ZNS256G NVMe | |
| Dell Latitude 5320-TM4V2 | |
* ... más pequeño es mejor
Continuous load read: DiskSpd Read Loop, Queue Depth 8
Tarjeta gráfica
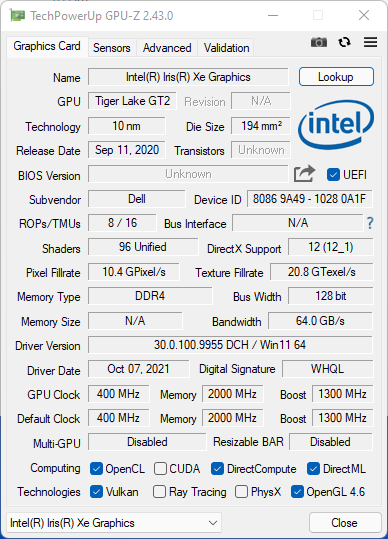
Dell confía en la iGPU para la solución gráfica IGPU Intel Iris Xe G7 con 80 UEs. Su rendimiento depende de la configuración de la memoria de trabajo instalada y de la eficacia de la solución de refrigeración. El rendimiento es medio o casi medio en las pruebas 3DMark.
| 3DMark Performance rating - Percent | |
| Media de la clase Subnotebook | |
| Dell XPS 13 9305 Core i5 FHD | |
| Lenovo ThinkBook 13s G3 20YA0005GE | |
| Medio Intel Iris Xe Graphics G7 80EUs | |
| Dell Latitude 5320-TM4V2 | |
| Lenovo ThinkPad L13 Gen2-21AB000PGE | |
| Acer TravelMate P4 TMP414-51-59MR | |
| Lenovo ThinkPad L14 G2-20X1003WGE | |
| Lenovo ThinkBook 14 G2 ITL 20VDS02G00 | |
| Dell Latitude 5310-23VP6 -2! | |
| 3DMark 11 - 1280x720 Performance GPU | |
| Media de la clase Subnotebook (995 - 18489, n=55, últimos 2 años) | |
| Lenovo ThinkBook 13s G3 20YA0005GE | |
| Dell XPS 13 9305 Core i5 FHD | |
| Medio Intel Iris Xe Graphics G7 80EUs (2246 - 6579, n=112) | |
| Dell Latitude 5320-TM4V2 | |
| Lenovo ThinkPad L13 Gen2-21AB000PGE | |
| Acer TravelMate P4 TMP414-51-59MR | |
| Lenovo ThinkPad L14 G2-20X1003WGE | |
| Lenovo ThinkBook 14 G2 ITL 20VDS02G00 | |
| 3DMark | |
| 1920x1080 Fire Strike Graphics | |
| Media de la clase Subnotebook (832 - 32931, n=57, últimos 2 años) | |
| Dell XPS 13 9305 Core i5 FHD | |
| Medio Intel Iris Xe Graphics G7 80EUs (1560 - 5398, n=114) | |
| Lenovo ThinkBook 13s G3 20YA0005GE | |
| Dell Latitude 5320-TM4V2 | |
| Lenovo ThinkPad L13 Gen2-21AB000PGE | |
| Acer TravelMate P4 TMP414-51-59MR | |
| Lenovo ThinkPad L14 G2-20X1003WGE | |
| Lenovo ThinkBook 14 G2 ITL 20VDS02G00 | |
| Dell Latitude 5310-23VP6 | |
| 2560x1440 Time Spy Graphics | |
| Media de la clase Subnotebook (804 - 14477, n=56, últimos 2 años) | |
| Dell XPS 13 9305 Core i5 FHD | |
| Medio Intel Iris Xe Graphics G7 80EUs (561 - 1576, n=111) | |
| Dell Latitude 5320-TM4V2 | |
| Lenovo ThinkBook 13s G3 20YA0005GE | |
| Lenovo ThinkPad L13 Gen2-21AB000PGE | |
| Acer TravelMate P4 TMP414-51-59MR | |
| Lenovo ThinkPad L14 G2-20X1003WGE | |
| Lenovo ThinkBook 14 G2 ITL 20VDS02G00 | |
| 3DMark 11 Performance | 5287 puntos | |
| 3DMark Fire Strike Score | 3013 puntos | |
| 3DMark Time Spy Score | 1274 puntos | |
ayuda | ||
Rendimiento de los juegos
El Latitude no es un portátil para juegos. Jugar a títulos AAA actuales es prácticamente imposible. Si aún quieres jugar en el dispositivo, puedes conectar una pantalla externa y una eGPU a través de los dos puertos Thunderbolt 4. Sin embargo, los beneficios de tal configuración son cuestionables, porque no se puede usar todo el rendimiento de la tarjeta gráfica integrada. El cuello de botella no sería Thunderbolt 4, sino el procesador de bajo voltaje.
En los juegos, la iGPU rinde a un nivel muy bajo, pero medio para su construcción. Si quieres sacarle un poco más de partido - sin usar una dGPU - deberías mirar los dispositivos con una Radeon RX Vega 8 como el Lenovo ThinkBook 13s G3.
El rendimiento de otras tarjetas gráficas probadas por nosotros se puede comparar en nuestra lista de benchmarks de GPUs https://www.notebookcheck.com/Mobile-Grafikkarten-Benchmarkliste.735.0.html.
| Final Fantasy XV Benchmark - 1280x720 Lite Quality | |
| Media de la clase Subnotebook (21.4 - 129.8, n=55, últimos 2 años) | |
| Lenovo ThinkBook 13s G3 20YA0005GE | |
| Dell XPS 13 9305 Core i5 FHD | |
| Medio Intel Iris Xe Graphics G7 80EUs (8.32 - 45.6, n=107) | |
| Dell Latitude 5320-TM4V2 | |
| Acer TravelMate P4 TMP414-51-59MR | |
| Lenovo ThinkPad L14 G2-20X1003WGE | |
| Lenovo ThinkBook 14 G2 ITL 20VDS02G00 | |
| Far Cry 5 - 1280x720 Low Preset AA:T | |
| Media de la clase Subnotebook (36 - 104, n=23, últimos 2 años) | |
| Medio Intel Iris Xe Graphics G7 80EUs (14 - 63, n=50) | |
| Lenovo ThinkPad L13 Gen2-21AB000PGE | |
| Dell Latitude 5320-TM4V2 | |
| God of War - 1920x1080 Low Preset | |
| Medio Intel Iris Xe Graphics G7 80EUs (14 - 21.1, n=5) | |
| Dell Latitude 5320-TM4V2 | |
| Strange Brigade - 1920x1080 medium AA:medium AF:4 | |
| Media de la clase Subnotebook (29.8 - 137.5, n=50, últimos 2 años) | |
| Dell XPS 13 9305 Core i5 FHD | |
| Medio Intel Iris Xe Graphics G7 80EUs (6 - 48.8, n=86) | |
| Lenovo ThinkPad L13 Gen2-21AB000PGE | |
| Dell Latitude 5320-TM4V2 | |
| Acer TravelMate P4 TMP414-51-59MR | |
| Lenovo ThinkBook 14 G2 ITL 20VDS02G00 | |
| Dell Latitude 5310-23VP6 | |
| bajo | medio | alto | ultra | |
|---|---|---|---|---|
| The Witcher 3 (2015) | 54.7 | 36.5 | 13.6 | |
| Final Fantasy XV Benchmark (2018) | 29.2 | 18 | 11.9 | |
| Far Cry 5 (2018) | 30 | 18 | 17 | |
| Strange Brigade (2018) | 62.6 | 25.1 | 20.8 | 17.4 |
| God of War (2022) | 15.7 | 14.6 |
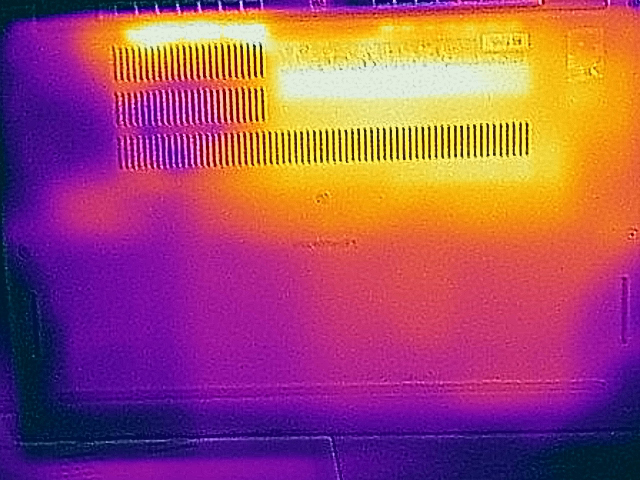
Emisiones: el PC móvil de Dell es prácticamente silencioso
Emisiones acústicas
El ventilador suele ser silencioso en reposo y con poca carga. Bajo carga, sin embargo, sube el volumen y medimos unos impresionantes 51 dB(A) al principio del test de estrés. El modo de Ultra Rendimiento de Dell juega un papel aquí - sin él, la refrigeración no sube tanto de volumen. La carga simple, por otro lado, es razonable con 38 dB(A) en el mismo modo Temp.
Ruido
| Ocioso |
| 26 / 26 / 27.5 dB(A) |
| Carga |
| 38 / 51 dB(A) |
 | ||
30 dB silencioso 40 dB(A) audible 50 dB(A) ruidosamente alto |
||
min: | ||
| Dell Latitude 5320-TM4V2 Iris Xe G7 80EUs, i5-1135G7, Toshiba KBG40ZNS256G NVMe | Lenovo ThinkBook 13s G3 20YA0005GE Vega 8, R7 5800U, WDC PC SN530 SDBPNPZ-512G | Dell XPS 13 9305 Core i5 FHD Iris Xe G7 80EUs, i5-1135G7, Samsung PM9A1 MZVL2512HCJQ | Lenovo ThinkPad L13 Gen2-21AB000PGE Vega 7, R5 PRO 5650U, SK Hynix HFS512 GDE9X081N | Lenovo ThinkBook 14 G2 ITL 20VDS02G00 UHD Graphics Xe G4 48EUs, i3-1115G4, Samsung PM991A MZALQ256HBJD | |
|---|---|---|---|---|---|
| Noise | 1% | 9% | 1% | 5% | |
| apagado / medio ambiente * (dB) | 26 | 24.7 5% | 26 -0% | 25 4% | 24.6 5% |
| Idle Minimum * (dB) | 26 | 24.7 5% | 26 -0% | 25 4% | 24.6 5% |
| Idle Average * (dB) | 26 | 27 -4% | 26 -0% | 25 4% | 24.6 5% |
| Idle Maximum * (dB) | 27.5 | 29.8 -8% | 26 5% | 27.8 -1% | 26.7 3% |
| Load Average * (dB) | 38 | 42.4 -12% | 33.5 12% | 44.1 -16% | 38.9 -2% |
| Load Maximum * (dB) | 51 | 42.4 17% | 33.5 34% | 44.3 13% | 42.8 16% |
| Witcher 3 ultra * (dB) | 42.4 | 33.5 |
* ... más pequeño es mejor
Temperatura
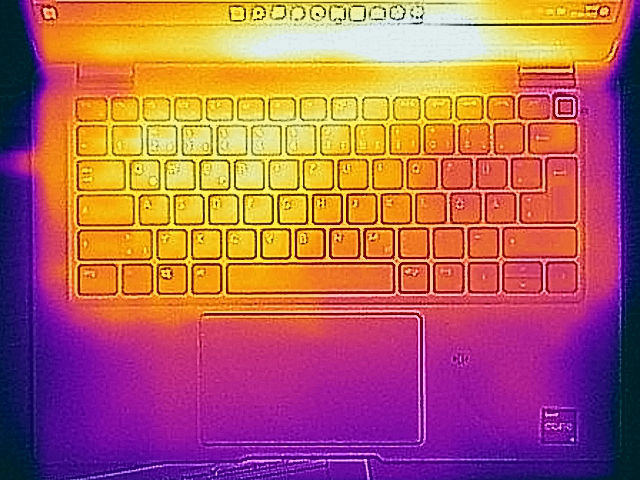
El Latitude no se calienta excesivamente ni siquiera en la prueba de estrés. Mientras tanto, registramos temperaturas de 43 grados centígrados en algunos puntos de medición, pero sólo de forma selectiva. En el uso cotidiano, los índices se encuentran constantemente dentro de la zona verde, alcanzando apenas 35 grados en algunos puntos.
(+) La temperatura máxima en la parte superior es de 38.6 °C / 101 F, frente a la media de 35.9 °C / 97 F, que oscila entre 21.4 y 59 °C para la clase Subnotebook.
(±) El fondo se calienta hasta un máximo de 42.9 °C / 109 F, frente a la media de 39.2 °C / 103 F
(+) En reposo, la temperatura media de la parte superior es de 28.5 °C / 83# F, frente a la media del dispositivo de 30.8 °C / 87 F.
(+) El reposamanos y el panel táctil están a una temperatura inferior a la de la piel, con un máximo de 25.1 °C / 77.2 F y, por tanto, son fríos al tacto.
(+) La temperatura media de la zona del reposamanos de dispositivos similares fue de 28.2 °C / 82.8 F (+3.1 °C / 5.6 F).
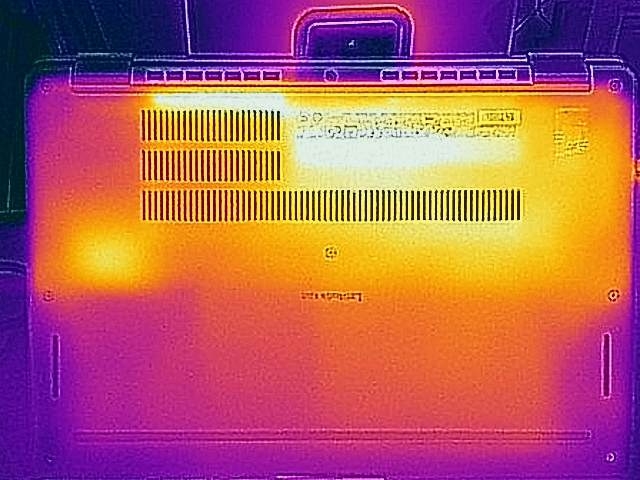
| Dell Latitude 5320-TM4V2 Intel Core i5-1135G7, Intel Iris Xe Graphics G7 80EUs | Lenovo ThinkBook 13s G3 20YA0005GE AMD Ryzen 7 5800U, AMD Radeon RX Vega 8 (Ryzen 4000/5000) | Dell XPS 13 9305 Core i5 FHD Intel Core i5-1135G7, Intel Iris Xe Graphics G7 80EUs | Lenovo ThinkPad L13 Gen2-21AB000PGE AMD Ryzen 5 PRO 5650U, AMD Radeon RX Vega 7 | Lenovo ThinkBook 14 G2 ITL 20VDS02G00 Intel Core i3-1115G4, Intel UHD Graphics Xe G4 48EUs | |
|---|---|---|---|---|---|
| Heat | 18% | 8% | -1% | 14% | |
| Maximum Upper Side * (°C) | 38.6 | 36.5 5% | 43.5 -13% | 42.7 -11% | 35 9% |
| Maximum Bottom * (°C) | 42.9 | 39.6 8% | 44.8 -4% | 44.9 -5% | 38 11% |
| Idle Upper Side * (°C) | 35.3 | 24.5 31% | 26.2 26% | 32.6 8% | 28 21% |
| Idle Bottom * (°C) | 34.9 | 25 28% | 26.4 24% | 33.9 3% | 30 14% |
* ... más pequeño es mejor
Prueba de esfuerzo
Nuestra prueba de estrés (Prime95 y Furmark se ejecutan durante al menos una hora) procesa la CPU con 3,1 GHz durante unos segundos. Luego la velocidad cae a 1,2 GHz (CPU) y se mantiene en este nivel. La potencia del paquete baja de 47 vatios a 18 vatios durante un corto periodo de tiempo en esta prueba. La prueba de estrés es un escenario extremo que no se da en el uso diario. Utilizamos esta prueba para comprobar si el sistema funciona de forma estable incluso a plena carga.
Altavoz
Los altavoces estéreo han encontrado su lugar en la zona frontal de la parte inferior del dispositivo. Producen un sonido decente, pero no muy alto. Los altavoces tienen muchos agudos y medios, y los bajos están descuidados. El micrófono de doble matriz junto a la webcam ofrece muy buenas grabaciones, independientemente de si el interlocutor está hablando a medio metro o a dos metros delante del dispositivo. Se pueden conectar unos auriculares a través del puerto combo de 3,5 mm.
Dell Latitude 5320-TM4V2 análisis de audio
(±) | la sonoridad del altavoz es media pero buena (81 dB)
Graves 100 - 315 Hz
(-) | casi sin bajos - de media 21.7% inferior a la mediana
(±) | la linealidad de los graves es media (14.2% delta a frecuencia anterior)
Medios 400 - 2000 Hz
(+) | medios equilibrados - a sólo 3.2% de la mediana
(+) | los medios son lineales (5.1% delta a la frecuencia anterior)
Altos 2 - 16 kHz
(±) | máximos más altos - de media 5.2% más altos que la mediana
(+) | los máximos son lineales (5.6% delta a la frecuencia anterior)
Total 100 - 16.000 Hz
(±) | la linealidad del sonido global es media (15.6% de diferencia con la mediana)
En comparación con la misma clase
» 36% de todos los dispositivos probados de esta clase eran mejores, 5% similares, 58% peores
» El mejor tuvo un delta de 5%, la media fue 18%, el peor fue ###max##%
En comparación con todos los dispositivos probados
» 23% de todos los dispositivos probados eran mejores, 5% similares, 72% peores
» El mejor tuvo un delta de 4%, la media fue 23%, el peor fue ###max##%
Lenovo ThinkPad L13 Gen2-21AB000PGE análisis de audio
(+) | los altavoces pueden reproducir a un volumen relativamente alto (#82.4 dB)
Graves 100 - 315 Hz
(-) | casi sin bajos - de media 25.6% inferior a la mediana
(±) | la linealidad de los graves es media (13.8% delta a frecuencia anterior)
Medios 400 - 2000 Hz
(+) | medios equilibrados - a sólo 3.3% de la mediana
(+) | los medios son lineales (4.6% delta a la frecuencia anterior)
Altos 2 - 16 kHz
(+) | máximos equilibrados - a sólo 4.1% de la mediana
(+) | los máximos son lineales (6.5% delta a la frecuencia anterior)
Total 100 - 16.000 Hz
(±) | la linealidad del sonido global es media (19% de diferencia con la mediana)
En comparación con la misma clase
» 58% de todos los dispositivos probados de esta clase eran mejores, 6% similares, 36% peores
» El mejor tuvo un delta de 5%, la media fue 18%, el peor fue ###max##%
En comparación con todos los dispositivos probados
» 45% de todos los dispositivos probados eran mejores, 7% similares, 47% peores
» El mejor tuvo un delta de 4%, la media fue 23%, el peor fue ###max##%
Gestión de la energía: portátil de negocios con 10 horas de autonomía
Consumo de energía
No hay ninguna novedad en cuanto al consumo de energía. Medimos el consumo máximo de energía de 7,8 vatios en reposo, menos que cualquier otro modelo en el campo de pruebas. Durante la prueba de estrés (Prime95 y Furmark), el valor aumenta hasta 67 vatios durante unos segundos. La potencia nominal de la fuente de alimentación USB Type-C incluida es de 65 vatios.
| Off / Standby | |
| Ocioso | |
| Carga |
|
Clave:
min: | |
| Dell Latitude 5320-TM4V2 i5-1135G7, Iris Xe G7 80EUs, Toshiba KBG40ZNS256G NVMe, IPS, 1920x1080, 13.3" | Lenovo ThinkBook 13s G3 20YA0005GE R7 5800U, Vega 8, WDC PC SN530 SDBPNPZ-512G, IPS, 1920x1200, 13.3" | Lenovo ThinkPad L13 Gen2-21AB000PGE R5 PRO 5650U, Vega 7, SK Hynix HFS512 GDE9X081N, IPS, 1920x1080, 13.3" | Lenovo ThinkBook 14 G2 ITL 20VDS02G00 i3-1115G4, UHD Graphics Xe G4 48EUs, Samsung PM991A MZALQ256HBJD, a-Si IPS LED, 1920x1080, 14" | Medio Intel Iris Xe Graphics G7 80EUs | Media de la clase Subnotebook | |
|---|---|---|---|---|---|---|
| Power Consumption | -17% | 2% | -30% | -11% | -4% | |
| Idle Minimum * (Watt) | 3.4 | 5 -47% | 4.4 -29% | 6.3 -85% | 4.49 ? -32% | 3.71 ? -9% |
| Idle Average * (Watt) | 6 | 8.2 -37% | 7.6 -27% | 9.5 -58% | 7.4 ? -23% | 6.54 ? -9% |
| Idle Maximum * (Watt) | 7.8 | 9 -15% | 9.5 -22% | 10.4 -33% | 9.26 ? -19% | 7.89 ? -1% |
| Load Average * (Watt) | 41 | 45 -10% | 33 20% | 32.7 20% | 36.6 ? 11% | 42.1 ? -3% |
| Witcher 3 ultra * (Watt) | 37.9 | 45.1 -19% | 33.4 12% 33.3 12% | |||
| Load Maximum * (Watt) | 67 | 51.2 24% | 32.5 51% | 63.3 6% | 61.7 ? 8% | 65.1 ? 3% |
* ... más pequeño es mejor
Power consumption Witcher 3 / Stresstest
Power consumption with external monitor
Duración de la batería
La duración de la batería de 63 Wh es buena. El portátil de 13,3 pulgadas terminó nuestra prueba WLAN (abrir sitios web a través de un script) después de diez horas. Eso no es raro para los portátiles modernos, como muestra la competencia con dos excepciones. Interesante: el predecesor Latitude 5310 dura una hora más. Sin embargo, el verdadero contendiente en términos de duración de la batería es el Lenovo ThinkPad L13 Gen2 con sus once horas, que el AMD de 13 pulgadas logra con sólo 46 vatios-hora de batería.
La duración máxima comprobada es de algo más de 21 horas. Esto no es de utilidad práctica porque el brillo se redujo al mínimo y los módulos inalámbricos se desactivaron (en reposo, sin carga).
| Dell Latitude 5320-TM4V2 i5-1135G7, Iris Xe G7 80EUs, 63 Wh | Dell Latitude 5310-23VP6 i5-10310U, UHD Graphics 620, 60 Wh | Lenovo ThinkBook 13s G3 20YA0005GE R7 5800U, Vega 8, 56 Wh | Lenovo ThinkPad L13 Gen2-21AB000PGE R5 PRO 5650U, Vega 7, 46 Wh | Lenovo ThinkPad L14 G2-20X1003WGE i5-1135G7, Iris Xe G7 80EUs, 45 Wh | Lenovo ThinkBook 14 G2 ITL 20VDS02G00 i3-1115G4, UHD Graphics Xe G4 48EUs, 58 Wh | Media de la clase Subnotebook | |
|---|---|---|---|---|---|---|---|
| Duración de Batería | 10% | 9% | -11% | -32% | -24% | 22% | |
| Reader / Idle (h) | 21.3 | 17.2 -19% | 13.2 -38% | 28.6 ? 34% | |||
| WiFi v1.3 (h) | 10.1 | 11.1 10% | 11 9% | 11 9% | 6.9 -32% | 7.6 -25% | 14.1 ? 40% |
| Load (h) | 2.2 | 1.7 -23% | 2 -9% | 1.998 ? -9% | |||
| H.264 (h) | 15.6 | 8.8 | 15.3 ? |
Pro
Contra
Veredicto - El portátil de Dell se queda con la miel en los labios

El Latitude 5320 de Dell obtiene un 84% de puntuación. Es un buen resultado, pero no puede seguir el ritmo de las puntuaciones de los rivales de Lenovo (86-88%). ¿Cómo puede ser eso, ya que los tiempos de ejecución son fuertes, hay Thunderbolt 4, y las emisiones no podrían ser menores?
El Latitude 5320 tiene algunos puntos débiles que no deberían estar ahí y que le cuestan al dispositivo puntos importantes en total
Estas son las razones de la rebaja en la valoración: En primer lugar, nos molestó el ClickPad sin teclas físicas. Casi no hay retroalimentación háptica, lo que resulta en un punto de presión apenas perceptible. No disfrutamos del uso de este touchpad.
Otros puntos débiles son la pantalla - comparada con la del predecesor y la de la competencia - que es débil en casi todos los aspectos: espacio de color, brillo y reproducción del color - todo necesita mejorar. Por último, la memoria RAM también es de a bordo, un paso atrás en comparación con el predecesor Latitude 5310.
Además, el procesador Tiger-Lake rinde por debajo de la media, los térmicos sólo le permiten un rendimiento limitado. Así, la máquina Intel se queda aún más atrás en comparación con los portátiles AMD
Obtendrás más pantalla y mejores dispositivos de entrada si te haces con el predecesor 5310, que actualmente aún se puede encontrar en las tiendas. El rendimiento del procesador de Comet Lake es sólo ligeramente inferior, y el tiempo de ejecución es incluso una hora más.
Se obtiene más tiempo de ejecución y más rendimiento con el ThinkPad L13 Gen2 - pero la pantalla no es mucho mejor aquí. Si el rendimiento y la pantalla deben ser buenos, entonces el ThinkBook 13s G3 podría ser una opción: el AMD Ryzen trae significativamente más rendimiento a la mesa.
Precio y disponibilidad
La unidad de revisión Latitude 5320-TM4V2 está actualmente disponible por 1.190 euros en Cyberport. El Latitude 5320-TM4V2 está en las estanterías por 1.000 euros en notebooksbilliger.
Dell Latitude 5320-TM4V2
- 03/11/2022 v7 (old)
Sebastian Jentsch
Price comparison
