Análisis del portátil Lenovo ThinkPad L13 Gen2 de AMD: ultrabook Ryzen rápido y resistente
El Lenovo ThinkPad L13 Gen 2 AMD es un ultrabook compacto de 13 pulgadas. La línea ThinkPad se centra en dispositivos de entrada muy buenos y una construcción robusta y duradera. Es el sucesor del ThinkPad L13 Gen1, que ha sido mejorado en comparación con el ThinkPad L390 con un diseño ligeramente más delgado y ligero, y ahora también cuenta con procesadores AMD que incluyen gráficos Vega por primera vez en esta serie.
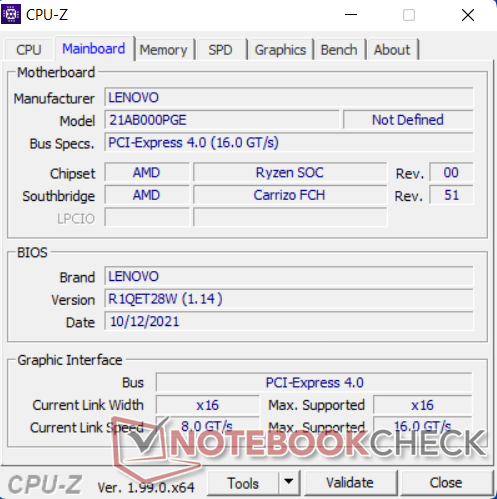
Los clientes privados son más propensos a comprar la serie E como otra variante económica, mientras que la serie L, sin embargo, está más orientada a la serie T y tiene, por ejemplo, un teclado reemplazable (mantenible). Además de las empresas, las autoridades y las escuelas, la serie L, especialmente la clase compacta de 13 pulgadas, también es interesante para los estudiantes. Nuestro dispositivo de prueba con el número de modelo 21AB000PGE está disponible por 999 euros (~1106 dólares); la versión de campus para el sector educativo cuesta 949 euros (~1051 dólares). Por supuesto, también será interesante ver cómo le va al modelo AMD contra la versión Intel del ThinkPad L13 Gen2 como probaremos y discutiremos en este análisis, entre otras cosas.
Otros competidores interesantes en el segmento empresarial de precio medio son sin duda elHP ProBook x360 435 G8el HP EliteBook 845 G7el ultraligero HP Pavilion Aero 13 - los tres con CPU AMD - así como Inspiron 13 7306 de Dell con procesador Intel.
Posibles contendientes en la comparación
Valoración | Fecha | Modelo | Peso | Altura | Tamaño | Resolución | Precio |
|---|---|---|---|---|---|---|---|
| 87.5 % v7 (old) | 03/2022 | Lenovo ThinkPad L13 Gen2-21AB000PGE R5 PRO 5650U, Vega 7 | 1.4 kg | 17.6 mm | 13.30" | 1920x1080 | |
| 86.1 % v7 (old) | 01/2021 | Lenovo ThinkPad L13 Gen2-20VH0017GE i5-1135G7, Iris Xe G7 80EUs | 1.4 kg | 17.6 mm | 13.30" | 1920x1080 | |
| 88.3 % v7 (old) | 04/2021 | Lenovo ThinkPad L13 Yoga Gen2-20VK000VGE i5-1135G7, Iris Xe G7 80EUs | 1.5 kg | 17.6 mm | 13.30" | 1920x1080 | |
| 90.6 % v7 (old) | 11/2021 | Lenovo ThinkPad X13 G2 AMD 20XH001KGE R5 PRO 5650U, Vega 7 | 1.4 kg | 18.19 mm | 13.30" | 1920x1200 | |
| 88.2 % v7 (old) | 11/2020 | HP EliteBook 845 G7 Ryzen 7 Pro 4750U R7 PRO 4750U, Vega 7 | 1.4 kg | 17.9 mm | 14.00" | 1920x1080 | |
| 85.7 % v7 (old) | 08/2021 | HP ProBook x360 435 G8 R7-5800U R7 5800U, Vega 8 | 1.5 kg | 18 mm | 13.30" | 1920x1080 | |
| 84.4 % v7 (old) | 08/2021 | HP Pavilion Aero 13 be0097nr R7 5800U, Vega 8 | 953 g | 17 mm | 13.30" | 1920x1200 | |
| 86.8 % v7 (old) | 12/2021 | Dell Inspiron 13 7306-6TYH5 i7-1165G7, Iris Xe G7 96EUs | 1.4 kg | 18 mm | 13.30" | 3840x2160 |
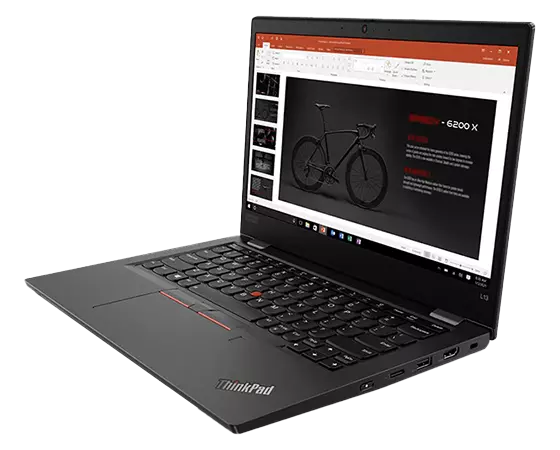
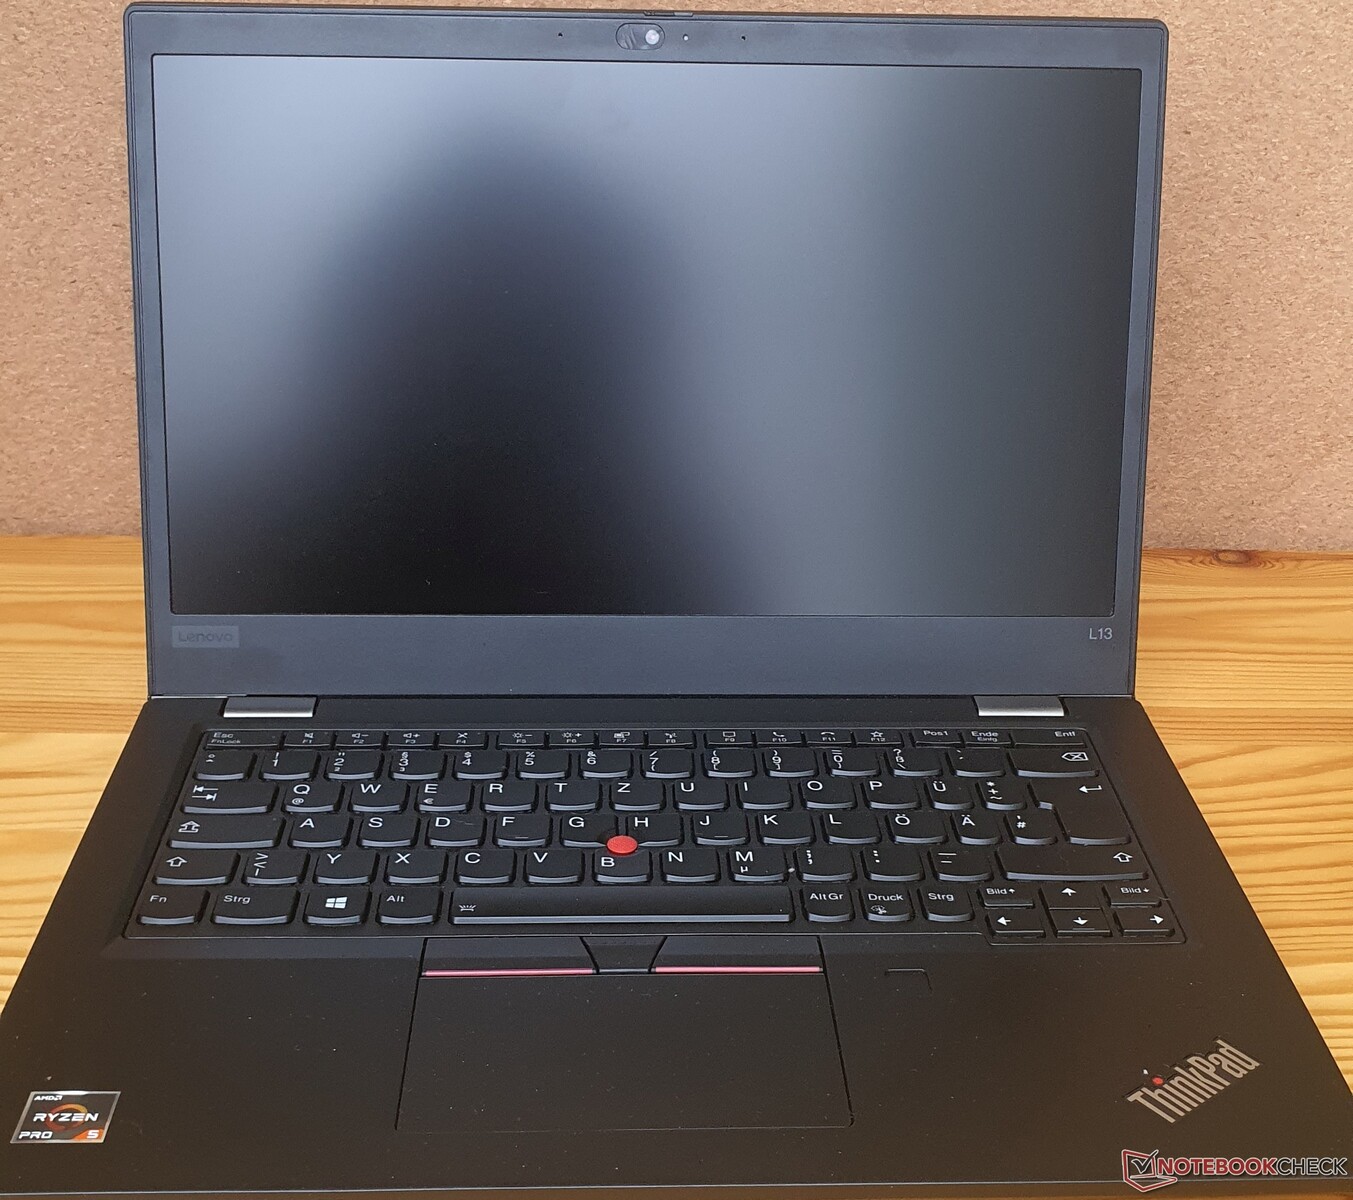
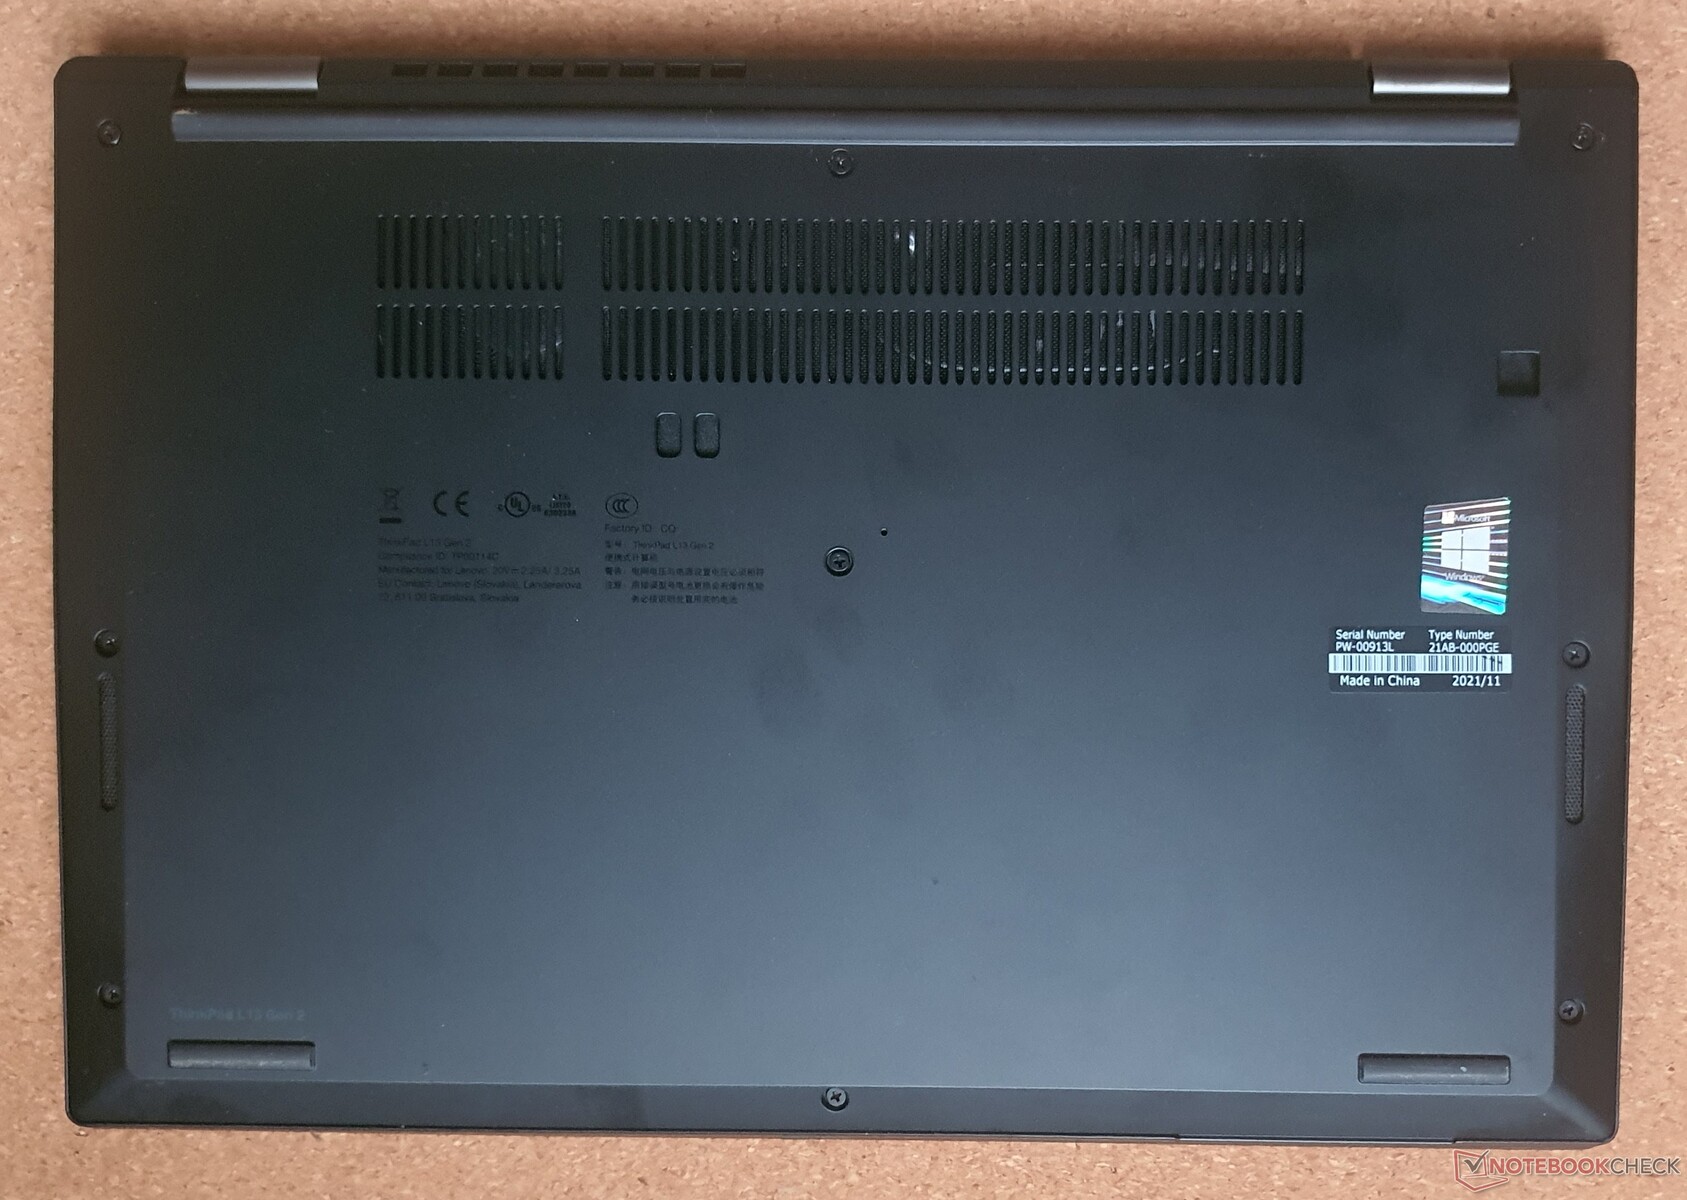
Carcasa - Muy robusta con un tamaño reducido
En comparación con su predecesor, el ThinkPad L390la carcasa se ha adelgazado, por lo que sus dimensiones están ahora al nivel más moderno del ThinkPad X390 en lugar del nivel de los ultrabooks de 14 pulgadas (como el X1 Carbon G6). Las ranuras de ventilación adicionales en la parte inferior deberían mejorar el rendimiento de la refrigeración
La construcción incluye mucho plástico en lugar del compuesto de fibra de vidrio y plástico engomado (GFRP) de la serie T. Sólo la tapa de la pantalla está reforzada con aluminio, lo que dificulta su torsión. La parte inferior es de plástico GFRP. En general, el dispositivo es muy robusto, la unidad base así como la cubierta del teclado no ceden en absoluto incluso bajo una mayor presión. Sin embargo, las superficies de plástico negro mate son muy susceptibles a las huellas dactilares. Debido al bajo peso total en combinación con unas bisagras muy ajustadas, el ThinkPad L13 Gen 2 AMD no puede abrirse realmente con una mano.
Puedes ver en las dimensiones que la distancia al Dell Inspiron 13 y el propio ThinkPad X13 G2 ya no es tan amplia como lo era con el ThinkPad L390. Todos los dispositivos empresariales también tienen un peso similar en comparación. Si buscas un dispositivo ultraligero en este rango de precios, estarás satisfecho con Aero 13 de HP,especialmente porque sus dimensiones son aún más pequeñas, y por su pantalla 16:10.
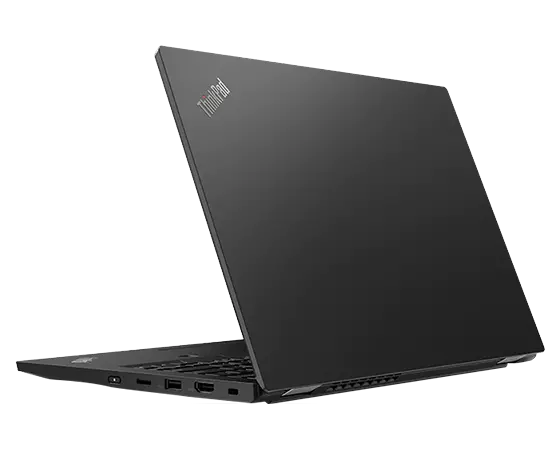
Equipo - Conectividad con puertos heredados sin Thunderbolt
La 2ª generación de la serie L ofrece Thunderbolt 4 por primera vez - pero no (aún) en las variantes AMD. Nuestro ThinkPad L13 se las arregla con puertos USB-C normales. Por lo demás, la conectividad es amplia. Sólo nos habría gustado ver un lector de tarjetas SD de tamaño completo, pero eso hace tiempo que no es común en un ultrabook de 13 pulgadas, al igual que el "desaparecido" puerto LAN.
La posición de los puertos puede calificarse de buena. El botón de encendido está ubicado un poco más adelante en el lado derecho y no puede ser presionado accidentalmente en nuestra opinión.


Lector de tarjetas SD
El lector de tarjetas microSD ofrece buenas velocidades que están en la media de la clase de dispositivo probado. Las estaciones de trabajo premium como la ThinkPad P1 G4 sin embargo, aportan más del doble de velocidades a la mesa.
| SD Card Reader | |
| average JPG Copy Test (av. of 3 runs) | |
| Lenovo ThinkPad L13 Yoga Gen2-20VK000VGE (AV PRO V60) | |
| Lenovo ThinkPad L13 Gen2-20VH0017GE (Toshiba Exceria Pro M501 64 GB UHS-II) | |
| Media de la clase Subnotebook (23.7 - 188, n=9, últimos 2 años) | |
| Lenovo ThinkPad L13 Gen2-21AB000PGE | |
| HP ProBook x360 435 G8 R7-5800U (AV Pro UHS-II V60) | |
| maximum AS SSD Seq Read Test (1GB) | |
| Media de la clase Subnotebook (24.9 - 195, n=8, últimos 2 años) | |
| HP ProBook x360 435 G8 R7-5800U (AV Pro UHS-II V60) | |
| Lenovo ThinkPad L13 Gen2-21AB000PGE | |
| Lenovo ThinkPad L13 Gen2-20VH0017GE (Toshiba Exceria Pro M501 64 GB UHS-II) | |
| Lenovo ThinkPad L13 Yoga Gen2-20VK000VGE (AV PRO V60) | |
| Dell Inspiron 13 7306-6TYH5 (AV Pro SD microSD 128 GB V60) | |
Comunicación
La prueba WLAN también muestra un rendimiento bastante mediocre de la tarjeta RealTek WiFi-6 con Bluetooth 5.1. La tarjeta Wi-Fi AX201 del L13 Gen2 con procesador Intel es significativamente más rápida aquí.
Cámara web
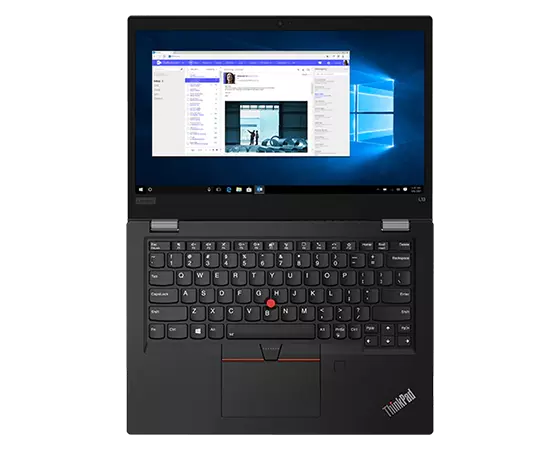
La webcam de 720p del Lenovo ThinkPad L13 Gen2 AMD produce una imagen con colores incorrectos y una visualización borrosa. Es suficiente para las videoconferencias. Además, está el "ThinkShutter" para cubrir permanentemente la webcam cuando no se necesita. También hay un módulo de infrarrojos para Windows Hello.
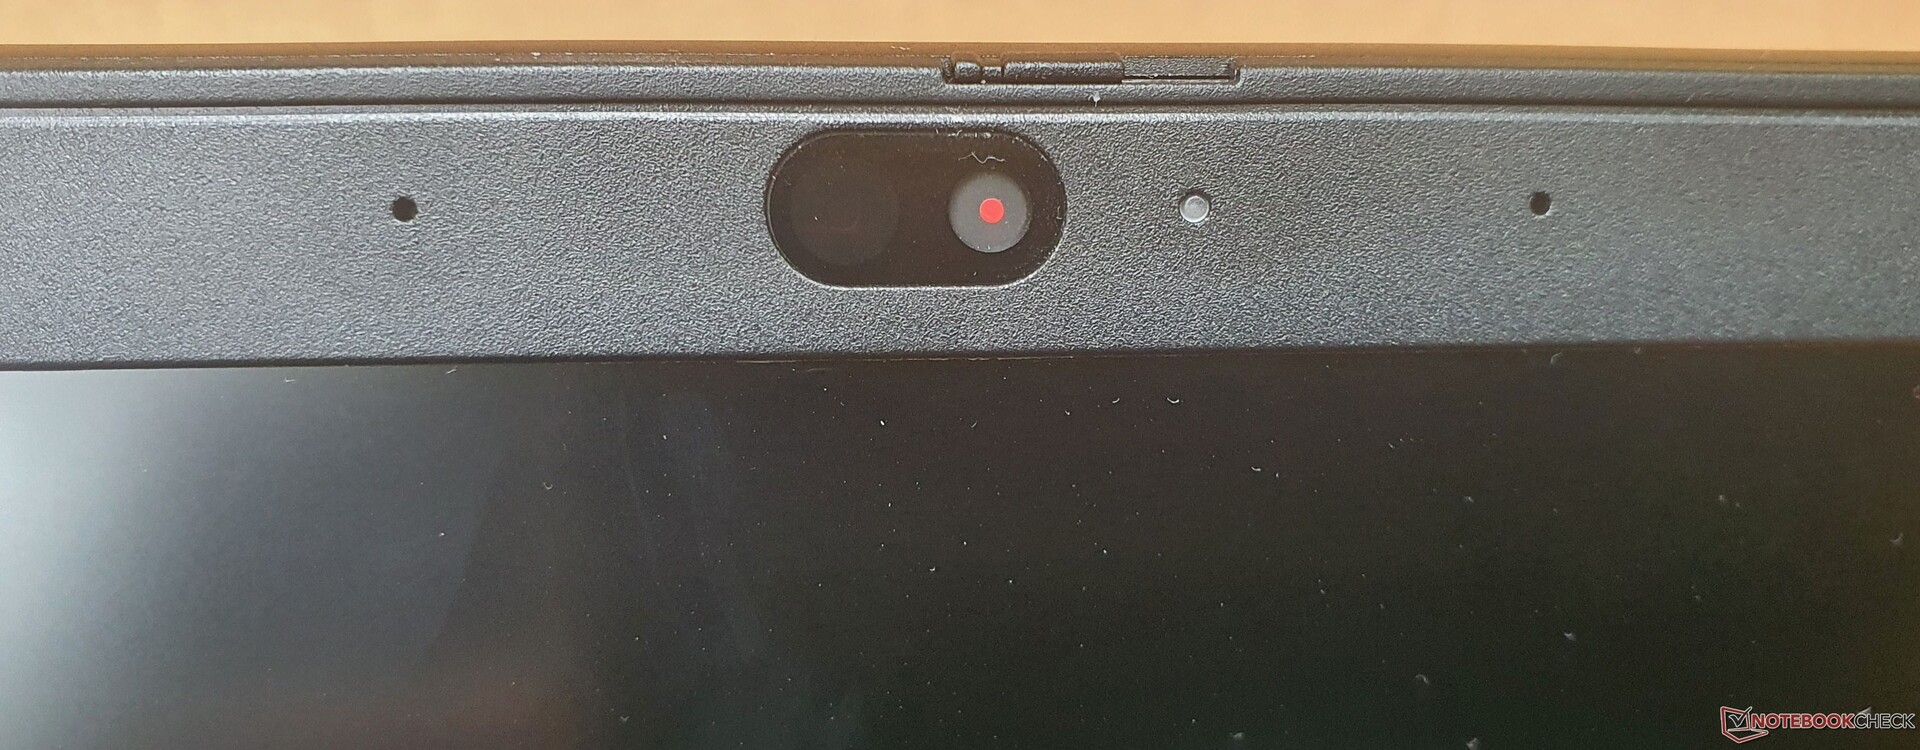


Seguridad
Como dispositivo empresarial, el ThinkPad L13 cuenta con las mismas características de seguridad que la serie T en contraste con la serie E: escáner de huellas dactilares, TPM 2.0, una cámara de infrarrojos (opcional) para Windows Hello, un lector de tarjetas inteligentes, un dispositivo integrado para un bloqueo de seguridad y el ThinkShutter para la cámara web.
Accesorios
Además de la fuente de alimentación USB-C de 65 vatios, no hay ningún otro accesorio en el embalaje de cartón.El embalaje aún no es 100% ecológico, pero Lenovo probablemente cambiará eso en el futuro
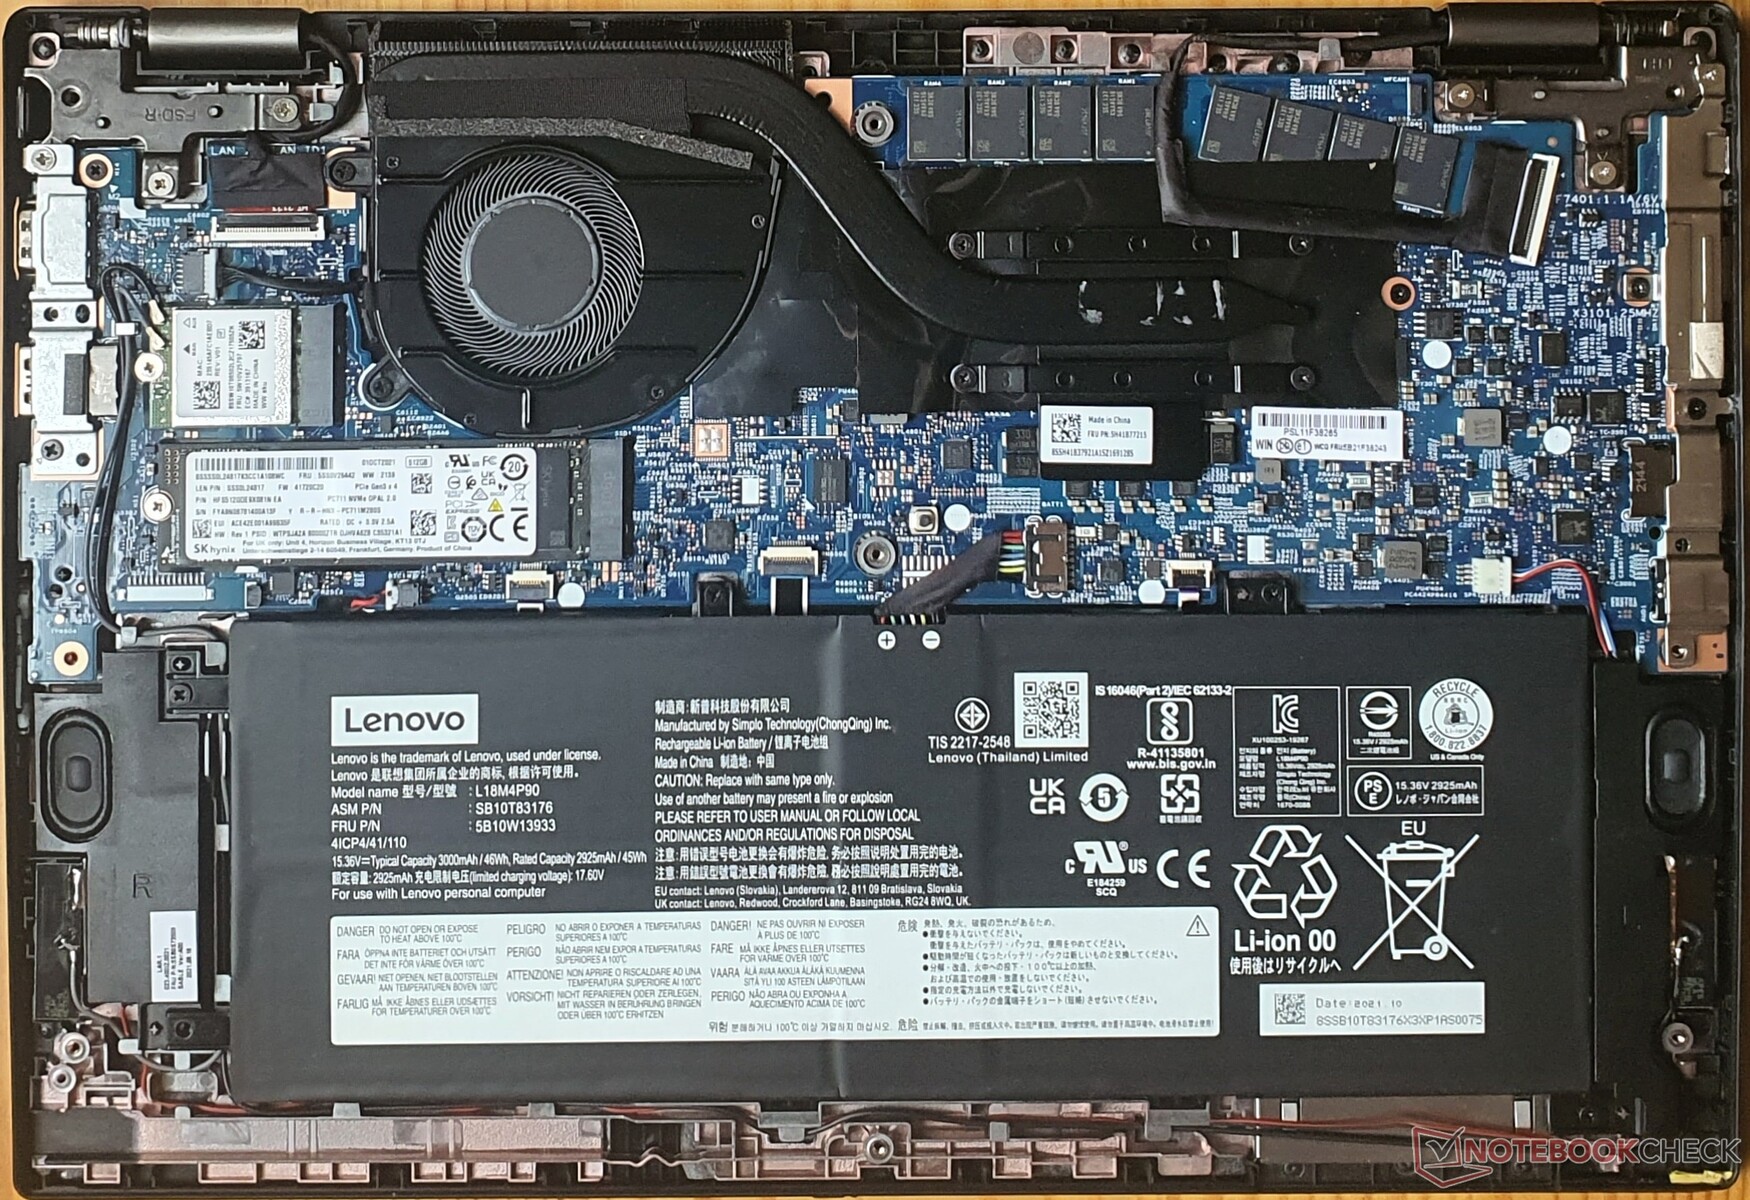
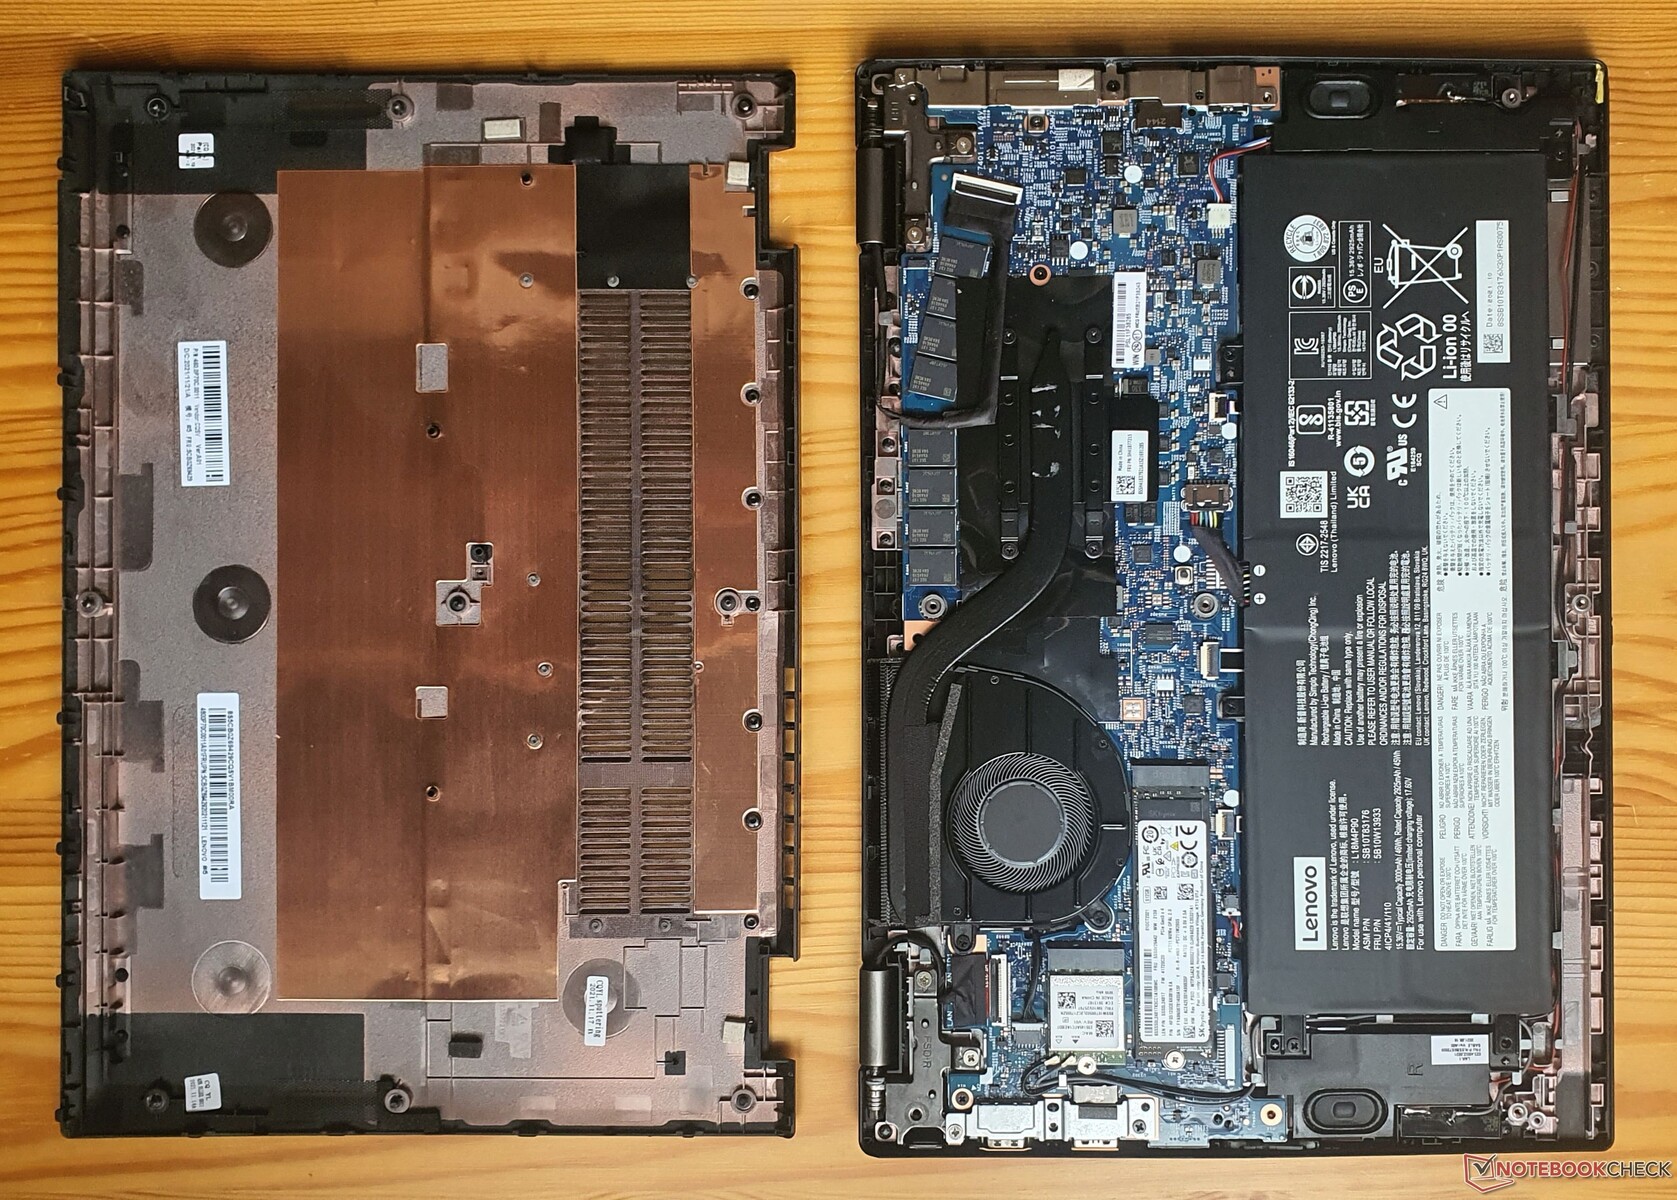
Mantenimiento
Aquí se pueden intercambiar: Wi-Fi, el SSD M.2-2280 así como la batería. No hay ranuras de RAM o una ranura para WWAN. El ventilador es fácilmente accesible para su limpieza.
Para acceder al interior del ThinkPad, la placa base se retira desatornillando nueve tornillos; los tornillos quedan pegados a la carcasa, por lo que no se pierden. También hay bastantes clips de plástico alrededor, que es mejor abrir cuidadosamente uno por uno con una herramienta de plástico spudger. En caso de apuro, también se puede intentar utilizar una tarjeta de crédito vieja.
Aunque esto requiere un poco de paciencia, quitar el teclado es muy sencillo: Hay que aflojar dos tornillos de la parte inferior y se puede extraer el teclado interno. Esto no sólo permite realizar reparaciones en la zona, sino también cambiar a otras distribuciones de teclado (como QWERTY).
Garantía
A diferencia de la serie T de ThinkPad, la serie L se vende con sólo un año de servicio de entrega. Está disponible una ampliación de tres a cinco años por un cargo adicional, así como servicio in situ y extras como la protección contra accidentes.
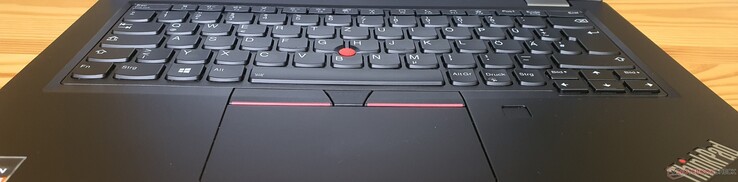
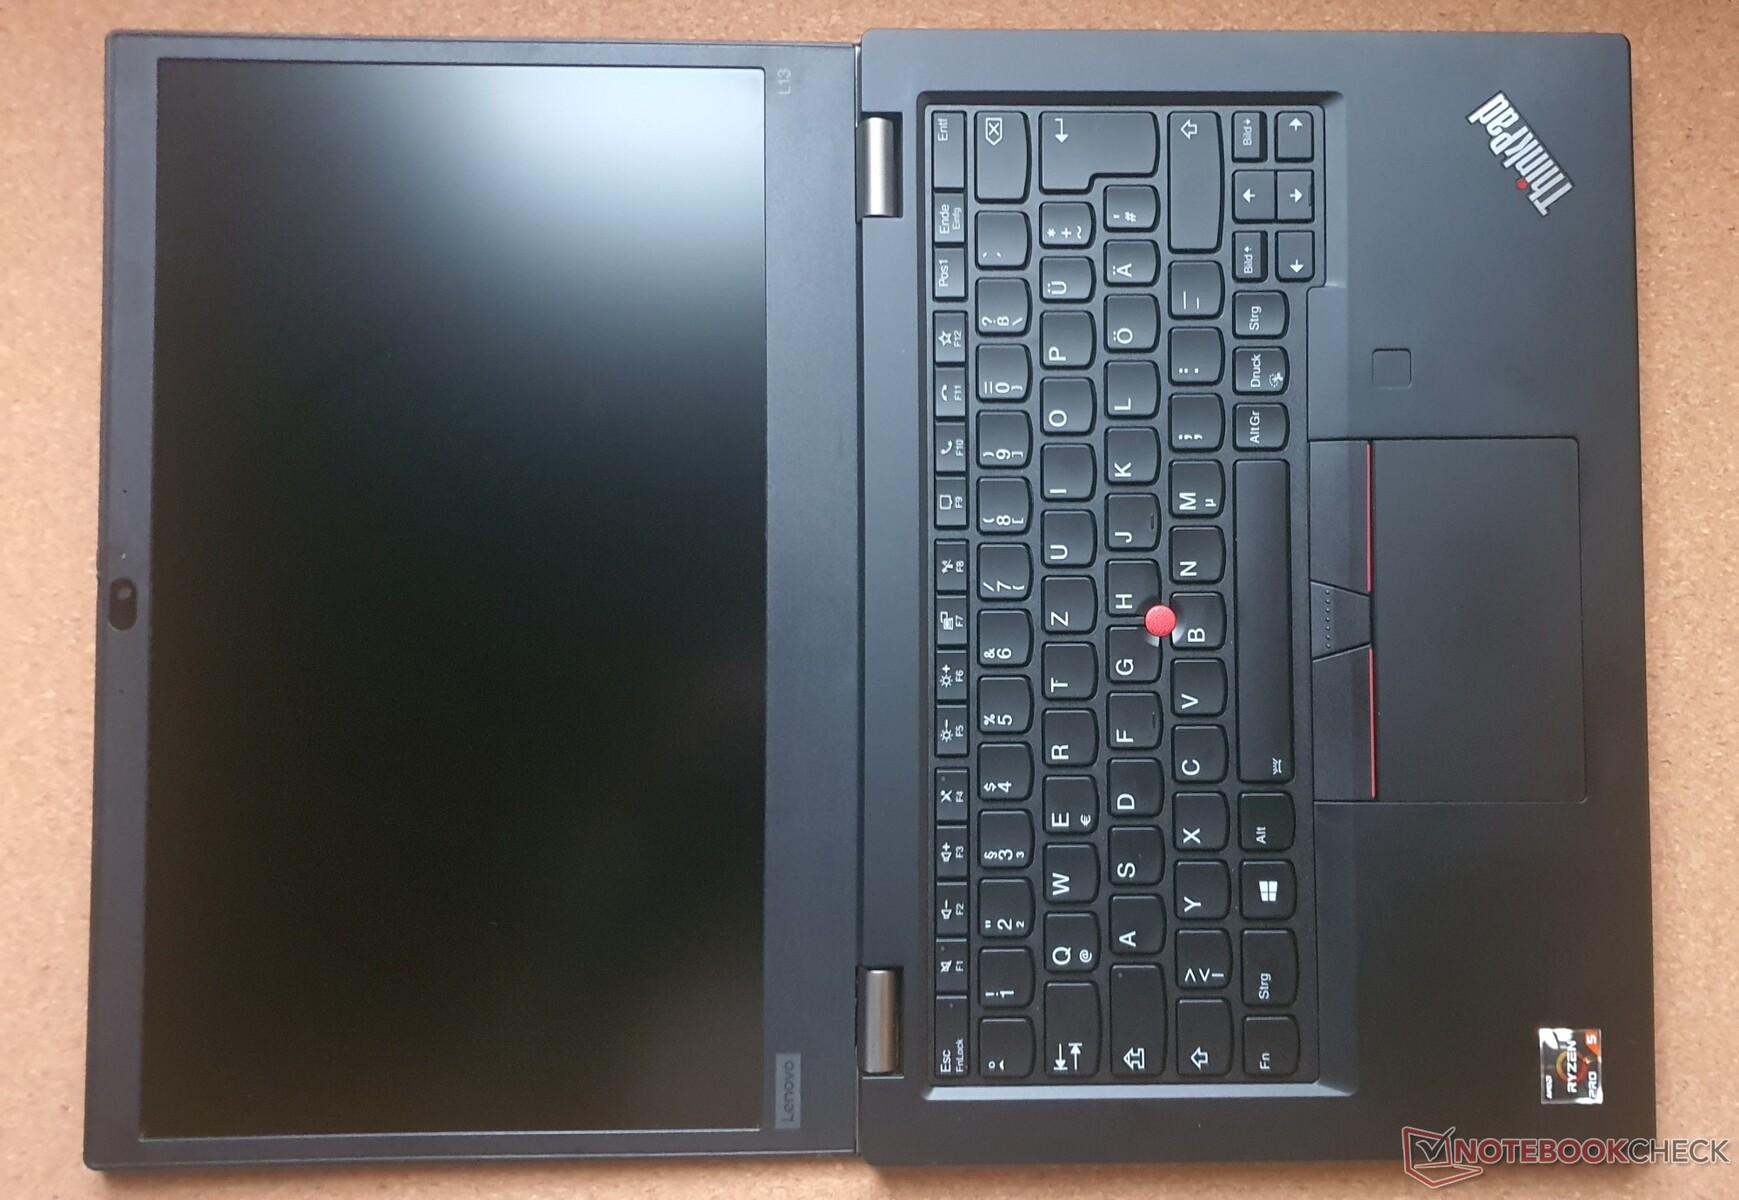
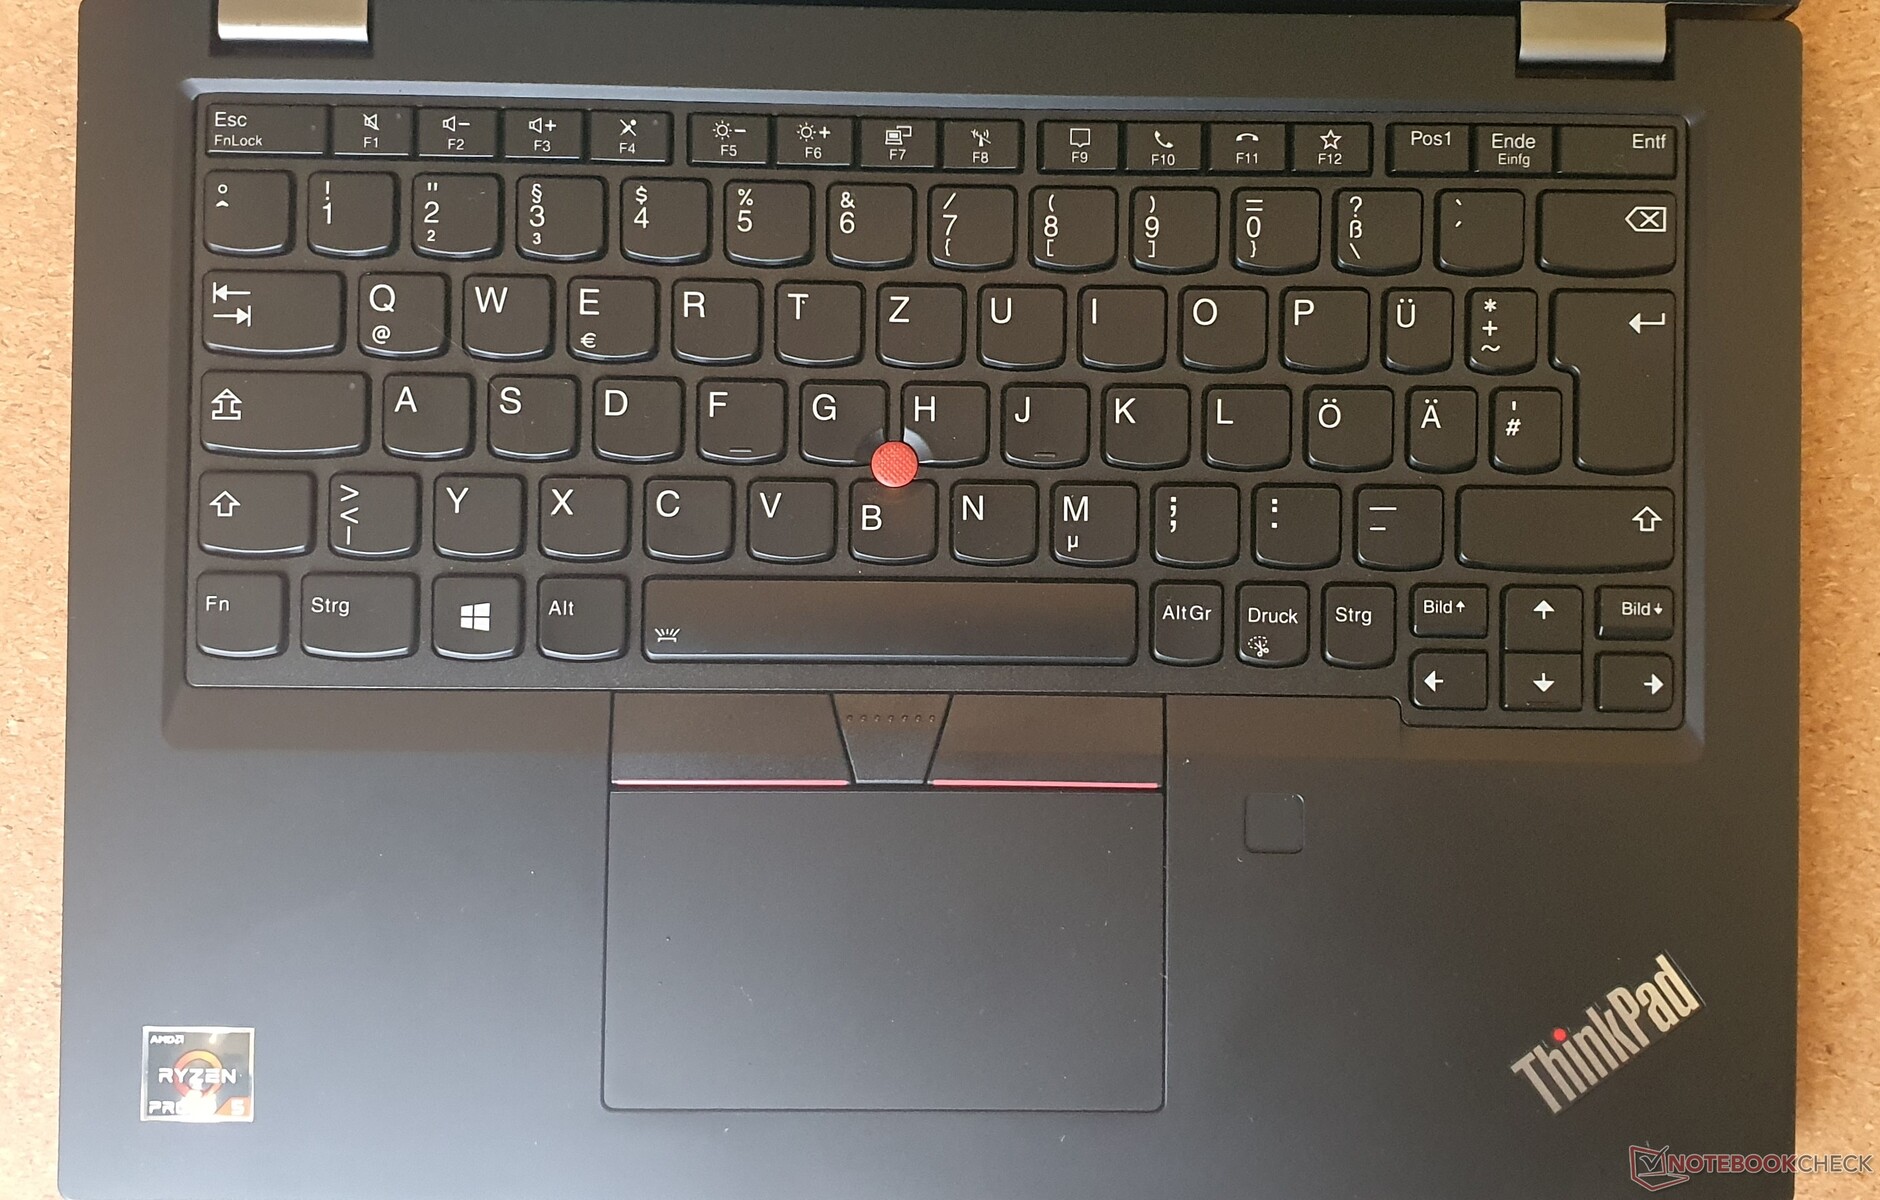
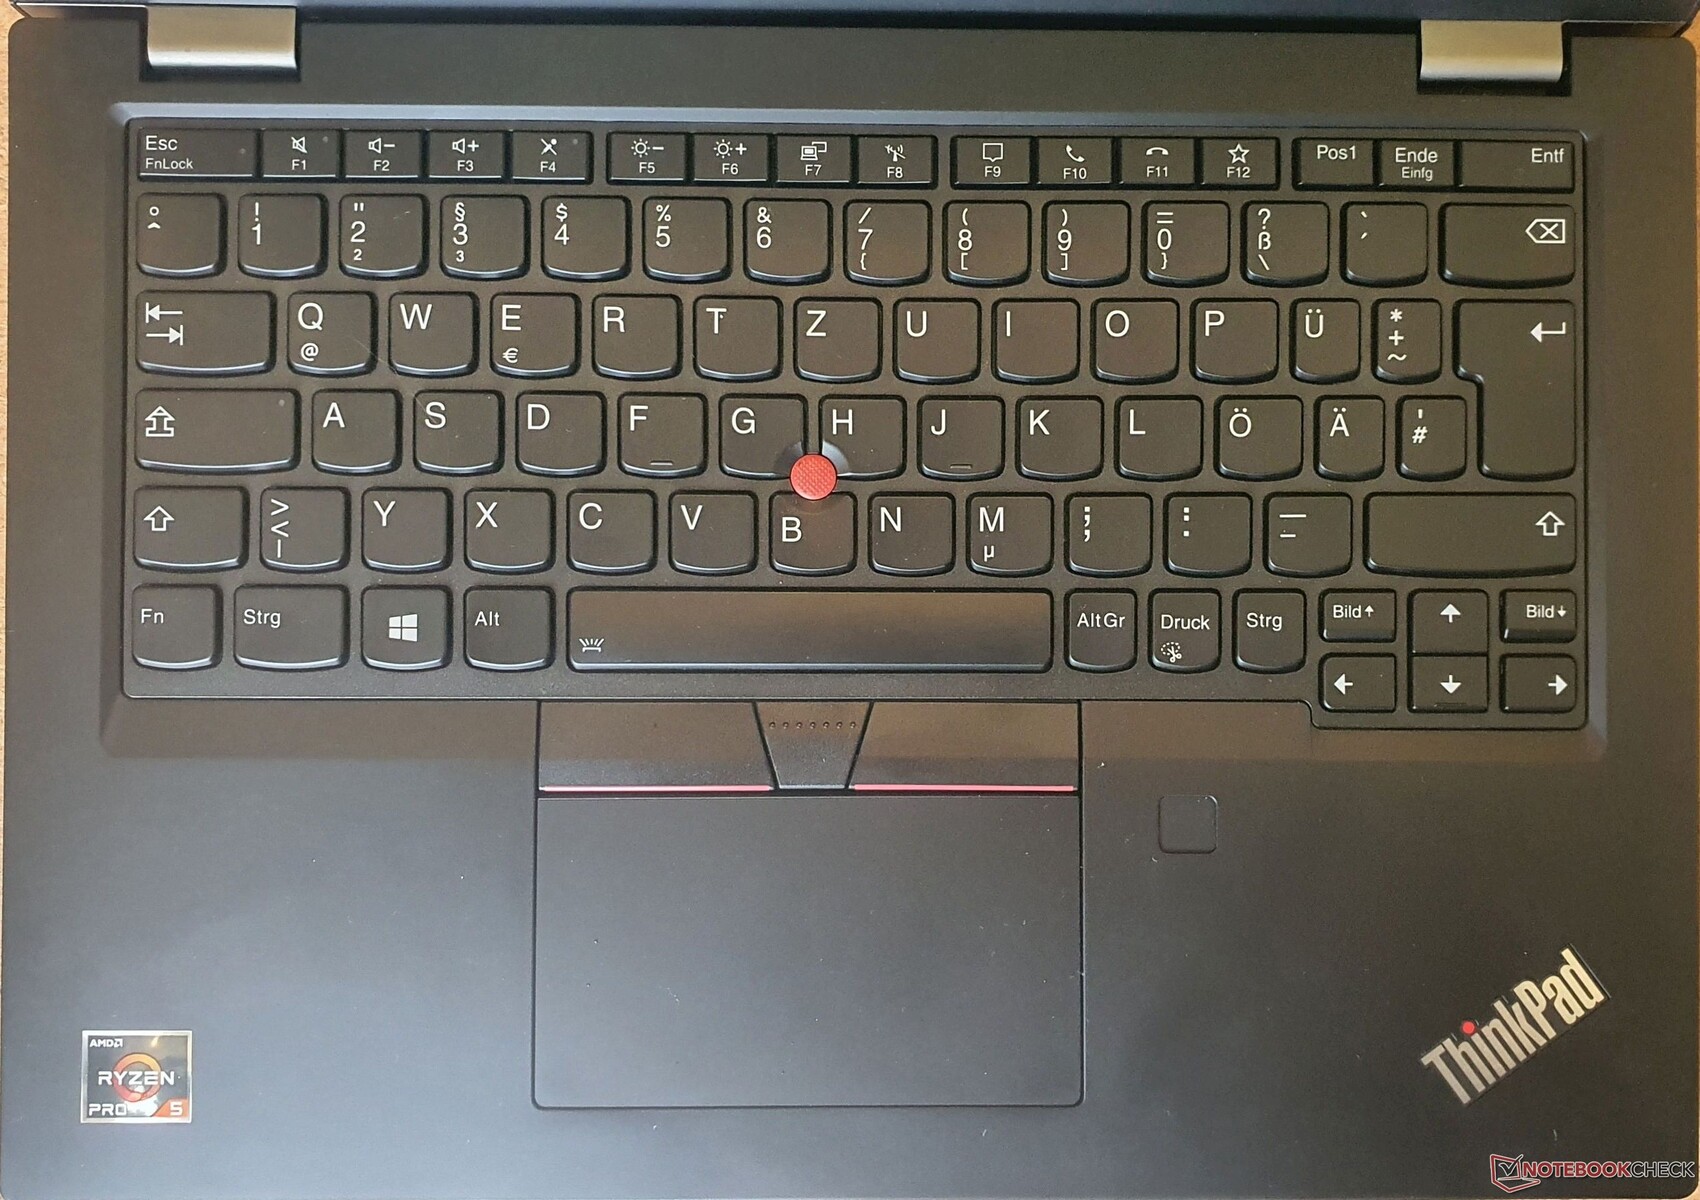
Dispositivos de entrada - Punto de presión nítido con un recorrido de 1,8 mm junto con un preciso panel táctil
Teclado
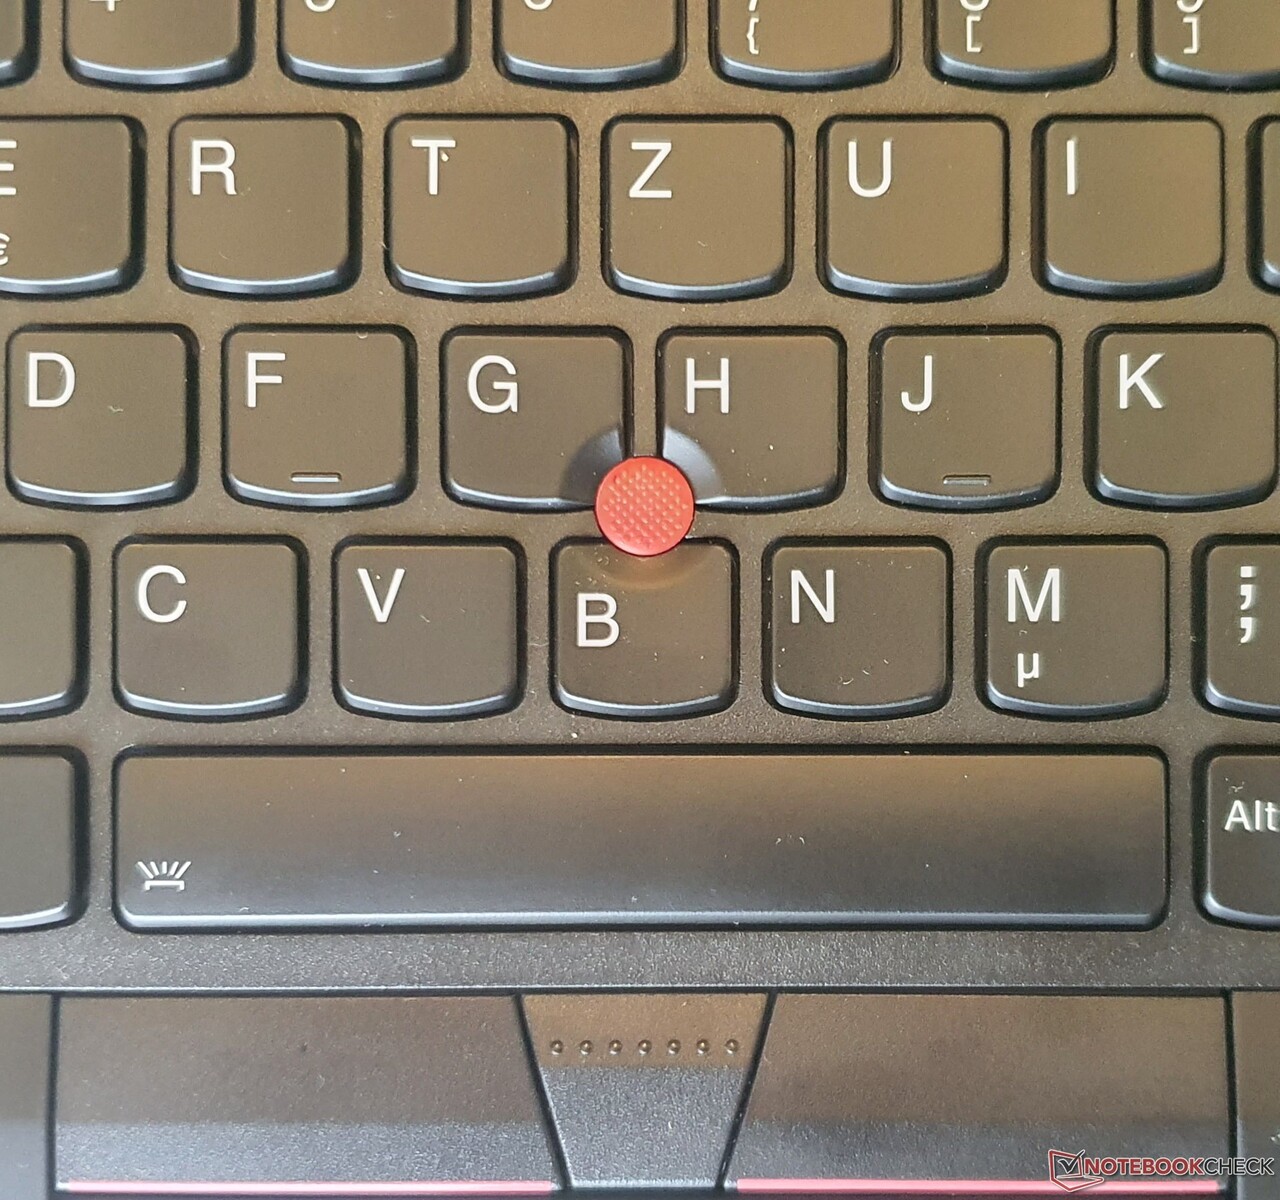
Las teclas ligeramente cóncavas, típicas de los ThinkPads, tienen una gran sensación de "agarre", ya que se adaptan a la forma de las yemas de los dedos. El teclado tiene una retroiluminación ajustable en dos niveles. Tiene un recorrido muy bueno de 1,8 mm, mientras que muchos ThinkPads modernos, así como portátiles de otros fabricantes, sólo ofrecen alrededor de 1,5 mm y menos aquí. El punto de presión es muy bueno y al probador le gusta incluso más que el "clásico" ThinkPad T430 (2,5 mm de recorrido), que suele usarse como referencia para uno de los mejores teclados chiclet.
La fuerza de accionamiento inicial está muy bien medida y, por tanto, ofrece una excelente sensación de tecleo, que en general es mucho mejor que en un X1 Carbon G9 o T14s Gen 2. El teclado no cede al escribir. Sin embargo, las teclas resultan un poco más pequeñas (95% del ancho estándar), como es el caso de la mayoría de portátiles de este tamaño.
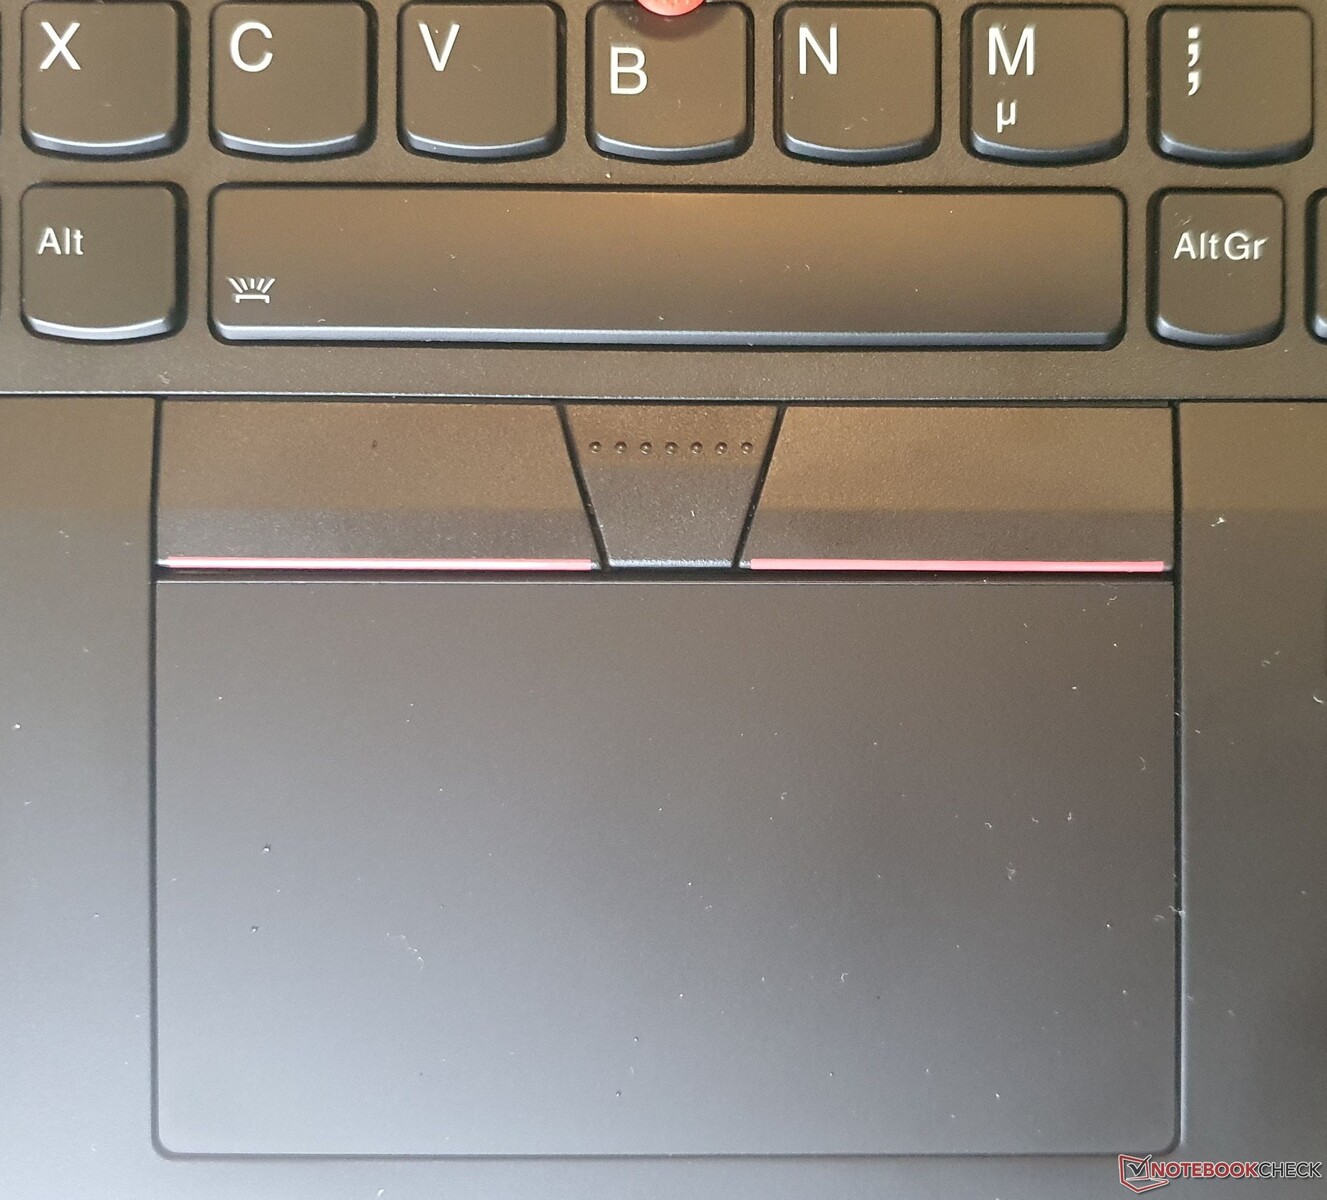
Touchpad y TrackPoint
La superficie de Mylar del touchpad es muy ligeramente rugosa y las propiedades de deslizamiento son incluso mejores que las de una superficie de cristal completamente lisa, en opinión del probador, pero esto también depende del gusto personal. Es suficientemente grande, especialmente para un dispositivo tan compacto
Precision , la capacidad de respuesta, el desplazamiento y los gestos multitáctiles funcionan muy bien. Los botones del ratón integrados en el touchpad se disparan con bastante precisión, pero el clic derecho está implementado de forma algo más aburrida, lo que podría deberse al dispositivo de prueba. También hay que tener en cuenta que Lenovo suele tener varios proveedores para el touchpad y el teclado, por lo que el mismo modelo puede diferir de nuestro modelo de pruebas al final.
El conocido TrackPoint de los ThinkPads de Lenovo permite un control más preciso y rápido del ratón con un poco de práctica, especialmente porque nunca hay que quitar las manos del teclado para deslizar el cursor por la pantalla. Afortunadamente, no está colocado demasiado profundo en el teclado, por lo que tiene un gran agarre. Los tres botones asociados (por encima del touchpad) se disparan sin problemas, pero de forma más vaga que en los ThinkPads más antiguos. El botón derecho del ratón también es un poco vago. Son comparables a los botones delThinkPad T480. El botón central, que se usa para el desplazamiento con el TrackPoint pero que también se puede reprogramar como clic central, por otro lado, ofrece muy buena respuesta.
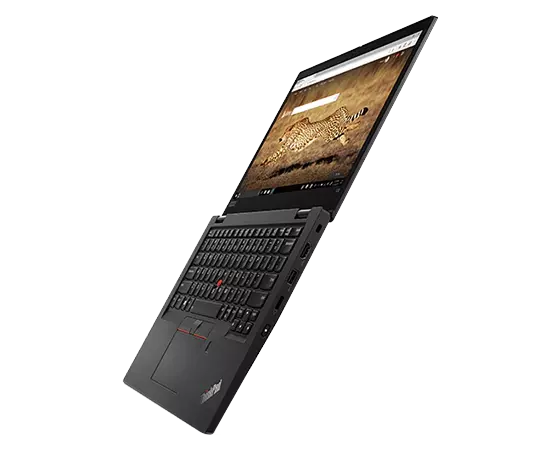
Pantalla - Panel FHD de brillo moderado con opción táctil
Hay tres opciones de panel para el ThinkPad L13 Gen2, al igual que el modelo Intel
13.3" HD (1366 x 768) TN, antirreflejo, 250 nits
13.3" FHD (1920 x 1080) IPS, antirreflejo, 250 nits
13.3" FHD (1920 x 1080) IPS, antirreflejo, pantalla táctil, 300 nits
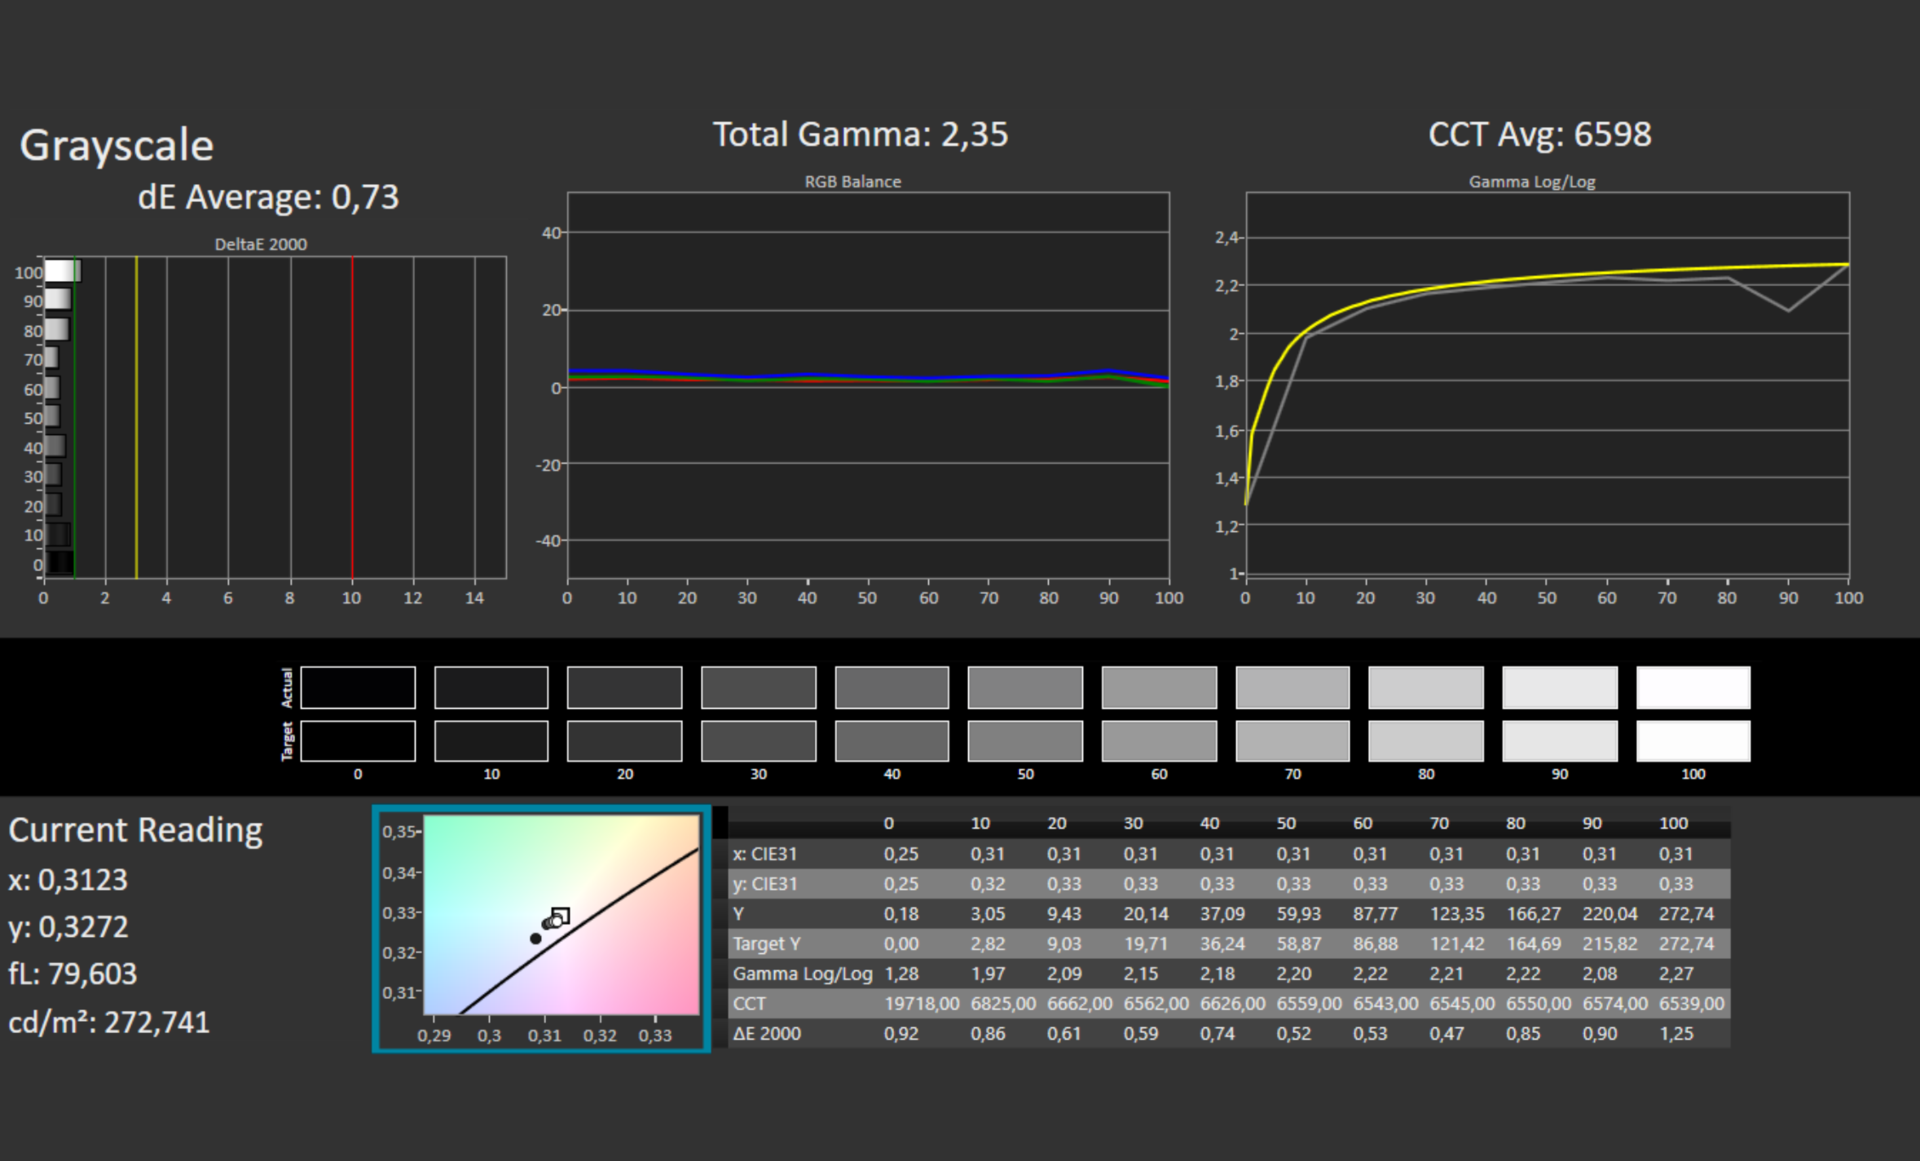
Todas las variantes ofrecen una pantalla mate, incluido el modelo con pantalla táctil en la célula, aunque la pantalla HD con tecnología TN de ángulo de visión débil debería evitarse a toda costa. Según el fabricante, nuestro modelo FHD con tecnología IPS tiene un brillo de unos 250 nits, pero esto se supera en la práctica, ya que nuestras mediciones muestran una media de 273 nits. Esto es suficiente para salas cerradas en la mayoría de los casos y la pantalla está claramente por encima de los 237 nits del modelo Intel y a la par con el valor medido del predecesor.
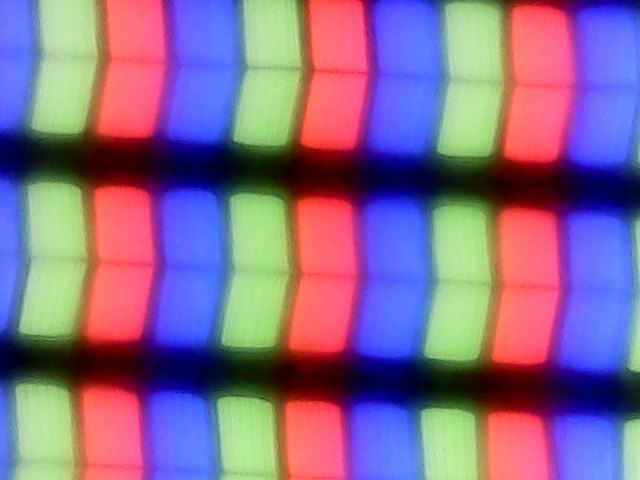
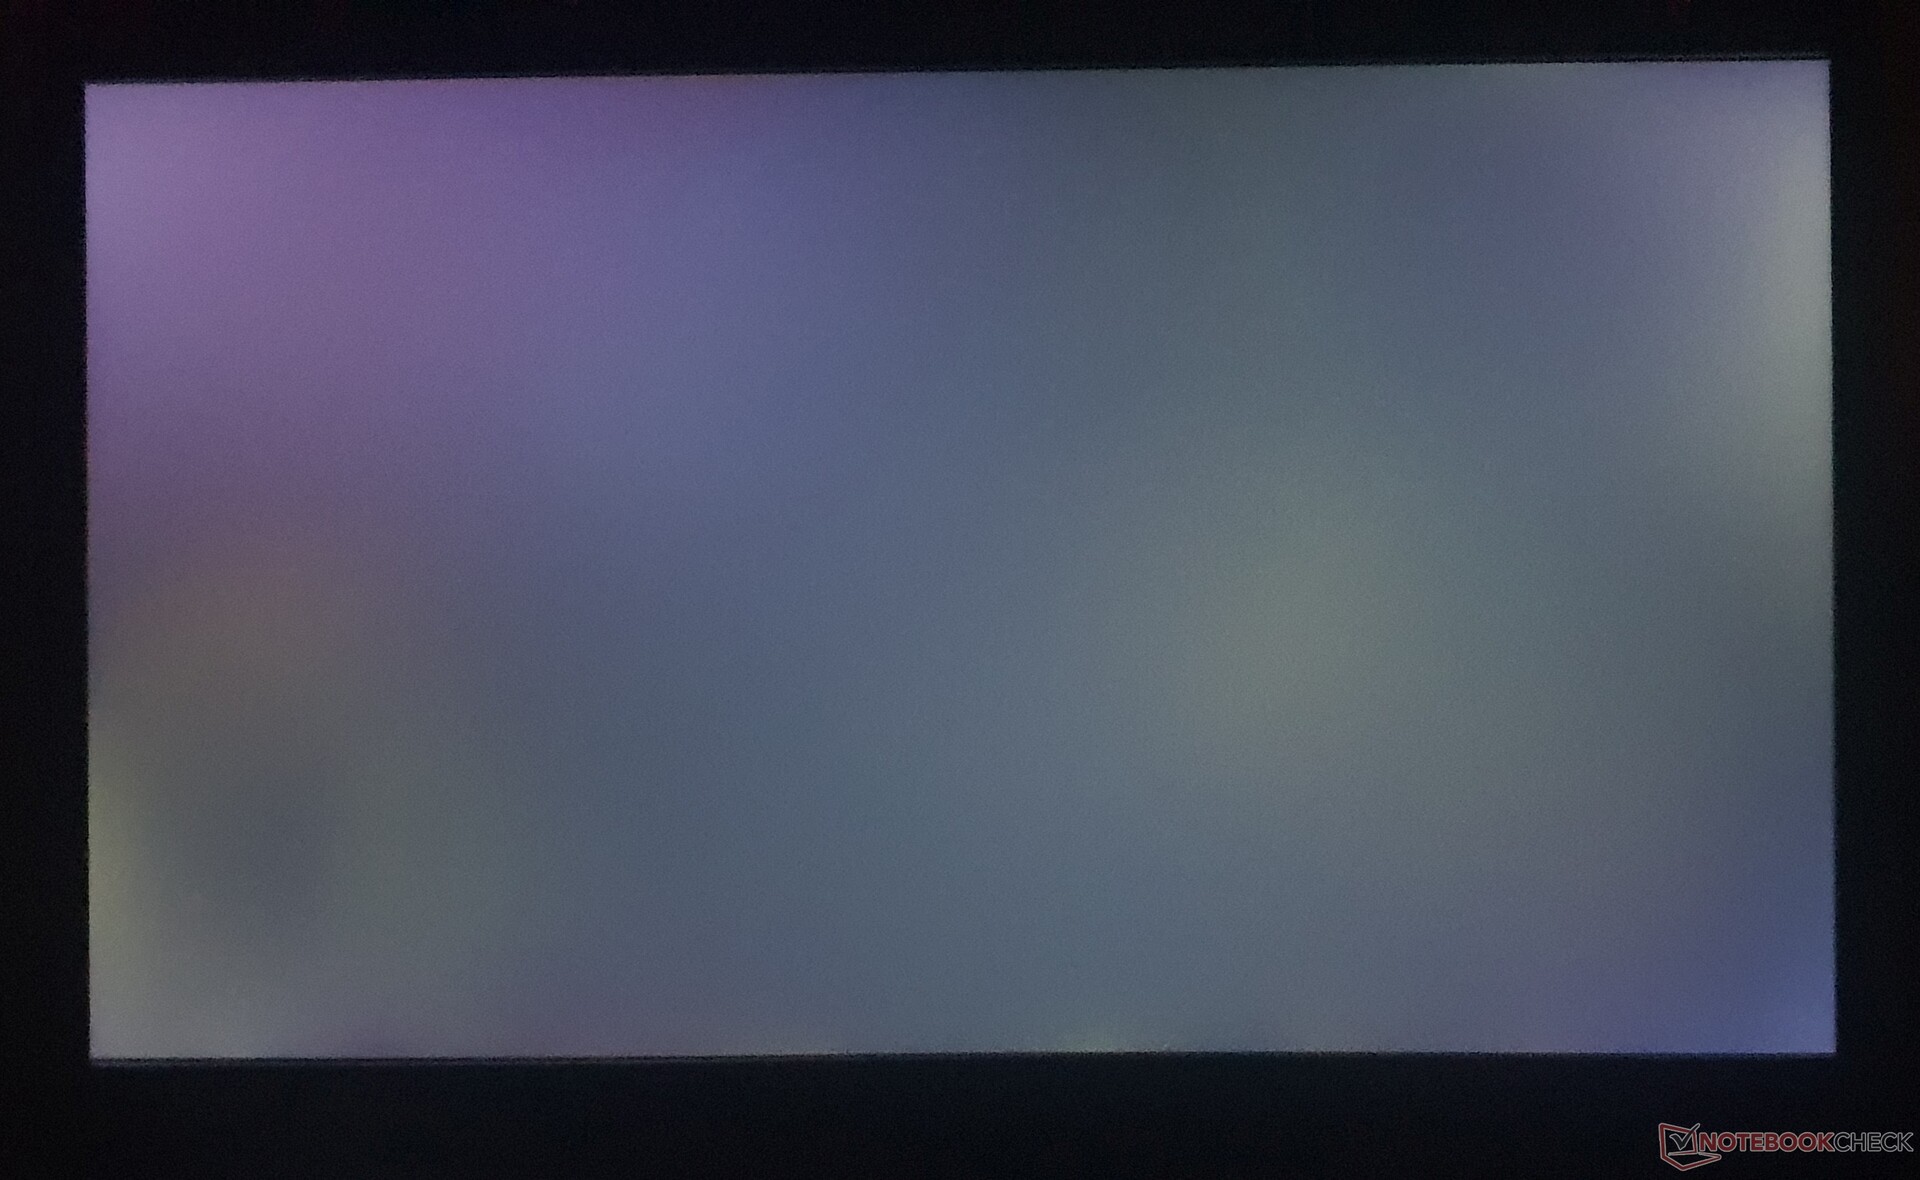
ElL13 Yoga Gen2 es otro 10 por ciento más brillante con casi 300 nits, el Dell Inspiron 13 7306 logra 312 nits, al igual que el ThinkPad X13 G2. El HP Pavilion Aero 13 se desmarca completamente de la competencia con 474 nits. Es interesante que la versión con pantalla táctil del L13 sea supuestamente 50 nits más brillante. La homogeneidad de la iluminación del 87% es de buena a muy buena, y la pantalla no sufre de PWM o sangrado de luz de fondo. Las áreas brillantes se ven mínimamente granuladas en la pantalla mate, pero sin distraer.
| |||||||||||||||||||||||||
iluminación: 87 %
Brillo con batería: 292 cd/m²
Contraste: 1069:1 (Negro: 0.275 cd/m²)
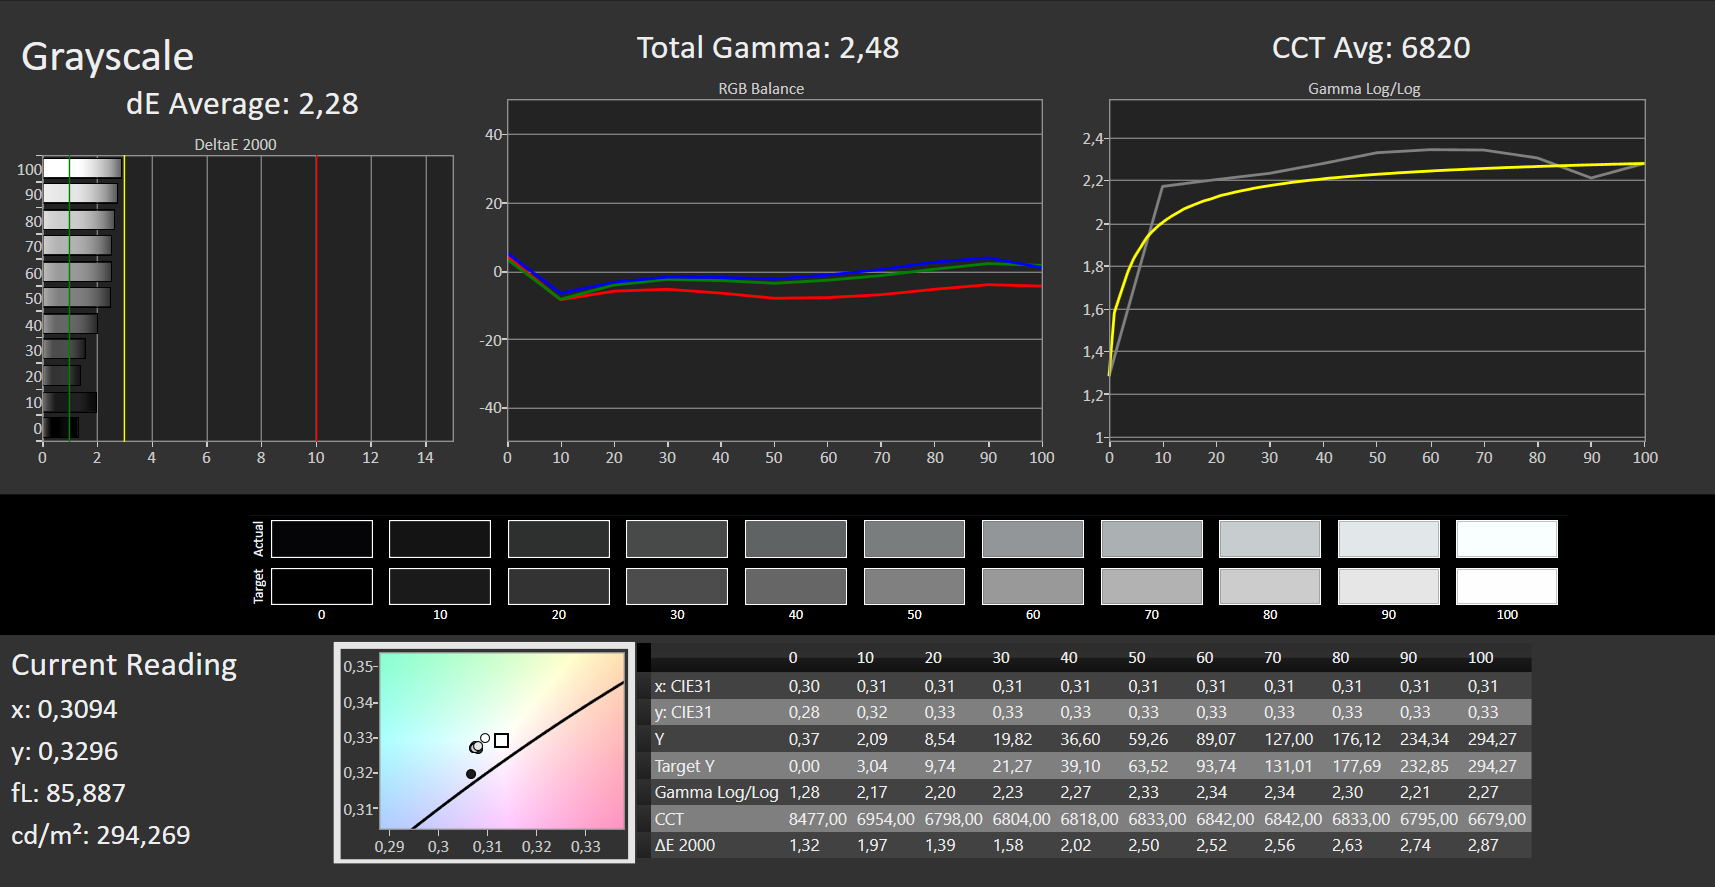
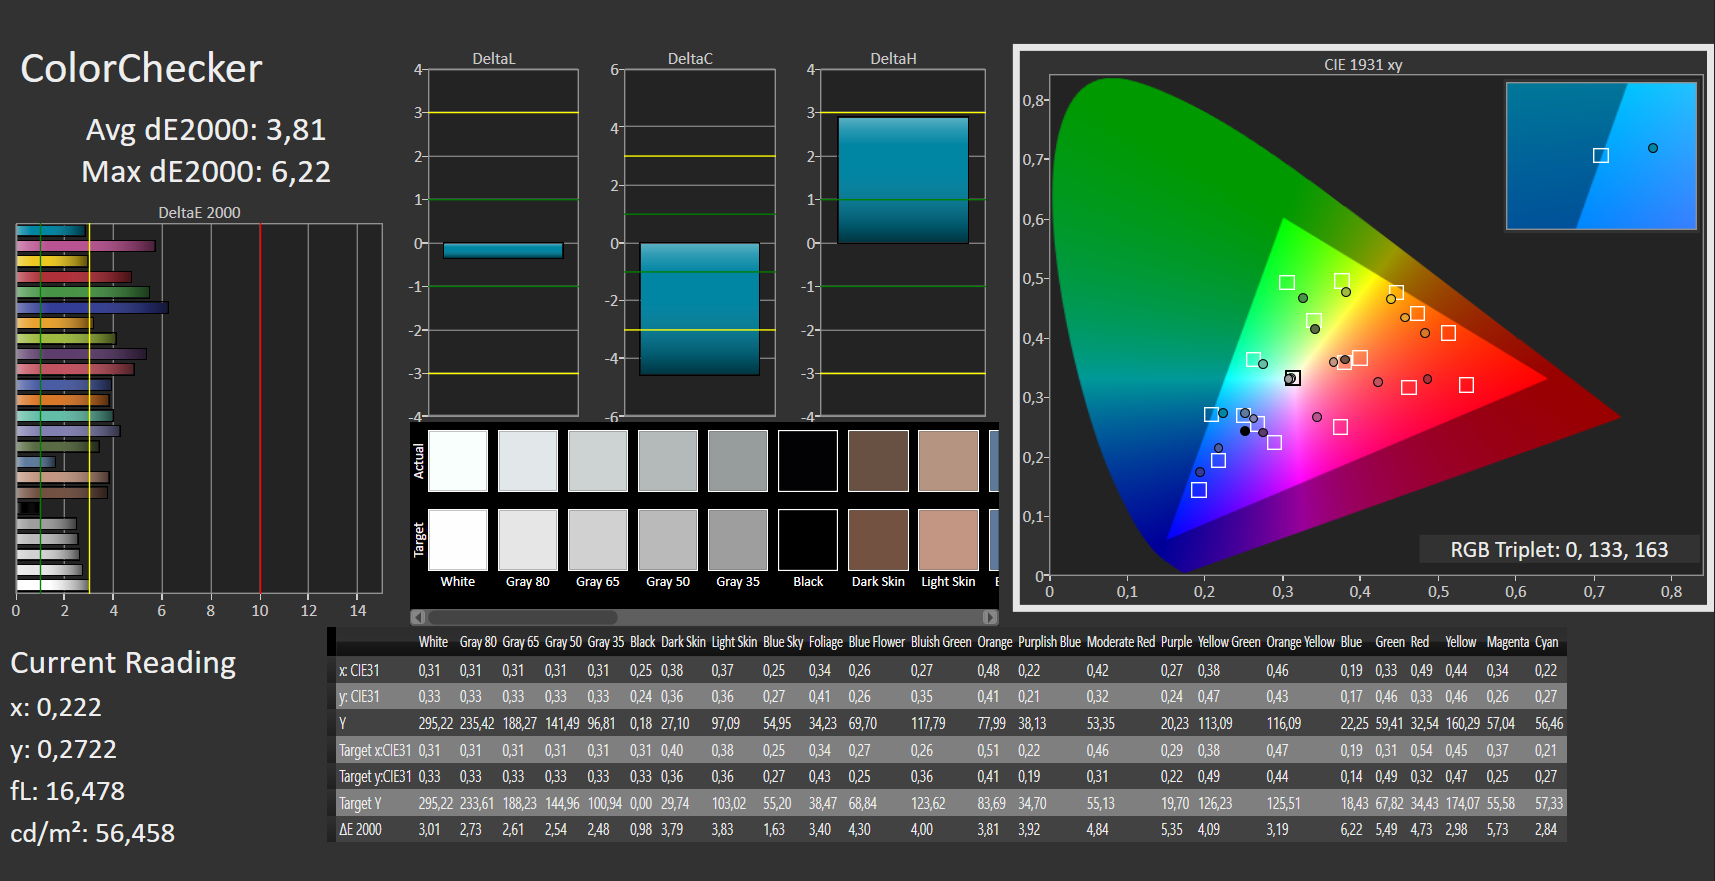
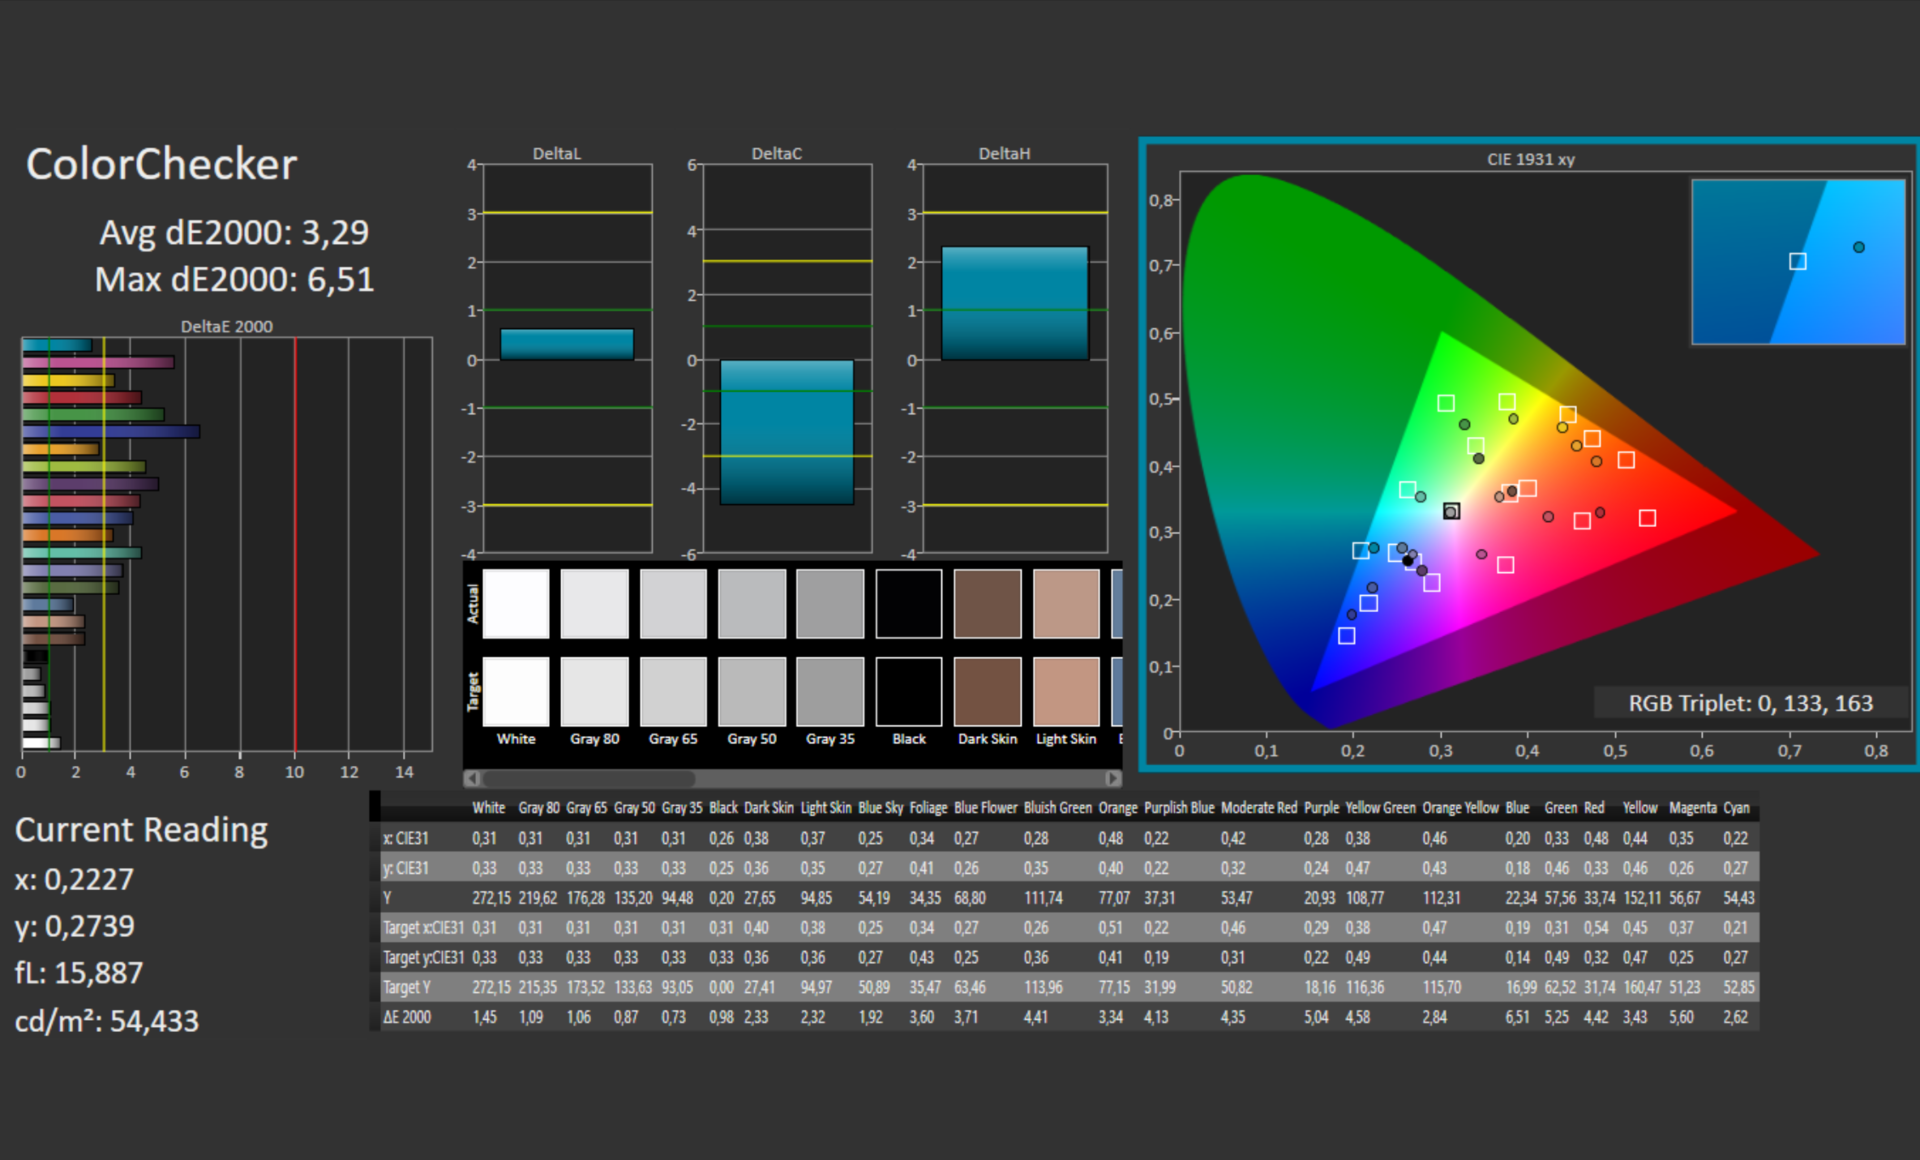
ΔE ColorChecker Calman: 3.81 | ∀{0.5-29.43 Ø4.71}
calibrated: 3.29
ΔE Greyscale Calman: 2.28 | ∀{0.09-98 Ø4.96}
38.7% AdobeRGB 1998 (Argyll 3D)
56.3% sRGB (Argyll 3D)
37.47% Display P3 (Argyll 3D)
Gamma: 2.48
CCT: 6820 K
| Lenovo ThinkPad L13 Gen2-21AB000PGE IVO M133NWF4 RA, IPS, 1920x1080, 13.3" | Lenovo ThinkPad L13 Gen2-20VH0017GE B133HAN06.6, IPS, 1920x1080, 13.3" | Lenovo ThinkPad L13 Yoga Gen2-20VK000VGE N133HCE-EP2, IPS, 1920x1080, 13.3" | Dell Inspiron 13 7306-6TYH5 AUO2B2B, IPS-Grade, 3840x2160, 13.3" | Lenovo ThinkPad X13 G2 AMD 20XH001KGE NV133WUM-N61, IPS LED, 1920x1200, 13.3" | HP Pavilion Aero 13 be0097nr AU Optronics AUO6496, IPS, 1920x1200, 13.3" | |
|---|---|---|---|---|---|---|
| Display | 13% | 81% | 66% | 83% | 89% | |
| Display P3 Coverage (%) | 37.47 | 42.49 13% | 68.5 83% | 63.8 70% | 70.1 87% | 73.4 96% |
| sRGB Coverage (%) | 56.3 | 99.4 77% | 90.9 61% | 99.4 77% | 99.8 77% | |
| AdobeRGB 1998 Coverage (%) | 38.7 | 43.92 13% | 70.7 83% | 64.9 68% | 71.3 84% | 74.8 93% |
| Response Times | -1% | 8% | -1% | 32% | 9% | |
| Response Time Grey 50% / Grey 80% * (ms) | 49.2 ? | 52.4 ? -7% | 44.4 ? 10% | 52 ? -6% | 34 ? 31% | 42.4 ? 14% |
| Response Time Black / White * (ms) | 32.8 ? | 31.2 ? 5% | 31.2 ? 5% | 31 ? 5% | 22 ? 33% | 31.6 ? 4% |
| PWM Frequency (Hz) | 25000 ? | |||||
| Screen | -28% | 22% | -5% | 25% | 19% | |
| Brightness middle (cd/m²) | 294 | 244 -17% | 316 7% | 312 6% | 309 5% | 473.9 61% |
| Brightness (cd/m²) | 273 | 237 -13% | 299 10% | 313 15% | 297 9% | 458 68% |
| Brightness Distribution (%) | 87 | 93 7% | 92 6% | 95 9% | 81 -7% | 91 5% |
| Black Level * (cd/m²) | 0.275 | 0.21 24% | 0.25 9% | 0.29 -5% | 0.26 5% | 0.36 -31% |
| Contrast (:1) | 1069 | 1162 9% | 1264 18% | 1076 1% | 1188 11% | 1316 23% |
| Colorchecker dE 2000 * | 3.81 | 4.7 -23% | 1.7 55% | 3.91 -3% | 1.6 58% | 2.99 22% |
| Colorchecker dE 2000 max. * | 6.22 | 17.7 -185% | 3.8 39% | 6.83 -10% | 3 52% | 4.35 30% |
| Colorchecker dE 2000 calibrated * | 3.29 | 4.3 -31% | 0.7 79% | 0.8 76% | 1.1 67% | |
| Greyscale dE 2000 * | 2.28 | 2.8 -23% | 2.8 -23% | 3.42 -50% | 2 12% | 4 -75% |
| Gamma | 2.48 89% | 2.24 98% | 2.25 98% | 2.18 101% | 2.24 98% | 2.35 94% |
| CCT | 6820 95% | 6259 104% | 6654 98% | 6194 105% | 6315 103% | 6269 104% |
| Color Space (Percent of AdobeRGB 1998) (%) | 40.3 | 64.5 | ||||
| Color Space (Percent of sRGB) (%) | 63 | 99.4 | ||||
| Media total (Programa/Opciones) | -5% /
-18% | 37% /
33% | 20% /
12% | 47% /
38% | 39% /
32% |
* ... más pequeño es mejor
El valor de negro de 0,275 cd/m² y el contraste resultante de 1069:1 es bueno y está en el medio de la comparación de clases. La resolución está perfectamente bien para una diagonal de 13,3 pulgadas, pero con un valor PPI de 166, no puede llamarse de ultra alta resolución. La ventaja de esto es que evita el escalado, aunque para ello se necesitan buenos ojos. El probador prefirió el 125 por ciento aquí.
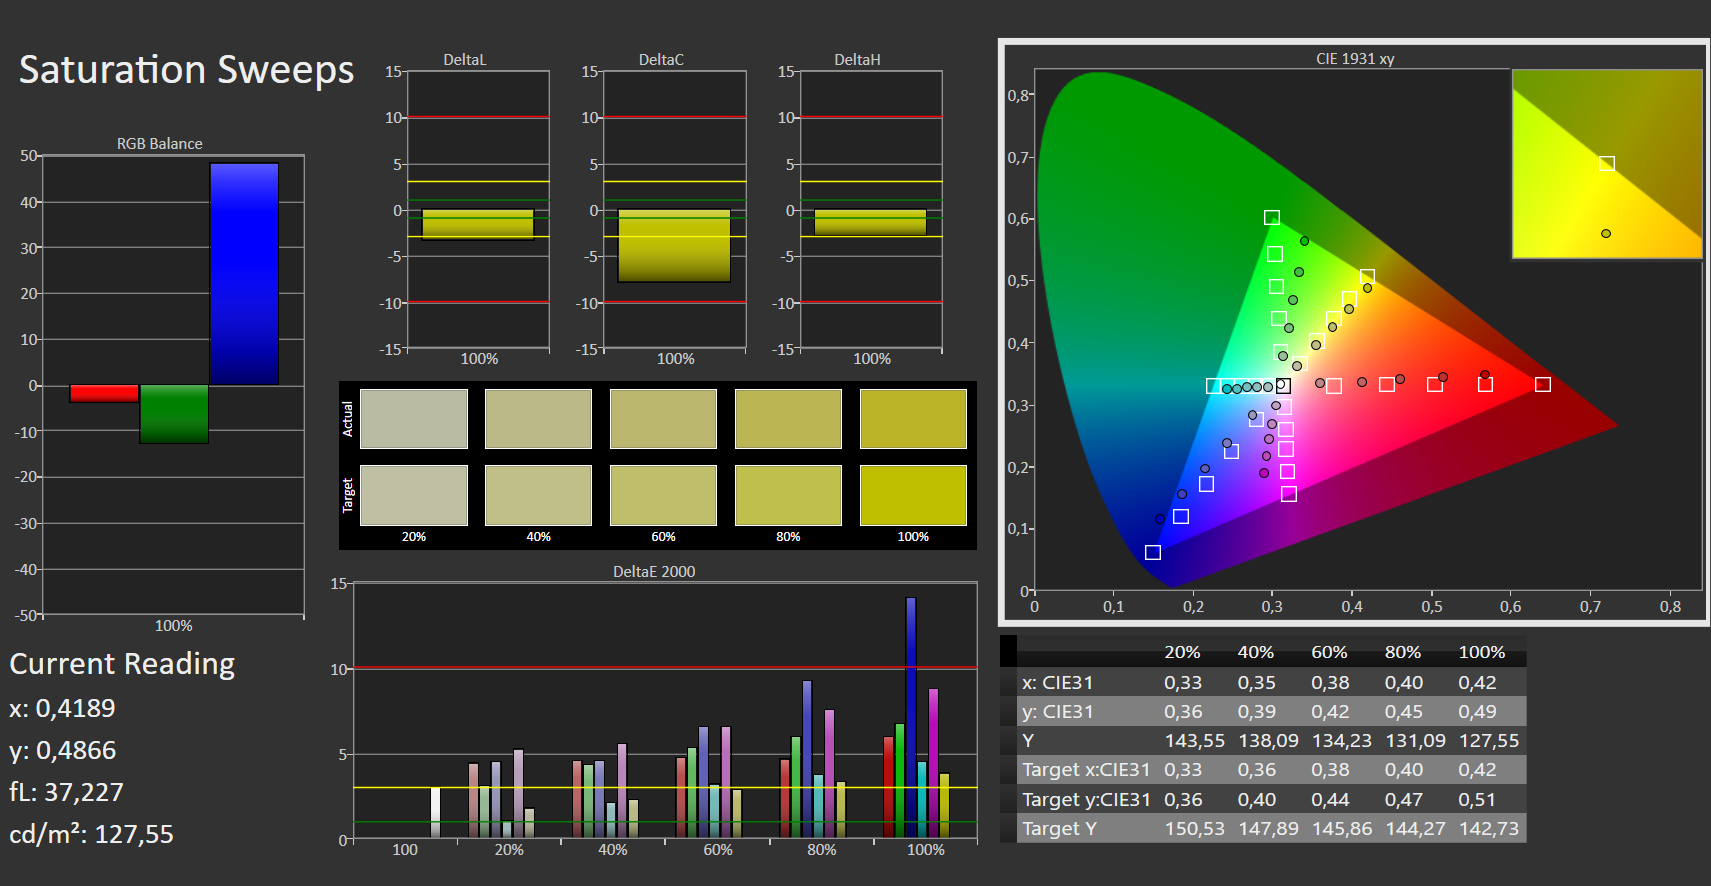
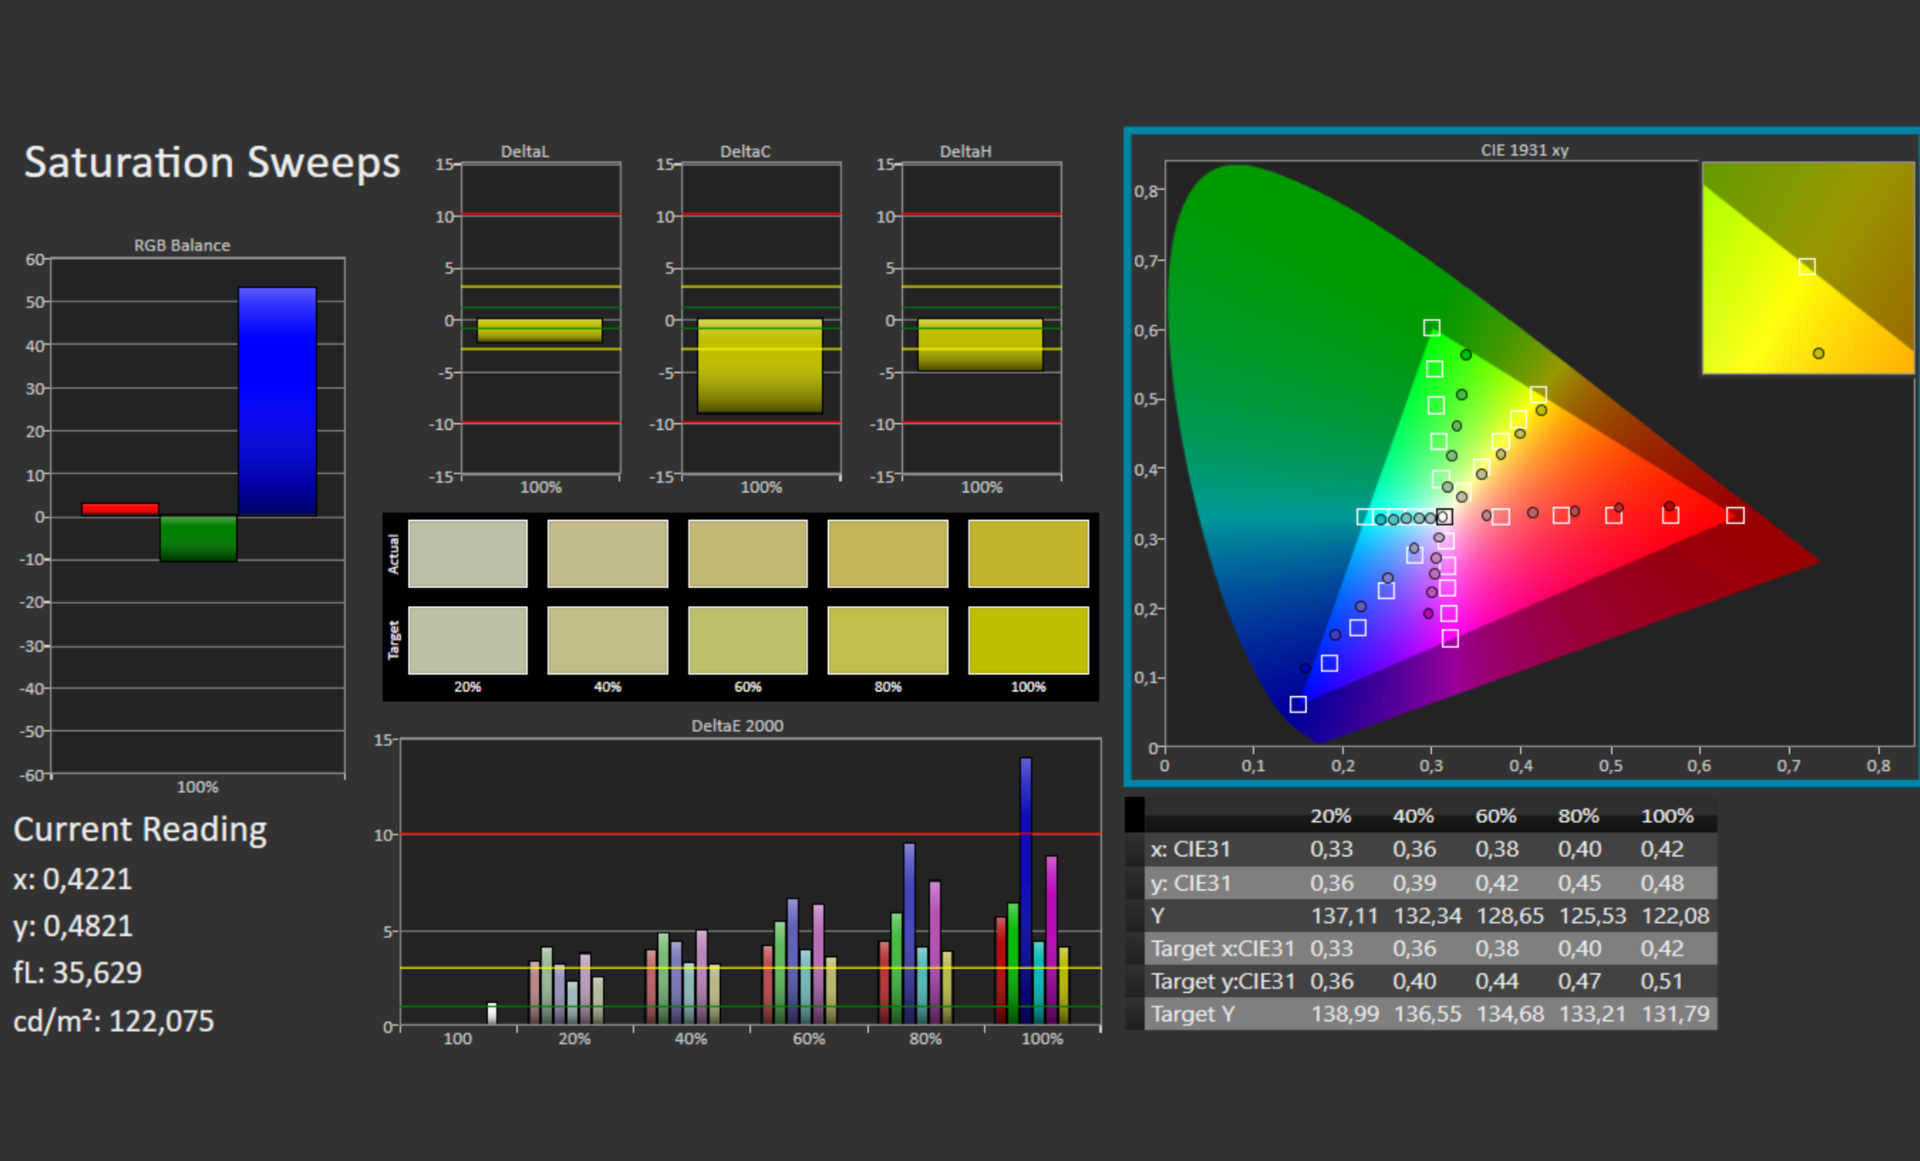
Nuestro análisis también reveló que el panel no puede mostrar los colores con precisión. Junto con la baja cobertura del espacio de color (sRGB sólo el 56%), el panel no es, por tanto, adecuado para editar imágenes/vídeos. Sin embargo, no hay restricciones para el uso normal en la oficina. Todos los modelos de la comparación, como el L13 Yoga Gen2rinden mucho mejor con una cobertura del 90% al 99% del espacio de color sRGB. Subjetivamente, la imagen del display fue muy agradable en todos los escenarios (oficina, internet, vídeos, fotos).
Tiempos de respuesta del display
| ↔ Tiempo de respuesta de Negro a Blanco | ||
|---|---|---|
| 32.8 ms ... subida ↗ y bajada ↘ combinada | ↗ 17.8 ms subida |  |
| ↘ 15 ms bajada | ||
| La pantalla mostró tiempos de respuesta lentos en nuestros tests y podría ser demasiado lenta para los jugones. En comparación, todos los dispositivos de prueba van de ##min### (mínimo) a 240 (máximo) ms. » 88 % de todos los dispositivos son mejores. Eso quiere decir que el tiempo de respuesta es peor que la media (19.8 ms) de todos los dispositivos testados. | ||
| ↔ Tiempo de respuesta 50% Gris a 80% Gris | ||
| 49.2 ms ... subida ↗ y bajada ↘ combinada | ↗ 23.4 ms subida |  |
| ↘ 25.8 ms bajada | ||
| La pantalla mostró tiempos de respuesta lentos en nuestros tests y podría ser demasiado lenta para los jugones. En comparación, todos los dispositivos de prueba van de ##min### (mínimo) a 636 (máximo) ms. » 85 % de todos los dispositivos son mejores. Eso quiere decir que el tiempo de respuesta es peor que la media (31 ms) de todos los dispositivos testados. | ||
Parpadeo de Pantalla / PWM (Pulse-Width Modulation)
| Parpadeo de Pantalla / PWM no detectado |  | ||
Comparación: 52 % de todos los dispositivos testados no usaron PWM para atenuar el display. Si se usó, medimos una media de 7751 (mínimo: 5 - máxmo: 343500) Hz. | |||
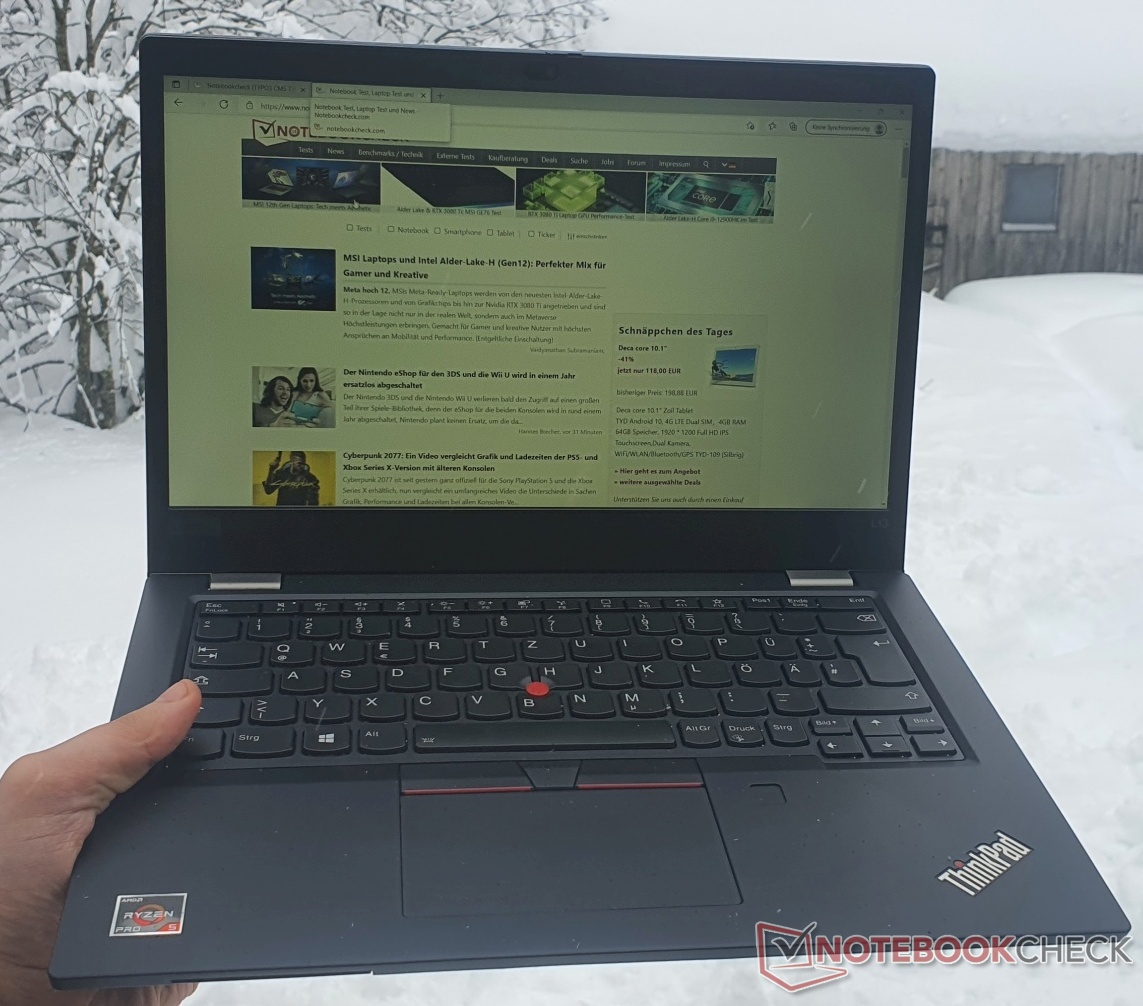
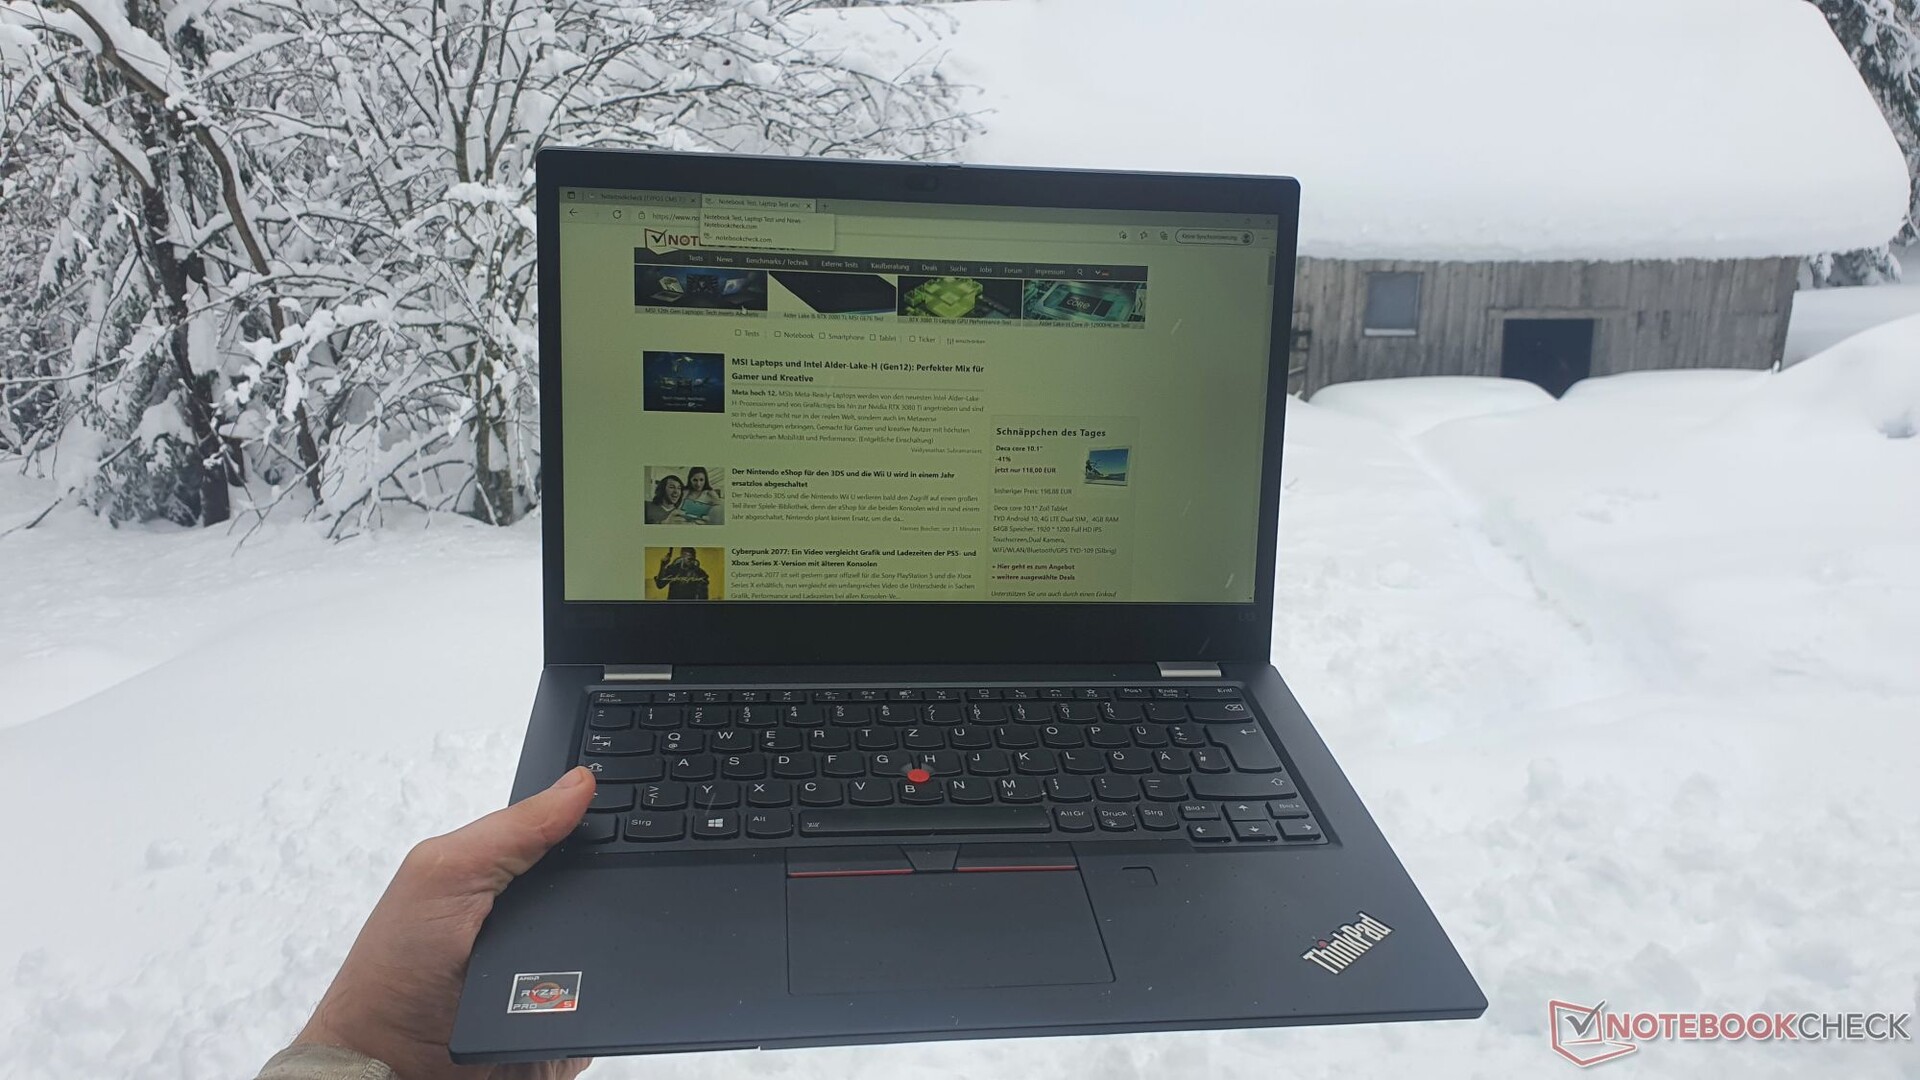
La pantalla mate con 273 nits de brillo es definitivamente utilizable para el uso en exteriores, pero necesita un poco más de brillo bajo la luz solar directa.
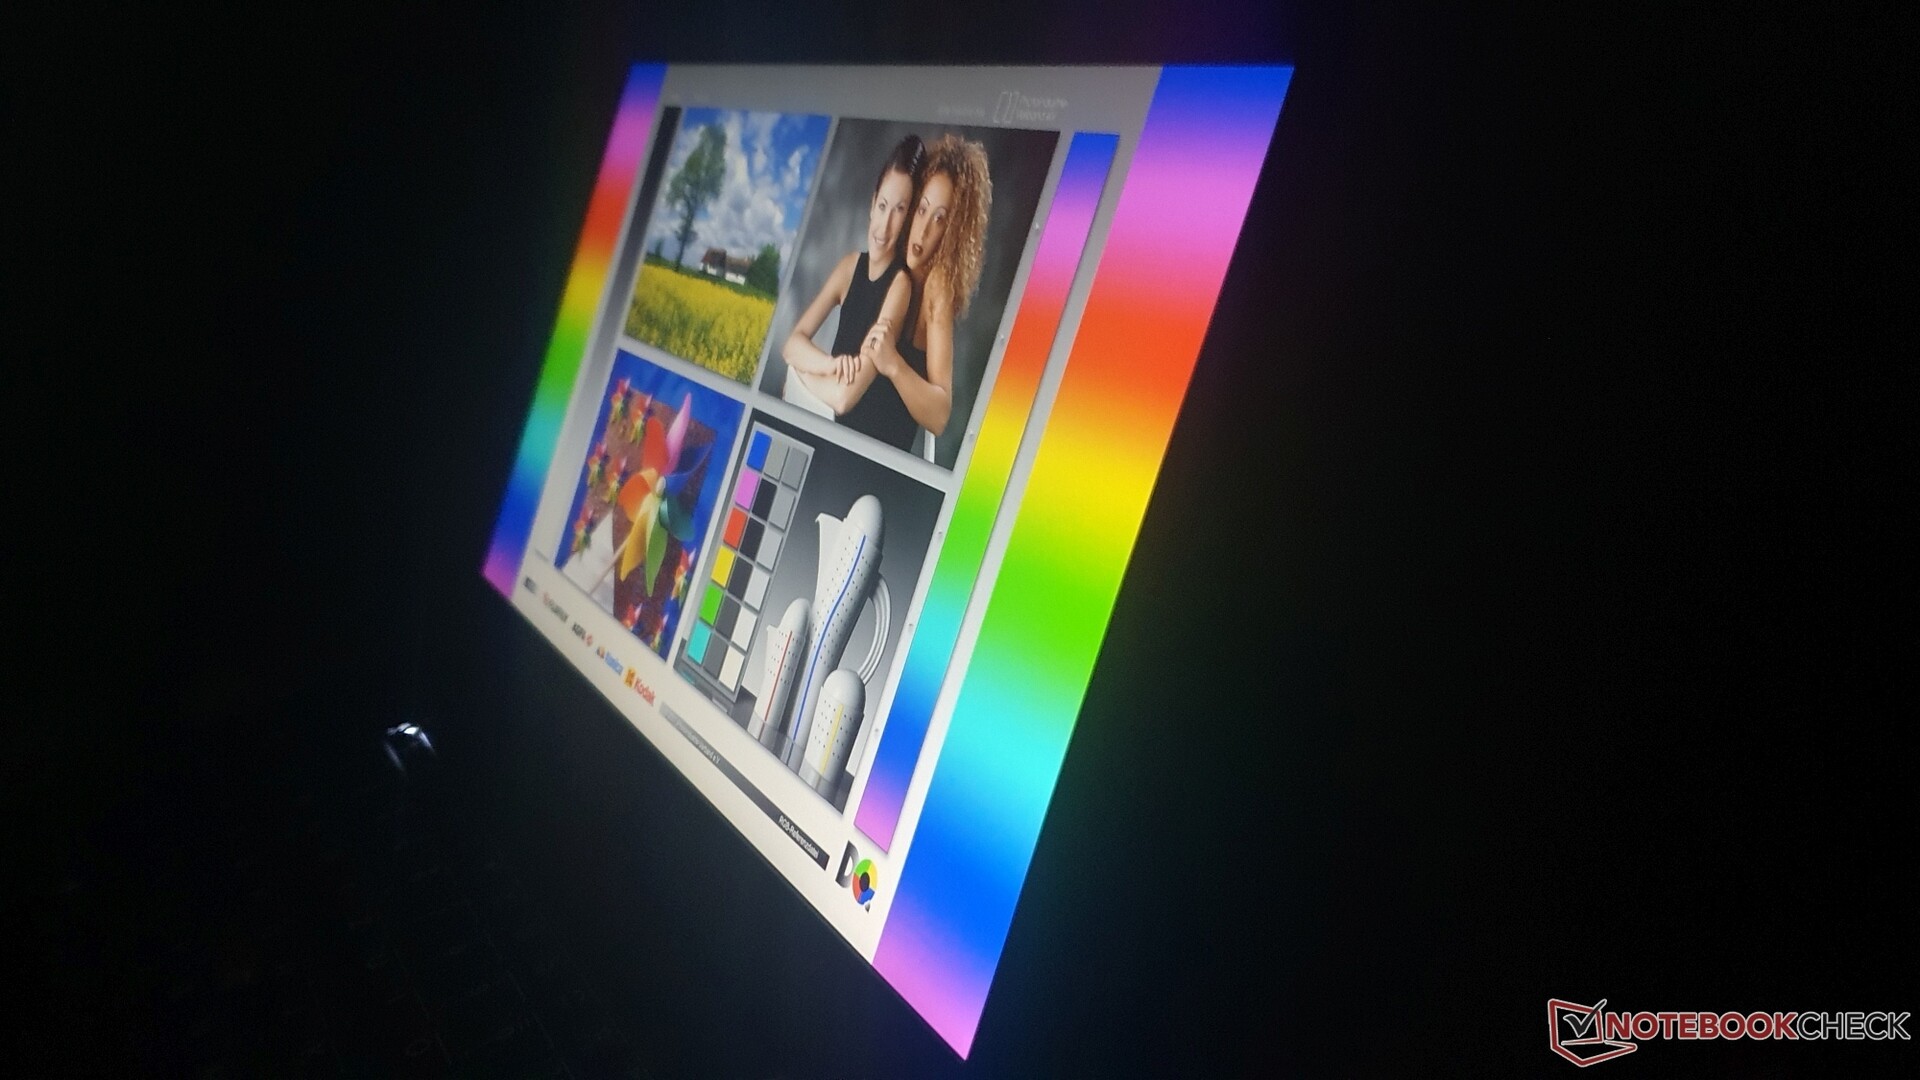
Los ángulos de visión pueden describirse como muy buenos, como es típico de los paneles IPS, aunque los OLED ofrecen ángulos de visión notablemente mejores y algunos paneles IPS de gama alta son incluso más "capaces". Sin embargo, no hay restricciones para las tareas convencionales
Rendimiento: AMD duplica el rendimiento de la CPU de Intel
Nuestro dispositivo de prueba viene con el AMD Ryzen 5 PRO 5650U que no deja nada que desear en términos de rendimiento para un ultrabook, ya que la CPU casi funciona al nivel de las estaciones de trabajo de los últimos años. Como alternativa, existe un procesador aún más potente con otros dos núcleos, el Ryzen 7 PRO 5850Uque también se utiliza en estaciones de trabajo móviles, como el ThinkPad P14s G2 por ejemplo.
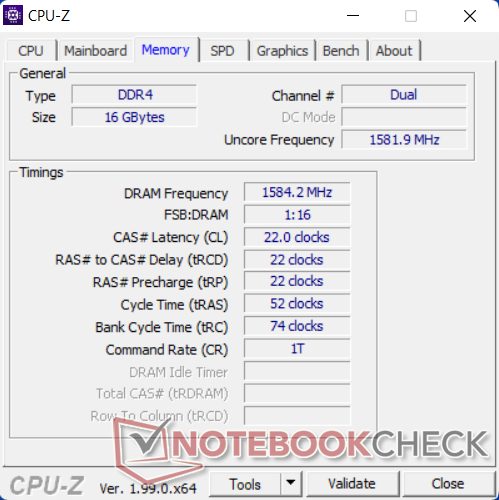
A Ryzen 3 5450U con "sólo" cuatro núcleos de CPU también es posible y ya es suficiente para la mayoría de tareas, mientras que debería ser notablemente fácil para el bolsillo. El ThinkPad L13 Gen2 está disponible con 8 GB o 16 GB de memoria de trabajo soldada, por lo que 8 GB sólo bastan para el trabajo ofimático más ligero y la navegación. Con el predecesor, el ThinkPad L390era posible añadir 64 GB a través de dos ranuras de RAM
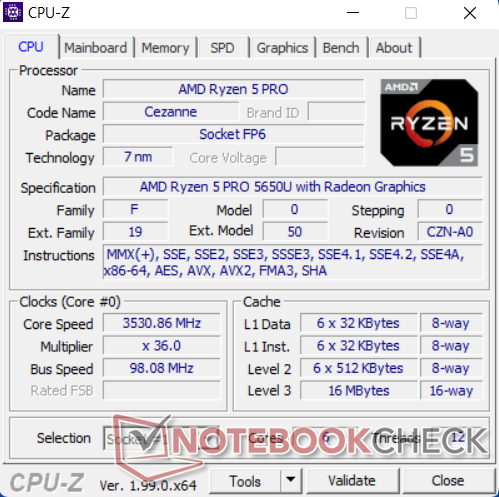
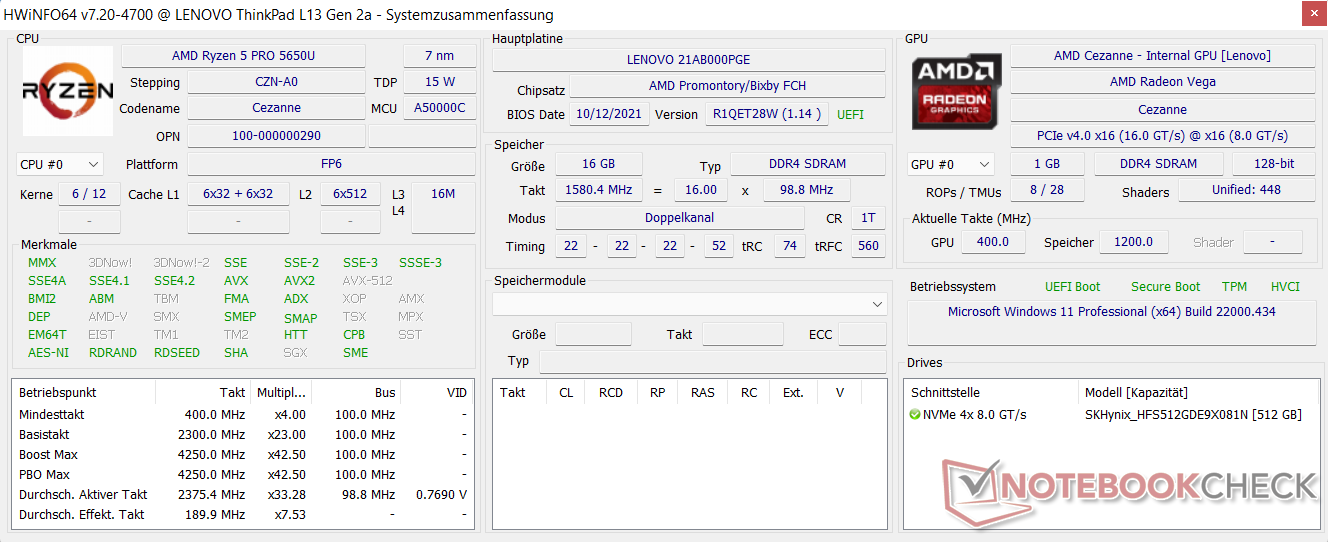
Procesador
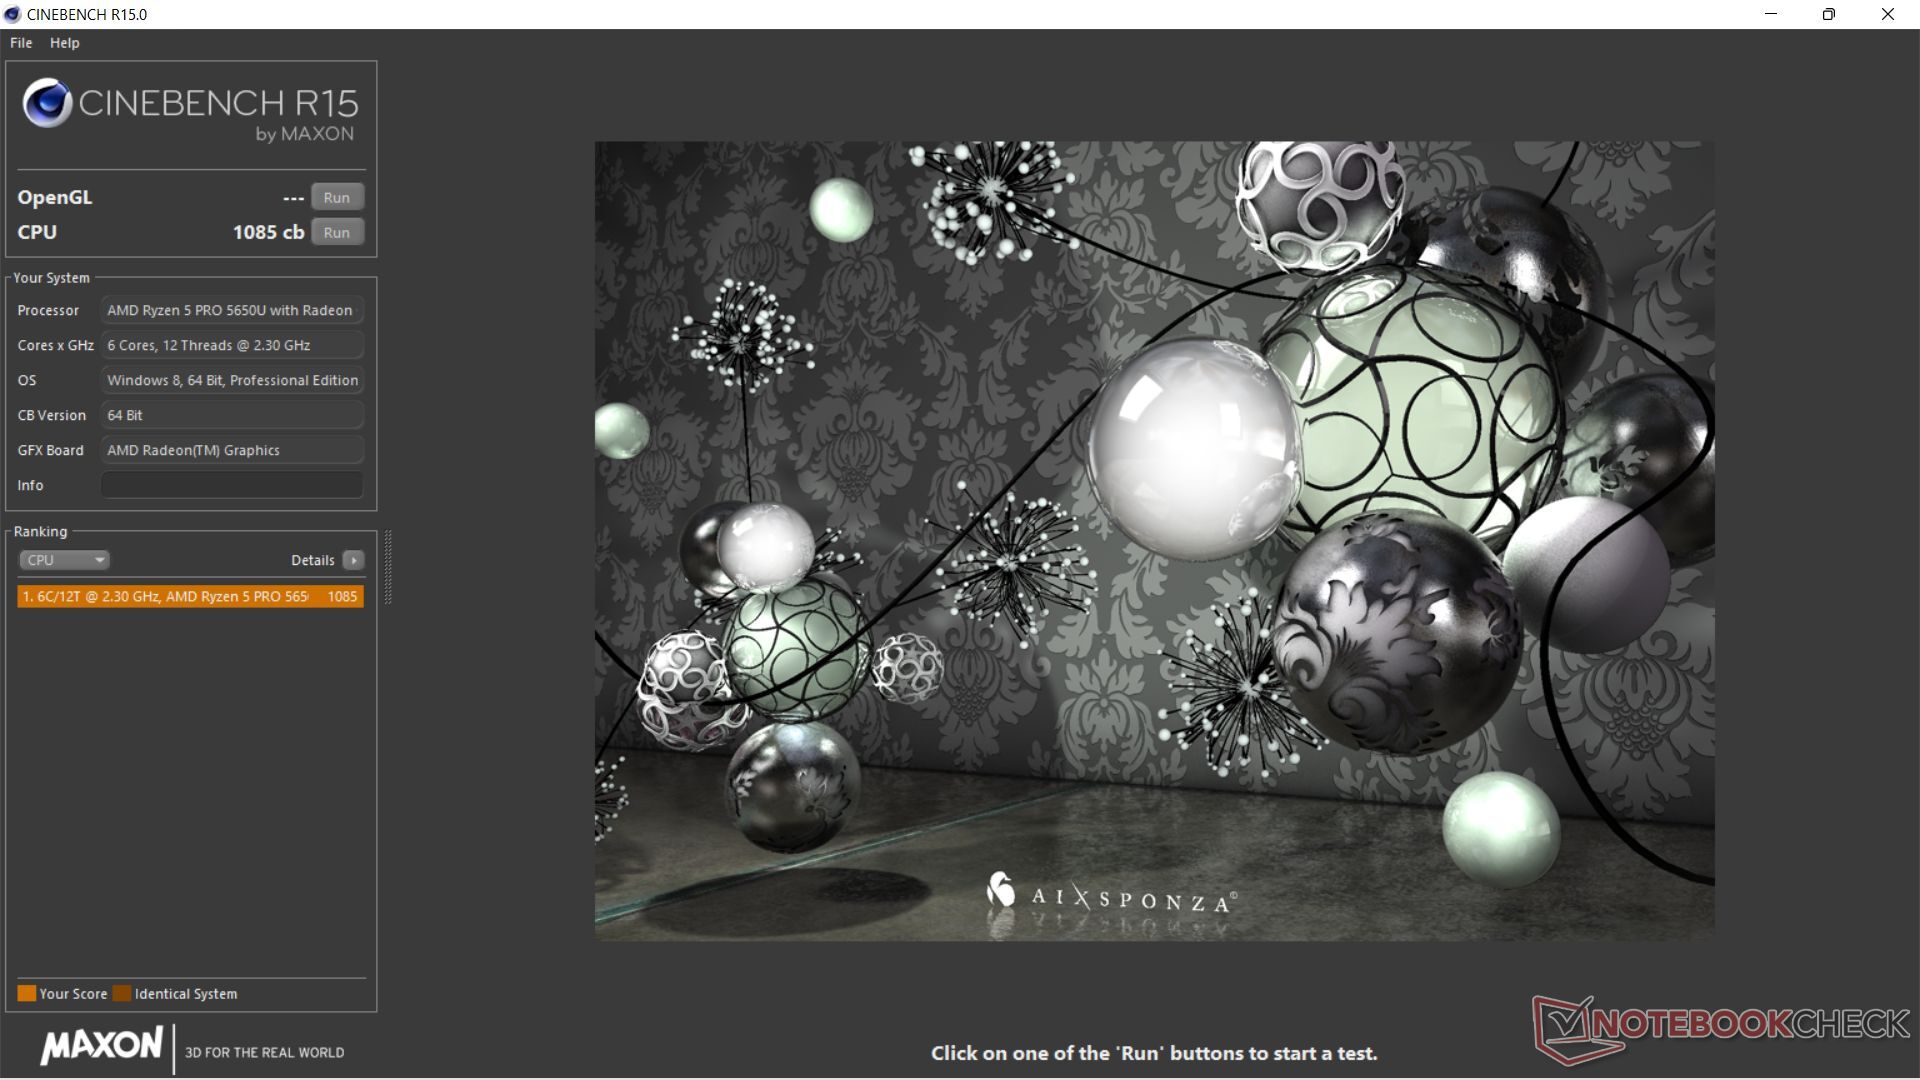
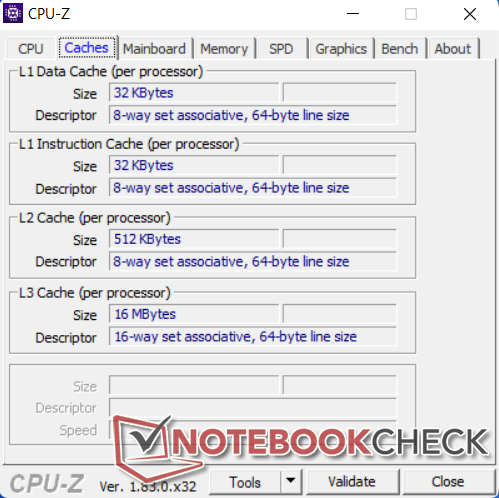
El Ryzen 5 PRO 5650U es un procesador de seis núcleos con la arquitectura Zen 3 de AMD y una Vega-7de gráficos Vega-7. Los seis núcleos de la CPU tienen una frecuencia de hasta 2.3 a 4.2 GHz. En la prueba multihilo Cinebench R15, el reloj está brevemente a 3.6 GHz (30 vatios), baja a unos 2.65 GHz (15 vatios) tras unos segundos y se mantiene así durante todo el periodo de prueba. El nivel de rendimiento es, por tanto, constante, pero otros dispositivos de comparación como el ThinkPad X13 G2con la misma CPU, revelan un 15 por ciento más de rendimiento en Cinebench. En el bucle SingleCore, los 3.55 GHz están presentes con un consumo de 12.5 vatios.
En los benchmarks de aplicaciones, se puede ver que el procesador suele superar a su modelo hermano basado en Intel hasta en un 75 a 95 por ciento en los benchmarks multihilo bajo carga continua (como Cinebench Multi Loop), lo cual es muy impresionante. Sólo el procesador interno de ocho núcleos de AMD vuelve a superarlo claramente en el campo de la comparación. El rendimiento de la CPU no está limitado en modo batería. Más bien, se establece un límite TDP de 15 vatios desde el principio, por lo que no se libera todo el rendimiento en favor del volumen operativo.
Cinebench R15 Multi Endurance test
Cinebench R23: Multi Core | Single Core
Cinebench R20: CPU (Multi Core) | CPU (Single Core)
Cinebench R15: CPU Multi 64Bit | CPU Single 64Bit
Blender: v2.79 BMW27 CPU
7-Zip 18.03: 7z b 4 | 7z b 4 -mmt1
Geekbench 5.5: Multi-Core | Single-Core
HWBOT x265 Benchmark v2.2: 4k Preset
LibreOffice : 20 Documents To PDF
R Benchmark 2.5: Overall mean
| CPU Performance rating | |
| Media de la clase Subnotebook | |
| HP ProBook x360 435 G8 R7-5800U | |
| HP Pavilion Aero 13 be0097nr -2! | |
| Lenovo ThinkPad X13 G2 AMD 20XH001KGE | |
| Medio AMD Ryzen 5 PRO 5650U | |
| HP EliteBook 845 G7 Ryzen 7 Pro 4750U -2! | |
| Lenovo ThinkPad L13 Gen2-21AB000PGE | |
| Dell Inspiron 13 7306-6TYH5 | |
| HP Elitebook x360 1040 G5 -12! | |
| Lenovo ThinkPad L13 Gen2-20VH0017GE | |
| Lenovo ThinkPad L13 Yoga Gen2-20VK000VGE | |
| Cinebench R23 / Multi Core | |
| Media de la clase Subnotebook (1555 - 21812, n=60, últimos 2 años) | |
| HP ProBook x360 435 G8 R7-5800U | |
| HP Pavilion Aero 13 be0097nr | |
| Lenovo ThinkPad X13 G2 AMD 20XH001KGE | |
| Medio AMD Ryzen 5 PRO 5650U (6210 - 7140, n=3) | |
| Lenovo ThinkPad L13 Gen2-21AB000PGE | |
| Dell Inspiron 13 7306-6TYH5 | |
| Lenovo ThinkPad L13 Yoga Gen2-20VK000VGE | |
| Lenovo ThinkPad L13 Gen2-20VH0017GE | |
| Cinebench R23 / Single Core | |
| Media de la clase Subnotebook (358 - 2213, n=61, últimos 2 años) | |
| Dell Inspiron 13 7306-6TYH5 | |
| HP ProBook x360 435 G8 R7-5800U | |
| HP Pavilion Aero 13 be0097nr | |
| Lenovo ThinkPad X13 G2 AMD 20XH001KGE | |
| Medio AMD Ryzen 5 PRO 5650U (1356 - 1367, n=3) | |
| Lenovo ThinkPad L13 Gen2-20VH0017GE | |
| Lenovo ThinkPad L13 Gen2-21AB000PGE | |
| Lenovo ThinkPad L13 Yoga Gen2-20VK000VGE | |
| Cinebench R20 / CPU (Multi Core) | |
| Media de la clase Subnotebook (579 - 8541, n=57, últimos 2 años) | |
| HP ProBook x360 435 G8 R7-5800U | |
| HP EliteBook 845 G7 Ryzen 7 Pro 4750U | |
| HP Pavilion Aero 13 be0097nr | |
| Lenovo ThinkPad X13 G2 AMD 20XH001KGE | |
| Medio AMD Ryzen 5 PRO 5650U (2415 - 2771, n=3) | |
| Lenovo ThinkPad L13 Gen2-21AB000PGE | |
| Dell Inspiron 13 7306-6TYH5 | |
| Lenovo ThinkPad L13 Yoga Gen2-20VK000VGE | |
| Lenovo ThinkPad L13 Gen2-20VH0017GE | |
| Lenovo ThinkPad L13 Gen2-20VH0017GE | |
| Cinebench R20 / CPU (Single Core) | |
| Media de la clase Subnotebook (128 - 832, n=57, últimos 2 años) | |
| Dell Inspiron 13 7306-6TYH5 | |
| HP ProBook x360 435 G8 R7-5800U | |
| HP Pavilion Aero 13 be0097nr | |
| Lenovo ThinkPad X13 G2 AMD 20XH001KGE | |
| Medio AMD Ryzen 5 PRO 5650U (524 - 533, n=3) | |
| Lenovo ThinkPad L13 Gen2-21AB000PGE | |
| Lenovo ThinkPad L13 Gen2-20VH0017GE | |
| Lenovo ThinkPad L13 Gen2-20VH0017GE | |
| Lenovo ThinkPad L13 Yoga Gen2-20VK000VGE | |
| HP EliteBook 845 G7 Ryzen 7 Pro 4750U | |
| Blender / v2.79 BMW27 CPU | |
| Lenovo ThinkPad L13 Gen2-20VH0017GE | |
| Lenovo ThinkPad L13 Gen2-20VH0017GE | |
| Lenovo ThinkPad L13 Yoga Gen2-20VK000VGE | |
| Dell Inspiron 13 7306-6TYH5 | |
| Lenovo ThinkPad L13 Gen2-21AB000PGE | |
| Medio AMD Ryzen 5 PRO 5650U (422 - 455, n=3) | |
| Lenovo ThinkPad X13 G2 AMD 20XH001KGE | |
| Media de la clase Subnotebook (159 - 2271, n=58, últimos 2 años) | |
| HP EliteBook 845 G7 Ryzen 7 Pro 4750U | |
| HP Pavilion Aero 13 be0097nr | |
| HP ProBook x360 435 G8 R7-5800U | |
| 7-Zip 18.03 / 7z b 4 -mmt1 | |
| Media de la clase Subnotebook (2643 - 6699, n=59, últimos 2 años) | |
| HP Pavilion Aero 13 be0097nr | |
| HP ProBook x360 435 G8 R7-5800U | |
| Dell Inspiron 13 7306-6TYH5 | |
| Lenovo ThinkPad X13 G2 AMD 20XH001KGE | |
| Medio AMD Ryzen 5 PRO 5650U (5021 - 5081, n=3) | |
| Lenovo ThinkPad L13 Gen2-21AB000PGE | |
| Lenovo ThinkPad L13 Gen2-20VH0017GE | |
| Lenovo ThinkPad L13 Gen2-20VH0017GE | |
| Lenovo ThinkPad L13 Yoga Gen2-20VK000VGE | |
| HP EliteBook 845 G7 Ryzen 7 Pro 4750U | |
| Geekbench 5.5 / Multi-Core | |
| Media de la clase Subnotebook (2557 - 17218, n=49, últimos 2 años) | |
| HP EliteBook 845 G7 Ryzen 7 Pro 4750U | |
| HP ProBook x360 435 G8 R7-5800U | |
| Dell Inspiron 13 7306-6TYH5 | |
| Lenovo ThinkPad X13 G2 AMD 20XH001KGE | |
| Medio AMD Ryzen 5 PRO 5650U (5634 - 5788, n=3) | |
| Lenovo ThinkPad L13 Gen2-21AB000PGE | |
| Lenovo ThinkPad L13 Gen2-20VH0017GE | |
| Lenovo ThinkPad L13 Gen2-20VH0017GE | |
| Lenovo ThinkPad L13 Yoga Gen2-20VK000VGE | |
| Geekbench 5.5 / Single-Core | |
| Media de la clase Subnotebook (726 - 2224, n=49, últimos 2 años) | |
| Dell Inspiron 13 7306-6TYH5 | |
| HP ProBook x360 435 G8 R7-5800U | |
| Lenovo ThinkPad L13 Yoga Gen2-20VK000VGE | |
| Lenovo ThinkPad L13 Gen2-20VH0017GE | |
| Lenovo ThinkPad L13 Gen2-20VH0017GE | |
| Medio AMD Ryzen 5 PRO 5650U (1352 - 1384, n=3) | |
| Lenovo ThinkPad X13 G2 AMD 20XH001KGE | |
| Lenovo ThinkPad L13 Gen2-21AB000PGE | |
| HP EliteBook 845 G7 Ryzen 7 Pro 4750U | |
| HWBOT x265 Benchmark v2.2 / 4k Preset | |
| Media de la clase Subnotebook (0.97 - 25.1, n=57, últimos 2 años) | |
| HP ProBook x360 435 G8 R7-5800U | |
| HP Pavilion Aero 13 be0097nr | |
| HP EliteBook 845 G7 Ryzen 7 Pro 4750U | |
| Lenovo ThinkPad X13 G2 AMD 20XH001KGE | |
| Medio AMD Ryzen 5 PRO 5650U (8.36 - 9.27, n=3) | |
| Lenovo ThinkPad L13 Gen2-21AB000PGE | |
| Dell Inspiron 13 7306-6TYH5 | |
| Lenovo ThinkPad L13 Yoga Gen2-20VK000VGE | |
| Lenovo ThinkPad L13 Gen2-20VH0017GE | |
| Lenovo ThinkPad L13 Gen2-20VH0017GE | |
| LibreOffice / 20 Documents To PDF | |
| HP EliteBook 845 G7 Ryzen 7 Pro 4750U | |
| HP ProBook x360 435 G8 R7-5800U | |
| Lenovo ThinkPad L13 Gen2-21AB000PGE | |
| Media de la clase Subnotebook (39.9 - 220, n=56, últimos 2 años) | |
| Lenovo ThinkPad L13 Yoga Gen2-20VK000VGE | |
| HP Pavilion Aero 13 be0097nr | |
| Lenovo ThinkPad X13 G2 AMD 20XH001KGE | |
| Medio AMD Ryzen 5 PRO 5650U (35.3 - 57.6, n=4) | |
| Lenovo ThinkPad L13 Gen2-20VH0017GE | |
| Lenovo ThinkPad L13 Gen2-20VH0017GE | |
| Dell Inspiron 13 7306-6TYH5 | |
| R Benchmark 2.5 / Overall mean | |
| Lenovo ThinkPad L13 Yoga Gen2-20VK000VGE | |
| Lenovo ThinkPad L13 Gen2-20VH0017GE | |
| Lenovo ThinkPad L13 Gen2-20VH0017GE | |
| HP EliteBook 845 G7 Ryzen 7 Pro 4750U | |
| Dell Inspiron 13 7306-6TYH5 | |
| Lenovo ThinkPad L13 Gen2-21AB000PGE | |
| Medio AMD Ryzen 5 PRO 5650U (0.555 - 0.569, n=3) | |
| Lenovo ThinkPad X13 G2 AMD 20XH001KGE | |
| HP ProBook x360 435 G8 R7-5800U | |
| HP Pavilion Aero 13 be0097nr | |
| Media de la clase Subnotebook (0.4024 - 1.456, n=58, últimos 2 años) | |
* ... más pequeño es mejor
AIDA64: FP32 Ray-Trace | FPU Julia | CPU SHA3 | CPU Queen | FPU SinJulia | FPU Mandel | CPU AES | CPU ZLib | FP64 Ray-Trace | CPU PhotoWorxx
| Performance rating | |
| Media de la clase Subnotebook | |
| HP Pavilion Aero 13 be0097nr | |
| HP ProBook x360 435 G8 R7-5800U | |
| Lenovo ThinkPad X13 G2 AMD 20XH001KGE | |
| Medio AMD Ryzen 5 PRO 5650U | |
| Lenovo ThinkPad L13 Gen2-21AB000PGE | |
| Dell Inspiron 13 7306-6TYH5 | |
| Lenovo ThinkPad L13 Gen2-20VH0017GE | |
| Lenovo ThinkPad L13 Yoga Gen2-20VK000VGE | |
| AIDA64 / FP32 Ray-Trace | |
| Media de la clase Subnotebook (1135 - 32888, n=58, últimos 2 años) | |
| HP ProBook x360 435 G8 R7-5800U | |
| HP Pavilion Aero 13 be0097nr | |
| Lenovo ThinkPad X13 G2 AMD 20XH001KGE | |
| Medio AMD Ryzen 5 PRO 5650U (7205 - 8274, n=3) | |
| Lenovo ThinkPad L13 Gen2-21AB000PGE | |
| Lenovo ThinkPad L13 Gen2-20VH0017GE | |
| Lenovo ThinkPad L13 Gen2-20VH0017GE | |
| Dell Inspiron 13 7306-6TYH5 | |
| Lenovo ThinkPad L13 Yoga Gen2-20VK000VGE | |
| AIDA64 / FPU Julia | |
| HP ProBook x360 435 G8 R7-5800U | |
| HP Pavilion Aero 13 be0097nr | |
| Media de la clase Subnotebook (5218 - 123315, n=58, últimos 2 años) | |
| Lenovo ThinkPad X13 G2 AMD 20XH001KGE | |
| Medio AMD Ryzen 5 PRO 5650U (46649 - 53123, n=3) | |
| Lenovo ThinkPad L13 Gen2-21AB000PGE | |
| Dell Inspiron 13 7306-6TYH5 | |
| Lenovo ThinkPad L13 Gen2-20VH0017GE | |
| Lenovo ThinkPad L13 Gen2-20VH0017GE | |
| Lenovo ThinkPad L13 Yoga Gen2-20VK000VGE | |
| AIDA64 / CPU SHA3 | |
| Media de la clase Subnotebook (444 - 5287, n=58, últimos 2 años) | |
| HP ProBook x360 435 G8 R7-5800U | |
| HP Pavilion Aero 13 be0097nr | |
| Dell Inspiron 13 7306-6TYH5 | |
| Lenovo ThinkPad X13 G2 AMD 20XH001KGE | |
| Lenovo ThinkPad L13 Gen2-20VH0017GE | |
| Lenovo ThinkPad L13 Gen2-20VH0017GE | |
| Medio AMD Ryzen 5 PRO 5650U (1553 - 1829, n=3) | |
| Lenovo ThinkPad L13 Yoga Gen2-20VK000VGE | |
| Lenovo ThinkPad L13 Gen2-21AB000PGE | |
| AIDA64 / CPU Queen | |
| HP Pavilion Aero 13 be0097nr | |
| HP ProBook x360 435 G8 R7-5800U | |
| Medio AMD Ryzen 5 PRO 5650U (67818 - 70596, n=3) | |
| Lenovo ThinkPad L13 Gen2-21AB000PGE | |
| Lenovo ThinkPad X13 G2 AMD 20XH001KGE | |
| Media de la clase Subnotebook (10579 - 95002, n=48, últimos 2 años) | |
| Dell Inspiron 13 7306-6TYH5 | |
| Lenovo ThinkPad L13 Yoga Gen2-20VK000VGE | |
| Lenovo ThinkPad L13 Gen2-20VH0017GE | |
| Lenovo ThinkPad L13 Gen2-20VH0017GE | |
| AIDA64 / FPU SinJulia | |
| HP ProBook x360 435 G8 R7-5800U | |
| HP Pavilion Aero 13 be0097nr | |
| Lenovo ThinkPad X13 G2 AMD 20XH001KGE | |
| Medio AMD Ryzen 5 PRO 5650U (7289 - 7931, n=3) | |
| Lenovo ThinkPad L13 Gen2-21AB000PGE | |
| Media de la clase Subnotebook (744 - 18418, n=58, últimos 2 años) | |
| Lenovo ThinkPad L13 Gen2-20VH0017GE | |
| Lenovo ThinkPad L13 Gen2-20VH0017GE | |
| Dell Inspiron 13 7306-6TYH5 | |
| Lenovo ThinkPad L13 Yoga Gen2-20VK000VGE | |
| AIDA64 / FPU Mandel | |
| HP ProBook x360 435 G8 R7-5800U | |
| HP Pavilion Aero 13 be0097nr | |
| Media de la clase Subnotebook (3341 - 65433, n=58, últimos 2 años) | |
| Lenovo ThinkPad X13 G2 AMD 20XH001KGE | |
| Medio AMD Ryzen 5 PRO 5650U (25763 - 29311, n=3) | |
| Lenovo ThinkPad L13 Gen2-21AB000PGE | |
| Dell Inspiron 13 7306-6TYH5 | |
| Lenovo ThinkPad L13 Gen2-20VH0017GE | |
| Lenovo ThinkPad L13 Gen2-20VH0017GE | |
| Lenovo ThinkPad L13 Yoga Gen2-20VK000VGE | |
| AIDA64 / CPU ZLib | |
| Media de la clase Subnotebook (164.9 - 1379, n=58, últimos 2 años) | |
| HP ProBook x360 435 G8 R7-5800U | |
| HP Pavilion Aero 13 be0097nr | |
| Lenovo ThinkPad X13 G2 AMD 20XH001KGE | |
| Medio AMD Ryzen 5 PRO 5650U (414 - 473, n=3) | |
| Lenovo ThinkPad L13 Gen2-21AB000PGE | |
| Dell Inspiron 13 7306-6TYH5 | |
| Lenovo ThinkPad L13 Gen2-20VH0017GE | |
| Lenovo ThinkPad L13 Gen2-20VH0017GE | |
| Lenovo ThinkPad L13 Yoga Gen2-20VK000VGE | |
| AIDA64 / FP64 Ray-Trace | |
| Media de la clase Subnotebook (610 - 17495, n=58, últimos 2 años) | |
| HP ProBook x360 435 G8 R7-5800U | |
| HP Pavilion Aero 13 be0097nr | |
| Lenovo ThinkPad X13 G2 AMD 20XH001KGE | |
| Medio AMD Ryzen 5 PRO 5650U (3893 - 4383, n=3) | |
| Lenovo ThinkPad L13 Gen2-21AB000PGE | |
| Lenovo ThinkPad L13 Gen2-20VH0017GE | |
| Lenovo ThinkPad L13 Gen2-20VH0017GE | |
| Dell Inspiron 13 7306-6TYH5 | |
| Lenovo ThinkPad L13 Yoga Gen2-20VK000VGE | |
| AIDA64 / CPU PhotoWorxx | |
| Media de la clase Subnotebook (6569 - 85600, n=58, últimos 2 años) | |
| Dell Inspiron 13 7306-6TYH5 | |
| Lenovo ThinkPad L13 Gen2-20VH0017GE | |
| Lenovo ThinkPad L13 Gen2-20VH0017GE | |
| Lenovo ThinkPad L13 Yoga Gen2-20VK000VGE | |
| Lenovo ThinkPad X13 G2 AMD 20XH001KGE | |
| Medio AMD Ryzen 5 PRO 5650U (14215 - 17421, n=3) | |
| HP Pavilion Aero 13 be0097nr | |
| Lenovo ThinkPad L13 Gen2-21AB000PGE | |
| HP ProBook x360 435 G8 R7-5800U | |
Rendimiento del sistema
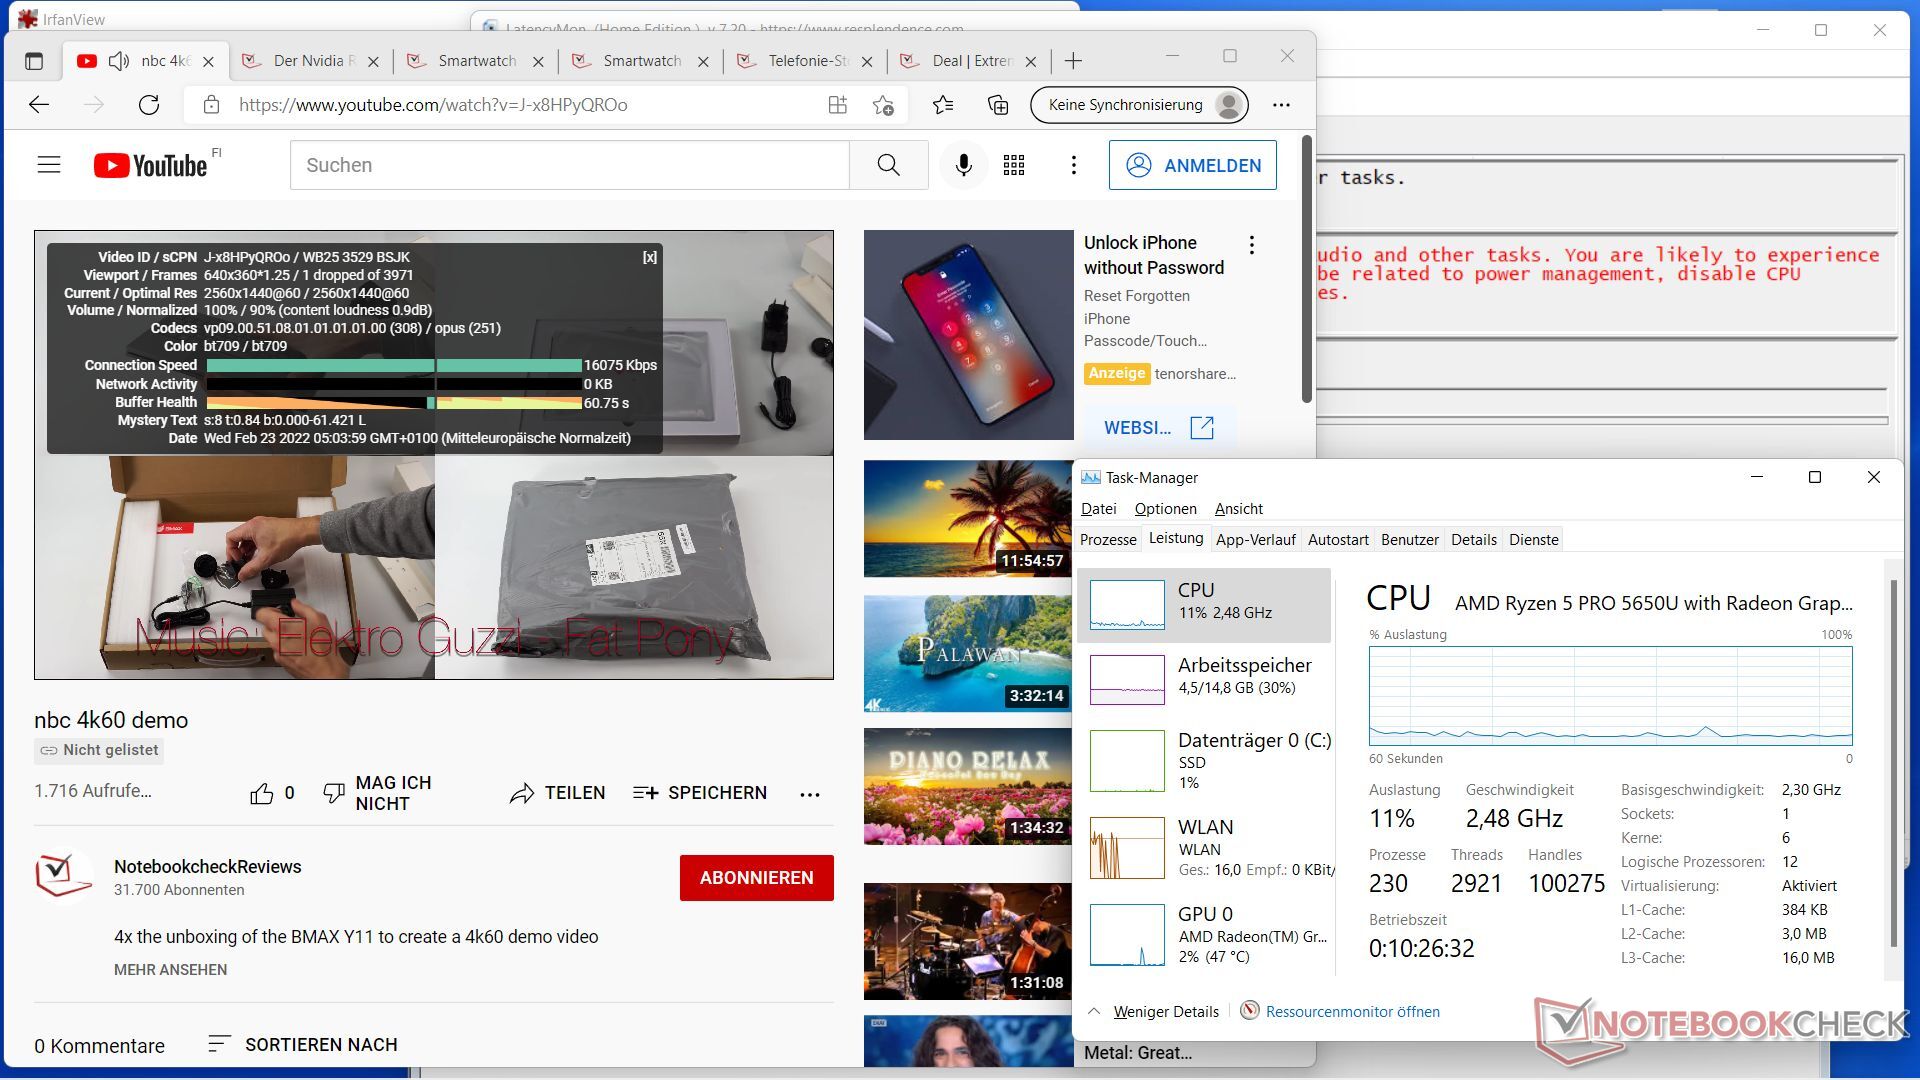
El rendimiento del sistema en el test PCMark así como en el trabajo y la navegación subjetiva, incluso con aplicaciones exigentes en multitarea incluyendo la reproducción de vídeos 4K, está al nivel esperado.
Casi todo se ejecuta sin lags y subjetivamente, incluso las estaciones de trabajo de gama alta actuales no parecieron más rápidas para el probador, pero por el contrario, los sistemas AMD son generalmente un poco más rápidos en términos de interacción con las interfaces de Windows y la navegación. Sin embargo, esta experiencia sigue siendo subjetiva y puede tener fondos especiales como los controladores de la GPU de AMD, que "ópticamente" muestran todo muy suavemente y sin retrasos según la experiencia del probador.
Sólo los portátiles basados en M1 de Apple dentro de macOS resultaron ser ligeramente más rápidos, pero tampoco por mucho. los vídeos 4K causan sólo una carga de la CPU del 6 por ciento, para comparar: A Core i9-10885H en un ThinkPad P1 G3 (sin dGPU), que es aproximadamente un 50 por ciento más rápido, causó una carga de la CPU del 4 por ciento.
| PCMark 10 / Score | |
| Media de la clase Subnotebook (4920 - 9939, n=46, últimos 2 años) | |
| HP Pavilion Aero 13 be0097nr | |
| Lenovo ThinkPad X13 G2 AMD 20XH001KGE | |
| Medio AMD Ryzen 5 PRO 5650U, AMD Radeon RX Vega 7 (5320 - 5720, n=3) | |
| HP ProBook x360 435 G8 R7-5800U | |
| Lenovo ThinkPad L13 Gen2-21AB000PGE | |
| Dell Inspiron 13 7306-6TYH5 | |
| HP EliteBook 845 G7 Ryzen 7 Pro 4750U | |
| Lenovo ThinkPad L13 Gen2-20VH0017GE | |
| Lenovo ThinkPad L13 Yoga Gen2-20VK000VGE | |
| HP Elitebook x360 1040 G5 | |
| PCMark 10 / Essentials | |
| Media de la clase Subnotebook (8552 - 11646, n=46, últimos 2 años) | |
| Lenovo ThinkPad X13 G2 AMD 20XH001KGE | |
| Medio AMD Ryzen 5 PRO 5650U, AMD Radeon RX Vega 7 (9576 - 10750, n=3) | |
| Dell Inspiron 13 7306-6TYH5 | |
| HP Pavilion Aero 13 be0097nr | |
| Lenovo ThinkPad L13 Yoga Gen2-20VK000VGE | |
| Lenovo ThinkPad L13 Gen2-21AB000PGE | |
| HP ProBook x360 435 G8 R7-5800U | |
| Lenovo ThinkPad L13 Gen2-20VH0017GE | |
| HP Elitebook x360 1040 G5 | |
| HP EliteBook 845 G7 Ryzen 7 Pro 4750U | |
| PCMark 10 / Productivity | |
| Media de la clase Subnotebook (5435 - 16606, n=46, últimos 2 años) | |
| HP Pavilion Aero 13 be0097nr | |
| Lenovo ThinkPad X13 G2 AMD 20XH001KGE | |
| Medio AMD Ryzen 5 PRO 5650U, AMD Radeon RX Vega 7 (8729 - 9087, n=3) | |
| Lenovo ThinkPad L13 Gen2-21AB000PGE | |
| HP ProBook x360 435 G8 R7-5800U | |
| HP EliteBook 845 G7 Ryzen 7 Pro 4750U | |
| Dell Inspiron 13 7306-6TYH5 | |
| HP Elitebook x360 1040 G5 | |
| Lenovo ThinkPad L13 Gen2-20VH0017GE | |
| Lenovo ThinkPad L13 Yoga Gen2-20VK000VGE | |
| PCMark 10 / Digital Content Creation | |
| Media de la clase Subnotebook (5722 - 13779, n=46, últimos 2 años) | |
| HP Pavilion Aero 13 be0097nr | |
| Lenovo ThinkPad X13 G2 AMD 20XH001KGE | |
| HP EliteBook 845 G7 Ryzen 7 Pro 4750U | |
| HP ProBook x360 435 G8 R7-5800U | |
| Medio AMD Ryzen 5 PRO 5650U, AMD Radeon RX Vega 7 (4891 - 5495, n=3) | |
| Dell Inspiron 13 7306-6TYH5 | |
| Lenovo ThinkPad L13 Gen2-21AB000PGE | |
| Lenovo ThinkPad L13 Gen2-20VH0017GE | |
| Lenovo ThinkPad L13 Yoga Gen2-20VK000VGE | |
| HP Elitebook x360 1040 G5 | |
| PCMark 10 Score | 5320 puntos | |
ayuda | ||
| AIDA64 / Memory Copy | |
| Media de la clase Subnotebook (14554 - 131023, n=58, últimos 2 años) | |
| Dell Inspiron 13 7306-6TYH5 | |
| HP Pavilion Aero 13 be0097nr | |
| Lenovo ThinkPad L13 Gen2-20VH0017GE | |
| Lenovo ThinkPad L13 Gen2-20VH0017GE | |
| Lenovo ThinkPad L13 Gen2-21AB000PGE | |
| Medio AMD Ryzen 5 PRO 5650U (31262 - 33245, n=3) | |
| Lenovo ThinkPad L13 Yoga Gen2-20VK000VGE | |
| Lenovo ThinkPad X13 G2 AMD 20XH001KGE | |
| HP ProBook x360 435 G8 R7-5800U | |
| AIDA64 / Memory Read | |
| Media de la clase Subnotebook (15948 - 127174, n=58, últimos 2 años) | |
| Dell Inspiron 13 7306-6TYH5 | |
| Lenovo ThinkPad L13 Gen2-20VH0017GE | |
| Lenovo ThinkPad L13 Gen2-20VH0017GE | |
| Lenovo ThinkPad L13 Yoga Gen2-20VK000VGE | |
| HP Pavilion Aero 13 be0097nr | |
| Lenovo ThinkPad L13 Gen2-21AB000PGE | |
| Medio AMD Ryzen 5 PRO 5650U (36338 - 37610, n=3) | |
| Lenovo ThinkPad X13 G2 AMD 20XH001KGE | |
| HP ProBook x360 435 G8 R7-5800U | |
| AIDA64 / Memory Write | |
| Media de la clase Subnotebook (15709 - 135141, n=58, últimos 2 años) | |
| Dell Inspiron 13 7306-6TYH5 | |
| Lenovo ThinkPad L13 Gen2-20VH0017GE | |
| Lenovo ThinkPad L13 Gen2-20VH0017GE | |
| Lenovo ThinkPad L13 Yoga Gen2-20VK000VGE | |
| Lenovo ThinkPad L13 Gen2-21AB000PGE | |
| HP Pavilion Aero 13 be0097nr | |
| Medio AMD Ryzen 5 PRO 5650U (25594 - 32670, n=3) | |
| Lenovo ThinkPad X13 G2 AMD 20XH001KGE | |
| HP ProBook x360 435 G8 R7-5800U | |
| AIDA64 / Memory Latency | |
| Lenovo ThinkPad L13 Gen2-21AB000PGE | |
| Lenovo ThinkPad X13 G2 AMD 20XH001KGE | |
| Medio AMD Ryzen 5 PRO 5650U (100 - 120, n=3) | |
| Media de la clase Subnotebook (6.1 - 159.9, n=56, últimos 2 años) | |
| Dell Inspiron 13 7306-6TYH5 | |
| HP Pavilion Aero 13 be0097nr | |
| HP ProBook x360 435 G8 R7-5800U | |
| Lenovo ThinkPad L13 Gen2-20VH0017GE | |
| Lenovo ThinkPad L13 Gen2-20VH0017GE | |
| Lenovo ThinkPad L13 Yoga Gen2-20VK000VGE | |
* ... más pequeño es mejor
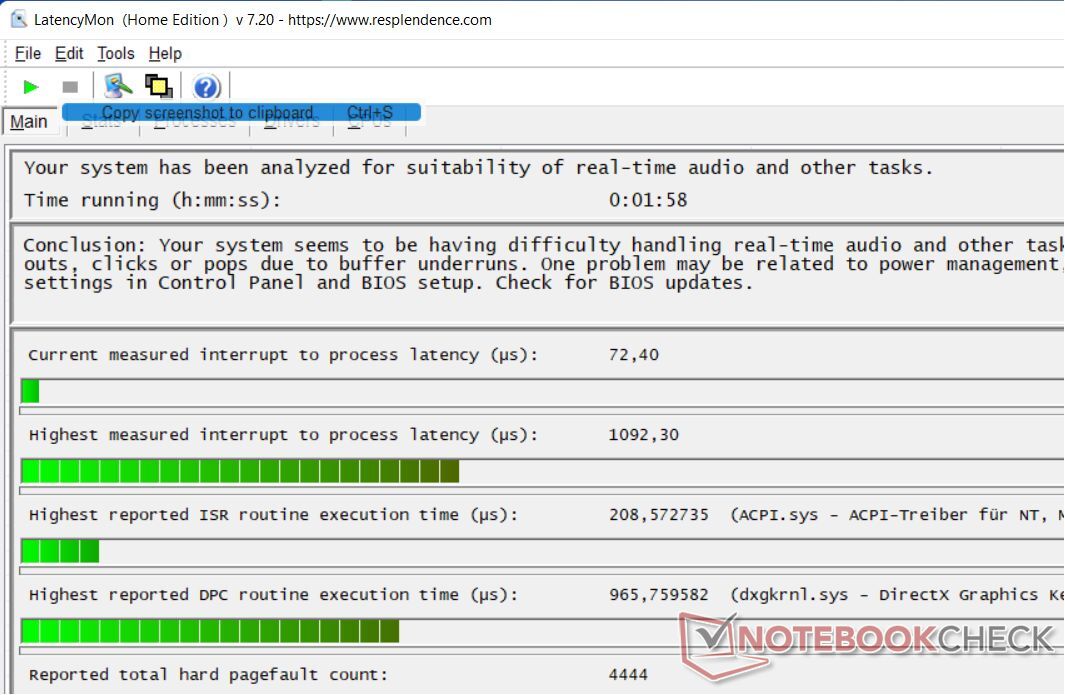
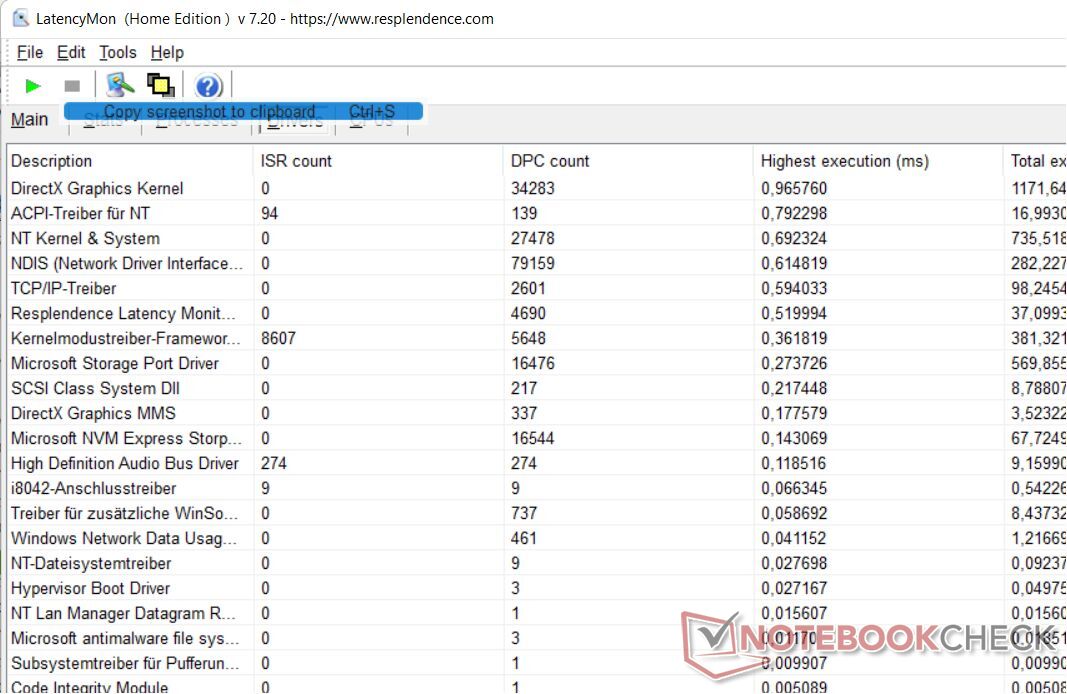
Latencias del CPD
Las latencias del CPD están generalmente en el rango verde a ligeramente amarillo, pero podría haber ligeros retrasos en el vídeo y el audio en tiempo real. Responsable, además de los sospechosos habituales (ACPI, controlador del módulo del kernel), el controlador DirectX así como el controlador de red aparecen aquí. Algunos de los competidores funcionan un poco mejor, otros mucho mejor. Sólo la versión de Intel del L13 Gen2 funciona un poco peor.
| DPC Latencies / LatencyMon - interrupt to process latency (max), Web, Youtube, Prime95 | |
| Lenovo ThinkPad L13 Gen2-20VH0017GE | |
| Lenovo ThinkPad L13 Gen2-21AB000PGE | |
| HP Pavilion Aero 13 be0097nr | |
| Lenovo ThinkPad X13 G2 AMD 20XH001KGE | |
| Dell Inspiron 13 7306-6TYH5 | |
| Lenovo ThinkPad L13 Yoga Gen2-20VK000VGE | |
| HP ProBook x360 435 G8 R7-5800U | |
* ... más pequeño es mejor
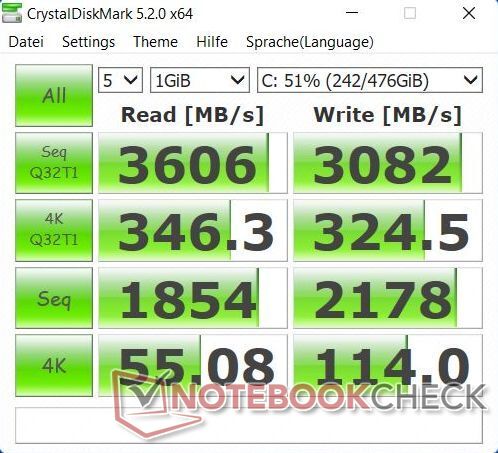
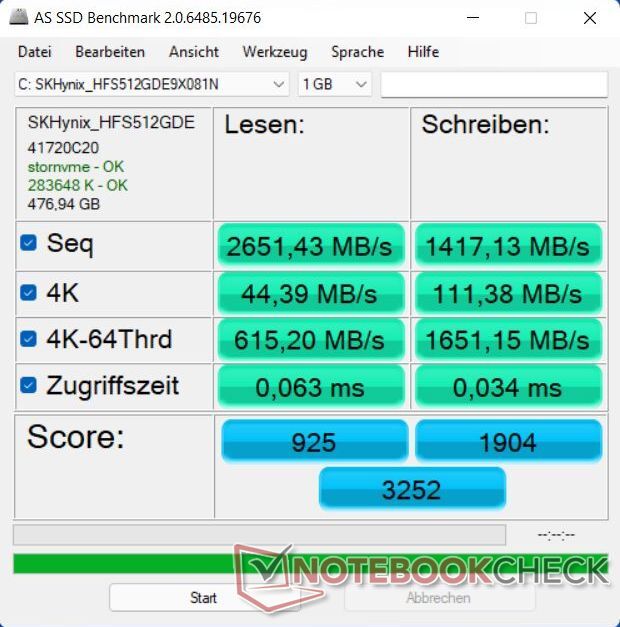
Almacenamiento masivo
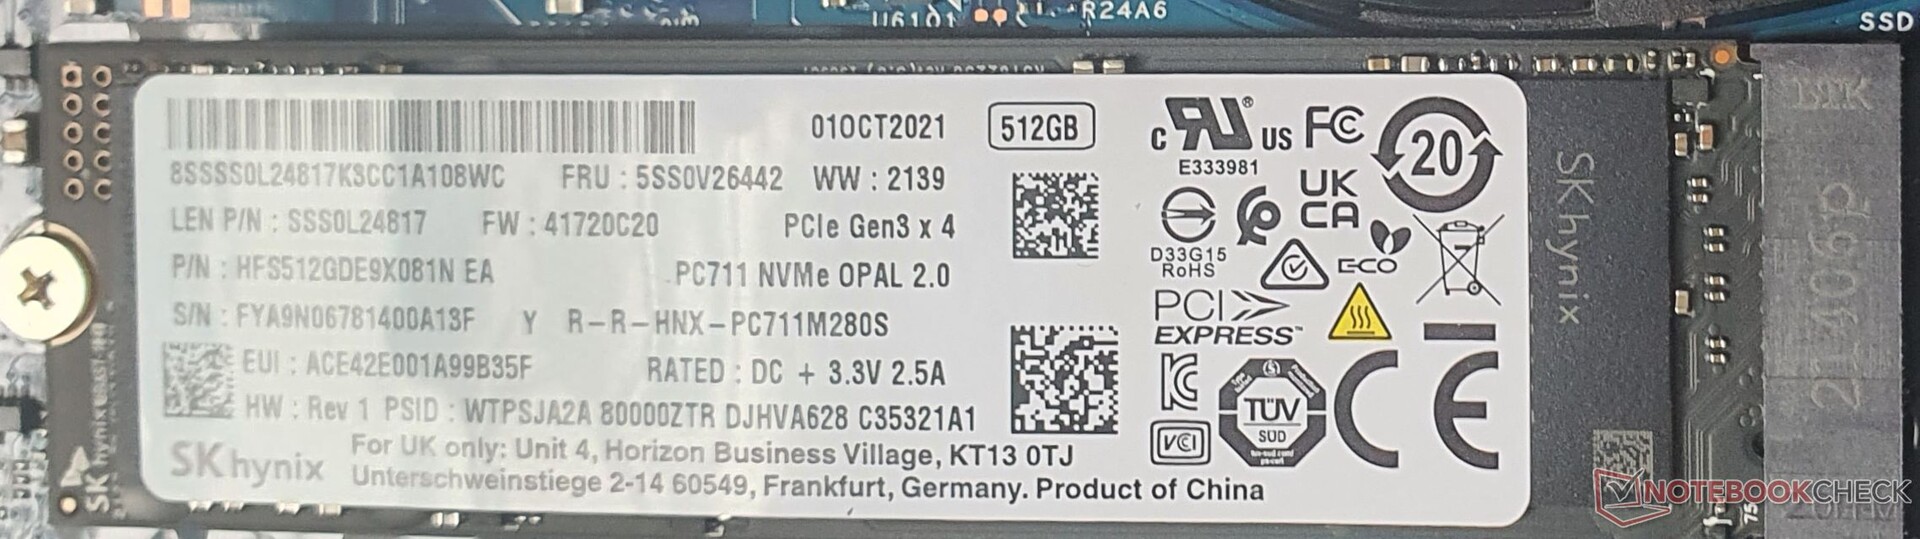
La unidad de sistema de 512 GB de Hynix, que se conecta con PCI-E 3.0 x4, rinde muy bien en las pruebas y sólo es superada por la SSD del ThinkPad X13 G2 batido. Sin embargo, la diferencia pasa desapercibida en la práctica. En cualquier caso, no causa ningún retraso en el sistema, las apps se inician casi inmediatamente y el portátil arranca en poco tiempo.
Se puede encontrar más información y comparaciones de pruebas en nuestra tabla de discos duros y SSD de .
| Lenovo ThinkPad L13 Gen2-21AB000PGE Vega 7, R5 PRO 5650U, SK Hynix HFS512 GDE9X081N | Lenovo ThinkPad L13 Yoga Gen2-20VK000VGE Iris Xe G7 80EUs, i5-1135G7, WDC PC SN730 SDBPNTY-256G | Lenovo ThinkPad X13 G2 AMD 20XH001KGE Vega 7, R5 PRO 5650U, Samsung SSD PM981a MZVLB512HBJQ | HP ProBook x360 435 G8 R7-5800U Vega 8, R7 5800U, Samsung PM991 MZVLQ512HALU | HP Pavilion Aero 13 be0097nr Vega 8, R7 5800U, Intel SSD 660p SSDPEKNW512G8 | Dell Inspiron 13 7306-6TYH5 Iris Xe G7 96EUs, i7-1165G7, Toshiba KBG40ZNS512G NVMe | |
|---|---|---|---|---|---|---|
| CrystalDiskMark 5.2 / 6 | -5% | -27% | -15% | -14% | ||
| Write 4K (MB/s) | 114 | 119.7 5% | 86.7 -24% | 128.3 13% | 127 11% | |
| Read 4K (MB/s) | 55.1 | 38.54 -30% | 32.45 -41% | 50.9 -8% | 52.7 -4% | |
| Write Seq (MB/s) | 2179 | 1754 -20% | 1235 -43% | 971 -55% | ||
| Read Seq (MB/s) | 1854 | 1709 -8% | 1417 -24% | 1540 -17% | ||
| Write 4K Q32T1 (MB/s) | 324.5 | 461.9 42% | 390.8 20% | 538 66% | 312.1 -4% | |
| Read 4K Q32T1 (MB/s) | 346.3 | 390.5 13% | 291 -16% | 344.4 -1% | 445.2 29% | |
| Write Seq Q32T1 (MB/s) | 3082 | 2185 -29% | 1384 -55% | 980 -68% | 683 -78% | |
| Read Seq Q32T1 (MB/s) | 3607 | 3118 -14% | 2350 -35% | 1829 -49% | 2327 -35% | |
| Write 4K Q8T8 (MB/s) | 341.8 | |||||
| Read 4K Q8T8 (MB/s) | 658 | |||||
| AS SSD | 2% | 11% | -38% | -49% | -128% | |
| Copy Game MB/s (MB/s) | 1144 | 1360 19% | 326.7 -71% | 539 -53% | 842 -26% | |
| Copy Program MB/s (MB/s) | 444.9 | 565 27% | 132.1 -70% | 614 38% | 343 -23% | |
| Copy ISO MB/s (MB/s) | 2101 | 1855 -12% | 708 -66% | 906 -57% | 11031 425% | |
| Score Total (Points) | 3252 | 2384 -27% | 3902 20% | 1892 -42% | 1798 -45% | 2477 -24% |
| Score Write (Points) | 1904 | 941 -51% | 2086 10% | 589 -69% | 1018 -47% | 527 -72% |
| Score Read (Points) | 925 | 961 4% | 1244 34% | 879 -5% | 533 -42% | 1322 43% |
| Access Time Write * (ms) | 0.034 | 0.025 26% | 0.034 -0% | 0.038 -12% | 0.135 -297% | 0.718 -2012% |
| Access Time Read * (ms) | 0.063 | 0.051 19% | 0.075 -19% | 0.104 -65% | 0.074 -17% | 0.085 -35% |
| 4K-64 Write (MB/s) | 1651 | 571 -65% | 1829 11% | 365.8 -78% | 815 -51% | 335.2 -80% |
| 4K-64 Read (MB/s) | 615 | 681 11% | 903 47% | 645 5% | 324.6 -47% | 1078 75% |
| 4K Write (MB/s) | 111.4 | 169.6 52% | 110.6 -1% | 99.5 -11% | 126.6 14% | 106.7 -4% |
| 4K Read (MB/s) | 44.39 | 41.18 -7% | 47.96 8% | 40.35 -9% | 46.87 6% | 47.53 7% |
| Seq Write (MB/s) | 1417 | 2000 41% | 1457 3% | 1237 -13% | 761 -46% | 850 -40% |
| Seq Read (MB/s) | 2651 | 2387 -10% | 2936 11% | 1936 -27% | 1616 -39% | 1967 -26% |
| Media total (Programa/Opciones) | -2% /
-1% | 11% /
11% | -33% /
-34% | -32% /
-36% | -71% /
-94% |
* ... más pequeño es mejor

* ... más pequeño es mejor
Tarjeta gráfica
El modelo de AMD Vega-7iGPU se compara de forma interesante con la GPU Intel Xe-G7 (80 EUs) casi a la par. En general, el ThinkPad ofrece el rendimiento esperado para un dispositivo con RAM de doble canal. Por suerte, el rendimiento no se reduce en modo batería.
| 3DMark 11 Performance | 4927 puntos | |
| 3DMark Cloud Gate Standard Score | 17289 puntos | |
| 3DMark Fire Strike Score | 2863 puntos | |
| 3DMark Time Spy Score | 1048 puntos | |
ayuda | ||
Rendimiento de los juegos
Nuestra prueba estandarizada Witcher 3 muestra que el Vega 7 Graphics computa un 15% más lento que la media de esta iGPU dependiendo de los ajustes. Los dispositivos del campo de pruebas también rinden mucho mejor aquí, con la gráfica Vega 8 del HP Pavilion Aero 13 computando un 50% más rápido. Con todo, el modelo hermano con Gráficos Intel Xe7 (80 EUs) calcula casi tan rápido como nuestro modelo de pruebas con la APU de AMD. Sin embargo, AMD consume mucha menos energía, por lo que puedes jugar más tiempo en modo batería.
Se puede observar que el reloj del núcleo de 1800 MHz no se alcanza del todo, sino que es de 1500 MHz, mientras que la CPU se sincroniza inicialmente con 3,6 GHz y rápidamente se ralentiza a 1,4 GHz constantes. En general, algunos juegos de hace unos años pueden jugarse bien y sin problemas en el dispositivo de trabajo con ajustes bajos o medios.
| bajo | medio | alto | ultra | |
|---|---|---|---|---|
| The Witcher 3 (2015) | 49.4 | 31 | 13.6 | 10.2 |
| Dota 2 Reborn (2015) | 101 | 75.3 | 44.3 | 41.8 |
| X-Plane 11.11 (2018) | 39.7 | 29 | 26 | |
| Far Cry 5 (2018) | 35 | 15 | 14 | |
| Strange Brigade (2018) | 69.2 | 26.4 | 22 | 19 |
Emisiones - La APU de AMD ayuda a mantener el dispositivo fresco
Emisiones acústicas
Sin carga, el ventilador está completamente apagado o se comporta en silencio. La navegación web ligera y ver YouTube en calidad hasta 4K tampoco pone en marcha el ventilador.
Sin embargo, cuando empiezas a hacer multitarea o a navegar por la web muy rápido (abriendo varias páginas en intervalos de 1 segundo o haciendo clic constantemente en enlaces, por ejemplo), el ventilador se vuelve bastante audible y se comporta así de forma más molesta que algunos dispositivos de la clase business premium de 14 pulgadas. Aunque no se considera demasiado molesto, muchos dispositivos de la comparación también tienen mejores curvas de ventilador aquí.
Sin embargo, puedes evitarlo fácilmente desenchufando el cable de alimentación o cambiando manualmente al modo de ahorro de energía. La herramienta "ThinkPad Fan Control" también puede ayudar. Sin embargo, el resultado de la prueba tiene naturalmente en cuenta la configuración de fábrica del fabricante.
Ruido
| Ocioso |
| 25 / 25 / 27.8 dB(A) |
| Carga |
| 44.1 / 44.3 dB(A) |
 | ||
30 dB silencioso 40 dB(A) audible 50 dB(A) ruidosamente alto |
||
min: | ||
| Lenovo ThinkPad L13 Gen2-21AB000PGE Vega 7, R5 PRO 5650U, SK Hynix HFS512 GDE9X081N | Lenovo ThinkPad L13 Gen2-20VH0017GE Iris Xe G7 80EUs, i5-1135G7, Samsung SSD PM981a MZVLB512HBJQ | Dell Inspiron 13 7306-6TYH5 Iris Xe G7 96EUs, i7-1165G7, Toshiba KBG40ZNS512G NVMe | Lenovo ThinkPad X13 G2 AMD 20XH001KGE Vega 7, R5 PRO 5650U, Samsung SSD PM981a MZVLB512HBJQ | HP Pavilion Aero 13 be0097nr Vega 8, R7 5800U, Intel SSD 660p SSDPEKNW512G8 | |
|---|---|---|---|---|---|
| Noise | -3% | 6% | 14% | 12% | |
| apagado / medio ambiente * (dB) | 25 | 29.3 -17% | 25 -0% | 24.17 3% | 23.9 4% |
| Idle Minimum * (dB) | 25 | 29.3 -17% | 25 -0% | 24.17 3% | 23.9 4% |
| Idle Average * (dB) | 25 | 29.3 -17% | 25 -0% | 24.17 3% | 23.9 4% |
| Idle Maximum * (dB) | 27.8 | 29.3 -5% | 25 10% | 24.17 13% | 23.9 14% |
| Load Average * (dB) | 44.1 | 34.3 22% | 35.7 19% | 29.92 32% | 32.2 27% |
| Load Maximum * (dB) | 44.3 | 36.3 18% | 41.8 6% | 31.52 29% | 34.8 21% |
| Witcher 3 ultra * (dB) | 34.7 |
* ... más pequeño es mejor
Temperatura
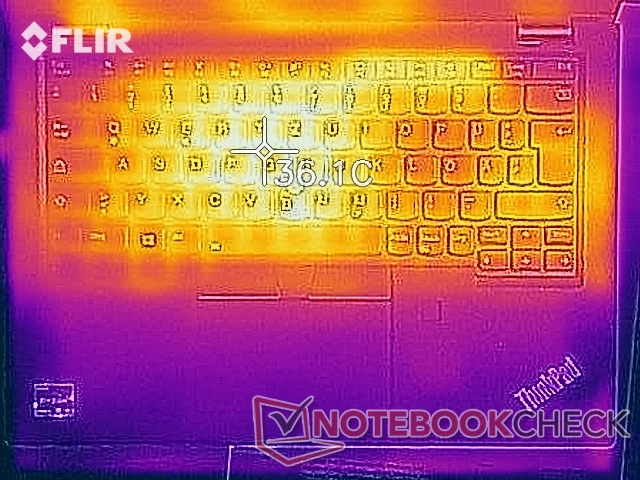
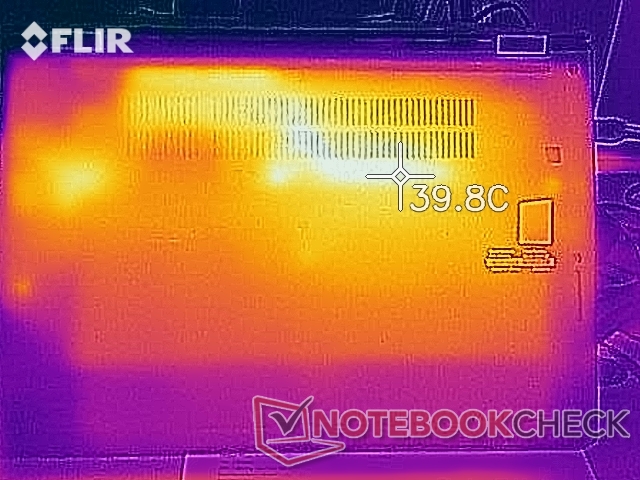
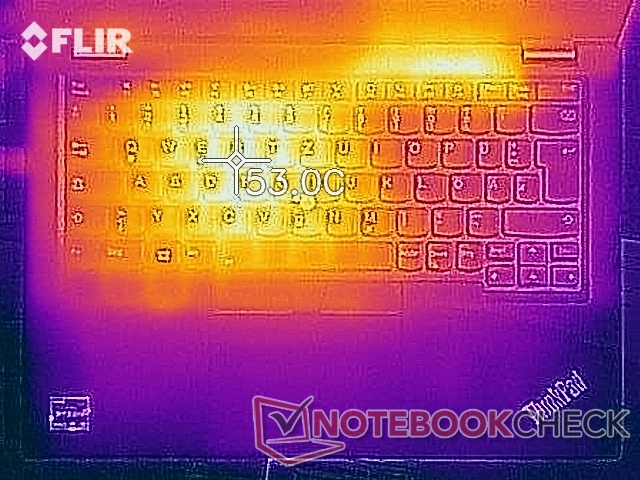
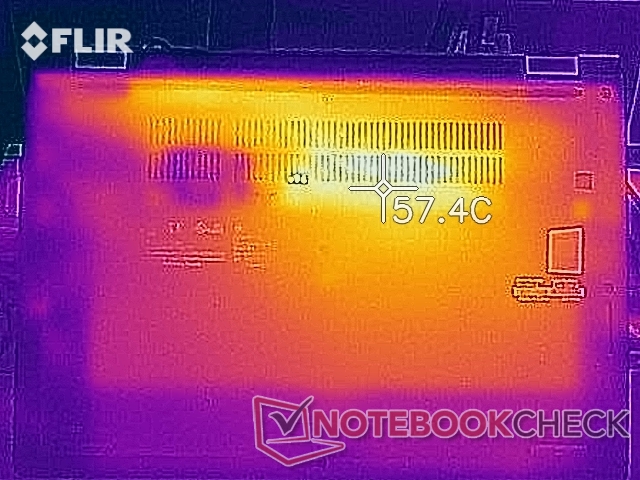
El calentamiento general del dispositivo es muy moderado. Se puede sentir un ligero y casi agradable calentamiento en el área central superior del teclado. El resto del portátil permaneció completamente frío, excepto por el área de la entrada de ventilación en la parte inferior así como la salida de ventilación en la parte posterior del dispositivo. Sin embargo, tampoco se calentó demasiado aquí, ya que el rendimiento está regulado de antemano.
(±) La temperatura máxima en la parte superior es de 42.7 °C / 109 F, frente a la media de 35.9 °C / 97 F, que oscila entre 21.4 y 59 °C para la clase Subnotebook.
(±) El fondo se calienta hasta un máximo de 44.9 °C / 113 F, frente a la media de 39.2 °C / 103 F
(+) En reposo, la temperatura media de la parte superior es de 28 °C / 82# F, frente a la media del dispositivo de 30.8 °C / 87 F.
(+) El reposamanos y el panel táctil están a una temperatura inferior a la de la piel, con un máximo de 27.1 °C / 80.8 F y, por tanto, son fríos al tacto.
(±) La temperatura media de la zona del reposamanos de dispositivos similares fue de 28.2 °C / 82.8 F (+1.1 °C / 2 F).
| Lenovo ThinkPad L13 Gen2-21AB000PGE AMD Ryzen 5 PRO 5650U, AMD Radeon RX Vega 7 | Lenovo ThinkPad L13 Yoga Gen2-20VK000VGE Intel Core i5-1135G7, Intel Iris Xe Graphics G7 80EUs | Lenovo ThinkPad L13 Gen2-20VH0017GE Intel Core i5-1135G7, Intel Iris Xe Graphics G7 80EUs | HP ProBook x360 435 G8 R7-5800U AMD Ryzen 7 5800U, AMD Radeon RX Vega 8 (Ryzen 4000/5000) | Dell Inspiron 13 7306-6TYH5 Intel Core i7-1165G7, Intel Iris Xe Graphics G7 96EUs | Lenovo ThinkPad X13 G2 AMD 20XH001KGE AMD Ryzen 5 PRO 5650U, AMD Radeon RX Vega 7 | HP Pavilion Aero 13 be0097nr AMD Ryzen 7 5800U, AMD Radeon RX Vega 8 (Ryzen 4000/5000) | |
|---|---|---|---|---|---|---|---|
| Heat | 1% | 2% | 11% | 9% | 14% | 14% | |
| Maximum Upper Side * (°C) | 42.7 | 43.3 -1% | 43.3 -1% | 43.8 -3% | 39 9% | 43.7 -2% | 35.6 17% |
| Maximum Bottom * (°C) | 44.9 | 54.5 -21% | 58 -29% | 47.4 -6% | 42.9 4% | 38 15% | 38.6 14% |
| Idle Upper Side * (°C) | 32.6 | 26.6 18% | 25.6 21% | 24.6 25% | 29.8 9% | 25.8 21% | 29.6 9% |
| Idle Bottom * (°C) | 33.9 | 30.7 9% | 28.8 15% | 25.2 26% | 29.4 13% | 26.2 23% | 29 14% |
* ... más pequeño es mejor
Prueba de esfuerzo
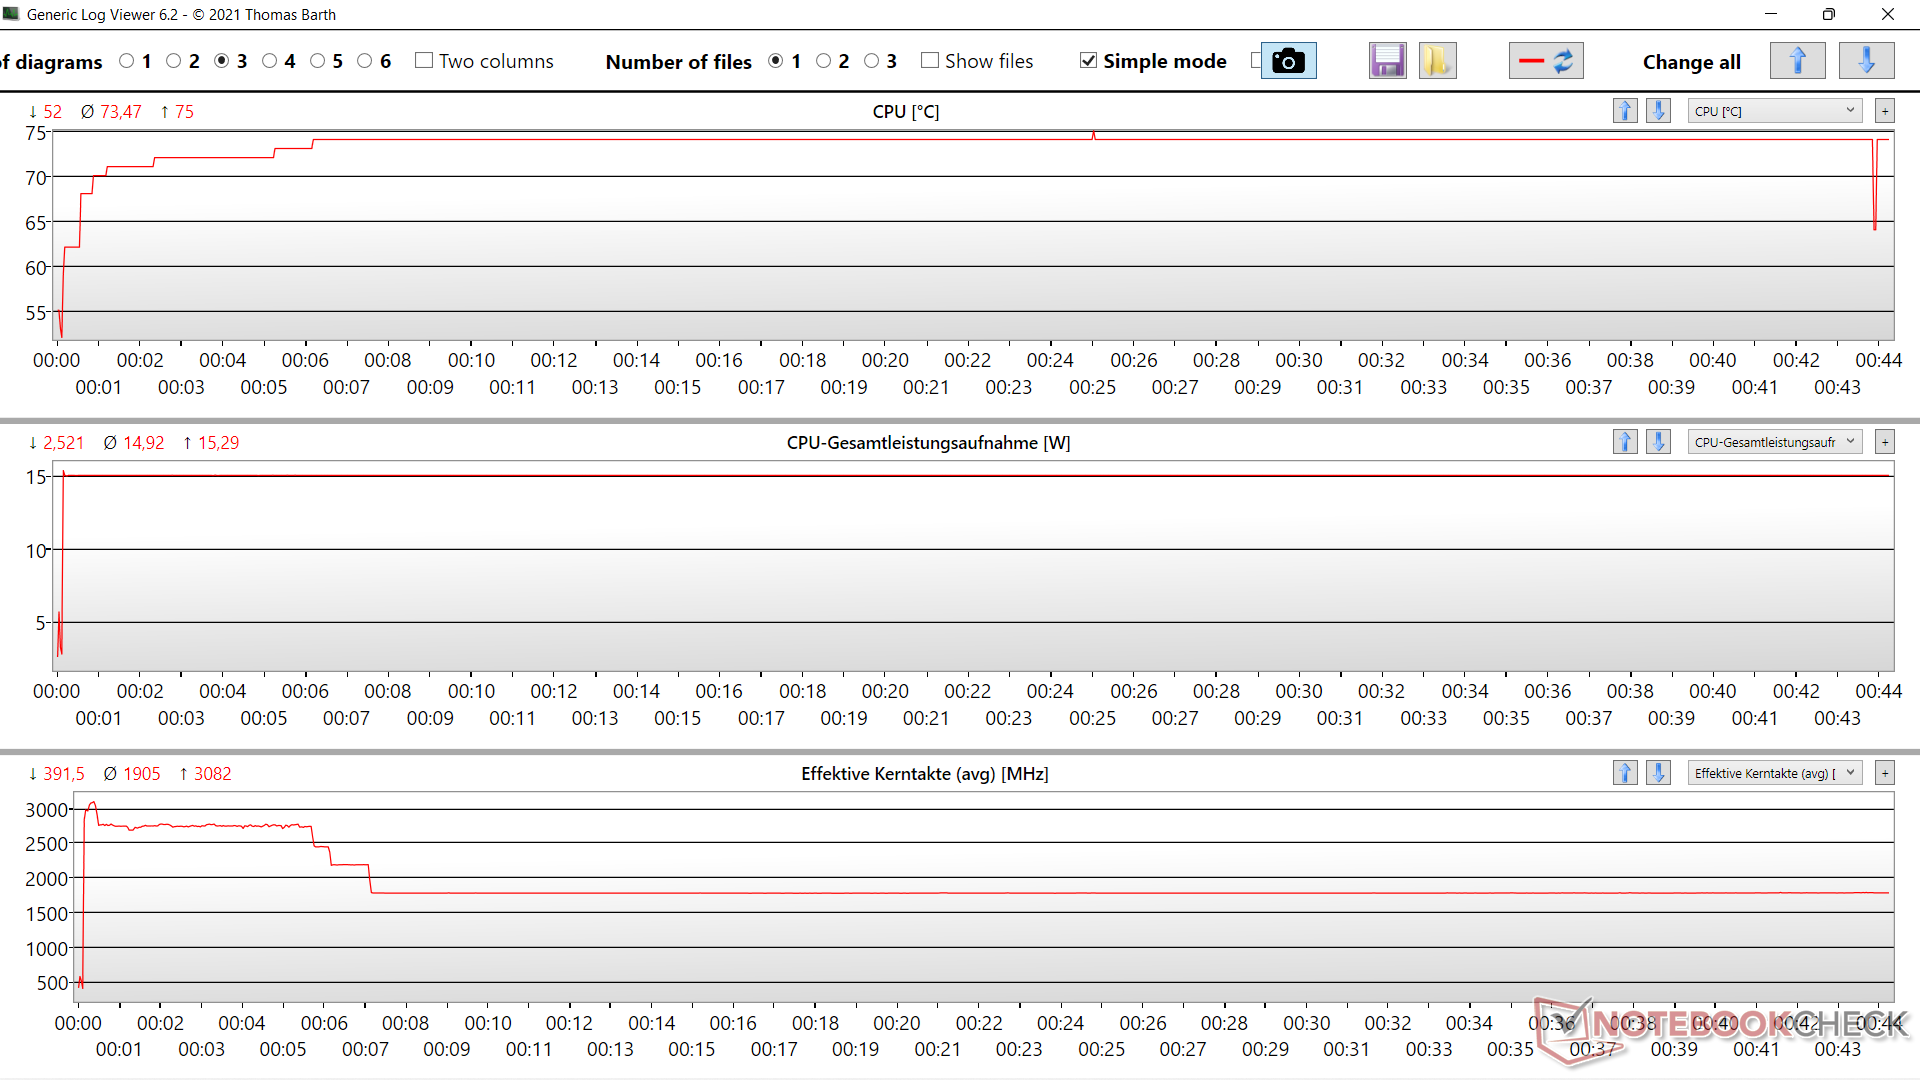
Bajo carga combinada (Prime95 + FurMark), el procesador AMD consume unos 23 vatios al principio y se estabiliza rápidamente en 15 vatios. El reloj de la CPU es de 3,7 GHz durante unos segundos, baja a 2,75 GHz y se mantiene ahí durante unos 12 minutos hasta que se ralentiza sucesivamente hasta los 1,8 GHz finales. Esto es ligeramente inferior al reloj base de 2,3 GHz, pero en los escenarios cotidianos no notamos ninguna caída del reloj por debajo del reloj base, que es de 2,75 GHz permanentes bajo carga pura de la CPU. Son buenos resultados. Tras unos 82 °C iniciales, la temperatura del núcleo se estabiliza en 74 °C. La iGPU Vega funciona a 900 MHz durante 7 minutos bajo carga combinada y luego de forma estable a 550 MHz, permaneciendo muy fría a 67 °C. La iGPU por sí sola consume entre 14 y 15 vatios en la prueba de estrés.
Aún hay margen de mejora en ambos casos, tanto en términos de reloj como de temperatura - pero Lenovo parece haber priorizado el funcionamiento silencioso sobre el rendimiento máximo en su ultrabook empresarial: Esto también se refleja en el comportamiento del ventilador, que es relativamente ruidoso en el test de estrés, pero en absoluto molesto. El ventilador gira a unas 5650 RPM (análogo a la designación de la CPU ;) ).
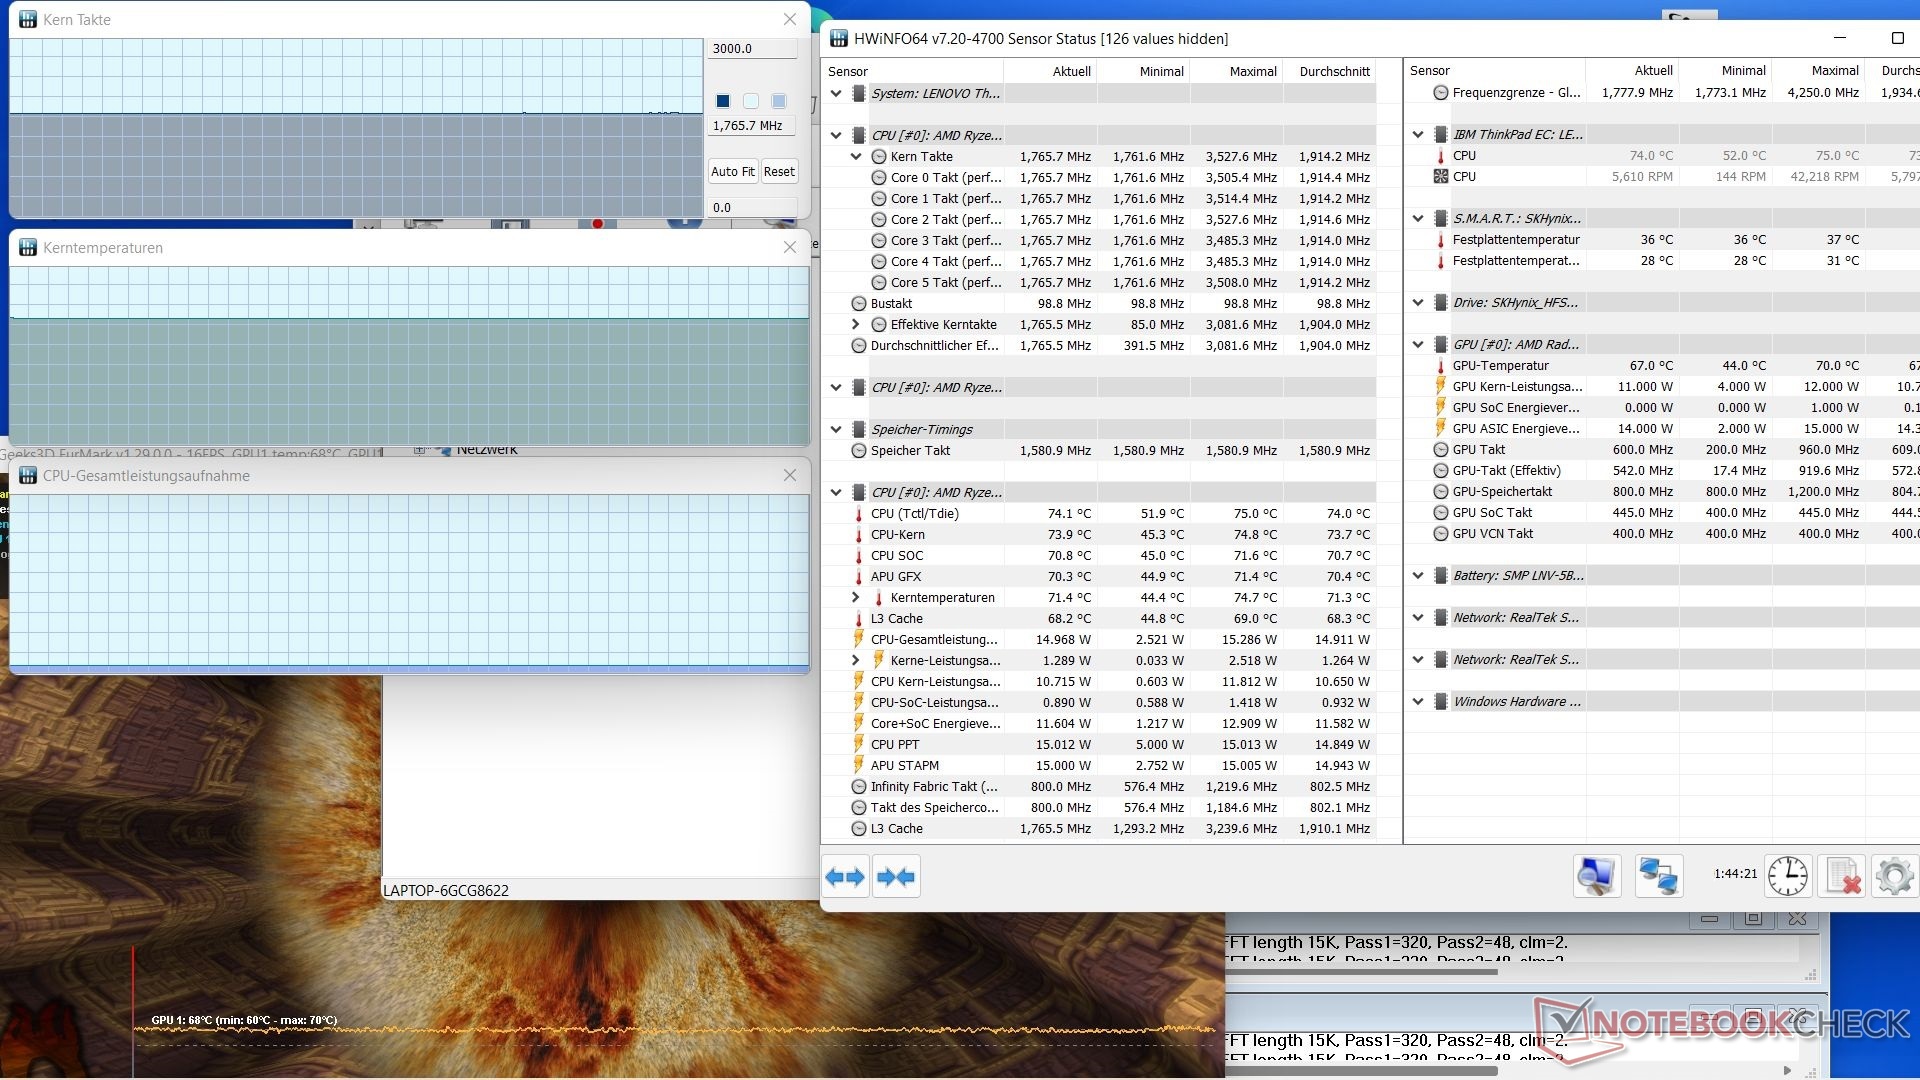
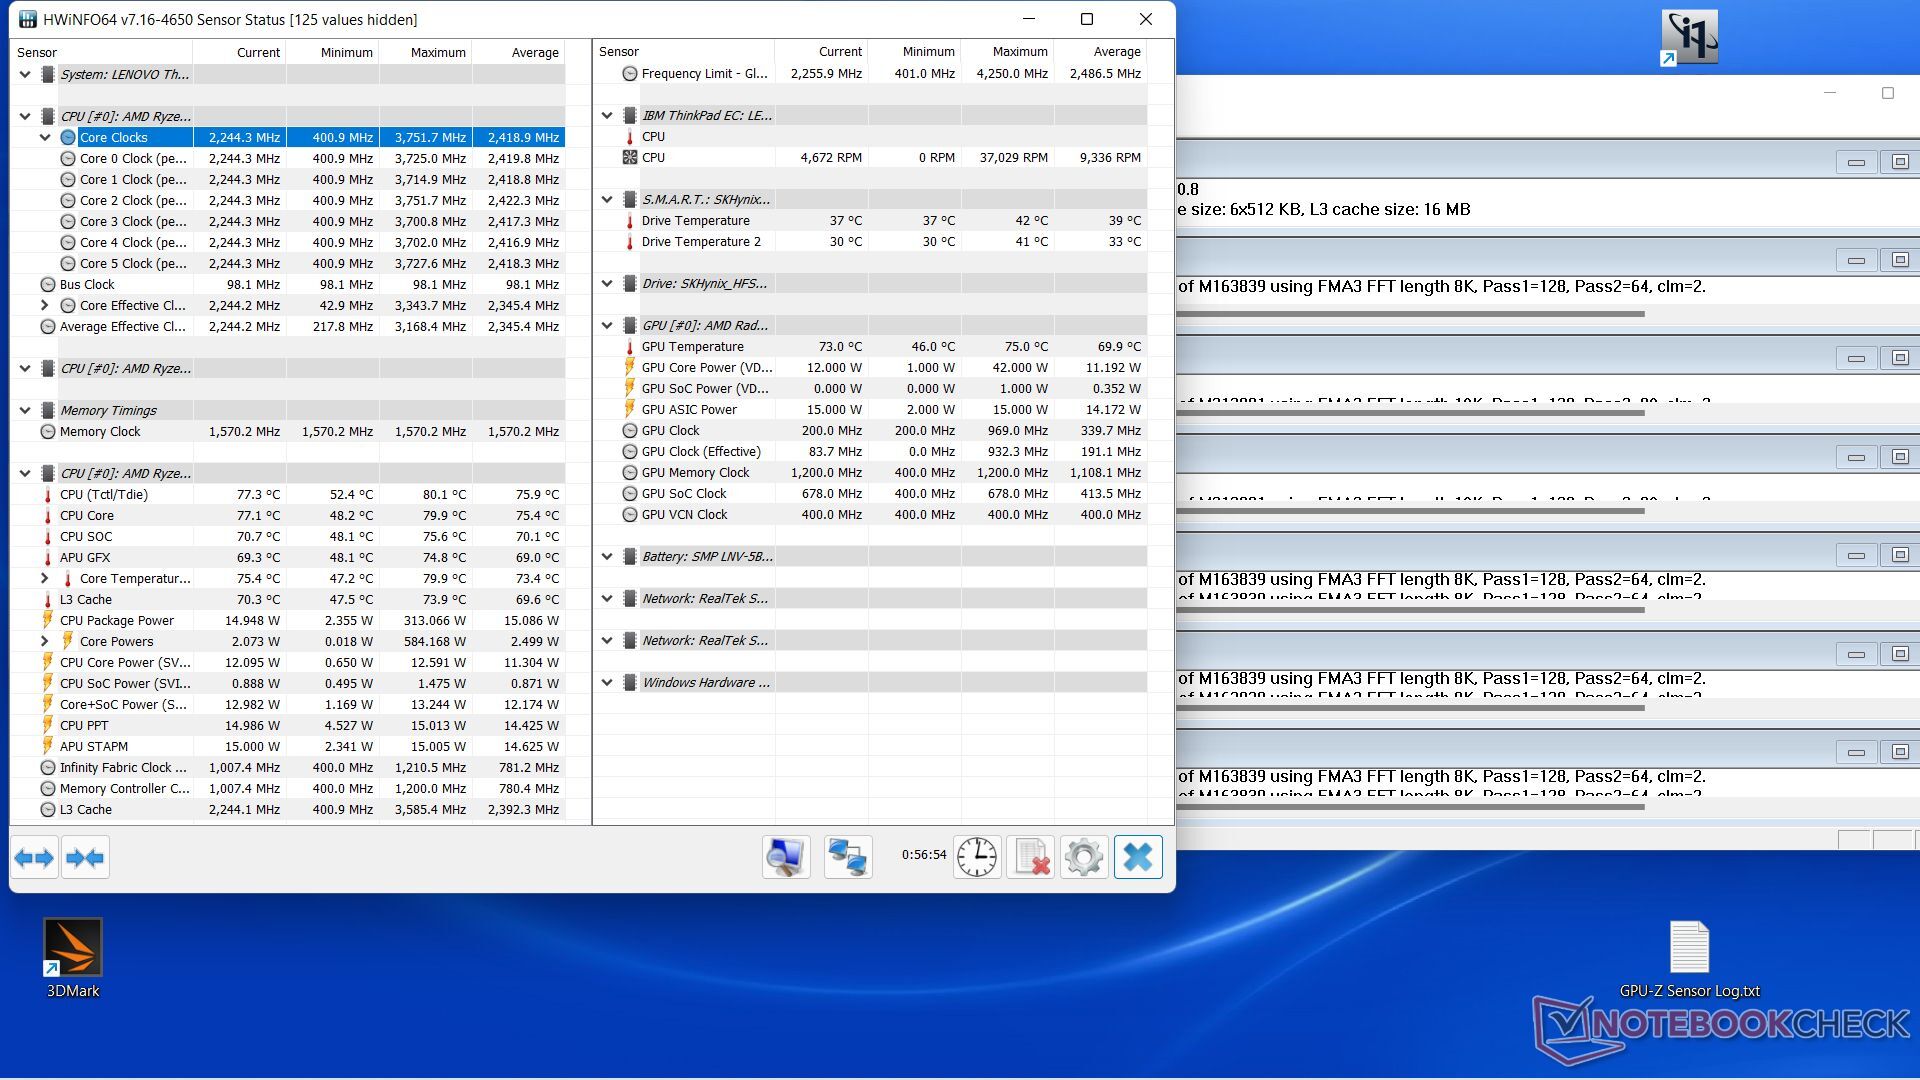
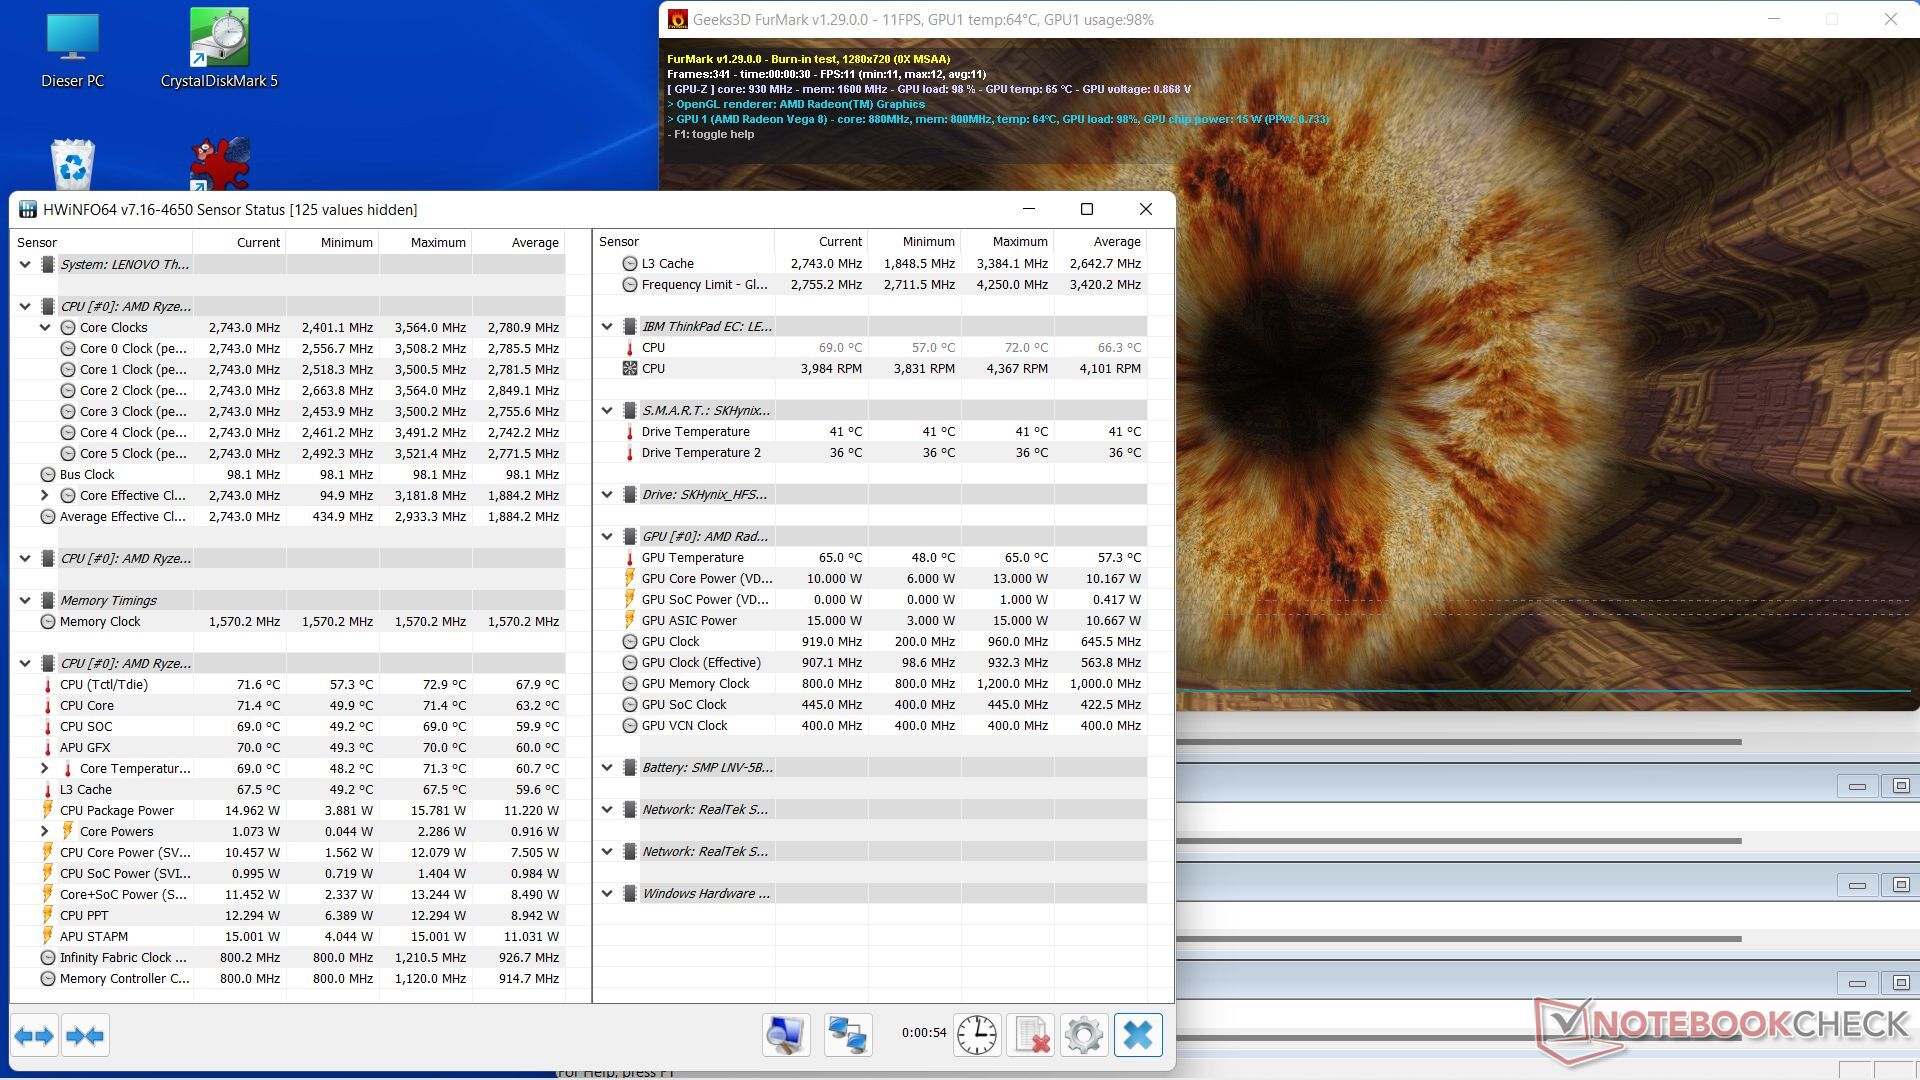
| Reloj de la CPU (GHz) | Reloj de la GPU (MHz) | Temperatura media dela CPU (°C) | Temperatura media de la GPU (°C) | |
| Sistema en reposo | 2,3 GHz | 200 MHz | 43 °C | 40 °C |
| Prime95 Stress | 2,25 GHz | 200 MHz | 75 °C | 73 °C |
| Prime95+ FurMarkStress | 1,8 GHz | 550 MHz | 74 °C | 70 °C |
| Witcher 3 Stress | 1,4 GHz | 1,5 GHz | 70 °C | 64 °C |
Altavoz
Los altavoces son más bien básicos y no ofrecen graves. Sin embargo, los agudos y los medios se reproducen con claridad. El volumen en sí es bastante alto, incluso para películas y música de todo tipo. Los dispositivos rivales de Dell y HP rinden mejor aquí, y el propio ThinkPad X13 Gen2 también ofrece una calidad de sonido mucho mejor. En caso de duda, recomendamos usar auriculares u otro sistema de audio externo.
Lenovo ThinkPad L13 Gen2-21AB000PGE análisis de audio
(+) | los altavoces pueden reproducir a un volumen relativamente alto (#82.4 dB)
Graves 100 - 315 Hz
(-) | casi sin bajos - de media 25.6% inferior a la mediana
(±) | la linealidad de los graves es media (13.8% delta a frecuencia anterior)
Medios 400 - 2000 Hz
(+) | medios equilibrados - a sólo 3.3% de la mediana
(+) | los medios son lineales (4.6% delta a la frecuencia anterior)
Altos 2 - 16 kHz
(+) | máximos equilibrados - a sólo 4.1% de la mediana
(+) | los máximos son lineales (6.5% delta a la frecuencia anterior)
Total 100 - 16.000 Hz
(±) | la linealidad del sonido global es media (19% de diferencia con la mediana)
En comparación con la misma clase
» 58% de todos los dispositivos probados de esta clase eran mejores, 6% similares, 36% peores
» El mejor tuvo un delta de 5%, la media fue 18%, el peor fue ###max##%
En comparación con todos los dispositivos probados
» 45% de todos los dispositivos probados eran mejores, 7% similares, 48% peores
» El mejor tuvo un delta de 4%, la media fue 23%, el peor fue ###max##%
Lenovo ThinkPad L13 Gen2-20VH0017GE análisis de audio
(±) | la sonoridad del altavoz es media pero buena (77.6 dB)
Graves 100 - 315 Hz
(-) | casi sin bajos - de media 19.5% inferior a la mediana
(-) | los graves no son lineales (15% delta a la frecuencia anterior)
Medios 400 - 2000 Hz
(+) | medios equilibrados - a sólo 4.6% de la mediana
(+) | los medios son lineales (3.4% delta a la frecuencia anterior)
Altos 2 - 16 kHz
(±) | máximos reducidos - de media 6.7% inferior a la mediana
(±) | la linealidad de los máximos es media (10.7% delta a frecuencia anterior)
Total 100 - 16.000 Hz
(±) | la linealidad del sonido global es media (25.6% de diferencia con la mediana)
En comparación con la misma clase
» 78% de todos los dispositivos probados de esta clase eran mejores, 6% similares, 16% peores
» El mejor tuvo un delta de 7%, la media fue 21%, el peor fue ###max##%
En comparación con todos los dispositivos probados
» 79% de todos los dispositivos probados eran mejores, 4% similares, 17% peores
» El mejor tuvo un delta de 4%, la media fue 23%, el peor fue ###max##%
Gestión de la energía: Ryzen garantiza el doble de duración de la batería
Consumo de energía
La APU consume entre 8 y 9.5 vatios en reposo, y un máximo de 33 vatios a plena carga, con la CPU y la iGPU consumiendo algo menos de 15 vatios cada una. La fuente de alimentación de 65 vatios es, por tanto, más que suficiente, por lo que incluso las soluciones de alimentación USB-C más pequeñas son suficientes
| Off / Standby | |
| Ocioso | |
| Carga |
|
Clave:
min: | |
| Lenovo ThinkPad L13 Gen2-21AB000PGE R5 PRO 5650U, Vega 7, SK Hynix HFS512 GDE9X081N, IPS, 1920x1080, 13.3" | Lenovo ThinkPad L13 Gen2-20VH0017GE i5-1135G7, Iris Xe G7 80EUs, Samsung SSD PM981a MZVLB512HBJQ, IPS, 1920x1080, 13.3" | Lenovo ThinkPad L13 Yoga Gen2-20VK000VGE i5-1135G7, Iris Xe G7 80EUs, WDC PC SN730 SDBPNTY-256G, IPS, 1920x1080, 13.3" | HP ProBook x360 435 G8 R7-5800U R7 5800U, Vega 8, Samsung PM991 MZVLQ512HALU, IPS, 1920x1080, 13.3" | HP Pavilion Aero 13 be0097nr R7 5800U, Vega 8, Intel SSD 660p SSDPEKNW512G8, IPS, 1920x1200, 13.3" | Medio AMD Radeon RX Vega 7 | Media de la clase Subnotebook | |
|---|---|---|---|---|---|---|---|
| Power Consumption | -17% | -19% | 4% | -3% | -16% | -16% | |
| Idle Minimum * (Watt) | 4.4 | 4.4 -0% | 4.6 -5% | 3.2 27% | 3.4 23% | 4.79 ? -9% | 3.71 ? 16% |
| Idle Average * (Watt) | 7.6 | 7.2 5% | 7.3 4% | 5.5 28% | 6.9 9% | 7.72 ? -2% | 6.54 ? 14% |
| Idle Maximum * (Watt) | 9.5 | 9.8 -3% | 10.2 -7% | 6.4 33% | 8 16% | 9.12 ? 4% | 7.89 ? 17% |
| Load Average * (Watt) | 33 | 31.7 4% | 32.3 2% | 35.5 -8% | 42.6 -29% | 38.4 ? -16% | 42.1 ? -28% |
| Witcher 3 ultra * (Watt) | 33.4 33.3 | 33.3 -0% | 35 -5% | 36.4 -9% | 35.2 -5% | ||
| Load Maximum * (Watt) | 32.5 | 66.6 -105% | 65.3 -101% | 47.5 -46% | 43.1 -33% | 51.7 ? -59% | 65.1 ? -100% |
* ... más pequeño es mejor
Power consumption - The Witcher 3 / Stress test
Power consumption with external monitor
Duración de la batería
En nuestra prueba estandarizada de WLAN, el ThinkPad L13 logra una duración de 11:02 h a 150 cd/m², que es casi el doble de las 6:04 h del modelo Intel. Sigue siendo de 9:14 h a brillo máximo. En la prueba de vídeo con el cortometraje Big Buck Bunny, duró 15:38 horas. La tabla muestra más o menos las mismas duraciones de batería para todos los rivales con procesadores AMD, por lo que en general podemos atestiguar que los ultrabooks basados en Intel tienen una duración significativamente peor. El L13 se queda sin batería tras 1:40 h a plena carga
| Lenovo ThinkPad L13 Gen2-21AB000PGE R5 PRO 5650U, Vega 7, 46 Wh | Lenovo ThinkPad L13 Gen2-20VH0017GE i5-1135G7, Iris Xe G7 80EUs, 46 Wh | HP ProBook x360 435 G8 R7-5800U R7 5800U, Vega 8, 45 Wh | Dell Inspiron 13 7306-6TYH5 i7-1165G7, Iris Xe G7 96EUs, 60 Wh | Lenovo ThinkPad X13 G2 AMD 20XH001KGE R5 PRO 5650U, Vega 7, 54.7 Wh | HP Pavilion Aero 13 be0097nr R7 5800U, Vega 8, 43 Wh | Media de la clase Subnotebook | |
|---|---|---|---|---|---|---|---|
| Duración de Batería | -36% | -28% | -13% | -15% | -1% | 28% | |
| Reader / Idle (h) | 17.2 | 13.8 -20% | 18.9 10% | 28.6 ? 66% | |||
| H.264 (h) | 15.6 | 7.6 -51% | 10.3 -34% | 13.6 -13% | 15.3 ? -2% | ||
| WiFi v1.3 (h) | 11 | 6.1 -45% | 9.5 -14% | 6.9 -37% | 9.3 -15% | 9 -18% | 14.1 ? 28% |
| Load (h) | 1.7 | 1.5 -12% | 1.1 -35% | 2 18% | 1.4 -18% | 1.8 6% | 1.998 ? 18% |
Pro
Contra
Veredicto: ThinkPad empresarial duradero con la potencia de AMD

Nuestro modelo de prueba de Campuspoint lo hace de bien a muy bien en la mayoría de las pruebas: Es robusto con una muy buena calidad de construcción, los dispositivos de entrada están en la liga más alta, especialmente el teclado, la pantalla es adecuada, aunque un poco más de brillo sería una ventaja. Gracias a la CPU HexaCore de AMD, el rendimiento es prácticamente el doble en comparación con el modelo de Intel, incluso con la energía de la batería, y la duración de la batería también se duplica. El dispositivo también se mantiene más fresco y funciona de forma silenciosa, ya que la CPU se conforma con 15 vatios. La iGPU Vega 7 integrada también es suficientemente rápida para esta clase de portátil. El único defecto que trae el AMD Cezanne es la falta de Thunderbolt. Otros puntos negativos son la RAM soldada, la fuerte susceptibilidad a las huellas dactilares y que la pantalla no llega a los 300 nits. Los altavoces y la webcam están por debajo de lo esperado, pero son tolerables para un dispositivo de negocios. Un ultrabook premium como el ThinkPad X1 Carbon simplemente no es el objetivo aquí.
El ThinkPad L13 G2 AMD ofrece un alto rendimiento con una duración de batería igualmente alta, combinada con un teclado excepcional y un diseño duradero.
El dispositivo empresarial es perfecto para cualquiera que busque un compañero de trabajo móvil y fiable, ya sea para la investigación en la web o para un uso de oficina y de mecanografía en la universidad o en el trabajo. En definitiva, podemos recomendar la versión AMD del ThinkPad L13 G2 sobre la variante Intel. Para los que quieran usar el ThinkPad con dispositivos de entrada y salida externos también como estación de trabajo doméstica, recomendamos la versión OctaCore aún más rápida con AMD Ryzen 7 5850U. Las alternativas en el mismo segmento de precios son elHP ProBook x360 435 G8 AMDy el HP Pavilion Aero 13 y en el sector de los convertibles el Dell Inspiron 13 7306 2n1 con pantalla 4K y la variante Yoga del dispositivo de prueba, el Lenovo ThinkPad L13 Yoga Gen2.
Precio y disponibilidad
Nuestra configuración del ThinkPad L13 Gen2 con 512 GB SSD y 16 GB de memoria de trabajo está actualmente disponible en Campuspoint por 999 euros(~$1106) o en Cyberport por unos 1,019 Euros(~$1128). El modelo especial Campus ya parte de unos 949 Euros (~$1051). También puedes hacerte con el modelo OctaCore por sólo 40 euros más.
Lenovo ThinkPad L13 Gen2-21AB000PGE
- 02/25/2022 v7 (old)
Marvin Gollor
Price comparison
