Análisis para el Intel Core i7-1185G7 procesador
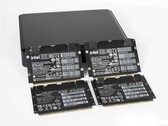
Análisis del elemento de chasis Intel NUC Pro: un barebone modular para muchos propósitos
El elemento del chasis de la NUC pro es principalmente una carcasa vacía y sólo cobra vida con un elemento de computación. Hemos echado un vistazo más de cerca al dispositivo y hemos analizado el rendimiento de cuatro elementos de computación diferentes. Estos se basan en los últimos procesadores Alder Lake-U de Intel en su última versión.
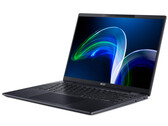
Intel Core i7-1185G7, Iris Xe G7 96EUsAnálisis del Acer TravelMate P6 TMP614P-52: Un portátil de oficina ligero con una gran duración de la batería
El TravelMate ofrece un procesador Core i7 (Tiger Lake), 16 GB de RAM y una excelente duración de la batería. Acer ha tomado una gran decisión al utilizar una pantalla de 14 pulgadas con una relación de aspecto 16:10 (1.920 x 1.200 píxeles) que facilita el trabajo y ofrece una garantía de tres años para el dispositivo en Alemania (dos años en Estados Unidos).
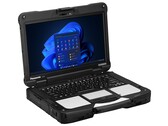
Intel Core i7-1185G7, Iris Xe G7 96EUs, 14", 1.2 kgAnálisis del portátil Panasonic Toughbook 40: Muy adaptable y modular
El modelo puede admitir hasta cuatro tarjetas de expansión individuales para satisfacer las diversas demandas de los agentes de policía, las empresas de servicios públicos y otras condiciones de trabajo del sector público. Panasonic apuesta por la versatilidad para distinguir mejor la serie Toughbook de otras.
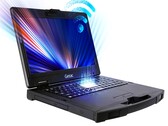
Intel Core i7-1185G7, Iris Xe G7 96EUs, 14", 3.9 kgAnálisis del portátil Getac S410 Gen 4: Cambios sencillos con grandes mejoras
La serie Tiger Lake-U de Intel ha hecho maravillas en los portátiles de consumo, por lo que es estupendo ver por fin las mismas opciones disponibles en modelos robustos diseñados para uso empresarial o industrial.
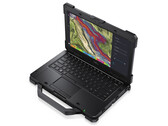
Intel Core i7-1185G7, Iris Xe G7 96EUs, 14", 3.2 kgAnálisis del Dell Latitude 7330 Rugged Extreme: Uno de los mejores portátiles robustos de 13 pulgadas
Puede ser pesado, pero todo se ha hecho tan bien que el peso se puede pasar por alto. La pantalla en sí es mejor que en la mayoría de los otros portátiles robustos en términos de colores, contraste y brillo.
Intel Core i7-1185G7, Iris Xe G7 96EUs, 13.3", 2.7 kgMicrosoft Surface Pro 8, i7-1185G7: Intel Iris Xe Graphics G7 96EUs, 13.00", 0.9 kg
análise » Análisis del Microsoft Surface Pro 8 Convertible: Potente, 120 Hz y por fin Thunderbolt
Dell Latitude 15 9520 2-in-1: Intel Iris Xe Graphics G7 96EUs, 15.00", 1.7 kg
análise » Dell Latitude 15 9520 2-en-1 vs. Latitude 9510 2-en-1: Lo nuevo no siempre es mejor
Panasonic Toughbook FZ-55 MK2: Intel Iris Xe Graphics G7 96EUs, 14.00", 2.3 kg
análise » Revisión del portátil robusto Panasonic Toughbook FZ-55 MK2: Iris Xe marca la diferencia
HP EliteBook 840 Aero G8 3E4Q6AA: Intel Iris Xe Graphics G7 96EUs, 14.00", 1.2 kg
análise » Análisis del HP EliteBook 840 Aero G8: Posiblemente el portátil Intel EVO más silencioso que hemos visto nunca
MSI Summit E14 A11SCS: NVIDIA GeForce GTX 1650 Ti Max-Q, 14.00", 1.3 kg
análise » Análisis del portátil MSI Summit E14: gráficos GeForce GTX sin el peso de GeForce GTX
Dell Latitude 9420 2-in-1: Intel Iris Xe Graphics G7 96EUs, 14.00", 1.5 kg
análise » Análisis del convertible 2 en 1 Dell Latitude 9420: Totalmente mejor que el Latitude 9410
HP Elite Dragonfly Max: Intel Iris Xe Graphics G7 96EUs, 13.30", 1.2 kg
análise » Análisis del HP EliteBook Dragonfly Max Convertible: Sure View suena mejor de lo que parece
Lenovo ThinkPad P14s Gen2-20VX000GGE: NVIDIA T500 Laptop GPU, 14.00", 1.5 kg
análise » Análisis del portátil Lenovo ThinkPad P14s Gen 2: Estación de trabajo compacta con nueva tarjeta gráfica
Dell XPS 13 9310 OLED: Intel Iris Xe Graphics G7 96EUs, 13.40", 1.2 kg
análise » Análisis del portátil Dell XPS 13 9310 OLED: ¿Es mejor que el IPS?
Microsoft Surface Laptop 4 13 i7: Intel Iris Xe Graphics G7 96EUs, 13.50", 1.3 kg
análise » Análisis del Microsoft Surface Laptop 4 13 - ¿Demasiado caro con CPU Intel?
MSI Summit E13 Flip Evo A11MT: Intel Iris Xe Graphics G7 96EUs, 13.40", 1.4 kg
análise » Análisis del MSI Summit E13 Flip Evo Convertible: Un diseño atemporal
MSI Stealth 15M A11SEK: NVIDIA GeForce RTX 2060 Max-Q, 15.60", 1.7 kg
análise » Análisis del portátil MSI Stealth 15M GeForce RTX: Gráficos más rápidos que el Dell XPS 15, el HP Spectre x360 o el Asus ZenBook
Lenovo Yoga 9 14 ITL 4K: Intel Iris Xe Graphics G7 96EUs, 14.00", 1.5 kg
análise » Análisis del portátil Lenovo Yoga 9i 14 4K: El 2 en 1 de 14 pulgadas de alto rendimiento ahora también con pantalla táctil 4K y Intel Core i7-1185G7
MSI Summit E15 A11SCST: NVIDIA GeForce GTX 1650 Ti Max-Q, 15.60", 1.8 kg
análise » Análisis del portátil MSI Summit E15: Avanza en el segmento empresarial premium
MSI Prestige 14 Evo A11M-005: Intel Iris Xe Graphics G7 96EUs, 14.00", 1.2 kg
análise » Revisión del portátil MSI Prestige 14 Evo: Intel se está poniendo al día
Dell XPS 13 9310 Core i7 4K: Intel Iris Xe Graphics G7 96EUs, 13.40", 1.3 kg
análise » Core i7-1165G7 vs. Core i7-1185G7: Revisión del portátil Dell XPS 13 9310 4K
Intel Reference Design Laptop 28W: Intel Iris Xe Graphics G7 96EUs, 14.00"
análise » Review del Intel Core i7-1185G7 - Primeros puntos de referencia de Tiger Lake
Panasonic Toughbook 40: Intel Iris Xe Graphics G7 96EUs, 14.00", 3.9 kg
análise externo » Panasonic Toughbook 40
Acer TravelMate P6 TMP614P-52-724G: Intel Iris Xe Graphics G7 96EUs, 14.00", 1.2 kg
análise externo » Acer TravelMate P6 TMP614P-52-724G
Dell Latitude 7330 Rugged Extreme: Intel Iris Xe Graphics G7 96EUs, 13.30", 2.7 kg
análise externo » Dell Latitude 7330 Rugged Extreme
Dell Latitude 14 5430 Rugged, i7-1185G7: Intel Iris Xe Graphics G7 96EUs, 14.00", 2 kg
análise externo » Dell Latitude 14 5430 Rugged, i7-1185G7
Dell Latitude 15 9520 2-in-1: Intel Iris Xe Graphics G7 96EUs, 15.00", 1.7 kg
análise externo » Dell Latitude 15 9520 2-in-1
Dell Latitude 15 5520, i7-1185G7: Intel Iris Xe Graphics G7 96EUs, 15.60", 1.6 kg
análise externo » Dell Latitude 15 5520, i7-1185G7
Dell XPS 13 9310 Core i7 4K: Intel Iris Xe Graphics G7 96EUs, 13.40", 1.3 kg
análise externo » Dell XPS 13 9310 Core i7 4K
Microsoft Surface Pro 8, i7-1185G7: Intel Iris Xe Graphics G7 96EUs, 13.00", 0.9 kg
análise externo » Microsoft Surface Pro 8, i7-1185G7
Dell Latitude 15 9520-NMM8M: Intel Iris Xe Graphics G7 96EUs, 15.60", 1.4 kg
análise externo » Dell Latitude 15 9520-NMM8M
Panasonic Toughbook FZ-55 MK2: Intel Iris Xe Graphics G7 96EUs, 14.00", 2.3 kg
análise externo » Panasonic Toughbook FZ-55 MK2
MSI Summit E14 A11SCST-069NE: NVIDIA GeForce GTX 1650 Ti Mobile, 14.00", 1.3 kg
análise externo » MSI Summit E14 A11SCST-069NE
Dell Latitude 13 7320 2-in-1, i7-1185G7: Intel Iris Xe Graphics G7 96EUs, 13.30", 1.1 kg
análise externo » Dell Latitude 13 7320 2-in-1, i7-1185G7
MSI Summit E14 A11SCS: NVIDIA GeForce GTX 1650 Ti Max-Q, 14.00", 1.3 kg
análise externo » MSI Summit E14 A11SCS
Fujitsu LifeBook U9311X i7 LTE: Intel Iris Xe Graphics G7 96EUs, 13.30", 1 kg
análise externo » Fujitsu LifeBook U9311X i7 LTE
HP ZBook Firefly 14 G8, i7-1185G7: NVIDIA T500 Laptop GPU, 14.00", 1.4 kg
análise externo » HP ZBook Firefly 14 G8, i7-1185G7
Microsoft Surface Laptop 4 15, i7-1185G7: Intel Iris Xe Graphics G7 96EUs, 15.00", 1.5 kg
análise externo » Microsoft Surface Laptop 4 15, i7-1185G7
Dell Latitude 9420 2-in-1: Intel Iris Xe Graphics G7 96EUs, 14.00", 1.5 kg
análise externo » Dell Latitude 9420 2-in-1
MSI Prestige 14 A11SCS-036DC: NVIDIA GeForce GTX 1650 Ti Max-Q, 14.00", 1.3 kg
análise externo » MSI Prestige 14 A11SCS-036DC
Lenovo ThinkPad X1 Yoga G6-20XY002VUS: Intel Iris Xe Graphics G7 96EUs, 14.00", 1.4 kg
análise externo » Lenovo ThinkPad X1 Yoga G6-20XY002VUS
HP EliteBook 840 Aero G8 3E4Q6AA: Intel Iris Xe Graphics G7 96EUs, 14.00", 1.2 kg
análise externo » HP EliteBook 840 G8 3E4Q6AA
MSI Summit E15 A11SCS-091AU: NVIDIA GeForce GTX 1650 Ti Max-Q, 15.60", 1.7 kg
análise externo » MSI Summit E15 A11SCS-091AU
Asus ExpertBook B9 B9400CEA-KC0266R: Intel Iris Xe Graphics G7 96EUs, 14.00", 1 kg
análise externo » Asus ExpertBook B9 B9400CEA-KC0266R
Lenovo ThinkPad X1 Carbon G9 FHD, i7-1185G7: Intel Iris Xe Graphics G7 96EUs, 15.60", 1.1 kg
análise externo » Lenovo ThinkPad X1 Carbon G9 FHD, i7-1185G7
MSI Prestige 14 Evo A11M-266RU: Intel Iris Xe Graphics G7 96EUs, 14.00", 1.3 kg
análise externo » MSI Prestige 14 Evo A11M-266RU
MSI Stealth 15M A11SEK-055XES: NVIDIA GeForce RTX 2060 Mobile, 15.60", 1.7 kg
análise externo » MSI Stealth 15M A11SEK-055XES
HP ZBook Firefly 15 G8-313P1EA: NVIDIA T500 Laptop GPU, 15.60", 1.8 kg
análise externo » HP ZBook Firefly 15 G8-313P1EA
Dell Latitude 14 7420, i7-1185G7: Intel Iris Xe Graphics G7 96EUs, 14.00", 1.2 kg
análise externo » Dell Latitude 14 7420, i7-1185G7
Dell XPS 13 9310 OLED: Intel Iris Xe Graphics G7 96EUs, 13.40", 1.2 kg
análise externo » Dell XPS 13 9310 OLED
MSI Summit E13 Flip Evo A11MT: Intel Iris Xe Graphics G7 96EUs, 13.40", 1.4 kg
análise externo » MSI Summit E13 Flip Evo A11MT
Dell Latitude 13 7320, i7-1185G7: Intel Iris Xe Graphics G7 96EUs, 13.30", 1.3 kg
análise externo » Dell Latitude 13 7320, i7-1185G7
Lenovo ThinkPad P14s Gen2-20VX000GGE: NVIDIA T500 Laptop GPU, 14.00", 1.5 kg
análise externo » Lenovo ThinkPad P14s Gen2-20VX000GGE
HP Elite Dragonfly Max: Intel Iris Xe Graphics G7 96EUs, 13.30", 1.2 kg
análise externo » HP Elite Dragonfly Max
Microsoft Surface Laptop 4 13 i7: Intel Iris Xe Graphics G7 96EUs, 13.50", 1.3 kg
análise externo » Microsoft Surface Laptop 4 13 i7
MSI Prestige 15 A11SCS-033XES: NVIDIA GeForce GTX 1650 Ti Max-Q, 15.60", 1.7 kg
análise externo » MSI Prestige 15 A11SCS-033XES
HP EliteBook 840 Aero G8, i7-1185G7: Intel Iris Xe Graphics G7 96EUs, 14.00", 1.2 kg
análise externo » HP EliteBook 840 Aero G8, i7-1185G
Lenovo Yoga 9i 14ITL5-82BG004GGE: Intel Iris Xe Graphics G7 96EUs, 14.00", 1.4 kg
análise externo » Lenovo Yoga 9i 14ITL5-82BG004GGE
MSI Summit E15 A11SCST-067RU: NVIDIA GeForce GTX 1650 Ti Max-Q, 15.60", 1.8 kg
análise externo » MSI Summit E15 A11SCST-067RU
MSI Summit E15 A11SCST-227ID: NVIDIA GeForce GTX 1650 Ti Max-Q, 15.60"
análise externo » MSI Summit E15 A11SCST-227ID
MSI Prestige 15 A11SCX-019XES: NVIDIA GeForce GTX 1650 Max-Q, 15.60", 1.7 kg
análise externo » MSI Prestige 15 A11SCX-019XES
MSI Prestige 14 Evo A11M-014IT: Intel Iris Xe Graphics G7 96EUs, 14.00", 1.3 kg
análise externo » MSI Prestige 14 Evo A11M-014IT
MSI Summit E15 A11SCST: NVIDIA GeForce GTX 1650 Ti Max-Q, 15.60", 1.8 kg
análise externo » MSI Summit E15 A11SCST
Lenovo Yoga 9 14 ITL 4K: Intel Iris Xe Graphics G7 96EUs, 14.00", 1.5 kg
análise externo » Lenovo Yoga 9 14 ITL 4K
MSI Stealth 15M A11SDK-085: NVIDIA GeForce GTX 1660 Ti Max-Q, 15.60"
análise externo » MSI Stealth 15M A11SDK-085
MSI Stealth 15M A11SDK-032RU: NVIDIA GeForce GTX 1660 Ti Max-Q, 15.60"
análise externo » MSI Stealth 15M A11SDK-032RU
MSI Prestige 14 Evo A11M-005: Intel Iris Xe Graphics G7 96EUs, 14.00", 1.2 kg
análise externo » MSI Prestige 14 Evo A11M-005
Lenovo Yoga 9 14ITL5, i7-1185G7: Intel Iris Xe Graphics G7 96EUs, 14.00", 1.4 kg
análise externo » Lenovo Yoga 9 14ITL5, i7-1185G7
HP EliteBook 840 Aero G8 3E4Q6AA: Intel Iris Xe Graphics G7 96EUs, 14.00", 1.2 kg
» El HP EliteBook 840 G8 tiene una gran ventaja sobre la mayoría de los otros portátiles de negocios, pero tiene un costo
HP Elite Dragonfly Max: Intel Iris Xe Graphics G7 96EUs, 13.30", 1.2 kg
» No estamos tan seguros de HP Sure View
MSI Summit E13 Flip Evo A11MT: Intel Iris Xe Graphics G7 96EUs, 13.40", 1.4 kg
» MSI Summit E13 Flip vs. XPS 13 2-en-1: Dando a Dell una carrera por su dinero
MSI Stealth 15M A11SEK: NVIDIA GeForce RTX 2060 Max-Q, 15.60", 1.7 kg
» Tiger Lake El MSI Stealth 15M es la prueba de que los portátiles para juegos con CPUs Core U de 15 W a 25 W pueden funcionar
» Tiger Lake El MSI Stealth 15M es la prueba de que los portátiles para juegos con CPUs Core U de 15 W a 25 W pueden funcionar
MSI Summit E15 A11SCST: NVIDIA GeForce GTX 1650 Ti Max-Q, 15.60", 1.8 kg
» MSI Summit E15 - Un rival para el Dell XPS 15 y el Lenovo ThinkPad X1 Extreme
MSI Prestige 14 Evo A11M-005: Intel Iris Xe Graphics G7 96EUs, 14.00", 1.2 kg
» MSI Prestige 14 Evo: Intel contra AMD